| ý | ANNUAL REPORT PURSUANT TO SECTION 13 OR 15(d) OF THE SECURITIES EXCHANGE ACT OF 1934 |
| ¨ | TRANSITION REPORT PURSUANT TO SECTION 13 OR 15(d) OF THE SECURITIES EXCHANGE ACT OF 1934 |
| TEXAS | 74-2088619 | |
(State or other jurisdiction of incorporation or organization) |
| |
| 78209 | |
| (Address of principal executive offices) | (Zip Code) | |
Title of each class | Name of each exchange on which registered | |
| Common Stock, $0.10 par value | ||
þ No ¨
Large accelerated filer | Accelerated filer | |||
Non-accelerated filer | (Do not check if a smaller reporting company) | Smaller reporting company | ||
Item 1. Item 1A. Item 1B. Item 5. Item 6. Item 7. Item 7A. Item 8. Item 9. Item 9A. Item 10. Item 11. Item 12. Item 13. Item 14. Item 15. general economic and business conditions and industry trends; the continued the highly competitive nature of our business; our future financial performance, including availability, terms and deployment of capital; the continued availability of drilling rig, well service rig, wireline unit and coiled tubing unit components; changes in, or our failure or inability to comply with, governmental regulations, including those relating to the environment. Pioneer Drilling Company provides drilling services and production services to independent and major oil and gas exploration and production companies throughout much of the oil and gas producing regions of the United States and internationally in Colombia. Drilling Division Locations South Texas East Texas West Texas Utah Colombia Well Services. Existing and newly-drilled wells require a range of services to establish and maintain production over their useful lives. We use our premium well service rig fleet Oil (West Texas Intermediate) Natural Gas (Henry Hub) U.S. Land Rig Count U.S. Workover Rig Count U.S. land rig counts and U.S. well service rig counts. Since late 2009, increases primarily in oil prices have caused increases in exploration and production spending and the corresponding increases in drilling and well services activities are reflected by increases in the U.S. land rig counts and the U.S. well service rig counts in 2010 and 2011. to the short-term viability of a lease or field, but these projects are less sensitive to commodity price volatility as compared to capital expenditures for exploration. Discretionary operating expenditure work is evaluated according to a simple short-term payout criterion which is far less dependent on commodity price forecasts. routed from the mud pits to the mud pump and from the mud pump through a standpipe and the rotary hose to the drill stem. The drilling mud travels down the drill stem to the bit, up the annular space between the drill stem and the borehole and through the blowout preventer stack to the return flow line. It then travels to a shale shaker for removal of rock cuttings, and then back to the mud pits, which are usually steel tanks. The reserve pits, usually one or two fairly shallow excavations, are used for waste material and excess water around the location. These upgrades provide our customers with drilling rigs that have more varied capabilities for drilling in unconventional plays, and they improve our efficiency and safety. Top drives provide maximum torque and rotational control, improved well control and better hole conditioning. In horizontal drilling, operators can utilize top drives to reach formations that may not be accessible with conventional rotary drilling. An iron roughneck is a remotely operated pipe handling feature on the rig floor, which is used to help reduce the occurrence of repetitive motion injuries and decrease drill pipe tripping time. Walking systems increase efficiency by allowing multiple wells to be drilled on the same pad site and permitting the drilling rig to move between wells while drill pipe remains in the derrick, thus reducing move times and costs. Our walking system enables the drilling rig to move forward, backward, and side to side which affords the operator additional flexibility. An automated catwalk is a drill pipe handling feature used to raise drill pipe, drill collars, casing, and other necessary items to the drilling rig floor. Its function significantly reduces pick up and lay down time, thereby decreasing operator costs for handling casing. Average number of operating rigs for the period Average utilization rate Type of Contract Daywork Turnkey Footage Total number of wells We provide drilling services and production services to numerous major and independent oil and gas exploration and production companies that are active in the geographic areas in which we operate. The following table shows our three largest customers as a percentage of our total revenue for each of our last three fiscal years. Customer Chesapeake Operating, Inc. the type and condition of each of the competing drilling rigs; the mobility and efficiency of the rigs; the quality of service and experience of the rig crews; the safety records of the rigs; the offering of ancillary services; and the ability to provide drilling equipment adaptable to, and personnel familiar with, new technologies and drilling techniques. better withstand industry downturns; compete more effectively on the basis of price and technology; better retain skilled rig personnel; and build new rigs or acquire and refurbish existing rigs so as to be able to place rigs into service more quickly than us in periods of high drilling demand. blowouts; fires and explosions; loss of well control; collapse of the borehole; lost or stuck drill strings; and damage or loss from natural disasters. suspension of drilling operations; damage to, or destruction of, our property and equipment and that of others; personal injury and loss of life; damage to producing or potentially productive oil and gas formations through which we drill; and environmental damage. Our corporate office facilities are located at 1250 N.E. Loop 410, Suite 1000 San Antonio, Texas 78209 and are leased through December 2020with subject to special protective measures and which may expose us to additional operating costs and liabilities for accidental discharges of oil, natural gas, drilling fluids or contaminated water, or for noncompliance with other aspects of applicable laws. We are also subject to the requirements of the federal Occupational Safety and Health Act our revenues, cash flows and profitability; the fair market value of our drilling rig fleet and production service assets; our ability to maintain or increase our borrowing capacity; our ability to obtain additional capital to finance our business and make acquisitions, and the cost of that capital; and our ability to retain skilled rig personnel whom we would need in the event of an upturn in the demand for our services. Currently, there are growing expectations of a possible downturn in the global economic environment in 2012, which could lead to a decline in oil and natural gas prices that would adversely affect our business. the type and condition of each of the competing drilling, the mobility and efficiency of the rigs; the quality of service and experience of the rig crews; the safety records of the rigs; the offering of ancillary services; and the ability to provide drilling and production equipment adaptable to, and personnel familiar with, new technologies and drilling and production techniques. better withstand industry downturns; compete more effectively on the basis of price and technology; retain skilled rig personnel; and build new rigs or acquire and refurbish existing rigs so as to be able to place rigs into service more quickly than us in periods of high drilling demand. results of operations. Under a typical turnkey drilling contract, we agree to drill a well for our customer to a specified depth and under specified conditions for a fixed price. We provide technical expertise and engineering services, as well as most of the equipment and drilling supplies required to drill the well. We often subcontract for related services, such as the provision of casing crews, cementing and well In addition, since we are only paid by our customers after we have performed the terms of the drilling contract in full, our liquidity can be affected by the number of turnkey and footage contracts that we enter into. blowouts; cratering; fires and explosions; loss of well control; collapse of the borehole; damaged or lost drilling equipment; and damage or loss from natural disasters. suspension of operations; damage to, or destruction of, our property and equipment and that of others; personal injury and loss of life; damage to producing or potentially productive oil and gas formations through which we drill; and environmental damage. Go-Coil to complement our existing production services offerings. unanticipated costs and assumption of liabilities and exposure to unforeseen liabilities of acquired businesses, including environmental liabilities; difficulties in integrating the operations and assets of the acquired business and the acquired personnel; limitations on our ability to properly assess and maintain an effective internal control environment over an acquired business in order to comply with applicable periodic reporting requirements; potential losses of key employees and customers of the acquired businesses; risks of entering markets in which we have limited prior experience; and increases in our expenses and working capital requirements. balance of impairing our ability to make investments and obtain additional financing for working capital, capital expenditures, acquisitions or other general corporate purposes; limiting our ability to use operating cash flow in other areas of our business because we must dedicate a substantial portion of these funds to make principal and interest payments on our indebtedness; making us more vulnerable to a downturn in our business, our industry or the economy in general as a substantial portion of our operating cash flow could be required to make principal and interest payments on our indebtedness, making it more difficult to react to changes in our business, limiting our flexibility in planning for, or reacting to, changes in our business and the industry in which we operate; putting us at a competitive disadvantage to competitors that have less debt; and increasing our vulnerability to rising interest rates. refinancing or restructuring our debt; selling assets; reducing or delaying acquisitions or capital investments, such as refurbishments of our rigs and related equipment; or seeking to raise additional capital. limitations on the incurrence of additional indebtedness; restrictions on investments, capital expenditures, mergers or consolidations, asset dispositions, acquisitions, transactions with affiliates and other transactions without the lenders’ consent; and limitation on dividends and distributions. Revolving Credit Facility and our Senior Notes. risks of war, terrorism, civil unrest and kidnapping of employees; expropriation, confiscation or nationalization of our assets; renegotiation or nullification of contracts; foreign taxation; the inability to repatriate earnings or capital due to laws limiting the right and ability of foreign subsidiaries to pay dividends and remit earnings to affiliated companies; changing political conditions and changing laws and policies affecting trade and investment; concentration of customers; the overlap of different tax structures; the burden of complying with multiple and potentially conflicting laws; the risks associated with the assertion of foreign sovereignty over areas in which our operations are conducted; difficulty in collecting international accounts receivable; and potentially longer payment cycles. environmental quality; pollution control; remediation of contamination; preservation of natural resources; transportation, and worker safety. cash flows. provisions regulating the ability of our shareholders to nominate candidates for election as directors or to bring matters for action at annual meetings of our shareholders; limitations on the ability of our shareholders to call a special meeting and act by written consent; provisions dividing our board of directors into three classes elected for staggered terms; and the authorization given to our board of directors to issue and set the terms of preferred stock. Fiscal Year Ended December 31, 2008: First Quarter Second Quarter Third Quarter Fourth Quarter Nine Months Ended December 31, 2007: First Quarter Second Quarter Third Quarter Fiscal Year Ended March 31, 2007: First Quarter Second Quarter Third Quarter Fourth Quarter NYSE Amex: 2011 Plan category Equity compensation plans approved by security holders Equity compensation plans not approved by security holders Total performance graph. Statement of Operations Data: Revenues (Loss) income from operations (Loss) income before income taxes Net (loss) earnings applicable to common stockholders (Loss) earnings per common share-basic (Loss) earnings per common share-diluted Other Financial Data: Net cash provided by operating activities Net cash used in investing activities Net cash provided by financing activities Capital expenditures Balance Sheet Data: Working capital Property and equipment, net Long-term debt and capital lease obligations, excluding current installments Shareholders’ equity Total assets The statement of operations data and other financial data for the The statement of operations data and other financial data for the year ended December 31, 2008 reflect the impact of a goodwill impairment charge of $118.6 million and an intangible asset impairment charge of $52.8 million. Drilling Division Locations South Texas East Texas West Texas Utah Colombia Well Services. Existing and newly-drilled wells require a range of services to establish and maintain production over their useful lives. We use our premium well service rig fleet Oil (West Texas Intermediate) Natural Gas (Henry Hub) U.S. Land Rig Count U.S. Workover Rig Count production companies. Exploration and production spending is generally categorized as either a capital expenditure or next 12 months. Drilling Services Division: Routine rigs Discretionary New-builds and acquisitions Total Drilling Services Division Production Services Division: Routine Discretionary New-builds and acquisitions Total Production Services Division costs on as necessary, from borrowings under our Revolving Credit Facility. 2010 Cash and cash equivalents Receivables, net Unbilled receivables Deferred income taxes Inventory Prepaid expenses and other current Current assets Accounts payable Current portion of long-term debt Prepaid drilling contracts Accrued expenses—payroll and related employee costs Accrued expenses—insurance premiums and deductibles Accrued expenses—other Current liabilities Working capital Colombian operations. payroll payments. Senior secured credit facility Subordinated notes payable Other Less current portion Other Contractual Obligations Contractual Obligations Long-term debt Interest on long term debt Purchase commitments Operating leases Restricted cash obligation Other Total through maturity. equipment. The total estimated cost for the Revolving Credit Facility. At unsecured basis by our existing domestic subsidiaries, except for Pioneer Services Holdings, LLC and Go-Coil, LLC, and by certain of our future domestic subsidiaries. The subsidiaries that generally operate our non-U.S. business concentrated in Colombia do not guarantee our Senior Notes. The non-guarantor subsidiaries do not have any payment obligations under the Senior Notes, the guarantees or the Indenture. In the event of a bankruptcy, liquidation or reorganization of any non-guarantor subsidiary, such non-guarantor subsidiary will pay the holders of its debt and other liabilities, including its trade creditors, before it will be able to distribute any of its assets to us. In the future, any non-U.S. subsidiaries, immaterial subsidiaries and subsidiaries that we designate as unrestricted subsidiaries under the Indenture will not guarantee the Senior Notes. —Our Drilling Services Division earns revenues by drilling oil and gas wells for our customers under daywork, turnkey or footage contracts, which usually provide for the drilling of a single well. We recognize revenues on daywork contracts for the days completed based on the dayrate each contract specifies. We recognize revenues from our turnkey and footage contracts on the percentage-of-completion method based on our estimate of the number of days to complete each contract. Individual contracts are usually completed in less than 60 days. The risks to us under a turnkey contract and, to a lesser extent, under footage contracts, are substantially greater than on a contract drilled on a daywork basis. Under a turnkey contract, we assume most of the risks associated with drilling operations that are generally assumed by the operator in a daywork contract, including the risks of blowout, loss of hole, stuck drill pipe, machinery breakdowns and abnormal drilling conditions, as well as risks associated with subcontractors’ services, supplies, cost escalations and personnel operations. We evaluate for potential impairment of long-lived assets and intangible assets subject to amortization when indicators of impairment are specifically, significant adverse changes in industry trends include significant declines in revenue rates, utilization rates, oil and natural gas market prices and industry rig counts for drilling rigs and Goodwill results from business acquisitions and represents the excess of acquisition costs over the fair value of the net assets acquired. flows that We provide deferred taxes for the basis differences in our property and equipment between financial reporting and tax reporting purposes and other costs such as compensation, tax depreciation exceeds our financial reporting depreciation, resulting in our providing deferred taxes on this depreciation difference. After 5 years, financial reporting depreciation exceeds tax depreciation, and the deferred tax liability begins to reverse. We consider the recognition of revenues and costs on turnkey and footage contracts to be critical accounting estimates. On these types of contracts, we are required to estimate the number of days needed for us to complete the contract and our total cost to complete the contract. Our actual costs could substantially exceed our estimated costs if we encounter problems such as lost circulation, stuck drill pipe or an underground blowout on contracts still in progress subsequent to the release of the financial statements. We receive payment under turnkey and footage contracts when we deliver to our customer a well completed to the depth specified in the contract, unless the customer authorizes us to drill to a more shallow depth. Since 1995, we have completed all our turnkey or footage contracts. Although our initial cost estimates for turnkey and footage contracts do not include cost estimates for risks such as stuck drill pipe or loss of circulation, we believe that our experienced management team, our knowledge of geologic formations in our areas of operations, the condition of our drilling equipment and our experienced crews have previously enabled us to make reasonable cost estimates and complete contracts according to our drilling plan. While we do bear the risk of loss for cost overruns and other events that are not specifically provided for in our initial cost estimates, our pricing of turnkey and footage contracts takes such risks into consideration. We are more likely to encounter losses on turnkey and footage contracts in periods in which revenue rates are lower for all types of contracts. During periods of reduced demand for drilling rigs, our overall profitability on turnkey and footage contracts has historically exceeded our profitability on daywork contracts. When we encounter, during the course of our drilling operations, conditions unforeseen in the preparation of our original cost estimate, we increase our cost estimate to complete the contract. If we anticipate a loss on a contract in progress at the end of a reporting period due to a change in our cost estimate, we accrue the entire amount of the estimated loss, including all costs that are included in our revised estimated cost to complete that contract, in our consolidated statement of operations for that reporting period. during 2011. for our Production Services Division. 2011 a drilling rig, 2010 future periods. actual achievement levels at the end of the pre-determined performance periods. Drilling Services Division: Revenues Operating costs Drilling Services Division margin Average number of drilling rigs Utilization rate Revenue days Average revenues per day Average operating costs per day Drilling Services Division margin per day Production Services Division: Revenues Operating costs Production Services Division margin Combined: Revenues Operating costs Combined margin EBITDA 2010 Reconciliation of combined margin and Combined margin Selling, general and administrative Bad debt expense Other income (expense) EBITDA Depreciation and amortization Impairment of goodwill Impairment of intangible assets Interest income (expense), net Income tax expense Net (loss) earnings contracts we are able to obtain. As demand for drilling rigs decreases, daywork rates move down and we may switch to performing more turnkey drilling contracts to maintain higher utilization rates and improve our Drilling Services Division’s margins. Turnkey drilling contracts also result in higher average revenues per day and higher average operating costs per day when compared to daywork drilling contracts. We completed 11 turnkey drilling contracts during 2010, as compared to 14 turnkey drilling contracts completed during 2009. The shift to fewer turnkey drilling contracts is due to the increase in the demand for drilling services in 2010. The following table provides percentages of our drilling revenues by drilling contract type for the years ended December 31, 2010 and 2009: 2009. costs. new wireline units. Contract drilling revenues: Daywork contracts Turnkey contracts Footage contracts Total contract drilling revenues Contract drilling costs: Daywork contracts Turnkey contracts Footage contracts Total contract drilling costs Drilling margin: Daywork contracts Turnkey contracts Footage contracts Total drilling margin Revenue days by type of contract: Daywork contracts Turnkey contracts Footage contracts Total revenue days EBITDA Contract drilling revenue per revenue day Contract drilling costs per revenue day Drilling margin per revenue day Rig utilization rates Average number of rigs during the period Reconciliation of drilling margin and EBITDA to net earnings: Drilling margin General and administrative expense Bad debt expense Other income EBITDA Income tax expense Interest income (expense), net Depreciation and amortization Net earnings January 2011. in In risk. 2011 21, 2012 Shareholders Go-Coil. 21, 2012 ASSETS Current assets: Cash and cash equivalents Receivables, net of allowance for doubtful accounts Unbilled receivables Deferred income taxes Inventory Prepaid expenses and other current assets Total current assets Property and equipment, at cost Less accumulated depreciation and amortization Net property and equipment Deferred income taxes Intangible assets, net of amortization Other long-term assets Total assets LIABILITIES AND SHAREHOLDERS’ EQUITY Current liabilities: Accounts payable Current portion of long-term debt Prepaid drilling contracts Accrued expenses: Payroll and related employee costs Insurance premiums and deductibles Other Total current liabilities Long-term debt, less current portion Other long-term liabilities Deferred income taxes Total liabilities Commitments and contingencies Shareholders’ equity: Preferred stock, 10,000,000 shares authorized; none issued and outstanding Common stock $.10 par value; 100,000,000 shares authorized; 49,997,578 shares and 49,650,978 shares issued and outstanding at December 31, 2008 and December 31, 2007, respectively Additional paid-in capital Accumulated earnings Accumulated other comprehensive loss Total shareholders’ equity Total liabilities and shareholders’ equity Revenues: Drilling services Production services Total revenue Costs and expenses: Drilling services Production services Depreciation and amortization Selling, general and administrative Bad debt expense Impairment of goodwill Impairment of intangible assets Total operating costs and expenses (Loss) income from operations Other (expense) income: Interest expense Interest income Other Total other (expense) income (Loss) income before income taxes Income tax expense Net (loss) earnings (Loss) earnings per common share—Basic (Loss) earnings per common share—Diluted Weighted average number of shares outstanding—Basic Weighted average number of shares outstanding—Diluted Balance as of March 31, 2006 Comprehensive income: Net earnings Total comprehensive income Issuance of common stock for: Exercise of options and related income tax benefits of $24 Stock-based compensation expense Balance as of March 31, 2007 Comprehensive income: Net earnings Total comprehensive income Issuance of common stock for: Exercise of options and related income tax benefits of $54 Stock-based compensation expense Balance as of December 31, 2007 Comprehensive loss: Net loss Unrealized loss on securities Total comprehensive loss Exercise of options and related income tax benefits of $244 Issuance of restricted stock Stock-based compensation expense Balance as of December 31, 2008 Cash flows from operating activities: Net (loss) earnings Adjustments to reconcile net (loss) earnings to net cash provided by operating activities: Depreciation and amortization Allowance for doubtful accounts (Gain) loss on dispositions of property and equipment Stock-based compensation expense Impairment of goodwill and intangibles assets Deferred income taxes Change in other assets Change in non-current liabilities Changes in current assets and liabilities: Receivables Inventory Prepaid expenses & other current assets Accounts payable Income tax payable Prepaid drilling contracts Accrued expenses Net cash provided by operating activities Cash flows from investing activities: Acquisition of production services business of WEDGE Acquisition of production services business of Competition Acquisition of other production services businesses Purchases of property and equipment Purchase of auction rate securities, net Proceeds from sale of property and equipment Proceeds from insurance recoveries Net cash used in investing activities Cash flows from financing activities: Payments of debt Proceeds from issuance of debt Debt issuance costs Proceeds from exercise of options Excess tax benefit of stock option exercises Net cash provided by financing activities Net decrease in cash and cash equivalents Beginning cash and cash equivalents Ending cash and cash equivalents Supplementary disclosure: Interest paid Income tax paid Drilling Division Locations South Texas East Texas West Texas Utah Colombia performed. We plan to add another The accompanying consolidated financial statements have been prepared in accordance with accounting principles generally accepted in the United States of America. In preparing the accompanying consolidated financial statements, we make various estimates and assumptions that affect the amounts of assets and liabilities we report as of the dates of the balance sheets and income and expenses we report for the periods shown in the income statements and statements of cash flows. Our actual results could differ significantly from those estimates. Material estimates that are particularly susceptible to significant changes in the near term relate to our recognition of revenues and costs for turnkey contracts, our estimate of the allowance for doubtful accounts, our estimate of the liability relating to the self-insurance portion of our health and workers’ compensation insurance, our estimate of asset impairments, our estimate of deferred taxes, our estimate of compensation related accruals and our determination of depreciation and amortization expense. 2012. complete the contract. Contract costs include labor, materials, supplies, repairs and maintenance, operating overhead allocations and allocations of depreciation and amortization expense. operating costs. recognized. As of monthly basis. Balances more than Balance at beginning of year Increase in allowance charged to expense Accounts charged against the allowance, net of recoveries Balance at end of year consolidated balance sheet. 2010 Depreciation and amortization expense using prior useful lives Impact of change in estimated useful lives Depreciation and amortization expense, as reported Diluted (loss) earnings per common share using prior useful lives Impact of change in estimated useful lives Diluted (loss) earnings per common share, as reported Goodwill balance at January 1, 2008 Goodwill relating to acquisitions Impairment Goodwill balance at December 31, 2008 2011 Cost: Customer Relationships Non-compete Trade marks Accumulated amortization: Customer Relationships Non-compete Trade marks Impairment: Customer Relationships capital using the average cost method. Net (loss) income Other comprehensive loss—unrealized loss on securities Comprehensive (loss) income thousands): substance, multiple awards. 3, Cash acquired Other current assets Property and equipment Intangibles and other assets Goodwill Total assets acquired Current liabilities Long-term debt Other long term liabilities Total liabilities assumed Net assets acquired Total revenues Net (loss) earnings (Loss) earnings per common share Basic Diluted Senior secured credit facility Subordinated notes payable Other Less current portion of representations and warranties, covenant defaults, cross-defaults to certain other material indebtedness in excess of specified amounts, certain events of bankruptcy and insolvency, judgment defaults in excess of specified amounts, failure of any guaranty or security document supporting the credit agreement and change of control. notes issued in the exchange offer. Years Ended December 31, 2009 2010 2011 2012 2013 Thereafter Domestic Foreign (Loss) income before income tax Current tax: Federal State Foreign Deferred taxes: Federal State Foreign Income tax expense Expected tax (benefit) expense State income taxes Incentive stock options Goodwill impairment Tax benefits in foreign jurisdictions Domestic production activities deduction Tax-exempt interest income Non deductible items for tax purposes Uncertain tax positions Other, net Results of operations Stockholders’ equity Deferred tax assets: Auction rate preferred securities Intangibles Employee benefits and insurance claims accruals Accounts receivable reserve Employee stock based compensation Accrued expenses not deductible for tax purposes Accrued revenue not income for book purposes Foreign net operating loss carryforward Valuation allowance Total deferred tax assets Deferred tax liabilities: Property and equipment Total deferred tax liabilities Net deferred tax liabilities 2011 losses can be carried forward indefinitely. 2011 Basic Net (loss) earnings Weighted average shares (Loss) earnings per share Diluted Net (loss) earnings Effect of dilutive securities Net (loss) earnings available to common shareholders after assumed conversion Weighted average shares: Outstanding Options (Loss) earnings per share antidilutive. We have stock based award plans that are administered by the Compensation Committee of our Board of Directors, which selects persons eligible to receive awards and determines the number of stock options, restricted stock, or restricted stock units subject to each award and the terms, conditions and other provisions of the awards. awards are exercised. Expected volatility Weighted-average risk-free interest rates Weighted-average expected life in years Weighted-average grant-date fair value Outstanding stock options as of March 31, 2007 Granted Exercised Canceled Forfeited Outstanding stock options as of December 31, 2007 Granted Exercised Canceled Forfeited Outstanding stock options as of December 31, 2008 Stock options exercisable as of December 31, 2008 2011 Nonvested stock options as of March 31, 2007 Granted Vested Forfeited Nonvested stock options as of December 31, 2007 Granted Vested Forfeited Nonvested stock options as of December 31, 2008 2009 Nonvested restricted stock as of December 31, 2007 Granted Vested Forfeited Nonvested restricted stock as of December 31, 2008 2011 Division— Drilling Division Locations South Texas East Texas West Texas Utah Colombia Identifiable assets Revenues Operating costs Segment margin Depreciation and amortization Capital expenditures Segment margin Depreciation and amortization Selling, general and administrative Bad debt (expense) recovery Impairment of goodwill Impairment of intangible assets Loss from operations Identifiable assets Revenues Year Ended December 31, 2008 (1) (2) Revenues Income (loss) from operations Income tax (expense) benefit Net earnings (loss) Earnings (loss) per share: Basic Diluted (3) Nine Months Ended December 31, 2007 Revenues Income from operations Income tax expense Net earnings Earnings per share: Basic Diluted (3) forms and (2) accumulated and communicated to our management, including our Chief Executive Officer and Chief Financial Officer, as appropriate to allow timely decisions regarding required disclosure. 53. 51. Schedules Description Restated Articles of Incorporation of Pioneer Drilling Amended and Restated Bylaws of Pioneer Drilling Company (Form 8-K dated December 15, 2008 (File No. 1-8182, Exhibit 3.1)). Form of Certificate representing Common Stock of Pioneer Drilling Company (Form S-8 filed November 18, 2003 (Reg. No. 333-110569, Exhibit 4.3)). Pioneer Drilling Company 2007 Incentive Plan Form of Long-Term Incentive Cash Award Agreement (Form 10-Q dated August 5, 2010 (File No. 1-8182, Exhibit 10.2)). Pioneer Drilling Company Amended and Restated Key Executive Severance Plan dated December 10, 2007 (Form 10-Q for the quarter ended March 31, 2008 (File No. 1-8182, Exhibit 10.4)). Pioneer Drilling Company’s 1995 Stock Plan and form of Stock Option Agreement (Form 10-K for the year ended March 31, 2001 (File No. 1-8182, Exhibit 10.5)). Pioneer Drilling Company’s 1999 Stock Plan and form of Stock Option Agreement (Form 10-K for the year ended March 31, 2001 (File No. 1-8182, Exhibit 10.7)). Pioneer Drilling Company 2003 Stock Plan (Form S-8 filed November 18, 2003 (File No. 333-110569, Exhibit 4.4)). Pioneer Drilling Company Amended and Restated 2007 Incentive Plan (Form 10-Q for the quarter ended September 30, 2011 (File No. 1-8182, Exhibit 10.1)). Pioneer Drilling Company Form of Indemnification Agreement (Form 8-K dated August 8, 2007 (File No. 1-8182, Exhibit 10.1)). Pioneer Drilling Company Employee Relocation Policy Executive Employment Letter, effective March 1, 2008, from Pioneer Drilling Company to Joseph B. Eustace (Form 8-K dated March 5, 2008 (File No. 1-8182, Exhibit 10.1)). Confidentiality and Non-Competition Agreement, dated February 29, 2008, by and between Pioneer Drilling Company, Pioneer Production Services, Inc. and Joe Eustace (Form 8-K dated March 5, 2008 (File No. 1-8182, Exhibit 10.2)). Employment Letter, Subsidiaries of Pioneer Drilling Company. Certification by Wm. Stacy Locke, President and Chief Executive Officer, pursuant to Rule 13a-14(a) or Rule 15d-14(a) under the Securities Exchange Act of 1934. Certification by Lorne E. Phillips, Executive Vice President and Chief Financial Officer, pursuant to Rule 13a-14(a) or Rule 15d-14(a) under the Securities Exchange Act of 1934. Certification by Wm. Stacy Locke, President and Chief Executive Officer, pursuant to Section 906 of the Sarbanes-Oxley Act of 2002 (Subsections (a) and (b) of Section 1350, Chapter 63 of Title 18, United States Code). Certification by Lorne E. Phillips, Executive Vice President and Chief Financial Officer, pursuant to Section 906 of the Sarbanes-Oxley Act of 2002 (Subsections (a) and (b) of Section 1350, Chapter 63 of Title 18, United States Code). Incorporated by reference to the filing indicated. Management contract or compensatory plan or arrangement. PIONEER DRILLING COMPANY Title Executive Vice President and Chief Financial Officer Director Director Director Description Restated Articles of Incorporation of Pioneer Drilling Amended and Restated Bylaws of Pioneer Drilling Company (Form 8-K dated December 15, 2008 (File No. 1-8182, Exhibit 3.1)). Form of Certificate representing Common Stock of Pioneer Drilling Company (Form S-8 filed November 18, 2003 (Reg. No. 333-110569, Exhibit 4.3)). Pioneer Drilling Company 2007 Incentive Plan Form of Long-Term Incentive Cash Award Agreement (Form 10-Q dated August 5, 2010 (File No. 1-8182, Exhibit 10.2)). Pioneer Drilling Company Amended and Restated Key Executive Severance Plan dated December 10, 2007 (Form 10-Q for the quarter ended March 31, 2008 (File No. 1-8182, Exhibit 10.4)). Pioneer Drilling Company’s 1995 Stock Plan and form of Stock Option Agreement (Form 10-K for the year ended March 31, 2001 (File No. 1-8182, Exhibit 10.5)). Pioneer Drilling Company’s 1999 Stock Plan and form of Stock Option Agreement (Form 10-K for the year ended March 31, 2001 (File No. 1-8182, Exhibit 10.7)). Pioneer Drilling Company 2003 Stock Plan (Form S-8 filed November 18, 2003 (File No. 333-110569, Exhibit 4.4)). Pioneer Drilling Company Amended and Restated 2007 Incentive Plan (Form 10-Q for the quarter ended September 30, 2011 (File No. 1-8182, Exhibit 10.1)). Pioneer Drilling Company Form of Indemnification Agreement (Form 8-K dated August 8, 2007 (File No. 1-8182, Exhibit 10.1)). Pioneer Drilling Company Employee Relocation Policy Executive Officers – Package A (Form 8-K dated August 8, 2007 (File No. 1-8182, Exhibit 10.3)). Employment Letter, effective March 1, 2008, from Pioneer Drilling Company to Joseph B. Eustace (Form 8-K dated March 5, 2008 (File No. 1-8182, Exhibit 10.1)). Confidentiality and Non-Competition Agreement, dated February 29, 2008, by and between Pioneer Drilling Company, Pioneer Production Services, Inc. and Joe Eustace (Form 8-K dated March 5, 2008 (File No. 1-8182, Exhibit 10.2)). Employment Letter, Subsidiaries of Pioneer Drilling Company. Certification by Wm. Stacy Locke, President and Chief Executive Officer, pursuant to Rule 13a-14(a) or Rule 15d-14(a) under the Securities Exchange Act of 1934. Certification by Lorne E. Phillips, Executive Vice President and Chief Financial Officer, pursuant to Rule 13a-14(a) or Rule 15d-14(a) under the Securities Exchange Act of 1934. Certification by Wm. Stacy Locke, President and Chief Executive Officer, pursuant to Section 906 of the Sarbanes-Oxley Act of 2002 (Subsections (a) and (b) of Section 1350, Chapter 63 of Title 18, United States Code). Certification by Lorne E. Phillips, Executive Vice President and Chief Financial Officer, pursuant to Section 906 of the Sarbanes-Oxley Act of 2002 (Subsections (a) and (b) of Section 1350, Chapter 63 of Title 18, United States Code). Incorporated by reference to the filing indicated. Management contract or compensatory plan or arrangement. Page Page Item 2. Item 3. 27Item 2.27Item 3.28Item 4.28 535586Item 9B. 86Item 9B.88 88888888 88 89thatcontained in this Annual Report on Form 10-K, contains, including those that express a belief, expectation or intention, as well as those that are not statements of historical fact, are forward-looking statements. ThoseSuch forward-looking statements appear in Item 1—“Business” and Item 3—“Legal Proceedings” in Part I of this report; in Item 5—“Market for Registrant’s Common Equity, Related Shareholder Matters and Issuer Purchases of Equity Securities,” Item 7—“Management’s Discussion and Analysis of Financial Condition and Results of Operations,” Item 7A—“Quantitative and Qualitative Disclosures About Market Risk” and in the Notes to Consolidated Financial Statements we have included in Item 8 of Part II of this report; and elsewhere in this report. These forward-looking statements speak only as of the date of this report. We disclaim any obligation to update these statements, and we caution you not to rely on them unduly. We have based these forward-looking statements on our current expectations and assumptions about future events. While our management considers these expectations and assumptions to be reasonable, they are inherently subject to significant business, economic, competitive, regulatory and other risks, contingencies and uncertainties, most of which are difficult to predict and many of which are beyond our control. These risks, contingencies and uncertainties relate to, among other matters, the following:risks associated with the current global crisislevels and itsvolatility of oil and gas prices;strength of thedemand for drilling services or production services in the geographic areas where we operate;levels and volatility of oil and gas prices;decisions about onshore exploration and development projects to be made by oil and gas companies;workoverwell service rigs, wireline units and wirelinecoiled tubing units within the industry;the continued availability of drilling rig, workover rig and wireline unit components;our future financial performance, including availability, terms and deployment of capital;the continued availability of qualified personnel; and These factors are not necessarily allthe important factors that could affect us. Unpredictable or unknown factors we have not discussed in this report could also have material adverse effects on actual results of matters that are the subject of our forward-looking statements. We do not intend to update our description of important factors each time a potential important factor arises, except as required by applicable securities laws and regulations. We advise our security holders that they should (1) be aware that importantunpredictable or unknown factors not referred to above could affect the accuracy of our forward-looking statements and (2) use caution and common sense when considering our forward-looking statements. Also, please read the risk factors set forth in Item 1A—“Risk Factors.”Item 1. Business In December 2007, our Board of Directors approved a change in our fiscal year end from March 31st to December 31st. The fiscal year end change was effective December 31, 2007 and resulted in a nine month reporting period from April 1, 2007 to December 31, 2007. Fiscal years beginning with the year ended December 31, 2008, will represent twelve month reporting periods. We implemented the fiscal year end change to align our United States reporting period with the required Colombian statutory reporting period as well as the reporting periods of peer companies in the industry.GeneralOur companyPioneer Drilling Company was incorporated under the laws of the State of Texas in 1979 as the successor to a business that had been operating since 1968. Over the years, our business has grown through acquisitions and through organic growth. Since September 1999, we have significantly expanded our drilling rig fleet by adding 42 rigs through acquisitions and by adding 27 rigs through the construction of rigs from new and used components. OnIn March 1, 2008, we significantly expanded our service offerings when we acquiredwith the acquisition of two production services businesses, of WEDGE Group Incorporated (“WEDGE”) for $314.7 million and Prairie Investors d/b/a Competition Wireline (“Competition”) for $30.0 million which provide well services, wireline services and fishing and rental services. We fundedhave continued to invest in the WEDGE acquisition primarily with $311.5 milliongrowth of borrowings underall our $400 million senior secured revolving credit facility. As of February 23, 2009, the senior secured revolving credit facility has an outstanding balance of $257.5 million, all of which maturesservice offerings through acquisitions and organic growth. On December 31, 2011, we acquired Go-Coil, LLC ("Go-Coil"), a coiled tubing service company based in February 2013.Maurice, Louisiana, to complement our existing production services offerings. Drilling services and production services are fundamental to establishing and maintaining the flow of oil and natural gas throughout the productive life atof a well site and enable us to meet multiple needs of our customers.11,10, Segment Information, of the Notes to Consolidated Financial Statements, included in Part II Item 8,Financial Statements and Supplementary Data,of this Annual Report on Form 10-K.•Drilling Services Division—Our Drilling Services Division provides contract land drilling services with its fleet of 70 drilling rigs in the following locations: Rig Count 1715 22518 North TexasDakota 9 64North Dakota6Oklahoma 5 5823, 2009, 3610, 2012, 55 drilling rigs are operating 29under drilling contracts, 44 of which are under term contracts. We have nine drilling rigs that are idle, and five drilling rigs locatedthree of which are under contract to begin working in our Oklahoma drilling division have been placed in storage or “cold stacked” due to lowdemand for drilling rigs in this region.the first quarter of 2012. We are actively marketing all our idle drilling rigs and we are earning revenue on two of these rigs through early termination fees on their drilling contracts with terms expiring in March 2009 and May 2009. We are constructing a 1500 horsepower drilling rig that we expect to be completed and available for operation in the in our North Dakota drilling division under a contract with a three year term beginning March 2009. rigs.•Production Services Division—Our Production Services Division provides a broad range of well services to oil and gas drilling and producing companies, including workover services, wireline services, and fishing and rental services. Our production services operations are managed regionally and are concentrated in the major United States onshore oil and gas producing regions in the Gulf Coast, Mid-Continent, and Rocky Mountain states. We provide our services to a diverse group of oil and gas companies. The primary productions services we offer are the following: of 74 workover rigs in seven division locations to provide these required services, including maintenance of existing wells, workover of existing wells, completion of newly-drilled wells, and plugging and abandonment of wells at the end of their useful lives. We haveacquired 15 well service rigs during 2011 and two additional well service rigs in early 2012, resulting in a premium workovertotal of 91 well service rigs in 12 locations as of February 10, 2012. Our well service rig fleet consistingconsists of sixty-nineeighty-one 550 horseposewerhorsepower rigs, fournine 600 horsepower rigs, and one 400 horsepower rig. The average age of this fleet is 1.4 years as of December 31, 2008. As of February 23, 2009, 62 workoverAll our well service rigs are currently operating and 12 workoveror are being actively marketed, with January2012 utilization of approximately 86%. We plan to add another 13 well service rigs are idle with no crews assigned.59 truck mounted wireline units in 15 division locations to provide these important logging and perforating services. We provide both open and cased-hole logging services, including the latest pulsed-neutron technology. In addition, we provide services which allow oil and gas exploration and production companies to evaluate the integrity of wellbore casing, recover pipe, or install bridge plugs. Our truck mountedWe acquired 21 wireline units have an average ageduring 2011 and four additional wireline units in early 2012, resulting in a total of 3.7 years109 wireline units in 24 locations as of December 31, 2008.February 10, 2012. We plan to add another 18 wireline units to our fleet during 2012.are often required tofrequently rent unique equipment such as power swivels, foam aircirculating units, blow-out preventers, air drilling equipment, pumps, tanks, pipe, tubing, and fishing tools. We have approximately $15 million worthprovide rental services out offour locations in Texas and Oklahoma. As of December 31, 2011 our fishing and rental tools that we provide outhave a gross book value of four locations in Texas and Oklahoma.$15.1 million.In recent months, there has been substantial volatility and a decline in oil and natural gas prices due to the deteriorating global economic environment. In addition, there has been substantial uncertainty in the capital markets and access to financing is uncertain. These conditions have adversely affected our business environment.Our customers have curtailed their drilling programs and reduced their production activities, which has resulted in a decrease in demand for drilling and production services and a reduction in day rates and utilization. In addition, certain of our customers could experience an inability to pay suppliers in the event they are unable to access the capital markets to fund their business operations. For three years before the end ofOilFrom late 2008 and into late 2009, there was substantial volatility and a decline in oil and natural gas prices declined significantly atdue to the end of 2008downturn in the global economic environment. In response, our customers curtailed their drilling programs and reduced their production activities, particularly in recent monthsnatural gas producing regions, which resulted in a deteriorating global economic environment,decrease in demand and revenue rates for certain of our drilling rigs and production services equipment. Additionally, there was uncertainty in the capital markets and access to financing was limited. These conditions adversely affected our business environment.have announced cuts inmodestly increased their exploration budgetsand production spending for 2009. We expect these reductions in oil2010 and gas exploration budgets to result in a reduction in ourindustry rig utilization and revenue rates improved, particularly in 2009. In addition,oil-producing regions and in certain shale regions. Increased natural gas production in the U.S. shale regions continues to depress natural gas prices, but oil prices continued to increase during 2011, resulting in continued increases in exploration and production spending during 2011, as compared to 2010. As a result, we may experience a shiftexperienced continued increases in industry rig utilization and revenue rates during 2011, as compared to more turnkey2010. We expect continued modest increases in exploration and footage drilling contracts from daywork drilling contracts. production spending for 2012, which we expect will result in modest increases in industry equipment utilization and revenue rates in 2012, as compared to 2011. However, if oil prices remain steady but natural gas prices further decline to historically low levels for the remainder of 2012, then industry equipment utilization and revenue rates could decrease.1A—“Risk1A – “Risk Factors” in Part I of this Annual Report on Form 10-K.6, 200910, 2012, the spot price for West Texas Intermediate crude oil was $40.17,$98.67, the spot price for Henry Hub natural gas was $4.67$2.51 and the Baker Hughes U.S. land rig count was 1,330,1,932, a 21% decrease14%increase from 1,6771,696 on February 8, 2008.4, 2011. The average weekly spot prices of West Texas Intermediate crude oil and Henry Hub natural gas, the average weekly domestic land rig count per the Baker Hughes land rig count, and the average monthly domestic workoverwell service rig count for the year ended December 31, 2008, the nine months ended December 31, 2007 and each of the previouslast five years ended March 31 were: Year Ended
December 31,
2008 Nine Months
Ended
December 31,
2007 Years Ended March 31, 2007 2006 2005 2004 $ 99.86 $ 77.42 $ 64.96 $ 59.94 $ 45.04 $ 31.47 $ 8.81 $ 6.82 $ 6.53 $ 9.10 $ 5.99 $ 5.27 1,792 1,684 1,589 1,329 1,110 964 2,514 2,394 2,376 2,271 2,087 1,996 Increased expenditures for exploration and production activities generally lead to increased demand for our drilling services and production services. Over the past several years, rising Year ended December 31, 2011 2010 2009 2008 2007 Oil (West Texas Intermediate) $ 94.94 $ 79.39 $ 61.81 $ 99.86 $ 72.71 Natural Gas (Henry Hub) $ 3.95 $ 4.35 $ 3.85 $ 8.81 $ 6.90 U.S. Land Rig Count 1,829 1,493 1,035 1,792 1,670 U.S. Well Service Rig Count 2,075 1,854 1,735 2,514 2,388 and thefrom 2004 to late 2008 resulted in corresponding increase in onshore oil and natural gas exploration and production spending led to expanded drilling and well service activity as reflected by the increases in the U.S. land rig counts and U.S. workoverwell service rig counts, overwhile declines in prices from late 2008 to late 2009 led to decreases in the previous five years.an operating expenditure. Activities designed to add hydrocarbon reserves are classified as capital expenditures, while those associated with maintaining or accelerating production are categorized as operating expenditures.even a short periodlong periods of time, capital expenditure projects are routinely deferred until prices return to an acceptable level.Our business is influenced substantially by both operating and capital expenditures by exploration and production companies. operatesoperate in active drilling markets in the United States.States and Colombia. Our long-term strategy is to maintain and leverage our position as a leading land drilling and production services company, continue to expand our relationships with existing customers, expand our customer base in the areas in which we currently operate and evolve into a premier multi-service,further enhance our geographic diversification through selective international oilfield services provider.expansion. The key elements of this long-term strategy include:•Expand our Operations into International Markets—In early 2007, we announced our intention to expand internationally and began negotiating drilling contracts Colombia. We currently have five drilling rigs located in Colombia.•Pursue Opportunities into Other Oilfield Services—We strive to mitigate the cyclical risk in oilfield services by complementing our drilling services with certain production services. Effective March 1, 2008, we acquired the production services businesses of WEDGE and Competition which provide well services, wireline services and fishing and rental services. We now have a fleet of 74 workover rigs, 59 wireline units and approximately $15 million of fishing and rental tools equipment that operate out of facilities in Texas, Kansas, North Dakota, Colorado, Utah, Montana, Louisiana and Oklahoma. We expanded our Production Services Division with the acquisitions of Paltec, Inc. (Paltec) in August 2008 and Pettus Well Service (Pettus) in October 2008, both operating in Texas.•Continue Growth with Select Capital Deployment—We intend to continue growing our business by making selective acquisitions, continuing new-build programs and / or upgrading our existing assets. Our capital investment decisions are determined by strategic fit and an analysis of the projected return on capital employed on each of those alternatives. We are currently constructing one 1500 horsepower drilling rig that we expect to be completed and available for operation in our North Dakota drilling division under a contract with a three year term beginning March 2009. In addition, we will take delivery of two new wireline units in 2009.With the recent declineMost Attractive Domestic Markets. Shale plays and non-shale oil or liquid rich environments are increasingly important to domestic hydrocarbon production and not all drilling rigs are capable of successfully drilling in these unconventional opportunities. We are currently operating in unconventional areas in the Bakken, Marcellus and Eagle Ford shales and Permian and Uintah Basins, and we intend to add ten new-build drilling rigs that will be operating in the shale plays in 2012. We also intend to continue adding capacity to our wireline, coiled tubing, and well servicing product offerings, which are well positioned to capitalize on increased shale development.natural gas prices dueproduction. We are continuously evaluating additional international expansion opportunities and intend to target international markets that share the deteriorating global economic environmentfavorable characteristics of our Colombian operations and which would allow us to deploy sufficient assets in order to realize economies of scale.expected reductions ininvestment must be consistent with our rig utilization and revenue rates in 2009, our near-term strategy is to maintain a strong balance sheet and ample liquidity. Management has initiated certain cost reduction measures including workforce and wage rate reductionsstrategic objectives. We currently have term contracts for ten new-build AC drilling rigs that are fit for purpose for domestic shale plays, five of which we estimate will reduce operating expenses during the downturnbegin working in the industry cycle. Budgeted capital expenditures for 2009 represent routine capital expenditures necessaryfirst half of 2012, with the remaining five to keepbegin operating by the end of 2012. On December 31, 2011, we acquired the coiled tubing service company, Go-Coil, to complement our equipmentexisting production services offerings. We have also significantly increased our other production services fleets with the addition of 21 wireline units and 15 well service rigs in safe2011. We expect to add another 18 wireline units, 13 well service rigs and efficient working order and limited discretionary capital expendituresthree coiled tubing units by the end of new equipment or upgrades of existing equipment. In addition, our marketing initiatives are focused on identifying regional opportunities and evaluating more turnkey drilling contract opportunities. We believe this near-term strategy will position us to take advantage of business opportunities and continue our long-term growth strategy.2012.Thethe swivel assembly sustains the weight of the drill stem, permits its rotation and affords a rotating pressure seal and passageway for circulating drilling fluid into the top of the drill string. The swivel also has a large handle that fits inside the hook assembly at the bottom of the traveling block. Drilling fluid enters the drill stem through a hose, called the rotary hose, attached to the side of the swivel. The kelly is a triangular, square or hexagonal piece of pipe, usually 40 feet long, that transmits torque from the rotary table to the drill stem and permits its vertical movement as it is lowered into the hole. The bottom end of the kelly fits inside a corresponding triangular, square or hexagonal opening in a device called the kelly bushing. The kelly bushing, in turn, fits into a part of the rotary table called the master bushing. As the master bushing rotates, the kelly bushing also rotates, turning the kelly, which rotates the drill pipe and thus the drill bit. Drilling fluid is pumped through the kelly on its way to the bottom. The rotary table, equipped with its master bushing and kelly bushing, supplies the necessary torque to turn the drill stem. The drill pipe and drill collars are both steel tubes through which drilling fluid can be pumped. Drill pipe, sometimes called drill string, comes in 30-foot sections, or joints, with threaded sections on each end. Drill collars are heavier than drill pipe and both are also threaded on the ends. Collars are used on the bottom of the drill stem to apply weight to the drilling bit. At the end of the drill stem is the bit, which chews up the formation rock and dislodges it so that drilling fluid can circulate the fragmented material back up to the surface where the circulating system filters it out of the fluid.1036 rigs (with three additional spare top drives available for installation), iron roughnecks in 3749 rigs walking(with six additional spare iron roughnecks available for installation), walking/skidding systems in one rig (with three other systems available for installation)16 rigs and automatic catwalks in twoeight rigs.Our drilling rig fleet consists of 70 rigs. Not included in our 70 drilling rig count is a 1500 horsepower rig that we expect to be completed and available for operation in our North Dakota drilling division under a contract with a three year term beginning March 2009. We own all the rigs in our fleet. With the recent decline in demand for drilling services, as of February 23, 2009, we have 36 drilling rigs operating, 29 drilling rigs are idle and five drilling rigs located in our Oklahoma division have been placed in storage or “cold stacked” due to low demand for drilling rigs in this region. We are actively marketing all our idle drilling rigs and we are earning revenues on two of these rigs through early termination fees on these drilling contracts with terms expiring in March 2009 and May 2009. Year
Ended
December 31, Nine
Months
Ended
December 31, Years ended March 31, 2008 2007 2007 2006 2005 2004 67.4 66.7 60.8 52.3 40.1 27.3 89 % 89 % 95 % 95 % 96 % 88 % Year ended December 31, 2011 2010 2009 2008 2007 Average number of operating rigs for the period 69.3 71.0 70.7 67.4 66.1 Average utilization rate 73 % 59 % 41 % 89 % 89 % 6, 2009,10, 2012, we ownedown a fleet of 8054 trucks and related transportation equipment that we use to transport our drilling rigs to and from drilling sites. By owning our own trucks, we reduce the overall cost of rig moves and reduce downtime between rig moves.and footage contracts that expose us to greater risk of loss without commensurate increases inbut which offer higher potential contract profitability.We obtain our contracts for drilling oil and gas wells either through competitive bidding or through direct negotiations with customers. Our drilling contracts generally provide for compensation on either a daywork, turnkey or footage basis. The contract terms we offer generally depend on the complexity and risk of operations, the on-site drilling conditions, the type of equipment used and the anticipated duration of the work to be performed. Generally, our contracts provide for the drilling of a single well and typically permit the customer to terminate on short notice. However, we have entered into more longer-term drilling contracts during periods of high rig demand. In addition, we generally construct new drilling rigs once we have entered into longer-term drilling contracts for such rigs. As of February 6, 2009, we had 27 contracts with terms of six months to three years in duration, of which 18 will expire by August 6, 2009, six have a remaining term of six to 12 months, one has a remaining term of 12 to 18 months and two have a remaining term in excess of 18 months. Year
Ended
December 31,
2008 Nine
Months
Ended
December 31,
2007 Year
Ended
March 31,
2007 828 606 742 10 5 2 71 66 60 909 677 804 Year ended December 31, Types of Contracts 2011 2010 2009 Daywork 655 453 323 Turnkey 17 11 14 Footage — — 1 Total number of wells 672 464 338 We provide rig-basedOur well services rig fleet provides a range of well services, including maintenance of existing wells, workover of existing wells, completion of newly-drilled wells, and plugging and abandonment of wells at the end of their useful lives.workoverwell service rigs are also used to convert former producing wells to injection wells through which water or carbon dioxide is then pumped into the formation for enhanced oil recovery operations. Workovers also include major subsurface repairs such as repair or replacement of well casing, recovery or replacement of tubing and removal of foreign objects from the well bore. These extensive workover operations are normally performed by a workoverwell service rig with additional specialized auxiliary equipment, which may include rotary drilling equipment, mud pumps, mud tanks and fishing tools, depending upon the particular type of workover operation. All of our well servicingservice rigs are designed to perform complex workover operations. A workover may require a few days to several weeks and generally requires additional auxiliary equipment. The demand for workover services is sensitive to oil and gas producers’ intermediate and long-term expectations for oil and gas prices.servicingservice rigs to minimize the use of higher cost drilling rigs in the completion process. The completion process typically requires a few days to several weeks, depending on the nature and type of the completion, and generally requires additional auxiliary equipment. Accordingly, completion services require less well-to-well mobilization of equipment and generally provide higher operating margins than regular maintenance work. The demand for completion services is directly related to drilling activity levels, which are sensitive to changes in oil and gas prices.servicingservice rigs are also used in the process of permanently closing oil and gas wells no longer capable of producing in economic quantities. Many well operators bid this work on a “turnkey” basis, requiring the service company to perform the entire job, including the sale or disposal of equipment salvaged from the well as part of the compensation received, and complying with state regulatory requirements. Plugging and abandonment work can provide favorable operating margins and is less sensitive to oil and gas pricing than drilling and workover activity since well operators must plug a well in accordance with state regulations when it is no longer productive. We perform plugging and abandonment work throughout our core areas of operation in conjunction with equipment provided by other service companies.December 31, 2008,February 10, 2012, our fleet of well service rigs totaled 7491 rigs. These rigs are located mostly in Texas, serving the Gulf Coast and ArkLaTex regions, though we also have five rigs in Louisiana and four11 rigs in North Dakota. We estimate that approximately 20% of our rigs are located in predominantly oil regions while 80% of our rigs are located in predominantly natural gas regions. Our fleet is one ofamong the youngestnewest in the industry, consisting primarily of premium, 550 HPhorsepower rigs capable of working at depths of 20,000 feet.59109 wireline trucks.units, as of February 10, 2012. We provide these services in Texas, Kansas, Colorado, Utah, Montana, North Dakota, Louisiana, Oklahoma, Wyoming and North Dakota.Mississippi. Wireline services typically utilize a single truck equipped with a spool of wireline that is used to lower and raise a variety of specialized tools in and out of the wellbore. These tools can be used to measure pressures and temperatures as well as the condition of the casing and the cement that holds the casing in place. Other applications for wireline tools include placing equipment in or retrieving equipment from the wellbore, or perforating the casing and cutting off pipe that is stuck in the well so that the free section can be recovered. Electric wireline contains a conduit that allows signals to be transmitted to or from tools located in the well. Wireline trucks are often used in place of a well servicingservice rig when there is no requirement to remove tubulars from the well in order to make repairs. Wireline trucks, like well servicingservice rigs, are utilized throughout the life of a well.servicingservice rigs are equipped with a complement of tools to complete routine operations under normal conditions for most projects in the geographic area where they are employed. When downhole problems develop with drilling or servicing operations, or conditions require non-routine equipment, our customers will usually rely on a provider of rental and fishing tools to augment equipment that is provided with a typical drilling or well servicingservice rig package. The important rental tools that we offer include air drilling equipment, foam units, power swivels, and blowout preventers.wirelinecoiled tubing units are mobile, during periods of heavy snow, ice or rain, we may not be able to move our equipment between locations.Customers
RevenueFiscal year ended December 31, 2011 Fiscal Year Ended December 31, 2008: EOG Resources, Inc.10.013.5% Ecopetrol 7.410.6% Anadarko Petroleum Corporation 6.43.6% Nine Months Ended December 31, 2007: EOG Resources, Inc. 13.1Ecopetrol 17.7 % AnadarkoWhiting Petroleum Corporation 8.88.9% 7.73.7% Fiscal Year Ended March 31, 2007: EOG Resources, Inc. 9.7Ecopetrol 16.2 % Chesapeake Operating Inc. 9.15.9% Anadarko PetroleumCabot Oil and Gas Corporation 6.15.6% Inc.Ltd. In addition to pricing and rig availability, we believe the following factors are also important to our customers in determining which drilling contractors to select:Contract drillingManyComplete ProductionSuperior Energy Services, Inc. and CC Forbes. In addition, there are numerous smaller companies that compete in our well service markets.Pioneerwe do and operate in all major U.S. oil and natural gas producing basins. Other competitors include Weatherford International, Baker Atlas,Hughes, Superior Energy Services, Basic Energy Services, and Key Energy Services. The market for wireline services is very competitive, but historically we have competed effectively with our competitors based on performance and strong customer service.whichthat provide fishing services generally compete based on the reputation of their fishing tool operators and their relationships with customers. Competition for rental tools is sometimes based on price; however, in most cases, when a customer chooses a specific fishing tool operator for a particular job, then the necessary rental equipment will be part of that job as well. Our primary competitors include:in this area include Baker Oil Tools,Hughes, Weatherford International, Basic Energy Services, Key Energy Services, Quail Tools (owned by Parker Drilling) and Knight Oil Tools.7. “Management’s7—“Management’s Discussion and Analysis of Financial Condition and Results of Operations.”We can offer no assurance that ourOur insurance or indemnification arrangements willmay not adequately protect us against liability or loss from all the hazards of our operations. The occurrence of a significant event that we have not fully insured or indemnified against or the failure of a customer to meet its indemnification obligations to us could materially and adversely affect our results of operations and financial condition. Furthermore, we may not be able to maintain adequate insurance in the future at rates we consider reasonable.to our drillingproduction services equipment is based on our estimates of the cost of comparable used equipment to replace the insured property. The policy provides for a deductible on drilling rigs of $250,000 per occurrence ($500,000 deductible for rigs with an insured value greater than $10 million)., and a deductible on production services equipment of $100,000 per occurrence. Our third-party liability insurance coverage is $51$76 million per occurrence and in the aggregate, with a deductible of $260,000 per occurrence. We believe that we are adequately insured for public liability and property damage to others with respect to our operations. However, such insurance may not be sufficient to protect us against liability for all consequences of well disasters, extensive fire damage or damage to the environment.1,9523,330 employees. Approximately 247300 of these employees are salaried administrative or supervisory employees. The rest of our employees are hourly employees working in operations for our Drilling Services Division and Production Services Division.Division and are primarily compensated on an hourly basis. The number of hourly employees in operations fluctuates depending on the utilization of our drilling rigs, workoverwell service rigs, wireline units and wirelinecoiled tubing units at any particular time. None of our employment arrangements are subject to collective bargaining arrangements.Facilitiescostspayments escalating from $26,809$29,839 per month in January 2012to $29,316$42,635 per month with a non-cancelablein December 2020, for which the lease term expiring in is cancelable as early as December 2013. 2016 with applicable penalties.4082 other real estate locations in the United States (Texas, Oklahoma, Colorado, Utah, Montana, North Dakota, Pennsylvania, Wyoming, Mississippi, Arkansas, Louisiana and Kansas) and internationally in Colombia. These real estate locations are primarily used for divisionregional offices and storage and maintenance yards. We own 10 of these real estate locations and the remaining 3072 real estate locations are leased with costspayments ranging from $175$250 per month to $8,917$30,966 per month with non-cancelable lease terms expiring through April 2013.August 2022.(“OSHA”)(OSHA) and comparable state statutes. The OSHA hazard communication standard, the Environmental Protection Agency (EPA) “community right-to-know” regulations under Title III of the Federal Superfund Amendment and Reauthorization Act and comparable state statutes require us to organize and report information about the hazardous materials we use in our operations to employees, state and local government authorities and local citizens.Web siteWebsite address iswww.pioneerdrlg.com. Our annual reports on Form 10-K, quarterly reports on Form 10-Q, current reports on Form 8-K and amendments to those reports, are available free of charge through our Website as soon as reasonably practicable after we electronically file those materials with, or furnish those materials to, the Securities and Exchange Commission. The public may read and copy these materials at the Securities and Exchange Commission’s Public Reference Room at 100 F Street, N.E., Washington, DC 20549. For additional information on the Securities and Exchange Commission’s Public Reference Room, please call 1-800-SEC-0330. In addition, the Securities and Exchange Commission maintains an Internet site atwww.sec.gov that contains reports, proxy and information statements and other information regarding issuers that file electronically. We have also posted on our Web siteWebsite our: Charters for the Audit, Compensation, and Nominating and Corporate Governance Committees of our Board; Code of Conduct and Ethics; Rules of Conduct; and Company Contact Information.Item 1A. Risk Factors by oil and gas companies operating in the geographic markets where we operate. The oil and gas exploration and production industry is a historically cyclical industry characterized by significant changes in the levels of exploration and development activities. Oil and gas prices, and market expectations of potential changes in those prices, significantly affect the levels of those activities. Worldwide political, economic, and military events as well as natural disasters have contributed to oil and gas price volatility and are likely to continue to do so in the future. Any prolonged reduction in the overall level of exploration and development activities, whether resulting from changes in oil and gas prices or otherwise, could materially and adversely affect us in many ways by negatively impacting:Many factors beyond our control affect oil and gas prices, including:the cost of exploring for, producing and delivering oil and gas;the discovery rate of new oil and gas reserves;the rate of decline of existing and new oil and gas reserves;available pipeline and other oil and gas transportation capacity;the ability of oil and gas companies to raise capital;economic conditions in the United States and elsewhere;actions by OPEC, the Organization of Petroleum Exporting Countries;political instability in the Middle East and other major oil and gas producing regions;governmental regulations, both domestic and foreign;domestic and foreign tax policy;weather conditions in the United States and elsewhere;the pace adopted by foreign governments for the exploration, development and production of their national reserves;the price of foreign imports of oil and gas; andthe overall supply and demand for oil and gas.As a result of recent declines inDuring 2009, oil and natural gas prices fell significantly below the levels seen in late 2008, and substantial uncertainty in the capital markets due to the deteriorating global economic environment, our customerswhile oil prices have reduced spending on explorationimproved during 2010 and production and this has resulted in a decrease in demand for our services. We are unable to determine whether customers and/or vendors and suppliers will be able to access financing necessary to sustain their current level of operations, fulfill their commitments and/or fund future operations and obligations. The deteriorating global economic environment may impact industry fundamentals, and the potential resulting decrease in demand for drilling and production services could adversely affect our business.Oil and natural gas prices, and market expectations of potential changes in these prices, significantly impact the level of worldwide drilling and production services activities. Oil and2011, natural gas prices have declined significantly during recent monthsremained depressed. Future declines in a deteriorating global economic environment. This declineand volatility in oil and natural gas prices as well as the current crisis in the global credit markets, have caused exploration and production companies to reduce their overall level of drilling and production services activity and spending. When drilling and production activity and spending declines, both day rates and utilization have historically declined. As a result, the recent declines in oil and natural gas prices and the global economic crisis could materially and adversely affect our business and financial results.Moreover, the deteriorating global economic environment may impact fundamentals that are critical to our industry, such as the global demand for, and consumption of, oil and natural gas. Reduced demand for oil and natural gas generally results in lower prices for these commodities and may impact the economics of planned drilling projects and ongoing production projects, resulting in the curtailment, reduction, delay or postponement of such projects for an indeterminate period of time. Companies that planned to finance exploration, development or production projects through the capital markets may be forced to curtail, reduce, postpone or delay drilling or production services activities, and also may experience inability to pay suppliers. The deteriorating global economic environment could also impact our vendors and suppliers’ ability to meet obligations to provide materials and services in general. If any of the foregoing were to occur, it could have a material adverse effect on our business and financial results.workover and well-servicingwell service rigs are mobile and can be moved from one market to another in response to market conditions heightens the competition in the industry and may result in an oversupply of rigs in an area. Contract drilling companies and other oilfield service companies compete primarily on a regional basis, and the intensity of competition may vary significantly from region to region at any particular time. If demand for drilling or production services improves in a region where we operate, our competitors might respond by moving in suitable rigs from other regions. An influx of rigs from other regions could rapidly intensify competition, reduce profitability and make any improvement in demand for drilling or production services short-lived.workover and well-servicingwell service rigs;workover and well-servicingwell service rigs intensifies price competition and makes it more difficult for us to compete on the basis of factors other than price. In all of the markets in which we compete, an oversupply of rigs can cause greater price competition, which can reduce our profitability.Manymaywill continue to represent a component of our future revenues. The occurrence of uninsured or under-insured losses or operating cost overruns on our turnkey jobs could have a material adverse effect on our financial position andlogging.Underlogging. Under typical turnkey drilling arrangements, we do not receive progress payments and are paid by our customer only after we have performed the terms of the drilling contract in full. For these reasons, the risk to us under a turnkey drilling contract is substantially greater than for a well drilled on a daywork basis because we must assume most of the risks associated with drilling operations that the operator generally assumes under a daywork contract, including the risks of blowout, loss of hole, stuck drill pipe, machinery breakdowns, abnormal drilling conditions and risks associated with subcontractors’ services, supplies, cost escalations and personnel. Similar to our turnkey contracts, under a footage contract we assume most of the risks associated with drilling operations that the operator generally assumes under a daywork contract.workover and well-servicingwell services industries, including the risks of:We face increased exposure to operating difficulties because we primarily focus on providing drilling and production services for natural gas.Most of our drilling and production contracts are with exploration and production companies in search of natural gas. Drilling on land for natural gas generally occurs at deeper drilling depths than drilling for oil. Although deep-depth drilling and production services expose us to risks similar to risks encountered in shallow-depth drilling and production services, the magnitude of the risk for deep-depth drilling and production services is greater because of the higher costs and greater complexities involved in providing drilling and production services for deep wells. We generally do not insure risks related to operating difficulties other than blowouts. If we do not adequately insure the increased risk from blowouts or if our contractual indemnification rights are insufficient or unfulfilled, our profitability and other results of operations and our financial condition could be adversely affected in the event we encounter blowouts or other significant operating difficulties while providing drilling or production services at deeper depths.Our current primary focus on drilling for customers in search of natural gas could place us at a competitive disadvantage if we were to change our primary focus to drilling for customers in search of oil.Our drilling rig fleet consists of rigs capable of drilling on land at drilling depths of 6,000 to 18,000 feet because most of our contracts are with customers drilling in search of natural gas, which generally occurs at deeper drilling depths than drilling in search of oil, which often occurs at drilling depths less than 6,000 feet. Generally, larger drilling rigs capable of deep drilling generally incur higher mobilization costs than smaller drilling rigs drilling at shallower depths. If our primary focus shifts from drilling for customers in search of natural gas to drilling for customers in search of oil, the majority of our rig fleet would be disadvantaged in competing for new oil drilling projects as compared to competitors that primarily use shallower drilling depth rigs when drilling in search of oil.are occurringhave occurred in our industry. If we should suffer any material loss of personnel to competitors or be unable to employ additional or replacement personnel with the requisite level of training and experience to adequately operate our equipment, our operations could be materially and adversely affected. A significant increase in the wages paid by other employers could result in a reduction in our workforce, increases in wage rates, or both. The occurrence of either of these events for a significant period of time could have a material and adverse effect on our financial condition and results of operations.March 31, 2003,September 1999, we have significantly expanded our drilling rig fleet has increased from 24 to 70 drilling rigs, as a result ofthrough acquisitions and rig construction. In addition, duringthrough the first quarterconstruction of rigs from new and used components, and in March 2008, we completedsignificantly expanded our service offerings with the acquisition of thetwo production services businesses, which provide well services, wireline services and fishing and rental services. On December 31, 2011, we acquired the coiled tubing services business of WEDGE and Competition.For several yearshave had little or no long-term debt. In connection withacquired in 2008, and more recently, the acquisition of the production services businesses of WEDGE and Competition, we entered into a new $400 million, five-year, senior secured revolving credit facility. As of Go-Coil in 2011. At December 31, 2008,2011, our total debt was approximately $272.5 million.and in industry and market conditions;senior secured revolving credit facilityRevolving Credit Facility should allow us to meet our routine financial obligations for the foreseeable future. However, our ability to make payments on our indebtedness, and to fund planned capital expenditures, will depend on our ability to generate cash in the future. This, to a certain extent, is subject to conditions in the oil and gas industry, general economic and financial conditions, competition in the markets where we operate, the impact of legislative and regulatory actions on how we conduct our business and other factors, all of which are beyond our control. If our business does not generate sufficient cash flow from operations to service our outstanding indebtedness, we may have to undertake alternative financing plans, such as:senior secured revolving credit facilityRevolving Credit Facility or other instruments governing any future indebtedness, we could be in default under the terms of our senior secured revolving credit facilityRevolving Credit Facility or such instruments. In the event of a default, the Lenderslenders under our senior secured revolving credit facilityRevolving Credit Facility could elect to declare all the loans made under such facility to be due and payable together with accrued and unpaid interest and terminate their commitments thereunder and we or one or more of our subsidiaries could be forced into bankruptcy or liquidation. Any of the foregoing consequences could materially and adversely affect our business, financial condition, results of operations and prospects.senior secured revolving credit facility imposesRevolving Credit Facility and our Senior Notes impose restrictions on us that may affect our ability to successfully operate our business.senior secured revolving credit facilityRevolving Credit Facility limits our ability to take various actions, such as:senior secured revolving credit facilityRevolving Credit Facility requires us to maintain certain financial ratios and to satisfy certain financial conditions, which may require us to reduce our debt or take some other action in order to comply with them.financialrestrictions or conditions such as financial ratios orcovenants, would cause an event of default under our senior secured revolving credit facility.Revolving Credit Facility or our Senior Notes. An event of default, if not waived, could result in acceleration of the outstanding indebtedness, under our senior secured revolving credit facility, in which case the debt would become immediately due and payable. If this occurs, we may not be able to pay our debt or borrow sufficient funds to refinance it. Even if new financing is available, it may not be available on terms that are acceptable to us. These restrictions could also limit our ability to obtain future financings,financing, make needed capital expenditures, withstand a downturn in our business or the economy in general, or otherwise conduct necessary corporate activities. We also may be prevented from taking advantage of business opportunities that arise because of the limitations imposed on us by the restrictive covenants under our senior secured revolving credit facility.Our combinedhistoryrestrictions or delays in the completion of oil and natural gas wells that may not be sufficientreduce demand for investors to evaluate our businessdrilling and prospects.The acquisition of the production services businesses of WEDGEwell servicing activities and Competition significantly expandedcould adversely affect our operations and assets. Our historical combined financial statements include financial information based on the separate production services businesses of WEDGE and Competition. As a result, the historical and pro forma information presented may not provide an accurate indication of what our actual results would have been if the acquisition of the production services businesses of WEDGE and Competition had been completed at the beginning of the periods presented or of what our futureposition, results of operations and cash flows.likelyexpected to be. Our futurebe available by late 2012 and the final results of which are expected in 2014. The U.S. Department of the Interior has also announced that it will dependpropose regulations relating to the use of hydraulic fracturing techniques on public lands and disclosure of fracturing fluid constituents. In addition, some states and localities have adopted, and others are considering adopting, regulations or ordinances that could restrict hydraulic fracturing in certain circumstances, that would require, with some exceptions, disclosure of constituents of hydraulic fracturing fluids, or that would impose higher taxes, fees or royalties on natural gas production. Moreover, public debate over hydraulic fracturing and shale gas production has been increasing, and has resulted in delays of well permits in some areas.ability to efficiently managecustomers. The adoption of any federal, state or local laws or the implementation of regulations or ordinances restricting or increasing the costs of hydraulic fracturing could cause a decrease in the completion of new oil and natural gas wells and an associated decrease in demand for our combineddrilling and well servicing activities, any or all of which could adversely affect our financial position, results of operations and execute our business strategy.Corporation ActOrganizations Code and other applicable laws and by our credit facilities. Our debt arrangements include provisions that generally prohibit us from paying dividends on our capital stock, including our common stock.We may continue to experience market conditions that could adversely affect the liquidity of our auction rate preferred security investment.At December 31, 2008, we held $15.9 million (par value) of investments comprised of tax exempt, auction rate preferred securities (“ARPSs”), which are variable-rate preferred securities and have a long-term maturity with the interest rate being reset through “Dutch auctions” that are held every 7 days. The ARPSs have historically traded at par because of the frequent interest rate resets and because they are callable at par at the option of the issuer. Interest is paid at the end of each auction period. Our ARPSs are AAA/Aaa rated securities, collateralized by municipal bonds and backed by assets that are equal to or greater than 200% of the liquidation preference. Until February 2008, the auction rate securities market was highly liquid. Beginning mid-February 2008, we experienced several “failed” auctions, meaning that there was not enough demand to sell all of the securities that holders desired to sell at auction. The immediate effect of a failed auction is that such holders cannot sell the securities at auction and the interest rate on the security resets to a maximum auction rate. We have continued to receive interest payments on our ARPSs in accordance with their terms. Unless a future auction is successful or the issuer calls the security pursuant to redemption prior to maturity, we may not be able to access the funds we invested in our ARPSs without a loss of principal. We have no reason to believe that any of the underlying municipal securities that collateralize our ARPSs are presently at risk of default. We believe we will ultimately be able to liquidate our investments without material loss primarily due to the collateral securing the ARPSs. We do not currently intend to attempt to sell our ARPSs at a discount since our liquidity needs are expected to be met with cash flows from operating activities and our senior secured revolving credit facility. Our ARPSs are designated as available-for-sale and are reported at fair market value with the related unrealized gains or losses, included in accumulated other comprehensive income (loss), net of tax, a component of shareholders’ equity. The estimated fair value of our ARPSs at December 31, 2008 was $13.9 million compared with a par value of $15.9 million. The $2.0 million difference represents a fair value discount due to the current lack of liquidity which is considered temporary and is recorded as an unrealized loss. We would recognize an impairment charge if the fair value of our investments falls below the cost basis and is judged to be other-than-temporary. Our ARPSs are classified with other long-term assets on our consolidated balance sheet as of December 31, 2008 because of our inability to the determine recovery period of our investments.Item 1B. Unresolved Staff Comments Item 2. Properties Overview of Our Segments and Services”General” and “Business—Facilities” in Item 1 of this report. We consider each of our significant properties to be suitable for its intended use.Item 3. Legal Proceedings Item 4. Submission of Matters to a Vote of Security HoldersMine Safety DisclosuresWe did not submit any matter to a vote of our shareholders during the quarter ended December 31, 2008.Item 5. Market for Registrant’s Common Equity, Related Shareholder Matters and Issuer Purchases of Equity Securities 6, 2009, 49,997,57810, 2012, 61,828,317 shares of our common stock were outstanding, held by 560488 shareholders of record. The number of record holders does not necessarily bear any relationship to the number of beneficial owners of our common stock.American Stock Exchange (NYSE Alternext US)NYSE Amex under the symbol “PDC.” The following table sets forth, for each of the periods indicated, the high and low sales prices per share on the American Stock Exchange (NYSE Alternext US): Low High $ 10.59 $ 16.70 15.29 20.64 12.49 18.82 4.85 13.09 $ 12.69 $ 16.00 11.81 14.88 11.49 12.49 $ 12.60 $ 18.00 10.79 15.70 11.57 14.65 11.46 13.47 Low High Fiscal year ended December 31, 2011 First Quarter $ 8.24 $ 13.80 Second Quarter 11.89 16.17 Third Quarter 7.18 17.70 Fourth Quarter 6.41 11.78 Fiscal year ended December 31, 2010 First Quarter $ 6.89 $ 9.79 Second Quarter 5.24 7.92 Third Quarter 5.40 6.90 Fourth Quarter 6.04 9.03 Fiscal year ended December 31, 2009 First Quarter $ 3.28 $ 6.70 Second Quarter 3.46 6.88 Third Quarter 3.96 7.34 Fourth Quarter 6.00 8.16 American Stock Exchange (NYSE Alternext US)NYSE Amex on February 6, 200910, 2012 was $5.08$9.29 per share.No sharesour common stock were purchased by or on behalf of our company or any affiliated purchaserequity securities during the fiscal yearquarter ended December 31, 2008.Period October 1 - October 31 — — — — November 1 - November 30 — — — — December 1 - December 31 32,460 $8.98 — — Total 32,460 $8.98 — — (1) (2) The calculation of the average price paid per share does not give effect to any fees, commissions or other costs associated with the repurchase of such shares. 20032006 to December 31, 2008,2011, the cumulative total shareholder return on our common stock with the (1) cumulative total return on the companies that comprise the AMEX Composite Index (2)and both an old peer group index that includes the five companies that primarily provide contract drilling services, and (3) a new peer group index that includesinclude five and six companies, respectively, that provide contract drilling services and / or production services. With the acquisition of WEDGE and Competition on March 1, 2008, we expanded our operations beyond providing only contract drilling services and began providing production services. We believe the companies included in the new peer group index better reflect our peers with similar service offerings. The comparison assumes that $100 was invested on December 31, 20032006 in our common stock, the companies that compose the AMEX Composite Index and the companies that compose the old and new peer group indexes, and further assumes all dividends were reinvested. peer group index are Helmerich & Payne, Inc., Grey Wolf, Inc., Patterson-UTI Energy, Inc., Nabors Industries Ltd. and Unit Corp. The companies that comprise the new peer group index are Patterson-UTI Energy, Inc., Nabors Industries Ltd., Bronco Drilling Company, Precision Drilling Trust and Key Energy Services.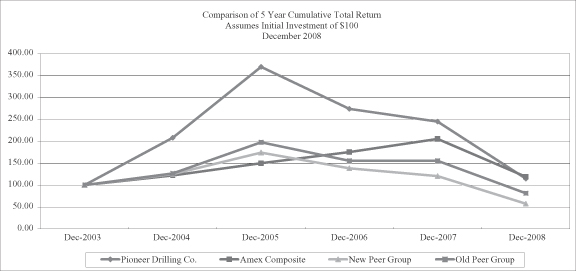
Equity Compensation Plan InformationThe During 2011, Bronco Drilling Company was acquired by a competing energy company and Union Drilling, Inc. and Basic Energy Services, Inc. were added to the peer group. Therefore, the companies that comprise the new peer group index are Patterson-UTI Energy, Inc., Nabors Industries Ltd., Union Drilling, Inc., Basic Energy Services, Inc., Precision Drilling Trust and Key Energy Services. For comparative purposes, both the old and new peer group indexes are reflected in the following table provides information on our equity compensation plans as of December 31, 2008: Number of securities to be
issued upon exercise of
outstanding options,
warrants and rights Weighted-average
exercise price per share
of outstanding options,
warrants and rights Number of securities
remaining available for
future issuance under
equity compensation plans
(1) 3,769,695 $ 12.85 2,035,073 — — — 3,769,695 $ 12.85 2,035,073 (1)Includes 822,489 shares that may be issued in the form of restricted stock or restricted stock units under the Amended and Restated Pioneer Drilling Company 2007 Incentive Plan.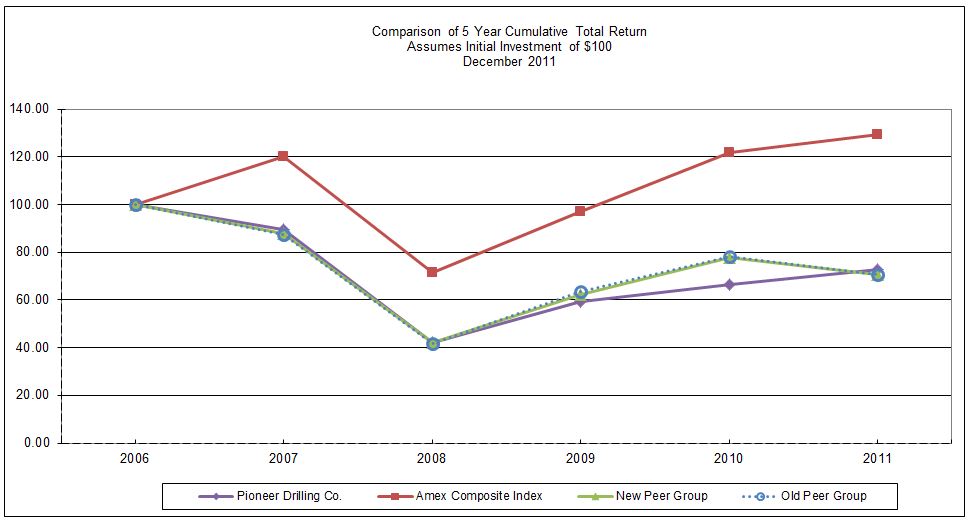
Item 6. Selected Financial Data YouThis information should review this informationbe reviewed in conjunction with “Management’s Discussion and Analysis of Financial Condition and Results of Operations” in Item 7 of this report and the historical financial statements and related notes this report contains. Year Ended
December 31,
2008 (1)(2) Nine months
Ended
December 31,
2007 Years Ended March 31, 2007 2006 2005 (In thousands, except per share amounts) $ 610,884 $ 313,884 $ 416,178 $ 284,148 $ 185,246 (43,954 ) 55,260 126,976 77,909 18,774 (56,688 ) 57,774 130,789 79,813 17,161 (62,745 ) 39,645 84,180 50,567 10,812 $ (1.26 ) $ 0.80 $ 1.70 $ 1.08 $ 0.31 $ (1.26 ) $ 0.79 $ 1.68 $ 1.06 $ 0.30 $ 186,391 $ 115,455 $ 131,530 $ 97,084 $ 33,665 (505,615 ) (123,858 ) (137,960 ) (125,217 ) (75,320 ) 269,342 161 201 49,634 109,513 148,096 128,038 147,230 128,871 80,388 As of December 31, As of March 31, 2008 (1) 2007 2007 2006 2005 (In thousands) $ 64,372 $ 99,807 $ 124,089 $ 106,904 $ 76,327 627,562 417,022 342,901 260,783 170,566 262,115 — — — 13,445 414,118 471,072 428,109 340,676 221,615 824,479 560,212 501,495 400,678 276,009 Year ended December 31, Nine months ended December 31, 2007 2011(1) 2010(1) 2009(1) 2008(1)(2) (In thousands, except per share amounts) Statement of Operations Data: Revenues $ 715,941 $ 487,210 $ 325,537 $ 610,884 $ 313,884 Income (loss) from operations 57,458 (18,572 ) (31,840 ) (43,954 ) 55,260 Income (loss) before income taxes 20,833 (47,558 ) (40,172 ) (56,688 ) 57,774 Net earnings (loss) applicable to common stockholders 11,177 (33,261 ) (23,215 ) (62,745 ) 39,645 Earnings (loss) per common share-basic $ 0.19 $ (0.62 ) $ (0.46 ) $ (1.26 ) $ 0.80 Earnings (loss) per common share-diluted $ 0.19 $ (0.62 ) $ (0.46 ) $ (1.26 ) $ 0.79 Other Financial Data: Net cash provided by operating activities $ 144,879 $ 98,351 $ 123,313 $ 186,635 $ 115,455 Net cash used in investing activities (307,484 ) (129,481 ) (113,909 ) (505,615 ) (123,858 ) Net cash provided by financing activities 226,791 12,762 4,154 269,098 161 Capital expenditures 237,787 135,151 110,453 148,096 128,038 As of December 31, 2011(1) 2010(1) 2009(1) 2008(1) 2007 (In thousands) Balance Sheet Data: Working capital $ 129,932 $ 76,142 $ 90,336 $ 64,372 $ 99,807 Property and equipment, net 793,956 655,508 637,022 627,562 417,022 Long-term debt and capital lease obligations, excluding current installments 418,728 279,530 258,073 262,115 — Shareholders’ equity 510,445 396,333 421,448 414,118 471,072 Total assets 1,172,754 841,343 824,955 824,479 560,212 (1) yearyears ended December 31, 2011, 2010, 2009 and 2008 and the balance sheet data as of December 31, 2011, 2010, 2009 and 2008 includesinclude the impact of the acquisitions of WEDGE and Competition, both of which occurred on March 1, 2008. See Note 2 to Consolidated Financial Statements, included in Part II, Item 8, Financial Statements and Supplementary Data, of this Annual Report on Form 10-K.(2) See Note 1 to Consolidated Financial Statements, included in Part II, Item 8, Financial Statements and Supplementary Data, of this Annual Report on Form 10-K.Item 7. Management’s Discussion and Analysis of Financial Condition and Results of Operations or could also have material adverse effecteffects on actual results of matters that are the subject of our forward-looking statements. All forward-looking statements speak only as the date on which they are made and we undertake no duty to update or revise any forward-looking statements. We advise our shareholders that they should (1) be aware that important factors not referred to above could affect the accuracy of our forward-looking statements and (2) use caution and common sense when considering our forward-looking statements.Our companyPioneer Drilling Company was incorporated under the laws of the State of Texas in 1979 as the successor to a business that had been operating since 1968. Over the years, our business has grown through acquisitions and through organic growth. Since September 1999, we have significantly expanded our drilling rig fleet by adding 42 rigs through acquisitions and by adding 27 rigs through the construction of rigs from new and used components. OnIn March 1, 2008, we significantly expanded our service offerings when we acquiredwith the acquisition of two production services businesses, of WEDGE Group Incorporated (“WEDGE”) for $314.7 million and Prairie Investors d/b/a Competition Wireline (“Competition”) for $30.0 million which provide well services, wireline services and fishing and rental services. We fundedhave continued to invest in the WEDGE acquisition primarily with $311.5 milliongrowth of borrowings underall our $400 million senior secured revolving credit facility. As of February 23, 2009, the senior secured revolving credit facility had an outstanding balance of $257.5 million, all of which maturesservice offerings through acquisitions and organic growth. On December 31, 2011, we acquired Go-Coil, LLC ("Go-Coil"), a coiled tubing service company based in February 2013.Maurice, Louisiana, to complement our existing production services offerings. Drilling services and production services are fundamental to establishing and maintaining the flow of oil and natural gas throughout the productive life atof a well site and enable us to meet multiple needs of our customers.11,10, Segment Information, of the Notes to Consolidated Financial Statements, included in Part II, Item 8,Financial Statements and Supplementary Data,of this Annual Report on Form 10-K.•Drilling Services Division—Our Drilling Services Division provides contract land drilling services with its fleet of 70 drilling rigs in the following locations: Rig Count 1715 22518 North TexasDakota 9 64North Dakota6Oklahoma 5 5823, 2009, 3610, 2012, 55 drilling rigs are operating 29under drilling contracts, 44 of which are under term contracts. We have nine drilling rigs that are idle, and five drilling rigs locatedthree of which are under contract to begin working in our Oklahoma drilling division have been placed in storage or “cold stacked” due to low demand for drilling rigs in this region.the first quarter of 2012. We are actively marketing all our idle drilling rigs and we are earning revenue on two of these rigs through early termination fees on their drilling contracts with a term expiring in March 2009 and May 2009. We are constructing a 1500 horsepower drilling rig that we expect to be completed and available for operation in the in our North Dakota drilling division under a contract with a three year term beginning March 2009. rigs.•Production Services Division—Our Production Services Division provides a broad range of well services to oil and gas drilling and producing companies, including workover services, wireline services, and fishing and rental services. Our production services operations are managed regionally and are concentrated in the major United States onshore oil and gas producing regions in the Gulf Coast, Mid-Continent, and Rocky Mountain states. We provide our services to a diverse group of oil and gas companies. The primary productions services we offer are the following: of 74 workover rigs in seven division locations to provide these required services, including maintenance of existing wells, workover of existing wells, completion of newly-drilled wells, and plugging and abandonment of wells at the end of their useful lives. We haveacquired 15 well service rigs during 2011 and two additional well service rigs in early 2012, resulting in a premium workovertotal of 91 well service rigs in 12 locations as of February 10, 2012. Our well service rig fleet consistingconsists of sixty-nineeighty-one 550 horseposewerhorsepower rigs, fournine 600 horsepower rigs, and one 400 horsepower rig. The average age of this fleet is 1.4 years as of December 31, 2008. As of February 23, 2009, 62 workoverAll our well service rigs are currently operating and 12 workoveror are being actively marketed, with January 2012 utilization of approximately 86%. We plan to add another 13 well service rigs are idle with no crews assigned.59 truck mounted wireline units in 15 division locations to provide these important logging and perforating services. We provide both open and cased-hole logging services, including the latest pulsed-neutron technology. In addition, we provide services which allow oil and gas exploration and production companies to evaluate the integrity of wellbore casing, recover pipe, or install bridge plugs. We acquired 21 wireline units during 2011 and four additional wireline units in early 2012, resulting in a total of 109 wireline units in 24 locations as of February 10, 2012. We plan to add another 18 wireline units to our fleet during 2012.We provide both open and cased-hole logging services, including the latest pulsed-neutron technology. In addition, we provide services which allow oil and gas companies to evaluate the integrity of wellbore casing, recover pipe, or install bridge plugs. Our truck mounted wireline units have an average age of 3.7 years as of December 31, 2008.are often required tofrequently rent unique equipment such as power swivels, foam aircirculating units, blow-out preventers, air drilling equipment, pumps, tanks, pipe, tubing, and fishing tools. We have approximately $15 million worthprovide rental services out offour locations in Texas and Oklahoma. As of December 31, 2011 our fishing and rental tools that we provide outhave a gross book value of four locations in Texas and Oklahoma.$15.1 million.In recent months, there has been substantial volatility and a decline in oil and natural gas prices due to the deteriorating global economic environment. In addition, there has been substantial uncertainty in the capital markets and access to financing is uncertain. These conditions have adversely affected our business environment. Our customers have curtailed their drilling programs and reduced their production activities, which has resulted in a decrease in demand for drilling and production services and a reduction in day rates and utilization. In addition, certain of our customers could experience an inability to pay suppliers in the event they are unable to access the capital markets to fund their business operations. For three years before the end ofOilFrom late 2008 and into late 2009, there was substantial volatility and a decline in oil and natural gas prices declined significantly atdue to the end of 2008downturn in the global economic environment. In response, our customers curtailed their drilling programs and reduced their production activities, particularly in recent monthsnatural gas producing regions, which resulted in a deteriorating global economic environment,decrease in demand and revenue rates for certain of our drilling rigs and production services equipment. Additionally, there was uncertainty in the capital markets and access to financing was limited. These conditions adversely affected our business environment.have announced cuts inmodestly increased their exploration budgetsand production spending for 2009. We expect these reductions in oil2010 and gas exploration budgets to result in a reduction in ourindustry rig utilization and revenue rates improved, particularly in 2009. In addition,oil-producing regions and in certain shale regions. Increased natural gas production in the U.S. shale regions continues to depress natural gas prices, but oil prices continued to increase during 2011, resulting in continued increases in exploration and production spending during 2011, as compared to 2010. As a result, we may experience a shiftexperienced continued increases in industry rig utilization and revenue rates during 2011, as compared to more turnkey2010. We expect continued modest increases in exploration and footage drilling contracts from daywork drilling contracts. production spending for 2012, which we expect will result in modest increases in industry equipment utilization and revenue rates in 2012, as compared to 2011. However, if oil prices remain steady but natural gas prices further decline to historically low levels for the remainder of 2012, then industry equipment utilization and revenue rates could decrease.1A—“Risk1A – “Risk Factors” in Part I of this Annual Report on Form 10-K.6, 200910, 2012, the spot price for West Texas Intermediate crude oil was $40.17,$98.67, the spot price for Henry Hub natural gas was $4.67$2.51 and the Baker Hughes U.S. land rig count was 1,330,1,932, a 21% decrease14%increase from 1,6771,696 on February 8, 2008.4, 2011. The average weekly spot prices of West Texas Intermediate crude oil and Henry Hub natural gas, the average weekly domestic land rig count per the Baker Hughes land rig count, and the average monthly domestic workoverwell service rig count for the year ended December 31, 2008, the nine months ended December 31, 2007 and each of the previouslast five years ended March 31 were: Year Ended
December 31,
2008 Nine Months
Ended
December 31,
2007 Years Ended March 31, 2007 2006 2005 2004 $ 99.86 $ 77.42 $ 64.96 $ 59.94 $ 45.04 $ 31.47 $ 8.81 $ 6.82 $ 6.53 $ 9.10 $ 5.99 $ 5.27 1,792 1,684 1,589 1,329 1,110 964 2,514 2,394 2,376 2,271 2,087 1,996 Increased expenditures for exploration and production activities generally leads to increased demand for our drilling services and production services. Over the past several years, rising Year ended December 31, 2011 2010 2009 2008 2007 Oil (West Texas Intermediate) $ 94.94 $ 79.39 $ 61.81 $ 99.86 $ 72.71 Natural Gas (Henry Hub) $ 3.95 $ 4.35 $ 3.85 $ 8.81 $ 6.90 U.S. Land Rig Count 1,829 1,493 1,035 1,792 1,670 U.S. Well Service Rig Count 2,075 1,854 1,735 2,514 2,388 and thefrom 2004 to late 2008 resulted in corresponding increase in onshore oil and natural gas exploration and production spending led to expanded drilling and well service activity as reflected by the increases in the U.S. land rig counts and U.S. workoverwell service rig counts, overwhile declines in prices from late 2008 to late 2009 led to decreases in the previous five years.With the recent declineU.S. land rig counts and U.S. well service rig counts. Since late 2009, increases primarily in oil prices have caused increases in exploration and natural gas prices due to the deteriorating global economic environmentproduction spending and the expected reductionscorresponding increases in our rig utilizationdrilling and revenue rates in 2009, our near-term strategy is to maintain a strong balance sheet and ample liquidity. Management has initiated certain cost reduction measures including workforce and wage rate reductions that will reduce operating expenses during the downturnwell services activities are reflected by increases in the industry cycle. BudgetedU.S. land rig counts and the U.S. well service rig counts in 2010 and 2011.for 2009 represent routine capital expenditures necessary to keep our equipment in safeby exploration and efficient working order and limited discretionary capital expenditures of new equipment or upgrades of existing equipment. In addition, our marketing initiatives are focused on identifying regional opportunities and evaluating more turnkey drilling contract opportunities. We believe this near-term strategy will position us to take advantage of business opportunities and continue our long-term growth strategy.an operating expenditure. Activities designed to add hydrocarbon reserves are classified as capital expenditures, while those associated with maintaining or accelerating production are categorized as operating expenditures.even a short periodlong periods of time, capital expenditure projects are routinely deferred until prices return to an acceptable level.Our business is influenced substantially by both operating and capital expenditures by exploration and production companies. of: (i)of cash and cash equivalents (which equaled $26.8$86.2 million as of December 31, 2008); (ii)2011), cash generated from operations;operations, and (iii) the unused portion of our senior secured revolving credit facility (the “Revolving Credit Facility”).haswere used to fund the acquisition of Go-Coil in December 2011.$133.2$241.0 million as of February 23, 2009. under our Revolving Credit Facility. There are no limitations on our ability to access the full borrowing availability under the senior secured revolving credit facilityRevolving Credit Facility other than maintaining compliance with the covenants in the credit agreement. Our principal liquidity requirements have been for working capital needs, capital expenditures and acquisitions.On February 29, 2008, we entered into a credit agreement with Wells Fargo Bank, N.A. and a syndicate of lenders (collectivelyRevolving Credit Facility. Additional information regarding these covenants is provided in the “Lenders”). The credit agreement provides for a senior secured revolving credit facility, with sub-limits for letters of credit and a swing-line facility of up to an aggregate principal amount of $400 million, all of which mature on February 28, 2013. The senior secured revolving credit facility and the obligations thereunder are secured by substantially all our domestic assets and are guaranteed by certain of our domestic subsidiaries.senior secured revolving credit facility bear interest, at our option, atthe bank prime rate or at the LIBOR rate, plus an applicable per annum margin in each case. The applicable per annum margin is determined based upon our leverage ratio in accordance with a pricing grid in the credit agreement. The per annum margin for LIBOR rate borrowings ranges from 1.50% to 2.50% and for bank prime rate borrowings ranges from 0.50% to 1.50%. Based on the terms in the credit agreement, the LIBOR margin and bank prime rate margin in effect until delivery of our financial statements and the compliance certificate for December 31, 2008 were 2.25% and 1.25%, respectively. A commitment fee is due quarterly based on the average daily unused amount of the commitments of the Lenders under the senior secured revolving credit facility. In addition, a fronting fee is due for each letter of credit issued and a quarterly letter of credit fee is due based on the average undrawn amount of letter of credit outstanding during such period. We may repay the senior secured revolving credit facility balance outstanding in whole or in part at any time without premium or penalty. The senior secured revolving credit facility replaced the $20.0 million credit facility we previously had with Frost National Bank. Borrowings under the senior secured revolving credit facility were used to fund the WEDGE acquisition andRevolving Credit Facility are available for futureselective acquisitions, working capital and other general corporate purposes.At February 23, 2009, we had $257.5 million outstanding under the revolving portion of the senior secured revolving credit facility$9.3 million in committed letters of credit. Under the terms of the credit agreement, committed letters of credit are applied against our borrowing capacity under the senior secured revolving credit facility. The borrowing availability under the senior secured revolving credit facility was $133.2 million at February 23, 2009. Principal payments of $15.0 million made after December 31, 2008 are classified in the current portion of long-term debt as of December 31, 2008. The outstanding balancecash equivalents, cash generated from operations and available borrowings under our senior secured credit facility is not due until maturity on February 28, 2013. However, when cash and working capital is sufficient, we may make principal paymentsRevolving Credit Facility are adequate to reduce the outstanding debt balance prior to maturity.At December 31, 2008, we held $15.9 million (par value) of investments comprised of tax exempt, auction rate preferred securities (“ARPSs”), which are variable-rate preferred securities and have a long-term maturity with the interest rate being reset through “Dutch auctions” that are held every 7 days. The ARPSs have historically traded at par because of the frequent interest rate resets and because they are callable at par at the option of the issuer. Interest is paid at the end of each auction period. Our ARPSs are AAA/Aaa rated securities, collateralized by municipal bonds and backed by assets that are equal to or greater than 200% of the liquidation preference. Until February 2008, the auction rate securities market was highly liquid. Beginning mid-February 2008, we experienced several “failed” auctions, meaning that there was not enough demand to sell all of the securities that holders desired to sell at auction. The immediate effect of a failed auction is that such holders cannot sell the securities at auction and the interest rate on the security resets to a maximum auction rate. We have continued to receive interest payments on our ARPSs in accordance with their terms. Unless a future auction is successful or the issuer calls the security pursuant to redemption prior to maturity, we may not be able to access the funds we invested in our ARPSs without a loss of principal. We have no reason to believe that any of the underlying municipal securities that collateralize our ARPSs are presently at risk of default. We believe we will ultimately be able to liquidate our investments without material loss primarily due to the collateral securing the ARPSs. We do not currently intend to attempt to sell our ARPSs at a discount sincecover our liquidity needs are expected to be met with cash flows from operating activities and our senior secured revolving credit facility. Our ARPSs are designated as available-for-sale and are reportedrequirements for at fair market value withleast the related unrealized gains or losses, included in accumulated other comprehensive income (loss), net of tax, a component of shareholders’ equity. The estimated fair value of our ARPSs at December 31, 2008 was $13.9 million compared with a par value of $15.9 million. The $2.0 million difference represents a fair value discount due to the current lack of liquidity which is considered temporary and is recorded as an unrealized loss. We would recognize an impairment charge if the fair value of our investments falls below the cost basis and is judged to be other-than-temporary. Our ARPSs are classified with other long-term assets on our consolidated balance sheet as of December 31, 2008 because of our inability to determine the recovery period of our investments.On March 1, 2008, we acquired theDecember 31, 2011 and 2010, our primary uses of capital resources were for acquisitions of production services business of WEDGE which provided well services, wireline servicesbusinesses and fishing and rental services with a fleet of 62 workover rigs, 45 wireline units and approximately $13 million of fishing and rental tools equipment through facilities in Texas, Kansas, North Dakota, Colorado, Montana, Utah and Oklahoma. The aggregate purchase price for the acquisition was approximately $314.7 million, which consisted of assets acquired of $340.8 million and liabilities assumed of $26.1 million. The aggregate purchase price included $3.4 million of costs incurred to acquire the production services business from WEDGE. We financed the acquisition with approximately $3.2 million of cash on hand and $311.5 million of debt incurred under our new $400 million senior secured revolving credit facility.On March 1, 2008, immediately following the acquisition of the production services business from WEDGE, we acquired the production services business from Competition which provided wireline services with a fleet of 6 wireline units through its facilities in Montana. The aggregate purchase price for the Competition acquisition was approximately $30.0 million, which consisted of assets acquired of $30.1 million and liabilities assumed of $0.1 million. The aggregate purchase price includes $0.4 million of costs incurred to acquire the production services business from Competition. We financed the acquisition with $26.7 million cash on hand and a note payable due to the prior owner for $3.3 million.On August 29, 2008, we acquired the wireline services business from Paltec. The aggregate purchase price was $7.8 million which we financed with $6.5 million in cash and a sellers note of $1.3 million. Intangible and other assets of $4.3 million and goodwill of $0.1 million were recorded in connection with the acquisition.On October 1, 2008, we acquired the well services business from Pettus Well Service. The aggregated purchase price was $3.0 million which we financed with $2.8 million in cash and a sellers note of $0.2 million. Intangible and other assets of $1.2 million and goodwill of $0.1 million were recorded in connection with the acquisition.For the year ended December 31, 2008 and the nine months ended December 31, 2007, the additions to our property and equipment additions that consisted of the following (amounts in thousands): Year ended
December 31,
2008 Nine months ended
December 31,
2007 $ 17,860 $ 16,029 61,034 52,292 30,281 59,717 109,175 128,038 4,740 — 1,175 — 33,006 — 38,921 — $ 148,096 $ 128,038 Year ended December 31, 2011 2010 Drilling Services Division: Routine $ 35,252 $ 17,441 Discretionary 67,352 88,201 New-builds and acquisitions 41,005 — Total Drilling Services Division 143,609 105,642 Production Services Division: Routine 8,168 6,972 Discretionary 31,523 1,202 New-builds and acquisitions 26,766 17,187 Total Production Services Division 66,457 25,361 Net cash used for purchases of property and equipment 210,066 131,003 Net impact of accruals 27,721 4,148 Total Capital Expenditures $ 237,787 $ 135,151 $0.3$2.3 million and $0.5 million of interest costs in property and equipment forduring the years ended December 31, 2011 and 2010, respectively.2008 and no capitalized interest cost for the nine months ended December 31, 2007.We constructed a 1500 horsepower drilling rig that was completed and placed into service in December 2008. As of December 31, 2008, we were constructing another 1500-horsepower drilling rig that we expect to complete and place in service in March 2009. Our2011$28.4$66.5 million of rigcosts for these two 1500 horsepowerat December 31, 2011. Additionally, we performed significant upgrade projects on 17 drilling rigs during the year ended December 31, 2008. In addition,2011, primarily in connection with obtaining new drilling contracts in unconventional plays and in our new West Texas drilling division location. Some of these projects included the installation of six iron roughnecks, one top drive, two automatic catwalks and three walking/skidding systems. During the year ended December 31, 2010, we performed significant upgrade projects on 24 drilling rigs, primarily in connection with obtaining new drilling contracts in unconventional plays and in Colombia. These projects included the installation of 16 top drives, five iron roughnecks, two automatic catwalks and 11 walking/skidding systems. We did not have any rigs under construction at December 31, 2010.incurred $20.2 million acquiring 14 workover rigs and $5.0 million acquiring 10acquired 21 wireline units and 15 well service rigs during the year ended December 31, 2008.2011, as well as ten coiled tubing units with the acquisition of Go-Coil on December 31, 2011. During the nine monthsyear ended December 31, 2007,2010, we incurred $56.2acquired 20 wireline units as well as auxiliary equipment for well service rigs.purchase and upgrade the 3 drilling rigs acquired for expansion into international markets.For the fiscal year ending December 31, 2009, we projectof approximately $84.5 million, comprised of newly approvedduring 2012. We expect the total capital expenditures offor 2012 will be allocated approximately $50.2 million70% for our Drilling Services Division and approximately $15.0 million30% for our Production Services Division and previously approvedDivision. Our planned capital expenditures from 2008for the year ending December 31, 2012 include well services, coiled tubing and wireline fleet additions, partial construction of approximately $19.3 millionnew-build AC drilling rigs and routine capital expenditures. Actual capital expenditures may vary depending on the level of new-build and other expansion opportunities that will be carried overmeet our strategic and incurred in 2009.return on capital criteria. We expect to fund these capital expenditures primarilypartially from the proceeds from the sale of our 2011 Senior Notes in November 2011, from operating cash flow in excess of our working capital requirements and, other normal cash flow requirements.$64.4$129.9 million at December 31, 2008,2011, compared to $99.8$76.1 million at December 31, 2007.2010. Our current ratio, which we calculate by dividing our current assets by our current liabilities, was 1.81.9 at December 31, 20082011 compared to 3.42.0 at December 31, 2007. at least meet our requirements for debt service and normal capital expenditures. However, during periods when higher percentages of our drilling contracts are turnkey and footage contracts, our short-term working capital needs could increase. December 31,
2008 December 31,
2007 Change $ 26,821 $ 76,703 $ (49,882 ) 87,161 47,370 39,791 12,262 7,861 4,401 6,270 3,670 2,600 3,874 1,180 2,694 8,902 5,073 3,829 145,290 141,857 3,433 21,830 21,424 406 17,298 — 17,298 1,171 1,933 (762 ) 13,592 5,172 8,420 17,520 9,548 7,972 9,507 3,973 5,534 80,918 42,050 38,868 $ 64,372 $ 99,807 $ (35,435 ) December 31,
2011 December 31,
2010 Change Cash and cash equivalents $ 86,197 $ 22,011 $ 64,186 Short-term investments — 12,569 (12,569 ) Receivables: Trade, net of allowance for doubtful accounts 106,084 61,345 44,739 Unbilled receivables 31,512 21,423 10,089 Insurance recoveries 5,470 4,035 1,435 Income taxes 2,168 2,712 (544 ) Deferred income taxes 15,433 9,867 5,566 Inventory 11,184 9,023 2,161 Prepaid expenses and other current assets 11,564 8,797 2,767 Current assets 269,612 151,782 117,830 Accounts payable 66,440 26,929 39,511 Current portion of long-term debt 872 1,408 (536 ) Prepaid drilling contracts 3,966 3,669 297 Accrued expenses: Payroll and related employee costs 29,057 18,057 11,000 Insurance premiums and deductibles 10,583 8,774 1,809 Insurance claims and settlements 5,470 4,035 1,435 Interest 12,283 7,307 4,976 Other 11,009 5,461 5,548 Current liabilities 139,680 75,640 64,040 Working capital $ 129,932 $ 76,142 $ 53,790 decreasechange in cash and cash equivalents was primarily due to our use of $147.5 million for certain property and equipment expenditures, debt payments of $87.8 million and $39.2 million of cash to fundduring the WEDGE, Competition, Paltec, Inc. and Pettus Well Service acquisitions. These uses of cash and cash equivalents were partially offset by $186.4 million of cash provided by operating activities and borrowings under the credit line of $47.9 million.The increase in our receivables at year ended 2008 as compared to December 31, 2007 was due to receivables of $20.7 million at December 31, 2008 that relate to our new Production Services Division that was formed when we acquired the production services businesses of WEDGE and Competition on March 1, 2008, anincrease in receivables of $14.7 million for our Drilling Services Division and an increase of $4.4 million for federal income tax refunds. The increase in receivables for our Drilling Services Division2011a $2,774 per day increasecash provided by operations of $144.9 million, net proceeds from the sale of common stock of $94.3 million, $130.3 million in average revenue ratesproceeds from net debt borrowings and a 3.5% increase$12.6 million net proceeds from the sale of our ARPSs in 2011, partially offset by $210.1 million used for purchases of property and equipment and $115.5 million used for the numberacquisition of revenue daysGo-Coil and other production services businesses.2008,2011 as compared to the quarter ended December 31, 2007.The2010receivables at December 31, 2008 as compared to December 31, 2007 wasreceivables.unbilledcertain accrued expenses during 2011 that will be deductible for income tax purposes in 2012 and therefore, we expect to realize the tax benefit of the deferred tax assets in the short-term.$4.5 million that relate to our drilling contracts in Colombia.The increase in inventory at 20082011 as compared to December 31, 2007 was2010 is primarily due to an environmental liability insurance claim.additionexpansion of inventory of $1.6 million for our new Production Services Divisionwireline operations during 2011 from 84 to 105 wireline units, and an increase of $1.1 million ofin inventory primarily related to our third, fourth and fifth drilling rigs that began operating in Colombia in February 2008, August 2008 and November 2008, respectively. We maintain inventories of replacement parts and supplies for our drilling rigs operating in Colombia to ensure efficient operations in geographically remote areas.current assets at December 31, 2008 as compared to December 31, 2007 is primarily due to $2.2 million in prepaid expenses and other current assets of our new Production Services Division. The increase also relates to additional prepaid insurance and deferred mobilization costs for the third, fourth and fifth drilling rigs that began operating in Colombia in 2008. In addition, prepaid expenses and other current assets increased by $0.9 million relating to funds held in a trust account that will be distributed to our former Chief Financial Officer on March 2, 2009 in accordance with the terms of the severance agreement and $0.7 million relating to funds held in escrow that will be paid to the former owner of Competition.The increase in accounts payable was primarily due to $4.6 million for our new Production Services Division and an increase of $1.5 million in accounts payable for our expanded operations in Colombia during 2008. The overall increase in accounts payable was partially offset by a decrease in drilling equipment purchases that were accrued at December 31, 2008 as compared to December 31, 2007.The increase in the current portion of long-term debt at December 31, 2008 is primarily due to principal payments that were made after December 31, 2008 to reduce the outstanding balance of our senior secured revolving credit facility and the current portion of our subordinated notes payable. The outstanding balance under our senior secured credit facility is not due until maturity on February 28, 2013. However, when cash and working capital is sufficient, we may make principal payments to reduce the outstanding debt balance prior to maturity.The increase in accrued payroll and related employee costs was due to an increase in deferred mobilization costs for domestic drilling rigs that moved between drilling division locations, as well as an increase in prepaid insurance costs due to the numbergrowth of employeesour business during 2011.our new Production Services Division and an the increase in operating costs of $34.1 million, or 36%, for the number of days represented in the payroll accrual at quarter ended December 31, 20082011 as compared to the quarter ended December 31, 2007. In addition,2010, and due to a $27.7 million increase in our accruals for capital expenditures as of December 31, 2011, as compared to December 31, 2010.employee costs increasedis primarily due to the payment obligationworkforce additions, accruals for our long-term compensation plans which accrue over two to three years, increased incentive compensation based on strong 2011 operating results, and fluctuations due to timing of $0.9 million to our former Chief Financial Officer.wasat December 31, 2011 as compared to December 31, 2010 is due to the increases in our drilling services and production services utilization and the resulting increased workforce during the quarter ended December 31, 2011 as compared to the quarter ended December 31, 2010. The increase in utilization and our workforce led to increased actuarial claims estimates for the deductibles under these insurance policies.increases in costs incurred for the self-insurance portionissuance of our health2011 Senior Notes in November 2011, for which interest is due semi-annually on March 15 and workers compensation insurance and other insurance costs during the year ended December 31, 2008 as compared to December 31, 2007.September 15.at December 31, 2008 as compared to December 31, 2007 is primarily due to $1.8 millionan increase in accrued expensesour sales tax accrual for sales tax payable on the construction of our new Production Services Division and an increasenew-build drilling rigs as well as the $1.7 million current portion of $1.5 million relating tothe net-worth tax accrual for our expandedColombian operations, in Colombia during 2008.which was assessed on January 1, 2011. In addition, accrued expenses increased due to a payment obligationwe have recorded an estimated accrual of $0.7$1.0 million at December 31, 2011 for the net working capital adjustment which is payable to the former ownerowners of Competition, as noted in the prepaidGo-Coil.other current asset description above.Long-term DebtLong-term debt as of December 31, 2008 consists of the following (amounts in thousands): $ 272,500 6,534 379 279,413 (17,298 ) $ 262,115 of the types specified below at December 31, 20082011 (amounts in thousands): Payments Due by Period Total Less than 1
year 2-3 years 4-5 years More than 5
years $ 279,413 $ 17,298 $ 3,314 $ 258,801 $ — 29,097 7,181 13,973 7,943 — 35,876 30,754 5,122 — — 4,803 1,566 2,228 1,009 — 4,140 1,540 1,300 1,300 — 100 100 — — — $ 353,429 $ 58,439 $ 25,937 $ 269,053 $ — Long-term Payments Due by Period Contractual Obligations Total Less than 1
year 2-3 years 4-5 years More than 5
yearsLong-term debt $ 426,854 $ 872 $ 899 $ 83 $ 425,000 Interest on long-term debt 272,997 42,115 83,985 83,944 62,953 Purchase commitments 134,859 113,859 21,000 — — Operating leases 17,407 4,607 5,974 3,020 3,806 Restricted cash obligation 1,300 650 650 — — Total $ 853,417 $ 162,103 $ 112,508 $ 87,047 $ 491,759 $272.5$425.0 million face amount outstanding under our senior secured credit facility, $6.5Senior Notes and $1.7 million outstanding under subordinated notes payable to certain employees that are former shareholders of previously acquired production services businesses and otherbusinesses. On July 22, 2011, we repaid the entire outstanding debt of $0.4 million. The outstanding balance under our senior secured credit facility is not due untilRevolving Credit Facility. However, we expect to use the availability under the Revolving Credit Facility to fund our working capital needs, capital expenditures, or selective acquisitions, as necessary, through the final maturity date of June 30, 2016. The $425.0 million face amount outstanding under our Senior Notes will mature on February 28, 2013, but principal paymentsMarch 15, 2018. Our Senior Notes have a carrying value of $15.0$417.7 million made after as of December 31, 2008 are classified2011, which represents the $425.0 million face value net of the $8.9 million of original issue discount and $1.7 million of original issue premium, net of amortization, based on the effective interest method. Our subordinated notes payable have final maturity dates in the current portion of long-term debt as of December 31, 2008. We may make principal payments to reduce the outstanding debt balance prior to maturity when cashMarch and working capital is sufficient.April2013.senior secured credit facilitySenior Notes are estimatedcalculated based on (1)the coupon interest rates that arerate of 9.875% due semi-annually in effectarrears on February 6, 2009, (2) $15.0 millionMarch 15 and September 15 of principal payments that have been made after December 31, 2008 to reduce the outstanding principal balance, and (3) the remaining principal balance of $257.5 million to be paid at maturity in February 2013.each year. Interest payment obligations on our subordinated notes payable are based on interest rates ranging from 5.44%6% to 14%, with quarterlyannual payments of principal and interest and final maturity dates ranging from January 2009 to March 2013.obligationscommitments primarily relate to ten new-build drilling rigrigs, equipment upgrades and workover rig upgrades, acquisitions orpurchases of other new construction. with terms in excess of one year for office space, operating facilities, equipment and personal property.2008,2011, we had restricted cash in the amount of $3.3$1.3 million held in an escrow account to be used for future payments in connection with the acquisition of Competition. The former ownerowners of Competition will receive annual installments of $0.7$0.7 million payable over a five year termthe remaining two years from the escrow account. In addition, we had restricted cash inamountproceeds of $0.9certain asset dispositions or debt issuances, which are applied to reduce outstanding revolving and swing-line loans and letter of credit exposure. There are no limitations on our ability to access the $250 million in a trust account that will be distributed to our former Chief Financial Officer on March 2, 2009 in accordance borrowing capacity other than maintaining compliance with the terms of the severance agreement.Debt RequirementsEffective June 11, 2008, we entered into a Waiver Agreement with the Lenders to waive the requirement to provide certain financial statements in conjunction with our compliance certificate within the time period required by the credit agreement. The Waiver Agreement required us to provide the financial statements and our compliance certificate on or before August 13, 2008. Until we provided these financial statements and our compliance certificate, the aggregate principal amount outstandingcovenants under the credit agreement could not exceed $350 million at any time (provided, however, that the commitment fee would continue to be calculated based on the total commitment of $400 million), and the per annum margin applicable to all amounts outstanding under the credit agreement would increase from the current rate of 2.25% for LIBOR rate borrowings and 1.25% for bank prime rate borrowings to 2.50% for LIBOR rate borrowings and 1.50% for bank prime rate borrowings. The required financial statements and our compliance certificate were delivered concurrently with the filing of the Quarterly Report on Form 10-Q for the quarterly period ended March 31, 2008 which occurred on August 5, 2008.2008,2011, we were in compliance with the restrictiveour financial covenants. Our total consolidated leverage ratio was 2.2 to 1.0, our senior consolidated leverage ratio was 0.1 to 1.0, and our interest coverage ratio was 6.7 to 1.0. The financial covenants contained in the credit agreement whichour Revolving Credit Facility include the following:We must have ano greaterthat cannot exceed 4.00 to 1.00;3.002.50 to 1.00 for any fiscal quarter through March 31, 2009, 2.75 to 1.00 for any fiscal quarter ending June 30, 2009 through March 31, 2010,1.00; and 2.50 to 1.00 for any fiscal quarter ending June 30, 2010 through maturity in February 2013;maximumsenior consolidated leverage ratio is greater than 2.252.00 to 1.00 at the end of any fiscal quarter, then we must have aour minimum asset coverage ratio nocannot be less than 1.251.00 to 1.00;1.00.We must have a minimum interest coverage (c) the senior consolidated leverage ratio noas of the last day of the most recent reported fiscal quarter is less than 3.002.00 to 1.00.2008,2011, our senior consolidated leverage ratio was 1.28not greater than 2.00 to 1.00 and our interest coverage ratio was 17.15therefore, we were not subject to 1.00. the capital expenditure threshold restrictions listed above.credit agreementRevolving Credit Facility has additional restrictive covenants that, among other things, limit the incurrence of additional debt, to a maximum of $15 million (other than debt under the senior secured revolving credit facility), investments, liens, dividends, acquisitions, redemptions of capital stock, prepayments of indebtedness, asset dispositions, mergers and consolidations, transactions with affiliates, capital expenditures, hedging contracts, sale leasebacks and other matters customarily restricted in such agreements. In addition, the credit agreementRevolving Credit Facility contains customary events of default, including without limitation, payment defaults, breaches of representations and warranties, covenant defaults, cross-defaults to certain other material indebtedness in excess of specified amounts, certain events of bankruptcy and insolvency, judgment defaults in excess of specified amounts, failure of any guaranty or security document supporting the credit agreement and change of control. Non-compliance with restrictive covenants or other events of defaultcredit agreement could triggerRevolving Credit Facility are secured by substantially all of our domestic assets (including equity interests in Pioneer Global Holdings, Inc. and 65% of the outstanding equity interests of any first-tier foreign subsidiaries owned by Pioneer Global Holdings, Inc., but excluding any equity interest in, and any assets of, Pioneer Services Holdings, LLC) and are guaranteed by certain of our domestic subsidiaries, including Pioneer Global Holdings, Inc. Borrowings under the Revolving Credit Facility are available for acquisitions, working capital and other general corporate purposes.early repayment requirementoffer to purchase the Senior Notes at a price equal to 100% of the principal amount of each Senior Note, together with any accrued and terminateunpaid interest to the date of purchase.secured revolving credit facility. as defined in the American Institute of Certified Public Accountants’ Statement of Position 81-1, to recognize revenue on our turnkey and footage contracts. Although our turnkey and footage contracts do not have express terms that provide us with rights to receive payment for the work that we perform prior to drilling wells to the agreed-on depth, we use this method because, as provided in applicable accounting literature, we believe we achieve a continuous sale for our work-in-progress and believe, under applicable state law, we ultimately could recover the fair value of our work-in-progress even in the event we were unable to drill to the agreed-on depth in breach of the applicable contract. However, in the event we were unable to drill to the agreed-on depth in breach of the contract, ultimate recovery of that value would be subject to negotiations with the customer and the possibility of litigation.including quantum meruit, available in applicable courts to recover the fair value of our work-in-progress under a turnkey or footage contract.term of certain drilling contracts.term. Costs incurred to relocate rigs and other drilling equipment to areas in which a contract has not been secured are expensed as incurred. Reimbursements that we receive for out-of-pocket expenses are recorded as revenue and the out-of-pocket expenses for which they relate are recorded as operating costs.The asset “unbilled receivables” represents revenues we have recognized in excess of amounts billed on drilling contracts and production services in progress. The asset “prepaid expenses and other” includes deferred mobilization costs for certain drilling contracts. The liability “prepaid drilling contracts” represents deferred mobilization revenues for certain drilling contracts and amounts collected on contracts in excess of revenues recognized.collectibilitycollectability is reasonably assured.Assetsassets and Intangible Assetsintangible assets—present, as defined in SFAS No. 144,Accounting for the Impairment or Disposal of Long-Lived Assets.present. Circumstances that could indicate a potential impairment include significant adverse changes in industry trends, economic climate, legal factors, and an adverse action or assessment by a regulator. Moreworkoverwell service rigs. In performing the impairment evaluation, we estimate the future undiscounted net cash flows relating to long-lived assets and intangible assets grouped at the lowest level that cash flows can be identified. For our Production Services Division, our long-lived assets and intangible assets are grouped at the reporting unit level which is one level below the operating segment level. For our Drilling Services Division, we perform an impairment evaluation and estimate future undiscounted cash flows for individual drilling rig assets. If the sum of the estimated future undiscounted net cash flows is less than the carrying amount of the long-lived assets and intangible assets for these asset grouping levels, then we would recognize an impairment charge. The amount of an impairment charge would be measured as the difference between the carrying amount and the fair value of these assets. The assumptions used in the impairment evaluation for long-lived assets and intangible assets are inherently uncertain and require management judgment.We performed an impairment analysis of our long-lived assets and intangible assets at December 31, 2008, due to significant adverse changes in the economic and business climate that resulted in decreases in estimated revenues, margins and cash flows. Essentially all our intangible assets were recorded in connection with the acquisitions of the production services businesses from WEDGE, Competition, Pettus and Paltec when revenues, margins and cash flows were at historically high levels earlier in 2008. We determined that the sum of the estimated future undiscounted net cash flows is less than the carrying amount of the long-lived assets and intangible assets in each reporting unit at December 31, 2008. Our long-lived asset and intangible asset impairment analysis for the reporting units in our Production Services Division resulted in no impairment charge to property and equipment and a non-cash impairment charge of $52.8 million to the carrying value of our intangible assets for customers relationships for the year ended December 31, 2008. For our Drilling Services Division, we have not recorded an impairment charge on any long-lived assets for the year ended December 31, 2008. The assumptions used in the impairment evaluation for long-lived assets and intangible assets are inherently uncertain and require management judgment. This impairment charge is not expected to have an impact on our liquidity or debt covenants; however, it is a reflection of the overall downturn in our industry and decline in our projected cash flows.GoodwillGoodwill— We account for goodwill and other intangible assets under the provisions of SFAS No. 142,Goodwill and Other Intangible Assets. Goodwill is tested for impairment annually as of December 31 or more frequently if events or changes in circumstances indicate that the asset might be impaired. Circumstances that could indicate a potential impairment include a significant adverse change in the economic or business climate, a significant adverse change in legal factors, an adverse action or assessment by a regulator, unanticipated competition, loss of key personnel and the likelihood that a reporting unit or significant portion of a reporting unit will be sold or otherwise disposed of. These circumstances could lead to our net book value exceeding our market capitalization which is another indicator of a potential impairment in goodwill. SFAS No. 142 requiresimpairment.impairment of goodwill. First, the fair value of each reporting unit with goodwill is compared to its carrying value to determine whether an indication of impairment exists. All our goodwill is related to our Production Services Division operating segment and is allocated to its three reporting units which are well services, wireline services and fishing and rental services. Second, if impairment is indicated, then the fair value of the reporting unit’sunit's goodwill is determined by allocating the unit’sunit's fair value to its assets and liabilities (including any unrecognized intangible assets) as if the reporting unit had been acquired in a business combination on the impairment test date. The amount of impairment for goodwill is measured as the excess of the carrying value of the reporting unit over its fair value.arewere discounted using a weighted average cost of capital rate. The market approach provides an estimated fair value based on our market capitalization that iswas computed using the prior 30-day average market price of our common stock and the number of shares outstanding as of the impairment test date. The estimated fair values computed using the income approach and the market approach are then equally weighted and combined into a single fair value. The primary assumptions used in the income approach are estimated cash flows and weighted average cost of capital. Estimated cash flows are primarily based on projected revenues, operating costs and capital expenditures and are discounted based on comparable industry average rates for weighted average cost of capital. We utilized discount rates based on weighted average cost of capital ranging from 15.8% to 16.7% when we estimated fair values of our reporting units as of December 31, 2008. The primary assumptions used in the market approach is the allocation of total market capitalization to each reporting unit, which is based on projected EBITDA percentages for each reporting unit, and control premiums, which are based on comparable industry averages. We utilized a 30% control premium when we estimated fair values of our reporting units as of December 31, 2008. To ensure the reasonableness of the estimated fair values of our reporting units, we perform a reconciliation of our total market capitalization to the total estimated fair value of all our reporting units. The assumptions used in estimating fair values of reporting units and performing the goodwill impairment test are inherently uncertain and require management judgment.Our common stock price per share declined in market value from $13.30 at September 30, 2008, to $5.57 at December 31, 2008, which resulted in our net book value exceeding our market capitalization during most of this time period. We believe the decline in the market price of our common stock resulted from a significant adverse change in the economic and business climate as financial markets reacted to the credit crisis facing major lending institutions and worsening conditions in the overall economy during the fourth quarter of the year ended December 31, 2008. During the same time, there were significant declines in oil and natural gas prices which lead to declines in production service revenues, margins and cash flows. We considered the impact of these significant adverse changes in the economic and business climate as we performed our annual impairment assessment of goodwill as of December 31, 2008. The estimated fair values of our reporting units were negatively impacted by significant reductions in estimated cash flows for the income approach component and a significant reduction in our market capitalization for the market approach component of our fair value estimation process. Our goodwill was initially recorded in connection with the acquisitions of the production services businesses from WEDGE, Competition, Pettus and Paltec, all of which occurred between March 1, 2008 and October 1, 2008, when production service revenues, margins and cash flows and our market capitalization were at historically high levels.Our goodwill impairment analysis lead us to conclude that there would be no remaining implied value attributable to our goodwill and accordingly, we recorded a non-cash charge of $118.6 million to our operating results for the year ended December 31, 2008, for the full impairment of our goodwill. Our goodwill impairment analysis would have lead to the same full impairment conclusion if we increased or decreased our discount rates or control premiums by 10% when estimating the fair values of our reporting units. This impairment charge is not expected to have an impact on our liquidity or debt covenants; however, it is a reflection of the overall downturn in our industry and decline in our projected cash flows.taxestaxes— foreign net operating loss carryforwards, employee benefit and other accrued liabilities which are deducted in different periods for financial reporting and tax reporting purposes. For property and equipment, basis differences arise from differences in depreciation periods and methods and the value of assets acquired in a business acquisition where we acquire an entity rather than just its assets. For financial reporting purposes, we depreciate the various components of our drilling rigs, workoverwell service rigs, and wireline units and coiled tubing units over 2 to 25 years and refurbishments over 3 to 5 years, while federal income tax rules require that we depreciate drilling rigs, workoverwell service rigs, wireline units and refurbishmentscoiled tubing units over 5 years. Therefore, in the first 5 years of our ownership of a drilling rig, workoverwell service rig, or wireline unit or coiled tubing units, ourestimatesestimates—During the year ended December 31, 2008, weWe experienced lossesa total loss of approximately $1.5 million on sixtwo of the 81 turnkey and footage contracts completed with a loss of less than $25,000 each on three of these contracts and a loss of less than $130,000 each on the remaining three contracts. We are more likely to encounter losses on turnkey and footage contracts in periods in which revenue rates are lower for all types of contracts. During periods of reduced demand for drilling rigs, our overall profitability on turnkey and footage contracts has historically exceeded our profitability on daywork contracts.didhad one turnkey contract in progress at December 31, 2011, which was completed prior to the release of the financial statements included in this report. have any turnkey or footageyet billed on daywork drilling contracts in progress at December 31, 2008. Our2011 and $3.0 million related to unbilled receivables of $12.3 million at December 31, 2008 did not include any amounts related to turnkey or footage contracts.$1.6$1.0 million at December 31, 2008 and no allowance for doubtful accounts at December 31, 2007.workoverwell service rig, wireline unit or wirelinecoiled tubing unit is idle or working. Our estimates of the useful lives of our drilling, production, transportation and other equipment are based on our more than 35 Effective January 1, 2008,reassessedhad a $1.2 million deferred tax asset related to the estimated useful lives assigned$3.3 million impairment of our ARPSs which represents a capital loss for tax treatment purposes. We can recognize a tax benefit associated with this impairment to a groupthe extent of 19 drilling rigs that were recently constructed. These drilling rigs were constructed with new components that have longer estimated useful lives when comparedcapital gains we expect to other drilling rigs that are equipped with older components. As a result, we increased the estimated useful lives for this group of recently constructed drilling rigs from an average useful life of 9 years to 12 years. This changeearn in the estimated useful lives of this group of 19 drilling rigs resulted in a $3.8 million decrease in depreciation and amortization expense forfuture periods. During the year ended December 31, 2008.2008,2011, we had foreign$46.1 million of deferred tax assets consisting ofrelated to foreign and domestic net operating lossesloss and other tax benefitsAMT credit carryforwards available to reduce future taxable income in a foreign jurisdiction.income. In assessing the realizability of our foreign deferred tax assets, we only recognize a tax benefit to the extent of taxable income that we expect to earn in the foreign jurisdiction in future periods. DueWe estimate that our operations will result in taxable income in excess of our net operating losses and we expect to recent declines in oilapply the net operating losses against the current year taxable income and natural gas prices and the downturn in our industry, we anticipate reductions in drilling rig utilization and revenue rates in 2009. Consequently,taxable income that we have a valuation allowance of $5.4 million that fully offsets our foreign deferred tax assets. The foreign net operating loss has an indefinite carryforward period. The foreign net operating loss is primarily due to the special income tax benefits permitted by the Colombian government that allows us to recover 140% of the cost of certain imported assets. We exported a 1500 horsepower drilling rig to Colombiaestimated in October 2008. To obtain this special income tax benefit, our U.S operating company sold this drilling rig in October 2008 to Stayton Asset Group, a variable interest entity established for this transaction for which we are the primary beneficiary. Stayton Asset Group immediately sold this drilling rig to our operating entity in Colombia.20082011 include accruals for costs incurred under the self-insurance portion of our health insurance of approximately $1.1$1.9 million and our workers’ compensation, general liability and auto liability insurance of approximately $9.6 million.$6.5 million. We have stop loss coverage of $150,000 per occurrence under our health insurance and a deductible of $125,000$500,000 per covered individual per yearoccurrence under the healthour workers’ compensation insurance. We have a deductible of $500,000$250,000 per occurrence under our workers’ compensation insurance, except in North Dakota, where we do not have a deductible. We have deductibles of $250,000 and $100,000 per occurrence underboth our general liability insurance and auto liability insurance, respectively.insurance. We accrue for these costs as claims are incurred based on historical claim development data, and we accrue the costs of administrative services associated with claims processing. We also evaluateworkers’long-term incentive compensation claim costplans which have performance-based award components dependent upon our performance over a set performance period, as compared to the performance of a pre-defined peer group. The accruals for these awards include estimates which affect our stock-based compensation expense, employee related accruals and equity. The accruals are adjusted based on estimates provided by a professional actuary.Effective March 1, 2008, we acquired the production services businesses of WEDGE and Competition which provide well services, wireline services and fishing and rental services. These acquisitions resulted in the formation of our new operating segment, the Production Services Division. We consolidated the results of these acquisitions from the day they were acquired. These acquisitions affect the comparability from period to period of our historical results, and our historical results may not be indicative of our future results.20082011 Compared with the Year Ended December 31, 2007201020082011 and December 31, 2007. Years ended
December 31, 2008 2007 (amounts in thousands) $ 456,890 $ 417,231 269,846 250,564 $ 187,044 $ 166,667 67.4 66.1 89 % 89 % 22,057 21,492 $ 20,714 $ 19,413 12,234 11,658 $ 8,480 $ 7,755 $ 153,994 $ — 80,097 — $ 73,897 $ — $ 610,884 $ 417,231 349,943 250,564 $ 260,941 $ 166,667 $ 214,766 $ 144,583 Year ended December 31, 2011 2010 Drilling Services Division: Revenues $ 433,902 $ 312,196 Operating costs 292,559 227,136 Drilling Services Division margin $ 141,343 $ 85,060 Average number of drilling rigs 69.3 71.0 Utilization rate 73 % 59 % Revenue days 18,383 15,182 Average revenues per day $ 23,603 $ 20,564 Average operating costs per day 15,915 14,961 Drilling Services Division margin per day $ 7,688 $ 5,603 Production Services Division: Revenues $ 282,039 $ 175,014 Operating costs 164,365 105,295 Production Services Division margin $ 117,674 $ 69,719 Combined: Revenues $ 715,941 $ 487,210 Operating costs 456,924 332,431 Combined margin $ 259,017 $ 154,779 Adjusted EBITDA $ 183,870 $ 103,151 Year ended December 31, 2011 2010 (amounts in thousands) Reconciliation of combined margin and Adjusted EBITDA to net income (loss): Combined margin $ 259,017 $ 154,779 General and administrative (67,318 ) (52,047 ) Bad debt expense (925 ) (493 ) Other (expense) income (6,904 ) 912 Adjusted EBITDA 183,870 103,151 Depreciation and amortization (132,832 ) (120,811 ) Impairment of equipment (484 ) — Interest expense (29,721 ) (26,567 ) Impairment of investments — (3,331 ) Income tax (expense) benefit (9,656 ) 14,297 Net income (loss) $ 11,177 $ (33,261 ) Year ended December 31, 2011 2010 Daywork Contracts 96 % 95 % Turnkey Contracts 4 % 5 % Footage Contracts — — Year ended December 31, 2010 2009 Drilling Services Division: Revenues $ 312,196 $ 219,751 Operating costs 227,136 147,343 Drilling Services Division margin $ 85,060 $ 72,408 Average number of drilling rigs 71.0 70.7 Utilization rate 59 % 41 % Revenue days 15,182 10,491 Average revenues per day $ 20,564 $ 20,947 Average operating costs per day 14,961 14,045 Drilling Services Division margin per day $ 5,603 $ 6,902 Production Services Division: Revenues $ 175,014 $ 105,786 Operating costs 105,295 68,012 Production Services Division margin $ 69,719 $ 37,774 Combined: Revenues $ 487,210 $ 325,537 Operating costs 332,431 215,355 Combined margin $ 154,779 $ 110,182 Adjusted EBITDA $ 103,151 $ 74,942 (EBITDA)(Adjusted EBITDA) information because we believe it provides investors and our management additional information to assist them in assessing our business and performance in comparison to other companies in our industry. Since Drilling Services Division margin, Production Services Division margin, combined margin and Adjusted EBITDA are “non-GAAP” financial measuremeasures under the rules and regulations of the SEC, we are providing the following reconciliation of combined margin and Adjusted EBITDA to net (loss) earnings,loss, which is the nearest comparable GAAP financial measure. Year ended
December 31, 2008 2007 (amounts in thousands)
EBITDA to net (loss) earnings: 260,941 166,667 (44,834 ) (19,608 ) (423 ) (2,612 ) (918 ) 136 214,766 144,583 (88,145 ) (63,588 ) (118,646 ) — (52,847 ) — (11,816 ) 3,266 (6,057 ) (27,398 ) $ (62,745 ) $ 56,863 Year ended December 31, 2010 2009 (amounts in thousands) Reconciliation of combined margin and Adjusted EBITDA to net loss: Combined margin $ 154,779 $ 110,182 General and administrative (52,047 ) (37,478 ) Bad debt recovery (expense) (493 ) 1,642 Other income 912 596 Adjusted EBITDA 103,151 74,942 Depreciation and amortization (120,811 ) (106,186 ) Interest income (expense), net (26,567 ) (8,928 ) Impairment of investments (3,331 ) — Income tax benefit 14,297 16,957 Net loss $ (33,261 ) $ (23,215 ) $39.7$92.4 million, or 10%42%, for the year ended December 31, 2008,2010, as compared to the year ended December 31, 2007, due to an increase in average contract drilling revenues of $1,301 per day, or 7%, that resulted from an increased demand for drilling rigs and higher revenues per day earned by our Colombian operations that expanded significantly during 2008. The increase in Drilling Services Divisions revenues is also2009, due to a 3%45% increase in revenue days that resulted from an increase in our rig utilization rate to 59% from 41%. We have experienced an increase in the demand for drilling services in 2010 as our industry begins to recover from the downturn that bottomed in late 2009. Consequently, utilization rates and drilling revenue rates have improved in 2010 as compared to 2009. However, when compared to 2009, our Drilling Services Division’s average revenues decreased by $383 per day, or 2%. During 2009, a slightlysignificant portion of our drilling rigs were still operating or were on standby under long-term drilling contracts that were entered into when drilling rig demand was high and drilling revenues per day were at historically high levels. The positive impact of the higher revenue rates for these long-term contracts had a diminishing affect on our average revenues per day as the contracts expired ratably during 2009. In addition, a larger percentage of our Drilling Services Division’s revenues were attributed to turnkey drilling contracts in 2009 when compared to 2010, and turnkey drilling contracts result in higher average numberrevenues per day than daywork drilling contracts. The overall decreases in our average drilling revenues per day during 2010 as compared to 2009 was partially offset by an increase in our Colombian operations during 2010, as drilling contracts in Colombia have higher revenue rates per day when compared to domestic drilling contracts.rigs. Year ended December 31, 2010 2009 Daywork Contracts 95 % 90 % Turnkey Contracts 5 % 10 % Footage Contracts — — grew by $19.3increased $79.8 million, or 8%54%, for the year ended December 31, 2008,2010, as compared to the corresponding period in 2009, primarily due to the increase in utilization and the increase in our operating costs of $916 per day, or 7%. The increase in operating costs per day is due to higher average drilling costs per day for our domestic operations, as well as the increase in our Colombian operations during 2010 as compared to the corresponding period in 2009, where we have a higher operating cost per day as compared to our domestic operations. We saw an increase in the demand for our services during 2010 as our industry begins to recover from the downturn that bottomed in late 2009. As utilization rates began to increase in 2010, average operating costs per day increased due to higher wage rates and repair and maintenance expenses as drilling rigs came out of storage and began operations. In addition, average operating costs per day in 2009 were lower due to a significant portion of our drilling rigs earning standby revenue rates under longer-term drilling contracts and incurring reduced operating costs. The overall increase in operating costs per day in 2010 was partially offset by a decrease in operating costs per day due to a smaller proportion of our drilling services attributable to turnkey contracts during the year ended December 31, 2007, due to an increase in average contract drilling operating costs of $576 per day, or 5%, that resulted primarily from higher operating costs per day for our Colombian operations which has higher labor and fuel costs when2010 as compared to drilling operationsthe corresponding period in the United States. This increase in our Drilling Services Division’s operating costs is also due to a 3% increase in revenue days that resulted from a slightly higher average number of drilling rigs.revenue of $154.0revenues increased by $69.2 million, andor 65%, while operating costs of $80.1increased by $37.3 million, or 55%, for the year ended December 31, 2008 are based on2010, as compared to the corresponding period in 2009. Our Production Services Division experienced increases in its revenue and operating resultscost due to higher demand for this newour wireline services, well services and fishing and rental services during 2010 as compared to 2009. The increase in our Production Services Division’s revenues is due primarily to higher utilization rates, especially in the wireline and well services operations, and to a lesser extent, higher revenue rates charged for these services during 2010, as compared to the corresponding period in 2009. We also expanded our operations in 2010 by adding 21 wireline units resulting in an increase in both revenues and operating segment which was created on March 1, 2008 when we acquired the production services businesses of WEDGE and Competition. selling, general and administrative expense for the year ended December 31, 2008 increased by approximately $25.2 million, or 129%, compared to the year ended December 31, 2007. The increase resulted from $4.4 million in additional compensation-related expenses incurred for existing and new employees in our corporate office which includes $0.9 million paid to our former Chief Financial Officer pursuant to a severance agreement. Professional and consulting expenses increased $5.2 million during the year ended December 31, 2008 which includes approximately $3.1 million due to an investigation conducted by the special subcommittee of our Board of Directors. In addition, we incurred $15.1 million and $0.7 million of additional selling, general and administrative expenses relating to our Production Service Division and our Colombian operations, respectively.Our bad debt expense decreased by $2.2 million for the year ended December 31, 2008, as compared to the year ended December 31, 2007, primarily due to a write-off of a trade receivable during the year ended December 31, 2007 for a former customer in bankruptcy.Our other income for the year ended December 31, 2008 decreased by $1.0 million as compared to the year ended December 31, 2007, primarily due to foreign currency translation losses relating to our operations in Colombia.Our depreciation and amortization expenses increased by $24.6$14.6 million, or 39%, for the year ended December 31, 2008,2010 as compared to December 31, 2007.the corresponding period in 2009. The increase resultedis primarily from additional depreciation and amortization expense of $21.8 milliondue to increases in compensation related expenses. With the industry downturn during 2009, we experienced a decrease in the demand for our Production Services Division acquisitions, which includesservices and we responded with workforce reductions, elimination of wage rate increases and reduced bonus compensation. During 2010, we saw an increase in amortization expense of intangible assets of $8.3 million. The increase is alsothe demand for our services as our industry began to recover from the industry downturn in 2009. Compensation related expenses increased during 2010 as we added employees in our corporate office and accrued for higher bonuses for 2010.increasescollection of a customer’s past due account receivable balance in the average size of our drilling rig fleet,2009 for which consisted of newly constructed rigs. Partially offsetting the increasewe had previously established a $1.3 million allowance for doubtful accounts in depreciation and amortization expense was a decrease of $3.8December 2008.2008, resulting from2010 as compared to the changecorresponding period in 2009, primarily due to the estimated useful livesincrease in foreign currency translation gains in excess of a group of 19 drilling rigs from an average useful life of 9 yearslosses recognized in relation to 12 years.We recorded goodwill of $118.6our operations in Colombia.in our Production Services Division operating segment in connection with the acquisitions of the production services businesses from WEDGE, Competition, Pettus and Paltec, all of which occurred duringfor the year ended December 31, 2008. On December 31, 2008, we performed an impairment analysis that lead us2010, as compared to conclude that there would be no remaining implied value attributablethe corresponding period in 2009. This increase resulted primarily from capital expenditures made to upgrade certain drilling rigs to meet the needs of our goodwill,customers and accordingly, we recorded a non-cash charge of $118.6 millionobtain new contracts as well as capital expenditures for the full impairmentacquisition of our goodwill. In addition, we performed an intangible asset impairment analysis on December 31, 2008, which resulted in a reduction to our intangible asset carrying value of customers’ relationships and a non-cash impairment charge of $52.8 million. These impairment charges are not expected to have an impact on our liquidity or debt covenants; however, they are a reflection of the overall downturn in our industry and decline in our projected cash flows.2008 is2010 primarily related to the outstanding debt balance for our Senior Notes, while interest due on the amounts outstanding under our senior secured revolving credit facility which was primarily used to fund the acquisitions of the production services businesses of WEDGE and Competition on March 1, 2008.Our income tax expense is $6.1 million for the year ended December 31, 2008,2009 primarily related to the outstanding debt balance under our Revolving Credit Facility. On March 11, 2010, we issued $250 million of Senior Notes with a coupon interest rate of 9.875%. The Senior Notes were sold with an original issue discount that will result in an effective yield to maturity of approximately 10.677%. The proceeds from the issuance of the Senior Notes were immediately used to make a payment of $234.8 million to reduce the outstanding debt balance under the Revolving Credit Facility. The Revolving Credit Facility had a relatively low interest rate of 3.74% as of December 31, 2009, which was based on the LIBOR rate plus a per annum margin. The Senior Notes have a higher interest rate when compared to the Revolving Credit Facility, which resulted in the increase in interest expense during 2010. In addition, interest expense increased in 2010 as compared to an expected income tax benefit of $19.8 million, which is based on the federal statutory rate of 35%, primarily2009 due to the permanent differences between GAAP requirements and United States income tax regulations. Certain typesan increase in total outstanding debt which was $280.9 million as of goodwill are not amortizable for income tax purposes. A significant portionDecember 31, 2010 as compared to $262.1 million as of the goodwill impairment charge recorded for GAAP purposes duringDecember 31, 2009.2008, is not deductible for income tax purposes in the current year or in future years. Therefore, our results of operations reflect2010, we recognized a pretax loss for GAAP purposes, but our results of operations will reflect pretax income for tax purposes. The increase in income tax expense was partially offset by tax benefits in foreign jurisdictions and other permanent differences.Statements of Operations Analysis—Nine Months Ended December 31, 2007 Compared with the Nine Months Ended December 31, 2006The following table provides information about our operations for the nine months ended December 31, 2007 and December 31, 2006. Nine Months Ended
December 31, 2007 2006 (In thousands) $ 292,617 $ 302,272 4,979 — 16,288 10,559 $ 313,884 $ 312,831 $ 175,299 $ 152,625 3,168 — 12,907 7,538 $ 191,374 $ 160,163 $ 117,318 $ 149,647 1,811 — 3,381 3,021 $ 122,510 $ 152,668 15,203 15,084 118 — 968 643 16,289 15,727 $ 104,241 $ 139,548 $ 19,270 $ 19,891 $ 11,749 $ 10,184 $ 7,521 $ 9,707 89 % 97 % 66.7 59.6 We present drilling margin and earnings before interest, taxes, depreciation and amortization (EBITDA) information because we believe it provides investors and our management additional information to assist them in assessing our business and performance in comparison to other companies in our industry. Since drilling margin and EBITDA are “non-GAAP” financial measure under the rules and regulations of the SEC, we are providing the following reconciliation of drilling margin and EBITDA to net earnings, which is the nearest comparable GAAP financial measure. Nine Months Ended
December 31, 2007 2006 (In thousands) $ 122,510 $ 152,668 (15,786 ) (12,370 ) (2,612 ) (800 ) 129 50 104,241 139,548 (18,129 ) (37,341 ) 2,385 2,874 (48,852 ) (38,120 ) $ 39,645 $ 66,961 Our contract drilling revenues grew by $1.1$3.3 million or .3%, for the nine months ended December 31, 2007 from the nine months ended December 31, 2006, due to a 4% increase in revenue days due to an increase in the number of rigs in our fleet. The overall increase was partially offset by a decrease in contract drilling revenues of $621 per day, or 3%, resulting from a reduced demand for drilling rigs.Our contract drilling costs grew by $31.2 million, or 19.5%, during the nine months ended December 31, 2007 from the corresponding period in 2006, primarily due to the increase in the number of revenue days resulting from the increase in the number of rigs in our fleet. Our contract drilling costs per revenue day increased by $1,565, or 15%, during the nine months ended December 31, 2007 from the corresponding period in 2006, primarily due to higher payroll and higher repairs and maintenance expenses. Contract drilling costs also increased due to a shift to more turnkey and footage revenue days as a percentage of total revenue days. Turnkey and footage revenue days represented 7% of total revenue days during the nine months ended December 31, 2007, compared to 4% during the nine months ended December 31, 2006. Under turnkey and footage contracts, we provide supplies and materials such as fuel, drill bits, casing and drilling fluids, which significantly add to drilling costs when compared to daywork contracts. These costs are also included in the revenues we recognize for turnkey and footage contracts, resulting in higher revenue rates per day for turnkey and footage contracts compared to daywork contracts which do not include such costs.Our general and administrative expense for the nine months ended December 31, 2007 increased by $3.4 million, or 28%, compared to the corresponding period in 2006. The increase resulted from $1.1 million in additional compensation-related expenses for salaries, bonuses, relocation benefits and stock options incurred for existing and new employees in our corporate office. Professional and consulting expenses increased $1.1 million during the nine months ended December 31, 2007. In addition, we incurred $.3 million of additional general and administrative expenses during the nine months ended December 31, 2007 relating to the commencementother-than-temporary impairment of our Colombian operations.Our depreciation and amortization expenses for the nine months ended December 31, 2007 increased by $10.7 million, or 28%, compared to the corresponding periodARPSs, which were liquidated in 2006. These increase in 2007 over 2006 resulted primarily from an increase in the average size of our rig fleet, which increases consisted entirely of newlyconstructed rigs. The higher costs of our new rigs increased our average depreciation costs per revenue day by $575 to $2,999 from $2,424 during the nine months ended December 31, 2007, compared to the corresponding period in 2006.Interest income for the nine months ended December 31, 2007 decreased by $.5 million, or 16%, compared to the corresponding period in 2006 due to lower average cash and cash equivalents balances during the nine months ended December 31, 2007 as compared to the corresponding period in 2006. Average cash and cash equivalents balances were $74.2 million and $85.8 million during the nine months ended 2007 and 2006, respectively.rates of 31.4% and 35.8%rate for the nine monthsyear ended December 31, 2007 and 2006, respectively, differ2010 differs from the federal statutory rate in the United States of 35% primarily due to a lower effective tax benefitsrate in foreign jurisdictions, tax benefits recognized for a previously unrecognized tax position, permanent differences and state income taxes.Our contract landtaxes, valuation allowances and other permanent differences.operations are subject to various federal and state lawsproduction services increases and regulations designed to protect the environment. Maintaining compliance with these regulationsavailability of personnel is part of our day-to-day operating procedures. We monitor each of our yard facilities and each of ourscarce. With the increase in rig locations on a day-to-day basis for potential environmental spill risks. In addition,counts beginning in late 2009, we maintain a spill prevention control and countermeasures plan for each yard facility and each rig location. The costs of these procedures represent only a small portion of our routine employee training, equipment maintenance and job site maintenance costs. We estimate the annual compliance costs for this program to be approximately $.4 million. We are not aware of any potential environmental clean-up obligations that would have a material adverse effect on our financial condition or results of operations.InflationDue to the increased rig count in each of our market areas over the past several years,saw decreased availability of personnel to operate our rigs is limited. In April 2005, January 2006, May 2006 and September 2008,therefore we raised wage rates for our drilling rig personnel by an average of 6%, 6%, 14% and 6%, respectively. We were able to pass thesehad wage rate increases on to our customers based on contract terms. In February 2009, we reduced wage rates for drilling rig personnel to offsetin certain of our locations of approximately 18% and 16% in February and July 2010, respectively. With continued increases in demand through 2011, and the resulting tightening of labor markets, we had another wage rate increase of approximately from September 2008. We do not expect wage rate increases duringtowards the fiscal year ending December 31, 2009.We are experiencing increases in costsend of the year. and costs of rig upgrades and new rig construction due toare also impacted by inflationary pressures when the increased industry-wide demand for equipment, supplies and service.drilling services increases. We estimateexperienced an increase in these costs increased by of approximately 5% and 10% to 15% during the fiscal years ended December 31, 20072010 and 2008. We do not expect 2011, respectively, and we estimate that we will experience similar cost increases during the fiscal year ending December 31, 2009.September 2006,October 2009, the Financial Accounting Standards Board (FASB) issued Accounting Standards Update (ASU) No. 2009-13, Revenue Recognition (Topic 605): Multiple Deliverable Revenue Arrangements – A Consensus of the FASB Emerging Issues Task Force. This update provides application guidance on whether multiple deliverables exist, how the deliverables should be separated and how the consideration should be allocated to one or more units of accounting. This update establishes a selling price hierarchy for determining the selling price of a deliverable. The selling price used for each deliverable will be based on vendor-specific objective evidence, if available, third-party evidence if vendor-specific objective evidence is not available, or estimated selling price if neither vendor-specific or third-party evidence is available. We are required to apply this guidance prospectively for revenue arrangements entered into or materially modified after January 1, 2011. The adoption of this new guidance has not had an impact on our financial position or results of operations.SFASASU No. 157,Fair Value Measurements. SFAS No. 157 defines fair value, establishes a framework2010-29, Business Combinations (Topic 805): Disclosure of Supplementary Pro Forma Information for measuring fair value and expands disclosureBusiness Combinations – A consensus of fair value measurements. SFAS No. 157 applies under other accounting pronouncements that require or permit fair value measurements and, accordingly, does not require any new fair value measurements. SFAS No. 157, as issued, was effective for financial statement issued for fiscal years beginning after November 15, 2007, and interim periods within those fiscal years. However, on February 12, 2008, the FASB issued FSP FAS No. 157-2,Effective DatesEmerging Issues Task Force. This update provides clarification requiring public companies that have completed material acquisitions to disclose the revenue and earnings of FASB Statement No. 157,which delays the effective datecombined business as if the acquisition took place at the beginning of SFAS No. 157 for fiscal years beginning after November 15, 2008 for all nonfinancial assetsthe comparable prior annual reporting period, and nonfinancial liabilities, except those that are recognized or disclosed at fair valuealso expands the supplemental pro forma disclosures to include a description of the nature and amount of material, nonrecurring pro forma adjustments directly attributable to the business combination included in the financial statementsreported pro forma revenue and earnings. We are required to apply this guidance prospectively for business combinations for which the acquisition date is on a recurring basis.or after January 1, 2011. The adoption of SFAS No. 157 didthis new guidance has not havehad a material impact on our financial position or results of operations.February 2007,May 2011, the FASB issued SFASASU No. 159,The2011-04, Fair Value Option for Financial AssetsMeasurement (Topic 820): Amendments to Achieve Fair Value Measurement and Financial Liabilities—Including an amendment of FASB Statement No. 115Disclosure Requirements in U.S. GAAP and IFRSs. This statement permits entities to choose to measure many financial instruments and certain other items atupdate clarifies existing guidance about how fair value should be applied where it already is required or permitted and provides wording changes that align this standard with International Financial Reporting Standards (IFRS). We are not currently required to be measured at fair value and establishes presentation and disclosure requirements designed to facilitate comparisons between entities that choose different measurement attributes for similar types of assets and liabilities. SFAS No. 159 is effective for fiscal yearsapply this guidance prospectively beginning after November 15, 2007. The adoption of SFAS No. 159 did not have a material impact onwith our financial position or results of operations.In December 2007, the FASB issued SFAS No. 160,Noncontrolling interestsfirst quarterly filing in Consolidated Financial Statements—an Amendment of ARB No. 51. This statement establishes accounting and reporting standards for the non-controlling interest in a subsidiary and for the deconsolidation of a subsidiary. SFAS No. 160 clarifies that a non-controlling interest in a subsidiary, which is sometimes referred to as minority interest, is an ownership interest in the consolidated entity that should be reported as a component of equity in the consolidated financial statements. Among other requirements, SFAS No. 160 requires consolidated net income to be reported at amounts that include the amounts attributable to both the parent and the non-controlling interest. It also requires disclosure, on the face of the consolidated income statement, of the amounts of consolidated net income attributable to the parent and to the non-controlling interest. SFAS No.160 is effective for fiscal years beginning on or after December 15, 2008.2012. We do not expect the adoption of this new guidance to have a material impact on our financial position or results of operations.December 2007,June 2011, the FASB issued SFASASU No. 141R (revised 2007) which replaces SFAS No. 141,Business Combinations(“SFAS No. 141R”)2011-05, Comprehensive Income (Topic 220): Presentation of Comprehensive Income. SFAS No. 141R appliesThis update increases the prominence of other comprehensive income in financial statements, eliminating the option of presenting other comprehensive income in the statement of changes in equity, and instead, giving companies the option to all transactionspresent the components of net income and other eventscomprehensive income in which one entity obtains control overeither one or more other businesses. SFAS No. 141R requires an acquirer, upon initially obtaining control of another entity, to recognize the assets, liabilities and any non-controlling interest in the acquiree at fair value as of the acquisition date. Contingent consideration is required to be recognized and measured at fair value on the date of acquisition rather than at a later date when the amount of that consideration may be determinable beyond a reasonable doubt. This fair value approach replaces the cost-allocation process required under SFAS No. 141 whereby the cost of an acquisition was allocated to the individual assets acquired and liabilities assumed based on their estimated fair value. SFAS No. 141R requires acquirers to expense acquisition-related costs as incurred rather than allocating such costs to the assets acquired and liabilities assumed, as was previously the case under SFAS No. 141. Under SFAS No.141R, the requirements of SFAS No. 146,Accounting for Costs Associated with Exit or Disposal Activities, would have to be met in order to accrue for a restructuring plan in purchase accounting. Pre-acquisition contingencies are to be recognized at fair value, unless it is a non-contractual contingency that is not likely to materialize, in which case, nothing should be recognized in purchase accounting and, instead, that contingency would be subject to the recognition criteria of SFAS No. 5,Accounting for Contingencies. SFAS No.141R is expected to have a significant impact on our accounting for business combinations closing on or after January 1, 2009.In March 2008, the FASB issued SFAS No. 161, Disclosures about Derivative Instruments and Hedging Activities—an amendment of FASB Statement No. 133(“SFAS No. 161”). SFAS No. 161 changes the disclosure requirements for derivative instruments and hedging activities. Entitiestwo consecutive financial statements. We are required to provide enhanced disclosures about (a) how and why an entity uses derivative instruments, (b) how derivative instruments and related hedged items are accounted for under Statement 133 and its related interpretations, and (c) how derivative instruments and related hedged items affect an entity’s financial position, financial performance, and cash flows.comply with this guidance prospectively beginning with our first quarterly filing in 2012. The guidance in SFAS No. 161 is effective for financial statements issued for fiscal years and interim periods beginning after November 15, 2008, with early application encouraged. This Statement encourages, but does not require, comparative disclosures for earlier periods at initial adoption. We do not have any derivative instruments and expect the adoption of SFAS No. 161 to have nothis new guidance will not impact on our financial position or resultsstatement of operations.operations, other than changes in presentation.April 2008,December 2011, the FASB issued FSP SFAS 142-3,DeterminationASU No. 2011-12, Comprehensive Income (Topic 220): Deferral of the Useful LifeEffective Date for Amendments to the Presentation of Intangible AssetsReclassifications of Items Out of Accumulated Other Comprehensive Income in Accounting Standards Update No. 2011-05. This guidance is intendedupdate delays the effective date of the requirement to improvepresent reclassification adjustments for each component of accumulated other comprehensive income in both net income and other comprehensive income on the consistency betweenface of the useful life of a recognized intangible asset under SFAS 142, financial statements.Intangible Assets, and(Topic 350): Testing Goodwill for Impairment. This update allows entities testing goodwill for impairment the periodoption of expected cash flows used to measureperforming a qualitative assessment before calculating the fair value of the asset under SFAS 141R whenreporting unit (i.e., step one of the underlying arrangement includes renewal or extensiontwo-step goodwill impairment test). If entities determine, on the basis ofterms qualitative factors, that the fair value of the reporting unit is more likely than not less than the carrying amount, the two-step impairment test would require substantial costs or result in a material modification to the asset upon renewal or extension. Companies estimating the useful life of a recognized intangible asset must now consider their historical experience in renewing or extending similar arrangements or, in the absence of historical experience, must consider assumptions that market participants would use about renewal or extension as adjusted for SFAS No. 142’s entity-specific factors. FSP 142-3 isbe required. The amendments are effective for periods beginning on or after January 1, 2009. We do not expect the adoption to have a material impact on our financial position or results of operations.In May 2008, the FASB issued SFAS No. 162,The Hierarchy of Generally Accepted Accounting Principles (“SFAS No. 162”). SFAS No. 162 identifies the sources of accounting principlesannual and the framework for selecting the principles used in the preparation of financial statements that are presented in conformity with generally accepted accounting principles. SFAS No. 162 is effective 60 days following approval by the Securities and Exchange Commission of the Public Company Accounting Oversight Board’s amendments to AU Section 411,The Meaning of Present Fairly in Conformity with Generally Accepted Accounting Principles. The adoption of SFAS No. 162 did not have a material impact on our financial position or results of operations.In June 2008, the FASB issued FSP No. EITF 03-6-1,Determining Whether Instruments Granted in Share-Based Payment Transactions are Participating Securities. This FSP provides that unvested share-based payment awards that contain nonforfeitable rights to dividends are participating securities and shall be included in the computation of earnings per share pursuant to the two class method. This FSP is effective for financial statements issuedinterim goodwill impairment tests performed for fiscal years beginning after December 15, 2008 and interim periods within those years. We do not expect the2011. The adoption of this FSP to have a materialnew guidance will not impact on our financial position or resultsstatement of operations.Item 7A. Quantitative and Qualitative Disclosures About Market Risk 2008,2011, we had $272.5 milliona zero balance outstanding under our senior secured revolving credit facilityRevolving Credit Facility, which is our only variable rate debt. Future borrowings under the Revolving Credit Facility would be subject to variable interest rate risk. The impact of a 1% increase in interest rates on this amount of debt would result in increased interest expense of approximately $2.7 million and a decrease in net income of approximately $1.8 million during an annual period.At December 31, 2008, we held $15.9 million (par value) of investments comprised of tax exempt, auction rate preferred securities (“ARPSs”), which are variable-rate preferred securities and have a long-term maturity with the interest rate being reset through “Dutch auctions” that are held every 7 days. The ARPSs have historically traded at par because of the frequent interest rate resets and because they are callable at par at the option of the issuer. Interest is paid at the end of each auction period. Our ARPSs are AAA/Aaa rated securities, collateralized by municipal bonds and backed by assets that are equal to or greater than 200% of the liquidation preference. Until February 2008, the auction rate securities market was highly liquid. Beginning mid-February 2008, we experienced several “failed” auctions, meaning that there was not enough demand to sell all of the securities that holders desired to sell at auction. The immediate effect of a failed auction is that such holders cannot sell the securities at auction and the interest rate on the security resets to a maximum auction rate. We have continued to receive interest payments on our ARPSs in accordance with their terms. Unless a future auction is successful or the issuer calls the security pursuant to redemption prior to maturity, we may not be able to access the funds we invested in our ARPSs without a loss of principal. We have no reason to believe that any of the underlying municipal securities that collateralize our ARPSs are presently at risk of default. We believe we will ultimately be able to liquidate our investments without material loss primarily due to the collateral securing the ARPSs. We do not currently intend to attempt to sell our ARPSs at a discount since our liquidity needs are expected to be met with cash flows from operating activities and our senior secured revolving credit facility. Our ARPSs are designated as available-for-sale and are reported at fair market value with the related unrealized gains or losses, included in accumulated other comprehensive income (loss), net of tax, a component of shareholders’ equity. The estimated fair value of our ARPSs at December 31, 2008 was $13.9 million compared with a par value of $15.9 million. The $2.0 million difference represents a fair value discount due to the current lack ofliquidity which is considered temporary and is recorded as an unrealized loss. We would recognize an impairment charge if the fair value of our investments falls below the cost basis and is judged to be other-than-temporary. Our ARPSs are classified with other long-term assets on our consolidated balance sheet as of December 31, 2008 because of our inability to determine the recovery period of our investments.$1.4$0.6 million for the year ended December 31, 2008.Item 8. Financial Statements and Supplementary Data Page 56 58 59 60 6162To the20082011 and 2007,2010, and the related consolidated statements of operations, shareholders’ equity and comprehensive income, and cash flows for each of the yearyears in the three-year period ended December 31, 2008, the nine months ended December 31, 2007 and the year ended March 31, 2007.2011. These consolidated financial statements and financial statement schedule are the responsibility of the Company’s management. Our responsibility is to express an opinion on these consolidated financial statements based on our audits.20082011 and 2007,2010, and the results of their operations and their cash flows for each of the yearyears in the three-year period ended December 31, 2008, the nine months ended December 31, 2007 and the year ended March 31, 2007,2011, in conformity with U.S. generally accepted accounting principles.the effectiveness of Pioneer Drilling Company’s internal control over financial reporting as of December 31, 2008,2011, based on criteria established in Internal Control—Integrated Framework issued by the Committee of Sponsoring Organizations of the Treadway Commission (COSO), and our report dated February 25, 200921, 2012 expressed an unqualified opinion on the effectiveness of the Company’s internal control over financial reporting.25, 2009Stockholders2008,2011, based on criteria established in Internal Control—Integrated Framework issued by the Committee of Sponsoring Organizations of the Treadway Commission (COSO). Pioneer Drilling Company’s management is responsible for maintaining effective internal control over financial reporting and for its assessment of the effectiveness of internal control over financial reporting, included in the accompanying Management’s Report on Internal Control Overover Financial Reporting. Our responsibility is to express an opinion on the Company’s internal control over financial reporting based on our audit.2008,2011, based on criteria established in Internal Control—Integrated Framework issued by the Committee of Sponsoring Organizations of the Treadway Commission.Pioneer Drillingthe production services businesses of WEDGE Group Incorporated, Prairie Investors d/b/a Competition Wireline, Paltec, Inc. and Pettus Well Service (acquired companies) during 2008,Go-Coil, LLC ("Go-Coil") on December 31, 2011 and management excluded Go-Coil's internal control over financial reporting from its assessment of the effectiveness of Pioneer Drilling Company’sthe Company's internal control over financial reporting as of December 31, 2008,2011. Go-Coil contributed approximately 10% of the acquired companies’ internal control over financial reporting associated withCompany's total assets of $232.1 million and total revenues of $154.0 million included in the consolidated financial statement amounts of Pioneer Drilling Company as of and for the year ended December 31, 2008.2011. Our audit of internal control over financial reporting of Pioneer Drillingthe Company also excluded an evaluation of the internal control over financial reporting of the acquired companies.20082011 and 2007,2010, and the related consolidated statements of operations, shareholders’ equity and comprehensive income, and cash flows for each of the yearyears in the three-year period ended December 31, 2008, the nine months ended December 31, 2007 and the year ended March 31, 2007,2011, and our report dated February 25, 200921, 2012 expressed an unqualified opinion on those consolidated financial statements.25, 2009 December 31,
2008 December 31,
2007 (In thousands, except share data) $ 26,821 $ 76,703 87,161 47,370 12,262 7,861 6,270 3,670 3,874 1,180 8,902 5,073 145,290 141,857 858,491 578,697 230,929 161,675 627,562 417,022 — 573 29,913 57 21,714 703 $ 824,479 $ 560,212 $ 21,830 $ 21,424 17,298 — 1,171 1,933 13,592 5,172 17,520 9,548 9,507 3,973 80,918 42,050 262,115 — 6,413 254 60,915 46,836 410,361 89,140 — — 5,000 4,965 301,923 294,922 108,440 171,185 (1,245 ) — 414,118 471,072 $ 824,479 $ 560,212 December 31,
2011 December 31,
2010 (In thousands, except share data) ASSETS Current assets: Cash and cash equivalents $ 86,197 $ 22,011 Short-term investments — 12,569 Receivables: Trade, net of allowance for doubtful accounts 106,084 61,345 Unbilled receivables 31,512 21,423 Insurance recoveries 5,470 4,035 Income taxes 2,168 2,712 Deferred income taxes 15,433 9,867 Inventory 11,184 9,023 Prepaid expenses and other current assets 11,564 8,797 Total current assets 269,612 151,782 Property and equipment, at cost 1,336,926 1,097,179 Less accumulated depreciation 542,970 441,671 Net property and equipment 793,956 655,508 Intangible assets, net of amortization 52,680 21,966 Goodwill 41,683 — Noncurrent deferred income taxes 735 — Other long-term assets 14,088 12,087 Total assets $ 1,172,754 $ 841,343 LIABILITIES AND SHAREHOLDERS’ EQUITY Current liabilities: Accounts payable $ 66,440 $ 26,929 Current portion of long-term debt 872 1,408 Prepaid drilling contracts 3,966 3,669 Accrued expenses: Payroll and related employee costs 29,057 18,057 Insurance premiums and deductibles 10,583 8,774 Insurance claims and settlements 5,470 4,035 Interest 12,283 7,307 Other 11,009 5,461 Total current liabilities 139,680 75,640 Long-term debt, less current portion 418,728 279,530 Noncurrent deferred income taxes 94,745 80,160 Other long-term liabilities 9,156 9,680 Total liabilities 662,309 445,010 Commitments and contingencies (Note 11) Shareholders’ equity: Preferred stock, 10,000,000 shares authorized; none issued and outstanding — — Common stock $.10 par value; 100,000,000 shares authorized; 61,782,180 shares and 54,228,170 shares outstanding at December 31, 2011 and December 31, 2010, respectively 6,188 5,425 Additional paid-in capital 442,020 339,105 Treasury stock, at cost; 95,409 shares and 25,380 shares at December 31, 2011 and December 31, 2010, respectively (904 ) (161 ) Accumulated earnings 63,141 51,964 Total shareholders’ equity 510,445 396,333 Total liabilities and shareholders’ equity $ 1,172,754 $ 841,343 Year Ended
December 31, 2008 Nine Months
Ended
December 31, 2007 Year Ended
March 31, 2007 (In thousands, except per share data) $ 456,890 $ 313,884 $ 416,178 153,994 — — 610,884 313,884 416,178 269,846 191,374 219,353 80,097 — — 88,145 48,852 52,856 44,834 15,786 16,193 423 2,612 800 118,646 — — 52,847 — — 654,838 258,624 289,202 (43,954 ) 55,260 126,976 (13,072 ) (16 ) (73 ) 1,256 2,401 3,828 (918 ) 129 58 (12,734 ) 2,514 3,813 (56,688 ) 57,774 130,789 (6,057 ) (18,129 ) (46,609 ) $ (62,745 ) $ 39,645 $ 84,180 $ (1.26 ) $ 0.80 $ 1.70 $ (1.26 ) $ 0.79 $ 1.68 49,789 49,645 49,603 49,789 50,201 50,132 Year ended December 31, 2011 2010 2009 (In thousands, except per share data) Revenues: Drilling services $ 433,902 $ 312,196 $ 219,751 Production services 282,039 175,014 105,786 Total revenues 715,941 487,210 325,537 Costs and expenses: Drilling services 292,559 227,136 147,343 Production services 164,365 105,295 68,012 Depreciation and amortization 132,832 120,811 106,186 General and administrative 67,318 52,047 37,478 Bad debt expense (recovery) 925 493 (1,642 ) Impairment of equipment 484 — — Total costs and expenses 658,483 505,782 357,377 Income (loss) from operations 57,458 (18,572 ) (31,840 ) Other (expense) income: Interest expense (29,721 ) (26,567 ) (8,928 ) Impairment of investments — (3,331 ) — Other (6,904 ) 912 596 Total other expense (36,625 ) (28,986 ) (8,332 ) Income (loss) before income taxes 20,833 (47,558 ) (40,172 ) Income tax (expense) benefit (9,656 ) 14,297 16,957 Net income (loss) $ 11,177 $ (33,261 ) $ (23,215 ) Income (loss) per common share—Basic $ 0.19 $ (0.62 ) $ (0.46 ) Income (loss) per common share—Diluted $ 0.19 $ (0.62 ) $ (0.46 ) Weighted average number of shares outstanding—Basic 57,390 53,797 50,313 Weighted average number of shares outstanding—Diluted 58,779 53,797 50,313 Shares
Common Amount
Common Additional
Paid In
Capital Accumulated
Earnings Accumulated
Other
Comprehensive
Loss Total
Shareholders’
Equity (In thousands) 49,592 $ 4,959 $ 288,356 $ 47,361 $ — $ 340,676 — — — 84,179 — 84,179 — — — — — 84,179 37 4 190 — — 194 — — 3,061 — — 3,061 49,629 4,963 291,607 131,540 — 428,110 — — — 39,645 — 39,645 — — — — — 39,645 22 2 158 — — 160 — — 3,157 — — 3,157 49,651 $ 4,965 $ 294,922 $ 171,185 $ — $ 471,072 — — — (62,745 ) — (62,745 ) — — — — (1,245 ) (1,245 ) (63,990 ) 170 17 1,011 — — 1,028 177 18 (34 ) — — (16 ) — — 6,024 — — 6,024 49,998 $ 5,000 $ 301,923 $ 108,440 $ (1,245 ) $ 414,118 Shares Amount Common Treasury Common Treasury (In thousands) Balance at December 31, 2008 49,998 — $ 5,000 $ — $ 301,923 $ 108,440 $ (1,245 ) $ 414,118 Comprehensive loss: Net loss — — — — — (23,215 ) — (23,215 ) Unrealized loss on securities — — — — — — (448 ) (448 ) Total comprehensive loss (23,663 ) Sale of common stock, net of offering costs 3,820 — 382 — 23,661 — — 24,043 Purchase of treasury stock — (5 ) — (31 ) — — — (31 ) Income tax effect of restricted stock vesting — — — — (235 ) — — (235 ) Issuance of restricted stock 308 — 31 — (31 ) — — — Stock-based compensation expense — — — — 7,216 — — 7,216 Balance at December 31, 2009 54,126 (5 ) $ 5,413 $ (31 ) $ 332,534 $ 85,225 $ (1,693 ) $ 421,448 Comprehensive loss: Net loss — — — — — (33,261 ) — (33,261 ) Impact of impairment of investments charge — — — — — — 1,693 1,693 Total comprehensive loss (31,568 ) Exercise of options and related income tax effect 63 — 6 — 248 — — 254 Purchase of treasury stock — (20 ) — (130 ) — — — (130 ) Income tax effect of restricted stock vesting — — — — (120 ) — — (120 ) Income tax effect of stock option forfeitures and expirations — — — — (226 ) — — (226 ) Issuance of restricted stock 64 — 6 — (6 ) — — — Stock-based compensation expense — — — — 6,675 — — 6,675 Balance at December 31, 2010 54,253 (25 ) $ 5,425 $ (161 ) $ 339,105 $ 51,964 $ — $ 396,333 Comprehensive income: Net income — — — — — 11,177 — 11,177 Total comprehensive income 11,177 Sale of common stock, net of offering costs 6,900 — — — 690 — — 93,653 — — — — 94,343 Exercise of options and related income tax effect 517 — 52 — 2,832 — — 2,884 Purchase of treasury stock — (70 ) — (743 ) — — — (743 ) Income tax effect of stock option forfeitures and expirations — — — — (254 ) — — (254 ) Issuance of restricted stock 207 — 21 — (21 ) — — — Stock-based compensation expense — — — — 6,705 — — 6,705 Balance at December 31, 2011 61,877 (95 ) $ 6,188 $ (904 ) $ 442,020 $ 63,141 $ — $ 510,445 Year Ended
December 31, 2008 Nine Months
Ended
December 31, 2007 Year Ended
March 31, 2007 (In thousands) $ (62,745 ) $ 39,645 $ 84,180 88,145 48,852 52,856 1,591 2,612 800 (805 ) 2,809 5,760 4,597 3,157 3,061 171,493 — — (2,310 ) 5,947 10,653 265 (519 ) 20 (621 ) (92 ) (41 ) (24,867 ) 9,692 (23,170 ) (927 ) (1,180 ) — (2,390 ) (1,420 ) (1,445 ) (2,610 ) 919 (137 ) 409 — (6,843 ) (762 ) 1,933 (140 ) 17,928 3,100 5,976 186,391 115,455 131,530 (313,621 ) — — (26,772 ) — — (9,301 ) — — (147,455 ) (126,158 ) (144,507 ) (15,900 ) — — 4,008 2,300 6,547 3,426 — — (505,615 ) (123,858 ) (137,960 ) (87,767 ) — — 359,400 — — (3,319 ) — — 784 107 174 244 54 27 269,342 161 201 (49,882 ) (8,242 ) (6,229 ) 76,703 84,945 91,174 $ 26,821 $ 76,703 $ 84,945 $ 12,468 $ 15 $ 104 $ 11,166 $ 9,473 $ 46,258 Year ended December 31, 2011 2010 2009 (In thousands) Cash flows from operating activities: Net income (loss) $ 11,177 $ (33,261 ) $ (23,215 ) Adjustments to reconcile net income (loss) to net cash provided by operating activities: Depreciation and amortization 132,832 120,811 106,186 Allowance for doubtful accounts 787 521 (1,170 ) Loss (gain) on dispositions of property and equipment 151 (1,629 ) 56 Stock-based compensation expense 6,705 6,675 7,216 Amortization of debt issuance costs and discount 3,302 2,609 1,547 Impairment of investments — 3,331 — Impairment of equipment 484 — — Deferred income taxes 8,098 (13,224 ) 28,400 Change in other long-term assets 2,828 (1,373 ) 69 Change in other long-term liabilities (623 ) 3,223 (1,312 ) Changes in current assets and liabilities: Receivables (46,802 ) (9,576 ) 18,180 Inventory (2,161 ) (3,487 ) (1,661 ) Prepaid expenses and other current assets (1,965 ) (2,598 ) 2,703 Accounts payable 9,331 7,458 (2,243 ) Prepaid drilling contracts 297 3,261 (763 ) Accrued expenses 20,438 15,610 (10,680 ) Net cash provided by operating activities 144,879 98,351 123,313 Cash flows from investing activities: Acquisition of production services business of Go-Coil (109,035 ) — — Acquisition of other production services businesses (6,502 ) (1,340 ) — Purchases of property and equipment (210,066 ) (131,003 ) (114,712 ) Proceeds from sale of property and equipment 5,550 2,331 767 Proceeds from sale of auction rate securities 12,569 — — Proceeds from insurance recoveries — 531 36 Net cash used in investing activities (307,484 ) (129,481 ) (113,909 ) Cash flows from financing activities: Debt repayments (113,158 ) (256,856 ) (17,298 ) Proceeds from issuance of debt 250,750 274,375 — Debt issuance costs (7,285 ) (4,865 ) (2,560 ) Proceeds from exercise of options 2,884 238 — Proceeds from common stock, net of offering costs of $5,707 and $454 in 2011 and 2009, respectively 94,343 — 24,043 Purchase of treasury stock (743 ) (130 ) (31 ) Net cash provided by financing activities 226,791 12,762 4,154 Net increase (decrease) in cash and cash equivalents 64,186 (18,368 ) 13,558 Beginning cash and cash equivalents 22,011 40,379 26,821 Ending cash and cash equivalents $ 86,197 $ 22,011 $ 40,379 Supplementary disclosure: Interest paid $ 26,955 $ 17,529 $ 7,917 Income tax paid (refunded) $ 952 $ (39,778 ) $ (8,889 ) 1.1. Organization and Summary of Significant Accounting Policies and subsidiaries provideprovides drilling services and production services to our customers in selectindependent and major oil and natural gas exploration and production companies throughout much of the oil and gas producing regions inof the United States and internationally in Colombia.7064 drilling rigs in the following locations: Rig Count 1715 22518 North TexasDakota 9 64North Dakota6Oklahoma 5 5823, 2009, 3610, 2012, 55 drilling rigs are operating 29under drilling contracts, 44 of which are under term contracts. We have nine drilling rigs that are idle, and five drilling rigs locatedthree of which are under contract to begin working in our Oklahoma drilling division have been placed in storage or “cold stacked” due to low demand for drilling rigs in this region.the first quarter of 2012. We are actively marketing all our idle drilling rigs.we are earning revenue on twomost of these rigsthe ancillary equipment needed to operate our drilling rigs. We obtain our contracts for drilling oil and natural gas wells either through early termination fees on theircompetitive bidding or through direct negotiations with customers. Our drilling contracts withgenerally provide for compensation on either a daywork, turnkey or footage basis. Contract terms expiring in March 2009generally depend on the complexity and May 2009. We are constructing a 1500 horsepowerrisk of operations, the on-site drilling rig that we expectconditions, the type of equipment used, and the anticipated duration of the work to be completed and available for operation in the in our North Dakota drilling division under a contract with a three year term beginning March 2009.broad range of services to exploration and production companies, including well services, to oil and gas drilling and producing companies, including workover services, wireline, services,coil tubing, and fishing and rental services. Our production services operations are managed regionally and arethrough locations concentrated in the major United States onshore oil and gas producing regions in the Gulf Coast, Mid-Continent, and Rocky Mountain and Appalachian states. WeAs of February 10, 2012, we have a premium fleet of 74 workover91 well service rigs consisting of sixty-nineeighty-one 550 horseposewerhorsepower rigs, fournine 600 horsepower rigs and one 400 horsepower rig. As of February 23, 2009, 62 workoverAll our well service rigs are currently operating and 12 workover rigsor are idlebeing actively marketed, with no crews assigned.January utilization of approximately 86%. We currently provide wireline and coiled tubing services with a fleet of 59109 and ten wireline and coiled tubing units, respectively, and we provide rental services with approximately $15$15.1 million of fishing and rental tools.In December 2007, our Board of Directors approved a change in our fiscal year end from March 31st to December 31st. The fiscal year end change was effective December 31, 2007 and resulted in a nine month reporting period from April 1, 2007 to December 31, 2007. We implemented the fiscal year end change to align our United States reporting period with the required Colombian statutory reporting period as well as the reporting periods of peer companies in the industry.However, we have entered into more longer-term drilling contracts duringDuring periods of high rig demand. In addition, we have entered into longer-term drilling contractsdemand, or for our newly constructed rigs. As of February 6, 2009,rigs, we had 27enter into longer-term drilling contracts. Currently, we have contracts with terms of six months to threefour years in duration,duration. As of which 18February 10, 2012, we have 44 drilling rigs operating under term contracts. Of these 44 contracts, if not renewed at the end of their terms, 21 will expire by August 6, 2009, sixJuly 10, 2012, 22 will expire by February 10, 2013 and one will expire by February 10, 2014. We have aterm contracts for an additional three drilling rigs that we expect will begin operating in the first quarter of 2012 and we have ten term contracts for new-build AC drilling rigs, five of which we estimate will begin working in the first half of 2012, with the remaining termfive to begin operating by the end of six to 12 months, one has a remaining term of 12 to 18 months and two have a remaining term in excess of 18 months.We earnOur Drilling Services Division earns revenues by drilling oil and natural gas wells for our customers under daywork, turnkey or footage contracts, which usually provide for the drilling of a single well. We recognize revenues on daywork contracts for the days completed based on the dayrate each contract specifies. We recognize revenues from our turnkey and footage contracts on the percentage-of-completion method based on our estimate of the number of days to complete each contract. With most drillingIndividual contracts we receive payments contractually designated for the mobilization of rigsare usually completed in less than 60 days. The risks to us under a turnkey contract and, other equipment. Payments received, and costs incurred for the mobilization servicesto a lesser extent, under footage contracts, are deferred and recognizedsubstantially greater than on a straight line basis overcontract drilled on a daywork basis. Under a turnkey contract, we assume most of the risks associated with drilling operations that are generally assumed by the operator in a daywork contract, termincluding the risks of certainblowout, loss of hole, stuck drill pipe, machinery breakdowns and abnormal drilling contracts. Costs incurred to relocate rigsconditions, as well as risks associated with subcontractors’ services, supplies, cost escalations and other drilling equipment to areas in which a contract has not been secured are expensed as incurred. Reimbursements that we receive for out-of-pocket expenses are recorded as revenue and the out-of-pocket expenses for which they relate are recorded as operating costs.personnel operations. as defined in the American Institute of Certified Public Accountants’ Statement of Position 81-1, to recognize revenue on our turnkey and footage contracts. Although our turnkey and footage contracts do not have express terms that provide us with rights to receive payment for the work that we perform prior to drilling wells to the agreed-on depth, we use this method because, as provided in applicable accounting literature, we believe we achieve a continuous sale for our work-in-progress and we believe, under applicable state law, we ultimately could recover the fair value of our work-in-progress even in the event we were unable to drill to the agreed-on depth in breach of the applicable contract. However, in the event we were unable to drill to the agreed-on depth in breach of the contract, ultimate recovery of that value would be subject to negotiations with the customer and the possibility of litigation.includingquantum meruit, available in applicable courts to recover the fair value of our work-in-progress under a turnkey or footage contract.We charge generalIn addition, the occurrence of uninsured or under-insured losses or operating cost overruns on our turnkey and administrative expenses to expense as we incur them. Changes in job performance, job conditionsfootage contracts could have a material adverse effect on our financial position and estimated profitability on uncompleted contracts may result in revisions to costs and income. When we encounter, during the courseresults of operations. Therefore, our drilling operations, conditions unforeseen in the preparation ofactual results for a contract could differ significantly if our cost estimates for that contract are later revised from our original cost estimate, we immediately increase our cost estimateestimates for the additional costs to complete the contract. If we anticipate a loss on a contract in progress at the end of a reporting period duewhich was not completed prior to the release of our financial statements.changestraight line basis over the related contract term. Costs incurred to relocate rigs and other drilling equipment to areas in our cost estimate,which a contract has not been secured are expensed as incurred. Reimbursements that we immediately accruereceive for out-of-pocket expenses are recorded as revenue and the entire amount of the estimated loss including all costs thatout-of-pocket expenses for which they relate are included in our revised estimated cost to complete that contract in our consolidated statement of operations for that reporting period. We had no turnkey or footage contracts in progressrecorded as of December 31, 2008.Services—We earnServices—Our Production Services Division earns revenues for well services, wireline, servicescoiled tubing, and fishing and rental services pursuant to master services agreements based on purchase orders, contracts or other persuasive evidence of an arrangement with the customer such as master service agreements, that include fixed or determinable prices. These production services revenues areProduction service revenue is recognized when the services haveservice has been rendered and collectibilitycollectability is reasonably assured.progress. progress at December 31, 2011 and $3.0 million related to unbilled receivables for our Production Services Division.assetassets “prepaid expenses and other current assets” includesand “other long-term assets” include the current and long-term portions of deferred mobilization costs for certain drilling contracts. The liabilityliabilities “prepaid drilling contracts” representsand “other long-term liabilities” include the current and long-term portions of deferred mobilization revenues for certain drilling contracts and amounts collected on contracts in excess of revenues recognized20082011 and 20072010 were $26.8$5.7 million and $76.7$5.7 million, respectively.2008,2011, we had restricted cash in the amount of $3.3$1.3 million held in an escrow account to be used for future payments in connection with the acquisition of Prairie Investors d/b/a Competition Wireline (“Competition”). The former ownerowners of Competition will receive annual installments of $0.7$0.7 million payable over a five year termthe remaining two years from the escrow account. Restricted cash of $0.7$0.7 million and $2.6$0.7 million is recorded in other current assets and other-long termother long-term assets, respectively. The associated obligation of $0.7$0.7 million and $2.6$0.7 million is recorded in other accrued expenses and other long-term liabilities, respectively.On August 28, 2008, we deposited $0.9 million into a trust account in accordance with the terms of the severance agreement in connection with the resignation of our former Chief Financial Officer. The trust account balance of $0.9 million plus net earnings will be distributed to our former Chief Financial Officer on March 2, 2009. As of December 31, 2008, this trust account had a balance of $0.9 million and is recorded in other current assets with the associated obligation recorded in accrued expenses.determine the allowance based on the credit worthiness of our customers and general economic conditions. Consequently, an adverse change in those factors could affect our estimate of our allowance for doubtful accounts. We review our allowance for doubtful accounts on acollectibility.collectability. We charge off account balances against the allowance after we have exhausted all reasonable means of collection and determined that the potential for recovery is remote. We do not have any off-balance sheet credit exposure related to our customers. Year Ended
December 31, 2008 Nine
Months Ended
December 31, 2007 Year Ended
March 31, 2007 $ — $ 1,000 $ 200 1,591 2,612 800 (17 ) (3,612 ) — $ 1,574 $ — $ 1,000 Year ended December 31, 2011 2010 2009 Balance at beginning of year $ 712 $ 286 $ 1,574 Increase (decrease) in allowance charged to expense 787 521 (1,170 ) Accounts charged against the allowance, net of recoveries (505 ) (95 ) (118 ) Balance at end of year $ 994 $ 712 $ 286 InvestmentsAs of Other long-term assets includeDecember 31, 2010, short-term investments inrepresented tax exempt, auction rate preferred securities (“ARPS”ARPSs”). Our ARPSs are that were classified with other long-term assets on our consolidated balance sheet as of available for sale. At December 31, 2008 because of our inability to determine the recovery period of our investments.At December 31, 2008,2010, we held $15.9$15.9 million (par value) of ARPSs, which arewere variable-rate preferred securities and havehad a long-term maturity with the interest rate being reset through “Dutch auctions” that arewere held every 7seven days. TheOn January 19, 2011, we entered into an agreement with a financial institution to sell the ARPSs have historically traded at par becausefor $12.6 million, which represented 79% of the frequent interest rate resetspar value, plus accrued interest. The $3.3 million difference between the ARPSs’ par value of $15.9 million and because they are callable at parthe sales price of $12.6 million represented an other-than-temporary impairment of the ARPSs investment which was reflected as an impairment of investments in our consolidated statement of operations for the year ended December 31, 2010.option$12.6 million price at which they were initially sold to the financial institution; and (b) if not repurchased, receive additional proceeds from the financial institution upon redemption of the issuer. Interest is paidARPSs by the original issuer of these securities (collectively, the “ARPSs Call Option”). Upon origination, the fair value of the ARPSs Call Option was estimated to be $0.6 million and was recognized as other income in our consolidated statement of operations for 2011. We are required to assess the value of the ARPSs Call Option at the end of each auction period. Our ARPSs are AAA/Aaa rated securities, collateralized by municipal bonds and backed by assets that are equal to or greater than 200% of the liquidation preference. Until February 2008, the auction rate securities market was highly liquid. Beginning mid-February 2008, we experienced several “failed” auctions, meaning that there was not enough demand to sell all of the securities that holders desired to sell at auction. The immediate effect of a failed auction is that such holders cannot sell the securities at auction and the interest rate on the security resets to a maximum auction rate. We have continued to receive interest payments on our ARPSsreporting period, with any changes in accordance with their terms. We may not be able to access the funds we invested in our ARPSs without a loss of principal, unless a future auction is successful or the issuer calls the security pursuant to redemption prior to maturity. We have no reason to believe that any of the underlying municipal securities that collateralize our ARPSs are presently at risk of default. We believe we will ultimately be able to liquidate our investments without material loss primarily due to the collateral securing the ARPSs. We do not currently intend to attempt to sell our ARPSs since our liquidity needs are expected to be met with cash flows from operating activities and our senior secured revolving credit facility.Our ARPSs are reported at amounts that reflect our estimate of fair value. Statement of Financial Accounting Standards (“SFAS”) No. 157, Fair Value Measurement, provides a hierarchal framework associated with the level of subjectivity used in measuring assets and liabilities at fair value. To estimate the fair values of our ARPSs, we used inputs defined by SFAS 157 as level 3 inputs which are unobservable for the asset or liability and are developed based on the best information available in the circumstances. We estimate the fair value recorded within our consolidated statement of ouroperations. As of based on discounted cash flow models and secondary market comparisons of similar securities.Our ARPSs are designated as available-for-sale and are reported at fair market value with the related unrealized gains or losses, included in accumulated other comprehensive income (loss), net of tax, a component of shareholders’ equity. TheCall Option had an estimated fair value of our ARPSs at December 31, 2008$13.9 million compared with a par value of $15.9 million. The $2.0 million difference represents a fair value discount due to the current lack of liquidity which is considered temporary and is recorded as an unrealized loss, net of tax, in accumulated other comprehensive income (loss). We would recognize an impairment chargeincluded in our statement of operations if the fair value ofother long-term assets in our investments falls below the cost basis and is judged to be other-than- temporary. Lives Cost Drilling rigs and equipment 3 - 25 $ 978,249 Well service rigs and equipment 5 - 20 153,503 Wireline units and equipment 2 - 10 101,955 Coiled tubing units and equipment 2 - 7 25,357 Fishing and rental tools and equipment 5 - 10 15,063 Vehicles 3 - 10 46,890 Office equipment 3 - 5 5,905 Buildings and improvements 3 - 40 9,196 Land — 808 $ 1,336,926 $0.8$(0.2) million ($2.8), $1.6 million and ($5.8)$(0.1) million for the yearyears ended December 31, 2008, the nine months ended December 31, 20072011, 2010 and the year ended March 31, 2007,2009, respectively. During the yearyears ended December 31, 2008,2011, 2010 and 2009, we capitalized $0.3$2.3 million, $0.5 million and $0.3 million, respectively, of interest costs incurred during the construction periods of certain drilling equipment.equipment and new-build drilling rigs. During 2011, we incurred $66.5 million of costs on ten new-build drilling rigs that were under construction at December 31, 2011. We did not capitalizehave any interest costs during the nine months ended December 31, 2007 or during the year ended March 31, 2007. We incurred $10.2 million of costs on one drilling rig that was under construction at December 31, 2008. We had no rigs under construction at December 31, 2007, and we incurred approximately $8.6 million of costs for rigs under construction at March 31, 2007.present, as defined in SFAS No. 144,Accounting for the Impairment or Disposal of Long-Lived Assets.present. Circumstances that could indicate a potential impairment include significant adverse changes in industry trends, economic climate, legal factors, and an adverse action or assessment by a regulator. More specifically, significant adverse changes in industry trends include significant declines in revenue rates, utilization rates, oil and natural gas market prices and industry rig counts for drilling rigs and workoverwell service rigs.As described in theIntangible Asset section of Note 1, our long-lived asset and intangible asset impairment analysis for the reporting units in our Production Services Division resulted in no impairment charge to property and equipment and a non-cash impairment charge of $52.8 million to the carrying value of our intangible assets for customers relationships for the year ended December 31, 2008. This impairment charge is not expected to have an impact on our liquidity or debt covenants; however, it is a reflection of the overall downturn in our industry and decline in our projected cash flows. For our Drilling Services Division, we have notrecorded an impairment charge on any long-lived assets for the year ended December 31, 2008. The assumptions used in the impairment evaluation for long-lived assets and intangible assets are inherently uncertain and require management judgment.Effective January 1, 2008, management reassessed the estimated useful lives assigned to a group of 19 drilling rigs that were recently constructed. These drilling rigs were constructed with new components that have longer estimated useful lives when compared to other drilling rigs that are equipped with older components. As a result, we increased the estimated useful lives for this group of recently constructed drilling rigs from an average useful life of 9 years to 12 years. The following table provides the impact of this change in depreciation and amortization expense for the year ended December 31, 2008 (amounts in thousands): Year Ended
December 31, 2008 $ 91,921 (3,776 ) $ 88,145 $ (1.31 ) 0.05 $ (1.26 ) As of December 31, 2008, the estimated useful lives of our asset classes are as follows:LivesDrilling rigs and equipment3 - 25Workover rigs and equipment5 -20Wireline units and equipment2 - 10Fishing and rental tools equipment7Vehicles3 - 10Office equipment3 - 5Buildings and improvements3 - 40 We account for goodwill and other intangible assets under the provisions of SFAS No. 142,Goodwill and Other Intangible Assets. Goodwill is tested for impairment annually as of December 31 or more frequently if events or changes in circumstances indicate that the asset might be impaired. Circumstances that could indicate a potential impairment include a significant adverse change in the economic or business climate, a significant adverse change in legal factors, an adverse action or assessment by a regulator, unanticipated competition, loss of key personnel and the likelihood that a reporting unit or significant portion of a reporting unit will be sold or otherwise disposed of. These circumstances could lead to our net book value exceeding our market capitalization which is another indicator of a potential impairment in goodwill. SFAS No. 142 requiresimpairment.impairment of goodwill. First, the fair value of each reporting unit with goodwill is compared to its carrying value to determine whether an indication of impairment exists. All our goodwill is related to our Production Services Division operating segment and is allocated to its three reporting units which are well services, wireline services and fishing and rental services. Second, if impairment is indicated, then the fair value of the reporting unit’sunit's goodwill is determined by allocating the unit’sunit's fair value to its assets and liabilities (including any unrecognized intangible assets) as if the reporting unit had been acquired in a business combination on the impairment test date. The amount of impairment for goodwill is measured as the excess of the carrying value of the reporting unit over its fair value.arewere discounted using a weighted average cost of capital rate. The market approach provides an estimated fair value based on our market capitalization that iswas computed using the prior 30-day average market price of our common stock and the number of shares outstanding as of the impairment test date. The estimated fair values computed using the income approach and the market approach arewere then equally weighted and combined into a single fair value.arewere primarily based on projected revenues, operating costs and capital expenditures and are discounted based on comparable industry average rates for weighted average cost of capital. We utilized discount rates based on weighted average cost of capital ranging from 15.8% to 16.7% when we estimated fair values of our reporting units as of December 31, 2008. The primary assumptions used in the market approach is the allocation of total market capitalization to each reporting unit, which iswas based on projected EBITDA percentages for each reporting unit, and control premiums, which arewere based on comparable industry averages. We utilized a 30% control premium when we estimated fair values of our reporting units as of December 31, 2008. To ensure the reasonableness of the estimated fair values of our reporting units, we performperformed a reconciliation of our total market capitalization to the total estimated fair value of all our reporting units. The assumptions used in estimating fair values of reporting units and performing the goodwill impairment test are inherently uncertain and requirerequired management judgment.Our common stock price per share declined in market value from $13.30 at September 30, 2008, to $5.57 at 2008, which resulted in our net book value exceeding our market capitalization during most2011. All of this time period. We believe the decline in the market price of our common stock resulted from a significant adverse change in the economic and business climate as financial markets reacted to the credit crisis facing major lending institutions and worsening conditions in the overall economy during the fourth quarter of the year ended December 31, 2008. During the same time, there were significant declines in oil and natural gas prices which lead to declines in production service revenues, margins and cash flows. We considered the impact of these significant adverse changes in the economic and business climate as we performed our annual impairment assessment of goodwill as of December 31, 2008. The estimated fair values of our reporting units were negatively impacted by significant reductions in estimated cash flows for the income approach component and a significant reduction in our market capitalization for the market approach component of our fair value estimation process. Our goodwill was initially recorded in connection with the acquisitionsacquisition of the production services businessesbusiness from WEDGE, Competition, Pettus and Paltec, all of which occurred between March 1, 2008 and October 1, 2008, when production service revenues, margins and cash flows andGo-Coil on December 31, 2011, as described in Note 2, Acquisitions. As a result, the goodwill has been allocated to the coiled tubing services reporting unit within our market capitalization were at historically high levels.OurProduction Services Division operating segment. No impairment loss on goodwill impairment analysis lead us to conclude that there would be no remaining implied fair value attributable to our goodwill and accordingly, we recorded a non-cash charge of $118.6 million to our operating results forwas recognized during the year ended 2008, for the full impairment of our goodwill. Our goodwill impairment analysis would have lead to the same full impairment conclusion if we increased or decreased our discount rates or control premiums by 10% when estimating the fair values of our reporting units. This impairment charge is not expected to have an impact on our liquidity or debt covenants; however, it is a reflection of the overall downturn in our industry and decline in our projected cash flows.Changes in the carrying amount of goodwill by operating segment are as follows (amounts in thousands): Drilling
Services
Division Production
Services
Division Total $ — $ — $ — — 118,646 118,646 — (118,646 ) (118,646 ) $ — $ — $ — customerscustomer relationships, non-compete agreements, trade marks and trade names. Essentially all of our intangible assets were recorded in connection with the acquisitions of the production services businesses from WEDGE, Competition, Pettus and Paltec, all of which occurred between March 1, 2008 and October 1, 2008 as described in Note 2.businesses. Intangible assets consist of the following components (amounts in thousands): December 31,
2008 December 31,
2007 $ 87,316 $ — 2,304 150 1,600 — (6,069 ) — (791 ) (93 ) (1,600 ) — (52,847 ) — $ 29,913 $ 57 December 31, 2011 December 31, 2010 Cost: Customer relationships $ 66,273 $ 33,036 Non-compete agreements 3,133 2,024 Trademarks / trade names 671 155 Accumulated amortization: Customer relationships (15,512 ) (11,462 ) Non-compete agreements (1,885 ) (1,787 ) $ 52,680 $ 21,966 present, as defined in SFAS No. 144,Accounting for the Impairment or Disposal of Long-Lived Assets.present. Circumstances that could indicate a potential impairment include significant adverse changes in industry trends, economic climate, legal factors, and an adverse action or assessment by a regulator. More specifically, significant adverse changes in industry trends include significant declines in revenue rates, utilization rates, oil and natural gas market prices and industry rig counts for drilling rigs and workoverwell service rigs.threefour reporting units which are well services, wireline services, coiled tubing services and fishing and rental services. If the sum of the estimated future undiscounted net cash flows is less than the carrying amount of the long-lived assets and intangible assets in each reporting unit, then we would recognize an impairment charge. The amount of an impairment charge would be measured as the difference between the carrying amount and the fair value of these assets. The assumptions used in the impairment evaluation for long-lived assets and intangible assets are inherently uncertain and require management judgment.We performed an impairment analysis our long-lived assets and intangible assets at December 31, 2008, due to significant adverse changes in the economic and business climate that resulted in decreases in estimated revenues, margins and cash flows. Essentially all our intangible assets were recorded in connection with the acquisitions of the production services businesses from WEDGE, Competition, Pettus and Paltec when revenues, margins and cash flows were at historically high levels earlier in 2008. We determined that the sum of the estimated future undiscounted net cash flows is less than the carrying amount of the long-lived assets and intangible assets in each reporting unit at December 31, 2008. Our impairment analysis resulted in a reduction to our intangible asset carrying value of customers relationships and a non-cash impairment charge of $52.8 million recorded to our operating results for the year ended December 31, 2008.Amortization expense for our customer relationships, trademarks and trade names are calculatedamortized using the straight-line method over their respective estimated economic useful lives which range from fourareis calculated using the straight-line method over the period of the agreements which range from onetwo to fiveseven years. Amortization expense was $8.4$4.3 million, $4.6 million and $4.7 million for the yearyears ended December 31, 2008, $34,000 for the nine month period ended December 31, 20072011, 2010 and $47,000 for the year ended March 31, 2007.2009, respectively. Amortization expense is estimated to be approximately $4.5$8.7 million $4.3, $8.7 million $3.8, $8.4 million $3.7, $8.4 million and $3.7$5.6 million for the years ending December 31, 2009, 2010, 2011, 2012, 2013, 2014, 2015 and 2013,2016, respectively. These future amortization amounts are estimates and reflect the impact of the $52.8 million impairment charge to intangible assets. Actual amortization amounts may be different due to future acquisitions, impairments, changes in amortization periods, or other factors. our investment in ARPSs, restricted cash held in an escrow account, cash deposits related to the deductibles on our workers’ compensation insurance policies, the long-term portion of deferred mobilization costs, the ARPSs Call Option, and loan fees,debt issuance costs, net of amortization. Loan feesDebt issuance costs are being amortized overdescribed in more detail in Note 3, Long-term Debt.five-year termcost method whereby the cost of the related senior secured revolver credit facility describedacquired common stock is recorded as treasury stock. Gains and losses on the subsequent reissuance of treasury stock shares are credited or charged to additional paid in Note 3.Pursuant to Statement of Financial Accounting Standards (“SFAS”) No. 109, “Accounting for Income Taxes,” weUnder SFAS No. 109, we reflect in income theThe effect of a change in tax rates on deferred tax assets and liabilities is reflected in income in the period during which the change occurs. Income income is comprised of net income (loss) income and other comprehensive loss. Other comprehensive loss includesDuring the change inyears ended December 31, 2009 and 2008, $2.7 million of the difference between the par value and fair value of ourthe ARPSs was considered temporary and was recorded as unrealized losses, net of tax, fortaxes of $1.0 million, in accumulated other comprehensive income (loss). For the year ended December 31, 2008. We had no other comprehensive income (loss) for2010, we recognized a $3.3 million other-than-temporary impairment of the year ended December 31, 2008, the nine months ended December 31, 2007 or the year ended March 31, 2007.ARPSs to earnings. The following table sets forth the components of comprehensive (loss) income: Year Ended
December 31,
2008 Nine Months
Ended
December 31,
2007 Year Ended
March 31,
2007 (amounts in thousands) $ (62,745 ) $ 39,645 $ 84,180 (1,245 ) — — $ (63,990 ) $ 39,645 $ 84,180 Earnings Per Common ShareWe compute and present earnings per common shareloss (amounts in accordance with SFAS No. 128, “Earnings per Share.” This standard requires dual presentation of basic and diluted earnings per share on the face of our statement of operations. Year ended December 31, 2011 2010 2009 Net income (loss) $ 11,177 $ (33,261 ) $ (23,215 ) Other comprehensive loss: unrealized losses on securities — — (448 ) Impact of impairment of investments charge — 1,693 — Comprehensive income (loss) $ 11,177 $ (31,568 ) $ (23,663 ) Effective April 1, 2006, we adopted SFAS No. 123 (Revised),Share-Based Payment(“SFAS 123R”),utilizing the modified prospective approach. Prior to the adoption of SFAS 123R, we accountedgrants in accordance withrestricted stock and restricted stock unit awards based on the intrinsic-value-based method prescribed by Accounting Principles Board Opinion No. 25,Accounting for Stock Issued to Employees(“APB 25”),and related interpretations, as permitted by SFAS No. 123,Accounting for Stock-Based Compensation(“SFAS 123”). Accordingly, we recognized nocompensation expense for stock options granted, as all stock options were granted at an exercise price equal to the closing marketfair value of the underlying common stock on the date of grant. Under the modified prospective approach, compensation cost for the fiscal year ended December 31, 2008 includes compensation cost for all stock options granted prior to, but not yet vested as of, April 1, 2006, based on the grant-date fair value estimated in accordanceawards. For our awards with SFAS 123, and compensation cost for all stock options granted subsequent to April 1, 2006, based on the grant-date fair value estimated in accordance with SFAS 123R. We use the graded vesting, methodwe recognize compensation expense on a straight-line basis over the service period for recognizing compensation costs for stock options.Compensation costs of approximately $3.1 million and $0.9 million for stock options were recognized in selling, general and administrative expense and operating costs, respectively, for the year ended December 31, 2008, of which $0.1 million relate to stock options granted to outside directors. Compensation costs of approximately $2.5 million and $0.7 million for stock options were recognized in selling, general and administrative and operating costs, respectively, for the nine months ended December 31, 2007. Approximately $0.4 millioneach separately vesting portion of the compensation costs includedaward as if the award was, in selling, general and administrative expense relate to stock options granted to outside directors that vested immediately upon grant pursuant to our stock option plans. Compensation costs of approximately $2.5 million and $0.5 million for stock options were recognized in selling, general and administrative expense and operating costs, respectively, for the fiscal year ended March 31, 2007. Approximately $0.3 million of the compensation costs included in selling, general and administrative expense relate to stock options granted to outside directors that vested immediately upon grant pursuant to our stock option plans.In accordance with SFAS 123R, we reportedWe report all excess tax benefits resulting from the exercise of stock options as financing cash flows in our consolidated statement of cash flows. There were 170,054 stock options exercised during the year ended December 31, 2008 and 22,500 stock options exercised during the nine months ended December 31, 2007.Restricted stock awards consist of our common stock that vest over a 3 year period. The fair value of restricted stock is based on the closing price of our common stock on the date of the grant. We amortize the fair value of the restricted stock awards to compensation expense using the graded vesting method. For the year ended December 31, 2008, 178,261 restricted stock awards were granted with a weighted-average grant date price of $17.07. Compensation costs of approximately $0.5 million and $0.1 for restricted stock awards were recognized in selling, general and administrative expense and operating costs, respectively, for the year ended December 31, 2008.Related-Party TransactionsOur Chief Executive Officer, President of Drilling Services Division, Senior Vice President of Drilling Services Division—Marketing, and a Vice President of Drilling Services Division—Operations occasionally acquire at fair value a 1% to 5% minority working interest in oil and natural gas wells that we drill for one of our customers. Our President of Drilling Services Division acquired a minority working interest in two wells that we drilled for this customer during the year ended December 31, 2008. These individuals acquired minority working interests in four and three wells that we drilled for this customer during the nine months ended December 31, 2007 and the year ended March 31, 2007, respectively. We recognized drilling services revenues of $2.0 million, $1.6 million and $1.9 million on these wells during the year ended December 31, 2008, the nine months ended December 31, 2007 and the year ended March 31, 2007, respectively.In connection with the acquisitions of the production services businesses from WEDGE Group Incorporated (“WEDGE”) and Competition on March 1, 2008, we have leases for various operating and office facilities with entities that are owned by former WEDGE employees and Competition employees that are now employees of our company. Rent expense for the year ended December 31, 2008 was approximately $479,000 for these related party leases. In addition, we have non-compete agreements with several former WEDGE employees that are nowemployees of our company. These non-compete agreements are recorded as intangible assets with a cost, net of accumulated amortization, of $1.4 million at December 31, 2008. See note 2 for further information regarding the acquisitions.We purchased goods and services during the year ended December 31, 2008 from eight vendors that are owned by employees of our company. For the year ended December 31, 2008, we purchased $330,000 of well servicing equipment from one of these related party vendors and purchases from the remaining seven related party vendors were $232,000.Recently Issued Accounting StandardsIn September 2006, the FASB issued SFAS No. 157,Fair Value Measurements. SFAS No. 157 defines fair value, establishes a framework for measuring fair value and expands disclosure of fair value measurements. SFAS No. 157 applies under other accounting pronouncements that require or permit fair value measurements and, accordingly, does not require any new fair value measurements. SFAS No. 157, as issued, was effective for financial statement issued for fiscal years beginning after November 15, 2007, and interim periods within those fiscal years. However, on February 12, 2008, the FASB issued FSP FAS No. 157-2,Effective Dates of FASB Statement No. 157,which delays the effective date of SFAS No. 157 for fiscal years beginning after November 15, 2008 for all nonfinancial assets and nonfinancial liabilities, except those that are recognized or disclosed at fair value in the financial statements on a recurring basis. The adoption of SFAS No. 157 did not have a material impact on our financial position or results of operations.In February 2007, the FASB issued SFAS No. 159,The Fair Value Option for Financial Assets and Financial Liabilities—Including an amendment of FASB Statement No. 115. This statement permits entities to choose to measure many financial instruments and certain other items at fair value that are not currently required to be measured at fair value and establishes presentation and disclosure requirements designed to facilitate comparisons between entities that choose different measurement attributes for similar types of assets and liabilities. SFAS No. 159 is effective for fiscal years beginning after November 15, 2007. The adoption of SFAS No. 159 did not have a material impact on our financial position or results of operations.In December 2007, the FASB issued SFAS No. 160,Noncontrolling interests in Consolidated Financial Statements—an Amendment of ARB No. 51. This statement establishes accounting and reporting standards for the non-controlling interest in a subsidiary and for the deconsolidation of a subsidiary. SFAS No. 160 clarifies that a non-controlling interest in a subsidiary, which is sometimes referred to as minority interest, is an ownership interest in the consolidated entity that should be reported as a component of equity in the consolidated financial statements. Among other requirements, SFAS No. 160 requires consolidated net income to be reported at amounts that include the amounts attributable to both the parent and the non-controlling interest. It also requires disclosure, on the face of the consolidated income statement, of the amounts of consolidated net income attributable to the parent and to the non-controlling interest. SFAS No.160 is effective for fiscal years beginning on or after December 15, 2008. We do not expect the adoption to have a material impact on our financial position or results of operations.In December 2007, the FASB issued SFAS No. 141R (revised 2007) which replaces SFAS No. 141,Business Combinations(“SFAS No. 141R”). SFAS No. 141R applies to all transactions and other events in which one entity obtains control over one or more other businesses. SFAS No. 141R requires an acquirer, upon initially obtaining control of another entity, to recognize the assets, liabilities and any non-controlling interest in the acquiree at fair value as of the acquisition date. Contingent consideration is required to be recognized and measured at fair value on the date of acquisition rather than at a later date when the amount of that consideration may be determinable beyond a reasonable doubt. This fair value approach replaces the cost-allocation process required under SFAS No. 141 whereby the cost of an acquisition was allocated to the individual assets acquired and liabilities assumed based on their estimated fair value. SFAS No. 141R requires acquirers to expense acquisition-related costs as incurred rather than allocating such costs to the assets acquired and liabilitiesassumed, as was previously the case under SFAS No. 141. Under SFAS No.141R, the requirements of SFAS No. 146,Accounting for Costs Associated with Exit or Disposal Activities, would have to be met in order to accrue for a restructuring plan in purchase accounting. Pre-acquisition contingencies are to be recognized at fair value, unless it is a non-contractual contingency that is not likely to materialize, in which case, nothing should be recognized in purchase accounting and, instead, that contingency would be subject to the recognition criteria of SFAS No. 5,Accounting for Contingencies. SFAS No.141R is expected to have a significant impact on our accounting for business combinations closing on or after January 1, 2009.In March 2008, the FASB issued SFAS No. 161, Disclosures about Derivative Instruments and Hedging Activities—an amendment of FASB Statement No. 133(“SFAS No. 161”). SFAS No. 161 changes the disclosure requirements for derivative instruments and hedging activities. Entities are required to provide enhanced disclosures about (a) how and why an entity uses derivative instruments, (b) how derivative instruments and related hedged items are accounted for under Statement 133 and its related interpretations, and (c) how derivative instruments and related hedged items affect an entity’s financial position, financial performance, and cash flows. The guidance in SFAS No. 161 is effective for financial statements issued for fiscal years and interim periods beginning after November 15, 2008, with early application encouraged. This Statement encourages, but does not require, comparative disclosures for earlier periods at initial adoption. We do not have any derivative instruments and expect the adoption of SFAS No. 161 to have no impact on our financial position or results of operations.In April 2008, the FASB issued FSP SFAS 142-3,Determination of the Useful Life of Intangible Assets. This guidance is intended to improve the consistency between the useful life of a recognized intangible asset under SFAS 142, Goodwill and Other Intangible Assets, and the period of expected cash flows used to measure the fair value of the asset under SFAS 141R when the underlying arrangement includes renewal or extension of terms that would require substantial costs or result in a material modification to the asset upon renewal or extension. Companies estimating the useful life of a recognized intangible asset must now consider their historical experience in renewing or extending similar arrangements or, in the absence of historical experience, must consider assumptions that market participants would use about renewal or extension as adjusted for SFAS No. 142’s entity-specific factors. FSP 142-3 is effective for periods beginning on or after January 1, 2009. We do not expect the adoption to have a material impact on our financial position or results of operations.In May 2008, the FASB issued SFAS No. 162,The Hierarchy of Generally Accepted Accounting Principles (“SFAS No. 162”). SFAS No. 162 identifies the sources of accounting principles and the framework for selecting the principles used in the preparation of financial statements that are presented in conformity with generally accepted accounting principles. SFAS No. 162 is effective 60 days following approval by the Securities and Exchange Commission of the Public Company Accounting Oversight Board’s amendments to AU Section 411,The Meaning of Present Fairly in Conformity with Generally Accepted Accounting Principles. The adoption of SFAS No. 162 did not have a material impact on our financial position or results of operations.In June 2008, the FASB issued FSP No. EITF 03-6-1,Determining Whether Instruments Granted in Share-Based Payment Transactions are Participating Securities. This FSP provides that unvested share-based payment awards that contain nonforfeitable rights to dividends are participating securities and shall be included in the computation of earnings per share pursuant to the two class method. This FSP is effective for financial statements issued for fiscal years beginning after December 15, 2008 and interim periods within those years. We do not expect the adoption of this FSP to have a material impact on our financial position or results of operations.2.2. Acquisitions March 1, 2008,December 31, 2011, we acquired the production services business from WEDGEof Go-Coil, LLC, a Louisiana limited liability company ("Go-Coil") which provided well services, wireline services and fishing and rentalprovides coiled tubing services with a fleet of 62 workover rigs, 45 wirelineseven onshore units and approximately $13 million of fishing and rental equipmentthree offshore units through its facilities in Louisiana, Texas, Kansas, North Dakota, Colorado, UtahOklahoma and Oklahoma.Pennsylvania. The aggregate purchase price for the acquisition was approximately $314.7$110.4 million, which consisted of assets acquired of $340.8$114.9 million and liabilities assumed of $26.1 million. The aggregate purchase price includes $3.4$4.5 million of costs incurred to acquire the production services business from WEDGE.. We financedfunded the acquisition with approximately $3.2 million of cash on hand and $311.5 millionthat was primarily generated from the proceeds of debt incurred under our senior secured revolving credit facilitythe Senior Notes issued in November 2011, as described in Note 3. and related acquisition costs to the estimated fair value of the assets acquired and liabilities assumed as of the date of acquisition (amounts in thousands): $ 1,168 22,102 138,493 66,118 112,869 $ 340,750 $ 10,655 1,462 13,949 $ 26,066 $ 314,684 Cash acquired $ 313 Other current assets 9,068 Property and equipment 30,103 Intangibles and other assets 33,695 Goodwill 41,683 Total assets acquired $ 114,862 Current liabilities $ 4,337 Long-term debt 131 Total liabilities assumed $ 4,468 Net assets acquired $ 110,394 WEDGEGo-Coil as though it was effective as of the beginning of each of the yearsyear ended December 31, 2008 and 2007.2011. Pro forma adjustments primarily relate to additional depreciation, amortization, interest and interesttax expenses, as well as the removal of approximately $14.1 million of nonrecurring costs, primarily related to discontinued compensation arrangements and acquisition related costs. The pro forma information reflects our company’s historical data and Go-Coil's historical data from the acquired production services business from WEDGE for the periods indicated. The pro forma data may not be indicative of the results we would have achieved had we completed the acquisition on January 1, 2007 or 2008,2011, or what we may achieve in the future and should be read in conjunction with the accompanying historical financial statements. Pro Forma Years Ended
December 31,
2008 Nine Months
Ended
December 31,
2007 (in thousands) $ 634,535 $ 401,461 $ (62,514 ) $ 44,504 $ (1.26 ) $ 0.90 $ (1.26 ) $ 0.89 On March 1, 2008, immediately following the Pro Forma Year ended December 31, 2011 (in thousands) Total revenues $ 762,978 Net earnings $ 8,412 Earnings per common share: Basic $ 0.15 Diluted $ 0.14 WEDGE, we acquired the production services business from Competition which provided wireline services with a fleet of 6 wireline units through its facilities in Montana. The aggregate purchase price for the Competition acquisitionGo-Coil was approximately $30.0 million, which consisted of assets acquired of $30.1 million and liabilitiesassumed of $0.1 million. The aggregate purchase price includes $0.4 million of costs incurred to acquire the production services business from Competition. We financed the acquisition with $26.7 million cash on hand and a note payable due to the prior owner for $3.3 million. Goodwill of $5.3 million and intangible assets and other assets of $18.0 million were recorded in connection with the acquisition.On August 29, 2008, we acquired the wireline services business from Paltec, Inc. The aggregate purchase price was $7.8 million which we financed with $6.5 million in cash and a sellers note of $1.3 million. Intangible and other assets of $4.3 million and goodwill of $0.1 million were recorded in connection with the acquisition.On October 1, 2008, we acquired the well services business from Pettus Well Service. The aggregated purchase price was $3.0 million which we financed with $2.8 million in cash and a sellers note of $0.2 million. Intangible and other assets of $1.2 million and goodwill of $0.1 million were recorded in connection with the acquisition.The acquisitions of the production services businesses from WEDGE, Competition, Paltec and Pettus were accounted for as acquisitionsan acquisition of businesses.a business in accordance with ASC Topic 805, allocationsallocation for these production services businessesthe Go-Coil acquisition is preliminary at this time and may change once we receive finalized information regarding the fair value estimates of the assets acquired and liabilities assumed in the acquisition. In addition, we have beennot finalized asthe working capital adjustment which will be payable to the former owners of December 31, 2008.Go-Coil and is estimated to be approximately $1.0 million. Goodwill was recognized as part of the WEDGE, Competition, Paltec and Pettus acquisitionsGo-Coil acquisition, since the purchase price exceeded the estimated fair value of the assets acquired and liabilities assumed. We believe that the goodwill is relatedrelates to the acquired workforces,workforce, future synergies between our existing Drilling Services Division and our new Production Services Divisionservice offerings and the ability to expand our service offerings. Theseoccurred between March 1, 2008 and October 1, 2008, whenin 2011 of other production service revenues, margins and cash flows and our market capitalization were at historically high levels. As described in note 1, our goodwill impairment analysis performed at December 31, 2008 led us to conclude that there would be no remaining implied value attributable to our goodwill and accordingly, we recorded a non-cash charge of $118.6 millionservices businesses for a full impairmenttotal of goodwill relating to$6.5 million in cash. The identifiable assets recorded in connection with these acquisitions. We also performed an impairment analysis which resulted in an impairment chargeacquisitions included fixed assets of $52.8$5.2 million, representing six wireline units and reduction in thetwo well service rigs, and intangible asset carrying valueassets of$1.3 million representing customer relationships relating toand non-competition agreements. We did not recognize any goodwill in conjunction with these acquisitions.acquisitions and no contingent assets or liabilities were assumed. These impairment charges were primarily related to significant adverse changesfour acquisitions have been accounted for as acquisitions of businesses in the economic and business climate that occurred during the fourth quarter of the year ended December 31, 2008.accordance with ASC Topic 805, Business Combinations.3.3. Long-term Debt Subordinated Debt and Note Payable as of December 31, 2008 consists of the following (amounts in thousands): $ 272,500 6,534 379 279,413 (17,298 ) $ 262,115 December 31, 2011 December 31, 2010 Senior secured revolving credit facility $ — $ 37,750 Senior Notes 417,747 240,080 Subordinated notes payable and other 1,853 3,108 419,600 280,938 Less current portion (872 ) (1,408 ) $ 418,728 $ 279,530 On February 29, 2008, we entered into(collectively the “Lenders”). The credit agreementwhich provides for a senior secured revolving credit facility, with sub-limits for letters of credit and a swing-line facilityloans, of up to an aggregate principal amount of $400$250 million, all of which maturematures on February 28, 2013.June 30, 2016 (the “Revolving Credit Facility”). The senior securedRevolving Credit Facility contains customary mandatory prepayments from the proceeds of certain asset dispositions or debt issuances, which are applied to reduce outstanding revolving and swing-line loans and letter of credit facility andexposure, but in no event will reduce the obligations thereunder are secured by substantially all our domestic assets and are guaranteed by certain of our domestic subsidiaries. borrowing availability under the Revolving Credit Facility to less than $250 million.senior secured revolving credit facilityRevolving Credit Facility bear interest, at our option, at the bank primeLIBOR rate or at the LIBORbank prime rate, plus an applicable per annum margin in each case. The applicable per annum margin is determined based upon our leverage ratio in accordance with a pricing grid in the credit agreement. The per annum margin for LIBOR rate borrowingsthat ranges from 1.50%2.50% to 2.50%3.25% and for bank primerate borrowings ranges from 0.50%1.50%. Based on the terms in the credit agreement, the2.25%, respectively. The LIBOR margin and bank prime rate margin in effect until delivery of our financial statementsat February 10, 2012 are 2.50% and the compliance certificate for December 31, 2008 are 2.25% and 1.25%1.50%, respectively. AThe Revolving Credit Facility requires a commitment fee is due quarterly based on the average daily unused amount of the commitments of the Lenders under the senior secured revolving credit facility. In addition,lenders, a fronting fee is due for each letter of credit issued, and a quarterly letter of credit fee is due based on the average undrawn amount of letters of credit outstanding during such period. We may repayseniorRevolving Credit Facility are secured revolving credit facility balanceby substantially all of our domestic assets (including equity interests in Pioneer Global Holdings, Inc. and 65% of the outstanding equity interests of any first-tier foreign subsidiaries owned by Pioneer Global Holdings, Inc., but excluding any equity interest in, whole or in part atand any time without premium or penalty. The senior secured revolving credit facility replaced the $20.0 million credit facility we previously had with Frost National Bank.assets of, Pioneer Services Holdings, LLC) and are guaranteed by certain of our domestic subsidiaries, including Pioneer Global Holdings, Inc. Borrowings under the senior secured revolving credit facility were used to fund the WEDGE acquisition andRevolving Credit Facility are available for future acquisitions, working capital and other general corporate purposes.At 23, 2009,10, 2012, we had $257.5a zero balance outstanding and $9.0 million outstanding under the revolving portion of the senior secured revolving credit facility and $9.3 million in committed letters of credit. Under the terms of the credit, agreement, committed letters of credit are applied against our borrowing capacity under the senior secured revolving credit facility. Thewhich resulted in borrowing availability of $241.0 millionunder the senior secured revolving credit facility was $133.2 million at February 23, 2009.our Revolving Credit Facility. There are no limitations on our ability to access the fullthis borrowing availability under the senior secured revolving credit facilitycapacity other than maintaining compliance with the covenants inunder the credit agreement. Principal payments of $15.0 million made after Revolving Credit Facility. At December 31, 2008 are classified in the current portion of long-term debt as of December 31, 2008. The outstanding balance under our senior secured credit facility is not due until maturity on February 28, 2013. However, when cash and working capital is sufficient, we may make principal payments to reduce the outstanding debt balance prior to maturity.Effective June 11, 2008, we entered into a Waiver Agreement with the Lenders to waive the requirement to provide certain financial statements in conjunction with our compliance certificate within the time period required by the credit agreement. The Waiver Agreement required us to provide the financial statements and our compliance certificate on or before August 13, 2008. Until we provided these financial statements and our compliance certificate, the aggregate principal amount outstanding under the credit agreement could not exceed $350 million at any time (provided, however, that the commitment fee would continue to be calculated based on the total commitment of $400 million)2011 and the per annum margin applicable to all amounts outstanding under the credit agreement would increase from the current rate of 2.25% for LIBOR rate borrowings and 1.25% for bank prime rate borrowings to 2.50% for LIBOR rate borrowings and 1.50% for bank prime rate borrowings. The required financial statements and our compliance certificate were delivered concurrently with the filing of the Quarterly Report on Form 10-Q for the quarterly period ended March 31, 2008 which occurred on August 5, 2008.At December 31, 2008, we were in compliance with the restrictiveour financial covenants. Our total consolidated leverage ratio was the credit agreement whichour Revolving Credit Facility include the following:We must have ano greaterthat cannot exceed 4.00 to 1.00;3.002.50 to 1.00 for any fiscal quarter through March 31, 2009, 2.75 to 1.00 for any fiscal quarter ending June 30, 2009 through March 31, 2010,1.00; and 2.50 to 1.00 for any fiscal quarter ending June 30, 2010 through maturity in February 2013;maximumsenior consolidated leverage ratio is greater than 2.252.00 to 1.00 at the end of any fiscal quarter, then we must have aour minimum asset coverage ratio nocannot be less than 1.251.00 to 1.00;1.00.We must have a minimum interest coverage (c) the senior consolidated leverage ratio noas of the last day of the most recent reported fiscal quarter is less than 3.002.00 to 1.00.2008,2011, our senior consolidated leverage ratio was 1.28not greater than 2.00 to 1.00 and our interest coverage ratio was 17.15therefore, we were not subject to 1.00. the capital expenditure threshold restrictions listed above.credit agreementRevolving Credit Facility has additional restrictive covenants that, among other things, limit the incurrence of additional debt, to a maximum of $15 million (other than debt under the senior secured revolving credit facility), investments, liens, dividends, acquisitions, redemptions of capital stock, prepayments of indebtedness, asset dispositions, mergers and consolidations, transactions with affiliates, capital expenditures, hedging contracts, sale leasebacks and other matters customarily restricted in such agreements. In addition, the credit agreementRevolving Credit Facility contains customary events of default, including without limitation, payment defaults, breaches Non-compliancerestrictive covenants ora coupon interest rate of 9.875% that are due in 2018 (the “ 2010 Senior Notes”). The 2010 Senior Notes were sold with an original issue discount of $10.6 million that was based on 95.75% of their face value, which will result in an effective yield to maturity of approximately 10.677%. On March 11, 2010, we received $234.8 million of net proceeds from the issuance of the 2010 Senior Notes after deductions were made for the $10.6 million of original issue discount and $4.6 million for underwriters’ fees and other eventsdebt offering costs. The net proceeds were used to repay a portion of defaultthe borrowings outstanding under our Revolving Credit Facility.credit agreement could triggerholders of our 2010 Senior Notes, we filed an early repayment requirementexchange offer registration statement on Form S-4 with the Securities and terminateExchange Commission that became effective on September 2, 2010. This exchange offer registration statement enabled the holders of our 2010 Senior Notes to exchange their senior notes for publicly registered notes with substantially identical terms. References to the “2010 Senior Notes” herein include the senior secured revolving credit facility.In addition to amounts outstanding under the senior secured revolving credit facility, long-term debt includestwo subordinated notes payable to certain employees that are former shareholders of the production services businesses that were acquired by WEDGE prior to our acquisition of WEDGE on March 1, 2008, a subordinated note payable to an employee that is a former shareholder of Competition, two subordinated notes payable to certain employees that are former shareholders of Paltec, Inc. and Pettus Well Service.which we have acquired. These subordinated notes payable have interest rates ranging from 5.44% to of 6% and 14%, require quarterlyannual payments of principal and interest and have final maturity dates ranging from January 2009 to in March 2013. The aggregate outstanding balance and April2013. We have other debt of these subordinated notes payable was $6.5$0.2 million as of December 31, 2008.Other2011 which represents a capital lease obligation for equipment, with monthly payments due through November 2016.represents financing arrangements for computer software with an outstanding balancecosts related to the issuance of $0.4our long-term debt were approximately $11.6 million at and $6.7 million as of December 31, 2008.2011 and 2010, respectively. We recognized approximately $1.8 million, $1.9 million and $1.5 million of associated amortization during 2011, 2010 and 2009, respectively. In June 2011, we recognized additional amortization expense related to the write-off of $0.6 million of debt issuance costs representing the portion of unamortized debt issuance costs associated with certain syndicate lenders who are no longer participating in the Revolving Credit Facility as amended on June 30, 2011.4.4. Leases costpayment escalating from $26,809$29,839 per month in January 2012to $29,316$42,635 per month in December 2020 pursuant to a lease extendingwhich extends through December 2013.2020, but which is cancelable as early as December 2016 with applicable penalties. We recognize rent expense on a straight line basis for our corporate office lease. In addition, we lease real estate at 3072 other locations under non-cancelable operating leases at costswith payments ranging from $175$250 per month to $8,917$30,966 per month, pursuant to leases expiring through April 2013.August 2022. These real estate locations are used primarily for division offices and storage and maintenance yards. We also lease vehicles, office and other equipment under non-cancelable operating leases expiring through May 2012.January 2017.20082011 were as follows (amounts in thousands): $ 1,566 1,279 949 607 402 — $ 4,803 Year ended December 31, 2012 $ 4,607 2013 3,475 2014 2,499 2015 1,839 2016 1,181 Thereafter 3,806 $ 17,407 yearyears ended December 31, 20082011, 2010 and 2009 was $1.4$3.6 million, $2.9 million and $0.3$2.1 million for the nine months ended December 31, 2007 and the year ended March 31, 2007., respectively.5.5. Income Taxes income before income taxes consist of the following (amounts in thousands): Year Ended
December 31,
2008 Nine Months Ended
December 31,
2007 Year Ended
March 31,
2007 $ (62,388 ) $ 55,752 $ 130,789 5,700 2,022 — $ (56,688 ) $ 57,774 $ 130,789 Year ended December 31, 2011 2010 2009 Domestic $ 23,396 $ (48,650 ) $ (46,221 ) Foreign (2,563 ) 1,092 6,049 Income (loss) before income tax $ 20,833 $ (47,558 ) $ (40,172 ) Year Ended
December 31,
2008 Nine Months Ended
December 31,
2007 Year Ended
March 31,
2007 $ 3,777 $ 10,587 $ 34,252 1,181 1,593 1,704 348 — — 5,306 12,180 35,956 476 6,533 9,195 (211 ) (100 ) 1,458 486 (484 ) — 751 5,949 10,653 $ 6,057 $ 18,129 $ 46,609 Year ended December 31, 2011 2010 2009 Current tax: Federal $ 716 $ (2,547 ) $ (46,073 ) State 1,090 32 (2,969 ) Foreign 1,301 931 1,087 3,107 (1,584 ) (47,955 ) Deferred taxes: Federal 7,199 (13,046 ) 31,740 State 102 1,366 3,390 Foreign (752 ) (1,033 ) (4,132 ) 6,549 (12,713 ) 30,998 Income tax expense (benefit) $ 9,656 $ (14,297 ) $ (16,957 ) income before income taxes consist of the following (amounts in thousands): Year Ended
December 31,
2008 Nine Months Ended
December 31,
2007 Year Ended
March 31,
2007 $ (19,840 ) $ 20,221 $ 45,776 556 971 2,417 508 538 547 26,752 — — (1,377 ) (1,191 ) — (457 ) (729 ) (1,388 ) (219 ) (475 ) (422 ) 247 61 48 — (717 ) (372 ) (113 ) (550 ) 3 $ 6,057 $ 18,129 $ 46,609 Year ended December 31, 2011 2010 2009 Expected tax expense (benefit) $ 7,291 $ (16,645 ) $ (14,060 ) State income taxes 775 909 274 Incentive stock options 41 266 243 Net tax benefits and nondeductible expenses in foreign jurisdictions 1,391 (207 ) (5,162 ) Domestic production activities deduction — — 1,130 Nontaxable interest income (1 ) (23 ) (33 ) Nondeductible expenses for tax purposes 567 349 218 Valuation allowance — 1,248 — Other, net (408 ) (194 ) 433 Income tax expense (benefit) $ 9,656 $ (14,297 ) $ (16,957 ) Year Ended
December 31,
2008 Nine Months Ended
December 31,
2007 Year Ended
March 31,
2007 $ 6,057 $ 18,129 $ 46,609 (963 ) (54 ) (24 ) $ 5,094 $ 18,075 $ 46,585 Year ended December 31, 2011 2010 2009 Results of operations $ 9,656 $ (14,297 ) $ (16,957 ) Stockholders' equity 255 1,332 (26 ) Income tax expense (benefit) $ 9,911 $ (12,965 ) $ (16,983 ) December 31,
2008 December 31,
2007 $ 719 $ — 23,207 — 4,963 3,292 600 — 2,222 1,095 1,730 498 1,784 613 4,705 3,637 39,930 9,135 (5,382 ) (3,997 ) 34,548 5,138 89,193 47,731 89,193 47,731 $ 54,645 $ 42,593 December 31,
2011 December 31,
2010Deferred tax assets: Auction rate preferred securities $ 1,239 $ 1,248 Intangibles 20,829 21,594 Employee benefits and insurance claims accruals 9,126 3,634 Accounts receivable reserve 369 42 Employee stock based compensation 6,914 6,099 Accrued expenses not deductible for tax purposes 1,149 — Accrued revenue not income for book purposes 2,212 3,393 Federal and state net operating loss and AMT credit carryforward 39,310 21,568 Foreign net operating loss carryforward 6,782 5,713 87,930 63,291 Valuation allowance (1,239 ) (1,248 ) Total deferred tax assets 86,691 62,043 Deferred tax liabilities: Accrued expenses not deductible for tax purposes — 105 Property and equipment 165,268 132,231 Total deferred tax liabilities 165,268 132,336 Net deferred tax liabilities $ 78,577 $ 70,293 netwith the exception of the existing valuation allowance at recorded to fully offset our deferred tax asset related to the unrealized loss on the impairment of our ARPS securities.2008.2008,2011, we had foreign$39.3 million and $6.8 million of deferred tax assets consisting ofrelated to domestic and foreign net operating losses, and other tax benefitsrespectively, that are available to reduce future taxable income in a foreign jurisdiction.income. In assessing the realizability of our foreign deferred tax assets, we only recognize a tax benefit to the extent of taxable income that we expect to earn in the foreign jurisdiction in future periods. DueWe estimate that our operations will result in taxable income in excess of our net operating losses and we expect to recent declines in oil and natural gas prices andapply the downturn in our industry, we anticipate reductions in drilling rig utilization and revenue rates in 2009. Consequently,net operating losses against taxable income that we have a valuation allowanceestimated in future periods. The domestic net operating losses can be used to offset future domestic taxable income through 2031, while the majority of $5.4 million that fully offsets our foreign deferred tax assets. Thethe foreign net operating loss has an indefinite carryforward period.2008,2011, the cumulative undistributed earningsearnings/loss of the subsidiary was approximately $1.9 million.a $16.7 million loss. If those earnings were not considered indefinitely reinvested, deferred income taxes would have been recorded after consideration of foreign tax credits. It is not practicable to estimate the amount of additional tax that might be payable on those earnings, if distributed.FIN No. 48ASC Topic 740 and no unrecognized tax benefit activity during the year ended December 31, 2008.2008,2011, no interest or penalties have been or are required to be accrued. Our open tax years for our federal income tax returns in the United States are for the years ended March 31, 2007 and December 31, 2007.2006 to 2010. Our open tax years for our income tax returns in Colombia are for the years ended December 31, 2008 to 2010.6.6. Fair Value of Financial Instruments amountsvalue of our cash, and cash equivalents, trade receivables and trade payables approximateare considered to be representative of their respective fair values.values due to the short-term nature of these instruments. December 31, 2011 December 31, 2010 Total debt $ 419,600 $ 443,309 $ 280,938 $ 308,630 7.(Loss) earnings7. Earnings (loss) Per Common Share earnings per share and diluted income (loss) earnings per share comparisons as required by SFAS No. 128computations (amounts in thousands, except per share data): Year Ended
December 31,
2008 Nine Months Ended
December 31,
2007 Year Ended
March 31,
2007 $ (62,745 ) $ 39,645 $ 84,180 49,789 49,645 49,603 $ (1.26 ) $ 0.80 $ 1.70 $ (62,745 ) $ 39,645 $ 84,180 — — — $ (62,745 ) $ 39,645 $ 84,180 49,789 49,645 49,603 — 556 529 49,789 50,201 50,132 $ (1.26 ) $ 0.79 $ 1.68 All outstanding Year ended December 31, 2011 2010 2009 Basic Net income (loss) $ 11,177 $ (33,261 ) $ (23,215 ) Weighted-average shares 57,390 53,797 50,313 Income (loss) per share $ 0.19 $ (0.62 ) $ (0.46 ) Diluted Net income (loss) $ 11,177 $ (33,261 ) $ (23,215 ) Effect of dilutive securities — — — Net income (loss) available to common shareholders after assumed conversion $ 11,177 $ (33,261 ) $ (23,215 ) Weighted average shares: Outstanding 57,390 53,797 50,313 Diluted effect of stock options, restricted stock, and restricted stock unit awards 1,389 — — 58,779 53,797 50,313 Income (loss) per share $ 0.19 $ (0.62 ) $ (0.46 ) calculationcalculations for the yearyears ended December 31, 20082010 and 2009, respectively, because the effect of their inclusion would be antidilutive, or would decrease the reported loss per share.8.8. Equity Transactions and Stock Based Compensation Plans Employees exercised stock options for the purchase170,054 shares ofour common stock at prices ranging from $3.67 to $10.31$6.75 per share, during the year December 31, 2008. Employees exercised stock options for the purchaseless underwriters’ commissions, pursuant to a public offering under our $300 million shelf registration statement filed in July 2009.22,500 shares ofour common stock at prices ranging from $4.52 to $4.77$14.50 per share, duringless underwriters’ commissions and other offering costs, pursuant to a public offering under our $300 million shelf registration statement. The remaining availability under the nine months ended December 31, 2007. Employees exercised stock options$300 million shelf registration statement for the purchase of 36,500 shares of common stock at prices ranging from $3.20 to $4.77 per share during the year ended March 31, 2007.Employees and directors were awarded 178,261 shares of restricted stock that vest over a three year period with a weighted-average grant date price of $17.07 during the year ended December 31, 2008.equity or debt offerings is $174.2 million. 9.Stock Option and Restricted Stock PlansEmployeeTotal shares available for future stock option grants, restricted stock grants, and restricted stock unit grants to employees and directors under existing plans were three- to five-year periods, and generally expire 10 years after the date of grant. Stock option awards granted to outside directors vest immediatelya three-year period and expire fiveten years after the date of grant. Our stock-based compensation plans provide that all stock optionsoption awards must have an exercise price not less than the fair market value of our common stock on the date of grant. Restricted stock awards consistWe issue shares of our common stock that vest over a three year period. Total shares available for futurewhen vested stock option grants and restricted stock grants to employees and directors under existing plans were 2,035,073 at December 31, 2008. Of the total shares available, no more than 822,489 shares may be granted in the form of restricted stock. stock option grant on the date of grant using a Black-Scholes options-pricing model. The following table summarizes the assumptions used in the Black-Scholes option-pricing model based on a weighted-average calculation for the yearyears ended December 31, 2008, for the nine months ended December 31, 20072011, 2010 and for the year ended March 31, 2007: Year Ended
December 31,
2008 Nine Months
Ended
December 31,
2007 Year Ended
March 31,
2007 44 % 46 % 49 % 2.7 % 4.7 % 5.0 % 3.72 4.00 2.86 $ 5.66 $ 5.84 $ 5.36 Year ended December 31, 2011 2010 2009 Expected volatility 65 % 62 % 58 % Risk-free interest rates 1.5 % 2.6 % 2.1 % Expected life in years 4.33 5.61 5.48 Grant-date fair value $4.69 $4.91 $2.09 At December 31, 2008, there was $5.7 million of unrecognized compensation cost relating to stock options which are expected to be recognized over a weighted-average period of 2.06 years.March 31, 2007 through December 31, 2008: Number of
Shares Weighted-Average
Exercise Price Weighted-Average
Remaining
Contract Life 1,946,500 $ 9.29 931,500 14.06 (22,500 ) 4.74 — — (55,001 ) 11.73 2,800,499 $ 10.87 1,460,764 $ 15.89 (170,054 ) 4.61 — — (321,514 ) 13.74 3,769,695 $ 12.85 7.70 1,741,932 $ 10.30 6.20 At 20092008,2011: Outstanding stock options as of December 31, 2009 5,055,613 $10.17 Granted 787,200 8.64 Forfeited (90,634) 12.84 Exercised (63,900) 3.73 Outstanding stock options as of December 31, 2010 5,688,279 $9.98 Granted 602,298 9.05 Forfeited (210,184) 12.41 Exercised (517,045) 5.58 Outstanding stock options as of December 31, 2011 5,563,348 $10.20 6.3 Stock options exercisable as of December 31, 2011 4,032,111 $11.27 5.6 Year ended December 31, 2011 2010 2009 General and administrative expense $ 3,483 $ 4,047 $ 4,290 Operating costs 237 500 971 $ 3,720 $ 4,547 $ 5,261 $0.9$10.1 million and the aggregate intrinsic value of stock options exercisable was $0.9 million.$6.5 million. Intrinsic value is the difference between the exercise price of a stock option and the closing market price of our common stock, which was $5.57$9.68 on December 31, 2008.March 31, 2007 through December 31, 2008: Number of
Shares Weighted-Average
Grant-Date
Fair Value 880,666 $ 5.48 931,500 5.84 (253,324 ) 5.49 (55,001 ) 5.89 1,503,841 $ 5.64 1,460,764 5.67 (627,993 ) 5.63 (308,849 ) 5.17 2,027,763 $ 5.74 Nonvested stock options as of December 31, 2009 2,537,474 $3.65 Granted 787,200 4.91 Vested (1,115,991) 4.19 Forfeited (24,000) 3.34 Nonvested stock options as of December 31, 2010 2,184,683 $3.83 Granted 602,298 4.69 Vested (1,154,360) 4.03 Forfeited (101,384) 4.34 Nonvested stock options as of December 31, 2011 1,531,237 $3.98 20072009 through December 31, 2008: Number
of Shares Weighted-Average
Grant-Date Fair
Value per Share — $ — 178,261 17.07 (3,645 ) 17.07 (750 ) 17.07 173,866 $ 17.07 Nonvested restricted stock as of December 31, 2009 427,358 $7.48 Granted 66,224 6.04 Vested (160,223) 8.52 Forfeited (3,700) 9.20 Nonvested restricted stock as of December 31, 2010 329,659 $6.66 Granted 32,360 12.36 Converted from restricted stock units 166,918 8.86 Vested (233,061) 8.25 Forfeited (14,040) 9.16 Nonvested restricted stock as of December 31, 2011 281,836 $7.18 178,261following table summarizes the compensation expense recognized for restricted stock awards granted during the yearyears ended December 31, 2008 were the first restricted stock awards granted under our stock based award plans. 2011, 2010 and 2009 (amounts in thousands): Year ended December 31, 2011 2010 2009 General and administrative expense $ 941 $ 1,119 $ 1,641 Operating costs 89 145 314 $ 1,030 $ 1,264 $ 1,955 2008,2011, there was $2.2$0.6 million of unrecognized compensation cost relating to restricted stock awards which are expected to be recognized over a weighted-average period of 2.650.9 years. Time-Based Award Performance-Based Award Nonvested restricted stock units as of December 31, 2009 — — — — Granted 72,120 8.86 194,680 8.86 Forfeited (5,040) 8.86 (2,160) 8.86 Nonvested restricted stock units as of December 31, 2010 67,080 $8.86 192,520 $8.86 Granted 251,023 11.19 146,479 10.23 Vested (22,656) 8.92 — — Converted to restricted stock — — (192,520) 8.86 Forfeited (22,496) 11.74 (7,390) 10.23 Nonvested restricted stock units as of December 31, 2011 272,951 $10.76 139,089 $10.23 Year ended December 31, 2011 2010 General and administrative expense $ 1,637 $ 748 Operating costs 318 116 $ 1,955 $ 864 10.9. Employee Benefit Plans and Insurance yearyears ended December 31, 2008, the nine months ended December 31, 20072011, 2010 and the year ended March 31, 20072009 were $1.8$2.6 million $0.8, $0.9 million and $1.0$0.7 million, respectively.hospitalization and dentalhospitalization coverage for employees and their dependents, which is partially funded by employee payroll deductions. We have provided for both reported and incurred but not reported medical costs in the accompanying consolidated balance sheets. We have a maximum liability of $125,000$150,000 per employee/dependent per year except for individuals employed by our Production Services Division where we had no deductible during the period ended December 31, 2008.year. Amounts in excess of the stated maximum are covered under a separate policy provided by an insurance company. Accrued expenses—payrollInsurance premiums and employee related costsdeductibles accruals at December 31, 20082011 and December 31, 20072010 include $1.1$1.9 million and $0.8$1.5 million, respectively, for our estimate of incurred but unpaid costs related to the self-insurance portion of our health insurance.$500,000$500,000 per incident for all workers’ compensation claims submitted by employees for on-the-job injuries, except in North Dakota where there is no deductible. Our deductible under workers’ compensation insurance increased from $250,000 in October 2007.injuries. We have deductiblesa deductible of $250,000 and $100,000$250,000 per occurrence under both our general liability insurance and auto liability insurance, respectively.insurance. We accrue our workers’ compensation claim cost estimates based on historical claims development data and we accrue the cost of administrative services associated with claims processing. Accrued expenses—insuranceInsurance premiums and deductibles accruals at December 31, 20082011 and December 31, 20072010 include $9.6$6.5 million and $8.6$6.6 million, respectively, for our estimate of costs relative to the self-insured portion of our workers’ compensation, general liability and auto liability insurance. Based upon our past experience, management believes that we have adequately provided for potential losses. However, future multiple occurrences of serious injuries to employees could have a material adverse effect on our financial position and results of operations.11.10. Segment Information At December 31, 2008, we had Prior to our acquisitions of the production services businesses from WEDGE and Competition onMarch 1, 2008, all our operations related to the Division and we reported these operations in a single operating segment. The acquisitions of the production services businesses from WEDGE and Competition resulted in the formation of our Production Services Division. See Note 2.Drilling Services Division—Our Drilling Services Division provides contract land drilling services with its fleet of 7064 drilling rigs inthat are assigned to the following locations: Rig Count 1715 22518 North TexasDakota 9 64North Dakota6Oklahoma 5 58broad range of well services to oil and gas drillingexploration and producingproduction companies, including workoverwell services, wireline, services,coiled tubing, and fishing and rental services. Our production services operations are managed regionally and arethrough locations concentrated in the major United States onshore oil and gas producing regions in the Gulf Coast, Mid-Continent, and Rocky Mountain and Appalachian states. We currently have a premium fleet of 74 workover91 well service rigs consisting of sixty-nineeighty-one 550 horseposewerhorsepower rigs, fournine 600 horsepower rigs and one 400 horsepower rig. We currently provide wireline and coiled tubing services with a fleet of 59109 and ten wireline and coiled tubing units, respectively, and we provide rental services with approximately $15$15.1 million of fishing and rental tools.yearyears ended December 31, 20082011, 2010 and 2009 (amounts in thousands): As of and for the Year Ended December 31, 2008 Drilling
Services
Division Production
Services
Division Corporate Total $ 567,956 $ 232,063 $ 24,460 $ 824,479 $ 456,890 $ 153,994 $ — $ 610,884 269,846 80,097 — 349,943 $ 187,044 $ 73,897 $ — $ 260,941 $ 66,270 $ 21,441 $ 434 $ 88,145 $ 107,344 $ 38,921 $ 1,831 $ 148,096 As of and for the year ended December 31, 2011 Corporate Total Identifiable assets $ 667,588 $ 398,128 $ 107,038 $ 1,172,754 Revenues $ 433,902 $ 282,039 $ — $ 715,941 Operating costs 292,559 164,365 — 456,924 Segment margin $ 141,343 $ 117,674 $ — $ 259,017 Depreciation and amortization $ 99,302 $ 32,683 $ 847 $ 132,832 Capital expenditures $ 168,120 $ 68,908 $ 759 $ 237,787 As of and for the year ended December 31, 2010 Corporate Total Identifiable assets $ 542,242 $ 261,777 $ 37,324 $ 841,343 Revenues $ 312,196 $ 175,014 $ — $ 487,210 Operating costs 227,136 105,295 — 332,431 Segment margin $ 85,060 $ 69,719 $ — $ 154,779 Depreciation and amortization $ 92,800 $ 26,740 $ 1,271 $ 120,811 Capital expenditures $ 109,261 $ 25,411 $ 479 $ 135,151 As of and for the year ended December 31, 2009 Corporate Total Identifiable assets $ 536,858 $ 234,920 $ 53,177 $ 824,955 Revenues $ 219,751 $ 105,786 $ — $ 325,537 Operating costs 147,343 68,012 — 215,355 Segment margin $ 72,408 $ 37,774 $ — $ 110,182 Depreciation and amortization $ 81,078 $ 23,893 $ 1,215 $ 106,186 Capital expenditures $ 94,887 $ 15,162 $ 404 $ 110,453 condensed consolidated statements of operations for the yearyears ended December 31, 20082011, 2010 and 2009 (amounts in thousands): Year Ended
December 31, 2008 $ 260,941 (88,145 ) (44,834 ) (423 ) (118,646 ) (52,847 ) $ (43,954 ) Year ended December 31, 2011 2010 2009 Segment margin $ 259,017 $ 154,779 $ 110,182 Depreciation and amortization (132,832 ) (120,811 ) (106,186 ) General and administrative (67,318 ) (52,047 ) (37,478 ) Bad debt (expense) recovery (925 ) (493 ) 1,642 Impairment of equipment (484 ) — — Income (loss) from operations $ 57,458 $ (18,572 ) $ (31,840 ) yearyears ended December 31, 20082011, 2010 and 2009 which is included in our Drilling Services Division (amounts in thousands): As of and for the
Year Ended
December 31, 2008 $ 107,927 $ 51,414 As of and for the years ended December 31, 2011 2010 2009 Identifiable assets $ 151,448 $ 157,509 $ 120,319 Revenues $ 109,539 $ 86,432 $ 56,617 12.11. Commitments and Contingencies $36.2$54.9 million relating to our performance under these bonds.In addition, due routine litigation or subject to disputes or claims related to our business activities, including workers’ compensation claims and employment-related disputes. Legal costs relating to these matters are expensed as incurred. In the opinion of our management, none of the pending litigation, disputes or claims against us will have a material adverse effect on our financial condition, results of operations or cash flow from operations and there is only a remote possibility that any such matter will require any additional loss accrual.operations.13.12. Quarterly Results of Operations (unaudited) yearyears ended December 31, 20082011 and the nine months ended December 31, 20072010 (in thousands, except per share data): First
Quarter Second
Quarter Third
Quarter Fourth
Quarter Total $ 113,397 $ 152,547 $ 174,245 $ 170,695 $ 610,884 17,995 33,716 42,073 (137,738 ) (43,954 ) (6,250 ) (9,609 ) (12,760 ) 22,562 (6,057 ) 11,848 19,117 24,194 (117,904 ) (62,745 ) $ 0.24 $ 0.38 $ 0.49 $ (2.37 ) $ (1.26 ) $ 0.24 $ 0.38 $ 0.48 $ (2.37 ) $ (1.26 ) $ 102,779 $ 106,516 $ 104,589 $ — $ 313,884 19,569 17,307 18,384 — 55,260 (7,362 ) (6,255 ) (4,512 ) — (18,129 ) 13,088 11,780 14,777 — 39,645 $ 0.26 $ 0.24 $ 0.30 $ — $ 0.80 $ 0.26 $ 0.23 $ 0.29 $ — $ 0.79 Year ended December 31, 2011 Total Revenues $ 153,349 $ 171,285 $ 187,651 $ 203,656 $ 715,941 Income from operations 5,919 11,918 19,324 20,297 57,458 Income tax (expense) benefit 2,102 (1,039 ) (5,250 ) (5,469 ) (9,656 ) Net income (loss) (6,035 ) 3,650 6,744 6,818 11,177 Earnings (loss) per share: Basic $ (0.11 ) $ 0.07 $ 0.11 $ 0.11 $ 0.19 Diluted $ (0.11 ) $ 0.07 $ 0.11 $ 0.11 $ 0.19 Year ended December 31, 2010 Revenues $ 86,021 $ 117,027 $ 135,544 $ 148,618 $ 487,210 Income (loss) from operations (20,116 ) (7,856 ) 2,536 6,864 (18,572 ) Income tax (expense) benefit 9,159 4,498 1,612 (972 ) 14,297 Net loss (14,547 ) (10,142 ) (2,580 ) (5,992 ) (33,261 ) Loss per share: Basic $ (0.27 ) $ (0.19 ) $ (0.05 ) $ (0.11 ) $ (0.62 ) Diluted $ (0.27 ) $ (0.19 ) $ (0.05 ) $ (0.11 ) $ (0.62 ) (1)Our quarterly results of operations for the year ended December 31, 2008 include the results of operations relating to acquisitions of WEDGE and Competition, both of which occurred on March 1, 2008. See note 2.13. Guarantor/Non-Guarantor Condensed Consolidated Financial Statements (2)Our quarterly results of operations for the fourth quarter of the year ended December 31, 2008 reflect the impact of a goodwill impairment charge of $118.6 million and an intangible asset impairment charge of $52.8 million. See note 1.(3)Due to the effects of rounding, the sum of quarterly earnings per share does not equal total earnings per share for the fiscal year. December 31, 2011 Parent Eliminations Consolidated ASSETS Current assets: Cash and cash equivalents $ 91,932 $ (13,879 ) $ 8,144 $ — $ 86,197 Receivables, net of allowance for doubtful accounts (2 ) 112,531 32,724 (19 ) 145,234 Intercompany receivable (payable) (122,552 ) 131,585 (9,033 ) — — Deferred income taxes 1,408 8,644 5,381 — 15,433 Inventory — 4,533 6,651 — 11,184 Prepaid expenses and other current assets 285 6,304 4,975 — 11,564 Total current assets (28,929 ) 249,718 48,842 (19 ) 269,612 Net property and equipment 1,605 675,679 117,422 (750 ) 793,956 Investment in subsidiaries 932,237 221,201 — (1,153,438 ) — Intangible assets, net of amortization 171 18,829 33,680 — 52,680 Goodwill — — 41,683 — 41,683 Noncurrent deferred income taxes 30,835 — 735 (30,835 ) 735 Other long-term assets 11,949 2,124 15 — 14,088 Total assets $ 947,868 $ 1,167,551 $ 242,377 $ (1,185,042 ) $ 1,172,754 LIABILITIES AND SHAREHOLDERS’ EQUITY Current liabilities: Accounts payable $ 1,090 $ 57,150 $ 8,200 — $ 66,440 Current portion of long-term debt — 850 22 — 872 Prepaid drilling contracts — 1,297 2,669 — 3,966 Accrued expenses 16,779 45,012 6,631 (20 ) 68,402 Total current liabilities 17,869 104,309 17,522 (20 ) 139,680 Long-term debt, less current portion 417,747 850 131 — 418,728 Noncurrent deferred income taxes 921 124,659 — (30,835 ) 94,745 Other long-term liabilities 137 5,496 3,523 — 9,156 Total liabilities 436,674 235,314 21,176 (30,855 ) 662,309 Total shareholders’ equity 511,194 932,237 221,201 (1,154,187 ) 510,445 Total liabilities and shareholders’ equity $ 947,868 $ 1,167,551 $ 242,377 $ (1,185,042 ) $ 1,172,754 December 31, 2010 Parent Eliminations Consolidated ASSETS Current assets: Cash and cash equivalents $ 15,737 $ (1,840 ) $ 8,114 $ — $ 22,011 Short-term investments 12,569 — — — 12,569 Receivables, net of allowance for doubtful accounts — 78,575 10,940 — 89,515 Intercompany receivable (payable) (80,900 ) 80,942 (42 ) — — Deferred income taxes 178 4,167 5,522 — 9,867 Inventory — 2,874 6,149 — 9,023 Prepaid expenses and other current assets 263 4,604 3,930 — 8,797 Total current assets (52,153 ) 169,322 34,613 — 151,782 Net property and equipment 1,601 562,390 92,267 (750 ) 655,508 Investment in subsidiaries 714,292 114,483 — (828,775 ) — Intangible assets, net of amortization 235 21,731 — — 21,966 Noncurrent deferred income taxes 14,632 — — (14,632 ) — Other long-term assets 6,739 2,844 2,504 — 12,087 Total assets $ 685,346 $ 870,770 $ 129,384 $ (844,157 ) $ 841,343 LIABILITIES AND SHAREHOLDERS’ EQUITY Current liabilities: Accounts payable $ 242 $ 20,134 $ 6,553 $ — $ 26,929 Current portion of long-term debt 63 1,345 — — 1,408 Prepaid drilling contracts — 1,000 2,669 — 3,669 Accrued expenses 9,861 30,786 2,987 — 43,634 Total current liabilities 10,166 53,265 12,209 — 75,640 Long-term debt, less current portion 277,830 1,700 — — 279,530 Noncurrent deferred income taxes — 94,769 23 (14,632 ) 80,160 Other long-term liabilities 267 6,744 2,669 — 9,680 Total liabilities 288,263 156,478 14,901 (14,632 ) 445,010 Total shareholders’ equity 397,083 714,292 114,483 (829,525 ) 396,333 Total liabilities and shareholders’ equity $ 685,346 $ 870,770 $ 129,384 $ (844,157 ) $ 841,343 Year ended December 31, 2011 Parent Eliminations Consolidated Revenues: $ — $ 606,402 $ 109,539 $ — $ 715,941 Costs and expenses: Operating costs — 372,945 83,979 — 456,924 Depreciation and amortization 847 119,520 12,465 — 132,832 General and administrative 19,797 45,152 2,921 (552 ) 67,318 Intercompany leasing — (4,860 ) 4,857 3 — Bad debt expense — 925 — — 925 Impairment of equipment — 484 — — 484 Total costs and expenses 20,644 534,166 104,222 (549 ) 658,483 Income (loss) from operations (20,644 ) 72,236 5,317 549 57,458 Other (expense) income: Equity in earnings of subsidiaries 43,182 (2,982 ) — (40,200 ) — Interest expense (29,497 ) (248 ) 24 — (29,721 ) Other 311 1,163 (7,829 ) (549 ) (6,904 ) Total other expense 13,996 (2,067 ) (7,805 ) (40,749 ) (36,625 ) Income (loss) before income taxes (6,648 ) 70,169 (2,488 ) (40,200 ) 20,833 Income tax (expense) benefit 17,825 (26,987 ) (494 ) — (9,656 ) Net income (loss) $ 11,177 $ 43,182 $ (2,982 ) $ (40,200 ) $ 11,177 Year ended December 31, 2010 Parent Eliminations Consolidated Revenues: $ — $ 400,778 $ 86,432 $ — $ 487,210 Costs and expenses: Operating costs — 263,649 68,782 — 332,431 Depreciation and amortization 1,271 109,971 9,569 — 120,811 General and administrative 15,337 34,177 2,959 (426 ) 52,047 Intercompany leasing — (4,323 ) 4,323 — — Bad debt expense — 493 — — 493 Total costs and expenses 16,608 403,967 85,633 (426 ) 505,782 Income (loss) from operations (16,608 ) (3,189 ) 799 426 (18,572 ) Other income (expense): Equity in earnings of subsidiaries (1,982 ) 1,335 — 647 — Interest expense (26,240 ) (333 ) 6 — (26,567 ) Impairment of investments (3,331 ) — — — (3,331 ) Other — 953 385 (426 ) 912 Total other income (expense) (31,553 ) 1,955 391 221 (28,986 ) Income (loss) before income taxes (48,161 ) (1,234 ) 1,190 647 (47,558 ) Income tax (expense) benefit 14,900 (748 ) 145 — 14,297 Net earnings (loss) $ (33,261 ) $ (1,982 ) $ 1,335 $ 647 $ (33,261 ) Year ended December 31, 2009 Parent Eliminations Consolidated Revenues: $ — $ 268,920 $ 56,617 $ — $ 325,537 Costs and expenses: Operating costs — 174,579 41,091 (315 ) 215,355 Depreciation and amortization 1,215 97,015 7,956 — 106,186 General and administrative 12,222 25,293 1,379 (1,416 ) 37,478 Bad debt recovery — (1,642 ) — — (1,642 ) Total costs and expenses 13,437 295,245 50,426 (1,731 ) 357,377 Income (loss) from operations (13,437 ) (26,325 ) 6,191 1,731 (31,840 ) Other income (expense): Equity in earnings of subsidiaries (2,250 ) 9,245 — (6,995 ) — Interest expense (8,584 ) (444 ) 100 — (8,928 ) Other 1,056 1,362 (91 ) (1,731 ) 596 Total other expense (9,778 ) 10,163 9 (8,726 ) (8,332 ) Income (loss) before income taxes (23,215 ) (16,162 ) 6,200 (6,995 ) (40,172 ) Income tax (expense) benefit — 13,912 3,045 — 16,957 Net earnings (loss) $ (23,215 ) $ (2,250 ) $ 9,245 $ (6,995 ) $ (23,215 ) Year ended December 31, 2011 Parent Eliminations Consolidated Cash flows from operating activities: $ (164,032 ) $ 300,198 $ 8,713 $ — $ 144,879 Cash flows from investing activities: Acquisition of production services business of Go-Coil — (109,035 ) — — (109,035 ) Acquisition of other production services businesses — (6,502 ) — — (6,502 ) Purchases of property and equipment (485 ) (200,887 ) (8,694 ) — (210,066 ) Proceeds from sale of property and equipment 7 5,532 11 — 5,550 Proceeds from sale of auction rate securities 12,569 — — — 12,569 12,091 (310,892 ) (8,683 ) — (307,484 ) Cash flows from financing activities: Debt repayments (111,813 ) (1,345 ) — — (113,158 ) Proceeds from issuance of debt 250,750 — — — 250,750 Debt issuance costs (7,285 ) — — — (7,285 ) Proceeds from exercise of options 2,884 — — — 2,884 Proceeds from common stock, net of offering costs 94,343 — — — 94,343 Purchase of treasury stock (743 ) — — — (743 ) 228,136 (1,345 ) — — 226,791 Net increase (decrease) in cash and cash equivalents 76,195 (12,039 ) 30 — 64,186 Beginning cash and cash equivalents 15,737 (1,840 ) 8,114 — 22,011 Ending cash and cash equivalents $ 91,932 $ (13,879 ) $ 8,144 $ — $ 86,197 Year ended December 31, 2010 Parent Eliminations Consolidated Cash flows from operating activities: $ (31,841 ) $ 115,650 $ 14,542 $ — $ 98,351 Cash flows from investing activities: Acquisition of other production services businesses — (1,340 ) — — (1,340 ) Purchases of property and equipment (478 ) (114,313 ) (16,212 ) — (131,003 ) Proceeds from sale of property and equipment — 2,290 41 — 2,331 Proceeds from insurance recoveries — 531 — — 531 (478 ) (112,832 ) (16,171 ) — (129,481 ) Cash flows from financing activities: Debt repayments (254,914 ) (1,942 ) — — (256,856 ) Proceeds from issuance of debt 274,375 — — — 274,375 Debt issuance costs (4,865 ) — — — (4,865 ) Proceeds from exercise of options 238 — — — 238 Purchase of treasury stock (130 ) — — — (130 ) 14,704 (1,942 ) — — 12,762 Net increase (decrease) in cash and cash equivalents (17,615 ) 876 (1,629 ) — (18,368 ) Beginning cash and cash equivalents 33,352 (2,716 ) 9,743 — 40,379 Ending cash and cash equivalents $ 15,737 $ (1,840 ) $ 8,114 $ — $ 22,011 Year ended December 31, 2009 Parent Eliminations Consolidated Cash flows from operating activities: $ 26,598 $ 91,432 $ 5,283 $ — $ 123,313 Cash flows from investing activities: Purchases of property and equipment (404 ) (106,628 ) (7,680 ) — (114,712 ) Proceeds from sale of property and equipment — 694 73 — 767 Proceeds from insurance recoveries — 36 — — 36 (404 ) (105,898 ) (7,607 ) — (113,909 ) Cash flows from financing activities: Debt repayments (15,152 ) (2,146 ) — — (17,298 ) Debt issuance costs (2,560 ) — — — (2,560 ) Proceeds from common stock, net of offering costs 24,043 — — — 24,043 Purchase of treasury stock (31 ) — — — (31 ) 6,300 (2,146 ) — — 4,154 Net increase (decrease) in cash and cash equivalents 32,494 (16,612 ) (2,324 ) — 13,558 Beginning cash and cash equivalents 858 13,896 12,067 — 26,821 Ending cash and cash equivalents $ 33,352 $ (2,716 ) $ 9,743 $ — $ 40,379 Item 9. Changes in and Disagreements With Accountants on Accounting and Financial Disclosure Item 9A. Controls and Procedures 20082011, to provide reasonable assuranceensure that information required to be disclosed in our reports filed or submitted under the Exchange Act is (1) recorded, processed, summarized and reported within the time periods specified in the Securities and Exchange Commission’s rules and forms.20082011 that has materially affected, or is reasonably likely to materially affect, our internal control over financial reporting.We completed the acquisitions of the production services businesses of WEDGE, Competition, Paltec and Pettus during 2008. We are in the process of transferring accounting processes for the new acquisition to our headquarters and into our existing internal control processes. The integration will lead to changes in these internal controls in future fiscal periods, but we do not expect these changes to materially affect our internal controls over financial reporting. Consistent with published guidance of the SEC, our management excluded from its assessment of the effectiveness of Pioneer Drilling Company’s internal control over financial reporting as of December 31, 2008, the internal control over financial reporting for WEDGE, Competition, Paltec and Pettus associated with total assets of $232.1 million and total revenues of $154.0 million included in the consolidated financial statement amounts of Pioneer Drilling Company as of and for the year ended December 31, 2008. We will include these acquired companies in the scope of our assessment of internal control over financial reporting for the year ending December 31, 2009.Investigation by the Special Subcommittee of the Board of DirectorsOn May 12, 2008, the Company announced a delay in filing its Form 10-Q for the quarter ended March 31, 2008 (the “Quarterly Report”), as a result of certain questions raised with respect to the effectiveness of the Company’s internal control over financial reporting. On May 15, 2008, the Board of Directors formed a special subcommittee of the Board (the “Special Committee”) to investigate the questions raised regarding the Company’s internal control over financial reporting and to determine whether such weaknesses, if any, have materially affected the Company’s financial statements The Special Committee engaged Bracewell & Giuliani LLP (“Bracewell”), as independent legal counsel, and Deloitte & Touche LLP (“Deloitte”), as independent forensic accountants, to assist in the investigation.In July 2008, after an extensive document review and interviewing relevant current and former employees and vendors, Bracewell presented their report to the Special Committee. After consideration of the report, the Special Committee then met with the Board of Directors, at which meeting Bracewell also presented its report to the Board of Directors, to discuss the report and present the Special Committee’s recommendations.After reviewing the report, the Special Committee and the Board of Directors concluded that they were not aware of any facts that caused them to believe that there was any material misstatement of the Company’s historical financial statements or in the financial statements proposed to be included in the Quarterly Report.Furthermore, based on the Bracewell report, the Special Committee and the Board do not believe that the questions raised constituted a material weakness in the Company’s internal control over financial reporting. The Bracewell report, however, did identify certain control deficiencies and made recommendations, that have been adopted by the Board of Directors, to enhance the Company’s governance and control environment.The Bracewell report noted some deficiencies in the Company’s manual process to record purchases and process expenditures, for both expense and capital expenditures. While there were certain compensating controls that mitigated the financial reporting risks associated with these deficiencies, the Bracewell report recommended that the Company implement a more effective systematic purchase order application integrated with the general ledger. Consistent with the recommendation in the Bracewell report, the Company intends to enhance its current process by expanding, upgrading, better systematizing and making prospective its current purchase order system.The Bracewell report and the Special Committee’s review also noted the desirability to improve communications and more clearly delineate roles and responsibilities within the Company. As recommended in the Bracewell report, the Company has hired a general counsel and chief compliance officer, and intends to further define roles and responsibilities within the Company, and to undertake a series of training initiatives.The Bracewell report also reviewed certain matters related to the Company’s Colombian operations. In light of the recent commencement of these operations and cultural and other issues involved in integrating them into the Company and its systems, including documentation procedures, the Bracewell report recommended, and the Board has already begun to focus on, additional oversight of these operations as the Company continues the intended expansion in this market.Finally, the Board has directed management to consider and report back to the Board with respect to the implementation of additional controls and procedures. These include a disclosure committee comprised of representatives from operations, compliance and finance and accounting and a quarterly subcertification and management representation process with signoff by segment and service line operating executives and controllers, corporate accounting managers and other personnel involved in the financial reporting process. These processes should enhance internal accountability for our financial statements.Company’sCompany's internal control over financial reporting is a process designed to provide reasonable assurance regarding the reliability of financial reporting and the preparation of financial statements for external purposes in accordance with generally accepted accounting principles. A company’scompany's internal control over financial reporting includes those policies and procedures that: (1) pertain to the maintenance of records that, in reasonable detail, accurately and fairly reflect the transactions and dispositions of the assets of the company; (2) provide reasonable assurance that transactions are recorded as necessary to permit preparation of financial statements in accordance with generally accepted accounting principles, and that receipts and expenditures of the companyPioneer Drilling Company are being made only in accordance with authorizations of management and directors of the company; and (3) provide reasonable assurance regarding prevention or timely detection of unauthorized acquisition, use, or disposition of the company’s assets that could have a material effect on the financial statements. Because of its inherent limitations, internal control over financial reporting may not prevent or detect misstatements. Also, projections of any evaluation of effectiveness to future periods are subject to the risk that controls may become inadequate because of changes in conditions, or that the degree of compliance with the policies or procedures may deteriorate.2008.2011. In making this assessment, it used the criteria set forth by the Committee of Sponsoring Organizations of the Treadway Commission (COSO) in Internal Control-Integrated Framework. Based on our assessment we have concluded that, as of December 31, 2008,2011, Pioneer Drilling Company’s internal control over financial reporting was effective based on those criteria.2008.2011. This report appears on page 57.Item 9B. Other Information 20092012 Annual Meeting of Shareholders. We intend to file that definitive proxy statement with the SEC by on or about April 10, 2009.2012.Item 10. Directors, Executive Officers and Corporate Governance “Section16(a)“Section 16(a) Beneficial Ownership Reporting Compliance” in the definitive proxy statement for our 20092012 Annual Meeting of Shareholders for the information this Item 10 requires.Item 11. Executive Compensation 20092012 Annual Meeting of Shareholders for the information this Item 11 requires.Item 12. Security Ownership of Certain Beneficial Owners and Management and Related Shareholder Matters (1) under the headingheadings “Equity Compensation Plan Information” in Item 5 of Part II of this report and (2) under the heading “Security Ownership of Certain Beneficial Owners and Management” in the definitive proxy statement for our 20092012 Annual Meeting of Shareholders for the information this Item 12 requires.Item 13. Certain Relationships and Related Transactions, and Director Independence 20092012 Annual Meeting of Shareholders for the information this Item 13 requires.Item 14. Principal Accountant Fees and Services 20092012 Annual Meeting of Shareholders for the information this Item 14 requires.Item 15. Exhibits and Financial Statement Schedules 55.Schedules. 2.1*3.1* - Securities Purchase Agreement, dated January 31, 2008, by and among Pioneer Drilling Company, WEDGE Group Incorporated, WEDGE Energy Holdings, L.L.C., WEDGE Oil & Gas Services, L.L.C., Timothy Daley, John Patterson and Patrick Grissom (Form 8-K dated February 1, 2008 (File No. 1-8182, Exhibit 2.1)) 2.2*-Letter Agreement, dated February 29, 2008, amending the Securities Purchase Agreement, dated January 31, 2008, by and among Pioneer Drilling Company, WEDGE Group Incorporated, WEDGE Energy Holdings, L.L.C., WEDGE Oil & Gas Services, L.L.C., Timothy Daley, John Patterson and Patrick Grissom (Form 8-K dated March 3, 2008 (File No. 1-8182, Exhibit 2.1)) 3.1-Company.Company (Form 10-K for the year ended December 31, 2008 (File No. 1-8182, Exhibit 3.1)). 3.2* - 4.1* - 4.2* - Credit Agreement betweenIndenture, dated March 11, 2010, by and among Pioneer Drilling Services, Ltd.Company, the subsidiary guarantors party thereto and FrostWells Fargo Bank, National Bank,Association, as Administrative Agent, Agent, Lead Arranger and Lender dated October 29, 2004trustee (Form 8-K dated November 2, 2004March 12, 2010, (File No. 1-8182, Exhibit 4.1)). 4.3* - Second Amendment,Registration Rights Agreement, dated MayMarch 11, 2005, to Credit Agreement between2010, by and among Pioneer Drilling Services, Ltd.Company, the subsidiary guarantors party thereto and Frost National Bank, as Administrative Agent, Lead Arranger and Lender dated October 29, 2004the initial purchasers party thereto (Form 8-K dated May 13, 2005March 12, 2010, (File No. 1-8182, Exhibit 4.1)4.2)). 4.4* - Third Amendment,October 25, 2005, to Credit Agreement betweenNovember 21, 2011, by and among Pioneer Drilling Services, Ltd.Company, the subsidiary guarantors party thereto and FrostWells Fargo Bank, National Bank,Association, as Administrative Agent, Lead Arranger and Lender dated October 29, 2004trustee (Form 8-K dated October 28, 2005November 21, 2011, (File No. 1-8182, Exhibit 4.1)4.2)). 4.5* - Fourth Amendment,December 15, 2005, to Credit Agreement betweenNovember 21, 2011, by and among Pioneer Drilling Services, Ltd.Company, the subsidiary guarantors party thereto and Frost National Bank, as Administrative Agent, Lead Arranger and Lender dated October 29, 2004the initial purchasers party thereto (Form 8-K dated December 16, 2005November 21, 2011, (File No. 1-8182, Exhibit 4.1)4.3)). 4.6*10.1* - Fifth Amendment,Purchase Agreement, dated October 30, 2006, to Credit Agreement betweenMarch 4, 2010, by and among Pioneer Drilling Services, Ltd.Company, the subsidiary guarantors party thereto and Frost National Bank, as Administrative Agent, Lead Arranger and Lender dated October 29, 2004the initial purchasers party thereto (Form 8-K dated October 31, 2006March 5, 2010 (File No. 1-8182, Exhibit 4.1)10.1)).10.1+10.2*- 10.3* - Pioneer Drilling Company 2007 Incentive Plan Form of Long-Term Incentive Cash Award Agreement (Form 10-Q dated August 5, 2010 (File No. 1-8182, Exhibit 10.1)). 10.4+* - 10.5+* - Pioneer Drilling Company 2007 Incentive Plan Form of Long-Term Incentive Restricted Stock Award Agreement (Form 10-Q dated August 5, 2010 (File No. 1-8182, Exhibit 10.3)). 10.6+* - Pioneer Drilling Company 2007 Incentive Plan Form of Restricted Stock Unit Agreement (Form 10-Q dated August 5, 2010 (File No. 1-8182, Exhibit 10.4)). Description 10.7+* - Pioneer Drilling Services, Ltd. Annual Incentive Compensation Plan dated August 5, 2005 (Form 8-K dated August 5, 2005 (File No. 1-8182, Exhibit 10.1)). 10.2+10.8+* - 10.3+10.9+* - 10.4+10.10+* - 10.5+10.11+* - 10.6+10.12+* - 10.13+* - Pioneer Drilling Company 2007 Incentive Plan adopted May 16, 2008Form of Stock Option Agreement (Form 10-Q for the quarter ended March 31,8-K dated September 4, 2008 (File No. 1-8182, Exhibit 10.5)10.1)).ExhibitNumber Description10.7+10.14+* - Joyce M. Schuldt Employment Letter, dated July 17,Pioneer Drilling Company 2007 Incentive Plan Form of Employee Restricted Stock Award Agreement (Form 8-K dated July 18, 2007September 4, 2008 (File No. 1-8182, Exhibit 10.1)10.2)).10.8+10.15+* - William D. Hibbetts Reassignment Letter, dated July 17,Pioneer Drilling Company 2007 Incentive Plan Form of Non-Employee Director Restricted Stock Award Agreement (Form 8-K dated July 18, 2007September 4, 2008 (File No. 1-8182, Exhibit 10.2)10.3)).10.9+10.16+* - 10.10+10.17+* - Officers—Officers – Package A (Form 8-K dated August 8, 2007 (File No. 1-8182, Exhibit 10.3)).10.11*Credit Agreement, dated February 29, 2008, among Pioneer Drilling Company, as Borrower, and Wells Fargo Bank, N.A., as administrative agent, issuing lender, swing line lender and co-lead arranger, Fortis Bank SA/NV, New York Branch, as co-lead arranger, and each of the other parties listed therein (Form 8-K dated March 3, 2008 (File No. 1-8182, Exhibit 10.1)).10.12* WaiverDescription10.18* - 9, 2008,30, 2011 among Pioneer Drilling Company, the guarantorslenders party thereto, and Wells Fargo Bank, N.A., as administrative agent, issuing lender and swing line lender and each of the other financial institutions party thereto (Form 8-K dated June 11, 2008July 5, 2011 (File No. 1-8182, Exhibit 10.1)).10.13+10.19+* - 10.14+10.20+* - 10.15+10.21+* - Agreement between Joyce M. Schuldt and Pioneer Drilling Company, dated August 20, 2008 (Form 8-K dated August 21, 2008 (File No. 1-8182, Exhibit 10.1)).10.16*Pioneer Drilling Company 2007 Incentive Plan Form of Stock Option Agreement (Form 8-K dated September 4, 2008 (File No. 1-8182, Exhibit 10.1)).10.17*Pioneer Drilling Company 2007 Incentive Plan Form of Employee Restricted Stock Award Agreement (Form 8-K dated September 4, 2008 (File No. 1-8182, Exhibit 10.2)).10.18*Pioneer Drilling Company 2007 Incentive Plan Form of Non-Employee Director Restricted Stock Award Agreement (Form 8-K dated September 4, 2008 (File No. 1-8182, Exhibit 10.3)).10.19+* Agreement, effective January 7, 2009, from Pioneer Drilling Company to Lorne E. Phillips (Form 8-K dated January 14, 2009 (File No. 1-8182, Exhibit 10.1)).21.112.1** - SubsidiariesComputation of Pioneer Drilling Company.23.121.1# - 23.1# - Consent of Independent Registered Public Accounting Firm. 31.131.1** - 31.231.2** - 32.132.1# - 32.232.2# - 101# - * ** Filed herewith. # Furnished herewith. + February 25, 2009 By: /s/ WM. STACY LOCKE February 21, 2012 Signature Title Date/s/ DEAN A. BURKHARDT Date Chairman February 25, 200921, 2012Dean A. Burkhardt s/S/ WM. STACY LOCKE President, Chief Executive Officer and Director (Principal Executive Officer) February 25, 200921, 2012Wm. Stacy Locke s/S/ LORNE E. E. PHILLIPS February 25, 200921, 2012Lorne E. Phillips s/S/ C. JOHN THOMPSON February 25, 200921, 2012C. John Thompson s/S/ JOHN MICHAEL RAUH February 25, 200921, 2012John Michael Rauh s/ S/ SCOTT D. URBAN February 25, 200921, 2012Scott D. Urban 2.1*3.1* - Securities Purchase Agreement, dated January 31, 2008, by and among Pioneer Drilling Company, WEDGE Group Incorporated, WEDGE Energy Holdings, L.L.C., WEDGE Oil & Gas Services, L.L.C., Timothy Daley, John Patterson and Patrick Grissom (Form 8-K dated February 1, 2008 (File No. 1-8182, Exhibit 2.1)) 2.2*-Letter Agreement, dated February 29, 2008, amending the Securities Purchase Agreement, dated January 31, 2008, by and among Pioneer Drilling Company, WEDGE Group Incorporated, WEDGE Energy Holdings, L.L.C., WEDGE Oil & Gas Services, L.L.C., Timothy Daley, John Patterson and Patrick Grissom (Form 8-K dated March 3, 2008 (File No. 1-8182, Exhibit 2.1)) 3.1-Company.Company (Form 10-K for the year ended December 31, 2008 (File No. 1-8182, Exhibit 3.1)). 3.2* - 4.1* - 4.2* - Credit Agreement betweenIndenture, dated March 11, 2010, by and among Pioneer Drilling Services, Ltd.Company, the subsidiary guarantors party thereto and FrostWells Fargo Bank, National Bank,Association, as Administrative Agent, Agent, Lead Arranger and Lender dated October 29, 2004trustee (Form 8-K dated November 2, 2004March 12, 2010, (File No. 1-8182, Exhibit 4.1)). 4.3* - Second Amendment,Registration Rights Agreement, dated MayMarch 11, 2005, to Credit Agreement between2010, by and among Pioneer Drilling Services, Ltd.Company, the subsidiary guarantors party thereto and Frost National Bank, as Administrative Agent, Lead Arranger and Lender dated October 29, 2004the initial purchasers party thereto (Form 8-K dated May 13, 2005March 12, 2010, (File No. 1-8182, Exhibit 4.1)4.2)). 4.4* - Third Amendment,October 25, 2005, to Credit Agreement betweenNovember 21, 2011, by and among Pioneer Drilling Services, Ltd.Company, the subsidiary guarantors party thereto and FrostWells Fargo Bank, National Bank,Association, as Administrative Agent, Lead Arranger and Lender dated October 29, 2004trustee (Form 8-K dated October 28, 2005November 21, 2011, (File No. 1-8182, Exhibit 4.1)4.2)). 4.5* - Fourth Amendment,Registration Rights Agreement, dated December 15, 2005, to Credit Agreement betweenNovember 21, 2011, by and among Pioneer Drilling Services, Ltd.Company, the subsidiary guarantors party thereto and Frost National Bank, as Administrative Agent, Lead Arranger and Lender dated October 29, 2004the initial purchasers party thereto (Form 8-K dated December 16, 2005November 21, 2011, (File No. 1-8182, Exhibit 4.1)4.3)). 4.6*10.1* - Fifth Amendment,Purchase Agreement, dated October 30, 2006, to Credit Agreement betweenMarch 4, 2010, by and among Pioneer Drilling Services, Ltd.Company, the subsidiary guarantors party thereto and Frost National Bank, as Administrative Agent, Lead Arranger and Lender dated October 29, 2004the initial purchasers party thereto (Form 8-K dated October 31, 2006March 5, 2010 (File No. 1-8182, Exhibit 4.1)10.1)).10.1+10.2*- 10.3* - Pioneer Drilling Company 2007 Incentive Plan Form of Long-Term Incentive Cash Award Agreement (Form 10-Q dated August 5, 2010 (File No. 1-8182, Exhibit 10.1)). 10.4+* - 10.5+* - Pioneer Drilling Company 2007 Incentive Plan Form of Long-Term Incentive Restricted Stock Award Agreement (Form 10-Q dated August 5, 2010 (File No. 1-8182, Exhibit 10.3)). Description 10.6+* - Pioneer Drilling Company 2007 Incentive Plan Form of Restricted Stock Unit Agreement (Form 10-Q dated August 5, 2010 (File No. 1-8182, Exhibit 10.4)). 10.7+* - Pioneer Drilling Services, Ltd. Annual Incentive Compensation Plan dated August 5, 2005 (Form 8-K dated August 5, 2005 (File No. 1-8182, Exhibit 10.1)). 10.2+10.8+* - 10.3+10.9+* - 10.4+10.10+* - 10.5+10.11+* - 10.6+10.12+* - 10.13+* - Pioneer Drilling Company 2007 Incentive Plan adopted May 16, 2008Form of Stock Option Agreement (Form 10-Q for the quarter ended March 31,8-K dated September 4, 2008 (File No. 1-8182, Exhibit 10.5)10.1)).10.7+10.14+* - Joyce M. Schuldt Employment Letter, dated July 17,Pioneer Drilling Company 2007 Incentive Plan Form of Employee Restricted Stock Award Agreement (Form 8-K dated July 18, 2007September 4, 2008 (File No. 1-8182, Exhibit 10.1)10.2)).ExhibitNumber Description10.8+10.15+* - William D. Hibbetts Reassignment Letter, dated July 17,Pioneer Drilling Company 2007 Incentive Plan Form of Non-Employee Director Restricted Stock Award Agreement (Form 8-K dated July 18, 2007September 4, 2008 (File No. 1-8182, Exhibit 10.2)10.3)).10.9+10.16+* - 10.10+10.17+* - 10.11*Credit Agreement, dated February 29, 2008, among Pioneer Drilling Company, as Borrower, and Wells Fargo Bank, N.A., as administrative agent, issuing lender, swing line lender and co-lead arranger, Fortis Bank SA/NV, New York Branch, as co-lead arranger, and each of the other parties listed therein (Form 8-K dated March 3, 2008 (File No. 1-8182, Exhibit 10.1)).10.12* WaiverDescription10.18* - 9, 2008,30, 2011 among Pioneer Drilling Company, the guarantorslenders party thereto, and Wells Fargo Bank, N.A., as administrative agent, issuing lender and swing line lender and each of the other financial institutions party thereto (Form 8-K dated June 11, 2008July 5, 2011 (File No. 1-8182, Exhibit 10.1)).10.13+10.19+* - 10.14+10.20+* - 10.15+10.21+* - Agreement between Joyce M. Schuldt and Pioneer Drilling Company, dated August 20, 2008 (Form 8-K dated August 21, 2008 (File No. 1-8182, Exhibit 10.1)).10.16*Pioneer Drilling Company 2007 Incentive Plan Form of Stock Option Agreement (Form 8-K dated September 4, 2008 (File No. 1-8182, Exhibit 10.1)).10.17*Pioneer Drilling Company 2007 Incentive Plan Form of Employee Restricted Stock Award Agreement (Form 8-K dated September 4, 2008 (File No. 1-8182, Exhibit 10.2)).10.18*Pioneer Drilling Company 2007 Incentive Plan Form of Non-Employee Director Restricted Stock Award Agreement (Form 8-K dated September 4, 2008 (File No. 1-8182, Exhibit 10.3)).10.19+* Agreement, effective January 7, 2009, from Pioneer Drilling Company to Lorne E. Phillips (Form 8-K dated January 14, 2009 (File No. 1-8182, Exhibit 10.1)).21.112.1** - SubsidiariesComputation of Pioneer Drilling Company.23.121.1# - 23.1# - Consent of Independent Registered Public Accounting Firm. 31.131.1** - 31.231.2** - 32.132.1# - 32.232.2# - 101# - * ** Filed herewith. # Furnished herewith. +