UNITED STATES
SECURITIES AND EXCHANGE COMMISSION
Washington, D.C. 20549
FORM 10-K
ANNUAL REPORT PURSUANT TO SECTION 13 OR 15(d)
OF THE
SECURITIES EXCHANGE ACT OF 1934
For the fiscal year ended December 31, 2008
2009Commission file number: 1-13283
Penn Virginia Corporation
(Exact name of registrant as specified in its charter)
| | |
Virginia | | 23-1184320 |
Virginia | | 23-1184320 |
| (State or other jurisdiction of
incorporation or organization)
| | (I.R.S. Employer
Identification Number)
|
Three Radnor Corporate Center, Suite 300
100 Matsonford Road
Radnor, Pennsylvania 19087
(Address of principal executive offices)
Registrant’s telephone number, including area code: (610) 687-8900
Securities registered pursuant to Section 12(b) of the Act:None
Securities registered pursuant to Section 12(g) of the Act:
| | |
Title of each class | | Name of exchange on which registered |
| Common Stock, $0.01 Par Value | | New York Stock Exchange |
Indicate by check mark if the registrant is a well-known seasoned issuer, as defined in Rule 405 of the Securities Act. Yesx No¨o
Indicate by check mark if the registrant is not required to file reports pursuant to Section 13 or Section 15(d) of the Securities Exchange Act of 1934 (“Exchange Act”). Yes¨o Nox
Indicate by check mark whether the registrant (1) has filed all reports required to be filed by Section 13 or 15(d) of the Exchange Act during the preceding 12 months (or for such shorter period that the registrant was required to file such reports), and (2) has been subject to such filing requirements for the past 90 days. Yesx No¨o
Indicate by check mark if disclosure of delinquent filers pursuant to Item 405 of Regulation S-K is not contained herein, and will not be contained, to the best of the registrant’s knowledge, in definitive proxy or information statements incorporated by reference in Part III of this Form 10-K or any amendment to this Form 10-K.¨o
Indicate by check mark whether the registrant is a large accelerated filer, an accelerated filer, a non-accelerated filer or a smaller reporting company. See the definitions of “large accelerated filer,” “accelerated filer” and “smaller reporting company” in Rule 12b-2 of the Exchange Act. (Check One)
| | | | | | |
| Large accelerated filer | | x | | Accelerated filero | | ¨ |
| | | |
| Non-accelerated filer | | ¨o | | Smaller reporting company | | ¨o |
Indicate by check mark whether the registrant is a shell company (as defined in Rule 12b-2 of the Exchange Act). Yes¨o Nox
The aggregate market value of common stock held by non-affiliates of the registrant was $1,966,744,687$532,899,076 as of June 30, 20082009 (the last business day of its most recently completed second fiscal quarter), based on the last sale price of such stock as quoted on the New York Stock Exchange. For purposes of making this calculation only, the registrant has defined affiliates as including all directors and executive officers of the registrant, but excluding any institutional shareholders. This determination of affiliate status is not necessarily a conclusive determination for other purposes.
As of February 25, 2009, 41,871,60722, 2010, 45,409,837 shares of common stock of the registrant were outstanding.
DOCUMENTS INCORPORATED BY REFERENCE
Portions of the Proxy Statement relating to the registrant’s Annual Meeting of Shareholders, to be held on May 5, 2009,2010, is incorporated by reference in Part III of this Form 10-K.
i
TABLE OF CONTENTS
Forward-Looking Statements
Certain statements contained herein that are not descriptions of historical facts are “forward-looking” statements within the meaning of Section 27A of the Securities Act of 1933, as amended, and Section 21E of the Securities Exchange Act of 1934, as amended, or Exchange Act. Because such statements include risks, uncertainties and contingencies, actual results may differ materially from those expressed or implied by such forward-looking statements. These risks, uncertainties and contingencies include, but are not limited to, the following:
the volatility of commodity prices for natural gas, NGLs, crude oil and coal;
our ability to access external sources of capital;
uncertainties relating to the occurrence and success of capital-raising transactions, including securities offerings and asset sales;
reductions in the borrowing base under our revolving credit facility, or Revolver;
our ability to develop and replace oil and gas reserves and the price for which such reserves can be acquired;
any impairment write-downs of our reserves or assets;
reductions in our anticipated capital expenditures;
the relationship between natural gas, NGL, crude oil and coal prices;
the projected demand for and supply of natural gas, NGLs, crude oil and coal;
the availability and costs of required drilling rigs, production equipment and materials;
our ability to obtain adequate pipeline transportation capacity for our oil and gas production;
competition among producers in the oil and natural gas and coal industries generally and among natural gas midstream companies;
the extent to which the amount and quality of actual production of our oil and natural gas or Penn Virginia Resource Partners, L.P., or PVR’s, coal differ from estimated proved oil and gas reserves and recoverable coal reserves;
PVR’s ability to generate sufficient cash from its businesses to maintain and pay the quarterly distribution to its general partner and its unitholders;
the experience and financial condition of PVR’s coal lessees and natural gas midstream customers, including the lessees’ ability to satisfy their royalty, environmental, reclamation and other obligations to PVR and others;
operating risks, including unanticipated geological problems, incidental to our business and to PVR’s coal and natural resource management or natural gas midstream business;
PVR’s ability to acquire new coal reserves or natural gas midstream assets and new sources of natural gas supply and connections to third-party pipelines on satisfactory terms;
PVR’s ability to retain existing or acquire new natural gas midstream customers and coal lessees;
the ability of PVR’s lessees to produce sufficient quantities of coal on an economic basis from PVR’s reserves and obtain favorable contracts for such production;
the occurrence of unusual weather or operating conditions including force majeure events;
delays in anticipated start-up dates of our oil and natural gas production, of PVR’s lessees’ mining operations and related coal infrastructure projects and new processing plants in PVR’s natural gas midstream business;
environmental risks affecting the drilling and producing of oil and gas wells, the mining of coal reserves or the production, gathering and processing of natural gas;
ii
TABLE OF CONTENTS
the timing of receipt of necessary governmental permits by us and by PVR or PVR’s lessees;
hedging results;
accidents;
changes in governmental regulation or enforcement practices, especially with respect to environmental, health and safety matters, including with respect to emissions levels applicable to coal-burning power generators;
uncertainties relating to the outcome of current and future litigation regarding mine permitting;
risks and uncertainties relating to general domestic and international economic (including inflation, interest rates and financial and credit markets) and political conditions (including the impact of potential terrorist attacks);
Penn Virginia GP Holdings, L.P.’s ability to generate sufficient cash from its interests in PVR to maintain and pay the quarterly distribution to its unitholders;
uncertainties relating to our continued ownership of interests in PVG and PVR; and
other risks set forth in Item 1A of this Annual Report on Form 10-K for the year ended December 31, 2009.
Additional information concerning these and other factors can be found in our press releases and public periodic filings with the Securities and Exchange Commission. Many of the factors that will determine our future results are beyond the ability of management to control or predict. Readers should not place undue reliance on forward-looking statements, which reflect management’s views only as of the date hereof. We undertake no obligation to revise or update any forward-looking statements, or to make any other forward-looking statements, whether as a result of new information, future events or otherwise.
iii
TABLE OF CONTENTS
Part I
Item 1 Business
General
Penn Virginia Corporation (NYSE: PVA) is an independent oil and gas company primarily engaged in the development, exploration and production of natural gas and oil in various domestic onshore regions including East Texas, the Mid-Continent, Appalachia Mississippi and the Gulf Coast.Mississippi. We also indirectly own partner interests in Penn Virginia Resource Partners, L.P. (NYSE: PVR), or PVR, a publicly traded limited partnership formed by us in 2001. Our ownership interests in PVR are held principally through our general partner interest and our 77%51.4% limited partner interest in Penn Virginia GP Holdings, L.P. (NYSE: PVG), or PVG, a publicly traded limited partnership formed by us in 2006. As of December 31, 2008,2009, PVG owned an approximatelyapproximate 37% limited partner interest in PVR and 100% of the general partner of PVR, which holds a 2% general partner interest in PVR.PVR and all of the incentive distribution rights, or IDRs. During 2009, we sold a portion of our limited partner interest in PVG in a public offering, reducing our limited partner interest in PVG from 77% to 51.4%. See “—Corporate Structure.”
PVG consolidates PVR’s results into its financial statements because PVG controls PVR’s general partner. We consolidate PVG’s results into our financial statements because we control PVG’s general partner. PVG and PVR function with capital structures that are independent of each other and us. While we report consolidated financial results of PVR’s coal and natural resource management and natural gas midstream businesses, the only cash we received from those businesses is in the form of cash distributions we received from PVG and PVR in respect of our partner interests in each of them. We received cash distributions of $42.3 million, $44.0 million $29.8 million and $28.6$29.8 million in the years ended December 31, 2009, 2008 and 2007 and 2006 on accountas a result of our partner interests in PVG and PVR.
Unless the context requires otherwise, references to the “Company,” “Penn Virginia,” “we,” “us” or “our” in this Annual Report on Form 10-K refer to Penn Virginia Corporation and its subsidiaries.
Segments
We are engaged in three primary business segments: (i) oil and gas, (ii) coal and natural resource management and (iii) natural gas midstream. We operate our oil and gas segment.segment, and PVR operates the coal and natural resource management and natural gas midstream segments. Our operating income was $256.8 million in 2008, compared to $192.6 million in 2007 and $170.5 million in 2006. Our segments’ contributions to operating income in 2008 were as follows:
the oil and gas segment contributed $170.6 million, or 66%;
the PVR coal and natural resource management segment contributed $96.3 million, or 37%; and
the PVR natural gas midstream segment contributed $18.9 million, or 7%.
These contributions were partially offset by $29.0 million of intercompany eliminations and corporate expenses, or 10%.
Oil and Gas Segment Overview
We have a geographically diverse asset base with core areas of operation in the East Texas, Mid-Continent, Appalachian Mississippi and Gulf CoastMississippi regions of the United States. As of December 31, 2008,2009, we had proved natural gas and oil reserves of approximately 916935 Bcfe, of which 82%83% were natural gas and 51%47% were proved developed. Our operations include both conventional and unconventional developmental drilling opportunities, as well as some exploratory prospects.
As of December 31, 2008,2009, 97% of our proved reserves were located in primarily longer-lived, lower-risk basins in East Texas, the Mid-Continent, Appalachia and Mississippi, which comprised 43%, 15%21%, 19%14% and 15%19%, respectively, of the proved reserves. OurWe sold our Gulf Coast properties, representing 3% of proved reserves, are shorter-lived and have higher impact exploratory prospects.in a transaction that closed on January 29, 2010. In 2008,2009, we produced 46.951.0 Bcfe, a 16%9% increase compared to 40.646.9 Bcfe in 2007,2008, with East Texas, the Mid-Continent, Appalachia, Mississippi and the Gulf Coast comprising 29%, 16%26%, 25%, 16%23%, 15% and 16%11% of total production volumes. In the three years ended December 31, 2008,2009, we drilled 785607 gross (544.4(413.3 net) wells, of which 94%93% were successful in producing natural gas in commercial quantities. For a more detailed discussion of our reserves and production, see Item 2, “Properties.”
The primary development play types that our oil and gas operations are focused on include: (i) the horizontal Lower Bossier (Haynesville) Shale and vertical Cotton Valley plays in East Texas, (ii) the horizontal Granite Wash horizontal Hartshorne CBM and the Woodford Shale playsplay in the Mid-Continent (iii) multi-lateral horizontal CBM and Marcellus Shale plays in Appalachia and (iv)(iii) the predominantly horizontal Selma Chalk play in Mississippi. In addition, we intend to focus on drilling exploratory wells in the Marcellus Shale play in Appalachia in order to determine whether our leasehold acreage position there will support a development program.
TABLE OF CONTENTS
We have grown our reserves and production primarily through development and exploratory drilling, complemented to a lesser extent by making strategic acquisitions. In 2008,Despite a challenging year in 2009, we replaced 604%approximately 147% of our 20082009 production entirely through the drillbit by adding approximately 28375 Bcfe of proved reserves from extensions, discoveries and additions, net of revisions. In 2008,2009, capital expenditures in our oil and gas segment were $641.7$171.8 million, of which $481.4$140.2 million, or 75%82%, was related to development drilling $23.8and $18.7 million, or 4%, was related to exploratory drilling, $95.5 million, or 15%11%, was related to leasehold acquisitions and $36.8acquisitions. The remaining $12.9 million, or 6%7%, was related to exploration drilling, pipelines, gathering and facilities.
As of December 31, 2009, we owned 1.1 million net acres of leasehold interests, approximately 34% of which were undeveloped. Many of our proved undeveloped locations and additional potential drilling locations are direct offsets or extensions from existing production. We believe our existing undeveloped acreage position represents over 10 years of drilling opportunities based on our historical drilling rate.
PVR Coal and Natural Resource Management Segment Overview
The PVR coal and natural resource management segment primarily involves the management and leasing of coal properties and the subsequent collection of royalties. PVR also earns revenues from other land management activities, such as selling standing timber, leasing fee-based coal-related infrastructure facilities to certain lessees and end-user industrial plants, collecting oil and gas royalties and from coal transportation, or wheelage, fees.
As of December 31, 2008,2009, PVR owned or controlled approximately 827829 million tons of proven and probable coal reserves in Central and Northern Appalachia, the San Juan Basin and the Illinois Basin. PVR enters into long-term leases with experienced, third-party mine operators, providing them the right to mine PVR’s coal reserves in exchange for royalty payments. PVR actively works with its lessees to develop efficient methods to exploit its reserves and to maximize production from PVR’s properties. PVR does not operate any mines. In 2008,2009, PVR’s lessees produced 33.734.3 million tons of coal from its properties and paid PVR coal royalties revenues of $122.8$120.4 million, for an average royalty per ton of $3.65.$3.51. Approximately 86%82% of PVR’s coal royalties revenues in 20082009 were derived from coal mined on PVR’s properties under leases containing royalty rates based on the higher of a fixed base price or a percentage of the gross sales price. The balance of PVR’s coal royalties revenues for the respective periods was derived from coal mined on PVR’s properties under leases containing fixed royalty rates that escalate annually. See “—PVR Contracts— Contracts — PVR Coal and Natural Resource Management Segment” for a description of PVR’s coal leases.
PVR Natural Gas Midstream Segment Overview
PVR’s natural gas midstream segment is engaged in providing natural gas processing, gathering and other related services. As of December 31, 2008,2009, PVR owned and operated natural gas midstream assets located in Oklahoma and Texas, including fivesix natural gas processing facilities having 300400 MMcfd of total capacity and approximately 4,0694,118 miles of natural gas gathering pipelines. PVR’s natural gas midstream business earns revenues primarily from gas processing contracts with natural gas producers and from fees charged for gathering natural gas volumes and providing other related services. In addition, PVR owns a 25% member interest in Thunder Creek Gas Services, LLC, or Thunder Creek, a joint venture that gathers and transports CBM in Wyoming’s Powder River Basin. PVR also owns a natural gas marketing business, which aggregates third-party volumes and sells those volumes into intrastate pipeline systems and at market hubs accessed by various interstate pipelines.
In 2008,2009, system throughput volumes at PVR’s gas processing plants and gathering systems, including gathering-only volumes, were 98.7121.3 Bcf, or approximately 270332 MMcfd.
Eliminations and Other
Eliminations and other primarily represents elimination of intercompany sales, corporate functions and the oil and gas segment derivatives
Business Strategy
We intend to pursue the following business strategies:
| • | | GrowthGrow primarily through development drilling. We anticipate spending up to $250.0$425 million on oil and gas capital expenditures in 2009.2010. We currently plan to allocate up to $237.5$275 million, or approximately 95%65%, of this amount to development drilling and related projects in our core areas of East Texas, the Mid-Continent
|
| Mississippi and Appalachia.Mississippi. We are applying horizontal drilling technology in each of thesethe core areas which may result in increased reserve additions, higher production rates and increased rates of return. Capital spending levels in each of our core areas is expected to be significantly lower in 2009 than 2008.
|
TABLE OF CONTENTS
| • | | UseExploratoryexploratory drilling providesto provide operational balance and future development growth opportunities. We intendanticipate allocating up to apply the remainder$45 million, or approximately 11%, of our 20092010 oil and gas capital expenditures of up to $12.5 million, or approximately 5%, to our exploratory drilling activities, including potentially higher-risk, higher-reward exploratorynew prospects in south Louisiana, as well asthe Granite Wash play in the Mid-Continent and the Marcellus Shale play in Pennsylvania. For many of these exploratory prospects, we collaborate with established industry partners to better manage costsBoth regions have prolific reserve and operational risks. Capital for other exploratory prospects in the Gulf Coast, Mid-Continent and Appalachian regions has been deferred until commodity prices increase and access to the capital markets allows for increased equity or debt financing. production growth potential. |
| • | | Pursue selective leasehold and producing property acquisition opportunities in existing basins.basins. Historically, we have pursued acquisitionsthe majority of properties that we believe have development potentialour growth in proved reserves and that are consistent with our lower-riskproduction has been achieved by drilling strategies.wells, or “through the drillbit.” Our experienced team of management and technical professionals looks for new opportunities to increase reservesextend our leasehold acreage holdings, especially in our core areas and production that complement our existing core properties. As a result of the current deterioration in the global economy, including financial and credit markets, minimal capital expenditures are anticipated as partMarcellus Shale play in Pennsylvania. We anticipate allocating up to $85 million, or approximately 20%, of near-termour 2010 oil and gas capital expenditures. In 2008,expenditures to leasehold acquisitions. While we made approximately $95.5 million of leasehold and otherdo not presently anticipate producing property acquisitions in our 2010 oil and gas acquisitions. capital expenditures, we may consider making these types of acquisitions in our core and target areas as opportunities arise. |
| • | | Manage risk exposure through an active hedging program. We actively manage our exposure to commodity price fluctuations by hedging the commodity price risk for our expected proved developed production through the use of derivatives, typically three-waycostless collar contracts. The level of our hedging activity and the duration of the instruments employed depend upon our cash flow at risk, available hedge prices and our operating strategy. As of December 31, 2008,For 2010, we had hedged approximately 37% and 31% of proved developed production for 2009 and the first quarter of 2010. In February 2009, we increased our hedges and approximately 50% and 30% of our 2009 and 2010 proved developed production is hedged based on fourth quarter 2008 production levels. We have hedged approximately 7%55% of our 2011 proved developed production. |
| • | | Assist PVR in growing its sources of cash flow. PVR’s management continues to focus on acquisitions and other capital expenditures that increase and diversify its sources of long-term cash flow. In 2008, PVR’s coal and natural resource management segment made aggregate capital expenditures of $27.3 million and PVR’s natural gas midstream segment made aggregate capital expenditures of $333.3 million, primarily related acquisitions and expansions. In 2009, PVR’s management anticipates spending up to $72.0 million for capital expenditures, the majority of which will be incurred in the PVR natural gas midstream segment. For a more detailed discussion of PVR’s acquisitions, see Item 7, “Management’s Discussion and Analysis of Financial Condition and Results of Operations—Acquisitions and Divestitures.”
|
| • | | Utilize the advantages of our relationship with PVR. During 2006, PVR began marketing ourestimated natural gas production, in Louisiana, Oklahomaat average floor and Texas, allowing PVRceiling prices of $6.09 and $8.19 per MMBtu, respectively.
|
| • | Manage cash liquidity and balance sheet debt levels. In response to add a new source of revenues. In 2008, PVR constructed the Crossroads plant, an 80 MMcfd gas processing plantdifficult conditions in the Bethany Field in East Texas,financial and entered into a gas gathering and processing agreement with us. The Crossroads plant provides fee-based gas processing services to ourcommodity markets during 2009, we significantly reduced oil and gas businesscapital spending levels from 2008, while taking steps to improve our balance sheet and cash liquidity by raising $65 million of new equity capital and completing a $300 million initial public debt offering. We also improved our cash liquidity position by selling non-core assets during 2009, including the sale of a portion of our holdings in the East Texas region,PVG for net proceeds of $118.1 million, excluding transaction costs, as well as certain oil and gas assets. We expect to continue to use debt financing, supplemented with equity issuances and the sale of other producers.non-core assets potentially including all or part of our interests in PVG, to fund our growth profile while maintaining a conservative capital structure. |
Contracts
Oil and Gas Segment
Transportation. We have entered into contracts which provide firm transportation capacity rights for specified volumes per day on a pipeline system for terms ranging from one to 15 years. The contracts require us to pay transportation demand charges regardless of the amount of pipeline capacity we use. We may sell excess capacity to third parties at our discretion.
Marketing. We generally sell our natural gas using spot market and short-term fixed price physical contracts. For the year ended December 31, 2008,2009, approximately 16%13% and 14%12% of our oil and gas segment revenues and 6%4% and 5%3% of our total consolidated revenues resulted from two of our oil and gas customers, Dominion Field Services, IncInc. and Crosstex Energy Services, L.P.Chesapeake Operating, Inc.
PVR Coal and Natural Resource Management Segment
PVR earns most of its coal royalties revenues under long-term leases that generally require its lessees to make royalty payments to it based on the higher of a percentage of the gross sales price or a fixed price per ton of coal they sell. The balance of PVR’s coal royalties revenues is earned under long-term leases that require the lessees to make royalty payments to PVR based on fixed royalty rates that escalate annually. A typical lease either expires upon exhaustion of the leased reserves or has a five to ten-year base term, with the lessee having an option to extend the lease for at least five years after the expiration of the base term. Substantially all of PVR’s leases require the lessee to pay minimum rental payments to PVR in monthly or annual installments, even if no mining activities are ongoing. These minimum rentals are recoupable, usually over a period from one to three years from the time of payment, against the production royalties owed to PVR once coal production commences.
TABLE OF CONTENTS
Substantially all of PVR’s leases impose obligations on the lessees to diligently mine the leased coal using modern mining techniques, indemnify PVR for any damages it incurs in connection with the lessee’s mining operations, including any damages PVR may incur due to the lessee’s failure to fulfill reclamation or other environmental obligations, conduct mining operations in compliance with all applicable laws, obtain its written consent prior to assigning the lease and maintain commercially reasonable amounts of general liability and other insurance. Substantially all of the leases grant PVR the right to review all lessee mining plans and maps, enter the leased premises to examine mine workings and conduct audits of lessees’ compliance with lease terms. In the event of a default by a lessee, substantially all of the leases give PVR the right to terminate the lease and take possession of the leased premises.
In addition, PVR earns revenues under coal services contracts, timber contracts and oil and gas leases. PVR’s coal services contracts generally provide that the users of PVR’s coal services pay PVR a fixed fee per ton of coal processed at its facilities. All of PVR’s coal services contracts are with lessees of PVR’s coal reserves and these contracts generally have terms that run concurrently with the related coal lease. PVR’s timber contracts generally provide that the timber companies pay PVR a fixed price per thousand board feet of timber harvested from PVR’s property. PVR receives royalties under its oil and gas leases based on a percentage of the revenues the producers receive for the oil and gas they sell.
PVR Natural Gas Midstream Segment
PVR’s natural gas midstream business generates revenues primarily from gas purchase and processing contracts with natural gas producers and from fees charged for gathering natural gas volumes and providing other related services. During the year ended December 31, 2008,2009, PVR’s natural gas midstream business generated a majority of its gross margin from two types of contractual arrangements under which its margin is exposed to increases and decreases in the price of natural gas and NGLs: (i) gas purchase/keep-whole and (ii) percentage-of-proceeds. AsFor the fourth quarter of December 31, 2008,2009, approximately 27%28% of PVR’s system throughput volumes were gathered or processed under gas purchase/keep-whole contracts, 45%53% were gathered or processed under percentage-of-proceeds contracts and 28%19% were gathered or processed under fee-based gathering contracts. A majority of the gas purchase/keep-whole and percentage-of-proceeds contracts include fee-based components such as gathering and compression charges. There is also a processing fee floor included in many
In 2009, 21% of the gas purchase/keep-whole contracts that ensures a minimum processing margin should the actual margins fall below the floor.
In 2008, 27% and 13% of PVR’sPVR natural gas midstream segmentsegment’s revenues and 16% and 8%13% of our total consolidated revenues resulted from twoone of PVR’s natural gas midstream customers, Conoco, Inc. and Louis Dreyfus Energy Services.
Gas Purchase/Keep-Whole Arrangements. Under gas purchase/keep-whole arrangements, PVR generally purchases natural gas at the wellhead at either (i) a percentage discount to a specified index price, (ii) a specified index price less a fixed amount or (iii) a combination of (i) and (ii). PVR then gathers the natural gas to one of its plants where it is processed to extract the entrained NGLs, which are then sold to third parties at market prices. PVR resells the remaining natural gas to third parties at an index price which typically corresponds to the specified purchase index. Because the extraction of the NGLs from the natural gas during processing reduces the BTU content of the natural gas, PVR retains a reduced volume of gas to sell after processing. Accordingly, under these arrangements, PVR’s revenues and gross margins increase as the price of NGLs increases relative to the price of natural gas, and its revenues and gross margins decrease as the price of natural gas increases relative to the price of NGLs. PVR has generally been able to mitigate its exposure in the latter case by requiring the payment under many of its gas purchase/keep-whole arrangements of minimum processing charges which ensure that PVR receives a minimum amount of processing revenues. The gross margins that PVR realizes under the arrangements described in clauses (i) and (iii) above also decrease in periods of low natural gas prices because these gross margins are based on a percentage of the index price.
Percentage-of-Proceeds Arrangements. Under percentage-of-proceeds arrangements, PVR generally gathers and processes natural gas on behalf of producers, sells the resulting residue gas and NGL volumes at market prices and remits to producers an agreed-upon percentage of the proceeds of those sales based on either an index price or the price actually received for the gas and NGLs. Under these types of arrangements, PVR’s revenues and gross margins increase as natural gas prices and NGL prices increase, and its revenues and gross margins decrease as natural gas prices and NGL prices decrease.
TABLE OF CONTENTS
Fee-Based Arrangements. Under fee-based arrangements, PVR receives fees for gathering, compressing and/or processing natural gas. The revenues PVR earns from these arrangements are directly dependent on the volume of natural gas that flows through its systems and are independent of commodity prices. To the extent a sustained decline in commodity prices results in a decline in volumes, however, PVR’s revenues from these arrangements would be reduced due to the related reduction in drilling and development of new supply.
In many cases, PVR provides services under contracts that contain a combination of more than one of the arrangements described above. The terms of PVR’s contracts vary based on gas quality conditions, the competitive environment at the time the contracts were signed and customer requirements. The contract mix and, accordingly, exposure to natural gas and NGL prices, may change as a result of changes in producer preferences, expansion in regions where some types of contracts are more common and other market factors.
Natural Gas Marketing Contracts. PVR is also engaged in natural gas marketing by aggregating third-party volumes and selling those volumes into interstate and intrastate pipeline systems such as Enogex and ONEOKPanhandle Eastern Pipeline and at market hubs accessed by various interstate pipelines. Connect Energy Services, LLC, or Connect Energy, PVR’s wholly owned subsidiary, has earned fees from Penn Virginia Oil & Gas, L.P., or PVOG LP, our wholly owned subsidiary, since September 1, 2006, for marketing a portion of PVOG LP’s natural gas production. Revenues from this business do not generate qualifying income for a publicly traded limited partnership, but PVR does not expect it to have an impact on its tax status, as it does not represent a significant percentage of PVR’s operating income. For the years ended December 31, 20082009 and 2007,2008, PVR’s natural gas marketing activities generated $5.8$1.8 million and $4.6$5.8 million in net revenues. Fees paid to the PVR natural gas midstream segment by our oil and gas segment are eliminated in consolidation.
Commodity Derivative Contracts
Oil and Gas Segment Commodity Derivatives.Derivatives. We utilize three-way collar derivative contracts to hedge against the variability in cash flows associated with anticipated sales of our future oil and gas production. While the use of derivative instruments limits the risk of adverse price movements, such use may also limit future revenues from favorable price movements.
A three-way collar contract consists of a collar contract plus a put option contract sold by us with a price below the floor price of the collar. The counterparty to a collar contract is required to make a payment to us if the settlement price for any settlement period is below the floor price for such contract. We are required to make a payment to the counterparty if the settlement price for any settlement period is above the ceiling price for such contract. Neither party is required to make a payment to the other party if the settlement price for any settlement period is equal to or greater than the floor price and equal to or less than the ceiling price for such contract.
The additional put option sold by us requires us to make a payment to the counterparty if the settlement price for any settlement period is below the put option price. By combining the collar contract with the additional put option, we are entitled to a net payment equal to the difference between the floor price of the collar contract and the additional put option price if the settlement price is equal to or less than the additional put option price. If the settlement price is greater than the additional put option price, the result is the same as it would have been with a collar contract only. If market prices are below the additional put option, we would be entitled to receive the market price plus the difference between the additional put option and the floor. See the oil and gas segment commodity derivative table in Item 7A, –“Quantitative“Quantitative and Qualitative Disclosures About Market Risk –— Price Risk.” This strategy enables us to increase the floor and the ceiling prices of the collar beyond the range of a traditional collar contract while defraying the associated cost with the sale of the additional put option.
We determine the fair values of our oil and gas derivative agreements based on discounted cash flows derived from third-party quoted forward prices for NYMEX Henry Hub gas and West Texas Intermediate crude oil closing prices as of December 31, 2008.2009. The discounted cash flows utilize discount rates adjusted for the credit risk of our counterparties for derivativesif the derivative is in an asset position and our own credit risk derivativesif the derivative is in a liability position, in accordance with Statement of Financial Accounting Standards, or SFAS, No. 157.position.
PVR Natural Gas Midstream Segment Commodity Derivatives.Derivatives. PVR utilizes three-way collar derivative contracts to hedge against the variability in cash flows associated with anticipated natural gas midstream revenues and cost of midstream
gas purchased. PVR also utilizes collar derivative contracts to hedge against the variability in its frac spread. PVR’s frac spread is the spread between the purchase price for the natural gas PVR purchases from producers and the sale price for NGLs that PVR sells after processing. PVR hedges against the variability in its frac spread by entering into costless collar and swap
TABLE OF CONTENTS
derivative contracts to sell NGLs forward at a predetermined commodity price and to purchase an equivalent volume of natural gas forward on an MMBtu basis. While the use of derivative instruments limits the risk of adverse price movements, such use may also limit future revenues or cost savings from favorable price movements.
A three-way collar contract consists of a collar contract plus a put option contract sold by PVR with a price below the floor price of the collar. The counterparty to a collar contract is required to make a payment to PVR if the settlement price for any settlement period is below the floor price for such contract. PVR is required to make a payment to the counterparty if the settlement price for any settlement period is above the ceiling price for such contract. Neither party is required to make a payment to the other party if the settlement price for any settlement period is equal to or greater than the floor price and equal to or less than the ceiling price for such contract.
The additional put option sold by PVR requires it to make a payment to the counterparty if the settlement price for any settlement period is below the put option price. By combining the collar contract with the additional put option, PVR is entitled to a net payment equal to the difference between the floor price of the collar contract and the additional put option price if the settlement price is equal to or less than the additional put option price. If the settlement price is greater than the additional put option price, the result is the same as it would have been with a collar contract only. If market prices are below the additional put option, PVR would be entitled to receive the market price plus the difference between the additional put option and the floor. See the PVR natural gas midstream segment commodity derivative table in Item 7A –“Quantitative and Qualitative Disclosures About Market Risk – Price Risk.” This strategy enables PVR to increase the floor and the ceiling prices of the collar beyond the range of a traditional collar contract while defraying the associated cost with the sale of the additional put option.
See Note 8 – “Derivative Instruments” into the Notes to Consolidated Financial Statements in Item 8, “Financial Statements and Supplementary Data,” for a further description of our and PVR’s derivatives programs.
Corporate Structure
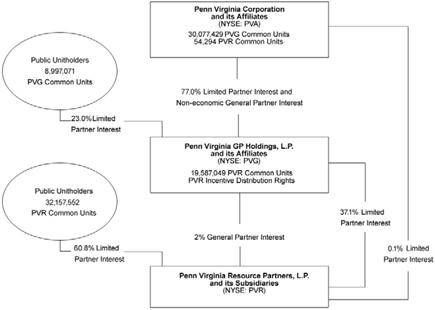
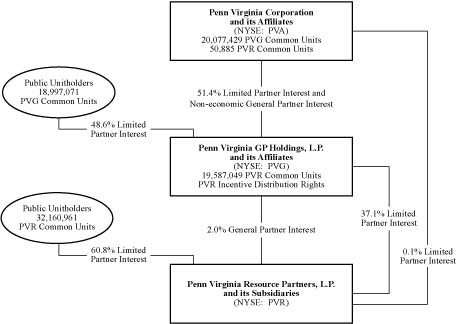
We are a Virginia corporation formed in 1882. As of December 31, 2008,2009, we owned the general partner of PVG and an approximately 77%51.4% limited partner interest in PVG. PVG owns an approximately 37% limited partner interest in PVR and the general partner of PVR, which holds a 2% general partner interest in PVR and all of the incentive distribution rights, or IDRs. We directly owned an additional 0.1% limited partner interest in PVR as of December 31, 2008.2009. The following diagram depicts our ownership of PVG and PVR as of December 31, 2008:2009:
Because PVG controls the general partner of PVR, the financial results of PVR are included in PVG’s consolidated financial statements. Because we control the general partner of PVG, the financial results of PVG are included in our consolidated financial statements. However, PVG and PVR function with capital structures that are independent of each
other and us, with each having publicly traded common units and PVR having its own debt instruments. PVG does not currently have any debt instruments. While we report consolidated financial results of PVR’s coal and natural resource management and natural gas midstream businesses, the only cash we receive from those businesses is in the form of cash distributions we receive from PVG and PVR in respect of our partner interests in each of them.
PVG and PVR Distributions
PVG Cash Distributions
PVG paid cash distributions of $1.40$1.52 per common unit during the year ended December 31, 2008.2009. In the first quarter of 2009,2010, PVG paid a cash distribution of $0.38 ($1.52 on an annualized basis) per common unit with respect to the fourth quarter of 2008.2009. This distribution was unchanged from the previous distribution paid on November 19, 2008.18, 2009. For the remainder of 2009,2010, PVG expects to pay quarterly cash distributions of at least $0.38 ($1.52 on an annualized basis) per common unit.
TABLE OF CONTENTS
PVR Cash Distributions
PVR paid cash distributions of $1.82$1.88 per common unit during the year ended December 31, 2008.2009. In the first quarter of 2009,2010, PVR paid a cash distribution of $0.47 ($1.88 on an annualized basis) per common unit with respect to the fourth quarter of 2008.2009. This distribution was unchanged from the previous distribution paid on November 14, 2008.13, 2009. For the remainder of 2009,2010, PVR expects to pay quarterly cash distributions of at least $0.47 ($1.88 on an annualized basis) per common unit.
PVR IDRs
In accordance with PVR’s partnership agreement, IDRs represent the right to receive an increasing percentage of quarterly distributions of PVR’s available cash from operating surplus after the minimum quarterly distribution and the target distribution levels have been achieved. The minimum quarterly distribution is $0.25 ($1.00 on an annualized basis) per unit. PVR’s general partner currently holds 100% of the IDRs, but may transfer these rights separately from its general partner interest to an affiliate (other than an individual) or to another entity as part of the merger or consolidation of PVR’s general partner with or into such entity or the transfer of all or substantially all of PVR’s general partner’s assets to another entity without the prior approval of PVR’s unitholders if the transferee agrees to be bound by the provisions of PVR’s partnership agreement. Prior to September 30, 2011, other transfers of the IDRs will require the affirmative vote of holders of a majority of the outstanding PVR common units. On or after September 30, 2011, the IDRs will be freely transferable. The IDRs are payable as follows:
If for any quarter:
PVR has distributed available cash from operating surplus to its common unitholders in an amount equal to the minimum quarterly distribution; and
PVR has distributed available cash from operating surplus on outstanding common units in an amount necessary to eliminate any cumulative arrearages in payment of the minimum quarterly distribution;
then, PVR will distribute any additional available cash from operating surplus for that quarter among the unitholders and its general partner in the following manner:
First, 98% to all unitholders, and 2% to PVR’s general partner, until each unitholder has received a total of $0.275 per unit for that quarter;
Second, 85% to all unitholders, and 15% to PVR’s general partner, until each unitholder has received a total of $0.325 per unit for that quarter;
Third, 75% to all unitholders, and 25% to PVR’s general partner, until each unitholder has received a total of $0.375 per unit for that quarter; and
Thereafter, 50% to all unitholders and 50% to PVR’s general partner.
Since 2001, PVR has increased its quarterly cash distribution from $0.25 ($1.00 on an annualized basis) per unit to $0.47 ($1.88 on an annualized basis) per unit, which is its most recently declared distribution. These increased cash distributions
by PVR have placed PVG, as the owner of PVR’s general partner, at the maximum target cash distribution level as described above and, as a consequence, since reaching such level, PVG, as the owner of PVR’s general partner, has received 50% of available cash in excess of $0.375 per unit.
TABLE OF CONTENTS
Cash Distributions Received
In conjunction with the initial public offering of PVG, we contributed our general partner interest, IDRs and most of our limited partner interest in PVR to PVG in exchange for the general partner interest and limited partner interests in PVG. We are currently entitled to receive quarterly cash distributions from PVG and PVR on our limited partner interests in PVG and PVR. As a result of our partner interests in PVG and PVR, we received the following total cash distributions for the periods presented. The reduction in cash distributions we received from 2008 to 2009 was the result of $44.0 million and $29.8 million fromour sale of a portion of our interest in PVG and PVR in the years ended December 31, 2008 and 2007 as shown in the following table:during 2009.
| | | | | | |
| | | Year Ended December 31, |
| | | 2008 | | 2007 |
| | | (in thousands) |
Penn Virginia GP Holdings, L.P. | | $ | 43,435 | | $ | 29,200 |
Penn Virginia Resource Partners, L.P. (1) | | | 583 | | | 640 |
| | | | | | |
Total | | $ | 44,018 | | $ | 29,840 |
| | | | | | |
| | | | | | |
| | Year Ended December 31, |
| | | 2009 | | 2008 | | 2007 |
| Penn Virginia GP Holdings, L.P. | | $ | 41,916 | | | $ | 43,435 | | | $ | 29,200 | |
| Penn Virginia Resource Partners, L.P.(1) | | | 363 | | | | 583 | | | | 640 | |
| | | $ | 42,279 | | | $ | 44,018 | | | $ | 29,840 | |

| (1) | Includes PVR distributions for restricted units held by employees and directors. |
We have historically received, on an annual basis, increasing distributions from our partner interests in PVG and PVR. Based on PVG’s and PVR’s current annualized distribution rates of $1.52 and $1.88 per unit, we would expect to receive aggregate annualized distributions of approximately $46.3 million in respect of our partner interests in the year ended December 31, 2009.
Prior to PVG’s initial public offering in December 2006, we indirectly owned common units representing an approximately 37% limited partner interest in PVR, as well as the sole 2% general partner interest and all of the IDRs in PVR. We received total distributions from PVR of $28.6 million in the year ended December 31, 2006, allocated among our limited partner interest, general partner interest and IDRs as shown in the following table:
| | | |
| | | Year Ended
December 31, 2006 |
| | | (in thousands) |
Limited partner interest | | $ | 23,039 |
General partner interest (2%) | | | 1,254 |
IDRs | | | 4,273 |
| | | |
Total | | $ | 28,566 |
| | | |
Competition
Oil and Gas Segment
The oil and natural gas industry is very competitive, and we compete with a substantial number of other companies that are large, well-established and have greater financial and operational resources than we do, which may adversely affect our ability to compete or grow our business. Many such companies not only engage in the acquisition, exploration, development and production of oil and natural gas reserves, but also carry on refining operations, electricity generation and the marketing of refined products. Competition is particularly intense in the acquisition of prospective oil and natural gas properties and oil and gas reserves. Our competitive position depends on our geological, geophysical and engineering expertise, our financial resources, our ability to develop properties and our ability to select, acquire and develop proved reserves. We compete with other oil and natural gas companies to secure drilling rigs and other equipment necessary for the drilling and completion of wells and recruiting and retaining qualified personnel, including geologists, geo-physicists, engineers and other specialists. Such equipment and labor may be in short supply from time to time. Shortages of equipment, labor or materials may result in increased costs or the inability to obtain such resources as needed. We also compete with majorsubstantially larger and independent oil and gas companies in the marketing and sale of oil and natural gas, and the oil and natural gas industry in general competes with other industries supplying energy and fuel to industrial, commercial and individual consumers.
PVR Coal and Natural Resource Management Segment
The coal industry is intensely competitive primarily as a result of the existence of numerous producers. PVR’s lessees compete with both large and small coal producers in various regions of the United States for domestic sales. The industry has undergone significant consolidation which has led to some of the competitors of PVR’s lessees having significantly larger financial and operating resources than most of PVR’s lessees. PVR’s lessees compete on the basis of coal price at the mine, coal quality (including sulfur content), transportation cost from the mine to the customer and the reliability of supply. Continued demand for PVR’s coal and the prices that PVR’s lessees obtain are also affected by demand for electricity, demand for metallurgical coal, access to transportation, environmental and government regulations, technological developments and the availability and price of alternative fuel supplies, including nuclear, natural gas, oil and hydroelectric power. Demand for PVR’s low sulfur coal and the prices PVR’s lessees will be able to obtain for it will also be affected by the price and availability of high sulfur coal, which can be marketed in tandem with emissions allowances which permit the high sulfur coal to meet federal Clean Air Act, or CAA, requirements.
PVR Natural Gas Midstream Segment
PVR experiences competition in all of its natural gas midstream markets. PVR’s competitors include major integrated oil companies, interstate and intrastate pipelines and companies that gather, compress, process, transport and market natural gas. Many of PVR’s competitors have greater financial resources and access to larger natural gas supplies than PVR does.
TABLE OF CONTENTS
The ability to offer natural gas producers competitive gathering and processing arrangements and subsequent reliable service is fundamental to obtaining and keeping gas supplies for PVR’s gathering systems. The primary concerns of the producer are:
the pressure maintained on the system at the point of receipt;
the relative volumes of gas consumed as fuel and lost;
the gathering/processing fees charged;
the timeliness of well connects;
the customer service orientation of the gatherer/processor; and
the reliability of the field services provided.
Government Regulation and Environmental Matters
The operations of our oil and gas business and PVR’s coal and natural resource management business and PVR’s natural gas midstream businessbusinesses are subject to environmental laws and regulations adopted by various governmental authorities in the jurisdictions in which these operations are conducted.conducted.
Oil and Gas Segment
State Regulatory Matters. Various aspects of our oil and natural gas operations are regulated by administrative agencies under statutory provisions of the states where such operations are conducted. All of the jurisdictions in which we own or operate producing crude oil and natural gas properties have statutory provisions regulating the exploration for and production of crude oil and natural gas. These provisions include permitting regulations regarding the drilling of wells, maintaining bonding requirements to drill or operate wells, locating wells, the method of drilling and casing wells, the surface use and restoration of properties upon which wells are drilled and the plugging and abandoning of wells. Our operations are also subject to various conservation laws and regulations. These include the regulation of the size of drilling and spacing units or proration units, the number of wells that may be drilled in an area and the unitization or pooling of crude oil and natural gas properties. In addition, state conservation laws establish maximum rates of production from crude oil and natural gas wells, generally prohibit the venting or flaring of natural gas and impose certain requirements regarding the ratability or fair apportionment of production from fields and individual wells. The effect of these regulations is to limit the amounts of crude oil and natural gas we can produce from our wells and to limit the number of wells or the locations at which we can drill.
Federal Energy Regulatory Commission. The Federal Energy Regulatory Commission, or the FERC, regulates the transportation and sale for resale of natural gas in interstate commerce under the Natural Gas Act of 1938, or the NGA, and the Natural Gas Policy Act of 1978, or the NGPA. In the past, the federal government has regulated the prices at which oil
and gas could be sold. The Natural Gas Wellhead Decontrol Act of 1989 removed all NGA and NGPA price and nonprice controls affecting producers’ wellhead sales of natural gas effective January 1, 1993. While sales by producers of their own natural gas production and all sales of crude oil, condensate and NGLs can currently be made at market prices, Congress could reenact price controls in the future.
Commencing in April 1992, the FERC issued Order Nos. 636, 636-A, 636-B and 636-C, or Order No. 636, which require interstate pipelines to provide transportation separate, or “unbundled,” from the pipelines’ sale of gas. Also, Order No. 636 requires pipelines to provide open-access transportation on a basis that is equal for all gas supplies. Although Order No. 636 does not directly regulate gas producers like us, the FERC has stated that it intends for Order No. 636 to foster increased competition within all phases of the natural gas industry. The courts have largely affirmed the significant features of Order No. 636 and numerous related orders pertaining to the individual pipelines, although certain appeals remain pending and the FERC continues to review and modify its open access regulations. In particular, the FERC has issued Order Nos. 637, 637-A and 637-B which, among other things, (i) permit pipelines to charge different maximum cost-based rates for peak and off-peak periods, (ii) encourage auctions for pipeline capacity, (iii) require pipelines to implement imbalance management services and (iv) restrict the ability of pipelines to impose penalties for imbalances, overruns and non-compliance with operational flow orders.
TABLE OF CONTENTS
The Energy Policy Act of 2005 amended the NGA and the NGPA and gave the FERC the authority to assess civil penalties of up to $1 million per day per violation for violations of rules, regulations and orders issued under these acts. In addition, the FERC has issued regulations that make it unlawful for any entity in connection with the purchase or sale of natural gas or the purchase or sale of transportation services subject to the jurisdiction of the FERC to use any manipulative or deceptive device or contrivance.
While any additional FERC action on these matters would affect us only indirectly, these changes are intended to further enhance competition in, and prevent manipulation of, natural gas markets. We cannot predict what further action the FERC will take on these matters, nor can we predict whether the FERC’s actions will achieve its stated goal of increasing competition in, and preventing manipulation of, natural gas markets. However, we do not believe that we will be treated materially differently than other natural gas producers with which we compete.
Environmental Matters. Extensive federal, state and local laws govern oil and natural gas operations, regulate the discharge of materials into the environment or otherwise relate to the protection of the environment. Numerous governmental departments issue rules and regulations to implement and enforce such laws that are often difficult and costly to comply with and which carry substantial administrative, civil and even criminal penalties for failure to comply. Some laws, rules and regulations relating to protection of the environment may, in certain circumstances, impose “strict liability” for environmental contamination, rendering a person liable for environmental and natural resource damages and cleanup costs without regard to negligence or fault on the part of such person. Other laws, rules and regulations may restrict the rate of oil and natural gas production below the rate that would otherwise exist or even prohibit exploration or production activities in sensitive areas. In addition, state laws often require some form of remedial action to prevent pollution from former operations, such as closure of inactive pits and plugging of abandoned wells. The regulatory burden on the oil and natural gas industry increases its cost of doing business and consequently affects its profitability. These laws, rules and regulations affect our operations, as well as the oil and gas exploration and production industry in general. We believe that we are in substantial compliance with current applicable environmental laws, rules and regulations and that continued compliance with existing requirements will not have a material adverse impact on us. Nevertheless, changes in existing environmental laws or the adoption of new environmental laws have the potential to adversely affect our operations.
As part of the 2008 Consolidated Appropriations Act, the EPA was required to issue a rule requiring mandatory reporting of greenhouse gas emissions above certain thresholds from all sectors of the U.S. economy. The proposed rule included greenhouse gas reporting requirements for oil and natural gas systems (“Subpart W”), including production and distribution facilities, but the EPA received extensive comments to Subpart W relating to the reporting of fugitive and vented emissions from the oil and gas sector. As a result, Subpart W was not included in the final rule. While the EPA may re-issue a proposed rule regarding the reporting of greenhouse gas emissions from oil and natural gas systems, we do not believe that any such future requirement will have a material adverse affect on our business, financial position or results of operations.
OSHA. We are subject to the requirements of the Occupational Safety and Health Act, or OSHA, and comparable state laws that regulate the protection of the health and safety of workers. In addition, the OSHA hazard communication standard requires that information be maintained about hazardous materials used or produced in our operations and that this information be provided to employees, state and local government authorities and citizens.
PVR Coal and Natural Resource Management Segment
General Regulation Applicable to Coal Lessees. PVR’s lessees are obligated to conduct mining operations in compliance with all applicable federal, state and local laws and regulations. These laws and regulations include matters involving the discharge of materials into the environment, employee health and safety, mine permits and other licensing requirements, reclamation and restoration of mining properties after mining is completed, management of materials generated by mining operations, surface subsidence from underground mining, water pollution, legislatively mandated benefits for current and retired coal miners, air quality standards, protection of wetlands, plant and wildlife protection, limitations on land use, storage of petroleum products and substances which are regarded as hazardous under applicable laws and management of
TABLE OF CONTENTS
of electrical equipment containing polychlorinated biphenyls, or PCBs. These extensive and comprehensive regulatory requirements are closely enforced, PVR’s lessees regularly have on-site inspections and violations during mining operations are not unusual in the industry, notwithstanding compliance efforts by PVR’s lessees. However, none of the violations to date, or the monetary penalties assessed, have been material to us, PVR or, to our knowledge, to PVR’s lessees. Although many new safety requirements have been instituted recently, PVR does not currently expect that future compliance will have a material adverse effect on PVR.
While it is not possible to quantify the costs of compliance by PVR’s lessees with all applicable federal, state and local laws and regulations, those costs have been and are expected to continue to be significant. The lessees post performance bonds pursuant to federal and state mining laws and regulations for the estimated costs of reclamation and mine closing, including the cost of treating mine water discharge when necessary. We do not accrue for such costs because PVR’s lessees are contractually liable for all costs relating to their mining operations, including the costs of reclamation and mine closure. However, PVR does require some smaller lessees to deposit into escrow certain funds for reclamation and mine closure costs or post performance bonds for these costs. Although we believe that the lessees typically accrue adequate amounts for these costs, their future operating results would be adversely affected if they later determined these accruals to be insufficient. Compliance with these laws and regulations has substantially increased the cost of coal mining for all domestic coal producers.
In addition, the utility industry, which is the most significant end-user of coal, is subject to extensive regulation regarding the environmental impact of its power generation activities which could affect demand for coal mined by PVR’s lessees. The possibility exists that new legislation or regulations may be adopted which have a significant impact on the mining operations of PVR’s lessees or their customers’ ability to use coal and may require PVR, its lessees or their customers to change operations significantly or incur substantial costs.
Air Emissions. The CAA and corresponding state and local laws and regulations affect all aspects of PVR’s business, both directly and indirectly. The CAA directly impacts PVR’s lessees’ coal mining and processing operations by imposing permitting requirements and, in some cases, requirements to install certain emissions control equipment, on sources that emit various hazardous and non-hazardous air pollutants. The CAA also indirectly affects coal mining operations by extensively regulating the air emissions of coal-fired electric power generating plants. There have been a series of recent federal rulemakings that are focused on emissions from coal-fired electric generating facilities. Installation of additional emissions control technology and additional measures required under Environmental Protection Agency, or EPA, laws and regulations will make it more costly to build and operate coal-fired power plants and, depending on the requirements of individual state implementation plans, could make coal a less attractive fuel alternative in the planning and building of power plants in the future. Any reduction in coal’s share of power generating capacity could negatively impact PVR’s lessees’ ability to sell coal, which could have a material effect on PVR’s coal royalties revenues.
The EPA’s Acid Rain Program, provided in Title IV of the CAA, regulates emissions of sulfur dioxide from electric generating facilities. Sulfur dioxide is a by-product of coal combustion. Affected facilities purchase or are otherwise allocated sulfur dioxide emissions allowances, which must be surrendered annually in an amount equal to a facility’s sulfur dioxide emissions in that year. Affected facilities may sell or trade excess allowances to other facilities that require additional allowances to offset their sulfur dioxide emissions. In addition to purchasing or trading for additional sulfur dioxide allowances, affected power facilities can satisfy the requirements of the EPA’s Acid Rain Program by switching to lower sulfur fuels, installing pollution control devices such as flue gas desulfurization systems, or “scrubbers,” or by reducing electricity generating levels.
The EPA has promulgated rules, referred to as the “NOx SIP Call,” that require coal-fired power plants and other large stationary sources in 21 eastern states and Washington D.C. to make substantial reductions in nitrogen oxide emissions in an effort to reduce the impacts of ozone transport between states. Additionally, in March 2005, the EPA issued the final Clean Air Interstate Rule, or CAIR, which would have permanently capped nitrogen oxide and sulfur dioxide emissions in 28 eastern states and Washington, D.C. beginning in 2009 and 2010. CAIR required those states to achieve the required emission reductions by requiring power plants to either participate in an EPA-administered “cap-and-trade” program that caps emission in two phases,
TABLE OF CONTENTS
or by meeting an individual state emissions budget through measures established by the state. The stringency of the caps under CAIR may have required many coal-fired sources to install additional pollution control equipment, such as wet scrubbers, to comply. This increased sulfur emission removal capability required by CAIR could have resulted in decreased demand for lower sulfur coal, which may have potentially driven down prices for lower sulfur coal. On July 11, 2008, the D.C. Circuit Court of Appeals vacated CAIR in its entirety. The EPA subsequently filed a petition for rehearing or, in the alternative, for a remand of the case without vacatur. On December 23, 2008, the Court issued an opinion to remand without vacating CAIR. Therefore, CAIR will remain in effect while the EPA conducts rulemaking to modify CAIR to comply with the Court’s July 2008 opinion. The Court declined to impose a schedule by
which the EPA must complete the rulemaking, but reminded the EPA that the Court does “.not intend to grant an indefinite stay of the effectiveness of this Court’s decision.” The EPA is considering its options on how to proceed.
In March 2005, the EPA finalized the Clean Air Mercury Rule, or CAMR, which was to establish a two-part, nationwide cap on mercury emissions from coal-fired power plants beginning in 2010. It was the subject of extensive controversy and litigation and, in February 2008, the U.S. Circuit Court of Appeals for the District of Columbia vacated CAMR. The EPA appealed the decision to the U.S. Supreme Court in October 2008, but withdrew its petition for certiorari on February 6, 2009. However, a utility group continues to seek certiorari, challenging the court of appeals decision to overturn CAMR. In the meantime, the EPA plans to develop standards consistent with the court of appeal’s ruling.ruling, intending to propose air toxics standards for coal- and oil-fired electric generating units by March 10, 2011, and finalize a rule by November 16, 2011. In conjunction with these efforts, on December 24, 2009, the EPA approved an Information Collection Request (ICR) requiring all U.S. power plants with coal-or oil-fired electric generating units to submit emissions information for use in developing air toxics emissions standards. In addition, various states have promulgated or are considering more stringent emission limits on mercury emissions from coal-fired electric generating units.
The EPA has adopted new, more stringent national air quality standards for ozone and fine particulate matter. As a result, some states will be required to amend their existing state implementation plans to attain and maintain compliance with the new air quality standards. In March 2007, the EPA published final rules addressing how states would implement plans to bring regions designated as non-attainment for fine particulate matter into compliance with the new air quality standard. Under the EPA’s final rule, states had until April 2008 to submit their implementation plans to the EPA for approval. Because coal mining operations and coal-fired electric generating facilities emit particulate matter, PVR’s lessees’ mining operations and their customers could be affected when the new standards are implemented by the applicable states.
Likewise, the EPA’s regional haze program to improve visibility in national parks and wilderness areas required affected states to develop implementation plans by December 2007 that, among other things, identify facilities that will have to reduce emissions and comply with stricter emission limitations. This program may restrict construction of new coal-fired power plants where emissions are projected to reduce visibility in protected areas. In addition, this program may require certain existing coal-fired power plants to install emissions control equipment to reduce haze-causing emissions such as sulfur dioxide, nitrogen oxide and particulate matter.
The U.S. Department of Justice, on behalf of the EPA, has filed lawsuits against a number of coal-fired electric generating facilities alleging violations of the new source review provisions of the CAA. The EPA has alleged that certain modifications have been made to these facilities without first obtaining permits required under the new source review program. Several of these lawsuits have settled, but others remain pending. On April 2, 2007, the U.S. Supreme Court ruled in one such case,Environmental Defense v. Duke Energy Corp. The Court held that the EPA is not required to use an “hourly rate test” in determining whether a modification to a coal burning utility requires a permit under the new source review program, thus allowing the EPA to apply a test based on average annual emissions. The use of an annual emissions test could subject more coal-fired utility modification projects to the permitting requirements of the CAA New Source Review Program, such as those that allow plants to run for more hours in a given year. However, Duke is expected to continue to contest remaining issues in the case, and so litigation in this and other pending cases will likely continue. Depending on the ultimate resolution of these cases, demand for PVR’s coal could be affected, which could have an adverse effect on PVR’s coal royalties revenues.
TABLE OF CONTENTS
Carbon Dioxide Emissions. The Kyoto Protocol to the United Nations Framework Convention on Climate Change calls for developed nations to reduce their emissions of greenhouse gases to 5% below 1990 levels by 2012. Carbon dioxide, which is a major byproduct of the combustion of coal and other fossil fuels, is subject to the Kyoto Protocol. The Kyoto Protocol went into effect on February 16, 2005 for those nations that ratified the treaty. In 2002, the United States withdrew its support for the Kyoto Protocol, and the United States is not participating in this treaty. Since the Kyoto Protocol became effective, there has been increasing international pressure on the United States to adopt mandatory restrictions on carbon dioxide emissions. In addition, on April 2, 2007 the U.S. Supreme Court held inMassachusetts v. EPA that unless the EPA affirmatively concludes that greenhouse gases are not causing climate change, the EPA must regulate greenhouse gas emissions from new automobiles under the CAA. The Court remanded the matter to the EPA for further consideration. This litigation did not directly concern the EPA’s authority to regulate greenhouse gas emissions from stationary sources, such as coal mining operations or coal-fired power plants. However, the Court’s decision is likely to influence another lawsuit currently pending in the U.S. Court of Appeals for the District of Columbia Circuit, involving a challenge to the EPA’s decision not to regulate carbon dioxide from power plants and other stationary sources under a CAA new source performance standard rule, which specifies emissions limits for new facilities. The court remanded that question to the EPA for further consideration in light of the ruling inMassachusetts v. EPA. On July 11, 2008, the EPA released an advanced notice of proposed rulemaking to regulate greenhouse gases under the CAA in response to the ruling inMassachusetts v. EPA. The notice did not contain a definitive proposal of what a greenhouse gas regulatory program would look like, but it presented the EPA’s analyses and policy alternatives for consideration. The EPA stated that promulgating a program under the CAA would take years to issue. In 2009, EPA took further steps toward greenhouse gas regulation under the CAA, issuing a final rule declaring that six greenhouse gases, including carbon dioxide and methane, “endanger both the public health and the public welfare of current and future generations.” The issuance of this “endangerment finding” allows the EPA to begin regulating greenhouse gas emissions under existing provisions of CAA. In late September and early October of 2009, in anticipation of the issuance of the endangerment finding, the EPA officially proposed two sets of rules regarding possible future regulation of greenhouse gas emissions under the CAA, one that would regulate greenhouse gas emissions from motor vehicles and the other greenhouse gas emissions from large stationary sources such as power plants or industrial facilities. Any decision in this case or any regulatory action by the EPA limiting greenhouse gas emissions
from power plants could impact the demand for PVR’s coal, which could have an adverse effect on PVR’s coal royalties revenues.
The permitting of a number of proposed new coal-fired power plants has also recently been contested by environmental organizations for concerns related to greenhouse gas emissions from new plants. For instance, in October 2007, state regulators in Kansas became the first to deny an air emissions construction permit for a new coal-fired power plant based on the plant’s projected emissions of carbon dioxide. State regulatory authorities in Florida and North Carolina have also rejected the construction of new coal-fired power plants based on the uncertainty surrounding the potential costs associated with greenhouse gas emissions from these plants under future laws limiting the emission of carbon dioxide.
In addition, permits for several new coal-fired power plants without limits imposed on their greenhouse gas emissions have been appealed by environmental organizations to the EPA’s Environmental Appeals Board, or EAB, and other judicial forums under the CAA. For example, in June 2008, a Georgia court voided a CAA permit and halted the construction of a coal-fired power plant for failure to address carbon dioxide emissions. Likewise, in November 2008, in another case,In re Deseret Power Electric Cooperative, the EAB remanded the permitting decision back to the Region to reopen the record and reconsider whether carbon dioxide is a pollutant subject to regulation under the CAA with instructions to consider its nationwide implications. In December 2008, the EPA Administrator issued an interpretive rule determining thatthe phrase in the CAA “not subject to regulation” does not include pollutants for which only monitoring and reporting is required. Because carbon dioxide is such a pollutant, this interpretive rule has the effect of precluding any consideration of carbon dioxide emissions in connection with federal permitting under the CAA. Environmental groups filed a Petition for Reconsideration of the interpretive rule. On February 17, 2009, the EPA stated that it would grant the Petition for Reconsideration and allow public comment, but it declined to stay the effectiveness of the interpretive rule at that time.
TABLE OF CONTENTS
A number of states have also either passed legislation or announced initiatives focused on decreasing or stabilizing carbon dioxide emissions associated with the combustion of fossil fuels, and many of these measures have focused on emissions from coal-fired electric generating facilities. For example, ten northeastern and mid-Atlantic states have agreed to implement a regional cap-and-trade program, referred to as the Regional Greenhouse Gas Initiative, or RGGI, to stabilize carbon dioxide emissions from regional power plants beginning in 2009. This initiative aims to reduce emissions of carbon dioxide to levels roughly corresponding to average annual emissions between 2000 and 2004. The members of RGGI agreed to seek to establish in statute and/or regulation a carbon dioxide trading program and have each state’s component of the regional program effective no later than December 31, 2008. Auctions for carbon dioxide allowances under the program began in September 2008. Following the RGGI model, seven Western states and four Canadian provinces have also formed a regional greenhouse gas reduction initiative known as the Western Regional Climate Action Initiative, which calls for an overall reduction of regional greenhouse gas emissions from major industrial and commercial sources, including fossil-fuel fired power plants, in participating states through trading of emissions credits beginning in 2012. Similarly, in 2007, six Midwestern states and one Canadian province signed the Midwestern Greenhouse Gas Reduction Accord to develop and implement steps to reduce greenhouse gas emissions, including developing a market-based, multi-sector cap. Some states have passed laws individually. For example, in 2006, the governor of California signed Assembly Bill 32 into law, requiring the California Air Resources Board to develop regulations and market mechanisms to reduce California’s greenhouse gas emissions by 25% by 2020 with mandatory caps beginning in 2012 for significant sources. In 2007, New Jersey passed a greenhouse gas reduction that would be economy wide, requiring emissions to drop to 1990 levels by 2020 and that emissions be capped at 80% of 2006 levels by 2050.
Several different pieces ofAt the federal level, legislation werewas introduced in Congress in 2007, 2008 and 20082009 to reduce greenhouse gas emissions in the United States. Newly elected President Obama, stated in his campaign that climate change policySuch or similar federal legislation, which generally seeks to place an economy-wide cap on emissions of greenhouse gases and would be a priorityrequire most sources of his administration, and the Democratic majority in Congress has indicated that it will seek to enact legislation to reduce greenhouse gas emissions.emissions to obtain greenhouse gas emission “allowances” corresponding to their annual emissions of greenhouse gases, could be taken up in 2010 or later years. It is possible that future federal and state initiatives to control and put a price on carbon dioxide emissions, or otherwise regulate greenhouse gas emissions, could result in increased costs associated with coal consumption, such as costs to install additional controls to reduce carbon dioxide emissions or costs to purchase emissions reduction credits to comply with future emissions trading programs. Such increased costs for coal consumption could result in some customers switching to alternative sources of fuel, which could negatively impact PVR’s lessees’ coal sales, and thereby have an adverse effect on PVR’s coal royalties revenues.
Surface Mining Control and Reclamation Act of 1977. The Surface Mining Control and Reclamation Act of 1977, or SMCRA, and similar state statutes establish minimum national operational, reclamation and closure standards for all aspects of surface mining, as well as most aspects of deep mining. SMCRA requires that comprehensive environmental protection and reclamation standards be met during the course of and following completion of mining activities. SMCRA also imposes on mine operators the responsibility of restoring the land to its original state and compensating the landowner for types of
damages occurring as a result of mining operations, and requires mine operators to post performance bonds to ensure compliance with any reclamation obligations. Moreover, regulatory authorities may attempt to assign the liabilities of PVR’s coal lessees to another entity such as PVR if any of its lessees are not financially capable of fulfilling those obligations on the theory that PVR “owned” or “controlled” the mine operator in such a way for liability to attach. To our knowledge, no such claims have been asserted against PVR to date. In conjunction with mining the property, PVR’s coal lessees are contractually obligated under the terms of their leases to comply with all state and local laws, including SMCRA, with obligations including the reclamation and restoration of the mined areas by grading, shaping and reseeding the soil. Upon completion of the mining, reclamation generally is completed by seeding with grasses or planting trees for use as pasture or timberland, as specified in the approved reclamation plan. Additionally, the Abandoned Mine Lands Program, which is part of SMCRA, imposes a tax on all current mining operations, the proceeds of which are used to restore mines closed before 1977. The maximum tax is 31.5 cents per ton on surface-mined coal and 13.5 cents per ton on underground-mined coal. This tax was set to expire on June 30, 2006, but the program was extended until September 30, 2021.
TABLE OF CONTENTS
Federal and state laws require bonds to secure PVR’s lessees’ obligations to reclaim lands used for mining and to satisfy other miscellaneous obligations. These bonds are typically renewable on a yearly basis. It has become increasingly difficult for mining companies to secure new surety bonds without the posting of partial collateral. In addition, surety bond costs have increased while the market terms of surety bonds have generally become less favorable. It is possible that surety bonds issuers may refuse to renew bonds or may demand additional collateral upon those renewals. Any failure to maintain, or inability to acquire, surety bonds that are required by state and federal laws would have a material adverse effect on PVR’s lessees’ ability to produce coal, which could affect PVR’s coal royalties revenues.
Hazardous Materials and Wastes. The Federal Comprehensive Environmental Response, Compensation and Liability Act, or CERCLA, or the Superfund law, and analogous state laws, impose liability, without regard to fault or the legality of the original conduct, on certain classes of persons that are considered to have contributed to the release of a “hazardous substance” into the environment. These persons include the owner or operator of the site where the release occurred and companies that disposed or arranged for the disposal of the hazardous substances found at the site. Persons who are or were responsible for releases of hazardous substances under CERCLA may be subject to joint and several liability for the costs of cleaning up the hazardous substances that have been released into the environment and for damages to natural resources.
Some products used by coal companies in operations generate waste containing hazardous substances. PVR could become liable under federal and state Superfund and waste management statutes if its lessees are unable to pay environmental cleanup costs. CERCLA authorizes the EPA and, in some cases, third parties, to take actions in response to threats to the public health or the environment and to seek recovery from the responsible classes of persons of the costs they incurred in connection with such response. It is not uncommon for neighboring landowners and other third parties to file claims for personal injury and property damage allegedly caused by hazardous substances or other wastes released into the environment. The Resource Conservation and Recovery Act, or RCRA, and corresponding state laws and regulations exclude many mining wastes from the regulatory definition of hazardous wastes. Currently, the management and disposal of coal combustion by-products are also not regulated at the federal level and not uniformly at the state level. If rules are adopted to regulate the management and disposal of these by-products, they could add additional costs to the use of coal as a fuel and may encourage power plant operators to switch to a different fuel.
Clean Water Act. PVR’s coal lessees’ operations are regulated under the Clean Water Act, or the CWA, with respect to discharges of pollutants, including dredged or fill material into waters of the United States. Individual or general permits under Section 404 of the CWA are required to conduct dredge or fill activities in jurisdictional waters of the United States. Surface coal mining operators obtain these permits to authorize such activities as the creation of slurry ponds, stream impoundments and valley fills. Uncertainty over what legally constitutes a navigable water of the United States within the CWA’s regulatory scope may adversely impact the ability of PVR’s coal lessees to secure the necessary permits for their mining activities. Some surface mining activities require a CWA Section 404 “dredge and fill” permit under the CWA for valley fills and the associated sediment control ponds. On June 5, 2007, in response to the U.S. Supreme Court’s divided opinion inRapanos v. United States, the EPA and the U.S. Army Corps of Engineers, or the Corps, issued joint guidance to EPA regions and Corps districts interpreting the geographic extent of regulatory jurisdiction under Section 404 of the CWA. Specifically, the guidance places jurisdictional water bodies into two groups: waters where the agencies will assert regulatory jurisdiction “categorically” and waters where the agencies will assert jurisdiction on a case-by-case basis following a “significant nexus analysis.” It remains to be seen how this guidance will affect the permitting process for obtaining additional permits for valley fills and sediment ponds although it is likely to add uncertainty and delays in the issuance of new permits. Some valley fill surface mining activities have the potential to impact headwater streams that are not relatively permanent, which could therefore trigger a detailed “significant nexus analysis” to determine whether a Section 404 permit would be required. Such analyses could require the extensive collection of additional field data and could lead to delays in the issuance of CWA Section 404 permits for valley fill surface mining operations.
Recent federal district court decisions in West Virginia, and related litigation filed in federal district court in Kentucky, have created additional uncertainty regarding the future ability to obtain certain general permits authorizing the construction of valley fills for the disposal of overburden from mining operations. The Corps is authorized by Section 404 of the CWA to issue “nationwide” permits for specific categories of dredging
TABLE OF CONTENTS
and filling activities that are similar in nature and that are determined to have minimal adverse environmental effects. Nationwide Permit 21 authorizes the disposal of dredged or fill material from surface coal mining activities into the waters of the United States. A July 2004 decision by the Southern District of West Virginia inOhio Valley Environmental Coalition v. Bulen enjoined the Huntington District of the Corps from issuing further permits pursuant to Nationwide Permit 21. While the decision was vacated by the Fourth Circuit Court of Appeals in November 2005, it has been remanded to the District Court for the Southern District of West Virginia for further proceedings. Moreover, a similar lawsuit has been filed in the U.S. District Court for the Eastern District of Kentucky that seeks to enjoin the issuance of permits pursuant to Nationwide Permit 21 by the Louisville District of the Corps.
In the event similar lawsuits prove to be successful in adjoining jurisdictions, PVR’s lessees may be required to apply for individual discharge permits pursuant to Section 404 of the CWA in areas where they would have otherwise utilized Nationwide Permit 21. Such a change could result in delays in PVR’s lessees obtaining the required mining permits to conduct their operations, which could in turn have an adverse effect on PVR’s coal royalties revenues.
Individual CWA Section 404 permits for valley fills associated with surface mining activities are also subject to certain legal challenges and uncertainty. On September 22, 2005, in the caseOhio Valley Environmental Coalition (“OVEC”) v. United States Army Corps of Engineers, environmental group plaintiffs filed suit in the U.S. District Court for the Southern District of West Virginia challenging the Corps’ decision to issue individual CWA Section 404 permits for certain mining projects. Alex Energy, Inc., or Alex Energy, a lessee of PVR that operates the Republic No. 2 Mine in Kanawha County, West Virginia, intervened as a defendant in this litigation when the plaintiffs’ amended their complaint to add the December 22, 2005 individual CWA Section 404 permit for the Republic No. 2 Mine, or the Republic No. 2 Permit. On March 23, 2007, the district court rescinded several challenged CWA Section 404 permits, including the Republic No. 2 Permit, and remanded the permit applications to the Corps for further proceedings. In addition, the district court enjoined the permit holders, including Alex Energy, from all activities authorized under the rescinded permits. As part of theOVEC litigation, the environmental groups have also challenged the CWA Section 404 permit issued to Alex Energy for the Republic No. 1 Mine, also located in Kanawha County, West Virginia.
The Corps, Alex Energy, other impacted mining companies, and mining associations appealed the March 23, 2007 ruling to the U.S. Court of Appeals for the Fourth Circuit. On February 13, 2009, the Fourth Circuit reversed and vacated the District Court’s March 23, 2007 opinion and order that had rescinded the challenged permits and vacated the District Court’s injunction of activity under those permits and reversed a related order by the District Court that would have required yet additional permits under the CWA. One of the three judges dissented in part from this decision and would have upheld the decision rescinding the permits and enjoining future activity but agreed with the other two judges on the other parts of the decision. This decision may be subject to further appellate review including by the Fourth Circuit itself. We are unable to predict the outcome of any further appellate review that may be obtained.
In December 2007, plaintiff environmental groups brought a similar suit against the issuance of a CWA Section 404 permit for a surface coal mine in the U.S. District Court for the Eastern District of Kentucky, alleging identical violations. The Corps has voluntarily suspended its consideration of the permit application in that case for agency re-evaluation. While the final outcome of these cases remains uncertain, if lawsuits challenging the use of valley fills ultimately limits or prohibits the mining methods or operations of PVR’s lessees, it could have an adverse effect on PVR’s coal royalties revenues. In addition, it is possible that similar litigation affecting recently issued, pending or future individual or general CWA Section 404 permits relevant to the mining and related operations of PVR’s lessees could adversely impact PVR’s coal royalties revenues.
In December 2008, the Department of Interior published the Excess Spoil, Coal Mine Waste and Buffers for Perennial and Intermittent Streams rule under SMCRA in part to clarify when valley fills are permitted. The rule would require a 100-foot buffer around all waters, including streams, lakes, ponds and wetlands. However, the rule would exempt certain activities, such as permanent spoil fills and coal waste disposal facilities, and allow mining that changes a waterway’s flow, providing the mining company repairs damage later. Companies could also receive a permit to dispose of waste within the buffer zone if they explain why an
TABLE OF CONTENTS
alternative is not reasonably possible or is not necessary to meet environmental requirements. Environmental groups have brought lawsuits challenging the rule. It is unclear what impact the rule will have on the previously discussed lawsuits related to valley fills or any mining operations undertaken by PVR’s lessees in the future.
Total Maximum Daily Load, or TMDL, regulations under the CWA establish a process to calculate the maximum amount of a pollutant that a water body can receive and still meet state water quality standards and to allocate pollutant loads among the point- and non-point pollutant sources discharging into that water body. This process applies to those waters that states have designated as impaired (not meeting present water quality standards). Industrial dischargers, including coal mines, discharging to such waters will be required to meet new TMDL allocations for these stream segments. The adoption of new TMDL-related allocations for streams to which PVR’s lessees’ coal mining operations discharge could require more costly water treatment and could adversely affect PVR’s lessees’ coal production.
The CWA also requires states to develop anti-degradation policies to ensure non-impaired water bodies in the state do not fall below applicable water quality standards. These and other regulatory developments may restrict PVR’s lessees’ ability to develop new mines or could require PVR’s lessees to modify existing operations, which could have an adverse effect on PVR’s coal business.
The Safe Drinking Water Act, or the SDWA, and its state equivalents affect coal mining operations by imposing requirements on the underground injection of fine coal slurries, fly ash and flue gas scrubber sludge, and by requiring permits to conduct such underground injection activities. In addition to establishing the underground injection control program, the SDWA also imposes regulatory requirements on owners and operators of “public water systems.” This regulatory program could impact PVR’s lessees’ reclamation operations where subsidence or other mining-related problems require the provision of drinking water to affected adjacent homeowners.
Endangered Species Act. The Endangered Species Act and counterpart state legislation protect species threatened with possible extinction. Protection of threatened and endangered species may have the effect of prohibiting or delaying PVR’s lessees from obtaining mining permits and may include restrictions on timber harvesting, road building and other mining or agricultural activities in areas containing the affected species or their habitats. A number of species indigenous to areas where PVR’s properties are located are protected under the Endangered Species Act. Based on the species that have been identified to date and the current application of applicable laws and regulations, however, we do not believe there are any species protected under the Endangered Species Act that would materially and adversely affect PVR’s lessees’ ability to mine coal from PVR’s properties in accordance with current mining plans.
Mine Health and Safety Laws. The operations of PVR’s coal lessees are subject to stringent health and safety standards that have been imposed by federal legislation since the adoption of the Mine Health and Safety Act of 1969. The Mine Health and Safety Act of 1969 resulted in increased operating costs. The Mine Safety and Health Act of 1977, which significantly expanded the enforcement of health and safety standards of the Mine Health and Safety Act of 1969, imposes comprehensive health and safety standards on all mining operations. In addition, as part of the Mine Health and Safety Acts of 1969 and 1977, the Black Lung Acts require payments of benefits by all businesses conducting current mining operations to coal miners with black lung or pneumoconiosis and to some beneficiaries of miners who have died from this disease.
Recent mining accidents in West Virginia and Kentucky have received national attention and instigated responses at the state and national level that are likely to result in increased scrutiny of current safety practices and procedures at all mining operations, particularly underground mining operations. In January 2006, West Virginia passed a law imposing stringent new mine safety and accident reporting requirements and increased civil and criminal penalties for violations of mine safety laws. On March 7, 2006, New Mexico Governor Bill Richardson signed into law an expanded miner safety program including more stringent requirements for accident reporting and the installation of additional mine safety equipment at underground mines. Similarly, on April 27, 2006, Kentucky Governor Ernie Fletcher signed mine safety legislation that includes requirements for increased inspections of underground mines and additional mine safety equipment and authorizes the assessment of penalties of up to $5,000 per incident for violations of mine ventilation or roof control requirements.
TABLE OF CONTENTS
On June 15, 2006, the President signed the “Miner Act,” which was new mining safety legislation that mandates improvements in mine safety practices, increases civil and criminal penalties for non-compliance, requires the creation of additional mine rescue teams and expands the scope of federal oversight, inspection and enforcement activities. Pursuant to the Miner Act, the Mine Safety Health Administration, or MSHA, has promulgated new emergency rules on mine safety and revised MSHA’s civil penalty assessment regulations, which resulted in an across-the-board increase in penalties from the existing regulations. These requirements may add significant costs to PVR’s lessees’ operations, particularly for underground mines, and could affect the financial performance of PVR’s lessees’ operations.
Implementing and complying with these new laws and regulations could adversely affect PVR’s lessees’ coal production and could therefore have an adverse effect on PVR’s coal royalties revenues.
Mining Permits and Approvals. Numerous governmental permits or approvals are required for mining operations. In connection with obtaining these permits and approvals, PVR’s coal lessees may be required to prepare and present to federal, state or local authorities data pertaining to the effect or impact that any proposed production of coal may have upon the environment. The requirements imposed by any of these authorities may be costly and time consuming and may delay commencement or continuation of mining operations.
Under some circumstances, substantial fines and penalties, including revocation of mining permits, may be imposed under the laws described above. Monetary sanctions and, in severe circumstances, criminal sanctions may be imposed for failure to comply with these laws. Regulations also provide that a mining permit can be refused or revoked if the permit applicant or permittee owns or controls, directly or indirectly through other entities, mining operations which have outstanding environmental violations. Although, like other coal companies, PVR’s lessees’ have been cited for violations in the ordinary course of business, to our knowledge, none of them have had one of their permits suspended or revoked because of any violation, and the penalties assessed for these violations have not been material.
In order to obtain mining permits and approvals from state regulatory authorities, mine operators, including PVR’s lessees, must submit a reclamation plan for restoring, upon the completion of mining operations, the mined property to its prior condition, productive use or other permitted condition. Typically, PVR’s lessees submit the necessary permit applications between 12 and 24 months before they plan to begin mining a new area. In PVR’s experience, permits generally are approved within 12 months after a completed application is submitted. In the past, PVR’s lessees have generally obtained their mining permits without significant delay. PVR’s lessees have obtained or applied for permits to mine a majority of the reserves that are currently planned to be mined over the next five years. PVR’s lessees are also in the planning phase for obtaining permits for the additional reserves planned to be mined over the following five years. However, there are no assurances that they will not experience difficulty in obtaining mining permits in the future. See “—PVR Coal and Natural Resource Management Segment—Segment — Clean Water Act.”
OSHA. PVR’s lessees and PVR’s own business are subject to OSHA. See “—Oil and Gas Segment—Segment — OSHA.”
PVR Natural Gas Midstream Segment
General Regulation. PVR’s natural gas gathering facilities generally are exempt from the FERC’s jurisdiction under the NGA, but FERC regulation nevertheless could significantly affect PVR’s gathering business and the market for its services. In recent years, the FERC has pursued pro-competitive policies in its regulation of interstate natural gas pipelines into which PVR’s gathering pipelines deliver. However, we cannot assure you that the FERC will continue this approach as it considers matters such as pipeline rates and rules and policies that may affect rights of access to natural gas transportation capacity.
For example, the FERC will assert jurisdiction over an affiliated gatherer that acts to benefit its pipeline affiliate in a manner that is contrary to the FERC’s policies concerning jurisdictional services adopted pursuant to the NGA. In addition, natural gas gathering may receive greater regulatory scrutiny at both the state and federal levels now that the FERC has taken a less stringent approach to regulation of the gathering activities of interstate pipeline transmission companies and a number of such companies have transferred gathering facilities to unregulated affiliates. PVR’s gathering operations could be adversely affected should they be
TABLE OF CONTENTS
subject in the future to the application of state or federal regulation of rates and services. PVR’s gathering operations also may be or become subject to safety and operational regulations relating to the design, installation, testing, construction, operation, replacement and management of gathering facilities. Additional rules and legislation pertaining to these matters are considered or adopted from time to time. We cannot predict what effect, if any, such changes might have on PVR’s natural gas midstream operations, but the industry could be required to incur additional capital expenditures and increased costs depending on future legislative and regulatory changes.
In Texas, PVR’s gathering facilities are subject to regulation by the Texas Railroad Commission, which has the authority to ensure that rates, terms and conditions of gas utilities, including certain gathering facilities, are just and reasonable and not discriminatory. PVR’s operations in Oklahoma are regulated by the Oklahoma Corporation Commission, which prohibits PVR from charging any unduly discriminatory fees for its gathering services. We cannot predict whether PVR’s gathering rates will be found to be unjust, unreasonable or unduly discriminatory.
PVR is subject to ratable take and common purchaser statutes in Texas and Oklahoma. Ratable take statutes generally require gatherers to take, without undue discrimination, natural gas production that may be tendered to the gatherer for handling. Similarly, common purchaser statutes generally require gatherers to purchase without undue discrimination as to source of supply or producer. These statutes have the effect of restricting PVR’s right as an owner of gathering facilities to decide with whom it contracts to purchase or transport natural gas. Federal law leaves any economic regulation of natural gas gathering to the states, and Texas and Oklahoma have adopted complaint-based regulation that generally allows natural gas
producers and shippers to file complaints with state regulators in an effort to resolve grievances relating to natural gas gathering rates and access. We cannot assure you that federal and state authorities will retain their current regulatory policies in the future.
Texas and Oklahoma administer federal pipeline safety standards under the Natural Gas Pipeline Safety Act of 1968, or the NGPSA, which requires certain natural gas pipelines to comply with safety standards in constructing and operating the pipelines, and subjects pipelines to regular inspections. PVR also operates a NGL pipeline that is subject to regulation by the U.S. Department of Transportation under the Hazardous Liquids Pipeline Safety Act of 1979, as amended, and comparable state statutes with respect to design, installation, testing, construction, operation, replacement and management of pipeline facilities. In response to recent pipeline accidents, Congress and the U.S. Department of Transportation have instituted heightened pipeline safety requirements. Certain of PVR’s gathering facilities are exempt from these federal pipeline safety requirements under the rural gathering exemption. We cannot assure you that the rural gathering exemption will be retained in its current form in the future.
Failure to comply with applicable regulations under the NGA, the NGPSA and certain state laws can result in the imposition of administrative, civil and criminal remedies.
Air Emissions. PVR’s natural gas midstream operations are subject to the CAA and comparable state laws and regulations. See “—PVR Coal and Natural Resource Management Segment—Segment — Air Emissions.” These laws and regulations govern emissions of pollutants into the air resulting from the activities of PVR’s processing plants and compressor stations and also impose procedural requirements on how PVR conducts its natural gas midstream operations. Such laws and regulations may include requirements that PVR obtain pre-approval for the construction or modification of certain projects or facilities expected to produce air emissions, strictly comply with the emissions and operational limitations of air emissions permits PVR is required to obtain or utilize specific equipment or technologies to control emissions. PVR’s failure to comply with these requirements could subject it to monetary penalties, injunctions, conditions or restrictions on operations, and potentially criminal enforcement actions. PVR will be required to incur certain capital expenditures in the future for air pollution control equipment in connection with obtaining and maintaining operating permits and approvals for air emissions.
Hazardous Materials and Wastes. PVR’s natural gas midstream operations could incur liability under CERCLA and comparable state laws resulting from the disposal or other release of hazardous substances or wastes originating from properties PVR owns or operates, regardless of whether such disposal or release occurred during or prior to PVR’s acquisition of such properties. See “—PVR Coal and Natural Resource
TABLE OF CONTENTS
Management Segment—Segment — Hazardous Materials and Wastes.” Although petroleum, including natural gas and NGLs are generally excluded from CERCLA’s definition of “hazardous substance,” PVR’s natural gas midstream operations do generate wastes in the course of ordinary operations that may fall within the definition of a CERCLA “hazardous substance,” or be subject to regulation under state laws.
PVR’s natural gas midstream operations generate wastes, including some hazardous wastes, which are subject to RCRA and comparable state laws. However, RCRA currently exempts many natural gas gathering and field processing wastes from classification as hazardous waste. Specifically, RCRA excludes from the definition of hazardous waste produced waters and other wastes associated with the exploration, development or production of crude oil, natural gas or geothermal energy. Unrecovered petroleum product wastes, however, may still be regulated under RCRA as solid waste. Moreover, ordinary industrial wastes such as paint wastes, waste solvents, laboratory wastes and waste compressor oils may be regulated as hazardous waste. The transportation of natural gas and NGLs in pipelines may also generate some hazardous wastes. Although PVR believes that it is unlikely that the RCRA exemption will be repealed in the near future, repeal would increase costs for waste disposal and environmental remediation at PVR’s facilities.
PVR currently owns or leases numerous properties that for many years have been used for the measurement, gathering, field compression and processing of natural gas and NGLs. Although PVR believes that the operators of such properties used operating and disposal practices that were standard in the industry at the time, hydrocarbons or wastes may have been disposed of or released on or under such properties or on or under other locations where such wastes have been taken for disposal. These properties and the substances disposed or released on them may be subject to CERCLA, RCRA and analogous state laws. Under such laws, PVR could be required to remove or remediate previously disposed wastes (including waste disposed of or released by prior owners or operators) or property contamination (including groundwater contamination, whether from prior owners or operators or other historic activities or spills) or to perform remedial plugging or pit closure operations to prevent future contamination. PVR has ongoing remediation projects underway at several sites, but it does not believe that the costs associated with such cleanups will have a material adverse impact on PVR’s operations or revenues.
Water Discharges. PVR’s natural gas midstream operations are subject to the CWA. See “—PVR Coal and Natural Resource Management Segment—Segment — Clean Water Act.” Any unpermitted release of pollutants, including NGLs or condensates, from PVR’s systems or facilities could result in fines or penalties as well as significant remedial obligations.
OSHA.OSHA. PVR’s natural gas midstream operations are subject to OSHA. See “—Oil and Gas Segment—Segment — OSHA.”
Employees and Labor Relations
We and our subsidiaries had a total of 392382 employees at December 31, 2008,2009, including 157167 employees who directly supported PVR’s operations. We consider our current employee relations to be favorable.
Available Information
Our internet address ishttp://www.pennvirginia.com. We make available free of charge on or through our internet website our Corporate Governance Principles, Code of Business Conduct and Ethics, Executive and Financial Officer Code of Ethics, Audit Committee Charter, Compensation and Benefits Committee Charter and Nominating and Governance Committee Charter and we will provide copies of such documents to any shareholder who so requests. We also make available free of charge on or through our website our Annual Report on Form 10-K, Quarterly Reports on Form 10-Q, Current Reports on Form 8-K and amendments to those reports filed or furnished pursuant to Section 13(a) or 15(d) of the Securities Exchange Act of 1934, or the Exchange Act, as soon as reasonably practicable after we electronically file such material with, or furnish it to, the Securities and Exchange Commission. All references in this Annual Report on Form 10-K.10-K to the “NYSE” refer to the New York Stock Exchange, and all references to the “SEC” refer to the Securities and Exchange Commission.
TABLE OF CONTENTS
Common Abbreviations and Definitions
The following are abbreviations and definitions commonly used in the coal and oil and gas industries that are used in this Annual Report on Form 10-K.
| | |
| Bbl | | a standard barrel of 42 U.S. gallons liquid volume |
| |
| Bcf | | one billion cubic feet |
| |
| Bcfe | | one billion cubic feet equivalent with one barrel of oil or condensate converted to six thousand cubic feet of natural gas based on the estimated relative energy content |
| |
| BTU | | British thermal unit |
| |
| CBM | | coalbed methane |
| |
| Developed acreage | | lease acreage that is allocated or assignable to producing wells or wells capable of production |
| |
| Development well | | a well drilled within the proved area of an oil or gas reservoir to the depth of a stratigraphic horizon known to be productive |
| |
| Dry hole | | a well found to be incapable of producing either oil or gas in sufficient quantities to justify completion of the well |
| |
| Exploratory or exploration well | | a well drilled to find and produce oil or gas in an unproved area, to find a new reservoir in a field previously found to be productive of oil or gas in another reservoir, or to extend a known reservoir |
| GAAP | | accounting principles generally accepted in the Unites States of America |
| Gross acre or well | | an acre or well in which a working interest is owned |
| |
| MBbl | | one thousand barrels |
| |
| Mbf | | one thousand board feet |
| | |
Mcf | | one thousand cubic feet |
| |
Mcfe | | one thousand cubic feet equivalent with one barrel of oil or condensate converted to six thousand cubic feet of natural gas based on the estimated relative energy content |
| |
MMBbl | | one million barrels |
| |
MMbf | | one million board feet |
| |
MMBtu | | one million British thermal units |
| |
MMcf | | one million cubic feet |
| |
MMcfd | | one million cubic feet per day |
| |
MMcfe | | one million cubic feet equivalent with one barrel of oil or condensate converted to six thousand cubic feet of natural gas based on the estimated relative energy content |
| |
Net acre or well | | gross acres or wells multiplied by the owned working interest in those gross acres or wells |
| |
NGL | | natural gas liquid |
| |
NYMEX | | New York Mercantile Exchange |
| |
Present value of proved reserves | | the present value (discounted at 10%) of estimated future cash flows from proved oil and natural gas reserves, as estimated by our independent engineers, reduced by additional estimated future operating expenses, development expenditures and abandonment costs (net of salvage value) associated therewith (before income taxes) |
| | |
Probable coal reserves | | those reserves for which quantity and grade and/or quality are computed from information similar to that used for proven reserves, but the sites for inspection, sampling and measurement are more widely spaced or are otherwise less adequately spaced. The degree of assurance, although lower than that for proven reserves, is high enough to assume continuity between points of observation |
| |
Productive wells | | wells that are producing oil or gas or that are capable of production |
| |
Proved reserves | | those estimated quantities of crude oil condensate and natural gas, that geologicalwhich, by analysis of geoscience and engineering data, demonstratecan be estimated with reasonable certainty to be recoverable in future yearseconomically producible from a given date forward, from known oilreservoirs, and gas reservoirs under existing economic conditions, operating methods, and operating conditionsgovernment regulation before the time at which contracts providing the endright to operate expire, unless evidence indicates that renewal is reasonably certain, regardless of whether the respective yearsestimate is a deterministic estimate or probabilistic estimate |
| |
Proved developed reserves | | proved reserves that can be expected to be recoveredrecovered: (a) through existing wells with existing equipment and operating methods or in which the cost of the required equipment is relatively minor compared with the cost of a new well or (b) through installed extraction equipment and infrastructure operational at the time of the reserves estimate if the extraction is by means not involving a well |
| |
Proved undeveloped reserves | | proved reserves that are expected to be recovered from new wells on undrilled acreage, or from existing wells where a relatively major expenditure is required for recompletionrecompletion. Reserves on undrilled acreage shall be limited to those directly offsetting development spacing areas that are reasonably certain of production when drilled, unless evidence using reliable technology exists that establishes reasonable certainty of economic producibility at greater distances. Undrilled locations can be classified as having undeveloped reserves only if a development plan has been adopted indicating that they are scheduled to be drilled within five years, unless the specific circumstances justify a longer time. |
| |
Proven coal reserves | | those reserves for which: (i) quantity is computed from dimensions revealed in outcrops, trenches, workings or drill holes; (ii) grade and/or quality are computed from the results of detailed sampling; and (iii) the sites for inspection, sampling and measurement are spaced so closely, and the geologic |
| | |
| | character is so well defined, that the size, shape, depth and mineral content of reserves are well-establishedwell established |
| |
Standardized measure | | present value of proved reserves further reduced by the present value (discounted at 10%) of estimated future income taxes on cash flows using the average prices in effect at a fiscal yearduring the 12-month period prior to the period end determined as an unweighted arithmetic average of the first-day-of-the-month price for each month within the period and estimated future costs as of that fiscal year end. Prices are held constant throughout the life of the properties except where SEC guidelines permit alternate treatment, including the use of fixed and determinable contractual price escalations. |
| |
Undeveloped acreage | | lease acreage on which wells have not been drilled or completed to a point that would permit the production of commercial quantities of oil or gas, regardless of whether such acreage contains estimated net proved reserves |
| |
Working interest | | a cost-bearing interest under an oil and gas lease that gives the holder the right to develop and produce the minerals under the lease |
TABLE OF CONTENTS
Item 1A | Item 1A Risk FactorsRisk Factors
|
Our business and operations are subject to a number of risks and uncertainties as described below. However, the risks and uncertainties described below are not the only ones we face. Additional risks and uncertainties that we are unaware of, or that we may currently deem immaterial, may become important factors that harm our business, financial condition or results of operations. If any of the following risks actually occur, our business, financial condition or results of operations could suffer.
Risks Related to Our Oil and Gas Business
Natural gas and crude oil prices are volatile, and a substantial or extended decline in prices would hurt our profitability and financial condition.
Our revenues, operating results, cash flow, profitability, future rate of growth and the carrying value of our oil and gas properties depend heavily on prevailing market prices for natural gas and crude oil. Historically, natural gas and crude oil prices have been volatile, and they are likely to continue to be volatile. Wide fluctuations in natural gas and crude oil prices may result from relatively minor changes in the supply of and demand for oil and gas, market demand and other factors that are beyond our control, including:
domestic and foreign supplies of oil and natural gas;
political and economic conditions in oil or gas producing regions;
overall domestic and foreign economic conditions;
prices and availability of alternative fuels;
the availability of transportation facilities;
domestic and foreign governmental regulation.
Some of our projections and estimates are based on assumptions as to the future prices of natural gas and crude oil. These price assumptions are used for planning purposes. We expect our assumptions will change over time and that actual prices in the future will likely differ from our estimates. Any substantial or extended decline in the actual prices of natural gas or crude oil would have a material adverse effect on our financial position and results of operations (including reduced cash flow and borrowing capacity and possible asset impairment), the quantities of natural gas and crude oil reserves that we can economically produce, the quantity of estimated proved reserves that may be attributed to our properties and our ability to fund our capital program.
The current deterioration of the credit and capital markets may adversely impact our ability to obtain financing on acceptable terms or obtain funding under our revolving credit facility. This may hinder or prevent us from implementing our development plan, completing acquisitions or otherwise meeting our future capital needs.
Global financial markets have been experiencing extreme volatility and disruption, and the debt and equity capital markets have been exceedingly distressed. These issues have made, and will likely continue to make, it difficult to obtain financing. In particular, the cost of raising money in the equity capital markets has increased substantially while the availability of funds from those markets has diminished significantly. The current global economic downturn may adversely impact our ability to issue additional equity in the future at prices which will not be dilutive to our existing shareholders or preclude us from issuing equity at all.
Also, as a result of concerns about the stability of financial markets generally and the solvency of counterparties specifically, the cost of obtaining money from the credit markets has increased as many lenders and institutional investors have increased interest rates, enacted tighter lending standards, refused to refinance existing debt at maturity at all or on terms similar to our current debt and reduced and, in some cases, ceased to provide funding to borrowers. Moreover, even if lenders and institutional investors are willing and able to provide adequate funding, interest rates may rise in the future and therefore increase the cost of borrowing we incur on any of our floating rate debt. In addition, we may be unable to obtain adequate funding under our revolving credit facility, or the Revolver, because (i) our lending counterparties may be unwilling or unable to meet their future funding obligations or (ii) our borrowing base is re-determined twice a year and may decrease as a result of lower oil or natural gas prices and declines in reserves. See “Long-Term Debt” in Item 7, “Management’s Discussion and Analysis of Financial Condition and Results of Operations,” for a more detailed description of our and PVR’s debt covenants and borrowing capacities.
Due to these factors, we cannot be certain that future funding will be available if needed and to the extent required, on acceptable terms. If funding is not available when needed, or is available only on unfavorable terms, it might adversely affect our development plan as currently anticipated and our ability to complete acquisitions each of which could have a material adverse effect on our production, revenues and results of operations.
Our future performance depends on our ability to find or acquire additional oil and gas reserves that are economically recoverable.
Unless we successfully replace the reserves that we produce, our reserves will decline, eventually resulting in a decrease in oil and gas production and lower revenues and cash flows from operations. We have historically succeeded in substantially replacing reserves primarily through exploration and development and, to a lesser extent, acquisitions. We have conducted such activities on our existing oil and gas properties as well as on newly acquired properties. We may not be able to continue to replace reserves from such activities at acceptable costs. The currently depressed oil and gas prices may further limit the types of reserves that can be developed at acceptable costs. Lower prices also decrease our cash flows and may cause us to reduce capital expenditures. The business of exploring for, developing or acquiring reserves is capital intensive. We may not be able to make the necessary capital investments to maintain or expand our oil and gas reserves if cash flows from operations are reduced and external sources of capital remain limited or unavailable due to the deterioration of the global economy, including financial and credit markets. In addition, exploration and development activities involve numerous risks that may result in dry holes, the failure to produce oil and gas in commercial quantities and the inability to fully produce discovered reserves.
TABLE OF CONTENTS
We are continually identifying and evaluating acquisition opportunities. However, competition for producing oil and gas properties is intense and many of our competitors have financial and other resources substantially greater than those available to us. Depending on the longevity of the deterioration of the market, our ability to make acquisitions may be significantly adversely affected. In the event we are successful in completing an acquisition, we cannot ensure that such acquisition will consist of properties that contain economically recoverable reserves or that such acquisition will be profitably integrated into our operations.
We may not be able to fund our planned capital expenditures.
We make, and will continue to make, substantial capital expenditures to find, acquire, develop, exploit and produce oil and natural gas reserves. In 2009,2010, we anticipate making oil and gas segment capital expenditures, excluding acquisitions, of up to approximately $250.0$425 million. This is $391.7$253 million, or 61%147%, lowerhigher than the $641.7$172 million of capital expenditures, excluding acquisitions, that our oil and gas segment made in 2008. As a result of our decreased anticipated capital expenditures, we project a decrease in the number of wells that will be drilled in 2009.
If oil and gas prices decrease or we encounter operating difficulties that result in our cash flow from operations being less than expected, we may have to reduce the capital we can spend unless we raise additional funds through debt or equity financing. The current global economic downturn may adversely impact our ability to issue additional equity in the future at prices which will not be dilutive to our existing shareholders or preclude us from issuing equity at all. In addition, debt financing may not be available if needed and to the extent required, on acceptable terms.
Future cash flows and the availability of financing will also be subject to a number of variables, such as:
as our success in locating and producing new reserves;
reserves, the level of production from existing wells;wells and
prices of oil and natural gas.
If our revenues were to decrease due to lower oil and natural gas prices, decreased production or other reasons, and if we could not obtain capital through the Revolver, or otherwise, our ability to execute our development plans, replace our reserves or maintain production levels could be greatly limited.
Exploration and development drilling may not result in commercially productive reserves.
Oil and gas drilling and production activities are subject to numerous risks, including the risk that no commercially productive natural gas or oil reserves will be found. The costs of drilling, completing and operating wells are often uncertain, and drilling operations may be curtailed, delayed or canceled as a result of a variety of factors, many of which are beyond our control. These factors include:
unexpected drilling conditions;
pressure or irregularities in formations;
equipment failures or accidents;
shortages or delays in the availability of drilling rigs and the delivery of equipment;
shortages in experienced labor;
failure to secure necessary regulatory approvals and permits;
fires, explosions, blow-outs and surface cratering; and
adverse weather conditions.
The prevailing prices of oil and gas also affect the cost of and the demand for drilling rigs, production equipment and related services. The availability of drilling rigs can vary significantly from region to region at any particular time. Although land drilling rigs can be moved from one region to another in response to changes in levels of demand, an undersupply of rigs in any region may result in drilling delays and higher drilling costs for the rigs that are available in that region.
Another significant risk inherent in our drilling plans is the need to obtain drilling permits from state, local and other governmental authorities. Delays in obtaining regulatory approvals and drilling permits, including delays which jeopardize our ability to realize the potential benefits from leased properties within the
TABLE OF CONTENTS
applicable lease periods, the failure to obtain a drilling permit for a well or the receipt of a permit with unreasonable conditions or costs could have a material adverse effect on our ability to explore on or develop our properties.
The wells we drill may not be productive and we may not recover all or any portion of our investment in such wells. The seismic data and other technologies we use do not allow us to know conclusively prior to drilling a well that natural gas or oil is present or may be produced economically. The cost of drilling, completing and operating a well is often uncertain, and cost factors can adversely affect the economics of a project. Drilling activities can result in dry wells or wells that are productive but do not produce sufficient net revenues after operating and other costs to cover initial drilling costs.
Our future drilling activities may not be successful, nor can we be sure that our overall drilling success rate or our drilling success rate within a particular area will not decline. Unsuccessful drilling activities could have a material adverse effect on our business results of operations or financial condition. Also, we may not be able to obtain any options or lease rights in potential drilling locations that we identify. Although we have identified numerous potential drilling locations, we may not be able to economically produce oil or natural gas from all of them.
We are exposed to the credit risk of our customers, and nonpayment or nonperformance by our customers would reduce our cash flows.
We are subject to risk from loss resulting from our customers’ nonperformance or nonpayment. We depend on a limited number of customers for a significant portion of revenues from our oil and gas segment. In 2008, 30%2009, 25% of our oil and gas segment revenues and 11%7% of our total consolidated revenues resulted from two of our oil and gas customers. Any nonpayment or nonperformance by our oil and gas customers would reduce our cash flows.
Our business involves many operating risks that may result in substantial losses for which insurance may be unavailable or inadequate.
Our operations are subject to all of the risks and hazards typically associated with the exploitation, development and exploration for and the production and transportation of oil and natural gas. These operating risks include:
fires, explosions, blowouts, cratering and casing collapses;
formations with abnormal pressures;
pipeline ruptures or spills;
uncontrollable flows of oil, natural gas or well fluids;
environmental hazards such as natural gas leaks, oil spills and discharges of toxic gases; and
Any of these risks could result in substantial losses resulting from injury or loss of life, damage to or destruction of property, natural resources and equipment, pollution and other environmental damages, clean-up responsibilities, regulatory investigations and penalties and suspension of operations. In addition, under certain circumstances, we may be liable for environmental damage caused by previous owners or operators of properties that we own, lease or operate. As a result, we may incur substantial liabilities to third parties or governmental entities, which could reduce or eliminate funds available for exploration, development or acquisitions or cause us to incur losses.
In accordance with industry practice, we maintain insurance against some, but not all, of the risks described above. We cannot assure you that our insurance will be adequate to cover losses or liabilities. Also, we cannot predict the continued availability of insurance at premium levels that justify its purchase. No assurance can be given that we will be able to maintain insurance in the future at rates we consider reasonable. The occurrence of a significant event, not fully insured or indemnified against, could have a material adverse effect on our business, results of operations or financial condition.
TABLE OF CONTENTS
Our business depends on transportation facilities owned by others.
We deliver substantially all of our oil and natural gas production through pipelines that we do not own. The marketability of our production depends upon the availability, proximity and capacity of these pipelines as well as gathering systems and processing facilities. The unavailability or lack of available capacity on these systems and facilities could result in the shut-in of producing wells or the delay or discontinuance of development plans for properties. Federal, state and local regulation of oil and natural gas production and transportation, tax and energy policies, changes in supply and demand, pipeline pressures, damage to or destruction of pipelines and general economic conditions could adversely affect our ability to produce, gather and market our oil and natural gas.
Estimates of oil and natural gas reserves are not precise.
This Annual Report on Form 10-K contains estimates of our proved oil and gas reserves and the estimated future net cash flows from such reserves. These estimates are based upon various assumptions, including assumptions required by the SEC relating to oil and natural gas prices, drilling and operating expenses, capital expenditures, taxes and availability of funds. The process of estimating oil and natural gas reserves is complex. This process requires significant decisions and assumptions in the evaluation of available geological, geophysical, engineering and economic data for each reservoir. These estimates are dependent on many variables and, therefore, changes often occur as these variables evolve and commodity prices fluctuate.
Actual future production, oil and gas prices, revenues, taxes, development expenditures, operating expenses and quantities of recoverable oil and gas reserves will most likely vary from those estimated. Any significant variance could
materially affect the estimated quantities and present value of reserves disclosed by us. In addition, we may adjust estimates of proved reserves to reflect production history, results of exploration and development, prevailing oil and gas prices and other factors, many of which are beyond our control.
At December 31, 2008,2009, approximately 49%53% of our estimated proved reserves were proved undeveloped. Estimation of proved undeveloped reserves and proved developed non-producing reserves is based on volumetric calculations and adjacent reserve performance data. Recovery of proved undeveloped reserves requires significant capital expenditures and successful drilling operations. Production revenues from proved developed non-producing reserves will not be realized until some time in the future. The reserve data assumes that we will make significant capital expenditures to develop our reserves. Although we have prepared estimates of our reserves and the costs associated with these reserves in accordance with industry standards, these estimated costs may not be accurate, development may not occur as scheduled and actual results may not occur as estimated.
You should not assume that the present value of estimated future net cash flows (standardized measure) referred to herein is the current fair value of our estimated oil and gas reserves. In accordance with SEC requirements, we base the estimated discounted future net cash flows from our proved reserves on prices and costs on the date of the estimate. Actual current and future prices and costs may be materially higher or lower than the prices and costs as of the date of the estimate. As a result, net present value estimates using actual prices and costs may be significantly less than the SEC estimate that is provided herein. In addition, the 10% discount factor, which is required by the SEC to be used in calculating discounted future net cash flows for reporting purposes, is not necessarily the most accurate discount factor for us.
The oil and gas segment may record impairment losses on its oil and gas properties.
Quantities of proved reserves are estimated based on economic conditions in existence in the period of assessment. Lower oil and gas prices may have the impact of shortening the economic lives on certain fields because it becomes uneconomic to produce all recoverable reserves on such fields, thus reducing proved property reserve estimates. If such revisions in the estimated quantities of proved reserves occur, it will have the effect of increasing the rates of depreciation, depletion and amortization, or DD&A, on the affected properties, which would decrease earnings or result in losses through higher DD&A expense. The revisions may also be sufficient enough to cause impairment losses on certain properties that would result in a further non-cash expense to earnings.
If natural gas, crude oil and NGL prices decline or we drill uneconomic wells, it is reasonably possible we will have a significant impairment.
TABLE OF CONTENTS
We have limited control over the activities on properties we do not operate.
In 2008,2009, other companies operated approximately 21%35% of our net production. Our success in properties operated by others will depend upon a number of factors outside of our control, including timing and amount of capital expenditures, the operator’s expertise and financial resources, approval of other participants in drilling wells, selection of technology and maintenance of safety and environmental standards. We have limited ability to influence or control the operation or future development of these non-operated properties or the amount of capital expenditures that we are required to fund for their operation. Our dependence on the operator and other working interest owners for these projects and our limited ability to influence or control the operation and future development of these properties could have a material adverse effect on the realization of our targeted returns or lead to unexpected future costs.
Certain working interest owners in our properties have the right to control the timing of drilling activities on our properties under certain circumstances.
Under certain circumstances, certain of the other working interest owners in our properties have the right to limit the amount of drilling activities that can take place on our properties at any given time. If these working interest owners chose to exercise this right, we could be required to scale back anticipated drilling activities on the affected properties. In such an event, production from the affected properties would be deferred, thereby decreasing production from the properties in the short-term.
Our producing property acquisitions carry significant risks.
Acquisition of producing oil and gas properties is a key element of maintaining and growing reserves and production. Competition for these assets has been and will continue to be intense. Depending on the longevity of the deterioration of the market, our ability to make acquisitions may be significatelysignificantly adversely affected. In the event we do complete an acquisition,
its success will depend on a number of factors, many of which are beyond our control. These factors include the purchase price, future oil and gas prices, the ability to reasonably estimate or assess the recoverable volumes of reserves, rates of future production and future net revenues attainable from reserves, future operating and capital costs, results of future exploration, exploitation and development activities on the acquired properties and future abandonment and possible future environmental or other liabilities. There are numerous uncertainties inherent in estimating quantities of proved oil and gas reserves, actual future production rates and associated costs and potential liabilities with respect to prospective acquisition targets. Actual results may vary substantially from those assumed in the estimates. A customary review of subject properties will not necessarily reveal all existing or potential problems.
Additionally, significant acquisitions can change the nature of our operations and business depending upon the character of the acquired properties if they have substantially different operating and geological characteristics or are in different geographic locations than our existing properties. To the extent that acquired properties are substantially different than our existing properties, our ability to efficiently realize the expected economic benefits of such transactions may be limited.
Integrating acquired businesses and properties involves a number of special risks. These risks include the possibility that management may be distracted from regular business concerns by the need to integrate operations and systems and that unforeseen difficulties can arise in integrating operations and systems and in retaining and assimilating employees. Any of these or other similar risks could lead to potential adverse short-term or long-term effects on our operating results, and may cause us to not be able to realize any or all of the anticipated benefits of the acquisitions.
Derivative transactions may limit our potential gains and involve other risks.
In order to manage our exposure to price risks in the sale of our oil and natural gas, we periodically enter into oil and gas price hedging arrangements with respect to a portion of our expected production. Our hedges are limited in duration, usually for periods of two years or less. While intended to reduce the effects of volatile oil and natural gas prices, such transactions may limit our potential gains if oil or natural gas prices were to rise over the price established by the hedging arrangements. In trying to maintain an appropriate balance, we may end up hedging too much or too little, depending upon how oil or natural gas prices fluctuate in the future.
TABLE OF CONTENTS
In addition, derivative transactions may expose us to the risk of financial loss in certain circumstances, including instances in which:
our production is less than expected;
there is a widening of price basis differentials between delivery points for our production and the delivery point assumed in the hedge arrangement;
the counterparties to our futures contracts fail to perform under the contracts; or
a sudden, unexpected event materially impacts oil or natural gas prices.
In addition, derivative instruments involve basis risk. Basis risk in a derivative contract occurs when the index upon which the contract is based is more or less variable than the index upon which the hedged asset is based, thereby making the hedge less effective. For example, a NYMEX index used for hedging certain volumes of production may have more or less variability than the regional price index used for the sale of that production.
We are subject to complex laws and regulations that can adversely affect the cost, manner or feasibility of doing business.
Exploration, development, production and sale of oil and gas are subject to extensive federal, state and local laws and regulations, including complex environmental laws. Future laws or regulations, any adverse changes in the interpretation of existing laws and regulations, inability to obtain necessary regulatory approvals or a failure to comply with existing legal requirements may harm our business, results of operations or financial condition. We may be required to make large expenditures to comply with environmental and other governmental regulations. Failure to comply with these laws and regulations may result in the suspension or termination of operations and subject us to administrative, civil and criminal penalties. Matters subject to regulation include discharge permits for drilling operations, drilling bonds, spacing of wells, unitization and pooling of properties, environmental protection and taxation. Our operations create the risk of environmental liabilities to the government or third parties for any unlawful discharge of oil, gas or other pollutants into the air, soil or water. In the event of environmental violations, we may be charged with remedial costs. Laws and regulations protecting the environment have become more stringent in recent years, and may, in some circumstances, result in liability for environmental damage regardless of negligence or fault. In addition, pollution and similar environmental risks generally are
not fully insurable. These liabilities and costs could have a material adverse effect on our business, financial condition or results of operations. See Item 1, “Business—“Business — Government Regulation and Environmental Matters—Matters — Oil and Gas Segment—Segment —
Environmental Matters.”
Risks Related to Our Ownership Interests in PVG and PVR
We are not the only partnersmay sell all or a part of our remaining partner interest in PVG.
In September 2009, we sold approximately one-third of our limited partner interest in PVG, and PVR,we continue to own the general partner interest and PVG’san approximately 51% limited partner interest in PVG. We may sell all or a portion of our remaining interests in PVG in one or more transactions. We cannot be certain of whether or when any such sales may occur or, if they do, the amount of proceeds they would generate. However, if we sell all or a part of our interests in PVG, we will likely incur additional general and administrative costs related to costs and services which, prior to such sale, were paid for, in part, by affiliates of PVG.
A reduction in PVR’s respective partnership agreements require themdistributions will disproportionately affect the amount of cash distributions to distribute all availablewhich PVG is currently entitled, and, consequently, will affect the amount of cash distributions PVG is able to their respective partners,make to its unitholders, including public unitholders.
us.PVG and PVR are publicly traded limited partnerships. We own PVG GP, LLC, the sole general partner of PVG. As of December 31, 2008,2009, we also owned an approximately 77%51.4% limited partner interest in PVG. As of December 31, 2008,2009, PVG owned an approximately 37% limited partner interest in PVR, as well as 100% of the general partner of PVR, which owns a 2% general partner interest and the IDRs. We directly owned an additional 0.1% limited partner interest in PVR as of December 31, 2008. The remainder2009.
TABLE OF CONTENTS
PVG’s ownership of the outstanding limitedIDRs in PVR through PVG’s ownership of PVR’s general partner, interestsentitles it to receive increasing percentages, up to 50%, of incremental cash distributions above $0.375 per unit distributed by PVR on a quarterly basis. A decrease in eachthe amount of distributions by PVR to less than $0.375 per unit per quarter would reduce PVG’s percentage of the incremental cash distributions above $0.325 per common unit per quarter from 50% to 25%, consequently resulting in less cash available to PVG and PVR are owned by public unitholders. Although PVG’sto distribute to its unitholders, including us.
PVG and PVR’s respective partnership agreements require them to distribute, on a quarterly basis, 100% of their available cash to their respective unitholders of record and their respective general partners, we are not the only limited partners of PVG and PVR and, therefore, we receive only our proportionate share of cash distributions from each of PVG and PVR based on our partner interests in each of them. The remainder of the quarterly cash distributions is distributed, pro rata, to the public unitholders.
partners. For each of PVG and PVR, available cash is generally all cash on hand at the end of each quarter, after payment of fees and expenses and the establishment of cash reserves by their respective general partners.
PVG’s and PVR’s general partners determine the amount and timing of cash distributions by PVG and PVR and have broad discretion to establish and make additions to the respective partnership’s reserves in amounts the general partner determines to be necessary or appropriate:
to provide for the proper conduct of partnership business, and in the case of PVR, the businesses of its operating subsidiaries (including reserves for future capital expenditures and for anticipated future credit needs);
to provide funds for distributions to the respective unitholders and the respective general partner for any one or more of the next four calendar quarters; or
to comply with applicable law or any loan or other agreements.
A decrease in the amount of distributions by PVR and, consequently, PVG may be caused by a variety of circumstances. PVR may generate less cash available for distributions or determine to create larger reserves in computing cash available for distribution. Even if cash available for distribution remained stable, PVG and PVR may determine to modify the IDRs to reduce the percentage of incremental cash distributions such IDRs are entitled to receive. Accordingly, cash distributions we receive on our partner interests in PVG and PVR may be reduced at any time, or we may not receive any cash distributions from PVG or PVR, which would in turn reduce our available cash.
PVG’s ability to make distributions to us is entirely dependent upon PVG receiving distributions from PVR, and the amount of cash that PVR will be able to distribute to its unitholders, including PVG, principally depends upon the amount of cash it can generate from its coal and natural resource management and natural gas midstream businesses.
PVG’s earnings and cash flow consist exclusively of cash distributions from PVR. Consequently, a significant decline in PVR’s earnings or cash distributions would have a negative impact on its distributions to its partners, including us. The amount of cash that PVR will be able to distribute to its partners, including PVG, each quarter principally depends upon the amount of cash it can generate from its coal and natural resource management and natural gas midstream businesses. The amount of cash that PVR will generate will fluctuate from quarter to quarter based on, among other things:
the amount of coal its lessees are able to produce;
the price at which its lessees are able to sell the coal;
its lessees’ timely receipt of payment from their customers;
PVR’s timely receipt of payment from its lessees;
the amount of natural gas transported in its gathering systems;
the amount of throughput in its processing plants;
the price of and demand for natural gas;
the price of and demand for NGLs;
the relationship between natural gas and NGL prices;
TABLE OF CONTENTS
the fees it charges and the margins it realizes for its natural gas midstream services; and
In addition, the actual amount of cash that PVR will have available for distribution will depend on other factors, some of which are beyond its control, including:
the level of capital expenditures it makes;
the cost of acquisitions, if any;
its debt service requirements;
fluctuations in its working capital needs;
restrictions on distributions contained in its debt agreements;
prevailing economic conditions; and
the amount of cash reserves established by its general partner in its sole discretion for the proper conduct of its business.
Because of these factors, PVR may not have sufficient available cash each quarter to continue paying distributions at their current level or at all. If PVR reduces its per unit distribution, PVG will have less cash available for distribution to its unitholders, including us, and would probably be required to reduce its per unit distribution to its unitholders, including us. The amount of cash that PVR has available for distribution depends primarily upon PVR’s cash flow, including cash flow from financial reserves and working capital borrowings, and is not solely a function of profitability, which will be affected by non-cash items. As a result, PVR may make cash distributions during periods when it records losses and may not make cash distributions during periods when it records profits.
Since PVR’s inception as a publicly traded partnership, it has grown principally by making acquisitions in both of its business segments and, to a lesser extent, by organic growth on its properties. Readily available access to debt and equity capital and credit availability hashave been and continue to be critical factors in PVR’s ability to grow. The current deterioration instate of the global financial marketseconomy and the consequential adverse effect on credit availability ismay adversely impactingimpact PVR’s access to new capital and credit availability. Depending on the longevity and ultimate severity of this deterioration,downturn, PVR’s ability to make acquisitions may be significantly adversely affected, as may PVR’s ability to make cash distributions to its unitholders and, in turn, would affect our ability to make cash distributions to our unitholders.
In addition, the timing and amount, if any, of an increase or decrease in distributions by PVR to its unitholders will not necessarily be comparable to the timing and amount of any changes in distributions made by PVG. PVG’s ability to distribute cash received from PVR to its unitholders, including us, is limited by a number of factors, including:
PVG’s estimated general and administrative expenses as well as other operating expenses;
expenses of PVR’s general partner and PVR;
reserves necessary for PVG to make the necessary capital contributions to maintain its indirect 2% general partner interest in PVR, as required by PVR’s partnership agreement upon the issuance of additional limited partner secutitiessecurities by PVR;
reserves PVG’s general partner believes prudent for PVG to maintain the proper conduct of its business or to provide for future distributions by PVG; and
restrictions on distributions contained in any future debt agreements.
A reduction in PVR’s distributions will disproportionately affect the amount of cash distributions to which PVG is currently entitled, and, consequently, will affect the amount of cash distributions PVG is able to make to its unitholders, including us.
PVG’s ownership of the IDRs in PVR, through PVG’s ownership of PVR’s general partner, entitles PVG to receive its pro rata share of specified percentages of total cash distributions made by PVR with respect to any particular quarter only in the event that PVR distributes more than $0.275 per unit for such quarter. As a result, the holders of PVR’s common units have a priority over the holders of PVR’s IDRs to the extent of cash distributions by PVR up to and including $0.275 per unit for any quarter.
PVG’s IDRs entitle it to receive increasing percentages, up to 50%, of incremental cash distributions above $0.375 per unit distributed by PVR on a quarterly basis. Because PVG is at the maximum target cash distribution level on the IDRs,
future growth in distributions PVG receives from PVR, and in distributions we receive from PVG, will not result from an increase in the target cash distribution level associated with the IDRs. Furthermore, a decrease in the amount of distributions by PVR to less than $0.375 per unit per quarter would reduce PVG’s percentage of the incremental cash distributions above $0.325 per common unit per quarter from 50% to 25%, consequently resulting in less cash available to PVG to distribute to its unitholders, including us. A decrease in the amount of distributions by PVR and, consequently, PVG may be caused by a variety of circumstances. PVR may generate less cash available for distributions or determine to create larger reserves in computing cash available for distribution. Even if cash available for distribution remained stable, PVG and PVR may determine to modify the IDRs to reduce the percentage of incremental cash distributions such IDRs are entitled to receive.
PVR may issue additional limited partner interests or other equity securities, which may increase the risk that PVR will not have sufficient available cash to maintain or increase its cash distribution level, which in turn may reduce the available cash that PVG has to distribute to its unitholders, including us.
PVR has wide latitude to issue additional limited partner interests on the terms and conditions established by its general partner. PVG receives cash distributions from PVR on the general partner interest, IDRs and the limited partner interest that PVG holds. Because a majority of the cash PVG receives from PVR is attributable
TABLE OF CONTENTS
to PVG’s indirect ownership of the IDRs, payment of distributions on additional PVR limited partner interests may increase the risk that PVR will be unable to maintain or increase its quarterly cash distribution per unit, which in turn may reduce the amount of incentive distributions PVG receives and the available cash that PVG has to distribute to its unitholders, including us.
Conflicts of interest may arise because the board of directors of the respective general partners of PVG and PVR has a fiduciary duty to manage the general partners in a manner that is beneficial to their owners, and at the same time, in a manner that is beneficial to the respective unitholders of PVG and PVR.
We own the sole general partner of PVG and PVG owns the sole general partner of PVR. PVG and PVR are publicly traded limited partnerships. Each of the board of directors of the general partners owes a fiduciary duty to the respective unitholders of PVG and PVR, and not just to us and PVG as owners of the general partners. As a result of these conflicts, the board of directors of the general partners of PVG and PVR may favor the interests of the public unitholders of PVG and PVR over the interests of the respective owners of the general partners.
Our ability to sell our common units of PVG, and PVG’s ability to sell its partner interests in PVR, may be limited by securities law restrictions and liquidity constraints.
As of December 31, 2008, we owned 30,077,429 common units of PVG and PVG owned 19,587,049 common units of PVR, all of which are unregistered and restricted securities within the meaning of Rule 144 under the Securities Act of 1933, or the Securities Act. Unless we or PVG were to register these units, we or PVG are limited to selling into the market in any three-month period an amount of PVG common units or PVR common units that does not exceed the greater of 1% of the total number of common units outstanding or the average weekly reported trading volume of the common units for the four calendar weeks prior to the sale. In addition, PVG faces contractual limitations on its ability to sell its general partner interest and IDRs in PVR and the market for such interests is illiquid.
Congress is considering proposed legislation that may, if enacted, negatively impact the value of our limited partner interests in PVG by precluding PVG from qualifying for treatment as a partnership for U.S. federal income tax purposes under the publicly traded partnership rules.
In response to recent public offerings of interests in the management operations of private equity funds and hedge funds, members of Congress are considering substantive changes to the definition of qualifying income under Section 7704(d) of the Internal Revenue Code and changing the characterization of certain types of income received from partnerships. In particular, one proposal recharacterizes certain income and gain received with respect to “investment service partnership interests” as ordinary income for the performance of services, which may not be treated as qualifying income for publicly traded partnerships. As such proposal is currently interpreted, a significant portion of PVG’s interests in PVR may be viewed as an investment service partnership interest. Although we are unable to predict whether the proposed legislation, or any other proposals, will ultimately be enacted, the enactment of any such legislation could negatively impact the value of our limited partner interests in PVG.
Risks Related to PVR’s Coal and Natural Resource Management Business
If PVR’s lessees do not manage their operations well or experience financial difficulties, their production volumes and PVR’s coal royalties revenues could decrease.
PVR depends on its lessees to effectively manage their operations on its properties. PVR’s lessees make their own business decisions with respect to their operations, including decisions relating to:
credit review of their customers;
marketing of the coal mined;
coal transportation arrangements;
negotiations with unions;
employee hiring and firing;
employee wages, benefits and other compensation;
mine closure and reclamation.
If PVR’s lessees do not manage their operations well, or if they experience financial difficulties, their production could be reduced, which would result in lower coal royalties revenues to PVR and could have a material adverse effect on PVR’s business, results of operations or financial condition.
TABLE OF CONTENTS
The coal mining operations of PVR’s lessees are subject to numerous operational risks that could result in lower coal royalties revenues.
PVR’s coal royalties revenues are largely dependent on the level of production from its coal reserves achieved by its lessees. The level of PVR’s lessees’ production is subject to operating conditions or events that may increase PVR’s lessees’ cost of mining and delay or halt production at particular mines for varying lengths of time and that are beyond their or its control, including:
the inability to acquire necessary permits;
changes or variations in geologic conditions, such as the thickness of the coal deposits and the amount of rock embedded in or overlying the coal deposit;
changes in governmental regulation of the coal industry;
mining and processing equipment failures and unexpected maintenance problems;
adverse claims to title or existing defects of title;
interruptions due to power outages;
adverse weather and natural disasters, such as heavy rains and flooding;
labor-related interruptions;
employee injuries or fatalities; and
Any interruptions to the production of coal from PVR’s reserves could reduce its coal royalties revenues and could have a material adverse effect on PVR’s business, results of operations or financial condition. In addition, PVR’s coal royalties revenues are based upon sales of coal by its lessees to their customers. If PVR’s lessees do not receive payments for delivered coal on a timely basis from their customers, their cash flow would be adversely affected, which could cause PVR’s cash flow to be adversely affected and could have a material adverse effect on PVR’s business, results of operations or financial condition.
A substantial or extended decline in coal prices could reduce PVR’s coal royalties revenues and the value of PVR’s coal reserves.
A substantial or extended decline in coal prices from recent levels could have a material adverse effect on PVR’s lessees’ operations (including mine closures) and on the quantities of coal that may be economically produced from its properties. In addition, because a majority of PVR’s coal royalties are derived from coal mined on PVR’s properties under leases containing royalty rates based on the higher of a fixed base price or a percentage of the gross sales price, PVR’s coal royalties revenues could be reduced by such a decline. Such a decline could also reduce PVR’s coal services revenues and the value of its coal reserves. Additionally, volatility in coal prices could make it difficult to estimate with precision the value of PVR’s coal reserves and any coal reserves that PVR may consider for acquisition. The future impact of the current deteriorationstate of the global economy, including financial and credit markets on coal production levels and prices is uncertain. Depending on the longevity and ultimate severity of the deterioration,downturn, demand for coal may decline, which could adversely effect production and pricing for coal mined by PVR’s lessees, and, consequently, adversely effectaffect the royalty income received by PVR.
PVR depends on a limited number of primary operators for a significant portion of its coal royalties revenues and the loss of or reduction in production from any of PVR’s major lessees would reduce its coal royalties revenues.
PVR depends on a limited number of primary operators for a significant portion of its coal royalties revenues. In the year ended December 31, 2008,2009, five primary operators, each with multiple leases, accounted for 65%61% of PVR’s coal royalties revenues and 7%10% of our total consolidated revenues. If any of these operators enters bankruptcy or decides to cease operations or significantly reduces its production, PVR’s coal royalties revenues would be reduced.
TABLE OF CONTENTS
A failure on the part of PVR’s lessees to make coal royalty payments could give PVR the right to terminate the lease, repossess the property or obtain liquidation damages and/or enforce payment obligations under the lease. If PVR repossessed any of its properties, PVR would seek to find a replacement lessee. PVR may not be able to find a replacement lessee and, if it finds a replacement lessee, PVR may not be able to enter into a new lease on favorable terms within a reasonable period of time. In addition, the outgoing lessee could be subject to bankruptcy proceedings that could further delay the execution of a new lease or the assignment of the existing lease to another operator. If PVR enters into a new lease, the replacement operator might not achieve the same levels of production or sell coal at the same price as the lessee it replaced. In addition, it may be difficult for PVR to secure new or replacement lessees for small or isolated coal reserves, since industry trends toward consolidation favor larger-scale, higher technology mining operations to increase productivity rates.
PVR’s coal business will be adversely affected if PVR is unable to replace or increase its coal reserves through acquisitions.
Because PVR’s reserves decline as its lessees mine its coal, PVR’s future success and growth depends, in part, upon its ability to acquire additional coal reserves that are economically recoverable. The current deterioration instate of the global economy, including financial markets, and the consequential adverse effect on credit availability is adversely impacting PVR’s access to new capital and credit availability. Depending on the longevity and ultimate severity of this deterioration,downturn, PVR’s ability to make acquisitions may be significantly adversely affected. If PVR is unable to negotiate purchase contracts to replace or increase its coal reserves on acceptable terms, PVR’s coal royalties revenues will decline as its coal reserves are depleted and PVR could, therefore, experience a material adverse effect on its business, results of operations or financial condition. If PVR is able to acquire additional coal reserves, there is a possibility that any acquisition could be dilutive to earnings and reduce its ability to make distributions to unitholders, including us, or to pay interest on, or the principal of, its debt obligations. Any debt PVR incurs to finance an acquisition may similarly affect its ability to make distributions to unitholders, including us, or to pay interest on, or the principal of, its debt obligations. PVR’s ability to make acquisitions in the future also could be limited by restrictions under its existing or future debt agreements, competition from other coal companies for attractive properties or the lack of suitable acquisition candidates.
PVR’s lessees could satisfy obligations to their customers with coal from properties other than PVR’s, depriving PVR of the ability to receive amounts in excess of the minimum coal royalties payments.
PVR does not control its lessees’ business operations. PVR’s lessees’ customer supply contracts do not generally require its lessees to satisfy their obligations to their customers with coal mined from PVR’s reserves. Several factors may influence a lessee’s decision to supply its customers with coal mined from properties PVR does not own or lease, including the royalty rates under the lessee’s lease with PVR, mining conditions, transportation costs and availability and customer coal quality specifications. If a lessee satisfies its obligations to its customers with coal from properties PVR does not own or lease, production under its lease will decrease, and PVR will receive lower coal royalties revenues.
Fluctuations in transportation costs and the availability or reliability of transportation could reduce the production of coal mined from PVR’s properties.
Transportation costs represent a significant portion of the total cost of coal for the customers of PVR’s lessees. Increases in transportation costs could make coal a less competitive source of energy or could make coal produced by some or all of PVR’s lessees less competitive than coal produced from other sources. On the other hand, significant decreases in transportation costs could result in increased competition for PVR’s lessees from coal producers in other parts of the country or increased imports from offshore producers.
PVR’s lessees depend upon rail, barge, trucking, overland conveyor and other systems to deliver coal to their customers. Disruption of these transportation services due to weather-related problems, strikes, lockouts, bottlenecks, mechanical failures and other events could temporarily impair the ability of PVR’s lessees to supply coal to their customers. PVR’s lessees’ transportation providers may face difficulties in the future and impair the ability of its lessees to supply coal to their customers, thereby resulting in decreased coal royalties revenues to PVR.
TABLE OF CONTENTS
PVR’s lessees’ workforces could become increasingly unionized in the future, which could adversely affect their productivity and thereby reduce PVR’s coal royalties revenues.
One of PVR’s lessees has one mine operated by unionized employees. This mine was PVR’s third largest mine on the basis of coal production for the year ended December 31, 2008.2009. All of PVR’s lessees could become increasingly unionized in the future. If some or all of PVR’s lessees’ non-unionized operations were to become unionized, it could adversely affect their productivity and increase the risk of work stoppages. In addition, PVR’s lessees’ operations may be adversely affected by work stoppages at unionized companies, particularly if union workers were to orchestrate boycotts against its lessees’ operations. Any further unionization of PVR’s lessees’ employees could adversely affect the stability of production from its coal reserves and reduce its coal royalties revenues.
PVR’s coal reserve estimates depend on many assumptions that may be inaccurate, which could materially adversely affect the quantities and value of PVR’s coal reserves.
PVR’s estimates of its coal reserves may vary substantially from the actual amounts of coal its lessees may be able to economically recover. There are numerous uncertainties inherent in estimating quantities of reserves, including many factors beyond PVR’s control. Estimates of coal reserves necessarily depend upon a number of variables and assumptions, any one of which may, if incorrect, result in an estimate that varies considerably from actual results. These factors and assumptions relate to:
geological and mining conditions, which may not be fully identified by available exploration data;
the amount of ultimately recoverable coal in the ground;
the effects of regulation by governmental agencies; and
future coal prices, operating costs, capital expenditures, severance and excise taxes and development and reclamation costs.
Actual production, revenues and expenditures with respect to PVR’s coal reserves will likely vary from estimates, and these variations may be material. As a result, you should not place undue reliance on the coal reserve data provided by PVR.
Any change in fuel consumption patterns by electric power generators away from the use of coal could affect the ability of PVR’s lessees to sell the coal they produce and thereby reduce PVR’s coal royalties revenues.
According to the U.S. Department of Energy, domestic electric power generation accounted for approximately 90%89% of domestic coal consumption in 2007.2008. The amount of coal consumed for domestic electric power generation is affected primarily by the overall demand for electricity, the price and availability of competing fuels for power plants such as nuclear, natural gas, fuel oil and hydroelectric power and environmental and other governmental regulations. PVR believes that most new power plants will be built to produce electricity during peak periods of demand. Many of these new power plants will likely be fired by natural gas because of lower construction costs compared to coal-fired plants and because natural gas is a cleaner burning fuel. The increasingly stringent requirements of the CAA may result in more electric power generators shifting from coal to natural gas-fired power plants. See Item 1, “Business—“Business — Government Regulation and Environmental Matters—Matters — PVR Coal and Natural Resource Management Segment—Segment — Air Emissions.”
Extensive environmental laws and regulations affecting electric power generators could have corresponding effects on the ability of PVR’s lessees to sell the coal they produce and thereby reduce PVR’s coal royalties revenues.
Federal, state and local laws and regulations extensively regulate the amount of sulfur dioxide, particulate matter, nitrogen oxides, mercury and other compounds emitted into the air from electric power plants, which are the ultimate consumers of the coal PVR’s lessees produce. These laws and regulations can require significant emission control expenditures for many coal-fired power plants, and various new and proposed laws and regulations may require further emission reductions and associated emission control expenditures. As
TABLE OF CONTENTS
a result of these current and proposed laws, regulations and trends, electricity generators may elect to switch to other fuels that generate less of these emissions, possibly further reducing demand for the coal that PVR’s lessees produce and thereby reducing its coal royalties revenues. See Item 1, “Business—“Business — Government Regulation and Environmental Matters—Matters — PVR Coal and Natural Resource Management Segment—Segment — Air Emissions.”
Concerns about the environmental impacts of fossil-fuel emissions, including perceived impacts on global climate change, are resulting in increased regulation of emissions of greenhouse gases in many jurisdictions and increased interest in and the likelihood of further regulation, which could significantly affect PVR’s coal royalties revenues.
Global climate change continues to attract considerable public and scientific attention. Several widely publicized scientific reports have engendered widespread concern about the impacts of human activity, especially fossil fuel combustion, on global climate change. Legislative attention in the United States is being paid to global climate change and to reducing greenhouse gas emissions, particularly from coal combustion by power plants. Such legislation was introduced in Congress in 2006, 2007 and 2008the last several years to reduce greenhouse gas emissions in the United States and further proposals or amendments are likely to be offered in the future. AlthoughIn anticipation of EPA’s endangerment finding regarding greenhouse gas emissions (which was finalized in December 2009), the United States Supreme Court’s recent decision inMassachusetts v. Environmental Protection Agency relatedagency proposed two sets of rules regarding possible future regulation of greenhouse gas emissions under the CAA. While the first proposes to newregulate greenhouse gas emissions from motor vehicles, the reasoning of the decision could affect regulation of carbon dioxide emissions under other federal regulatory programs, including those that regulatetargets greenhouse gas emissions from coal-firedlarge stationary sources such as power plants.plants or industrial facilities. Several states have also either passed legislation or announced initiatives focused on decreasing or stabilizing carbon dioxide emissions associated with the combustion of fossil fuels, and many of these measures have focused on emissions from coal-fired power plants. See Item 1, “Business—“Business — Governmental Regulation and Environmental Matters—Matters — PVR Coal and Natural Resource Management Segment—Segment — Air Emissions.” Enactment of laws, passage of regulations regarding greenhouse gas emissions by the United States or some of its states, or other actions to limit carbon dioxide emissions could result in electric generators switching from coal to other fuel sources. This may adversely affect the use of and demand for fossil fuels, particularly coal.
Delays in PVR’s lessees obtaining mining permits and approvals, or the inability to obtain required permits and approvals, could have an adverse effect on PVR’s coal royalties revenues.
Mine operators, including PVR’s lessees, must obtain numerous permits and approvals that impose strict conditions and obligations relating to various environmental and safety matters in connection with coal mining. The permitting rules are complex and can change over time. The public has the right to comment on many permit applications and otherwise participate in the permitting process, including through court intervention. Accordingly, permits required by PVR’s lessees to conduct operations may not be issued, maintained or renewed, may not be issued or renewed in a timely fashion, or may involve requirements that restrict PVR’s lessees’ ability to economically conduct their mining operations. Limitations on PVR’s lessees’ ability to conduct their mining operations due to the inability to obtain or renew necessary permits, or due to uncertainty, litigation or delays associated with the eventual issuance of these permits, could have an adverse effect on its coal royalties revenues. See Item 1, “Business—“Business — Government Regulation and Environmental Matters—Matters — PVR Coal and Natural Resource Management Segment—Segment — Mining Permits and Approvals.”
Uncertainty over the precise parameters of the CWA’s regulatory scope and a recent federal district court decision may adversely impact PVR’s coal lessees’ ability to secure the necessary permits for their valley fill surface mining activities.
To dispose of mining overburden generated from surface mining activities, PVR’s lessees often need to obtain government approvals, including CWA Section 404 permits to construct valley fills and sediment control ponds. Ongoing uncertainty over which waters are subject to the CWA may adversely impact PVR’s lessees’ ability to secure these necessary permits. In addition, a 2007 decision by a U.S. District Court in West Virginia invalidated a permit issued to one of PVR’s lessees for the Republic No. 2 Mine and enjoined PVR’s lessee, Alex Energy, Inc., from taking any further actions under this permit. This ruling was appealed and the appellate court reversed and vacated the district court’s order. It is unclear if this ruling will be appealed or if
TABLE OF CONTENTS
the permits will be challenged on other grounds. Uncertainty over the correct legal standard for issuing Section 404 permits may lead to rulings invalidating other permits, additional challenges to various permits and additional delays and costs in applying for and obtaining new permits that could ultimately have an adverse effect on PVR’s
coal royalties revenues. See Item 1, “Business—“Business — Government Regulation and Environmental Matters—Matters — PVR Coal and Natural Resource Management Segment—Segment — Clean Water Act,” for more information about the litigation described above
PVR’s lessees’ mining operations are subject to extensive and costly laws and regulations, which could increase operating costs and limit its lessees’ ability to produce coal, which could have an adverse effect on PVR’s coal royalties revenues.
PVR’s lessees are subject to numerous and detailed federal, state and local laws and regulations affecting coal mining operations, including laws and regulations pertaining to employee health and safety, permitting and licensing requirements, air quality standards, water pollution, plant and wildlife protection, reclamation and restoration of mining properties after mining is completed, the discharge of materials into the environment, surface subsidence from underground mining and the effects that mining has on groundwater quality and availability. Numerous governmental permits and approvals are required for mining operations. PVR’s lessees are required to prepare and present to federal, state or local authorities data pertaining to the effect or impact that any proposed exploration for or production of coal may have upon the environment. The costs, liabilities and requirements associated with these regulations may be significant and time-consuming and may delay commencement or continuation of exploration or production operations. The possibility exists that new laws or regulations (or judicial interpretations of existing laws and regulations) may be adopted in the future that could materially affect PVR’s lessees’ mining operations, either through direct impacts such as new requirements impacting its lessees’ existing mining operations, or indirect impacts such as new laws and regulations that discourage or limit coal consumers’ use of coal. Any of these direct or indirect impacts could have an adverse effect on PVR’s coal royalties revenues. See Item 1, “Business—“Business — Government Regulation and Environmental Matters—Matters — PVR Coal and Natural Resource Management Segment.”
Because of extensive and comprehensive regulatory requirements, violations during mining operations are not unusual in the industry and, notwithstanding compliance efforts, PVR does not believe violations by its lessees can be eliminated completely. Failure to comply with these laws and regulations may result in the assessment of administrative, civil and criminal penalties, the imposition of cleanup and site restoration costs and liens and, to a lesser extent, the issuance of injunctions to limit or cease operations. PVR’s lessees may also incur costs and liabilities resulting from claims for damages to property or injury to persons arising from their operations. If PVR’s lessees are required to pay these costs and liabilities and if their financial viability is affected by doing so, then their mining operations and, as a result, PVR’s coal royalties revenues and its ability to make distributions to us, could be adversely affected.
The PVR coal and natural resource management segment may record impairment losses on its long-lived assets.
The PVR coal and natural resource management segment has completed a number of acquisitions in recent years. See Note 4, “Acquisitions and Divestitures,” in the Notes to Consolidated Financial Statements in Item 8, “Financial Statements and Supplementary Data,” for a description of the PVR coal and natural resource management segment’s material acquisitions. In conjunction with our accounting for these acquisitions, it was necessary for us to estimate the values of the assets acquired and liabilities assumed, which involved the use of various assumptions. The most significant assumptions, and the ones requiring the most judgment, involve the estimated fair values of property, plant and equipment, and the resulting amount of goodwill, if any. Unforeseen changes in operations, the business environment or market conditions could substantially alter management’s assumptions and could result in lower estimates of values of acquired assets or of future cash flows. This could result in impairment charges being recorded in our consolidated statements of income.
Risks Related to PVR’s Natural Gas Midstream Business
The success of PVR’s natural gas midstream business depends upon its ability to find and contract for new sources of natural gas supply.
In order to maintain or increase system throughput levels on PVR’s gathering systems and asset utilization rates at its processing plants, PVR must contract for new natural gas supplies. The primary factors affecting PVR’s ability to connect new supplies of natural gas to its gathering systems include the level of drilling activity creating new gas supply near its gathering systems, PVR’s success in contracting for existing natural gas supplies that are not committed to other systems and PVR’s ability to expand and increase the capacity of its systems. PVR may not be able to obtain additional contracts for natural gas supplies.
Fluctuations in energy prices can greatly affect production rates and investments by third parties in the development of new oil and natural gas reserves. Drilling activity generally decreases as oil and natural gas prices decrease. PVR has no control over the level of drilling activity in its areas of operations, the amount of reserves underlying the wells and the rate at which production from a well will decline. In addition, PVR has no control over producers or their production decisions,
which are affected by, among other things, prevailing and projected energy prices, demand for hydrocarbons, the level of reserves, geological considerations, governmental regulation and the availability and cost of capital.
TABLE OF CONTENTS
PVR’s natural gas midstream assets, including its gathering systems and processing plants, are connected to natural gas reserves and wells for which the production will naturally decline over time. PVR’s cash flows associated with these systems will decline unless it is able to secure new supplies of natural gas by connecting additional production to these systems. A material decrease in natural gas production in PVR’s areas of operation, as a result of depressed commodity prices or otherwise, would result in a decline in the volume of natural gas PVR handles, which would reduce its revenues and operating income. In addition, PVR’s future growth will depend, in part, upon whether it can contract for additional supplies at a greater rate than the rate of natural decline in PVR’s currently connected supplies.
PVR typically does not obtain independent evaluations of natural gas reserves dedicated to its gathering systems; therefore, volumes of natural gas on PVR’s systems in the future could be less than it anticipates.
PVR typically does not obtain independent evaluations of natural gas reserves connected to its gathering systems due to the unwillingness of producers to provide reserve information, as well as the cost of such evaluations. Accordingly, PVR does not have independent estimates of total reserves dedicated to its gathering systems or the anticipated life of such reserves. If the total reserves or estimated life of the reserves connected to PVR’s gathering systems is less than it anticipates and PVR’s is unable to secure additional sources of natural gas, then the volumes of natural gas gathered on PVR’s gathering systems in the future could be less than PVR anticipates. A decline in the volumes of natural gas on PVR’s systems could have a material adverse effect on PVR’s business, results of operations or financial condition.
A reduction in demand for NGL products by the petrochemical, refining or heating industries could materially adversely affect PVR’s business, results of operations and financial condition.
The NGL products PVR produces, including ethane, propane, normal butane, isobutane and natural gasoline, have a variety of applications, including as heating fuels, petrochemical feedstocks and refining blend stocks. A reduction in demand for NGL products, whether because of general economic conditions, new government regulations, reduced demand by consumers for products made with NGL products, increased competition from petroleum-based products due to pricing differences, mild winter weather or other reasons, could result in a decline in the volume of NGL products PVR handles or reduce the fees PVR charges for its services. Any reduced demand for PVR’s NGL products could adversely affect demand for the services PVR provides as well as NGL prices, which would negatively impact PVR’s results of operations and financial condition.
The profitability of PVR’s natural gas midstream business is dependent upon prices and market demand for natural gas and NGLs, which are beyond PVR’s control and have been volatile.
PVR is subject to significant risks due to fluctuations in natural gas commodity prices. During 2008,2009, PVR generated a majority of its gross margin from two types of contractual arrangements under which its margin is exposed to increases and decreases in the price of natural gas and NGLs—NGLs — gas purchase/keep-whole and percentage-of-proceeds arrangements. See Item 1, “Business—Contracts—“Business — Contracts — PVR Natural Gas Midstream Segment.”
Virtually all of the system throughput volumes in PVR’s Crescent System and Hamlin System are processed under percentage-of-proceeds arrangements. The system throughput volumes in PVR’s Panhandle System are processed primarily under either percentage-of proceeds or gas purchase/keep-whole arrangements. Under both types of arrangements, PVR provides gathering and processing services for natural gas received. Under percentage-of-proceeds arrangements, PVR generally sells the NGLs produced from the processing operations and the remaining residue gas at market prices and remits to the producers an agreed upon percentage of the proceeds based on either an index price or the price actually received for gas and NGLs. Under these arrangements, revenues and gross margins decline when natural gas prices and NGL prices decrease. Accordingly, a decrease in the price of natural gas or NGLs could have a material adverse effect on PVR’s business, results of operations or financial condition. Under gas purchase/keep-whole arrangements, PVR generally buys natural gas from producers based upon an index price and then sells the NGLs and the remaining residue gas to third parties at market prices. Because the extraction of the NGLs from the natural gas during processing reduces the volume of natural gas available for sale, profitability is dependent on the value of those NGLs being higher than the value of the volume of gas reduction or “shrink.” Under these
TABLE OF CONTENTS
arrangements, revenues and gross margins decrease when the price of natural gas increases relative to the price of NGLs. Accordingly, a change in the relationship between the price of natural gas and the price of NGLs could have a material adverse effect on PVR’s business, results of operations or financial condition.
In the past, the prices of natural gas and NGLs have been extremely volatile, and PVR expects this volatility to continue. The markets and prices for residue gas and NGLs depend upon factors beyond PVR’s control. These factors include demand for oil, natural gas and NGLs, which fluctuates with changes in market and economic conditions, and other factors, including:
the impactstate of the current deterioration in the global economy, including financial and credit markets, on worldwide demand for oil and domestic demand for natural gas and NGLs;
the impact of weather on the demand for oil and natural gas
the level of domestic oil and natural gas production;
the availability of imported oil and natural gas;
actions taken by foreign oil and gas producing nations;
the availability of local, intrastate and interstate transportation systems;
the availability and marketing of competitive fuels;
the impact of energy conservation efforts; and
the extent of governmental regulation and taxation.
Acquisitions and expansions may affect PVR’s business by substantially increasing the level of its indebtedness and contingent liabilities and increasing the risks of being unable to effectively integrate these new operations.
From time to time, PVR evaluates and acquires assets and businesses that it believes complement its existing operations. Readily available access to debt and equity capital and credit availability has been and continues to be critical factors in PVR’s ability to grow. The current deterioration instate of the global economy, including financial markets, and the consequential adverse effect on credit availability is adversely impacting PVR’s access to new capital and credit availability. Depending on the longevity and ultimate severity of the deterioration,this downturn, PVR’s ability to make acquisitions may be significantly adversely affected. In the event PVR completes acquisitions, PVR may encounter difficulties integrating these acquisitions with its existing businesses without a loss of employees or customers, a loss of revenues, an increase in operating or other costs or other difficulties. In addition, PVR may not be able to realize the operating efficiencies, competitive advantages, cost savings or other benefits expected from these acquisitions. Future acquisitions might not generate increases in PVR’s cash distributions to its unitholders, and because of the capital used to complete such acquisitions, or the debt incurred, PVR’s and our results of operations may change significantly.
Expanding PVR’s natural gas midstream business by constructing new gathering systems, pipelines and processing facilities subjects PVR to construction risks.
One of the ways PVR may grow its natural gas midstream business is through the construction of additions to existing gathering, compression and processing systems. The construction of a new gathering system or pipeline, the expansion of an existing pipeline through the addition of new pipe or compression and the construction of new processing facilities involve numerous regulatory, environmental, political and legal uncertainties beyond PVR’s control and require the expenditure of significant amounts of capital. PVR’s access to such capital is currently adversely impacted by the deterioration instate of the global economy, including financial and credit markets. If PVR does undertake these projects, they may not be completed on schedule, or at all, or at the anticipated cost. Moreover, PVR’s revenues may not increase immediately upon the expenditure of funds on a particular project. For example, the construction of gathering facilities requires the expenditure of significant amounts of capital, which may exceed PVR’s estimates. Generally, PVR may have only limited natural gas supplies committed to these facilities prior to their construction. Moreover, PVR may construct facilities to capture anticipated future growth in production in a region in which anticipated production growth does not materialize. As a result, there is the risk that new facilities may not be able to attract enough natural
TABLE OF CONTENTS
gas to achieve PVR’s expected investment return, which could have a material adverse effect on PVR’s business, results of operations or financial condition.
If PVR is unable to obtain new rights-of-way or the cost of renewing existing rights-of-way increases, then PVR may be unable to fully execute its growth strategy and its cash flows could be reduced.
The construction of additions to PVR’s existing gathering assets may require PVR to obtain new rights-of-way before constructing new pipelines. PVR may be unable to obtain rights-of-way to connect new natural gas supplies to its existing gathering lines or capitalize on other attractive expansion opportunities. Additionally, it may become more expensive for PVR to obtain new rights-of-way or to renew existing rights-of-way. If the cost of obtaining new rights-of-way or renewing existing rights-of-way increases, then PVR’s cash flows could be reduced.
PVR is exposed to the credit risk of its natural gas midstream customers, and nonpayment or nonperformance by PVR’s customers would reduce its cash flows.
PVR is subject to risk of loss resulting from nonpayment or nonperformance by its natural gas midstream customers. PVR depends on a limited number of customers for a significant portion of its natural gas midstream revenues. In the year ended December 31, 2008, 40%2009, 21% of PVR’s natural gas midstream segment revenues and 24%13% of our total consolidated revenues related to two of PVR’s natural gas midstream segment customers. Any nonpayment or nonperformance by PVR’s natural gas midstream segment customers would reduce its cash flows.
Any reduction in the capacity of, or the allocations to, PVR in interconnecting third-party pipelines could cause a reduction of volumes processed, which could adversely affect PVR’s revenues and cash flows.
PVR is dependent upon connections to third-party pipelines to receive and deliver residue gas and NGLs. Any reduction of capacities of these interconnecting pipelines due to testing, line repair, reduced operating pressures or other causes could result in reduced volumes gathered and processed in PVR’s natural gas midstream facilities. Similarly, if additional shippers begin transporting volumes of residue gas and NGLs on interconnecting pipelines, PVR’s allocations in these pipelines could be reduced. Any reduction in volumes gathered and processed in PVR’s facilities could adversely affect its revenues and cash flows.
Natural gas derivative transactions may limit PVR’s potential gains and involve other risks.
In order to manage PVR’s exposure to price risks in the marketing of its natural gas and NGLs, PVR periodically enters into condensate, natural gas and NGL price hedging arrangements with respect to a portion of its expected production. PVR’s hedges are limited in duration, usually for periods of two years or less. However, in connection with acquisitions, sometimes PVR’s hedges are for longer periods. These hedging transactions may limit PVR’s potential gains if natural gas or NGL prices were to rise (or decline with respect to natural gas hedges entered into to lock the frac spread) over the price established by the hedging arrangements. Moreover, PVR has entered into derivative transactions related to only a portion of its condensate, natural gas and NGL volumes. As a result, PVR will continue to have direct commodity price risk with respect to the unhedged portion of these volumes. In trying to maintain an appropriate balance, PVR may end up hedging too much or too little, depending upon how natural gas or NGL prices fluctuate in the future.
In addition, derivative transactions may expose PVR to the risk of financial loss in certain circumstances, including instances in which:
PVR’s production is less than expected;
there is a widening of price basis differentials between delivery points for PVR’s production and the delivery point assumed in the hedge arrangement;
the counterparties to PVR’s futures contracts fail to perform under the contracts; or
a sudden, unexpected event materially impacts natural gas or NGL prices.
In addition, derivative instruments involve basis risk. Basis risk in a derivative contract occurs when the index upon which the contract is based is more or less variable than the index upon which the hedged asset is based, thereby making the hedge less effective. For example, a NYMEX index used for hedging certain volumes of production may have more or less variability than the regional price index used for the sale of that production.
The accounting standards regarding hedge accounting are complex, and even when PVR engages in hedging transactions that are effective economically, these transactions may not be considered effective for accounting purposes. Accordingly, our consolidated financial statementsConsolidated Financial Statements may reflect volatility due to these derivatives, even when there is no underlying economic impact at that point. In addition, it is not always possible for PVR to engage in a derivative transaction that completely mitigates its exposure to commodity prices. Our consolidated financial statementsConsolidated Financial Statements may reflect a gain or loss arising from an exposure to commodity prices for which PVR is unable to enter into a completely effective hedge transaction.
PVR’s natural gas midstream business involves many hazards and operational risks, some of which may not be fully covered by insurance.
PVR’s natural gas midstream operations are subject to the many hazards inherent in the gathering, compression, treating, processing and transportation of natural gas and NGLs, including:
damage to pipelines, related equipment and surrounding properties caused by hurricanes, tornadoes, floods, fires and other natural disasters and acts of terrorism;
inadvertent damage from construction and farm equipment;
leaks of natural gas, NGLs and other hydrocarbons; and
These risks could result in substantial losses due to personal injury or loss of life, severe damage to and destruction of property and equipment and pollution or other environmental damage and may result in curtailment or suspension of PVR’s related operations. PVR’s natural gas midstream operations are concentrated in Texas and Oklahoma, and a natural disaster or other hazard affecting these areas could have a material adverse effect on its business, results of operations or financial condition. PVR is not fully insured against all risks incident to its natural gas midstream business. PVR does not have property insurance on all of its underground pipeline systems that would cover damage to the pipelines. PVR is not insured against all environmental accidents that might occur, other than those considered to be sudden and accidental. If a significant accident or event occurs that is not fully insured, it could adversely affect PVR’s business, results of operations or financial condition.
Federal, state or local regulatory measures could adversely affect PVR’s natural gas midstream business.
PVR owns and operates an 11-mile interstate natural gas pipeline that, pursuant to the NGA, is subject to the jurisdiction of the FERC. The FERC has granted PVR waivers of various requirements otherwise applicable to conventional FERC-jurisdictional pipelines, including the obligation to file a tariff governing rates, terms and conditions of open access transportation service. The FERC has determined that PVR will have to comply with the filing requirements if the PVR natural gas midstream segment ever desires to apply for blanket transportation authority to transport third-party gas on the 11-mile pipeline. The FERC may revoke these waivers at any time.
PVR’s natural gas gathering facilities generally are exempt from the FERC’s jurisdiction under the NGA, but the FERC regulation nevertheless could change and significantly affect PVR’s gathering business and the market for its services. For a more detailed discussion of how regulatory measures affect PVR’s natural gas gathering business, see Item 1, “Business?“Business — Government Regulation and Environmental Matters?Matters — PVR Natural Gas Midstream Segment.”
Failure to comply with applicable federal and state laws and regulations can result in the imposition of administrative, civil and criminal remedies.
TABLE OF CONTENTS
The PVR natural gas midstream business is subject to extensive environmental regulation.
Many of the operations and activities of PVR’s gathering systems, plants and other facilities are subject to significant federal, state and local environmental laws and regulations. These include, for example, laws and regulations that impose obligations related to air emissions and discharge of wastes from PVR’s facilities and the cleanup of hazardous substances that may have been released at properties currently or previously owned or operated by PVR or the prior owners of its natural gas midstream business or locations to which it or they have sent wastes for disposal. These laws and regulations can restrict or impact PVR’s business activities in many ways, including restricting the manner in which it disposes of substances, requiring pre-approval for the construction or modification of certain projects or facilities expected to produce air emissions, requiring remedial action to remove or mitigate contamination, and requiring capital expenditures to comply with control requirements. Failure to comply with these laws and regulations may trigger a variety of administrative, civil and criminal enforcement measures, including the assessment of monetary penalties, the imposition of remedial requirements and the issuance of orders enjoining future operations. Certain environmental statutes impose strict, joint and several liability for costs required to clean up and restore sites where substances and wastes have been disposed or otherwise released. Moreover, it is not uncommon for neighboring landowners and other third parties to file claims for personal injury and property damage allegedly caused by the release of substances or wastes into the environment.
There is inherent risk of the incurrence of environmental costs and liabilities in PVR’s natural gas midstream business due to its handling of natural gas and other petroleum products, air emissions related to its natural gas midstream operations, historical industry operations, waste disposal practices and the use by the prior owners of its natural gas midstream business of natural gas flow meters containing mercury. For example, an accidental release from one of PVR’s pipelines or processing facilities could subject it to substantial liabilities arising from environmental cleanup, restoration costs and natural resource damages, claims made by neighboring landowners and other third parties for personal injury and property damage, and fines or penalties for related violations of environmental laws or regulations. Moreover, the possibility exists that stricter
laws, regulations or enforcement policies could significantly increase PVR’s compliance costs and the cost of any remediation that may become necessary. PVR may incur material environmental costs and liabilities. Insurance may not provide sufficient coverage in the event an environmental claim is made. See Item 1, “Business—“Business — Government Regulation and Environmental Matters—Matters — PVR Natural Gas Midstream Segment.”
The PVR natural gas midstream segment may record impairment losses on its long-lived assets.
The PVR natural gas midstream segment has completed a number of acquisitions in recent years.years, including the North Texas System (Lone Star Gathering, L.P., or Lone Star). See Note 4, “Acquisitions and Divestitures,” in5 to the Notes to Consolidated Financial Statements in Item 8, “Financial Statements and Supplementary Data,” for a description of the PVR natural gas midstream segment’s material acquisitions. In conjunction with our accounting for these acquisitions, it was necessary for us to estimate the values of the assets acquired and liabilities assumed, which involved the use of various assumptions. The most significant assumptions, and the ones requiring the most judgment, involve the estimated fair values of property, plant and equipment, and the resulting amount of goodwill, if any. Unforeseen changes in operations, the business environment or market conditions could substantially alter management’s assumptions and could result in lower estimates of values of acquired assets or of future cash flows. This could result in impairment charges being recorded in our consolidated statementsConsolidated Statements of income.Income.
Item 1B Unresolved Staff Comments
The North Texas Gas Gathering System has a limited operating history and has system throughput volumes representing only a small percentage of its total design capacity.
The assets comprising the North Texas Gas Gathering System were all built after June 2005 and, consequently, have a limited operating history. In addition, the total current system throughput volumes on the North Texas Gas Gathering System represent only a small percentage of its total design capacity. Accordingly, the North Texas Gas Gathering System to date has generated only modest levels of revenues. In order for PVR’s 2008 acquisition of substantially all of the assets of Lone Star Gathering L.P., or Lone Star, to be a success, PVR will need to substantially increase system throughput volumes over historical levels. Any such increase will require a significant increase in PVR’s producers’ production in the areas served by the North Texas Gas Gathering System, and no assurance can be given that they will be able to so increase production or sustain such an increase over time. In particular, while producers are currently actively drilling in Johnson and Hill Counties, PVR expects that the success of the Lone Star acquisition will require producers to expand their drilling and production activities in Bosque, Hamilton, Somervell and Erath Counties. PVR also will need to operate the North Texas Gas Gathering System reliably and efficiently, in the absence of any significant operating history on which to draw. While the North Texas Gas Gathering System is modern, there may be unexpected operating and capital expenditures necessary to operate it properly. In addition, PVR will need to effectively integrate the North Texas Gas Gathering System within its existing natural gas midstream business, both operationally and administratively. We cannot assure that these endeavors will be successful. If PVR is unsuccessful, the revenues from the North Texas Gas Gathering System will be adversely affected.
Item 1B | Unresolved Staff Comments |
Wehave received no written comments from the SEC staff comments regarding our periodic or current reports under the Exchange Act withinwhich were issued 180 days beforeor more preceding the end of our 2009 fiscal year ended December 31, 2008.that remain unresolved.
TABLE OF CONTENTS
Item 2 Properties
Title to Properties
The following map shows the general locations of our oil and gas production and exploration, PVR’s coal reserves and related infrastructure investments and PVR’s natural gas gathering and processing systems as of December 31, 2008:
2009: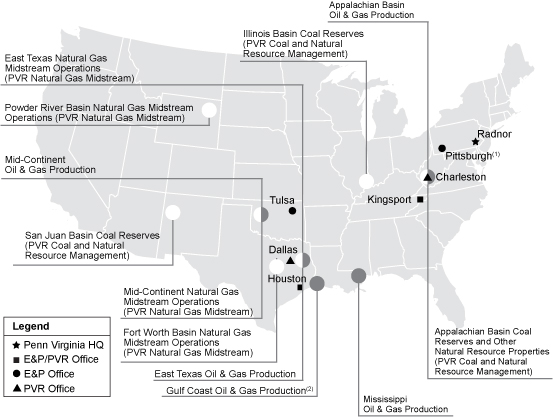
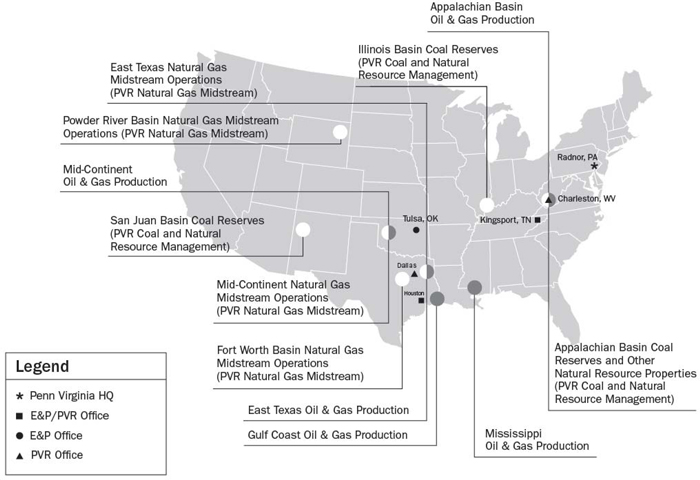
| (1) | We opened a Pittsburgh, PA office in the first half of 2010. |
| (2) | We sold our Gulf Coast oil and gas production assets in January 2010. |
We believe that we have satisfactory title to all of our properties and the associated oil, natural gas and coal reserves in accordance with standards generally accepted in the oil and natural gas, coal and natural resource management and natural gas midstream industries.
Facilities
We are headquartered in Radnor, Pennsylvania, with additional offices in Pittsburgh, Pennsylvania, Oklahoma, Tennessee, Texas and West Virginia. All of our office facilities are leased, except for PVR’s West Virginia office, which it owns. We believe that our properties are adequate for our current needs.
Oil and Gas Segment Properties
As is customary in the oil and gas industry, we make only a cursory review of title to farmout acreage and to undeveloped oil and gas leases upon execution of any contracts. Prior to the commencement of drilling operations, a thorough title examination is conducted and curative work is performed with respect to significant defects. To the extent title opinions or other investigations reflect defects, we cure such title defects. If we were unable to remedy or cure any title defect of a nature such that it would not be prudent to commence drilling operations on a property, we could suffer a loss of our investment in the property. Prior to completing an acquisition of producing oil and gas assets, we obtain or review title opinions on all material
TABLE OF CONTENTS
leases. Our oil and gas properties are subject to customary royalty interests, liens for current taxes and other burdens that we believe do not materially interfere with the use or materially affect the value of such properties.
Production and Pricing
The following table sets forth production, average realized prices and production expenses with respect to our properties in the oil and gas segment for the years ended December 31, 2008, 2007 and 2006:
| | | | | | | | | | | | |
| | | Year Ended December 31, | |
| | | 2008 | | | 2007 | | | 2006 | |
Production | | | | | | | | | | | | |
Natural gas (MMcf) | | | 41,493 | | | | 37,802 | | | | 28,968 | |
Crude oil (MBbl) | | | 506 | | | | 325 | | | | 288 | |
NGL (MBbl) | | | 392 | | | | 136 | | | | 94 | |
Total production (MMcfe) | | | 46,881 | | | | 40,569 | | | | 31,260 | |
Average realized prices (1) | | | | | | | | | | | | |
Natural gas ($/Mcf): | | | | | | | | | | | | |
Natural gas revenues, as reported | | $ | 8.89 | | | $ | 6.94 | | | $ | 7.35 | |
Derivatives (gains) losses included in natural gas revenues | | | — | | | | (0.01 | ) | | | (0.02 | ) |
| | | | | | | | | | | | |
Natural gas revenues before impact of derivatives | | | 8.89 | | | | 6.93 | | | | 7.33 | |
Cash settlements on natural gas derivatives (2) | | | (0.18 | ) | | | 0.39 | | | | 0.37 | |
| | | | | | | | | | | | |
Natural gas revenues, adjusted for derivatives | | $ | 8.71 | | | $ | 7.32 | | | $ | 7.70 | |
| | | | | | | | | | | | |
Crude oil ($/Bbl): | | | | | | | | | | | | |
Crude oil revenues, as reported | | $ | 91.95 | | | $ | 69.04 | | | $ | 61.23 | |
Derivatives (gains) losses included in crude oil revenues | | | — | | | | 1.54 | | | | 1.59 | |
| | | | | | | | | | | | |
Crude oil revenues before impact of derivatives | | | 91.95 | | | | 70.58 | | | | 62.82 | |
Cash settlements on crude oil derivatives (2) | | | (0.55 | ) | | | (2.26 | ) | | | (0.77 | ) |
| | | | | | | | | | | | |
Crude oil revenues, adjusted for derivatives | | $ | 91.40 | | | $ | 68.32 | | | $ | 62.05 | |
| | | | | | | | | | | | |
Production expenses ($/Mcfe) | | | | | | | | | | | | |
Lease operating | | $ | 1.27 | | | $ | 1.15 | | | $ | 0.88 | |
Taxes other than income | | | 0.50 | | | | 0.44 | | | | 0.38 | |
General and administrative | | | 0.45 | | | | 0.40 | | | | 0.41 | |
| | | | | | | | | | | | |
Total production expenses | | $ | 2.22 | | | $ | 1.99 | | | $ | 1.67 | |
| | | | | | | | | | | | |
(1) | In 2006, we discontinued hedge accounting prospectively for our remaining and future commodity derivatives. Consequently, we began recognizing mark-to-market gains and losses in earnings currently, rather than deferring such amounts in accumulated other comprehensive income. The derivatives (gains) losses included in natural gas revenues and crude oil revenues represent the reclassifications out of accumulated other comprehensive income related to the derivatives for which we discontinued hedge accounting in 2006. The average realized prices represent the effects of the derivatives for which we discontinued hedge accounting on our natural gas and crude oil revenues. |
(2) | Cash settlements on derivatives represent the realized portion of the commodity derivatives and are recorded on the derivatives line on the consolidated statements of income. Had we not elected to discontinue hedge accounting, the cash settlements would have been recognized in the natural gas and crude oil revenues lines on the consolidated statements of income. |
Proved Reserves
The following table presents certain information regarding our proved reserves as of December 31, 2009, 2008 2007 and 2006.2007. The proved reserve estimates presented below were prepared by Wright and& Company, Inc., independent petroleum engineers. No reserve estimate has been filed with any federal authority or agency since January 1, 2008. For additional information regarding estimates of proved reserves the preparation of such estimates by Wright and Company, Inc. and other information about our oil and gas reserves, see the Supplemental Information on Oil and Gas Producing Activities (Unaudited) in the Notes to the Consolidated Financial Statements in Item 8, “Financial Statements and Supplementary Data.” Our estimatesthe report of proved reserves inWright & Company Inc., which is included as an Exhibit to this annual report. We did not file any reports during the following table are consistentyear ended December 31, 2009 with those filed by usany federal authority or agency with other federal agencies.
respect to our estimate of oil and gas reserves. | | | | | | | | | | | | | | | | | | | | | | | | |
| | | Natural
Gas | | Oil and
Condensate | | Natural
Gas
Equivalents | | Standardized
Measure (1) | | Year-End Prices
Used (2) | | Natural
Gas | | Oil and
Condensate | | Natural
Gas
Equivalents | | Standardized
Measure(1) | | Price Measurement Used(2) |
| | | | (Bcf) | | (MMBbl) | | (Bcfe) | | $ in millions | | $/MMBtu | | $/Bbl |
2009
| | | | | | | | | | | | | | | | | | | | | | | | | |
| Developed | | | | 388 | | | | 8.4 | | | | 439 | | | $ | 425 | | | | | | | | | |
| Undeveloped | | | | 389 | | | | 18.0 | | | | 496 | | | | 100 | | | | | | | | | |
| | | (Bcf) | | (MMBbl) | | (Bcfe) | | (in millions) | | $/
MMBtu | | $/Bbl | | | 777 | | | | 26.4 | | | | 935 | | | $ | 525 | | | $ | 3.87 | | | $ | 61.18 | |
2008 | | | | | | | | | | | | | | | | | | | | | | | | | | | | | | | | | | | | |
Developed | | 411 | | 9.9 | | 470 | | $ | 692 | | | | | | | 411 | | | | 9.9 | | | | 470 | | | $ | 692 | | | | | | | | | |
Undeveloped | | 343 | | 17.1 | | 446 | | | 37 | | | | | | | 343 | | | | 17.1 | | | | 446 | | | | 37 | | | | | | | | | |
| | | | | | | | | | | | | | | 754 | | | | 27.0 | | | | 916 | | | $ | 729 | | | $ | 5.71 | | | $ | 44.60 | |
Total | | 754 | | 27.0 | | 916 | | $ | 729 | | $ | 5.71 | | $ | 44.60 | |
| | | | | | | | | | | | | |
| 2007 | | | | | | | | | | | | | | | | | | | | | | | | | | | | | | | | | | | | |
Developed | | 373 | | 4.5 | | 399 | | $ | 788 | | | | | | | 373 | | | | 4.5 | | | | 399 | | | $ | 788 | | | | | | | | | |
Undeveloped | | 215 | | 10.7 | | 281 | | | 184 | | | | | | | 215 | | | | 10.7 | | | | 281 | | | | 184 | | | | | | | | | |
| | | | | | | | | | | | | | | 588 | | | | 15.2 | | | | 680 | | | $ | 972 | | | $ | 6.80 | | | $ | 95.95 | |
Total | | 588 | | 15.2 | | 680 | | $ | 972 | | $ | 6.80 | | $ | 95.95 | |
| | | | | | | | | | | | | |
| 2006 | | | | | | | | | | | | | |
Developed | | 326 | | 3.0 | | 345 | | $ | 545 | | | | | |
Undeveloped | | 131 | | 1.9 | | 142 | | | 60 | | | | | |
| | | | | | | | | | | | | |
Total | | 457 | | 4.9 | | 487 | | $ | 605 | | $ | 5.64 | | $ | 61.05 | |
| | | | | | | | | | | | | |
| (1) | Standardized measure is the present value of proved reserves further reduced by the present value (discounted at 10%) of estimated future income taxes on cash flows usingand estimated future costs. The standardized measure considers average prices for the year ended December 31, 2009 and prices in effect at a fiscal year endyear-end for the years ended December 31, 2008 and estimated future costs as of that fiscal year end. For information on the changes in the standardized measure of discounted future net cash flows, see the Supplemental Information on Oil and Gas Producing Activities (Unaudited) in the Notes to Consolidated Financial Statements in Item 8, “Financial Statements and Supplementary Data.”2007, respectively. |
| (2) | Natural gas and oil prices were based on average (beginning of month basis) sales prices per Mcf and Bbl in effect at year end, with the representative price of natural gas adjusted for basis premium and BTU content to arrive at the appropriate net price. |
InEffective for 2009 and future periods and in accordance with the SEC’s new guidelines, the engineers’ estimates of future net revenues from our properties and the standardized measure thereof are based on the average (beginning of month basis) oil and natural gas sales prices in effect as of December 31, 2008,during 2009, and estimated future costs as of December 31, 2008.2009. The prices are held constant throughout the life of the properties except where such guidelines permit alternate treatment, including the use of fixed and determinable contractual price escalations. As noted in the table above, the standardized measure for periods prior to 2009 was based on prices in effect at December 31. Prices for oil and gas are subject to substantial seasonal fluctuations as well as fluctuations resulting from numerous other factors. See Item 7, “Management’s Discussion and Analysis of Financial Condition and Results of Operations.”
Proved reserves are the estimated quantities of crude oil, condensate and natural gas that geological and engineering data demonstrate with reasonable certainty to be recoverable in future years from known oil and gas reservoirs under existing economic and operating conditions. Proved developed reserves are proved reserves that can be expected to be recovered through existing wells with existing equipment and operating methods. Proved undeveloped reserves are proved reserves expected to be recovered through new wells on
TABLE OF CONTENTS
undrilled acreage or from existing wells where a relatively major expenditure is required for completion. The proved undeveloped reserves included in our current estimates relate to wells that are forecasted to be drilled within the next five years. There are numerous uncertainties inherent in estimating quantities of proved reserves and in projecting future rates of production and timing of development expenditures, including many factors beyond our control.
Reserve engineering is a subjective process of estimating underground accumulations of oil and natural gas that cannot be measured in an exact manner, and the accuracy of any reserve estimate is a function of the quality of available data and of engineering and geological interpretation and judgment. The quantities of crude oil and natural gas that are ultimately recovered, production and operating costs, the amount and timing of future development expenditures and future crude oil and natural gas sales prices may all differ from those assumed in these estimates. Therefore, the standardized measure amounts shown above should not be construed as the current market value of the estimated oil and natural gas reserves attributable to our properties. The information set forth in the foregoing tables includes revisions of certain volumetric reserve estimates attributable to proved properties included in the preceding year’s estimates. Such revisions are the result of additional information from subsequent completions and production history from the properties involved or the result of a decrease (or increase) in the projected economic life of such properties resulting from changes in production prices.
Our policies and practices regarding internal controls over the recording of reserves is structured to objectively and accurately estimate our oil and gas reserves quantities and present values in compliance with the SEC's regulations and GAAP. Our Manager of Engineering is primarily responsible for overseeing the preparation of the Company's reserve estimate by our independent third party engineers, Wright & Company, Inc. The Manager of Engineering has over twenty-four years of industry experience in the estimation and evaluation of reserve information, holds a B.S. degree in Petroleum Engineering from Texas A&M University and is licensed by the state of Texas as a Professional Engineer. The Company's internal controls over reserve estimates include reconciliation and review controls, including an independent internal review of assumptions used in the estimation.
The technical person primarily responsible for review of our reserve estimates at Wright & Company, Inc., meets the requirements regarding qualifications, independence, objectivity, and confidentiality set forth in the Standards Pertaining to the Estimating and Auditing of Oil and Gas Reserves Information promulgated by the Society of Petroleum Engineers. Wright & Company, Inc. is an independent firm of petroleum engineers, geologists, geophysicists, and petro physicists; they do not own an interest in our properties and are not employed on a contingent fee basis.
For additional information about the risks inherent in our estimates of proved reserves, see “Risk Factors” in Item 1A.
Production and Reserves by Region
The following table setstables set forth by region the estimated quantities of proved reserves, as of December 31, 2008:
| | | | | | | |
| | | Proved Reserves as of December 31,
2008 | |
| Region | | Proved
Reserves | | % of
Total
Proved
Reserves | | % Proved
Developed | |
| | | (Bcfe) | | | | | |
Appalachia | | 170 | | 19% | | 74 | % |
Mississippi | | 155 | | 17% | | 71 | % |
East Texas | | 419 | | 46% | | 31 | % |
Mid-Continent | | 141 | | 15% | | 55 | % |
Gulf Coast | | 31 | | 3% | | 89 | % |
| | | | | | | |
Total | | 916 | | 100% | | | |
| | | | | | | |
The following table sets forth by regionwell as the average daily production and total production for the years ended December 31, 2008, 2007 and 2006:periods presented:
| | | | | | | | | | | | | | | | | | |
| | | Average Daily Production
for the Year Ended
December 31, | | Total Production for the Year
Ended December 31, | | As of December 31, 2009 |
| Region | | 2008 | | 2007 | | 2006 | | 2008 | | 2007 | | 2006 | | Proved
Reserves | | % of Total
Proved Reserves | | % Proved
Developed |
| | | | | (MMcfe) | | | | | | (MMcfe) | | | | (Bcfe) | | | | |
Appalachia | | 31.4 | | 34.0 | | 35.0 | | 11,497 | | 12,424 | | 12,759 | | | 134 | | | | 14 | % | | | 79 | % |
Mississippi | | 20.1 | | 20.7 | | 17.6 | | 7,340 | | 7,551 | | 6,411 | | | 175 | | | | 19 | % | | | 57 | % |
East Texas | | 36.6 | | 21.9 | | 12.5 | | 13,409 | | 7,986 | | 4,546 | | | 403 | | | | 43 | % | | | 31 | % |
Mid-Continent | | 20.9 | | 11.3 | | 3.4 | | 7,646 | | 4,131 | | 1,248 | | | 199 | | | | 21 | % | | | 37 | % |
Gulf Coast | | 19.1 | | 23.2 | | 17.3 | | 6,989 | | 8,477 | | 6,296 | | | 24 | | | | 3 | % | | | 92 | % |
| | | | | | | | | | | | | | | 935 | | | | 100 | % | | | | |
Total | | 128.1 | | 111.1 | | 85.8 | | 46,881 | | 40,569 | | 31,260 | |
| | | | | | | | | | | | | |
TABLE OF CONTENTS
| | | | | | | | | | | | |
| | Average Daily Production for the Year Ended December 31, | | Total Production for the
Year Ended December 31, |
| Region | | 2009 | | 2008 | | 2007 | | 2009 | | 2008 | | 2007 |
| | | (MMcfe) | | (MMcfe) |
| Appalachia | | | 31.4 | | | | 31.4 | | | | 34.0 | | | | 11,465 | | | | 11,497 | | | | 12,424 | |
| Mississippi | | | 21.5 | | | | 20.1 | | | | 20.7 | | | | 7,822 | | | | 7,340 | | | | 7,551 | |
| East Texas | | | 35.9 | | | | 36.6 | | | | 21.9 | | | | 13,117 | | | | 13,409 | | | | 7,986 | |
| Mid-Continent | | | 35.1 | | | | 20.9 | | | | 11.3 | | | | 12,825 | | | | 7,646 | | | | 4,131 | |
| Gulf Coast(1) | | | 15.8 | | | | 19.1 | | | | 23.2 | | | | 5,771 | | | | 6,989 | | | | 8,477 | |
| | | | 139.7 | | | | 128.1 | | | | 111.1 | | | | 51,000 | | | | 46,881 | | | | 40,569 | |
| (1) | We completed the sale of our Gulf Coast properties in a transaction that closed on January 29, 2010. |
Acreage
The following table sets forth our developed and undeveloped acreage as of December 31, 2008.2009. The acreage is located primarily in the Appalachian, Mississippi, East Texas, Mid-Continent and Gulf Coast regions of the United States.
| | | | |
| | | Gross
Acreage | | Net
Acreage |
| | | (in thousands) |
Developed | | 888 | | 771 |
Undeveloped | | 790 | | 453 |
| | | | |
Total | | 1,678 | | 1,224 |
| | | | |
| | | | |
| | Gross
Acreage | | Net
Acreage |
| | | (in thousands) |
| Developed | | | 865 | | | | 752 | |
| Undeveloped | | | 761 | | | | 393 | |
| | | | 1,626 | | | | 1,145 | |
Wells Drilled
The following table sets forth the gross and net numbers of exploratory and development wells that we drilled during the years ended December 31, 2009, 2008 2007 and 2006.2007. The number of wells drilled refers to the number of wells reaching total depth at any time during the respective year. Net wells equal the number of gross wells multiplied by our working interest in each of the gross wells. Productive wells represent either wells which were producing oil or gas or which were capable of commercial production.
| | | | | | | | | | | | | | | | | | | | | | | | |
| | | 2008 | | 2007 | | 2006 | | 2009 | | 2008 | | 2007 |
| | | Gross | | Net | | Gross | | Net | | Gross | | Net | | Gross | | Net | | Gross | | Net | | Gross | | Net |
Development | | | | | | | | | | | | | | | | | | | | | | | | | | | | | | | | | | | | |
Productive | | 259 | | 160.5 | | 265 | | 198.5 | | 187 | | 138.9 | | | 25 | | | | 16.9 | | | | 259 | | | | 160.5 | | | | 265 | | | | 198.5 | |
Non-productive | | 4 | | 3.0 | | 6 | | 5.1 | | 3 | | 2.4 | | | 1 | | | | 1.0 | | | | 4 | | | | 3.0 | | | | 6 | | | | 5.1 | |
Under evaluation | | 11 | | 8.8 | | — | | — | | — | | — | | | 4 | | | | 1.8 | | | | 11 | | | | 8.8 | | | | — | | | | — | |
| | | | | | | | | | | | | |
Total development | | 274 | | 172.3 | | 271 | | 203.6 | | 190 | | 141.3 | | | 30 | | | | 19.7 | | | | 274 | | | | 172.3 | | | | 271 | | | | 203.6 | |
| | | | | | | | | | | | | |
| Exploratory | | | | | | | | | | | | | | | | | | | | | | | | | | | | | | | | | | | | |
Productive | | 6 | | 3.5 | | 11 | | 5.2 | | 13 | | 7.2 | | | 2 | | | | 1.0 | | | | 6 | | | | 3.5 | | | | 11 | | | | 5.2 | |
Non-productive | | 5 | | 2.8 | | 3 | | 1.6 | | 6 | | 2.3 | | | — | | | | — | | | | 5 | | | | 2.8 | | | | 3 | | | | 1.6 | |
Under evaluation | | 1 | | 1.0 | | 4 | | 2.6 | | 1 | | 1.0 | | | — | | | | — | | | | 1 | | | | 1.0 | | | | 4 | | | | 2.6 | |
| | | | | | | | | | | | | |
Total exploratory | | 12 | | 7.3 | | 18 | | 9.4 | | 20 | | 10.5 | | | 2 | | | | 1.0 | | | | 12 | | | | 7.3 | | | | 18 | | | | 9.4 | |
| | | | | | | | | | | | | |
Total | | 286 | | 179.6 | | 289 | | 213.0 | | 210 | | 151.8 | | | 32 | | | | 20.7 | | | | 286 | | | | 179.6 | | | | 289 | | | | 213.0 | |
| | | | | | | | | | | | | |
The elevenfour development wells under evaluation at December 31, 20082009 included seven Cotton Valley wellsthree in East Texas,the Mid-Continent region (Granite Wash) and one horizontal Lower Bossier (Haynesville) Shale well in East Texas, one additional well in East Texas and two wells in the Mid-Continent region. The exploratory well under evaluation at December 31, 2008 was in the Mid-Continent region.
The four exploratory wells under evaluation as of December 31, 2007 included two Devonian Shale wells in West Virginia, one New Albany Shale well in Illinois and one horizontal CBM well in West Virginia. In 2008, we determined that all four wells were not commercially viable. Accordingly, we charged $4.3 million to expense related to those wells.Texas.
The exploratory well under evaluation as of December 31, 20062008 was a Cotton Valleyin the Mid-Continent region. In 2009, the well in East Texas. In 2007, wewas determined that this well wasto be commercially viable and we reclassified $1.1$2.5 million of suspended exploratory drilling costs related to wells, equipmentthis well to proved property and facilities based on the determination of proved reserves.equipment.
TABLE OF CONTENTS
Productive Wells
The following table sets forth the number of productive oil and gas wells in which we had a working interest at December 31, 2008. Productive wells are wells that are producing oil or gas or that are capable of commercial production.2009.
| | | | | | | | | | | | | | | | | | | | |
Operated Wells | Operated Wells | | Non-Operated Wells | | Total | Operated Wells | | Non-Operated Wells | | Total Wells |
Gross | | Net | | Gross | | Net | | Gross | | Net | | Net | | Gross | | Net | | Gross | | Net |
1,652 | | 1,415 | | 670 | | 93 | | 2,322 | | 1,508 | |
1,667
| | | | 1,482.1 | | | | 460 | | | | 91.4 | | | | 2,127 | | | | 1,573.5 | |
In addition to the above working interest wells, we own royalty interests in 2,6112,818 gross wells.
Coal Reserves and Production
Other Natural Resource Management AssetsAs of December 31, 2008,2009, PVR owned or controlled approximately 827829 million tons of proven and probable coal reserves located on approximately 495,000497,000 acres (including fee and leased acreage) in Illinois, Kentucky, New Mexico, Virginia and West Virginia. PVR’s coal reserves are in various surface and underground mine seams located on the following properties:
Central Appalachia Basin: properties located in eastern Kentucky, southwestern Virginia and southern West Virginia;
Northern Appalachia Basin: properties located in northern West Virginia;
Illinois Basin: properties located in southern Illinois and western Kentucky; and
San Juan Basin: properties located in the four corners area of New Mexico.
| • | Central Appalachia Basin: properties located in eastern Kentucky, southwestern Virginia and southern West Virginia; |
| • | Northern Appalachia Basin: properties located in northern West Virginia; |
| • | Illinois Basin: properties located in southern Illinois and western Kentucky; and |
| • | San Juan Basin: properties located in the four corners area of New Mexico. |
Coal reserves are coal tons that can be economically extracted or produced at the time of determination considering legal, economic and technical limitations. All of the estimates of PVR’s coal reserves are classified as proven and probable reserves. Proven and probable coal reserves are defined as follows:
Proven Coal Reserves. Proven coal reserves are reserves for which: (i) quantity is computed from dimensions revealed in outcrops, trenches, workings or drill holes; (ii) grade and/or quality are computed from the results of detailed sampling; and (iii) the sites for inspection, sampling and measurement are spaced so closely, and the geologic character is so well defined, that the size, shape, depth and mineral content of reserves are well-established.
Probable Coal Reserves. Probable coal reserves are reserves for which quantity and grade and/or quality are computed from information similar to that used for proven reserves, but the sites for inspection, sampling and measurement are more widely spaced or are otherwise less adequately spaced. The degree of assurance, although lower than that for proven coal reserves, is high enough to assume continuity between points of observation.
In areas where geologic conditions indicate potential inconsistencies related to coal reserves, PVR performs additional exploration to ensure the continuity and mineability of the coal reserves. Consequently, sampling in those areas involves drill holes or channel samples that are spaced closer together than those distances cited above.
Coal reserve estimates are adjusted annually for production, unmineable areas, acquisitions and sales of coal in place. The majority of PVR’s coal reserves are high in energy content, low in sulfur and suitable for either the steam or to a lesser extent metallurgical market.
The amount of coal that a lessee can profitably mine at any given time is subject to several factors and may be substantially different from “proven and probable coal reserves.” Included among the factors that influence profitability are the existing market price, coal quality and operating costs.
TABLE OF CONTENTS
The following tables set forth production data for the years ended December 31, 2008, 2007 and 2006 and reserve information as of December 31, 20082009 with respect to each of PVR’s properties:properties (tons in millions):
| | | | | | |
| | | Production for the Year
Ended December 31, |
Property | | 2008 | | 2007 | | 2006 |
| | | (tons in millions) |
Central Appalachia | | 19.6 | | 18.8 | | 20.2 |
Northern Appalachia | | 3.6 | | 4.2 | | 5.0 |
Illinois Basin | | 4.6 | | 3.8 | | 2.5 |
San Juan Basin | | 5.9 | | 5.7 | | 5.1 |
| | | | | | |
Total | | 33.7 | | 32.5 | | 32.8 |
| | | | | | |
| | | | | | | | | | | | | | | | | | | | | | | | |
| | | Proven and Probable Reserves as of December 31, 2008 | | Proven and Probable Reserves as of December 31, 2009 |
Property | | Underground | | Surface | | Total | | Steam | | Metallurgical | | Total | | Underground | | Surface | | Total | | Steam | | Metallurgical | | Total |
| | | (tons in millions) | |
Central Appalachia | | 440.8 | | 149.0 | | 589.8 | | 502.5 | | 87.3 | | 589.8 | | | 443.6 | | | | 160.3 | | | | 603.9 | | | | 514.7 | | | | 89.2 | | | | 603.9 | |
Northern Appalachia | | 26.4 | | — | | 26.4 | | 26.4 | | — | | 26.4 | | | 23.4 | | | | — | | | | 23.4 | | | | 23.4 | | | | — | | | | 23.4 | |
Illinois Basin | | 154.9 | | 10.8 | | 165.7 | | 165.7 | | — | | 165.7 | | | 154.2 | | | | 9.7 | | | | 163.9 | | | | 163.9 | | | | — | | | | 163.9 | |
San Juan Basin | | — | | 44.9 | | 44.9 | | 44.9 | | — | | 44.9 | | | — | | | | 37.4 | | | | 37.4 | | | | 37.4 | | | | — | | | | 37.4 | |
| | | | | | | | | | | | | |
Total | | 622.1 | | 204.7 | | 826.8 | | 739.5 | | 87.3 | | 826.8 | | | 621.2 | | | | 207.4 | | | | 828.6 | | | | 739.4 | | | | 89.2 | | | | 828.6 | |
| | | | | | | | | | | | | |
The following table sets forth the coal reserves PVR owned and leased with respect to each of its coal properties as of December 31, 2008:2009 (tons in millions):
| | | | | | | | | | | | |
Property | | Owned | | Leased | | Total
Controlled | | Owned | | Leased | | Total
Controlled |
| | | (tons in millions) | |
Central Appalachia | | 454.4 | | 135.4 | | 589.8 | | | 452.9 | | | | 151.0 | | | | 603.9 | |
Northern Appalachia | | 26.4 | | — | | 26.4 | | | 23.4 | | | | — | | | | 23.4 | |
Illinois Basin | | 135.5 | | 30.2 | | 165.7 | | | 133.9 | | | | 30.0 | | | | 163.9 | |
San Juan Basin | | 41.1 | | 3.8 | | 44.9 | | | 33.6 | | | | 3.8 | | | | 37.4 | |
| | | | | | | |
Total | | 657.4 | | 169.4 | | 826.8 | | | 643.8 | | | | 184.8 | | | | 828.6 | |
| | | | | | | |
The following table sets forth PVR’s coal reserve activity for each of its coal properties for the yearsperiods presented and ended December 31, 2008, 2007 and 2006:
(tons in millions): | | | | | | | | | |
| | | 2008 | | | 2007 | | | 2006 | |
| | | (tons in millions) | |
Reserves - beginning of year | | 818.4 | | | 765.4 | | | 689.1 | |
Purchase of coal reserves | | 34.6 | | | 60.0 | | | 96.2 | |
Tons mined by lessees | | (33.7 | ) | | (32.5 | ) | | (32.8 | ) |
Revisions of estimates and other | | 7.5 | | | 25.5 | | | 12.9 | |
| | | | | | | | | |
Reserves - end of year | | 826.8 | | | 818.4 | | | 765.4 | |
| | | | | | | | | |
Other Natural Resource Management Assets
| | | | | | |
| | As of December 31, |
| | | 2009 | | 2008 | | 2007 |
| Reserves at beginning of year | | | 826.8 | | | | 818.4 | | | | 765.4 | |
| Purchase of coal reserves | | | 2.4 | | | | 34.6 | | | | 60.0 | |
| Tons mined by lessees | | | (34.3 | ) | | | (33.7 | ) | | | (32.5 | ) |
| Revisions of estimates and other | | | 33.7 | | | | 7.5 | | | | 25.5 | |
| Reserves at end of year | | | 828.6 | | | | 826.8 | | | | 818.4 | |
Coal Preparation and Loading Facilities
PVR generates coal services revenues from fees it charges to its lessees for the use of its coal preparation and loading facilities, which are located in Virginia, West Virginia and Kentucky. The facilities provide efficient methods to enhance lessee production levels and exploit PVR’s reserves.
Timber and Oil and Gas Royalty Interests
PVR owns approximately 243,000 acres of forestland in Kentucky, Virginia and West Virginia. Approximately 26% of PVR’s forestland is located on the approximately 62,000 acres in West Virginia that PVR acquired in September 2007. See Item 7, “Management’s Discussion and Analysis of Financial Condition and Results of Operations—Acquisitions and Divestitures,” for a discussion of PVR’s forestland acquisition. The balancemajority of PVR’s forestland is located on properties that also contain its coal reserves.
PVR owns royalty interests in approximately 10.97.2 Bcfe of proved oil and gas reserves located on approximately 56,000 acres in Kentucky, Virginia and West Virginia. Approximately 85%86% of PVR’s oil and gas royalty interests in these reserves are associated with the leases of property in eastern Kentucky and southwestern Virginia that PVR acquired from us in October 2007. See Item 7, “Management’s Discussion and Analysis of Financial Condition and Results of Operations—Acquisitions and Divestitures” for a discussion of PVR’s oil and gas royalty interest acquisition.
Natural Gas Midstream Systems
PVR’s natural gas midstream business derives revenues primarily from gas processing contracts with natural gas producers and from fees charged for gathering natural gas volumes and providing other related services. PVR owns, leases or has rights-of-way to the properties where the majority of its natural gas midstream facilities are located. PVR also owns a natural gas marketing business, which aggregates third-party volumes and sells those volumes into intrastate pipeline systems and at market hubs accessed by various interstate pipelines.
TABLE OF CONTENTS
PVR owned fivesix natural gas processing facilities having 300400 MMcfd of total capacity as of December 31, 2008.2009. PVR’s natural gas midstream operations currently include four natural gas gathering and processing systems and two stand-alone natural gas gathering systems, including: (i) the Panhandle gathering and processing facilities in the Texas/Oklahoma panhandle area; (ii) the Crossroads gathering and processing facilities in East Texas; (iii) the Crescent gathering and processing facilities in central Oklahoma; (iv) the Arkoma gathering system in eastern Oklahoma; (v) the North Texas gathering and pipeline facilities in the Fort Worth Basin; and (vi) the Hamlin gathering and processing facilities in west-central Texas. These assets included approximately 4,0694,118 miles of natural gas gathering pipelines as of December 31, 2008.2009. In addition, PVR owns a 25% member interest in Thunder Creek, a joint venture that gathers and transports CBM in Wyoming’s Powder River Basin.
The following table sets forth information regarding PVR’s natural gas midstream assets:
| | | | | | |
| Asset | | Type | | Approximate
Length
(Miles) | | Current
Processing
Capacity
(MMcfd) |
| Panhandle System(1) | | | Gathering pipelines and
processing facilities | | | | 1,681 | | | | 260 | |
| Crossroads System | | | Gathering pipelines and
processing facility | | | | 8 | | | | 80 | |
| Crescent System | | | Gathering pipelines and
processing facility | | | | 1,701 | | | | 40 | |
| Hamlin System | | | Gathering pipelines and
processing facility | | | | 516 | | | | 20 | |
| Arkoma System | | | Gathering pipelines | | | | 78 | | | | — | |
| North Texas Gathering System | | | Gathering pipelines | | | | 134 | | | | — | |
| | | | | | | | 4,118 | | | | 400 | |
| | | | | | | | | | | | | | |
| | | | | | | | | | | Year Ended
December 31, 2008 | |
Asset | | Type | | Approximate
Length
(Miles) | | Approximate
Wells
Connected | | Current
Processing
Capacity
(MMcfd) | | Average
System
Throughput
(MMcfd) | | | Utilization
of
Processing
Capacity
(% ) | |
Panhandle System | | Gathering pipelines and processing facility | | 1,648 | | 1,037 | | 160 | | 181.0 | (1) | | 100 | % |
Crossroads System | | Gathering pipelines and processing facility | | 8 | | — | | 80 | | 36.0 | | | 45 | % |
Crescent System | | Gathering pipelines and processing facility | | 1,698 | | 850 | | 40 | | 22.5 | | | 56 | % |
Hamlin System | | Gathering pipelines and processing facility | | 506 | | 243 | | 20 | | 6.3 | | | 32 | % |
Arkoma System | | Gathering pipelines | | 78 | | 81 | | — | | 14.0 | (2) | | | |
North Texas Gas Gathering System | | Gathering pipelines | | 131 | | 39 | | — | | 10.0 | (2) | | | |
| | | | | | | | | | | | | | |
| | | | 4,069 | | 2,250 | | 300 | | 269.8 | | | | |
| | | | | | | | | | | | | | |
| (1) | Includes the Beaver, Spearman and Sweetwater natural gas processed at other systems connected to the Panhandle System via the pipeline acquired in June 2006.processing plants. |
| (2) | Gathering-only volumes. |
Item 3 Legal Proceedings
Although we may, from time to time, be involved in litigation and claims arising out of our operations in the normal course of business, we are not currently a party to any material legal proceedings. In addition, we are not aware of any material legal or governmental proceedings against us, or contemplated to be brought against us, under the various environmental protection statutes to which we are subject. See Item 1, “Business—“Business — Government Regulation and Environmental Matters,” for a more detailed discussion of our material environmental obligations.
Item 4 Reserved
TABLE OF CONTENTS
Item 4 | Submission of Matters to a Vote of Security Holders |
There were no matters submitted to a vote
Part II
Item 5 Market for the Registrant’s Common Equity, Related Shareholder Matters and Issuer Purchases of security holders during the fourth quarter of 2008.
Part II
Item 5 | Market for the Registrant’s Common Equity, Related Shareholder Matters and Issuer Purchases of Equity Securities |
Equity SecuritiesMarket Information
Our common stock is traded on the NYSE under the symbol “PVA.” The high and low sales prices (composite transactions) and dividends paid fordeclared related to each fiscal quarter in 20082009 and 20072008 were as follows:
| | | | | | | | | |
| | | Sales Price (1) | | Cash
Dividends Declared |
Quarter Ended | | High | | Low | | (1) |
December 31, 2008 | | $ | 53.19 | | $ | 21.65 | | $ | 0.05625 |
September 30, 2008 | | $ | 81.00 | | $ | 45.74 | | $ | 0.05625 |
June 30, 2008 | | $ | 76.44 | | $ | 44.07 | | $ | 0.05625 |
March 31, 2008 | | $ | 46.12 | | $ | 37.01 | | $ | 0.05625 |
December 31, 2007 | | $ | 49.56 | | $ | 40.94 | | $ | 0.05625 |
September 30, 2007 | | $ | 44.50 | | $ | 35.68 | | $ | 0.05625 |
June 30, 2007 | | $ | 43.25 | | $ | 36.51 | | $ | 0.05625 |
March 31, 2007 | | $ | 37.16 | | $ | 31.95 | | $ | 0.05625 |
| (1) | On May 8, 2007, our board of directors approved a two-for-one split of our common stock in the form of a 100% dividend payable on June 19, 2007 to shareholders of record on June 12, 2007. Shareholders received one additional share of common stock for each share held on the record date. The sales prices and quarterly dividends have been adjusted to give retroactive effect to the stock split. |
| | | | | | |
| | Sales Price | | Cash
Dividends
Declared |
| Quarter Ended | | High | | Low |
| December 31, 2009 | | $ | 26.32 | | | $ | 17.25 | | | $ | 0.05625 | |
| September 30, 2009 | | $ | 23.92 | | | $ | 13.16 | | | $ | 0.05625 | |
| June 30, 2009 | | $ | 23.24 | | | $ | 10.46 | | | $ | 0.05625 | |
| March 31, 2009 | | $ | 31.53 | | | $ | 7.22 | | | $ | 0.05625 | |
| December 31, 2008 | | $ | 53.19 | | | $ | 21.65 | | | $ | 0.05625 | |
| September 30, 2008 | | $ | 81.00 | | | $ | 45.74 | | | $ | 0.05625 | |
| June 30, 2008 | | $ | 76.44 | | | $ | 44.07 | | | $ | 0.05625 | |
| March 31, 2008 | | $ | 46.12 | | | $ | 37.01 | | | $ | 0.05625 | |
Equity Holders
As of February 6, 2009,8, 2010, there were 500485 record holders and approximately 8,2613,000 beneficial owners (held in street name) of our common stock.
Comparison of Cumulative Five-Year Total ReturnTABLE OF CONTENTS
Penn Virginia Corporation, S&P SmallCap 600 Index and
S&P 600 Oil & Gas Exploration & Production Index
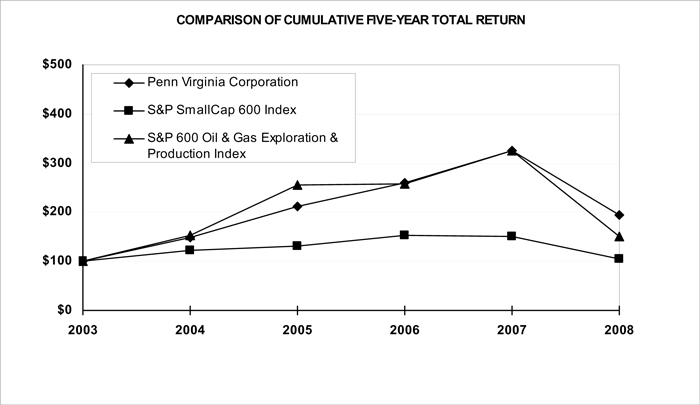
| | | | | | | | | | | | | | | |
| | | 2004 | | 2005 | | 2006 | | 2007 | | 2008 |
Penn Virginia Corporation | | $ | 147.73 | | $ | 210.92 | | $ | 259.00 | | $ | 324.52 | | $ | 194.20 |
S&P Smallcap 600 Index | | $ | 122.65 | | $ | 132.07 | | $ | 152.04 | | $ | 151.59 | | $ | 104.48 |
S&P 600 Oil & Gas Exploration & Production Index | | $ | 152.36 | | $ | 255.01 | | $ | 257.33 | | $ | 325.87 | | $ | 150.32 |
Item 6 | Selected Financial Data |
Item 6 Selected Financial Data
The following selected historical financial information was derived from our consolidated financial statementsConsolidated Financial Statements as of December 31, 2009, 2008, 2007, 2006 2005 and 2004,2005, and for each of the years then ended. The selected financial data should be read in conjunction with our consolidated financial statementsConsolidated Financial Statements and the accompanying notesNotes and Supplementary Data in Item 7, “Management’s Discussion and Analysis of Financial Condition and Results of Operations,” and Item 8, “Financial Statements and Supplementary Data.”
| | | | | | | | | | | | | | | |
| | | Year Ended December 31, |
| | | 2008 | | 2007 | | 2006 | | 2005 (1) | | 2004 |
| | | (in thousands, except share data) |
Revenues | | $ | 1,220,851 | | $ | 852,950 | | $ | 753,929 | | $ | 673,864 | | $ | 228,425 |
Operating income (2) | | $ | 256,823 | | $ | 192,624 | | $ | 170,532 | | $ | 162,017 | | $ | 80,796 |
Net income | | $ | 124,168 | | $ | 50,754 | | $ | 75,909 | | $ | 62,088 | | $ | 33,355 |
Per common share: (3) | | | | | | | | | | | | | | | |
Net income, basic | | $ | 2.97 | | $ | 1.33 | | $ | 2.03 | | $ | 1.67 | | $ | 0.91 |
Net income, diluted | | $ | 2.95 | | $ | 1.32 | | $ | 2.01 | | $ | 1.66 | | $ | 0.91 |
Dividends paid | | $ | 0.23 | | $ | 0.23 | | $ | 0.23 | | $ | 0.23 | | $ | 0.23 |
Cash flows provided by operating activities | | $ | 383,774 | | $ | 313,030 | | $ | 275,819 | | $ | 231,407 | | $ | 146,365 |
Total assets (4) | | $ | 2,996,552 | | $ | 2,253,461 | | $ | 1,633,149 | | $ | 1,251,546 | | $ | 783,335 |
Total debt, net of short-term borrowings | | $ | 1,130,100 | | $ | 751,153 | | $ | 428,214 | | $ | 325,846 | | $ | 188,926 |
Minority interest in PVG (5) | | $ | 299,671 | | $ | 179,162 | | $ | 438,372 | | $ | 313,524 | | $ | 182,891 |
Shareholders’ equity (5) | | $ | 1,018,790 | | $ | 810,098 | | $ | 382,425 | | $ | 310,308 | | $ | 252,860 |
| | | | | | | | | | |
| | 2009 | | 2008 | | 2007 | | 2006 | | 2005(1) |
| | | (In thousands, except per share amounts) |
Statement of Income Data:
| | | | | | | | | | | | | | | | | | | | |
| Revenues | | $ | 815,137 | | | $ | 1,220,851 | | | $ | 852,950 | | | $ | 753,929 | | | $ | 673,864 | |
| Depreciation, depletion and amortization | | $ | 223,367 | | | $ | 192,236 | | | $ | 129,523 | | | $ | 94,217 | | | $ | 76,937 | |
| Operating income (loss)(2) | | $ | (98,202 | ) | | $ | 256,823 | | | $ | 192,624 | | | $ | 170,532 | | | $ | 162,017 | |
| Net income (loss)(3) | | $ | (77,368 | ) | | $ | 181,520 | | | $ | 80,810 | | | $ | 118,927 | | | $ | 92,477 | |
| Income (loss) attributable to Penn Virginia Corporation(3) | | $ | (114,643 | ) | | $ | 121,084 | | | $ | 50,491 | | | $ | 75,909 | | | $ | 62,088 | |
Common Stock Data:
| | | | | | | | | | | | | | | | | | | | |
| Earnings (loss) per common share, basic(4) | | $ | (2.62 | ) | | $ | 2.89 | | | $ | 1.32 | | | $ | 2.03 | | | $ | 1.67 | |
| Earnings (loss) per common share, diluted(4) | | $ | (2.62 | ) | | $ | 2.87 | | | $ | 1.31 | | | $ | 2.01 | | | $ | 1.66 | |
Weighted-average shares outstanding:
| | | | | | | | | | | | | | | | | | | | |
| Basic | | | 43,811 | | | | 41,760 | | | | 38,061 | | | | 37,362 | | | | 37,092 | |
| Diluted | | | 43,811 | | | | 42,031 | | | | 38,358 | | | | 37,732 | | | | 37,464 | |
| Actual shares outstanding at year-end | | | 45,272 | | | | 41,786 | | | | 41,331 | | | | 37,490 | | | | 37,201 | |
| Dividends declared per share | | $ | 0.225 | | | $ | 0.225 | | | $ | 0.225 | | | $ | 0.225 | | | $ | 0.225 | |
| Market value at year-end | | $ | 21.29 | | | $ | 25.66 | | | $ | 42.89 | | | $ | 34.23 | | | $ | 27.87 | |
| Number of shareholders | | | 3,486 | | | | 8,761 | | | | 8,196 | | | | 7,970 | | | | 7,095 | |
Balance Sheet and Other Financial Data:
| | | | | | | | | | | | | | | | | | | | |
| Property and equipment, net(3) | | $ | 2,352,358 | | | $ | 2,512,177 | | | $ | 1,899,067 | | | $ | 1,358,383 | | | $ | 983,219 | |
| Total assets(3) | | $ | 2,888,507 | | | $ | 2,996,565 | | | $ | 2,252,271 | | | $ | 1,633,149 | | | $ | 1,251,546 | |
| Total debt(3) | | $ | 1,118,527 | | | $ | 1,107,538 | | | $ | 727,369 | | | $ | 439,046 | | | $ | 333,954 | |
| Shareholders’ equity(3) | | $ | 1,237,999 | | | $ | 1,222,442 | | | $ | 911,700 | | | $ | 815,848 | | | $ | 618,883 | |
| Cash provided by operating activities | | $ | 275,947 | | | $ | 383,774 | | | $ | 313,030 | | | $ | 275,819 | | | $ | 231,407 | |
| Cash acquisitions and additions | | $ | 286,353 | | | $ | 879,086 | | | $ | 713,510 | | | $ | 464,939 | | | $ | 475,324 | |
Other Statistical Data:
| | | | | | | | | | | | | | | | | | | | |
| Total production (MMcfe) | | | 51,000 | | | | 46,881 | | | | 40,569 | | | | 31,260 | | | | 27,362 | |
| Proved reserves (Bcfe) | | | 935 | | | | 916 | | | | 680 | | | | 487 | | | | 377 | |
| (1) | The 2005 column includes the results of operations of the PVR natural gas midstream segment since March 3, 2005, the closing date of the acquisition of Cantera Gas Resources, LLC. |
| (2) | Operating income (loss) in 2009, 2008, 2007, 2006 2005 and 20042005 included impairment charges of $106.4 million, $20.0 million, $2.5$2.6 million, $8.5 million $4.8 million and $0.7$4.8 million related to our oil and gas properties.properties and other assets. Operating income in 2008 included a loss on the impairment of goodwill of $31.8 million.million |
| (3) | Certain financial data for 2008 and 2007 has been adjusted in connection with a change in accounting principle with respect to our Convertible Notes (see Note 22 to the Consolidated Financial Statements). |
| (4) | For comparative purposes, amounts per common share in 2006 2005 and 20042005 have been adjusted for the effect of a two-for-one stock split on June 19, 2007. |
| (4) | The increases in total assets are primarily due to significant oil and gas segment drilling and to the 2008 Lone Star acquisition. |
| (5) | The decrease in minority interest and consequent increase in shareholders’ equity in 2007 is primarily due to the gain on the sale of PVG and PVR units. We recognized a gain in paid-in capital of $104.1 million in May 2007 when all junior securities of PVG and PVR ceased to be outstanding. |
TABLE OF CONTENTS
Item 7 | Management’s Discussion and Analysis of Financial Condition and Results of Operations |
Item 7 Management’s Discussion and Analysis of Financial Condition and Results of Operations
The following discussion and analysis of the financial condition and results of operations of Penn Virginia Corporation and its subsidiaries (“Penn Virginia,” “we,” “us” or “our”) should be read in conjunction with our consolidated financial statementsConsolidated Financial Statements and the accompanying notesNotes thereto included in Item 8, “Financial Statements and Supplementary Data.”8. All dollar amounts presented in the tables that follow are in thousands unless otherwise indicated.
Overview of Business
We are an independent oil and gas company primarily engaged in the development, exploration and production of natural gas and oil in various domestic onshore regions including East Texas, the Mid-Continent, Appalachia Mississippi and the Gulf Coast.Mississippi. We also indirectly own partner interests in PVR, which is engaged in the coal and natural resource management and natural gas midstream businesses. Our ownership interests in PVR are held principally through our general partner interest and our 77%51.4% limited partner interest in PVG. As of December 31, 2008,2009, PVG owned an approximately 37% limited partner interest in PVR and 100% of the general partner of PVR, which holds a 2% general partner interest in PVR and all of the IDRs. Although results are consolidated for financial reporting, Penn Virginia, PVG and PVR operate with independent capital structures. As such, cash flow available to us from PVG and PVR is only in the form of cash distributions declared and paid to us as a result of our partner interests in those entities.
We are engaged in three primary business segments: (i) oil and gas, (ii) coal and natural resource management and (iii) natural gas midstream. We operate our oil and gas segment, and PVR operates the coal and natural resource management and natural gas midstream segments. Our operating income
Key Developments
During 2009, the following general business developments and corporate actions had an impact upon the financial reporting of our results of operations and financial position as well as the overall presentation of financial information: (i) the effect of 2009 commodity prices on our drilling program, (ii) disposition of Gulf Coast properties, which was $256.8completed in January 2010, (iii) entrance into a new credit facility and the issuance of senior notes, (iv) sale of 10 million PVG units, (v) common stock offering of 3.5 million shares, (vi) organization restructuring and (vii) implementation of an accounting standard update with respect to our 4.5% Convertible Senior Subordinated Notes, or Convertible Notes. A discussion of these key developments follows:
2009 Commodity Prices and Impact on Drilling Program
Beginning in the latter part of 2008 and continuing into 2009, the domestic energy markets experienced a precipitous decline in commodity prices including those for natural gas, crude oil and NGLs, among others. Accordingly, these conditions led to our decision at the beginning of 2009 to significantly reduce our drilling program. In addition to the significant impact on revenues directly attributable to lower commodity prices, we incurred certain material costs associated with the suspension of our drilling program. The effect on revenues and a more thorough analysis of delayed drilling costs is provided in Results of Operations — Oil and Gas Segment below. Energy markets and related commodity prices improved in the second half of 2009, providing support for our decision to significantly increase the expected size of our drilling program in 2010 as compared to $192.62009.
Disposition of Gulf Coast Properties
In December 2009, we signed agreements to complete the sale of our Gulf Coast properties in exchange for $32 million in 2007of net cash proceeds and $170.5 million in 2006. Our segments’ contributions to operating income in 2008 were as follows:
thecertain oil and gas segment contributed $170.6properties in the Selma Chalk play in our Mississippi region, excluding transaction costs and purchase and sale adjustments. The transaction closed on January 29, 2010. During 2009, we recorded total asset impairments of $97.4 million or 66%;in connection with the classification of these properties as held for sale. Additional information is provided in Notes 5 and 19 to the Consolidated Financial Statements.
Completion of a New Credit Facility and the Issuance of Senior Notes
In November 2009, we entered into the Revolver, which is a new credit agreement that provides for a $300 million revolving credit facility commitment against a $420 million borrowing base, and includes a $20 million sublimit for the issuance of letters of credit as well as an option to increase the commitments
TABLE OF CONTENTS
under the PVR coal and natural resource management segment contributed $96.3Revolver by up to an additional $225 million. The credit facility is secured by our reserves. The initial borrowing base of $420 million or 37%; and
was subsequently reduced to $380 million in connection with the PVR natural gas midstream segment contributed $18.9 million, or 7%.Gulf Coast property sale discussed above.
These contributions to operating income were partially offset by $29.0In June 2009, we issued $300 million of intercompany eliminations10.375% Senior Unsecured Notes, or Senior Notes, which will mature on June 15, 2016. The Senior Notes were sold at 97% of par and corporateprovided proceeds of $281.6 million, net of original issue discount and issuance costs.
Additional information regarding the Revolver and the Senior Notes is provided in the discussion of Liquidity and Capital Resources that follows as well as Note 12 to the Consolidated Financial Statements.
Sale of PVG Units
In September 2009, we sold 10 million units of PVG owned by us for proceeds net of offering expenses or 10%.
The following table presentsof $118.1 million resulting in a summaryreduction of our limited partner interest in PVG from 77.0% to 51.4%. Additional information is provided in the Liquidity and Capital Resources discussion that follows as well as Note 17 to the Consolidated Financial Statements.
Common Stock Offering of 3.5 Million Shares
In May 2009, we completed the sale of 3.5 million shares of our common stock in a registered public offering that provided $64.8 million of net proceeds. Additional information is provided in the Liquidity and Capital Resources discussion that follows as well as Note 17 to the Consolidated Financial Statements.
Organization Restructuring
In November 2009, we implemented an organization restructuring that will result in the transfer of certain financial information relatingcorporate and oil and gas accounting and administrative functions from our Kingsport, Tennessee office location to our segmentsHouston, Texas and Radnor, Pennsylvania locations. In addition, the restructuring will result in the relocation of our eastern region oil and gas divisional office from Kingsport to a new office in Pittsburgh, Pennsylvania. Approximately 30 employees will be terminated in connection with the restructuring plans and we anticipate incurring approximately $4 million in costs including termination benefits, relocation costs and other incremental costs associated with expanding our other office locations. Additional information is provided in Note 20 to the Consolidated Financial Statements.
Retrospective Application of Change in Accounting Principle for Convertible Notes
Effective January 1, 2009, we adopted a new accounting standard regarding convertible debt instruments that may be settled in cash upon conversion, including partial cash settlement with respect to our Convertible Notes. The change in accounting principle, as applied retrospectively to all periods presented, resulted in adjustments to the Consolidated Statements of Income and Cash Flows for the years ended December 31, 2008, 2007 and 2006:
| | | | | | | | | | | | | | | | |
| | | Oil and
Gas | | PVR Coal and
Natural
Resource
Management | | PVR
Natural Gas
Midstream | | Eliminations
and Other | | | Consolidated |
| | | (in thousands) |
For the Year Ended December 31, 2008: | | | | | | | | | | | | | | | | |
Revenues | | $ | 469,330 | | $ | 153,327 | | $ | 728,253 | | $ | (130,059 | ) | | $ | 1,220,851 |
Operating costs and expenses | | | 146,515 | | | 26,226 | | | 650,145 | | | (102,858 | ) | | | 720,028 |
Impairments | | | 19,963 | | | — | | | 31,801 | | | — | | | | 51,764 |
Depreciation, depletion and amortization | | | 132,276 | | | 30,805 | | | 27,361 | | | 1,794 | | | | 192,236 |
| | | | | | | | | | | | | | | | |
Operating income (loss) | | $ | 170,576 | | $ | 96,296 | | $ | 18,946 | | $ | (28,995 | ) | | $ | 256,823 |
| | | | | | | | | | | | | | | | |
| | | | | |
For the Year Ended December 31, 2007: | | | | | | | | | | | | | | | | |
Revenues | | $ | 303,241 | | $ | 111,639 | | $ | 437,806 | | $ | 264 | | | $ | 852,950 |
Operating costs and expenses | | | 109,449 | | | 20,138 | | | 370,070 | | | 28,560 | | | | 528,217 |
Impairments | | | 2,586 | | | — | | | — | | | — | | | | 2,586 |
Depreciation, depletion and amortization | | | 87,223 | | | 22,690 | | | 18,822 | | | 788 | | | | 129,523 |
| | | | | | | | | | | | | | | | |
Operating income (loss) | | $ | 103,983 | | $ | 68,811 | | $ | 48,914 | | $ | (29,084 | ) | | $ | 192,624 |
| | | | | | | | | | | | | | | | |
| | | | | |
For the Year Ended December 31, 2006: | | | | | | | | | | | | | | | | |
Revenues | | $ | 235,956 | | $ | 112,981 | | $ | 404,910 | | $ | 82 | | | $ | 753,929 |
Operating costs and expenses | | | 86,369 | | | 19,138 | | | 358,440 | | | 16,716 | | | | 480,663 |
Impairments | | | 8,517 | | | — | | | — | | | — | | | | 8,517 |
Depreciation, depletion and amortization | | | 56,237 | | | 20,399 | | | 17,094 | | | 487 | | | | 94,217 |
| | | | | | | | | | | | | | | | |
Operating income (loss) | | $ | 84,833 | | $ | 73,444 | | $ | 29,376 | | $ | (17,121 | ) | | $ | 170,532 |
| | | | | | | | | | | | | | | | |
We have grown by making acquisitions in all three of our business segments and by organic growth on our and PVR’s properties. Readily available access to debt and equity capital and credit availability have been and continue to be critical factors in our and PVR’s ability to grow. The current deterioration in global financial markets and the consequential adverse effect on credit availability is adversely impacting our and PVR’s access to new capital and credit availability. Depending on the longevity and ultimate severity of this deterioration, our and PVR’s ability to make acquisitions may be significantly adversely affected, as may PVR’s ability to make cash distributions to its limited partners and to PVG, the owner of its general partner. See Item 1A, “Risk Factors.”
Oil and Gas Segment
We have a geographically diverse asset base with core areas of operation in the East Texas, Mid-Continent, Appalachian, Mississippi and Gulf Coast regions of the United States. As of December 31, 2008, we had proved natural gas and oil reserves of approximately 916 Bcfe, of which 82% were natural gas and 51% were proved developed.
As of December 31, 2008, 97% of our proved reserves were located in primarily longer-lived, lower-risk basins in East Texas, the Mid-Continent, Appalachia and Mississippi, which comprised 43%, 15%, 19% and 15% of the proved reserves. Our Gulf Coast properties, representing 3% of proved reserves, are shorter-lived and have higher impact exploratory prospects. In 2008, we produced 46.9 Bcfe, a 16% increase compared to 40.6 Bcfe in 2007, with East Texas, the Mid-Continent, Appalachia, Mississippi and the Gulf Coast comprising 29%, 16%, 25%, 16% and 16% of total production volumes. In the three years ended December 31, 2008, we drilled 785 gross (544.4 net) wells, of which 94% were successful in producing natural gas in commercial quantities. For a more detailed discussion of our reserves and production, see Item 2, “Properties.”
The primary development play types that our oil and gas operations are focused on include: (i) the horizontal Lower Bossier (Haynesville) Shale and vertical Cotton Valley plays in East Texas, (ii) the horizontal Granite Wash, horizontal Hartshorne CBM and the Woodford Shale plays in the Mid-Continent, (iii) multi-lateral horizontal CBM and Marcellus Shale plays in Appalachia and (iv) the predominantly horizontal Selma Chalk play in Mississippi.
We have grown our reserves and production primarily through development and exploratory drilling, complemented to a lesser extent by making strategic acquisitions. In 2008, we replaced 604% of our 2008 production entirely through the
drillbit by adding approximately 283 Bcfe of proved reserves from extensions, discoveries and additions, net of revisions. In 2008, capital expenditures in our oil and gas segment were $641.7 million, of which $481.4 million, or 75%, was related to development drilling, $23.8 million, or 4%, was related to exploratory drilling, $95.5 million, or 15%, was related to leasehold acquisitions and $36.8 million, or 6%, was related to pipelines, gathering and facilities.
As of December 31, 2008, we owned 1.2 million net acres of leasehold interests, approximately 37% of which were undeveloped. We have identified approximately 1,400 proved undeveloped locations and over 2,800 additional potential drilling locations, of which approximately half are located in East Texas and the Mid-Continent. Many of our proved undeveloped locations and additional potential drilling locations are direct offsets or extensions from existing production. We believe our existing undeveloped acreage position represents over 10 years of drilling opportunities based on our historical drilling rate.
Our operations include both conventional and unconventional developmental drilling opportunities,respectively, as well as some exploratory prospects. In the East Texas play, we drilled 102 gross (76.4 net) wells in 2008, including 93 gross (68.4 net) successful wells. We recently shifted our focus to the Lower Bossier (Haynesville) Shale play, which we believe has increased proved reserves and production levels. In Appalachia, we drilled 75 gross (33.1 net) wells in 2008, including 18 gross (9.0 net) horizontal CBM locations and 71 gross (30.6 net) successful locations. In the Selma Chalk play in Mississippi, we drilled 29 gross (28.6 net) wells in 2008, including 28 gross (27.6 net) successful horizontal wells. We also have unconventional development programs in the Mid-Continent and some higher-impact exploratory prospects in the Gulf Coast. In the Mid-Continent region, we drilled 75 gross (37.7 net) wells in 2008, including 29 gross (23.9 net) successful CBM locations.
Our aggressive growth profile in our oil and gas segment has been accomplished primarily by drilling oil and natural gas wells in our operating areas and, to a lesser extent, by making acquisitions of both producing properties and undeveloped leases. This growth profile has required us to spend capital in excess of our cash flow from operations, and readily available access to debt and equity capital were and continue to be a critical factor in our ability to grow. The current deterioration in global financial markets and the consequential adverse effect on credit availability is adversely impacting access to new capital and expanded credit availability. We currently have internal cash flows and available credit facility borrowings that we believe supports growth through 2009. However, depending on the longevity and ultimate severity of the global financial and credit markets deterioration, we may ultimately need to limit our capital spending to more closely mirror internally generated cash flow, which may materially adversely effect how aggressively we can grow. See Item 1A, “Risk Factors.”
In addition, our revenues, profitability and future rate of growth are highly dependent on the prevailing prices for oil and natural gas, which are affected by numerous factors that are generally beyond our control. Crude oil prices are generally determined by global supply and demand. Natural gas prices are influenced by national and regional supply and demand. A substantial or extended decline in the price of oil or natural gas could have a material adverse effect on our revenues, profitability and cash flow and could, under certain circumstances, result in an impairment of some of our oil and natural gas properties. Our future profitability and growth are also highly dependent on the results of our exploratory and development drilling programs.
PVR Coal and Natural Resource Management Segment
As of December 31, 2008, PVR owned or controlled approximately 827 million tons of proven and probable coal reserves in Central and Northern Appalachia, the San Juan Basin and the Illinois Basin. PVR enters into long-term leases with experienced, third-party mine operators, providing them the right to mine PVR’s coal reserves in exchange for royalty payments. PVR actively works with its lessees to develop efficient methods to exploit its reserves and to maximize production from PVR’s properties. PVR does not operate any mines. In 2008, PVR’s lessees produced 33.7 million tons of coal from its properties and paid PVR coal royalties revenues of $122.8 million, for an average royalty per ton of $3.65. Approximately 86% of PVR’s coal royalties revenues in 2008 were derived from coal mined on PVR’s properties under leases containing royalty rates based on the higher of a fixed base price or a percentage of the gross sales price. The balance of PVR’s coal royalties revenues for the respective periods was derived from coal mined on PVR’s properties under leases containing fixed royalty rates that escalate annually.
Coal royalties are impacted by several factors that PVR generally cannot control. The number of tons mined annually is determined by an operator’s mining efficiency, labor availability, geologic conditions, access to capital, ability to market coal and ability to arrange reliable transportation to the end-user. New legislation or regulations have been or may be adopted which may have a significant impact on the mining operations of PVR’s lessees or its customers’ ability to use coal and which may require PVR, its lessees or its lessees’ customers to change operations significantly or incur substantial costs. See Item 1A, “Risk Factors.”
To a lesser extent, coal prices also impact coal royalties revenues. Generally, as coal prices change, PVR’s average royalty per ton also changes because the majority of PVR’s lessees pay royalties based on the gross sales prices of the coal mined. Most of PVR’s coal is sold by its lessees under contracts with a duration of one year or more; therefore, changes to PVR’s average royalty occur as its lessees’ contracts are renegotiated.
PVR also earns revenues from other land management activities, such as selling standing timber, leasing fee-based coal-related infrastructure facilities to certain lessees and end-user industrial plants, collecting oil and gas royalties and from coal transportation, or wheelage, fees.
The future impact of the current deterioration of the global economy, including financial and credit markets, on coal production levels and prices is uncertain. Depending on the longevity and ultimate severity of the deterioration, demand for coal may decline, which could adversely effect production and pricing for coal mined by PVR’s lessees, and, consequently, adversely effect the royalty income received by PVR and its ability to make cash distributions to its limited partners and to PVG, the owner of PVR’s general partner.
PVR Natural Gas Midstream Segment
PVR’s natural gas midstream segment is engaged in providing natural gas processing, gathering and other related services. As of December 31, 2008, PVR owned and operated natural gas midstream assets located in Oklahoma and Texas, including five natural gas processing facilities having 300 MMcfd of total capacity and approximately 4,069 miles of natural gas gathering pipelines. PVR’s natural gas midstream business earns revenues primarily from gas processing contracts with natural gas producers and from fees charged for gathering natural gas volumes and providing other related services. In addition, PVR owns a 25% member interest in Thunder Creek, a joint venture that gathers and transports CBM in Wyoming’s Powder River Basin. PVR also owns a natural gas marketing business, which aggregates third-party volumes and sells those volumes into intrastate pipeline systems and at market hubs accessed by various interstate pipelines.
In 2008, system throughput volumes at PVR’s gas processing plants and gathering systems, including gathering-only volumes, were 98.7 Bcf, or approximately 270 MMcfd. In 2008, 27% and 13% of PVR’s natural gas midstream segment revenues and 16% and 8% of our total consolidated revenues were related to two of PVR’s natural gas midstream customers, Conoco, Inc. and Louis Dreyfus Energy Services.
PVR continually seeks new supplies of natural gas to both offset the natural declines in production from the wells currently connected to its systems and to increase system throughput volumes. New natural gas supplies are obtained for all of PVR’s systems by contracting for production from new wells, connecting new wells drilled on dedicated acreage and contracting for natural gas that has been released from competitors’ systems. In 2008, PVR’s natural gas midstream segment made aggregate capital expenditures of $333.3 million, primarily related to PVR’s 25% member interest acquisition of Thunder Creek, the Lone Star acquisition, PVR’s acquisition of pipeline assets in the Anadarko Basin of Oklahoma and Texas and PVR’s capacity expanding capital expenditures related to the Spearman and Crossroads plants. For a more detailed discussion of PVR’s acquisitions and investments, see “— Acquisitions and Divestitures.”
Revenues, profitability and the future rate of growth of the PVR natural gas midstream segment are highly dependent on market demand and prevailing NGL and natural gas prices. Historically, changes in the prices of most NGL products have generally correlated with changes in the price of crude oil. NGL and natural gas prices have been subject to significant volatility in recent years in response to changes in the supply and demand for NGL products and natural gas market uncertainty. The current deterioration in global economy, including financial and credit markets, will likely result in a decrease in worldwide demand for oil and domestic demand for natural gas and NGLs. Depending on the longevity and ultimate severity of the deterioration, NGL production from PVR’s processing plants could decrease and adversely effect its natural gas midstream processing income and PVR’s ability to make cash distributions to its limited partners and to PVG, the owner of PVR’s general partner.
Eliminations and Other
Eliminations and other primarily represents elimination of intercompany sales, corporate functions such as interest expense and income tax expense, and the oil and gas segment derivatives.
Ownership of and Relationship with PVG and PVR
Penn Virginia, PVG and PVR are publicly traded on the NYSE under the symbols “PVA,” “PVG” and “PVR.” As of December 31, 2008, we owned the general partner of PVG and an approximately 77% limited partner interest in PVG. PVG
also owns an approximately 37% limited partner interest in PVR and 100% of the general partner of PVR, which holds a 2% general partner interest in PVR and all of the IDRs. We directly owned an additional 0.1% limited partner interest in PVRConsolidated Balance Sheet as of December 31, 2008. Because PVG controlsAdditional information is provided in Note 22 to the general partner of PVR, the financial results of PVR are included in PVG’s consolidated financial statements. Because we control the general partner of PVG, the financial results of PVG are included in our consolidated financial statements. However, PVG and PVR function with capital structures that are independent of each other and us, with each having publicly traded common units and PVR having its own debt instruments. PVG does not currently have any debt instruments. While we report consolidated financial results of PVR’s coal and natural resource management and natural gas midstream businesses, the only cash we received from those businesses is in the form of cash distributions we received from PVG and PVR in respect of our partner interests in each of them.
In conjunction with the initial public offering of PVG, we contributed our general partner interest, IDRs and most of our limited partner interest in PVR to PVG in exchange for the general partner interest and a limited partner interest in PVG. We are currently entitled to receive quarterly cash distributions from PVG and PVR on our limited partner interests in PVG and PVR. As a result, we received total distributions of $44.0 million and $29.8 million from PVG and PVR in the years ended December 31, 2008 and 2007 as shown in the following table:
| | | | | | |
| | | Year Ended
December 31, |
| | | 2008 | | 2007 |
| | | (in thousands) |
Penn Virginia GP Holdings, L.P. | | $ | 43,435 | | $ | 29,200 |
Penn Virginia Resource Partners, L.P. (1) | | | 583 | | | 640 |
| | | | | | |
Total | | $ | 44,018 | | $ | 29,840 |
| | | | | | |
| (1) | Includes PVR distributions for restricted units held by employees and directors. |
We have historically received increasing distributions from our partner interests in PVG and PVR. Based on PVG’s and PVR’s current annualized distribution rates of $1.52 and $1.88 per unit, we would receive aggregate annualized distributions of $46.3 million in respect of our partner interests in the year ended December 31, 2009. As a result of PVR’s 2008 unit offering, we recognized a gain in shareholders’ equity and PVG recognized gains in its partners’ capital. See Note 3 – “Summary of Significant Accounting Policies” and Note 6 – “PVR Unit Offering” in the Notes to Consolidated Financial Statements in Item 8, “Financial Statements and Supplementary Data.”Statements.
Prior to PVG’s initial public offering in December 2006, we indirectly owned common units representing an approximately 37% limited partner interest in PVR, as well as the sole 2% general partner interest and all of the IDRs in PVR. We received total distributions from PVR of $28.6 million in 2006, allocated among our limited partner interest, general partner interest and IDRs as shown in the following table:
| | | |
| | | Year Ended
December 31,
2006 |
| | | (in thousands) |
Limited partner interest | | $ | 23,039 |
General partner interest (2%) | | | 1,254 |
IDRs | | | 4,273 |
| | | |
Total | | $ | 28,566 |
| | | |
Acquisitions and Divestitures
Oil and Gas Segment
In July 2008, we completed the sale of certain unproved oil and gas acreage in Louisiana for cash proceeds of $32.0 million and recognized a $30.5 million gain on that sale.
In October 2007, we acquired lease rights to property covering 4,800 acres located in East Texas, with estimated proved reserves of 21.9 Bcfe. The purchase price was $44.9 million in cash and was funded with long-term debt under the Revolver.
In October 2007, we sold to PVR oil and gas royalty interests associated with leases of property in eastern Kentucky and southwestern Virginia with estimated proved reserves of 8.7 Bcfe at January 1, 2007. The sale price was $31.0 million in cash, and the proceeds of the sale were used to repay borrowings under the Revolver. The gain on the sale and the related depletion expenses have been eliminated in the consolidation of our financial statements.
In September 2007, we sold non-operated working interests in oil and gas properties located in eastern Kentucky and southwestern Virginia, with estimated proved reserves of 13.3 Bcfe. The sale price was $29.1 million in cash, and the proceeds of the sale were used to repay borrowings under the Revolver. We recognized a gain of $12.4 million on the sale, which is reported in the revenues section of our consolidated statements of income.
In August 2007, we acquired lease rights to property covering approximately 22,700 acres located in eastern Oklahoma, with estimated proved reserves of 18.8 Bcfe. The purchase price was $47.9 million in cash and was funded with long-term debt under the Revolver.
In July 2007, we acquired lease rights to property covering approximately 4,000 acres located in East Texas, with estimated proved reserves of 19.5 Bcfe. The purchase price was $22.0 million in cash and was funded with long-term debt under the Revolver.
In June 2006, we acquired 100% of the capital stock of Crow Creek Holding Corporation, or Crow Creek. Crow Creek was a privately owned independent exploration and production company with operations primarily in the Oklahoma portions of the Arkoma and Anadarko Basins. Crow Creek’s assets included estimated net proved reserves of 42.7 Bcfe, approximately 85% of which were natural gas. The purchase price was $71.5 million in cash and was funded with long-term debt under the Revolver.
PVR Coal and Natural Resource Management Segment
In May 2008, PVR acquired fee ownership of approximately 29 million tons of coal reserves and approximately 56 million board feet of hardwood timber in western Virginia and eastern Kentucky. The purchase price was $24.5 million in cash and was funded with long-term debt under PVR’s revolving credit facility, or the PVR Revolver.
In September 2007, PVR acquired fee ownership of approximately 62,000 acres of forestland in northern West Virginia. The purchase price was $93.3 million in cash and was funded with long-term debt under the PVR Revolver.
In June 2007, PVR acquired a combination of fee ownership and lease rights to approximately 51 million tons of coal reserves, along with a preparation plant and coal handling facilities. The property is located on approximately 17,000 acres in western Kentucky. The purchase price was $42.0 million in cash and was funded with long-term debt under the PVR Revolver.
In May 2006, PVR acquired lease rights to approximately 69 million tons of coal reserves. The reserves are located on approximately 20,000 acres in southern West Virginia. The purchase price was $65.0 million in cash and was funded with long-term debt under the PVR Revolver.
PVR Natural Gas Midstream Segment
In July 2008, PVR completed the Lone Star acquisition. Lone Star’s assets are located in the southern portion of the Fort Worth Basin of North Texas and include approximately 129 miles of gas gathering pipelines and approximately 240,000 acres dedicated by active producers. The Lone Star acquisition expanded the geographic scope of the PVR natural gas midstream segment into the Barnett Shale play in the Fort Worth Basin. PVR acquired this business for approximately $164.3 million and a liability of $4.7 million, which represents the fair value of a $5.0 million guaranteed payment, plus contingent payments of $30.0 million and $25.0 million. Funding for the acquisition was provided by $80.7 million of borrowings under the PVR Revolver, 2,009,995 PVG common units (which PVR purchased from two of our subsidiaries for $61.8 million) and 542,610 newly issued PVR common units. The contingent payments will be triggered if revenues from certain assets located in a defined geographic area reach certain targets by or before June 30, 2013 and will be funded in cash or PVR common units, at PVR’s election.
In April 2008, PVR acquired a 25% member interest in Thunder Creek, a joint venture that gathers and transports CBM in Wyoming’s Powder River Basin. The purchase price was $51.6 million in cash, after customary closing adjustments, and was funded with long-term debt under the PVR Revolver.
In June 2006, PVR completed the acquisition of approximately 115 miles of gathering pipelines and related compression facilities in Texas and Oklahoma. These assets are contiguous to PVR’s Panhandle System. The purchase price was $14.7 million and was funded with cash. Subsequently, PVR borrowed $14.7 million under the PVR Revolver to replenish the cash used for the acquisition.
Liquidity and Capital Resources
Cash Flows
Although results are consolidated for financial reporting, Penn Virginia, PVG and PVR operate with independent capital structures. Since PVR’s inception in 2001 and PVG’s inception in 2006, withWith the exception of cash distributions paid to us by PVG and PVR, the cash needs of each entity have been met independently with a combination of operating cash flows, asset sales, credit facility borrowings and the issuance of common stock and new PVG and PVR units. We expect that our cash needs and the cash needs of PVG and PVR will continue to be met independently of each other with a combination of these funding sources.
Liquidity is defined as the ability to convert assets into cash or to obtain cash. Short-term liquidity refers to the ability to meet short-term obligations of 12 months or less. Liquidity is a matter of degree and is expressed in terms of working capital and the current ratio and, due to the recent deterioration of the credit and financial markets, in terms of the availability of borrowing capacity against existing credit facilities and debt instruments. Our consolidated working capital (current assets minus current liabilities) and consolidated current ratio (current assets divided by current liabilities) are as follows as of December 31, 2008 and 2007:
| | | | | | | |
| | | As of December 31, | |
| | | 2008 | | 2007 | |
Current Assets | | $ | 263,518 | | $ | 244,072 | |
Current Liabilities | | | 247,594 | | | 261,899 | |
| | | | | | | |
Working Capital | | | 15,924 | | | (17,827 | ) |
Current Ratio | | | 1.06 | | | 0.93 | |
As discussed in more detail in “Long-Term Debt” below, as of December 31, 2008, we had availability of $146.7 million, subject to redetermination in the second quarter of 2009, and PVR had availability of $130.3 million under our separate credit facilities.
With respect to Penn Virginia (excluding the sources and uses of capital by PVG and PVR), we satisfy our working capital requirements and fund our capital expenditures using cash generated from our operations, asset sales, borrowings under the Revolver and proceeds from equitycommon stock offerings. We satisfy our debt service obligations and dividend payments solely using cash generated from our operations. We believe that the cash generated from our operations and our borrowing capacity will be sufficient to meet our 2010
TABLE OF CONTENTS
working capital requirements, anticipated capital expenditures (other than major capital improvements or acquisitions), scheduled debt payments and dividend payments. Our ability to satisfy our obligations and planned expenditures will depend on our future operating performance, which will be affected by, among other things, prevailing economic conditions in the commodity markets of oil and natural gas, some of which are beyond our control. In addition, depending on the longevity and ultimate severity of the current deterioration of the global economy, including financial and credit markets, our ability to grow through acquisitions may be significantly adversely effected. This is due to our debt capacity not being as readily expandable as in the past, which is driven by the overall restrictions on lending by the banking industry. Because of this deterioration in the financial and credit markets, we are anticipating a decrease in capital spending in 2009. See Item 1A, “Risk Factors.”
PVR’s ability to satisfy its obligations and planned expenditures will depend upon its future operating performance, which will be affected by prevailing economic conditions in the coal industry and natural gas midstream market, some of which are beyond PVR’s control. In addition, depending on the longevity and ultimate severity of the current deterioration of the global economy, including financial and credit markets, PVR’s ability to grow may be significantly adversely affected, as may PVR’s ability to make acquisitions and cash distributions to its limited partners, to us and to PVG, the owner of PVR’s general partner. This is due to PVR’s debt capacity not being as readily expandable as in the past, which is driven by the overall restrictions on lending by the banking industry. Because of these restrictions to PVR’s debt capacity and deterioration in the financial and credit markets, PVR is anticipating a decrease in capital spending in 2009. See Item 1A, “Risk Factors.”
Cash Flows
Except where noted, theThe following discussiontables summarize our statements of cash flows, and capital expenditures relates to our consolidated results.
The following table summarizes our cash flow statementson a disaggregated basis, for the years ended December 31, 2008, 2007 and 2006, consolidating the PVG cash flow statement andperiods presented:
| | | | | | |
| For the Year Ended December 31, 2009 | | Oil & Gas,
PVA Corporate
& Other | | PVG/PVR | | Consolidated |
| Cash flows from operating activities | | $ | 117,733 | | | $ | 158,214 | | | $ | 275,947 | |
Cash flows from investing activities
| | | | | | | | | | | | |
| Acquisitions | | | (17,314 | ) | | | (29,580 | ) | | | (46,894 | ) |
| Additions to property and equipment | | | (188,362 | ) | | | (51,097 | ) | | | (239,459 | ) |
| Other | | | 15,094 | | | | 1,147 | | | | 16,241 | |
| Net cash used in investing activities | | | (190,582 | ) | | | (79,530 | ) | | | (270,112 | ) |
Cash flows from financing activities
| | | | | | | | | | | | |
| Dividends paid | | | (9,836 | ) | | | — | | | | (9,836 | ) |
| Distributions received (paid) | | | 42,279 | | | | (120,450 | ) | | | (78,171 | ) |
| Debt borrowings (repayments) | | | (332,000 | ) | | | 52,000 | | | | (280,000 | ) |
| Short-term bank borrowings (repayments) | | | (7,542 | ) | | | — | | | | (7,542 | ) |
| Net proceeds from issuance of senior notes | | | 291,009 | | | | — | | | | 291,009 | |
| Net proceeds from issuance of common stock | | | 64,835 | | | | — | | | | 64,835 | |
| Net proceeds from the sale of PVG units | | | 118,080 | | | | — | | | | 118,080 | |
| Debt issuance costs paid | | | (14,959 | ) | | | (9,258 | ) | | | (24,217 | ) |
| Net cash provided by financing activities | | | 151,866 | | | | (77,708 | ) | | | 74,158 | |
| Net increase in cash and cash equivalents | | $ | 79,017 | | | $ | 976 | | | $ | 79,993 | |
| | | | | | |
| For the Year Ended December 31, 2008 | | Oil & Gas,
PVA Corporate
& Other | | PVG/PVR | | Consolidated |
| Cash flows from operating activities | | $ | 246,587 | | | $ | 137,187 | | | $ | 383,774 | |
Cash flows from investing activities
| | | | | | | | | | | | |
| Acquisitions | | | (33,371 | ) | | | (260,376 | ) | | | (293,747 | ) |
| Additions to property and equipment | | | (513,687 | ) | | | (71,652 | ) | | | (585,339 | ) |
| Other | | | 32,521 | | | | 998 | | | | 33,519 | |
| Net cash used in investing activities | | | (514,537 | ) | | | (331,030 | ) | | | (845,567 | ) |
Cash flows from financing activities
| | | | | | | | | | | | |
| Dividends paid | | | (9,398 | ) | | | — | | | | (9,398 | ) |
| Distributions received (paid) | | | 44,018 | | | | (108,263 | ) | | | (64,245 | ) |
| Debt borrowings (repayments) | | | 210,000 | | | | 156,000 | | | | 366,000 | |
| Short-term bank borrowings | | | 7,542 | | | | — | | | | 7,542 | |
| Net proceeds from issuance of PVR units | | | — | | | | 138,141 | | | | 138,141 | |
| Other, net | | | 11,764 | | | | (4,200 | ) | | | 7,564 | |
| Net cash provided by financing activities | | | 263,926 | | | | 181,678 | | | | 445,604 | |
| Net decrease in cash and cash equivalents | | $ | (4,024 | ) | | $ | (12,165 | ) | | $ | (16,189 | ) |
TABLE OF CONTENTS
Cash Flows From Operating Activities
Consistent with the oil and gas corporatesegment’s operating performance, our cash flows from operating activities reflected significant declines in commodity prices for our products partially offset by lower cash operating expenses and other cash flow statement:
| | | | | | | | | | | | |
For The Year Ended December 31, 2008 | | Oil and
Gas, PVA
Corporate
& Other | | | PVG | | | Consolidated | |
Net cash provided by operating activities | | $ | 246,587 | | | $ | 137,187 | | | $ | 383,774 | |
Net cash flows from investing activities: | | | | | | | | | | | | |
Acquisitions | | | (33,371 | ) | | | (260,376 | ) | | | (293,747 | ) |
Additions to property and equipment | | | (513,687 | ) | | | (71,652 | ) | | | (585,339 | ) |
Other | | | 32,521 | | | | 998 | | | | 33,519 | |
| | | | | | | | | | | | |
Net cash used in investing activities | | | (514,537 | ) | | | (331,030 | ) | | | (845,567 | ) |
| | | | | | | | | | | | |
Cash flows from financing activities: | | | | | | | | | | | | |
Dividends paid | | | (9,398 | ) | | | — | | | | (9,398 | ) |
Distributions received (paid) | | | 44,018 | | | | (108,263 | ) | | | (64,245 | ) |
Debt borrowings, net | | | 210,000 | | | | 156,000 | | | | 366,000 | |
Proceeds received from issuance of PVR partners’ capital | | | — | | | | 138,141 | | | | 138,141 | |
Short-term bank borrowings | | | 7,542 | | | | — | | | | 7,542 | |
Other | | | 11,764 | | | | (4,200 | ) | | | 7,564 | |
| | | | | | | | | | | | |
Net cash provided by financing activities | | | 263,926 | | | | 181,678 | | | | 445,604 | |
| | | | | | | | | | | | |
Net decrease in cash and cash equivalents | | $ | (4,024 | ) | | $ | (12,165 | ) | | $ | (16,189 | ) |
| | | | | | | | | | | | |
| | | |
For the Year Ended December 31, 2007 | | Oil and
Gas, PVA
Corporate
& Other | | | PVG | | | Consolidated | |
Net cash provided by operating activities | | $ | 186,550 | | | $ | 126,480 | | | $ | 313,030 | |
Net cash flows from investing activities: | | | | | | | | | | | | |
Acquisitions | | | (115,084 | ) | | | (176,917 | ) | | | (292,001 | ) |
Additions to property and equipment | | | (373,386 | ) | | | (48,123 | ) | | | (421,509 | ) |
Other | | | 29,169 | | | | 858 | | | | 30,027 | |
| | | | | | | | | | | | |
Net cash used in investing activities | | | (459,301 | ) | | | (224,182 | ) | | | (683,483 | ) |
| | | | | | | | | | | | |
Cash flows from financing activities: | | | | | | | | | | | | |
Dividends paid | | | (8,499 | ) | | | — | | | | (8,499 | ) |
Distributions received (paid) | | | 29,840 | | | | (79,579 | ) | | | (49,739 | ) |
Debt borrowings, net | | | 131,000 | | | | 193,500 | | | | 324,500 | |
Gross proceeds from PVA stock offering | | | 135,441 | | | | — | | | | 135,441 | |
Cash received for stock warrants sold | | | 18,187 | | | | — | | | | 18,187 | |
Cash paid for convertible note hedges | | | (36,817 | ) | | | — | | | | (36,817 | ) |
Other | | | 972 | | | | 597 | | | | 1,569 | |
| | | | | | | | | | | | |
Net cash provided by financing activities | | | 270,124 | | | | 114,518 | | | | 384,642 | |
| | | | | | | | | | | | |
Net increase (decrease) in cash and cash equivalents | | $ | (2,627 | ) | | $ | 16,816 | | | $ | 14,189 | |
| | | | | | | | | | | | |
| | | |
For the Year Ended December 31, 2006 | | Oil and
Gas, PVA
Corporate
& Other | | | PVG | | | Consolidated | |
Net cash provided by operating activities | | $ | 175,136 | | | $ | 100,683 | | | $ | 275,819 | |
Net cash flows from investing activities: | | | | | | | | | | | | |
Acquisitions | | | (103,907 | ) | | | (91,259 | ) | | | (195,166 | ) |
Additions to property and equipment | | | (231,320 | ) | | | (38,453 | ) | | | (269,773 | ) |
Other | | | 2,568 | | | | 36 | | | | 2,604 | |
| | | | | | | | | | | | |
Net cash used in investing activities | | | (332,659 | ) | | | (129,676 | ) | | | (462,335 | ) |
| | | | | | | | | | | | |
Cash flows from financing activities: | | | | | | | | | | | | |
Dividends paid | | | (8,398 | ) | | | — | | | | (8,398 | ) |
Distributions received (paid) | | | 22,186 | | | | (60,813 | ) | | | (38,627 | ) |
Debt borrowings (repayments), net | | | 142,000 | | | | (37,100 | ) | | | 104,900 | |
Proceeds from equity issuance | | | (1,590 | ) | | | 119,408 | | | | 117,818 | |
Other | | | 7,213 | | | | (1,965 | ) | | | 5,248 | |
| | | | | | | | | | | | |
Net cash provided by financing activities | | | 161,411 | | | | 19,530 | | | | 180,941 | |
| | | | | | | | | | | | |
Net increase (decrease) in cash and cash equivalents | | $ | 3,888 | | | $ | (9,463 | ) | | $ | (5,575 | ) |
| | | | | | | | | | | | |
Net Cash Provided by Operating Activities
Changes toseverance taxes as well as lower working capital andutilization primarily attributable to our current ratio are largely affected bya significantly reduced drilling program. Also, mitigating the decline in cash revenues during 2009 was the net cash received from our derivatives portfolio. Our derivatives provided by both our and PVR’s operating activities. Netapproximately $58 million in cash provided by our and PVR’sreceipts during 2009 as compared to net cash payments of approximately $8 million during 2008.
Excluding the impact of derivatives settlements, PVG’s cash flows from operating activities primarily came fromdeclined by approximately $20 million during 2009 as compared to 2008 consistent with a decline in the following sources:
Oil and gas segment:
The sale of natural gas, crude oil and NGL’s;
settlements from our oil and gas commodity derivatives; and
the collection of fees charged for gathering natural gas volumes.
PVR coal and natural resource management segment:
the collection of coal royalties;
the sale of standing timber;
the collection of coal transportation, or wheelage, fees;
distributions received from PVR’s equity investees; and
settlements from PVR’s interest rate swaps, or the PVR Interest Rate Swaps.
PVR natural gas midstream segment:
segment’s gross margin despite higher system throughput. In addition, the collection of revenues from natural gas processing contracts with natural gas producers;
the collection of revenues from PVR’s natural gas marketing business; and
settlements from PVR’sPVR natural gas midstream commodity derivatives.
In addition, we receive settlementssegment incurred higher cash operating expenses primarily attributable to operating a more expanded network during 2009 resulting from our interest rate swaps, or the Interest Rate Swaps, which are included in our corporateacquisitions and other activities.
Both we and PVR use theexpansions in recent prior years. Also contributing to lower net cash provided byflows from operating activities was a decline in the oil and gas segment, the PVR coal and natural resource management segment and the PVR natural gas midstream segment in the following ways:
operating expenses, such as office rentals, core-hole drilling costs and repairs and maintenance costs;
taxes other than income, such as severance and property taxes;
general and administrative expenses, such as office rentals, staffing costs and legal fees;
interest on debt service obligations;
repayments of borrowings;
PVR’s distributions to partners; and
dividends to our shareholders.
Net cash provided by operating activities of the oil and gas segment and for Penn Virginia corporate and other activities in 2008 increased by $60.0 million, or 32%, to $246.6 million from $186.6 million in 2007. This increase was primarily attributable to increased natural gas, crude oil and NGLsegment’s revenues resulting from increases in both production and pricing, partially offset by increased staffing costs in the oil and gas segment; increased severance taxes, which were driven by increased natural gas, crude oil and NGL production; increased cash outflows for oil and gas commodity derivative settlements; and increased operating costs in the oil and gas segment. See “ –Oil and Gas Segment” and “–Eliminations and Other – Corporate Operating Expenses” for a more detailed explanation of the factors that increased cash provided by operating activities.
Net cash provided by operating activities of the oil and gas segment and for Penn Virginia corporate and other activities in 2007 increased by $11.5 million, or 7%, to $186.6 million from $175.1 million in 2006. The overall increase in cash provided by operating activities in 2007 compared to 2006 was primarily attributable to increased natural gas and crude oil production, partially offset by increased consulting fees and staffing costs. See “– Oil and Gas Segment” and “–Eliminations and Other –Corporate Operating Expenses” for a more detailed explanation of the factors that increased cash provided by operating activities.
PVG does not have any operations on a stand-alone basis. It primarily relies on cash distributions received from PVR for its general and administrative expenses, which are the costs of PVG being a publicly-traded company.
Net cash provided by PVG’s consolidated operating activities in 2008 increased by $10.7 million, or 8%, to $137.2 million from $126.5 million in 2007. The overall increase in net cash provided by PVG’s consolidated operating activities in 2008 compared to 2007 was primarily attributable to increased cash received from the sales of residue gas and NGLs, which was primarily driven by increased system throughput volume; increased coal royalties received, which was driven primarily by increased production and sales prices of coal in the Central Appalachian and Illinois Basin regions; and increased cash received from the sale of standing timber, which was due primarily to increased harvesting from PVR’s September 2007 forestland acquisition. These increases were partially offset by increased cash outflows from PVR’s natural gas midstream derivative settlements. See “– PVR Coal and Natural Resource Management Segment” and “– PVR Natural Gas Midstream Segment” for a more detailed explanation of the factors that increased cash provided by PVR’s operating activities.
Net cash provided by PVG’s consolidated operating activities in 2007 increased by $25.8 million, or 26%, to $126.5 million from $100.7 million in 2006. This increase was primarily attributable to increased sales of NGLs, which was primarily driven by increased volumes of processed gas and a higher frac spread during 2007 than in 2006; and decreased cash outflows for PVR’s natural gas midstream commodity derivative settlements. These increases were partially offset by a decreaseproportionate decline in coal royaltiescash operating expenses. With respect to derivatives, PVR received which was driven by a decrease in coal production from subleased properties in the Central Appalachian region. See “– PVR Coal and Natural Resource Management Segment” and “– PVR Natural Gas Midstream Segment” for a more detailed explanation of the factors that increased cash provided by PVR’s operating activities.
Net Cash Used in Investing Activities
Net cash used in the oil and gas segment and for Penn Virginia corporate and other activities in 2008 increased by $55.2 million, or 12%, to $514.5 million from $459.3approximately $3 million in 2007. PVG’s investing activities consist solelycash receipts during 2009 as compared to net cash payments of cash provided by and used in PVR’s investing activities. Net cash used by PVR in its investing activities in 2008 increased by $106.8approximately $38 million or 48%, to $331.0 million from $224.2 million in 2007. during 2008.
Cash Flows From Investing Activities
The cash used by both us and PVR in investing activities for the years ended December 31, 2008, 2007 and 2006 were used primarily for capital expenditures. The following table sets forthexpenditures partially offset by proceeds received from the sale of certain properties and equipment. Consistent with economic conditions during 2009, we significantly reduced our drilling program and PVR reduced its capital expenditures by segment made during the years ended December 31,additions and acquisition activities.
Our 2008 2007 and 2006:
| | | | | | | | | |
| | | Year Ended December 31, |
| | | 2008 (1) | | 2007 (2) | | 2006 (3) |
| | | (in thousands) |
Oil and gas | | | | | | | | | |
Proved property acquisitions | | $ | — | | $ | 88,174 | | $ | 72,724 |
Development drilling | | | 481,401 | | | 310,428 | | | 175,257 |
Exploration drilling | | | 23,785 | | | 42,540 | | | 41,923 |
Seismic | | | 4,169 | | | 2,773 | | | 6,238 |
Lease acquisition and other | | | 95,529 | | | 53,775 | | | 27,795 |
Pipeline, gathering, facilities | | | 36,812 | | | 22,738 | | | 14,547 |
| | | | | | | | | |
Total | | $ | 641,696 | | $ | 520,428 | | $ | 338,484 |
| | | | | | | | | |
| | | |
Coal and natural resource management | | | | | | | | | |
Acquisitions | | | 27,075 | | | 145,918 | | | 76,402 |
Expansion capital expenditures | | | — | | | 85 | | | 15,103 |
Other property and equipment expenditures | | | 195 | | | 84 | | | 100 |
| | | | | | | | | |
Total | | | 27,270 | | | 146,087 | | | 91,605 |
| | | | | | | | | |
| | | |
Natural gas midstream | | | | | | | | | |
Acquisitions | | | 259,417 | | | — | | | 14,626 |
Expansion capital expenditures | | | 59,385 | | | 38,686 | | | 15,394 |
Other property and equipment expenditures | | | 14,505 | | | 9,767 | | | 9,414 |
| | | | | | | | | |
Total | | $ | 333,307 | | $ | 48,453 | | $ | 39,434 |
| | | | | | | | | |
| | | |
Other | | $ | 1,336 | | $ | 7,294 | | $ | 3,682 |
| | | | | | | | | |
| | | |
Total capital expenditures | | $ | 1,003,609 | | $ | 722,262 | | $ | 473,205 |
| | | | | | | | | |
| (1) | The oil and gas segment acquisitions in 2006 excludes deferred tax assets of $32.3 million and acquisition of net liabilities other than property or equipment of $29.1 million related to the acquisition of Crow Creek. |
| (2) | The PVR coal and natural resource management segment acquisitions in 2007 include an $11.5 million lease receivable associated with the acquisition of fee ownership and lease rights to coal reserves in western Kentucky and $31.0 million of oil and gas royalty interests that PVR purchased from us. The PVR coal and natural resource management segment acquisitions in 2006 include the acquisition of assets and liabilities other than property or equipment of $1.2 million. |
| (3) | The PVR natural gas midstream segment acquisitions in 2008 include the following non-cash items, all of which was given as consideration in the Lone Star acquisition: newly issued PVR units valued at $15.2 million; PVG units, which were purchased from two of our subsidiaries, valued at $68.0 million; and a $4.7 million guaranteed payment which will be paid in 2009. The remainder of the difference between (i) capital additions and (ii) cash paid for acquisitions and additions to property and equipment primarily consists of the change in accrued drilling costs. |
In 2008, the oil and gas segment made aggregate capital expenditures of $641.7 million. These capital expenditures were primarily discretionary capital ependituresin nature and included development drilling and various lease acquisitions primarilylargely in East Texas. In 2008, we drilled a successful horizontal Lower Bossier (Haynesville) Shale well in Harrison County, Texas. Based on this successful horizontal test, we had four drilling rigs drilling horizontal Lower Bossier (Haynesville) Shale wells as of December 31, 2008. In addition to these capital expenditures, we also completed the sale of unproved oil and gas acreage in Louisiana for cash proceeds of $32.0 million.
In 2007, the oil and gas segment made aggregate capital expenditures of $520.4 million. These capital expenditures were primarily discretionary capital expenditures and included development drilling, the acquisitions of lease rights to property in eastern Oklahoma with estimated proved reserves of 18.8 Bcfe, the acquisition of lease rights to property in East Texas with estimated proved reserves of 21.9 Bcfe and lease rights to property in East Texas with estimated proved reserves of 19.5 Bcfe. In addition to these capital expenditures, we sold non-operated working interests in oil and gas properties located in eastern Kentucky and southwestern Virginia for $29.1 million in cash and sold to PVR oil and gas royalty interests associated with leases of property in eastern Kentucky and southwestern Virginia with estimated proved reserves of 8.7 Bcfe for $31.0 million. Other capital expenditures of $7.3 million in 2007 were also discretionary capital expenditures and were primarily due to consulting fees related to the implementation of a software system.
In 2006, the oil and gas segment made aggregate capital expenditures of $338.5 million, which were primarily discretionary capital expenditures related to development drilling, the acquisition of Crow Creek for $71.5 million and exploratory drilling.
In 2008, PVR made aggregate capital expenditures of $360.6 million. These capitalPVR’s expenditures consisted primarily of discretionary capital expenditures which included PVR’s 25% member interest acquisition in Thunder Creek, the Lone Star acquisition, pipeline assets in the Anadarko Basin of Oklahoma and Texas, expansion capital expenditures related to the Spearman and Crossroads plants and the acquisition of approximately 29 million tons of coal reserves and an estimated 56 million board feetMMbf of hardwood timber in western Virginia and eastern Kentucky.
The PVR natural gas midstream segment also incurred approximately $14.5 million of maintenancefollowing table sets forth our capital expenditures programs, by segment, for equipment overhauls and connecting wells in existing areas.the periods presented:
In 2007, PVR made aggregate
| | | | |
| | Year Ended December 31, |
| | | 2009 | | 2008 |
Oil and gas:
| | | | | | | | |
| Development drilling | | $ | 140,243 | | | $ | 481,401 | |
| Exploration drilling | | | 2,524 | | | | 23,785 | |
| Seismic | | | 1,195 | | | | 4,169 | |
| Lease acquisition and other | | | 18,456 | | | | 95,529 | |
| Pipeline and gathering facilities | | | 9,382 | | | | 36,812 | |
| | | | 171,800 | | | | 641,696 | |
Coal and natural resources:
| | | | | | | | |
| Acquisitions | | | 2,067 | | | | 27,075 | |
| Other property and equipment expenditures | | | 185 | | | | 195 | |
| | | | 2,252 | | | | 27,270 | |
Natural gas midstream:
| | | | | | | | |
| Acquisitions | | | 27,514 | | | | 259,417 | |
| Expansion capital expenditures | | | 36,863 | | | | 59,385 | |
| Other property and equipment expenditures | | | 8,399 | | | | 14,505 | |
| | | | 72,776 | | | | 333,307 | |
| Other | | | 1,958 | | | | 1,336 | |
| Total capital expenditures | | $ | 248,786 | | | $ | 1,003,609 | |
TABLE OF CONTENTS
The following table reconciles the total capital expenditures programs provided above with the net cash paid for acquisitions and additions to property and equipment as reflected in the Consolidated Statements of $225.5 million. These capital expenditures consisted primarilyCash Flows for the periods presented:
| | | | |
| | Year Ended December 31, |
| | | 2009 | | 2008 |
| Total capital expenditures | | $ | 248,786 | | | $ | 1,003,609 | |
Less:
| | | | | | | | |
| Exploration expenses | |
| Seismic | | | (1,195 | ) | | | (4,169 | ) |
| Other | | | (3,460 | ) | | | (2,419 | ) |
| Changes in accrued capitalized costs | | | 39,549 | | | | (33,181 | ) |
| Non-cash purchase consideration(1) | | | — | | | | (87,865 | ) |
Add:
| | | | | | | | |
| Capitalized interest paid | | | 2,544 | | | | 2,712 | |
| Other | | | 129 | | | | 399 | |
| Total capital expenditure cash outflows | | $ | 286,353 | | | $ | 879,086 | |
| Cash paid for acquisitions | | $ | 46,894 | | | $ | 293,747 | |
| Cash paid for additions to property and equipment | | | 239,459 | | | | 585,339 | |
| Total reflected in cash flows from investing activities | | $ | 286,353 | | | $ | 879,086 | |
| (1) | Attributable to the PVR natural gas midstream segment’s 2008 Lone Star acquisition and reflects the following items: PVR units valued at $15.2 million; PVG units, which were purchased from two of our subsidiaries, valued at $68 million and a $5 million guaranteed payment accrued in 2008 and paid in 2009 (see Note 5 to the Consolidated Financial Statements). |
Cash Flows From Financing Activities
During 2009, we issued the Senior Notes which provided proceeds of discretionary capital expenditures, which included PVR’s coal reserve acquisitions, a forestland acquisition,$281.6 million, net of an oiloriginal issue discount and gas royalty interest acquisitionissuance costs and natural gas midstream gathering system expansion projects. The PVR natural gas midstream segment also incurred $9.8sold 3.5 million shares of maintenance capital expenditures for equipment overhauls and connecting wells in existing areas.
In 2006, PVR made aggregate capital expenditures of $131.0 million. These capital expenditures consisted primarily of discretionary capital expenditures, which included PVR’s coal reserve acquisitions, coal loadout facility construction projects, a natural gas midstream acquisition and coal and natural gas midstream gathering system expansion projects. The PVR natural gas midstream segment also incurred $9.4 million of maintenance capital expenditures for equipment overhauls and connecting wells in existing areas.
We funded oil and gas and other capital expenditures in 2008 with borrowings under the Revolver, cash provided by operating activities, cash distributions received from PVG and PVR and cash provided by operating activities. We funded oil and gas and other capital expenditures in 2007 with borrowings under the Revolver, cash provided by operating activities, cash distributions received from PVG and PVR, the issuance ofour common stock and convertible notes, the salein a registered public offering providing net proceeds of common stock warrants and$64.8 million. In addition, we sold 10 million units of PVG owned by us for net proceeds of $118.1 million resulting in a reduction of our limited partner interest in PVG from the sale of oil and gas working and royalty interests. We funded oil and gas and other capital expenditures in 2006 with cash provided by operating activities, cash distributions received from PVG and PVR and borrowings under the Revolver.
PVR funded its coal and natural resource management and natural gas midstream capital expenditures in 2008 primarily with cash provided by operating activities, borrowings under the PVR Revolver,77.0% to 51.4%. These proceeds from the sale of common units and a contribution from its general partner to maintain its 2% general partner interest. PVR funded its capital expenditures in 2007 with cash provided by operating activities and borrowings under the PVR Revolver. PVR funded its capital expenditures in 2006 with cash provided by operating activities, borrowings under the PVR Revolver, proceeds from the sale of common and Class B units to PVG and a contribution from its general partner to maintain its 2% general partner interest.
Net Cash Provided by Financing Activities
Net cash provided by financing in the oil and gas segment and for corporate activities in 2008 decreased by $6.2 million, or 2%, to $263.9 million from $270.1 million in 2007, duewere used primarily to proceeds received in 2007, but not 2008, for a stock offering, higher net proceeds from debt borrowings in 2008 and higher distributions received from PVG and PVR in 2008. Net cash provided by financing activities in the oil and gas segment and for corporate activities in 2007 increased by $108.7 million, or 67%, to $270.1 million from $161.4 million in 2006, due primarily to the $135.4 million in net proceeds received fromeliminate our 2007 stock offering, $18.2 million received in 2007 for the stock warrants that we sold and higher distributions received from PVG and PVR in 2007, partially offset by the $36.8 million paid in 2007 for the convertible note hedges.
In 2008, we had $210.0 million of net borrowings, consisting of borrowings under the Revolver of $273.0 million and repayments under the Revolver of $63.0 million. See “— Long-Term Debt” below for a more detailed description of our December 31, 2008 long-term debt balance. We had $131.0 million of net borrowings in 2007, comprised of net borrowings of $230.0 million under our convertible senior subordinated notes, or the Convertible Notes, and net repayments of $99.0 million under the Revolver. In addition, proceeds from the sale of our oil and gas working interests in 2007 were used to repay borrowings under the Revolver. WeDuring 2008, we had net borrowings of $142.0$210 million under the Revolver in 2006, which consisted of $162.0 million of borrowings, partially offset by $20.0 million of repayments.
As a result of our partner interests in PVG andDuring 2009, PVR we received cash distributions of $44.0 million in 2008, $29.8 million in 2007 and $28.6 million in 2006. These distributions we received were primarily used for oil and gas segment capital expenditures.
Net cash provided by PVG’s financing activities in 2008 increased by $67.2 million, or 59%, to $181.7 million from $114.5 million in 2007. This increase was primarily due to net PVR borrowings of $156.0 million in 2008, comprised ofhad net borrowings of $220.4$60.0 million under its revolving credit agreement, or PVR Revolver, which was primarily used to fund PVR’s capital expenditures program. In connection with the Revolver, the increase in the capacity of the PVR Revolver and the issuance of our Senior Notes, a total of $24.2 million was paid in 2009 in issuance costs and fees.
During 2008, PVR had net repaymentsborrowings of $64.4$156 million underprimarily attributable to the PVR Revolver offset by the repayment of PVR’s Senior Unsecured Notes due 2013, or the PVR Notes. See “— Long-Term Debt” below for a more detailed description of PVR’s December 31, 2008 long-term debt balance.2013. PVR also received net proceeds of $141.1 million from the sale of its common units in a registered public offering in 2008, which was comprised of net proceeds of $138.2 million from the sale of the common units to the public and $2.9 million in contributions from its general partner to maintain its 2% general partner interest in PVR. These increases in 2008 financing activities were partially offset by increased cash distributions paid to PVR’s and PVG’s partners. Cash distributions paidpartner’s due to unaffiliated partners increased by $28.7 million, or 36%, from $79.6 millionincreases in 2007 to $108.3 million in 2008 because both PVG and PVR increased their cashthe distributions paid per unit. This increase in cash distributions paid to unaffiliated partners was also due tounit as well as the increase in PVR’s outstanding common units resulting from PVR’sthe 2008 unit offering, where PVR issued an additional 5.15 million PVR common units to the public. See “– PVR Unit Offering” below for a more detailed description of this event. PVR also incurred $4.2 million of payments for debt issuance costs. Net cash provided by PVG’s financing activities in the year ended December 31, 2008 was used primarily for PVR’s capital expenditures.
PVR’s cash distributions per unit increased in every sequential quarter from the distribution paid in February 2007 for the fourth quarter of 2006 through the distribution paid in November 2008 for the third quarter of 2008. However, the most recent cash distribution paid to PVR’s partners in February 2009 for the fourth quarter of 2008 was unchanged from the distribution paid for the immediately prior quarter. PVG’s cash distribution per unit increased in every sequential quarter from the distribution paid in May 2007 for the first quarter of 2007 to the distribution paid in November 2008 for the third quarter of 2008. However, the most recent cash distribution paid to PVG’s partners in February 2009 for the fourth quarter of 2008 was unchanged from the distribution paid for the immediately prior quarter. Both PVG and PVR will continue to be cautious about increasing cash distributions to unitholders in the foreseeable future in order to preserve cash liquidity in light of uncertain commodity and financial markets.
Net cash provided by PVG’s financing activities in 2007 increased by $95.0 million, or 486%, to $114.5 million from $19.5 million in 2006. This increase is due primarily to $193.5 million of net borrowings in 2007, comprised of net borrowings of $204.5 million under the PVR Revolver and net repayments of $11.0 million under the PVR Notes. These increases in 2007 financing activities were partially offset by cash distributions paid to PVG’s and PVR’s partners. Distributions to partners increased by $18.8 million, or 31%, from $60.8 million in 2006 to $79.6 million in 2007 because PVG and PVR increased their cash distributions paid per unit. Net cash provided by PVG’s financing activities in the year ended December 31, 2007 was used primarily for PVR’s capital expenditures.
In December 2006, PVG completed its initial public offering and used substantially all of the resulting proceeds to purchase newly issued common and Class B units from PVR. PVR used the proceeds received from this transaction to repay $114.6 million of debt outstanding under the PVR Revolver. PVR had a total of $37.1 million of net repayments of debt in 2006, comprised of $28.8 million of net repayments under the PVR Revolver and $8.3 million of net repayments under the PVR Notes. PVG and PVR also paid $60.8 million in cash distributions to their partners in 2006.offering.
In January 2009,2010, PVG declared a $0.38 ($1.52 on an annualized basis) per unit quarterly distribution for the three months ended December 31, 2008, of which we will receive $11.4 million, or $45.6 million on an annualized basis, as a result of our limited partner interest in PVG.2009. This distribution was paid on February 18, 200919, 2010 to unitholders of record at the close of business on February 2, 2009.2010. In January 2009,2010, PVR declared a $0.47 ($1.88 on an annualized basis) per unit quarterly distribution for the three months ended December 31, 2008, of which we will receive $0.1 million, or $0.4 million on an annualized basis, as a result of our limited partner interest in PVR.2009. This distribution was paid on February 13, 200912, 2010 to
unitholders of record at the close of business on February 2, 2009.
TABLE OF CONTENTS
2010. The portion of PVR’s distribution paid to PVG serves as the basis for PVG’s distribution to its unitholders, including us. On a combined basis, we received a total of $7.7 million of distributions from PVG and PVR in February 2010.
Sources of Liquidity
Debt and Credit Facilities
| | | | |
| | As of December 31, |
| | | 2009 | | 2008 |
| Short-term borrowings | | $ | — | | | $ | 7,542 | |
| Revolving credit facility | | | — | | | | 332,000 | |
| Senior notes | | | 291,749 | | | | — | |
| Convertible notes | | | 206,678 | | | | 199,896 | |
| Total recourse debt of the Company | | | 498,427 | | | | 539,438 | |
| Long-term debt of PVR | | | 620,100 | | | | 568,100 | |
| Total consolidated debt | | | 1,118,527 | | | | 1,107,538 | |
| Less: Short-term borrowings | | | — | | | | (7,542 | ) |
| Total consolidated long-term debt | | $ | 1,118,527 | | | $ | 1,099,996 | |
Long-Term Debt
Revolver.Revolving Credit Facility. As of December 31, 2008,In November 2009, we had $332.0entered into the Revolver and simultaneously terminated our previous credit agreement. The Revolver provides for a $300 million outstandingrevolving credit facility and matures in November 2012. We have the option to increase the commitments under the Revolver whichby up to an additional $225 million upon the receipt of commitments from one or more lenders. The Revolver is senior togoverned by a borrowing base calculation and the Convertible Notes. At the current $479.0 million limit onavailability under the Revolver may not exceed the lesser of the aggregate commitments and given our outstanding balance of $332.0the borrowing base. The initial borrowing base was $420 million net of $0.3and was reduced to $380 million of letters of credit, we could borrow up to $146.7 million at December 31, 2008. The Revolver, which matures in December 2010, is secured by a portionconnection with the sale of our proved oil and gas reserves. Our borrowing base can be redetermined twice per year.Gulf Coast properties as discussed previously. The Revolver is available to us for general purposes including working capital, capital expenditures and acquisitions and includes a $20.0$20 million sublimit for the issuance of letters of credit. We had outstanding letters of credit of $0.3 million as of December 31, 2008. In 2008, we incurred commitment fees of $0.8 million on
Borrowings under the unused portion of the Revolver. The commitments, which can be redetermined relative to our borrowing base, cannot be withdrawn by the bank. We capitalized $2.0 million of interest cost incurred in 2008. The Revolver is governed by a borrowing base calculation and is redetermined semi-annually. We anticipate that the Revolver’s borrowing base will be decreased when it is redetermined in the second quarter of 2009. We have the option to electbear interest, at our option, at either (i) a rate derived from the London Interbank Offered Rate or LIBOR,(“LIBOR”), as adjusted for statutory reserve requirements for Eurocurrency liabilities (the “Adjusted LIBOR”), plus aan applicable margin ranging from 1.00%2.000% to 1.75%3.000% or (ii) the greater of (a) the prime rate, (b) federal funds effective rate plus 0.5% and (c) the one-month Adjusted LIBOR plus 1.0%, in each case, plus an applicable margin (ranging from 1.000% to 2.000%). In each case, the applicable margin is determined based on the ratio of our outstanding borrowings to the borrowing base or (ii)available Revolver capacity.
The Revolver is guaranteed by Penn Virginia and all of our material oil and gas subsidiaries. The obligations under the greaterRevolver are secured by a first priority lien on a portion of our proved oil and gas reserves and a pledge of the prime rate or federal funds rate plus a marginequity interests in the guarantor subsidiaries, which excludes PVG, PVR and their subsidiaries.
As of up to 1.00%. The weighted average interest rate on borrowingsDecember 31, 2009, there were no amounts outstanding under the Revolver during 2008 was approximately 4.4%. We do not have a publicand we had remaining borrowing capacity of up to $299.3 million, net of outstanding letters of credit rating forof $0.7 million. A discussion of the Revolver.
The financialapplicable covenants underand related compliance with respect to the Revolver require us notis provided in the discussion of Financial Condition that follows.
Senior Notes. In June 2009, we issued and sold $300 million of Senior Notes which mature in June 2016. The Senior Notes were sold at 97% of par, equating to exceed specified ratios. We are requiredan effective yield to maintain a Debt-to-EBITDAX ratiomaturity of no more than 3.5-to-1.0 and at December 31, 2008 such ratio was 1.5-to-1.0. We are also required to maintain an EBITDAX-to-interest expense ratio of no less than 2.5-to-1.0 and at December 31, 2008 such ratio was 21.8-to-1.0. Inapproximately 11%. The net proceeds from the event that we would be in default of our covenants, we could appeal to the banks for a waiversale of the covenant default. Should the banks deny our appealSenior Notes of $281.6 million were used to waive the covenant default, the outstandingrepay borrowings under the Revolver would become payable upon demandrevolving credit facility associated with the previous credit agreement. The Senior Notes are senior to our existing and would be reclassifiedfuture subordinated indebtedness and are effectively subordinated to the current liabilities section of our consolidated balance sheet. The Revolver contains cross-default provisions for default of indebtedness of more than $5.0 million. The Revolver does not contain a subjective acceleration clause. EBITDAX, which is a non-GAAP measure, is generally defined in the Revolver as our net income before the effects of interest expense, interest income, income tax expense, DD&A expense, other similar non-cash charges, exploration expense, non-cash compensation expense and non-cash hedging activity. For covenant calculation purposes, EBITDAX is further adjusted for distributions received through the company’s ownership in PVG and for dividends paid to shareholders. In addition, the financial covenants impose dividend limitation restrictions. The Revolver contains various other covenants that limit our ability to incur indebtedness, grant liens, make certain loans, acquisitions and investments, make any material change to the nature of our business or enter into a merger or sale of our assets, including the sale or transfer of interests in our subsidiaries. As of December 31, 2008, we were in compliance with all of our covenantsindebtedness, including the Revolver, to the extent of the collateral securing that indebtedness. The obligations under the Senior Notes are fully and unconditionally guaranteed by our subsidiaries that guarantee our indebtedness under the Revolver.
TABLE OF CONTENTS
Convertible Notes. In December 2007, we issued the Convertible Notes Note Hedges and Warrants. As of December 31, 2008, we had $230.0 million of Convertible Notes outstanding. The Convertible Notes bearwith interest at a rate of 4.50% per year payable semiannually in arrears on May 15 and November 15 of each year. We do not have a public credit rating for the Convertible Notes.
The Convertible Notes are convertible into cash up to the principal amount thereof and shares of our common stock, if any, in respect of the excess conversion value, based on an initial conversion rate of 17.3160 shares of common stock per $1,000 principal amount of the Convertible Notes (which is equal to an initial conversion price of approximately $57.75 per share of common stock), subject to adjustment, and, if not converted or repurchased earlier, will mature onin November 15, 2012. Holders of Convertible Notes may convert their Convertible Notes at their option prior to the close of business on the business day immediately preceding September 15, 2012 only under the following circumstances: (i) during any fiscal quarter if the last reported sale price per share of common stock for at least 20 trading days (whether or not consecutive) in the 30 consecutive trading days ending on the last trading day of the immediately preceding fiscal quarter is greater than or equal to 130% of the then applicable conversion price on each such trading day; (ii) during the five business day period after any ten consecutive trading day period in which the trading price per $1,000 principal amount of the Convertible Notes for each day of such period was less than 98% of the product of the last reported sale price per share of common stock and the applicable conversion rate on each such day; or (iii) upon the occurrence of certain corporate events set forth in the indenture governing the Convertible Notes. On and after September 15, 2012 until the close of business on the third business day immediately preceding November 15, 2012, holders of the Convertible Notes may convert their Convertible Notes at any time, regardless of the foregoing circumstances.
The holders of the Convertible Notes who convert their Convertible Notes in connection with a make-whole fundamental change, as defined in the indenture governing the Convertible Notes, may be entitled to an increase in the conversion rate as specified in the indenture governing the Convertible Notes. Additionally, in the event of a fundamental change, as defined in the indenture governing the Convertible Notes, the holders of the Convertible Notes may require us to purchase all or a portion of their Convertible Notes at a purchase price equal to 100% of the principal amount of the Convertible Notes, plus accrued and unpaid interest, if any.
The Convertible Notes are our unsecured senior subordinated obligations, ranking junior in right of payment to any of our senior indebtedness and to any of our secured indebtedness to the extent of the value of the assets securing such indebtedness and equal in right of payment to any of our future unsecured senior subordinated indebtedness. The Convertible Notes will rank senior in right of payment to any of our future junior subordinated indebtedness and will structurally rank junior to all existing and future indebtedness of our guarantor subsidiaries.
In connection with the sale of the Convertible Notes, we entered into convertible note hedge transactions, or the Note Hedges, with respect to shares of our common stock with affiliates of certain of the underwriters of the Convertible Notes (collectively, the “Option Counterparties”). The Note Hedges cover, subject to anti-dilution adjustments, the net shares of our common stock that would be deliverable to converting noteholders in the event of a conversion of the Convertible Notes. In December 2007, we paid an aggregate amount of $18.6 million of the net proceeds from the sale of the Convertible Notes for the cost of the Note Hedges (after such cost was offset by the proceeds of the Warrants described below).
We also entered into separate warrant transactions, or the Warrants, whereby we sold to the Option Counterparties warrants to acquire, subject to anti-dilution adjustments, approximately 3,982,680 shares of our common stock at an exercise price of $74.25 per share. In December 2007, we received proceeds of $18.2 million resulting from this sale. Upon exercise of the Warrants, we will deliver shares of our common stock equal to the difference between the then market price and the strike price of the Warrants.
If the market value per share of our common stock at the time of conversion of the Convertible Notes is above the strike price of the Note Hedges, the Note Hedges entitle us to receive from the Option Counterparties net shares of our common stock (and cash for any fractional share cash amount) based on the excess of the then current market price of our common stock over the strike price of the Note Hedges. Additionally, if the market price of our common stock at the time of exercise of the Warrants exceeds the strike price of the Warrants, we will owe the Option Counterparties net shares of our common stock (and cash for any fractional share cash amount), not offset by the Note Hedges, in an amount based on the excess of the then current market price of our common stock over the strike price of the Warrants.
On October 3, 2008, one of the Option Counterparties, Lehman Brothers OTC Derivatives Inc., or Lehman OTC, joined other Lehman Brothers entities and filed for bankruptcy protection. We had purchased 22.5% of the Note Hedges from Lehman OTC, or the Lehman Note Hedges, for approximately $8.3 million, and we had sold 22.5% of the Warrants to Lehman OTC for approximately $4.1 million. If the Lehman Note Hedges are rejected or terminated in connection with the Lehman OTC bankruptcy, we would have a claim against Lehman OTC and possibly Lehman Brothers Inc., as guarantor, for the damages and/or close-out values resulting from any such rejection or termination. While we intend to pursue any claim for damages and/or close-out values resulting from the rejection or termination of the Lehman Note Hedges, at this point in the Lehman bankruptcy cases it is not possible to determine with accuracy the ultimate recovery, if any, that we may realize on potential claims against Lehman OTC or its affiliated guarantor resulting from any rejection or termination of the Lehman Note Hedges. We also do not know whether Lehman OTC will assume or reject the Lehman Note Hedges, and therefore cannot predict whether Lehman OTC intends to perform its obligations under the Lehman Note Hedges. If Lehman OTC does not perform such obligations and the price of our common stock exceeds the $57.75 conversion price (as adjusted) of the Convertible Notes, our existing shareholders would experience dilution at the time or times the Convertible Notes are converted. The extent of any such dilution would depend, among other things, on the then prevailing market price of our common stock and the number of shares of common stock then outstanding, but we believe the impact will not be material and will not affect our income statement presentation. We are not otherwise exposed to counterparty risk related to the bankruptcies of Lehman Brothers Inc. or its affiliates and do not believe that the Lehman bankruptcies will have a material adverse effect on our financial condition or results of operations.
TABLE OF CONTENTS
Interest Rate SwapsSwaps.. We have In December 2009, we entered into an a new interest rate swap agreement, or New Interest Rate Swap, to establish variable rates on a portion of the outstanding obligation under the Senior Notes. The notional amount of the New Interest Rate Swap is $100 million, or approximately one-third of the face amount outstanding under the Senior Notes. We will pay a variable rate equivalent to the three-month LIBOR plus a margin of 8.175%, and the counterparties will pay a fixed rate of 10.375%. The term of the New Interest Rate Swap extends through June 2013.
In addition to the New Interest Rate Swap, we previously entered into interest rate swaps agreements, or the Previous Interest Rate Swaps, to establish fixed rates on a portion of the previously outstanding borrowings under the Revolver until December 2010. The notional amounts of the Previous Interest Rate Swaps total $50.0 million, or approximately 15% of our total long-term debt outstanding under the Revolver.$50 million. We will pay a weighted averageweighted-average fixed rate of 5.34% on the notional amount, and the counterparties will pay a variable rate equal to the three-month LIBOR. Settlements onAs there are currently no amounts outstanding under the Revolver, we entered into an offsetting fixed-to-floating interest rate swap in December 2009 that effectively unwinds the Previous Interest Rate Swaps are recorded as interest expense. The Interest Rate Swaps followed hedge accounting. Accordingly, the effective portion of the change in the fair value of the swap transactions is recorded each period
in other comprehensive income. The ineffective portion of the change in fair value, if any, is recordedSwaps. With respect to current period earnings in interest expense. After considering the applicable margin of 1.25% in effect as of December 31, 2008, the totalthis fixed-to-floating interest rate onswap, we pay a variable rate equivalent to the $50.0 million portionthree-month LIBOR and the counterparties will pay a fixed rate of Revolver borrowings covered by the Interest Rate Swaps was 6.6% at0.53% until December 31, 2008.2010.
PVR Revolver.Long-Term Debt of PVR. As of December 31, 2008, net2009, the long-term debt of outstanding borrowings of $568.1 million and letters of credit of $1.6 million, PVR had remaining borrowing capacity of $130.3 million onwas solely attributable to the PVR Revolver. PVR believes that its remaining borrowing capacity, which will be used primarily for capital expenditures, will be sufficient for its future capital needs and commitments. In August 2008,March 2009, PVR increased the size of the PVR Revolver from $600.0$700 million to $700.0 million and secured the$800 million. The PVR Revolver is secured with substantially all of PVR’s assets. As of December 31, 2009, PVR had remaining borrowing capacity of $178.3 million on the PVR Revolver, net of outstanding borrowings of $620.1 million and letters of credit of $1.6 million. The PVR Revolver matures in December 2011 and is available to PVR for general purposes, including working capital, capital expenditures and acquisitions, and includes a $10.0 million sublimit for the issuance of letters of credit. In 2008, PVR incurred commitment fees of $0.5 million on the unused portion of the PVR Revolver. The interest rate under the PVR Revolver fluctuates based on the ratio of PVR’s total indebtedness-to-EBITDA. Interest is payable at a base rate plus an applicable margin of up to 0.75%1.25% if PVR selects the base rate borrowing option under the PVR Revolver or at a rate derived from LIBOR plus an applicable margin ranging from 0.75%1.75% to 1.75%2.75% if PVR selects the LIBOR-based borrowing option. At December 31, 2009, the base rate applicable margin was 0.75% and the LIBOR-based rate applicable margin was 2.25%. The weighted average interest rate on borrowings outstanding under the PVR Revolver during 20082009 was approximately 4.6%2.7%. PVR does not have a public credit rating forDebt outstanding under the PVR Revolver is non-recourse to us and PVG. A discussion of the applicable covenants and related compliance with respect to the PVR Revolver is provided in the discussion of Financial Condition that follows.
PVR Interest Rate Swaps. PVR entered into interest rate swaps, or the PVR Interest Rate Swaps, to establish fixed rates on a portion of the outstanding borrowings under the PVR Revolver. The following table sets forth the PVR Interest Rate Swap positions as of December 31, 2009:
| | | | |
| Dates | | Notional
Amounts | | Weighted-
Average
Fixed Rate |
| | | (in millions) | | |
| Until March 2010 | | $ | 310.0 | | | | 3.54 | % |
| March 2010 – December 2011 | | $ | 250.0 | | | | 3.37 | % |
| December 2011 – December 2012 | | $ | 100.0 | | | | 2.09 | % |
The PVR Interest Rate Swaps extend one year past the maturity of the current PVR Revolver. After considering the applicable margin of 2.25% in effect as of December 31, 2009, the total interest rate on the $310 million portion of PVR Revolver borrowings covered by the PVR Interest Rate Swaps was 5.79% as of December 31, 2009.
Common Stock Offering
In May 2009, we completed the sale of 3.5 million shares of our common stock in a registered public offering. The net sales proceeds of $64.8 million were used to repay borrowings under the Revolver.
TABLE OF CONTENTS
Asset Dispositions
During 2009, we initiated a number of asset dispositions in addition to other debt and capital raising activities in connection with a broader effort to support funding for our capital spending program for 2010 (see Future Capital Needs and Commitments discussion that follows). The following table summarizes the net cash realized from the largest asset dispositions that closed during the year ended December 31, 2009:
| | |
| Asset Description | | Net Cash
Realized |
| 10 million common units of PVG | | $ | 118,080 | |
| Mid-Continent oil and gas properties | | | 10,211 | |
| Gulf Coast oil and gas properties(1) | | | 4,871 | |
| | | $ | 133,162 | |
| (1) | Includes $2.3 million received as a deposit in connection the with sale of the Gulf Coast properties that closed on January 29, 2010. |
As referenced in the table above, we completed the sale of our remaining Gulf Coast properties in January 2010 which completed our efforts to exit activities in this region. This sale resulted in the realization of additional net proceeds of $23.2 million in January 2010 as well as the receipt of certain oil and gas properties in Mississippi. These Gulf Coast properties were classified as “Assets held for sale” and are reflected as such on the Consolidated Balance Sheets as of December 31, 2009 (see also Notes 5 and 19 to the Consolidated Financial Statements).
Financial Condition
Covenant Compliance
The terms of the Revolver require us to maintain certain financial covenants. These covenants, which are effective with the period ended December 31, 2009, are as follows:
Total debt to EBITDAX, each as defined in the Revolver, for any four consecutive quarters may not exceed 4.0 to 1.0 reducing to 3.5 to 1.0 for periods ending on or after September 30, 2011. Both total debt and EBITDAX excludes those items of PVG and PVR as they are not guarantor subsidiaries under the Revolver. EBITDAX, which is a non-GAAP (generally accepted accounting principles) measure, generally means net income plus interest expense, taxes, depreciation, depletion and amortization expenses, exploration expenses, impairments, other non-cash charges or losses and the amount of cash distributions received from PVG and PVR.
The current ratio, as of the last day of any quarter, may not be less than 1.0 to 1.0. The current ratio is generally defined as current assets to current liabilities. For purposes of this ratio, the Revolver essentially excludes the current assets and current liabilities of PVG and PVR as they are not guarantor subsidiaries. Current assets and current liabilities attributable to derivative instruments are also excluded. In addition, current assets include the amount of any unused commitment under the Revolver.
As of December 31, 2009, we were in compliance with all of the Revolver’s covenants.
The financial covenants underof the PVR Revolver require PVRare as follows:
Total debt to consolidated EBITDA may not exceed 5.25 to exceed specified ratios. PVR is required to maintain a debt-to-consolidated EBITDA ratio of less than 5.25-to-1.0 and at December 31, 2008 such ratio was 4.05-to-1.0. PVR is also required to maintain a consolidated EBITDA-to-interest expense ratio of greater than 2.5-to-1.0 and at December 31, 2008, such ratio was 4.74-to-1.0.1.0. EBITDA, which is a non-GAAP measure, is generally defined in the PVR Revolver as PVR’s net income before the effectsplus interest expense, net of interest expense, interest income, DD&A expensedepreciation, depletion and amortization expenses, and non-cash hedging activity. activity and impairments.
Consolidated EBITDA to interest expense may not be less than 2.5 to 1.0.
As of December 31, 2009, PVR was in compliance with all of the PVR Revolver’s covenants.
TABLE OF CONTENTS
The following table summarizes the actual results of our and PVR’s covenant compliance for the period ended December 31, 2009:
| | | | |
| Description of Covenant | | Covenant | | Actual
Results |
Penn Virginia Corporation and guarantor subsidiaries:
| | | | | | | | |
| Total debt to EBITDAX | | | 4.0 | | | | 1.9 | |
| Current ratio | | | 1.0 | | | | 6.9 | |
PVR:
| | | | | | | | |
| Debt to EBITDA | | | 5.25 | | | | 3.36 | |
| EBITDA to interest expense | | | 2.5 | | | | 7.5 | |
In the event that we or PVR would be in default of itsour covenants under the Revolver and the PVR Revolver, respectively, we or PVR could appeal to the banks for a waiver of the covenant default. Should the banks deny our or PVR’s appeal to waive the covenant default, the outstanding borrowings under the Revolver or the PVR Revolver would become payable uponon demand and would be reclassified to theas a component of current liabilities section of our consolidated balance sheet. The PVRon the Consolidated Balance Sheet. In addition, both the Revolver contains cross-default provisions for default of indebtedness of more than $7.5 million. The PVR Revolver does not contain a subjective acceleration clause. The PVR Revolver prohibits PVR from making distributions to its partners if any potential default or event of default, as defined inand the PVR Revolver occurs or would result fromimpose limitations on dividends and distributions, as well as limit the distributions. In addition, the PVR Revolver contains various covenants that limit PVR’s ability to incur indebtedness, grant liens, make certain loans, acquisitions and investments, make any material change to the nature of our or PVR’s business or enter into a merger or sale of our or PVR’s assets, including the sale or transfer of interests in our or PVR’s subsidiaries. As of December 31, 2008, PVR was in compliance with all of its covenants under the PVR Revolver.
PVR Notes. In July 2008, PVR paid an aggregate of $63.3 million to the holders of the PVR Notes to prepay 100% of the aggregate principal amount of the PVR Notes. This amount consisted of approximately $58.4 million aggregate principal amount outstanding on the PVR Notes, $1.1 million in accrued and unpaid interest on the PVR Notes through the prepayment date and $3.8 million in make-whole amounts due in connection with the prepayment. The $3.8 million of make-whole payments were recorded in interest expense on our consolidated statements of income. The PVR Notes were repaid with borrowings under the PVR Revolver. While the PVR Notes were outstanding, PVR had a DBRS public credit rating. However, due to the repayment of the PVR Notes, PVR has elected not to renew this rating. As of December 31, 2007, PVR owed $64.0 million under the PVR Notes, the current portion of which was $12.6 million. The PVR Notes bore interest at a fixed rate of 6.02%.
PVR Interest Rate Swaps. PVR has entered into the PVR Interest Rate Swaps to establish fixed rates on a portion of the outstanding borrowings under the PVR Revolver. Until March 2010, the notional amounts of the PVR Interest Rate Swaps total $285.0 million, or approximately 50% of PVR’s total long-term debt outstanding as of December 31, 2008, with PVR paying a weighted average fixed rate of 3.67% on the notional amount, and the counterparties paying a variable rate equal to the three-month LIBOR. From March 2010 to December 2011, the notional amounts of the PVR Interest Rate Swaps total $225.0 million, with PVR paying a weighted average fixed rate of 3.52% on the notional amount, and the counterparties paying a variable rate equal to the three-month LIBOR. From December 2011 to December 2012, the notional amounts of the PVR Interest Rate Swaps total $75.0 million, with PVR paying a weighted average fixed rate of 2.10% on the notional amount, and the counterparties paying a variable rate equal to the three-month LIBOR. The PVR Interest Rate Swaps extend one year past the maturity of the current PVR Revolver and they have been entered into with six financial institution counterparties, with no counterparty having more than 26% of the open positions. After considering the applicable margin of 1.75% in effect as of December 31, 2008, the total interest rate on the $285.0 million portion of PVR Revolver borrowings covered by the PVR Interest Rate Swaps was 5.42% at December 31, 2008. In January 2009, PVR entered into an additional $25.0 million interest rate swap with a maturity of December 2012. Inclusive of this additional interest rate swap, the
weighted average fixed interest rate PVR pays to its counterparties is 3.54% through March 2010, 3.37% from March 2010 through December 2011 and 2.09% from December 2011 through December 2012.
PVR monitors changes in its counterparties and are not aware of any specific concerns regarding PVR’s counterparties’ ability to make payments under any of the PVR Interest Rate Swaps, including the January 2009 swap agreement.
PVR Unit Offering
In 2008, PVR issued 5.15 million common units to the public representing limited partner interests and received $138.2 million in net proceeds. PVR received total contributions of $2.9 million from its general partner in order to maintain its 2% general partner interest in PVR. The net proceeds were used to repay a portion of PVR’s borrowings under the PVR Revolver.
Future Capital Needs and Commitments
Subject to commodity prices and the availability of capital, we are committedexpect to expandingexpand our oil and gas operations over the next several years through a combination of development, exploration and acquisition of new properties. We have a portfolio of assets which balances relatively low risk, moderate to potentially higher return development projects in East Texas, the Mid-Continent, Appalachia and Mississippi, with higher risk, potentially higher return exploration prospects in south Louisiana and south Texas. We expect to continueby continuing to execute a program dominated by development drilling and, to a lesser extent, exploration drilling, supplemented periodically with property and reserve acquisitions.
In 2009,2010, we anticipate making oil and gas segment capital expenditures, excluding acquisitions, of up to approximately $250.0$425 million. The capital expenditures are expected to be primarily funded from internally generated sources of cash, including cash distributions received from PVG and PVR, supplemented by Revolver borrowings as needed.and proceeds from the sale of non-core assets and the sale of part or all of our interests in PVG. At December 31, 2008,2009, we had $146.7$79 million of cash and $300 million of unused borrowing capacity under the Revolver. We continually review drilling and other capital expenditure plans and may change the amount we spend in any area based on industry conditions, cash flows provided by operating activities and the availability of capital. We believe our cash flow from operating activities and sources of debt financing are sufficient to fund our 2009 planned oil and gas capital expenditure program.
For future periods, we continue to assess funding needs for our growth opportunities in the context of our presently available debt capacity. We expect to continue to use a combination of cash flows from operating activities borrowings underand debt financing, supplemented with equity issuances and the Revolver and issuancessale of additional debt and equity securitiesother non-core assets, potentially including all or part of our interests in PVG, to fund our growth. However, if the current disruptions in the worldwide credit, capital and commodities markets continue into the future, our ability to grow will likely become limited. We cannot be certain that we will be able to issue our debt or equity securities on terms or in the amounts that we anticipate, or at all, and we may be unable to refinance the Revolver when it expires in 2010. In addition, we may be unable to obtain adequate funding under the Revolver because our lending counterparties may be unwilling or unable to meet their funding obligations. We believe our portfolio of assets provides us with opportunities for organic growth in 2009 which will require capital in excess of our internal sources. We expect to continue to rely on the Revolver to fund a large portion of our capital needs, supplemented by the issuance of additional debt and equity securities as needed, if available under commercially acceptable terms.
Currently, PVG has no capital requirements. In the future, we may decide to facilitate PVR acquisitions and other capital expenditures by the issuance of PVG debt or equity if market conditions are favorable to such an issuance.
PVR believes that its remaining borrowing capacity of $130.3$178.3 million will be sufficient for its 20092010 capital needs and commitments. In 2009, PVR anticipates making capital expenditures, excluding acquisitions, of up to $72.0 million. The majority of the 2009 capital expenditures will be incurred in the PVR natural gas midstream segment. PVR intends to fund these capital expenditures with a combination of cash flows provided by operating activities and borrowings under the PVR Revolver. Long-term cash requirements for acquisitions and other capital expenditures are expected to be funded by several sources, including cash flows from operating activities, borrowings under the PVR Revolver and the issuances of additional debt and equity securities, if available under commercially acceptable terms. PVR’s short-term cash requirements for operating expenses and quarterly distributions to PVG, as the owner of PVR’s general partner, and unitholders are expected to be funded through operating cash flows. In 2010, PVR anticipates making capital expenditures, excluding acquisitions, of up to $60 million. The majority of these capital expenditures are expected to be incurred in the PVR natural gas midstream segment. PVR intends to fund these capital expenditures with a combination of operating cash flows and borrowings under the PVR Revolver. Long-term cash requirements for acquisitions and other capital expenditures are expected to be funded by operating cash flows, borrowings under the PVR Revolver and the issuances of additional debt and equity securities if available under commercially acceptable terms.
Part of PVR’s long-term strategy is to increase cash available for distribution to PVR’s unitholders by making acquisitions and other capital expenditures. PVR’s ability to make these acquisitions and other capital expenditures in the future will depend largely on the availability of debt financing and on PVR’s ability to periodically use equity financing
through the issuance of new common units. Future financing will depend on various factors, including prevailing market conditions, interest rates and PVR’s financial condition and credit rating.
The current disruptions in the global financial and commodities markets and the general economic climate have made access to equity and debt capital markets very difficult since late in 2008. While signs of improvement in these markets have started to arise in 2009, with issuances of debt and equity securities by other publicly traded partnerships, the short-term outlook remains uncertain with respect to PVR’s ability to access the capital markets on acceptable terms. If the situation worsens and PVR is unable to access the capital markets for an extended period, PVR’s ability to make acquisitions and other capital expenditures, as well as PVR’s ability to increase or sustain cash distributions to its limited partners and to PVG, the owner of PVR’s general partner, will likely become limited. If additional financing is required, there are no assurances that it will be available, or if available, that it can be obtained on terms favorable to PVR or not dilutive to PVR’s future earnings.TABLE OF CONTENTS
Contractual Obligations
The following table summarizes our and PVR’s contractual obligations as of December 31, 2008:2009:
| | | | | | | | | | | | | | | |
| | | Payments Due by Period |
| | | Total | | Less Than
1 Year | | 1-3 Years | | 3-5 Years | | More Than
5 years |
| | | (in thousands) |
Revolver | | $ | 332,000 | | $ | — | | $ | 332,000 | | $ | — | | $ | — |
Convertible Notes | | | 230,000 | | | — | | | — | | | 230,000 | | | — |
PVR Revolver | | | 568,100 | | | — | | | 568,100 | | | — | | | — |
Asset retirement obligations (1) | | | 8,589 | | | — | | | — | | | 369 | | | 8,220 |
Derivatives (2) | | | 24,255 | | | 15,534 | | | 8,721 | | | — | | | — |
Interest expense (3) | | | 114,217 | | | 37,426 | | | 66,441 | | | 10,350 | | | — |
Unrecognized tax benefits (4) | | | 4,600 | | | 1,800 | | | — | | | — | | | 2,800 |
Natural gas midstream activities (5) | | | 36,793 | | | 13,069 | | | 11,862 | | | 8,541 | | | 3,321 |
Rental commitments (6) | | | 34,578 | | | 12,009 | | | 9,639 | | | 4,339 | | | 8,591 |
Oil and gas activities (7) | | | 84,802 | | | 32,825 | | | 28,761 | | | 5,538 | | | 17,678 |
| | | | | | | | | | | | | | | |
Total contractual obligations (8) | | $ | 1,437,934 | | $ | 112,663 | | $ | 1,025,524 | | $ | 259,137 | | $ | 40,610 |
| | | | | | | | | | | | | | | |
| | | | | | | | | | |
| | Payments Due by Period |
| | | Total | | Less than
1 Year | | 1 – 3 Years | | 3 – 5 Years | | More Than
5 Years |
| Senior Notes | | $ | 291,749 | | | $ | — | | | $ | — | | | $ | — | | | $ | 291,749 | |
| Convertible Notes | | | 206,678 | | | | — | | | | 206,678 | | | | — | | | | — | |
| PVR Revolver | | | 620,100 | | | | — | | | | 620,100 | | | | — | | | | — | |
| Interest expense(1) | | | 272,450 | | | | 56,915 | | | | 97,544 | | | | 72,600 | | | | 45,391 | |
| Asset retirement obligations(2) | | | 8,849 | | | | — | | | | — | | | | — | | | | 8,849 | |
| Derivatives(3) | | | 22,892 | | | | 16,147 | | | | 6,745 | | | | — | | | | — | |
| Rental commitments(4) | | | 40,893 | | | | 8,452 | | | | 10,608 | | | | 8,771 | | | | 13,062 | |
| Oil and gas activities(5) | | | 59,812 | | | | 23,629 | | | | 15,714 | | | | 5,468 | | | | 15,001 | |
| Natural gas midstream activities(6) | | | 32,320 | | | | 13,103 | | | | 10,202 | | | | 7,354 | | | | 1,661 | |
| Total contractual obligations(7) | | $ | 1,555,743 | | | $ | 118,246 | | | $ | 967,591 | | | $ | 94,193 | | | $ | 375,713 | |
| (1) | The asset retirement obligations reflectRepresents estimated interest payments that will be due under the discounted balance, which is recorded in the other liabilities section of our consolidated balance sheets. See Note 16, “Asset Retirement Obligations,” in theSenior Notes, to Consolidated Financial Statements in Item 8, “Financial StatementsConvertible Notes and Supplementary Data.” PVR Revolver. |
| (2) | The undiscounted balance was $52.2approximately $52.5 million atas of December 31, 2008.2009. |
| (2)(3) | The derivatives commitments represent theRepresents estimated payments that we and PVR will make resulting from the oil and gas and natural gas midstream commodity derivatives as well as both from both our and PVR’s interest rate swaps. See “– Long-Term Debt – Interest Rate Swaps and Item 7A, “Quantitative and Qualitative Disclosures About Market Risk” – Price Risk” for a detailed description of our and PVR’s derivatives and interest rate swaps. |
| (3) | The interest expense commitments represent the estimated interest payments that will be due under the Revolver, the PVR Revolver and the Convertible Notes. See “– Long-Term Debt” for a detailed description of these debt instruments and the factors affecting our and PVR’s interest expense calculations. |
| (4) | See Note 19, “Income Taxes,” in the Notes to Consolidated Financial Statements in Item 8, “Financial Statements and Supplementary Data,” for a further description of this liability and the factors underlying the calculation of this expense. |
| (5) | Commitments for PVR natural gas midstream activities relate to firm transportation agreements. As of December 31, 2008, PVR’s firm transportation capacity rights for specified volumes per day on a pipeline system had terms that ranged from one to seven years. The contracts require PVR to pay transportation demand charges regardless of the amount of pipeline capacity PVR uses. PVR may sell excess capacity to third parties at its discretion. |
| (6) | Our rental commitments primarily relatePrimarily relates to equipment and building leases and leases of coal reserve-based properties which PVR subleases, or intends to sublease, to third parties. The obligation with respect to leased properties which PVR subleases expires when the property has been mined to exhaustion or the lease has been canceled. The timing of mining by third party operators is difficult to estimate due to numerous factors. PVR believes that its future rental commitments cannot be estimated with certainty; however, based on current knowledge and historical trends, PVR believes that it will incur between approximately $0.9 million and $1.0 million in rental commitments annually until the reserves have been exhausted. |
| (7)(5) | Commitments for oil and gas activities relaterelating to firm transportation agreements and drilling contracts. In 2004, we entered into contracts which provide firm transportation capacity rights for specified volumes per day on a pipeline system with terms that ranged from one to 10 years. The contracts require us to pay transportation demand charges regardless of the amount of pipeline capacity we use. We may sell excess capacity to third parties at our discretion. We also have agreements to purchase oil and gas well drilling services from third parties with terms that ranged from two to three years. |
| (8)(6) | Commitments for PVR natural gas midstream activities relating to firm transportation agreements. |
| (7) | Total contractual obligations do not include anticipated 20092010 capital expenditures, excluding acquisitions, of up to $250.0 million for the oil and gas segment and $72.0 million for PVR.expenditures. |
Part of the purchase price for the PVR Lone Star acquisition includes contingent payments of approximately $55.0$55 million. These contingency payments will be made by PVR if certain revenue targets are met before June 30, 2013. Because the outcome of these contingent payments is not determinable beyond a reasonable doubt, PVR did not accrue these contingent payments as a liability during the year ended December 31, 2008.2009. Rather, once the revenue targets are met, the contingent payments will be recorded as an additional cost of the Lone Star.Star acquisition.
Off-Balance Sheet Arrangements
We may enter into off-balance sheet arrangements and transactions that can give rise to material off-balance sheet obligations. As of December 31, 2008,2009, the material off-balance sheet arrangements and transactions that we did notor PVR have entered into included operating lease arrangements, drilling commitments, firm transportation agreements, and letters of credit, all of which are customary in our and PVR’s business. See Contractual Obligations summarized above for more details related to the value of off-balance sheet arrangements. Neither we nor PVR had any relationships with unconsolidated entities or financial partnerships, such as entities often referred to as structured finance or special purpose entities, which would have been established for the purpose of facilitating off-balance sheet arrangements or other contractually narrow or limited purposes. We are, therefore, not materially exposed to any financing, liquidity, market or credit risk that could arise if we had engaged in such relationships.
TABLE OF CONTENTS
Results of Operations
Consolidated Review
The following table presents summary consolidated operating results for the periods presented:
Selected Financial Data—Consolidated
| | | | | | |
| | Year Ended December 31, |
| | | 2009 | | 2008 | | 2007 |
| Revenues | | $ | 815,137 | | | $ | 1,220,851 | | | $ | 852,950 | |
| Expenses | | | 913,339 | | | | 964,028 | | | | 660,326 | |
| Operating income (loss) | | | (98,202 | ) | | | 256,823 | | | | 192,624 | |
Other income (expense)
| | | | | | | | | | | | |
| Interest expense | | | (68,884 | ) | | | (49,299 | ) | | | (37,851 | ) |
| Derivatives | | | 11,854 | | | | 46,582 | | | | (47,282 | ) |
| Other | | | 2,612 | | | | (666 | ) | | | 3,651 | |
| Income tax (expense) benefit | | | 75,252 | | | | (71,920 | ) | | | (30,332 | ) |
| Net income (loss) | | | (77,368 | ) | | | 181,520 | | | | 80,810 | |
| Less: Net income attributable to noncontrolling interests | | | (37,275 | ) | | | (60,436 | ) | | | (30,319 | ) |
| Income (loss) attributable to Penn Virginia Corporation | | $ | (114,643 | ) | | $ | 121,084 | | | $ | 50,491 | |
The following tables present summary financial information relating to our segments for the periods presented:
| | | | | | | | | | |
| | Oil & Gas | | PVR Coal
and Natural
Resource
Management | | PVR
Natural Gas
Midstream | | Eliminations
and Other | | Consolidated |
For the Year Ended December 31, 2009:
| | | | | | | | | | | | | | | | | | | | |
| Revenues | | $ | 235,084 | | | $ | 144,600 | | | $ | 512,104 | | | $ | (76,651 | ) | | $ | 815,137 | |
| Cost of midstream gas purchased | | | — | | | | — | | | | 406,583 | | | | (72,729 | ) | | | 333,854 | |
| | | | 235,084 | | | | 144,600 | | | | 105,521 | | | | (3,922 | ) | | | 481,283 | |
| Operating costs and expenses | | | 154,233 | | | | 24,231 | | | | 45,842 | | | | 23,886 | | | | 248,192 | |
| Depreciation, depletion and amortization | | | 150,429 | | | | 31,330 | | | | 38,905 | | | | 2,703 | | | | 223,367 | |
| Impairments | | | 106,415 | | | | 1,511 | | | | — | | | | — | | | | 107,926 | |
| Operating income (loss) | | $ | (175,993 | ) | | $ | 87,528 | | | $ | 20,774 | | | $ | (30,511 | ) | | $ | (98,202 | ) |
For the Year Ended December 31, 2008:
| | | | | | | | | | | | | | | | | | | | |
| Revenues | | $ | 469,330 | | | $ | 153,327 | | | $ | 728,253 | | | $ | (130,059 | ) | | $ | 1,220,851 | |
| Cost of midstream gas purchased | | | — | | | | — | | | | 612,530 | | | | (127,909 | ) | | | 484,621 | |
| | | | 469,330 | | | | 153,327 | | | | 115,723 | | | | (2,150 | ) | | | 736,230 | |
| Operating costs and expenses | | | 146,515 | | | | 26,226 | | | | 37,615 | | | | 25,051 | | | | 235,407 | |
| Depreciation, depletion and amortization | | | 132,276 | | | | 30,805 | | | | 27,361 | | | | 1,794 | | | | 192,236 | |
| Impairments | | | 19,963 | | | | — | | | | 31,801 | | | | — | | | | 51,764 | |
| Operating income (loss) | | $ | 170,576 | | | $ | 96,296 | | | $ | 18,946 | | | $ | (28,995 | ) | | $ | 256,823 | |
For the Year Ended December 31, 2007:
| | | | | | | | | | | | | | | | | | | | |
| Revenues | | $ | 303,241 | | | $ | 111,639 | | | $ | 437,806 | | | $ | 264 | | | $ | 852,950 | |
| Cost of midstream gas purchased | | | — | | | | — | | | | 343,293 | | | | — | | | | 343,293 | |
| | | | 303,241 | | | | 111,639 | | | | 94,513 | | | | 264 | | | | 509,657 | |
| Operating costs and expenses | | | 109,449 | | | | 20,138 | | | | 26,777 | | | | 28,560 | | | | 184,924 | |
| Depreciation, depletion and amortization | | | 87,223 | | | | 22,690 | | | | 18,822 | | | | 788 | | | | 129,523 | |
| Impairments | | | 2,586 | | | | — | | | | — | | | | — | | | | 2,586 | |
| Operating income (loss) | | $ | 103,983 | | | $ | 68,811 | | | $ | 48,914 | | | $ | (29,084 | ) | | $ | 192,624 | |
TABLE OF CONTENTS
Oil and Gas Segment
Year Ended December 31, 2009 Compared With Year Ended December 31, 2008
The following table sets forth a summary of certain consolidated financial operating performance and other data for our oil and gas segment for the periods presented:
| | | | | | | | |
| | Year Ended December 31, | | Favorable (Unfavorable) | | % Change |
| | | 2009 | | 2008 |
Revenues
| | | | | | | | | | | | | | | | |
| Natural gas | | $ | 169,666 | | | $ | 368,801 | | | $ | (199,135 | ) | | | (54%) | |
| Crude oil | | | 43,258 | | | | 46,529 | | | | (3,271 | ) | | | (7%) | |
| NGL | | | 15,735 | | | | 21,292 | | | | (5,557 | ) | | | (26%) | |
| Total product revenues | | | 228,659 | | | | 436,622 | | | | (207,963 | ) | | | (48%) | |
| Gain on sale of property and equipment | | | 2,345 | | | | 30,634 | | | | (28,289 | ) | | | (92%) | |
| Other income | | | 4,080 | | | | 2,074 | | | | 2,006 | | | | 97% | |
| Total revenues | | | 235,084 | | | | 469,330 | | | | (234,246 | ) | | | (50%) | |
Expenses
| | | | | | | | | | | | | | | | |
| Operating | | | 55,699 | | | | 59,459 | | | | 3,760 | | | | 6% | |
| Taxes other than income | | | 16,556 | | | | 23,336 | | | | 6,780 | | | | 29% | |
| General and administrative | | | 22,625 | | | | 21,284 | | | | (1,341 | ) | | | (6%) | |
| Production costs | | | 94,880 | | | | 104,079 | | | | 9,199 | | | | 9% | |
| Exploration | | | 57,754 | | | | 42,436 | | | | (15,318 | ) | | | (36%) | |
| Depreciation, depletion and amortization | | | 150,429 | | | | 132,276 | | | | (18,153 | ) | | | (14%) | |
| Impairments | | | 106,415 | | | | 19,963 | | | | (86,452 | ) | | | (433%) | |
| Loss on sale of assets | | | 1,599 | | | | — | | | | (1,599 | ) | | | n/a | |
| Total expenses | | | 411,077 | | | | 298,754 | | | | (112,323 | ) | | | (38%) | |
| Operating income (loss) | | $ | (175,993 | ) | | $ | 170,576 | | | $ | (346,569 | ) | | | (203%) | |
Production:
| | | | | | | | | | | | | | | | |
| Natural gas (MMcf) | | | 43,338 | | | | 41,493 | | | | 1,845 | | | | 4% | |
| Crude oil (MBbl) | | | 750 | | | | 506 | | | | 244 | | | | 48% | |
| NGL (MBbl) | | | 527 | | | | 392 | | | | 135 | | | | 34% | |
| Total production (MMcfe) | | | 51,000 | | | | 46,881 | | | | 4,119 | | | | 9% | |
Rates:
| | | | | | | | | | | | | | | | |
| Natural gas ($/Mcf) | | $ | 3.91 | | | $ | 8.89 | | | $ | (4.97 | ) | | | (56%) | |
| Crude oil ($/Bbl) | | | 57.68 | | | | 91.95 | | | | (34.28 | ) | | | (37%) | |
| NGL ($/Bbl) | | | 29.86 | | | | 54.32 | | | | (24.46 | ) | | | (45%) | |
| Total ($/Mcfe) | | $ | 4.48 | | | $ | 9.31 | | | $ | (4.83 | ) | | | (52%) | |
Production
The following tables set forth a summary of our production volume and product revenue by geographical region for the periods presented:
| | | | | | | | |
| | Year Ended December 31, | | Favorable (Unfavorable) |
| | | 2009 | | 2008 | | % Change |
| | | (MMcfe) | | | | |
| East Texas | | | 13,116 | | | | 13,409 | | | | (293 | ) | | | (2%) | |
| Appalachia | | | 11,465 | | | | 11,497 | | | | (32 | ) | | | (0%) | |
| Mid-Continent | | | 12,826 | | | | 7,646 | | | | 5,180 | | | | 68% | |
| Mississippi | | | 7,822 | | | | 7,340 | | | | 482 | | | | 7% | |
| Gulf Coast | | | 5,771 | | | | 6,989 | | | | (1,218 | ) | | | (17%) | |
| Total production | | | 51,000 | | | | 46,881 | | | | 4,119 | | | | 9% | |
TABLE OF CONTENTS
| | | | | | | | |
| | Year Ended December 31, | | Favorable (Unfavorable) | | |
| | | 2009 | | 2008 | | % Change |
| East Texas | | $ | 55,159 | | | $ | 129,105 | | | $ | (73,946 | ) | | | (57%) | |
| Appalachia | | | 46,863 | | | | 107,282 | | | | (60,419 | ) | | | (56%) | |
| Mid-Continent | | | 63,720 | | | | 59,969 | | | | 3,751 | | | | 6% | |
| Mississippi | | | 32,792 | | | | 69,916 | | | | (37,124 | ) | | | (53%) | |
| Gulf Coast | | | 30,125 | | | | 70,350 | | | | (40,225 | ) | | | (57%) | |
| Total revenues | | $ | 228,659 | | | $ | 436,622 | | | $ | (207,963 | ) | | | (48%) | |
Approximately 85% and 89% of total production in the years ended December 31, 2009 and 2008 2007 and 2006:
| | | | | | | | | |
| | | Year Ended December 31, |
| | | 2008 | | 2007 | | 2006 |
| | | (in thousands, except per share data) |
Revenues | | $ | 1,220,851 | | $ | 852,950 | | $ | 753,929 |
Expenses | | | 964,028 | | | 660,326 | | | 583,397 |
| | | | | | | | | |
Operating income | | $ | 256,823 | | $ | 192,624 | | $ | 170,532 |
Net income | | $ | 124,168 | | $ | 50,754 | | $ | 75,909 |
Earnings per share, basic | | $ | 2.97 | | $ | 1.33 | | $ | 2.03 |
Earnings per share, diluted | | $ | 2.95 | | $ | 1.32 | | $ | 2.01 |
Cash flows provided by operating activities | | $ | 383,774 | | $ | 313,030 | | $ | 275,819 |
Operating incomewas natural gas. Total production increased in 2008 compared to 2007 primarily due to continued development of the Granite Wash play in the Mid-Continent region and the horizontal Selma Chalk play in Mississippi. Our Appalachian production was relatively consistent with the prior year. We have deferred drilling in the East Texas region until early 2010 and we were in the process of exiting all of our activities in the Gulf Coast region during the fourth quarter of 2009.
In 2009, we drilled a $106.6total of 32 gross (20.7 net) wells, including 30 gross (19.7 net) development wells and 2 gross (1.0 net) exploratory wells. All wells were successful except 5 gross (2.8 net) development wells, including 4 gross (1.8 net) development wells under evaluation at December 31, 2009.
Our operations include both conventional and unconventional developmental drilling opportunities, as well as some exploratory prospects. We recently shifted our focus to the Lower Bossier (Haynesville) Shale play, which we believe has increased proved reserves and production levels. In this East Texas play, we drilled 10 gross (9.5 net) wells, including 8 gross (7.5 net) successful wells. We also have unconventional development programs in the Mid-Continent region where we drilled 17 gross (6.2 net) wells, including 14 gross (5.4 net) successful wells, primarily in the Granite Wash and Woodford Shale plays. In the Selma Chalk play in Mississippi and Appalachian region, we drilled 5 gross (5.0 net) wells all of which were successful.
Revenues
The following table provides an analysis of the change in our oil and gas segment revenues for the year ended December 31, 2009 as compared to the year ended December 31, 2008:
| | | | | | |
| | 2009 Revenue Variance Due to |
| | | Volume | | Price | | Total |
| Natural gas | | $ | 16,399 | | | $ | (215,534 | ) | | $ | (199,135 | ) |
| Crude oil | | | 22,437 | | | | (25,708 | ) | | | (3,271 | ) |
| NGL | | | 7,333 | | | | (12,890 | ) | | | (5,557 | ) |
| | | $ | 46,168 | | | $ | (254,131 | ) | | $ | (207,963 | ) |
Our revenues, profitability and future rate of growth are highly dependent on the prevailing prices for oil and natural gas, which are affected by numerous factors that are generally beyond our control. Crude oil prices are generally determined by global supply and demand. Natural gas prices are influenced by national and regional supply and demand. A substantial or extended decline in the price of oil or natural gas could have a material adverse effect on our revenues, profitability and cash flow and could, under certain circumstances, result in an impairment of some of our oil and natural gas properties. Our future profitability and growth are also highly dependent on the results of our exploratory and development drilling programs.
Effects of Derivatives
Our natural gas and crude oil revenues may change significantly from period to period as a result of changes in commodity prices or production volumes. As part of our risk management strategy, we use derivative financial instruments to hedge natural gas and, to a lesser extent, oil prices.
For the derivatives related to the oil and gas segment, we received $59.9 million in cash settlements in 2009 and we paid cash settlements of $7.6 million in 2008. The following table reconciles natural gas and crude oil revenues to realized prices, as adjusted for derivative activities, for the periods presented:
TABLE OF CONTENTS
| | | | | | | | |
| | Year Ended December 31, | | Favorable (Unfavorable) | | % Change |
| | | 2009 | | 2008 |
| Natural gas revenues as reported | | $ | 169,666 | | | $ | 368,801 | | | $ | (199,135 | ) | | | (54%) | |
| Cash settlements on natural gas derivatives | | | 55,545 | | | | (7,339 | ) | | | 62,884 | | | | (857%) | |
| Natural gas revenues adjusted for derivatives | | $ | 225,211 | | | $ | 361,462 | | | $ | (136,251 | ) | | | (38%) | |
| Natural gas revenue rates per Mcf, as reported | | $ | 3.91 | | | $ | 8.89 | | | $ | (4.97 | ) | | | (56%) | |
| Cash settlements on natural gas derivatives per Mcf | | | 1.29 | | | | (0.18 | ) | | | 1.46 | | | | (811%) | |
| Natural gas revenue rates per Mcf adjusted for derivatives | | $ | 5.20 | | | $ | 8.71 | | | $ | (3.51 | ) | | | (40%) | |
| Crude oil revenues as reported | | $ | 43,258 | | | $ | 46,529 | | | $ | (3,271 | ) | | | (7%) | |
| Cash settlements on crude oil derivatives | | | 4,361 | | | | (281 | ) | | | 4,642 | | | | (1652%) | |
| Crude oil revenues adjusted for derivatives | | $ | 47,619 | | | $ | 46,248 | | | $ | 1,371 | | | | 3% | |
| Crude oil revenue rates per Bbl, as reported | | $ | 57.68 | | | $ | 91.95 | | | $ | (34.28 | ) | | | (37%) | |
| Cash settlements on crude oil derivatives per Bbl | | | 5.81 | | | | (0.55 | ) | | | 6.37 | | | | (1157%) | |
| Crude oil revenue rates per Bbl adjusted for derivatives | | $ | 63.49 | | | $ | 91.40 | | | $ | (27.91 | ) | | | (31%) | |
Gain on Sale of Property and Equipment
In 2009, we recognized gains on the sale of certain properties and equipment in our East Texas region. In 2008, we recognized gains on the sale of property and equipment, primarily related to the sale of all of our working interest in unproved properties in Louisiana.
Other Income
Other income increased primarily due to increased gathering revenues in the East Texas region resulting from increased production in that region and an overall increase in natural gas revenues,gathering fees per Mcf that we charged.
Production Costs
The following table sets forth a $28.7 million increase in coal royaltiessummary of our production costs per Mcfe for the periods presented:
| | | | | | | | |
| | Year Ended December 31, | | Favorable (Unfavorable) | | |
| | | 2009 | | 2008 | | % Change |
| Operating | | $ | 1.09 | | | $ | 1.27 | | | $ | 0.18 | | | | 14 | % |
| Taxes other than income | | | 0.32 | | | | 0.50 | | | | 0.17 | | | | 35 | % |
| General and administrative | | | 0.44 | | | | 0.45 | | | | 0.01 | | | | 2 | % |
| Total production costs per Mcfe | | $ | 1.86 | | | $ | 2.22 | | | | 0.36 | | | | 16 | % |
Operating expenses decreased primarily due to lower repair and a $15.3 million increase in gross margin,maintenance costs and lower water disposal fees partially offset by a $62.7 million increasehigher gathering and processing fees from higher production in DD&A expenses and $51.8 million of impairments recorded in 2008. Operatingcertain regions. Taxes other than income increased in 2007 compared to 2006decreased, primarily due to a $49.3 million increase in natural gas revenues, a $21.8 million increase in natural gas midstream gross marginthe timing of refunds and $12.4 million in net gains on the sales of properties in 2007,lower severance taxes resulting from lower commodity prices partially offset by a $35.3 million increase in DD&A expense, a $17.4 million increase in generalthe impact of higher production. General and administrative expenses were relatively flat.
The following table sets forth the components of exploration expenses for the periods presented:
TABLE OF CONTENTS
| | | | | | | | |
| | Year Ended December 31, | | Favorable (Unfavorable) | | |
| | | 2009 | | 2008 | | % Change |
| Dry hole costs | | $ | 1,397 | | | $ | 14,435 | | | $ | 13,038 | | | | 90% | |
| Geological and geophysical | | | 912 | | | | 4,171 | | | | 3,259 | | | | 78% | |
| Unproved leasehold | | | 31,618 | | | | 21,412 | | | | (10,206 | ) | | | (48%) | |
| Standby rig charges | | | 20,084 | | | | — | | | | (20,084 | ) | | | n/a | |
| Other | | | 3,743 | | | | 2,418 | | | | (1,325 | ) | | | (55%) | |
| | | $ | 57,754 | | | $ | 42,436 | | | $ | (15,318 | ) | | | (36%) | |
In 2009, dry hole costs and geological and geophysical expenses were significantly decreased due to our reduced drilling program. In 2008, the dry hole costs were primarily due to the write-off of six wells in the Appalachian region, which were non-economic. Unproved leasehold expense increased primarily as a $20.2result of a change we made to our accounting process in 2009 to amortize additional insignificant unproved properties over the average estimated life of the leases rather than amortizing some leases and assessing other leases on an occurrence basis. In conjunction with the drilling program reduction, we amended certain drilling rig contracts to delay commencement of drilling until January 2010. As a result, in 2009 we recognized standby rig charges for cancellation fees, minimum daily standby fees and demobilization fees as a component of exploration expenses. Other expenses increased due to increased delay rentals in the Gulf Coast region primarily related to lease renewals on certain prospects.
Depreciation, Depletion and Amortization (DD&A)
DD&A expenses increased approximately $11.6 million increase in operating expenses.
Net income increased in 2008 compared to 2007 primarily due to the increase in operating incomeequivalent production and a $93.9approximately $6.5 million increasedue to higher depletion rates which were caused by higher cost wells being drilled. Our average depletion rate increased by $0.13 per Mcfe, or 5%, from $2.82 per Mcfe in derivatives income resulting from2008 to $2.95 per Mcfe in 2009.
Impairments
Impairment charges in 2009 includes $97.5 million attributable to assets that were sold during 2009 or held for sale as of December 31, 2009. The most significant of these related to our Gulf Coast properties in Texas and Louisiana as well as certain properties in North Dakota. The sale of our North Dakota properties was completed in the fourth quarter of 2009 and the sale of our Gulf Coast properties was completed in January 2010. See Note 19 to the Consolidated Financial Statements for additional information with respect to the Gulf Coast assets held for sale. Other impairment charges during 2009 include $4.1 million for re-evaluation related to our tubular inventory due to decline in market value and $4.8 million of other impairments. Impairment charges in 2008 related to declines in spot and future oil and gas prices which reduced the estimated reserve bases of fields on certain properties in the Mid-Continent and Appalachian regions. These changes in the valuation of unrealized derivative positions, partially offset by the corresponding increasereserve estimates in income tax expense. Net income decreased in 2007 compared to 20062008 were primarily due to a $66.8 million increasedecrease in derivative lossesfourth quarter oil and gas prices and a $12.6 million increasedecline in interest expense, partially offset by the increase in operating income and the corresponding decrease in income tax expense.well performance.
The assets, liabilities and earnings of PVG are fully consolidated in our financial statements, with the public unitholders’ interest (23% as of December 31, 2008) reflected as a minority interest in our consolidated financial statements. The assets,TABLE OF CONTENTS
liabilities and earnings of PVR are fully consolidated in PVG’s financial statements, with the interest that PVG does not own (61%, after the effect of IDRs, as of December 31, 2008) reflected as a minority interest in PVG’s consolidated financial statements.
Oil and Gas Segment
Year Ended December 31, 2008 Compared With Year Ended December 31, 2007
The following table sets forth a summary of certain financial operating performance and other data for our oil and gas segment and the percentage change for the years ended December 31, 2008periods presented:
| | | | | | | | |
| | Year Ended December 31, | | Favorable
(Unfavorable) | | |
| | | 2008 | | 2007 | | % Change |
Revenues
| | | | | | | | | | | | | | | | |
| Natural gas | | $ | 368,801 | | | $ | 262,169 | | | $ | 106,632 | | | | 41% | |
| Crude oil | | | 46,529 | | | | 22,439 | | | | 24,090 | | | | 107% | |
| NGL | | | 21,292 | | | | 5,678 | | | | 15,614 | | | | 275% | |
| Total product revenues | | | 436,622 | | | | 290,286 | | | | 146,336 | | | | 50% | |
| Gain on sale of property and equipment | | | 30,634 | | | | 12,235 | | | | 18,399 | | | | 150% | |
| Other income | | | 2,074 | | | | 720 | | | | 1,354 | | | | 188% | |
| Total revenues | | | 469,330 | | | | 303,241 | | | | 166,089 | | | | 55% | |
Expenses
| | | | | | | | | | | | | | | | |
| Operating | | | 59,459 | | | | 46,713 | | | | (12,746 | ) | | | (27%) | |
| Taxes other than income | | | 23,336 | | | | 17,847 | | | | (5,489 | ) | | | (31%) | |
| General and administrative | | | 21,284 | | | | 16,281 | | | | (5,003 | ) | | | (31%) | |
| Production costs | | | 104,079 | | | | 80,841 | | | | (23,238 | ) | | | (29%) | |
| Exploration | | | 42,436 | | | | 28,608 | | | | (13,828 | ) | | | (48%) | |
| Depreciation, depletion and amortization | | | 132,276 | | | | 87,223 | | | | (45,053 | ) | | | (52%) | |
| Impairments | | | 19,963 | | | | 2,586 | | | | (17,377 | ) | | | (672%) | |
| Total expenses | | | 298,754 | | | | 199,258 | | | | (99,496 | ) | | | (50%) | |
| Operating income | | $ | 170,576 | | | $ | 103,983 | | | $ | 66,593 | | | | 64% | |
Production:
| | | | | | | | | | | | | | | | |
| Natural gas (MMcf) | | | 41,493 | | | | 37,802 | | | | 3,691 | | | | 10% | |
| Crude oil (MBbl) | | | 506 | | | | 325 | | | | 181 | | | | 56% | |
| NGL (MBbl) | | | 392 | | | | 136 | | | | 256 | | | | 188% | |
| Total production (MMcfe) | | | 46,881 | | | | 40,569 | | | | 6,312 | | | | 16% | |
Rates:
| | | | | | | | | | | | | | | | |
| Natural gas ($/Mcf) | | $ | 8.89 | | | $ | 6.94 | | | $ | 1.95 | | | | 28% | |
| Crude oil ($/Bbl) | | | 91.95 | | | | 69.04 | | | | 22.91 | | | | 33% | |
| NGL ($/Bbl) | | | 54.32 | | | | 41.75 | | | | 12.57 | | | | 30% | |
| Total ($/Mcfe) | | $ | 9.31 | | | $ | 7.16 | | | $ | 2.16 | | | | 30% | |
Production
The following tables set forth a summary of our production volume and 2007:product revenue by geographical region for the periods presented:
| | | | | | | | | | | | | | | |
| | | Year Ended
December 31, | | %
Change | | | Year Ended
December 31, |
| | | 2008 | | 2007 | | | 2008 | | 2007 |
| | | (in thousands, except as
noted) | | | | | (per Mcfe) (1) |
Financial Highlights | | | | | | | | | | | | | | | |
Revenues | | | | | | | | | | | | | | | |
Natural gas | | $ | 368,801 | | $ | 262,169 | | 41 | % | | $ | 8.89 | | $ | 6.94 |
Crude oil | | | 46,529 | | | 22,439 | | 107 | % | | | 91.95 | | | 69.04 |
NGL | | | 21,292 | | | 5,678 | | 275 | % | | | 54.32 | | | 41.75 |
Gain on the sale of property and equipment | | | 30,634 | | | 12,235 | | 150 | % | | | | | | |
Other income | | | 2,074 | | | 720 | | 188 | % | | | | | | |
| | | | | | | | | | | | | | | |
Total revenues | | | 469,330 | | | 303,241 | | 55 | % | | | 10.01 | | | 7.47 |
| | | | | | | | | | | | | | | |
| | | | | |
Expenses | | | | | | | | | | | | | | | |
Operating | | | 59,459 | | | 46,713 | | 27 | % | | | 1.27 | | | 1.15 |
Taxes other than income | | | 23,336 | | | 17,847 | | 31 | % | | | 0.50 | | | 0.44 |
General and administrative | | | 21,284 | | | 16,281 | | 31 | % | | | 0.45 | | | 0.40 |
| | | | | | | | | | | | | | | |
Production costs | | | 104,079 | | | 80,841 | | 29 | % | | | 2.22 | | | 1.99 |
Exploration | | | 42,436 | | | 28,608 | | 48 | % | | | 0.91 | | | 0.71 |
Impairments | | | 19,963 | | | 2,586 | | 672 | % | | | 0.43 | | | 0.06 |
Depreciation, depletion and amortization | | | 132,276 | | | 87,223 | | 52 | % | | | 2.82 | | | 2.15 |
| | | | | | | | | | | | | | | |
Total expenses | | | 298,754 | | | 199,258 | | 50 | % | | | 6.37 | | | 4.91 |
| | | | | | | | | | | | | | | |
Operating income | | $ | 170,576 | | $ | 103,983 | | 64 | % | | $ | 3.64 | | $ | 2.56 |
| | | | | | | | | | | | | | | |
| | | | | |
Production | | | | | | | | | | | | | | | |
Natural gas (MMcf) | | | 41,493 | | | 37,802 | | 10 | % | | | | | | |
Crude oil (MBbl) | | | 506 | | | 325 | | 56 | % | | | | | | |
NGL (MBbl) | | | 392 | | | 136 | | 188 | % | | | | | | |
| | | | | | | | | | | | | | | |
Total production (MMcfe) | | | 46,881 | | | 40,569 | | 16 | % | | | | | | |
| | | | | | | | | | | | | | | |
| | | | | | | | |
| | Year Ended December 31, | | Favorable
(Unfavorable) | | % Change |
| | | 2008 | | 2007 |
| | | (MMcfe) | | | | |
| East Texas | | | 13,409 | | | | 7,986 | | | | 5,423 | | | | 68% | |
| Appalachia | | | 11,497 | | | | 12,426 | | | | (929 | ) | | | (7%) | |
| Mid-Continent | | | 7,646 | | | | 4,129 | | | | 3,517 | | | | 85% | |
| Mississippi | | | 7,340 | | | | 7,551 | | | | (211 | ) | | | (3%) | |
| Gulf Coast | | | 6,989 | | | | 8,477 | | | | (1,488 | ) | | | (18%) | |
| Total production | | | 46,881 | | | | 40,569 | | | | 6,312 | | | | 16% | |
TABLE OF CONTENTS
| (1) | Natural gas revenues are shown per Mcf, crude oil and NGL revenues are shown per Bbl and all other amounts are shown per Mcfe. |
Production.
| | | | | | | | |
| | Year Ended December 31, | | Favorable
(Unfavorable) | | % Change |
| | | 2008 | | 2007 |
| East Texas | | $ | 129,105 | | | $ | 59,333 | | | $ | 69,772 | | | | 118 | % |
| Appalachia | | | 107,282 | | | | 86,936 | | | | 20,346 | | | | 23 | % |
| Mid-Continent | | | 59,969 | | | | 24,980 | | | | 34,989 | | | | 140 | % |
| Mississippi | | | 69,916 | | | | 53,737 | | | | 16,179 | | | | 30 | % |
| Gulf Coast | | | 70,350 | | | | 65,300 | | | | 5,050 | | | | 8 | % |
| Total revenues | | $ | 436,622 | | | $ | 290,286 | | | $ | 146,336 | | | | 50 | % |
Approximately 89% and 93% of total production in the years ended December 31, 2008 and 2007 was natural gas. Total production increased by 6.3 Bcfe, or 16%, from 40.6 Bcfe in 2007 to 46.9 Bcfe in the same period of 2008, primarily due toThe increased production in the East Texas region is due primarily to aggressive drilling and Mid-Continent regions, partially offset by decreased productionadditional processing for sales points which were previously sold as wet gas, but are now processed through PVR’s Crossroads plant, which was placed into service in the Appalachian, Mississippi and Gulf Coast regions.
April 2008. In 2008, we drilled a successful horizontal Lower Bossier (Haynesville) Shale well in Harrison County, Texas. Based on this successful horizontal test, we had four rigs drilling horizontal Lower Bossier (Haynesville) Shale wells as of December 31, 2008.
The following table summarizes totaldecrease in the Appalachian region is due primarily to the sale of oil and gas royalty interests to PVR in October 2007. Production in the Mississippi region was relatively constant from 2007 to 2008. The increase in production in the Mid-Continent region is due primarily to higher CBM production and high production wells in the Granite Wash and Woodford Shale areas. The decrease in production in the Gulf Coast region is due primarily to decreased natural gas crude oil and NGL production and total natural gas, crude oil and NGL revenues byresulting from depletion of certain prospects within that region. In addition, the Gulf Coast region, forparticularly the years ended December 31, 2008 and 2007:Bayou Postillion area, experienced disruptions in production due to inclement weather.
| | | | | | | | | | |
| | | Natural Gas, Crude
Oil and NGL
Production | | Natural Gas, Crude
Oil and NGL
Revenues |
| | | Year Ended
December 31, | | Year Ended
December 31, |
Region | | 2008 | | 2007 | | 2008 | | 2007 |
| | | (MMcfe) | | (in thousands) |
East Texas | | 13,409 | | 7,986 | | $ | 129,105 | | $ | 59,333 |
Appalachia | | 11,497 | | 12,426 | | | 107,282 | | | 86,936 |
Mid-Continent | | 7,646 | | 4,129 | | | 59,969 | | | 24,980 |
Mississippi | | 7,340 | | 7,551 | | | 69,916 | | | 53,737 |
Gulf Coast | | 6,989 | | 8,477 | | | 70,350 | | | 65,300 |
| | | | | | | | | | |
Total | | 46,881 | | 40,569 | | $ | 436,622 | | $ | 290,286 |
| | | | | | | | | | |
In 2008, we drilled a total of 285 gross (179.6 net) wells, including 274 gross (172.3 net) development wells and 12 gross (7.3 net) exploratory wells. All wells were successful except (i) 15 gross (11.8 net) development wells, including 11 gross (8.8 net) development wells under evaluation at December 31, 2008 and (ii) 6 gross (3.8 net) exploratory wells, including one exploratory well that was under evaluation at December 31, 2008.
Our operations include both conventional and unconventional developmental drilling opportunities, as well as some exploratory prospects. In the Lower Bossier (Haynesville) play, we drilled 102 gross (76.4 net) wells in 2008, including 93 gross (68.4 net) successful wells. In Appalachia, we drilled 75 gross (33.1 net) wells in 2008, including 18 gross (9.0 net) horizontal CBM locations and 71 gross (30.6 net) successful locations. In the Selma Chalk play in Mississippi, we drilled 29 gross (28.6 net) wells in 2008, including 28 gross (27.6 net) successful horizontal wells. We also have unconventional development programs in the Mid-Continent and some higher-impact exploratory prospects in the Gulf Coast. In the Mid-Continent region, we drilled 75 gross (37.7 net) wells in 2008, including 29 gross (23.9 net) successful CBM locations.
In 2007, we drilled a total of 289 gross (213.0 net) wells, including 271 gross (203.6 net) development wells and 18 gross (9.4 net) exploratory wells. All wells were successful except six gross (5.1 net) development wells and seven gross (4.2 net) exploratory wells, including four (2.6 net) wells under evaluation at December 31, 2007.
Revenues
The increased productionfollowing table provides an analysis of the change in the East Texas region is due primarily to aggressive drilling and additional processing for sales points which were previously sold as wet gas, but are now processed through PVR’s Crossroads plant, which was placed into service in April 2008.
The decrease in the Appalachian region is due primarily to the sale ofour oil and gas royalty interestssegment revenues for the year ended December 31, 2008 as compared to PVR in October 2007. Production in the Mississippi region was relatively constant from 2007 to 2008.year ended December 31, 2007:
The increase in production in the Mid-Continent region is due primarily to higher CBM production and high production wells in the Granite Wash and Woodford Shale areas.
| | | | | | |
| | 2008 Revenue Variance Due to |
| | | Volume | | Price | | Total |
| Natural gas | | $ | 25,598 | | | $ | 81,034 | | | $ | 106,632 | |
| Crude oil | | | 12,497 | | | | 11,593 | | | | 24,090 | |
| NGL | | | 10,688 | | | | 4,926 | | | | 15,614 | |
| | | $ | 48,783 | | | $ | 97,553 | | | $ | 146,336 | |
The decrease in production in the Gulf Coast region is due primarily to decreased natural gas production resulting from depletion of certain prospects within that region. In addition, the Gulf Coast region, particularly the Bayou Postillion area, experienced disruptions in production due to inclement weather.TABLE OF CONTENTS
Revenues. Natural gas revenues increased by $106.6 million, or 41%, from $262.2 million in 2007 to $368.8 million in 2008. Of the $106.6 million increase, $81.0 million was the result of increased realized prices for natural gas and $25.6 million was the result of increased natural gas production from drilling. Our average realized price received for natural gas increased by $1.95 per Mcf, or 28%, from $6.94 per Mcf in 2007 to $8.89 per Mcf in 2008.
Crude oil revenues increased by $24.1 million, or 107%, from $22.4 million in 2007 to $46.5 million in 2008. Of the $24.1 million increase, $12.5 million was the result of increased crude oil production and $11.6 million was the result of higher realized prices for crude oil. Our average realized price received for crude oil increased by $22.91 per Bbl, or 33%, from $69.04 per Bbl in 2007 to $91.95 per Bbl in 2008.
NGL revenues increased by $15.6 million, or 275%, from $5.7 million in 2007 to $21.3 million in 2008. Of the $15.6 million increase, $10.7 million was the result of increased NGL production and $4.9 million was the result of higher realized prices for NGLs. Our average realized price received for NGLs increased by $12.57 per Bbl, or 30%, from $41.75 per Bbl in 2007 to $54.32 per Bbl in 2008.
Effects of Derivatives
Our natural gas and crude oil revenues may change significantly from period to period as a result of changes in commodity prices or production volumes. As part of our risk management strategy, we use derivative financial instruments to hedge natural gas and, to a lesser extent, oil prices.
In 2006, we discontinued hedge accounting prospectively for our remaining and future commodity derivatives. Consequently, we began recognizing realized and mark-to-market gains and losses in the derivatives line of our consolidated statementsConsolidated Statements of incomeIncome rather than deferring such amounts in accumulated other comprehensive income. See Note 8, “Derivative Instruments,”However, realized gains and losses and changes in the Notes to Consolidated Financial Statements in Item 8, “Financial Statements and Supplementary Data,” for a tabular schedule of the 2008 effectsfair value of derivatives on our consolidated statements of income.
entered into prior to the election to discontinue hedge accounting continued to be deferred in accumulated other comprehensive income until the original forecasted transactions settled in 2007. Accordingly, the natural gas, crude oil and NGL revenues for 2007 include amounts, as indicated in the table below, for derivative gains and losses attributable to settlements during 2007. For the derivatives related to the oil and gas segment, we paid $7.6 million in cash settlements in 2008 and we received cash settlements of $14.1 million in cash settlements in 2007. The following table reconciles natural gas and crude oil revenues to realized prices, as adjusted for derivative activities, for the years ended December 31, 2008 and 2007:
periods presented: | | | | | | | | | | | | | | | | |
| | | Year Ended December 31, | |
| | | 2008 | | | 2007 | | | 2008 | | | 2007 | |
| | | (in thousands) | | | (per Mcf) | |
Natural gas revenues, as reported | | $ | 368,801 | | | $ | 262,169 | | | $ | 8.89 | | | $ | 6.94 | |
Derivatives gains included in natural gas revenues (1) | | | — | | | | (222 | ) | | | — | | | | (0.01 | ) |
| | | | | | | | | | | | | | | | |
Natural gas revenues before impact of derivatives | | | 368,801 | | | | 261,947 | | | | 8.89 | | | | 6.93 | |
Cash settlements on natural gas derivatives (2) | | | (7,339 | ) | | | 14,863 | | | | (0.18 | ) | | | 0.39 | |
| | | | | | | | | | | | | | | | |
Natural gas revenues, adjusted for derivatives | | $ | 361,462 | | | $ | 276,810 | | | $ | 8.71 | | | $ | 7.32 | |
| | | | | | | | | | | | | | | | |
| | |
| | | (in thousands) | | | (per Bbl) | |
Crude oil revenues, as reported | | $ | 46,529 | | | $ | 22,439 | | | $ | 91.95 | | | $ | 69.04 | |
Derivatives losses included in crude oil revenues (1) | | | — | | | | 502 | | | | — | | | | 1.54 | |
| | | | | | | | | | | | | | | | |
Crude oil revenues before impact of derivatives | | | 46,529 | | | | 22,941 | | | | 91.95 | | | | 70.58 | |
Cash settlements on crude oil derivatives (2) | | | (281 | ) | | | (735 | ) | | | (0.55 | ) | | | (2.26 | ) |
| | | | | | | | | | | | | | | | |
Crude oil revenues, adjusted for derivatives | | $ | 46,248 | | | $ | 22,206 | | | $ | 91.40 | | | $ | 68.32 | |
| | | | | | | | | | | | | | | | |
| | | | | | | | |
| | Year Ended December 31, | | Favorable (Unfavorable) | | |
| | | 2008 | | 2007 | | % Change |
| Natural gas revenues as reported | | $ | 368,801 | | | $ | 262,169 | | | $ | 106,632 | | | | 41% | |
| Derivative gains included in natural gas revenues | | | — | | | | (222 | ) | | | 222 | | | | (100%) | |
| Natural gas revenues before impact of derivatives | | | 368,801 | | | | 261,947 | | | | 106,854 | | | | 41% | |
| Cash settlements on natural gas derivatives | | | (7,339 | ) | | | 14,863 | | | | (22,202 | ) | | | (149%) | |
| Natural gas revenues adjusted for derivatives | | $ | 361,462 | | | $ | 276,810 | | | $ | 84,652 | | | | 31% | |
| Natural gas revenue rates per Mcf, as reported | | $ | 8.89 | | | $ | 6.94 | | | $ | 1.95 | | | | 28% | |
| Derivative gains included in natural gas revenues | | | — | | | | (0.01 | ) | | | 0.01 | | | | (100%) | |
| Natural gas revenues before impact of derivatives | | | 8.89 | | | | 6.93 | | | | 1.96 | | | | 28% | |
| Cash settlements on natural gas derivatives | | | (0.18 | ) | | | 0.39 | | | | (0.57 | ) | | | (145%) | |
| Natural gas revenue rates per Mcf adjusted for derivatives | | $ | 8.71 | | | $ | 7.32 | | | $ | 1.39 | | | | 19% | |
| Crude oil revenues as reported | | $ | 46,529 | | | $ | 22,439 | | | $ | 24,090 | | | | 107% | |
| Derivative gains included in crude oil revenues | | | — | | | | 502 | | | | (502 | ) | | | (100%) | |
| Crude oil revenues before impact of derivatives | | | 46,529 | | | | 22,941 | | | | 23,588 | | | | 103% | |
| Cash settlements on crude oil derivatives | | | (281 | ) | | | (735 | ) | | | 454 | | | | (62%) | |
| Crude oil revenues adjusted for derivatives | | $ | 46,248 | | | $ | 22,206 | | | $ | 24,042 | | | | 108% | |
| Crude oil revenues as reported | | $ | 91.95 | | | $ | 69.04 | | | $ | 22.91 | | | | 33% | |
| Derivative gains included in crude oil revenues | | | — | | | | 1.54 | | | | (1.54 | ) | | | (100%) | |
| Crude oil revenues before impact of derivatives | | | 91.95 | | | | 70.58 | | | | 21.37 | | | | 30% | |
| Cash settlements on crude oil derivatives | | | (0.55 | ) | | | (2.26 | ) | | | 1.71 | | | | (76%) | |
| Crude oil revenues adjusted for derivatives | | $ | 91.40 | | | $ | 68.32 | | | $ | 23.08 | | | | 34% | |
TABLE OF CONTENTS
| (1) | As a result of the original forecasted transactions settling, we reclassified the remaining amounts in accumulated other comprehensive income to earnings in 2007. As a result, in 2008, no derivatives gains or losses were reported as part of natural gas, crude oil and NGL revenues. |
| (2) | As a result of the original forecasted transactions settling, we mark-to-market our derivative positions and record the gains or losses on the derivatives line of our consolidated statements of income. These cash settlements relate to those derivative gains or losses. Had we not elected to discontinue hedge accounting for our commodity derivatives in 2006, these cash settlements would have been recognized in the natural gas and crude oil revenues lines on our consolidated statements of income. |
Gain on saleSale of propertyProperty and equipment
. EquipmentIn 2008, we recognized $30.6 million of gains on the sales of property and equipment, primarily related to the sale of all of our working interest in unproved properties in Louisiana. In 2007, we recognized $12.2 million of net gainsa gain on sales ofthe sale property and equipment primarily related to the September 2007 sale of non-operated working interests in oil and gas properties.
Other income
. IncomeOther income increased by $1.4 million, or 188% from $0.7 million in 2007 to $2.1 million in 2008, primarily due to increased gathering revenues in the East Texas region resulting from increased production in that region and an overall increase in gathering fees per Mcf that we charged.
Production Costs
The following table sets forth a summary of our production costs per Mcfe for the periods presented:
Expenses. Aggregate operating costs and expenses increased by $99.5 million, or 50%, from $199.3 million in 2007 to $298.8 million in 2008, primarily due to increased operating expenses, taxes other than income, general and administrative, exploration expenses, $20.0 million of impairment expenses in 2008 and increased DD&A expenses.
| | | | | | | | |
| | Year Ended December 31, | | Favorable
(Unfavorable) | | |
| | | 2008 | | 2007 | | % Change |
| Operating | | $ | 1.27 | | | $ | 1.15 | | | $ | (0.12 | ) | | | (10%) | |
| Taxes other than income | | | 0.50 | | | | 0.44 | | | | (0.06 | ) | | | (13%) | |
| General and administrative | | | 0.45 | | | | 0.40 | | | | (0.05 | ) | | | (13%) | |
| Total production costs per Mcfe | | $ | 2.22 | | | $ | 1.99 | | | | (0.23 | ) | | | (11%) | |
Operating expenses increased by $12.8 million, or 27%, from $46.7 million, or $1.15 per Mcfe, in 2007 to $59.5 million, or $1.27 per Mcfe, in 2008. This increase isprimarily due primarily to increased compressor rentals in East Texas and in the Mid-Continent region related to increased production and capital expenditures in those regions; increased repairs and maintenance expenses in the Mississippi, Mid-Continent and East Texas regions; and new processing fees related to the Crossroads plant, which began operations in the second quarter of 2008.
Taxes other than income increased, by $5.5 million, or 31%, from $17.8 million in 2007 to $23.3 million in 2008, primarily due to an increase in severance and ad valorem taxes related to higher commodity prices and increased production.
General and administrative expenses increased by $5.0 million, or 31%, from $16.3 million in 2007 to $21.3 million in 2008, primarily due to increased staffing costs in the East Texas and Mid-Continent regions.
ExplorationThe following table sets forth the components of exploration expenses infor the years ended December 31, 2008 and 2007 consisted of the following:
periods presented: | | | | Year Ended
December 31, | | | | | | | | |
| | | 2008 | | 2007 | | Year Ended December 31, | | Favorable
(Unfavorable) | | |
| | | (in thousands) | | 2008 | | 2007 | | % Change |
Dry hole costs | | $ | 14,435 | | $ | 11,689 | | $ | 14,435 | | | $ | 11,689 | | | $ | (2,746 | ) | | | (23%) | |
Geological and geophysical | | | 4,171 | | | 2,769 | | | 4,171 | | | | 2,769 | | | | (1,402 | ) | | | (51%) | |
Unproved leasehold | | | 21,412 | | | 13,036 | | | 21,412 | | | | 13,036 | | | | (8,376 | ) | | | (64%) | |
Other | | | 2,418 | | | 1,114 | | | 2,418 | | | | 1,114 | | | | (1,304 | ) | | | (117%) | |
| | | | | | $ | 42,436 | | | $ | 28,608 | | | $ | (13,828 | ) | | | (48%) | |
Total | | $ | 42,436 | | $ | 28,608 | |
| | | | | |
Exploration expenses increased by $13.8 million, or 48%, from $28.6 million in 2007 to $42.4 million in 2008. In 2008, the dry hole costs were primarily due to the write-off of six wells in the Appalachian region, which were non-economic. In 2007, the dry hole costs were primarily due to the write-off of three exploratory wells in the Gulf Coast region and one exploratory well in the East Texas region in 2007.region. Geological and geophysical expenses increased due to seismic expenses incurred primarily in East Texas and South Louisiana, which was driven by increased growth of drilling prospects. Unproved leasehold expenses increased primarily due to the abandonment of property in the Mid-Continent and Appalachian regions. Other expenses increased due to increased delay rentals in the Gulf Coast region primarily related to lease renewals on certain prospects.
We recorded $20.0 million of impairment charges in 2008 related to declines in spot
Depreciation, Depletion and future oil and gas prices which reduced the estimated reserve bases of fields on certain properties in the Mid-Continent and Appalachian regions. These changes in reserve estimates in 2008 were primarily due to a decrease in fourth quarter oil and gas prices and a decline in well performance. We recorded $2.6 million of impairment charges in 2007 related to changes in estimates of the reserve bases of fields on certain properties in the Gulf Coast and Mid-Continent regions. These changes in reserve estimates were primarily due to declines in well performance.Amortization
DD&A expenses increased by $45.1 million, or 52%, from $87.2 million in 2007 to $132.3 million in the same period of 2008, primarily due to the increase in equivalent production and higher depletion rates. Our average depletion rate increased by $0.67 per Mcfe, or 31%, from $2.15 per Mcfe in 2007 to $2.82 per Mcfe in 2008 due to increased drilling costs in the East Texas and Mid-Continent regions and revisions in reserve estimates. The higher drilling costs were due primarily to increased drilling rig day rates and increased steel costs.
Impairments
Year Ended December 31, 2007 Compared With Year Ended December 31, 2006
The following table sets forth a summary of certain financialImpairment charges in 2008 related to declines in spot and other data for ourfuture oil and gas segment andprices which reduced the percentage change for the years ended December 31, 2007 and 2006:
| | | | | | | | | | | | | | | | |
| | | Year Ended
December 31, | | | %
Change | | | Year Ended
December 31, |
| | | 2007 | | 2006 | | | | 2007 | | 2006 |
| | | (in thousands, except as
noted) | | | | | | (per Mcfe) (1) |
Financial Highlights | | | | | | | | | | | | | | | | |
Revenues | | | | | | | | | | | | | | | | |
Natural gas | | $ | 262,169 | | $ | 212,919 | | | 23 | % | | $ | 6.94 | | $ | 7.35 |
Crude oil | | | 22,439 | | | 17,634 | | | 27 | % | | | 69.04 | | | 61.23 |
NGL | | | 5,678 | | | 3,603 | | | 58 | % | | | 41.75 | | | 38.33 |
Gain (loss) on the sale of property and equipment | | | 12,235 | | | (234 | ) | | 5329 | % | | | | | | |
Other income | | | 720 | | | 2,034 | | | (65 | )% | | | | | | |
| | | | | | | | | | | | | | | | |
Total revenues | | | 303,241 | | | 235,956 | | | 29 | % | | | 7.47 | | | 7.55 |
| | | | | | | | | | | | | | | | |
| | | | | |
Expenses | | | | | | | | | | | | | | | | |
Operating | | | 46,713 | | | 27,403 | | | 70 | % | | | 1.15 | | | 0.88 |
Taxes other than income | | | 17,847 | | | 11,810 | | | 51 | % | | | 0.44 | | | 0.38 |
General and administrative | | | 16,281 | | | 12,826 | | | 27 | % | | | 0.40 | | | 0.41 |
| | | | | | | | | | | | | | | | |
Production costs | | | 80,841 | | | 52,039 | | | 55 | % | | | 1.99 | | | 1.67 |
Exploration | | | 28,608 | | | 34,330 | | | (17 | )% | | | 0.71 | | | 1.10 |
Impairments | | | 2,586 | | | 8,517 | | | (70 | )% | | | 0.06 | | | 0.27 |
Depreciation, depletion and amortization | | | 87,223 | | | 56,237 | | | 55 | % | | | 2.15 | | | 1.80 |
| | | | | | | | | | | | | | | | |
Total expenses | | | 199,258 | | | 151,123 | | | 32 | % | | | 4.91 | | | 4.84 |
| | | | | | | | | | | | | | | | |
Operating income | | $ | 103,983 | | $ | 84,833 | | | 23 | % | | $ | 2.56 | | $ | 2.71 |
| | | | | | | | | | | | | | | | |
| | | | | |
Production | | | | | | | | | | | | | | | | |
Natural gas (MMcf) | | | 37,802 | | | 28,968 | | | 30 | % | | | | | | |
Crude oil (MBbl) | | | 325 | | | 288 | | | 13 | % | | | | | | |
NGL (MBbl) | | | 136 | | | 94 | | | 45 | % | | | | | | |
| | | | | | | | | | | | | | | | |
Total production (MMcfe) | | | 40,569 | | | 31,260 | | | 30 | % | | | | | | |
| | | | | | | | | | | | | | | | |
| (1) | Natural gas revenues are shown per Mcf, crude oil and NGL revenues are shown per Bbl, and all other amounts are shown per Mcfe. |
Production. Approximately 93%estimated reserve bases of production in 2007 and 2006 was natural gas. Total production increased by 9.3 Bcfe, or 30%, from 31.3 Bcfe in 2006 to 40.6 Bcfe in 2007 primarily due to increased productionfields on certain properties in the East Texas, Mid-Continent Mississippi and Gulf Coast regions, partially offset by decreased productionAppalachian regions. These
TABLE OF CONTENTS
changes in the Appalachian region.
The following table summarizes total natural gas, crude oil and NGL production and total natural gas, crude oil and NGL revenues by region for the years ended December 31, 2007 and 2006:
| | | | | | | | | | |
| | | Natural Gas, Crude
Oil and NGL
Production | | Natural Gas, Crude
Oil and NGL
Revenues |
| | | Year Ended
December 31, | | Year Ended
December 31, |
Region | | 2007 | | 2006 | | 2007 | | 2006 |
| | | (MMcfe) | | (in thousands) |
East Texas | | 7,986 | | 4,546 | | $ | 59,333 | | $ | 33,656 |
Mid-Continent | | 4,129 | | 1,248 | | | 24,980 | | | 7,420 |
Appalachia | | 12,426 | | 12,759 | | | 86,936 | | | 96,683 |
Mississippi | | 7,551 | | 6,411 | | | 53,737 | | | 47,801 |
Gulf Coast | | 8,477 | | 6,296 | | | 65,300 | | | 48,596 |
| | | | | | | | | | |
Total | | 40,569 | | 31,260 | | $ | 290,286 | | $ | 234,156 |
| | | | | | | | | | |
We drilled a total of 289 gross (213.0 net) wells during 2007, including 271 gross (203.6 net) development wells and 18 gross (9.4 net) exploratory wells. All wellsreserve estimates in 2008 were successful except six gross (5.1 net) development wells and seven gross (4.2 net) exploratory wells, with four (2.6 net) wells under evaluation as of December 31, 2007.
The increased production in the East Texas region was due primarily to aggressive drilling and development in the region, as well as contributions from acquisitions in the region in 2007. The increase in production in the Mid-Continent
region is due primarily to the development program in this region and due to contributions resulting from an acquisition in the Arkoma Basin. Production in the Appalachian region remained relatively constant from 2006 to 2007. The increase in production in the Mississippi region is due primarily to the development program in this region, which included contributions from two wells that were drilled horizontally in late 2006 and early 2007, as well as contributions from two acquisitions in the Gwinville Field. The increase in production in the Gulf Coast region is due primarily to exploration successes in South Louisiana.
Revenues. Natural gas revenues increased by $49.3 million, or 23%, from $212.9 million in 2006 to $262.2 million in 2007. Of the $49.3 million increase, $64.9 million was the result of increased natural gas production, partially offset by a $15.6 million decrease resulting from lower realized prices for natural gas. Our average realized price received for natural gas decreased by $0.41 per Mcf, or 6%, from $7.35 per Mcf in 2006 to $6.94 per Mcf in 2007.
Crude oil revenues increased by $4.8 million, or 27%, from $17.6 million in 2006 to $22.4 million in 2007. Of the $4.8 million increase, $2.5 million was the result of higher realized prices for crude oil and $2.3 million was the result of increased crude oil production. Our average realized price received for crude oil increased by $7.81 per Bbl, or 13%, from $61.23 per Bbl in 2006 to $69.04 per Bbl in 2007.
NGL revenues increased by $2.1 million, or 58%, from $3.6 million in 2006 to $5.7 million in 2007. Of the $2.1 million increase, $1.6 million was the result of increased NGL production and $0.5 million was the result of higher realized prices for NGLs. Our average realized price received for NGLs increased by $3.42 per Bbl, or 9%, from $38.33 per Bbl to $41.75 per Bbl in 2007.
Effects of Derivatives
For the derivatives related to the oil and gas segment, we received cash settlements of $14.1 million and $10.5 million in 2007 and 2006. The following table reconciles natural gas and crude oil revenues to realized prices, as adjusted for derivative activities for the years ended December 31, 2008 and 2007:
| | | | | | | | | | | | | | | | |
| | | Year Ended December 31, | |
| | | 2007 | | | 2006 | | | 2007 | | | 2006 | |
| | | (in thousands) | | | (per Mcf) | |
Natural gas revenues, as reported | | $ | 262,169 | | | $ | 212,919 | | | $ | 6.94 | | | $ | 7.35 | |
Derivatives gains included in natural gas revenues (1) | | | (222 | ) | | | (448 | ) | | | (0.01 | ) | | | (0.02 | ) |
| | | | | | | | | | | | | | | | |
Natural gas revenues before impact of derivatives | | | 261,947 | | | | 212,471 | | | | 6.93 | | | | 7.33 | |
Cash settlements on natural gas derivatives (2) | | | 14,863 | | | | 10,711 | | | | 0.39 | | | | 0.37 | |
| | | | | | | | | | | | | | | | |
Natural gas revenues, adjusted for derivatives | | $ | 276,810 | | | $ | 223,182 | | | $ | 7.32 | | | $ | 7.70 | |
| | | | | | | | | | | | | | | | |
| | |
| | | (in thousands) | | | (per Bbl) | |
Crude oil revenues, as reported | | $ | 22,439 | | | $ | 17,634 | | | $ | 69.04 | | | $ | 61.23 | |
Derivatives losses included in crude oil revenues (1) | | | 502 | | | | 457 | | | | 1.54 | | | | 1.59 | |
| | | | | | | | | | | | | | | | |
Crude oil revenues before impact of derivatives | | | 22,941 | | | | 18,091 | | | | 70.58 | | | | 62.82 | |
Cash settlements on crude oil derivatives (2) | | | (735 | ) | | | (222 | ) | | | (2.26 | ) | | | (0.77 | ) |
| | | | | | | | | | | | | | | | |
Crude oil revenues, adjusted for derivatives | | $ | 22,206 | | | $ | 17,869 | | | $ | 68.32 | | | $ | 62.05 | |
| | | | | | | | | | | | | | | | |
| (1) | As a result of the original forecasted transactions settling, we reclassified the remaining amounts in accumulated other comprehensive income to earnings in 2007. As a result, in 2008, no derivatives gains or losses were reported as part of natural gas, crude oil and NGL revenues. |
| (2) | As a result of the original forecasted transactions settling, we mark-to-market our derivative positions and record these gains or losses on the derivatives line on the Consolidated Statements of Income in Item 8, “Financial Statements and Supplementary Data.” These cash settlements relate to those derivative gains or losses. Had we not elected to discontinue hedge accounting on our commodity derivatives in 2006, these cash settlements would have been recognized in the natural gas and crude oil revenues lines on our consolidated statements of income. |
Gain on sale of property and equipment. In 2007, we recognized a $12.2 million gain on the sale property and equipment primarily related to the September 2007 sale of non-operated working interests in oil and gas properties.
Other income. Other income decreased by $1.3 million, or 65%, from $2.0 million in 2006 to 0.7 million in 2007. This decrease is primarily due to an increase in fees paid by us to PVR for marketing our natural gas. This fee arrangement began in September 2006, and the increase in the fee was due primarily to a full year of the fee in 2007, as well as an increase in production in the East Texas and Mid-Continent regions.
Expenses. Aggregate operating costs and expenses increased by $48.2 million, or 32%, from $151.1 million in 2006 to $199.3 million in 2007 primarily due to increases in operating expenses, taxes other than income, general and administrative expenses and DD&A expenses, partially offset by a decrease in exploration expenses and the impairment of properties.
Operating expenses increased by $19.3 million, or 70%, from $27.4 million, or $0.88 per Mcfe, in 2006 to $46.7 million, or $1.15 per Mcfe, in 2007. In addition to a general increase in oilfield service costs and activity in all operating areas, the increase was due to the 30% production increase and additional expenses in a number of operating areas related to workovers, water disposal, gathering, compression and maintenance.
Taxes other than income increased by $6.0 million, or 51%, from $11.8 million in 2006 to $17.8 million in 2007 primarily due to the 24% increase in natural gas, crude oil and NGL revenues and a severance tax credit received in 2006 related to production in the Cotton Valley play in East Texas and property tax adjustments in West Virginia.
General and administrative expenses increased by $3.5 million, or 27%, from $12.8 million in 2006 to $16.3 million in 2007 primarily due to an expansion of operations across the oil and gas segment, increased drilling activity and acquisitions, increased consulting costs and increased staffing and benefits costs. General and administrative costs, on a Mcfe basis, remained relatively constant at $0.40 in 2007 compared with $0.41 in 2006.
DD&A expenses increased by $31.0 million, or 55%, from $56.2 million in 2006 to $87.2 million in 2007 primarily due to the 30% increase in equivalent production and higher depletion rates. Our average depletion rate increased from $1.80 per Mcfe in 2006 to $2.15 per Mcfe in 2007 primarily due to increased development costs and the sale of and reduced contributions from properties with lower depletion rates.
Exploration expenses in the years ended December 31, 2007 and 2006 consisted of the following:
| | | | | | |
| | | Year Ended
December 31, |
| | | 2007 | | 2006 |
| | | (in thousands) |
Dry hole costs | | $ | 11,689 | | $ | 15,178 |
Geological and geophysical | | | 2,769 | | | 6,237 |
Unproved leasehold | | | 13,036 | | | 9,410 |
Other | | | 1,114 | | | 3,505 |
| | | | | | |
Total | | $ | 28,608 | | $ | 34,330 |
| | | | | | |
Exploration expenses decreased by $5.7 million, or 17%, from $34.3 million in 2006 to $28.6 million in 2007 primarily due to decreases in dry hole costs and geological and geophysical costs, partially offset by an increase in unproved leasehold expenses. Dry hole costs decreased primarily due to write-offs of three exploratory wells in 2007 compared to eight wells in 2006. Geological and geophysical expenses decreased primarily due to a decrease in core-hole drilling, asfourth quarter oil and gas prices and a decline in well as a reduction in seismic purchases. Unproved leasehold expenses increased primarily due to a $2.7 million write-off of a prospect in the Williston Basin. Other costs decreased primarily due to a decrease in delay rental payments. In 2006, we incurred $1.8 million of delay rent charges caused by drilling delays in Louisiana.
We recorded $2.6 million of impairmentperformance. Impairment charges in 2007 related to changes in estimates of the reserve bases of fields on certain properties in Oklahomathe Gulf Coast and Texas. We recorded $8.5 million of impairment charges in 2006 related to changes in estimates of reserve bases of certain fields in Louisiana, Texas and West Virginia.Mid-Continent regions. These changes in reserve estimates were primarily due to declines in well performance.
PVR Coal and Natural Resource Management Segment
Year Ended December 31, 20082009 Compared With Year Ended December 31, 2007
2008The following table sets forth a summary of certain financial and other data for the PVR coal and natural resource management segment and the percentage change for the years ended December 31, 2008 and 2007:
periods presented: | | | | | | | | | | | | | | |
| | | Year Ended December 31, | | %
Change | | | Year Ended December 31, | | Favorable
(Unfavorable) | | |
| | | 2008 | | 2007 | | | 2009 | | 2008 | | % Change |
| | | (in thousands, except as
noted) | | |
Financial Highlights | | | | | | | |
Revenues | | | | | | | | | | | | | | | | | | | | | | |
Coal royalties | | $ | 122,834 | | | $ | 94,140 | | | 30 | % | | $ | 120,435 | | | $ | 122,834 | | | $ | (2,399 | ) | | | (2%) | |
Coal services | | | 7,355 | | | | 7,252 | | | 1 | % | | | 7,332 | | | | 7,355 | | | | (23 | ) | | | (0%) | |
Timber | | | 6,943 | | | | 1,711 | | | 306 | % | | | 5,726 | | | | 6,943 | | | | (1,217 | ) | | | (18%) | |
Oil and gas royalty | | | 5,989 | | | | 1,864 | | | 221 | % | | | 2,471 | | | | 5,989 | | | | (3,518 | ) | | | (59%) | |
Other | | | 10,206 | | | | 6,672 | | | 53 | % | | | 8,636 | | | | 10,206 | | | | (1,570 | ) | | | (15%) | |
| | | | | | | | | |
Total revenues | | | 153,327 | | | | 111,639 | | | 37 | % | | | 144,600 | | | | 153,327 | | | | (8,727 | ) | | | (6%) | |
| | | | | | | | | |
| Expenses | | | | | | | | | | | | | | | | | | | | | | |
Coal royalties expense | | | 9,534 | | | | 5,540 | | | 72 | % | |
| Coal royalties | | | | 5,768 | | | | 9,534 | | | | 3,766 | | | | 40% | |
Other operating | | | 2,406 | | | | 2,531 | | | (5 | )% | | | 2,892 | | | | 2,406 | | | | (486 | ) | | | (20%) | |
Taxes other than income | | | 1,680 | | | | 1,110 | | | 51 | % | | | 1,704 | | | | 1,680 | | | | (24 | ) | | | (1%) | |
General and administrative | | | 12,606 | | | | 10,957 | | | 15 | % | | | 13,867 | | | | 12,606 | | | | (1,261 | ) | | | (10%) | |
| Impairments | | | | 1,511 | | | | — | | | | (1,511 | ) | | | n/a | |
Depreciation, depletion and amortization | | | 30,805 | | | | 22,690 | | | 36 | % | | | 31,330 | | | | 30,805 | | | | (525 | ) | | | (2%) | |
| Total expenses | | | | 57,072 | | | | 57,031 | | | | (41 | ) | | | (0%) | |
| Operating income | | | $ | 87,528 | | | $ | 96,296 | | | $ | (8,768 | ) | | | (9%) | |
Coal royalty tons by region
| | | | | | | | | | | | | | | | | |
| Central Appalachia | | | | 18,319 | | | | 19,587 | | | | (1,268 | ) | | | (6%) | |
| Northern Appalachia | | | | 3,786 | | | | 3,578 | | | | 208 | | | | 6% | |
| Illinois Basin | | | | 4,724 | | | | 4,584 | | | | 140 | | | | 3% | |
| San Juan Basin | | | | 7,501 | | | | 5,941 | | | | 1,560 | | | | 26% | |
| Total | | | | 34,330 | | | | 33,690 | | | | 640 | | | | 2% | |
Coal royalties revenue by region
| | | | | | | | | | | | | | | | | |
| Central Appalachia | | | $ | 85,183 | | | $ | 93,577 | | | $ | (8,394 | ) | | | (9%) | |
| Northern Appalachia | | | | 6,931 | | | | 6,568 | | | | 363 | | | | 6% | |
| Illinois Basin | | | | 12,420 | | | | 10,451 | | | | 1,969 | | | | 19% | |
| San Juan Basin | | | | 15,901 | | | | 12,238 | | | | 3,663 | | | | 30% | |
| | | | | | | | | | $ | 120,435 | | | $ | 122,834 | | | $ | (2,399 | ) | | | (2%) | |
Total expenses | | | 57,031 | | | | 42,828 | | | 33 | % | |
| Less coal royalties expenses(1) | | | | (5,768 | ) | | | (9,534 | ) | | | 3,766 | | | | (40%) | |
| Net coal royalties revenues | | | $ | 114,667 | | | $ | 113,300 | | | $ | 1,367 | | | | 1% | |
Coal royalties per ton by region ($/ton)
| | | | | | | | | | | | | | | | | |
| Central Appalachia | | | $ | 4.65 | | | $ | 4.78 | | | $ | (0.13 | ) | | | (3%) | |
| Northern Appalachia | | | | 1.83 | | | | 1.84 | | | | (0.01 | ) | | | (1%) | |
| Illinois Basin | | | | 2.63 | | | | 2.28 | | | | 0.35 | | | | 15% | |
| San Juan Basin | | | | 2.12 | | | | 2.06 | | | | 0.06 | | | | 3% | |
| | | | | | | | | | | 3.51 | | | | 3.65 | | | $ | (0.14 | ) | | | (4%) | |
| Operating income | | $ | 96,296 | | | $ | 68,811 | | | 40 | % | |
| | | | | | | | | |
| Operating Statistics | | | | | | | |
Royalty coal tons produced by lessees (tons in thousands) | | | 33,690 | | | | 32,528 | | | 4 | % | |
| Average royalties revenues per ton ($/ton) | | $ | 3.65 | | | $ | 2.89 | | | 26 | % | |
Less royalties expense per ton ($/ton) | | | (0.28 | ) | | | (0.17 | ) | | 65 | % | |
| | | | | | | | | |
Average net coal royalties per ton ($/ton) | | $ | 3.37 | | | $ | 2.72 | | | 24 | % | |
| | | | | | | | | |
| Less coal royalties expenses(1) | | | | (0.17 | ) | | | (0.28 | ) | | | 0.11 | | | | (39%) | |
| Net coal royalties revenues | | | $ | 3.34 | | | $ | 3.37 | | | $ | (0.03 | ) | | | (1%) | |
Revenues. Coal royalties revenues increased by $28.7 million, or 30%, from $94.1 million in 2007 to $122.8 million in 2008 primarily due to increased production in the Central Appalachian and Illinois Basin regions and increased sales prices in those regions. Coal royalties expense increased by $4.0 million, or 72%, from $5.5 million in 2007 to $9.5 million in 2008, primarily due to the increase in production on PVR’s subleased property in the Central Appalachian region and is due to higher average sales prices for coal in the Central Appalachian region. The average net coal royalty per ton, which represents the average coal royalties revenue per ton, net of coal royalties expense, increased by $0.65 per ton, or 24%, from $2.72 per ton in 2007 to $3.37 per ton in 2008. The increase in average net coal royalty per ton was due primarily to the higher royalty revenues per ton received by PVR’s lessees in the region. The increase in royalty revenues per ton received in Central Appalachia was due primarily to both increased coal production and higher average sales prices for coal in that region.
The following table summarizes coal production, coal royalties revenues and coal royalties per ton by region for the years ended December 31, 2008 and 2007:
| | | | | | | | | | | | | | | | | | | | |
| | | Coal Production | | Coal Royalties
Revenues | | | Coal Royalties
Per Ton | |
| | | Year Ended
December 31, | | Year Ended
December 31, | | | Year Ended
December 31, | |
Region | | 2008 | | 2007 | | 2008 | | | 2007 | | | 2008 | | | 2007 | |
| | | (tons in thousands) | | (in thousands) | | | ($/ton) | |
Central Appalachia | | 19,587 | | 18,827 | | $ | 93,577 | | | $ | 68,815 | | | $ | 4.78 | | | $ | 3.66 | |
Northern Appalachia | | 3,578 | | 4,194 | | | 6,568 | | | | 6,434 | | | | 1.84 | | | | 1.53 | |
Illinois Basin | | 4,584 | | 3,779 | | | 10,451 | | | | 7,432 | | | | 2.28 | | | | 1.97 | |
San Juan Basin | | 5,941 | | 5,728 | | | 12,238 | | | | 11,459 | | | | 2.06 | | | | 2.00 | |
| | | | | | | | | | | | | | | | | | | | |
Total | | 33,690 | | 32,528 | | $ | 122,834 | | | $ | 94,140 | | | $ | 3.65 | | | $ | 2.89 | |
| | | | | | | | | | | | | | | | | | | | |
Less coal royalties expense (1) | | | | | | | (9,534 | ) | | | (5,540 | ) | | | (0.28 | ) | | | (0.17 | ) |
| | | | | | | | | | | | | | | | | | | | |
Net coal royalties revenues | | | | | | $ | 113,300 | | | $ | 88,600 | | | $ | 3.37 | | | $ | 2.72 | |
| | | | | | | | | | | | | | | | | | | | |
| (1) | PVR’s coal royalties expense is incurred primarily in the Central Appalachian region. |
Revenues
Coal royalties revenues decreased slightly due to the decrease in the average coal royalty received per ton. This decrease was due to an overall shift in production mix to lower royalty lessees, primarily to fixed rate leases in the San Juan Basin from the higher royalty Central Appalachian region.
TABLE OF CONTENTS
Coal production by PVR’s lessees increased slightly due to higher production in the San Juan Basin resulting from the start up of a second mine and improved mining conditions. This increase was partially offset by a decline in production in the Central Appalachian region increased by 0.8 million tons, or 4%, from 18.8 million tons in 2007 to 19.6 million tons in 2008. This increasewhich was due primarily to a reduction in longwall mining activity and the timing of mining equipment addeda depressed coal market.
Timber revenues decreased due to PVR’s properties in that region during 2008. Coal production in the Northern Appalachian regionlower sales prices resulting from weakened market conditions for furniture-grade wood products. The average price received by PVR for timber decreased by 0.6 million tons, or 15%,27% from 4.2 million tons in 2007 to 3.6 million tons in 2008. This decrease was due primarily to adverse longwall mining conditions. Coal production in the Illinois Basin region increased by 0.8 million tons, or 21%, from 3.8 million tons in 2007 to 4.6 million tons in 2008. This increase was due primarily to a full year of production$287 per Mbf in 2008 on the coal reserves that were acquiredto $209 per Mbf in June 2007. Coal production in the San Juan Basin region remained relatively constant from 2007 to 2008.2009.
Coal services revenues remained relatively constant from 2007 to 2008. Timber revenues increased by $5.2 million, or 306%, from $1.7 million in 2007 to $6.9 million in 2008 primarily due to increased harvesting from PVR’s September 2007 forestland acquisition. OilThe oil and gas royalty revenues increased by $4.1 million, or 221%,decrease was primarily attributable to lower natural gas prices in 2009. Realized prices received for natural gas decreased 57% from $1.9 million in 2007 to $6.0 million$10.63 per Mcf in 2008 to $4.55 per Mcf in 2009.
Other revenues, which consisted primarily of wheelage fees, forfeiture income and management fees, decreased due to the increased royalties resultinglower wheelage income from PVR’s October 2007 oil and gas royalty interest acquisition. Other revenues increased by $3.5 million, or 53%, from $6.7 milliona decline in 2007 to $10.2 millioncoal production in 2008, primarily due to increased coal transportation, or wheelage, fees attributable to better longwall production and an increasecertain areas. In addition, in sales prices in 2008, increased forfeiture income and a $0.8 million gain on the settlement of sterilized coal.unmined coal was recognized.
Expenses
Expenses. Other operatingCoal royalties expenses remained relatively constant from 2007 to 2008. Taxes other than income increased by $0.6 million, or 51%, from $1.1 million in 2007 to $1.7 million in 2008, primarilydecreased due to increased severance taxes resultinga decline in mining activity by PVR’s lessees from subleased properties in the Central Appalachian region where PVR’s September 2007 forestland acquisitioncoal royalties expense is primarily incurred. Mining activity on PVR’s subleased property fluctuates between periods due to the proximity of PVR’s property boundaries and October 2007 oil and gas royalty interest acquisition. other mineral owners.
General and administrative expenses increased by $1.6 million, or 15%,as a result of an uncollectible account receivable resulting from $11.0 million in 2007 to $12.6 million in 2008, primarily due toa PVR lessee bankruptcy and increased staffing and related benefit costs.
The $1.5 million impairment expense in 2009 was the result of a reduction in the value of an intangible asset. PVR tests long-lived assets for impairment if a triggering event occurs and the impairment was triggered by a wheelage contract being rejected in bankruptcy. As a result of the impairment, the fair value of the contract has been reduced to zero.
DD&A expenses increased by $8.1 million, or 36%, from $22.7 million in 2007 to $30.8 million in 2008 primarilyslightly due to increasedhigher depletion expense resulting from the increase in coal mined from PVR’s September 2007 forestland acquisition, October 2007 oil and gas royalty interest acquisition and May 2008 coal reserves and forestland acquisition.properties by its lessees. On a per ton basis, DD&A remained constant at $0.91 per ton for both periods.
TABLE OF CONTENTS
Year Ended December 31, 20072008 Compared With Year Ended December 31, 20062007
The following table sets forth a summary of certain financial and other data for the PVR coal and natural resource management segment and the percentage change for the years ended December 31, 2007 and 2006:
periods presented: | | | | | | | | | | | | | | |
| | | Year Ended December 31, | | %
Change | | | Year Ended December 31, | | Favorable
(Unfavorable) | | |
| | | 2007 | | 2006 | | | 2008 | | 2007 | | % Change |
| | | (in thousands, except as
noted) | | |
Financial Highlights | | | | | | | |
Revenues | | | | | | | | | | | | | | | | | | | | | | |
Coal royalties | | $ | 94,140 | | | $ | 98,163 | | | (4 | )% | | $ | 122,834 | | | $ | 94,140 | | | $ | 28,694 | | | | 30% | |
Coal services | | | 7,252 | | | | 5,864 | | | 24 | % | | | 7,355 | | | | 7,252 | | | | 103 | | | | 1% | |
Timber | | | 1,711 | | | | 1,024 | | | 67 | % | | | 6,943 | | | | 1,711 | | | | 5,232 | | | | 306% | |
Oil and gas royalty | | | 1,864 | | | | 957 | | | 95 | % | | | 5,989 | | | | 1,864 | | | | 4,125 | | | | 221% | |
Other | | | 6,672 | | | | 6,973 | | | (4 | )% | | | 10,206 | | | | 6,672 | | | | 3,534 | | | | 53% | |
| | | | | | | | | |
Total revenues | | | 111,639 | | | | 112,981 | | | (1 | )% | | | 153,327 | | | | 111,639 | | | | 41,688 | | | | 37% | |
| | | | | | | | | |
| Expenses | | | | | | | | | | | | | | | | | | | | | | |
Coal royalties | | | 5,540 | | | | 6,927 | | | (20 | )% | | | 9,534 | | | | 5,540 | | | | (3,994 | ) | | | (72%) | |
Other operating | | | 2,531 | | | | 1,673 | | | 51 | % | | | 2,406 | | | | 2,531 | | | | 125 | | | | 5% | |
Taxes other than income | | | 1,110 | | | | 934 | | | 19 | % | | | 1,680 | | | | 1,110 | | | | (570 | ) | | | (51%) | |
General and administrative | | | 10,957 | | | | 9,604 | | | 14 | % | | | 12,606 | | | | 10,957 | | | | (1,649 | ) | | | (15%) | |
Depreciation, depletion and amortization | | | 22,690 | | | | 20,399 | | | 11 | % | | | 30,805 | | | | 22,690 | | | | (8,115 | ) | | | (36%) | |
| Total expenses | | | | 57,031 | | | | 42,828 | | | | (14,203 | ) | | | (33%) | |
| Operating income | | | $ | 96,296 | | | $ | 68,811 | | | $ | 27,485 | | | | 40% | |
Coal royalty tons by region
| | | | | | | | | | | | | | | | | |
| Central Appalachia | | | | 19,587 | | | | 18,827 | | | | 760 | | | | 4% | |
| Northern Appalachia | | | | 3,578 | | | | 4,194 | | | | (616 | ) | | | (15%) | |
| Illinois Basin | | | | 4,584 | | | | 3,779 | | | | 805 | | | | 21% | |
| San Juan Basin | | | | 5,941 | | | | 5,728 | | | | 213 | | | | 4% | |
| Total | | | | 33,690 | | | | 32,528 | | | | 1,162 | | | | 4% | |
Coal royalties revenue by region
| | | | | | | | | | | | | | | | | |
| Central Appalachia | | | $ | 93,577 | | | $ | 68,815 | | | $ | 24,762 | | | | 36% | |
| Northern Appalachia | | | | 6,568 | | | | 6,434 | | | | 134 | | | | 2% | |
| Illinois Basin | | | | 10,451 | | | | 7,432 | | | | 3,019 | | | | 41% | |
| San Juan Basin | | | | 12,238 | | | | 11,459 | | | | 779 | | | | 7% | |
| | | | | | | | | | $ | 122,834 | | | $ | 94,140 | | | $ | 28,694 | | | | 30% | |
Total expenses | | | 42,828 | | | | 39,537 | | | 8 | % | |
| Less coal royalties expenses(1) | | | | (9,534 | ) | | | (5,540 | ) | | | (3,994 | ) | | | 72% | |
| Net coal royalties revenues | | | $ | 113,300 | | | $ | 88,600 | | | $ | 24,700 | | | | 28% | |
Coal royalties per ton by region ($/ton)
| | | | | | | | | | | | | | | | | |
| Central Appalachia | | | $ | 4.78 | | | $ | 3.66 | | | $ | 1.12 | | | | 31% | |
| Northern Appalachia | | | | 1.84 | | | | 1.53 | | | | 0.31 | | | | 20% | |
| Illinois Basin | | | | 2.28 | | | | 1.97 | | | | 0.31 | | | | 16% | |
| San Juan Basin | | | | 2.06 | | | | 2.00 | | | | 0.06 | | | | 3% | |
| | | | | | | | | | | 3.65 | | | | 2.89 | | | $ | 0.76 | | | | 26% | |
| Operating income | | $ | 68,811 | | | $ | 73,444 | | | (6 | )% | |
| | | | | | | | | |
| Operating Statistics | | | | | | | |
Royalty coal tons produced by lessees (tons in thousands) | | | 32,528 | | | | 32,778 | | | (1 | )% | |
| Average royalties revenues per ton ($/ton) | | $ | 2.89 | | | $ | 2.99 | | | (3 | )% | |
Less royalties expense per ton ($/ton) | | $ | (0.17 | ) | | $ | (0.21 | ) | | (19 | )% | |
| | | | | | | | | |
Average net coal royalties per ton ($/ton) | | $ | 2.72 | | | $ | 2.78 | | | (2 | )% | |
| | | | | | | | | |
| Less coal royalties expenses(1) | | | | (0.28 | ) | | | (0.17 | ) | | | (0.11 | ) | | | 65% | |
| Net coal royalties revenues | | | $ | 3.37 | | | $ | 2.72 | | | $ | 0.65 | | | | 24% | |
Revenues. Coal royalties revenues decreased by $4.1 million, or 4%, from $98.2 million in 2006 to $94.1 million in 2007, primarily due to a lower average royalty per ton. Coal royalties expense decreased by $1.4 million, or 20%, from $6.9 million in 2006 to $5.5 million in 2007 primarily due to a decrease in production from subleased properties in the Central Appalachian region. The average net coal royalty per ton, which represents the average coal royalties revenue per ton, net of coal royalties expense, remained relatively constant from 2006 to 2007.
The following table summarizes coal production, coal royalties revenues and coal royalties per ton by region for the years ended December 31, 2007 and 2006:
| | | | | | | | | | | | | | | | | | | | |
| | | Coal Production | | Coal Royalties
Revenues | | | Coal Royalties
Per Ton | |
| | | Year Ended
December 31, | | Year Ended
December 31, | | | Year Ended
December 31, | |
Region | | 2007 | | 2006 | | 2007 | | | 2006 | | | 2007 | | | 2006 | |
| | | (tons in thousands) | | (in thousands) | | | ($/ton) | |
Central Appalachia | | 18,827 | | 20,156 | | $ | 68,815 | | | $ | 76,542 | | | $ | 3.66 | | | $ | 3.80 | |
Northern Appalachia | | 4,194 | | 5,009 | | | 6,434 | | | | 7,314 | | | | 1.53 | | | | 1.46 | |
Illinois Basin | | 3,779 | | 2,540 | | | 7,432 | | | | 4,768 | | | | 1.97 | | | | 1.88 | |
San Juan Basin | | 5,728 | | 5,073 | | | 11,459 | | | | 9,539 | | | | 2.00 | | | | 1.88 | |
| | | | | | | | | | | | | | | | | | | | |
Total | | 32,528 | | 32,778 | | $ | 94,140 | | | $ | 98,163 | | | $ | 2.89 | | | $ | 2.99 | |
| | | | | | | | | | | | | | | | | | | | |
Less coal royalties expense (1) | | | | | | | (5,540 | ) | | | (6,927 | ) | | | (0.17 | ) | | | (0.21 | ) |
| | | | | | | | | | | | | | | | | | | | |
Net coal royalties revenues | | | | | | $ | 88,600 | | | $ | 91,236 | | | $ | 2.72 | | | $ | 2.78 | |
| | | | | | | | | | | | | | | | | | | | |
| (1) | PVR’s coal royalties expense is incurred primarily in the Central Appalachian region. |
Revenues
Coal royalties revenues increased as a result of higher coal prices and additional tons being mined by PVR’s lessees. Coal royalty tons increased primarily due to higher production in PVR’sthe Central Appalachia and Illinois Basin regions, partially offset by a production decline in the Northern Appalachian region. The Central Appalachian region decreased by 1.4 million tons, or 7%, from 20.2 million tons in 2006increase was the result of longwall mining and the timing of additional mining equipment added to 18.8 million tons in 2007. This decreasePVR’s properties during 2008. The Illinois Basin region increase was due primarily to delays in the move of the longwall due to adverse mining conditions, the closinga full year of certain minesproduction in 2006 in PVR’s Central Appalachian region and permitting issues in the Central Appalachian region involving properties2008 on which PVR’s coal reserves are located. Coal productionwhich were acquired by PVR in PVR’s
June 2007. The Northern Appalachian region decreased by 0.8 million tons, or 16%, from 5.0 million tons in 2006 to 4.2 million tons in 2007. This decrease was due primarily to delays in the movea result of theadverse longwall mining conditions.
TABLE OF CONTENTS
Coal prices were higher on average due to development delays, as well asinternational coal shortages on both the depletion of reservesmetallurgical and steam markets, which not only drove increases in one mine.export metallurgical pricing, but also allowed some higher thermal capacity steam coal to crossover into the metallurgical market; consequently, this caused the domestic steam coal markets to tighten and resulted in higher domestic pricing. PVR’s coal royalties revenues are dependent on the prevailing coal prices received by its lessees, which are affected by numerous factors that are generally beyond PVR’s control. Coal production in PVR’s Illinois Basin region increasedprices are generally determined by 1.3 million tons, or 49%, from 2.5 million tons in 2006 to 3.8 million tons in 2007. This increase was due primarily to the June 2007 acquisition of coal reserves in Westernnational and Hopkins Counties, Kentucky. Coal production in PVR’s San Juan Basin region increased by 0.6 million tons, or 13%, from 5.1 million tons in 2006 to 5.7 million tons in 2007. This increase was due primarily to an increase in spot market orders of coal due to the depletion of adjacent reserves not owned by PVR.regional supply and demand.
Coal services revenues increased by $1.4 million, or 24%, from $5.9 million in 2006 to $7.3 million in 2007 primarily due to the completed construction of a coal services facility in Knott County, Kentucky, which began operations in October 2006. Timber revenues increased by $0.7 million, or 67%, from $1.0 million in 2006 to $1.7 million in 2007 primarily due to increased harvesting from PVR’s September 2007 forestland acquisition. OilThe average price received for timber increased 20% from $240 per Mbf in 2007 to $287 per Mbf in 2008.
The oil and gas royalty revenues increased by $0.9 million, or 95%, from $1.0 million in 2006 to $1.9 million in 2007increase was primarily due to the increased royalties resulting from PVR’s October 2007 oil and gas royalty interest acquisition. acquisition from us. Realized prices received for natural gas increased 31% from $8.11 per Mcf in 2007 to $10.63 per Mcf in 2008.
Other revenues which consisted primarily of wheelage fees, forfeiture income and management fee income, remained relatively constant from 2006 to 2007.
Expenses. Other operating expenses increased by $0.8 million, or 51%, from $1.7 million in 2006 to $2.5 million in 2007 primarily due to an increase in mine maintenance and core-hole drilling expenses on PVR’s Central Appalachian and Illinois Basin properties. General and administrative expenses increased by $1.4 million, or 14%, from $9.6 million in 2006 to $11.0 million in 2007 primarily due to increased staffing costs. DD&Acoal transportation, or wheelage, fees attributable to greater production, increased forfeiture income and the recognition of a $0.8 million gain on the settlement of unmined coal.
Expenses
Coal royalties expenses increased due to additional mining by $2.3 million, or 11%,PVR’s lessees from $20.4 millionsubleased properties in 2006 to $22.7 million in 2007the Central Appalachian region.
Taxes other than income increased primarily due to increased depletionseverance taxes resulting from PVR’s September 2007 forestland acquisition and October 2007 oil and gas royalty interest acquisition. In addition, PVR began depreciating its
General and administrative expenses increased primarily due to increased staffing and related benefit costs.
DD&A expenses increased due to increased depletion resulting from PVR’s September 2007 forestland acquisition, October 2007 oil and gas royalty interest acquisition and May 2008 coal services facilityreserves and forestland acquisition. A discussion of DD&A methodologies is provided in Knott County, Kentucky, which began operations in October 2006.the Critical Accounting Estimates that follows.
TABLE OF CONTENTS
PVR Natural Gas Midstream Segment
Year Ended December 31, 20082009 Compared With Year Ended December 31, 2007
2008The following table sets forth a summary of certain financial and other data for the PVR natural gas midstream segment and the percentage change for the years ended December 31, 2008 and 2007:
periods presented: | | | | | | | | | | | | | | |
| | | Year Ended
December 31, | | %
Change | | | Year Ended December 31, | | Favorable (Unfavorable) | | % Change |
| | | 2008 | | 2007 | | | 2009 | | 2008 |
| | | (in thousands, except as
noted) | | |
Financial Highlights | | | | | | | |
Revenues | | | | | | | | | | | | | | | | | | | | | | |
Residue gas | | $ | 452,535 | | | $ | 242,129 | | | 87 | % | | $ | 289,427 | | | $ | 452,535 | | | $ | (163,108 | ) | | | (36%) | |
Natural gas liquids | | | 229,765 | | | | 172,144 | | | 33 | % | | | 182,794 | | | | 229,765 | | | | (46,971 | ) | | | (20%) | |
Condensate | | | 26,009 | | | | 13,889 | | | 87 | % | | | 17,010 | | | | 26,009 | | | | (8,999 | ) | | | (35%) | |
Gathering, processing and transportation fees | | | 11,693 | | | | 5,012 | | | 133 | % | | | 15,558 | | | | 11,693 | | | | 3,865 | | | | 33% | |
| | | | | | | | | |
Total natural gas midstream revenues (1) | | | 720,002 | | | | 433,174 | | | 66 | % | | | 504,789 | | | | 720,002 | | | | (215,213 | ) | | | (30%) | |
Equity earnings in equity investment | | | 2,408 | | | | — | | | — | | | | 5,548 | | | | 2,408 | | | | 3,140 | | | | 130% | |
Producer services | | | 5,843 | | | | 4,632 | | | 26 | % | | | 1,767 | | | | 5,843 | | | | (4,076 | ) | | | (70%) | |
| | | | | | | | | |
Total revenues | | | 728,253 | | | | 437,806 | | | 66 | % | | | 512,104 | | | | 728,253 | | | | (216,149 | ) | | | (30%) | |
| | | | | | | | | |
| Expenses | | | | | | | | | | | | | | | | | | | | | | |
Cost of midstream gas purchased (1) | | | 612,530 | | | | 343,293 | | | 78 | % | | | 406,583 | | | | 612,530 | | | | 205,947 | | | | 34% | |
Operating | | | 20,737 | | | | 12,893 | | | 61 | % | | | 26,451 | | | | 20,737 | | | | (5,714 | ) | | | (28%) | |
Taxes other than income | | | 2,578 | | | | 1,926 | | | 34 | % | | | 3,090 | | | | 2,578 | | | | (512 | ) | | | (20%) | |
General and administrative | | | 14,300 | | | | 11,958 | | | 20 | % | | | 16,301 | | | | 14,300 | | | | (2,001 | ) | | | (14%) | |
Impairments | | | 31,801 | | | | — | | | — | | | | — | | | | 31,801 | | | | 31,801 | | | | 100% | |
Depreciation and amortization | | | 27,361 | | | | 18,822 | | | 45 | % | | | 38,905 | | | | 27,361 | | | | (11,544 | ) | | | (42%) | |
| | | | | | | | | |
Total operating expenses | | | 709,307 | | | | 388,892 | | | 82 | % | | | 491,330 | | | | 709,307 | | | | 217,977 | | | | 31% | |
| | | | | | | | | |
| Operating income | | $ | 18,946 | | | $ | 48,914 | | | (61 | )% | | $ | 20,774 | | | $ | 18,946 | | | $ | 1,828 | | | | 10% | |
| | | | | | | | | |
| Operating Statistics | | | | | | | | | | | | | | | | | | | | | | |
System throughput volumes (MMcf) | | | 98,683 | | | | 67,810 | | | 46 | % | | | 121,335 | | | | 98,683 | | | | 22,652 | | | | 23% | |
System throughput volumes (MMcfd) | | | 270 | | | | 186 | | | 45 | % | |
| | Daily throughput volumes (MMcfd) | | | | 332 | | | | 270 | | | | 62 | | | | 23% | |
Gross margin | | $ | 107,472 | | | $ | 89,881 | | | 20 | % | | $ | 98,206 | | | $ | 107,472 | | | $ | (9,266 | ) | | | (9%) | |
Impact of derivatives | | | (31,709 | ) | | | (13,184 | ) | | 141 | % | |
| | | | | | | | | |
| Cash impact of derivatives | | | | 10,566 | | | | (31,709 | ) | | | 42,275 | | | | 133% | |
Gross margin, adjusted for impact of derivatives | | $ | 75,763 | | | $ | 76,697 | | | (1 | )% | | $ | 108,772 | | | $ | 75,763 | | | $ | 33,009 | | | | 44% | |
| | | | | | | | | |
| Gross margin ($/Mcf) | | $ | 1.09 | | | $ | 1.33 | | | (18 | )% | | $ | 0.81 | | | $ | 1.09 | | | $ | (0.28 | ) | | | (26%) | |
Impact of derivatives ($/Mcf) | | | (0.32 | ) | | | (0.19 | ) | | 68 | % | |
| | | | | | | | | |
| Cash impact of derivatives ($/Mcf) | | | | 0.09 | | | | (0.32 | ) | | | 0.41 | | | | 128% | |
Gross margin, adjusted for impact of derivatives ($/Mcf) | | $ | 0.77 | | | $ | 1.14 | | | (32 | )% | | $ | 0.90 | | | $ | 0.77 | | | $ | 0.13 | | | | 17% | |
| | | | | | | | | |
| (1) | In 2009 and 2008, PVR recorded $72.5 million and $127.9 million of natural gas midstream revenue and $72.5 million and $127.9 million for the cost of midstream gas purchased related to the purchase of natural gas from our subsidiary PVOG LP, and the subsequent sale of that gas to third parties. PVR takes title to the gas prior to transporting it to third parties. These transactions do not impact the gross margin. |
TABLE OF CONTENTS
Gross Margin. PVR’s gross
Gross margin is the difference between itsPVR’s natural gas midstream revenues and its cost of midstream gas purchased. Natural gas midstream revenues included residue gas sold from processing plants after NGLs were removed, NGLs sold after being removed from system throughput volumes received, condensate collected and sold and gathering and other fees primarily from natural gas volumes connected to PVR’s gas processing plants. Cost of midstream gas purchased consisted of amounts payable to third-party producers for natural gas purchased under percentage-of-proceeds and gas purchase/keep-whole contracts.
Natural gas midstream revenues increased by $286.8 million, or 66%, from $433.2 million in 2007 to $720.0 million in 2008. Cost of midstream gas purchased increased by $269.2 million, or 78%, from $343.3 million in 2007 to $612.5 million in 2008. The gross margin increased by $17.6 million, or 20%, from $89.9 million in 2007 to $107.5 million in 2008. The gross margin increasedecrease was a result of increasedlower commodity pricing increased system throughput volume production and higherlower fractionation, or frac spreads, during 2008 compared to 2007.partially offset by increased system throughput volumes and increased natural gas processing capacity. Frac spreads are the difference between the price of NGLs sold and the cost of natural gas purchased on a per MMBtu basis.
SystemDrilling activities by producers central to PVR’s natural gas gathering and processing plants were at reduced levels from the previous year due to lower natural gas prices. However, PVR’s 2009 system throughput volumes increased by 84 MMcfd, or 45%,benefited from 186 MMcfd in 2007 to 270 MMcfd in 2008. This increase in throughput volumes is due primarily to the Crossroads plant in East Texas, which became fully operationalresults of drilling activity in 2008 and to the Lone Starfirst part of 2009. PVR’s expansion and acquisition which was consummatedactivity, especially in the third quarter of 2008. Also, the continued successful development by producers operating in the vicinity of the Panhandle System, as well as our successhas alleviated pipeline pressures and allowed PVR to move all of its gas in contractingthis region to its processing plants. As noted above, in July 2009 PVR completed an acquisition of gas processing and connecting new supply contributedresidue pipeline facilities in western Oklahoma. The acquired assets included the 60 MMcfd Sweetwater plant. Additionally, PVR completed a 40 MMcfd processing plant expansion in its Spearman complex that was put into service on July 31, 2009. The acquired and expanded processing facilities increased PVR’s processing capacity in the Panhandle System to the increase in throughput volume.
In 2008, PVR’s two expansion projects related260 MMcfd and overall processing capacity to 400 MMcfd. The increased processing capacity has allowed PVR to process natural gas volumes that were being bypassed due to processing facilities became operational. These two natural gas processing facilities consistedcapacity constraints in the Panhandle System and has alleviated pipeline pressure-related volume constraints in the eastern portion of the Spearman plant in the Texas Panhandle, which was placed into service in February 2008 and has approximately 60 MMcfd capacity, and the Crossroads plant in East Texas, which was placed into service in April 2008 and has approximately 80 MMcfd capacity. The Crossroads plant will process most of the Cotton Valley gas production for Penn Virginia as well as other producers, and the Spearman plant will process gas that had previously bypassed its Beaver plant.Panhandle.
During 2008,2009, PVR generated a majority of theits gross margin from contractual arrangements under which the gross margin is exposed to increases and decreases in the price of natural gas and NGLs. See Item 1, “Business –— Contracts –— PVR Natural Gas Midstream Segment,” for discussion of the types of contracts utilized by the PVR natural gas midstream segment. As part of itsPVR’s risk management strategy, PVRit uses derivative financial instruments to economically hedge NGLs sold and natural gas purchased. See Note 8 “Derivative Instruments,” into the Notes to Consolidated Financial Statements in Item 8, “Financial Statements and Supplementary Data,” for a description of our derivativePVR’s derivatives program. Adjusted for the impact of our commodity derivative instruments for which we discontinued hedge accounting in 2006, PVR’s gross margin remained relatively constant from 2007 to 2008. On a per Mcf basis, the gross margin, adjusted for the impact of ourPVR’s commodity derivative instruments, for which we discontinued hedge accountingPVR’s gross margin increased in 2006, decreased2009 by $0.37,$0.13, or 32%, from $1.14 per Mcf in 2007 to $0.77 in 2008. Gross margins during the first part17%. This favorable impact of 2008 continued to increase given the favorable pricing environment, such as highercommodity derivatives is a result of overall lower commodity prices during 2009 and frac spreads, andthe expiration of older derivative instruments.
Revenues Other Than Gross Margin
Equity earnings in equity investment increased system throughput volumes. However, margins decreased towards the end of the year due to a significant decreasefull year of results in the prices of NGLs as2009 compared with a result of reduced industrial demandpartial year in a weakening economy. The gross margin on a Mcf basis decreased in2008. In April 2008, due to an increase in fee-based system throughput volumes. These volumes are associated with the expansions and acquisitions made during 2008.
Producer Services Revenues. Producer services revenues increased by $1.2 million, or 26%, from $4.6 million in 2007 to $5.8 million in 2008 primarily due to an increase in agent fees for the marketing of our and third parties’ natural gas production. Agent fees increased primarily due to increases in our natural gas production as well as increases in the price of natural gas.
Equity Earnings in Equity Investment. This increase is due to PVR’sPVR acquired a 25% member interest in Thunder Creek, a joint venture that gathers and transports CBM in Wyoming’s Powder River Basin. PVR acquired this member interestIn addition, revenues from the joint venture have grown in April 2008.2009 due to mainline volume increases in the Powder River Basin.
Expenses. Total operating costsProducer services revenues decreased due to a negative relative change in the natural gas indices on which PVR’s purchases and sales of natural gas are based and a decrease in marketing fees resulting from lower commodity prices.
Expenses
Operating expenses increased primarily due to increasesPVR’s prior and current years’ acquisitions, expansion projects, compressor rentals and labor costs. Increased costs for compressor rentals and labor costs were incurred due to expanding PVR’s footprint in operating expenses, taxesthe Panhandle System.
Taxes other than income general and administrative expenses and depreciation and amortization, as well as a goodwill impairment loss.
Operating expenses increased by $7.8 million, or 61%, from $12.9 million in 2007 to $20.7 million in 2008, primarily due to expenses related tohigher property taxes. The increase in property taxes was a result of PVR’s expanding footprint in areas of operation, including acquisitions and the addition of the Spearman and Crossroads plants. These expenses include increased repairs and maintenance expenses, increased compressor rentals, chemical and treating expenses and increased employee expenses. plant expansions.
General and administrative expenses increased by $2.3 million, or 20%, from $12.0 million in 2007 to $14.3 million in 2008 primarily due to increased staffing and related benefit costs. Taxes other than income increased by $0.7 million, or 34%,The increase was primarily attributable to labor costs resulting from $1.9 millionPVR’s 2008 acquisitions and plant expansions. PVR incurred a full year of salaries and benefits in 2007 to $2.6 million2009 compared with a partial year in 2008. Depreciation and amortization expenses increased by $8.6 million, or 45%, from $18.8 million
TABLE OF CONTENTS
Impairment expense in 2007 to $27.4 million2008 was the result of a reduction in 2008. Increases in both taxes other than income and depreciation and amortization expenses were primarily due to capital spending on the Spearman and Crossroads plants and acquisitions, including increased payroll taxes resulting from increased staffing.
In accordance with SFAS No. 142,Goodwill and Other Intangible Assets, we testvalue of goodwill. PVR tests goodwill for impairment on an annual basis, at a minimum, and more frequently if a triggering event occurs. The goodwill testing during the fourth quarter of 2008 identified a goodwill impairment loss of $31.8 million. The impairment charge, which was triggered by fourth quarter declines in oil and gas spot and futures prices and a decline in PVR’s market capitalization, reducesreduced to zero all goodwill recorded in conjunction with acquisitions made by the PVR natural gas midstream segment in 2008 and prior years.
In determining the fair value of the PVR natural gas midstream segment (reporting unit), we used an income approach. Under the income approach, the fair value of the reporting unit is estimated basedDepreciation and amortization expenses increased primarily due to PVR’s acquisitions, capital expansions on the present valueSpearman and Sweetwater plants and new well connections in existing areas of expected futureoperation.
cash flows. The income approach is dependent on a number of factors including estimates of forecasted revenue and operating costs, appropriate discount rates and a market-derived earnings multiple terminal value (the value of the reporting unit at the end of the estimation period). Key assumptions used in the discounted cash flows model described above include estimates of future commodity prices based on the December 31, 2008 commodity price strips and estimates of operating, administrative and capital costs. We discounted the resulting future cash flows using a peer company based weighted average cost of capital of 12%.
See Note 12, “Goodwill,” in the Notes to Consolidated Financial Statements in Item 8, “Financial Statements and Supplementary Data,” for a further description of the impairment of goodwill.
Year Ended December 31, 20072008 Compared With Year Ended December 31, 2006
2007The following table sets forth a summary of certain financial and other data for the PVR natural gas midstream segment and the percentage change for the years ended December 31, 2007 and 2006:periods presented:
| | | | | | | | | | | | | | |
| | | Year Ended December 31, | | %
Change | | | Year Ended December 31, | | Favorable
(Unfavorable) | | % Change |
| | | 2007 | | 2006 | | | 2008 | | 2007 |
| | | (in thousands, except as
noted) | | |
Financial Highlights | | | | | | | |
Revenues | | | | | | | | | | | | | | | | | | | | | | |
Residue gas | | $ | 242,129 | | | $ | 259,764 | | | (7 | )% | | $ | 452,535 | | | $ | 242,129 | | | $ | 210,406 | | | | 87% | |
Natural gas liquids | | | 172,144 | | | | 130,675 | | | 32 | % | | | 229,765 | | | | 172,144 | | | | 57,621 | | | | 33% | |
Condensate | | | 13,889 | | | | 9,989 | | | 39 | % | | | 26,009 | | | | 13,889 | | | | 12,120 | | | | 87% | |
Gathering and transportation fees | | | 5,012 | | | | 2,287 | | | 119 | % | |
| | | | | | | | | |
Total natural gas midstream revenues | | | 433,174 | | | | 402,715 | | | 8 | % | |
| Gathering, processing and transportation fees | | | | 11,693 | | | | 5,012 | | | | 6,681 | | | | 133% | |
| Total natural gas midstream revenues(1) | | | | 720,002 | | | | 433,174 | | | | 286,828 | | | | 66% | |
| Equity earnings in equity investment | | | | 2,408 | | | | — | | | | 2,408 | | | | n/a | |
Producer services | | | 4,632 | | | | 2,195 | | | 111 | % | | | 5,843 | | | | 4,632 | | | | 1,211 | | | | 26% | |
| | | | | | | | | |
Total revenues | | | 437,806 | | | | 404,910 | | | 8 | % | | | 728,253 | | | | 437,806 | | | | 290,447 | | | | 66% | |
| | | | | | | | | |
| Expenses | | | | | | | | | | | | | | | | | | | | | | |
Cost of midstream gas purchased | | | 343,293 | | | | 334,594 | | | 3 | % | |
| Cost of midstream gas purchased(1) | | | | 612,530 | | | | 343,293 | | | | (269,237 | ) | | | (78%) | |
Operating | | | 12,893 | | | | 11,403 | | | 13 | % | | | 20,737 | | | | 12,893 | | | | (7,844 | ) | | | (61%) | |
Taxes other than income | | | 1,926 | | | | 1,420 | | | 36 | % | | | 2,578 | | | | 1,926 | | | | (652 | ) | | | (34%) | |
General and administrative | | | 11,958 | | | | 11,023 | | | 8 | % | | | 14,300 | | | | 11,958 | | | | (2,342 | ) | | | (20%) | |
| Impairments | | | | 31,801 | | | | — | | | | (31,801 | ) | | | n/a | |
Depreciation and amortization | | | 18,822 | | | | 17,094 | | | 10 | % | | | 27,361 | | | | 18,822 | | | | (8,539 | ) | | | (45%) | |
| | | | | | | | | |
Total operating expenses | | | 388,892 | | | | 375,534 | | | 4 | % | | | 709,307 | | | | 388,892 | | | | (320,415 | ) | | | (82%) | |
| | | | | | | | | |
| Operating income | | $ | 48,914 | | | $ | 29,376 | | | 67 | % | | $ | 18,946 | | | $ | 48,914 | | | $ | (29,968 | ) | | | (61%) | |
| | | | | | | | | |
| Operating Statistics | | | | | | | | | | | | | | | | | | | | | | |
System throughput volumes (MMcf) | | | 67,810 | | | | 61,995 | | | 9 | % | | | 98,683 | | | | 67,810 | | | | 30,873 | | | | 46% | |
System throughput volumes (MMcfd) | | | 186 | | | | 170 | | | 9 | % | |
| | Daily throughput volumes (MMcfd) | | | | 270 | | | | 186 | | | | 84 | | | | 45% | |
Gross margin | | $ | 89,881 | | | $ | 68,121 | | | 32 | % | | $ | 107,472 | | | $ | 89,881 | | | $ | 17,591 | | | | 20% | |
Impact of derivatives | | | (13,184 | ) | | | (17,483 | ) | | (25 | )% | |
| | | | | | | | | |
| Cash impact of derivatives | | | | (31,709 | ) | | | (13,184 | ) | | | (18,525 | ) | | | (141%) | |
Gross margin, adjusted for impact of derivatives | | $ | 76,697 | | | $ | 50,638 | | | 51 | % | | $ | 75,763 | | | $ | 76,697 | | | $ | (934 | ) | | | (1%) | |
| | | | | | | | | |
| Gross margin ($/Mcf) | | $ | 1.33 | | | $ | 1.10 | | | 21 | % | | $ | 1.09 | | | $ | 1.33 | | | $ | (0.24 | ) | | | (18%) | |
Impact of derivatives ($/Mcf) | | | (0.19 | ) | | | (0.28 | ) | | (32 | )% | |
| | | | | | | | | |
| Cash impact of derivatives ($/Mcf) | | | | (0.32 | ) | | | (0.19 | ) | | | (0.13 | ) | | | (68%) | |
Gross margin, adjusted for impact of derivatives ($/Mcf) | | $ | 1.14 | | | $ | 0.82 | | | 39 | % | | $ | 0.77 | | | $ | 1.14 | | | $ | (0.37 | ) | | | (32%) | |
| | | | | | | | | |
Gross Margin. Natural gas midstream revenues increased by $30.5 million, or 8%, from $402.7 million in 2006 to $433.2 million in 2007. Cost of midstream gas purchased increased by $8.7 million, or 3%, from $334.6 million in 2006 to $343.3 million in 2007. PVR’s gross margin increased by $21.8 million, or 32%, from $68.1 million in 2006 to $89.9 million in 2007. The gross margin increase was a result of a higher frac spread during 2007 and higher volumes of processed gas.
| (1) | In 2008, PVR recorded $127.9 million of natural gas midstream revenue and $127.9 million for the cost of midstream gas purchased related to the purchase of natural gas from our subsidiary PVOG LP, and the subsequent sale of that gas to third parties. PVR takes title to the gas prior to transporting it to third parties. These transactions do not impact the gross margin. |
TABLE OF CONTENTS
System throughput volumes at PVR’s gas processing plants and gathering systems increased by 16 MMcfd, or 9%, from 170 MMcfd in 2006 to 186 MMcfd in 2007. This increase is the result of higher volumes of processed gas, which is the portion of the system throughput volumes that is actually processed at the processing facility. The increase in processed gas was attributable to PVR’s success in contracting and connecting new supply to PVR’s facilities. Much of this new gas was a result of continued successful development by the producers operating in the vicinity of PVR’s systems. Additionally, the pipeline PVR acquired in 2006 allowed PVR to connect a number of PVR’s gathering systems directly to its Beaver plant, bringing its utilization of processing capacity to 100%.
During 2007, PVR generated a majority of its gross margin from contractual arrangements under which its gross margin is exposed to increases and decreases in the price of natural gas and NGLs. See Item 1, “Business – Contracts – PVR Natural Gas Midstream Segment,” for a discussion of the types of contracts utilized by the PVR natural gas midstream segment. As part of PVR’s risk management strategy, PVR uses derivative financial instruments to economically hedge NGLs sold and natural gas purchased. See Note 8, “Derivative Instruments,” in the Notes to Consolidated Financial Statements in Item 8, “Financial Statements and Supplementary Data,” for a description of our derivative program. Adjusted for the impact of our commodity derivative instruments for which we discontinued hedge accounting in 2006, PVR’s gross margin increased by $26.1 million, or 51%, from $50.6 million in 2006 to $76.7 million in 2007. On a per Mcf basis, PVR’s gross margin, adjusted for the impact of our commodity derivative instruments for which we discontinued hedge accounting in 2006, increased by $0.32, or 39%, from $0.82 per Mcf in 2006 to $1.14 in 2007.
Producer Services Revenues. Producer services revenues increased by $2.4 million, or 111%, from $2.2 million in 2006 to $4.6 million in 2007 primarily due to an increase in agent fees for the marketing of our and third parties’ natural gas production. Agent fees increased primarily due to increases in our natural gas production as well as increases in the price of natural gas.
Expenses. Total operating costs and expenses remained relatively constant in 2007 compared to 2006.
Operating expenses increased by $1.5 million, or 13%, from $11.4 million in 2006 to $12.9 million in 2007 primarily due to a full year of operations in 2007 on the pipeline and related compression facilities in Texas and Oklahoma that PVR acquired in 2006 and increased fees from compressor rentals. General and administrative expenses increased by $1.0 million, or 8%, from $11.0 million in 2006 to $12.0 million in 2007 primarily due to increased staffing costs. Taxes other than income increased by $0.5 million, or 36%, from $1.4 million in 2006 to $1.9 million in 2007. Depreciation and amortization expenses increased by $1.7 million, or 10%, from $17.1 million in 2006 to $18.8 million in 2007. Increases in both taxes other than income and depreciation and amortization expenses were primarily due to capital spending on organic growth and acquisition opportunities occurring in both 2006 and 2007.
Eliminations and Other
Our eliminations and other results consist of elimination of intercompany sales, corporate operating expenses, interest expense, derivative activity and minority interest.
Corporate Operating Expenses. Corporate operating expenses primarily consist of general and administrative expenses other than from our oil and gas segment, the PVR coal and natural resource management segment and the PVR natural gas midstream segment. Corporate operating expenses increased by $1.2 million, or 4%, from $30.2 million in 2007 to $31.6 million in 2008 primarily due to increased DD&A expenses resulting from capitalized costs incurred on a software implementation project. Corporate operating expenses increased by $13.2 million, or 77%, from $17.2 million in 2006 to $30.4 million in 2007 primarily due to increased general and administrative expenses resulting from wage increases, increased consulting expenses and the recognition of additional stock-based compensation expenses.
Interest Expense. Our consolidated interest expense increased by $6.9 million, or 18%, from $37.4 million in 2007 to $44.3 million in 2008. Our consolidated interest expense increased by $12.6 million, or 51%, from $24.8 million in 2006 to $37.4 million in 2007. Our consolidated interest expense is comprised of the following for the years ended December 31, 2008, 2007 and 2006:
| | | | | | | | | | | | |
| | | Year Ended December 31, | |
Source | | 2008 | | | 2007 | | | 2006 | |
| | | (in thousands) | |
Penn Virginia borrowings | | $ | (20,612 | ) | | $ | (23,768 | ) | | $ | (8,837 | ) |
Penn Virginia capitalized interest | | | 2,038 | | | | 3,685 | | | | 2,817 | |
Penn Virginia interest rate swaps | | | (1,015 | ) | | | 2 | | | | 9 | |
PVR borrowings | | | (23,641 | ) | | | (18,861 | ) | | | (19,661 | ) |
PVR capitalized interest | | | 675 | | | | 786 | | | | 335 | |
PVR interest rate swaps | | | (1,706 | ) | | | 737 | | | | 505 | |
| | | | | | | | | | | | |
Total interest expense | | $ | (44,261 | ) | | $ | (37,419 | ) | | $ | (24,832 | ) |
| | | | | | | | | | | | |
Total interest expense related to our borrowings, capitalized interest and Interest Rate Swaps remained relatively constant from 2007 to 2008. Total interest expense related to our borrowings, capitalized interest and Interest Rate Swaps increased by $14.1, or 234%, from $6.0 million in 2006 to $20.1 million in 2007. Our oil and gas segment capitalized $2.0 million, $3.7 million and $2.8 million of interest in 2008, 2007 and 2006. Both the borrowings and the capitalized interest for these periods were related to our oil and gas segment’s drilling program and unproved properties where it is anticipated exploratory and development testing will occur. In addition, the borrowings were also related to $88.2 million and $72.7 million in proved property acquisitions that we made in 2007 and 2006. We did not make any proved property acquisitions in 2008. In connection with periodic settlements, we recognized $1.0 million in net hedging losses on the Interest Rate Swaps in interest expense in 2008.
Interest expense from PVR borrowings, PVR capitalized interest and PVR Interest Rate Swaps increased by $7.4, or 42%, from $17.3 million in 2007 to $24.7 million in 2008. This increase is primarily due to the increase in PVR’s average debt balance, which increased from $289.3 million in 2007 to $478.5 million in 2008. Interest expense from PVR borrowings, PVR capitalized interest and PVR Interest Rate Swaps decreased by $1.5 million, or 8%, from $18.8 million in 2006 to $17.3 million in 2007 primarily due to a $114.6 million principal payment made by PVR on the PVR Revolver in December 2006.
PVR capitalized $0.7 million and $0.8 million in interest costs in 2008 and 2007 primarily related to the construction of the Spearman and Crossroads plants and $0.3 million in 2006 related to the construction of a coal services facility in October 2006. In connection with periodic settlements, PVR recognized $1.7 million in net hedging losses on the PVR Interest Rate Swaps in interest expense in 2008. In connection with periodic settlements, PVR recognized $0.7 million and $0.5 million in net hedging gains on the PVR Interest Rate Swaps in interest expense in 2007 and 2006.
Derivatives. Our results of operations and operating cash flows were impacted by changes in market prices for NGLs, crude oil and natural gas prices. Commodity markets are volatile, and as a result, our hedging activity results can vary significantly. Our results of operations are affected by the volatility of changes in fair value, which fluctuate with changes in natural gas, crude oil and NGL prices. We determine the fair values of our oil and gas derivative agreements based on discounted cash flows derived from third-party quoted forward prices for NYMEX Henry Hub gas and West Texas Intermediate crude oil closing prices as of December 31, 2008. PVR determines the fair values its commodity derivative agreements based on discounted cash flows based on quoted forward prices for the respective commodities. The discounted cash flows utilize discount rates adjusted for the credit risk of our counterparties for derivatives in an asset position, and our own credit risk derivatives in a liability position, in accordance with SFAS No. 157.
Consolidated derivative gains were $46.6 million in the year ended December 31, 2008. Consolidated derivative losses were $47.3 million in the year ended December 31, 2007. Consolidated derivative gains were $19.5 in the year ended December 31, 2006. These gains and losses were due primarily to changes in fair value. Cash paid for settlements totaled $46.1 million, $3.7 million and $8.9 million in the years ended December 31, 2008, 2007 and 2006.
Our consolidated derivative activity for the years ended December 31, 2008, 2007 and 2006 is summarized below:
| | | | | | | | | | | | |
| | | Year Ended December 31, | |
| | | 2008 | | | 2007 | | | 2006 | |
| | | (in thousands) | |
Oil and gas segment unrealized derivative gain (loss) | | $ | 37,365 | | | $ | (15,842 | ) | | $ | 20,268 | |
Oil and gas segment realized gain (loss) | | | (7,620 | ) | | | 14,128 | | | | 10,489 | |
Natural gas midstream segment unrealized derivative gain (loss) | | | 55,303 | | | | (27,789 | ) | | | 8,176 | |
Natural gas midstream segment realized loss | | | (38,466 | ) | | | (17,779 | ) | | | (19,436 | ) |
| | | | | | | | | | | | |
Total derivative gain (loss) | | $ | 46,582 | | | $ | (47,282 | ) | | $ | 19,497 | |
| | | | | | | | | | | | |
Minority Interest. Minority interest primarily represents PVR’s net income allocated to the limited partner units owned by the public. Minority interest reduced our consolidated income from operations by $60.4 million, $30.3 million and $43.0 million in the years ended December 31, 2008, 2007 and 2006. The increase in minority interest for the year ended December 31, 2008 compared to the same period of 2007 was primarily due to the increase in PVR’s net income from $56.6 million in 2007 to $104.5 million in 2008. The decrease in minority interest for the year ended December 31, 2007 compared to the same period of 2006 was primarily due to the decrease in PVR’s net income from $73.9 million in 2006 to $56.6 million in 2007.
Summary of Critical Accounting Policies and Estimates
The process of preparing financial statements in accordance with accounting principles generally accepted in the United States of America requires our management to make estimates and judgments regarding certain items and transactions. It is possible that materially different amounts could be recorded if these estimates and judgments change or if the actual results differ from these estimates and judgments. We consider the following to be the most critical accounting policies which involve the judgment of our management.
Oil and Gas Reserves
The estimates of oil and gas reserves are the single most critical estimate included in our consolidated financial statements. Reserve estimates become the basis for determining depletive write-off rates, recoverability of historical cost investments and the fair value of properties subject to potential impairments. There are many uncertainties inherent in estimating crude oil and natural gas reserve quantities, including projecting the total quantities in place, future production rates and the timing of future development expenditures. In addition, reserve estimates of new discoveries are less precise than those of producing properties due to the lack of a production history. Accordingly, these estimates are subject to change as additional information becomes available.
Proved reserves are the estimated quantities of crude oil, condensate and natural gas that geological and engineering data demonstrate with reasonable certainty to be recoverable in future years from known oil and gas reservoirs under existing economic and operating conditions at the end of the respective years. Proved developed reserves are proved reserves that can be expected to be recovered through existing wells with existing equipment and operating methods. Proved undeveloped reserves are those reserves that are expected to be recovered from new wells or undrilled acreage, or from existing wells where a relatively major expenditure is required for recompletion.
There are several factors which could change our estimates of oil and gas reserves. Significant rises or declines in product prices could lead to changes in the amount of reserves as production activities become more or less economical. An additional factor that could result in a change of recorded reserves is the reservoir decline rates differing from those assumed when the reserves were initially recorded. Estimation of future production and development costs is also subject to change partially due to factors beyond our control, such as energy costs and inflation or deflation of oil field service costs. Additionally, we perform impairment tests pursuant to SFAS No. 144,Accounting for the Impairment or Disposal of Long-Lived Assets, when significant events occur, such as a market move to a lower price environment or a material revision to our reserve estimates. For the years ended December 31, 2008, 2007 and 2006, we recorded impairment charges related to our oil and gas segment properties of $20.0 million, $2.6 million and $8.5 million. See Note 14 – “Impairment of Oil and Gas Properties” in the Notes to Consolidated Financial Statements in Item 8, “Financial Statements and Supplementary Data,” for a detailed description of the impairment of our oil and gas properties.
Oil and Gas Revenues
We record revenues associated with sales of natural gas, crude oil, condensate and NGLs when title passes to the customer. We recognize natural gas sales revenues from properties in which we have an interest with other producers on the basis of our net working interest (“entitlement method of accounting”). Natural gas imbalances occur when we sell more or less than our entitled ownership percentage of total natural gas production. We treat any amount received in excess of our share as deferred revenues. If we take less than we are entitled to take, we record the under-delivery as a receivable. As a result of the numerous requirements necessary to gather information from purchasers or various measurement locations, calculate volumes produced, perform field and wellhead allocations and distribute and disburse funds to various working interest partners and royalty owners, the collection of revenues from oil and gas production may take up to 60 days following the month of production. Therefore, we make accruals for revenues and accounts receivable based on estimates of our share of production, particularly from properties that are operated by our partners. Since the settlement process may take 30 to 60 days following the month of actual production, our financial results include estimates of production and revenues for the related time period. We record any differences, which we do not expect to be significant, between the actual amounts ultimately received and the original estimates in the period they become finalized.
Coal Royalties Revenues
We recognize coal royalties revenues on the basis of tons of coal sold by PVR’s lessees and the corresponding revenues from those sales. Since PVR does not operate any coal mines, it does not have access to actual production and revenues information until approximately 30 days following the month of production. Therefore, our financial results include estimated revenues and accounts receivable for the month of production. We record any differences, which historically have not been significant, between the actual amounts ultimately received or paid and the original estimates in the period they become finalized.
Natural Gas Midstream Gross Margin
PVR’s grossGross margin is the difference between itsPVR’s natural gas midstream revenues and its cost of midstream gas purchased. Natural gas midstream revenues included residue gas sold from processing plants after NGLs were removed, NGLs sold after being removed from system throughput volumes received, condensate collected and sold and gathering and other fees primarily from natural gas volumes connected to PVR’s gas processing plants. We recognize revenues from the sale of NGLs and residue gas when PVR sells the NGLs and residue gas produced at its gas processing plants. We recognize gathering and transportation revenues based upon actual volumes delivered. Cost of midstream gas purchased consistsconsisted of amounts payable to third-party producers for natural gas purchased under percentage-of-proceeds and gas purchase/keep-whole contracts.
DueThe gross margin increase was a result of higher commodity pricing, increased system throughput volume production and higher frac spreads during 2008 compared to 2007.
The system throughput volumes increase is due primarily to PVR’s Crossroads plant in East Texas, which became fully operational in 2008, and to the time neededLone Star acquisition, which was consummated in the third quarter of 2008. Also, the continued development by producers operating in the vicinity of the Panhandle System, as well as PVR’s success in contracting and connecting new supply contributed to gather informationthe increase in throughput volume.
During 2008, PVR generated a majority of its gross margin from various purchaserscontractual arrangements under which the gross margin is exposed to increases and measurement locations and then calculate volumes delivered,decreases in the collectionprice of natural gas midstream revenues and the calculationNGLs. See Item 1, “Business — Contracts — PVR Natural Gas Midstream Segment,” for discussion of the costtypes of midstream gas purchased may take up to 30 days following the month of production. Therefore, PVR makes accruals for revenues and accounts receivable and the related cost of midstream gas purchased and accounts payable based on estimates of natural gas purchased and NGLs and residue gas sold. We record any differences, which historically have not been significant, between the actual amounts ultimately received or paid and the original estimates in the period they become finalized.
Derivative Activities
From time to time, we enter into derivative financial instruments to mitigate our exposure to natural gas, crude oil and NGL price volatility. The derivative financial instruments, which are placed with financial institutions that we believe are acceptable credit risks, take the form of collars and three-way collars. All derivative financial instruments are recognized in our consolidated financial statements at fair value in accordance with SFAS No. 133,Accounting for Derivative Instruments and Hedging Activities. The fair values of our derivative instruments are determined based on discounted cash flows derived from quoted forward prices. All derivative transactions are subject to our risk management policy, which has been reviewed and approvedcontracts utilized by our board of directors.
Until April 30, 2006, we applied hedge accounting for commodity derivative financial instruments as allowed under SFAS No. 133. Our commodity derivative financial instruments initially qualified as cash flow hedges, and changes in fair value of the effective portion of these contracts were deferred in accumulated other comprehensive income until the hedged transactions settled. When we discontinued hedge accounting for commodity derivatives, a net loss remained in accumulated other comprehensive income of $12.1 million. As the hedged transactions settled in 2006, 2007 and 2008, we and PVR recognized the $12.1 million of deferred changes in fair value in revenues and cost of gas purchased in our consolidated
statements of income related to commodity derivatives. As of December 31, 2008, all amounts deferred under previous commodity hedging relationships have been reclassified into revenues and cost of midstream gas purchased.
PVR continues to apply hedge accounting to some of its interest rate hedges. Settlements on the PVR interest rate swap agreements (the “PVR Interest Rate Swaps”) that follow hedge accounting are recorded as interest expense. The effective portion of the change in the fair value of the swaps that follow hedge accounting is recorded each period in accumulated other comprehensive income. Certain of the PVR Interest Rate Swaps do not follow hedge accounting. Accordingly, mark-to-market gains and losses for the PVR Interest Rate Swaps that do not follow hedge accounting are recognized in earnings currently in the derivatives line on the consolidated statements of income. Our results of operations are affected by the changes in fair value, which fluctuates with changes in interest rates.
Because we no longer apply hedge accounting for our commodity derivatives, we recognize changes in fair value in earnings currently in the derivatives line on the consolidated statements of income. We have experienced and could continue to experience significant changes in the estimate of unrealized derivative gains or losses recognized due to fluctuations in the value of these commodity derivative contracts. The discontinuation of hedge accounting has no impact on our reported cash flows, although our results of operations are affected by the volatility of mark-to-market gains and losses and changes in fair value, which fluctuate with changes in natural gas, crude oil and NGL prices. These fluctuations could be significant in a volatile pricing environment. See Note 8 – “Derivative Instruments” in the Notes to Consolidated Financial Statements in Item 8, “Financial Statements and Supplementary Data,” for a further description of our and PVR’s derivatives programs.
Depreciation, Depletion and Amortization
We determine depreciation and depletion of oil and gas producing properties by the units-of-production method and these amounts could change with revisions to estimated proved recoverable reserves. We compute depreciation and amortization of property and equipment using the straight-line balance method over the estimated useful life of each asset as follows:
| | |
| | Useful Life |
Gathering systems
| | 15-20 years |
Compressor stations
| | 5-15 years |
Processing plants
| | 15 years |
Other property and equipment
| | 3-20 years |
PVR depletes coal properties on an area-by-area basis at a rate based on the cost of the mineral properties and the number of tons of estimated proven and probable coal reserves contained therein. Proven and probable coal reserves have been estimated by PVR’s own geologists and outside consultants. PVR’s estimates of coal reserves are updated periodically and may result in adjustments to coal reserves and depletion rates that are recognized prospectively. From time to time, PVR carries out core-hole drilling activities on its coal properties in order to ascertain the quality and quantity of the coal contained in those properties. These core-hole drilling activities are expensed as incurred. PVR depletes timber using a methodology consistent with the units-of-production method, but that is based on the quantity of timber harvested. PVR determines depletion of oil and gas royalty interests by the units-of-production method and these amounts could change with revisions to estimated proved recoverable reserves. When PVR retires or sells an asset, we remove its cost and related accumulated depreciation and amortization from our consolidated balance sheets. We record the difference between the net book value (net of any assumed asset retirement obligation), and proceeds from disposition as a gain or loss on the sales of property and equipment.
Intangible assets are primarily associated with assumed contracts, customer relationships and rights-of-way. These intangible assets are amortized over periods of up to 20 years, the period in which benefits are derived from the contracts, relationships and rights-of-way, and are combined with property, plant and equipment and are reviewed for impairment under SFAS No. 144,Accounting for the Impairment or Disposal of Long-Lived Assets. See Note 13, “Intangible Assets, net” in the Notes to Consolidated Financial Statements in Item 8, “Financial Statements and Supplementary Data,” for a more detailed description of our intangible assets.
Impairment of Goodwill
Goodwill has been allocated to the PVR natural gas midstream segment. Under SFAS No. 141,Business Combinations,As part of PVR’s risk management strategy, it uses derivative financial instruments to economically hedge NGLs sold and SFAS No. 142,Goodwillnatural gas purchased. See Note 8 to the Consolidated Financial Statements for a description of PVR’s derivatives program. On a per Mcf basis, adjusted for the impact of PVR’s commodity derivative instruments for which it discontinued hedge accounting in 2006, PVR’s gross margin decreased by $0.37, or 32%. Gross margins during the first part of 2008 continued to increase given the favorable pricing environment, such as higher commodity prices and frac spreads, and increased system throughput volumes. However, margins decreased towards the end of 2008 due to a significant decrease in the prices of NGLs as a result of reduced industrial demand in a weakening economy. The gross margin on a per Mcf basis decreased in 2008 due to an increase in fee-based system throughput volumes. These increased volumes are associated with PVR’s 2008 expansions and acquisitions.
Revenues Other Intangible Assets, goodwill recordedThan Gross Margin
Equity earnings in connection withequity investment increased due to PVR’s April 2008 acquisition of a 25% member interest in Thunder Creek, a joint venture that gathers and transports CBM in Wyoming’s Powder River Basin. PVR acquired the member interest in April 2008.
Producer services revenues increased due to an increase in agent fees for the marketing of Penn Virginia’s and third parties’ natural gas production. Agent fees increased primarily due to increases in Penn Virginia’s natural gas production as well as increases in the price of natural gas.
Expenses
Operating expenses increased due to expenses related to PVR’s expanding footprint in areas of operation, including acquisitions and business combinations is not amortized, but testedthe addition of the Spearman and Crossroads plants. These expenses include increased repairs and maintenance expenses, increased compressor rentals, chemical and treating expenses and increased labor costs.
Taxes other than income decreased due to higher property taxes. The increase in property taxes was a result of PVR’s acquisitions and plant expansions.
General and administrative expenses increased due to increased staffing and related benefit costs. The increase in personnel was primarily attributable to PVR’s acquisitions, plant expansions and well connects in established areas of operation.
Impairment expense in 2008 was the result of a reduction in the value of goodwill. PVR tests goodwill for impairment on an annual basis, at least annually.
Goodwill impairment is determined using a two-step test.minimum, and more frequently if a triggering event occurs. The first step of the impairment test is used to identify potential impairment by comparing the fair value of a reporting unit to the book value, including goodwill. If the fair value of a reporting unit exceeds its book value, goodwill of the reporting unit is not considered impaired, and the second step of the impairment test is not required. If the book value of a reporting unit exceeds its fair value, the second step of the impairment test is performed to measure the amount of impairment loss, if any. The second step of the impairment test compares the implied fair value of the reporting unit’s goodwill with the book value of that goodwill. If the book value of the reporting unit’s goodwill exceeds the implied fair value of that goodwill, an impairment loss is recognized in an amount equal to that excess. The implied fair value of goodwill is determined in the same manner as the amount of goodwill recognized in a business combination. The annual impairment testing is performed in the fourth quarter.
Management uses a number of different criteria when evaluating an asset for possible impairment. Indicators such as significant decreases in a reporting unit’s book value, decreases in cash flows, sustained operating losses, a sustained decrease in market capitalization, adverse changes in the business climate, legal matters, losses of significant customers and new technologies which could accelerate obsolescence of business products are used by management when performing evaluations. We tested goodwill for impairment during the fourth quarter of 2008 and recordedidentified a goodwill impairment loss of $31.8 million. The impairment charge,loss, which was triggered by fourth quarter declines in oil and gas spot and futures prices and a
TABLE OF CONTENTS
decline in PVR’s market capitalization, reducesreduced to zero all goodwill recorded in conjunction with acquisitions made by the PVR natural gas midstream segment in 2008 and prior years.
Depreciation and amortization expenses increased primarily due to capital expansions on the Spearman and Crossroads plants and acquisitions.
Eliminations and Other
Year Ended December 31, 2009 Compared With Year Ended December 31, 2008
The following table presents a reconciliation of our reporting segments’ operating income (loss) to net income (loss) attributable to Penn Virginia for the periods presented:
| | | | | | | | |
| | Year Ended December 31, | | Favorable
(Unfavorable) | | % Change |
| | | 2009 | | 2008 |
| Operating income (loss) from segments | | $ | (67,691 | ) | | $ | 285,818 | | | $ | (353,509 | ) | | | (124%) | |
| Operating loss from Eliminations and other | | | (30,511 | ) | | | (28,995 | ) | | | (1,516 | ) | | | 5% | |
| Operating income (loss) | | | (98,202 | ) | | | 256,823 | | | | (355,025 | ) | | | (138%) | |
Other income (expense)
| | | | | | | | | | | | | | | | |
| Interest expense | | | (68,884 | ) | | | (49,299 | ) | | | (19,585)40% | |
| Derivatives | | | 11,854 | | | | 46,582 | | | | (34,728 | ) | | | (75%) | |
| Other | | | 2,612 | | | | (666 | ) | | | 3,278 | | | | (492%) | |
| Income tax (expense) benefit | | | 75,252 | | | | (71,920 | ) | | | 147,172 | | | | (205%) | |
| Net income (loss) | | | (77,368 | ) | | | 181,520 | | | | (258,888 | ) | | | (143%) | |
Less:
| | | | | | | | | | | | | | | | |
| Net income attributable to noncontrolling interests | | | (37,275 | ) | | | (60,436 | ) | | | 23,161 | | | | (38%) | |
| Net income (loss) attributable to Penn Virginia Corporation | | $ | (114,643 | ) | | $ | 121,084 | | | $ | (235,727 | ) | | | (195%) | |
The operating loss from eliminations and other is primarily attributable to corporate expenses which consist of general and administrative expenses other than from our operating segments. Corporate expenses increased in 2009 primarily due to higher salaries and benefits as well as higher depreciation expense. Compensation-based increases are attributable to the recognition of additional stock-based compensation expense, while the increase in depreciation is attributable to software development projects.
Interest Expense
Interest expense increased primarily as a result of higher interest rates on outstanding borrowings, including the Senior Notes, which were issued in June 2009. Also, we realized higher amortization of the original issue discount and issuance costs on the Senior Notes and Convertible Notes as well as higher amortization of issuance costs associated with the Revolver and PVR Revolver. In determiningaddition, capitalized interest declined during 2009 primarily as a result of our and PVR’s reduced capital expenditures programs. See Note 21 to the Consolidated Financial Statements for additional detail.
Derivatives
The components of our and PVR’s derivative activities are presented below for the periods presented:
| | | | | | | | |
| | Year Ended December 31, | | Favorable
(Unfavorable) | | % Change |
| | | 2009 | | 2008 |
| Oil and gas unrealized derivative gain (loss) | | $ | (26,690 | ) | | $ | 37,365 | | | $ | (64,055 | ) | | | (171%) | |
| Oil and gas realized gain (loss) | | | 59,908 | | | | (7,620 | ) | | | 67,528 | | | | (886%) | |
| Interest rate swap unrealized gain | | | 111 | | | | — | | | | 111 | | | | n/a | |
| Interest rate swap realized loss | | | (1,761 | ) | | | — | | | | (1,761 | ) | | | n/a | |
| PVR Midstream unrealized derivative gain (loss) | | | (25,974 | ) | | | 62,661 | | | | (88,635 | ) | | | (141%) | |
| PVR Midstream realized gain (loss) | | | 10,566 | | | | (37,189 | ) | | | 47,755 | | | | (128%) | |
| PVR interest rate swap unrealized gain (loss) | | | 3,260 | | | | (7,358 | ) | | | 10,618 | | | | (144%) | |
| PVR interest rate swap realized gain (loss) | | | (7,566 | ) | | | (1,277 | ) | | | (6,289 | ) | | | 492% | |
| | | $ | 11,854 | | | $ | 46,582 | | | $ | (34,728 | ) | | | (75%) | |
TABLE OF CONTENTS
Derivative activity is primarily due to volatility in the natural gas, NGL and crude oil prices. We determine the fair value of our and PVR’s commodity derivative agreements using quoted forward prices for these commodities. Cash received for settlements during 2009 was $61.1 million as compared to cash payments for settlement of $46.1 million during 2008.
Other
Other income, which primarily consists of interest income and gains and losses on non-operating securities, increased during 2009 primarily as a result of a $3.8 million make-whole payment recorded during 2008 in connection with PVR’s prepayment of its notes.
Income Tax Expense
Due to the PVR natural gas midstream segment (reporting unit),operating losses incurred during 2009, we usedrecognized an income approach. Undertax benefit as compared to income tax expense during 2008. The effective tax benefit rate for 2009 was 39.6% as compared to an effective tax rate of 37.3% for 2008. We expect to realize any income tax benefits created in 2009 by amending prior year tax returns and carrying forward any excess income tax benefits.
Noncontrolling Interests
Noncontrolling interests represent net income allocated to the limited partners of PVG owned by the public. The decrease in net income approach,attributable to noncontrolling interests during 2009 is directly attributable to a decrease in PVG’s net income, primarily attributable to a decrease in PVR’s operating income and other expenses as referenced above, partially offset by the fair valueeffect of our reduced ownership interest in PVG. In September 2009, we sold 10 million of our PVG common units, which reduced our ownership in PVG from 77.0% to 51.4%.
Year Ended December 31, 2008 Compared With Year Ended December 31, 2007
The following table presents a reconciliation of our reporting segments’ operating income (loss) to net income (loss) attributable to Penn Virginia for the periods presented:
| | | | | | | | |
| | Year Ended December 31, | | Favorable
(Unfavorable) | | % Change |
| | | 2008 | | 2007 |
| Operating income from segments | | $ | 285,818 | | | $ | 221,708 | | | $ | 64,110 | | | | 29% | |
| Operating loss from Eliminations and other | | | (28,995 | ) | | | (29,084 | ) | | | 89 | | | | (0%) | |
| Operating income | | | 256,823 | | | | 192,624 | | | | 64,199 | | | | 33% | |
Other income (expense)
| | | | | | | | | | | | | | | | |
| Interest expense | | | (49,299 | ) | | | (37,851 | ) | | | (11,448 | ) | | | 30% | |
| Derivatives | | | 46,582 | | | | (47,282 | ) | | | 93,864 | | | | (199%) | |
| Other | | | (666 | ) | | | 3,651 | | | | (4,317 | ) | | | (118%) | |
| Income tax expense | | | (71,920 | ) | | | (30,332 | ) | | | (41,588 | ) | | | 137% | |
| Net income | | | 181,520 | | | | 80,810 | | | | 100,710 | | | | 125% | |
Less:
| | | | | | | | | | | | | | | | |
| Net income attributable to noncontrolling interests | | | (60,436 | ) | | | (30,319 | ) | | | (30,117 | ) | | | 99% | |
| Net income attributable to Penn Virginia Corporation | | $ | 121,084 | | | $ | 50,491 | | | $ | 70,593 | | | | 140% | |
Operating Loss from Eliminations and Other
The operating loss from eliminations and other is primarily comprised of corporate operating expenses including general and administrative expenses other than from our operating segments. Corporate operating expenses increased in 2008 primarily due to increased DD&A expenses resulting from capitalized costs incurred on a software development project.
TABLE OF CONTENTS
Interest Expense
Interest expense increased in 2008 primarily as a result of the reporting unit is estimated basedfull year impact of interest and the accretion of original issue discount on the present value of expected future cash flows. The income approach is dependent on a number of factors including estimates of forecasted revenue and operating costs, appropriate discount rates and a market-derived earnings multiple terminal value (the value of the reporting unitour Convertible Notes which were issued at the end of the estimation period). Key assumptions used2007. In addition, we recognized $1.0 million in the discounted cash flows model described above include estimates of future commodity prices basednet hedging losses on the December 31, 2008 commodity price strips and estimates of operating, administrative and capital costs. We discounted the resulting future cash flows using a peer company based weighted average cost of capital of 12%.
This loss is recorded in the impairment line on our consolidated statements of income. The goodwill impairment loss reflects the negative impact of certain factors which resulted in a reduction in the anticipated cash flows used to estimate fair value. The business and marketplace environments in which PVR currently operates differs from the historical environments that drove the factors used to value and record the acquisition of these business units. Our goodwill balance at December 31, 2007 was $7.7 million. See Note 12 – “Goodwill” in the Notes to Consolidated Financial Statements in Item 8, “Financial Statements and Supplementary Data,” for a description of goodwill and the related impairment charge.
Oil and Gas Properties
We use the successful efforts method to account for our oil and gas properties. Under this method, costs of acquiring properties, costs of drilling successful exploration wells and development costs are capitalized. Geological and geophysical costs, delay rentals and costs to drill exploratory wells that do not discover proved reserves are expensed as oil and gas exploration. We will carry the costs of an exploratory well as an asset if the well found a sufficient quantity of reserves to justify its capitalization as a producing well and as long as we are making sufficient progress assessing the reserves and the economic and operating viability of the project. For certain projects, it may take us more than one year to evaluate the future potential of the exploratory well and make a determination of its economic viability. Our ability to move forward on a project may be dependent on gaining access to transportation or processing facilities or obtaining permits and government or partner approval, the timing of which is beyond our control. In such cases, exploratory well costs remain suspended as long as we are actively pursuing access to necessary facilities and access to such permits and approvals and believe that they will be obtained. We assess the status of suspended exploratory well costs on a quarterly basis.
A portion of the carrying value of our oil and gas properties is attributable to unproved properties. At December 31, 2008, the costs attributable to unproved properties were $154.8 million. We regularly assess on a property-by-property basis the impairment of individual unproved properties whose acquisition costs are relatively significant. Unproved properties whose acquisition costs are not relatively significant are amortized in the aggregate over the lesser of five years or the
average remaining lease term. As exploration work progresses and the reserves on significant properties are proven, capitalized costs of these properties will be subject to depreciation and depletion. If the exploration work is unsuccessful, the capitalized costs of the properties related to the unsuccessful work will be expensed. The timing of any write-downs of these unproven properties, if warranted, depends upon the nature, timing and extent of future exploration and development activities and their results.
Fair Value Measurements
We adopted SFAS No. 157,Fair Value Measurements, effective January 1, 2008, for financial assets and liabilities measured on a recurring basis. SFAS No. 157 applies to all financial assets and financial liabilities that are being measured and reported on a fair value basis. SFAS No. 157 defines fair value, establishes a framework for measuring fair value and requires enhanced disclosures about fair value measurements. The Financial Accounting Standards Board, or FASB, Staff Position FAS 157-2,Effective Date of FASB Statement No. 157, delays the application of SFAS No. 157 for nonfinancial assets and nonfinancial liabilities to fiscal years and interim periods beginning after November 15, 2008.
SFAS No. 157 requires fair value measurements to be classified and disclosed in one of the following three categories:
Level 1: Unadjusted quoted prices in active markets that are accessible at the measurement date for identical, unrestricted assets or liabilities. Level 1 inputs generally provide the most reliable evidence of fair value.
Level 2: Quoted prices in markets that are not active or inputs, which are observable, either directly or indirectly, for substantially the full term of the asset or liability.
Level 3: Prices or valuation techniques that require inputs that are both significant to the fair value measurement and unobservable (i.e., supported by little or no market activity).
We use the following methods and assumptions to estimate the fair values of financial instruments:
Marketable securities: Our marketable securities consist of various publicly traded equities. The fair values are based on quoted market prices, which are level 1 inputs.
Commodity derivative instruments: Both our oil and gas commodity derivatives and PVR’s natural gas midstream segment commodity derivatives utilize three-way collar derivative contracts. PVR also utilizes collar derivative contracts to hedge against the variability in its frac spread. We determine the fair values of our oil and gas derivative agreements based on discounted cash flows derived from third-party quoted forward prices for NYMEX Henry Hub gas and West Texas Intermediate crude oil closing prices as of December 31, 2008. PVR determines the fair values of its commodity derivative agreements based on discounted cash flows based on quoted forward prices for the respective commodities. We generally use the income approach, using valuation techniques that convert future cash flows to a single discounted value. Each of these is a level 2 input. See Note 8 – “Derivative Instruments” in the Notes to Consolidated Financial Statements in Item 8, “Financial Statements and Supplementary Data.”
Interest rate swaps: We have entered into thePrevious Interest Rate Swaps in interest expense during 2008. Interest expense attributable to establish fixed ratesPVR’s borrowings increased by $4.8 million primarily due to an increase in PVR’s average debt balance from $289.3 million in 2007 to $478.5 million in 2008. PVR also recognized $1.7 million in net hedging losses on a portion of the outstanding borrowings under the Revolver. PVR has entered into interest the PVR Interest Rate Swaps in interest expense during 2008.
Derivatives
The components of our and PVR’s derivative activities are presented below for the periods presented:
| | | | | | | | |
| | Year Ended December 31, | | Favorable
(Unfavorable) | | % Change |
| | | 2008 | | 2007 |
| Oil and gas unrealized derivative gain (loss) | | $ | 37,365 | | | $ | (15,842 | ) | | $ | 53,207 | | | | (336%) | |
| Oil and gas realized gain (loss) | | | (7,620 | ) | | | 14,128 | | | | (21,748 | ) | | | (154%) | |
| PVR Midstream unrealized derivative gain (loss) | | | 62,661 | | | | (27,789 | ) | | | 90,450 | | | | (325%) | |
| PVR Midstream realized gain loss | | | (37,189 | ) | | | (17,779 | ) | | | (19,410 | ) | | | 109% | |
| PVR interest rate swap unrealized loss | | | (7,358 | ) | | | — | | | | (7,358 | ) | | | n/a | |
| PVR interest rate swap realized loss | | | (1,277 | ) | | | — | | | | (1,277 | ) | | | n/a | |
| | | $ | 46,582 | | | $ | (47,282 | ) | | $ | 93,864 | | | | (199%) | |
Derivative activity reflects volatility experienced in 2008 primarily attributable to establish fixed rates on a portion of the outstanding borrowings under the PVR Revolver. We use an income approach using valuation techniques that connect future cash flows to a single discounted value. We estimate the fair value of the swaps based on published interest rate yield curves as of the date of the estimate. Each of these is a level 2 input. See Note 8 – “Derivative Instruments”developments in the Notes to Consolidated Financial Statements in Item 8, “Financial Statementscommodity markets reflecting global economic declines.
Other
Other income, which primarily consists of interest income and Supplementary Data.”
Gain on Sale of Subsidiary Units
We account for PVR equity issuances as sales of minority interest. For each PVR equity issuance, we have calculated a gain under SEC Staff Accounting Bulletin No. 51 (or Topic 5-H),Accounting for Sales of Stock by a Subsidiary(“SAB 51”). SAB 51 provides guidance on accounting for the effect of issuances of a subsidiary’s stock on the parent’s investment in that subsidiary. In some situations, SAB 51 allows registrants to elect an accounting policy of recording gains or losses on issuances of stock by a subsidiary either in income or as a capital transaction. Accordingly, we adopted a policy of recording SAB 51 gains and losses directly to shareholders’ equity.
New Accounting Pronouncements
In December 2007, the FASB issued SFAS No. 160, Noncontrolling Interests in Consolidated Financial Statements, an amendment of ARB No. 51, which mandates that a noncontrolling (minority) interest shall be reported in the consolidated statement of financial position within equity, separately from the parent company’s equity. This statement amends ARB No. 51 and clarifies that a noncontrolling interest in a subsidiary is an ownership interest in the consolidated entity. SFAS No. 160 also requires consolidated net income to include amounts attributable to both the parent and noncontrolling interest and requires disclosure, on the face of the consolidated statements of income, of the amounts of consolidated net income attributable to the parent and to the noncontrolling interest. SFAS No. 160 also requires that gains from the sales of subsidiary stock be recorded directly to shareholders’ equity. If we sell sufficient controlling interest in our subsidiaries to require deconsolidation of those subsidiaries, then we expect to record a gain or loss on our consolidated statements of income. SFAS No. 160 became effective January 1, 2009 and will result in the classification of minority interest in PVG and PVR to be recordednon-operating securities, decreased during 2008 primarily as a componentresult of shareholders’ equity. Net income and comprehensive income attributable to the noncontrolling interest will be separately presented on the face of the consolidated statements of income and consolidated statement of shareholders’ equity and comprehensive income, applied retrospectively for all periods presented.
In Maya $3.8 million make-whole payment recorded during 2008 the FASB issued Staff Position No. APB 14-1,Accounting for Convertible Debt Instruments That May Be Settled in Cash upon Conversion (Including Partial Cash Settlement) (“FSP APB 14-1”). This standard requires issuers of convertible debt that may be settled wholly or partly in cash to account for the debt and equity components separately. FSP APB 14-1 requires that issuers of convertible debt separately account for the liability and equity components in a manner that will reflect the entity’s nonconvertible debt borrowing rate when interest cost is recognized in subsequent periods. FSP APB 14-1 is effective for financial statements issued for fiscal years beginning after December 15, 2008 and interim periods within those years, and must be applied retrospectively to all periods presented. Early adoption is prohibited. The adoption of FSP APB 14-1 will result in increased interest expense of approximately $8.0 million to $12.0 million for 2009. Beginningconnection with the first quarter of 2009, we will recast our financial statements to retroactively apply the increase in interest expense resulting from the adoption to all periods presented. See Note 19 “Long-Term Debt” in the Notes to Consolidated Financial Statements in Item 8, “Financial Statements and Supplementary Data,” for a discussion of our convertible notes.
Revised Oil and Gas Standard
In December 2008, the SEC released the final rule forModernization of Oil and Gas Reporting, or Modernization. The Modernization disclosure requirements will permit reporting of oil and gas reserves using an average price based upon the prior 12-month period rather than year-end prices and the use of new technologies to determine proved reserves, if those technologies have been demonstrated to result in reliable conclusions about reserves volumes. Companies will also be allowed to disclose probable and possible reserves to investors in SEC filed documents. In addition, companies will be required to report the independence and qualificationsPVR’s prepayment of its reserves preparer or auditor and file reports when a third party is relied uponnotes.
Income Tax Expense
The effective tax rate for 2008 was 37.3% as compared to prepare reserves estimates or conduct a reserves audit. The Modernization disclosure requirements will becomean effective tax rate of 37.5% for the year ended December 31, 2009. The SEC is coordinating with the FASB to obtain the revisions necessary under SFAS No. 19,Financial Accounting and Reporting by Oil and Gas Producing Companies, and SFAS No. 69,Disclosures about Oil and Gas Producing Activities, to provide consistency with the Modernization. In the event that consistency is not achieved in time for companies to comply with the Modernization, the SEC will consider delaying the compliance date.2007.
Environmental Matters
Extensive federal, state and local laws govern oil and natural gas operations, regulate the discharge of materials into the environment or otherwise relate to the protection of the environment. Numerous governmental departments issue rules and regulations to implement and enforce such laws that are often difficult and costly to comply with and which carry substantial administrative, civil and even criminal penalties for failure to comply. Some laws, rules and regulations relating to protection of the environment may, in certain circumstances, impose “strict liability” for environmental contamination, rendering a person liable for environmental and natural resource damages and cleanup costs without regard to negligence or fault on the part of such person. Other laws, rules and regulations may restrict the rate of oil and natural gas production below the rate that would otherwise exist or even prohibit exploration or production activities in sensitive areas. In addition, state laws often require some form of remedial action to prevent pollution from former operations, such as closure of inactive pits and plugging of abandoned wells. The regulatory burden on the oil and natural gas industry increases its cost of doing business and consequently affects its profitability. These laws, rules and regulations affect our operations, as well as the oil and gas exploration and production industry in general. We believe that we are in substantial compliance with current applicable environmental laws, rules and regulations and that continued compliance with existing requirements will not have a material impact on our financial condition or results of operations. Nevertheless, changes in existing environmental laws or the adoption of new environmental laws have the potential to adversely affect our operations.
TABLE OF CONTENTS
PVR’s operations and those of its lessees are subject to environmental laws and regulations adopted by various governmental authorities in the jurisdictions in which these operations are conducted. The terms of PVR’s coal property leases impose liability on the relevant lessees for all environmental and reclamation liabilities arising under those laws and regulations. The lessees are bonded and have indemnified PVR against any and all future environmental liabilities. PVR regularly visits its coal properties to monitor lessee compliance with environmental laws and regulations and to review mining activities. PVR’s management believes that its operations and those of its lessees comply with existing laws and regulations and does not expect any material impact on its financial condition or results of operations.
As of December 31, 20082009 and 2007,2008, PVR’s environmental liabilities were $1.2$1.0 million and $1.5$1.2 million, which represents PVR’s best estimate of the liabilities as of those dates related to its coal and natural resource management and natural gas midstream businesses. PVR has reclamation bonding requirements with respect to certain unleased and inactive properties. Given the uncertainty of when a reclamation area will meet regulatory standards, a change in this estimate could occur in the future. For a summary of the environmental laws and regulations applicable to PVR’s operations, see Item 1, “Business—Government“Business-Government Regulation and Environmental Matters.”
RecentCritical Accounting Pronouncements
Estimates
The process of preparing financial statements in accordance with accounting principles generally accepted in the United States of America requires our management to make estimates and judgments regarding certain items and transactions. It is possible that materially different amounts could be recorded if these estimates and judgments change or if the actual results differ from these estimates and judgments. We consider the following to be the most critical accounting policies which involve the judgment of our management.
Oil and Gas Reserves
The estimates of oil and gas reserves are the single most critical estimate included in our Consolidated Financial Statements. Reserve estimates become the basis for determining depletive write-off rates, recoverability of historical cost investments and the fair value of properties subject to potential impairments. There are many uncertainties inherent in estimating crude oil and natural gas reserve quantities, including projecting the total quantities in place, future production rates and the timing of future development expenditures. In addition, reserve estimates of new discoveries are less precise than those of producing properties due to the lack of a production history. Accordingly, these estimates are subject to change as additional information becomes available.
Proved reserves are the estimated quantities of crude oil, condensate and natural gas that geological and engineering data demonstrate with reasonable certainty to be recoverable in future years from known oil and gas reservoirs under existing economic and operating conditions at the end of the respective years. Proved developed reserves are proved reserves that can be expected to be recovered through existing wells with existing equipment and operating methods. Proved undeveloped reserves are those reserves that are expected to be recovered from new wells or undrilled acreage, or from existing wells where a relatively major expenditure is required for recompletion.
There are several factors which could change our estimates of oil and gas reserves. Significant rises or declines in product prices could lead to changes in the amount of reserves as production activities become more or less economical. An additional factor that could result in a change of recorded reserves is the reservoir decline rates differing from those assumed when the reserves were initially recorded. Estimation of future production and development costs is also subject to change partially due to factors beyond our control, such as energy costs and inflation or deflation of oil field service costs. Additionally, we perform impairment tests when significant events occur, such as a market move to a lower price environment or a material revision to our reserve estimates. For the years ended December 31, 2009, 2008 and 2007, we recorded impairment charges related to our oil and gas segment properties of $102.3 million, $20.0 million and $2.6 million. See the discussions of Results of Operations — Oil and Gas Segment and Note 19 to the Consolidated Financial Statements for a further description of the impairment of our oil and gas properties.
TABLE OF CONTENTS
Oil and Gas Properties
We use the successful efforts method to account for our oil and gas properties. Under this method, costs of acquiring properties, costs of drilling successful exploration wells and development costs are capitalized. Geological and geophysical costs, delay rentals and costs to drill exploratory wells that do not discover proved reserves are expensed as oil and gas exploration. We will carry the costs of an exploratory well as an asset if the well found a sufficient quantity of reserves to justify its capitalization as a producing well and as long as we are making sufficient progress assessing the reserves and the economic and operating viability of the project. For certain projects, it may take us more than one year to evaluate the future potential of the exploratory well and make a determination of its economic viability. Our ability to move forward on a project may be dependent on gaining access to transportation or processing facilities or obtaining permits and government or partner approval, the timing of which is beyond our control. In such cases, exploratory well costs remain suspended as long as we are actively pursuing access to necessary facilities and access to such permits and approvals and believe that they will be obtained. We assess the status of suspended exploratory well costs on a quarterly basis.
A portion of the carrying value of our oil and gas properties is attributable to unproved properties. At December 31, 2009, the costs attributable to unproved properties were $73.1 million. We regularly assess on a property-by-property basis the impairment of individual unproved properties whose acquisition costs are relatively significant. Unproved properties whose acquisition costs are not relatively significant are amortized in the aggregate over the lesser of five years or the average remaining lease term. As exploration work progresses and the reserves on significant properties are proven, capitalized costs of these properties will be subject to depreciation and depletion. If the exploration work is unsuccessful, the capitalized costs of the properties related to the unsuccessful work will be charged to exploration expense. The timing of any write-downs of these unproven properties, if warranted, depends upon the nature, timing and extent of future exploration and development activities and their results.
Depreciation, Depletion and Amortization
We determine depreciation and depletion of oil and gas producing properties by the units-of-production method and these amounts could change with revisions to estimated proved recoverable reserves. We compute depreciation and amortization of property and equipment using the straight-line balance method over the estimated useful life of each asset.
PVR depletes coal properties on an area-by-area basis at a rate based on the cost of the mineral properties and the number of tons of estimated proven and probable coal reserves contained therein. Proven and probable coal reserves have been estimated by PVR’s own geologists and outside consultants. PVR’s estimates of coal reserves are updated periodically and may result in adjustments to coal reserves and depletion rates that are recognized prospectively. From time to time, PVR carries out core-hole drilling activities on its coal properties in order to ascertain the quality and quantity of the coal contained in those properties. These core-hole drilling activities are expensed as incurred. PVR depletes timber using a methodology consistent with the units-of-production method, but that is based on the quantity of timber harvested. PVR determines depletion of oil and gas royalty interests by the units-of-production method and these amounts could change with revisions to estimated proved recoverable reserves. When PVR retires or sells an asset, we remove its cost and related accumulated depreciation and amortization from our Consolidated Balance Sheets. We record the difference between the net book value, net of any assumed asset retirement obligation, and proceeds from dispositions of property and equipment as a gain or loss.
Intangible assets are primarily associated with assumed contracts, customer relationships and rights-of-way. These intangible assets are amortized over periods of up to 20 years, the period in which benefits are derived from the contracts, relationships and rights-of-way, and are combined with property, plant and equipment and are reviewed for impairment. See Note 11 to the Consolidated Financial Statements for a more detailed description of our and PVR’s intangible assets.
Derivative Activities
From time to time, we and PVR enter into derivative financial instruments to mitigate our exposure to natural gas, crude oil and NGL price volatility. The derivative financial instruments, which are placed with financial institutions that we believe are acceptable credit risks, take the form of collars and three-way collars.
TABLE OF CONTENTS
All derivative financial instruments are recognized in our Consolidated Financial Statements at fair value. The fair values of our derivative instruments are determined based on discounted cash flows derived from quoted forward prices. All derivative transactions are subject to our risk management policy, which has been reviewed and approved by our board of directors.
We recognize changes in fair value in earnings currently in the derivatives line on the Consolidated Statements of Income. We have experienced and could continue to experience significant changes in the estimate of unrealized derivative gains or losses recognized due to fluctuations in the value of these commodity derivative contracts. Our results of operations are affected by the volatility of mark-to-market gains and losses and changes in fair value, which fluctuate with changes in natural gas, crude oil and NGL prices. These fluctuations could be significant in a volatile pricing environment. See Note 8 to the Consolidated Financial Statements for a further description of our and PVR’s derivatives programs.
New Accounting Standards
See Note 3 – “Summary of Significant Accounting Policies” into the Notes to Consolidated Financial Statements in Item 8, “Financial Statements and Supplementary Data,” for a description of recent accounting pronouncements.standards.
Forward-Looking Statements
Certain statements contained herein that are not descriptions of historical facts are “forward-looking” statements within the meaning of Section 27A of the Securities Act
Item 7A Quantitative and Section 21E of the Exchange Act. Because such statements include risks, uncertainties and contingencies, actual results may differ materially from those expressed or implied by such forward-
looking statements. These risks, uncertainties and contingencies include, but are not limited to, the risks set forth in Item 1A, “Risk Factors.”
Additional information concerning these and other factors can be found in our press releases and public periodic filings with the SEC. Many of the factors that will determine our future results are beyond the ability of management to control or predict. Readers should not place undue reliance on forward-looking statements, which reflect management’s views only as of the date hereof. We undertake no obligation to revise or update any forward-looking statement or to make any other forward-looking statements, whether as a result of new information, future events or otherwise.
Item 7A | Quantitative and Qualitative Disclosures About Market Risk |
Qualitative Disclosures About Market RiskMarket risk is the risk of loss arising from adverse changes in market rates and prices. The principal market risks to which we and PVR are exposed are as follows:
As a result of our and PVR’s risk management activities as discussed below, we are also exposed to counterparty risk with financial institutions with whom we and PVR enter into these risk management positions. Sensitivity to these risks has heightened due to the recent deteriorationstate of the global economy, including financial and credit markets.
At December 31, 2008, PVR reported a net commodity derivative asset related to the natural gas midstream segment of $22.7 million that is with two counterparties and is substantially concentrated with one of those counterparties. We reported a net commodity derivative asset related to our oil and gas segment of $41.2 million, 72% of which was concentrated with three counterparties. These concentrations may impact our overall credit risk, either positively or negatively, in that these counterparties may be similarly affected by changes in economic or other conditions. Neither we nor PVR paid nor received collateral with respect to our derivative positions. No significant uncertainties related to the collectability of amounts owed to us or PVR exists with regard to these counterparties.
Price Risk
We produce and sell natural gas, crude oil, NGLs and coal. As a result, our financial results are affected when prices for these commodities fluctuate. Such effects can be significant. Our and PVR’s price risk management program permitsprograms permit the utilization of derivative financial instruments (such as futures, forwards, option contracts, costless collars, three-way collars and swaps) to seek to mitigate the price risks associated with fluctuations in natural gas, NGL and crude oil prices as they relate to our anticipated production and PVR’s natural gas midstream business. The derivative financial instruments are placed with major financial institutions that we and PVR believe are of acceptable credit risk. The fair values of
At December 31, 2009, we reported a commodity derivative asset related to our price risk management activities are significantly affected by fluctuations in the prices of natural gas, NGLs and crude oil.
Quantities of proved reserves are estimated based on economic conditions in existence in the period of assessment. Lower oil and gas pricessegment of $14.5 million. The contracts underlying such commodity derivatives are with four counterparties, all of which are investment grade financial institutions, and over 50% of such commodity derivative asset is substantially concentrated with one of these counterparties. This concentration may haveimpact our overall credit risk, either positively or negatively, in that these counterparties may be similarly affected by changes in economic or other conditions. We neither paid nor received collateral with respect to our derivative positions. The maximum amount of loss due to credit risk if counterparties to our derivative asset positions fail to perform according to the impact of shortening the economic lives on certain fields because it becomes uneconomic to produce all recoverable reserves on such fields, thus reducing proved property reserve estimates. If such revisions in the estimated quantities of proved reserves occur, it will have the effect of increasing the rates of DD&A on the affected properties, which would decrease earnings or result in losses through higher DD&A expense. The revisions may also be sufficient enough to cause impairment losses on certain properties that would result in a further non-cash expense to earnings. If natural gas, crude oil and NGL prices decline or we drill uneconomic wells, it is reasonably possible we could have a significant impairment.
The PVR natural gas midstream segment has completed a number of acquisitions in recent years. See Note 4, “Acquisitions and Divestitures,” for a descriptionterms of the PVR natural gas midstream segment’s material acquisitions. In conjunction with our accounting for these acquisitions, it was necessary for PVRcontracts would be equal to estimate the valuesfair value of the assets acquired and liabilities assumed, which involvedcontracts as of December 31, 2009. No significant uncertainties related to the usecollectability of various assumptions. The most significant assumptions, and the ones requiring the most judgment, involve the estimated fair values of property, plant and equipment, and the resulting amount of goodwill, if any. Changes in operations, further decreases in commodity prices, changes in the business environment or further deteriorations of market conditions could substantially alter management’s assumptions and could result in lower estimates of values of acquired assets or of future cash flows. Ifamounts owed to us exist with regard to these events occur, it is reasonably possible we could have a significant impairment charge to be recorded in our consolidated statements of income.counterparties.
In 2008,2009, we reported consolidated net derivative gains of $46.6$11.9 million. Until April 30, 2006, we applied hedge accounting for commodity derivative financial instruments as allowed under SFAS No. 133. Our commodity derivative financial instruments initially qualified as cash flow hedges, and changes in fair value of the effective portion of contracts were deferred in accumulated other comprehensive income until the hedged transactions settled. When we discontinued hedge accounting for commodity derivatives, a net loss of $12.1 million remained in accumulated other comprehensive income. As the hedged transactions settled in 2006, 2007 and 2008,Because we and PVR recognized the $12.1 million of deferred changes in fair value in revenues and cost of gas purchased in our consolidated statements of income. As of December 31, 2008, neither we nor PVR had any net losses remaining in accumulated other comprehensive income.
Because we no longer applyuse hedge accounting for our commodity derivatives, we recognize changes in fair value in earnings currently in the derivatives line item on the consolidated statementsour Consolidated Statements of income.Income. We have experienced and could continue to experience significant changes in the estimate of derivative gains or losses recognized due to fluctuations in the value of our and PVR’s commodity derivative contracts. The discontinuation of hedge accounting has no impact on our reported cash flows, although ourOur and PVR’s results of operations are affected by the volatility of mark-to-marketunrealized gains and losses and changes in fair value, which fluctuate with changes in natural gas, crude oil and NGL prices. These fluctuations could be significant in a volatile pricing environment. See Note 8 – “Derivative Instruments” into the Notes to Consolidated Financial Statements in Item 8, “Financial Statements and Supplementary Data,” for a further description of our and PVR’s derivatives programs.
TABLE OF CONTENTS
Oil and Gas Segment
The following table lists our open mark-to-market commodity derivative agreements and their fair values as of December 31, 2008:2009:
| | | | | | | | | | | | | | |
| | | Average
Volume
Per Day | | Weighted Average Price | | Estimated
Fair Value
(in
thousands) |
| | | Additional
Put
Option | | Floor | | Ceiling | |
| | | (in
MMBtus) | | | | (per
MMBtu) | | | | |
Natural Gas Three-way Collars | | | | | | | | | | | | | | |
First Quarter 2009 | | 65,000 | | $ | 6.00 | | $ | 8.67 | | $ | 11.68 | | $ | 13,688 |
Second Quarter 2009 | | 40,000 | | $ | 6.38 | | $ | 8.75 | | $ | 10.79 | | | 6,918 |
Third Quarter 2009 | | 40,000 | | $ | 6.38 | | $ | 8.75 | | $ | 10.79 | | | 6,166 |
Fourth Quarter 2009 | | 30,000 | | $ | 6.83 | | $ | 9.50 | | $ | 13.60 | | | 4,869 |
First Quarter 2010 | | 30,000 | | $ | 6.83 | | $ | 9.50 | | $ | 13.60 | | | 4,070 |
| | | | | |
| | | (Bbl) | | | | (Bbl) | | | | |
Crude Oil Three-way Collars | | | | | | | | | | | | | | |
First Quarter 2009 | | 500 | | $ | 80.00 | | $ | 110.00 | | $ | 179.00 | | | 1,328 |
Second Quarter 2009 | | 500 | | $ | 80.00 | | $ | 110.00 | | $ | 179.00 | | | 1,272 |
Third Quarter 2009 | | 500 | | $ | 80.00 | | $ | 110.00 | | $ | 179.00 | | | 1,236 |
Fourth Quarter 2009 | | 500 | | $ | 80.00 | | $ | 110.00 | | $ | 179.00 | | | 1,197 |
| | | | | |
Settlements to be paid in subsequent month | | | | | | | | | | | | | | 465 |
| | | | | | | | | | | | | | |
| | | | | |
Oil and gas segment commodity derivatives - net asset | | | | | | | | | | | | | $ | 41,209 |
| | | | | | | | | | | | | | |
| | | | | | | | | | |
| | Average
Volume Per
Day | | Weighted Average Price |
| | | Additional
Put Option | | Floor | | Ceiling | | Fair Value |
| Natural Gas Costless Collars | | | (in MMBtus) | | | | | | | | (per MMBtu) | | | | | | | | | |
| First Quarter 2010 | | | 35,000 | | | | | | | $ | 4.96 | | | $ | 7.41 | | | $ | 115 | |
| Second Quarter 2010 | | | 30,000 | | | | | | | $ | 5.33 | | | $ | 8.02 | | | | 1,047 | |
| Third Quarter 2010 | | | 30,000 | | | | | | | $ | 5.33 | | | $ | 8.02 | | | | 883 | |
| Fourth Quarter 2010 | | | 50,000 | | | | | | | $ | 5.65 | | | $ | 8.77 | | | | 1,656 | |
| First Quarter 2011 | | | 50,000 | | | | | | | $ | 5.65 | | | $ | 8.77 | | | | 307 | |
| Second Quarter 2011 | | | 30,000 | | | | | | | $ | 5.67 | | | $ | 7.58 | | | | 787 | |
| Third Quarter 2011 | | | 30,000 | | | | | | | $ | 5.67 | | | $ | 7.58 | | | | 553 | |
| Fourth Quarter 2011 | | | 20,000 | | | | | | | $ | 6.00 | | | $ | 8.50 | | | | 469 | |
| First Quarter 2012 | | | 20,000 | | | | | | | $ | 6.00 | | | $ | 8.50 | | | | (28 | ) |
| Natural Gas Three-way Collars | | | (in MMBtus) | | | | | | | | (per MMBtu) | | | | | | | | | |
| First Quarter 2010 | | | 30,000 | | | $ | 6.83 | | | $ | 9.50 | | | $ | 13.60 | | | | 6,914 | |
| Natural Gas Swaps | | | (in MMBtus) | | | | | | | | (per MMBtu) | | | | | | | | | |
| First Quarter 2010 | | | 15,000 | | | | | | | $ | 6.19 | | | | | | | | 733 | |
| Second Quarter 2010 | | | 30,000 | | | | | | | $ | 6.17 | | | | | | | | 1,648 | |
| Third Quarter 2010 | | | 30,000 | | | | | | | $ | 6.17 | | | | | | | | 1,122 | |
| Crude Oil Costless Collars | | | (barrels) | | | | | | | | (per barrel) | | | | | | | | | |
| First Quarter 2010 | | | 500 | | | | | | | $ | 60.00 | | | $ | 74.75 | | | | (308 | ) |
| Second Quarter 2010 | | | 500 | | | | | | | $ | 60.00 | | | $ | 74.75 | | | | (455 | ) |
| Third Quarter 2010 | | | 500 | | | | | | | $ | 60.00 | | | $ | 74.75 | | | | (546 | ) |
| Fourth Quarter 2010 | | | 500 | | | | | | | $ | 60.00 | | | $ | 74.75 | | | | (608 | ) |
| Settlements to be received in subsequent period | | | | | | | | | | | | | | | | | | | 226 | |
We estimate that a $1.00 per MMBtu increase in the natural gas purchase price would decrease the fair value of the natural gas derivatives by $22.4 million. We estimate that a $1.00 per MMBtu decrease in the natural gas purchase price would increase the fair value for the natural gas derivatives by $22.9 million. In addition, we estimate that a $5.00 per barrel increase in the crude oil price would decrease the fair value of our crude oil derivatives by $0.8 million. We estimate that a $5.00 per barrel decrease in the crude oil price would increase the fair value of our crude oil derivatives by $0.7 million.
We estimate that, excluding the derivative positions described above, for every $1.00 per MMBtu increase or decrease in the natural gas price, oil and gas segment operating income in 2009for 2010 would increase or decrease by approximately $41.0$17.8 million. In addition, we estimate that for every $5.00 per barrel increase or decrease in the crude oil price, oil and gas segment operating income in 2009for 2010 would increase or decrease by approximately $4.0$1.8 million. This assumes that crude oil prices, natural gas prices and inletproduction volumes remain constant at anticipated levels. These estimated changes in gross margin and operating income exclude potential cash receipts or payments in settling these derivative positions.
We estimate that a $1.00 per MMBtu increase in the natural gas purchase price would decrease the fair value of the natural gas three-way collars by $7.7 million. We estimate that a $1.00 per MMBtu decrease in the natural gas purchase price would increase the fair value for the natural gas three-way collars by $5.6 million. We estimate that for a $5.00 per barrel increase in the crude oil price, the fair value of the crude oil three-way collar would decrease by $0.1 million. We estimate that for a $5.00 per barrel decrease in the crude oil price, the fair value of the crude oil three-way collar would increase by $0.2 million. These estimated changes exclude potential cash receipts or payments in settling these derivative positions.TABLE OF CONTENTS
PVR Natural Gas Midstream Segment
The following table lists PVR’s open mark-to-market commodity derivative agreements and their fair values as of December 31, 2008:2009:
| | | | | | | | | | | | | | |
| | | Average
Volume
Per Day | | Weighted Average Price | | Fair Value
(in
thousands) |
| | | Additional
Put
Option | | Floor | | Ceiling | |
| | | (in
barrels) | | | | (per
barrel) | | | | |
Crude Oil Three-way Collar | | | | | | | | | | | | | | |
First Quarter 2009 through Fourth Quarter 2009 | | 1,000 | | $ | 70.00 | | $ | 90.00 | | $ | 119.25 | | $ | 6,101 |
| | | | | |
| | | (in
MMBtu) | | | | (per
MMBtu) | | | | |
Frac Spread Collar | | | | | | | | | | | | | | |
First Quarter 2009 through Fourth Quarter 2009 | | 6,000 | | | | | $ | 9.09 | | $ | 13.94 | | | 14,943 |
| | | | | |
Settlements to be received in subsequent month | | | | | | | | | | | | | | 1,694 |
| | | | | | | | | | | | | | |
| | | | | |
Natural gas midstream segment commodity derivatives - net asset | | | | | | | | | | | | | $ | 22,738 |
| | | | | | | | | | | | | | |
| | | | | | | | | | |
| | Average
Volume Per
Day | | Weighted Average Price |
| | | Swap Price | | Floor | | Ceiling | | Fair Value |
| Crude Oil Collar | | | (barrels) | | | | | | | | ($ per barrel) | | | | | |
| First through Fourth Quarter 2010 | | | 750 | | | | | | | $ | 70.00 | | | $ | 81.25 | | | $ | (1,329 | ) |
| First through Fourth Quarter 2010 | | | 1,000 | | | | | | | $ | 68.00 | | | $ | 80.00 | | | | (2,171 | ) |
| First through Fourth Quarter 2011 | | | 400 | | | | | | | $ | 75.00 | | | $ | 98.50 | | | | 18 | |
| Natural Gas Purchase Swap | | | (MMBtus) | | | | ($ per MMBtu) | | | | | | | | | | | | | |
| First through Fourth Quarter 2010 | | | 5,000 | | | | 5.815 | | | | | | | | | | | | (41 | ) |
| First through Fourth Quarter 2011 | | | 3,000 | | | | 6.430 | | | | | | | | | | | | (99 | ) |
| NGL – Natural Gasoline Collar | | | (gallons) | | | | | | | | ($ per gallon) | | | | | |
| First through Fourth Quarter 2011 | | | 60,000 | | | | | | | $ | 1.55 | | | $ | 1.92 | | | | (945 | ) |
| Settlements to be received in subsequent period | | | | | | | | | | | | | | | | | | | 1,331 | |
We estimatePVR estimates that a $5.00 per barrel increase in the crude oil price would decrease the fair value of its crude oil collars by $3.1 million. PVR estimates that a $5.00 per barrel decrease in the crude oil price would increase the fair value of its crude oil collars by $2.8 million. PVR estimates that a $1.00 per MMBtu increase in the natural gas price would increase the fair value of its natural gas purchase swaps by $2.7 million. PVR estimates that a $1.00 per MMBtu decrease in the natural gas price would decrease the fair value of its natural gas purchase swaps by $2.7 million. PVR estimates that a $0.11 per gallon increase in the natural gasoline (a natural gas liquid, NGL) price would decrease the fair value of its natural gasoline collar by $1.8 million. PVR estimates that a $0.11 per gallon decrease in the natural gasoline price would increase the fair value of its natural gasoline collar by $1.7 million.
PVR estimates that, excluding the effects of derivative positions described above, for every $1.00 per MMBtu increase or decrease in the natural gas price, its natural gas midstream gross margin and operating income in 2009for 2010 would increase or decrease or increase by approximately $4.7$6.9 million. In addition, we estimate that for every $5.00 per barrel increase or decrease in the crude oil price, our natural gas midstream gross margin and operating income in 20092010 would increase or decrease by approximately $4.6$11.5 million. This assumes that natural gas prices, crude oil prices, natural gas prices and inlet volumes remain constant at anticipated levels. These estimated changes in PVR’s gross margin and operating income exclude potential cash receipts or payments in settling these derivative positions.
We estimate that for a $5.00 per barrel increase in the crude oil price, the fair value of the crude oil three-way collar would decrease by $0.5 million. We estimate that for a $5.00 per barrel decrease in the crude oil price, the fair value of the crude oil three-way collar would increase by $0.4 million. In addition, we estimate that a $1.00 per MMBtu increase or decrease in the natural gas purchase price and a $4.65 per barrel (the estimated equivalent of $5.00 per barrel of crude oil) increase or decrease in the NGL sales price would affect the fair value of the frac spread collar by $0.3 million. These estimated changes exclude potential cash receipts or payments in settling these derivative positions.
Interest Rate Risk
As of December 31, 2008, we had $332.0 million of outstanding indebtedness under the Revolver, which carries a variable interest rate throughout its term. We entered into the Interest Rate Swaps to effectively convert the interest rate on $50.0 million of the amount outstanding under the Revolver from a LIBOR-based floating rate to a weighted average fixed rate of 5.34% plus the applicable margin until December 2010. The Interest Rate Swaps are accounted for as cash flow hedges in accordance with SFAS No. 133. A 1% increase in short-term interest rates on the floating rate debt outstanding under the Revolver (net of amounts fixed through hedging transactions) as of December 31, 2008 would cost us approximately $2.8 million in additional interest expense.
As of December 31, 2008,2009, PVR had $568.1$620.1 million of outstanding indebtedness under the PVR Revolver, which carries a variable interest rate throughout its term. PVR entered into the PVR Interest Rate Swaps to effectively convert theestablish fixed interest raterates on $285.0 milliona portion of the amount outstanding indebtedness under the PVR Revolver. Until March 2010, the notional amounts of the PVR Interest Rate Swaps total $310.0 million, or 50%, of PVR’s outstanding indebtedness under the PVR Revolver from a LIBOR-based floating rate toas of December 31, 2009, with PVR paying a weighted average fixed rate of 3.67% plus3.54% on the applicable margin until March 2010.notional amount, and the counterparties paying a variable rate equal to the three-month LIBOR. From March 2010 to December 2011, the notional amounts of the PVR Interest Rate Swaps total $225.0$250.0 million, or 40.3% of PVR’s outstanding indebtedness under the PVR Revolver as of December 31, 2009, with PVR paying a weighted average fixed rate of 3.52%3.37% on the notional amount, and the counterparties paying a variable rate equal to the three-month LIBOR. From December 2011 to December 2012, the notional amounts of the PVR Interest Rate Swaps total $75.0$100.0 million, or 16.1% of PVR’s outstanding indebtedness under the PVR Revolver as of December 31, 2009, with PVR paying a weighted average fixed rate of 2.10%2.09% on the notional amount, and the counterparties paying a variable rate equal to the three-month LIBOR. The PVR Interest Rate Swaps extend one year past the maturity of the current PVR Revolver. A 1% increase in short-term interest rates on the floating rate debt outstanding under the PVR Revolver (net of amounts fixed through hedging transactions)the PVR Interest Rate Swaps) as of December 31, 20082009 would cost usPVR approximately $2.8$3.1 million in additional interest expense.expense per year.
TABLE OF CONTENTS
During the first quarter of 2009, both we and PVR continues to applydiscontinued hedge accounting to somefor all of the Previous Interest Rate Swaps and the PVR Interest Rate Swaps. Settlements on the PVR Interest Rate Swaps that follow hedge accounting are recorded as interest expense. The effective portion of the change in theAccordingly, subsequent fair value of the swaps that follow hedge accounting is recorded each period in accumulated other comprehensive income.
Certain of the PVR Interest Rate Swaps do not follow hedge accounting. Accordingly, mark-to-market gains and losses for the PVRPrevious and New Interest Rate Swaps that do not follow hedge accounting are recognized in earnings currently on the derivatives line on the consolidated statements of income. Ourcurrently. Therefore, our results of operations are affected by the volatility of changes in fair value, which fluctuatefluctuates with changes in interest rates. These fluctuations could be significant. See Note 8 – “Derivative Instruments” into the Notes to Consolidated Financial Statements in Item 8, “Financial Statements and Supplementary Data,” for a further description of our and PVR’s derivatives programs.program.
Customer Credit RiskTABLE OF CONTENTS
We are exposed to the credit risk of our customers
Item 8 Financial Statements and lessees. Approximately 57% of our consolidated accounts receivable at December 31, 2008 resulted from our oil and gas segment, approximately 33% resulted from the PVR natural gas midstream segment and approximately 10% resulted from the PVR coal and natural resource management segment. Approximately $26.8 million of the PVR natural gas midstream segment’s receivables at December 31, 2008 were related to three customers: Tenaska Marketing Ventures, Conoco, Inc. and Louis Dreyfus Energy Services. Approximately 46% of PVR’s natural gas midstream segment receivables and 16% of our consolidated receivables at December 31, 2008 related to these three natural gas midstream customers. Approximately $20.3 million of our oil and gas segment receivables at December 31, 2008 were related to three customers: Dominion Field Services, Inc., Antero Resources Corporation and Chesapeake Energy. Approximately 24% of our oil and gas segment’s receivables and 14% of our consolidated receivables at December 31, 2008 related to these three oil and gas customers. No significant uncertainties related to the collectability of amounts owed to us or PVR exist in regard to these customers.
These customer concentrations increase our exposure to credit risk on our consolidated receivables, since the financial insolvency of any of these customers could have a significant impact on our results of operations. If our customers or lessees become financially insolvent, they may not be able to continue to operate or meet their payment obligations. Any material losses as a result of customer defaults could harm and have an adverse effect on our business, financial condition or results of operations. Substantially all of our trade accounts receivable are unsecured.
To mitigate the risks of nonperformance by our customers, we perform ongoing credit evaluations of our existing customers. We monitor individual customer payment capability in granting credit arrangements to new customers by performing credit evaluations, seek to limit credit to amounts we believe the customers can pay and maintain reserves we believe are adequate to cover exposure for uncollectable accounts. As of December 31, 2008, no receivables were collateralized, and we recorded a $1.0 million allowance for doubtful accounts in the oil and gas segment and a $1.4 million allowance for doubtful accounts in the PVR natural gas midstream segment.
Item 8 | Financial Statements and Supplementary Data |
Supplementary DataPENN VIRGINIA CORPORATION AND SUBSIDIARIES
INDEX TO CONSOLIDATED FINANCIAL STATEMENTS
TABLE OF CONTENTS
REPORT OF INDEPENDENT REGISTERED PUBLIC ACCOUNTING FIRM
The Board of Directors and Shareholders
Penn Virginia Corporation:
We have audited the accompanying consolidated balance sheets of Penn Virginia Corporation a Virginia corporation, and subsidiaries as of December 31, 20082009 and 2007,2008, and the related consolidated statements of income, shareholders’ equity and comprehensive income, and cash flows for each of the years in the three-year period ended December 31, 2008.2009. These consolidated financial statements are the responsibility of the Company’s management. Our responsibility is to express an opinion on these consolidated financial statements based on our audits.
We conducted our audits in accordance with the standards of the Public Company Accounting Oversight Board (United States). Those standards require that we plan and perform the audit to obtain reasonable assurance about whether the financial statements are free of material misstatement. An audit includes examining, on a test basis, evidence supporting the amounts and disclosures in the financial statements. An audit also includes assessing the accounting principles used and significant estimates made by management, as well as evaluating the overall financial statement presentation. We believe that our audits provide a reasonable basis for our opinion.
In our opinion, the consolidated financial statements referred to above present fairly, in all material respects, the financial position of Penn Virginia Corporation and subsidiaries as of December 31, 20082009 and 2007,2008, and the results of their operations and their cash flows for each of the years in the three-year period ended December 31, 2008,2009, in conformity with U.S. generally accepted accounting principles.
As discussed in Note 3 to the consolidated financial statements, effective January 1, 2007, the Company changed its method of accounting for income tax uncertainties.
We also have audited, in accordance with the standards of the Public Company Accounting Oversight Board (United States), Penn Virginia Corporation’s internal control over financial reporting as of December 31, 2008,2009, based on criteria established inInternal Control –— Integrated Framework issued by the Committee of Sponsoring Organizations of the Treadway Commission (COSO), and our report dated February 27, 2009March 1, 2010 expressed an unqualified opinion on the effectiveness of the Company’s internal control over financial reporting.
/s/ KPMG LLP
Houston, Texas
March 1, 2010
February 27, 2009TABLE OF CONTENTS
REPORT OF INDEPENDENT REGISTERED PUBLIC ACCOUNTING FIRM
The Board of Directors and Shareholders
Penn Virginia Corporation:
We have audited Penn Virginia Corporation’s internal control over financial reporting as of December 31, 2008,2009, based on criteria established inInternal Control—Control — Integrated Framework issued by the Committee of Sponsoring Organizations of the Treadway Commission.Commission (COSO). Penn Virginia Corporation’s management is responsible for maintaining effective internal control over financial reporting and for its assessment of the effectiveness of internal control over financial reporting, included in the accompanying Management’s Annual Report on Internal Control Over Financial Reporting (Item 9A(b) herein). Our responsibility is to express an opinion on the Company’s internal control over financial reporting based on our audit.
We conducted our audit in accordance with the standards of the Public Company Accounting Oversight Board (United States). Those standards require that we plan and perform the audit to obtain reasonable assurance about whether effective internal control over financial reporting was maintained in all material respects. Our audit included obtaining an understanding of internal control over financial reporting, assessing the risk that a material weakness exists, and testing and evaluating the design and operating effectiveness of internal control based on the assessed risk. Our audit also included performing such other procedures as we considered necessary in the circumstances. We believe that our audit provides a reasonable basis for our opinion.
A company’s internal control over financial reporting is a process designed to provide reasonable assurance regarding the reliability of financial reporting and the preparation of financial statements for external purposes in accordance with generally accepted accounting principles. A company’s internal control over financial reporting includes those policies and procedures that:that (1) pertain to the maintenance of records that, in reasonable detail, accurately and fairly reflect the transactions and dispositions of the assets of the company; (2) provide reasonable assurance that transactions are recorded as necessary to permit preparation of financial statements in accordance with generally accepted accounting principles, and that receipts and expenditures of the company are being made only in accordance with authorizations of management and directors of the company; and (3) provide reasonable assurance regarding prevention or timely detection of unauthorized acquisition, use, or disposition of the company’s assets that could have a material effect on the financial statements.
Because of its inherent limitations, internal control over financial reporting may not prevent or detect misstatements. Also, projections of any evaluation of effectiveness to future periods are subject to the risk that controls may become inadequate because of changes in conditions, or that the degree of compliance with the policies or procedures may deteriorate.
In our opinion, Penn Virginia Corporation maintained, in all material respects, effective internal control over financial reporting as of December 31, 2008,2009, based on criteria established inInternal Control—Control — Integrated Framework issued by the Committee of Sponsoring Organizations of the Treadway Commission.
We also have audited, in accordance with the standards of the Public Company Accounting Oversight Board (United States), the consolidated balance sheets of Penn Virginia Corporation and subsidiaries as of December 31, 20082009 and 2007,2008, and the related consolidated statements of income, shareholders’ equity and comprehensive income, and cash flows for each of the years in the three-year period ended December 31, 2008,2009, and our report dated February 27, 2009,March 1, 2010 expressed an unqualified opinion on those consolidated financial statements.
/s/ KPMG LLP
Houston, Texas
March 1, 2010
February 27, 2009TABLE OF CONTENTS
PENN VIRGINIA CORPORATION AND SUBSIDIARIES
CONSOLIDATED STATEMENTS OF INCOME
(in thousands, except per share data)
| | | | | | |
| | Year Ended December 31, |
| | | 2009 | | 2008 | | 2007 |
Revenues
| | | | | | | | | | | | |
| Natural gas | | $ | 169,666 | | | $ | 368,801 | | | $ | 262,169 | |
| Crude oil | | | 43,258 | | | | 46,529 | | | | 22,439 | |
| Natural gas liquids (NGLs) | | | 15,735 | | | | 21,292 | | | | 5,678 | |
| Natural gas midstream | | | 428,016 | | | | 589,783 | | | | 433,174 | |
| Coal royalties | | | 120,435 | | | | 122,834 | | | | 94,140 | |
| Gain on sale of property and equipment | | | 2,345 | | | | 31,426 | | | | 12,416 | |
| Other | | | 35,682 | | | | 40,186 | | | | 22,934 | |
| Total revenues | | | 815,137 | | | | 1,220,851 | | | | 852,950 | |
Expenses
| | | | | | | | | | | | |
| Cost of midstream gas purchased | | | 333,854 | | | | 484,621 | | | | 343,293 | |
| Operating | | | 86,766 | | | | 89,891 | | | | 67,610 | |
| Exploration | | | 57,754 | | | | 42,436 | | | | 28,608 | |
| Taxes other than income | | | 22,073 | | | | 28,586 | | | | 21,723 | |
| General and administrative | | | 80,000 | | | | 74,494 | | | | 66,983 | |
| Depreciation, depletion and amortization | | | 223,367 | | | | 192,236 | | | | 129,523 | |
| Impairments | | | 107,926 | | | | 51,764 | | | | 2,586 | |
| Loss on sale of assets | | | 1,599 | | | | — | | | | — | |
| Total expenses | | | 913,339 | | | | 964,028 | | | | 660,326 | |
| Operating income (loss) | | | (98,202 | ) | | | 256,823 | | | | 192,624 | |
Other income (expense)
| | | | | | | | | | | | |
| Interest expense | | | (68,884 | ) | | | (49,299 | ) | | | (37,851 | ) |
| Derivatives | | | 11,854 | | | | 46,582 | | | | (47,282 | ) |
| Other | | | 2,612 | | | | (666 | ) | | | 3,651 | |
| Income (loss) before income taxes and noncontrolling interests | | | (152,620 | ) | | | 253,440 | | | | 111,142 | |
| Income tax benefit (expense) | | | 75,252 | | | | (71,920 | ) | | | (30,332 | ) |
| Net income (loss) | | | (77,368 | ) | | | 181,520 | | | | 80,810 | |
| Less net income attributable to noncontrolling interests | | | (37,275 | ) | | | (60,436 | ) | | | (30,319 | ) |
| Income (loss) attributable to Penn Virginia Corporation | | $ | (114,643 | ) | | $ | 121,084 | | | $ | 50,491 | |
Earnings (loss) per share – basic and diluted:
| | | | | | | | | | | | |
Earnings (loss) per share attributable to Penn Virginia Corporation
| | | | | | | | | | | | |
| Basic | | $ | (2.62 | ) | | $ | 2.89 | | | $ | 1.32 | |
| Diluted | | $ | (2.62 | ) | | $ | 2.87 | | | $ | 1.31 | |
| Weighted average shares outstanding, basic | | | 43,811 | | | | 41,760 | | | | 38,061 | |
| Weighted average shares outstanding, diluted | | | 43,811 | | | | 42,031 | | | | 38,358 | |
| | | | | | | | | | | | |
| | | Year Ended December 31, | |
| | | 2008 | | | 2007 | | | 2006 | |
Revenues | | | | | | | | | | | | |
Natural gas | | $ | 368,801 | | | $ | 262,169 | | | $ | 212,919 | |
Crude oil | | | 46,529 | | | | 22,439 | | | | 17,634 | |
Natural gas liquids | | | 21,292 | | | | 5,678 | | | | 3,603 | |
Natural gas midstream | | | 589,783 | | | | 433,174 | | | | 402,715 | |
Coal royalties | | | 122,834 | | | | 94,140 | | | | 98,163 | |
Gain on sales of property and equipment | | | 31,426 | | | | 12,416 | | | | — | |
Other | | | 40,186 | | | | 22,934 | | | | 18,895 | |
| | | | | | | | | | | | |
Total revenues | | | 1,220,851 | | | | 852,950 | | | | 753,929 | |
| | | | | | | | | | | | |
| | | |
Expenses | | | | | | | | | | | | |
Cost of midstream gas purchased | | | 484,621 | | | | 343,293 | | | | 334,594 | |
Operating | | | 89,891 | | | | 67,610 | | | | 47,406 | |
Exploration | | | 42,436 | | | | 28,608 | | | | 34,330 | |
Taxes other than income | | | 28,586 | | | | 21,723 | | | | 14,767 | |
General and administrative | | | 74,494 | | | | 66,983 | | | | 49,566 | |
Impairments | | | 51,764 | | | | 2,586 | | | | 8,517 | |
Depreciation, depletion and amortization | | | 192,236 | | | | 129,523 | | | | 94,217 | |
| | | | | | | | | | | | |
Total expenses | | | 964,028 | | | | 660,326 | | | | 583,397 | |
| | | | | | | | | | | | |
| | | |
Operating income | | | 256,823 | | | | 192,624 | | | | 170,532 | |
| | | |
Other income (expense) | | | | | | | | | | | | |
Interest expense | | | (44,261 | ) | | | (37,419 | ) | | | (24,832 | ) |
Other | | | (666 | ) | | | 3,651 | | | | 3,718 | |
Derivatives | | | 46,582 | | | | (47,282 | ) | | | 19,497 | |
| | | | | | | | | | | | |
| | | |
Income before minority interest and income taxes | | | 258,478 | | | | 111,574 | | | | 168,915 | |
Minority interest | | | 60,436 | | | | 30,319 | | | | 43,018 | |
Income tax expense | | | 73,874 | | | | 30,501 | | | | 49,988 | |
| | | | | | | | | | | | |
| | | |
Net income | | $ | 124,168 | | | $ | 50,754 | | | $ | 75,909 | |
| | | | | | | | | | | | |
Net income per share, basic | | $ | 2.97 | | | $ | 1.33 | | | $ | 2.03 | |
| | | |
Net income per share, diluted | | $ | 2.95 | | | $ | 1.32 | | | $ | 2.01 | |
| | | |
Weighted average shares outstanding, basic | | | 41,760 | | | | 38,061 | | | | 37,362 | |
Weighted average shares outstanding, diluted | | | 42,031 | | | | 38,358 | | | | 37,732 | |
See accompanying notes to consolidated financial statements.
TABLE OF CONTENTS
PENN VIRGINIA CORPORATION AND SUBSIDIARIES
CONSOLIDATED BALANCE SHEETS
(in thousands)
| | | | |
| | As of December 31, |
| | | 2009 | | 2008 |
ASSETS
| | | | | | | | |
Current assets
| | | | | | | | |
| Cash and cash equivalents | | $ | 98,331 | | | $ | 18,338 | |
| Accounts receivable, net of allowance for doubtful accounts | | | 124,804 | | | | 149,241 | |
| Derivative assets | | | 17,572 | | | | 67,569 | |
| Inventory | | | 12,204 | | | | 18,468 | |
| Assets held for sale | | | 38,282 | | | | — | |
| Other current assets | | | 8,049 | | | | 9,902 | |
| Total current assets | | | 299,242 | | | | 263,518 | |
Property and equipment
| | | | | | | | |
| Oil and gas properties (successful efforts method) | | | 1,960,140 | | | | 2,107,128 | |
| Other property and equipment | | | 1,146,973 | | | | 1,076,471 | |
| Total property and equipment | | | 3,107,113 | | | | 3,183,599 | |
| Accumulated depreciation, depletion and amortization | | | (754,755 | ) | | | (671,422 | ) |
| Net property and equipment | | | 2,352,358 | | | | 2,512,177 | |
| Equity investments | | | 87,601 | | | | 78,443 | |
| Intangibles, net | | | 83,741 | | | | 92,672 | |
| Derivative assets | | | 3,630 | | | | 4,070 | |
| Other assets | | | 61,935 | | | | 45,685 | |
| Total assets | | $ | 2,888,507 | | | $ | 2,996,565 | |
LIABILITIES AND SHAREHOLDERS’ EQUITY
| | | | | | | | |
Current liabilities
| | | | | | | | |
| Short-term borrowings | | $ | — | | | $ | 7,542 | |
| Accounts payable and accrued liabilities | | | 137,388 | | | | 206,902 | |
| Derivative liabilities | | | 16,147 | | | | 15,534 | |
| Deferred taxes | | | — | | | | 17,598 | |
| Income taxes payable | | | — | | | | 18 | |
| Total current liabilities | | | 153,535 | | | | 247,594 | |
| Other liabilities | | | 43,463 | | | | 45,887 | |
| Derivative liabilities | | | 6,745 | | | | 8,721 | |
| Deferred income taxes | | | 328,238 | | | | 371,925 | |
| Long-term debt of the Company | | | 498,427 | | | | 531,896 | |
| Long-term debt of PVR | | | 620,100 | | | | 568,100 | |
| Commitments and contingencies (Note 15) | | | — | | | | — | |
Shareholders’ equity:
| | | | | | | | |
Preferred Stock of $100 par value – 100,000 shares authorized; none issued
| | | | | | | | |
| Common stock of $0.01 par value – 64,000,000 shares authorized; shares issued and outstanding of 45,386,004 and 41,870,893 as of December 31, 2009 and 2008, respectively | | | 265 | | | | 230 | |
| Paid-in capital | | | 590,846 | | | | 485,967 | |
| Retained earnings | | | 319,167 | | | | 443,646 | |
| Deferred compensation obligation | | | 2,423 | | | | 2,237 | |
| Accumulated other comprehensive loss | | | (1,286 | ) | | | (4,182 | ) |
| Treasury stock – 113,858 and 85,227 shares common stock, at cost, as of December 31, 2009 and 2008, respectively | | | (3,327 | ) | | | (2,683 | ) |
| Total Penn Virginia Corporation shareholders’ equity | | | 908,088 | | | | 925,215 | |
| Noncontrolling interests of subsidiaries | | | 329,911 | | | | 297,227 | |
| Total shareholders’ equity | | | 1,237,999 | | | | 1,222,442 | |
| Total liabilities and shareholders’ equity | | $ | 2,888,507 | | | $ | 2,996,565 | |
| | | | | | | | |
| | | As of December 31, | |
| | | 2008 | | | 2007 | |
Assets | | | | | | | | |
Current assets | | | | | | | | |
Cash and cash equivalents | | $ | 18,338 | | | $ | 34,527 | |
Accounts receivable, net of allowance for doubtful accounts | | | 149,241 | | | | 179,120 | |
Deferred income taxes | | | — | | | | 16,273 | |
Derivative assets | | | 67,569 | | | | 5,683 | |
Inventory | | | 18,468 | | | | 5,194 | |
Other | | | 9,902 | | | | 3,275 | |
| | | | | | | | |
Total current assets | | | 263,518 | | | | 244,072 | |
| | | | | | | | |
Property and equipment | | | | | | | | |
Oil and gas properties (successful efforts method) | | | 2,106,126 | | | | 1,525,728 | |
Other property and equipment | | | 1,076,471 | | | | 859,380 | |
| | | | | | | | |
| | | 3,182,597 | | | | 2,385,108 | |
Accumulated depreciation, depletion and amortization | | | (671,422 | ) | | | (486,094 | ) |
| | | | | | | | |
Net property and equipment | | | 2,511,175 | | | | 1,899,014 | |
Equity investments | | | 78,443 | | | | 25,640 | |
Goodwill | | | — | | | | 7,718 | |
Intangible assets, net | | | 92,672 | | | | 28,938 | |
Derivative assets | | | 4,070 | | | | 310 | |
Other assets | | | 46,674 | | | | 47,769 | |
| | | | | | | | |
Total assets | | $ | 2,996,552 | | | $ | 2,253,461 | |
| | | | | | | | |
| | |
Liabilities and Shareholders’ Equity | | | | | | | | |
Current liabilities | | | | | | | | |
Short-term borrowings | | $ | 7,542 | | | $ | 12,561 | |
Accounts payable and accrued liabilities | | | 206,902 | | | | 205,127 | |
Derivative liabilities | | | 15,534 | | | | 43,048 | |
Deferred taxes | | | 17,598 | | | | — | |
Income taxes payable | | | 18 | | | | 1,163 | |
| | | | | | | | |
Total current liabilities | | | 247,594 | | | | 261,899 | |
| | | | | | | | |
| | |
Other liabilities | | | 45,887 | | | | 54,169 | |
Derivative liabilities | | | 8,721 | | | | 3,030 | |
Deferred income taxes | | | 245,789 | | | | 193,950 | |
Long-term debt of the Company | | | 562,000 | | | | 352,000 | |
Long-term debt of PVR | | | 568,100 | | | | 399,153 | |
Minority interests of subsidiaries | | | 299,671 | | | | 179,162 | |
| | |
Commitments and contingencies (see Note 23) | | | | | | | | |
| | |
Shareholders’ equity | | | | | | | | |
Preferred stock of $100 par value – 100,000 shares authorized; none issued | | | — | | | | — | |
Common stock of $0.01 par value – 64,000,000 shares authorized; 41,870,893and 41,408,497 shares issued and outstanding at December 31, 2008 and December 31, 2007 | | | 230 | | | | 225 | |
Paid-in capital | | | 578,639 | | | | 485,998 | |
Retained earnings | | | 446,993 | | | | 332,223 | |
Deferred compensation obligation | | | 2,237 | | | | 1,608 | |
Accumulated other comprehensive income | | | (6,626 | ) | | | (7,936 | ) |
Treasury stock – 95,378 and 77,924 shares common stock, at cost, on December 31, 2008 and December 31, 2007 | | | | | | | | |
| | | (2,683 | ) | | | (2,020 | ) |
| | | | | | | | |
| | |
Total shareholders’ equity | | | 1,018,790 | | | | 810,098 | |
| | | | | | | | |
Total liabilities and shareholders’ equity | | $ | 2,996,552 | | | $ | 2,253,461 | |
| | | | | | | | |
See accompanying notes to consolidated financial statements.
TABLE OF CONTENTS
PENN VIRGINIA CORPORATION AND SUBSIDIARIES
CONSOLIDATED STATEMENTS OF CASH FLOWS
(in thousands)
| | | | | | |
| | Year Ended December 31, |
| | | 2009 | | 2008 | | 2007 |
Cash flows from operating activities
| | | | | | | | | | | | |
| Net income (loss) | | $ | (77,368 | ) | | $ | 181,520 | | | $ | 80,810 | |
Adjustments to reconcile net income (loss) to net cash provided by operating activities:
| | | | | | | | | | | | |
| Depreciation, depletion and amortization | | | 223,367 | | | | 192,236 | | | | 129,523 | |
| Impairments | | | 107,926 | | | | 51,764 | | | | 2,586 | |
Derivative contracts:
| | | | | | | | | | | | |
| Total derivative losses (gains) | | | (5,333 | ) | | | (41,102 | ) | | | 52,157 | |
| Cash receipts (payments) to settle derivatives | | | 61,147 | | | | (46,086 | ) | | | (3,651 | ) |
| Deferred income taxes | | | (83,222 | ) | | | 58,551 | | | | 23,171 | |
| Loss (gain) on the sale of property and equipment | | | (1,910 | ) | | | (31,426 | ) | | | (12,416 | ) |
| Dry hole and unproved leasehold expense | | | 33,278 | | | | 35,847 | | | | 24,975 | |
| Other | | | 22,632 | | | | 12,522 | | | | 5,393 | |
Changes in operating assets and liabilities:
| | | | | | | | | | | | |
| Accounts receivable | | | 24,879 | | | | 29,418 | | | | (41,772 | ) |
| Inventory | | | 1,919 | | | | (13,440 | ) | | | (1,106 | ) |
| Accounts payable and accrued liabilities | | | (15,452 | ) | | | (31,969 | ) | | | 42,733 | |
| Other assets and liabilities | | | (15,916 | ) | | | (14,061 | ) | | | 10,627 | |
| Net cash provided by operating activities | | | 275,947 | | | | 383,774 | | | | 313,030 | |
Cash flows from investing activities
| | | | | | | | | | | | |
| Acquisitions | | | (46,894 | ) | | | (293,747 | ) | | | (292,001 | ) |
| Additions to property and equipment | | | (239,459 | ) | | | (585,339 | ) | | | (421,509 | ) |
| Other | | | 16,241 | | | | 33,519 | | | | 30,027 | |
| Net cash used in investing activities | | | (270,112 | ) | | | (845,567 | ) | | | (683,483 | ) |
Cash flows from financing activities
| | | | | | | | | | | | |
| Dividends paid | | | (9,836 | ) | | | (9,398 | ) | | | (8,499 | ) |
| Distributions paid to noncontrolling interest holders | | | (78,171 | ) | | | (64,245 | ) | | | (49,739 | ) |
| Proceeds from (repayments) of bank borrowings | | | (7,542 | ) | | | 7,542 | | | | — | |
| Proceeds from Company borrowings | | | 87,000 | | | | 273,000 | | | | 283,500 | |
| Repayments of Company borrowings | | | (419,000 | ) | | | (63,000 | ) | | | (382,500 | ) |
| Proceeds from PVR borrowings | | | 132,000 | | | | 453,800 | | | | 220,500 | |
| Repayments of PVR borrowings | | | (80,000 | ) | | | (297,800 | ) | | | (27,000 | ) |
| Net proceeds from issuance of Senior notes | | | 291,009 | | | | — | | | | — | |
| Proceeds from the issuance of convertible notes | | | — | | | | — | | | | 230,000 | |
| Net proceeds from the issuance of common stock | | | 64,835 | | | | — | | | | 135,441 | |
| Cash received for stock warrants sold | | | — | | | | — | | | | 18,187 | |
| Cash paid for convertible note hedges | | | — | | | | — | | | | (36,817 | ) |
| Net proceeds from the issuance of PVR units | | | — | | | | 138,141 | | | | 860 | |
| Net proceeds from the sale of PVG units | | | 118,080 | | | | — | | | | — | |
| Debt issuance costs paid | | | (24,217 | ) | | | (4,200 | ) | | | (8,141 | ) |
| Other | | | — | | | | 11,764 | | | | 8,850 | |
| Net cash provided by financing activities | | | 74,158 | | | | 445,604 | | | | 384,642 | |
| Net increase (decrease) in cash and cash equivalents | | | 79,993 | | | | (16,189 | ) | | | 14,189 | |
| Cash and cash equivalents – beginning of period | | | 18,338 | | | | 34,527 | | | | 20,338 | |
| Cash and cash equivalents – end of period | | $ | 98,331 | | | $ | 18,338 | | | $ | 34,527 | |
Supplemental disclosures:
| | | | | | | | | | | | |
Cash paid for:
| | | | | | | | | | | | |
| Interest (net of amounts capitalized) | | $ | 59,911 | | | $ | 43,244 | | | $ | 34,794 | |
| Income taxes (net of refunds received) | | $ | 9,443 | | | $ | 15,228 | | | $ | (1,897 | ) |
Noncash investing activities:
| | | | | | | | | | | | |
| Issuance of PVR units for acquisition | | $ | — | | | $ | 15,171 | | | $ | — | |
| PVG units given as consideration for acquisition | | $ | — | | | $ | 68,021 | | | $ | — | |
| Other liabilities | | $ | — | | | $ | 4,673 | | | $ | — | |
| | | | | | | | | | | | |
| | | Year Ended December 31, | |
| | | 2008 | | | 2007 | | | 2006 | |
Cash flows from operating activities | | | | | | | | | | | | |
Net income | | $ | 124,168 | | | $ | 50,754 | | | $ | 75,909 | |
Adjustments to reconcile net income to net cash provided by operatingactivities: | | | | | | | | | | | | |
Depreciation, depletion and amortization | | | 192,236 | | | | 129,523 | | | | 94,217 | |
Impairments | | | 51,764 | | | | 2,586 | | | | 8,517 | |
Derivative contracts: | | | | | | | | | | | | |
Total derivative losses (gains) | | | (41,102 | ) | | | 52,157 | | | | (17,535 | ) |
Cash paid to settle derivatives | | | (46,086 | ) | | | (3,651 | ) | | | (8,947 | ) |
Deferred income taxes | | | 60,505 | | | | 23,340 | | | | 38,020 | |
Minority interest | | | 60,436 | | | | 30,319 | | | | 43,018 | |
Gain on the sale of property and equipment | | | (31,426 | ) | | | (12,416 | ) | | | — | |
Dry hole and unproved leasehold expense | | | 35,847 | | | | 24,975 | | | | 24,502 | |
Other | | | 7,484 | | | | 4,961 | | | | 4,260 | |
Changes in operating assets and liabilities: | | | | | | | | | | | | |
Accounts receivable | | | 29,418 | | | | (41,772 | ) | | | (1,770 | ) |
Inventory | | | (13,440 | ) | | | (1,106 | ) | | | (659 | ) |
Accounts payable and accrued liabilities | | | (31,969 | ) | | | 42,733 | | | | 30,116 | |
Other assets and liabilities | | | (14,061 | ) | | | 10,627 | | | | (13,829 | ) |
| | | | | | | | | | | | |
Net cash provided by operating activities | | | 383,774 | | | | 313,030 | | | | 275,819 | |
| | | | | | | | | | | | |
| | | |
Cash flows from investing activities | | | | | | | | | | | | |
Acquisitions | | | (293,747 | ) | | | (292,001 | ) | | | (195,166 | ) |
Additions to property and equipment | | | (585,339 | ) | | | (421,509 | ) | | | (269,773 | ) |
Other | | | 33,519 | | | | 30,027 | | | | 2,604 | |
| | | | | | | | | | | | |
Net cash used in investing activities | | | (845,567 | ) | | | (683,483 | ) | | | (462,335 | ) |
| | | | | | | | | | | | |
| | | |
Cash flows from financing activities | | | | | | | | | | | | |
Dividends paid | | | (9,398 | ) | | | (8,499 | ) | | | (8,398 | ) |
Distributions paid to minority interest holders | | | (64,245 | ) | | | (49,739 | ) | | | (38,627 | ) |
Short-term bank borrowings | | | 7,542 | | | | — | | | | — | |
Proceeds from Company borrowings | | | 273,000 | | | | 513,500 | | | | 162,000 | |
Repayments of Company borrowings | | | (63,000 | ) | | | (382,500 | ) | | | (20,000 | ) |
Proceeds from PVR borrowings | | | 453,800 | | | | 220,500 | | | | 85,800 | |
Repayments of PVR borrowings | | | (297,800 | ) | | | (27,000 | ) | | | (122,900 | ) |
Net proceeds from issuance of PVR partners' capital | | | 138,141 | | | | 860 | | | | 117,818 | |
Net proceeds from issuance of PVA equity | | | — | | | | 135,441 | | | | — | |
Cash received for stock warrants sold | | | — | | | | 18,187 | | | | — | |
Cash paid for convertible note hedges | | | — | | | | (36,817 | ) | | | — | |
Other | | | 7,564 | | | | 709 | | | | 5,248 | |
| | | | | | | | | | | | |
Net cash provided by financing activities | | | 445,604 | | | | 384,642 | | | | 180,941 | |
| | | | | | | | | | | | |
| | | |
Net increase (decrease) in cash and cash equivalents | | | (16,189 | ) | | | 14,189 | | | | (5,575 | ) |
Cash and cash equivalents – beginning of period | | | 34,527 | | | | 20,338 | | | | 25,913 | |
| | | | | | | | | | | | |
Cash and cash equivalents – end of period | | $ | 18,338 | | | $ | 34,527 | | | $ | 20,338 | |
| | | | | | | | | | | | |
| | | |
Supplemental disclosures: | | | | | | | | | | | | |
Cash paid for: | | | | | | | | | | | | |
Interest (net of amounts capitalized) | | $ | 43,244 | | | $ | 34,794 | | | $ | 23,452 | |
Income taxes paid (refunds received) | | $ | 15,228 | | | $ | (1,897 | ) | | $ | 16,741 | |
| | | |
Noncash investing activities: (see Note 4) | | | | | | | | | | | | |
Deferred tax liabilities related to acquisition, net | | $ | — | | | $ | — | | | $ | 32,759 | |
Issuance of PVR units for acquisition | | $ | 15,171 | | | $ | — | | | $ | — | |
PVG units given as consideration for acquisition | | $ | 68,021 | | | $ | — | | | $ | — | |
Other liabilities | | $ | 4,673 | | | $ | — | | | $ | — | |
See accompanying notes to consolidated financial statements.
TABLE OF CONTENTS
PENNSPENN VIRGINIA CORPORATION AND SUBSIDIARIES
CONSOLIDATED STATEMENTS OF SHAREHOLDERS’ EQUITY AND COMPREHENSIVE INCOME
(in thousands)
| | | | | | | | | | | | | | | | | | | | | | |
| | Shares
Outstanding | | Common
Stock | | Paid-in
Capital | | Retained
Earnings | | Deferred
Compensation
Obligation | | Accumulated
Other
Comprehensive
Income (Loss) | | Treasury
Stock | | Total Penn
Virginia
Stockholders’
Equity | | Noncontrolling
Interests | | Total
Shareholders’
Equity | | Comprehensive
Income (Loss) |
| Balance at December 31, 2006 | | $ | 37,562 | | | $ | 188 | | | $ | 95,611 | | | $ | 289,967 | | | $ | 1,314 | | | $ | (2,409 | ) | | $ | (1,649 | ) | | $ | 383,022 | | | $ | 432,827 | | | $ | 815,849 | | | $ | 120,127 | |
| Dividends paid ($0.225 per share) | | | — | | | | — | | | | — | | | | (8,498 | ) | | | — | | | | — | | | | — | | | | (8,498 | ) | | | — | | | | (8,498 | ) | | | | |
| Distributions to noncontrolling interest holders | | | — | | | | — | | | | — | | | | — | | | | — | | | | — | | | | — | | | | — | | | | (49,739 | ) | | | (49,739 | ) | | | | |
| Issuance of common stock | | | 3,450 | | | | 35 | | | | 135,371 | | | | — | | | | — | | | | — | | | | — | | | | 135,406 | | | | — | | | | 135,406 | | | | | |
| Purchase of call options, net of tax benefit of $14,580 | | | — | | | | — | | | | (22,237 | ) | | | — | | | | — | | | | — | | | | — | | | | (22,237 | ) | | | — | | | | (22,237 | ) | | | | |
| Sale of warrants | | | — | | | | — | | | | 18,187 | | | | — | | | | — | | | | — | | | | — | | | | 18,187 | | | | — | | | | 18,187 | | | | | |
| Issuance costs attributable to convertible notes | | | — | | | | — | | | | 21,216 | | | | — | | | | — | | | | — | | | | — | | | | 21,216 | | | | — | | | | 21,216 | | | | | |
| Sale of PVG units | | | — | | | | — | | | | (995 | ) | | | — | | | | — | | | | — | | | | — | | | | (995 | ) | | | — | | | | (995 | ) | | | | |
| Recognition of SAB 51 gain (Note 3) | | | — | | | | — | | | | 148,184 | | | | — | | | | — | | | | — | | | | — | | | | 148,184 | | | | (241,736 | ) | | | (93,552 | ) | | | | |
| Common stock issued as compensation | | | 19 | | | | — | | | | 878 | | | | — | | | | — | | | | — | | | | — | | | | 878 | | | | — | | | | 878 | | | | | |
| PVR units issued as compensation | | | — | | | | — | | | | 1,583 | | | | — | | | | — | | | | — | | | | — | | | | 1,583 | | | | 32 | | | | 1,615 | | | | | |
| Vesting of restricted units | | | — | | | | — | | | | (1,099 | ) | | | — | | | | — | | | | — | | | | — | | | | (1,099 | ) | | | 1,099 | | | | — | | | | | |
| Exercise of stock options | | | 366 | | | | 2 | | | | 8,791 | | | | — | | | | — | | | | — | | | | — | | | | 8,793 | | | | — | | | | 8,793 | | | | | |
| Compensation costs related to stock options | | | — | | | | — | | | | 2,611 | | | | — | | | | — | | | | — | | | | — | | | | 2,611 | | | | — | | | | 2,611 | | | | | |
| Deferred compensation | | | 11 | | | | — | | | | 613 | | | | — | | | | 294 | | | | — | | | | (371 | ) | | | 536 | | | | — | | | | 536 | | | | | |
| Other | | | — | | | | — | | | | — | | | | — | | | | — | | | | — | | | | — | | | | — | | | | 815 | | | | 815 | | | | | |
| Net income | | | — | | | | — | | | | — | | | | 50,491 | | | | — | | | | — | | | | — | | | | 50,491 | | | | 30,319 | | | | 80,810 | | | $ | 80,810 | |
| Other comprehensive gain, net of tax | | | — | | | | — | | | | — | | | | — | | | | — | | | | (785 | ) | | | — | | | | (785 | ) | | | 803 | | | | 18 | | | | 18 | |
| Balance at December 31, 2007 | | | 41,408 | | | | 225 | | | | 408,714 | | | | 331,960 | | | | 1,608 | | | | (3,194 | ) | | | (2,020 | ) | | | 737,293 | | | | 174,420 | | | | 911,713 | | | $ | 80,828 | |
| Dividends paid ($0.225 per share) | | | — | | | | — | | | | — | | | | (9,398 | ) | | | — | | | | — | | | | — | | | | (9,398 | ) | | | — | | | | (9,398 | ) | | | | |
| Distributions to noncontrolling interest holders | | | — | | | | — | | | | — | | | | — | | | | — | | | | — | | | | — | | | | — | | | | (64,245 | ) | | | (64,245 | ) | | | | |
| Gain on sale of securities | | | — | | | | — | | | | (1,700 | ) | | | — | | | | — | | | | — | | | | — | | | | (1,700 | ) | | | — | | | | (1,700 | ) | | | | |
| Recognition of SAB 51 gain (Note 3) | | | — | | | | — | | | | 24,335 | | | | — | | | | — | | | | — | | | | — | | | | 24,335 | | | | (39,723 | ) | | | (15,388 | ) | | | | |
| Gain on sale of PVG units to PVR, net of tax (Note 4) | | | — | | | | — | | | | 36,429 | | | | — | | | | — | | | | — | | | | — | | | | 36,429 | | | | — | | | | 36,429 | | | | | |
| PVG units transferred as acquisition consideration | | | — | | | | — | | | | — | | | | — | | | | — | | | | — | | | | — | | | | — | | | | 23,469 | | | | 23,469 | | | | | |
| Public offering of PVR units | | | — | | | | — | | | | — | | | | — | | | | — | | | | — | | | | — | | | | — | | | | 138,141 | | | | 138,141 | | | | | |
| Common stock issued as compensation | | | 40 | | | | — | | | | 1,258 | | | | — | | | | — | | | | — | | | | (663 | ) | | | 595 | | | | — | | | | 595 | | | | | |
| PVR units issued as compensation | | | — | | | | — | | | | 2,231 | | | | — | | | | — | | | | — | | | | — | | | | 2,231 | | | | 709 | | | | 2,940 | | | | | |
| Vesting of restricted units | | | — | | | | — | | | | (1,722 | ) | | | — | | | | — | | | | — | | | | — | | | | (1,722 | ) | | | 1,722 | | | | — | | | | | |
| Exercise of stock options | | | 423 | | | | 5 | | | | 11,722 | | | | — | | | | — | | | | — | | | | — | | | | 11,727 | | | | — | | | | 11,727 | | | | | |
| Compensation costs related to stock options | | | — | | | | — | | | | 4,071 | | | | — | | | | — | | | | — | | | | — | | | | 4,071 | | | | — | | | | 4,071 | | | | | |
| Deferred compensation | | | — | | | | — | | | | 629 | | | | — | | | | 629 | | | | — | | | | — | | | | 1,258 | | | | — | | | | 1,258 | | | | | |
| Net income | | | — | | | | — | | | | — | | | | 121,084 | | | | — | | | | — | | | | — | | | | 121,084 | | | | 60,436 | | | | 181,520 | | | $ | 181,520 | |
| Other comprehensive gain, net of tax | | | — | | | | — | | | | — | | | | — | | | | — | | | | (988 | ) | | | — | | | | (988 | ) | | | 2,298 | | | | 1,310 | | | | 1,310 | |
| Balance at December 31, 2008 | | | 41,871 | | | | 230 | | | | 485,967 | | | | 443,646 | | | | 2,237 | | | | (4,182 | ) | | | (2,683 | ) | | | 925,215 | | | | 297,227 | | | | 1,222,442 | | | $ | 182,830 | |
| Dividends paid ($0.225 per share) | | | — | | | | — | | | | — | | | | (9,836 | ) | | | — | | | | — | | | | — | | | | (9,836 | ) | | | — | | | | (9,836 | ) | | | | |
| Distributions to noncontrolling interest holders | | | — | | | | — | | | | — | | | | — | | | | — | | | | — | | | | — | | | | — | | | | (78,171 | ) | | | (78,171 | ) | | | | |
| Gain on sale of securities | | | — | | | | — | | | | (1,241 | ) | | | — | | | | — | | | | — | | | | — | | | | (1,241 | ) | | | — | | | | (1,241 | ) | | | | |
| Issuance of common stock | | | 3,500 | | | | 35 | | | | 64,800 | | | | — | | | | — | | | | — | | | | — | | | | 64,835 | | | | — | | | | 64,835 | | | | | |
| Sale of PVG units, net of taxes | | | — | | | | — | | | | 32,739 | | | | — | | | | — | | | | — | | | | — | | | | 32,739 | | | | 67,713 | | | | 100,452 | | | | | |
| Common stock issued as compensation | | | 3 | | | | — | | | | 60 | | | | — | | | | — | | | | — | | | | — | | | | 60 | | | | — | | | | 60 | | | | | |
| PVR units issued as compensation | | | — | | | | — | | | | 2,190 | | | | — | | | | — | | | | — | | | | — | | | | 2,190 | | | | 1,796 | | | | 3,986 | | | | | |
| Vesting of restricted units | | | — | | | | — | | | | (3,023 | ) | | | — | | | | — | | | | — | | | | — | | | | (3,023 | ) | | | 3,023 | | | | — | | | | | |
| Exercise of stock options | | | — | | | | — | | | | — | | | | — | | | | — | | | | — | | | | — | | | | — | | | | — | | | | — | | | | | |
| Compensation costs related to stock options | | | — | | | | — | | | | 6,602 | | | | — | | | | — | | | | — | | | | — | | | | 6,602 | | | | — | | | | 6,602 | | | | | |
| Deferred compensation | | | 12 | | | | — | | | | 568 | | | | — | | | | 186 | | | | — | | | | (258 | ) | | | 496 | | | | — | | | | 496 | | | | | |
| Other | | | — | | | | — | | | | 2,184 | | | | — | | | | — | | | | — | | | | (386 | ) | | | 1,798 | | | | — | | | | 1,798 | | | | | |
| Net income (loss) | | | — | | | | — | | | | — | | | | (114,643 | ) | | | — | | | | — | | | | — | | | | (114,643 | ) | | | 37,275 | | | | (77,368 | ) | | $ | (77,368 | ) |
| Other comprehensive gain, net of tax | | | — | | | | — | | | | — | | | | — | | | | — | | | | 2,896 | | | | — | | | | 2,896 | | | | 1,048 | | | | 3,944 | | | | 3,944 | |
| Balance at December 31, 2009 | | | 45,386 | | | $ | 265 | | | $ | 590,846 | | | $ | 319,167 | | | $ | 2,423 | | | $ | (1,286 | ) | | $ | (3,327 | ) | | $ | 908,088 | | | $ | 329,911 | | | $ | 1,237,999 | | | $ | (73,424 | ) |
| | | | | | | | | | | | | | | | | | | | | | | | | | | | | | | | | | | |
| | | Shares
Outstanding | | Common
Stock | | Paid-in
Capital | | | Retained
Earnings | | | Deferred
Compensation
Obligation | | Accumulated
Other
Comprehensive
Income | | | Treasury
Stock | | | Unearned
Compensation
and
ESOP | | | Total
Shareholders'
Equity | | | Comprehensive
Income (Loss) |
Balance at December 31, 2005 | | 37,248 | | | 186 | | | 98,541 | | | | 222,456 | | | | 580 | | | (7,816 | ) | | | (832 | ) | | | (2,807 | ) | | | 310,308 | | | $ | 54,992 |
| | | | | | | | | | | | | | | | | | | | | | | | | | | | | | | | | | | |
| | | | | | | | | | |
Adoption of SFAS No. 123(R) (See Note 18) | | — | | | — | | | (2,807 | ) | | | — | | | | — | | | — | | | | — | | | | 2,807 | | | | — | | | | |
Dividends paid ($0.225 per share) | | — | | | — | | | — | | | | (8,398 | ) | | | — | | | — | | | | — | | | | — | | | | (8,398 | ) | | | |
Sale of PVR & PVG securities | | — | | | — | | | (3,560 | ) | | | — | | | | — | | | — | | | | — | | | | — | | | | (3,560 | ) | | | |
Stock issued as compensation | | 12 | | | — | | | 691 | | | | — | | | | — | | | — | | | | — | | | | — | | | | 691 | | | | |
PVR units issued as compensation, net | | — | | | — | | | 1,229 | | | | — | | | | — | | | — | | | | — | | | | — | | | | 1,229 | | | | |
Vesting of restricted units | | — | | | — | | | (1,056 | ) | | | — | | | | — | | | — | | | | — | | | | — | | | | (1,056 | ) | | | |
Exercise of stock options | | 302 | | | 2 | | | 5,860 | | | | — | | | | — | | | — | | | | — | | | | — | | | | 5,862 | | | | |
Compensation costs related to stock options | | — | | | — | | | 1,402 | | | | — | | | | — | | | — | | | | — | | | | — | | | | 1,402 | | | | |
Deferred compensation | | — | | | — | | | 734 | | | | — | | | | 734 | | | — | | | | (817 | ) | | | — | | | | 651 | | | | |
Contribution to GP Holdings of investmentin PVR | | — | | | — | | | (475 | ) | | | — | | | | — | | | — | | | | — | | | | — | | | | (475 | ) | | | |
Net income | | — | | | — | | | — | | | | 75,909 | | | | — | | | — | | | | — | | | | — | | | | 75,909 | | | $ | 75,909 |
Other comprehensive gain, net of tax | | — | | | — | | | — | | | | — | | | | — | | | 1,200 | | | | — | | | | — | | | | 1,200 | | | | 1,200 |
Adoption of SFAS No. 158, net of tax (See Note 16) | | — | | | — | | | — | | | | — | | | | — | | | (1,338 | ) | | | — | | | | — | | | | (1,338 | ) | | | |
| | | | | | | | | | | | | | | | | | | | | | | | | | | | | | | | | | | |
Balance at December 31, 2006 | | 37,562 | | | 188 | | | 100,559 | | | | 289,967 | | | | 1,314 | | | (7,954 | ) | | | (1,649 | ) | | | — | | | | 382,425 | | | $ | 77,109 |
| | | | | | | | | | | | | | | | | | | | | | | | | | | | | | | | | | | |
| | | | | | | | | | |
Dividends paid ($0.225 per share) | | — | | | — | | | — | | | | (8,498 | ) | | | — | | | — | | | | — | | | | — | | | | (8,498 | ) | | | |
Sale of PVR & PVG securities | | — | | | — | | | (995 | ) | | | — | | | | — | | | — | | | | — | | | | — | | | | (995 | ) | | | |
SAB 51 gain on PVR & PVG offerings | | — | | | — | | | 241,736 | | | | — | | | | — | | | — | | | | — | | | | — | | | | 241,736 | | | | |
Stock issued as compensation | | 19 | | | — | | | 878 | | | | — | | | | — | | | — | | | | — | | | | — | | | | 878 | | | | |
PVR units issued as compensation, net | | — | | | — | | | 1,583 | | | | — | | | | — | | | — | | | | — | | | | — | | | | 1,583 | | | | |
Vesting of restricted units | | — | | | — | | | (1,099 | ) | | | — | | | | — | | | — | | | | — | | | | — | | | | (1,099 | ) | | | |
Exercise of stock options | | 366 | | | 2 | | | 8,791 | | | | — | | | | — | | | — | | | | — | | | | — | | | | 8,793 | | | | |
Compensation costs related to stock options | | — | | | — | | | 2,611 | | | | — | | | | — | | | — | | | | — | | | | — | | | | 2,611 | | | | |
Deferred compensation | | 11 | | | — | | | 613 | | | | — | | | | 294 | | | — | | | | (371 | ) | | | — | | | | 536 | | | | |
Common stock offering | | 3,450 | | | 35 | | | 131,321 | | | | — | | | | — | | | — | | | | — | | | | — | | | | 131,356 | | | | |
Net income | | — | | | — | | | — | | | | 50,754 | | | | — | | | — | | | | — | | | | — | | | | 50,754 | | | $ | 50,754 |
Other comprehensive gain, net of tax | | — | | | — | | | — | | | | — | | | | — | | | 18 | | | | — | | | | — | | | | 18 | | | | 18 |
| | | | | | | | | | | | | | | | | | | | | | | | | | | | | | | | | | | |
| | | | | | | | | | |
Balance at December 31, 2007 | | 41,408 | | $ | 225 | | $ | 485,998 | | | $ | 332,223 | | | $ | 1,608 | | $ | (7,936 | ) | | $ | (2,020 | ) | | $ | — | | | $ | 810,098 | | | $ | 50,772 |
| | | | | | | | | | | | | | | | | | | | | | | | | | | | | | | | | | | |
| | | | | | | | | | |
Dividends paid ($0.225 per share) | | — | | | — | | | — | | | | (9,398 | ) | | | — | | | — | | | | — | | | | — | | | | (9,398 | ) | | | |
Sale of PVR & PVG securities | | — | | | — | | | (1,700 | ) | | | — | | | | — | | | — | | | | — | | | | — | | | | (1,700 | ) | | | |
Recognition of SAB 51 gain (See Note 3) | | — | | | — | | | 39,723 | | | | — | | | | — | | | — | | | | — | | | | — | | | | 39,723 | | | | |
Stock issued as compensation | | 40 | | | — | | | 1,258 | | | | — | | | | — | | | — | | | | (663 | ) | | | — | | | | 595 | | | | |
PVR units issued as compensation, net | | — | | | — | | | 2,231 | | | | — | | | | — | | | — | | | | — | | | | — | | | | 2,231 | | | | |
Vesting of restricted units | | — | | | — | | | (1,722 | ) | | | — | | | | — | | | — | | | | — | | | | — | | | | (1,722 | ) | | | |
Exercise of stock options | | 423 | | | 5 | | | 11,722 | | | | — | | | | — | | | — | | | | — | | | | — | | | | 11,727 | | | | |
Compensation costs related to stock options | | — | | | — | | | 4,071 | | | | — | | | | — | | | — | | | | — | | | | — | | | | 4,071 | | | | |
Deferred compensation | | — | | | — | | | 629 | | | | — | | | | 629 | | | — | | | | — | | | | — | | | | 1,258 | | | | |
Gain on sale of subsidiary units, net of tax of $23.2 million | | | | | | | | | | | | | | | | | | | | | | | | | | | | | | | | | | | |
(see Note 3) | | — | | | — | | | 36,429 | | | | — | | | | — | | | — | | | | — | | | | — | | | | 36,429 | | | | |
Net income | | — | | | — | | | — | | | | 124,168 | | | | — | | | — | | | | — | | | | — | | | | 124,168 | | | $ | 124,168 |
Other comprehensive gain, net of tax | | — | | | — | | | — | | | | — | | | | — | | | 1,310 | | | | — | | | | — | | | | 1,310 | | | | 1,310 |
| | | | | | | | | | | | | | | | | | | | | | | | | | | | | | | | | | | |
Balance at December 31, 2008 | | 41,871 | | $ | 230 | | $ | 578,639 | | | $ | 446,993 | | | $ | 2,237 | | $ | (6,626 | ) | | $ | (2,683 | ) | | $ | — | | | $ | 1,018,790 | | | $ | 125,478 |
| | | | | | | | | | | | | | | | | | | | | | | | | | | | | | | | | | | |
See accompanying notes to consolidated financial statements.
TABLE OF CONTENTS
PENN VIRGINIA CORPORATION AND SUBSIDIARIES
NOTES TO CONSOLIDATED FINANCIAL STATEMENTS
(in thousands, except per share amounts)1. Nature of Operations
Penn Virginia Corporation (“Penn Virginia,” the “Company,” “we,” “us” or “our”) is an independent oil and gas company primarily engaged in the development, exploration and production of natural gas and oil in various domestic onshore regions including East Texas, the Mid-Continent, Appalachia Mississippi and the Gulf Coast.Mississippi. We also indirectly own partner interests in Penn Virginia Resource Partners, L.P. (“PVR”), a publicly traded limited partnership formed by us in 2001. Our ownership interests in PVR are held principally through our general partner and 77%51.4% limited partner interests in Penn Virginia GP Holdings, L.P. (“PVG”), a publicly traded limited partnership formed by us in 2006. As of December 31, 2008,2009, PVG owned an approximately 37% limited partner interest in PVR and 100% of the general partner of PVR, which holds a 2% general partner interest in PVR and all of the incentive distribution rights (“IDRs”).
We are engaged in three primary business segments: (i) oil and gas, (ii) coal and natural resource management and (iii) natural gas midstream. We directly operate our oil and gas segment, and PVR operates our coal and natural resource management and natural gas midstream segments. Because PVG controls the general partner of PVR, the financial results of PVR are included in PVG’s consolidated financial statements. Because we control the general partner of PVG, the financial results of PVG are included in our consolidated financial statements.Consolidated Financial Statements. However, PVG and PVR function with capital structures that are independent of each other and us, with each having publicly traded common units and PVR having its own debt instruments. PVG does not currently have any debt instruments.
2. | Penn Virginia Resource Partners, L.P. and Penn Virginia GP Holdings, L.P. |
2. Penn Virginia Resource Partners, L.P. and Penn Virginia GP Holdings, L.P.
PVR is principally engaged in the management of coal and natural resource properties and the gathering and processing of natural gas in the United States. PVR completed its initial public offering in October 2001. PVG derives its cash flow solely from cash distributions received from PVR. PVG completed its initial public offering in December 2006. PVG’s general partner is an indirect wholly owned subsidiary of ours.
PVR’s coal and natural resource management segment primarily involves the management and leasing of coal properties and the subsequent collection of royalties. PVR’s coal reserves are primarily located in Kentucky, Virginia, West Virginia, Illinois and New Mexico. PVR also earns revenues from other land management activities, such as selling standing timber, leasing fee-based coal-related infrastructure facilities to certain lessees and end-user industrial plants, collecting oil and gas royalties and from coal transportation, or wheelage, fees.
PVR’s natural gas midstream segment is engaged in providing natural gas processing, gathering and other related services. PVR owns and operates natural gas midstream assets located in Oklahoma and Texas. PVR’s natural gas midstream business derives revenues primarily from gas processing contracts with natural gas producers and from fees charged for gathering natural gas volumes and providing other related services. In addition, PVR owns a 25% member interest in Thunder Creek Gas Services, LLC (“Thunder Creek”), a joint venture that gathers and transports coalbed methane (“CBM”) in Wyoming’s Powder River Basin. PVR also owns a natural gas marketing business, which aggregates third-party volumes and sells those volumes into intrastate pipeline systems and at market hubs accessed by various interstate pipelines. PVR’s natural gas marketing and gathering and processing businesses provide services to us for which we are charged agent fees. During 2009, 2008 and 2007, we paid a total of $5.4 million, $5.3 million and $2.2 million in agent fees to PVR (see Note 24).
Cash flow available to us from PVG and PVR is only in the form of cash distributions declared and paid to us as a result of our partner interests in each of them. We received cash distributions of $42.3 million, $44.0 million and $29.8 million from PVG and PVR in the years ended December 31, 2009, 2008 and 2007, as a result of our partner interests in PVG and PVR.
3. | Summary of Significant Accounting Policies |
TABLE OF CONTENTS
PENN VIRGINIA CORPORATION AND SUBSIDIARIES
NOTES TO CONSOLIDATED FINANCIAL STATEMENTS
(in thousands, except per share amounts)
3. Summary of Significant Accounting Policies
Principles of Consolidation
Our consolidated financial statementsConsolidated Financial Statements include the accounts of Penn Virginia and all of its subsidiaries, including PVG and PVR. Intercompany balances and transactions have been eliminatedeliminated. Investments in consolidation. PVR ownsaffiliated companies where we have a 25% member20% to 50% ownership interest in Thunder Creek, a joint venture that gathersare accounted for using the equity method of accounting. These investments are presented separately on the Consolidated Balance Sheets and transports coalbed methane in Wyoming’s Powder River Basin and a 50% member interest in a coal handling joint venture. Earningsearnings from PVR’s equity affiliates are recorded as other revenues on the consolidated statementsConsolidated Statements of income and PVR’s investments in these equity affiliates are recorded on the equity investments line on the consolidated balance sheets. Our consolidated financial statements have been prepared in accordance with accounting principles generally accepted in the United States of America. These statements involve the use of estimates and judgments where appropriate.Income.
Prior to PVG’s initial public offering on December 5, 2006, our ownership of PVR included our ownership of limited partner interests in PVR and our ownership of Penn Virginia Resource GP, LLC, which is PVR’s general partner and owns the IDRs in PVR. Our sole ownership of Penn Virginia Resource GP, LLC provided us with a 2% general partner interest in PVR. Our general partner interest gave us control of PVR.
PVG’s only cash-generating assets are its ownership of limited partners interests in PVR and its ownership interest in Penn Virginia Resource GP, LLC, which owns the general partner interest and IDRs in PVR. Therefore, PVG’s cash flows are dependent upon PVR’s ability to make cash distributions, and the distributions PVG receives are subject to PVR’s cash distribution policies.
The minority interests of subsidiaries on our consolidated balance sheets reflect the outside ownership interest of PVG and PVR as of December 31, 2008, 2007 and 2006. PVG’s outside ownership interest was 23% at December 31, 2008 and 18% at December 31, 2007 and 2006. PVR’s outside ownership interest was 61% at December 31, 2008 and 56% at December 31, 2007 and 2006.
Use of Estimates
Preparation of our consolidated financial statementsConsolidated Financial Statements in conformity with accounting principles generally accepted in the United States of America requires management to make estimates and assumptions that affect the reported amounts of assets and liabilities in our consolidated financial statementsConsolidated Financial Statements and the reported amounts of revenues and expenses during the reporting period. Actual results could differ from those estimates.
Cash and Cash Equivalents
We consider all highly liquid investments purchased with an original maturity of three months or less to be cash equivalents.
Allowance for Doubtful Accounts
The allowance for doubtful accounts represents an estimate of uncollectible accounts receivable. The recorded amount reflects various factors, including accounts receivable aging, customer-specific risk issues and historical write-off experience. When a specific accounts receivable balance is deemed uncollectible, a charge is taken to this reserve. Recoveries of balances previously written off are also reflected in this reserve.
Inventories
Inventories, which primarily consist of tubular products, are stated at the lower of cost or market and are valued principally on the weighted-average-cost method.
Assets Held for Sale
When specific actions to dispose of assets progress to the point that “plan of sale” criteria have been met, impairments, to the extent they exist, are recognized in the Consolidated Statements of Income and the underlying assets are reclassified as assets held for sale. Gains and losses on sales of assets are reflected in total revenues or total expenses, respectively.
Oil and Gas Properties
We use the successful efforts method to account for our oil and gas properties. Under this method, costs of acquiring properties, costs of drilling successful exploration wells and development costs are capitalized. Geological and geophysical costs, delay rentals and costs to drill exploratory wells that do not find proved reserves are expensed as oil and gas exploration. We will carry the costs of an exploratory well as an asset if the well found a sufficient quantity of reserves to justify its completion as a producing well and as long as we are making sufficient progress assessing the reserves and the economic and operating viability of the project. For certain projects, it may take us more than one year to evaluate the future potential of the exploratory well and make a determination of its economic viability. Our ability to move forward on a project may be dependent on gaining access to transportation or processing facilities or obtaining permits and government or partner approval, the timing of which is beyond our control. In such cases, exploratory well costs remain suspended as long as we are actively pursuing access to necessary facilities and access to such permits and approvals and believe that they will be obtained. We assess the status of suspended exploratory well costs on a quarterly basis.
TABLE OF CONTENTS
PENN VIRGINIA CORPORATION AND SUBSIDIARIES
NOTES TO CONSOLIDATED FINANCIAL STATEMENTS
(in thousands, except per share amounts)
3. Summary of Significant Accounting Policies – (continued)
The costs of unproved leaseholds, including associated interest costs for the period activities that were in progress to bring projects to their intended use, are capitalized pending the results of exploration efforts. Interest costs associated with non-producing leases were capitalized in the amounts of $2.0 million, $3.7 million and $2.8 million in 2008, 2007 and 2006. We regularly assess on a property-by-property basis the impairment of individual unproved properties whose acquisition costs are relatively significant. Unproved properties whose acquisition costs are not relatively significant are amortized in the aggregate over the lesser of five years or the average remaining lease term. As exploration work progresses and the reserves on significant properties are proven, capitalized costs of these properties will be subject to depreciation and depletion. If the exploration work is unsuccessful, the capitalized costs of the properties related to the unsuccessful work will be expensed.charged to exploration expense. The timing of any write-downs of these unproven properties, if warranted, depends upon the nature, timing and extent of future exploration and development activities and their results. As of December 31, 2008, 2007 and 2006, unproved leasehold costs amounted to $154.8 million, $127.8 million and $100.0 million.
Other Property and Equipment
Other property and equipment primarily consist of processing facilities, gathering systems, compressor stations, PVR’s ownership in coal fee mineral interests, PVR’s royalty interest in oil and natural gas wells, forestlands and related equipment. Property and equipment are carried at cost and include expenditures for additions and improvements, such as roads and land improvements, which increase the productive lives of existing assets. Maintenance and repair costs are
expensed charged to expense as incurred. Renewals and betterments, which extend the useful life of the properties, are capitalized.
We compute depreciation and amortization of property, plant and equipment using the straight-line balance method over the estimated useful life of each asset as follows:
| | |
| | Useful Life |
| Gathering systems | | | Useful Life15 – 20 years | |
Gathering systems
Compressor stations | | 15-20 | 5 – 15 years | |
Compressor stations
Processing plants | | 5-15 years |
Processing plants
| | 15 years | |
Other property and equipment | | 3-20 | 3 – 20 years | |
Coal properties are depleted on an area-by-area basis at a rate based on the cost of the mineral properties and the number of tons of estimated proven and probable coal reserves contained therein. Proven and probable coal reserves have been estimated by PVR’s own geologists and outside consultants. PVR’s estimates of coal reserves are updated periodically and may result in adjustments to coal reserves and depletion rates that are recognized prospectively. From time to time, PVR carries out core-hole drilling activities on its coal properties in order to ascertain the quality and quantity of the coal contained in those properties. These core-hole drilling activities are expensed as incurred. PVR depletes timber using a methodology consistent with the units-of-production method, but that is based on the quantity of timber harvested. PVR determines depletion of oil and gas royalty interests by the units-of-production method and these amounts could change with revisions to estimated proved recoverable reserves. When PVR retires or sells an asset, we remove its cost and related accumulated depreciation and amortization from our consolidated balance sheets.Consolidated Balance Sheets. We record the difference between the net book value, net of any assumed asset retirement obligation (“ARO”), and proceeds from dispositions of property and equipment as a gain or loss.
Intangible Assets
Intangible assets are primarily associated with assumed contracts, customer relationships and rights-of-way. These intangible assets are amortized over periods of up to 20 years, the period in which benefits are derived from the contracts, relationships and rights-of-way, and are combined with property, plant and equipment and are reviewed for impairment under SFAS No. 144,rights-of-way.
TABLE OF CONTENTS
PENN VIRGINIA CORPORATION AND SUBSIDIARIES
NOTES TO CONSOLIDATED FINANCIAL STATEMENTS
(in thousands, except per share amounts)
3. Summary of Significant Accounting for the Impairment or Disposal of Long-Lived Assets. See Note 13, “Intangible Assets, net” for a more detailed description of our intangible assets.
Asset Retirement Obligations
In accordance with Statement of Financial Accounting Standards (“SFAS”) No. 143,Accounting for Asset Retirement Obligations, we recognize the fair value of a liability for an ARO in the period in which it is incurred. The determination of fair value is based upon regional market and specific facility type information. The associated asset retirement costs are capitalized as part of the carrying cost of the asset. See Note 16Policies – “Asset Retirement Obligations.” The long-lived assets for which our AROs are recorded include natural gas processing facilities, compressor stations, gathering systems, coal processing plants and wells. The amount of an ARO and the costs capitalized equal the estimated future cost to satisfy the abandonment obligation using current prices that are escalated by an assumed inflation factor after discounting the future cost back to the date that the abandonment obligation was incurred using a rate commensurate with the risk, which approximates our cost of funds. After recording these amounts, the ARO is accreted to its future estimated value using the same assumed rate, and the additional capitalized costs are depreciated over the productive life of the assets. Both the accretion and the depreciation are included in depreciation, depletion and amortization (“DD&A”) expense on our consolidated statements of income.
In connection with PVR’s natural gas midstream assets, we are obligated under federal regulations to perform limited procedures around the abandonment of pipelines. We are unable to reasonably determine the fair value of such ARO because the settlement dates, or ranges thereof, are indeterminable. An ARO will be recorded in the period in which we can reasonably determine the settlement dates.
(continued)Impairment of Long-Lived and Other Assets
We review long-lived assets to be held and used wheneverfor impairment when events or circumstances indicate thata possible decline in the recoverability of the carrying value of those assets may not be recoverable. We recognize an impairment loss whensuch property. If the carrying amount of an asset exceeds the sumvalue of the undiscountedasset is determined to be impaired, we reduce the asset to its fair value. Fair value may be estimated using comparable market data, a discounted cash flow method, or a combination of the two. In the discounted cash flow method, estimated future cash flows. In this circumstance, we recognize an impairment loss equal toflows are based on management’s expectations for the difference between the carrying valuefuture and the fair valuecould include estimates of future production, commodity prices based on published forward commodity price curves as of the asset. Fair value is estimated to be the present value of future net cash flows from the asset, discounted using a rate commensurate with the risk and remaining lifedate of the asset.estimate, operating and development costs, and a risk-adjusted discount rate.
Quantities of proved reserves are estimated based on economic conditions in existence in the period of assessment. Lower oil and gas prices may have the impact of shortening the economic lives on certain fields because it becomes uneconomic to produce all recoverable reserves on such fields, thus reducing proved property reserve estimates. If such revisions in the estimated quantities of proved reserves occur, it will have the effect of increasing the rates of depletion and amortization (“DD&A&A”) on the affected properties, which would decrease earnings or result in losses through higher DD&A expense.&A. The revisions may also be sufficient enough to cause impairment losses on certain properties that would result in a further non-cash expense to earnings. If natural gas, crude oil and natural gas liquids (“NGL”)NGL prices decline or we drill uneconomic wells, it is reasonably possible we could have a significant impairment charge to be recorded in our consolidated statementsConsolidated Statements of income.Income.
The PVR natural gas midstream segment has completed a number of acquisitions in recent years. See Note 4, “Acquisitions and Divestitures,” for a description of the PVR natural gas midstream segment’s material acquisitions. In conjunction with our accounting for these acquisitions, it was necessary for PVR to estimate the values of the assets acquired and liabilities assumed, which involved the use of various assumptions. The most significant assumptions, and the ones requiring the most judgment, involve the estimated fair values of property, plant and equipment, and the resulting amount of goodwill, if any. Changes in operations, further decreases in commodity prices, changes in the business environment or futher deterioriations of market conditions could substantially alter management’s assumptions and could result in lower estimates of values of acquired assets or of future cash flows. If these events occur, it is reasonably possible we could have a significant impairment charge to be recorded in our consolidated statements of income.
For the years ended December 31, 2008, 2007 and 2006, we recorded impairment charges related to ourWe review oil and gas segment properties for impairment when events and circumstances indicate a decline in the recoverability of $20.0 million, $2.6 million and $8.5 million. See Note 14 – “Impairmentthe carrying value of Oil and Gas Properties.”
Impairmentsuch properties, such as a downward revision of Goodwill
Goodwill has been allocated to the PVR natural gas midstream segment. Under SFAS No. 141,Business Combinations, and SFAS No. 142,Goodwill and Other Intangible Assets, goodwill recordedreserve estimates or lower commodity prices. We estimate the future cash flows expected in connection with a business combination is not amortized, but tested for impairment at least annually.
Goodwill impairment is determined using a two-step test. The first stepthe properties and compare such future cash flows to the carrying amounts of the impairment test isproperties to determine if the carrying amounts are recoverable. The factors used to identify potential impairment by comparingdetermine fair value include, but are not limited to, estimates of proved and probable reserves, future commodity prices, the timing of future production and capital expenditures and a discount rate commensurate with the risk reflective of the lives remaining for the respective oil and gas properties. Because these significant fair value inputs are typically not observable, we classify impairments of long-lived assets as a level 3 fair value measure (see Notes 5 and 19).
Income Taxes
We recognize deferred tax liabilities and assets for the expected future tax consequences of events that have been recognized in a company’s financial statements or tax returns. Using this method, deferred tax liabilities and assets are determined based on the difference between the financial statement carrying amounts and tax bases of assets and liabilities using enacted tax rates. We recognize interest related to unrecognized tax benefits in interest expense and penalties are included in income tax expense.
Asset Retirement Obligations
We recognize the fair value of a reporting unitliability for an ARO in the period in which it is incurred. The determination of fair value is based upon regional market and specific facility type information. The associated asset retirement costs are capitalized as part of the carrying cost of the asset. The long-lived assets for which our AROs are recorded include natural gas processing facilities, compressor stations, gathering systems, coal processing plants and oil and natural gas wells. The amount of an ARO and the costs capitalized represent the estimated future cost to satisfy the abandonment obligation using current prices that are escalated by an assumed inflation factor after discounting the future cost back to the bookdate that the abandonment obligation was incurred using a rate commensurate with the risk, which approximates our cost of funds. Because these significant fair value including goodwill. Ifinputs are typically not observable, we categorized the initial fair value estimates as a level 3 input. After recording these amounts, the ARO is accreted to its future estimated value
TABLE OF CONTENTS
PENN VIRGINIA CORPORATION AND SUBSIDIARIES
NOTES TO CONSOLIDATED FINANCIAL STATEMENTS
(in thousands, except per share amounts)
3. Summary of Significant Accounting Policies – (continued)
using the same assumed rate, and the additional capitalized costs are depreciated over the productive life of the assets. Both the accretion and the depreciation are included in DD&A expense on our Consolidated Statements of Income.
In connection with PVR’s natural gas midstream assets, we are obligated under federal regulations to perform limited procedures around the abandonment of pipelines. In some cases, we are unable to reasonably determine the fair value of a reporting unit exceeds its book value, goodwill ofsuch ARO because the reporting unit is not considered impaired, and the second step of the impairment test is not required. If the book value of a reporting unit exceeds its fair value, the second step of the impairment test is performed to measure the amount of impairment loss, if any. The second step of the impairment test compares the implied fair value of the reporting unit’s goodwill with the book value of that goodwill. If the book value of the reporting unit’s goodwill exceeds the implied fair value of that goodwill, an impairment loss is recognized in an amount equal to that excess. The implied fair value of goodwill is determinedsettlement dates, or ranges thereof, are indeterminable. An ARO will be recorded in the same manner asperiod in which we can reasonably determine the amount of goodwill recognized in a business combination. The annual impairment testing is performed in the fourth quarter.settlement dates.
Management uses a number of different criteria when evaluating goodwill for possible impairment. Indicators such as significant decreases in a reporting unit’s book value, decreases in cash flows, sustained operating losses, a sustained decrease in market capitalization, adverse changes in the business climate, legal matters, losses of significant customers and new technologies which could accelerate obsolescence of business products are used by management when performing evaluations. We tested goodwill for impairment during the fourth quarter of 2008 and recorded an impairment charge of $31.8 million. As a result of this impairment charge, we did not have a balance in goodwill at December 31, 2008. We had a $7.7 million balance in goodwill at December 31, 2007. See Note 12, “Goodwill.”
Environmental Liabilities
Other liabilities include accruals for environmental liabilities that we either assumed in connection with certain acquisitions or recorded in operating expenses when it became probable that a liability had been incurred and the amount of that liability could be reasonably estimatedestimated.
Derivative Instruments
ConcentrationFrom time to time, we and PVR utilize derivative financial instruments to mitigate our exposure to interest rates, and natural gas, NGL and crude oil price volatility. The derivative financial instruments, which are placed with financial institutions that we believe are acceptable credit risks, take the form of Credit Risk
Approximately 57%swaps, collars and three-way collars. All derivative financial instruments are recognized in the Consolidated Financial Statements at fair value. The fair values of our consolidated accounts receivable at December 31, 2008 resultedand PVR’s derivative instruments are determined based on discounted cash flows derived from quoted forward prices. All derivative transactions are subject to our risk management policy, which has been reviewed and approved by our board of directors.
Because we and PVR no longer apply hedge accounting for our commodity derivatives, we recognize changes in fair value in earnings currently as a component of the derivatives line on the Consolidated Statements of Income. We and PVR have experienced and could continue to experience significant changes in the estimate of unrealized derivative gains or losses recognized due to fluctuations in the value of these commodity derivative contracts. The discontinuation of hedge accounting has no impact on our and PVR’s reported cash flows, although our and PVR’s results of operations are affected by the volatility of mark-to-market gains and losses and changes in fair value, which fluctuate with changes in natural gas, crude oil and gas segment, approximately 33% resulted from the PVR natural gas midstream segment and approximately 10% resulted from the PVR coal and natural resource management segment. Approximately 46% of PVR’s natural gas midstream segment accounts receivables and 16% of our consolidated accounts receivable at December 31, 2008 related to three natural gas midstream customers. Approximately $20.3 million of our oil and gas segment trade receivables at December 31, 2008 were related to three customers. Approximately 24% of our oil and gas segment’s receivables and 14% of our consolidated receivables at December 31, 2008 related to these three oil and gas customers. NoNGL prices. These fluctuations could be significant uncertainties related to the collectability of amounts owed to us or PVR exists in regards to these natural gas midstream segment or these oil and gas segment customers.
As of December 31, 2008, no receivables were collateralized, and we recorded a $1.0 million allowance for doubtful accounts in the oil and gas segment and a $1.4 million allowance for doubtful accounts in the PVR natural gas midstream segment.volatile pricing environment.
Revenue Recognition
At December 31, 2008, PVR reported a net commodity derivative asset related to the natural gas midstream segment of $22.7 million that is with two counterparties and is substantially concentrated with one of those counterparties. We reported a net commodity derivative asset related to our oil and gas segment of $41.2 million, 72% of which was concentrated with three counterparties. These concentrations may impact our overall credit risk, either positively or negatively, in that these counterparties may be similarly affected by changes in economic or other conditions. Neither we nor PVR paid nor received collateral with respect to our derivative positions. No significant uncertainties related to the collectability of amounts owed to us or PVR exists with regard to these counterparties.
These concentrations may impact our overall credit risk, either positively or negatively, in that these entities may be similarly affected by changes in economic or other conditions.
Revenues
Oil and Gas Revenues. We record revenues associated with sales of natural gas, crude oil, condensate and NGLs when title passes to the customer. We recognize natural gas sales revenues from properties in which we have an interest with other producers on the basis of our net working interest (“entitlement” method of accounting). Natural gas imbalances occur when we sell more or less than our entitled ownership percentage of total natural gas production. We treat any amount received in excess of our share as deferred revenues. If we take less than we are entitled to take, we record the under-delivery as a receivable. As a result of the numerous requirements necessary to gather information from purchasers or various measurement locations, calculate volumes produced, perform field and wellhead allocations and distribute and disburse funds to various working interest partners and royalty owners, the collection of revenues from oil and gas production may take up to 60 days following the month of production. Therefore, we make accruals for revenues and accounts receivable based on estimates of our share of production, particularly from properties that are operated by our partners. Since the settlement process may take 30 to 60 days following the month of actual production, our financial results include estimates of production and revenues for the related time period. We record any differences, which we dohistorically have not expect to bebeen significant, between the actual amounts ultimately received and the original estimates in the period they become finalized.
TABLE OF CONTENTS
PENN VIRGINIA CORPORATION AND SUBSIDIARIES
NOTES TO CONSOLIDATED FINANCIAL STATEMENTS
(in thousands, except per share amounts)
3. Summary of Significant Accounting Policies – (continued)
Natural Gas Midstream Revenues. We recognize revenues from the sale of NGLs and residue gas when PVR sells the NGLs and residue gas produced at its gas processing plants. We recognize gathering and transportation revenues based upon actual volumes delivered. Due to the time needed to gather information from various purchasers and measurement locations and then calculate volumes delivered, the collection of natural gas midstream revenues may take up to 30 days following the month of production. Therefore, we make accruals for revenues and accounts receivable and the related cost of midstream gas purchased and accounts payable based on estimates of natural gas purchased and NGLs and residue gas sold. We record any differences, which historically have not been significant, between the actual amounts ultimately received or paid and the original estimates in the period they become finalized.
Coal Royalties Revenues. We recognize coal royalties revenues on the basis of tons of coal sold by PVR’s lessees and the corresponding revenues from those sales. Since PVR does not operate any coal mines, it does not have access to actual production and revenues information until approximately 30 days following the month of production. Therefore, our financial results include estimated revenues and accounts receivable for the month of production. We record any differences, which historically have not been significant, between the actual amounts ultimately received or paid and the original estimates in the period they become finalized.
Derivative Activities
From time to time, we enter into derivative financial instruments to mitigate our exposure to natural gas, crude oil and price volatility. The derivative financial instruments, which are placed with financial institutions that we believe are acceptable credit risks, take the form of collars and three-way collars. All derivative financial instruments are recognized in our consolidated financial statements at fair value in accordance with SFAS No. 133,Accounting for Derivative Instruments and Hedging Activities. The fair values of our derivative instruments are determined based on discounted cash flows derived from quoted forward prices. All derivative transactions are subject to our risk management policy, which has been reviewed and approved by our board of directors.
Until April 30, 2006, we applied hedge accounting for commodity derivative financial instruments as allowed under SFAS No. 133. Our commodity derivative financial instruments initially qualified as cash flow hedges, and changes in fair value of the effective portion of these contracts were deferred in accumulated other comprehensive income (“AOCI”) until
the hedged transactions settled. When we discontinued hedge accounting for commodity derivatives, a net loss remained in AOCI of $12.1 million. As the hedged transactions settled in 2006, 2007 and 2008, we and PVR recognized the $12.1 million of deferred changes in fair value in revenues and cost of gas purchased in our consolidated statements of income related to commodity derivatives. As of December 31, 2008, all amounts deferred under previous commodity hedging relationships have been reclassified into revenues and cost of midstream gas purchased.
PVR continues to apply hedge accounting to some of its interest rate hedges. Settlements on the PVR interest rate swap agreements (the “PVR Interest Rate Swaps”) that follow hedge accounting are recorded as interest expense. The effective portion of the change in the fair value of the swaps that follow hedge accounting are recorded each period in AOCI. Certain of the PVR Interest Rate Swaps do not follow hedge accounting. Accordingly, mark-to-market gains and losses for the PVR Interest Rate Swaps that do not follow hedge accounting are recognized in earnings currently in the Derivatives line on the consolidated statements of income.
Because we no longer apply hedge accounting for our commodity derivatives, we recognize changes in fair value in earnings currently in the derivatives line on the consolidated statements of income. We have experienced and could continue to experience significant changes in the estimate of unrealized derivative gains or losses recognized due to fluctuations in the value of these commodity derivative contracts. The discontinuation of hedge accounting has no impact on our reported cash flows, although our results of operations are affected by the volatility of mark-to-market gains and losses and changes in fair value, which fluctuate with changes in natural gas, crude oil and NGL prices. These fluctuations could be significant in a volatile pricing environment.
During the year ended December 31, 2008, we reclassified a total of $8.2 million from AOCI to earnings related to our and PVR’s commodity derivatives and our and PVR’s Interest Rate Swaps. At December 31, 2008, a $1.2 million loss remained in AOCI related to PVR Interest Rate Swaps on which PVR discontinued hedge accounting. The $1.2 million loss will be recognized in earnings through the end of 2011 as the hedged transactions settle. See Note 8 – “Derivative Instruments,” for a more detailed description of our and PVR’s derivative programs.
Stock-BasedShare-Based Compensation
We have several stock compensation plans that allow incentive and nonqualified stock options and restricted stock to be granted to key employees and officers and nonqualified stock options and deferred common stock units to be granted to directors. The general partners of PVG and PVR both have long-term incentive plans that permit the granting of awards to their directors and employees and employees of their affiliates who perform services for PVG and PVR.
We and PVR account for stock-based compensation in accordance with SFAS No. 123 (R),Share-Based Payment,which establishes standards for transactions in which an entity exchanges its equity instruments for goods and services. This standard requires us and PVR to measure the cost of employee services received in exchange for an award of equity instruments based on the grant-date fair value of the award. See Note 21 – “Share-Based Payments.”
Concentration of Credit Risk
Approximately 17% of PVR’s natural gas midstream segment accounts receivables and 9% of our consolidated accounts receivable at December 31, 2009 related to three natural gas midstream customers. Approximately $8.3 million of our oil and gas segment trade receivables at December 31, 2009 was related to one customer. Approximately 19% of our oil and gas segment’s receivables and 7% of our consolidated receivables at December 31, 2009 related to this oil and gas customer. No significant uncertainties related to the collectability of amounts owed to us or PVR exists in regards to the natural gas midstream segment or oil and gas segment customers.
Income TaxesAt December 31, 2009, we reported a commodity derivative asset related to our oil and gas segment of $14.5 million, over 50% of which was concentrated with one counterparty. This concentration may impact our overall credit risk, either positively or negatively, in that this counterparty may be similarly affected by changes in economic or other conditions. We neither paid nor received collateral with respect to our derivative positions. No significant uncertainties related to the collectability of amounts owed to us exist with regard to this counterparty.
We account for income taxesThese concentrations may impact our overall credit risk, either positively or negatively, in accordancethat these entities may be similarly affected by changes in economic or other conditions.
New Accounting Standards
In January 2010, the Financial Accounting Standards Board (the “FASB”) issued new authoritative guidance with respect oil and gas reserve estimation and disclosures. The new guidance effectively aligns the oil and gas reserve estimation and disclosure requirements of GAAP with the provisionsrequirements of SFAS No. 109,the Securities and Exchange Commission that were issued in the form of a final rule in December 2008. The new guidance is intended to provide investors with a more meaningful and comprehensive understanding of oil and gas
TABLE OF CONTENTS
PENN VIRGINIA CORPORATION AND SUBSIDIARIES
NOTES TO CONSOLIDATED FINANCIAL STATEMENTS
(in thousands, except per share amounts)
3. Summary of Significant Accounting Policies – (continued)
reserves by expanding the definition of proved oil and gas producing activities and updating the reserve estimation requirements for Income Taxes, which requires a companychanges in practice and technology that have occurred during the past several decades. One of the more significant changes associated with the new guidance is the requirement to recognize deferred tax liabilitiesutilize an average (beginning of the month basis) oil and assetsgas price for the expectedyear in the determination of estimates of future tax consequencesnet revenues and the standardized measure. We applied the new guidance to our supplemental oil and gas producing activities disclosures as of eventsDecember 31, 2009 included herein.
In August 2009, the FASB issued guidance on how companies should measure liabilities at fair value. The guidance clarifies that the quoted price for an identical liability should be used. However, if such information is not available, an entity may use the quoted price of an identical liability when traded as an asset, quoted prices for similar liabilities or similar liabilities traded as assets, or another valuation technique (such as the market or income approach). The guidance also indicates that the fair value of a liability is not adjusted to reflect the impact of contractual restrictions that prevent its transfer and indicates circumstances in which quoted prices for an identical liability or quoted price for an identical liability traded as an asset may be considered level 1 fair value measurements. This guidance was effective October 1, 2009 and the adoption did not have been recognizeda material impact on our Consolidated Financial Statements.
In April 2009, the FASB issued an amendment to business combination standards related to accounting for assets acquired and liabilities assumed in a company’s financial statements or tax returns. Using this method, deferred tax liabilitiesbusiness combination that arise from contingencies. This amendment addresses application issues raised by preparers, auditors and assets are determined basedmembers of the legal profession on the difference between the financial statement carrying amountsinitial recognition and tax basesmeasurement, subsequent measurement and accounting and disclosure of assets and liabilities using enacted tax rates. We now recognize interest related to unrecognized tax benefits in interest expense, and penalties are included in income tax accrued. See Note 19, “Income Taxes.”
Accounting for Uncertainty in Income Taxes
We adopted Financial Accounting Standards Board (“FASB”) Interpretation No. 48,Accounting for Uncertainty in Income Taxes,an interpretation of FASB Statement No. 109 (“FIN 48”) as of January 1, 2007. FIN 48 clarifies the accounting for uncertainty in income taxes recognized in a company’s financial statements in accordance with SFAS No. 109. FIN 48 prescribes a recognition threshold and measurement attribute for the financial statement recognition and measurement of a tax position taken or expected to be taken in a tax return. FIN 48 also provides guidance on derecognition, classification, interest and penalties, accounting in interim periods, disclosure and transition. We also adopted FASB Staff Position No. FIN 48–1,Definition of Settlement in FASB Interpretation No. 48 (“FSP FIN 48–1”) as of January 1, 2007. FSP FIN 48–1 provides that a company’s tax position will be considered settled if the taxing authority has completed its examination, the company does not plan to appeal and it is remote that the taxing authority would reexamine the tax position in the future.
The adoption of FIN 48 did not result in a transition adjustment to retained earnings; instead, $8.7 million was reclassifiedarising from deferred income taxes to a long-term liability. See Note 19 – “Income Taxes.”
Gain on Sale of Subsidiary Units
We account for PVR equity issuances as sales of minority interest. For each PVR equity issuance, we have calculated a gain under SEC Staff Accounting Bulletin No. 51 (or Topic 5-H),Accounting for Sales of Stock by a Subsidiary(“SAB 51”). SAB 51 provides guidance on accounting for the effect of issuances of a subsidiary’s stock on the parent’s investment in that subsidiary. In some situations, SAB 51 allows registrants to elect an accounting policy of recording gains or losses on issuances of stock by a subsidiary either in income or as a capital transaction. Accordingly, we adopted a policy of recording SAB 51 gains and losses directly to shareholders’ equity. As a result of PVR’s unit offering in May 2008, we recognized gains in consolidated shareholders’ equity totaling $39.7 million, with a corresponding entry to minority interest. See Note 6 – “PVR Unit Offering.”
In addition, we recognized a $36.4 million gain in consolidated shareholders’ equity, net of the related income taxes of $23.2 million, on the sale of PVG units to PVR. PVR subsequently delivered these units as consideration in its acquisition of Lone Star Gathering, L.P. (“Lone Star”). See Note 4 – “Acquisitions and Divestitures.”
New Accounting Standards
In December 2007, the FASB issued SFAS No. 141 (revised 2007),Business Combinations(“SFAS No.141(R)”). SFAS No. 141(R) provides companies with principles and requirements on how an acquirer recognizes and measures in its financial statements the identifiable assets acquired, liabilities assumed and any noncontrolling interest in the acquiree as well as the recognition and measurement of goodwill acquired or a gain from a bargain purchasecontingencies in a business combination. SFAS No. 141(R) also requires certain disclosures to enable usersThe amendment is effective for assets or liabilities arising from contingencies in business combinations for which the acquisition date is on or after the beginning of the financial statementsfirst annual reporting period beginning on or after December 15, 2008. This amendment will have an impact on our accounting for any future business combinations.
In April 2008, The FASB issued an amendment to evaluateaccounting standards related to the nature and financial effectsdetermination of the business combination. Acquisition costs associated withuseful life of intangible assets. This amendment addresses the business combination will generallyfactors that should be expensed as incurred. In addition, changesconsidered in an acquired entity’s valuation allowancedeveloping renewal or extension assumptions used to determine the useful life of a recognized intangible. This amendment is effective for deferred tax assetsfiscal years beginning after December 15, 2008 and uncertain tax positions after the measurement period will be recorded in income tax expense. SFAS No. 141(R) became effectivedid not have a material impact on January 1, 2009.
In December 2007, the FASB issued SFAS No. 160,Noncontrolling Interests inour Consolidated Financial Statements an amendment of ARB No. 51, which mandates that a noncontrolling (minority) interest shall be reported inupon its adoption.
Effective January 1, 2009, we adopted the consolidated statement of financial position within equity, separately fromnew accounting standard issued by the parent company’s equity. This statement amends ARB No. 51 and clarifies that aFASB on noncontrolling interest in consolidated financial statements. This standard requires that the noncontrolling interests in PVG and PVR be reported on our Consolidated Balance Sheets as a subsidiary is an ownershipseparate item within shareholders’ equity. Net income attributable to the noncontrolling interest in the consolidated entity. SFAS No. 160 also requires consolidated net income to include amounts attributable to both the parentPVG and noncontrolling interest and requires disclosure,PVR is separately presented on the face of our Consolidated Statement of Income. Our Consolidated Financial Statements have been adjusted on a retrospective basis to reflect the consolidated statementsadoption of income, of the amounts of consolidated netthis standard. Comprehensive income attributable to the parentnoncontrolling interests in PVG and to the noncontrolling interest. SFAS No. 160PVR is separately presented in our schedule of comprehensive income. The standard also requires that gains from the salessale of subsidiary stockunits be recorded directly to shareholders’shareholders equity. If, in the future, we sell sufficient controlling interestinterests in our subsidiaries to require deconsolidation of those subsidiaries, then we expect to record a gain or loss on our consolidated statementsConsolidated Statement of income. SFAS No. 160 became effective January 1, 2009Income.
Subsequent Events
Management has evaluated all activities of the Company through, the date upon which the Consolidated Financial Statements were issued, and will resultconcluded that no subsequent events have occurred that would require recognition in the classification of minority interestConsolidated Financial Statements or disclosure in PVG and PVR to be recorded as a component of shareholders’ equity. Net income and comprehensive income attributablethe Notes to the noncontrolling interest will be separately presented onConsolidated Financial Statements.
TABLE OF CONTENTS
PENN VIRGINIA CORPORATION AND SUBSIDIARIES
NOTES TO CONSOLIDATED FINANCIAL STATEMENTS
(in thousands, except per share amounts)
3. Summary of Significant Accounting Policies – (continued)
Prior-Period Revision
During the face of the consolidated statements of income and consolidated statement of shareholders’ equity and comprehensive income, applied retrospectively for all periods presented.
In April 2008, the FASB issued Staff Position No. FAS 142-3,Determination of the Useful Life of Intangible Assets (“FSP FAS 142-3”), which amends SFAS No. 142. The pronouncement requires that companies estimating the useful life of a recognized intangible asset consider their historical experience in renewing or extending similar arrangements or, in the absence of historical experience, consider assumptions that market participants would use about renewal or extension. FSP FAS 142-3 is effective for financial statements issued for fiscal years and interim periods beginning after December 15, 2008 and must be applied prospectively to intangible assets acquired after the effective date. Effective January 1, 2009, we will prospectively apply FSP FAS 142-3 to all intangible assets purchased.
In May 2008, the FASB issued Staff Position No. APB 14-1,Accounting for Convertible Debt Instruments That May Be Settled in Cash upon Conversion (Including Partial Cash Settlement) (“FSP APB 14-1”). This standard requires issuers of convertible debt that may be settled wholly or partly in cash to account for the debt and equity components separately. FSP APB 14-1 requires that issuers of convertible debt separately account for the liability and equity components in a manner that will reflect the entity’s nonconvertible debt borrowing rate when interest cost is recognized in subsequent periods. FSP APB 14-1 is effective for financial statements issued for fiscal years beginning after December 15, 2008 and interim periods within those years, and must be applied retrospectively to all periods presented. Early adoption is prohibited. The adoption of FSP APB 14-1 will result in increased interest expense of approximately $8.0 million to $12.0 million for 2009. Beginning with the firstfourth quarter of 2009, we will recast ouridentified an accounting error related to deferred income taxes associated with certain subsidiary equity issuance transactions that were recorded in shareholders’ equity from 2004 through 2008 in accordance with SEC Staff Accounting Bulletin No. 51 (or Topic 5-H),Accounting for Sales of Stock by a Subsidiary (“SAB 51”). We accounted for these equity issuances of PVR and PVG as sales of minority interests, now noncontrolling interests, upon the Company’s adoption of the new accounting standard on noncontrolling interests in consolidated financial statements to retroactively applyas of January 1, 2009. For each PVR or PVG equity issuance, we recognized a SAB 51 gain in shareholders’ equity. Upon analysis of the 2009 sale of PVG units, management identified deferred income tax liabilities that should have been recorded in prior periods. The impact of this reclassification was an understatement of long-term deferred income tax liability, and an overstatement of paid-in capital for the years ended December 31, 2004 through 2008, including the related quarterly periods contained therein. The error had no effect on the statements of income or cash flows. The cumulative impact on the December 31, 2008, balance sheet would have been an increase in interest expensethe deferred income tax liability of approximately $114 million with a corresponding decrease in paid-in capital. Management determined that the effects of the misstatement were not material to any previously reported quarterly or annual period; therefore, the related corrections were reflected in the 2008 and 2009 balance sheet and the 2007 portion of the statement of stockholders’ equity. Prior period financial statements included in this filing have been revised to reflect these adjustments and the following table identifies those adjustments to deferred income taxes and additional paid-in capital resulting from the adoptionrevision:
| | | | | | |
| | 2008 | | 2007 | | 2006 |
Cumulative revision as of December 31,
| | | | | | | | | | | | |
| Deferred income tax liabilities (noncurrent) | | $ | 113,888 | | | $ | 98,513 | | | $ | 4,949 | |
| Additional paid-in capital | | | (113,888 | ) | | | (98,513 | ) | | | (4,949 | ) |
Revision for the year ended December 31,
| | | | | | | | | | | | |
| Deferred income tax liabilities (noncurrent) | | | 15,375 | | | | 93,564 | | | | — | |
| Additional paid-in capital | | | (15,375 | ) | | | (93,564 | ) | | | — | |
4. Fair Value Measurements
We apply the authoritative accounting provisions for measuring fair value of both our financial and nonfinancial assets and liabilities. Fair value is an exit price representing the expected amount we would receive to all periods presented. See Note 19 – “Long-Term Debt” forsell an asset or pay to transfer a discussion of our convertible notes.
liability in an orderly transaction with market participants at the measurement date.In June 2008,We use a hierarchy which prioritizes the FASB’s Emerging Issues Task Force (“EITF”) reached a consensus with regardinputs we use to Issue Number 07-5,Determining Whether an Instrument (or Embedded Feature) is Indexed to an Entity’s Own Stock (“EITF 07-5”). Derivative contracts on a company’s own stock may be accounted for as equity instruments, rather than asmeasure fair value into three distinct categories based upon whether such inputs are observable in active markets or unobservable. We classify assets and liabilities only ifin their entirety based on the derivative contracts are indexed solelylowest level of input that is significant to the company’s stockfair value measurement. Our methodology for categorizing assets and canliabilities that are measured at fair value pursuant to this hierarchy gives the highest priority to unadjusted quoted prices in active markets and the lowest level to unobservable inputs as outlined below:
Fair value measurements are to be settledclassified and disclosed in shares. EITF 07-5 addresses whether provisions that introduce adjustment features (including contingent adjustment features) would preclude treating a derivative contract or an embedded derivativeone of the following three categories:
| • | Level 1: Unadjusted quoted prices in active markets that are accessible at the measurement date for identical, unrestricted assets or liabilities. Level 1 inputs generally provide the most reliable evidence of fair value. |
| • | Level 2: Quoted prices in markets that are not active or inputs, which are observable, either directly or indirectly, for substantially the full term of the asset or liability. |
TABLE OF CONTENTS
PENN VIRGINIA CORPORATION AND SUBSIDIARIES
NOTES TO CONSOLIDATED FINANCIAL STATEMENTS
(in thousands, except per share amounts)
4. Fair Value Measurements – (continued)
| • | Level 3: Prices or valuation techniques that require inputs that are both significant to the fair value measurement and unobservable (i.e., supported by little or no market activity). |
Recurring Fair Value Measurements
Certain assets and liabilities are measured at fair value on a company’s own stock as indexed solelyrecurring basis in our Consolidated Balance Sheet. The following table summarizes the valuation of our assets and liabilities for the periods presented:
| | | | | | | | |
| | As of December 31, 2009 |
| | | Fair Value
Measurement | | Fair Value Measurement Classification |
| Description | | Level 1 | | Level 2 | | Level 3 |
Assets:
| | | | | | | | | | | | | | | | |
| Publicly traded equity securities | | $ | 5,904 | | | $ | 5,904 | | | $ | — | | | $ | — | |
| Interest rate swap assets – current | | | 1,463 | | | | — | | | | 1,463 | | | | — | |
| Interest rate swap assets – noncurrent | | | 1,266 | | | | — | | | | 1,266 | | | | — | |
| Commodity derivative assets – current | | | 16,109 | | | | — | | | | 16,109 | | | | — | |
| Commodity derivative assets – noncurrent | | | 2,364 | | | | — | | | | 2,364 | | | | — | |
Liabilities:
| | | | | | | | | | | | | | | | |
| Deferred compensation – noncurrent liability | | | (6,564 | ) | | | (6,564 | ) | | | — | | | | — | |
| Interest rate swap liabilities – current | | | (10,123 | ) | | | — | | | | (10,123 | ) | | | — | |
| Interest rate swap liabilities – noncurrent | | | (5,575 | ) | | | — | | | | (5,575 | ) | | | — | |
| Commodity derivative liabilities – current | | | (6,024 | ) | | | — | | | | (6,024 | ) | | | — | |
| Commodity derivative liabilities – noncurrent | | | (1,170 | ) | | | — | | | | (1,170 | ) | | | — | |
| Totals | | $ | (2,350 | ) | | $ | (660 | ) | | $ | (1,690 | ) | | $ | — | |
| | | | | | | | |
| | As of December 31, 2008 |
| | | Fair Value
Measurement | | Fair Value Measurement Classification |
| Description | | Level 1 | | Level 2 | | Level 3 |
Assets:
| | | | | | | | | | | | | | | | |
| Publicly traded equity securities | | $ | 4,559 | | | $ | 4,559 | | | $ | — | | | $ | — | |
| Commodity derivative assets – current | | | 67,569 | | | | — | | | | 67,569 | | | | — | |
| Commodity derivative assets – noncurrent | | | 4,070 | | | | — | | | | 4,070 | | | | — | |
Liabilities:
| | | | | | | | | | | | | | | | |
| Deferred compensation – noncurrent liability | | | (5,056 | ) | | | (5,056 | ) | | | — | | | | — | |
| Interest rate swap liabilities – current | | | (7,840 | ) | | | — | | | | (7,840 | ) | | | — | |
| Interest rate swap liabilities – noncurrent | | | (8,721 | ) | | | — | | | | (8,721 | ) | | | — | |
| Commodity derivative liabilities – current | | | (7,694 | ) | | | — | | | | (7,694 | ) | | | — | |
| Totals | | $ | 46,887 | | | $ | (497 | ) | | $ | 47,384 | | | $ | — | |
TABLE OF CONTENTS
PENN VIRGINIA CORPORATION AND SUBSIDIARIES
NOTES TO CONSOLIDATED FINANCIAL STATEMENTS
(in thousands, except per share amounts)
4. Fair Value Measurements – (continued)
We used the following methods and assumptions to estimate the company’s stock. fair values:
| • | Cash, cash equivalents, accounts receivable and accounts payable: The carrying amounts approximate fair value due to the short-term nature or maturity of the instruments. |
| • | Publicly traded equity securities: Our publicly traded equity securities consist of various publicly traded equities that are held as assets for funding certain deferred compensation obligations. The fair values are based on quoted market prices, which are level 1 inputs. |
| • | Commodity derivatives: Both our oil and gas commodity derivatives and the PVR natural gas midstream segment’s commodity derivatives utilize swaps and collar derivative contracts. PVR also utilizes collar derivative contracts to hedge against the variability in its frac spread. We determine the fair values of our oil and gas derivative agreements based on discounted cash flows derived from third-party quoted forward prices for NYMEX Henry Hub gas and West Texas Intermediate crude oil closing prices as of December 31, 2009, respectively. PVR determines the fair values of its commodity derivative agreements based on discounted cash flows based on quoted forward prices for the respective commodities. We generally use the income approach, using valuation techniques that convert future cash flows to a single discounted value. Each of these is a level 2 input. See Note 8 for the effects of the derivative instruments on our Consolidated Statements of Income. |
| • | Interest rate swaps: In 2009, we entered into interest rate swap agreements to establish variable rates on a portion of the outstanding obligations under the Senior Notes. In prior years, we entered into interest rate swap agreements to establish fixed rates on a portion of the outstanding borrowings under the Revolver. PVR has entered into interest rate swap agreements to establish fixed rates on a portion of the outstanding borrowings under the PVR Revolver. We use an income approach using valuation techniques that connect future cash flows to a single discounted value. We estimate the fair value of the swaps based on published interest rate yield curves as of the date of the estimate. Each of these is a level 2 input. |
| • | Deferred compensation: Certain of our deferred compensation obligations are ultimately to be settled in cash based on the underlying fair value of certain publicly traded equity securities. The fair values of these obligations are based on quoted market prices, which are level 1 inputs. |
Additional Fair Value Disclosures
The EITF reached a consensus that contingent and other adjustment features are consistent with equity indexation if theyfair value of floating-rate debt approximates the carrying amount because the interest rates paid are based on variables that would be inputs to a “plain vanilla” option or forward pricing model and they do not increaseshort-term maturities. The fair value of our fixed rate long-term debt is estimated based on the contract’s exposure to those variables. EITF 07-5 is effective for fiscal years beginning after December 15, 2008. It must initially be applied by recording a cumulative-effect adjustment to opening retained earnings at the date of adoptionpublished market prices for the effectsame or similar issues. As of EITF 07-5 on outstanding instruments. We expect no effect on retained earnings as a resultDecember 31, 2009 and 2008, the fair value of adopting EITF 07-5.our fixed rate debt was $545.7 million and $168.5 million, respectively.
4. | Acquisitions and Divestitures |
5. Acquisitions and Divestitures
In the following paragraphs, all references to coal, crude oil and natural gas reserves and acreage acquired are unaudited. The factors we used to determine the fair market value of acquisitions include, but are not limited to, discounted future net cash flows on a risked-adjusted basis, geographic location, quality of resources, potential marketability and financial condition of lessees.
TABLE OF CONTENTS
PENN VIRGINIA CORPORATION AND SUBSIDIARIES
NOTES TO CONSOLIDATED FINANCIAL STATEMENTS
(in thousands, except per share amounts)
5. Acquisitions and Divestitures – (continued)
Business Combination
Lone Star Gathering, L.P.
(“Lone Star”)On July 17, 2008, PVR completed an acquisition of substantially all of the assets of Lone Star. Lone Star’s assets are located in the southern portion of the Fort Worth Basin of North Texas and include approximately 129 miles of gas gathering pipelines and approximately 240,000 acres dedicated by active producers. The Lone Star acquisition expandsexpanded the geographic scope of the PVR natural gas midstream segment into the Barnett Shale play in the Fort Worth Basin.
PVR acquired this business for approximately $164.3 million and a liability of $4.7 million, which represents the fair value of a $5.0$5 million guaranteed payment, plus contingent payments of $30.0$30 million and $25.0$25 million. Funding for the acquisition was provided by $80.7 million of borrowings under PVR’s revolving credit facility (the “PVR Revolver”), 2,009,995 of PVG common units (which PVR purchased from two subsidiaries of ours for $61.8 million) and 542,610 newly issued PVR common units.
The contingent payments will be triggered if revenues from certain assets located in a defined geographic area reach certain targets by or before June 30, 2013 and will be funded in cash or common units, at PVR’s election.
The Lone Star acquisition has been accounted for using the purchase method of accounting in accordance with SFAS No. 141,Business Combinations.accounting. Under the purchase method of accounting, the total purchase price has been allocated to the net tangible and intangible assets acquired from Lone Star based on their estimated fair values. The total purchase price was allocated to the assets purchased based upon fair values on the date of the Lone Star acquisition as follows:
| | | |
Cash consideration paid for Lone Star | | $ | 81,125 |
Fair value of PVG common units given as consideration for Lone Star | | | 68,021 |
Fair value of PVR common units issued and given as consideration for Lone Star | | | 15,171 |
Payment guaranteed December 31, 2009 | | | 4,673 |
| | | |
Total purchase price | | $ | 168,990 |
| | | |
| |
Fair value of assets acquired: | | | |
| |
Property and equipment | | $ | 88,596 |
Intangible assets | | | 69,200 |
Goodwill | | | 11,194 |
| | | |
Fair value of assets acquired | | $ | 168,990 |
| | | |
| | |
| Cash consideration paid for Lone Star | | $ | 81,125 | |
| Fair value of PVG common units given as consideration for Lone Star | | | 68,021 | |
| Fair value of PVR common units issued and given as consideration for Lone Star | | | 15,171 | |
| Fair value of payment guaranteed December 31, 2009 | | | 4,673 | |
| Total purchase price | | $ | 168,990 | |
Fair value of assets acquired:
| | | | |
| Property and equipment | | $ | 88,596 | |
| Intangible assets | | | 69,200 | |
| Goodwill | | | 11,194 | |
| Fair value of assets acquired | | $ | 168,990 | |
The purchase price includes approximately $11.2 million of goodwill all of which has beenand intangible assets acquired were allocated to the PVR natural gas midstream segment. A significant factor that contributed to the initial recognition of goodwill includeswas the ability to acquire an established business on the western border of the expanding Barnett Shale play in the Fort Worth Basin. Under SFAS No. 141 and SFAS 142,Goodwill and Other Intangible Assets,goodwill recorded in connection with a business combination is not amortized, but is tested for impairment at least annually. Accordingly, the accompanying pro forma combined income statement does not include amortization of the goodwill recorded in the acquisition. AsHowever, as a result of testing goodwill for impairment in the fourth quarter of 2008, we subsequently recognized a loss on the full impairment of the goodwill. See Note 12, “Goodwill” for a description of our goodwill impairment.
The purchase price includes approximately $69.2 million of intangible assets that are associated with certain assumed contracts and customer relationships. These intangible assets will beare being amortized over the period in which benefits are derived from the contracts and relationships assumed and will be reviewed for impairment under SFAS No. 144,Accounting for the Impairment or Disposal of Long-Lived Assets.impairment. Based on when the estimated economic benefit will be earned, we have estimated the useful lives of these intangible assets to be 20 years. Seeyears (see Note 13, “Intangible Assets, net.”11).
TABLE OF CONTENTS
PENN VIRGINIA CORPORATION AND SUBSIDIARIES
NOTES TO CONSOLIDATED FINANCIAL STATEMENTS
(in thousands, except per share amounts)
5. Acquisitions and Divestitures – (continued)
The following pro forma financial information reflects the consolidated results of our operations as if the Lone Star acquisition had occurred on January 1, 2007. The pro forma information includes adjustments primarily for depreciation of acquired property and equipment, the amortization of intangible assets, interest expense for acquisition debt and the change in weighted average common units resulting from the issuance of 542,610 of PVR’s newly issuedPVR common units given as consideration in the Lone Star acquisition. The pro forma financial information is not necessarily indicative of the results of operations as it would have been had these transactions been effected on the assumed date:
| | | | | | |
| | | (Unaudited)
Year Ended December 31, |
| | | 2008 | | 2007 |
| | | (in thousands) |
Revenues | | $ | 1,224,418 | | $ | 855,944 |
Net income | | $ | 121,533 | | $ | 47,016 |
Net income per limited partner unit, basic | | $ | 2.91 | | $ | 1.24 |
Net income per limited partner unit, diluted | | $ | 2.88 | | $ | 1.22 |
| | | | |
| | (Unaudited)
Year Ended December 31, |
| | | 2008 | | 2007 |
| Revenues | | $ | 1,224,418 | | | $ | 855,944 | |
| Net income attributable to Penn Virginia Corporation | | $ | 118,449 | | | $ | 46,753 | |
| Net income per share, basic | | $ | 2.84 | | | $ | 1.23 | |
| Net income per share, diluted | | $ | 2.81 | | | $ | 1.21 | |
Other Business Combinations
In July 2009, PVR completed an acquisition of the gas processing and residue pipeline facilities in western Oklahoma for approximately $22.6 million in cash (the “Sweetwater” plant). Funding of the acquisition was provided by long-term debt under the PVR Revolver. The acquired assets included a 60 MMcfd processing plant. The purchase price has been allocated as follows: $13.1 million to processing plant and related equipment and $9.5 million to pipelines and compressor stations. The acquisition included nonfinancial assets and liabilities that were measured at fair value. The cost approach was used to develop the fair values of the acquisition. The cost approach is a technique that uses the reproduction or replacement cost as an initial basis for value. The cost to reproduce or replace the subject asset with a new asset, either identical (reproduction) or having the same utility (replacement), establishes the highest amount a prudent investor is likely to pay. Because these significant fair value inputs are typically not observable, we categorized the initial fair value estimates as a Level 3 input.
In April 2008, PVR acquired a 25% member interest in Thunder Creek, a joint venture that gathers and transports coalbed methaneCBM in Wyoming’s Powder River Basin. The purchase price was $51.6 million in cash, after customary closing adjustments and was funded with long-term debt under the PVR Revolver. The entire member interest is recorded in equity investments on the consolidated balance sheets.Consolidated Balance Sheets. This investment includes $37.3 million of fair value for the net assets acquired and $14.3 million of fair value paid in excess of PVR’s portion of the underlying equity in the net assets acquired related to customer contracts and related customer relations. This excess is being amortized to equity earnings over the life of the underlying contracts, which is 12 years. The earnings are recorded in other revenues on our consolidated statementsConsolidated Statements of income.Income.
In October 2007, we acquired lease rights to property covering 4,800 acres located in East Texas, with estimated proved reserves of 21.9 Bcfe. The purchase price was $44.9 million in cash and was funded with long-term debt under the our revolving credit facility (the “Revolver”).
In September 2007, PVR acquired fee ownership of approximately 62,000 acres of forestland in northern West Virginia. The purchase price was $93.3 million in cash and was funded with long-term debt under the PVR Revolver. The purchase price has been allocated as follows: $86.1 million to timber, $6.6 million to land and $0.6 million to oil and gas royalty interests.
In August 2007, we acquired the lease rights to property covering approximately 22,700 acres located in eastern Oklahoma with estimated proved reserves of 18.8 Bcfe. The purchase price was $47.9 million in cash and was funded with long-term debt under the Revolver. We acquired these assets in order to expand our oil and gas segment business. The acquisition has been recorded as a component of oil and gas properties.
TABLE OF CONTENTS
PENN VIRGINIA CORPORATION AND SUBSIDIARIES
NOTES TO CONSOLIDATED FINANCIAL STATEMENTS
(in thousands, except per share amounts)
5. Acquisitions and Divestitures – (continued)
In June 2007, PVR acquired a combination of fee ownership and lease rights to approximately 51 million tons of coal reserves, along with a preparation plant and coal handling facilities. The property is located on approximately 17,000 acres
in western Kentucky. The purchase price was $42.0$42 million in cash and was funded with long-term debt under the PVR Revolver. The purchase price has been allocated as follows: $30.2 million to coal properties, $11.3 million to the coal processing plant and related facilities and $0.5 million to land. PVR also recorded a $28.1 million lease receivable and $16.6 million to deferred rent relating to a coal services facility lease.
The pro forma results for the years ended December 31, 2008 2007 and 20062007 for the above acquisitions did not materially change the historical results for those periods.
Divestitures
DivestituresOn December 23, 2009, we entered into purchase and sale agreements with Hilcorp Energy I, L.P. (“Hilcorp”) which resulted in the transfer of all of our oil and gas properties in the Gulf Coast region (southern Texas and Louisiana) in exchange for net cash proceeds of $32 million and oil and gas properties located in the Gwinville field in northern Mississippi, excluding transaction costs and purchase and sale adjustments. The fair value of the properties received from Hilcorp was $8.2 million. An initial deposit of $2.3 million was received from Hilcorp in December 2009. This amount is reflected in accrued liabilities as of December 31, 2009. The transaction provided for certain purchase and sale adjustments based upon the collection of revenues and the payment of expenses attributable to the properties that took place after an effective date of October 1, 2009 and prior to the closing which occurred on January 29, 2010. During 2009, we recorded an impairment of $97.4 million on the Gulf Coast properties. Upon the closing of the transaction in January 2010, we received total net proceeds of $23.2 million plus the aforementioned Mississippi oil and gas properties valued at $8.2 million, reflecting all actual purchase and sale adjustments prior to the closing.
During the fourth quarter of 2009, we also committed to the disposition of certain oil and gas properties in North Dakota. The fair value of these properties was $2.6 million as of December 31, 2009, which we expect to realize during 2010. During 2009, we recorded an impairment of $3.7 million on the North Dakota properties.
The combined fair value of the Gulf Coast and North Dakota oil and gas properties, as well as liabilities attributable to the disposal groups, have been reflected as assets and liabilities held for sale and included in current assets and current liabilities, respectively, as of December 31, 2009. As of December 31, 2009, the fair value of the disposal group, consisting of the underlying properties and related assets and liabilities, was derived using a market approach based on agreements of sale for our Gulf Coast properties and indications of interest from potential third-party purchasers of the North Dakota properties, adjusted for working capital and closing costs. Because these significant fair value inputs are typically not observable, we have categorized the amounts as Level 3 inputs.
The following table reflects the fair values on our balance sheet as of December 31, 2009:
| | |
Assets held for sale
| | | | |
| Fair value of oil and gas properties | | $ | 38,282 | |
Liabilities held for sale
| | | | |
| Asset retirement obligation | | $ | 500 | |
In July 2008, we sold certain unproved oil and gas acreage in Louisiana for cash proceeds of $32.0$32 million and recognized a $30.5 million gain on that sale. The $30.5 million gain on the sale is reported in the revenues section of our consolidated statementsConsolidated Statements of income.Income.
TABLE OF CONTENTS
PENN VIRGINIA CORPORATION AND SUBSIDIARIES
NOTES TO CONSOLIDATED FINANCIAL STATEMENTS
(in thousands, except per share amounts)
5. Acquisitions and Divestitures – (continued)
In September 2007, we sold non-operated working interests in oil and gas properties located in eastern Kentucky and southwestern Virginia, with estimated proved reserves of 13.3 Bcfe. The sale price was $29.1 million in cash, and the proceeds of the sale were used to repay borrowings under the Revolver. We recognized a gain of $12.4 million on the sale, which is reported in the revenues section of our consolidated statementsConsolidated Statements of income.Income.
6. Accounts Receivable, net
The following table summarizes our accounts receivable by operating segment:
| | | | |
| | As of December 31, |
| | | 2009 | | 2008 |
| Penn Virginia oil and gas | | $ | 44,178 | | | $ | 76,981 | |
| PVR natural gas midstream | | | 69,865 | | | | 59,384 | |
| PVR coal and natural resource management | | | 13,021 | | | | 15,235 | |
| Other non-trade | | | 107 | | | | 18 | |
| | | | 127,171 | | | | 151,618 | |
| Less: Allowance for doubtful accounts | | | (2,367 | ) | | | (2,377 | ) |
| | | $ | 124,804 | | | $ | 149,241 | |
On May 8, 2007, our board of directors approved a two-for-one-split of our common stock in the form of a 100% stock dividend payable on June 19, 2007 to shareholders of record on June 12, 2007. Shareholders received one additional share of common stock for each share held on the record date. All common shares and per share data for the year ended December 31, 2006 has been retroactively adjusted to reflect the stock split.
In May 2008, PVR issued to the public 5.15 million common units representing limited partner interests in PVR and received $138.2 million in net proceeds. PVG made contributions to PVR of $2.9 million to maintain its indirect 2% general partner interest. PVR used the net proceeds to repay a portion of its borrowings under the PVR Revolver.
7. | Fair Value Measurement of Financial Instruments |
We adopted SFAS No. 157,Fair Value Measurements, effective January 1, 2008, for financial assets and liabilities measured on a recurring basis. SFAS No. 157 applies to all assets and liabilities that are being measured and reported on a fair value basis. SFAS No. 157 defines fair value, establishes a framework for measuring fair value and requires enhanced disclosures about fair value measurements. FASB Staff Position FAS 157-2,Effective Date of FASB Statement No. 157 (“FSP SFAS 157-2”), delayed the application of SFAS No. 157 for nonfinancial assets and nonfinancial liabilities to fiscal years and interim periods beginning after November 15, 2008. Examples of nonfinancial assets for which FSP SFAS 157-2 delays application of SFAS No. 157 include business combinations, impairment and initial recognition of an ARO.
Our financial instruments consist of cash and cash equivalents, receivables, accounts payable, derivative instruments and long-term debt. The carrying values of all of these financial instruments, except fixed rate long-term debt, approximate fair value. The fair value of our fixed rate long-term debt at December 31, 2008 and 2007 was $168.5 million and $230.0 million. As a result of repaying PVR’s Senior Unsecured Notes due 2013 (the “PVR Notes”), PVR had no fixed-rate long-term debt as of December 31, 2008. The fair value of PVR’s fixed-rate long-term debt at December 31, 2007 was $65.8 million.
SFAS No. 157 requires fair value measurements to be classified and disclosed in one of the following three categories:
Level 1: Unadjusted quoted prices in active markets that are accessible at the measurement date for identical, unrestricted assets or liabilities. Level 1 inputs generally provide the most reliable evidence of fair value.
Level 2: Quoted prices in markets that are not active or inputs, which are observable, either directly or indirectly, for substantially the full term of the asset or liability.
Level 3: Prices or valuation techniques that require inputs that are both significant to the fair value measurement and unobservable (i.e., supported by little or2009, no market activity).receivables were collateralized.
7. Inventories
The following table summarizes the valuationcomponents of our financial instruments by the above SFAS No. 157 categories asinventories:
| | | | |
| | As of December 31, |
| | | 2009 | | 2008 |
| Tubular products and well equipment | | $ | 10,372 | | | $ | 16,595 | |
| Other equipment and supplies | | | 1,832 | | | | 1,873 | |
| | | $ | 12,204 | | | $ | 18,468 | |
During 2009, we experienced a market decline in value related to a re-evaluation of December 31, 2008 (in thousands):
| | | | | | | | | | | | | | |
Description | | Fair Value
Measurements,
December 31,
2008 | | | Fair Value Measurement at December 31,
2008, Using |
| | | Quoted
Prices in
Active
Markets
for
Identical
Assets
(Level 1) | | Significant
Other
Observable
Inputs
(Level 2) | | | Significant
Unobservable
Inputs
(Level 3) |
Marketable securities | | $ | 4,559 | | | $ | 4,559 | | $ | — | | | $ | — |
Interest rate swap liability - current | | | (7,840 | ) | | | — | | | (7,840 | ) | | | — |
Interest rate swap liability - noncurrent | | | (8,721 | ) | | | — | | | (8,721 | ) | | | — |
Commodity derivative assets - current | | | 67,569 | | | | — | | | 67,569 | | | | — |
Commodity derivative assets - noncurrent | | | 4,070 | | | | — | | | 4,070 | | | | — |
Commodity derivative liability - current | | | (7,694 | ) | | | — | | | (7,694 | ) | | | — |
| | | | | | | | | | | | | | |
Total | | $ | 51,943 | | | $ | 4,559 | | $ | 47,384 | | | $ | — |
| | | | | | | | | | | | | | |
See Note 8 – “Derivative Instruments,” for the effectsour tubular products inventory resulting in an impairment of the derivative instruments on our consolidated statements of income.
We use the following methods and assumptions to estimate the fair values$4.1 million. The impairment charge was included in the above table:
Marketable securities: Our marketable securities consist of various publicly traded equities. The fair values are based on quoted market prices, which are level 1 inputs.
Commodity derivative instruments: Both our oil and gas commodity derivatives and PVR’s natural gas midstream segment commodity derivatives utilize three-way collar derivative contracts. PVR also utilizes collar derivative contracts to hedge against the variability in its frac spread. We determine the fair valuesimpairments line of our oil and gas derivative agreements based on discounted cash flows derived from third-party quoted forward prices for NYMEX Henry Hub gas and West Texas Intermediate crude oil closing prices asConsolidated Statements of December 31, 2008. PVR determines the fair values its commodity derivative agreements based on discounted cash flows based on quoted forward prices for the respective commodities. We generally use the income approach, using valuation techniques that convert future cash flows to a single discounted value. Each of these is a level 2 input. See Note 8 – “Derivative Instruments.”Income.
Interest rate swaps: We have entered into interest rate swap agreements (the “Interest Rate Swaps”) to establish fixed rates on a portion of the outstanding borrowings under the Revolver. PVR has entered into the PVR Interest Rate Swaps to establish fixed rates on a portion of the outstanding borrowings under the PVR Revolver. We use an income approach using valuation techniques that connect future cash flows to a single discounted value. We estimate the fair value of the swaps based on published interest rate yield curves as of the date of the estimate. Each of these is a level 2 input. See Note 8 – “Derivative Instruments.”
For commodity derivative instruments, we recognize changes in fair values in earnings currently, rather than deferring such amounts in AOCI (shareholders’ equity).
8. Derivative Financial Instruments
Oil and Gas Segment Commodity Derivatives
We utilize three-way collarcollars and swap derivative contracts to hedge against the variability in cash flows associated with anticipated sales of our future oil and gas production. While the use of derivative instruments limits the risk of adverse price movements, such use may also limit future revenues from favorable price movements.
A three-way collar contract consists of a collar contract plus a put option contract sold by us with a price below the floor price of the collar. The counterparty to a collar contract is required to make a payment to us if the settlement price for any settlement period is below the floor price for such contract. We are required to make a payment to the counterparty if the settlement price for any settlement period is above the ceiling price for such contract. Neither party is required to make a payment to the other party if the settlement price for any settlement period is equal to or greater than the floor price and equal to or less than the ceiling price for such contract.
TABLE OF CONTENTS
PENN VIRGINIA CORPORATION AND SUBSIDIARIES
NOTES TO CONSOLIDATED FINANCIAL STATEMENTS
(in thousands, except per share amounts)
8. Derivative Financial Instruments – (continued)
The additional put option sold by us requires us to make a payment to the counterparty if the settlement price for any settlement period is below the put option price. By combining the collar contract with the additional put option, we are entitled to a net payment equal to the difference between the floor price of the collar contract and the additional put option price if the settlement price is equal to or less than the additional put option price. If the settlement price is greater than the additional put option price, the result is the same as it would have been with a collar contract only. If market prices are below the additional put option, we would be entitled to receive the market price plus the difference between the additional put option and the floor. See the oil and gas segment commodity derivative table in this footnote. This strategy enables us to increase the floor and the ceiling prices of the collar beyond the range of a traditional collar contract while defraying the associated cost with the sale of the additional put option.
We determine the fair values of our oil and gas derivative agreements based on discounted cash flows derived fromusing third-party quoted forward quoted prices for NYMEX Henry Hub natural gas and West Texas Intermediate crude oil closing prices as of December 31, 2008. The discounted cash flows utilize2009 and discount rates adjusted for the credit risk of our counterparties for derivativesif the derivative in an asset position, and our own credit risk derivativesif the derivative is in a liability position, in accordance with SFAS No. 157. position.
The following table sets forth our commodity derivative positions as of December 31, 2008:2009:
| | | | | | | | | | | | | | |
| | | Average
Volume
Per Day | | Weighted Average Price | | Estimated
Fair Value
(in
thousands) |
| | | Additional
Put
Option | | Floor | | Ceiling | |
Natural Gas Three-way Collars | | (in MMBtus) | | | | | | (per MMBtu) | | | | | | |
First Quarter 2009 | | 65,000 | | $ | 6.00 | | $ | 8.67 | | $ | 11.68 | | $ | 13,688 |
Second Quarter 2009 | | 40,000 | | $ | 6.38 | | $ | 8.75 | | $ | 10.79 | | | 6,918 |
Third Quarter 2009 | | 40,000 | | $ | 6.38 | | $ | 8.75 | | $ | 10.79 | | | 6,166 |
Fourth Quarter 2009 | | 30,000 | | $ | 6.83 | | $ | 9.50 | | $ | 13.60 | | | 4,869 |
First Quarter 2010 | | 30,000 | | $ | 6.83 | | $ | 9.50 | | $ | 13.60 | | | 4,070 |
| | | | | |
Crude Oil Three-way Collars | | (Bbl) | | | | | | (Bbl) | | | | | | |
First Quarter 2009 | | 500 | | $ | 80.00 | | $ | 110.00 | | $ | 179.00 | | | 1,328 |
Second Quarter 2009 | | 500 | | $ | 80.00 | | $ | 110.00 | | $ | 179.00 | | | 1,272 |
Third Quarter 2009 | | 500 | | $ | 80.00 | | $ | 110.00 | | $ | 179.00 | | | 1,236 |
Fourth Quarter 2009 | | 500 | | $ | 80.00 | | $ | 110.00 | | $ | 179.00 | | | 1,197 |
| | | | | |
Settlements to be paid in subsequent month | | | | | | | | | | | | | | 465 |
| | | | | | | | | | | | | | |
Oil and gas segment commodity derivatives -net asset | | | | | | | | | | | | | $ | 41,209 |
| | | | | | | | | | | | | | |
| | | | | | | | | | |
| | Average
Volume Per
Day | | Weighted Average Price | | Fair Value |
| | | Additional
Put Option | | Floor | | Ceiling |
Natural Gas Costless Collars
| | | (in MMBtu) | | | | | | | | (per MMBtu) | | | | | | | | | |
| First Quarter 2010 | | | 35,000 | | | | | | | $ | 4.96 | | | $ | 7.41 | | | $ | 115 | |
| Second Quarter 2010 | | | 30,000 | | | | | | | $ | 5.33 | | | $ | 8.02 | | | | 1,047 | |
| Third Quarter 2010 | | | 30,000 | | | | | | | $ | 5.33 | | | $ | 8.02 | | | | 883 | |
| Fourth Quarter 2010 | | | 50,000 | | | | | | | $ | 5.65 | | | $ | 8.77 | | | | 1,656 | |
| First Quarter 2011 | | | 50,000 | | | | | | | $ | 5.65 | | | $ | 8.77 | | | | 307 | |
| Second Quarter 2011 | | | 30,000 | | | | | | | $ | 5.67 | | | $ | 7.58 | | | | 787 | |
| Third Quarter 2011 | | | 30,000 | | | | | | | $ | 5.67 | | | $ | 7.58 | | | | 553 | |
| Fourth Quarter 2011 | | | 20,000 | | | | | | | $ | 6.00 | | | $ | 8.50 | | | | 469 | |
| First Quarter 2012 | | | 20,000 | | | | | | | $ | 6.00 | | | $ | 8.50 | | | | (28 | ) |
Natural Gas Three-way Collars
| | | (in MMBtu) | | | | | | | | (per MMBtu) | | | | | | | | | |
| First Quarter 2010 | | | 30,000 | | | $ | 6.83 | | | $ | 9.50 | | | $ | 13.60 | | | | 6,914 | |
| Natural Gas Swaps | | | (in MMBtu) | | | | | | | | (per MMBtu) | | | | | | | | | |
| First Quarter 2010 | | | 15,000 | | | | | | | $ | 6.19 | | | | | | | | 733 | |
| Second Quarter 2010 | | | 30,000 | | | | | | | $ | 6.17 | | | | | | | | 1,648 | |
| Third Quarter 2010 | | | 30,000 | | | | | | | $ | 6.17 | | | | | | | | 1,122 | |
Crude Oil Costless Collars
| | | (barrels) | | | | | | | | (per barrel) | | | | | | | | | |
| First Quarter 2010 | | | 500 | | | | | | | $ | 60.00 | | | $ | 74.75 | | | | (308 | ) |
| Second Quarter 2010 | | | 500 | | | | | | | $ | 60.00 | | | $ | 74.75 | | | | (455 | ) |
| Third Quarter 2010 | | | 500 | | | | | | | $ | 60.00 | | | $ | 74.75 | | | | (546 | ) |
| Fourth Quarter 2010 | | | 500 | | | | | | | $ | 60.00 | | | $ | 74.75 | | | | (608 | ) |
Settlements to be received in subsequent period
| | | | | | | | | | | | | | | | | | | 226 | |
At December 31, 2008, we reported a net derivative asset related to the oil and gas commodity derivatives of $41.2 million. See theAdoption of SFAS No. 161 section below for the impact of the oil and gas commodity derivatives on our consolidated statements of income.TABLE OF CONTENTS
PENN VIRGINIA CORPORATION AND SUBSIDIARIES
NOTES TO CONSOLIDATED FINANCIAL STATEMENTS
(in thousands, except per share amounts)
8. Derivative Financial Instruments – (continued)
PVR Natural Gas Midstream Segment Commodity Derivatives
PVR utilizes three-way collarcostless collars and swap derivative contracts to hedge against the variability in cash flows associated with anticipated natural gas midstream revenues and cost of midstream gas purchased. PVR also utilizes collar derivative contracts to hedge against the variability in its frac spread. PVR’s frac spread is the spread between the purchase price for the natural gas PVRit purchases from producers and the sale price for NGLs that PVRit sells after processing. PVR hedges against the variability in its frac spread by entering into costless collar and swap derivative contracts to sell NGLs forward at a predetermined commodity price and to purchase an equivalent volume of natural gas forward on an MMBtu basis. While the use of derivative instruments limits the risk of adverse price movements, such use may also limit future revenues or cost savings from favorable price movements.
A three-wayWith respect to a costless collar contract, consists of a collar contract plus a put option contract sold by PVR with a price below the floor price of the collar. The counterparty to a collar contract is required to make a payment to PVR if the settlement price for any settlement period is below the floorPut (or floor) price for such contract. PVR is required to make a payment to the counterparty if the settlement price for any settlement period is above the ceilingCall (or ceiling) price for such contract. Neither party is required to make a payment to the other party if the settlement price for any settlement period is equal to or greater than the floor price and equal to or less than the ceiling price for such contract.
The additional put option sold by With respect to a swap contract for the purchase of a commodity, the counterparty is required to make a payment to PVR requires itif the settlement price for any settlement period is greater than the swap price for such contract, and PVR is required to make a payment to the counterparty if the settlement price for any settlement period is below the put option price. By combining the collar contract with the additional put option, PVR is entitled to a net payment equal to the difference between the floor price of the collar contract and the additional put option
price if the settlement price is equal to or less than the additional put option price. If the settlementswap price is greater than the additional put option price, the result is the same as it would have been with a collar contract only. If market prices are below the additional put option, PVR would be entitled to receive the market price plus the difference between the additional put option and the floor. See the PVR natural gas midstream segment commodity derivative table in this footnote. This strategy enables PVR to increase the floor and the ceiling prices of the collar beyond the range of a traditional collar contract while defraying the associated cost with the sale of the additional put option.for such contract.
PVR determines the fair values of its derivative agreements based on discountedby discounting the cash flows based on quoted forward quoted prices for the respective commodities as of December 31, 2008,2009, using discount rates adjusted for the credit risk of the counterparties if the derivative is in an asset position and PVR’s own credit risk for derivatives in a liability position.
The following table sets forth PVR’s positions as of December 31, 20082009 for commodities related to natural gas midstream revenues and cost of midstream gas purchased:
| | | | | | | | | | | | | | |
| | | Average
Volume
Per Day | | Weighted Average Price | | Fair Value
(in
thousands) |
| | | Additional
Put
Option | | Floor | | Ceiling | |
Crude Oil Three-way Collar | | (in barrels) | | | | | | (per barrel) | | | | | | |
First Quarter 2009 through Fourth Quarter 2009 | | 1,000 | | $ | 70.00 | | $ | 90.00 | | $ | 119.25 | | $ | 6,101 |
| | | | | |
Frac Spread Collar | | (in MMBtu) | | | | | | (per MMBtu) | | | | | | |
First Quarter 2009 through Fourth Quarter 2009 | | 6,000 | | | | | $ | 9.09 | | $ | 13.94 | | | 14,943 |
| | | | | |
Settlements to be received in subsequent month | | | | | | | | | | | | | | 1,694 |
| | | | | | | | | | | | | | |
| | | | | |
Natural gas midstream segment commodity derivatives - net asset | | | | | | | | | | | | | $ | 22,738 |
| | | | | | | | | | | | | | |
| | | | | | | | | | |
| | Average
Volume
Per Day | | Swap Price | | Weighted Average Price | | Fair Value |
| | | Floor | | Ceiling |
| Crude Oil Collar | | | (barrels) | | | | | | | | ($ per barrel) | | | | | |
| First through Fourth Quarter 2010 | | | 750 | | | | | | | $ | 70.00 | | | $ | 81.25 | | | $ | (1,329 | ) |
| First through Fourth Quarter 2010 | | | 1,000 | | | | | | | $ | 68.00 | | | $ | 80.00 | | | | (2,171 | ) |
| First through Fourth Quarter 2011 | | | 400 | | | | | | | $ | 75.00 | | | $ | 98.50 | | | | 18 | |
| Natural Gas Purchase Swap | | | (MMBtu) | | | | ($ per MMBtu) | | | | | | | | | | | | | |
| First through Fourth Quarter 2010 | | | 5,000 | | | | 5.815 | | | | | | | | | | | | (41 | ) |
| First through Fourth Quarter 2011 | | | 3,000 | | | | 6.430 | | | | | | | | | | | | (99 | ) |
| NGL – Natural Gasoline Collar | | | (gallons) | | | | | | | | ($ per gallon) | | | | | |
| First through Fourth Quarter 2011 | | | 60,000 | | | | | | | $ | 1.55 | | | $ | 1.92 | | | | (945 | ) |
| Settlements to be received in subsequent period | | | | | | | | | | | | | | | | | | | 1,331 | |
AtTABLE OF CONTENTS
PENN VIRGINIA CORPORATION AND SUBSIDIARIES
NOTES TO CONSOLIDATED FINANCIAL STATEMENTS
(in thousands, except per share amounts)
8. Derivative Financial Instruments – (continued)
Interest Rate Swaps
In 2006, we entered into interest rate swaps (“Previous Interest Rate Swaps”) with notional amounts of $50.0 million to establish fixed interest rates on a portion of the then outstanding borrowings under our Revolver through December 31, 2008, PVR reported a net derivative asset related to2010. During the PVR natural gas midstream segmentfirst quarter of $22.7 million. No loss remains in AOCI related to derivatives in the PVR natural gas midstream segment for which PVR2009, we discontinued hedge accounting in 2006. Seefor all of theAdoption of SFAS No. 161section below Previous Interest Rate Swaps. Accordingly, subsequent fair value gains and losses for the impact ofPrevious Interest Rate Swaps have been recognized in the PVR natural gas midstream commodity derivativesderivative line item on our consolidated statementsConsolidated Statement of income.Income.
Interest Rate Swaps
We have entered intoIn September 2009, we paid off all amounts outstanding under the Revolver and, as a result, we reclassified the net hedging losses of $2.4 million remaining in accumulated other comprehensive income (“AOCI”) related to the Interest Rate Swaps from AOCI to interest expense.
As there are currently no amounts outstanding under the Revolver, we entered into an offsetting fixed-to-floating interest rate swap in December 2009 that effectively unwinds the Previous Interest Rate Swaps. With respect to this fixed-to-floating interest rate swap, we pay a variable rate equivalent to the three-month LIBOR and the counterparties will pay a fixed rate of 0.53% until December 2010.
In December 2009, we entered into a new interest rate swap agreement (“New Interest Rate Swap”) to establish fixedvariable rates on a portion of the outstanding borrowingsobligation under the Revolver until December 2010.10.375% Senior Unsecured Notes (“Senior Notes”). The notional amountsamount of the New Interest Rate Swaps total $50.0Swap is $100 million, or approximately 15%one-third of our total long-term debtthe face amount outstanding under the Revolver at December 31, 2008.Senior Notes. We will pay a weighted average fixed rate of 5.34% on the notional amount, and the counterparties will pay a variable rate equalequivalent to the three-month London Interbank Offered Rate (“LIBOR”) plus a margin of 8.175%, and the counterparties will pay a fixed rate of 10.375%. Settlements onThe term of the New Interest Rate Swaps are recorded as interest expense. The Interest Rate Swaps follow hedge accounting. Accordingly, the effective portion of the change in the fair value of the swap transactions is recorded each period in other comprehensive income. The ineffective portion of the change in fair value, if any, is recorded to current period earnings as interest expense. We reported a (i) net derivative liability of $3.8 million at December 31, 2008 and (ii) loss in AOCI of $2.5 million, net of the related income tax benefit of $1.3 million, at December 31, 2008 related to the Interest Rate Swaps. In connection with periodic settlements, we recognized $0.7 million in net hedging losses, net of the related income tax benefit of $0.3 million, on the Interest Rate Swaps in interest expense in 2008. Based upon future interest rate curves at December 31, 2008, we expect to realize $1.9 million of hedging losses within the next 12 months. The amounts that we ultimately realize will vary due to changes in the fair value of open derivative agreements prior to settlement.Swap extends through June 2013.
PVR Interest Rate Swaps
PVR has entered into the PVRinterest rate swaps (the “PVR Interest Rate SwapsSwaps”) to establish fixed rates on a portion of the outstanding borrowings under the PVR Revolver. Until March 2010, the notional amounts of the PVR Interest Rate Swaps total $285.0$310.0 million, or approximately 50% of PVR’s total long-term debt outstanding as of December 31, 2008,2009, with PVR paying a weighted average fixed rate of 3.67%3.54% on the notional amount, and the counterparties paying a variable rate equal to the three-month LIBOR. From March 2010 to December 2011, the notional amounts of the PVR Interest Rate Swaps total $225.0$250.0 million with PVR paying a weighted average fixed rate of 3.52%3.37% on the notional amount, and the counterparties paying a variable rate equal to the three-month LIBOR. From December 2011 to December 2012, the notional amounts of the PVR Interest Rate Swaps total $75.0$100.0 million, with PVR paying a weighted average fixed rate of 2.10%2.09% on the notional amount, and the counterparties paying a variable rate equal to the three-month LIBOR. The PVR Interest Rate Swaps extend one year past the maturity of the current PVR Revolver. The PVR Interest Rate Swaps have been entered into with sixseven financial institution
counterparties, with no counterparty having more than 26%24% of the open positions. In January
During the first quarter of 2009, PVR entered into an additional $25.0 million interest rate swap with a maturity of December 2012. Inclusive of this additional interest rate swap, the weighted average fixed interest rate PVR pays to its counterparties is 3.54% through March 2010, 3.37% from March 2010 through December 2011, and 2.09% from December 2011 through December 2012.
PVR continues to applydiscontinued hedge accounting to some of its interest rate hedges. Settlements on the PVR Interest Rate Swaps that follow hedge accounting are recorded as interest expense. Accordingly, the effective portion of the change in the fair value of the transactions for the swaps that follow hedge accounting are recorded each period in AOCI. At December 31, 2008, a $1.2 million loss remained in AOCI related to Interest Rate Swaps on which we discontinued hedge accounting. The $1.2 million loss will be recognized in earnings through 2011 as the hedged transactions settle. Certainall of the PVR Interest Rate Swaps do not follow hedge accounting.Swaps. Accordingly, mark-to-marketsubsequent fair value gains and losses for the PVR Interest Rate Swaps that do not follow hedge accounting arehave been recognized in earnings currentlythe derivatives line item on our Consolidated Statements of Income. At December 31, 2009, a $1.4 million loss remained in AOCI related to the Derivatives line onPVR Interest Rate Swaps. The $1.4 million loss will be recognized in interest expense as the consolidated statements of income.PVR Interest Rate Swaps settle.
PVR reported a (i) net derivative liability of $12.8$9.7 million at December 31, 20082009 and (ii) loss in AOCI of $4.2$1.4 million at December 31, 20082009 related to the PVR Interest Rate Swaps. In connection with periodic settlements, PVRwe recognized $1.1 million, net of income tax benefit of $0.6$3.4 million of net hedging losses in interest expense in the year ended December 31, 2008.2009. Based upon future interest rate curves at December 31, 2008, PVR expects2009, we expect to realize $5.9
TABLE OF CONTENTS
PENN VIRGINIA CORPORATION AND SUBSIDIARIES
NOTES TO CONSOLIDATED FINANCIAL STATEMENTS
(in thousands, except per share amounts)
8. Derivative Financial Instruments – (continued)
$7.7 million of hedging losses within the next 12 months. The amounts that PVRwe ultimately realizesrealize will vary due to changes in the fair value of open derivative agreements prior to settlement.
AdoptionFinancial Statement Impact of SFAS No. 161
In March 2008, the FASB issued SFAS No. 161,Disclosures about Derivative Instruments and Hedging Activities,an Amendment of FASB Statement No. 133, which amends and expands the disclosures required by SFAS No. 133. We elected to adopt SFAS No. 161 early, effective June 30, 2008. SFAS No. 161 requires companies to disclose how and why an entity uses derivative instruments, how derivative instruments and related hedged items are accounted for and how derivative instruments and related hedged items affect an entity’s financial position, financial performance and cash flows.
In the year ended December 31, 2008, we reclassified a total of $5.3 million, net of income tax expense of $2.9 million, out of AOCI and into earnings. We also recorded unrealized hedging losses of $4.4 million, net of income tax benefit of $2.3 million, in AOCI in the year ended December 31, 2008 related to the Interest Rate Swaps and the PVR Interest Rate Swaps. See Note 22, “Other Comprehensive Income,” for a detailed schedule of our AOCI.
DerivativesThe following table summarizes the effects of our consolidated derivative activities, as well as the location of the gains and losses, on our consolidated statementsConsolidated Statements of incomeIncome for the year ended December 31, 2008periods presented (in thousands):
| | | | | | |
| | Location of gain (loss)
on derivatives recognized
in income | | Year Ended December 31, |
| | | 2009 | | 2008 |
Derivatives not designated as hedging instruments:
| | | | | | | | | | | | |
| Interest rate contracts(1) | | | Interest expense | | | | (7,220 | ) | | | (2,721 | ) |
| Interest rate contracts | | | Derivatives | | | | (5,956 | ) | | | (8,635 | ) |
| Commodity contracts(2) | | | Natural gas
midstream revenues | | | | — | | | | (8,219 | ) |
| Commodity contracts(2) | | | Cost of midstream
gas purchased | | | | — | | | | 2,739 | |
| Commodity contracts | | | Derivatives | | | | 17,810 | | | | 55,217 | |
| Total increase in net income resulting from derivatives | | | | | | $ | 4,634 | | | $ | 38,381 | |
Realized and unrealized derivative impact:
| | | | | | | | | | | | |
| Cash received (paid) for commodity and interest rate settlements | | | Derivatives | | | $ | 61,147 | | | $ | (46,086 | ) |
| Cash paid for interest rate contract settlements | | | Interest expense | | | | (808 | ) | | | (1,518 | ) |
| Unrealized derivative gain (loss)(3) | | | | | | | (55,705 | ) | | | 85,985 | |
| Total increase (decrease) in net income resulting from derivatives | | | | | | $ | 4,634 | | | $ | 38,381 | |
| | | | | | |
| | | Location of gain (loss) on derivatives recognized in income | | Year Ended
December 31,
2008 | |
Derivatives designated as hedging instruments under SFAS No. 133 | | | | | | |
(Effective portion): | | | | | | |
Interest rate contracts (1) | | Interest expense | | $ | (1,518 | ) |
| | | | | | |
Increase (decrease) in net income resulting from derivatives designatedas hedging instruments under SFAS No. 133 (Effective Portion) | | | | $ | (1,518 | ) |
| | | | | | |
| | |
Derivatives not designated as hedging instruments under SFAS No. 133: | | | | | | |
Interest rate contracts | | Derivatives | | $ | (8,635 | ) |
Interest rate contracts (1) | | Interest expense | | | (1,203 | ) |
Commodity contracts (1) | | Natural gas midstream revenues | | | (8,219 | ) |
Commodity contracts (1) | | Cost of midstream gas purchased | | | 2,739 | |
Commodity contracts | | Derivatives | | | 55,217 | |
| | | | | | |
Increase (decrease) in net income resulting from derivatives notdesignated as hedging instruments under SFAS No. 133 | | | | $ | 39,899 | |
| | | | | | |
| | |
Total increase (decrease) in net income resulting from derivatives | | | | $ | 38,381 | |
| | | | | | |
| | |
Realized and unrealized derivative impact: | | | | | | |
Cash paid for commodity and interest rate contract settlements | | Derivatives | | $ | (46,086 | ) |
Cash paid for interest rate contract settlements | | Interest expense | | | (1,518 | ) |
Unrealized derivative gain | | (2) | | | 85,985 | |
| | | | | | |
Total increase (decrease) in net income resulting from derivatives | | | | $ | 38,381 | |
| | | | | | |
| (1) | This represents Interest Rate Swap amounts reclassified out of AOCI and into earnings. During 2008 and 2009 PVR discontinued hedge accounting for various Interest Rate Swaps at different times. By the first quarter of 2009 PVR discontinued hedge accounting for the remaining Interest Rate Swaps. PVA discontinued hedge accounting for Interest Rate Swaps in first quarter 2009. During 2009 and 2008 PVA reclassified $3.8 million and $1.0 million for remaining AOCI and actual hedge settlements that were reclassified into earnings in the same period or periods relating to PVA Interest Rate Swaps not designated for hedge accounting. During 2009 and 2008 PVR reclassified $3.4 million and $1.7 million for remaining AOCI and actual hedge settlements that were reclassified into earnings in the same period or periods relating to PVR Interest Rate Swaps not designated for hedge accounting. |
| (2) | This represents commodity derivative amounts reclassified out of AOCI and into earnings. Subsequent to the discontinuation of hedge accounting for commodity derivatives in 2006, amounts remaining in AOCI have been reclassified into earnings in the same period or periods during which the original hedge forecasted transaction affects earnings. No losses remain in AOCI related to commodity derivatives for which we discontinued hedge accounting in 2006. At December 31, 2008, a $1.2 million loss remained in AOCI related to the PVR Interest Rate Swaps on which PVR discontinued hedge accounting in 2008. |
(2) | This activity represents(3) | Represents unrealized gains (losses) in the natural gas midstream, cost of midstream gas purchased, interest expense and derivatives lines oncaption in our consolidated statements of income. |
TABLE OF CONTENTS
PENN VIRGINIA CORPORATION AND SUBSIDIARIES
NOTES TO CONSOLIDATED FINANCIAL STATEMENTS
(in thousands, except per share amounts)
8. Derivative Financial Instruments – (continued)
The following table summarizes the fair value of our derivative instruments, as well as the locations of these instruments on our consolidated balance sheets as of December 31, 2008 (in thousands):Consolidated Balance Sheets for the periods presented:
| | | | | | | | | | | | | | | | |
| | | Balance Sheet Location | | Estimated fair values at
December 31, 2008 | | | | Fair Values as of December 31, |
Derivatives designated as hedging instruments under SFAS No. 133: | | | |
| Derivative
Assets | |
| Derivative
Liabilities | |
| | | | | | | | | | 2009 | | 2008 |
| | | | Balance Sheet Location | | Derivative
Assets | | Derivative
Liabilities | | Derivative
Assets | | Derivative
Liabilities |
Derivatives de-designated as hedging instruments:
| | | | | | | | | | | | | | | | | | | | | |
Interest rate contracts | | Derivative liabilities - current | | $ | — | | $ | 3,177 | | | Derivative liabilities – current | | | $ | — | | | $ | — | | | $ | — | | | $ | 3,177 | |
Interest rate contracts | | Derivative liabilities - noncurrent | | | — | | | 3,648 | | | Derivative liabilities – noncurrent | | | | — | | | | — | | | | — | | | | 3,648 | |
| | | | | | | |
Total derivatives designated as hedging instruments under SFAS No. 133 | | | | $ | — | | $ | 6,825 | |
| | | | | | | |
Derivatives not designated as hedging instruments under SFAS No. 133: | | | | | | | |
| Total derivatives de-designated as hedging instruments | | | | | | | | — | | | | — | | | | — | | | | 6,825 | |
Derivatives not designated as hedging instruments:
| | | | | | | | | | | | | | | | | | | | | |
Interest rate contracts | | Derivative liabilities - current | | $ | — | | $ | 4,663 | | | Derivative assets/liabilities – current | | | | 1,463 | | | | 10,123 | | | | — | | | | 4,663 | |
Interest rate contracts | | Derivative liabilities - noncurrent | | | — | | | 5,073 | | | Derivative assets/liabilities – noncurrent | | | | 1,266 | | | | 5,575 | | | | — | | | | 5,073 | |
Commodity contracts | | Derivative assets/liabilities - current | | | 67,569 | | | 7,694 | | | Derivative assets/liabilities – current | | | | 16,109 | | | | 6,024 | | | | 67,569 | | | | 7,694 | |
Commodity contracts | | Derivative assets/liabilities - noncurrent | | | 4,070 | | | — | | | Derivative assets/liabilities – noncurrent | | | | 2,364 | | | | 1,170 | | | | 4,070 | | | | — | |
| | | | | | | |
Total derivatives not designated as hedging instruments under SFAS No. 133 | | | | $ | 71,639 | | $ | 17,430 | |
| | | | | | | |
Total estimated fair value of derivative instruments | | | | $ | 71,639 | | $ | 24,255 | |
| | | | | | | |
| Total derivatives not designated as hedging instruments | | | | | | | | 21,202 | | | | 22,892 | | | | 71,639 | | | | 17,430 | |
| Total fair value of derivative instruments | | | | | | | $ | 21,202 | | | $ | 22,892 | | | $ | 71,639 | | | $ | 24,255 | |
See Note 7, “Fair Value Measurement of Financial Instruments”4 for a description of how the above financial instruments are valued in accordance with SFAS No. 157.valued.
The following table summarizes the effect of the Interest Rate Swaps and the PVR Interest Rate Swaps on our total interest expense for the year ended December 31, 2008 (in thousands):
| | | | |
Source | | Year Ended
December 31,
2008 | |
Interest on borrowings | | $ | (44,253 | ) |
Capitalized interest (1) | | | 2,713 | |
Interest rate swaps | | | (2,721 | ) |
| | | | |
Total interest expense | | $ | (44,261 | ) |
| | | | |
(1) | Capitalized interest was primarily related to the construction of PVR’s natural gas gathering facilities and the oil and gas segment’s development of unproved properties. |
The effects of derivative gains (losses), cash settlements of our oil and gas commodity derivatives, cash settlements of PVR’s natural gas midstream commodity derivatives, and cash settlements of the PVR Interest Rate Swaps that do not follow hedge accounting are reported as adjustments to reconcile net income to net cash provided by operating activities on our consolidated statementsConsolidated Statements of cash flows.Cash Flows. These items are recorded in the “Total derivative losses (gains)” and “Cash settlements of derivatives” linesline on the consolidated statementsConsolidated Statements of cash flows.Cash Flows.
The above hedging activity represents cash flow hedges. As of December 31, 2008,2009, neither PVR nor we actively traded derivative instruments or have any fair value hedges.instruments. In addition, as of December 31, 2008,2009, neither PVR nor we owned derivative instruments containing credit risk contingencies.
9. Property and Equipment, net
In December 2007, we completed the sale of 3,450,000 shares ofThe following table summarizes our common stock property and equipment:
| | | | |
| | As of December 31, |
| | | 2009 | | 2008 |
Oil and gas properties:
| | | | | | | | |
| Proved | | $ | 1,887,073 | | | $ | 1,951,325 | |
| Unproved | | | 73,067 | | | | 155,803 | |
| Total oil and gas properties | | | 1,960,140 | | | | 2,107,128 | |
Other property and equipment:
| | | | | | | | |
| Coal properties | | | 478,803 | | | | 476,787 | |
| Midstream property and equipment | | | 491,199 | | | | 426,064 | |
| Land | | | 20,743 | | | | 20,985 | |
| Timber | | | 87,869 | | | | 87,869 | |
| Other property and equipment | | | 68,359 | | | | 64,766 | |
| Total property and equipment | | | 3,107,113 | | | | 3,183,599 | |
| Accumulated depreciation, depletion and amortization | | | (754,755 | ) | | | (671,422 | ) |
| | | $ | 2,352,358 | | | $ | 2,512,177 | |
TABLE OF CONTENTS
PENN VIRGINIA CORPORATION AND SUBSIDIARIES
NOTES TO CONSOLIDATED FINANCIAL STATEMENTS
(in a registered public offering. Thethousands, except per share amounts)
9. Property and Equipment, net proceeds of the sale were $135.4 million and were used to repay a portion of the outstanding borrowings under the Revolver and for general corporate purposes.
stock (and cash for any fractional share cash amount), not offset by the Note Hedges, in an amount based on the excess of the then current market price of our common stock over the strike price of the Warrants.
– (continued)The following table describes the changes in capitalized exploratory drilling costs that are pending the determination of proved reserves:
| | | | | | | | | | | | | | | | | | | | | |
| | | 2008 | | | 2007 | | | 2006 | |
| | | Number
of Wells | | | Cost | | | Number
of Wells | | | Cost | | | Number
of Wells | | | Cost | |
Balance at beginning of period | | 4 | | | $ | 4,336 | | | 1 | | | $ | 1,119 | | | 3 | | | $ | 1,670 | |
Additions pending determination of proved reserves | | 1 | | | | 2,482 | | | 4 | | | | 4,336 | | | 1 | | | | 1,119 | |
Reclassifications to wells, equipment and facilitiesbased on the determination of proved reserves | | — | | | | — | | | (1 | ) | | | (1,119 | ) | | — | | | | — | |
Charged to expense | | (4 | ) | | | (4,336 | ) | | — | | | | — | | | (3 | ) | | | (1,670 | ) |
| | | | | | | | | | | | | | | | | | | | | |
Balance at end of period | | 1 | | | $ | 2,482 | | | 4 | | | $ | 4,336 | | | 1 | | | $ | 1,119 | |
| | | | | | | | | | | | | | | | | | | | | |
| | | | | | | | | | | | |
| | 2009 | | 2008 | | 2007 |
| | | Number
of Wells | | Cost | | Number
of Wells | | Cost | | Number
of Wells | | Cost |
| Balance at beginning of year | | | 1 | | | $ | 2,482 | | | | 4 | | | $ | 4,336 | | | | 1 | | | $ | 1,119 | |
| Additions pending determination of proved reserves | | | — | | | | — | | | | 1 | | | | 2,482 | | | | 4 | | | | 4,336 | |
| Reclassification to wells, equipment and facilities based on the determination of proved reserves | | | (1 | ) | | | (2,482 | ) | | | — | | | | — | | | | (1 | ) | | | (1,119 | ) |
| Charged to exploration expense | | | — | | | | — | | | | (4 | ) | | | (4,336 | ) | | | — | | | | — | |
| Balance at end of year | | | — | | | $ | — | | | | 1 | | | $ | 2,482 | | | | 4 | | | $ | 4,336 | |
We had no capitalized exploratory drilling costs that had been under evaluation for a period greater than one year as of December 31, 2009, 2008 2007 and 2006.2007.
11. | Property and Equipment |
10. Equity Investments
The following table summarizes our propertythe activity associated with PVR’s equity investments:
| | | | | | |
| | Year Ended December 31, |
| | | 2009 | | 2008 | | 2007 |
| Balance at beginning of year | | $ | 78,443 | | | $ | 25,640 | | | $ | 25,355 | |
| Equity earnings | | | 9,397 | | | | 5,919 | | | | 2,802 | |
| Amortization(1) | | | (2,125 | ) | | | (1,743 | ) | | | (1,017 | ) |
| Investments(2) | | | 6,622 | | | | 52,577 | | | | — | |
| Distributions | | | (4,736 | ) | | | (3,950 | ) | | | (1,500 | ) |
| Balance at end of year | | $ | 87,601 | | | $ | 78,443 | | | $ | 25,640 | |
| (1) | Reflects the amortization of intangible assets related to contracts and customer relationships acquired representing the excess of our investment over the underlying equity in the net assets. |
| (2) | Primarily reflects the acquisition of PVR’s 25% member interest in Thunder Creek during 2008 and PVR’s 50% joint venture investment in Crosspoint Pipeline during 2009. |
11. Intangible Assets and equipment as of December 31, 2008Goodwill
The following table summarizes PVR’s net intangible assets:
| | | | |
| | As of December 31, |
| | | 2009 | | 2008 |
| Contracts and customer relationships | | $ | 104,700 | | | $ | 106,900 | |
| Rights-of-way | | | 4,552 | | | | 4,552 | |
| Total intangible assets | | | 109,252 | | | | 111,452 | |
| Accumulated amortization | | | (25,511 | ) | | | (18,780 | ) |
| | | $ | 83,741 | | | $ | 92,672 | |
TABLE OF CONTENTS
PENN VIRGINIA CORPORATION AND SUBSIDIARIES
NOTES TO CONSOLIDATED FINANCIAL STATEMENTS
(in thousands, except per share amounts)
11. Intangible Assets and 2007:
| | | | | | | | |
| | | December 31, | |
| | | 2008 | | | 2007 | |
| | | (in thousands) | |
Oil and gas properties | | | | | | | | |
Proved | | $ | 1,951,325 | | | $ | 1,397,923 | |
Unproved | | | 154,801 | | | | 127,805 | |
| | | | | | | | |
Total oil and gas properties | | | 2,106,126 | | | | 1,525,728 | |
Other property and equipment: | | | | | | | | |
Coal properties | | | 476,787 | | | | 453,484 | |
Midstream property and equipment | | | 426,064 | | | | 238,040 | |
Land | | | 20,985 | | | | 17,753 | |
Timber | | | 87,869 | | | | 87,800 | |
Other property and equipment | | | 64,766 | | | | 62,303 | |
| | | | | | | | |
Total property and equipment | | | 3,182,597 | | | | 2,385,108 | |
Accumulated depreciation, depletion and amortization | | | (671,422 | ) | | | (486,094 | ) |
| | | | | | | | |
Net property and equipment | | $ | 2,511,175 | | | $ | 1,899,014 | |
| | | | | | | | |
The changescontracts and customer relationships and rights-of-way were primarily acquired by PVR in the carrying amountLone Star acquisition (see Note 5). PVR also has contract and customer relationship intangible assets included within its equity investments (see Note 10). Contracts and customer relationships are amortized on a straight-line basis over the expected useful lives of goodwillthe individual contracts and relationships, up to 20 years. Total intangible amortization expense for the yearyears ended December 31, 2008 are as follows:2009, 2007 and 2006 was approximately $7.4 million, $5.5 million and $4.1 million, respectively.
| | | | |
| | | Natural
gas
midstream
segment | |
Balance at January 1, 2008 | | $ | 7,718 | |
| |
Goodwill acquired during year | | | 24,083 | |
Impairment loss incurred during year | | | (31,801 | ) |
| | | | |
| |
Balance at December 31, 2008 | | $ | — | |
| | | | |
In accordance with SFAS No. 142, PVR tests goodwillThe following table sets forth our estimated aggregate amortization expense for impairment on an annual basis, at a minimum,the next five years and more frequently if a triggering event occurs. thereafter:
| | |
| Year | | Amortization
Expense |
| 2010 | | $ | 6,791 | |
| 2011 | | | 6,285 | |
| 2012 | | | 5,718 | |
| 2013 | | | 5,499 | |
| 2014 | | | 5,346 | |
| Thereafter | | | 54,102 | |
| Total | | $ | 83,741 | |
PVR’s annual impairment testing of goodwill and the subsequent hypothetical purchase price allocation, using the guidance prescribed by SFAS No. 142, resulted in an impairment to goodwill of approximately $31.8 million in the fourth quarter of 2008. The impairment charge, which was triggered by fourth quarter declines in oil and gas spot and futures prices and a decline in PVR’s market capitalization reducesduring the fourth quarter of 2008, reduced to zero all goodwill recorded in conjunction with acquisitions made by the PVR natural gas midstream segment in 2008 and prior years. As of December 31, 2009 and 2008, we had no goodwill recorded.
In determining the fair value of the PVR natural gas midstream segment (reporting unit), in 2008, we used an income approach. Under the income approach, the fair value of the reporting unit iswas estimated based on the present value of expected future cash flows. The income approach is dependent on a number of factors including estimates of forecasted revenue and operating costs, appropriate discount rates and a market-derived earnings multiple terminal value (the value of the reporting unit at the end of the estimation period).
Key assumptions used in the discounted cash flows model described above include estimates of future commodity prices based on the December 31, 2008 commodity price strips and estimates of operating, administrative and capital costs. We discounted the resulting future cash flows using a PVR peer company based weighted average cost of capital of 12%.
This loss iswas recorded in the impairment line on our consolidated statementsConsolidated Statements of income.Income. The goodwill impairment loss reflects the negative impact of certain factors which resulted in a reduction in the anticipated cash flows used to estimate fair value. The business and marketplace environments in which PVR currently operates differs from the historical environments that drove the factors used to value and record the acquisition of these business units. Our goodwill balance at December 31, 2007 was $7.7 million.
TABLE OF CONTENTS
13. | Intangible Assets, net |
The following table summarizes PVR’s net intangible assets as of December 31, 2008 and 2007:
| | | | | | | | |
| | | As of December 31, | |
| | | 2008 | | | 2007 | |
| | | (in thousands) | |
Contracts and customer relationships | | $ | 106,900 | | | $ | 37,700 | |
Rights-of-way | | | 4,552 | | | | 4,552 | |
| | | | | | | | |
Total intangible assets | | | 111,452 | | | | 42,252 | |
Accumulated amortization | | | (18,780 | ) | | | (13,314 | ) |
| | | | | | | | |
Intangible assets, net | | $ | 92,672 | | | $ | 28,938 | |
| | | | | | | | |
The contracts and customer relationships and rights-of-way were primarily acquired by PVR
PENN VIRGINIA CORPORATION AND SUBSIDIARIES
NOTES TO CONSOLIDATED FINANCIAL STATEMENTS
(in the Lone Star acquisition. See Note 4 – “Acquisitions and Divestitures.” Contracts and customer relationships are amortized on a straight-line basis over the expected useful lives of the individual contracts and relationships, up to 20 years. Total intangible amortization expense for the years ended December 31, 2008, 2007 and 2006 was approximately $5.5 million, $4.1 million and $5.0 million. As of December 31, 2008 and 2007, accumulated amortization of intangible assets
was $18.8 million and $13.3 million. The following table sets forth our estimated aggregate amortization expense for the next five years and thereafter:
| | | |
Year | | Amortization
Expense |
| | | (in thousands) |
2009 | | $ | 9,538 |
2010 | | | 9,054 |
2011 | | | 8,467 |
2012 | | | 7,779 |
2013 | | | 7,560 |
Thereafter | | | 70,498 |
| | | |
Total | | $ | 112,896 |
| | | |
14. | Impairment of Oil and Gas Properties |
In accordance with SFAS No. 144, we review oil and gas properties for impairment when events and circumstances indicate a decline in the recoverability of the carrying value of such properties, such as a downward revision of the reserve estimates or lower commodity prices. We estimate the future cash flows expected in connection with the properties and compare such future cash flows to the carrying amounts of the properties to determine if the carrying amounts are recoverable. When we find that the carrying amounts of the properties exceed their estimated undiscounted future cash flows, we adjust the carrying amounts of the properties to their fair value as determined by discounting their estimated future cash flows. The factors used to determine fair value include, but are not limited to, estimates of proved and probable reserves, future commodity prices, the timing of future production and capital expenditures and a discount rate commensurate with the risk reflective of the lives remaining for the respective oil and gas properties.
For the year ended December 31, 2008, we recorded $20.0 million of impairment charges in 2008 related to declines in spot and future oil and gas prices and declines in well performance. This reduced the estimated reserves on certain properties in the Mid-Continent and Appalachian regions, which was primarily due to a decline in well performance.
For the year ended December 31, 2007, we recognized impairment charges of $2.6 million primarily related to changes in estimates of the reserve bases of fields on certain properties in Oklahoma and Texas. These changes in reserve estimates were primarily due to declines in well performance. For the year ended December 31, 2006, we recognized impairment charges of $8.5 million related to changes in estimates of the reserve bases of fields on certain properties in Louisiana, Texas and West Virginia.
15. | Accounts Payable and Accrued Liabilities |
The following table summarizes our accounts payable and accrued liabilities as of December 31, 2008 and 2007:
| | | | | | |
| | | December 31, |
| | | 2008 | | 2007 |
| | | (in thousands) |
Deferred income - PVR coal | | $ | 4,842 | | $ | 2,958 |
Drilling costs | | | 54,477 | | | 19,446 |
Royalties | | | 9,495 | | | 18,032 |
Production and franchise taxes | | | 12,062 | | | 11,935 |
Compensation | | | 11,011 | | | 8,757 |
Interest | | | 3,049 | | | 3,153 |
Other | | | 5,702 | | | 14,830 |
| | | | | | |
Total accrued liabilities | | | 100,638 | | | 79,111 |
Accounts payable | | | 106,264 | | | 126,016 |
| | | | | | |
Accounts payable and accrued liabilities | | $ | 206,902 | | $ | 205,127 |
| | | | | | |
16. | Asset Retirement Obligations |
The following table reconciles the beginning and ending aggregate carrying amount of our AROs for the years ended December 31, 2008 and 2007, which are included in other liabilities on our consolidated balance sheets:
| | | | | | | | |
| | | Year Ended
December 31, | |
| | | 2008 | | | 2007 | |
| | | (in thousands) | |
Balance at beginning of period | | $ | 7,873 | | | $ | 6,747 | |
Liabilities incurred | | | 487 | | | | 540 | |
Revision of estimates | | | (505 | ) | | | — | |
Liabilities settled | | | 9 | | | | (219 | ) |
Accretion expense | | | 725 | | | | 805 | |
| | | | | | | | |
Balance at end of period | | $ | 8,589 | | | $ | 7,873 | |
| | | | | | | | |
The accretion expense is recorded in the depreciation, depletion and amortization expense line on the consolidated statements of income.
The following table summarizes our other liabilities as of December 31, 2008 and 2007:
| | | | | | |
| | | December 31, |
| | | 2008 | | 2007 |
| | | (in thousands) |
Deferred income - PVR Coal | | $ | 20,260 | | $ | 22,243 |
Asset retirement obligations | | | 8,589 | | | 7,873 |
Pension | | | 1,891 | | | 1,838 |
Post-retirement health care | | | 3,478 | | | 4,036 |
Environmental liabilities | | | 974 | | | 1,278 |
Unrecognized tax benefits | | | 2,800 | | | 8,386 |
Deferred compensation | | | 7,435 | | | 8,018 |
Other | | | 460 | | | 497 |
| | | | | | |
Total other liabilities | | $ | 45,887 | | $ | 54,169 |
| | | | | | |
12. Debt
The following table summarizes our long-term debt as of December 31, 2008debt:
| | | | |
| | As of December 31, |
| | | 2009 | | 2008 |
| Short-term borrowings(1) | | $ | — | | | $ | 7,542 | |
| Revolving credit facility | | | — | | | | 332,000 | |
| Senior notes, net of discount | | | 291,749 | | | | — | |
| Convertible notes, net of discount | | | 206,678 | | | | 199,896 | |
| PVR revolving credit facility | | | 620,100 | | | | 568,100 | |
| Total debt | | | 1,118,527 | | | | 1,107,538 | |
| Less: Short-term borrowings | | | — | | | | (7,542 | ) |
| | | $ | 1,118,527 | | | $ | 1,099,996 | |
| (1) | The short-term borrowings reflect a book overdraft for 2008. |
Revolving Credit Facility
In November 2009, we entered into the Revolver and 2007:
| | | | | | | | |
| | | As of December 31, | |
| | | 2008 | | | 2007 | |
| | | (in thousands) | |
Short-term borrowings | | $ | 7,542 | | | $ | 12,561 | |
Revolving credit facility—variable rate of 3.4% and 6.7% at December 31, 2008 and 2007 | | | 332,000 | | | | 122,000 | |
Convertible senior subordinated notes | | | 230,000 | | | | 230,000 | |
PVR revolving credit facility—variable rate of 4.4% and 6.2% at December 31, 2008 and 2007 | | | 568,100 | | | | 347,700 | |
PVR senior unsecured notes—noncurrent portion | | | — | | | | 51,453 | |
| | | | | | | | |
Total debt | | | 1,137,642 | | | | 763,714 | |
Less: Short-term borrowings | | | (7,542 | ) | | | (12,561 | ) |
| | | | | | | | |
Total long-term debt | | $ | 1,130,100 | | | $ | 751,153 | |
| | | | | | | | |
Insimultaneously terminated our previous credit agreement. The Revolver provides for a $300 million revolving credit facility and matures in November 2012. We have the year ended December 31, 2008,option to increase the short-term borrowings reflect a book overdraft. In the year ended December 31, 2007, the short-term borrowings reflect the current portion of the PVR Notes.
We capitalized interest costs amounting to $2.0 million, $3.7 million and $3.2 million in 2008, 2007 and 2006 because the borrowings funded the preparation of unproved properties for their development.
PVR capitalized interest costs amounting to $0.7 million and $0.8 million in the years ended December 31, 2008 and 2007 related to the construction of two natural gas processing plants. PVR capitalized interest costs amounting to $0.3 million in the year ended December 31, 2006 related to the construction of a coal services facility in October 2006.
Revolver
As of December 31, 2008, we had $332.0 million outstandingcommitments under the Revolver whichby up to an additional $225 million upon the receipt of commitments from one or more lenders. The Revolver is senior togoverned by a borrowing base calculation and the Convertible Notes. At the current $479.0 million limit onavailability under the Revolver may not exceed the lesser of the aggregate commitments and given our outstanding balance of $332.0the borrowing base. The initial borrowing base was $420 million net of $0.3and was reduced to $380 million of letters of credit, we could borrow up to $146.7 million at December 31, 2008. The Revolver, which matures in December 2010, is secured by a portionconnection with the sale of our proved oil and gas reserves. OurGulf Coast properties as discussed previously. The borrowing base can be redtermined twice per year.is redetermined semi-annually. The Revolver is available to us for general purposes including working capital, capital expenditures and acquisitions and includes a $20.0$20 million sublimit for the issuance of letters of credit. We had outstanding letters of credit of $0.3 million as of December 31, 2008. In 2008, we incurred commitment fees of $0.8 million on the unused portion of the Revolver. The commitments, which are can be redetermined relative to our borrowing base, cannot be withdrawn by the bank. The Revolver is governed by a borrowing base calculation and is redetermined semi-annually. We have the option to elect interest at (i) LIBOR, plus a margin ranging from 1.00% to 1.75%, based on the ratio of our outstanding borrowings to the borrowing base or (ii) the greater of the prime rate or federal funds rate plus a margin of up to 1.00%. The weighted average interest rate on borrowings outstanding under the Revolver during 2008 was 4.4%.
The Revolver’s financial covenants underinclude a minimum current ratio, as defined in the Revolver require uscredit agreement, and our total debt to EBITDAX, a non-GAAP measure, must not to exceed a specified ratios.ratio. The Revolver contains various other covenants that limit our ability to incur indebtedness, grant liens, make certain loans, acquisitions and investments, make any material change to the nature of our business or enter into a merger or sale of our assets, including the sale or transfer of interests in our subsidiaries. As of December 31, 2008,2009, we were in compliance with all of our covenants under the Revolver.
Convertible NotesBorrowings under the Revolver bear interest, at our option, at either (i) a rate derived from LIBOR, as adjusted for statutory reserve requirements for Eurocurrency liabilities (the “Adjusted LIBOR”), plus an applicable margin ranging from 2.000% to 3.000% or (ii) the greater of (a) the prime rate, (b) federal funds effective rate plus 0.5% and (c) the one-month Adjusted LIBOR plus 1.0%, in each case, plus an applicable margin (ranging from 1.000% to 2.000%). In each case, the applicable margin is determined based on the ratio of our outstanding borrowings to the available Revolver capacity. During 2009, we incurred commitment fees of $0.4 million on the unused portion of the Revolver and that of the credit facility under the previous credit agreement.
The Revolver is guaranteed by Penn Virginia and all of our material oil and gas subsidiaries. The obligations under the Revolver are secured by a first priority lien on a portion of our proved oil and gas reserves and a pledge of the equity interests in the guarantor subsidiaries.
As of December 31, 2008,2009, there were no amounts outstanding under the Revolver and we had $230.0remaining borrowing capacity of up to $299.3 million, net of outstanding letters of credit of $0.7 million.
TABLE OF CONTENTS
PENN VIRGINIA CORPORATION AND SUBSIDIARIES
NOTES TO CONSOLIDATED FINANCIAL STATEMENTS
(in thousands, except per share amounts)
12. Debt – (continued)
Senior Notes
In June 2009, we issued and sold $300 million of Senior Notes which mature in June 2016. The Senior Notes were sold at 97% of par, equating to an effective yield to maturity of approximately 11%. The net proceeds from the sale of the Senior Notes of $281.6 million were used to repay borrowings under the revolving credit facility associated with the previous credit agreement. The Senior Notes are senior to our existing and future subordinated indebtedness and are effectively subordinated to all of our indebtedness, including the Revolver, to the extent of the collateral securing that indebtedness. The obligations under the Senior Notes are fully and unconditionally guaranteed by our subsidiaries that guarantee our indebtedness under the Revolver.
Convertible Notes
In December 2007, we issued 4.50% Convertible Notes outstanding. The (“Convertible Notes bearNotes”) with interest at a rate of 4.50% per year payable semiannually in arrears on May 15 and November 15 of each year.
The Convertible Notes are convertible into cash up to the principal amount thereof and shares of our common stock, if any, in respect of the excess conversion value, based on an initial conversion rate of 17.3160 shares of common stock per $1,000 principal amount of the Convertible Notes (which is equal to an initial conversion price of approximately $57.75 per share of common stock), subject to adjustment, and, if not converted or repurchased earlier, will mature onin November 15, 2012. Holders of Convertible Notes may convert their Convertible Notes at their option prior to the close of business on the business day immediately preceding September 15, 2012 only under certain circumstances. On and after September 15, 2012 until the close of business on the third business day immediately preceding November 15, 2012, holders of the Convertible Notes may convert their Convertible Notes at any time.
The holders of the Convertible Notes who convert their Convertible Notes in connection with a make-whole fundamental change, as defined in the indenture governing the Convertible Notes, may be entitled to an increase in the conversion rate as specified in the indenture governing the Convertible Notes. Additionally, in the event of a fundamental change, as defined in the indenture governing the Convertible Notes, the holders of the Convertible Notes may require us to purchase all or a portion of their Convertible Notes at a purchase price equal to 100% of the principal amount of the Convertible Notes, plus accrued and unpaid interest, if any.
The Convertible Notes are ourrepresented by a liability component which is reflected herein as long-term debt, net of discount and an equity component which is included in additional paid-in capital in shareholders’ equity representing the convertible feature. The following table summarizes the carrying amount of these components for the periods presented:
| | | | |
| | As of December 31, |
| | | 2009 | | 2008 |
| Principal | | $ | 230,000 | | | $ | 230,000 | |
| Unamortized discount | | | (23,322 | ) | | | (30,104 | ) |
| Net carrying amount of liability component | | $ | 206,678 | | | $ | 199,896 | |
| Carrying amount of equity component | | $ | 36,850 | | | $ | 36,850 | |
The unamortized discount will be amortized through the end of 2012. The effective interest rate on the liability component of the Convertible Notes for the years ended December 31, 2009 and 2008 was 8.5%. During both 2009 and 2008, we recognized $10.4 million of interest expense related to the contractual coupon rate on the Convertible Notes and $6.8 million of interest expense related to the amortization of the discount.
The Convertible Notes are unsecured senior subordinated obligations, ranking junior in right of payment to any of our senior indebtedness and to any of our secured indebtedness to the extent of the value of the assets securing such indebtedness and equal in right of payment to any of our future unsecured senior subordinated indebtedness. The Convertible Notes will rank senior in right of payment to any of our future junior subordinated indebtedness and will structurally rank junior to all existing and future indebtedness of our guarantor subsidiaries.
In connection with the sale of the Convertible Notes, we entered into convertible note hedge transactions (“Note Hedges”) with respect to shares of our common stock (the “Note Hedges”) with affiliates of certain of the underwriters of the Convertible Notes (collectively, the “Option Counterparties”). The Note Hedges cover, subject to anti-dilution adjustments, the net shares of our common stock that would be deliverable to converting noteholders in the event of a conversion of the Convertible Notes. We paid an aggregate amount of $18.6 million of the net proceeds from the sale of the Convertible Notes for the cost of the Note Hedges (after such cost is offset by the proceeds of the Warrants described below).
TABLE OF CONTENTS
PENN VIRGINIA CORPORATION AND SUBSIDIARIES
NOTES TO CONSOLIDATED FINANCIAL STATEMENTS
(in thousands, except per share amounts)
12. Debt – (continued)
We also entered into separate warrant transactions, (“Warrants”), whereby we sold to the Option Counterparties warrants to acquire, subject to anti-dilution adjustments, approximately 4.0 million3,982,680 shares of our common stock (the “Warrants”) at an exercise price of $74.25 per share. Upon exercise of the Warrants, we will deliver shares of our common stock equal to the difference between the then market price and the strike price of the Warrants.
The Note Hedges and the Warrants are separate contracts entered into by us with the Option Counterparties, are not part of the terms of the Convertible Notes and will not affect the noteholders’ rights under the Convertible Notes. The Note Hedges are expected to offset the potential dilution upon conversion of the Convertible Notes in the event that the market value per share of our common stock at the time of exercise is greater than the strike price of the Note Hedges, which corresponds to the initial conversion price of the Convertible Notes and is simultaneously subject to certain adjustments.
If the market value per share of our common stock at the time of conversion of the Convertible Notes is above the strike price of the Note Hedges, the Note Hedges entitle us to receive from the Option Counterparties net shares of our common stock (and cash for any fractional share cash amount) based on the excess of the then current market price of our common stock over the strike price of the Note Hedges. Additionally, if the market price of our common stock at the time of exercise of the Warrants exceeds the strike price of the Warrants, we will owe the Option Counterparties net shares of our common stock (and cash for any fractional share cash amount), not offset by the Note Hedges, in an amount based on the excess of the then current market price of our common stock over the strike price of the Warrants.
On October 3, 2008, one of the Option Counterparties, Lehman Brothers OTC Derivatives Inc. (“Lehman OTC”) joined other Lehman Brothers entities and filed for bankruptcy protection. We had purchased 22.5% of the Note Hedges from Lehman OTC (“Lehman Note Hedges”) for approximately $8.3 million, and we had sold 22.5% of the Warrants to Lehman OTC for approximately $4.1 million. If the Lehman Note Hedges are rejected or terminated in connection with the Lehman OTC bankruptcy, we would have a claim against Lehman OTC and possibly Lehman Brothers Inc., as guarantor, for the damages and/or close-out values resulting from any such rejection or termination. While we intend to pursue any claim for damages and/or close-out values resulting from the rejection or termination of the Lehman Note Hedges, at this point in the Lehman bankruptcy cases it is not possible to determine with accuracy the ultimate recovery, if any, that we may realize on potential claims against Lehman OTC or its affiliated guarantor resulting from any rejection or termination of the Lehman Note Hedges. We also do not know whether Lehman OTC will assume or reject the Lehman Note Hedges, and therefore cannot predict whether Lehman OTC intends to perform its obligations under the Lehman Note Hedges. If Lehman OTC does not perform such obligations and the price of our common stock exceeds the $57.75 conversion price (as adjusted) of the Convertible Notes, our existing shareholders would experience dilution at the time or times the Convertible Notes are converted. The extent of any such dilution would depend, among other things, on the then prevailing market price of our common stock and the number of shares of common stock then outstanding, but we believe the impact will not be material and will not affect our income statement presentation. We are not otherwise exposed to counterparty risk related to the bankruptcies of Lehman Brothers Inc. or its affiliates and do not believe that the Lehman bankruptcies will have a material adverse effect on our financial condition or results of operations.
PVR Revolver
Revolving Credit FacilityAs of December 31, 2008, net2009, the long-term debt of outstanding borrowings of $568.1 million and letters of credit of $1.6 million, PVR had remaining borrowing capacity of $130.3 million onwas solely attributable to the PVR Revolver. In August 2008,March 2009, PVR increased the size of the PVR Revolver from $600.0$700 million to $700.0 million and secured the$800 million. The PVR Revolver is secured with substantially all of PVR’s assets. As of December 31, 2009, PVR had remaining borrowing capacity of $178.3 million on the PVR Revolver, net of outstanding indebtedness of $620.1 million and letters of credit of $1.6 million. The PVR Revolver matures in December 2011 and is available to PVR for general purposes, including working capital, capital expenditures and acquisitions, and includes a $10.0 million sublimit for the issuance of letters of credit. In 2008,Interest is payable at a base rate plus an applicable margin of up to 1.25% if PVR selects the base rate borrowing option or at a rate derived from LIBOR plus an applicable margin ranging from 1.75% to 2.75% if PVR selects the LIBOR-based borrowing option. At December 31, 2009, the base rate applicable margin was 0.75% and the LIBOR-based rate applicable margin was 2.25%. During 2009, PVR incurred commitment fees of $0.5 million on the unused portion of the PVR Revolver. The interest rate under the PVR Revolver fluctuates based on the ratio of PVR’s total indebtedness-to-EBITDA. Interest is payable at a base rate plus an applicable margin of up to 0.75% if PVR selects the base rate borrowing option under the PVR Revolver or at a rate derived from LIBOR plus an applicable margin ranging from 0.75% to 1.75% if PVR selects the LIBOR-based borrowing option. The weighted average interest rate on borrowingsindebtedness outstanding under the PVR Revolver during 20082009 was 4.6%approximately 2.7%. PVR does not have a public credit rating forDebt outstanding under the PVR Revolver.Revolver is non-recourse to us and PVG.
TABLE OF CONTENTS
PENN VIRGINIA CORPORATION AND SUBSIDIARIES
NOTES TO CONSOLIDATED FINANCIAL STATEMENTS
(in thousands, except per share amounts)
12. Debt – (continued)
The financial covenants under the PVR Revolver require PVR not to exceed specified ratios. The PVR Revolver prohibits PVR from making distributions to its partners if any potential default, or event of default, as defined in the PVR Revolver, occurs or would result from the distributions. In addition, the PVR Revolver contains various covenants that limitlimits PVR’s ability to incur indebtedness, grant liens, make certain loans, acquisitions and investments, make any material change to the nature of PVR’sits business, or enter into a merger or sale of PVR’sour assets, including the sale or transfer of interests in PVR’sits subsidiaries. As of December 31, 2008,2009, PVR was in compliance with all of its covenants under the PVR Revolver.
PVR Notes
In July 2008, PVR paid an aggregate of $63.3 million to the holders of the PVR Notes to prepay 100% of the aggregate principal amount of the PVR Notes. This amount consisted of approximately $58.4 million aggregate principal amount outstanding on the PVR Notes, $1.1 million in accrued and unpaid interest on the PVR Notes through the prepayment date and $3.8 million in make-whole amounts due in connection with the prepayment. The $3.8 million of make-whole payments were recorded in interest expense on our consolidated statements of income. The PVR Notes were repaid with borrowings under the PVR Revolver. While the PVR Notes were outstanding, PVR had a DBRS public credit rating. However, due to the repayment of the PVR Notes, PVR has elected not to renew this rating. As of December 31, 2007, PVR owed $64.0 million under the PVR Notes, the current portion of which was $12.6 million. The PVR Notes bore interest at a fixed rate of 6.02%.
Debt Maturities
The following table sets forth the aggregate maturities of the principal amounts of our and PVR’s long-term debt for the next five years and thereafter:
| | | |
Year | | Aggregate
Maturities of
Principal
Amounts |
2009 | | $ | — |
2010 | | | 332,000 |
2011 | | | 568,100 |
2012 | | | 230,000 |
2013 | | | — |
Thereafter | | | — |
| | | |
Total debt, including current maturities | | | 1,130,100 |
| | | |
In 2006, the FASB issued Interpretation No. 48,Accounting for Uncertainty in | | |
| Year | | Aggregate
Maturities of
Principal
Amounts |
| 2010 | | $ | — | |
| 2011 | | | 620,100 | |
| 2012 | | | 206,678 | |
| 2013 | | | — | |
| 2014 | | | — | |
| Thereafter | | | 291,749 | |
| Total | | $ | 1,118,527 | |
13. Income Taxes – an Interpretation of FASB Statement No. 109
(“FIN 48”) which we adopted on January 1, 2007. FIN 48 clarifies the accounting for uncertainty in income taxes by prescribing a minimum recognition threshold for a tax position taken or expected to be taken that is required to be met before being recognized in the financial statements. FIN 48 also provides guidance on derecognition, measurement, classification, interest and penalties, accounting in interim periods, disclosure and transition. The adoption of FIN 48 did not
result in a transition adjustment to retained earnings; instead, $8.7 million was reclassified from deferred income taxes to a long-term liability.
Due to the geographical scope of our operations, we are subject to ongoing tax examinations in numerous domestic jurisdictions. Accordingly, we may record incremental tax expense based upon the more-likely-than-not outcomes of any uncertain tax positions. In addition, when applicable, we adjust the previously recorded tax expense to reflect examination results when the position is effectively settled. Our ongoing assessments of the more-likely-than-not outcomes of the examinations and related tax positions require judgment and can increase or decrease our effective tax rate, as well as impact our operating results. The specific timing of when the resolution of each tax position will be reached is uncertain.
No liability for unrecognized tax benefits remained at December 31, 2009. The liability for unrecognized tax benefits at December 31, 2008 and 2007 included $3.3 million and $8.0 million of tax positions which would changechanged the effective tax rate if recognized. We recognize interest related to unrecognized tax benefits in interest expense, and penalties are included in income tax expense.2009, when settled. For the years ended December 31, 2009, 2008 and 2007, we recognized $0.1 million, $0.5 million and $0.7 million in interest and penalties. Prior to adoption of FIN 48, we classified interest on taxes as a component of income tax expense and penalties were included in income tax expense. We had accrued interest and penalties of $1.8 million and $3.4 million for the years endedas of December 31, 2008 and 2007.2008. Tax years from 20052006 forward remain open for examination by the Internal Revenue Service. Tax years from 20042005 forward remain open for state jurisdictions.
We are currently evaluating the filing status of a subsidiary TABLE OF CONTENTS
PENN VIRGINIA CORPORATION AND SUBSIDIARIES
NOTES TO CONSOLIDATED FINANCIAL STATEMENTS
(in a state. If management and the state’s taxing authority determine that the subsidiary’s income is taxable in that state, it is reasonably possible that a settlement of approximately $1.8 million will be made by the end of 2009. We classified $1.8 million of the total liability for unrecognized tax benefits as a current liability in income taxes payable on the balance sheet at December 31, 2008. This current liability represents our best estimate of the change in unrecognized tax benefits that we expect to occur within the next 12 months.thousands, except per share amounts)
13. Income Taxes – (continued)
A reconciliation of the beginning and ending amount ofour unrecognized tax benefits for the periods presented is as follows
| | | | | | |
| | Year Ended December 31, |
| | | 2009 | | 2008 | | 2007 |
| Balance at beginning of year | | $ | 4,600 | | | $ | 9,852 | | | $ | 8,737 | |
| Additions as a result of tax positions taken in the current year | | | 78 | | | | 220 | | | | 1,659 | |
| Additions as a result of tax positions taken in prior years | | | 100 | | | | 461 | | | | — | |
| Settlements | | | (4,778 | ) | | | (5,933 | ) | | | (544 | ) |
| Balance at end of year | | | — | | | | 4,600 | | | | 9,852 | |
| Less: current portion | | | — | | | | (1,800 | ) | | | (1,466 | ) |
| Long-term portion | | $ | — | | | $ | 2,800 | | | $ | 8,386 | |
In the years ended December 31, 2009, 2008 and 2007, is as followswe paid $2.5 million, $2.2 million and $0.4 million, respectively, in cash to settle uncertain tax positions. In the same years, we recognized $2.1 million, $3.7 million and $0.1 million in tax and interest benefits related to waived taxes, penalties and interest in connection with settlement.
| | | | | | | | |
| | | Year Ended
December 31, | |
| | | 2008 | | | 2007 | |
| | | (in millions) | |
Beginning of year (adoption adjustment) | | $ | 9,852 | | | $ | 8,737 | |
Additions based on tax positions related to the current year | | | 220 | | | | 1,659 | |
Additions as a result of tax positions taken in prior years | | | 461 | | | | — | |
Settlements | | | (5,933 | ) | | | (544 | ) |
| | | | | | | | |
Balance at end of year | | | 4,600 | | | | 9,852 | |
Less: current portion | | | (1,800 | ) | | | (1,466 | ) |
| | | | | | | | |
Long-term portion | | $ | 2,800 | | | $ | 8,386 | |
| | | | | | | | |
(1) | In the years ended December 31, 2008 and 2007, we paid $2.2 million and $0.4 million in cash to settle uncertain tax positions. In the same years, we recognized $3.7 million and $0.1 million in tax and interest benefits related to waived taxes, penalties and interest in connection with settlement. |
The following table summarizes our provision for income taxes from continuing operations for the years ended December 31, 2008, 2007 and 2006:
periods presented: | | | | | | | | | | | | |
| | | Year Ended December 31, | | Year Ended December 31, |
| | | 2008 | | 2007 | | 2006 | | 2009 | | 2008 | | 2007 |
| | | (in thousands) | |
Current income taxes | | | | | | | |
Current income taxes (benefit)
| | | | | | | | | | | | | |
Federal | | $ | 13,838 | | | $ | 6,212 | | $ | 11,710 | | $ | 6,572 | | | $ | 13,838 | | | $ | 6,212 | |
State | | | (469 | ) | | | 949 | | | 258 | | | 1,398 | | | | (469 | ) | | | 949 | |
| | | | | | | | |
Total current | | | 13,369 | | | | 7,161 | | | 11,968 | | | 7,970 | | | | 13,369 | | | | 7,161 | |
| | | | | | | | |
Deferred income taxes | | | | | | | |
Deferred income taxes (benefit)
| | | | | | | | | | | | | |
Federal | | | 50,380 | | | | 19,797 | | | 29,419 | | | (68,488 | ) | | | 48,617 | | | | 19,646 | |
State | | | 10,125 | | | | 3,543 | | | 8,601 | | | (14,734 | ) | | | 9,934 | | | | 3,525 | |
| | | | | | | | |
Total deferred | | | 60,505 | | | | 23,340 | | | 38,020 | | | (83,222 | ) | | | 58,551 | | | | 23,171 | |
| | | | | | | | | $ | (75,252 | ) | | $ | 71,920 | | | $ | 30,332 | |
Total income tax expense | | $ | 73,874 | | | $ | 30,501 | | $ | 49,988 | |
| | | | | | | | |
The following table reconciles the difference between the taxes computed by applying the statutory tax rate to income from operations before income taxes and our reported income tax expense for the years ended December 31, 2008, 2007 and 2006:periods presented:
| | | | | | | | | | | | | | | | | | | | | | | | |
| | | Year Ended December 31, | | | Year Ended December 31, |
| | | 2008 | | 2007 | | 2006 | | | 2009 | | 2008 | | 2007 |
Computed at federal statutory tax rate | | $ | 69,369 | | | 35.0 | % | | $ | 28,441 | | | 35.0 | % | | $ | 44,063 | | 35.0 | % | |
| Computed at federal statutory rate | | | $ | (66,463 | ) | | | (35.0 | )% | | $ | 67,606 | | | | 35.0 | % | | $ | 28,290 | | | | 35.0 | % |
State income taxes, net of federal income tax benefit | | | 7,475 | | | 3.8 | % | | | 3,275 | | | 4.0 | % | | | 5,391 | | 4.2 | % | | | (7,036 | ) | | | (3.7 | )% | | | 7,284 | | | | 3.8 | % | | | 3,257 | | | | 4.0 | % |
Other, net | | | (2,970 | ) | | (1.5 | )% | | | (1,215 | ) | | (1.5 | )% | | | 534 | | 0.5 | % | | | (1,753 | ) | | | (0.9 | )% | | | (2,970 | ) | | | (1.5 | )% | | | (1,215 | ) | | | (1.5 | )% |
| | | | | | | | | | | | | | | | | | | $ | (75,252 | ) | | | (39.6 | )% | | $ | 71,920 | | | | 37.3 | % | | $ | 30,332 | | | | 37.5 | % |
Total income tax expense | | $ | 73,874 | | | 37.3 | % | | $ | 30,501 | | | 37.5 | % | | $ | 49,988 | | 39.7 | % | |
| | | | | | | | | | | | | | | | | | |
TABLE OF CONTENTS
PENN VIRGINIA CORPORATION AND SUBSIDIARIES
NOTES TO CONSOLIDATED FINANCIAL STATEMENTS
(in thousands, except per share amounts)
13. Income Taxes – (continued)
The following table summarizes the principal components of our net deferred income tax liability as of December 31, 2008 and 2007:for the periods presented:
| | | | December 31, | | | | |
| | | 2008 | | 2007 | | As of December 31, |
| | | (in thousands) | | 2009 | | 2008 |
Deferred tax liabilities: | | | | | | | | | | | | |
Property and equipment | | $ | 278,149 | | $ | 229,557 | | $ | 347,627 | | | $ | 392,037 | |
Fair value of derivative instrument | | | 6,919 | | | — | |
| Fair value of derivative instruments | | | | — | | | | 6,919 | |
| Convertible notes | | | | 9,027 | | | | 12,248 | |
| Other | | | | 11,683 | | | | — | |
| Total deferred tax liabilities | | | | 368,337 | | | | 411,204 | |
Deferred tax assets:
| | | | | | | | | |
| Fair value of derivative instruments | | | | 9,194 | | | | — | |
| Deferred income – coal properties | | | | 9,069 | | | | 9,732 | |
| Pension and postretirement benefits | | | | 4,096 | | | | 4,279 | |
| Stock-based compensation | | | | 5,349 | | | | 4,699 | |
| Net operating loss carryforwards | | | | 1,806 | | | | — | |
Other | | | — | | | 997 | | | 12,768 | | | | 2,971 | |
| | | | | | | 42,282 | | | | 21,681 | |
Total deferred tax liabilities | | | 285,068 | | | 230,554 | |
| | | | | |
| Deferred tax assets: | | | | | |
Fair value of derivative instrument | | | — | | | 30,015 | |
Deferred income - coal properties | | | 9,732 | | | 9,836 | |
Pension and post-retirement benefits | | | 4,279 | | | 4,877 | |
Stock-based compensation | | | 4,699 | | | 3,428 | |
Net operating loss carry forwards | | | — | | | 459 | |
Other | | | 2,971 | | | 4,262 | |
| | | | | |
| Less: Valuation allowance | | | | (885 | ) | | | — | |
Total deferred tax assets | | | 21,681 | | | 52,877 | | | 41,397 | | | | 21,681 | |
| | | | | |
Net deferred tax liability | | $ | 263,387 | | $ | 177,677 | | $ | 326,940 | | | $ | 389,523 | |
| | | | | |
In assessing our deferred tax assets, we consider whether a valuation allowance should be recorded for some or all of the deferred tax assets which may not be realized. The ultimate realization of the deferred tax assets is dependent upon the generation of future taxable income during the periods in which the temporary differences become deductible. Among other items, we consider the scheduled reversal of deferred tax liabilities, projected future taxable income and available tax planning strategies. As of December 31, 2009, a valuation allowance of $0.9 million had been recorded for deferred tax assets that were not more likely than not to be realized. As of December 31, 2008, and 2007, no valuation allowance had been recorded because we estimated that it was more likely than not that all of our deferred tax assets would be realized.
In June 2006, we acquired 100% of the common stock of Crow Creek Holding Corporation. As a result, we acquired federal and state tax The net operating loss carryforwards (“NOLs”) which,losses, if unused, will expire between 2022 and 2026. In additionin the years 2024 to the carryforward period, these acquired NOLs are subject to other restrictions and limitations, including Section 382 of the Internal Revenue Code, which impact their ultimate realizability. As of December 31, 2008, we had utilized all of these federal and state NOLs.2029.
20. Earnings per Share
14. Asset Retirement Obligations
The following table provides a reconciliation ofreconciles our AROs for the numerators and denominators usedperiods presented, which are included in the calculation of basic and diluted earningsother liabilities on our Consolidated Balance Sheets:
| | | | |
| | Year Ended December 31, |
| | | 2009 | | 2008 |
| Balance at beginning of year | | $ | 8,589 | | | $ | 7,873 | |
| Liabilities incurred | | | 411 | | | | 487 | |
| Revision of estimates | | | — | | | | (505 | ) |
| Liabilities settled | | | (142 | ) | | | 9 | |
| Transfers(1) | | | (500 | ) | | | — | |
| Accretion expense | | | 491 | | | | 725 | |
| Balance at end of year | | $ | 8,849 | | | $ | 8,589 | |
| (1) | An ARO was transferred to Liabilities held for sale in connection with the sale of our Gulf Coast properties (see Note 5). |
TABLE OF CONTENTS
PENN VIRGINIA CORPORATION AND SUBSIDIARIES
NOTES TO CONSOLIDATED FINANCIAL STATEMENTS
(in thousands, except per share amounts)
15. Commitments and Contingencies
Penn Virginia Corporation Commitments
The following table sets forth our significant commitments, by category, for the next five years and thereafter. A discussion of these items follows:
| | | | | | |
| | Penn Virginia Corporation |
| Year | | Minimum
Rental
Commitments | | Drilling
Commitments | | Firm
Transportation
Commitments |
| 2010 | | $ | 4,209 | | | $ | 19,883 | | | $ | 3,746 | |
| 2011 | | | 2,662 | | | | 8,458 | | | | 3,746 | |
| 2012 | | | 1,516 | | | | — | | | | 3,510 | |
| 2013 | | | 1,449 | | | | — | | | | 2,779 | |
| 2014 | | | 1,458 | | | | — | | | | 2,689 | |
| Thereafter | | | 5,119 | | | | — | | | | 15,001 | |
| Total | | $ | 16,413 | | | $ | 28,341 | | | $ | 31,471 | |
Rental Commitments
Operating lease rental expense in the years ended December 31, 2009, 2008 and 2007 was $18.0 million, $18.5 million and 2006:$13.4 million.
Our rental commitments primarily relate to equipment and building leases.
| | | | | | | | | | | |
| | | Year Ended December 31, |
| | | 2008 | | | 2007 | | | 2006 |
| | | (in thousands, except per share data) |
Net income | | $ | 124,168 | | | $ | 50,754 | | | $ | 75,909 |
Less: Portion of subsidiary net incomeallocated to undistributed share-basedcompensation awards (net of tax) | | | (295 | ) | | | (186 | ) | | | — |
| | | | | | | | | | | |
| | $ | 123,873 | | | $ | 50,568 | | | $ | 75,909 |
Weighted average shares, basic | | | 41,760 | | | | 38,061 | | | | 37,362 |
Effect of dilutive securities: | | | | | | | | | | | |
Stock options | | | 271 | | | | 297 | | | | 370 |
| | | | | | | | | | | |
Weighted average shares, diluted | | | 42,031 | | | | 38,358 | | | | 37,732 |
| | | | | | | | | | | |
Net income per share, basic | | $ | 2.97 | | | $ | 1.33 | | | $ | 2.03 |
| | | | | | | | | | | |
Net income per share, diluted | | $ | 2.95 | | | $ | 1.32 | | | $ | 2.01 |
| | | | | | | | | | | |
Drilling Commitments
OptionsWe have agreements to purchase oil and gas well drilling services from third parties with an exercise price exceedingterms that range up to three years. The agreements include early termination provisions that would require us to pay penalties if we terminate the average priceagreements prior to the end of their original terms. The amount of penalty is based on the number of days remaining in the contractual term and declines as time passes. As of December 31, 2009, the penalty amount would have been $38.3 million if we had terminated our agreements on that date. Our management intends to utilize drilling services under these agreements for the full terms and has no plans to terminate the agreements early.
Oil and Gas Segment Firm Transportation Commitments
We have entered into contracts which provide firm transportation capacity rights for specified volumes per day on a pipeline system with terms that ranged from one to 10 years. The contracts require us to pay transportation demand charges regardless of the underlying securities are not consideredamount of pipeline capacity we use. We may sell excess capacity to be dilutive and are not included third parties at our discretion.
TABLE OF CONTENTS
PENN VIRGINIA CORPORATION AND SUBSIDIARIES
NOTES TO CONSOLIDATED FINANCIAL STATEMENTS
(in calculation of the denominator for diluted earningsthousands, except per share amounts)
15. Commitments and Contingencies – (continued)
PVR Commitments
The following table sets forth PVR’s significant commitments, by category, for the next five years and thereafter. A discussion of these items follows:
| | | | |
| | PVR |
| Year | | Minimum
Rental
Commitments | | Firm
Transportation
Commitments |
| 2010 | | $ | 4,243 | | | $ | 13,103 | |
| 2011 | | | 3,413 | | | | 5,694 | |
| 2012 | | | 3,017 | | | | 4,508 | |
| 2013 | | | 2,971 | | | | 4,033 | |
| 2014 | | | 2,893 | | | | 3,321 | |
| Thereafter | | | 7,943 | | | | 1,661 | |
| Total | | $ | 24,480 | | | $ | 32,320 | |
Rental Commitments
Operating lease rental expense in the years ended December 31, 2009, 2008 and 2007 was $7.5 million, $4.5 million and 2006.$2.6 million.
PVR rental commitments primarily relate to equipment and building leases and leases of coal reserve-based properties which PVR subleases, or intends to sublease, to third parties. The total numberobligation with respect to leased properties which PVR subleases expires when the property has been mined to exhaustion or the lease has been canceled. The timing of sharesmining by third party operators is difficult to estimate due to numerous factors. PVR believes that could potentially dilute basic earningsits future rental commitments with regard to this subleased property cannot be estimated with certainty.
PVR Natural Gas Midstream Segment Firm Transportation Commitments
As of December 31, 2009, PVR had contracts for firm transportation capacity rights for specified volumes per day on a pipeline system with terms that ranged from one to seven years. The contracts require PVR to pay transportation demand charges regardless of the amount of pipeline capacity PVR uses. PVR may sell excess capacity to third parties at its discretion.
Legal
We are involved, from time to time, in various legal proceedings arising in the ordinary course of business. While the ultimate results of these proceedings cannot be predicted with certainty, our management believes that these claims will not have a material effect on our financial position or results of operations.
Environmental Compliance
Extensive federal, state and local laws govern oil and natural gas operations, regulate the discharge of materials into the environment or otherwise relate to the protection of the environment. Numerous governmental departments issue rules and regulations to implement and enforce such laws that are often difficult and costly to comply with and which carry substantial administrative, civil and even criminal penalties for failure to comply. Some laws, rules and regulations relating to protection of the environment may, in certain circumstances, impose “strict liability” for environmental contamination, rendering a person liable for environmental and natural resource damages and cleanup costs without regard to negligence or fault on the part of such person. Other laws, rules and regulations may restrict the rate of oil and natural gas production below the rate that would otherwise exist or even prohibit exploration or production activities in
TABLE OF CONTENTS
PENN VIRGINIA CORPORATION AND SUBSIDIARIES
NOTES TO CONSOLIDATED FINANCIAL STATEMENTS
(in thousands, except per share amounts)
15. Commitments and Contingencies – (continued)
sensitive areas. In addition, state laws often require some form of remedial action to prevent pollution from former operations, such as closure of inactive pits and plugging of abandoned wells. The regulatory burden on the oil and natural gas industry increases its cost of doing business and consequently affects its profitability. These laws, rules and regulations affect our operations, as well as the oil and gas exploration and production industry in general. We believe that we are in substantial compliance with current applicable environmental laws, rules and regulations and that continued compliance with existing requirements will not have a material adverse impact on us. Nevertheless, changes in existing environmental laws or the adoption of new environmental laws have the potential to adversely affect our operations.
PVR’s operations and those of its lessees are subject to environmental laws and regulations adopted by various governmental authorities in the jurisdictions in which these operations are conducted. The terms of PVR’s coal property leases impose liability on the relevant lessees for all environmental and reclamation liabilities arising under those laws and regulations. The lessees are bonded and have indemnified PVR against any and all future was 20,000environmental liabilities. PVR regularly visits its coal properties to monitor lessee compliance with environmental laws and regulations and to review mining activities. PVR’s management believes that its operations and those of its lessees comply with existing laws and regulations and does not expect any material impact on its financial condition or results of operations.
As of December 31, 2009 and 2008, PVR’s environmental liabilities were $1.0 million and $1.2 million, which represents PVR’s best estimate of the liabilities as of those dates related to its coal and natural resource management and natural gas midstream businesses. PVR has reclamation bonding requirements with respect to certain unleased and inactive properties. Given the uncertainty of when a reclamation area will meet regulatory standards, a change in this estimate could occur in the future.
Mine Health and Safety Laws
There are numerous mine health and safety laws and regulations applicable to the coal mining industry. However, since PVR does not operate any mines and does not employ any coal miners, PVR is not subject to such laws and regulations. Accordingly, we have not accrued any related liabilities.
16. Additional Balance Sheet Detail
The following tables summarize components of selected balance sheet accounts:
| | | | |
| | As of December 31, |
| | | 2009 | | 2008 |
Accounts payable and accrued liabilities:
| | | | | | | | |
| Deferred income | | $ | 5,234 | | | $ | 6,211 | |
| Drilling costs | | | 11,203 | | | | 54,477 | |
| Royalties | | | 6,717 | | | | 9,495 | |
| Production and franchise taxes | | | 11,189 | | | | 12,062 | |
| Compensation | | | 11,582 | | | | 11,011 | |
| Interest | | | 3,759 | | | | 3,049 | |
| Liabilities held for sale | | | 500 | | | | — | |
| Deposit received on properties to be sold | | | 2,280 | | | | — | |
| Other | | | 5,754 | | | | 4,333 | |
| Total accrued liabilities | | | 58,218 | | | | 100,638 | |
| Accounts payable | | | 79,170 | | | | 106,264 | |
| | | $ | 137,388 | | | $ | 206,902 | |
TABLE OF CONTENTS
PENN VIRGINIA CORPORATION AND SUBSIDIARIES
NOTES TO CONSOLIDATED FINANCIAL STATEMENTS
(in thousands, except per share amounts)
16. Additional Balance Sheet Detail – (continued)
| | | | |
| | As of December 31, |
| | | 2009 | | 2008 |
Other liabilities:
| | | | | | | | |
| Deferred income – PVR Coal | | $ | 18,371 | | | $ | 20,260 | |
| Asset retirement obligations | | | 8,849 | | | | 8,589 | |
| Pension | | | 1,762 | | | | 1,891 | |
| Postretirement health care | | | 3,452 | | | | 3,478 | |
| Environmental obligations | | | 861 | | | | 974 | |
| Unrecognized tax benefits | | | — | | | | 2,800 | |
| Deferred compensation | | | 9,741 | | | | 7,435 | |
| Other | | | 427 | | | | 460 | |
| | | $ | 43,463 | | | $ | 45,887 | |
17. Shareholders Equity’
In September 2009, we sold 10 million units of PVG owned by us for proceeds of $118.1 million, net of offering costs resulting in a reduction of our limited partner interest in PVG from 77.0% to 51.4%. The transaction resulted in a $67.7 million increase in noncontrolling interests and a $50.4 million increase to additional paid-in capital less $17.7 million for deferred income tax effects.
In May 2009, we issued 3,500,000 shares of our common stock in 2008 and zeroa registered public offering that provided $64.8 million of net proceeds. The net proceeds were used in 2007 and 2006. The Convertibleaddition to the Senior Notes (see Note 9 – “Common Stock Offering, Convertible Note Offering, Warrant and Note Hedges”) issued into repay our borrowings under our previous revolving credit facility.
In December 2007, have not metwe completed the criteria for conversion. Therefore, the Convertible Notes are not dilutive and are not includedsale of 3,450,000 shares of our common stock in the calculationa registered public offering. The net proceeds of the denominatorsale were $135.4 million and were used to repay a portion of the outstanding borrowings under our previous revolving credit facility and for diluted earningsgeneral corporate purposes.
Comprehensive income represents changes in shareholders’ equity during the reporting period, including net income (loss) and charges directly to shareholders’ equity which are excluded from net income. The following table sets forth the components of comprehensive income for the periods presented:
| | | | | | |
| | Cash Flow
Hedges | | Other | | Total |
Year ended December 31, 2009:
| | | | | | | | | | | | |
| Hedging unrealized losses, net of tax of ($62) | | $ | 115 | | | $ | — | | | $ | 115 | |
| Hedging reclassification adjustment, net of tax of $1,986 | | | 3,689 | | | | — | | | | 3,689 | |
| Other, net of tax of $75 | | | — | | | | 140 | | | | 140 | |
| Other comprehensive income | | $ | 3,804 | | | $ | 140 | | | $ | 3,944 | |
Year ended December 31, 2008:
| | | | | | | | | | | | |
| Hedging unrealized losses, net of tax of ($2,352) | | $ | (4,368 | ) | | $ | — | | | $ | (4,368 | ) |
| Hedging reclassification adjustment, net of tax of $2,871 | | | 5,332 | | | | — | | | | 5,332 | |
| Other, net of tax of $186 | | | — | | | | 346 | | | | 346 | |
| Other comprehensive income | | $ | 964 | | | $ | 346 | | | $ | 1,310 | |
Year ended December 31, 2007:
| | | | | | | | | | | | |
| Hedging unrealized losses, net of tax of ($1,432) | | $ | (2,659 | ) | | $ | — | | | $ | (2,659 | ) |
| Hedging reclassification adjustment, net of tax of $1,499 | | | 2,691 | | | | — | | | | 2,691 | |
| Other, net of tax of ($8) | | | — | | | | (14 | ) | | | (14 | ) |
| Other comprehensive income | | $ | 32 | | | $ | (14 | ) | | $ | 18 | |
TABLE OF CONTENTS
PENN VIRGINIA CORPORATION AND SUBSIDIARIES
NOTES TO CONSOLIDATED FINANCIAL STATEMENTS
(in thousands, except per share for the years ended December 31, 2008 and 2007.
21.amounts)18. Share-Based Payments
CompensationStock Compensation Plans
We have several stock compensation plans (collectively, the “Stock Compensation Plans”) that allow incentive and nonqualified stock options and restricted stock to be granted to key employees and officers and nonqualified stock options and deferred common stock units to be granted to directors. At December 31, 2008,2009, there were approximately 376,5951,615,410 and 1,492,666376,595 shares available for issuance to directorsemployees and employeesdirectors pursuant to the Stock Compensation Plans.Plans, respectively. For the years ended December 31, 2009, 2008 2007 and 2006,2007, we recognized $9.1 million, $5.9 million $4.1 million and $2.8$4.1 million of compensation expense related to the Stock Compensation Plans, which is recorded onreflected in the general and administrative expensesexpense line onof the consolidated statementsConsolidated Statements of income.Income. The total income tax benefit recognized in our consolidated statementsthe Consolidated Statements of incomeIncome for the Stock Compensation Plans was $3.5 million, $2.3 million $1.6 million and $1.1$1.6 million for the years ended December 31, 2009, 2008 2007 and 2006.2007.
Stock Options. The exercise price of all options granted under the Stock Compensation Plans is equal to the fair market value of our common stock on the date of the grant. Options may be exercised at any time after vesting and prior to ten years following the date of grant. Options vest upon terms established by the compensation and benefits committee of our board of directors.directors (the “Committee”). Generally, options vest ratably over a three-year period, with one-third vesting in each year. In addition, all options will vest upon a change of control of us, as defined by the Stock Compensation Plans. In the case of employees, if a grantee’s employment terminates (i) for cause, all of the grantee’s options, whether vested or unvested, will be automatically forfeited, (ii) by reason of death, disability or retirement (age 62 and providing ten consecutive years of service) the grantee’s options will automatically vest and (iii) for any other reason, the grantee’s unvested options will be automatically forfeited.
In the case of directors, if a grantee’s membership on our board of directors terminates for any reason, the grantee’s unvested options will be automatically forfeited. We have a policy of issuing new shares to satisfy share option exercises.
The fair value of each option award is estimated on the date of grant using the Black-Scholes-Merton option-pricing formula that uses the assumptions noted in the following table. Expected volatilities are based on historical changes in the market value of our stock. Separate groups of employees that have similar historical exercise behavior are considered separately to estimate expected lives. Options granted have a maximum term of ten years. We base the risk-free interest rate on the U.S. Treasury rate for the week of the grant having a term equal to the expected life of the option.
| | | | | | | | | | | | |
| | | 2008 | | 2007 | | 2006 | | 2009 | | 2008 | | 2007 |
| Expected volatility | | 38.5% to 56.1% | | 30.0% to 38.5% | | 20.9% to 31.5% | | | 51.7% to 64.9% | | | | 38.5% to 56.1% | | | | 30.0% to 38.5% | |
| Dividend yield | | 0.37% to 0.67% | | 0.51% to 0.63% | | 0.60% to 0.71% | | | 1.25% to 1.49% | | | | 0.37% to 0.67% | | | | 0.51% to 0.63% | |
| Expected life | | 3.5 to 4.6 years | | 3.5 to 4.6 years | | 3.5 to 4.6 years | | | 3.5 to 4.6 years | | | | 3.5 to 4.6 years | | | | 3.5 to 4.6 years | |
| Risk-free interest rate | | 1.86% to 2.87% | | 3.86% to 4.72% | | 4.59% to 5.01% | | | 1.23% to 1.84% | | | | 1.86% to 2.87% | | | | 3.86% to 4.72% | |
TABLE OF CONTENTS
PENN VIRGINIA CORPORATION AND SUBSIDIARIES
NOTES TO CONSOLIDATED FINANCIAL STATEMENTS
(in thousands, except per share amounts)
18. Share-Based Compensation – (continued)
The following table summarizes activity for our most recent fiscal year with respect to common stock options awarded:
| | | | | | | | | | | |
Options | | Shares
Under
Options | | | Weighted
Average
Exercise
Price | | Weighted
Average
Remaining
Contractual
Term | | Aggregate
Intrinsic
Value |
| | | | | | | | (in years) | | (in thousands) |
Outstanding at January 1, 2008 | | 1,346,417 | | | $ | 25.39 | | | | | |
Granted | | 482,594 | | | | 43.18 | | | | | |
Exercised | | (421,934 | ) | | | 18.87 | | | | | |
Forfeit | | (29,862 | ) | | | 36.81 | | | | | |
| | | | | | | | | | | |
Outstanding at December 31, 2008 | | 1,377,215 | | | $ | 33.28 | | 7.6 | | $ | 4,282 |
| | | | | | | | | | | |
Exercisable at December 31, 2008 | | 529,853 | | | $ | 23.99 | | 6.1 | | $ | 4,282 |
| | | | | | | | | | | |
| | | | | | | | |
| | Shares Under
Options | | Weighted-
Average
Exercise
Price | | Weighted-
Average
Remaining
Contractual
Term | | Aggregate
Intrinsic Value |
| Outstanding at beginning of year | | | 1,377,215 | | | $ | 33.38 | | | | | | | | | |
| Granted | | | 1,162,472 | | | | 15.10 | | | | | | | | | |
| Exercised | | | — | | | | — | | | | | | | | | |
| Forfeited | | | (262,770 | ) | | | 26.30 | | | | | | | | | |
| Outstanding at end of year | | | 2,276,917 | | | $ | 24.86 | | | | 7.7 | | | $ | 7,912 | |
| Exercisable at end of year | | | 1,102,673 | | | $ | 27.48 | | | | 6.6 | | | $ | 2,916 | |
The weighted-average grant-date fair value of options granted during the years ended December 31, 2009, 2008 and 2007 was $5.60, $13.20 and 2006 was $13.20, $9.83 and $7.17 per option. The total intrinsic value of options exercised during the years ended December 31, 2008 2007 and 20062007 was $13.1 million and $10.0 million and $7.4 million.
The following table summarizes the status of our nonvested There were no options as of December 31, 2008 and changesexercised during the year then ended:2009.
| | | | | | |
Nonvested Options | | Options | | | Weighted
Average
Grant-Date
Fair Value |
Nonvested at January 1, 2008 | | 728,812 | | | $ | 8.54 |
Granted | | 482,594 | | | | 13.20 |
Vested | | (334,182 | ) | | | 7.99 |
Forfeit | | (29,862 | ) | | | 9.46 |
| | | | | | |
Nonvested at December 31, 2008 | | 847,362 | | | $ | 11.38 |
| | | | | | |
As of December 31, 2008,2009, we had $6.5 million of total unrecognized compensation cost related to nonvested stock options. We expect that cost to be recognized over a weighted-average period of 0.9 years. The total grant-date fair value of stock options that vested in 2009, 2008 and 2007 and 2006 was $5.7 million, $2.7 million and $1.8 million and $0.8 million. Cash received from the exercise of stock options in 2008 was $8.0 million, net of employee taxes withheld. The actual tax benefit realized for the tax deductions from option exercises was $4.6 million for the year ended December 31, 2008.
Restricted Stock. Restricted stock vests upon terms established by the compensationCommittee and benefits committee of our board of directors andas specified in the award agreement. In addition, all restricted stock will vest upon a change of control of us. If a grantee’s employment terminates for any reason other than death or disability, the grantee’s restricted stock will be automatically forfeited unless otherwise determined by the compensation and benefits committeeCommittee and specified in the award agreement. If a grantee’s employment terminates by reason of death or disability, or if a grantee becomes retirement eligible (age 62 and providing 10 consecutive years of service), the grantee’s restricted stock will automatically vest. Except as specified by the compensation and benefits committee,Committee, a grantee shall be entitled to receive any dividends declared on our common stock. Restricted stock vests over a three-year period, with one-third vesting in each year. We recognize compensation expense on a straight-line basis over the vesting period.
The following table summarizes the status of our nonvested restricted stock as of December 31, 20082009 and changes during the year then ended:
| | | | | | | |
Nonvested Options | | Nonvested
Restricted
Stock | | | Weighted
Average
Grant-Date
Fair Value | |
Nonvested at January 1, 2008 | | 49,348 | | | $ | 31.92 | |
Granted | | 39,354 | | | | 42.27 | |
Vested | | (34,302 | ) | | | (30.88 | ) |
| | | | | | | |
Nonvested at December 31, 2008 | | 54,400 | | | $ | 40.06 | |
| | | | | | | |
| | | | |
| | Nonvested
Restricted
Stock | | Weighted-
Average
Grant Date
Fair Value |
| Balance at beginning of year | | | 54,400 | | | $ | 40.06 | |
| Vested | | | (33,740 | ) | | | (39.60 | ) |
| Balance at end of year | | | 20,660 | | | $ | 40.82 | |
At December 31, 2008,2009, we had $1.5$0.4 million of total unrecognized compensation cost related to nonvested restricted stock. We expect that cost to be recognized over a weighted-average period of 1.00.6 years. The total grant-date fair value of restricted stock that vested in the years ended December 31, 2009, 2008 and 2007 was $1.3 million, $1.0 million and $0.6 million.
TABLE OF CONTENTS
PENN VIRGINIA CORPORATION AND SUBSIDIARIES
NOTES TO CONSOLIDATED FINANCIAL STATEMENTS
(in thousands, except per share amounts)
18. Share-Based Compensation – (continued)
Deferred Common Stock Units. A portion of the compensation paid to non-employee members of our board of directors is paid in deferred common stock units. Each deferred common stock unit represents one share of common stock, which vests immediately upon issuance and is available to the holder upon termination or retirement from our board of directors. Deferred common stock units awarded to directors receive all cash or other dividends we pay on account of shares of our common stock. The fair value of the deferred common stock units is calculated based on the grant-date stock price.
The following table summarizes activity for the most recent fiscal year with respect to deferred common stock units awarded:
| | | | | |
| | | Deferred
Common
Stock
Units | | Weighted
Average
Grant-date
Fair Value |
Outstanding at January 1, 2008 | | 51,972 | | $ | 30.94 |
Granted | | 14,105 | | | 44.59 |
| | | | | |
Outstanding at December 31, 2008 | | 66,077 | | $ | 33.86 |
| | | | | |
| | | | |
| | Deferred
Common
Stock Units | | Weighted-
Average
Grant Date
Fair Value |
| Balance at beginning of year | | | 66,077 | | | $ | 33.86 | |
| Granted | | | 29,045 | | | | 19.55 | |
| Converted | | | (11,936 | ) | | | 32.01 | |
| Balance at end of year | | | 83,186 | | | $ | 29.13 | |
The aggregate intrinsic value of deferred common stock units converted to shares of common stock in the year ended December 31, 2007 was $0.3 million.
In accordance with EITF Issue No. 97-14,Accounting for Deferred Compensation Arrangements Where Amounts Earned Are Held in a Rabbi Trust and Invested, weWe recorded a $2.4 million, $2.2 million $1.6 million and $1.3$1.6 million deferred compensation obligation in shareholders’ equity at December 31, 2009, 2008 2007 and 20062007 and a corresponding amount for treasury stock.
Deferred Phantom Stock Units. A phantom unit entitles the grantee to receive a share of common stock upon the vesting of the phantom unit, or in the discretion of the Committee, the cash equivalent of the value of a share of common stock. The Committee determines the time period over which phantom units granted to employees and directors will vest. In addition, all phantom units will vest upon a change of control. If a director’s membership on the board of directors terminates for any reason, or an employee’s employment with us and our affiliates terminates for any reason other than retirement after reaching age 62 and completing 10 years of consecutive service, the grantee’s phantom units will be automatically forfeited unless, and to the extent, the Committee provides otherwise. Phantom units generally vest over a three-year period, with one-third vesting in each year. The Committee, in its discretion, may grant tandem dividend equivalent rights with respect to phantom units. A dividend equivalent right is a right to receive an amount in cash equal to, and 30 days after, the cash dividends made with respect to a share of common stock during the period such phantom unit is outstanding. Payments of dividend equivalent rights associated with shares of common stock that are expected to vest are recorded as dividends; however, payments associated with units that are not expected to vest are recorded as compensation expense.
The following table summarizes activity for the most recent fiscal year with respect to phantom stock units awarded:
| | | | |
| | Deferred
Phantom
Stock Units | | Weighted-
Average
Grant Date
Fair Value |
| Balance at beginning of year | | | — | | | $ | — | |
| Granted | | | 111,755 | | | | 15.42 | |
| Vested | | | (39,841 | ) | | | (15.06 | ) |
| Balance at end of year | | | 71,914 | | | $ | 15.62 | |
TABLE OF CONTENTS
PENN VIRGINIA CORPORATION AND SUBSIDIARIES
NOTES TO CONSOLIDATED FINANCIAL STATEMENTS
(in thousands, except per share amounts)
18. Share-Based Compensation – (continued)
PVG Long-Term Incentive Plan
PVG’s general partner has adopted a long-term incentive plan. PVG’s long-term incentive plan permits the grant of awards to employees and directors of PVG’s general partner and employees of its affiliates who perform services for PVG. Awards under the PVG’s long-term incentive plan can be in the form of PVG common units, restricted PVG units, PVG unit options, phantom PVG units and deferred PVG common units. The PVG long-term incentive plan is administered by the compensation and benefits committee of the board of directors of PVG’s general partner (the “PVG Committee”). PVG reimburses its general partner for payments made pursuant to the PVG long-term incentive plan. PVG recognizes compensation cost based on the fair value of the awards over the vesting period.
PVG recognized compensation expense related to its long-term incentive plan of $0.4 million for each of the years ended December 31, 2009, 2008 and 2007 Compensation expense is recorded on the general and administrative expense line on the Consolidated Statements of Income.
Deferred PVG Common Units. A portion of the compensation to the non-employee directors of PVG’s general partner is paid in deferred PVG common units. Each deferred PVG common unit represents one PVG common unit, which vests
immediately upon issuance and is available to the holder upon termination or retirement from the board of directors of ourPVG’s general partner. At December 31, 2007, 13,396 deferred PVG common units were outstanding at a weighted average grant date fair value of $27.30. At December 31, 2008, 32,128 deferred PVG common units were outstanding at a weighted average grant date fair value of $23.40.
We granted 18,732 deferred PVG common units in 2008 at a weighted average grant date fair value of $20.61 per unit. We granted 13,396 deferred PVG common units in 2007 at a weighted average grant date fair value of $27.30 per unit. The fair value of the deferred PVG common units is calculated based on the grant-dategrant date unit price.
The following table summarizes activity for the most recent fiscal year with respect to deferred PVG common units awarded:
| | | | |
| | Deferred
PVG
Common
Units | | Weighted- Average
Grant Date
Fair Value |
| Balance at beginning of year | | | 32,128 | | | $ | 23.40 | |
| Granted and vested | | | 32,172 | | | | 13.28 | |
| Balance at end of year | | | 64,300 | | | $ | 18.34 | |
PVR Long-Term Incentive Plan
PVR’s general partner has adopted a long-term incentive plan. PVR’s long-term incentive plan permits the grant of awards to employees and directors of PVR’s general partner and employees of its affiliates who perform services for PVR. In January 2009, PVR’s general partner increased the number of common units permitted to be granted under the long-term incentive plan to 3,000,000 PVR common units. Awards under the PVR long-term incentive plan can be in the form of PVR common units, restricted PVR units, PVR unit options, phantom PVR units and deferred PVR common units. The PVR long-term incentive plan is administered by the compensation and benefits committee of the board of directors of PVR’s general partner.partner (the “PVR Committee”). PVR reimburses its general partner for payments made pursuant to the PVR long-term incentive plan. PVR recognizes compensation cost based on the fair value of the awards over the vesting period.
PVR recognizes compensation expense related to the granting of common units and deferred common units and the vesting of restricted units granted under PVR’s long-term incentive plan. PVR recognized a total of $4.8 million, $3.2 million $2.4 million and $1.9$2.4 million in the years ended December 31, 2009, 2008 2007 and 20062007 of compensation expense related to the granting of common units and deferred common units and the vesting of restricted units granted under the long-term incentive plan. Compensation expense is recorded on the general and administrative expense line on the Consolidated Statements of Income.
TABLE OF CONTENTS
PENN VIRGINIA CORPORATION AND SUBSIDIARIES
NOTES TO CONSOLIDATED FINANCIAL STATEMENTS
(in thousands, except per share amounts)
18. Share-Based Compensation – (continued)
PVR Common Units. PVR’s common units, which are granted to non-employee directors, vest immediately upon issuance. PVR’s general partner granted 1,871 common units at a weighted average grant-date fair value of $15.46 per unit to non-employee directors in 2009. PVR’s general partner granted 1,525 common units at a weighted average grant-dategrant date fair value of $20.27 per unit to non-employee directors in 2008. PVR’s general partner granted 1,183 common units at a weighted average grant-date fair value of $27.09 per unit to non-employee directors in 2007. PVR’s general partner granted 1,795 common units at a weighted average grant-date fair value of $26.01 per unit to non-employee directors in 2006. The fair value of the PVR common units is calculated based on the grant-date unit price.
Restricted PVR Units. Restricted PVR units vest upon terms established by the compensation and benefits committee of its general partner’s board of directors. In addition, all restricted PVR units will vest upon a change of control of PVR’s general partner or us. If a grantee’s employment with, or membership on the board of directors of, PVR’s general partner terminates for any reason, the grantee’s unvested restricted PVR units will be automatically forfeited unless, and to the extent that, the compensation and benefits committee provides otherwise. Distributions payable with respect to restricted PVR units may, in the compensation and benefits committee’s discretion, be paid directly to the grantee or held by PVR’s general partner and made subject to a risk of forfeiture during the applicable restriction period. Restricted PVR units generally vest over a three-year period, with one-third vesting in each year. The fair value of the restricted PVR units is calculated based on the grant-date unit price.
The following table summarizes the status of nonvested restricted PVR units as of December 31, 2008 and changes during the year then ended:
| | | | | | |
| | | Nonvested
Restricted
Units | | | Weighted
Average
Grant-Date
Fair Value |
Nonvested at January 1, 2008 | | 156,931 | | | $ | 27.40 |
Granted | | 138,251 | | | | 26.57 |
Vested | | (71,074 | ) | | | 27.27 |
Forfeit | | (2,253 | ) | | | 27.09 |
| | | | | | |
Nonvested at December 31, 2008 | | 221,855 | | | $ | 26.93 |
| | | | | | |
At December 31, 2008, PVR had $3.7 million of total unrecognized compensation cost related to nonvested restricted units. PVR expects to reimburse its general partner for that cost over a weighted-average period of 0.9 years. The total grant-date fair value of restricted units that vested in 2008, 2007 and 2006 was $1.9 million, $1.2 million and $2.2 million.
Deferred PVR Common Units. A portion of the compensation to the non-employee directors of PVR’s general partner is paid in deferred PVR common units. Each deferred PVR common unit represents one PVR common unit, which vests immediately upon issuance and is available to the holder upon termination or retirement from the board of directors of PVR’s general partner. PVR’s general partner granted 21,337
The following table summarizes the activity for the most recent fiscal year with respect to deferred PVR common units in 2008 at a weighted-average grant-date fair value of $23.85. PVR’s general partner granted 22,209 deferred PVR common units in 2007 at a weighted average grant-date fair value of $26.43. At December 31, 2008, 56,433 deferred PVR common units were outstanding at a weighted average grant-date fair value of $24.87. At December 31, 2007, 61,218 deferred PVR common units were outstanding at a weighted average grant-date fair value of $25.58. At December 31, 2006, 39,009 deferred PVR common units were outstanding at a weighted average grant-date fair value of $25.26 per PVR common unit. In 2008, 26,122 deferred PVR common units converted to PVR common units. The aggregate intrinsic value of deferred PVR common units converted to PVR common units in 2008 and 2006 was $0.7 million and $0.2 million. awarded:
| | | | |
| | Deferred
PVR
Common
Units | | Weighted-
Average
Grant Date
Fair Value |
| Balance at beginning of year | | | 63,569 | | | $ | 23.98 | |
| Granted and vested | | | 35,819 | | | | 15.62 | |
| Balance at end of year | | | 99,388 | | | $ | 20.97 | |
No deferred PVR common units converted to PVR common units in 2007.2009. The fair value of the deferred PVR common units is calculated based on the grant-dategrant date unit price.
22. Other Comprehensive Income
Comprehensive income represents changesRestricted PVR Units. Restricted PVR units vest upon terms established by the PVR Committee. In addition, all restricted PVR units will vest upon a change of control of PVR’s general partner or us. If a grantee’s employment with, or membership on the board of directors of, PVR’s general partner terminates for any reason, the grantee’s unvested restricted PVR units will be automatically forfeited unless, and to the extent that, the PVR Committee provides otherwise. Distributions payable with respect to restricted PVR units may, in shareholders’ equitythe PVR Committee’s discretion, be paid directly to the grantee or held by PVR’s general partner and made subject to a risk of forfeiture during the reportingapplicable restriction period. Restricted PVR units generally vest over a three-year period, including net income and charges directly to shareholders’ equity which are excluded from net income. with one-third vesting in each year.
The following table sets forthsummarizes the activity for the most recent fiscal year with respect to restricted PVR units awarded:
| | | | |
| | Nonvested
Restricted
PVR Units | | Weighted-
Average
Grant Date
Fair Value |
| Balance at beginning of year | | | 221,855 | | | $ | 26.93 | |
| Vested | | | (128,106 | ) | | | 27.19 | |
| Forfeited | | | (940 | ) | | | 26.36 | |
| Balance at end of year | | | 92,809 | | | $ | 26.57 | |
At December 31, 2009, PVR had $1.2 million of total unrecognized compensation cost related to nonvested restricted units. PVR expects to reimburse its general partner for that cost over a weighted-average period of 0.3 years. The total grant-date fair value of restricted units that vested in 2009, 2008 and 2007 was $3.5 million, $1.9 million and $1.2 million.
TABLE OF CONTENTS
PENN VIRGINIA CORPORATION AND SUBSIDIARIES
NOTES TO CONSOLIDATED FINANCIAL STATEMENTS
(in thousands, except per share amounts)
18. Share-Based Compensation – (continued)
PVR Phantom Units. A phantom PVR unit entitles the grantee to receive a common PVR unit upon the vesting of the phantom PVR unit, or in the discretion of the PVR Committee, the cash equivalent of the value of a common PVR unit. The PVR Committee determines the time period over which phantom units granted to employees and directors will vest. In addition, all phantom PVR units will vest upon a change of control of PVR’s partner or us. If a director’s membership on the board of directors of its general partner terminates for any reason, or an employee’s employment with PVR’s general partner and its affiliates terminates for any reason other than retirement after reaching age 62 and completing 10 years of consecutive service, the grantee’s phantom PVR units will be automatically forfeited unless, and to the extent, the PVR Committee provides otherwise. Phantom PVR units generally vest over a three-year period, with one-third vesting in each year. The PVR Committee, in its discretion, may grant tandem distribution equivalent rights with respect to phantom PVR units. A distribution equivalent right is a right to receive an amount in cash equal to, and 30 days after, the cash distributions made with respect to a common PVR unit during the period such phantom PVR unit is outstanding. Payments of distribution equivalent rights associated with units that are expected to vest are recorded as capital distributions; however, payments associated with PVR units that are not expected to vest are recorded as compensation expense.
The following table summarizes the status of PVR phantom units as of December 31, 2009 and changes during the year then ended:
| | | | |
| | Nonvested
Phantom
Units | | Weighted-
Average
Grant Date
Fair Value |
| Balance at beginning of year | | | — | | | $ | — | |
| Granted | | | 354,792 | | | | 11.59 | |
| Vested | | | (75,410 | ) | | | 11.59 | |
| Forfeited | | | (2,379 | ) | | | 11.59 | |
| Balance at end of year | | | 277,003 | | | $ | 11.59 | |
At December 31, 2009, PVR had $2.3 million of total unrecognized compensation cost related to nonvested phantom PVR units. The total grant-date fair value of phantom PVR units that vested on 2009 was $0.9 million.
19. Impairments
The following table summarizes impairment charges recorded during the periods presented:
| | | | | | |
| | Year Ended December 31, |
| | | 2009 | | 2008 | | 2007 |
| Oil and gas properties(1) | | $ | 4,932 | | | $ | 19,963 | | | $ | 2,586 | |
| Assets held for sale(2) | | | 97,400 | | | | — | | | | — | |
| Inventories | | | 4,083 | | | | — | | | | — | |
| Goodwill(3) | | | — | | | | 31,801 | | | | — | |
| Other | | | 1,511 | | | | — | | | | — | |
| | | $ | 107,926 | | | $ | 51,764 | | | $ | 2,586 | |
| (1) | Charges in 2009 relate to declines in spot and future oil and gas prices which reduced reserves on certain properties in the Mid-Continent region. Charges in 2008 relate to declines in spot and future oil and gas prices and declines in well performance which reduced reserves on certain properties in the |
TABLE OF CONTENTS
PENN VIRGINIA CORPORATION AND SUBSIDIARIES
NOTES TO CONSOLIDATED FINANCIAL STATEMENTS
(in thousands, except per share amounts)
19. Impairments – (continued)
| | Mid-Continent and Appalachian regions. Charges in 2007 relate to changes in estimates of reserve bases of fields on certain properties in Oklahoma and Texas due to declines in well performance. |
| (2) | Reflects an adjustment to fair value less costs to sell for oil and gas properties held for sale located in the Gulf Coast region (see Note 5). |
| (3) | Reflects the negative impact of declines in oil and gas spot and futures prices and a decline in PVR’s market capitalization which reduced to zero all goodwill recorded in conjunction with acquisitions made by the PVR natural gas midstream segment. |
20. Restructuring Activities
In November 2009, we implemented an organization restructuring that will result in the transfer of certain corporate and oil and gas accounting and administrative functions from our Kingsport, Tennessee office location to our Houston, Texas and Radnor, Pennsylvania locations. In addition, the restructuring will result in the relocation of our eastern region oil and gas divisional office from Kingsport to a new office in Pittsburgh, Pennsylvania. Approximately 30 employees will be terminated in connection with the restructuring plans. We expect to incur approximately $1.2 million in special termination benefit costs which will be paid to eligible employees upon the completion of various transition activities. Accordingly, these costs will be charged to operations ratably over the transition period which is anticipated to be completed in March 2010. In addition, we anticipate incurring approximately $1.2 million in relocation costs as well as $1.5 million in other incremental costs associated with expanding our other office locations.
The following table summarizes the cumulative obligation recognized and the charges incurred as of and for the year ended December 31, 2009:
| | |
| Balance at beginning of year | | $ | — | |
| Termination benefits accrued | | | 529 | |
| Cash payments | | | — | |
| Balance at end of year | | $ | 529 | |
21. Interest Expense
The following table summarizes the components of comprehensive incomeour total interest expense for the years ended December 31, 2008, 2007periods presented:
| | | | | | |
| | Year Ended December 31, |
| | | 2009 | | 2008 | | 2007 |
| Interest and accretion on borrowings and related fees | | $ | 65,203 | | | $ | 50,679 | | | $ | 42,624 | |
| Interest rate swaps | | | 7,220 | | | | 2,721 | | | | (737 | ) |
| Other | | | (996 | ) | | | (439 | ) | | | 488 | |
| Capitalized interest | | | (2,543 | ) | | | (3,662 | ) | | | (4,524 | ) |
| | | $ | 68,884 | | | $ | 49,299 | | | $ | 37,851 | |
TABLE OF CONTENTS
PENN VIRGINIA CORPORATION AND SUBSIDIARIES
NOTES TO CONSOLIDATED FINANCIAL STATEMENTS
(in thousands, except per share amounts)
22. Changes in Accounting Principle
Effective January 1, 2009, we adopted the new accounting standard which determines whether instruments granted in share-based payment transactions are participating securities. Under this standard, unvested share-based payment awards that contain non-forfeitable rights to dividends or dividend equivalents are participating securities and, 2006:
| | | | | | | | | | | | |
| | | Cash
Flow
Hedges | | | Other | | | Total | |
| | | (in thousands) | |
Hedging unrealized loss, net of tax of ($2,352) | | $ | (4,368 | ) | | $ | — | | | $ | (4,368 | ) |
Hedging reclassification adjustment, net of tax of $2,871 | | | 5,332 | | | | — | | | | 5,332 | |
Other, net of tax of $186 | | | — | | | | 346 | | | | 346 | |
| | | | | | | | | | | | |
Other comprehensive income for the year ended December 31, 2008 | | $ | 964 | | | $ | 346 | | | $ | 1,310 | |
| | | | | | | | | | | | |
| | | |
Hedging unrealized loss, net of tax of ($1,432) | | $ | (2,659 | ) | | $ | — | | | $ | (2,659 | ) |
Hedging reclassification adjustment, net of tax of $1,449 | | | 2,691 | | | | — | | | | 2,691 | |
Other, net of tax of ($8) | | | — | | | | (14 | ) | | | (14 | ) |
| | | | | | | | | | | | |
Other comprehensive income for the year ended December 31, 2007 | | $ | 32 | | | $ | (14 | ) | | $ | 18 | |
| | | | | | | | | | | | |
| | | |
Hedging unrealized loss, net of tax of $321 | | $ | 597 | | | $ | — | | | $ | 597 | |
Hedging reclassification adjustment, net of tax of $335 | | | 622 | | | | — | | | | 622 | |
Other, net of tax of ($10) | | | — | | | | (19 | ) | | | (19 | ) |
| | | | | | | | | | | | |
Other comprehensive income for the year ended December 31, 2006 | | $ | 1,219 | | | $ | (19 | ) | | $ | 1,200 | |
| | | | | | | | | | | | |
Includedtherefore, are included in the comprehensive income balance at December 31, 2008 is $1.2 million of losses relatingcomputing earnings per share pursuant to the PVR Interest Rate Swapstwo-class method. Under the two-class method, earnings per share are determined for each class of common stock and participating securities according to dividends or dividend equivalents and their respective participation rights in undistributed earnings. We have determined that our unvested phantom stock awards contain non-forfeitable rights to dividends and, therefore, are participating securities for purposes of this standard. Because the phantom stock awards do not participate in losses, they are antidilutive if we are in a loss position.
Effective January 1, 2009, we also adopted the new accounting standard regarding convertible debt instruments that may be settled in cash upon conversion, including partial cash settlement. Because the Convertible Notes can be settled wholly or partly in cash upon conversion into our common stock, this standard requires us to account separately for the liability and equity components in a manner that reflects our nonconvertible debt borrowing rate when measuring interest cost of the Convertible Notes. The value assigned to the liability component was the estimated value of a similar debt issuance without the conversion feature as of the issuance date in December 2007. Transaction costs associated with issuing the instrument were allocated to the liability and equity components in proportion to the allocation of the original proceeds and were accounted for as debt issuance costs and equity issuance costs. In addition, recognizing the Convertible Notes as two separate components resulted in a tax basis difference associated with the liability component that represents a temporary difference. Because the liability component was valued exclusive of the conversion feature, the Convertible Notes were recorded at a discount reflecting the below-market coupon interest rate. This discount is accreted through additional interest expense to par value over the remaining expected life of the debt ending in 2012.
We applied both new standards retroactively to all periods presented as required.
TABLE OF CONTENTS
PENN VIRGINIA CORPORATION AND SUBSIDIARIES
NOTES TO CONSOLIDATED FINANCIAL STATEMENTS
(in thousands, except per share amounts)
22. Changes in Accounting Principle – (continued)
The following tables reflect the effects of adopting the standard on which PVR discontinued hedge accounting. The $1.2 million loss will be recognized the relevant lines of our Consolidated Financial Statements for the periods presented:
| | | | | | |
| | As Originally
Reported | | As Adjusted | | Effects of
Change |
Consolidated Statements of Income
| | | | | | | | | | | | |
For the Year Ended December 31, 2008:
| | | | | | | | | | | | |
| Interest expense(1) | | $ | 44,261 | | | $ | 49,299 | | | $ | 5,038 | |
| Income tax expense (benefit)(2) | | | 73,874 | | | | 71,920 | | | | (1,954 | ) |
| Net income(3) | | | 184,604 | | | | 181,520 | | | | (3,084 | ) |
| Net income (loss) attributable to Penn Virginia Corporation | | | 124,168 | | | | 121,084 | | | | (3,084 | ) |
Earnings per share attributable to Penn Virginia Corporation:
| | | | | | | | | | | | |
| Basic | | $ | 2.97 | | | $ | 2.89 | | | $ | (0.08 | ) |
| Diluted | | $ | 2.95 | | | $ | 2.87 | | | $ | (0.08 | ) |
For the Year Ended December 31, 2007:
| | | | | | | | | | | | |
| Interest expense(1) | | $ | 37,419 | | | $ | 37,851 | | | $ | 432 | |
| Income tax expense (benefit)(2) | | | 30,501 | | | | 30,332 | | | | (169 | ) |
| Net income(3) | | | 81,073 | | | | 80,810 | | | | (263 | ) |
| Net income (loss) attributable to Penn Virginia Corporation | | | 50,754 | | | | 50,491 | | | | (263 | ) |
Earnings per share attributable to Penn Virginia Corporation:
| | | | | | | | | | | | |
| Basic | | $ | 1.33 | | | $ | 1.32 | | | $ | (0.01 | ) |
| Diluted | | $ | 1.32 | | | $ | 1.31 | | | $ | (0.01 | ) |
Consolidated Balance Sheet
| | | | | | | | | | | | |
As of December 31, 2008:
| | | | | | | | | | | | |
| Oil and gas properties(4) | | $ | 2,106,126 | | | $ | 2,107,128 | | | $ | 1,002 | |
| Other assets(5) | | | 46,674 | | | | 45,685 | | | | (989 | ) |
| Long-term debt(6) | | | 562,000 | | | | 531,896 | | | | (30,104 | ) |
| Deferred income taxes (noncurrent liability)(7) | | | 359,677 | | | | 371,925 | | | | 12,248 | |
| Paid-in capital(8) | | | 464,751 | | | | 485,967 | | | | 21,216 | |
| Retained earnings(9) | | | 446,993 | | | | 443,646 | | | | (3,347 | ) |
Consolidated Statements of Cash Flows
| | | | | | | | | | | | |
For the Year Ended December 31, 2008:
| | | | | | | | | | | | |
Cash flows from operating activities
| | | | | | | | | | | | |
| Net income (loss) | | $ | 184,604 | | | | 181,520 | | | $ | (3,084 | ) |
| Deferred income taxes | | | 60,505 | | | | 58,551 | | | | (1,954 | ) |
| Other noncash adjustments | | | 7,484 | | | | 12,522 | | | | 5,038 | |
For the Year Ended December 31, 2007:
| | | | | | | | | | | | |
Cash flows from operating activities
| | | | | | | | | | | | |
| Net income (loss) | | $ | 81,073 | | | | 80,810 | | | $ | (263 | ) |
| Deferred income taxes | | | 23,340 | | | | 23,171 | | | | (169 | ) |
| Other noncash adjustments | | | 4,961 | | | | 5,393 | | | | 432 | |
| (1) | Represents additional interest expense that would have been recorded related to the debt discount had the accounting guidance been in place when the Convertible Notes were issued. This increase is partially |
TABLE OF CONTENTS
PENN VIRGINIA CORPORATION AND SUBSIDIARIES
NOTES TO CONSOLIDATED FINANCIAL STATEMENTS
(in earnings through the end of 2011 as the hedged transactions settle. See Note 8, “Derivative Instruments.”
thousands, except per share amounts)22. Changes in Accounting Principle – (continued)
| | offset by changes in capitalized interest and the amortization of debt issuance costs, which resulted from the separation of the debt and equity components of the Convertible Notes. |
| (2) | The adjustment to income taxes is based on our effective tax rates. |
| (3) | Net income (loss) includes noncontrolling interests. |
| (4) | The impact on oil and gas properties is due to capitalized interest. |
| (5) | The adjustment to Other assets reflects a decrease in debt issuance costs. |
| (6) | The impact on Long-term debt is due to the unamortized discount balance of the Convertible Notes. |
| (7) | The impact on deferred income taxes is due to the change in the tax basis of the liability component. |
| (8) | The impact on paid-in capital balance is due to the equity component and related issuance costs as well as the change in deferred income taxes. |
| (9) | The impact on retained earnings is due to the additional interest expense net of tax as discussed in footnote 1 above. |
23. Commitments and Contingencies
Earnings per ShareRental Commitments
Operating lease rental expense in the years ended December 31, 2008, 2007 and 2006 was $22.8 million, $16.0 million and $10.0 million. The following table sets forth our consolidated minimum rental commitmentsprovides a reconciliation of the numerators and denominators used in the calculation of basic and diluted earnings per share for the next five years under all non-cancelable operating leases in effect at December 31, 2008:
periods presented: | | | |
Year | | Minimum
Rental
Commitments |
| | | (in thousands) |
2009 | | $ | 12,009 |
2010 | | | 6,136 |
2011 | | | 3,503 |
2012 | | | 2,189 |
2013 | | | 2,150 |
Thereafter | | | 8,591 |
| | | |
Total minimum payments | | $ | 34,578 |
| | | |
| | | | | | |
| | Year Ended December 31, |
| | | 2009 | | 2008(1) | | 2007(1) |
| Net income (loss) attributable to common shareholders | | $ | (114,643 | ) | | $ | 121,084 | | | $ | 50,491 | |
| Less: Portion of subsidiary net income allocated to undistributed share-based compensation awards, net of taxes | | | (116 | ) | | | (295 | ) | | | (186 | ) |
| | | $ | (114,759 | ) | | $ | 120,789 | | | $ | 50,305 | |
| Weighted-average shares, basic | | | 43,811 | | | | 41,760 | | | | 38,061 | |
| Effect of dilutive securities(2) | | | — | | | | 271 | | | | 297 | |
| Weighted-average shares, diluted | | | 43,811 | | | | 42,031 | | | | 38,358 | |
| Net income (loss) per common share, basic | | $ | (2.62 | ) | | $ | 2.89 | | | $ | 1.32 | |
| Net income (loss) per common share, diluted | | $ | (2.62 | ) | | $ | 2.87 | | | $ | 1.31 | |
Our rental commitments primarily relate to equipment and building leases and leases of coal reserve-based properties which PVR subleases, or intends to sublease, to third parties. The obligation with respect to leased properties which PVR subleases expires when the property has been mined to exhaustion or the lease has been canceled. The timing of mining by third party operators is difficult to estimate due to numerous factors. PVR believes that its future rental commitments with regard to this subleased property cannot be estimated with certainty.
Drilling Commitments
We have agreements to purchase oil and gas well drilling services from third parties with terms that range from two to three years. The agreements include early termination provisions that would require us to pay penalties if we terminate the agreements prior to the end of their original terms. The amount of penalty is based on the number of days remaining in the contractual term and declines as time passes. As of December 31, 2008, the penalty amount would have been $41.6 million if we had terminated our agreements on that date. Our management intends to utilize drilling services under these agreements for the full terms and has no plans to terminate the agreements early. The following table sets forth our obligation for drilling commitments in effect at December 31, 2008 for the next five years and thereafter:
| | | |
Year | | Drilling
Commitments |
2009 | | $ | 29,774 |
2010 | | | 17,056 |
2011 | | | 5,952 |
2012 | | | — |
2013 | | | — |
Thereafter | | | — |
| | | |
Total drilling commitments | | $ | 52,782 |
| | | |
Oil and Gas Segment Firm Transportation Commitments
In 2004, we entered into contracts which provide firm transportation capacity rights for specified volumes per day on a pipeline system with terms that ranged from one to 10 years. The contracts require us to pay transportation demand charges regardless of the amount of pipeline capacity we use. We may sell excess capacity to third parties at our discretion. The following table sets forth our obligation for firm transportation commitments in effect at December 31, 2008 for the next five years and thereafter:
| | | |
Year | | Firm
Transportation
Commitments |
2009 | | $ | 3,051 |
2010 | | | 2,986 |
2011 | | | 2,767 |
2012 | | | 2,771 |
2013 | | | 2,767 |
Thereafter | | | 17,678 |
| | | |
Total firm transportation commitments | | $ | 32,020 |
| | | |
PVR Natural Gas Midstream Segment Firm Transportation Commitments
As of December 31, 2008, PVR had contracts for firm transportation capacity rights for specified volumes per day on a pipeline system with terms that ranged from one to seven years. The contracts require PVR to pay transportation demand charges regardless of the amount of pipeline capacity PVR uses. PVR may sell excess capacity to third parties at its discretion. The following table sets forth PVR’s obligation for firm transportation commitments in effect at December 31, 2008 for the next five years and thereafter:
| | | |
Year | | Firm
Transportation
Commitments |
| | | (in thousands) |
2009 | | $ | 13,069 |
2010 | | | 6,168 |
2011 | | | 5,694 |
2012 | | | 4,508 |
2013 | | | 4,033 |
Thereafter | | | 3,321 |
| | | |
Total firm transportation commitments | | $ | 36,793 |
| | | |
Legal
We are involved, from time to time, in various legal proceedings arising in the ordinary course of business. While the ultimate results of these proceedings cannot be predicted with certainty, our management believes that these claims will not have a material effect on our financial position or results of operations.
Environmental Compliance
Extensive federal, state and local laws govern oil and natural gas operations, regulate the discharge of materials into the environment or otherwise relate to the protection of the environment. Numerous governmental departments issue rules and regulations to implement and enforce such laws that are often difficult and costly to comply with and which carry substantial administrative, civil and even criminal penalties for failure to comply. Some laws, rules and regulations relating to protection of the environment may, in certain circumstances, impose “strict liability” for environmental contamination, rendering a person liable for environmental and natural resource damages and cleanup costs without regard to negligence or fault on the part of such person. Other laws, rules and regulations may restrict the rate of oil and natural gas production below the rate that would otherwise exist or even prohibit exploration or production activities in sensitive areas. In addition, state laws often require some form of remedial action to prevent pollution from former operations, such as closure of inactive pits and plugging of abandoned wells. The regulatory burden on the oil and natural gas industry increases its cost of doing business and consequently affects its profitability. These laws, rules and regulations affect our operations, as well as the oil and gas exploration and production industry in general. We believe that we are in substantial compliance with current applicable environmental laws, rules and regulations and that continued compliance with existing requirements will not have a material adverse impact on us. Nevertheless, changes in existing environmental laws or the adoption of new environmental laws have the potential to adversely affect our operations.
PVR’s operations and those of its lessees are subject to environmental laws and regulations adopted by various governmental authorities in the jurisdictions in which these operations are conducted. The terms of PVR’s coal property
leases impose liability on the relevant lessees for all environmental and reclamation liabilities arising under those laws and regulations. The lessees are bonded and have indemnified PVR against any and all future environmental liabilities. PVR regularly visits its coal properties to monitor lessee compliance with environmental laws and regulations and to review mining activities. PVR’s management believes that its operations and those of its lessees comply with existing laws and regulations and does not expect any material impact on its financial condition or results of operations.
As of December 31, 2008 and 2007, PVR’s environmental liabilities were $1.2 million and $1.5 million, which represents PVR’s best estimate of the liabilities as of those dates related to its coal and natural resource management and natural gas midstream businesses. PVR has reclamation bonding requirements with respect to certain unleased and inactive properties. Given the uncertainty of when a reclamation area will meet regulatory standards, a change in this estimate could occur in the future.
Mine Health and Safety Laws
There are numerous mine health and safety laws and regulations applicable to the coal mining industry. However, since PVR does not operate any mines and does not employ any coal miners, PVR is not subject to such laws and regulations. Accordingly, we have not accrued any related liabilities.
| (1) | Adjusted for the adoption of changes in accounting principle with respect to earnings per share and convertible notes (see Note 22). |
| (2) | For 2009, approximately 0.1 million potentially dilutive securities, including the Convertible Notes, stock options, restricted stock and phantom stock had the effect of being anti-dilutive and were excluded from the calculation of diluted earnings per common share. |
24. Segment Information
Segment information has been prepared in accordance with SFAS No. 131,Disclosure about Segments of an Enterprise and Related Information.Under SFAS No. 131,Our operating segments are defined asrepresent components of an enterpriseour businesses about which separate financial information is available and is evaluated regularly by the chief operating decision maker, or decision-making group, in assessing performance. Our decision-making group consists of our Chief Executive Officer and other senior officers. This group routinely reviews and makes operating and resource allocation decisions among our oil and gas operations and PVR’s coal and natural resource management operations and PVR’s natural gas midstream operations. Accordingly, our reportable segments are as follows:
| • | Oil and Gas — crude oil and natural gas exploration, development and production. |
Oil and Gas—crude oil and natural gas exploration, development and production.TABLE OF CONTENTS
PVR Coal and Natural Resource Management—management and leasing of coal properties and subsequent collection of royalties; other land management activities such as selling standing timber; leasing of fee-based coal-related infrastructure facilities to certain lessees and end-user industrial plants; collection of oil and gas royalties; and coal transportation, or wheelage fees.
PVR Natural Gas Midstream—natural gas processing, gathering and other related services.
PENN VIRGINIA CORPORATION AND SUBSIDIARIES
NOTES TO CONSOLIDATED FINANCIAL STATEMENTS
(in thousands, except per share amounts)
24. Segment Information – (continued)
| • | PVR Coal and Natural Resource Management — PVR’s coal and natural resource management segment primarily involves the management and leasing of coal properties and the subsequent collection of royalties. Our coal reserves are primarily located in Kentucky, Virginia, West Virginia, Illinois and New Mexico. PVR also earns revenues from other land management activities, such as selling standing timber; leasing of fee-based coal-related infrastructure facilities to certain lessees and end-user industrial plants; collection of oil and gas royalties; and coal from transportation, or wheelage fees. |
| • | PVR Natural Gas Midstream — PVR’s natural gas midstream segment is engaged in providing natural gas processing, gathering and other related services. PVR owns and operates natural gas midstream assets located in Oklahoma and Texas. PVR’s natural gas midstream business derives revenues primarily from gas processing contracts with natural gas producers and from fees charged for natural gas volumes and providing other related services. In addition, PVR owns a 25% member interest in Thunder Creek, a joint venture that gathers and transports CBM in Wyoming’s Powder River Basin. PVR also owns a natural gas marketing business, which aggregates third-party volumes and sells those volumes into interstate pipeline systems and at market hubs accessed by various interstate pipelines. |
The following table presents a summary of certain financial information relating to our segments as of and for the years ended December 31, 2008, 2007 and 2006:
periods presented: | | | | | | | | | | | | | | | | | | | | | | | | |
| | | Revenues | | | Intersegment revenues (1) | |
| | | 2008 | | | 2007 | | | 2006 | | | 2008 | | | 2007 | | | 2006 | |
Oil and gas (2) | | $ | 471,479 | | | $ | 304,790 | | | $ | 236,238 | | | $ | (2,149 | ) | | $ | (1,549 | ) | | $ | (282 | ) |
Coal and natural resource (3) | | | 152,535 | | | | 110,847 | | | | 112,189 | | | | 792 | | | | 792 | | | | 792 | |
Natural gas midstream (4) | | | 595,884 | | | | 436,257 | | | | 404,628 | | | | 132,369 | | | | 1,549 | | | | 282 | |
Eliminations and other | | | 953 | | | | 1,056 | | | | 874 | | | | (131,012 | ) | | | (792 | ) | | | (792 | ) |
| | | | | | | | | | | | | | | | | | | | | | | | |
Consolidated totals | | $ | 1,220,851 | | | $ | 852,950 | | | $ | 753,929 | | | $ | — | | | $ | — | | | $ | — | |
| | | | | | | | | | | | | | | | | | | | | | | | |
| | |
| | | Operating income | | | DD&A expense | |
| | | 2008 | | | 2007 | | | 2006 | | | 2008 | | | 2007 | | | 2006 | |
Oil and gas | | $ | 170,576 | | | $ | 103,983 | | | $ | 84,833 | | | $ | 132,276 | | | $ | 87,223 | | | $ | 56,237 | |
Coal and natural resource | | | 96,296 | | | | 68,811 | | | | 73,444 | | | | 30,805 | | | | 22,690 | | | | 20,399 | |
Natural gas midstream | | | 18,946 | | | | 48,914 | | | | 29,376 | | | | 27,361 | | | | 18,822 | | | | 17,094 | |
Eliminations and other | | | (28,995 | ) | | | (29,084 | ) | | | (17,121 | ) | | | 1,794 | | | | 788 | | | | 487 | |
| | | | | | | | | | | | | | | | | | | | | | | | |
Consolidated totals | | $ | 256,823 | | | $ | 192,624 | | | $ | 170,532 | | | $ | 192,236 | | | $ | 129,523 | | | $ | 94,217 | |
| | | | | | | | | | | | | | | | | | | | | | | | |
Interest expense | | | (44,261 | ) | | | (37,419 | ) | | | (24,832 | ) | | | | | | | | | | | | |
Other | | | (666 | ) | | | 3,651 | | | | 3,718 | | | | | | | | | | | | | |
Derivatives | | | 46,582 | | | | (47,282 | ) | | | 19,497 | | | | | | | | | | | | | |
Minority interest | | | (60,436 | ) | | | (30,319 | ) | | | (43,018 | ) | | | | | | | | | | | | |
Income tax expense | | | (73,874 | ) | | | (30,501 | ) | | | (49,988 | ) | | | | | | | | | | | | |
| | | | | | | | | | | | | | | | | | | | | | | | |
Consolidated net income | | $ | 124,168 | | | $ | 50,754 | | | $ | 75,909 | | | | | | | | | | | | | |
| | | | | | | | | | | | | | | | | | | | | | | | |
| | |
| | | Additions to property and equipment | | | Total assets at December 31, | |
| | | 2008 | | | 2007 | | | 2006 | | | 2008 | | | 2007 | | | 2006 | |
Oil and gas | | $ | 607,220 | | | $ | 512,473 | | | $ | 331,551 | | | $ | 1,727,373 | | | $ | 1,287,359 | | | $ | 885,550 | |
Coal and natural resource (5) | | | 27,270 | | | | 177,960 | | | | 92,697 | | | | 600,418 | | | | 610,866 | | | | 409,709 | |
Natural gas midstream (6) | | | 304,758 | | | | 47,080 | | | | 37,015 | | | | 618,402 | | | | 320,413 | | | | 304,314 | |
Eliminations and other | | | (60,162 | ) | | | (24,003 | ) | | | 3,676 | | | | 50,359 | | | | 34,823 | | | | 33,576 | |
| | | | | | | | | | | | | | | | | | | | | | | | |
Consolidated totals | | $ | 879,086 | | | $ | 713,510 | | | $ | 464,939 | | | $ | 2,996,552 | | | $ | 2,253,461 | | | $ | 1,633,149 | |
| | | | | | | | | | | | | | | | | | | | | | | | |
| | | | | | | | | | | | |
| | Revenues | | Intersegment Revenues(1) |
| | | 2009 | | 2008 | | 2007 | | 2009 | | 2008 | | 2007 |
| Oil and gas(2) | | $ | 235,084 | | | $ | 471,479 | | | $ | 304,790 | | | $ | (1,152 | ) | | $ | (2,149 | ) | | $ | (1,549 | ) |
| Coal and natural resource(3) | | | 144,600 | | | | 152,535 | | | | 110,847 | | | | 791 | | | | 792 | | | | 792 | |
| Natural gas midstream(4) | | | 512,104 | | | | 595,884 | | | | 436,257 | | | | 76,773 | | | | 132,369 | | | | 1,549 | |
| Eliminations and other | | | (76,651 | ) | | | 953 | | | | 1,056 | | | | (76,412 | ) | | | (131,012 | ) | | | (792 | ) |
| | | $ | 815,137 | | | $ | 1,220,851 | | | $ | 852,950 | | | $ | — | | | $ | — | | | $ | — | |
| | | | | | | | | | | | |
| | Operating income (loss) | | DD&A expense |
| | | 2009 | | 2008 | | 2007 | | 2009 | | 2008 | | 2007 |
| Oil and gas(5) | | $ | (175,993 | ) | | $ | 170,576 | | | $ | 103,983 | | | $ | 150,429 | | | $ | 132,276 | | | $ | 87,223 | |
| Coal and natural resource(6) | | | 87,528 | | | | 96,296 | | | | 68,811 | | | | 31,330 | | | | 30,805 | | | | 22,690 | |
| Natural gas midstream(7) | | | 20,774 | | | | 18,946 | | | | 48,914 | | | | 38,905 | | | | 27,361 | | | | 18,822 | |
| Eliminations and other | | | (30,511 | ) | | | (28,995 | ) | | | (29,084 | ) | | | 2,703 | | | | 1,794 | | | | 788 | |
| | | $ | (98,202 | ) | | $ | 256,823 | | | $ | 192,624 | | | $ | 223,367 | | | $ | 192,236 | | | $ | 129,523 | |
| Interest expense | | | (68,884 | ) | | | (49,299 | ) | | | (37,851 | ) | | | | | | | | | | | | |
| Derivatives | | | 11,854 | | | | 46,582 | | | | (47,282 | ) | | | | | | | | | | | | |
| Other | | | 2,612 | | | | (666 | ) | | | 3,651 | | | | | | | | | | | | | |
| Income tax (expense) benefit | | | 75,252 | | | | (71,920 | ) | | | (30,332 | ) | | | | | | | | | | | | |
| Net income (loss) | | | (77,368 | ) | | | 181,520 | | | | 80,810 | | | | | | | | | | | | | |
| Less: Net income attributable to noncontrolling interests | | | (37,275 | ) | | | (60,436 | ) | | | (30,319 | ) | | | | | | | | | | | | |
| Income (loss) attributable to Penn Virginia Corporation | | $ | (114,643 | ) | | $ | 121,084 | | | $ | 50,491 | | | | | | | | | | | | | |
TABLE OF CONTENTS
PENN VIRGINIA CORPORATION AND SUBSIDIARIES
NOTES TO CONSOLIDATED FINANCIAL STATEMENTS
(in thousands, except per share amounts)
24. Segment Information – (continued)
| | | | | | | | | | | | |
| | Additions to property and equipment | | Total assets at December 31, |
| | | 2009 | | 2008 | | 2007 | | 2009 | | 2008 | | 2007 |
| Oil and gas | | $ | 203,678 | | | $ | 607,220 | | | $ | 512,473 | | | $ | 1,591,460 | | | $ | 1,727,373 | | | $ | 1,287,359 | |
| Coal and natural resource(8) | | | 2,252 | | | | 27,270 | | | | 177,960 | | | | 574,258 | | | | 600,418 | | | | 610,866 | |
| Natural gas midstream(9) | | | 78,425 | | | | 304,758 | | | | 47,080 | | | | 633,802 | | | | 618,402 | | | | 320,413 | |
| Eliminations and other | | | 1,998 | | | | (60,162 | ) | | | (24,003 | ) | | | 88,987 | | | | 50,359 | | | | 34,823 | |
| | | $ | 286,353 | | | $ | 879,086 | | | $ | 713,510 | | | $ | 2,888,507 | | | $ | 2,996,552 | | | $ | 2,253,461 | |
| (1) | Intersegment revenues represent gas gathering and processing transactions between the PVR natural gas midstream segment and the oil and gas segment. Intersegment revenues also represent agent fees paid by the oil and gas segment to the PVR natural gas midstream segment for marketing certain natural gas production and rail car rental fees paid by a corporate affiliate to the PVR coal and natural resource management segment. |
| (2) | Oil and gas segment revenues for the year ended December 31, 2007 excludes $31.0 million of gain related to the sale of royalty interests to PVR. See Note 4 – “Acquisitions and Divestitures.” |
| (3) | The PVR coal and natural resource management segment’s revenues for the years ended December 31, 2009, 2008 and 2007 and 2006 include $1.8$1.7 million, $1.8 million and $1.3$1.8 million of equity earnings related to PVR’s 50% interest in Coal Handling Solutions LLC. |
| (4) | The PVR natural gas midstream segment’s revenues for the yearyears ended December 31, 20082009 and 208 include $5.3 million and $2.4 million of equity earnings related to PVR’s 25% member interest in Thunder Creek that PVR acquired in 2008 for $51.6 million. See Note 4 – “Acquisitions and Divestitures,”5 for a further description of this acquisition. |
| (5) | Oil and gas segment’s operating income for the years ended December 31, 2009, 2008 and 2007 includes impairments of oil and gas properties and other assets for $106.4 million, $20.0 million and $2.6 million, respectively. See Note 19. |
| (6) | The PVR coal and natural gas midstream segment’s operating income for the year ended December 31, 2009 includes an intangible asset impairment of $1.5 million. |
| (7) | The PVR natural gas midstream segment’s operating income for the year ended December 31, 2008 includes an impairment of goodwill for $31.8 million. See Notes 5 and 19. |
| (8) | Total assets atas of December 31, 2009, 2008 2007 and 20062007 for the PVR coal and natural resource management segment included equity investmentinvestments of $21.0 million, $23.4 million $25.6 million and $25.3$25.6 million related to PVR’s 50% interest in Coal Handling Solutions, LLC. |
(6) | (9) | Total assets atas of December 31, 2009 and 2008 for the PVR natural gas midstream segment included equity investmentinvestments of $59.8 million and $55.0 million related to PVR’s 25% member interest in Thunder Creek that PVR acquired in 2008. See Note 4 – “Acquisitions and Divestitures,” for a further description of this acquisition. Total assets atas of December 31, 2007 and 2006 for the PVR natural gas midstream segment included goodwill of $7.7 million. The PVR natural gas midstream segment had no goodwill balance remaining in total assets at December 31, 2008, due to $31.8 million of losses on the impairment of goodwill. See Note 12, “Goodwill.” |
Operating income is equal to total revenues less cost of midstream gas purchased, operating costs and expenses and DD&A expenses. Operating income does not include certain other income items, interest expense, interest income and income taxes. Identifiable assets are those assets used in our operations in each segment.
For the year ended December 31, 2009, one third-party customer of the PVR natural gas midstream segment accounted for $109.5 million, or 13%, of our total consolidated net revenues, and two third-party customers of our oil and gas segment accounted for $58.2 million, or 7% of our total consolidated net revenues. For the year ended December 31, 2008, two third-partythird party customers of the PVR natural gas midstream segment accounted for $288.7 million, or 24%, of our total consolidated net revenues, and two third-party customersrevenues. For the year ended December 31, 2007, one customer of our oil andthe PVR natural gas midstream segment accounted for $142.3$109.2 million, or 11%13%, of our total consolidated net revenues. These customer concentrations may impact our
TABLE OF CONTENTS
PENN VIRGINIA CORPORATION AND SUBSIDIARIES
NOTES TO CONSOLIDATED FINANCIAL STATEMENTS
(in thousands, except per share amounts)
24. Segment Information – (continued)
results of operations, either positively or negatively, in that these counterparties may be similarly affected by changes in economic or other conditions. We are not aware of any financial difficulties experienced by these customers.
Intercompany railcar rental revenues were $0.8 million infor each of the years 2009, 2008 and 2007, respectively, and are included in the PVR coal and natural resource management segment. The offsetting railcar rental expense and the elimination of the revenue and expense are included in the corporate and other column of the preceding table. In
The oil and gas segment and the PVR natural gas midstream segment are parties to a Master Services Agreement effective September 1, 2006. Pursuant to the Master Services Agreement, PVR’s natural gas midstream segment will market all of the oil and gas segment’s oil and gas production in Arkansas, Louisiana, Oklahoma and Texas for a fee equal to 1% of the net sales price (subject to specified limitations) received by the oil and gas segment for such production. The Master Services Agreement has a primary term of five years and automatically renews for additional one-year terms until terminated by either party. Under the Master Services Agreement, the oil and gas segment paid fees to the PVR natural gas midstream of $1.4 million, $3.0 million and $2.2 million for the years ended December 31, 2009, 2008 and 2007.
The PVR natural gas midstream segment and the oil and gas segment are parties to a natural Gas Gathering and Processing Agreement effective April 1, 2007. Pursuant to the Gas Gathering and Processing Agreement, the oil and gas segment and the PVR natural gas midstream segment have agreed that the PVR natural gas midstream segment will gather and process all of the oil and gas segment’s current and future gas production in certain areas of the Bethany Field in East Texas and redeliver the NGLs to oil and gas segment for a $0.30/MMBtu service fee (with an annual CPI adjustment). The Gas Gathering and Processing Agreement has a primary term of 15 years and automatically renews for additional one year terms until terminated by either party. The PVR natural gas midstream segment began gathering and processing the oil and gas segment’s gas in June 2008. For the years ended December 31, 2009 and 2008, the oil and gas segment paid $3.0the PVR natural gas midstream segment $4.0 million and $2.3 million in fees pursuant to the Gas Gathering and Processing Agreement.
From time to time, the oil and gas segment sells gas or NGLs to the PVR natural gas midstream segment for marketing a portion ofat its Crossroads Plant, the oil and gas segment’s natural gas production.
The PVR natural gas midstream segment gatheredtransports them to the marketing location, and processed the naturalthen resells such gas deliveredor NGLs to third parties. The sales price received by the oil and gas segment and then purchasedfrom the processedPVR natural gas andmidstream segment for such gas or NGLs equals the sales price received by the PVR natural gas midstream segment for such gas or NGLs from the third parties. For the years ended December 31, 2009 and 2008, the oil and gas segment forreceived $72.5 million and $127.9 million to sell to third parties. Infrom the PVR natural gas midstream segment in connection with such sales. For the years ended December 31, 2009 and 2008, the PVR natural gas midstream segment recorded $72.5 million and $127.9 million of natural gas midstream revenue and $127.9 millionthe same amounts for the cost of midstream gas purchased related to the purchase of natural gas from PVOG LPthe oil and gas segment and the subsequent sale of that gas to third parties. The PVR does not takenatural gas midstream segment takes title to the gas prior to transporting it to third parties. These transactions do not impact the gross margin, nor do they impact operating income.
Forincome other than the year ended December 31, 2007, one customer of the PVR natural gas midstream segment accounted for $109.2 million, or 13%, of our total consolidated net revenues. Intercompany railcar rental revenues were $0.8 million in 2007 and are includedfee collected earlier in the PVR coalprocess.
25. Condensed Consolidating Financial Information of Guarantor Subsidiaries
The Senior Notes are fully and natural resource management segment. The offsetting railcar rental expenseunconditionally and the elimination of the revenuejoint and expense are included in the corporate and other column of the preceding table. In 2007, theseverally guaranteed by our oil and gas segment paid $2.2 millionsubsidiaries (collectively, the “Guarantor Subsidiaries”). The primary non-guarantor subsidiaries are PVG and PVR (collectively, the “Non-guarantor Subsidiaries”). As such, the Company is subject to the PVR natural gas midstream segment for marketing a portionrequirements Rule 3-10(f) of Regulation S-X of the oilSecurities and gas segment’s natural gas production.Exchange Commission regarding financial statements of guarantors and issuers of registered guaranteed securities.
ForTABLE OF CONTENTS
PENN VIRGINIA CORPORATION AND SUBSIDIARIES
NOTES TO CONSOLIDATED FINANCIAL STATEMENTS
(in thousands, except per share amounts)
25. Condensed Consolidating Financial Information of Guarantor Subsidiaries – (continued)
The condensed consolidating financial information below present the year ended December 31, 2006, one customerfinancial position, results of operations and cash flows of the PVR natural gas midstream segment accounted for $129.1 million, or 17%,Company, the Guarantor Subsidiaries and Non-guarantor Subsidiaries:
Balance Sheets
| | | | | | | | | | |
| | As of December 31, 2009 |
| | | Penn Virginia
Corporation | | Guarantor
Subsidiaries | | Non-guarantor
Subsidiaries | | Eliminations | | Consolidated |
| | | (in thousands) |
Assets
| | | | | | | | | | | | | | | | | | | | |
| Cash and cash equivalents | | $ | 76,074 | | | $ | 2,943 | | | $ | 19,314 | | | $ | — | | | $ | 98,331 | |
| Accounts receivable | | | — | | | | 42,378 | | | | 82,426 | | | | — | | | | 124,804 | |
| Inventory | | | — | | | | 10,372 | | | | 1,832 | | | | — | | | | 12,204 | |
| Assets held for sale | | | — | | | | 38,282 | | | | — | | | | — | | | | 38,282 | |
| Other current assets | | | 3,311 | | | | 16,510 | | | | 10,124 | | | | (4,324 | ) | | | 25,621 | |
| Total current assets | | | 79,385 | | | | 110,485 | | | | 113,696 | | | | (4,324 | ) | | | 299,242 | |
| Property and equipment, net | | | 6,314 | | | | 1,473,034 | | | | 900,948 | | | | (27,938 | ) | | | 2,352,358 | |
| Investments in affiliates (equity method) | | | 1,346,659 | | | | 89,992 | | | | — | | | | (1,436,651 | ) | | | — | |
| Other assets | | | 22,785 | | | | 7,874 | | | | 210,438 | | | | (4,190 | ) | | | 236,907 | |
| Total assets | | $ | 1,455,143 | | | $ | 1,681,385 | | | $ | 1,225,082 | | | $ | (1,473,103 | ) | | $ | 2,888,507 | |
Liabilities and shareholders’ equity
| | | | | | | | | | | | | | | | | | | | |
| Accounts payable and accrued liabilities | | $ | 8,909 | | | $ | 55,278 | | | $ | 73,201 | | | $ | — | | | $ | 137,388 | |
| Other current liabilities | | | — | | | | 9,220 | | | | 11,251 | | | | (4,324 | ) | | | 16,147 | |
| Total current liabilities | | | 8,909 | | | | 64,498 | | | | 84,452 | | | | (4,324 | ) | | | 153,535 | |
| Deferred income taxes | | | — | | | | 260,933 | | | | 71,495 | | | | (4,190 | ) | | | 328,238 | |
| Long-term debt of PVR | | | — | | | | — | | | | 620,100 | | | | — | | | | 620,100 | |
| Long-term debt of the Company | | | 498,427 | | | | — | | | | — | | | | — | | | | 498,427 | |
| Other long-term liabilities | | | 11,781 | | | | 9,295 | | | | 29,132 | | | | — | | | | 50,208 | |
| Penn Virginia Corporation’s equity | | | 936,026 | | | | 1,346,659 | | | | 89,992 | | | | (1,464,589 | ) | | | 908,088 | |
| Noncontrolling interests in subsidiaries | | | — | | | | — | | | | 329,911 | | | | — | | | | 329,911 | |
| Total liabilities and shareholders’ equity | | $ | 1,455,143 | | | $ | 1,681,385 | | | $ | 1,225,082 | | | $ | (1,473,103 | ) | | $ | 2,888,507 | |
TABLE OF CONTENTS
PENN VIRGINIA CORPORATION AND SUBSIDIARIES
NOTES TO CONSOLIDATED FINANCIAL STATEMENTS
(in thousands, except per share amounts)
25. Condensed Consolidating Financial Information of our total consolidated net revenues. Intercompany railcar rental revenues were $0.8 million Guarantor Subsidiaries – (continued)
Balance Sheets
| | | | | | | | | | |
| | As of December 31, 2008 |
| | | Penn Virginia
Corporation | | Guarantor
Subsidiaries | | Non-guarantor
Subsidiaries | | Eliminations | | Consolidated |
| | | (in thousands) |
Assets
| | | | | | | | | | | | | | | | | | | | |
| Cash and cash equivalents | | $ | — | | | $ | — | | | $ | 18,338 | | | $ | — | | | $ | 18,338 | |
| Accounts receivable | | | — | | | | 75,962 | | | | 73,279 | | | | — | | | | 149,241 | |
| Inventory | | | — | | | | 16,595 | | | | 1,873 | | | | — | | | | 18,468 | |
| Other current assets | | | 37,455 | | | | 7,241 | | | | 32,823 | | | | (48 | ) | | | 77,471 | |
| Total current assets | | | 37,455 | | | | 99,798 | | | | 126,313 | | | | (48 | ) | | | 263,518 | |
| Property and equipment, net | | | 8,255 | | | | 1,637,832 | | | | 895,247 | | | | (29,157 | ) | | | 2,512,177 | |
| Investments in affiliates (equity method) | | | 1,574,758 | | | | 268,314 | | | | — | | | | (1,843,072 | ) | | | — | |
| Other assets | | | 32,857 | | | | 49 | | | | 237,065 | | | | (49,101 | ) | | | 220,870 | |
| Total assets | | $ | 1,653,325 | | | $ | 2,005,993 | | | $ | 1,258,625 | | | $ | (1,921,378 | ) | | $ | 2,996,565 | |
Liabilities and shareholders’ equity
| | | | | | | | | | | | | | | | | | | | |
| Current maturities of long-term debt | | $ | 7,542 | | | $ | — | | | $ | — | | | $ | — | | | $ | 7,542 | |
| Accounts payable and accrued liabilities | | | 8,294 | | | | 129,190 | | | | 69,418 | | | | — | | | | 206,902 | |
| Other current liabilities | | | 15,032 | | | | — | | | | 18,166 | | | | (48 | ) | | | 33,150 | |
| Total current liabilities | | | 30,868 | | | | 129,190 | | | | 87,584 | | | | (48 | ) | | | 247,594 | |
| Deferred income taxes | | | 11,868 | | | | 409,158 | | | | — | | | | (49,101 | ) | | | 371,925 | |
| Long-term debt of PVR | | | — | | | | — | | | | 568,100 | | | | — | | | | 568,100 | |
| Long-term debt of the Company | | | 531,896 | | | | — | | | | — | | | | — | | | | 531,896 | |
| Other long-term liabilities | | | 10,433 | | | | 6,775 | | | | 37,400 | | | | — | | | | 54,608 | |
| Penn Virginia Corporation’s equity | | | 1,068,260 | | | | 1,460,870 | | | | 268,314 | | | | (1,872,229 | ) | | | 925,215 | |
| Noncontrolling interests in subsidiaries | | | — | | | | — | | | | 297,227 | | | | — | | | | 297,227 | |
| Total liabilities and shareholders’ equity | | $ | 1,653,325 | | | $ | 2,005,993 | | | $ | 1,258,625 | | | $ | (1,921,378 | ) | | $ | 2,996,565 | |
TABLE OF CONTENTS
PENN VIRGINIA CORPORATION AND SUBSIDIARIES
NOTES TO CONSOLIDATED FINANCIAL STATEMENTS
(in 2006 and are included thousands, except per share amounts)
25. Condensed Consolidating Financial Information of Guarantor Subsidiaries – (continued)
Income Statements
| | | | | | | | | | |
| | Year Ended December 31, 2009 |
| | | Penn Virginia
Corporation | | Guarantor
Subsidiaries | | Non-guarantor
Subsidiaries | | Eliminations | | Consolidated |
| | | (in thousands) |
| Revenues | | $ | — | | | $ | 235,084 | | | $ | 656,826 | | | $ | (76,773 | ) | | $ | 815,137 | |
| Cost of midstream gas purchased | | | — | | | | — | | | | 406,583 | | | | (72,729 | ) | | | 333,854 | |
| Operating | | | — | | | | 55,699 | | | | 35,111 | | | | (4,044 | ) | | | 86,766 | |
| Exploration | | | — | | | | 57,754 | | | | — | | | | — | | | | 57,754 | |
| Taxes other than income | | | 736 | | | | 16,556 | | | | 4,781 | | | | — | | | | 22,073 | |
| General and administrative | | | 24,784 | | | | 22,625 | | | | 32,591 | | | | — | | | | 80,000 | |
| Depreciation, depletion and amortization | | | 3,899 | | | | 150,429 | | | | 70,258 | | | | (1,219 | ) | | | 223,367 | |
| Impairments | | | — | | | | 106,415 | | | | 1,511 | | | | — | | | | 107,926 | |
| Loss on sale of assets | | | — | | | | 1,599 | | | | — | | | | — | | | | 1,599 | |
| Operating expenses | | | 29,419 | | | | 411,077 | | | | 550,835 | | | | (77,992 | ) | | | 913,339 | |
| Operating income | | | (29,419 | ) | | | (175,993 | ) | | | 105,991 | | | | 1,219 | | | | (98,202 | ) |
| Equity in earnings of subsidiaries | | | (93,753 | ) | | | 15,282 | | | | — | | | | 78,471 | | | | — | |
| Interest expense and other | | | (45,752 | ) | | | 2,780 | | | | (23,300 | ) | | | — | | | | (66,272 | ) |
| Derivatives | | | 36,240 | | | | (4,672 | ) | | | (19,714 | ) | | | — | | | | 11,854 | |
| Income (loss) before income taxes and noncontrolling interests | | | (132,684 | ) | | | (162,603 | ) | | | 62,977 | | | | 79,690 | | | | (152,620 | ) |
| Income tax benefit (expense) | | | 16,822 | | | | 68,850 | | | | (10,420 | ) | | | — | | | | 75,252 | |
| Net income (loss) | | | (115,862 | ) | | | (93,753 | ) | | | 52,557 | | | | 79,690 | | | | (77,368 | ) |
| Less net income attributable to noncontrolling interests | | | — | | | | — | | | | (37,275 | ) | | | — | | | | (37,275 | ) |
| Net income (loss) attributable to Penn Virginia Corporation | | $ | (115,862 | ) | | $ | (93,753 | ) | | $ | 15,282 | | | $ | 79,690 | | | $ | (114,643 | ) |
TABLE OF CONTENTS
PENN VIRGINIA CORPORATION AND SUBSIDIARIES
NOTES TO CONSOLIDATED FINANCIAL STATEMENTS
(in the PVR coal and natural resource management segment. The offsetting railcar rental expense and the eliminationthousands, except per share amounts)
25. Condensed Consolidating Financial Information of the revenue and expense are included Guarantor Subsidiaries – (continued)
Income Statements
| | | | | | | | | | |
| | Year Ended December 31, 2008 |
| | | Penn Virginia
Corporation | | Guarantor
Subsidiaries | | Non-guarantor
Subsidiaries | | Eliminations | | Consolidated |
| | | (in thousands) |
| Revenues | | $ | 3 | | | $ | 469,330 | | | $ | 881,737 | | | $ | (130,219 | ) | | $ | 1,220,851 | |
| Cost of midstream gas purchased | | | — | | | | — | | | | 612,530 | | | | (127,909 | ) | | | 484,621 | |
| Operating | | | — | | | | 59,459 | | | | 32,744 | | | | (2,312 | ) | | | 89,891 | |
| Exploration | | | — | | | | 42,436 | | | | — | | | | — | | | | 42,436 | |
| Taxes other than income | | | 984 | | | | 23,336 | | | | 4,266 | | | | — | | | | 28,586 | |
| General and administrative | | | 24,210 | | | | 21,285 | | | | 28,999 | | | | — | | | | 74,494 | |
| Depreciation, depletion and amortization | | | 3,388 | | | | 132,276 | | | | 58,189 | | | | (1,617 | ) | | | 192,236 | |
| Impairments | | | — | | | | 19,963 | | | | 31,801 | | | | — | | | | 51,764 | |
| Operating expenses | | | 28,582 | | | | 298,755 | | | | 768,529 | | | | (131,838 | ) | | | 964,028 | |
| Operating income | | | (28,579 | ) | | | 170,575 | | | | 113,208 | | | | 1,619 | | | | 256,823 | |
| Equity in earnings of subsidiaries | | | 134,321 | | | | 28,259 | | | | — | | | | (162,580 | ) | | | — | |
| Interest expense and other | | | (18,348 | ) | | | — | | | | (26,579 | ) | | | — | | | | (44,927 | ) |
| Derivatives | | | 29,745 | | | | — | | | | 16,837 | | | | — | | | | 46,582 | |
| Income (loss) before income taxes and noncontrolling interests | | | 117,139 | | | | 198,834 | | | | 103,466 | | | | (160,961 | ) | | | 258,478 | |
| Income tax benefit (expense) | | | 5,411 | | | | (64,513 | ) | | | (14,771 | ) | | | (1 | ) | | | (73,874 | ) |
| Net income (loss) | | | 122,550 | | | | 134,321 | | | | 88,695 | | | | (160,962 | ) | | | 184,604 | |
| Less net income attributable to noncontrolling interests | | | — | | | | — | | | | (60,436 | ) | | | — | | | | (60,436 | ) |
| Net income (loss) attributable to Penn Virginia Corporation | | $ | 122,550 | | | $ | 134,321 | | | $ | 28,259 | | | $ | (160,962 | ) | | $ | 124,168 | |
TABLE OF CONTENTS
PENN VIRGINIA CORPORATION AND SUBSIDIARIES
NOTES TO CONSOLIDATED FINANCIAL STATEMENTS
(in the corporate and other columnthousands, except per share amounts)
25. Condensed Consolidating Financial Information of the preceding table. In 2006, the oil and gas segment paid $0.4 million to the PVR natural gas midstream segment for marketing a portionGuarantor Subsidiaries – (continued)
Income Statements
| | | | | | | | | | |
| | Year Ended December 31, 2007 |
| | | Penn Virginia
Corporation | | Guarantor
Subsidiaries | | Non-guarantor
Subsidiaries | | Eliminations | | Consolidated |
| | | (in thousands) |
| Revenues | | $ | (305 | ) | | $ | 334,521 | | | $ | 549,734 | | | $ | (31,000 | ) | | $ | 852,950 | |
| Cost of midstream gas purchased | | | — | | | | — | | | | 343,293 | | | | — | | | | 343,293 | |
| Operating | | | — | | | | 46,713 | | | | 20,897 | | | | — | | | | 67,610 | |
| Exploration | | | — | | | | 28,608 | | | | — | | | | — | | | | 28,608 | |
| Taxes other than income | | | 780 | | | | 17,847 | | | | 3,096 | | | | — | | | | 21,723 | |
| General and administrative | | | 25,282 | | | | 16,283 | | | | 25,418 | | | | — | | | | 66,983 | |
| Depreciation, depletion and amortization | | | 985 | | | | 87,223 | | | | 41,541 | | | | (226 | ) | | | 129,523 | |
| Impairments | | | — | | | | 2,586 | | | | — | | | | — | | | | 2,586 | |
| Operating expenses | | | 27,047 | | | | 199,260 | | | | 434,245 | | | | (226 | ) | | | 660,326 | |
| Operating income | | | (27,352 | ) | | | 135,261 | | | | 115,489 | | | | (30,774 | ) | | | 192,624 | |
| Equity in earnings of subsidiaries | | | 111,729 | | | | 27,942 | | | | — | | | | (139,671 | ) | | | — | |
| Interest expense and other | | | (20,271 | ) | | | 13 | | | | (13,510 | ) | | | — | | | | (33,768 | ) |
| Derivatives | | | (1,715 | ) | | | — | | | | (45,567 | ) | | | — | | | | (47,282 | ) |
| Income (loss) before income taxes and noncontrolling interests | | | 62,391 | | | | 163,216 | | | | 56,412 | | | | (170,445 | ) | | | 111,574 | |
| Income tax benefit (expense) | | | 19,137 | | | | (51,487 | ) | | | 1,849 | | | | — | | | | (30,501 | ) |
| Net income (loss) | | | 81,528 | | | | 111,729 | | | | 58,261 | | | | (170,445 | ) | | | 81,073 | |
| Less net income attributable to noncontrolling interests | | | — | | | | — | | | | (30,319 | ) | | | — | | | | (30,319 | ) |
| Net income (loss) attributable to Penn Virginia Corporation | | $ | 81,528 | | | $ | 111,729 | | | $ | 27,942 | | | $ | (170,445 | ) | | $ | 50,754 | |
TABLE OF CONTENTS
PENN VIRGINIA CORPORATION AND SUBSIDIARIES
NOTES TO CONSOLIDATED FINANCIAL STATEMENTS
(in thousands, except per share amounts)
25. Condensed Consolidating Financial Information of the oil and gas segment’s natural gas production. The marketing agreement was effective September 1, 2006.Guarantor Subsidiaries – (continued)
Statements of Cash Flows
| | | | | | | | | | |
| | Year Ended December 31, 2009 |
| | | Penn Virginia
Corporation | | Guarantor
Subsidiaries | | Non-guarantor
Subsidiaries | | Eliminations | | Consolidated |
| | | (in thousands) |
| Net cash provided by (used in) operating activities | | $ | (15,213 | ) | | $ | 132,946 | | | $ | 158,214 | | | $ | — | | | $ | 275,947 | |
Cash flows provided by (used in) investing activities:
| | | | | | | | | | | | | | | | | | | | |
| Investment in (distributions from) affiliates | | | 101,778 | | | | 160,359 | | | | — | | | | (262,137 | ) | | | — | |
| Additions to property and equipment | | | (1,998 | ) | | | (203,678 | ) | | | (80,677 | ) | | | — | | | | (286,353 | ) |
| Proceeds from the sale of assets and other | | | — | | | | 15,094 | | | | 1,147 | | | | — | | | | 16,241 | |
| Cash flows provided by (used in) investing activities | | | 99,780 | | | | (28,225 | ) | | | (79,530 | ) | | | (262,137 | ) | | | (270,112 | ) |
Cash flows provided by (used in) financing activities:
| | | | | | | | | | | | | | | | | | | | |
| Distributions paid to noncontrolling interest holders | | | — | | | | — | | | | (78,171 | ) | | | — | | | | (78,171 | ) |
| Net proceeds from (repayments of) borrowings | | | (339,542 | ) | | | — | | | | 52,000 | | | | — | | | | (287,542 | ) |
| Net proceeds from issuance of senior notes | | | 291,009 | | | | — | | | | — | | | | — | | | | 291,009 | |
| Net proceeds from the sale of PVG units | | | — | | | | — | | | | 118,080 | | | | — | | | | 118,080 | |
| Net proceeds from issuance of equity | | | 64,835 | | | | — | | | | — | | | | — | | | | 64,835 | |
| Capital contributions from (distributions to) affiliates | | | — | | | | (101,778 | ) | | | (160,359 | ) | | | 262,137 | | | | — | |
| Other | | | (24,795 | ) | | | — | | | | (9,258 | ) | | | — | | | | (34,053 | ) |
| Cash flows provided by (used in) financing activities | | | (8,493 | ) | | | (101,778 | ) | | | (77,708 | ) | | | 262,137 | | | | 74,158 | |
| Net decrease in cash and cash equivalents | | | 76,074 | | | | 2,943 | | | | 976 | | | | — | | | | 79,993 | |
| Cash and Cash equivalents – beginning of period | | | — | | | | — | | | | 18,338 | | | | — | | | | 18,338 | |
Cash and Cash equivalents –
end of period | | $ | 76,074 | | | $ | 2,943 | | | $ | 19,314 | | | $ | — | | | $ | 98,331 | |
TABLE OF CONTENTS
PENN VIRGINIA CORPORATION AND SUBSIDIARIES
NOTES TO CONSOLIDATED FINANCIAL STATEMENTS
(in thousands, except per share amounts)
25. Condensed Consolidating Financial Information of Guarantor Subsidiaries – (continued)
Statements of Cash Flows
| | | | | | | | | | |
| | Year Ended December 31, 2008 |
| | | Penn Virginia
Corporation | | Guarantor
Subsidiaries | | Non-guarantor
Subsidiaries | | Eliminations | | Consolidated |
| | | (in thousands) |
| Net cash provided by operating activities | | $ | (4,813 | ) | | $ | 313,139 | | | $ | 75,448 | | | $ | — | | | $ | 383,774 | |
Cash flows provided by (used in) investing activities:
| | | | | | | | | | | | | | | | | | | | |
| Investment in (distributions from) affiliates | | | (217,542 | ) | | | 44,018 | | | | — | | | | 173,524 | | | | — | |
| Additions to property and equipment | | | (1,588 | ) | | | (607,220 | ) | | | (270,278 | ) | | | — | | | | (879,086 | ) |
| Proceeds from the sale of assets and other | | | — | | | | 32,521 | | | | 998 | | | | — | | | | 33,519 | |
| Cash flows provided by (used in) investing activities | | | (219,130 | ) | | | (530,681 | ) | | | (269,280 | ) | | | 173,524 | | | | (845,567 | ) |
Cash flows provided by (used in) financing activities:
| | | | | | | | | | | | | | | | | | | | |
| Distributions paid to noncontrolling interest holders | | | — | | | | — | | | | (64,245 | ) | | | — | | | | (64,245 | ) |
| Net proceeds from (repayments of) borrowings | | | 210,000 | | | | — | | | | — | | | | — | | | | 210,000 | |
| Net proceeds from issuance of PVR units | | | — | | | | — | | | | 138,141 | | | | — | | | | 138,141 | |
| Net proceeds from PVR long-term debt | | | — | | | | — | | | | 156,000 | | | | — | | | | 156,000 | |
| Capital contributions from (distributions to) affiliates | | | — | | | | 217,542 | | | | (44,018 | ) | | | (173,524 | ) | | | — | |
| Other | | | 9,908 | | | | — | | | | (4,200 | ) | | | — | | | | 5,708 | |
| Cash flows provided by (used in) financing activities | | | 219,908 | | | | 217,542 | | | | 181,678 | | | | (173,524 | ) | | | 445,604 | |
| Net increase (decrease) in cash and cash equivalents | | | (4,035 | ) | | | — | | | | (12,154 | ) | | | — | | | | (16,189 | ) |
| Cash and Cash equivalents – beginning of period | | | 4,035 | | | | — | | | | 30,492 | | | | — | | | | 34,527 | |
Cash and Cash equivalents –
end of period | | $ | — | | | $ | — | | | $ | 18,338 | | | $ | — | | | $ | 18,338 | |
TABLE OF CONTENTS
PENN VIRGINIA CORPORATION AND SUBSIDIARIES
NOTES TO CONSOLIDATED FINANCIAL STATEMENTS
(in thousands, except per share amounts)
25. Condensed Consolidating Financial Information of Guarantor Subsidiaries – (continued)
Statements of Cash Flows
| | | | | | | | | | |
| | Year Ended December 31, 2007 |
| | | Penn Virginia
Corporation | | Guarantor
Subsidiaries | | Non-guarantor
Subsidiaries | | Eliminations | | Consolidated |
| | | (in thousands) |
| Net cash provided by operating activities | | $ | 13,376 | | | $ | 174,655 | | | $ | 124,999 | | | $ | — | | | $ | 313,030 | |
Cash flows provided by (used in) investing activities:
| | | | | | | | | | | | | | | | | | | | |
| Investment in (distributions from) affiliates | | | (247,811 | ) | | | 29,840 | | | | — | | | | 217,971 | | | | — | |
| Additions to property and equipment | | | (6,995 | ) | | | (512,475 | ) | | | (225,040 | ) | | | 31,000 | | | | (713,510 | ) |
| Proceeds from the sale of assets and other | | | — | | | | 60,169 | | | | 858 | | | | (31,000 | ) | | | 30,027 | |
| Cash flows provided by (used in) investing activities | | | (254,806 | ) | | | (422,466 | ) | | | (224,182 | ) | | | 217,971 | | | | (683,483 | ) |
Cash flows provided by (used in) financing activities:
| | | | | | | | | | | | | | | | | | | | |
| Distributions paid to noncontrolling interest holders | | | — | | | | — | | | | (49,739 | ) | | | — | | | | (49,739 | ) |
| Net proceeds from (repayments of) borrowings | | | 131,000 | | | | — | | | | — | | | | — | | | | 131,000 | |
| Net proceeds from equity issuance | | | 135,441 | | | | — | | | | — | | | | — | | | | 135,441 | |
| Cash received for stock warrants sold | | | 18,187 | | | | — | | | | — | | | | — | | | | 18,187 | |
| Cash paid for convertible note hedges | | | (36,817 | ) | | | — | | | | — | | | | — | | | | (36,817 | ) |
| Net proceeds from PVR long-term debt | | | — | | | | — | | | | 193,500 | | | | — | | | | 193,500 | |
| Capital contributions from (distributions to) affiliates | | | — | | | | 247,811 | | | | (29,840 | ) | | | (217,971 | ) | | | — | |
| Other | | | (7,527 | ) | | | — | | | | 597 | | | | — | | | | (6,930 | ) |
| Cash flows provided by (used in) financing activities | | | 240,284 | | | | 247,811 | | | | 114,518 | | | | (217,971 | ) | | | 384,642 | |
| Net increase in cash and cash equivalents | | | (1,146 | ) | | | — | | | | 15,335 | | | | — | | | | 14,189 | |
Cash and Cash equivalents –
beginning of period | | | 5,181 | | | | — | | | | 15,157 | | | | — | | | | 20,338 | |
Cash and Cash equivalents –
end of period | | $ | 4,035 | | | $ | — | | | $ | 30,492 | | | $ | — | | | $ | 34,527 | |
TABLE OF CONTENTS
PENN VIRGINIA CORPORATION AND SUBSIDIARIES
NOTES TO CONSOLIDATED FINANCIAL STATEMENTS
(in thousands, except per share amounts)
Supplemental Quarterly Financial Information (Unaudited)
| | | | | | | | |
| 2009 | | First
Quarter | | Second
Quarter | | Third
Quarter | | Fourth
Quarter |
| Revenues | | $ | 199,160 | | | $ | 183,917 | | | $ | 195,163 | | | $ | 236,897 | |
| Operating income (loss)(1) | | $ | (7,439 | ) | | $ | (16,517 | ) | | $ | (94,831 | ) | | $ | 20,585 | |
| Income (loss) attributable to Penn Virginia Corp. | | $ | (7,209 | ) | | $ | (22,183 | ) | | $ | (79,900 | ) | | $ | (5,351 | ) |
Earnings (loss) per share attributable to Penn Virginia Corporation (3):
| | | | | | | | | | | | | | | | |
| Basic | | $ | (0.17 | ) | | $ | (0.52 | ) | | $ | (1.76 | ) | | $ | (0.12 | ) |
| Diluted | | $ | (0.17 | ) | | $ | (0.52 | ) | | $ | (1.76 | ) | | $ | (0.12 | ) |
Weighted-average shares outstanding:
| | | | | | | | | | | | | | | | |
| Basic | | | 41,922 | | | | 42,798 | | | | 45,427 | | | | 45,434 | |
| Diluted | | | 41,922 | | | | 42,798 | | | | 45,427 | | | | 45,434 | |
| | | | First
Quarter | | Second
Quarter | | Third
Quarter | | Fourth
Quarter | | |
| | | (in thousands, except share data) | | | | | | | | | |
2008 | | | | | | | | | | | | | | | | |
Revenues | | $ | 249,135 | | $ | 360,414 | | | $ | 385,612 | | $ | 225,690 | | | $ | 249,135 | | | $ | 360,414 | | | $ | 385,612 | | | $ | 225,690 | |
Operating income (1) | | $ | 60,133 | | $ | 106,224 | | | $ | 122,327 | | $ | (31,861 | ) | |
Net income | | $ | 3,926 | | $ | (3,793 | ) | | $ | 123,738 | | $ | 297 | | |
Net income per share (2): | | | | | | | | | |
| Operating income (loss)(2) | | | $ | 60,133 | | | $ | 106,224 | | | $ | 122,327 | | | $ | (31,861 | ) |
| Income (loss) attributable to Penn Virginia Corp. | | | $ | 3,194 | | | $ | (4,549 | ) | | $ | 122,953 | | | $ | (514 | ) |
Earnings (loss) per share attributable to Penn Virginia Corporation (3):
| | | | | | | | | | | | | | | | | |
Basic | | $ | 0.09 | | $ | (0.09 | ) | | $ | 2.95 | | $ | 0.01 | | | $ | 0.08 | | | $ | (0.11 | ) | | $ | 2.94 | | | $ | (0.01 | ) |
Diluted | | $ | 0.09 | | $ | (0.09 | ) | | $ | 2.90 | | $ | 0.01 | | | $ | 0.08 | | | $ | (0.11 | ) | | $ | 2.88 | | | $ | (0.01 | ) |
Weighted average sharesoutstanding (2): | | | | | | | | | |
Weighted-average shares outstanding:
| | | | | | | | | | | | | | | | | |
Basic | | | 41,558 | | | 41,740 | | | | 41,881 | | | 41,907 | | | | 41,558 | | | | 41,740 | | | | 41,881 | | | | 41,907 | |
Diluted | | | 41,803 | | | 41,740 | | | | 42,544 | | | 42,006 | | | | 41,803 | | | | 41,740 | | | | 42,544 | | | | 42,006 | |
| 2007 | | | | | | | | | |
Revenues | | $ | 186,270 | | $ | 222,398 | | | $ | 215,758 | | $ | 228,524 | | |
Operating income | | $ | 38,539 | | $ | 57,074 | | | $ | 51,884 | | $ | 45,127 | | |
Net income | | $ | 4,403 | | $ | 23,878 | | | $ | 17,114 | | $ | 5,359 | | |
Net income per share (2): | | | | | | | | | |
Basic | | $ | 0.12 | | $ | 0.63 | | | $ | 0.45 | | $ | 0.14 | | |
Diluted | | $ | 0.11 | | $ | 0.63 | | | $ | 0.45 | | $ | 0.14 | | |
Weighted average sharesoutstanding (2): | | | | | | | | | |
Basic | | | 37,594 | | | 37,750 | | | | 37,898 | | | 38,805 | | |
Diluted | | | 38,316 | | | 38,055 | | | | 38,213 | | | 39,157 | | |
| 2006 | | | | | | | | | |
Revenues | | $ | 200,907 | | $ | 179,150 | | | $ | 188,393 | | $ | 185,479 | | |
Operating income | | $ | 48,666 | | $ | 49,939 | | | $ | 44,644 | | $ | 27,283 | | |
Net income | | $ | 24,108 | | $ | 18,217 | | | $ | 22,881 | | $ | 10,703 | | |
Net income per share (2): | | | | | | | | | |
Basic | | $ | 0.65 | | $ | 0.49 | | | $ | 0.61 | | $ | 0.29 | | |
Diluted | | $ | 0.64 | | $ | 0.48 | | | $ | 0.61 | | $ | 0.28 | | |
Weighted average sharesoutstanding (2): | | | | | | | | | |
Basic | | | 37,304 | | | 37,354 | | | | 37,358 | | | 37,492 | | |
Diluted | | | 37,746 | | | 37,826 | | | | 37,790 | | | 37,872 | | |
| (1) | Operating income in 2008 includedIncludes impairments of oil and gas assets of $1.2 million, 3.3 million, $4.4 million and $0.1 million during each of the four quarters of 2009, respectively. Includes impairments of $87.9 million and $9.5 million for oil and gas properties held for sale during the third and fourth quarters of 2009, respectively. Includes a loss on$1.5 million impairment of one of PVR’s equity investments during the fourth quarter of 2009 (see Note 19). |
| (2) | Includes an impairment of goodwill offor $31.8 million that was recorded induring the fourth quarter of 2008. See2008 (see Note 12, “Goodwill.”19). |
(2) | (3) | The sum of the quarters may not equal the total of the respective year’s net incomeearnings per common share due to changes in the weighted averageweighted-average shares outstanding throughout the year. The net income per share and weighted average shares outstanding has been adjusted to reflect the two-for-one stock split in June 2007. See Note 5 – “Stock Split.” |
Supplemental Information on Oil and Gas Producing Activities (Unaudited)
The following supplemental information regarding the oil and gas producing activities is presented in accordance with the requirements of the SECcurrent oil and SFAS No. 69,Disclosures about Oil and Gas Producing Activities.gas accounting standards. The amounts shown include our net working and royalty interest in all of our oil and gas operations.
TABLE OF CONTENTS
PENN VIRGINIA CORPORATION AND SUBSIDIARIES
NOTES TO CONSOLIDATED FINANCIAL STATEMENTS
(in thousands, except per share amounts)
Capitalized Costs Relating to Oil and Gas Producing Activities
| | | | | | |
| | As of December 31, |
| | | 2009 | | 2008 | | 2007 |
| Proved properties | | $ | 353,386 | | | $ | 322,030 | | | $ | 280,795 | |
| Unproved properties | | | 73,067 | | | | 155,803 | | | | 127,805 | |
| Wells, equipment and facilities | | | 1,527,749 | | | | 1,623,274 | | | | 1,112,688 | |
| Support equipment | | | 5,938 | | | | 6,021 | | | | 4,493 | |
| | | | 1,960,140 | | | | 2,107,128 | | | | 1,525,781 | |
| Accumulated depreciation and depletion | | | (487,106 | ) | | | (469,296 | ) | | | (337,679 | ) |
| Net capitalized costs | | $ | 1,473,034 | | | $ | 1,637,832 | | | $ | 1,188,102 | |
| | | | | | | | | | | | |
| | | Year Ended December 31, | |
| | | 2008 | | | 2007 | | | 2006 | |
| | | (in thousands) | |
Proved properties | | $ | 322,030 | | | $ | 280,742 | | | $ | 213,017 | |
Unproved properties | | | 154,801 | | | | 127,805 | | | | 100,008 | |
Wells, equipment and facilities | | | 1,623,274 | | | | 1,112,688 | | | | 729,443 | |
Support equipment | | | 6,021 | | | | 4,493 | | | | 2,713 | |
| | | | | | | | | | | | |
| | | 2,106,126 | | | | 1,525,728 | | | | 1,045,181 | |
Accumulated depreciation and depletion | | | (469,296 | ) | | | (337,679 | ) | | | (247,523 | ) |
| | | | | | | | | | | | |
Net capitalized costs | | $ | 1,636,830 | | | $ | 1,188,049 | | | $ | 797,658 | |
| | | | | | | | | | | | |
In accordance with SFAS No. 143, duringDuring the years ended December 31, 2009, 2008 2007 and 2006,2007, an additional $0.5$0.4 million, $0.5 million and $1.4$0.5 million related to ARO assets were added to the cost basis of oil and gas wells for wells drilled.
Costs Incurred in Certain Oil and Gas Activities
| | | | | | | | | |
| | | Year Ended December 31, |
| | | 2008 | | 2007 | | 2006 |
| | | (in thousands) |
Proved property acquisition costs | | $ | — | | $ | 88,174 | | $ | 72,724 |
Unproved property acquisition costs | | | 93,110 | | | 18,817 | | | 56,563 |
Exploration costs | | | 30,373 | | | 46,425 | | | 51,665 |
Development costs and other | | | 518,213 | | | 367,012 | | | 184,675 |
| | | | | | | | | |
Total costs incurred | | $ | 641,696 | | $ | 520,428 | | $ | 365,627 |
| | | | | | | | | |
Costs for the year ended December 31, 2006 include deferred income taxes of $32.3 million provided for the book versus tax basis difference related to the acquired Crow Creek properties.
| | | | | | |
| | Year Ended December 31, |
| | | 2009 | | 2008 | | 2007 |
| Proved property acquisition costs | | $ | — | | | $ | — | | | $ | 88,174 | |
| Unproved property acquisition costs | | | 14,996 | | | | 93,110 | | | | 18,817 | |
| Exploration costs | | | 7,179 | | | | 30,373 | | | | 46,245 | |
| Development costs and other | | | 149,625 | | | | 518,213 | | | | 367,012 | |
| Total costs incurred | | $ | 171,800 | | | $ | 641,696 | | | $ | 520,248 | |
Results of Operations for Oil and Gas Producing Activities
The following table includes results solely from the production and sale of oil and gas and a non-cash charge for property impairments. It excludes corporate-related general and administrative expenses and gains or losses on property dispositions. The income tax expense is calculated by applying the statutory tax rates to the revenues after deducting costs, which include depletion allowances and giving effect to oil and gas related permanent differences and tax credits.
| | | | Years ended December 31, | | | | | | |
| | | 2008 | | 2007 | | 2006 | | Year Ended December 31, |
| | | (in thousands) | | 2009 | | 2008 | | 2007 |
Revenues | | $ | 436,622 | | $ | 290,286 | | $ | 234,156 | | $ | 228,659 | | | $ | 436,622 | | | $ | 290,286 | |
Production expenses | | | 82,191 | | | 65,130 | | | 39,681 | | | 72,255 | | | | 82,191 | | | | 65,130 | |
Exploration expenses | | | 42,436 | | | 28,608 | | | 34,330 | | | 57,754 | | | | 42,436 | | | | 28,608 | |
Depreciation and depletion expense | | | 132,276 | | | 87,223 | | | 56,237 | | | 150,429 | | | | 132,276 | | | | 87,223 | |
Impairment of oil and gas properties | | | 19,963 | | | 2,586 | | | 8,517 | | | 106,415 | | | | 19,963 | | | | 2,586 | |
| | | | | | | | | (158,194 | ) | | | 159,756 | | | | 106,739 | |
| | | 159,756 | | | 106,739 | | | 95,391 | |
Income tax expense | | | 61,985 | | | 41,628 | | | 37,775 | |
| | | | | | | |
| Income tax expense (benefit) | | | | (61,221 | ) | | | 61,985 | | | | 41,628 | |
Results of operations | | $ | 97,771 | | $ | 65,111 | | $ | 57,616 | | $ | (96,973 | ) | | $ | 97,771 | | | $ | 65,111 | |
| | | | | | | |
In accordance with SFAS No. 143, theThe combined depletion and accretion expense related to AROsasset retirement that were recognized during 2009, 2008 2007 and 20062007 in DD&A expense was approximately $0.7 million, $0.4 million and $0.7 million and $0.2 million.
TABLE OF CONTENTS
PENN VIRGINIA CORPORATION AND SUBSIDIARIES
NOTES TO CONSOLIDATED FINANCIAL STATEMENTS
(in thousands, except per share amounts)
Oil and Gas Reserves
The following table sets forth the net quantities of proved reserves and proved developed reserves during the periods indicated. This information includes the oil and gas segment’s royalty and net working interest share of the reserves in oil and gas properties. Net proved oil and gas reserves for the three years ended December 31, 20082009 were estimated by Wright and& Company, Inc., utilizing data compiled by us.
All reserves are located in the United States. There are many uncertainties inherent in estimating proved reserve quantities, and projecting future production rates and the timing of future development expenditures. In addition, reserve estimates of new discoveries are more imprecise than those of properties with a production history. Accordingly, these estimates are subject to change as additional information becomes available.
Proved reserves are the estimated quantities of crude oil, condensate and natural gas that geological and engineering data demonstrate with reasonable certainty to be recoverable in future years from known oil and gas reservoirs under existing economic and operating conditions at the end of the respective years.
Proved developed reserves are those reserves expected to be recovered through existing wells with existing equipment and operating methods.
Proved undeveloped reserves are proved reserves expected to be recovered through new wells on undrilled acreage or from existing wells where a relatively major expenditure is required for completion. The proved undeveloped reserves included in our current estimates relate to wells that are forecasted to be drilled within the next five years.
| | | | | | | | | |
Proved Developed and Undeveloped Reserves | | Natural
Gas
(MMcf) | | | Oil and
Condensate
(MBbl) | | | Total
Equivalents
(MMcfe) | |
December 31, 2005 | | 359,181 | | | 2,897 | | | 376,560 | |
Revisions of previous estimates | | (10,182 | ) | | 396 | | | (7,807 | ) |
Extensions, discoveries and other additions | | 97,286 | | | 597 | | | 100,867 | |
Production | | (28,967 | ) | | (382 | ) | | (31,260 | ) |
Purchase of reserves | | 39,928 | | | 1,402 | | | 48,346 | |
Sale of reserves in place | | — | | | — | | | — | |
| | | | | | | | | |
December 31, 2006 | | 457,246 | | | 4,910 | | | 486,706 | |
| | | | | | | | | |
Revisions of previous estimates | | (19,554 | ) | | 3,853 | | | 3,566 | |
Extensions, discoveries and other additions | | 137,634 | | | 6,547 | | | 176,915 | |
Production | | (37,802 | ) | | (461 | ) | | (40,569 | ) |
Purchase of reserves | | 72,102 | | | 390 | | | 74,440 | |
Sale of reserves in place | | (21,363 | ) | | (19 | ) | | (21,476 | ) |
| | | | | | | | | |
December 31, 2007 | | 588,263 | | | 15,220 | | | 679,582 | |
| | | | | | | | | |
Revisions of previous estimates | | (59,828 | ) | | (131 | ) | | (60,614 | ) |
Extensions, discoveries and other additions | | 267,190 | | | 12,783 | | | 343,888 | |
Production | | (41,493 | ) | | (898 | ) | | (46,881 | ) |
Purchase of reserves | | — | | | — | | | — | |
Sale of reserves in place | | — | | | — | | | — | |
| | | | | | | | | |
December 31, 2008 | | 754,132 | | | 26,974 | | | 915,975 | |
| | | | | | | | | |
| | | |
Proved Developed Reserves: | | | | | | | | | |
December 31, 2006 | | 326,480 | | | 3,049 | | | 344,775 | |
| | | | | | | | | |
December 31, 2007 | | 372,626 | | | 4,463 | | | 399,404 | |
| | | | | | | | | |
December 31, 2008 | | 411,366 | | | 9,895 | | | 470,736 | |
| | | | | | | | | |
Our Manager of Engineering if primarily responsible for overseeing the preparation of the Company’s reserve estimate by our independent third party engineers, Wright & Company, Inc. The Manager of Engineering has over twenty-four years of industry experience in the estimation and evaluation of reserve information, holds a B.S. degree in Petroleum Engineering from Texas A&M University and is licensed by the state of Texas as a Professional Engineer. The Company’s internal controls over reserve estimates include reconciliation and review controls, including an independent internal review of assumptions used in the estimation.
The technical person primarily responsible for review of our reserve estimates at Wright & Company, Inc., meets the requirements regarding qualifications, independence, objectivity, and confidentiality set forth in the Standards Pertaining to the Estimating and Auditing of Oil and Gas Reserves Information promulgated by the Society of Petroleum Engineers. Wright & Company, Inc. is an independent firm of petroleum engineers, geologists, geophysicists, and petro physicists; they do not own an interest in our properties and are not employed on a contingent fee basis.
TABLE OF CONTENTS
PENN VIRGINIA CORPORATION AND SUBSIDIARIES
NOTES TO CONSOLIDATED FINANCIAL STATEMENTS
(in thousands, except per share amounts)
| | | | | | |
| Proved Developed and Undeveloped Reserves | | Natural
Gas
(MMcf) | | Oil and
Condensate
(MBbl) | | Total
Equivalents
(MMcfe) |
| December 31, 2006 | | | 457,246 | | | | 4,910 | | | | 486,706 | |
| Revisions of previous estimates | | | (19,554 | ) | | | 3,853 | | | | 3,566 | |
| Extensions, discoveries and other additions(1) | | | 137,634 | | | | 6,547 | | | | 176,915 | |
| Production | | | (37,802 | ) | | | (461 | ) | | | (40,569 | ) |
| Purchase of reserves(2) | | | 72,102 | | | | 390 | | | | 74,440 | |
| Sale of reserves in place | | | (21,363 | ) | | | (19 | ) | | | (21,476 | ) |
| December 31, 2007 | | | 588,263 | | | | 15,220 | | | | 679,582 | |
| Revisions of previous estimates | | | (59,828 | ) | | | (131 | ) | | | (60,614 | ) |
| Extensions, discoveries and other additions(3) | | | 267,190 | | | | 12,783 | | | | 343,888 | |
| Production | | | (41,493 | ) | | | (898 | ) | | | (46,881 | ) |
| Purchase of reserves | | | — | | | | — | | | | — | |
| Sale of reserves in place | | | — | | | | — | | | | — | |
| December 31, 2008 | | | 754,132 | | | | 26,974 | | | | 915,975 | |
| Revisions of previous estimates(4) | | | (110,349 | ) | | | (8,442 | ) | | | (160,995 | ) |
| Extensions, discoveries and other additions(5) | | | 180,448 | | | | 9,203 | | | | 235,666 | |
| Production | | | (43,337 | ) | | | (1,277 | ) | | | (51,000 | ) |
| Purchase of reserves | | | — | | | | — | | | | — | |
| Sale of reserves in place | | | (4,229 | ) | | | (71 | ) | | | (4,659 | ) |
| December 31, 2009 | | | 776,665 | | | | 26,387 | | | | 934,987 | |
Proved Developed Reserves:
| | | | | | | | | | | | |
| December 31, 2007 | | | 372,626 | | | | 4,463 | | | | 399,404 | |
| December 31, 2008 | | | 411,366 | | | | 9,895 | | | | 470,736 | |
| December 31, 2009 | | | 388,382 | | | | 8,357 | | | | 438,524 | |
| (1) | Increased due to drilling 151 wells on locations which were not classified as proved undeveloped locations in our 2006 year-end reserve report and the addition of 229 new proved undeveloped locations as a result of our 2007 drilling activities. |
| (2) | We purchased approximately 74.4 Bcfe of reserves, primarily in Oklahoma and East Texas. |
| (3) | Increased due to the drilling of 158 wells on locations which were not classified as proved undeveloped locations in our 2007 year-end reserve report and the addition of 1,031 new proved undeveloped locations as a result of our 2008 drilling activities. |
| (4) | We had downward revisions of 161 Bcfe which were primarily the result of the following: 1) downward revisions of 63.1 Bcfe due to price, 2) a downward revision of 27.1 Bcfe in Appalachia for the removal of proved undeveloped reserves, which resulted from wells that no longer met the reasonable certainty threshold, 3) downward revisions of 20.1 Bcfe for NGLs that we received in East Texas as a result of lower plant yields and 4) various downward revisions amounting to 50.7 Bcfe across our assets which were the result of well performance and the application of the new oil and gas reserve calculation methodology. |
| (5) | We added 235.7 Bcfe due to the drilling of 13 wells on locations which were not classified as proved undeveloped locations in our 2008 year-end reserve report and the addition of 105 new proved undeveloped locations, primarily in the Gulf Coast and Mid-Continent regions, as a result of our 2009 drilling activities. |
TABLE OF CONTENTS
PENN VIRGINIA CORPORATION AND SUBSIDIARIES
NOTES TO CONSOLIDATED FINANCIAL STATEMENTS
(in thousands, except per share amounts)
The following table sets forth the standardized measure of the discounted future net cash flows attributable to our proved reserves. Future cash inflows were computed by applying the average prices of oil and gas during the 12-month period prior to the period end determined as an unweighted arithmetic average of the first-day-of-the-month price for each month within the period for 2009 and estimated future costs as of that fiscal year end to the estimated future production of proved reserves. For periods prior to 2009, future cash inflows were computed by applying year-end prices of oil and gas to the estimated future production of proved reserves. Natural gas prices were escalated only where existing contracts contained fixed and determinable escalation clauses. Contractually provided natural gas prices in excess of estimated market clearing prices were used in computing the future cash inflows only if we expect to continue to receive higher prices under legally enforceable contract terms. Future prices actually received may materially differ from current prices or the prices used in the standardized measure.
Future production and development costs represent the estimated future expenditures (based on current costs) to be incurred in developing and producing the proved reserves, assuming continuation of existing economic conditions. Future income tax expenses were computed by applying statutory income tax rates to the difference between pre-tax net cash flows relating to our proved reserves and the tax basis of proved oil and gas properties. In addition, the effects of statutory depletion in excess of tax basis, available net operating loss carryforwards and alternative minimum tax credits were used in computing future income tax expense. The resulting annual net cash inflows were then discounted using a 10% annual rate.
| | | | | | | | | | | | |
| | | Year Ended December 31, | |
| | | 2008 | | | 2007 | | | 2006 | |
| | | (in thousands) | |
Future cash inflows | | $ | 5,031,678 | | | $ | 5,140,818 | | | $ | 2,848,046 | |
Future production costs | | | (1,588,959 | ) | | | (1,496,057 | ) | | | (775,561 | ) |
Future development costs | | | (924,219 | ) | | | (667,118 | ) | | | (321,338 | ) |
| | | | | | | | | | | | |
Future net cash flows before income tax | | | 2,518,500 | | | | 2,977,643 | | | | 1,751,147 | |
Future income tax expense | | | (567,779 | ) | | | (727,561 | ) | | | (435,299 | ) |
| | | | | | | | | | | | |
Future net cash flows | | | 1,950,721 | | | | 2,250,082 | | | | 1,315,848 | |
10% annual discount for estimated timing of cash flows | | | (1,221,320 | ) | | | (1,278,172 | ) | | | (711,248 | ) |
| | | | | | | | | | | | |
Standardized measure of discounted future net cash flows | | $ | 729,401 | | | $ | 971,910 | | | $ | 604,600 | |
| | | | | | | | | | | | |
| | | | | | |
| | Year Ended December 31, |
| | | 2009 | | 2008 | | 2007 |
| Future cash inflows | | $ | 4,178,449 | | | $ | 5,031,678 | | | $ | 5,140,818 | |
| Future production costs | | | (1,300,235 | ) | | | (1,588,959 | ) | | | (1,496,057 | ) |
| Future development costs | | | (888,493 | ) | | | (924,219 | ) | | | (667,118 | ) |
| Future net cash flows before income tax | | | 1,989,721 | | | | 2,518,500 | | | | 2,977,643 | |
| Future income tax expense | | | (491,832 | ) | | | (567,779 | ) | | | (727,561 | ) |
| Future net cash flows | | | 1,497,889 | | | | 1,950,721 | | | | 2,250,082 | |
| 10% annual discount for estimated timing of cash flows | | | (973,118 | ) | | | (1,221,320 | ) | | | (1,278,172 | ) |
| Standardized measure of discounted future net cash flows | | $ | 524,771 | | | $ | 729,401 | | | $ | 971,910 | |
Changes in Standardized Measure of Discounted Future Net Cash Flows
| | | | | | |
| | Year Ended December 31, |
| | | 2009 | | 2008 | | 2007 |
| Sales of oil and gas, net of production costs | | $ | (157,891 | ) | | $ | (355,552 | ) | | $ | (227,136 | ) |
| Net changes in prices and production costs | | | (314,209 | ) | | | (318,730 | ) | | | 277,245 | |
| Extensions, discoveries and other additions | | | 138,482 | | | | 233,603 | | | | 241,497 | |
| Development costs incurred during the period | | | 65,043 | | | | 112,925 | | | | 108,584 | |
| Revisions of previous quantity estimates | | | (158,844 | ) | | | (93,346 | ) | | | 17,846 | |
| Purchases of minerals-in-place | | | — | | | | — | | | | 69,179 | |
| Sale of minerals-in-place | | | — | | | | — | | | | (42,395 | ) |
| Accretion of discount | | | 90,796 | | | | 126,114 | | | | 78,744 | |
| Net change in income taxes | | | 15,168 | | | | 110,670 | | | | (106,398 | ) |
| Other changes | | | 116,825 | | | | (58,193 | ) | | | (49,856 | ) |
| Net increase (decrease) | | | (204,630 | ) | | | (242,509 | ) | | | 367,310 | |
| Beginning of year | | | 729,401 | | | | 971,910 | | | | 604,600 | |
| End of year | | $ | 524,771 | | | $ | 729,401 | | | $ | 971,910 | |
TABLE OF CONTENTS
| | | | | | | | | | | | |
| | | Year Ended December 31, | |
| | | 2008 | | | 2007 | | | 2006 | |
Sales of oil and gas, net of productions costs | | $ | (355,552 | ) | | $ | (227,136 | ) | | $ | (196,284 | ) |
Net changes in prices and production costs | | | (318,730 | ) | | | 277,245 | | | | (720,914 | ) |
Extensions, discoveries and other additions | | | 233,603 | | | | 241,497 | | | | 142,007 | |
Development costs incurred during the period | | | 112,925 | | | | 108,584 | | | | 50,629 | |
Revisions of previous quantity estimates | | | (93,346 | ) | | | 17,846 | | | | (24,460 | ) |
Purchase of minerals-in-place | | | — | | | | 69,179 | | | | 51,810 | |
Sale of minerals-in-place | | | — | | | | (42,395 | ) | | | — | |
Accretion of discount | | | 126,114 | | | | 78,744 | | | | 141,165 | |
Net change in income taxes | | | 110,670 | | | | (106,398 | ) | | | 192,370 | |
Other changes | | | (58,193 | ) | | | (49,856 | ) | | | (68,169 | ) |
| | | | | | | | | | | | |
Net increase (decrease) | | | (242,509 | ) | | | 367,310 | | | | (431,846 | ) |
Beginning of year | | | 971,910 | | | | 604,600 | | | | 1,036,446 | |
| | | | | | | | | | | | |
End of year | | $ | 729,401 | | | $ | 971,910 | | | $ | 604,600 | |
| | | | | | | | | | | | |
PENN VIRGINIA CORPORATION AND SUBSIDIARIES
NOTES TO CONSOLIDATED FINANCIAL STATEMENTS
(in thousands, except per share amounts)
The changes in standardized measure relating to sales of reserves are calculated using prices in effect as of the beginning of the period and changes in standardized measure relating to purchases of reserves are calculated using the average prices in effect atduring the 12-month period prior to the period end determined as an unweighted arithmetic average of the period.first-day-of-the-month price for each month within the period and estimated future costs as of that fiscal year end. Accordingly, the changes in standardized measure for purchases and sales of reserves reflected above do not necessarily represent the economic reality of such transactions. See “Costs Incurred in Certain Oil and Gas Activities” earlier in this Note and our consolidated statementsConsolidated Statements of cash flows.Cash Flows.
Revised OilTABLE OF CONTENTS
Item 9 Changes in and Gas Standard
In December 2008, the SEC released the final rule forModernization of Oil and Gas Reporting, or Modernization. The Modernization disclosure requirements will permit reporting of oil and gas reserves using an average price based upon the prior 12-month period rather than year-end prices and the use of new technologies to determine proved reserves, if those technologies have been demonstrated to result in reliable conclusions about reserves volumes. Companies will also be allowed to disclose probable and possible reserves to investors in SEC filed documents. In addition, companies will be required to report the independence and qualifications of its reserves preparer or auditor and file reports when a third party is relied upon to prepare reserves estimates or conduct a reserves audit. The Modernization disclosure requirements will become effective for the year ended December 31, 2009. The SEC is coordinating with the FASB to obtain the revisions necessary under SFAS No. 19,FinancialDisagreements With Accountants on Accounting and Reporting by OilFinancial DisclosureNone.
Item 9A Controls and Gas Producing Companies, and SFAS No. 69,Disclosures about Oil and Gas Producing Activities, to provide consistency with the Modernization. In the event that consistency is not achieved in time for companies to comply with the Modernization, the SEC will consider delaying the compliance date.
Item 9 | Changes in and Disagreements With Accountants on Accounting and Financial Disclosure |
None.
Item 9A | Controls and Procedures |
Procedures
(a) Disclosure Controls and Procedures
Under the supervision and with the participation of our management, including our Chief Executive Officer and our Chief Financial Officer, we performed an evaluation of the design and operation of our disclosure controls and procedures (as defined in Rule 13a-15(e) of the Exchange Act) as of December 31, 2008.2009. Our disclosure controls and procedures are designed to ensure that information required to be disclosed by us in the reports we file or submit under the Exchange Act is recorded, processed, summarized and reported accurately and on a timely basis. Based on that evaluation, our Chief Executive Officer and our Chief Financial Officer concluded that, as of December 31, 2008,2009, such disclosure controls and procedures were effective.
(b) Management’s Annual Report on Internal Control Over Financial Reporting
Our management, including our Chief Executive Officer and our Chief Financial Officer, is responsible for establishing and maintaining adequate internal control over our financial reporting. Our management assessed the effectiveness of our internal control over financial reporting as of December 31, 2008.2009. This evaluation was completed based on the framework established inInternal Control—Control — Integrated Framework issued by the Committee of Sponsoring Organizations of the Treadway Commission.
Our management has concluded that, as of December 31, 2008,2009, our internal control over financial reporting was effective.
(c) Attestation Report of the Registered Public Accounting Firm
KPMG LLP, an independent registered public accounting firm, has issued an attestation report on the internal control over financial reporting as of December 31, 2008,2009, which is included in Item 8 of this Annual Report on Form 10-K.
(d) Changes in Internal Control Over Financial Reporting
No changes were made in our internal control over financial reporting that occurred during our last fiscal quarter that have materially affected, or are reasonably likely to materially affect, our internal control over financial reporting.
Item 9B Other Information
There was no information that was required to be disclosed by us on a Current Report on Form 8-K during the fourth quarter of 20082009 which we did not disclose.
TABLE OF CONTENTS
Part III
Item 10 | Directors, Executive Officers and Corporate Governance |
Item 10 Directors, Executive Officers and Corporate Governance
In accordance with General Instruction G(3), reference is hereby made to the Company’s definitive proxy statement to be filed within 120 days after the end of the fiscal year covered by this Annual Report on Form 10-K.
Item 11 | Executive Compensation |
Item 11 Executive Compensation
In accordance with General Instruction G(3), reference is hereby made to the Company’s definitive proxy statement to be filed within 120 days after the end of the fiscal year covered by this Annual Report on Form 10-K.
Item 12 | Security Ownership of Certain Beneficial Owners and Management and Related Shareholder Matters |
Item 12 Security Ownership of Certain Beneficial Owners and Management and Related Shareholder Matters
In accordance with General Instruction G(3), reference is hereby made to the Company’s definitive proxy statement to be filed within 120 days after the end of the fiscal year covered by this Annual Report on Form 10-K.
Item 13 | Certain Relationships and Related Transactions, and Director Independence |
Item 13 Certain Relationships and Related Transactions, and Director Independence
In accordance with General Instruction G(3), reference is hereby made to the Company’s definitive proxy statement to be filed within 120 days after the end of the fiscal year covered by this Annual Report on Form 10-K.
Item 14 | Principal Accounting Fees and Services |
Item 14 Principal Accounting Fees and Services
In accordance with General Instruction G(3), reference is hereby made to the Company’s definitive proxy statement to be filed within 120 days after the end of the fiscal year covered by this Annual Report on Form 10-K.
TABLE OF CONTENTS
Part IV
Item 15 | Exhibits, Financial Statement Schedules |
Item 15 Exhibits, Financial Statement Schedules
The following documents are filed as exhibits to this Annual Report on Form 10-K:
| | |
| (1) | | Financial Statements—Statements — The financial statements filed herewith are listed in the Index to Consolidated Financial Statements on page 9489 of this Annual Report on Form 10-K. |
| |
(2)(2.1) | | All schedules are omitted because they are not required, inapplicable or the information is included in the consolidated financial statements or the notes thereto.Purchase and Sale Agreement dated as of December 23, 2009 by and between Penn Virginia Oil & Gas, L.P. and Hilcorp Energy I, L.P. as amended by Amendment and Supplement to Purchase and Sale Agreement dated January 29, 2010 (incorporated by reference to Exhibit 2.1 to Registrant’s Current Report on Form 8-K filed on February 3, 2010). |
| |
(3)(2.2) | | Exhibits |
| Purchase and Sale Agreement dated as of December 23, 2009 by and between Hilcorp Energy I, L.P. and Penn Virginia Oil & Gas Corporation (incorporated by reference to Exhibit 2.2 to Registrant’s Current Report on Form 8-K filed on February 3, 2010). |
| (3.1) | | Articles of Incorporation of Penn Virginia Corporation (incorporated by reference to Exhibit 3.1 to Registrant’s Annual Report on Form 10-K for the year ended December 31, 1999). |
| |
(3.2)(3.1.1) | | Articles of Amendment of Articles of Incorporation of Penn Virginia Corporation (incorporated by reference to Exhibit 3.2 to Registrant’s Annual Report on Form 10-K for the year ended December 31, 1999). |
| |
(3.3)(3.1.2) | | Articles of Amendment of Articles of Incorporation of Penn Virginia Corporation (incorporated by reference to Exhibit 3 to Registrant’s Quarterly Report on Form 10-Q for the quarterly period ended June 30, 2004). |
| |
(3.4)(3.1.3) | | Articles of Amendment of Articles of Incorporation of Penn Virginia Corporation (incorporated by reference to Exhibit 3.1 to Registrant’s Current Report on Form 8-K filed on June 12, 2007). |
| |
(3.5) (3.2) | | Amended and Restated Bylaws of Registrant (incorporated by reference to Exhibit 3.1 to Registrant’s Current Report on Form 8-K filed on February 23,December 14, 2009). |
| |
| (4.1) | | Subordinated Indenture dated as of December 5, 2007 among Penn Virginia Corporation, as Issuer, Penn Virginia Holding Corp., Penn Virginia Oil & Gas Corporation, Penn Virginia Oil & Gas GP LLC, Penn Virginia Oil & Gas LP LLC, Penn Virginia MC Corporation, Penn Virginia MC Energy L.L.C., Penn Virginia MC Operating Company L.L.C. and Penn Virginia Oil & Gas, L.P., as Subsidiary Guarantors, and Wells Fargo Bank, N.A., as Trustee (incorporated by reference to Exhibit 4.1 to Registrant’s Current Report on Form 8-K filed on December 5, 2007). |
| |
(4.2)(4.1.1) | | First Supplemental Indenture dated December 5, 2007 between Penn Virginia Corporation, as Issuer, and Wells Fargo Bank, N.A., as Trustee (incorporated by reference to Exhibit 4.2 to Registrant’s Current Report on Form 8-K filed on December 5, 2007). |
| |
(10.1) (4.2) | | Amended and Restated Credit AgreementSenior Indenture dated as of December 4, 2003June 15, 2009, among Penn Virginia Corporation, as issuer, the lenders party thereto, Bank One, NA, as Administrative Agent, Wachoviasubsidiary guarantors named therein and Wells Fargo Bank, National Association, as Syndication Agent, Royal Bank of Canada, BNP Paribas and Fleet National Bank, as Documentation Agents, and Banc One Capital Markets, Inc. and Wachovia Capital Markets, LLC, as Co-Lead Arrangers and Joint Book RunnersTrustee (incorporated by reference to Exhibit 10.1 to Registrant’s Annual Report on Form 10-K for the year ended December 31, 2003). |
| |
(10.2) | | First Amendment to Amended and Restated Credit Agreement dated as of December 29, 2004 among Penn Virginia Corporation, the lenders party thereto and JPMorgan Chase Bank, N.A. (incorporated by reference to Exhibit 10.2 to Registrant’s Annual Report on Form 10-K for the year ended December 31, 2005). |
| |
(10.3) | | Second Amendment to Amended and Restated Credit Agreement dated as of December 15, 2005 among Penn Virginia Corporation, the lenders party thereto and JPMorgan Chase Bank, N.A. (incorporated by reference to Exhibit 10.3 to Registrant’s Annual Report on Form 10-K for the year ended December 31, 2005). |
| |
(10.4) | | Third Amendment to Amended and Restated Credit Agreement dated as of April 14, 2006 among Penn Virginia Corporation, the lenders party thereto and JPMorgan Chase Bank, N.A. (incorporated by reference to Exhibit 10.1 to Registrant’s Quarterly Report on Form 10-Q for the quarterly period ended March 31, 2006). |
| |
(10.5) | | Fourth Amendment to Amended and Restated Credit Agreement dated as of August 25, 2006 among Penn Virginia Corporation, the lenders party thereto and JPMorgan Chase Bank, N.A. (incorporated by reference to Exhibit 10.1 to Registrant’s Quarterly Report on Form 10-Q for the quarterly period ended September 30, 2006). |
| |
(10.6) | | Fifth Amendment to Amended and Restated Credit Agreement dated as of November 1, 2006 among Penn Virginia Corporation, the lenders party thereto and JPMorgan Chase Bank, N.A. (incorporated by reference to Exhibit 10.2 to Registrant’s Quarterly Report on Form 10-Q for the quarterly period ended September 30, 2006). |
| | |
(10.7) | | Sixth Amendment to Amended and Restated Credit Agreement dated as of April 13, 2007 among Penn Virginia Corporation, the lenders party thereto and JPMorgan Chase Bank, N.A. (incorporated by reference to Exhibit 10.1 to Registrant’s Current Report on Form 8-K filed on April 16, 2007). |
| |
(10.8) | | Seventh Amendment to Amended and Restated Credit Agreement dated as of June 12, 2007 among Penn Virginia Corporation, the lenders party thereto and JPMorgan Chase Bank, N.A. (incorporated by reference to Exhibit 10.14.1 to Registrant’s Current Report on Form 8-K filed on June 18, 2007)16, 2009). |
| |
(10.9)(4.2.1) | | WaiverFirst Supplemental Indenture relating to the 10.375% Senior Notes due 2016, dated as of June 15, 2009 among Penn Virginia Corporation, as issuer, the subsidiary guarantors named therein and Eighth AmendmentWells Fargo Bank, National Association, as trustee (incorporated by reference to Amended and Restated Exhibit 4.1 to Registrant’s Current Report on Form 8-K/A filed on June 18, 2009). |
| (4.3) | | Form of Note for 10.375% Senior Notes due 2016 (incorporated by reference to Annex A to Exhibit 4.1 to Registrant’s Current Report on Form 8-K/A filed on June 18, 2009). |
| (10.1) | | Credit Agreement dated as of August 1, 2007November 18, 2009 among Penn Virginia Holding Corp., as borrower, Penn Virginia Corporation, as parent, the lenders party thereto and JPMorgan Chase Bank, N.A. (incorporated by reference to Exhibit 10.1 to Registrant’s Current Report on Form 8-K filed on August 2, 2007). |
| |
(10.10) | | Waiver and Ninth Amendment to Amended and Restated Credit Agreement dated, as of October 5, 2007 among Penn Virginia Corporation, the lenders party thereto and JPMorgan Chase Bank, N.A. (incorporated by reference to Exhibit 10.1 to Registrant’s Current Report on Form 8-K filed on October 9, 2007). |
| |
(10.11) | | Waiver and Tenth Amendment to Amended and Restated Credit Agreement dated as of November 26, 2007 among Penn Virginia Corporation, the lenders party thereto and JPMorgan Chase Bank, N.A.administrative agent (incorporated by reference to Exhibit 10.1 to Registrant’s Current Report on Form 8-K filed on November 27, 2007)20, 2009). |
| |
(10.12) | | Eleventh Amendment to Amended and Restated Credit Agreement dated as of December 15, 2008 among Penn Virginia Corporation, the lenders party thereto and JPMorgan Chase Bank, N.A. (incorporated by reference to Exhibit 10.1 to Registrant’s Current Report on Form 8-K filed on December 17, 2008). |
| |
(10.13)(10.2) | | Call Option Confirmation dated November 29, 2007 between JPMorgan Chase Bank, National Association, London Branch and Penn Virginia Corporation (incorporated by reference to Exhibit 10.1 to Registrant’s Current Report on Form 8-K filed on December 5, 2007). |
| |
(10.14)(10.3) | | Call Option Confirmation dated November 29, 2007 between Wachovia Bank, National Association and Penn Virginia Corporation (incorporated by reference to Exhibit 10.3 to Registrant’s Current Report on Form 8-K filed on December 5, 2007). |
| |
(10.15)(10.4) | | Call Option Confirmation dated November 29, 2007 between Lehman Brothers OTC Derivatives Inc. and Penn Virginia Corporation. (incorporated by reference to Exhibit 10.5 to Registrant’s Current Report on Form 8-K filed on December 5, 2007) |
| |
(10.16)(10.5) | | Call Option Confirmation dated November 29, 2007 between UBS AG, London Branch and Penn Virginia Corporation (incorporated by reference to Exhibit 10.7 to Registrant’s Current Report on Form 8-K filed on December 5, 2007). |
| |
(10.17)(10.6) | | Warrant Confirmation dated November 29, 2007 between JPMorgan Chase Bank, National Association, London Branch and Penn Virginia Corporation (incorporated by reference to Exhibit 10.2 to Registrant’s Current Report on Form 8-K filed on December 5, 2007). |
| |
(10.18)(10.7) | | Warrant Transaction Amendment dated December 3, 2007 between JPMorgan Chase Bank, National Association, London Branch and Penn Virginia Corporation (incorporated by reference to Exhibit 10.9 to Registrant’s Current Report on Form 8-K filed on December 5, 2007). |
| |
(10.19)(10.8) | | Warrant Confirmation dated November 29, 2007 between Wachovia Bank, National Association and Penn Virginia Corporation (incorporated by reference to Exhibit 10.4 to Registrant’s Current Report on Form 8-K filed on December 5, 2007). |
| |
(10.20)(10.9) | | Warrant Transaction Amendment dated December 3, 2007 between Wachovia Bank, National Association and Penn Virginia Corporation (incorporated by reference to Exhibit 10.11 to Registrant’s Current Report on Form 8-K filed on December 5, 2007). |
| |
(10.21)(10.10) | | Warrant Confirmation dated November 29, 2007 between Lehman Brothers OTC Derivatives Inc. and Penn Virginia Corporation (incorporated by reference to Exhibit 10.6 to Registrant’s Current Report on Form 8-K filed on December 5, 2007). |
| |
(10.22)(10.11) | | Warrant Transaction Amendment dated December 3, 2007 between Lehman Brothers OTC Derivatives Inc. and Penn Virginia Corporation (incorporated by reference to Exhibit 10.10 to Registrant’s Current Report on Form 8-K filed on December 5, 2007). |
| |
(10.23)(10.12) | | Warrant Confirmation dated November 29, 2007 between UBS AG, London Branch and Penn Virginia Corporation (incorporated by reference to Exhibit 10.8 to Registrant’s Current Report on Form 8-K filed on December 5, 2007). |
| | |
(10.24)(10.13) | | Warrant Transaction Amendment dated December 3, 2007 between UBS AG, London Branch and Penn Virginia Corporation (incorporated by reference to Exhibit 10.12 to Registrant’s Current Report on Form 8-K filed on December 5, 2007). |
| |
(10.25)(10.14) | | Omnibus Agreement dated October 30, 2001 among Penn Virginia Corporation, Penn Virginia Resource GP, LLC, Penn Virginia Operating Co., LLC and Penn Virginia Resource Partners, L.P. (incorporated by reference to Exhibit 10.2 to Registrant’s Current Report on Form 8-K filed on November 14, 2001). |
| |
(10.26)(10.15) | | Amendment No. 1 to Omnibus Agreement dated December 19, 2002 among the Penn Virginia Corporation, Penn Virginia Resource GP, LLC, Penn Virginia Operating Co., LLC and Penn Virginia Resource Partners, L.P. (incorporated by reference to Exhibit 10.9 to Registrant’s Annual Report on Form 10-K for the year ended December 31, 2002). |
| |
(10.27)(10.16) | | Units Purchase Agreement dated June 17, 2008 by and among Penn Virginia Resource LP Corp., Kanawha Rail Corp. and Penn Virginia Resource Partners, L.P. (incorporated by reference to Exhibit 10.1 to Penn Virginia Resource Partners, L.P.’s Current Report on Form 8-K filed on July 22, 2008). |
| | |
(10.28)(10.17) | | Penn Virginia Corporation and Affiliated Companies’ Employees’ 401(k) Plan (incorporated by reference to Exhibit 10.5 to Registrant’s Current Report on Form 8-K filed on October 22, 2008).* |
| |
(10.29)(10.18) | | Penn Virginia Corporation Supplemental Employee Retirement Plan (incorporated by reference to Exhibit 10.1 to Registrant’s Current Report on Form 8-K filed on October 29, 2007).* |
| |
(10.30)(10.19) | | Penn Virginia Corporation Amended and Restated Non-Employee Directors Deferred Compensation Plan (incorporated by reference to Exhibit 10.2 to Registrant’s Current Report on Form 8-K filed on October 29, 2007).* |
| |
(10.31)(10.20) | | Penn Virginia Corporation Fifth Amended and Restated 1995 Directors’ Compensation Plan (incorporated by reference to Exhibit 10.29 to Registrant’s Annual Report on Form 10-K for the year ended December 31, 2007). * |
| |
(10.32)(10.21) | | Form of Agreement for Deferred Common Stock Unit Grants under the Penn Virginia Corporation Fifth Amended and Restated 1995 Directors’ Compensation Plan (incorporated by reference to Exhibit 10.30 to Registrant’s Annual Report on Form 10-K for the year ended December 31, 2007).* |
| |
(10.33)(10.22) | | Penn Virginia Corporation Sixth Amended and Restated 1999 Employee Stock Incentive Plan (incorporated by reference to Exhibit 10.1 to Registrant’s Current Report on Form 8-K filed on February 23, 2009).* |
| (10.22.1) | | Amendment No. 1 to the Penn Virginia Corporation Sixth Amended and Restated 1999 Employee Stock Incentive Plan (incorporated by reference to Exhibit 10.2 to Registrant’s Current Report on Form 8-K filed on April 28, 2009).* |
(10.34)(10.23) | | Form of Agreement for Stock Option Grants under the Penn Virginia Corporation Sixth Amended and Restated 1999 Employee Stock Incentive Plan (incorporated by reference to Exhibit 10.6 to Registrant’s Current Report on Form 8-K filed on October 29, 2007).* |
| |
(10.35)(10.24) | | Form of Agreement for Restricted Stock Awards under the Penn Virginia Corporation Sixth Amended and Restated 1999 Employee Stock Incentive Plan (incorporated by reference to Exhibit 10.33 to Registrant’s Annual Report on Form 10-K for the year ended December 31, 2007).* |
| |
(10.36)(10.25) | | Form of Agreement for Restricted Stock Unit Awards under the Penn Virginia Corporation Sixth Amended and Restated 1999 Employee Stock Incentive Plan (incorporated by reference to Exhibit 10.2 to Registrant’s Current Report on Form 8-K filed on February 23, 2009).* |
| |
(10.37)(10.26) | | Executive Change of Control Severance Agreement dated October 17, 2008 between Penn Virginia Corporation and A. James Dearlove (incorporated by reference to Exhibit 10.1 to Registrant’s Current Report on Form 8-K filed on October 22, 2008).* |
| |
(10.38)(10.27) | | Executive Change of Control Severance Agreement dated October 17, 2008 between Penn Virginia Corporation and Frank A. Pici (incorporated by reference to Exhibit 10.2 to Registrant’s Current Report on Form 8-K filed on October 22, 2008).* |
| |
(10.39)(10.28) | | Executive Change of Control Severance Agreement dated October 17, 2008 between Penn Virginia Corporation and Nancy M. Snyder (incorporated by reference to Exhibit 10.3 to Registrant’s Current Report on Form 8-K filed on October 22, 2008).* |
| |
(10.40)(10.29) | | Executive Change of Control Severance Agreement dated October 17, 2008 between Penn Virginia Corporation and H. Baird Whitehead (incorporated by reference to Exhibit 10.4 to Registrant’s Current Report on Form 8-K filed on October 22, 2008).* |
| |
(10.41)(10.30) | | Executive Change of Control Severance Agreement dated October 17, 2008 between Penn Virginia Resource GP, LLC and Keith D. Horton (incorporated by reference to Exhibit 10.1 to Penn Virginia Resource Partners, L.P.’s Current Report on Form 8-K filed on October 22, 2008).* |
| | |
(10.42)(10.31) | | Executive Change of Control Severance Agreement dated October 17, 2008 between Penn Virginia Resource GP, LLC and Ronald K. Page (incorporated by reference to Exhibit 10.15 to Penn Virginia Resource Partners, L.P.’s Annual Report on Form 10-K for the year ended December 31, 2008).* |
TABLE OF CONTENTS
| | |
(10.43)(10.32) | | Change of Location Severance Agreement dated November 5, 2008 between Penn Virginia Corporation and Nancy M. Snyder (incorporated by reference to Exhibit 10.8 to Registrant’s Quarterly Report on Form 10-Q for the quarter ended September 30, 2008).* |
| |
| (12.1) | | Statement of Computation of Ratio of Earnings to Fixed Charges Calculation. |
| (14.1) | | Penn Virginia Corporation Code of Business Conduct and Ethics (incorporated by reference to Exhibit 14.1 to Registrant’s Current Report on Form 8-K filed on July 27, 2009). |
| (21.1) | | Subsidiaries of Penn Virginia Corporation. |
| |
| (23.1) | | Consent of KPMG LLP. |
| |
| (23.2) | | Consent of Wright & Company, Inc. |
| |
| (31.1) | | Certification Pursuant to 18 U.S.C. Section 1350, as Adopted Pursuant to Section 302 of the Sarbanes-Oxley Act of 2002. |
| |
| (31.2) | | Certification Pursuant to 18 U.S.C. Section 1350, as Adopted Pursuant to Section 302 of the Sarbanes-Oxley Act of 2002. |
| |
| (32.1) | | Certification Pursuant to 18 U.S.C. Section 1350, as Adopted Pursuant to Section 906 of the Sarbanes-Oxley Act of 2002. |
| |
| (32.2) | | Certification Pursuant to 18 U.S.C. Section 1350, as Adopted Pursuant to Section 906 of the Sarbanes-Oxley Act of 2002. |
| (99.1) | | Report of Wright & Company, Inc. dated February 21, 2010 concerning evaluation of oil and gas reserves. |
| * | Management contract or compensatory plan or arrangement. |
TABLE OF CONTENTS
SIGNATURES
Pursuant to the requirements of Section 13 or 15(d) of the Securities Exchange Act of 1934, the Registrant has duly caused this report to be signed on its behalf by the undersigned, thereunto duly authorized.
| | | | | | |
| | | | PENN VIRGINIA CORPORATION |
| | | |
February 27, 2009 | | | | By:March 1, 2010 | | By: /s/ FRANK A. PICI |
| | | | | | Frank A. Pici |
| | | | | |
Frank A. Pici
Executive Vice President and Chief Financial Officer |
| | | |
February 27, 2009 | | | | By:March 1, 2010 | | By: /s/ FORREST W. MCNAIR |
| | | | | | Forrest W. McNair |
| | | | | |
Forrest W. McNair
Vice President and Controller |
Pursuant to the requirements of the Securities Exchange Act of 1934, this report has been signed below by the following persons on behalf of the Registrant and in the capacities and on the dates indicated.
| | | | |
| | |
/s/ Robert Garrett
Robert Garrett | | Chairman of the Board and Director | | February 27, 2009March 1, 2010 |
Robert Garrett | | | | |
| | |
/s/ EDWARD B. CLOUES, II John U. Clarke
John U. Clarke | | Director | | February 27, 2009March 1, 2010 |
/s/ Edward B. Cloues, II
Edward B. Cloues, II | | Director | | March 1, 2010 |
| | |
/s/ A. JAMES DEARLOVE James Dearlove
A. James Dearlove | | Director and President and Chief Executive Officer | | February 27, 2009March 1, 2010 |
A. James Dearlove | | | | |
| | |
/s/ KEITHKeith D. HORTON Horton
Keith D. Horton | | Director and Executive Vice President | | February 27, 2009March 1, 2010 |
Keith D. Horton | | | | |
| | |
/s/ STEVEN W. KRABLIN Marsha R. Perelman
Marsha R. Perelman | | Director | | February 27, 2009March 1, 2010 |
Steven W. Krablin | | | | |
| | |
/s/ MARSHA R. PERELMAN William H. Shea, Jr.
William H. Shea, Jr. | | Director | | February 27, 2009March 1, 2010 |
Marsha R. Perelman | | | | |
| | |
/s/ WILLIAM H. SHEA, JR. Philippe van Marcke de Lummen
Philippe van Marcke de Lummen | | Director | | February 27, 2009March 1, 2010 |
William H. Shea | | | | |
| | |
/s/ PHILIPPEVAN MARCKEDE LUMMEN Gary K. Wright
Gary K. Wright | | Director | | February 27, 2009 |
Philippe van Marcke de Lummen | | | | |
| | |
/s/ GARY K. WRIGHT
| | Director | | February 27, 2009 |
Gary K. Wright | | | | March 1, 2010 |
160
146