| x | Annual Report Pursuant to Section 13 OR 15(d) of the Securities |
| o | Transition Report Pursuant to Section 13 or 15(d) of the Securities |
x No o $ the registrant's 2012 definitive proxy statement to be filed pursuant to Regulation 14A. ITEM 1.B. ITEM 5. ITEM 12. In addition, our wholesale distributing capabilities provide valuable services to both manufacturers of consumer products and convenience retailers. Manufacturers benefit from our broad retail coverage, inventory management and efficient processing of small orders. Convenience retailers benefit from our distribution capabilities by gaining access to a broad product line, optimizing inventory management and accessing trade credit. other specialty and small format stores that carry convenience products. located east of the Mississippi. We believe our expansion eastward will be accomplished by Cigarettes Food Candy Other Tobacco Products Health, Beauty & General Non-alcoholic Beverages Equipment / Other Total Food/Non-Food Products Total Net Sales U.S. Department of 32%. Total cigarette consumption also declined in Canada from the U.S. Our carton sales in Canada increased 0.9% in 2011 on a comparative basis to last year. Although we anticipate overall cigarette consumption will continue to decline, we expect to offset the majority of the impact from these declines through market share expansion, growth in our non-cigarette categories and incremental gross profit maintain or enhance their overall profitability. excise taxes. We believe this drive toward more healthy and fresh foods being sold in the convenience markets is a recognized major trend in the industry. We have invested a significant amount of capital to position our Company to have the proper infrastructure to successfully deliver these highly perishable items. Our objective is to consolidate the current fragmented nature of convenience store vendor distribution by consolidating such items as dairy and bread and to grow “fresh food” market share for the customers we service as they fight for consumer “share of stomach” for fresh foods with other retailers. Ultimately we believe the defragmentation of vendor deliveries coupled with market share gains in fresh foods for the stores we service will increase our customers' sales and profits and in turn improve our sales and profits. We operate a Valero Energy Corporation. At December 31, the Tampa, Florida division. Secondly, club wholesalers such as Costco and Sam's Club provide a limited selection of products at generally competitive prices, however, they often have limited delivery options and often no services. Finally, some large convenience retail chains have chosen self-distribution due to the geographic density of their stores and their belief that they can economically service such locations. MSA products. U.S. Days payable outstanding for both categories, excluding the impact of prepayments, during 2011, 2010 and 2009 averaged about 11 days. Administration, Finance, and Purchasing Sales and Marketing Warehousing and Distribution Total Categories a score of 900 or greater (on a possible 1,000 point scale). reports can be accessed through the “Investor Relations” section of our website, or throughwww.sec.gov. Also available on our website are printable versions of operating results. sales and profitability. leverage our distribution centers and other fixed assets. Our ability to retain existing customers and attract new customers is dependent upon our ability to provide industry-leading customer service, offer competitive products at low prices, maintain high levels of productivity and efficiency in distributing products to our customers while integrating new customers into our distribution system, and offer marketing, merchandising and ancillary services that provide value to our customers. If we are unable to execute these tasks effectively, we may not be able to attract a significant number of new customers and our existing customer base could decrease, either customers and reduce the volume of our sales and profitability. Successful integration of new operations will depend on our ability to manage those operations, fully assimilate the operations into our distribution network, realize opportunities for revenue growth presented by strengthened product offerings and expanded geographic market coverage, maintain the customer base, and eliminate redundant and excess costs. We may not realize the anticipated benefits or savings from an acquisition to the extent or in the time frame anticipated, if at all, or such benefits and savings may include higher costs than anticipated. In addition, we may assume both known and unknown liabilities as part of an acquisition which may increase the costs and risks associated with assimilating such operations. management. profitability. times. We cannot assure you that we will be able to renew our respective collective bargaining agreements on favorable terms, that employees at other facilities will not unionize and that our labor costs will not and Other Tobacco Products declining generally. suffer. liabilities. stock price. Our operations are also subject to regulation by the Occupational Safety and Health Administration, the Drug Enforcement Agency and other federal, state, provincial and local agencies. Each of these regulatory authorities has broad administrative powers with respect to our operations. Regulations, and the costs of complying with those regulations, have been increasing in recent years. If we fail to adequately comply with government regulations, Albuquerque, New Mexico Spokane, Washington Wilkes-Barre, Pennsylvania As of December 31, Our common stock trades on the NASDAQ Global Market under the symbol “CORE.” According to the records of our transfer agent, we had 29, 2012. Fiscal 2008 4th Quarter 3rd Quarter 2nd Quarter 1st Quarter Fiscal 2007 4th Quarter 3rd Quarter 2nd Quarter 1st Quarter CORE NASDAQ Index Russell 2000 Index Performance Peer Group CORE NASDAQ Index Russell 2000 Index Performance Peer Group Calendar Month/Period in which purchases were made: Mar 12, 2008—approval of share repurchase Mar 20, 2008 to Mar 31, 2008 May 1, 2008 to May 31, 2008 Jun 1, 2008 to Jun 30, 2008 Jul 1, 2008 to Jul 31, 2008 Aug 1, 2008 to Aug 31, 2008 Sept 1, 2008 to Sept 30, 2008 Oct 1, 2008 to Oct 31, 2008 Nov 1, 2008 to Nov 30, 2008 Dec 1, 2008 to Dec 31, 2008 Total Repurchases The selected consolidated financial data for the five years The following financial data should be read in conjunction with the consolidated financial statements and notes thereto and withItem 7, (in millions, except per share amounts) Statement of Operations Data: Net sales Gross profit Warehousing and distribution expenses Selling, general and administrative expenses Income from operations Interest expense, net(c) Reorganization items, net(d) Net income Per Share Data(e): Basic income per common share Diluted income per common share Shares used to compute net income per share: Basic Diluted Other Financial Data: Excise taxes(f) Cigarette inventory holding profits(g) LIFO expense Depreciation and amortization(h) Stock-based compensation Capital expenditures Balance Sheet Data: Total assets Total debt, including current maturities Canada. pricing. We continue to monitor the current macroeconomic conditions, including consumer confidence, spending, cigarette consumption, employment, inflation/deflation levels and operating results. On anticipated increase in federal excise taxes mandated by the SCHIP legislation. Net sales Net sales—Cigarettes Net sales—Food/Non-food Net sales, less excise taxes(2) Gross profit Warehousing and distribution expenses(3) Selling, general and administrative expenses Income from operations Interest expense Interest income Foreign currency transaction losses (gains), net Income before income taxes Net income average sales price per carton due primarily to were 70.4% in 2010, despite the addition of FCGC which has a lower percentage of food/non-food net sales. 2010. The increase in gross profit for 2011 was driven primarily by a $42.3 million increase in remaining gross profit, incremental cigarette inventory holding gains of $2.1 million and candy inventory holding gains of $5.9 million, both resulting from manufacturer price increases, which also contributed to a $1.7 million increase in LIFO expense. The increase in remaining gross profit was due primarily to the addition of FCGC, the new Couche-Tard business and sales increases in our food/non-food category. Net sales Net sales, less excise taxes(2) Components of gross profit: OTP tax refunds(3) LIFO expense Cigarette inventory holding profits Remaining gross profit Gross profit VCI and Fresh, to its customers. 2010. 2011 compared with 2.0%, for 2010. Net sales Net sales—Cigarettes Net sales—Food/Non-food Net sales, less excise taxes(2) Gross profit Warehousing and distribution expenses(3) Selling, general and administrative expenses Income from operations Interest expense Interest income Foreign currency transaction (gains) losses, net Income before income taxes Net income Net sales Net sales, less excise taxes(2) Components of gross profit: State of Washington OTP tax refund LIFO expense Cigarette inventory holding profits Remaining gross profit Gross profit Cigarettes Net sales Excise Taxes in Net Sales Net Sales, less excise taxes(2) LIFO expense Remaining Gross Profit(3) Remaining Gross Profit % Gross Profit(4) Gross Profit % Gross Profit % less excise taxes Food/Non-Food Products Net sales Excise Taxes in Net Sales Net sales, less excise taxes(2) LIFO expense Remaining Gross Profit(3) Remaining Gross Profit % Gross Profit(5) Gross Profit % Gross Profit % less excise taxes Totals Total Net Sales Total Excise Taxes in Net Sales Total Net Sales, less excise taxes(2) LIFO expense Remaining Gross Profit(3) Remaining Gross Profit % Gross Profit(4) (5) Gross Profit % Gross Profit % less excise taxes scheduled maturity of our debt, we expect that our current liquidity 2011 manufacturer price increases. 2011 2011 2011. 2010 Net available borrowings Amounts borrowed Outstanding letters of credit Credit Facility. $ Long-term debt(1) Purchase obligations(2) Letters of credit Operating leases Capitalized leases(3) Total contractual obligations(4)(5)(6) amount. policies currently include a deductible of $500,000 per occurrence and we maintain excess loss insurance that covers any health and welfare costs in excess of $200,000 per person per year. Gross Claims Liabilities: Workers’ Compensation Liability Auto & General Liability Health & Welfare Liability Total Gross Claims Liabilities Insurance Recoverables Reserves (net): Workers’ Compensation Liability Auto & General Liability Health & Welfare Liability Reserves (net) A 10% change in our incurred but not reported estimates would increase or decrease the estimated reserves for our plan effective December 2007. rate of compensation increases. Actual results in any given year will often differ from actuarial assumptions because of economic and other factors. In accordance with U.S. GAAP, actual results that differ from the actuarial assumptions are accumulated and amortized over future periods and, therefore, affect recognized expense and the recorded obligation in such future periods. While we believe our assumptions are appropriate, significant differences in actual results or changes in our assumptions may materially affect our pension and other assets was 7.35% for 2011 and 2010. Expected return on plan assets Discount Discount Presentation of Comprehensive Income. ASU 2011-05 requires an entity to present the total of comprehensive income, the components of net income, and the components of other comprehensive income either in a single continuous statement of comprehensive income or in two separate but consecutive statements. In full retrospective application is required. In avoid collection of applicable taxes. The competitive environment has been characterized by a continued influx of cheap products that challenge sales of higher priced and fully taxed cigarettes. Increased sales of illicit or other low priced alternatives by third parties, or sales by means to avoid the collection of applicable taxes, could have an adverse effect on our results of operations. negative impact on our liquidity. Accordingly, we may be required to obtain additional debt financing, which we may not be able to obtain on satisfactory terms or at all. Gains our gross profit, for 2010. consolidated financial statements). transactions during 2011, 2010 or 2009. (a) Financial Statements filed as part of this Annual Report on Form 10-K 1. Financial Statements A. Audited Financial Statements 2. Financial Statement Schedule Current assets: Cash and cash equivalents Restricted cash Accounts receivable, net of allowance for doubtful accounts of $8.8 million and $9.3 million, respectively (Note 5) Other receivables, net (Note 5) Inventories, net (Note 6) Deposits and prepayments (Note 5) Deferred income taxes (Note 10) Total current assets Property and equipment, net (Note 7) Deferred income taxes (Note 10) Goodwill Other non-current assets, net (Note 5) Total assets Current liabilities: Accounts payable Book overdrafts Cigarette and tobacco taxes payable Accrued liabilities (Note 5) Deferred income taxes (Note 10) Total current liabilities Long-term debt, net (Note 8) Other long-term liabilities Claims liabilities, net of current portion Pension liabilities Total liabilities Commitments and contingencies (Note 9) Stockholders’ equity: Common stock; $0.01 par value (50,000,000 shares authorized, 10,746,416 and 10,445,886 shares issued and outstanding at December 31, 2008 and December 31, 2007, respectively) Additional paid-in capital Treasury stock at cost, 396,716 shares of common stock (Note 14) Retained earnings Accumulated other comprehensive loss Total stockholders’ equity Total liabilities and stockholders’ equity Net sales Cost of goods sold Gross profit Warehousing and distribution expenses Selling, general and administrative expenses Amortization of intangible assets Total operating expenses Income from operations Interest expense Interest income Foreign currency transaction losses (gains), net Income before income taxes Provision for income taxes (Note 10) Net income Basic income per common share (Note 11) Diluted income per common share (Note 11) Basic weighted average shares (Note 11) Diluted weighted average shares (Note 11) Balance, December 31, 2005 Net income Amortization of stock-based compensation Cash proceeds from exercise of common stock Minimum pension liability adjustment, net of taxes of $0.9 SFAS No. 158 adoption adjustment, net of taxes of $0.3 Excess tax deductions associated with common stock Issuance of stock-based instruments Foreign currency translation adjustment Total comprehensive income Balance, December 31, 2006 Net income Amortization of stock-based compensation Cash proceeds from exercise of common stock FIN 48 adoption adjustments Pension plan funded status adjustment, net of taxes of $0.7 Excess tax deductions associated with common stock Issuance of stock-based instruments Foreign currency translation adjustment Total comprehensive income Balance, December 31, 2007 Net income Amortization of stock-based compensation Cash proceeds from exercise of common stock Pension plan funded status adjustment, net of taxes of $3.8 Excess tax deductions associated with common stock Issuance of stock-based instruments Repurchases of common stock Foreign currency translation adjustment Total comprehensive income Balance, December 31, 2008 Cash flows from operating activities: Net income Adjustments to reconcile net income to net cash provided by operating activities: LIFO and inventory provisions Amortization of debt issuance costs Amortization of stock-based compensation expense Bad debt expense, net Depreciation and amortization Foreign currency transaction losses (gains), net Deferred income taxes Changes in operating assets and liabilities: Accounts receivable Other receivables Inventories Deposits, prepayments and other non-current assets Accounts payable Cigarette and tobacco taxes payable Pension, claims and other accrued liabilities Income taxes payable Net cash provided by operating activities Cash flows from investing activities: Restricted cash Acquisition of business, net of cash acquired Additions to property and equipment, net Capitalization of software Proceeds from sale of fixed assets Net cash used in investing activities Cash flows from financing activities: Borrowings (repayments) under revolving credit facility, net Repurchases of common stock shares (treasury stock) Proceeds from exercise of common stock options Excess tax deductions associated with stock-based compensation (Decrease) increase in book overdrafts Net cash (used in) provided by financing activities Effects of changes in foreign exchange rates (Decrease) increase in cash and cash equivalents Cash and cash equivalents, beginning of period Cash and cash equivalents, end of period Supplemental disclosures: Cash paid during the period for: Income taxes, includes interest paid, net of refunds Interest Balance, beginning of period Net additions charged to operations Less: Write-offs and adjustments Balance, end of period Vendor receivables, net Insurance recoverables, current Other Total Deposits Prepayments Total Internally developed and other purchased software, net Insurance recoverables, net of current portion Debt issuance costs, net Insurance deposits, net of current portion Amortizable intangibles Other customer receivables Other assets Total Accrued payroll, retirement, and other benefits Claims liabilities, current Other accrued expenses Accrued customer incentives payable Total Inventories at FIFO, net of reserves Less: LIFO reserve Inventories at LIFO Delivery, warehouse and office equipment Equipment under Capital Leases Leasehold improvements Land and buildings Accumulated depreciation and amortization Total Amounts borrowed (Credit Facility) Obligations under Capital Leases Total Long-term debt Net available borrowings Amounts borrowed Outstanding letters of credit Year Ending December 31, 2009 2010 2011 2012 2013 Thereafter Current: Federal State Foreign Total current tax provision Deferred: Federal State Foreign Total deferred tax (benefit) provision Income tax provision Federal income tax provision at the statutory rate Increase (decrease) resulting from: State income taxes, net of federal benefit Decrease in unrecognized tax benefits Effect of foreign operations Change in valuation allowances Other, net Income tax provision Deferred tax assets: Employee benefits, including post-retirement benefits Trade and other receivables Inventories Goodwill and intangibles Self-insurance reserves State taxes Other Subtotal Less: valuation allowance Net deferred tax assets Deferred tax liabilities: Property and equipment Deferred income Other Total deferred tax liabilities Total net deferred tax assets Net current deferred tax assets Net non-current deferred tax assets Balance at beginning of year Lapse of statute of limitations Other Balance at end of year Net Income Weighted Average Shares Outstanding Net Income Common Share Net Income Weighted Average Shares Outstanding Net Income Common Share Net Income Weighted Average Shares Outstanding Net Income Common Share Basic EPS 2004 Long-Term Incentive Plan—Restricted Stock Units and Options 2005 Long-Term Incentive Plan—Restricted Stock Units 2004 Directors Equity Incentive Plan 2005 Directors Equity Incentive Plan 2007 Long-Term Incentive Plan(1) Expected life (years) Risk-free interest rate Volatility Dividend yield Weighted-average fair value per share of grants: Stock options Restricted stock units Performance shares Directors’ Directors’ Expected to Vest(2) Change in Benefit Obligation: Obligation at beginning of period Interest cost Actuarial loss (gain) Benefit payments Benefit obligation at end of period Change in Pension Plan Assets: Fair value of pension plan assets at beginning of period Actual return on plan assets Employer contributions Benefit payments Fair value of pension plan assets at end of period Funded Status: Funded status Projected benefit obligation Accumulated benefit obligation Fair value of pension plan assets Interest cost Expected return on plan assets Net periodic benefit cost Interest cost Amortization of net actuarial loss Net periodic other benefit cost Benefit Obligations: Discount rate Net Periodic Benefit Costs: Discount rate Expected return on assets Assumed current trend rate for next year Ultimate year trend rate Year that ultimate trend rate is reached Effect on total of service and interest cost components of net periodic postretirement health care benefit cost Effect on the health care component of the accumulated postretirement benefit obligation Asset Category Equity securities Debt securities Insurance contracts Other Year ended December 31, 2009 2010 2011 2012 2013 2014 through 2018 Net loss during 2007 Net loss during 2008 Year ended December 31, 2007 Current liabilities Non-current liabilities Accumulated other comprehensive loss Year ended December 31, 2008 Current liabilities Non-current liabilities Accumulated other comprehensive loss Expected amortization of net loss Net sales(8) Net sales—Cigarettes Net sales—Food/Non-food Cigarette inventory holding profits(1) Gross profit Warehousing and distribution expenses(7) Selling, general and administrative expenses Income from operations Interest expense(5) Interest income Foreign currency transaction losses, net Net income Basic net income per share(6) Diluted net income per share(6) Shares used in computing basic net income per share Shares used in computing diluted net income per share Depreciation and amortization Stock-based compensation Excise taxes(8) Net sales(9) Net sales—Cigarettes Net sales—Food/Non-food Cigarette inventory holding profits(1) Gross profit Warehousing and distribution expenses(8) Selling, general and administrative expenses Income from operations Interest expense(6) Interest income Foreign currency transaction (gains) losses, net Net income Basic net income per share(7) Diluted net income per share(7) Shares used in computing basic net income per share Shares used in computing diluted net income per share Depreciation and amortization Stock-based compensation Excise taxes(9) Net sales: United States Canada Corporate adjustments and eliminations Total Income before income taxes: United States Canada Corporate adjustments and eliminations Total Interest expense: United States Canada Corporate adjustments and eliminations Total Interest income: United States Canada Corporate adjustments and eliminations Total Depreciation and amortization: United States Canada Corporate adjustments and eliminations Total Identifiable assets: United States Canada Total Cigarettes Food Candy Other Tobacco Products Health, Beauty & General Non-Alcoholic Beverages Equipment / Other Total Food/Non-Food Products Total Net Sales opinions. The information required by this item is included in our Proxy Statement for the The information required by this item is included in our Proxy Statement for the The information required by this item is included (i) in our Proxy Statement for the Delaware 20-1489747 (State or other jurisdiction of incorporation or organization) (I.R.S. Employer Identification No.) (650) 589-9445 (Address of Principal Executive Offices, including Zip Code) ( Registrant’sRegistrant's Telephone Number, Includingincluding Area Code)registered:registeredCommon Stock, par value $0.01 per share NASDAQ Global Market ¨o No x¨o No x¨oregistrant’sregistrant's knowledge, in definitive proxy or information statements incorporated by reference in Part III of this Form 10-K or any amendment to this Form 10-K. ¨o(Check one):¨o¨o ¨o(Do not check if a smaller reporting company).¨o No xstockequity held by non-affiliates computed by reference to the closingprice at which the common equity was last sold, or the average bid and asked price of thesuch common stockequity, as of June 30, 2008,2011, the last business day of the registrant’sregistrant's most recently completed second fiscal quarter: $277,773,841.Indicate by check mark whether397,712,744.has filed all reports required to be filed by Section 12, 13 or 15(d) of the Securities Exchange Act of 1934 subsequent to the distribution of securities under a plan confirmed by the court. Yes x No ¨As of February 27, 2009, the Registrant had 10,809,69211,398,254 shares of its common stock issued and outstanding.See Partsand IV. Registrant’s Proxy Statement for the 2009 Annual Meeting of Stockholders isthis Form 10-K will be included in an amendment to this Form 10-K or incorporated by reference to Part III in this Form 10-K. Page PagePART I ITEM 1.1ITEM 1.A.RISK FACTORS10 19ITEM 2. 20ITEM 3. LEGAL PROCEEDINGS20ITEM 4.20PART II 21 24 27 47 48 82 82ITEM 9.B. 84PART III ITEM 10.85ITEM 11.EXECUTIVE COMPENSATION85 85 85 85PART IV 86 FORWARD LOOKINGFORWARD-LOOKING STATEMENTSExcept for historical information, the statements madePrivate Securities Litigation ReformExchange Act of 1995. Forward-looking statements are based on certain assumptions or estimates, discuss future expectations, describe future plans1934 and strategies, contain projectionsthe Securities Act of results of operations or of financial condition or state other forward-looking information. Our ability to predict results or the actual effect of future plans or strategies is inherently uncertain.Although we believe that the expectations reflected in such forward-looking statements are based on reasonable assumptions, actual results and performance could differ materially from those set forth in the forward-looking statements. 1933.These forward-lookingForward-looking statements are made only as of the date of this Form 10-K and are based on theour current intent, beliefs, plans and expectations of our management and are subject to certainexpectations. They involve risks and uncertainties that could cause actual results to differ materially from historical results or those discusseddescribed in or implied by such forward lookingforward-looking statements.Factorsmightcould cause or contributeactual results and events to differ materially from such differences include, but are not limited to our dependence on the convenience retail industry for our revenues; uncertain and recent economic conditions; competition; price increases; our dependence on relatively few suppliers; the low-margin nature of cigarette and consumable goods distribution; certain distribution centers’ dependence on a few relatively large customers; competitionforward-looking statements is included in the labor market and collective bargaining agreements; product liability claims and manufacturer recalls of products; fuel price increases; our dependence on our senior management and key personnel; integration of acquired businesses; currency exchange rate fluctuations; our ability to borrow additional capital; governmental regulations and changes thereto; earthquake and natural disaster damage; failure or disruptions to our information systems; a general decline in cigarette sales volume; competition from sales of deep-discount brands and illicit and other low priced sales of cigarettes. Refer to Part I, Item 1A, “Risk Factors” of this Form 10-K. Except as providedrequired by law, we undertake no obligation to publicly update or revise any forward-looking statements, whether as a result of new information, future events or otherwise.ITEM 1.BUSINESSleading wholesale distributorslargest marketers of fresh and broad-line supply solutions to the convenience retail industry in North America in terms of annual sales, and providesproviding sales and marketing, distribution and logistics services to customer locations across the United StatesU.S. and Canada. Our origins date back to 1888, when Glaser Bros., a family-owned-and-operated candy and tobacco distribution business, was founded in San Francisco.Wholesale distributors provide valuable services to both manufacturers of consumer products and convenience retailers. Manufacturers benefit from wholesale distributors’ broad retail coverage, inventory management and efficient processing of small orders. Wholesale distributors provide convenience retailers access to a broad product line, the ability to place small quantity orders, inventory management and access to trade credit. In addition, large full-service wholesale distributors, such as Francisco, California.offeroffers retailers the ability to participate in manufacturer and Company sponsoredCompany-sponsored sales and marketing programs, merchandising and product category management services, as well as the use of information systems that are focused on minimizing retailers’retailers' investment in inventory, while seeking to maximize their sales.2007,2010, based on the NACS Association for Convenience and PetroleumFuel Retailing [formerly known as the National Association of Convenience Stores (NACS)], 20082011 State of the Industry (SOI)(“SOI”) Report, total in-store sales at convenience retail locations approximated $169increased 4.4% to approximately $190.4 billion and were generated through an estimated 146,000 stores across the United States.U.S. According to a more recent report from NACS, the number of convenience stores in the U.S. grew 1.2% in 2011 to approximately 148,000 stores. We estimate that 45% to 55%approximately 50% of the products that these stores sell are supplied by wholesale distributors such as Core-Mark. The convenience retail industry gross profit for in-store sales was approximately $45$60.1 billion in 20072010 and $44$58.6 billion in 2006.2009. Over the ten years from 19972000 through 2007,2010, convenience in-store sales increased by a compounded annual growth rate of 7.6%6.2%. Two of the factors influencing this growth were a 9.1% compounded annual growth rate in average cigarette sales for convenience retail locations and a 3.0% compounded annual growth rate in the number of stores.approximately 24,000over 28,000 customer locations in all 50 states of the Unites StatesU.S. and 5five Canadian provinces. The products we distribute include cigarettes, other tobacco products, candy, snacks, fast food, groceries, fresh products, dairy, non-alcoholicbread, beverages, general merchandise and health and beauty care products. We service traditional convenience stores as well as alternative outlets selling convenience products. Our traditional convenience store customers include many of the major national and super-regional convenience store operators, as well as thousands of multimulti- and single-store customers. Our alternative outlet customers comprise a variety of store formats, including druggrocery stores, grocerydrug stores, liquor stores, cigarette and tobacco shops, hotel gift shops, correctional facilities, military exchanges, college bookstores, casinos, video rental stores,movie theaters, hardware stores, airport concessions and airport concessions.in 14 states and Canada, including (excluding two distribution centers thatfacilities we operate as a third-partythird party logistics provider.provider) in the U.S. and Canada. We distribute approximately 42,000 SKUs (Stockin excess of 45,000 Stock Keeping Units)Units ("SKUs") of packaged consumable goods to our customers and also provide an array of information and data services that enable our customers to better manage retail product sales and marketing functions.2008,2011, our consolidated net sales increased 8.7%11.7% to $6,044.9 million$8.1 billion from $5,560.9 million$7.3 billion in 2007.2010. Cigarettes comprised approximately 68.2%70.4% of total net sales in 2008,2011, while approximately 71.0%68.3% of our gross profit was generated from food/non-food products.Francisco.Francisco, California. The executive management team, comprised of our CEO and 14 senior managers, has largely overseen the operationsan average tenure of Core-Mark for more than a decade, bringing theirover 16 years and applies its expertise to critical functional areas including logistics, sales and marketing, purchasing, information technology, finance, business development, human resources and retail store support.InnovativeInnovation & Flexible.Flexibility. Wholesale distributors typically provide convenience retailers access to a broad product line, the ability to place small quantity orders, inventory management and access to trade credit. As a large, full-service wholesale distributor we offer retailers the ability to participate in manufacturer and Company sponsoredCompany-sponsored sales and marketing programs, merchandisingretailers’retailers' investment in inventory, while seeking to maximize their sales.profitability and cash flow.profitability. To achieve that objective, we have become one of the largest marketers of fresh and broad-line supply solutions to the convenience retail industry in North America. In order to further enhance our value to the retailer, we plan to:(VCI)(“VCI”).We expect our VCI program will allow us to grow by capitalizing on the highly fragmented nature of the distribution channel that services the convenience retail industry. A convenience retailer generally receives their store merchandise through a large number of unique deliveries. This represents a highly inefficient and costly process for the individual stores. Today, we estimate that Core-Mark sells about 50% of what a convenience retailer purchases from their vendors. Our VCI program offers convenience retailersthe retailer the ability to receive one deliverymultiple weekly deliveries for the bulk of their products, including dairy and other perishable items, thus simplifyingmerchandise they would historically purchase from direct-store-delivery companies. This simplifies the supply chain and eliminatingas a by-product, retailers will improve inventory turns and working capital, eliminate operational costs.and transaction costs, and they will also greatly diminish their out-of-stocks on best-selling items.WeTo meet this expected demand, we have modified and upgraded our refrigerated capacity, including investing in chill docks state-of-the-art ordering devices and tri-temperature trailers, which enables us to deliver a significant range of chilled items including milk, produce and other fresh foods to retail outlets. We now have established partnerships with strategically located bakeries and commissaries to further enable us to deliver the in-house expertisefreshest product possible, with premium consumer items such as sandwiches, wraps, cut-fruit, parfaits, pastry, doughnuts, bread and experiencesome home meal replacement entrées (“HMR”). We continue to properly source, handle and market this highly perishable product line. We intend on expandingexpand the deliveryarray of fresh food and dairy products through the development of unique and comprehensive marketing programs. In addition, we have launchedprograms, including equipment programs that assist the retailer in obtaining the proper equipment to showcase their “fresh” product offering. We believe our investments in infrastructure, combined with our strategically located suppliers and in-house expertise, position us as the leader in providing fresh products and programs to convenience stores. Proper execution of VCI, with the cornerstone being dairy distribution, affords Core-Mark the critical mass necessary to offer retailers a rebranding program to properly reflectmultiple weekly delivery platform, which ensures the role this new fresh product line will play in the Company’sproper handling and the industry’s future.dating of "Fresh" products.expandingcontinuing to expand our presence east of the Mississippi. According to theThe Association for Convenience and Petroleum& Fuel Retailing 20082011 SOI Report, during 2007,2010, aggregate United StatesU.S. traditional convenience retail in-store sales were approximately $169$190.4 billion through approximately 146,000 stores with mostthe majority of those storesacquiringgaining new customers, both national and regional, through a combination of exemplary service, VCI programs, fresh product deliveries, innovative marketing strategies, and competitive pricing. In addition, we intend to explore selectpricing and acquisitions of other wholesale distributors which complementsmaller distributors.business. eastward expansion include:June 2006,September 2011, we signed a distribution agreement with Alimentation Couche-Tard, Inc. ("Couche-Tard") to service approximately 970 additional Couche-Tard corporate stores within Couche-Tard's Southeast, Gulf Coast and Florida markets. This distribution agreement led to the addition of our newest distribution facility located in Tampa, Florida.Klein Candy Company, L.P. (“Pennsylvania division”) surrounding states, which has provided Core-Mark with additional infrastructure and market share in the Southeastern region of the U.S. (See Note 3 --Acquisitions to further our eastern expansion. consolidated financial statements).January 2008, we opened a new distribution facility near Toronto, Ontario. This new facility expanded our existing market geography in Canada. In June 2008,August 2010, we acquired Auburn MerchandiseFinkle Distributors, Inc., (“AMD” or “New England division”FDI”), a convenience wholesaler servicing customers in New York, Pennsylvania and the surrounding states, to furthercontinue to expand our presence and infrastructuremarket share in the Northeastern region of the United StatesU.S. (See Note 3—Acquisitions)3 --Acquisitions to our consolidated financial statements).us being ableour ability to deliver consistently high levels of service, innovative marketing programs and information technology and logistics support. To that fundamental end, we are committed to further improving our operational efficiencies in our distribution centers while containing our costs in order to enhance profitability. To further enhance our competitive advantage, we have been one of the first to recognize emerging trends and to offer to the retailerretailers our unique marketing programs such as VCI and Fresh. In addition, we continue to roll out our Focused Marketing Initiative (“FMI”). This program is designed to drive deeper entrenchment with our customer base and to further differentiate ourselves in the market place. The FMI program is centered on increasing the profitability of the independent store through improved category insights and store management, maximizing geographic specific consumer preferences and habits as well as other available data resources. We believe this innovationour innovative approach which focuses on building a trusted partnership with our customers has established us as the market leader in providing valuable marketing and supply chain solutions into the convenience retail industry.approximately 24,000over 28,000 customer locations in all 50 states of the United StatesU.S. and 5five Canadian provinces. Our customers represent many of the large national and regional convenience retailers in the United StatesU.S. and Canada and leading alternative outlet customers. Our top ten customers accounted for approximately 30.1%31.5% of our net sales in 2008, while our largest2011. While no single customer accounted for approximately 7.5%10% or more of our total net sales in 2008.2011, Couche-Tard grew to approximately 13% of our net sales in the fourth quarter of 2011 due largely to sales under the new distribution agreement.(in(dollars in millions): Year ended December 31, 2011 2010 2009 Net Sales % of Net Sales Net Sales % of Net Sales Net Sales % of Net Sales Cigarettes $ 5,710.6 70.4 % $ 5,119.7 70.5 % $ 4,589.1 70.3 % Food 995.7 12.3 % 840.9 11.6 % 738.0 11.3 % Candy 459.8 5.7 % 426.0 5.8 % 405.0 6.2 % Other tobacco products 607.9 7.5 % 503.6 6.9 % 434.0 6.6 % Health, beauty & general 237.5 2.9 % 220.6 3.0 % 209.5 3.2 % Beverages 100.9 1.2 % 152.0 2.1 % 151.7 2.3 % Equipment/other 2.5 — % 4.0 0.1 % 4.3 0.1 % Total food/non-food products 2,404.3 29.6 % 2,147.1 29.5 % 1,942.5 29.7 % Total net sales $ 8,114.9 100.0 % $ 7,266.8 100.0 % $ 6,531.6 100.0 % 2008 2007 2006 Net Sales % of Net
Sales Net Sales % of Net
Sales Net Sales % of Net
Sales $ 4,124.8 68.2 % $ 3,863.1 69.5 % $ 3,783.8 71.2 % 710.1 11.7 % 596.7 10.7 % 522.4 9.8 % 401.3 6.7 % 349.8 6.3 % 318.3 6.0 % 402.7 6.7 % 353.4 6.4 % 322.6 6.1 % 220.1 3.6 % 206.2 3.7 % 187.7 3.5 % 180.9 3.0 % 186.4 3.4 % 174.3 3.3 % 5.0 0.1 % 5.3 0.1 % 5.3 0.1 % 1,920.1 31.8 % 1,697.8 30.5 % 1,530.6 28.8 % $ 6,044.9 100.0 % $ 5,560.9 100.0 % $ 5,314.4 100.0 % United StatesU.S. and Canadian manufacturers. With cigarettes accounting for approximately $4,124.8$5,710.6 million or 68.2%70.4% of our total net sales and 29.0%31.7% of our total gross profit in 2008,2011, we control major purchases of cigarettes centrally in order to optimize inventory levels and purchasing opportunities. The daily replenishment of inventory and brand selection is controlled by our distribution centers.United Statessince 1980.over the last ten years. Based on 20072011 statistics provided by the Tobacco Merchants Association (TMA)(“TMA”) published in early 20082012 and compiled from the United StatesAgriculture-EconomicAgriculture - Economic Research Service, total cigarette consumption in the United StatesU.S. declined from 480444 billion cigarettes in 19972001 to 362300 billion cigarettes in 2007,2011, or a 25% reduction in consumption. Prior to 2007, we had benefitted from a shift in cigarette and tobacco sales to the convenience retail segment. According to the most recent statistic available on the growth of cigarette sales in the convenience retail segment in the NACS 2007 SOI Report (which includes data through December 31, 2006), the convenience retail portion of aggregate United States cigarette sales increased from approximately 54% in 1999 to 64% in 2006. In 2007, convenience retailers were the largest trade class for cigarette sales accounting for approximately 69% of total industry volume according to the R.J. Reynolds’ 2007 Industry Report.45.541 billion cigarettes in 19972001 to 14.125 billion cigarettes in 2007,2011, or a 69%39% reduction in consumption, accordingbased on the 2011 statistics provided by TMA. In 2011 our carton sales increased 9.2% due to consumption statistics publishedthe incremental sales attributable to the FCGC and FDI acquisitions, the new distribution agreement with Couche-Tard and one additional selling day this year compared to 2010. Excluding these items, carton sales decreased 1.9% in 2008 by Canada’s central statistical agency, Statistics Canada.declined 1.0%decline in 2008 and 1.4% in 2007, excluding carton sales made by the new divisions, Toronto and New England. The shift in cigarette carton sales from other channelsorder to the convenience retail segment may no longer be adequate to compensate for consumption declines.thesestate, local and provincial excise taxes from our customers and remit these amounts to the appropriate authorities. Excise taxes are a significant component of our revenuenet sales and cost of sales. During 2008,2011, we included in net sales approximately $1,474.4$1,951.5 million of state, local and provincial excise taxes. As of December 31, 2008,2011, state cigarette excise taxes in the United StatesU.S. jurisdictions we serve ranged from $0.07$0.17 per pack of 20 cigarettes in South Carolinathe state of Missouri to $2.75$4.35 per pack of 20 cigarettes in the state of New York. In the Canadian jurisdictions we serve, provincial excise taxes ranged from C$2.47 per pack of 20 cigarettes in Ontario to C$4.205.72 per pack of 20 cigarettes in the Northwest Territories.In the United States, legislation was introduced in 2008 to fund the State Children’s Health Insurance Program (SCHIP) by raising the federal cigarette excise tax from 39¢ to $1.01 per pack. Federal excise taxes are levied on the manufacturers who pass the tax is includedon to us as part of the product cost and thus are not a component of our product cost charged by the manufacturer. The legislation, which was signed into law in February 2009, becomes effective on April 1, 2009.Food and Non-FoodFood/Non-food Products.TheOur food category includesproducts include fast food, candy, snacks, groceries, beverages, fresh products such as sandwiches, juices, salads, produce, dairy and bread. FoodOur non-food products include cigars, tobacco, health and Non-foodbeauty care products, general merchandise and equipment. Net sales of the combined food/non-food product categories were $1,920.1grew 12.0% in 2011 to $2,404.3 million, which was 29.6%of our total net sales. Excluding a reduction in our beverage product category resulting from the movement of Gatorade to a direct-store-delivery format during the first quarter of 2011, net sales in 2008 and account for approximately 31.8% of our sales, however, thesefood/non-food category increased 15.6% in 2011 compared to 2010. Gross profits for food/non-food categories represented approximately 71.0%grew $30.8 million, or 11.6%, to $296.7 million, which was 68.3% of our total gross profit. We structureFood/non-food products generated gross margins of 13.40% excluding excise taxes in 2011, while the cigarette category generated gross margins of 3.48% excluding excise taxes.marketingkey business strategies, VCI and merchandising programs around theseour fresh initiative, focus primarily on the higher margin categories in the food group. These categories include milk, fresh bread, fresh sandwiches, fresh fruit, fresh produce, fresh baked goods, home replacement meals and other fresh and natural products.3,8004,300 trade suppliers and manufacturers located across the United StatesU.S. and Canada. In 2008,2011, we purchased approximately 61%63% of our products from our top 20 suppliers, with our top two suppliers, Philip Morris and R.J. Reynolds, representing approximately 27% and 14% of our purchases, respectively. We coordinate our purchasing from suppliers by negotiating, on a corporate-wide basis, special arrangements to obtain volume discounts and additional incentives, while also taking advantage of promotional and advertisingmarketing incentives offered to us as a wholesale distributor. In addition, buyers in each of our distribution facilities purchase products, particularly food, directly from the manufacturers, improving product mix and availability for individual marketsmarkets.reducinghigher gross profits during the warm weather months (May through September) than in other times throughout the year. We believe this occurs because the convenience store industry which we serve tends to be busier during this period due to vacations and travel by consumers. During the second and third quarters of 2011, 2010 and 2009, we generated approximately 53% of our inventory investment.net sales for each fiscal year.Operationstotalnetwork of 26 distribution centers consisting(excluding two distribution facilities we operate as a third party logistics provider). In 2011, we acquired FCGC in Arkansas and we added a distribution center in Tampa, Florida initially to support a new distribution agreement with Couche-Tard by servicing their Southeast, Gulf Coast and Florida regions. Twenty-two of 22our distribution centers are located in the United StatesU.S. and four are located in Canada as of December 31, 2008.Canada. The map below describesdepicts the scope of our operations and distribution centers.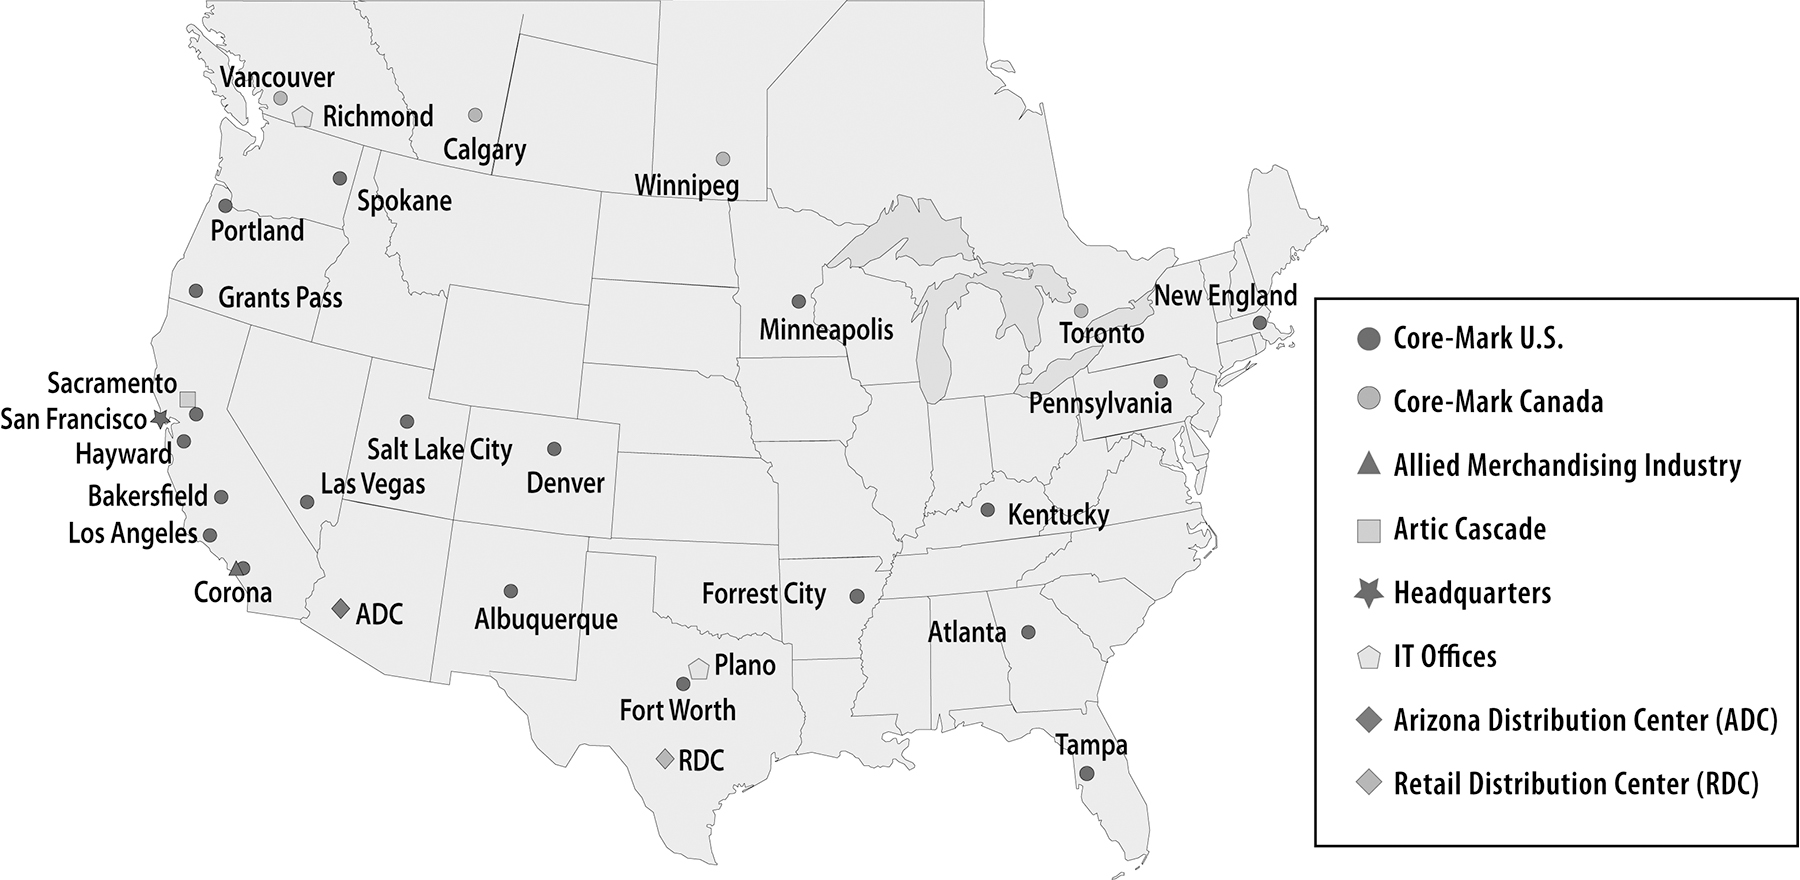
United States,U.S., Artic Cascade and Allied Merchandising Industry, are consolidating warehouses which buy products from our suppliers in bulk quantities and then distribute the products to many of our other distribution centers. By using Artic Cascade, located in Sacramento, California, to obtain products at lower cost from frozen product vendors, we are able to offer a broader selection of quality products to retailers at more competitive prices. Allied Merchandising Industry, located in Corona, California, purchases the majoritya portion of our non-foodnon-cigarette products, other than cigarettesprimarily health and tobacco products,beauty care and general merchandise items, for our distribution centers enabling us to reduceoptimize our overall general merchandise and health and beauty care product inventory.inventory to meet the needs of our customers. We operate two additional facilities as a third party logistics provider. One distribution facility located in Phoenix, Arizona, referred to as the Arizona Distribution Center (ADC)(“ADC”), is dedicated solely to supporting the logistics and management requirements of one of our major customers, Alimentation Couche-Tard.Couche-Tard, Inc. The second distribution facility located in San Antonio, Texas, referred to as the Valero Retail Distribution Center (RDC)(“RDC”), is dedicated solely to supporting another major customer, Valero.totaling approximately 42,000in excess of 45,000 SKUs, including approximately 4,900 SKUs ofover 2,000 cigarette and other tobacco products, from our suppliers and manufacturers. We offer customers a variety of food and food/non-food products, including fast food, candy, snacks, fast food, groceries, fresh products, dairy, non-alcoholicbread, beverages, other tobacco products, general merchandise and health and beauty care products.is comprisedconsists of a mix of dry, frozen and chilled products. Our receivers, stockers, order selectors, stampers, forklift drivers and loaders received, stored and picked nearly 435approximately 476 million, 407454 million and 405426 million items (a carton of 10 packs of cigarettes is one item) or 6671 million, 6471 million and 5965 million cubic feet of product, during the years ended December 31, 2008, 20072011, 2010 and 2006,2009, respectively, while limiting the service error rate to approximately threetwo errors per thousand items shipped(Note—these performance metrics do not include those of the Pennsylvania division prior to Core-Mark integrating them into our distribution system on October 1, 2006, and those of our New England division—See Note 3—Acquisitions). in 2011.or DCMS,("DCMS") platform provides our distribution centers with the flexibility to adapt to our customers’customers' information technology requirements in an industry that does not have a standard information technology platform. Actively integrating our customers intoonto our platform is a priority which enables fast, efficient and reliable service.Distribution2008,2011, we had approximately 9081,128 transportation department personnel, including delivery drivers, shuttle drivers, routers, training supervisors and managers who focus on achieving safe, on-time deliveries. Our daily orders are picked and loaded nightly in reverse order of scheduled delivery. At December 31, 2008,2011, our trucking fleet consisted of approximately 671700 tractors, trucks and vans, of which nearly all were leased. We have made a significant investment over the past few years in upgrading our trailer fleet to tri-temperature (“tri-temp”) which gives us the capability to deliver frozen, chilled and non-refrigerated goods in one delivery. As of December 31, 2008, over 40%2011, approximately 70% of our fleet consisted oftrailers were tri-temp, trailers with the remainder capable of delivering refrigerated and non-refrigerated foods. This provides us the multiple temperature zone capability needed to support our focus on delivering fresh products to our customers. Our fuel consumption costs for 20082011 totaled approximately $9.4$13.0 million, net of fuel surcharges passed on to customers, which represented an increase of approximately $2.4$3.5 million, from $7.0$9.5 million in 20072010, due to increasedhigher fuel prices, a 5.9% increase in miles driven, the acquisition of FCGC and the additionsaddition of two new divisions.2008,2011, there were approximately 350300 wholesale distributors toserving traditional convenience retailers in the United States.U.S. We believe that Core-Mark and McLane Company, Inc., a subsidiary of Berkshire Hathaway, Inc., and Core-Mark are the two largest convenience wholesale distributors measured(measured by annual sales,sales) in North America. There are alsotwo other large regional companies that provide products to specific regionsareas of the country, such as The H.T. Hackney Company in the Southeast and Eby-Brown Company in the Midwest and Mid-Atlantic and Southeast and GSC Enterprises, Inc. in Texas and surrounding states, andregions. In addition there are several hundred local distributors serving small regional chains and independent convenience retailers. In Canada, there are fewertwo large regional players, aside from Core-Mark, that make up the competitive landscape, Karrys Wholesale Distributors and Wallace and Carey, Inc.distributors compared to the United States. In addition,supply channels, we face potential competition from at least three other supply avenues. First, certain manufacturers such as Budweiser, Miller-Coors, Coca-Cola, bottlers, Frito Lay,Frito-Lay and Interstate BakeriesPepsiCo deliver their products directly to convenience retailers.decentralized distribution centers, order fulfillment rates, on time deliveries,on-time delivery performance using delivery equipment sized for the small format store, innovative marketing solutions and merchandising support, as well as competitive pricing. At least oneWe believe this represents a contrast to some large competitors who offer a standardized logistics approach, with emphasis on uniformity of our major competitors currently operatesproduct lines, and company determined delivery schedules using large delivery equipment designed for large format stores. We believe this emphasis on a standardized logistics model that concentrates onapproach, while it allows for competitive pricing, using large distribution centersis not best suited for retailers looking for more customized solutions and providingsupport from their supply partners in addition to competitive order fulfillment rates. This logistics model, however, may result in less certain delivery times and could leave the customer to perform all of the merchandising functions. Many of ourpricing. Alternatively, some small competitors focus on customer service from small distribution facilities and concentrate on long-standing customer relationships.relationships but often lack the range of offerings of the larger distributor. We believe that our unique combination of service, marketing solutions and price is a compelling combination that is highly attractive to customersretailers and mayhelps to enhance their growth and profitability.industry’sindustry's Master Settlement Agreement (MSA)(“MSA”), which was signed in November 1998. Since then, we have experienced increased wholesale competition for cigarette sales. Competition amongst cigarette wholesalers is based primarily on service, price and variety, whereas competition amongst manufacturers for cigarette sales is based primarily on brand positioning, price, product attributes, consumer loyalty, promotions, advertisingmarketing and retail presence. Cigarette brands produced by the major tobacco product manufacturers generally require competitive pricing, substantial marketing support, retail programs and other financial incentives to maintain or improve a brand’sbrand's market position. Historically, major tobacco product manufacturers have had a competitive advantage in the United StatesU.S. because significant cigarette marketing restrictions and the scale of investment required to compete made gaining consumer awareness and trial of new brands difficult. also face competition from the diversion into the U.S. and Canadian markets of cigarettes intended for sale outside of such markets, the sale of cigarettes in non-taxable jurisdictions, inter-state/provincial and international smuggling of cigarettes, the sale of counterfeit cigarettes by third parties, increased imports of foreign low priced brands, the sale of cigarettes by third parties over the internet and by other means designed to avoid collection of applicable taxes, includingtaxes. The competitive environment has been characterized by a continued influx of cheap products that challenge sales of higher priced and fully taxed cigarettes. sale of cigarettes in non-taxable jurisdictions, imports of foreign low priced brands, and the diversion into the United States market of cigarettes intended for sale outside the United States. The competitive environment has been impacted by alternative smoking products, such as snus and snuff, and highersnuff. In addition, cigarette prices continue to rise due to higher statecontinuing pressure on taxing jurisdictions to raise revenues through excise taxes andtaxes. Further, cigarette list price increasesprices have historically increased for cigarettes manufactured bythose manufacturers who are parties to the MSA. As a result, the lowest of manufacturers of numerous small share brands manufactured by companies that are not parties to the MSAnon-MSA participants have held their market share, putting profitability pressure on the profitability of premium cigarettes.9nine days for 20082011, 2010 and 10 days for 2007.2009. Credit terms may impact pricing and are competitive within our industry. An increasing number of our customers remit payment electronically, which facilitates efficient and timely monitoring of payment risk. Canadian days sales outstanding in receivables tend to be lower as Canadian industry practice is for shorter credit terms than those in the United States.items.items and periodically we may carry higher levels of inventory to take advantage of manufacturer price increases. The number of days of cost of sales in inventory averaged about 16 days during 2011 and about 15 days during 20082010 and 2007.2009. The increase of one day cost of sales in 2011 compared to 2010 was driven primarily by speculative purchases to take advantage of expected price increases by manufacturers. and consistent with our credit standing. We take advantage of the full complement of vendorterm offerings, including early payment terms. Our dayswhich may include enhanced cash discounts for earlier payment. Terms for our accounts payable outstanding during 2008 averaged 12 days, includingand cigarette and tobacco taxes payable as compared to 11 days for 2007, with a range ofanywhere from three days prepaid to 3060 days credit.EmployeesAsThe following chart provides a breakdown of our employees by function and geographic region (including employees at our third party logistic facilities) as of December 31, 2008, we had 4,181 employees, including 578 in administration, finance and purchasing, 1,026 in sales and marketing, and 2,577 in warehousing and distribution functions. Of these employees, 457 employees are located in Canada and the remainder in the United States. 2011: U.S. Canada Total Sales and Marketing 1,095 47 1,142 Warehousing and Distribution 2,792 248 3,040 Management, Administration, Finance and Purchasing 569 101 670 Total Categories 4,456 396 4,852 employ peoplehave employees who are covered by collective bargaining agreements with local affiliates of The International Brotherhood of Teamsters (Hayward and Las Vegas) and United Food and Commercial Workers (Calgary). Approximately 199188 employees, or 4.8%3.9% of our workforce, are unionized. There have been no disruptions in customer service, strikes, work stoppages or slowdowns as a result of union activities, and we believe we have satisfactory relations with our employees.TOTAL EMPLOYEES BY BUSINESS FUNCTIONS December 31, 2008 United States Canada Total
Core-Mark Employees 478 100 578 974 52 1,026 2,272 305 2,577 3,724 457 4,181 United StatesU.S. Food and Drug Administration (FDA)("FDA"). The FDA regulates the holding requirements for foods through its current good manufacturing practice regulations, specifies the standards of identity for certain foods and prescribes the format and content of certain information required to appear on food product labels. A limited number of the over-the-counter medications that we distribute are subject to the regulations of the United StatesU.S. Drug Enforcement Administration. In Canada, similar standards related to food and over-the-counter medications are governed by Health Canada. The products we distribute are also subject to federal, state, provincial and local regulation through such measures as the licensing of our facilities, enforcement by state, provincial and local health agencies of relevant standards for the products we distribute and regulation of the our trade practices in connection with the sale of our products. Our facilities are inspected periodically by federal, state, provincial and local authorities, including the Occupational Safety and Health Administration under the United StatesU.S. Department of Labor, which require us to comply with certain health and safety standards to protect our employees.United StatesU.S. Department of Labor, which sets employment practice standards for workers, and the United StatesU.S. and Canadian Departments of Transportation, which regulate transportation of perishable goods, and similar state, provincial and local agencies. ComplianceNon-compliance with, or significant changes to, these laws has not had and is not anticipated toor the implementation of new laws, could have a material effect on our results of operations.(AIB)(“AIB”). The AIB publishes standards as a tool to permit operators of distribution centers to evaluate the food safety risks within their operations and determine the levels of compliance with the standards. AIB conducts an inspection which is composed of food safety and quality criteria. AIB conducts its inspections based on five categories: adequacy of the company’scompany's food safety program, pest control, operational methods and personnel practices, maintenance of food safety and cleaning practices. Within these five categories, the AIB evaluates over 100 criteria items. AIB’s independent evaluation is summarized and posted on its website for our customers’ review. In 2008, nearly 87%2011, 95% of the audits of our distribution centers received the highest rating from the AIB and the remaining distribution centers received the second highest rating.BoondogglesCable Car®, Cable CarCore-Mark®, Core-Mark International®, Core-Mark InternationalEMERALD®, EMERALDFresh and Local™, Java Street®, Java StreetQUICKEATS®, QUICKEATSRichland Valley™, SmartStock®, Richland Valley and Tastefully YoursTM, SmartStock®, Starmark® and Tastefully Yours®.reportable geographic segments—areas -- the United StatesU.S. and Canada.See Note 16—14 -- Segment Information to our consolidated financial statements.United StatesU.S. Securities and Exchange Commission (“SEC”) through our website, as soon as reasonably practicable after they have been filed or furnished. These reports include, but are not limited to, our annual reports on Form 10-K, quarterly reports on Form 10-Q and any amendments to those reports. Our SECCore-Mark’sCore-Mark's Audit Committee Charter, Compensation Committee Charter, Nominating and Corporate Governance Committee Charter, and Code of Business Conduct and Ethics.Ethics, and Corporate Governance Guidelines and Principles. Copies of these documents may also be requested from:Governance—CodeGovernance--Code of Business Conduct and Ethics and Whistle Blower Policy:postedavailable on the “Investor Relations” section of our website at www.core-mark.com under “Corporate Governance.”Company’sCompany's accounting policies. The procedures are also described inon our website address atwww.core-mark.com under Corporate Governance in the “Investor Relations” section.ITEM 1.A.RISK FACTORSThe risks and uncertainties described below are not the only ones we face. Additional risks and uncertainties not currently known to us may also materially adversely affect our business, financial condition or results of operations. (See—(see Special Note Regarding Forward LookingForward-Looking Statements prior to Item 1. Business)Business).the EconomyOur Business and Market ConditionsCurrent difficultIndustry and market turmoil may reduce demand for our products and increase credit risks.Current market turmoil and difficultactualhigh unemployment and potential job losses among many sectors of the economy, significant declines inunderemployment rates, depressed real estate values, large losses to consumer retirement and investment accounts and increases in food and fuelother commodity prices, and uncertainty regarding federal tax and economic policies have resulted in reducedweakened consumer confidence and curtailed consumer spending.spending in certain sectors. If these economic conditions persist or deteriorate further, we expect that many convenience retail operators will experience continued weaknessinstability and further reductions in same store sales, which willwould adversely affect demand for our products and will result incould lead to reduced sales and increased pressures on margins. This may have a material adverse effect on our business and operating results. These economic and market conditions, combined with continuing difficultiesIn addition, ongoing uncertainty in the creditfinancial markets and the resulting pressures on liquidity may also place a number of our convenience retail customers under financial stress, which wouldcould increase our credit risk and potential bad debt exposure.Our business is sensitive to general These economic conditions and in particular, to gasoline prices and the labor market.Our operating results are also sensitive to, and may be adversely affected by, other factors, including inflation, competitive price pressures, severe weathermarket conditions and unexpected increases in fuel or other transportation-related costs. Due to the low margins on the products we distribute, changes in general economic conditions could materially adversely affect our operating results.Two particular economic factors may have a significant impactmaterial adverse effect on our sales, marginsbusiness and costs. First, our retailers have reported to us that when gasoline prices increased they have experienced a decrease in the proportion of their customers’ expenditures on food/non-food products compared to customers’ expenditures on cigarettes. When gasoline prices undergo sustained increases and a similar shift in expenditures results, we experience pressure on our sales and gross margins since sales of food/non-food products result in higher margins than sales of cigarettes do. Second, our results are sensitive to the labor market. For example, the strength of the employment market in the transportation sector has led to a shortage of qualified drivers in some areas, increasing our costs as we are required to use more temporary drivers and increase wages for permanent drivers in the affected areas. Shortages of qualified warehouse and other employees could similarly increase our costs.Historically, we have been able to pass on a substantial portion of increases in our own fuel costs to our customers in the form of fuel surcharges, but our ability to continue to pass through price increases, either from manufacturers or costs incurred in the business, including labor and fuel costs, is not assured.As a result of recent recessionary economic conditions and financial market turmoil, our pension plan is currently underfunded and we will be required to make cash payments to the plan, reducing the cash available for our business.We sponsored a qualified defined-benefit pension plan and a post-retirement benefit plan for employees hired before September 1986. We record a liability associated with these plans equal to the excess of the benefit obligation over the fair value of plan assets. The benefit liability recorded under the provisions of Statement of Financial Accounting Standards No. 158 “Employers’ Accounting for Defined Benefit Pension and Other Postretirement Plans,” at December 31, 2008 was $34.9 million for the pension plan. Our pension plan’s underfunded status increased from approximately $4.0 million in 2007 to approximately $12.8 million in 2008. The primary reason for this increase in the underfunding status of the plan from 2007 to 2008 is due to a lower return than expected on invested plan assets as of December 31, 2008 compared to December 31, 2007 as a result of the recent economic downturn and financial market turmoil. The amount of the estimated contributions is expected to increase in 2010 due, in part, to the underperformance of the plan assets relative to our expectations given the overall market downturn during 2008. If the performance of the assets in the plan does not meet our expectations, or if other actuarial assumptions are modified, our future cash payments to the plan could be substantially higher than we expect. The pension plan is subject to the Employee Retirement Income Security Act of 1974, or ERISA. Under ERISA, the Pension Benefit Guaranty Corporation, or PBGC, has the authority to terminate an underfunded pension plan under limited circumstances. In the event our pension plan is terminated for any reason while it is underfunded, we will incur a liability to the PBGC that may be equal to the entire amount of the underfunding in the pension plan.Risks Related to Our Business and Industrywouldcould suffer if there is an overall decline or consolidation in the convenience retail industry.the uncertainty of general economic conditionsdeclining sales in the convenience retail industry due to general economic conditions, credit exposure from our customers, termination of customer relationships without notice and consolidation of our customer base and consumer movement toward purchasing from club stores.base. Any of these factors could negatively affect the convenience retail industry which would negatively affect our results of operations.sales.deliveries,deliveries. We also face competition from club stores and the range and qualityalternate sources of services provided.consumable products that sell to convenience retailers. Some of our competitors, including aMcLane Company, Inc. (a subsidiary of Berkshire Hathaway Inc.), McLane Company, Inc., the largest convenience wholesale distributor in the United States, have substantial financial resources and long standinglong-standing customer relationships. In addition, heightened competition among our existing competitors, or by new entrants into the distribution market, could create additional competitive pressures that may reduce our margins and adversely affect our business. If we fail to successfully respond to these competitive pressures or to implement our strategies effectively, we may lose market share and our results of operations could suffer.If we are not able to retain existing customers and attract new customers, our results of operations could suffer.distribution customers. The ability to attract additional customers through our existing network of distribution centers is especially important because it enables us toor both of which could have an adverse impact on our results of operations.If the costs to us of the products we distribute increase and we cannot pass the increase on to our customers, our results of operations could be adversely affected.Our industry is characterized by a high volume of sales with relatively low profit margins. We experience increases in our cost of goods sold when manufacturers increase prices or reduce or eliminate discounts and incentive programs. If we cannot pass along such cost increases to our customers due to resistance to higher prices, our relatively narrow profit margins and earnings could be negatively affected.We rely on funding from manufacturer discount and incentive programs and cigarette excise stamping allowances, any material changes in these programs could adversely affect our results of operations.We receive payments from the manufacturers of the products we distribute for allowances, discounts, volume rebates, and other merchandising and incentive programs. These payments are a substantial benefit to us. The amount and timing of these payments are affected by changes in the programs by the manufacturers, our ability to sell specified volumes of a particular product, attaining specified levels of purchases by our customers, and the duration of carrying a specified product. In addition, we receive discounts from states in connection with the purchase of excise stamps for cigarettes. If the manufacturers or states change or discontinue these programs or change the timing of payments, or if we are unable to maintain the volume of our sales, our results of operations could be negatively affected.We depend on relatively few suppliers for a large portion of our products, and any interruptions in the supply of the products that we distribute could adversely affect our results of operations.We obtain the products we distribute from third party suppliers. At December 31, 2008, we had approximately 3,800 vendors, and during 2008 we purchased approximately 61% of our products from our top 20 suppliers, with our top two suppliers, Philip Morris and R. J. Reynolds, representing approximately 27% and 14% of our purchases, respectively. We do not have any long-term contracts with our suppliers committing them to provide products to us. Although our purchasing volume can provide leverage when dealing with suppliers, suppliers may not provide the products we distribute in the quantities we request or on favorable terms. Since we do not control the actual production of the products we distribute, we are also subject to delays caused by interruption in production based on conditions outside our control. These conditions include job actions or strikes by employees of suppliers, inclement weather, transportation interruptions, and natural disasters or other catastrophic events. Our inability to obtain adequate supplies of the products we distribute as a result of any of the foregoing factors or otherwise, could cause us to fail to meet our obligations to our customers and reduce the volume of our sales. cigarette or other manufacturers decide to engage in direct distribution of their products. non-alcoholic beverages, general merchandise and health and beauty care products. Our industry is characterized by a high volume of sales with relatively low profit margins. Our food/non-food sales are at prices that aregenerally priced based on the cost of the product plus a percentage markup. As a result, our profit levels may be negatively impacted during periods of cost deflation for these products, even though our gross profit as a percentage of the price of goods sold may remain relatively constant. Alternatively, periods of product cost inflation may also have a negative impact on our profit margins and earnings with respect to sales of cigarettes. Gross profit on cigarette sales are generally fixed on a cents per carton basis. Therefore, as cigarette prices increase, gross profit generally decreases as a percent of sales. In addition, if the cost of the cigarettes that we purchase increaseincreases due to manufacturer price increases, reduced or eliminated manufacturer discounts and incentive programs or increases in applicable excise tax rates, our inventory costs and accounts receivable could rise. To the extent that we are unable to pass on product cost increases are not passed on to our customers, due to their resistance to higher prices, our profit margins and earnings could be negatively impacted.Some of our distribution centers are dependenta few relatively large customers,manufacturer discount and our failure to maintain our relationships withincentive programs and cigarette excise stamping allowances, and any material changes in these customersprograms could substantially harm our business and prospects.Some of our distribution centers are dependent on relationships with a single customer or a few customers, and we expect our reliance on these relationships to continue for the foreseeable future. Any termination or non-renewal of customer relationships could severely and adversely affect the revenues generated by certain of our distribution centers. Any future termination, non-renewal or reduction in services that we provide to these select customers would cause our revenues to decline and our operating results would be harmed.We may be subject to product liability claims which could materially adversely affect our business, and our operations could be subject to disruptions as a resultresults of manufacturer recalls of products.Core-Mark, as with other distributors of food and consumer products, facesoperations.risk of exposure to product liability claims in the event that the use of products sold by us causes injury or illness. With respect to product liability claims, we believe that we have sufficient liability insurance coverage and indemnities from manufacturers. However, product liability insurance may not continue to be available at a reasonable cost, or, if available, may not be adequate to cover all of our liabilities. We generally seek contractual indemnification and insurance coverage from parties supplyingmanufacturers on the products we distribute but this indemnificationfor allowances, discounts, volume rebates and other merchandising and incentive programs. These payments are a substantial benefit to us. The amount and timing of these payments are affected by changes in the programs by the manufacturers, our ability to sell specified volumes of a particular product, attaining specified levels of purchases by our customers and the duration of carrying a specified product. In addition, we receive discounts from certain taxing jurisdictions in connection with the collection of excise taxes. If the manufacturers or insurance coverage is limited, astaxing jurisdictions change or discontinue these programs or change the timing of payments, or if we are unable to maintain the volume of our sales required by such programs, our results of operations could be negatively affected.practical matter, tolarge portion of our products, and any interruptions in the creditworthinesssupply of the indemnifyingproducts that we distribute could adversely affect our results of operations.the insured limitsduring 2011 we purchased approximately 63% of any insurance provided by suppliers. If weour products from our top 20 suppliers, with our top two suppliers, Philip Morris and R. J. Reynolds, representing approximately 27% and 14% of our purchases, respectively. We do not have adequate insurance, if contractual indemnification is not available or if a party cannot fulfill its indemnification obligation, product liability relating to defective products could materially adversely impactany long-term contracts with our results of operations.In addition, we may be required to manage a recall of products on behalf of a manufacturer. Managing a recall could disrupt our operations as we might be required to devote substantial resources toward implementing the recall, which could materially adversely affect our abilitysuppliers committing them to provide quality serviceproducts to us. Our suppliers may not provide the products we distribute in the quantities we request on favorable terms, or at all. We are also subject to delays caused by interruption in production due to conditions outside our control, such as job actions or strikes by employees of suppliers, inclement weather, transportation interruptions, regulatory requirements and natural disasters or other catastrophic events. Our inability to obtain adequate supplies of the products we distribute could cause us to fail to meet our obligations to our customers.Our success depends in a large part on factors such as our ability to successfully integrate such operations and personnel in a timely and efficient manner and retain the customer base of the acquired operations. If we cannot successfully integrate these operations and retain the customer base, we may experience material adverse consequences to our results of operations and financial condition. Theintegration of separately managed businesses operating in different markets involves a number of risks, including the following:demands on management related to the increase in our size after the acquisition of operations;difficulties in the assimilation of different corporate cultures and business practices, such as those involving vendor promotions, and of geographically dispersed personnel and operations;difficulties in the integration of departments, information technology systems, operating methods, technologies, books and records and procedures, as well as in maintaining uniform standards and controls, including internal accounting controls, procedures and policies; andexpenses of any undisclosed liabilities, such as those involving environmental or legal matters.new marketing initiatives.distributionconvenience industry environment, increase our market position within the industry and ultimately create increased shareholder value.new marketing initiatives andto realize the intended synergies, business opportunities and growth prospects. Many of the risk factors previously mentioned, such as increased competition, may limit our ability to capitalize on business opportunities and expand our business. Our efforts to capitalize on business opportunities may not bring the intended result. Assumptions underlying estimates of expected revenue growth or overall cost savings may not be met or economic conditions may deteriorate. Customer acceptance of new distribution formats developed may not be as anticipated, hampering our ability to attract new customers or maintain our existing customer base. Additionally, our management may have its attention diverted from other important activities while trying to execute new marketing initiatives. If these or other factors limit our ability to execute our strategic initiatives, our expectations of future results of operations, including expected revenue growth and cost savings, may not be met.or DCMS. The convenience retail industry does not have a standard information technology or IT platform. Therefore, actively integrating our customers into our IT platform is a priority, and our DCMS platform provides our distribution centers with the flexibility to adapt to our customers’ IT requirements.("DCMS"). We also rely on DCMS and our internal information technology staff to maintain the information required to operate our distribution centers and to provide our customers with fast, efficient and reliable deliveries. While weWe have taken steps to increase redundancy in our IT systems and have disaster recovery plans in place to mitigate unforeseen events that could disrupt our systems' service. However, if our DCMS fails or is subject to disruptions,not reliable, we may suffer disruptions in service to our customers and our results of operations could suffer.management and key personnel.management and other key personnel. Certain personnel suchexecutive officers as named in our information technology, tax and procurement staff, among others, have significant proprietary or industry knowledge and skills specific to our business.Proxy Statement. We do not maintain key person life insurance policies on these individuals, and we do not have employment agreementsour executive officers.them. The loss of the services of any of our senior executive officers or key employees could harm our business.We operate in a competitivemarketcould negatively impact our business and a portion of our employees are covered by collective bargaining agreements.benefitsbenefit packages in order to compete effectively in the hiring and retention of qualified employees or to hire more expensive temporary employees. In addition, atAny such shortage of qualified employees could decrease our ability to effectively serve our customers and might lead to lower earnings because of higher labor costs.2008, 199,2011, 188, or 4.8%3.9%, of our employees were covered by collective bargaining agreements with labor organizations, which expire at various times over the course of the next year.increase,increase. In addition, the National Labor Relations Board is becoming more active with the passage of administrative rules that we will be ablecould impact our ability to recover any increases inmanage our labor costs through increased prices charged to customers or thatforce. To the extent we will not suffer business interruptions as a result of strikes or other work stoppages. If we fail to attract and retain qualified employees, to controlstoppages, or our labor costs orincrease and we are not able to recover any increased labor costssuch increases through increased prices charged to our customers or offsets by productivity gains, our results of operations could be materially adversely affected.Proposed federal legislation that would eliminate the secret ballot in union elections may make it easier for unions to organize our employees. This may result in more of our employees becoming subject to collective bargaining agreements and may negatively affect our labor relations and labor costs.cigarette products,cigarettes, sales of which are declining.cigarette and other tobacco productscigarettes is currently a significant portion of our business. In 2008,2011, approximately 68.2%70.4% of our revenues camenet sales (which includes excise taxes) and 31.7% of our gross profit were generated from the distribution of cigarettes. During the same period, approximately 29.0% of our gross profit was generated from cigarettes. Due to increases in the prices of cigarettes, and other tobacco products, restrictions on advertisingmarketing and promotions by cigarette manufacturers, increases in cigarette regulation and excise taxes, health concerns, increased pressure from anti-tobacco groups and other factors, cigarette consumption in the United StatesU.S. and Canadian cigarette and tobacco marketCanada has generally been declining since 1980, and is expected togradually over the past few decades. We expect consumption trends of legal cigarette products will continue to decline.Priorbe negatively impacted by the factors described above. In addition, we expect rising prices may lead to 2007 our cigarette sales had benefitteda higher percentage of consumers purchasing cigarettes from a shift in salesillicit markets. If we are unable to the convenience retail segment, and as a result of this shift, convenience store cigarette sales had not declined in proportionsell other products to the decline in overall consumption. However, our cigarette carton sales began to decline in 2007, and this decline continued in 2008. We believe this trend is driven principally by an increasing decline in overall consumption due to factors such as increasingly more legislative controls which regulate where the consumer may or may not smoke and the acceleration in the frequency and amount of excise tax increases which reduces demand. The shiftmake up for these declines in cigarette cartonunit sales, from other channels to the convenience retail segmentour operating results may no longer be adequate to compensate for consumption declines.advertising,marketing, distribution, sale, taxation and use of tobacco products imposed by local, state, federal and foreign governments. Various state and provincial governmentsjurisdictions have adopted or are considering legislation and regulations restricting displays and advertisingmarketing of tobacco products, establishing fire safety standards for cigarettes, raising the minimum age to possess or purchase tobacco products, requiring the disclosure of ingredients used in the manufacture of tobacco products, imposing restrictions on public smoking, restricting the sale of tobacco products directly to consumers or other recipients over the Internet,internet and other tobacco product regulation. For example,In addition, the United States Supreme CourtFDA has recently determined that lawsuitsbeen empowered to regulate changes to nicotine yields and the chemicals and flavors used in tobacco products (including cigars and pipe products), require ingredient listings be displayed on tobacco products, prohibit the use of certain terms which may proceed againstattract youth or mislead users as to the risks involved with using tobacco manufacturers based on alleged deceptive advertising inproducts, as well as limit or otherwise impact the marketing of so-called “light” cigarettes. tobacco products by requiring additional labels or warnings as well as pre-approval of the FDA. Such legislation and related regulation could adversely impact the market for tobacco products and, accordingly, our sales of such products.British Columbia, Canada, many provinces have enacted legislation was adopted authorizing and facilitating the recovery by provincial government to seek recoverygovernments of tobacco-related health care costs from the tobacco industry by way of lawsuit. Some Canadian provincial governments have either already initiated lawsuits or indicated an intention that such lawsuits will be filed. It is unclear at this time how such restrictions and a lawsuit under such legislation is underway. The Supreme Courtlawsuits may affect Core-Mark and its Canadian operations.Canada unanimously upheld the Province’s right to sue thecigarettes and other tobacco industryproducts could decline and concluded the Tobacco Damages and Health Care Costs Recovery Act is constitutional. Other states and provinces may adopt similar legislation and initiate similar lawsuits. Furthermore, in Alberta, Canada, the Tobacco Reduction Act was passed in 2008 to prohibit the sale of all cigaretteour liquidity could be negatively impacted. from all health-care facilities, public post-secondary campuses, pharmacies and stores containing a pharmacy effective January 1, 2009. In addition, cigarettes are subject to substantial excise taxes in the United StatesU.S. and Canada. Significant increases in cigarette-related taxes and/or fees have been proposed or enacted and are likely to continue to be proposed or enacted by various taxing jurisdictions within the United StatesU.S. and Canada.Canada as a means of increasing government revenues. These tax increases are likelyexpected to continue and may negatively impact consumption and may cause a shift in sales from premium brands to discount brands or illicit channels as smokers seek lower priced options.an adversethe ability to change or rescind credit terms currently extended for the remittance ofsalesour liquidity. Accordingly, we may be required to obtain additional debt financing, which we may not be able to obtain on satisfactory terms or at all.dueand other tobacco products exposes us to lower consumption levels and sales outside of legitimate channels.In the United States we purchase cigarettes primarily from manufacturers covered by the tobacco industry’s Master Settlement Agreement (MSA), which results in our facing certain potential liabilities and financial risks including competition from lower priced sales of cigarettes produced by manufacturers who do not participate in the MSA.health-carehealth care costs related to tobacco use. Most other states sued the major United StatesU.S. cigarette manufacturers based on similar theories. The cigarette manufacturer defendants settled the first four of these cases with Mississippi, Florida, Texas and Minnesota by separate agreements. These states are referred to as non-MSA states. In November 1998, the major United StatesU.S. tobacco product manufacturers entered into the MSAa Master Settlement Agreement (“MSA”) with the other 46 states, the District of Columbia and certain United StatesU.S. territories. The other four states -- Mississippi, Florida, Texas and Minnesota (the “non-MSA states”) -- settled their litigations with the major cigarette manufacturers by separate agreements. The MSA and the other state settlement agreements settled health-carehealth care cost recovery actions and monetary claims relating to future conduct arising out of the use of, or exposure to, tobacco products, imposed a stream of future payment obligations on major United StatesU.S. cigarette manufacturers and placed significant restrictions on the ability to market and sell cigarettes. The payments required under the MSA result in the products sold by the participating manufacturers to be priced at higher levels than non-MSA manufacturers.orderconnection with the MSA, we are indemnified by most of the tobacco product manufacturers from which we purchase cigarettes and other tobacco products for liabilities arising from our sale of the tobacco products that they supply to limitus. Should the MSA ever be invalidated, we could be subject to substantial litigation due to our potentialdistribution of cigarettes and other tobacco related liabilities,products, and we may not be indemnified for such costs by the tobacco product manufacturers in the future. In addition, even if we are indemnified by cigarette manufacturers that are parties to the MSA, future litigation awards against such cigarette manufacturers and our Company could be so large as to eliminate the ability of the manufacturers to satisfy their indemnification obligations.The benefits of liability limitations and indemnities we are entitled to under the MSA do not apply to sales of cigarettes manufactured by non-MSA manufacturers. From time to time, however, we find it necessary to purchase a limited amount of cigarettes from non-MSA manufacturers when circumstances limit our ability to avoid doing so.manufacturers. For example, during a transition period while integrating distribution operations from an acquisition we may need to purchase and distribute cigarettes manufactured by non-MSA manufacturers to satisfy the demands of customers of the acquired business. With respect to sales of such non-MSA cigarettes, we could be subject to litigation that could expose us to liabilities for which we would not be indemnified.If the tobacco industry’s Master Settlement Agreement is invalidated, or tobacco manufacturers cannot meet their obligations to indemnify us, we could be subject to substantial litigation liability.In connection with the MSA, we are indemnified by the tobacco product manufacturers from which we cigarettes and other tobacco products for liabilities arising from our sale of the tobacco products that they supply to us. To date, litigation challenging the validity of the MSA, including claims that the MSA violates antitrust laws, has not been successful. However, if such litigation were to be successful and the MSA is invalidated, we could be subject to substantial litigation due to our sales of cigarettes and other tobacco products, and we may not be indemnified for such costs by the tobacco productprimarily from MSA manufacturers in the future. In addition, even if we continue to be indemnified by cigarette manufacturers that are parties to the MSA, future litigation awards against such cigarette manufacturers and our company could be so large as to eliminate the ability of the manufacturers to satisfy their indemnification obligations.We face competition from sales of deep-discount brands and illicit and other low priced sales of cigarettes.As a result of purchasing cigarettes for sale in MSA states primarily from manufacturers that are parties to the MSA, we are adversely impacted by sales of brands from non-MSA manufacturers and deep-discountdiscount brands manufactured by small manufacturers that are not original participantsparties to the MSA. The cigarettes subject to the MSA that we sell have been burdened by MSA related payments and are thus negatively impacted by widening price gaps between those brands and deep-discountdiscount brands for the past several years. Growth in market share of deep-discountdiscount brands since the MSA was signed in 1998 has had an adverse impact on the volume of the cigarettes that we sell.United States marketU.S. and Canadian markets of cigarettes intended for sale outside of such markets, the United States,sale of cigarettes in non-taxable jurisdictions, inter-state/provincial and international smuggling of cigarettes, the sale of counterfeit cigarettes by third parties, the sale of cigarettes in non-taxable jurisdictions, inter-state and international smuggling of cigarettes, increased imports of foreign low priced brands, the sale of cigarettes by third parties over the internet and by other means designed to avoid collection of applicable taxes. The competitive environment has been characterized by a continued influx of cheap products that challenge sales of higher priced and fully taxed cigarettes manufactured by parties to the MSA.cigarettes. Increased sales of counterfeit cigarettes, salesillicit or other low priced alternatives by third parties, over the internet, or sales by means to avoid the collection of applicable taxes, could have an adverse effect on our results of operations.Cigarettestobacco productsregulatory bodies. Significant changes in tax legislation could adversely affect our business or results of operations in a material way. For example, in the U.S. certain pending legislative and regulatory proposals effectively could limit, or even eliminate, use of the LIFO inventory method for financial and income tax purposes. Although the final outcome of these proposals cannot be ascertained at this time, the ultimate impact to us of the transition from LIFO to another inventory method could be material.substantial excise taxesthe Employee Retirement Income Security Act of 1974 ("ERISA"). Under ERISA, the Pension Benefit Guaranty Corporation ("PBGC") has the authority to terminate an underfunded pension plan under limited circumstances. In the event our pension plan is terminated for any reason while it is underfunded, we will incur a liability to the PBGC that may be equal to the entire amount of the underfunding in the pension plan. If this were to occur, our working capital and results of operations could be adversely impacted.these taxes are increased,there is a reduction in dividend payments, our salesstock price may be harmed.cigarettes and other tobacco products could decline.Cigarettes and tobacco products are subject to substantial excise taxes inDirectors approved the United States and Canada. Significant increases in cigarette-related taxes and/or fees have been proposed or enacted and are likelycommencement of a quarterly cash dividend. We intend to continue to pay quarterly dividends subject to capital availability and periodic determinations by our Board of Directors that cash dividends are in the best interest of our stockholders and are in compliance with all applicable laws and agreements to which we are a party. Future dividends may be proposedaffected by: then available cash, anticipated working capital requirements, overall financial condition, credit agreement restrictions, future prospects for earnings and cash flows, capital requirements for acquisitions, reserves for legal risks, stock repurchase programs, and changes in federal and state income tax laws or enacted withincorporate laws, as well as other factors considered relevant by our Board of Directors. Furthermore, the United Statespayment of dividends affects our cash flow and Canada. For example, several states passed ballot measures during 2007may act to limit certain strategic activities, such as acquisitions and 2008 which will havecapital expenditures. Our Board of Directors may, at its discretion, decrease or entirely discontinue the effectpayment of increasing excise taxes on cigarettes and other tobacco products. In the United States, legislation was recently introduced to fund the State Children’s Health Insurance Program (SCHIP) by raising the federal cigarette excise tax from 39¢ to $1.01 per pack. This legislation was passed and signed into lawdividends at any time. A reduction in February 2009 and becomes effective April 1, 2009.These tax increases are expected to continue to have an adverse impact on sales of cigarettes due to lower consumption levels and a shift in sales from the premium to the non-premium or discount cigarette segments or to sales outside of legitimate channels. In addition, state and local governments may require us to prepay for excise tax stamps placed on packages of cigarettes and other tobacco products that we sell. If these excise taxes are substantially increased, itour dividend payments could have a negative impacteffect on our liquidity. Accordingly, we may be required to obtain additional debt financing, which we may not be able to obtain on satisfactory terms or at all. Our inability to prepay the excise taxes may prevent or delay our purchase of cigarettes and other tobacco products, which could materially adversely affect our ability to supply our customers.Risks Related to Foreign Exchange and Financing20082011 and 14%16% in 2007.2010. We also incur a significant portion of our expenses in Canadian dollars. To the extent that we are unable to match revenues received in Canadian dollars with costs paid in the same currency, exchange rate fluctuations in Canadian dollars could have an adverse effect on our revenues and financial results. During times of a strengthening U.S. dollar, (such as the second half of 2008), our reported sales and earnings from our Canadian operations will be reduced because the Canadian currency will be translated into fewer U.S. dollars. Conversely, during times of a weakening U.S. dollar, (as occurred in 2007), our reported sales and earnings from our Canadian operations will be increased because the Canadian currency will be translated into more U.S. dollars. Accounting principles generally accepted in the United States (GAAP)of America (“GAAP”) require that such foreign currency transaction gains or losses on short-term intercompany transactions be recorded currently as gains or losses within the income statement. To the extent we incur losses on such transactions, our net income and earnings per share will be reduced.During the current economic downturn, some companies have experienced difficulties in drawing on lines of credit, issuing debt and raising capital generally, which has had a material adverse effect on their liquidity. In addition, if banks from which companies expect to receive financing fail or become insolvent, the borrowing capacity of those companies may be reduced. $250$200 million credit facility.Credit Facility. While we believe our sources of liquidity are adequate, we cannot assure you that these sources will be available or continue to provide us with sufficient liquidity and capital resources required to meet our future financial obligations, or to provide funds for our working capital, capital expenditures and other needs. We may requireAs such, additional equity or debt financing to meet our working capital requirements or to fund our capital expenditures. Wemay be necessary, but we may not be able to expand our existing Credit Facility or obtain new financing on terms satisfactory to us, or at all.credit facilityCredit Facility imposes restrictions on us that could increase our vulnerability to general adverse economic and industry conditions by limiting our flexibility in planning for and reacting to changes in our business and industry. Specifically, these restrictions limitplace limits on our ability, among other things, to: incur additional indebtedness, pay dividends and make distributions, issue stock of subsidiaries, make investments, repurchase stock, create liens, enter into transactions with affiliates, merge or consolidate, or transfer and sell our assets. In addition, under our credit facility,Credit Facility, under certain circumstances we are required to meet a fixed charge coverage ratio. Our ability to comply with this covenant may be affected by factors beyond our control and a breach of the covenant could result in an event of default under our credit facility,Credit Facility, which would permit the lenders to declareWe are subject to governmental regulation and ifUnited States Food and Drug Administration,FDA, Health Canada and similar regulatory authorities at the state, provincial and local levels. In addition, our employees operate tractor trailers, trucks, forklifts and various other powered material handling equipment and we are therefore subject to regulation by the U.S. and Canadian Departments of Transportation. or regulations become more stringent, we could experience increased inspections, regulatory authorities could take remedial action including imposing fines or shutting down our operations or we could be subject to increased compliance costs. If any of these events were to occur, our results of operations would be adversely affected.affecteffect on our business.We are headquartered conduct a significant portion of our operations in California. Our operations in California, are susceptible to damage from earthquakes. In addition,as well as one of our data centers is located in Richmond, British Columbia, Canada, which is susceptible to earthquakes, andare located in or near high hazard earthquake zones. In addition, one of our data centers is located in Plano, Texas, which is susceptible to wind storms. We believe that we maintain adequate insurance to indemnify us for losses. However, significant earthquake and natural disaster damage could result in losses in excess of our insurance coverage which would materially adversely affect our results of operations. We also have operations in areas that have been affected by natural disasters such as hurricanes, tornados, flooding, ice and snow storms. While we maintain insurance to indemnifycover us for losses due to such occurrences,potential losses, our insurance may not be sufficient in the event of a significant natural disaster or payments under our policies may not be received timely enough to prevent adverse impacts on our business. Our customers could also be affected by like events, which could adversely impactingimpact our sales.ITEM 1.B.UNRESOLVED STAFF COMMENTSITEM 2.PROPERTIES26,00027,000 square feet of leased office space. We also lease approximately 13,000 square feet for use by our information technology and tax personnel in Richmond, British Columbia, and approximately 6,000 square feet for use by our information technology personnel in Plano, Texas, and approximately 3,000 square feet of additional office space in Fort Worth, Texas. We lease approximately 2.73.2 million square feet and own approximately 0.40.7 million square feet of distribution space.Hayward, California Atlanta, Georgia Las Vegas, Nevada Whitinsville, Massachusetts(4)Tampa, FloridaAtlanta, GeorgiaLeitchfield, Kentucky Los Angeles, CaliforniaWilkes-Barre, PennsylvaniaWhitinsville, MassachusettsBakersfield, CaliforniaLeitchfield, KentuckyCalgary, AlbertaLos Angeles, California Denver, Colorado Minneapolis, Minnesota Calgary, Alberta Forrest City, Arkansas Portland, Oregon Toronto, Ontario Denver, ColoradoPortland, OregonVancouver, British Columbia Fort Worth, TexasSacramento, California(3)Salt Lake City, Utah Winnipeg, Manitoba Grants Pass, OregonSalt Lake City, UtahHayward, CaliforniaSpokane, Washington(1) third-partya third party logistics provider. Depots are defined as a secondary location for a division which may include any combination of sales offices, operational departments and/or storage. We own distribution center facilities located in Leitchfield, KentuckyKentucky; Wilkes-Barre, Pennsylvania; and Wilkes-Barre, Pennsylvania.Forrest City, Arkansas. All other facilities listed are leased. The facilities we own are subject to encumbrances under our principal credit facility.(2) This facility includes a distribution center and our Allied Merchandising Industry consolidating warehouse. (3) This facility includes a distribution center and our Artic Cascade consolidating warehouse. (4)Acquired in June 2008.Alimentation Couche-Tard, and one in San Antonio, Texas for Valero.Valero Energy Corporation. Each facility is leased by the specific customer solely for their use and operated by Core-Mark.LEGAL PROCEEDINGS2008,ITEM 4.SUBMISSION OF MATTERS TO A VOTE OF SECURITY HOLDERSNo matters were submitted to a votesecurity holders during the fourth quarter of the fiscal year covered by this report.2,7822,781 stockholders of record as of February 27, 2009.the NASDAQ Global Market for the periods indicated: Low
Price High
Price $ 14.81 $ 24.94 24.65 30.74 25.53 30.03 22.59 29.95 Low
Price High
Price 24.74 36.35 29.66 37.70 33.22 38.17 29.70 37.21 Fiscal 2011 4th Quarter $ 29.57 $ 40.52 3rd Quarter 30.33 38.69 2nd Quarter 32.41 35.84 1st Quarter 31.61 36.10 Fiscal 2010 4th Quarter $ 30.14 $ 37.19 3rd Quarter 25.61 31.85 2nd Quarter 26.25 31.88 1st Quarter 29.21 34.51 for the period Core-Mark had securities trading on the Pink Sheets or on the NASDAQ Global Market andat the end of each year from 2006 through 2011, as well as the cumulative total returnreturns of the NASDAQ Non-Financial Stock Index, the Russell 2000 Index and a peer group of companies (the(“the Performance Peer Group)Group”).perthe change in the share price change for the period, plus any dividends, divided by the share price at the beginning of the measurement period. Core-Mark’sCore-Mark's cumulative stockholder return is based on an investment of $100 on November 7, 2005December 29, 2006, and is compared to the total return of the NASDAQ Non-Financial Stock Index, the Russell 2000 Index, and the weighted averageweighted-average performance of the Performance Peer Group over the same period with a like amount invested. In 2008, we added a comparison toinvested, including the Russell 2000 Index.assumption that any dividends have been reinvested. We regularly compare our performance to this indexthe Russell 2000 Index since it includes primarily companies with relatively small market capitalization similar to us. Performance Food Group Co. (PFGC) was removed from the Peer Group as it was acquired by another company in 2008.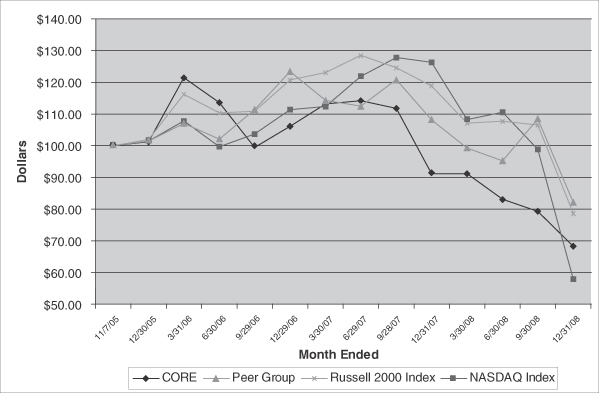
Investment Value at 11/7/05 12/30/05 3/31/06 6/30/06 9/29/06 12/29/06 $ 100.00 $ 101.27 $ 121.46 $ 113.65 $ 99.49 $ 106.19 $ 100.00 $ 101.56 $ 107.91 $ 99.68 $ 103.71 $ 111.38 $ 100.00 $ 102.04 $ 116.27 $ 110.42 $ 110.91 $ 120.78 $ 100.00 $ 101.47 $ 107.08 $ 102.10 $ 111.38 $ 123.46 3/30/07 6/29/07 9/28/07 12/31/07 3/31/08 6/30/08 9/30/08 12/31/08 $ 113.27 $ 114.22 $ 111.84 $ 91.17 $ 91.24 $ 83.17 $ 79.33 $ 68.32 $ 112.39 $ 121.93 $ 127.83 $ 126.36 $ 108.28 $ 110.64 $ 98.85 $ 57.94 $ 123.13 $ 128.57 $ 124.59 $ 118.89 $ 107.12 $ 107.75 $ 106.55 $ 78.72 $ 114.34 $ 112.48 $ 120.86 $ 108.20 $ 99.25 $ 95.28 $ 108.50 $ 82.18 We have not declared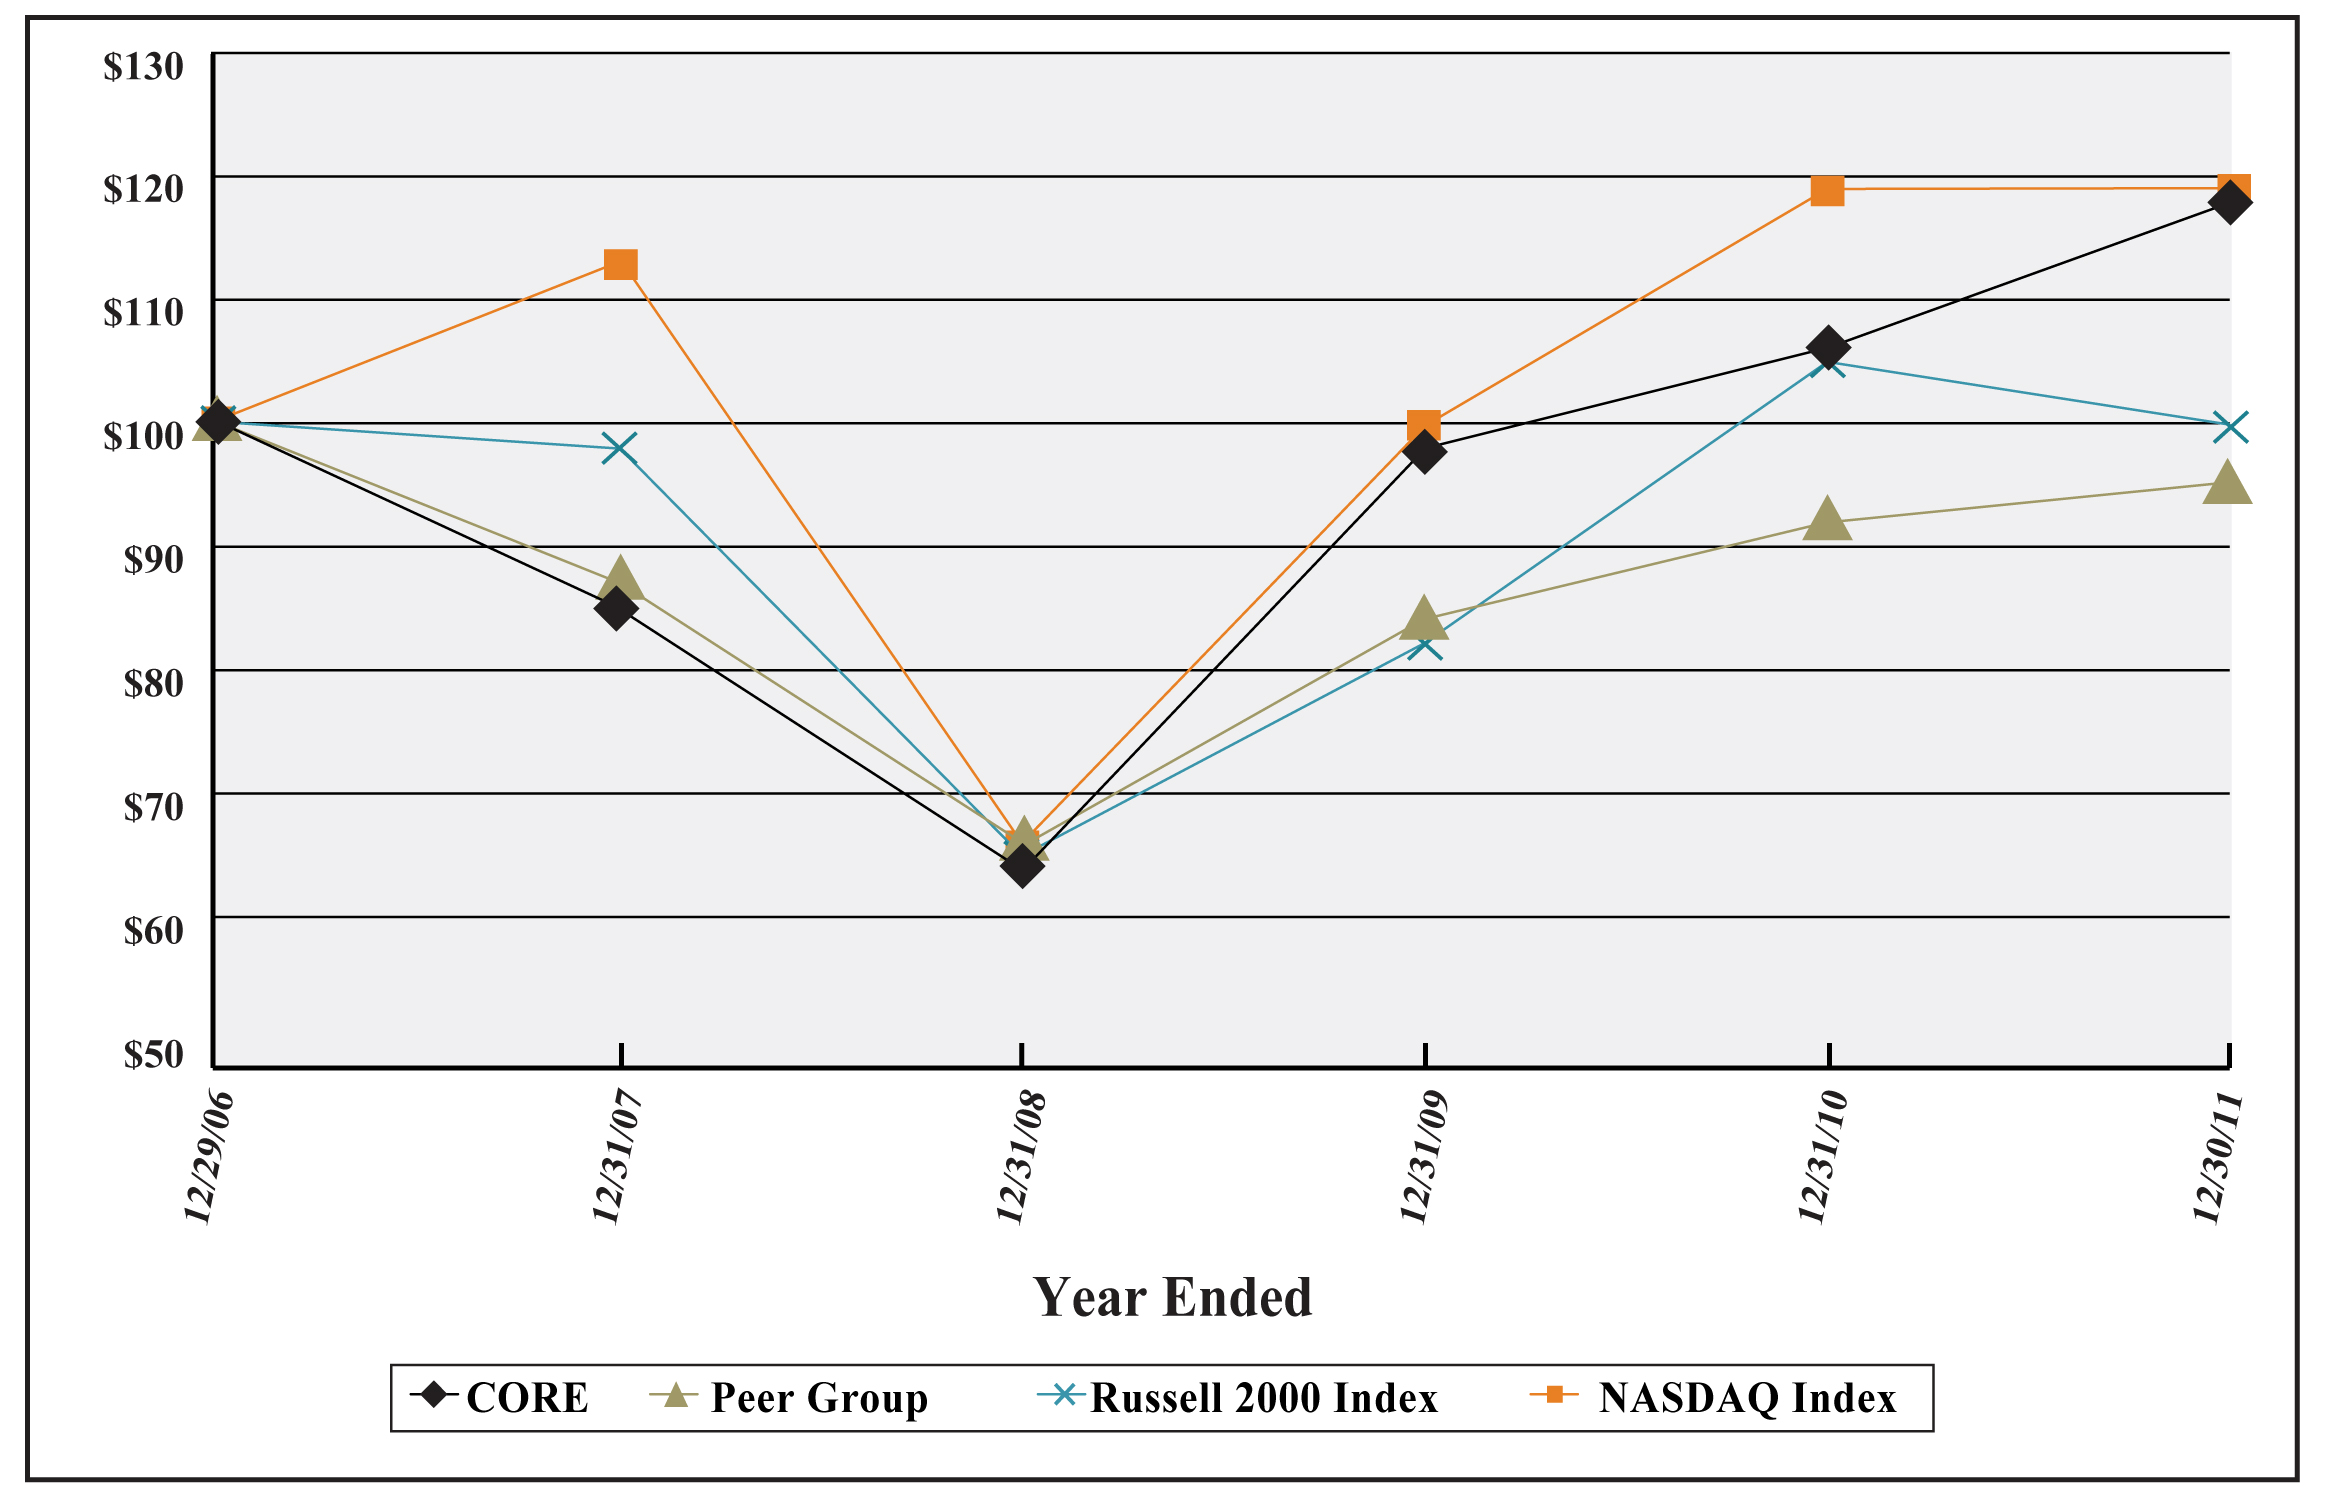
Investment Value at 12/29/06 12/31/07 12/31/08 12/31/09 12/31/10 12/30/11 CORE $ 100.00 $ 85.86 $ 64.33 $ 98.54 $ 106.40 $ 118.90 NASDAQ Index $ 100.00 $ 113.43 $ 66.67 $ 100.55 $ 119.34 $ 119.20 Russell 2000 $ 100.00 $ 98.43 $ 65.18 $ 82.89 $ 105.14 $ 100.75 Performance Peer Group $ 100.00 $ 87.65 $ 66.52 $ 84.06 $ 92.97 $ 95.58 paid any cash dividends“plan of reorganization,” on August 23, 2004 we issued an aggregate of 9,800,000 shares of our common stock and warrants to purchase an aggregate of 990,616 shares of our common stock to the Class 6(B) creditors of Fleming (our former parent company). We refer to the warrants we issued to the Class 6(B) creditors as the Class 6(B) warrants. We received no cash consideration at the time we issued the Class 6(B) warrants. The Class 6(B) warrants had an exercise price of $20.93 per share. The shares of common stock and the Class 6(B) warrants were issued pursuant to an exemption from registration under Section 1145(a) of the Bankruptcy Code. We also issued warrants to purchase an aggregate of 247,654 shares of our common stock to the holders of our Tranche B Notes, which we refer to as the Tranche B warrants. The Tranche B warrants had an exercise price of $15.50 per share. Shares of our common stock issued upon exercise of the Tranche B warrants are issued pursuant to an exemption from registration under Section 4(2) of the Securities Act of 1933.creditBoard declared a quarterly cash dividend of $0.17 per common share, which resulted in a total amount of approximately $1.9 million paid on December 15, 2011 to shareholders of record as of the close of business on November 15, 2011. On February 3, 2012, the Board declared the second quarterly cash dividend of $0.17 per common share, which is payable on March 15, 2012 to shareholders of record as of the close of business on February 24, 2012. The agreement for our Credit Facility places limitationscertain limits on our ability to pay cash dividends on our common stock. The payment of any future dividends will be determined by our board of directors in light of then existing conditions, including our earnings, financial condition and capital requirements, strategic alternatives, restrictions in financing agreements, business conditions and other factors.Sales of Unregistered SecuritiesCommon Stock and Warrants Issued Pursuant to the Plan of Reorganization in 2004Pursuant to the plan of reorganization (May 2004) described in Exhibit 2.1 and incorporated by reference (see Part IV, Item 15, Exhibit Index of this Form 10-K), herein referred to as “Fleming’s bankruptcy” or “plan of reorganization,” on August 23, 2004 we issued an aggregate of 9,800,000 shares of our common stock and warrants to purchase an aggregate of 990,616 shares of our common stock to the Class 6(B) creditors of Fleming. We refer to the warrants we issued to the Class 6(B) creditors as the Class 6(B) Warrants. We received no cash consideration for the issuance of common stock and the Class 6(B) Warrants. The Class 6(B) Warrants have an exercise price of $20.93 per share and may be exercised at the election of the holder at any time prior to August 23, 2011. The shares of common stock and the Class 6(B) Warrants were issued pursuant to an exemption from registration under Section 1145(a) of the Bankruptcy Code. We also issued warrants to purchase an aggregate of 247,654 shares of our common stock to the holders of our Tranche B Notes. The Tranche B Warrants have an exercise price of $15.50 per share. Shares of our common stock issued upon exercise of the Tranche B Warrants are issued pursuant to an exemption from registration under Section 4(2) of the Securities Act of 1933.During 2008, no Class 6(B) warrants were exercised or issued in either cash or cashless transactions, and a total of 21,988 shares of common stock have been issued since inception pursuant to exercises of Class 6(B) warrants. During 2008, there were no Tranche B warrants exercised and issued in cashless transactions, and the total number of shares of common stock issued since inception pursuant to Tranche B warrants as of December 31, 2008 remained at 73,507 shares.yearthree months ended December 31, 2008:2011:Issuer Purchases of Equity Securities Maximum Dollar Value of Shares that Total Number of Total Cost of May Yet be Calendar month Shares Average Cost Purchased Shares Purchased in which purchases were made: October 1, 2011 to October 31, 2011 — $ — $ — $ 12.0 November 1, 2011 to November 30, 2011 1,700 37.02 0.1 11.9 December 1, 2011 to December 31, 2011 23,648 39.60 0.9 11.0 Total repurchases for the three months ended December 31, 2011 25,348 $ 39.43 $ 1.0 $ 11.0 Total Number of
Shares Repurchased(1) Average Cost
per Share(2) Total Cost of
Purchased Shares
(in millions) Maximum
Repurchases
Allowed
(in millions)(3) — $ — $ — $ 30.0 97,854 29.15 2.9 27.1 51,282 27.84 1.4 25.7 118,949 27.17 3.2 22.5 61,860 25.97 1.6 20.9 29,648 28.56 0.9 20.0 37,123 27.17 1.0 19.0 — — — — — — — — — — — — 396,716 $ 27.66 $ 11.0 $ 19.0 (1) All purchases were made as part of the sharesshare repurchase program announced on March 14, 2008, as described in footnote (3).May 25, 2011.(2) Includes related transaction fees. (3) On March 12, 2008,May 24, 2011, our Board of Directors authorized the repurchase of up to $30 million of our common stock. The timing and amount of the purchases are based on market conditions, our cash and liquidity requirements, relevant securities laws and other factors. We have been funding the majority of the share repurchases from excess cash. The share repurchase program may be discontinued or amended at any time. The program has no expiration date and expires when the amount authorized has been expended or the Board withdraws its authorization.ITEM 6.SELECTED FINANCIAL DATAThe selected financial data for periods prior to August 23, 2004 relates to the Predecessor Company (which was “Core-Mark International, Inc.” prior to emerging from bankruptcy in 2004) and financial data for periods after August 22, 2004 relates to Core-Mark. In connection with the emergence from bankruptcy in 2004, Core-Mark implemented American Institute of Certified Public Accountants (AICPA)Statement of Position 90-7 (SOP 90-7) Financial Reporting by Entities in Reorganization Under the Bankruptcy Code.2008,from 2007 2006 and 2005to 2011 are derived from Core-Mark’sCore-Mark's audited consolidated financial statements included in our Annual Reports on Form 10-K.Management’sManagement's Discussion and Analysis of Financial Condition and Results of Operations. Core-Mark Holding Company, Inc. and Subsidiaries Year Ended December 31, (dollars in millions except per share amounts) 2007 Statement of Operations Data: Net sales $ 8,114.9 $ 7,266.8 $ 6,531.6 $ 6,044.9 $ 5,560.9 434.1 385.3 401.6 359.1 332.6 234.6 211.8 197.3 197.6 174.1 Selling, general and administrative expenses 150.8 142.5 137.3 129.4 119.0 Amortization of intangible assets 3.0 2.1 2.0 2.0 1.8 Income from operations 45.7 28.9 65.0 30.1 37.7 2.0 2.2 1.4 1.2 1.0 Net income 26.2 17.7 47.3 17.9 24.1 Per share data: Basic net income per common share $ 2.30 $ 1.64 $ 4.53 $ 1.71 $ 2.30 Diluted net income per common share $ 2.23 $ 1.55 $ 4.35 $ 1.64 $ 2.15 Shares used to compute net income per share: Basic 11.4 10.8 10.5 10.5 10.5 Diluted 11.7 11.4 10.9 10.9 11.2 Other Financial Data: $ 1,951.5 $ 1,756.5 $ 1,516.0 $ 1,474.4 $ 1,349.4 8.2 6.1 25.2 3.1 7.3 0.8 0.6 0.6 1.4 13.3 LIFO expense 18.3 16.6 6.7 11.0 13.1 22.4 19.7 18.7 17.4 14.9 Stock-based compensation 5.5 4.8 5.1 3.9 5.3 Capital expenditures 24.1 13.9 21.1 19.9 20.8 91.9 70.0 95.5 62.4 71.0 December 31, 2011 2010 2009 2008 2007 Balance Sheet Data: Total assets $ 870.2 $ 708.8 $ 677.9 $ 612.6 $ 577.1 Total debt, including current maturities 63.3 1.0 20.0 30.8 29.7 Core-Mark Holding Company, Inc. and
Subsidiaries Predecessor
Company Year ended December 31, Period from
August 23
through
December 31,
2004 Period from
January 1
through
August 22,
2004 2008(a) 2007 2006(b) 2005 $ 6,044.9 $ 5,560.9 $ 5,314.4 $ 4,891.1 $ 1,549.3 $ 2,673.1 359.1 332.6 297.7 271.0 90.9 149.8 197.6 174.1 151.1 135.7 42.6 78.7 129.4 119.0 106.6 90.0 34.9 59.3 30.1 37.7 38.5 44.0 13.0 11.8 1.2 1.0 4.2 11.0 5.2 4.4 — — — — 0.8 (70.0 ) 17.9 24.1 20.6 14.3 5.3 50.7 $ 1.71 $ 2.30 $ 2.05 $ 1.46 $ 0.54 $ 5.17 $ 1.64 $ 2.15 $ 1.87 $ 1.37 $ 0.54 $ 5.17 10.5 10.5 10.0 9.8 9.8 9.8 10.9 11.2 11.0 10.5 9.8 9.8 $ 1,474.4 $ 1,349.4 $ 1,313.3 $ 1,195.0 $ 367.8 $ 643.5 3.1 7.3 4.1 5.7 1.1 0.2 11.0 13.1 2.9 7.5 1.8 2.7 17.4 14.9 13.2 12.5 4.3 7.0 3.9 5.3 4.4 4.0 0.9 — 19.9 20.8 12.8 7.8 5.7 6.4 December 31, August 22,
2004 2008 2007 2006 2005 2004 $ 612.6 $ 577.1 $ 555.6 $ 510.4 $ 504.2 $ 517.2 30.8 29.7 78.0 59.6 77.5 118.7 (a) The selected consolidated financial data for 2011 includes the results of operations of FCGC, which was acquired in May 2011, and the Tampa, Florida division, which commenced operations in September 2011. (b) The selected consolidated financial data for 2010 includes approximately $105.9 million of incremental sales related to (c) The selected consolidated financial data for 2009 includes approximately $534.0 million of incremental sales related to increased cigarette prices by manufacturers in response to the increase in federal excise taxes mandated by the SCHIP legislation and $36.7 million of related cigarette inventory holding gains, offset by $11.5 million of net floor stock tax. (d) The selected consolidated financial data for 2008 includes the results of operations of the new Toronto division, which startedcommenced operations in late January 2008, and also the New England division following its acquisition in June 2008.(b)The selected consolidated financial data for 2006 includes the results(e) Gross margins may not be comparable to those of operationsother entities because warehousing and distribution expenses are not included as a component of the Pennsylvania division following its acquisition in June 2006.our cost of goods sold.(c)(f) income and includes amortization of debt issuance costs. Interest expense for January 1, 2004 through August 22, 2004 was imputed, as required under Staff Accounting Bulletin (SAB) Topic 1.B due to the Company being a subsidiary of Fleming.income. (d)Reorganization items, net: for the period from January 1, 2004 through August 22, 2004 consists primarily of fresh-start accounting adjustments, including a $5.8 million adjustment to reflect the fair value of assetsand liabilities, a $66.1 million net gain on the discharge of pre-petition debt, and other bankruptcy related costs including professional and other fees of $1.9 million; and for the period from August 23 to December 31, 2004 includes primarily bankruptcy related professional fees.(e)For the Predecessor Company, basic net income per share and diluted net income per share have been computed by dividing net income for the period by the 9,800,000 shares of Core-Mark common stock outstanding after emergence from bankruptcy.(f)(g)State, local and provincial excise taxes (predominantly cigarettes and tobacco) paid by the Company are included in net sales and cost of goods sold. (g)(h) Cigarette inventory holding profitsgains represent income related to cigarette and excise tax stamp inventories on hand at the time either cigarette manufacturers increase their prices or states increase their excise taxes, for which the Company is able to pass such increases on to its customers. This income is recorded as an offset to cost of goods sold and recognized as the inventory is sold. ThisAlthough we have realized cigarette inventory holding gains in each of the last five years, this income is not predictable and is dependent on inventory levels and the timing of manufacturer price increases or state excise tax increases. In 2009, we realized significant cigarette inventory holding gains due to the price increases in response to the federal excise taxes ("FET") levied on manufacturers by the SCHIP legislation.(h)(i) We received an Other Tobacco Products ("OTP") tax settlement of $0.8 million in 2011. We recognized a $0.6 million OTP tax gain resulting from a state tax method change in 2010 and received OTP tax refunds of $0.6 million in 2009, $1.4 million in 2008 and $13.3 million in 2007. (j) Depreciation and amortization includes depreciation on property and equipment and amortization of purchased intangibles. Special“Special Note on “Forward LookingRegarding Forward-Looking Statements,” which is included after Table of Contents in this Form 10-K.leading wholesale distributorslargest marketers of fresh and broad-line supply solutions to the convenience retail industry in North America in termsAmerica. We offer a full range of annual sales,products, marketing programs and provides sales and marketing, distribution and logistics servicestechnology solutions to over 28,000 customer locations acrossin the United StatesU.S. and Canada. Our customers include traditional convenience stores, grocery stores, drug stores, liquor stores and other specialty and small format stores that carry convenience products. Our product offering includes cigarettes, other tobacco products, candy, snacks, fast food, groceries, fresh products, dairy, bread, beverages, general merchandise and health and beauty care products. We operate a network of 26 distribution centers (including (excluding two distribution facilities we operate as a third party logistics provider) in the United StatesU.S. and Canada, distributing a diverse line of national and private label convenience store products to approximately 24,000 customer locations. The products we distribute include cigarettes, tobacco, candy, snacks, fast food, groceries, fresh products, dairy, non-alcoholic beverages, general merchandise, and health and beauty care products. We service a variety of store formats including traditional convenience stores, grocery stores, drug stores, liquor stores and other stores that carry convenience products.20082011 Results2008 increased 8.7% to $6.0 billion from $5.6 billionthe fourth quarter of 2011.2007 driven by a 13.1%our food/non-food category, were the primary drivers of an increase in our food/non-foodnet sales of $848.1 million, or 11.7%, to $8,114.9 million for 2011 compared to $7,266.8 million for 2010. In addition, inflation in cigarette prices from manufacturers and a 6.8%excise taxes contributed approximately 1.8% to the increase in total net sales for 2011 compared to 2010. Sales of our cigarette sales. Salesfood/non-food category increased 12.0%, or 15.6%, excluding a reduction in both categories benefittedour beverage product category resulting from the additionmovement of our new Toronto and New England divisions which contributed slightly more than 50%Gatorade to a direct-store-delivery ("DSD") format during the first quarter of our sales growth. The balance of this increase was driven by new customers, deeper sales penetration into existing stores and price inflation, partially offset by a slight decline in remaining cigarette cartons. Food, candy and other tobacco products were the fastest growing categories in the food/non-food product lines. Candy showed organic growth but also benefitted from manufacturer price increases over the past two years. Cigarette sales increased in absolute dollars compared to 2007 as a result of both price and excise tax increases and a 2.2% increase in overall cigarette carton sales, which includes sales from the two new divisions.Excluding our new Toronto division, cigarette carton sales in Canada increased approximately 8.3% in 2008 driven by market share gains and sales from additional product lines. Excluding the recently acquired New England division, cigarette carton sales in the United States experienced a modest decline of 1.7% for 2008. This result was an improvement compared with the 2.7% decline in cigarette carton sales in the United States for 2007 compared to 2006. The year-over-year decrease in carton sales in the United States, after excluding carton sales from our New England division, appears to be driven primarily by a decline in overall consumer demand which we believe is influenced by, among other factors, manufacturer price and state tax increases and legislative actions to regulate where a consumer can smoke. We expect these factors to continue to adversely impact our cigarette carton sales, primarily in the U.S., for 2009.2011. In addition, we expecthave seen an increase in price inflation in certain of our cigarette cartonfood/non-food commodities which not only improved our sales in the United States2011, but will continue to be adversely impacted by the passage of the State Children’s Health Insurance Program (SCHIP). Effective April 1, 2009, federal cigarette excise taxes will increase from 39¢benefit us in future quarters for products that use a cost-plus-markup approach to $1.01 per pack and manufacturers have passed along, or are expected to pass along, these taxes in their list prices charged to distributors.spending levels. We believe declinesfuel prices, where a significant change in consumer spending had a minormacroeconomic conditions could materially impact on our sales in 2008. However, ifconsumer spending declines further and/or the current declines persist for a prolonged period of time, our sales and gross profit may be materially and adversely impacted in 2009.20082011 increased 8.0% to $359.1 million compared with $332.6 million in 2007. Included in gross profit for 2008 is a net refund of $1.4 million from the State of Texas related to the overpayment of taxes on Other Tobacco Products (OTP). Gross profit for 2007 includes a $13.3 million OTP tax refund from the State of Washington. Gross profit for 2008 increased $40.4$48.8 million, or 12.4%12.7%, compared with 2007, excludingto $434.1 million and benefited from incremental cigarette inventory holding gains of $2.1 million and candy inventory holding gains of approximately $5.9 million, both resulting from manufacturer price increases, which also contributed to a $1.7 million increase in LIFO expense. Inventory holding gains are an integral part of the OTP tax refunds, cigarettewholesale business model, however, timing and magnitude is controlled by the manufacturer. Remaining gross profit1 which excludes the aforementioned inventory holding gains and changesLIFO expense, increased 10.7% or $42.3 million, from $395.2 million last year to $437.5 million in LIFO reserves. This2011. Remaining gross profit margin1 declined 5 basis points to 5.39% from 5.44% for 2010. The decline in remaining gross profit margin was due primarily to the addition of FCGC and the new business with Couche-Tard, as well as margin compression resulting from price increases by cigarette manufacturers in 2011. As we expand into more fair trade states where cigarette pricing is regulated, such as the case with FCGC, we will likely see higher cigarette gross profits, in terms of cents per carton, and lower food/non-food gross profit margins. To the extent that we capture large chain business like Couche-Tard, we will likely realize lower across the board gross profit margins since our invested assets for these customers are lower, allowing us in most cases to offer lower prices to achieve our desired return on investment.(1) Remaining gross profit and remaining gross profit margin are non-GAAP financial measures which we provide to segregate the effects of cigarette inventory holding gains, LIFO expense and other items that significantly affect the comparability of gross profit and related margins (see table reconciling gross profit and remaining gross profit in "Results from Operations" below). for 2008 was driven primarily by a 12.1% increasehigher sales and increases in the food/non-food categories and incremental gross profit from the Toronto and New England divisions.Operating expenses increased 11.6% to $329.0 million for 2008 compared with $294.9 million in 2007. Approximately 47% of this dollar increase was related to the addition of our New England and Toronto divisions, the latter of which is expected to leverage its operating expenses as they continue to add new customers. The remaining increase of 6% is attributable to a significant increase in health care and workers’ compensation costs stemming from higher medical costs as well as severity of certain claims. In addition, more employees earned a bonus in 2008 since the results used to calculate bonuses for 2007 excluded the OTP tax refund, but included the $5.9 million bad debt expense. Inflation in fuel costs also contributed to the remaininginventory holding gains offset partially by an increase in operating expenses especially duringof 9%. Operating expenses as a percentage of net sales improved 11 basis points in 2011 compared to 2010 despite additional infrastructure costs to support the first seven monthsnew distribution agreement with Couch-Tard, including our new Florida division and a $3.5 million increase in net fuel costs. While the impact of 2008. Significant increasesfuel costs lessened in the pricesecond half of 2011 as prices stabilized, future increases or decreases in fuel couldcosts or the fuel surcharges we pass on to our customers may materially impact our financial results depending on the extent and timing of these changes.increasesaddition of FCGC and the new Couche-Tard business, gross profit expansion in our abilityfood/non-food commodities, incremental inventory holding gains and operating expense leverage.adjustexpand our fuel surcharges accordingly. Our surcharge is generally set atpresence eastward, expand our fresh product offering and drive our vendor consolidation initiative. Some of our expansion activities include:beginningnumber of each quarterstores participating in our proprietary “Fresh and Local™” program by over 2,100 locations. Total store participation has grown to over 8,700 stores with approximately 4,600 of those stores purchasing three of the four qualifying fresh categories. We have continued to partner with our vendors and certain equipment manufacturers to assist the retailer in obtaining the proper refrigerated equipment to showcase their fresh product offering. In 2011 we expanded our line of equipment offerings to include open-air, walk-around and end-cap units and continued to provide our free-standing wall units. We have partnered with local dairies, bakeries and commissaries to further enable our divisions to deliver the freshest product possible aligned with geographical preferences. This program was in addition to our other sales and marketing initiatives focused on increasing sales for fresh products. We continue to add breadth to the program by offering new fresh item solutions and we realized positive margin growth in 2011 for “Fresh” by improving product assortment, in-store marketing efforts and spoil management.averagepurchase price allocation from the valuation of fuel for the previous quarter.Operating incomeassets and liabilities. The acquisition was $30.1funded with a combination of cash on hand and borrowings under our $200 million for 2008 compared with $37.7 millionrevolving credit facility. This acquisition has allowed us to increase our infrastructure and market share in 2007. Excluding cigarette holding gains, changes in LIFO reserves, and OTP tax refunds in both years, operating income increased 20.8% to $36.6 million in 2008 from $30.3 million in 2007. Depreciation and amortization increased to $17.4 million in 2008 from $14.9 million in 2007 resulting from investmentthe southeastern U.S. The financial results of FCGC's operations have been included in our new divisionsconsolidated financial statements since the date of acquisition, along with the costs associated with completing the acquisition and investmentintegrating them onto DCMS. FCGC's customers are located primarily in states where cigarette pricing is regulated. Sales in these states, known as "fair trade" states, will likely result in higher cigarette gross profits, in terms of cents per carton, and lower food/non-food gross profit margins. We integrated FCGC onto DCMS in October 2011 and expect to increase its operational leverage as a result of that conversion (cold channel enhancements, and stock compensation expenses decreased from $5.3 million in 2007 to $3.9 million in 2008.consolidated financial statements).(2) Adjusted EBITDA is not defined by GAAP and should be considered as a supplement to, and not as a substitute for, or superior to, financial measures calculated in accordance with GAAP (see calculation of adjusted EBITDA in "Liquidity and Capital Resources" below). Business DevelopmentsAsset Acquisitions in 2008 and 2006June 23, 2008,August 2, 2010, we acquired substantially all of the assets of Auburn MerchandiseFinkle Distributors, Inc. ("FDI"), (“AMD”) located in Whitinsville, Massachusetts, a wholly-owned subsidiary of Warren Equities, Inc.,Johnstown, New York, for approximately $28.7 million, including transaction costs.$36.0 million. FDI was a regional, convenience wholesaler servicing customers in New York, Pennsylvania and the surrounding states. The acquired assets purchased includeconsisted primarily of accounts receivable, inventory and fixed assets. AMD operates out of a 130,000 sq. ft. facility and conducts business primarily in the Northeastern region of the United States. The AMD acquisition has expanded our presence and infrastructure in the Northeastern region of the United States. The purchase price of approximately $28.7 million, including transaction costs, exceeded the estimated fair value of net assets acquired by approximately $0.9 million, which was recorded as goodwill. AMD conducts operations as the “New England” division of Core-Mark. Results of operations of AMD have been included in our consolidated financial statements of operations since the date of acquisition.On June 19, 2006, we completed the purchase Upon completion of substantially all the assets and certain liabilities of Klein Candy Co. L.P. (Pennsylvania Division), a full service distributor of tobacco and grocery items to convenience stores and other retail store formats in nine Eastern and mid-Western states, for approximately $58.3 million, including $0.7 million of direct transaction costs. We acquired Klein to help build a national distribution capacity. To fund the acquisition, we increasedtransitioned warehouse operations to our borrowingNew England and Pennsylvania divisions (see Note 3 --Acquisitions to our consolidated financial statements).by $57.6were re-established at $30 million but also increasedunder the February 2010 amendment to our available borrowing capacity by $27.6 million as a result of the inclusion of the Klein assets inCredit Facility (see Note 7 -- Long-Term Debt to our borrowing base. Approximately 60 days subsequent to the acquisition, we established accounts payable creditterms, including cigarette and tobacco taxes payable, of approximately $23.1 million related to the Pennsylvania division operations, which reduced the borrowings required as a result of the acquisition. In October 2006, we integrated the Pennsylvania division onto our proprietary DCMS platform(See Note 3—Acquisitions)consolidated financial statements).Share Repurchase ProgramOn March 12, 2008, our Board of Directors authorized a share repurchase program of up to $30.0 million to repurchase shares of our common stock in the open market or in privately negotiated transactions subject to market conditions. The number of shares to be repurchased and the timing of the purchases will be based on market conditions, our cash and liquidity requirements, relevant securities laws and other factors. The share repurchase program may be discontinued or amended at any time. We fundedwas approved by our Board to enable the company to buy shares when we believe our stock price is undervalued. Repurchases under the program also have the positive effect of offsetting the dilution associated with new share repurchases during 2008,issuances due to vesting of restricted stock and plan to fund any future repurchases, from available cash. Our Credit Facility was amended to allow us to execute the share repurchase program. Weexercise of stock options and warrants. During the year ended December 31, 2011, we repurchased 396,716542,415 shares of common stock under theat an average price of $35.03 per share repurchase program as of December 31, 2008 atfor a total cost of $19.0 million. No shares of common stock were repurchased under our share repurchase program for the year ended December 31, 2010. During the year ended December 31, 2009, we repurchased 98,646 shares of common stock at an average price of $22.77 per share for a total cost of $2.2 million. As of December 31, 2011 there was $11.0 million.Tobaccomillion available for future share repurchases under our share repurchase program.Refunds Settlement AgreementsIn November 2008, we entered into a settlement agreement withLiability Impact for the State of Texas Comptroller of Public Accounts related to a technical interpretation ofChildren's Health Insurance ProgramTexas’ Other Tobacco Products Tax Law,cigarettes from 39¢ to $1.01 per pack effective April 1, 2009. In March 2009, most U.S. manufacturers increased their list prices which resulted in an increase of approximately 28% on Core-Mark's product purchases in response to the passage of the SCHIP legislation. Cigarette inventory holding gains were $8.2 million for 2011 and $6.1 million for 2010, compared to cigarette inventory holding gains of $36.7 million, partially offset by a net refund of $1.4 million. This refund, which was received in January 2009, was recorded in the fourth quarter of 2008 as a reduction to cost of goods sold.In April 2007, we entered into a settlement agreement with the State of Washington Department of Revenue related to a technical interpretation of the State of Washington’s Other Tobacco Tax Law which specified a refund of Other Tobacco Product (OTP)federal floor stock tax of approximately $13.3$11.5 million, representing 25% of the State of Washington OTP tax we paid for the periods of December 1991 through December 1996 and May 1998 through June 2005. This refund, which was received2009. The significant cigarette inventory holding gains in July 2007, was recorded2009 were due primarily to increases in the second quarter of 2007 as a reduction to cost of goods sold.Expansion to Eastern CanadaIn January 2008, we opened a new distribution facility near Toronto, Ontario. This new facility expanded our existing market geographycigarette prices by manufacturers in Canada. We signed a long-term supply agreement with Couche-Tard, a Canadian retailer that operates over 600 stores in the province of Ontario. The total cost of the facility was approximately $9.6 million, including $1.8 million of start-up costs, of which approximately $1.0 million was expensed in 2008.New Business and Supply Agreement with MAPCO Express, Inc. in 2008On December 31, 2007, we signed a Supply Agreement with MAPCO Express, Inc. (MAPCO) to serve their network of approximately 500 convenience stores in 8 Southeastern states. This new business relationship has strengthened our sales and operations in the Southeastern United States.Distribution Development by Imperial Tobacco of Canada in 2006The largest tobacco manufacturer in Canada, Imperial Tobacco Canada, sales of whose products represented approximately 40% of our Canadian revenues, or approximately 8% of our total revenues, for the six months ended June 30, 2006, commenced by-passing wholesale distributors when it began direct-to-store delivery of its products in September 2006. This resulted in a decline in our sales of approximately $253.9 million in 2007 compared to 2006. As a result of the application of surcharges or increased mark-ups on other products we distribute to our Canadian customers, we believe we have recovered substantially all of our lost profits that resulted from the decision of Imperial Tobacco. Although competition provides our Canadian customers choices,thus far they have selected to continue purchasing products and services from us despite our need to apply surcharges and other means of recouping lost profits from the sales of Imperial Tobacco products.If other manufacturers were to take similar action and begin direct delivery of their products, our business would be adversely affected. However, to date we have had no indication that other manufacturers intend to do so. We believe that manufacturers may be less likely to make such a change since by using Core-Mark as a distributor the manufacturer leverages Core-Mark’s existing distribution network and shifts customer credit risk to us. Conversely, a decision to engage in direct distribution would require the manufacturer to invest in and bear those distribution costs and extend creditresponse to the customer directly.20082011 and 20072010(1) 2011 2010 2011 Amounts (in millions) % of Net sales % of Net sales, less excise taxes Amounts (in millions) % of Net sales % of Net sales, less excise taxes Increase (Decrease) (in millions) Net sales $ 848.1 $ 8,114.9 100.0 % — % $ 7,266.8 100.0 % — % Net sales — Cigarettes 590.9 5,710.6 70.4 64.1 5,119.7 70.5 64.0 Net sales — Food/non-food 257.2 2,404.3 29.6 35.9 2,147.1 29.5 36.0 653.1 6,163.4 76.0 100.0 5,510.3 75.8 100.0 48.8 434.1 5.3 7.0 385.3 5.3 7.0 Warehousing and distribution expenses 22.8 234.6 2.9 3.8 211.8 2.9 3.8 Selling, general and administrative expenses 8.3 150.8 1.9 2.4 142.5 2.0 2.6 Amortization of intangible assets 0.9 3.0 — — 2.1 — — Income from operations 16.8 45.7 0.6 0.7 28.9 0.4 0.5 Interest expense (0.2 ) (2.4 ) — — (2.6 ) — — Interest income — 0.4 — — 0.4 — — Foreign currency transaction (losses) gains, net (1.0 ) (0.5 ) — — 0.5 — — Income before taxes 16.0 43.2 0.5 0.7 27.2 0.4 0.5 Net income 8.5 26.2 0.3 0.4 17.7 0.2 0.3 21.9 91.9 1.1 1.5 70.0 1.0 1.3 2008
Increase
(Decrease)
(in millions) 2008 2007 Amounts
(in millions) % of
Net
sales % of
Net sales,
less excise
taxes Amounts
(in millions) % of
Net
sales % of Net
sales,
less excise
taxes $ 484.0 $ 6,044.9 100.0 — $ 5,560.9 100.0 — 261.7 4,124.8 68.2 60.7 3,863.1 69.5 62.4 222.3 1,920.1 31.8 39.3 1,697.8 30.5 37.6 359.0 4,570.5 75.6 100.0 4,211.5 75.7 100.0 26.5 359.1 5.9 7.9 332.6 6.0 7.9 23.5 197.6 3.3 4.3 174.1 3.1 4.1 10.4 129.4 2.1 2.8 119.0 2.1 2.8 (7.6 ) 30.1 0.5 0.7 37.7 0.7 0.9 (0.2 ) 2.2 — 0.1 2.4 — 0.1 (0.4 ) (1.0 ) — — (1.4 ) — — 7.2 6.3 0.1 0.1 (0.9 ) — — (15.0 ) 22.6 0.4 0.5 37.6 0.7 0.9 (6.2 ) 17.9 0.3 0.4 24.1 0.4 0.6 (1) Amounts and percentages have been rounded for presentation purposes and might differ from unrounded results. (2) actualproduct sales growth and increases in state, local and provincial excise taxes which we are responsible for collecting and remitting. Federal excise taxes are levied on the manufacturers who pass the taxes on to us as part of the product cost and thus are not a component of our excise taxes. Although increases in cigarette excise taxes result in higher net sales, our overall gross profit percentage may be reduced, however we do not expect increases in excise taxes to negatively impact gross profit per carton (See—see Comparison of Sales and Gross Profit by Product Line,Category, page 3633). Increases in cigarette-related taxes and/or fees, excise taxes, drive prices higher on the cigarette products we sell which result in higher net sales without increasing gross profit dollars. Increases in excise taxes result in a decline in overall gross profit percentage since net sales increase and gross profit dollars remain the same.(3) Gross margins may not be comparable to those of other entities because warehousewarehousing and distribution expenses are not included as a component of our cost of goods sold.(4) Adjusted EBITDA is not defined by GAAP and should be considered as a supplement to, and not as a substitute for, or superior to, financial measures calculated in accordance with GAAP (see calculation of adjusted EBITDA in "Liquidity and Capital Resources" below). $484.0$848.1 million, or 8.7%11.7%, to $6,044.9$8,114.9 million for 2008 from $5,560.9$7,266.8 million in 2007. The increase includes excise taxes2010. Excluding the effects of $124.9 million. Excluding our new distribution facility in Toronto and the recently acquired New England division,foreign currency fluctuations, net sales increased $227.6 million, or 4.1%,11.0% in 2011 compared to 2010, driven primarily by net sales attributable to the FCGC and FDI acquisitions, sales associated with the new distribution agreement with Couche-Tard and increases fromin food/non-food sales to existing and new customers.20082011 increased $261.7by $590.9 million, or 6.8%11.5%, to $4,124.8$5,710.6 million from $3,863.1$5,119.7 million in 2007. The2010. Net cigarette sales for 2011 increased 10.9%, excluding the effects of foreign currency fluctuations. This increase in net cigarette sales was driven by sales attributable to the FCGC and FDI acquisitions and sales associated with the new distribution agreement with Couche-Tard. In addition, there was a 4.5%3.3% increase in themanufacturercigarette price inflation and stateincreases in excise tax increasestaxes. Total carton sales in 2011 increased 9.2% in the U.S. and increased 1.3% in Canada. Excluding incremental carton sales from ourattributable to the FCGC and FDI acquisitions, carton sales associated with the new distribution facilities in Torontoagreement with Couche-Tard and New England, which also contributed to an approximate 2.2% increase in overallone additional selling day this year, carton sales compared with 2007. Carton sales declined approximately 1.7%by 1.9% in the United States, excluding sales from our New England division, due primarily to overall lower consumer demand. Carton sales in Canada increased 19.6%, or 8.3%, excluding sales from our new Toronto division. The increaseU.S. While we have experienced only slight declines in carton sales in Canada was attributable primarily to market share gainson a comparative basis, consistent with industry trends over theadditional product lines.the decline to the distributor. Total net cigarette sales as a percentage of total net sales was 68.2% for 2008 and 69.5% for 2007.Non-FoodNon-food Products. Net sales of food and food/non-food products for 20082011 increased $222.3$257.2 million, or 13.1%12.0%, to $1,920.1$2,404.3 million from $1,697.8$2,147.1 million in 2010. Excluding the effects of foreign currency fluctuations, net sales of our food/non-food products increased 11.3% in 2011. The following table provides net sales by product category for 2007.our food/non-food products (dollars in millions)(1): 2011 2010 Increase / (Decrease) Product Category Net Sales Net Sales Dollars Percentage Food $ 995.7 $ 840.9 $ 154.8 18.4 % Candy 459.8 426.0 33.8 7.9 % Other tobacco products 607.9 503.6 104.3 20.7 % Health, beauty & general 237.5 220.6 16.9 7.7 % Beverages 100.9 152.0 (51.1 ) (33.6 )% Equipment/other 2.5 4.0 (1.5 ) (37.5 )% Total Food/Non-food Products $ 2,404.3 $ 2,147.1 $ 257.2 12.0 % (1) Amounts and percentages have been rounded for presentation purposes and might differ from unrounded results. duedriven primarily by sales attributable to increases in our food, candythe FCGC and other tobacco product categoriesFDI acquisitions, the new distribution agreement with Couche-Tard and incremental sales driven by the Company’sour sales and marketing initiatives primarily impacting our food category. In addition, sales in our Other Tobacco Products ("OTP") category were positively impacted by an increase in sales of smokeless tobacco products, which we believe is driven by increased regulation of where people can smoke and the addition of our new Toronto and New England divisions.an increase in excise taxes. Total net sales of food and food/non-food products as a percentage of total net sales was 31.8%increased slightly to 29.6% for 20082011 compared to 30.5%29.5% for 2007.portionamount of sales remainingprofit after deducting the cost of goods sold from net sales during the period. Vendor incentives, cigaretteinventory holding profitsgains and changes in LIFO reserves are classified as elementscomponents of cost of goods sold.sold and therefore part of our gross profit. Gross profit in 2008for 2011 increased by $26.5$48.8 million, or 8.0%12.7%, to $359.1$434.1 million from $332.6$385.3 million in 2007.20082011 and 20072010(1): 2011 2010 % of Net sales % of Net sales, less excise taxes % of Net sales % of Net sales, less excise taxes Net sales $ 8,114.9 100.0 % — $ 7,266.8 100.0 % — 6,163.4 76.0 100.0 % 5,510.3 75.8 100.0 % Components of gross profit: Cigarette inventory holding gains $ 8.2 0.10 % 0.13 % $ 6.1 0.08 % 0.11 % 5.9 0.07 0.10 — — — 0.8 0.01 0.01 0.6 0.01 0.01 LIFO expense (18.3 ) (0.22 ) (0.30 ) (16.6 ) (0.23 ) (0.30 ) 437.5 5.39 7.10 395.2 5.44 7.17 Gross profit $ 434.1 5.35 % 7.04 % $ 385.3 5.30 % 6.99 % 2008 2007 Amounts
(in millions) % of Net
sales % of Net
sales, less
excise taxes Amounts
(in millions) % of Net
sales % of Net
sales, less
excise taxes $ 6,044.9 100.0 % — $ 5,560.9 100.0 % — 4,570.5 75.6 100.0 % 4,211.5 75.7 100.0 % 1.4 0.02 0.03 13.3 0.24 0.32 (11.0 ) (0.18 ) (0.24 ) (13.1 ) (0.24 ) (0.31 ) 3.1 0.05 0.07 7.3 0.13 0.17 365.6 6.05 8.00 325.1 5.85 7.72 $ 359.1 5.94 % 7.86 % $ 332.6 5.98 % 7.90 % (1) Amounts and percentages have been rounded for presentation purposes and might differ from unrounded results. (2) actualproduct sales growth and increases in state, local and provincial excise taxes which we are responsible for collecting and remitting. Federal excise taxes are levied on the manufacturers who pass the tax on to us as part of the product cost and thus are not a component of our excise taxes. Although increases in cigarette excise taxes result in higher net sales, our overall gross profit percentage may be reduced, however we do not expect increases in excise taxes to negatively impact gross profit per carton (See—see Comparison of Sales and Gross Profit by Product Line,Category, page 3633). Increases in cigarette-related taxes and/or fees, excise taxes, drive prices higher on the cigarette products we sell which result in higher net sales generally without increasing gross profit dollars. Increases in excise taxes result in a decline in overall gross profit percentage since net sales increase and gross profit dollars remain the same.(3) We recognized approximately $5.9 million of candy inventory holding gains resulting from manufacturer price increases during 2011. The candy inventory holding gains were estimated as the amount in excess of our normal manufacturer incentives for those products sold during 2011. (4) We received an OTP (Other Tobacco Products) tax refunds from the Statesettlement of Texas of $1.4$0.8 million in 2008,2011 and recognized a $0.6 million OTP tax gain resulting from the State of Washington of $13.3 milliona state tax method change in 2007.2010.As a percentage(5) Remaining gross profit is a non-GAAP financial measure which we provide to segregate the effects of LIFO expense, cigarette inventory holding gains and other items that significantly affect the comparability of gross profit. improved to 6.05% for 2008 compared to 5.85% for 2007. Ourmargin by approximately eight basis points in 2011.percentage for cigarettes declinedincreased approximately 5 basis points for 2008 to 2.56% compared with 2.61% in 2007. This decline was due primarily to inflation in product cost from increases in excise taxes. Our remaining cigarette gross profit increased 2.4%12.0%, or 3.4% on a cents per carton basis.basis, in 2011 compared to 2010 due primarily to higher remaining gross profit per carton from FCGC, which operates primarily in fair trade states. As we expand our presence into fair trade states cigarette margins will be positively impacted and food/non-food margins will generally be negatively impacted.related tomargin for our food/non-food category increaseddecreased approximately 3221 basis points for 2008in 2011 to 13.53%12.39% compared with 13.21%to 12.60% in 2007.2010. Excluding FCGC and the new Couche-Tard business, which have lower food/non-food margins than the rest of our new divisions, Toronto and New England,business, food/non-food remaining gross profitfor food/non-food category margins increased 47approximately 22 basis points to 13.68% in 2008 compared with 2007. The increase inpoints.percentagefor food/non-food products was approximately 68.1% of our total remaining gross profit compared to 68.5% in 2010. The decrease in 2011 was due primarily to the addition of FCGC, which derives a higher percentage of sales from higher margin food/non-food products combined with an increase in inventory holding gains related to candy, somewhat offset by an increase in inventory shrinkage and the addition of national chain store customers.In 2008, approximately 71.0% ofits remaining gross profit was derived from cigarettes. We expect FCGC's food/non-food products comparedremaining gross profit margin to 69.5% in 2007,increase over time as we introduce and implement our marketing programs, including the impact of the OTP tax refunds.warehousing, distribution,Warehousing and selling, generalDistribution, and administrativeSelling, General and Administrative activities. In 2008,2011, operating expenses increased $34.1$32.0 million, or 11.6%9.0%, to $329.0$388.4 million from $294.9$356.4 million in 2007. Included in operating expenses for 2007 was a bad debt charge2010. The majority of $5.9 million related to two customers and a workers’ compensation benefit of $3.1 million related to favorable claims experience prior to 2007. Excluding these two items, operating expenses increased $36.9 million, or 12.6%, for 2008. Thisthe increase in operating expenses was driven primarily by a 13.5% increase in warehouseattributable to the addition of FCGC, FDI, the new Florida distribution center and other infrastructure costs to support the new distribution agreement with Couche-Tard. Additional items impacting operating expenses and an 8.7% increase in selling, general and administrative expenses.for the year ended December 31, 2011 are discussed below. As a percentage of net sales, totalwere 5.4%declined to 4.8% in 20082011 compared with 5.3%to 4.9% in 2007.$23.5$22.8 million, or 13.5%10.8%, to $197.6$234.6 million in 20082011 from $174.1$211.8 million in 2007.2010. The increase in warehousing and distribution expenses compared with 2010 was due primarily to increases in sales volume, the addition of our TorontoFCGC, FDI, the new Florida distribution center and New England divisions which represented 48.9% of thea $2.7 million increase sales growth and related operational inefficiencies at two of our divisions which accounted for 24.8% of the increase, higherin net fuel costs net of surcharges, which represented 7.0% of the increase,excluding FCGC and an increase in facility and truck rental expense due primarily to investment in additional capacity in certain locations to support our growth in key markets.Florida. As a percentage of net sales, warehousing and distribution expenses were 3.3%2.9% for 2008both years, including the impact of higher fuel costs. While the impact of fuel costs lessened in the second half of 2011 as comparedprices stabilized, future increases or decreases in fuel costs or in the fuel surcharges we pass on to 3.1% for 2007.our customers may materially impact our financial results depending on the extent and timing of these changes.Expenses.Expenses. SG&A expenses increased $10.4$8.3 million, or 8.7%5.8%, in 2011to $129.4$150.8 million from $142.5 million in 2008 from $119.0 million2010. The increase in 2007. SG&A expenses were impacted in 2007 by a $5.9 million bad debt charge related to two customers that filed for bankruptcy protection and a workers’ compensation benefit of $3.1 million related to favorable claims experience prior to 2007. Excluding these two items, SG&A expenses increased by $13.2 million, or 11.4%, in 2008. The increase for 2008 is2011 was due primarily to higher employee benefitthe addition of FCGC including $2.7 million of transition costs, driven by increases in healthcare and workers’ compensation costs due to a higher wage base, increased medical costs, as well as an increase in the severity of certain claims, the addition of the TorontoFlorida distribution center including $1.8 million of start-up costs, other infrastructure costs to support the new distribution agreement with Couche-Tard, and New England divisions,an increase of $2.7 million for employee bonus and lower bonus last year asstock-based compensation expense, partially offset by a result$1.2 million decrease in health and welfare costs. SG&A expenses for 2010 included $2.8 million of fewer employees qualifying.FDI integration costs, $1.6 million of costs related to the settlement of insurance claims we inherited from Fleming, our former parent company, and $1.1 million of expenses for advisory and due diligence activities necessary to analyze multiple offers from potential acquirers. As a percentage of net sales, SG&A expenses were 2.1%1.9% for both 2008 and 2007.debt interest and loan amortization of fees related to borrowings. For 2008,Interest expense was $2.4 million for 2011 compared to $2.6 million for the same period in 2010. Lower fees for unused facility and letter of credit participation were offset in part by higher interest expense decreased by $0.2 million, or 8.3%,due to $2.2 million from $2.4 million in 2007. The decrease in interest expense was due primarily to lower interest rateshigher borrowings during 2008 compared to 2007.2011. Average borrowings for 20082011 were $21.1$21.1 million compared to $19.8 million for 2007. During 2008, the weightedwith an average interest rate on the revolving credit facility was 3.8%of 2.2%, compared to 6.7%average borrowings of $3.1 million and an average interest rate of 2.9% for the same period in 2007. The decline in interest rates is the result of general decreases in rates charged to us on2010.prime2011 and LIBOR borrowings.Interest Income. In 20082010. Our interest income was $1.0 million compared to $1.4 million for 2007. Interest income is derived primarily from our earnings on cash balances kept in trust, checking accounts and overnight deposits. The interest income was lower for 2008 due primarily to a reduction in prevailing interest rates.Losses (Gains), net(Losses) Gains, Net. We incurredrealized foreign currency transaction losses of $6.3$0.5 million for 2011 compared to gains of $0.5 million in 2008 compared to $0.9 million in gains in 2007.2010. The fluctuation was due primarily to the depreciationlevel of the Canadian foreign exchange rate against the US dollar over the last six months of 2008 on transactions betweeninvestment in our Canadian operations and to changes in the Canadian/U.S. operations. For 2008 the average Canadian/United States exchange rate was $1.0676 compared to $1.0735 for 2007.rate.20.8%39.4% for 20082011 compared to 35.9%34.9% for 2007 (See 2010 (seeNote 10—9 -- Income Taxesto our consolidated financial statements for a reconciliation of the differences between the federal statutory tax rate and the effective tax rate). The increase in our effective tax rate for 2011 was due primarily to a higher proportion of earnings from our Canadian operations in 2011, the impact of uncertain tax positions recognized in each period and non-deductible transaction costs related to our recent acquisition of FCGC. 2010 2009 2010 Amounts (in millions) % of Net sales % of Net sales, less excise taxes Amounts (in millions) % of Net sales % of Net sales, less excise taxes Increase (Decrease) (in millions) Net sales $ 735.2 $ 7,266.8 100.0 % — % $ 6,531.6 100.0 % — % Net sales — Cigarettes 530.6 5,119.7 70.5 64.0 4,589.1 70.3 64.0 Net sales — Food/non-food 204.6 2,147.1 29.5 36.0 1,942.5 29.7 36.0 494.7 5,510.3 75.8 100.0 5,015.6 76.8 100.0 (16.3 ) 385.3 5.3 7.0 401.6 6.1 8.0 Warehousing and distribution expenses 14.5 211.8 2.9 3.8 197.3 3.0 3.9 Selling, general and administrative expenses 5.2 142.5 2.0 2.6 137.3 2.1 2.7 Amortization of intangible assets 0.1 2.1 — — 2.0 — — Income from operations (36.1 ) 28.9 0.4 0.5 65.0 1.0 1.3 Interest expense 0.9 (2.6 ) — — (1.7 ) — — Interest income 0.1 0.4 — — 0.3 — — Foreign currency transaction gains (losses), net (1.7 ) 0.5 — — 2.2 — — Income before taxes (38.6 ) 27.2 0.4 0.5 65.8 1.0 1.3 (29.6 ) 17.7 0.2 0.3 47.3 0.7 0.9 (25.5 ) 70.0 1.0 1.3 95.5 1.5 1.9 (1) Amounts and percentages have been rounded for presentation purposes and might differ from unrounded results. (2) (3) Gross margins may not be comparable to those of other entities because warehousing and distribution expenses are not included as a component of our cost of goods sold. (4) The decrease in net income compared to 2009 was due primarily to a $19.1 million reduction in cigarette inventory holding gains, a $5.3 million reduction in income earned primarily from manufacturer price increases, an increase in LIFO expense of $9.9 million and $5.5 million of additional expenses in 2010. (5) Adjusted EBITDA is not defined by GAAP and should be considered as a supplement to, and not as a substitute for, or superior to, financial measures calculated in accordance with GAAP (see calculation of adjusted EBITDA in "Liquidity and Capital Resources" below). 2010 2009 Increase / (Decrease) Product Category Net Sales Net Sales Dollars Percentage Food $ 840.9 $ 738.0 $ 102.9 13.9 % Candy 426.0 405.0 21.0 5.2 % Other tobacco products 503.6 434.0 69.6 16.0 % Health, beauty & general 220.6 209.5 11.1 5.3 % Beverages 152.0 151.7 0.3 0.1 % Equipment/other 4.0 4.3 (0.3 ) (5.5 )% Total Food/Non-food Products $ 2,147.1 $ 1,942.5 $ 204.6 10.5 % (1) Amounts and percentages have been rounded for presentation purposes and might differ from unrounded results. 2010 2009 % of Net sales % of Net sales, less excise taxes % of Net sales % of Net sales, less excise taxes Net sales $ 7,266.8 100.0 % — $ 6,531.6 100.0 % — 5,510.3 75.8 100.0 % 5,015.6 76.8 100.0 % Components of gross profit: Cigarette inventory holding gains $ 6.1 0.08 % 0.11 % $ 36.7 0.56 % 0.73 % — — — (11.5 ) (0.18 ) (0.23 ) 0.6 0.01 0.01 0.6 0.01 0.01 LIFO expense (16.6 ) (0.23 ) (0.30 ) (6.7 ) (0.10 ) (0.13 ) 395.2 5.44 7.17 382.5 5.86 7.63 Gross profit $ 385.3 5.30 % 6.99 % $ 401.6 6.15 % 8.01 % (1) Amounts and percentages have been rounded for presentation purposes and might differ from unrounded results. (2) Net sales, less excise taxes is a non-GAAP financial measure which we provide to separate the increase in sales due to product sales growth and increases in state, local and provincial excise taxes which we are responsible for collecting and remitting. Federal excise taxes are levied on the manufacturers who pass the tax on to us as part of the product cost and thus (3) In February 2009, SCHIP was signed into law and imposed a floor stock tax on tobacco products held for sale on April 1, 2009. The net floor stock tax was recorded as an increase to our cost of goods sold in the second quarter of 2009. (4) We recognized a $0.6 million OTP tax gain resulting from a state tax method change in 2010. We recognized an OTP tax refund of $0.6 million in 2009. (5) Remaining gross profit is a non-GAAP financial measure which we provide to segregate the effects of LIFO expense, cigarette inventory holding gains, FET associated with the SCHIP legislation and other items that significantly affect the comparability of gross profit. 20082010 was a $3.2$0.7 million net benefit, including $0.1 million of interest recovery, compared to a net benefit of $6.7 million, including $2.1 million of interest recovery, for the same period in 2009. The net benefits related primarily to the expiration of the statute of limitations for uncertain tax positions and changesrevisions to prior year’syear estimates and $0.1 millionbased upon the finalization of penalties netour tax returns.2007Sales and 2006Gross Profit by Product Category 2011 2010 2009 Cigarettes Net sales $ 5,710.6 $ 5,119.7 $ 4,589.1 1,762.1 1,594.2 1,381.0 3,948.5 3,525.5 3,208.1 LIFO expense 10.4 11.3 6.6 137.4 119.4 142.4 Gross profit % 2.41 % 2.33 % 3.10 % Gross profit % less excise taxes 3.48 % 3.39 % 4.44 % $ 139.6 $ 124.6 $ 122.9 Remaining gross profit % 2.44 % 2.43 % 2.68 % Remaining gross profit % less excise taxes 3.54 % 3.53 % 3.83 % Food/Non-food Products Net sales $ 2,404.3 $ 2,147.1 $ 1,942.5 189.4 162.3 135.0 2,214.9 1,984.8 1,807.5 LIFO expense 7.9 5.3 0.1 296.7 265.9 259.2 Gross profit % 12.34 % 12.38 % 13.34 % Gross profit % less excise taxes 13.40 % 13.40 % 14.34 % $ 297.9 $ 270.6 $ 259.6 12.39 % 12.60 % 13.36 % Remaining gross profit % less excise taxes 13.45 % 13.63 % 14.36 % Totals Net sales $ 8,114.9 $ 7,266.8 $ 6,531.6 1,951.5 1,756.5 1,516.0 6,163.4 5,510.3 5,015.6 LIFO expense 18.3 16.6 6.7 434.1 385.3 401.6 Gross profit % 5.35 % 5.30 % 6.15 % Gross profit % less excise taxes 7.04 % 6.99 % 8.01 % $ 437.5 $ 395.2 $ 382.5 Remaining gross profit % 5.39 % 5.44 % 5.86 % Remaining gross profit % less excise taxes 7.10 % 7.17 % 7.63 % 2007
Increase
(Decrease)
(in millions) 2007 2006 Amounts
(in millions) % of
Net
sales % of
Net sales,
less excise
taxes Amounts
(in millions) % of
Net
sales % of Net
sales,
less excise
taxes $ 246.5 $ 5,560.9 100.0 — $ 5,314.4 100.0 79.3 3,863.1 69.5 62.4 3,783.8 71.2 64.4 167.2 1,697.8 30.5 37.6 1,530.6 28.8 35.6 210.4 4,211.5 75.7 100.0 4,001.1 75.3 100.0 34.9 332.6 6.0 7.9 297.7 5.6 7.4 23.0 174.1 3.1 4.1 151.1 2.8 3.8 12.4 119.0 2.1 2.8 106.6 2.0 2.7 (0.8 ) 37.7 0.7 0.9 38.5 0.7 1.0 (2.9 ) 2.4 — 0.1 5.3 0.1 0.1 0.3 (1.4 ) — — (1.1 ) — — 1.2 (0.9 ) — — 0.3 — — 3.6 37.6 0.7 0.9 34.0 0.6 0.8 3.5 24.1 0.4 0.6 20.6 0.4 0.5 (1) Amounts and percentages have been rounded for presentation purposes and might differ from unrounded results. (2) Excise taxes included in our net sales consist of state, local and provincial excise taxes which we are responsible for collecting and remitting. Federal excise taxes are levied on the manufacturers who pass the tax on to us as part of the product cost and thus are not a component of our excise taxes. Although increases in cigarette excise taxes result in higher net sales, our overall gross profit percentage may be reduced since gross profit dollars generally remain the same. (3) Net sales, less excise taxes is a non-GAAP financial measure which we provide to separate the increase in sales due to actualproduct sales growth and increases in excise taxes (See—Comparison of Sales and Gross Profit by Product Line, page 36). Increases in cigarette-related taxes and/or fees, excise taxes, drive prices higher on the cigarette products we sell which result in higher net sales without increasing gross profit dollars. Increases in excise taxes result in a decline in overall gross profit percentage since net sales increase and gross profit dollars remain the same.taxes.(3)Gross margins may not be comparable(4) Cigarette gross profit includes (i) cigarette inventory holding gains related to those of other entities because warehouse and distribution expenses are not included as a component of cost of goods sold.manufacturer price increases, (ii) increases inConsolidated Net Sales.Net sales increased by $246.5state, local and provincial excise taxes, (iii) federal excise floor taxes and (iv) LIFO effects. Cigarette inventory holding gains for the years 2011, 2010 and 2009 were $8.2 million, or 4.6%, to $5,560.9$6.1 million and $36.7 million, respectively. The significant amount of cigarette inventory holding gains in 2007 from $5,314.4 million in 2006. The increase is due primarily to $231.9 million of incremental sales from our Pennsylvania division which we acquired in June 2006, and net sales increases of $268.5 million to existing and new customers offset by lost sales of $253.9 million due to Imperial Tobacco’s move to direct-to-store delivery. Increases in our overall Canadian operations net sales due to foreign currency exchange rate changes were approximately $40.9 million for 2007 compared to $59.1 million for 2006.Net Sales of Cigarettes.Net sales of cigarettes for 2007 increased $79.3 million, or 2.1%, to $3,863.1 million from $3,783.8 million in 2006. The increase in net cigarette sales was driven by a 3.6% increase in the average sales price per carton due primarily to manufacturer price and state excise tax increases, offset by a 1.4% decrease in overall carton sales compared to 2006. The decrease in cigarette carton sales2009 was due primarily to increases in cigarette prices by manufacturers in response to the loss of Imperial Tobacco volume described above offset by incremental sales from the Pennsylvania division.Adjusting for these items, remaining carton sales declined 2.1% for 2007. Total net cigarette sales as a percentage of total net sales were 69.5% for 2007 and 71.2% for 2006.Net Sales of Food/Non-Food Products.Net sales of food and non-food products for 2007 increased $167.2 million, or 10.9%, to $1,697.8 million from $1,530.6 millionincreases in 2006. The increase was due primarily to higher sales to existing and new customers drivenfederal excise taxes mandated by the Company’s sales and marketing initiatives, and incremental sales from the Pennsylvania division. Total net sales of food and non-food products as a percentage of total net sales were 30.5% for 2007 and 28.8% for 2006.Gross Profit.Gross profit represents the portion of sales remaining after deducting the cost of goods sold during the period. Vendor incentives, cigarette holding profits and changes in LIFO reserves are classified as elements of cost of goods sold. Gross profit in 2007 increased by $34.9 million, or 11.7%, to $332.6 million from $297.7 million in 2006. The increase inSCHIP legislation. Cigarette gross profit dollars for 2007the year ended December 31, 2009 was due primarily to an overall increase in sales volume, the Statenegatively impacted by $10.6 million of Washington OTPfederal excise floor tax refundnet of $13.3 million recorded as a reduction to cost of goods sold, and an increase in cigarette inventory holding profits of $3.2 million, partially offset by an increase of $10.2 million in LIFO expense.The following table provides the components comprising the change in gross profit as a percentage of net sales for 2007 and 2006(1): 2007 2006 Amounts
(in millions) % of Net
sales % of Net
sales, less
excise taxes Amounts
(in millions) % of Net
sales % of Net
sales, less
excise taxes $ 5,560.9 100.0 % — $ 5,314.4 100.0 % — 4,211.5 75.7 100.0 % 4,001.1 75.3 100.0 % 13.3 0.24 0.32 — — — (13.1 ) (0.24 ) (0.31 ) (2.9 ) (0.06 ) (0.07 ) 7.3 0.13 0.17 4.1 0.08 0.10 325.1 5.85 7.72 296.5 5.58 7.41 $ 332.6 5.98 % 7.90 % $ 297.7 5.60 % 7.44 % (1)Amounts and percentages have been rounded for presentation purposes and might differ from unrounded results.(2)Net sales, less excise taxes is a non-GAAP financial measure which we provide to separate the increase in sales due to actual sales growth and increases in excise taxes (See—Comparison of Sales and Gross Profit by Product Line, page 36). Increases in cigarette-related taxes and/or fees, excise taxes, drive prices higher on the cigarette products we sell which result in higher net sales generally without increasing gross profit dollars. Increases in excise taxes result in a decline in overall gross profit percentage since net sales increase and gross profit dollars remain the same.As a percentage of net sales, our remaining gross profit improved to 5.85% for 2007 compared to 5.58% for 2006. Our remaining gross profit percentage for cigarettes increased approximately 7 basis points for 2007 to 2.61% compared with 2.54% in 2006. Our remaining cigarette gross profit increased 6.4% on a cents per carton basis. Remaining gross profitmanufacturer reimbursements related to our food/non-food category increased approximately 13 basis points for 2007 to 13.21% compared with 13.08% in 2006.As a percentage of net sales, gross profit increased to approximately 6.0% for 2007 from 5.6% for 2006. In 2007, approximately 69.5% of gross profit was derived from food/non-food products, including the State of Washington OTP tax refund benefit of $13.3 million, compared to 66.9% in 2006.Operating Expenses.Our operating expenses include costs related to warehousing, distribution, and selling, general and administrative activities. In 2007, operating expenses increased $35.7 million, or 13.8%, to $294.9 million from $259.2 million in 2006. Included in operating expenses for 2007 was a charge of $5.9 million related to an increase in our allowance for doubtful accounts for two customers who declared bankruptcy in the fourth quarter of 2007, and a workers’ compensation benefit of $3.1 million related to favorable claims experience prior to 2007. Excluding these two items, operating expenses increased $32.9 million, or 12.7%, in 2007 as compared to 2006. As a percentage of sales, total operating expenses were 5.3% in 2007 compared with 4.9% in 2006. The increase in operating expenses as a percentage of sales was due primarily to an increase in warehousing and distribution expenses which were 3.1% of sales in 2007 compared to 2.8% in 2006 and to the reduction in sales related to the loss of Imperial Tobacco volume.SCHIP.Warehousing and Distribution Expenses.Warehousing and distribution expenses increased by $23.0 million, or 15.2%, to $174.1 million in 2007 from $151.1 million in 2006. The increase in warehousing and distribution expenses was due primarily to the addition of the Pennsylvania division in June 2006, an increase in sales volume, higher salaries and benefits and an increase in facility rent expense. The increase in salaries and benefits was driven primarily by tight labor market conditions at five of our divisions. Rent expense increased due primarily to investment in additional leased capacity in certain locations to support our growth in key markets. Additionally, included in warehousing and distribution costs in 2007 was approximately $0.2 million of start up costs related to our new Toronto facility which became operational in 2008. As a percentage of sales, these expenses were 3.1% for 2007 as compared to 2.8% for 2006.Selling, General and Administrative (“SG&A”) Expenses.SG&A expenses increased $12.4 million, or 11.6%, to $119.0 million in 2007 from $106.6 million in 2006. The increase in SG&A expenses was due primarily to incremental expenses from our Pennsylvania division which we acquired in June 2006, an increase in the allowance for doubtful accounts of $5.9 million related to two customers, and severance expense due to organizational changes in Canada amounting to $0.6 million, offset by a workers’ compensation benefit of $3.1 million related to favorable claims experience for prior years. Additionally, included in SG&A expenses for 2007 is approximately $0.6 million of start up costs related to our new Toronto facility which became operational in 2008. SG&A expenses for 2006 include a benefit of $3.8 million of workers’ compensation costs resulting from a favorable settlement of amounts owed by us for claims inherited in connection with the Fleming bankruptcy, and the favorable settlement of vendors’ payables and previously written-off customer’s receivables totaling $1.6 million. Additionally in 2006, we received a $1.6 million benefit in insurance proceeds related to a fire at our Denver distribution center in 2002. These benefits in 2006 were offset by incremental costs of $1.0 million incurred in connection with the integration of the Pennsylvania division, and $0.6 million of closure and consolidation costs for the Victoria/Vancouver Facility in Canada. As a percentage of net sales, SG&A expenses were 2.1% for 2007 compared to 2.0% for 2006.Interest Expense.Interest expense includes both debt interest and amortization of fees related to borrowings. For 2007, interest expense decreased by $2.9 million, or 54.7%, to $2.4 million from $5.3 million in 2006. The decrease in interest expense was due primarily to lower average borrowings during 2007 compared to 2006, partially offset by a higher average interest rate. The average borrowings for 2007 were $19.8 million compared to $60.7 million for 2006. During 2007, the weighted average interest rate on the revolving credit facility was 6.7% compared to 6.5% for the same period in 2006.Interest Income.In 2007 interest income was $1.4 million compared to $1.1 million for 2006. Our interest income is derived from earnings on cash balances kept in trust, checking accounts and overnight deposits.Foreign Currency Transaction (Gains) Losses, net. We incurred foreign currency transaction gains of $0.9 million in 2007 compared to $0.3 million in losses in 2006. The fluctuation was due primarily to the appreciation of the Canadian foreign exchange rate against the US dollar in 2007 on transactions between our Canadian and U.S. operations. For 2007 the average Canadian/United States exchange rate was $1.0735 compared to $1.1343 for 2006.Income Taxes.Our effective tax rate was 35.9% for 2007 compared to 39.4% for 2006 (SeeNote 10— Income Taxes for a reconciliation of the differences between the federal statutory tax rate and the effective tax rate). Included in the provision for income taxes for 2007 was $1.4 million of after-tax interest related to the underpayment of income taxes in 2004 and 2005, and to unrecognized tax benefits under FIN 48. The underpayment of income taxes in 2004 and 2005 was due primarily to the misapplication of a tax position we adopted upon emergence from bankruptcy in 2004. The provision for income taxes also included a $2.1 million benefit, inclusive of $0.4 million of after tax interest, related primarily to corrections to our tax liability reserves associated with unitary taxes and other bankruptcy related costs, and to the expiration of the statute of limitations for certain tax positions included in our unrecognized tax benefits as of December 31, 2007.Comparison of Sales and Gross Profit by Product LineThe following table summarizes our cigarette and other product sales, LIFO expense, gross profit and other relevant financial data for 2008, 2007 and 2006 (dollars in millions)(1): 2008 2007 2006 $ 4,124.8 $ 3,863.1 $ 3,783.8 $ 1,350.9 $ 1,237.2 $ 1,209.0 $ 2,773.9 $ 2,625.9 $ 2,574.8 $ 4.7 $ 6.7 $ 1.7 $ 105.7 $ 100.9 $ 96.2 2.56 % 2.61 % 2.54 % $ 104.1 $ 101.5 $ 98.5 2.52 % 2.63 % 2.61 % 3.75 % 3.87 % 3.83 % $ 1,920.1 $ 1,697.8 $ 1,530.6 $ 123.5 $ 112.2 $ 104.3 $ 1,796.6 $ 1,585.6 $ 1,426.3 $ 6.3 $ 6.4 $ 1.2 $ 259.9 $ 224.2 $ 200.3 13.53 % 13.21 % 13.08 % $ 255.0 $ 231.1 $ 199.2 13.28 % 13.61 % 13.01 % 14.19 % 14.57 % 13.96 % $ 6,044.9 $ 5,560.9 $ 5,314.4 $ 1,474.4 $ 1,349.4 $ 1,313.3 $ 4,570.5 $ 4,211.5 $ 4,001.1 $ 11.0 $ 13.1 $ 2.9 $ 365.6 $ 325.1 $ 296.5 6.05 % 5.85 % 5.58 % $ 359.1 $ 332.6 $ 297.7 5.94 % 5.98 % 5.60 % 7.86 % 7.90 % 7.44 % (1)Amounts and percentages have been rounded for presentation purposes and might differ from unrounded results.(2)Net sales, less excise taxes is a non-GAAP financial measure which we provide to separate the increase in sales due to actual sales growth and increases in excise taxes. Increases in cigarette-related taxes and/or fees,excise taxes, drive prices higher on the cigarette products we sell which result in higher net sales generally without increasing gross profit dollars. Increases in excise taxes result in a decline in overall gross profit percentage since net sales increase and gross profit dollars remain the same.(3)(5)Remaining gross profit is a non-GAAP financial measure which we provide to segregate the effects of LIFO expense, cigarette inventory holding profitsgains and other major non-recurring items, such as FET associated with the SCHIP legislation and OTP tax refunds,items, that significantly affect the comparability of gross profit.(4)Cigarettes(6) Food/non-food gross profit includes (i) cigarette inventory holding profitsgains related to manufacturer price increases, and(ii) increases in state, local and provincial excise taxes, (iii) federal excise floor taxes, (iv) LIFO effects and (ii) LIFO expense. Cigarette holding profits for the years 2008, 2007 and 2006 were $3.1 million, $7.3 million and $4.1 million, respectively.(5)Food/Non-Food gross profit includes (i) increases(v) OTP tax items. Included in excise taxes and (ii) LIFO expense. In addition, included in Food/Non-Foodfood/non-food gross profit for 20082011 is the Stateapproximately $5.9 million of Texas OTP net tax refund of $1.4 million,candy inventory holding gains and for 2007 the State of Washingtonan OTP tax refundsettlement of $13.3$0.8 million. Included in food/non-food gross profit for 2010 and 2009 is an OTP tax gain of $0.6 million bothresulting from a state tax method change and OTP tax refunds of $0.6 million, respectively, all of which were recorded as a reduction to costour costs of goods sold.sold in the applicable year. Also included in food/non-food gross profit for the year ended December 31, 2009 is $0.9 million of federal excise floor taxes related to SCHIP.InflationHistorically, we have not experienced a significant adverse impact as a result of price increases from our suppliers as we have been able to adjust our selling prices in order to maintain our overall gross profit dollars. However, significant increases in cigarette product costs and cigarette excise taxes adversely impact our gross profit as a percentage of net sales because we are paid on a per carton basis. While we have historically been able to maintain or slightly increase gross profit dollars related to such increases, gross profit percentages typically decline as a result of the impact of significant price or tax increases on net cigarette sales. Inversely, we have generally benefitted from price increases on the net sales of food/non-food categories because we generally mark up product costs using a percentage of cost of goods sold.Inflation can also result in increases in LIFO expense, adversely impacting our gross profit percentage (See Note 2—Summary of Significant Accounting Policies).Our fuel costs represent a significant portion of our operating expenses. Fuel consumption costs for 2008 totaled approximately $9.4 million, net of fuel surcharges passed on to customers, which represented an increase of approximately $2.4 million, or 34.3%, from $7.0 million in 2007 due primarily to increased fuel prices and to a lesser extent to miles driven, and the addition of our Toronto and New England divisions. For 2007, our fuel consumption costs were $7.0 million, net of fuel surcharges passed on to customers, which represented an increase of approximately $0.5 million, or 7.7%, from $6.5 million in 2006 due to increased fuel prices, miles driven and the addition of our Pennsylvania division.(7) Excluding FCGC and the new Couche-Tard business, food/non-food remaining gross profit margins increased 22 basis points in 2011 compared to 2010. We expect that FCGC margins will improve over time as we introduce more of our marketing programs to the FCGC customer base. The decrease in remaining gross profit margin in 2010 compared to 2009 was attributable primarily to contract renewals, competitive pricing pressures and a net reduction of $5.3 million related to income earned primarily from manufacturers' price increases. 20082011 were $15.7$15.2 million compared to $21.3$16.1 million as of December 31, 2007.2010. Our restricted cash as of December 31, 20082011 was $11.4$12.6 million compared to $12.8 million as compared to $11.5 million for 2007.of December 31, 2010. Restricted cash primarily represents funds that have been set aside in trust as required by one of the Canadian provincial taxing authorities to secure amounts payable for cigarette and tobacco excise taxes.and debt service requirements of our credit facilities.Credit Facility, income taxes and dividend payments. We have historically funded our liquidity requirements through our currentcash flows from operations and external borrowings. OurFor the year ended December 31, 2011, our cash flowflows from operating activities provided $55.6$11.3 million in 2008 and at the end of 2008 we had $186.0$106.2 million of borrowing capacity available in our revolving credit facility.Duringfacility as of December 31, current downturncommencement of a quarterly dividend program. The Board declared a quarterly cash dividend of $0.17 per common share, which resulted in global financial markets some companies have experienced difficulties drawinga total amount of approximately $1.9 million paid on linesDecember 15, 2011 to shareholders of credit, issuing debt and raising capital generally,record as of the close of business on November 15, 2011. On February 3, 2012, the Board declared the second quarterly cash dividend of $0.17 per common share, which have had a material adverse impactis payable on their liquidity. March 15, 2012 to shareholders of record as of the close of business on February 24, 2012.revolving credit facilityCredit Facility and thenotwithstanding these adverse market conditions, will be sufficient to meet all of our anticipated operating needs during the next twelve months.2008$11.0$63.6 million to $55.6$11.3 million for 2008the year ended December 31, 2011 compared with $66.6to net cash provided of $74.9 million for 2007. Thethe same period in 2010. This decrease was due primarily to an increase of $71.1 million in net cash flowsused to fund working capital. Inventory levels and prepaid inventory at December 31, 2011, net of related accounts payable, used $37.5 million more in cash in 2011 compared to 2010 due primarily to investments at year-end to capitalize on promotional opportunities, support new business, maximize LIFO tax strategy, and fund increases in inventory to support holiday timing. In addition, tobacco taxes payable used $24.6 million more cash in 2011 compared to 2010, as 2010 benefited from the establishment of credit terms related to both the FDI acquisition, and one additional taxing jurisdiction, and tax increases in several states. A $7.5 million increase in net income adjusted for non-cash items offset partially the increase in net cash used to fund working capital.operationsoperating activities increased by $41.8 million to $74.9 million for the year ended December 31, 2010 compared to $33.1 million for the same period in 2009. The increase in cash provided by operating activities was due primarily to a $7.0$68.6 million increase in cash provided by working capital.activity such as depreciation, amortization, LIFO expense, and foreign currency transaction losses, coupled with a $4.0 million decrease in working capital due primarily to the addition of our Toronto and New England divisions and higher cigarette inventories to capitalize on buying opportunities.Year ended December 31, 2007Net cash provided by operating activities increased by $29.1 million to $66.6 million for 2007 compared with $37.5 million for 2006. The increase in net cash flow provided by operations wasitems due primarily to a $16.1$19.1 million increasereduction in cigarette inventory holding gains included in prior year net income adjusted for non-cash activity such as depreciation, amortization and LIFO expenserelated to the SCHIP legislation and a $13.0$5.3 million net increasereduction in cash provided by working capital. The increaseincome earned primarily from working capital was largely driven by cigarette and tobacco taxes payable which generated $20.0 million in cash through the re-establishment of credit terms in several states with the largest impact coming from the State of California.2008$25.8$24.6 million to $49.1$75.1 million for 2008 from $23.3the year ended December 31, 2011 compared to $50.5 million for the same period in 2007.2010. This increase was due primarily to the acquisition of AMD.FCGC in 2011 for which we paid $50.8 million net of acquired cash, compared with the acquisition of FDI in the same period in 2010 for which we paid $35.9 million net of acquired cash. Capital expenditures increased by $10.2 million to $24.1 million in 2011 compared with $13.9 million for 2010. The increase in capital expenditures is due primarily to the opening of our Florida distribution center and IT and other equipment for FCGC. The remainder of our capital expenditures during 2011 consisted of additions to our trucking fleet, freezer and cooler expansion and other warehouse equipment.$28.0$35.9 million, net of cash received, for the acquired assets, which consisted primarily of purchased accounts receivable, inventory and fixed assets, offset by approximately $1.6 million of cash received in the acquisition.assets. Capital expenditures were $19.9decreased by $7.2 million to $13.9 million in 20082010 compared with $20.8$21.1 million for 2007.2009. Capital expenditures for 2008 relatedduring 2010 consisted primarily of additions to the completion of our new Toronto distribution facility and expenditures for refrigerated deliverytrucking fleet and warehouse equipment.We estimate that fiscal 2009 capital expenditures will not exceed $27.0 million.Year ended December 31, 2007Net cash used in investing activities decreased by $43.3 million to $23.3 million for 2007 from $66.6 million in 2006. Cash flows in investing activities in 2006 included $55.5 million related to the Klein acquisition.Capital expenditures increased by $8.0 million to $20.8 million in 2007 due primarily to our investment in the Toronto facility which approximated $6.4 million and to expenditures in refrigerated delivery and warehouse equipment.2008used inprovided from financing activities decreasedincreased by $28.5$88.2 million to $11.0$62.9 million for 2011 compared to a net cash use of $25.3 million for the same period in 2008 compared with $39.5 million in 2007. The decrease2010. This increase was due primarily to higher repaymentsan increase in net borrowings under our Credit Facility of $81.2 million to fund the acquisition of FCGC and our working capital requirements primarily resulting from the timing of year-end inventory purchases. An increase in book overdrafts of $30.0 million which was caused by the level of cash on our revolving linehand in relation to the timing of credit madevendor payments also contributed to the increase in 2007 as compared to 2008,net cash provided, partially offset by approximately $11.0$19.0 million of cash paymentsused to repurchase our common stock and a decrease in book overdrafts.2007$58.2$16.1 million to $39.5$25.3 million offor 2010 compared with $9.2 million for 2009. The increase in net cash used for 2007 compared with $18.7 million of net cash provided byin financing activities for the same period in 2006. The change was due primarily to a $14.5 million decrease in book overdrafts and an increase of $8.5 million in net repayments under our revolving credit facility, partially offset slightly by ana $6.1 million increase in proceeds received from the exercise of stock options and warrants. The decrease in book overdrafts.overdrafts was due primarily to the level of cash on hand and timing of vendor payments compared to the same period in 2009. Year Ended December 31, 2011 2010 2009 Net income $ 26.2 $ 17.7 $ 47.3 2.0 2.2 1.4 Provision for income taxes 17.0 9.5 18.5 Depreciation and amortization 22.4 19.7 18.7 LIFO expense 18.3 16.6 6.7 Stock-based compensation expense 5.5 4.8 5.1 Foreign currency transaction losses (gains), net 0.5 (0.5 ) (2.2 ) Adjusted EBITDA $ 91.9 $ 70.0 $ 95.5 In October 2005, we entered into $250 million five-year revolving credit facility (“Credit Facility”). with a capacity of $200 million, which also provides for up to an additional $100 million of lenders' revolving commitments, subject to certain provisions. On May 5, 2011, we entered into a fourth amendment to our Credit Facility (the "Fourth Amendment"), which extended our Credit Facility, from February 2014 to May 2016, and reduced the unused facility fees and the margin on LIBOR or CDOR borrowings. The margin added to LIBOR or CDOR is a range of 175 to 225 basis points, down from a range of 275 to 350 basis points. The Fourth Amendment ties the LIBOR or CDOR margin to the amount of available credit under the revolving Credit Facility, instead of the achievement of certain operating results as defined in the original agreement. At the date of signing the Fourth Amendment, we incurred fees of approximately $0.7 million, which are being amortized over the term of the amendment.a first priority interest and liens upon substantially all of our present and future assets. The terms of the Credit Facility permit prepayment without penalty at any time (subject to customary breakage costs with respect to LIBORLIBOR- or CDOR-based loans prepaid prior to the end of an interest period).On March 12, 2008, we entered into a Second Amendment to our Credit Facility (the “Second Amendment”). This Amendment established our basket for permitted acquisitions made after the date of the Second Amendment at $100 million and increased our basket for permitted stock repurchases to $30 million.Net available borrowings, amounts borrowed and outstanding letters of credit under the Credit Facility were as follows (in millions): December 31,
2008 December 31,
2007 $ 186.0 $ 160.0 $ 30.0 $ 29.7 $ 24.4 $ 28.5 We areAs of December 31, 2011, we were in compliance with all of the covenants under the facility. December 31, 2011 December 31, 2010 Amounts borrowed $ 62.0 $ — Outstanding letters of credit $ 23.7 $ 26.2 Amounts available to borrow $ 106.2 $ 161.4 weighted averageweighted-average interest rate was calculated based on our daily cost of borrowing, which was computed on a blend of prime and LIBOR rates. The weighted averageweighted-average interest rate on our revolving credit facility for the years ended December 31, 2011 and 2010was 3.8% for 20082.2% and 6.7% for 2007.2.9%, respectively. We paid total unused facility fees and letter of credit participation fees, which are included in interest expense, of $1.3 million for 2011 compared to $1.8 million for 2010. Amortization of debt issuance costs of $0.5 million for 2011 and 2010 are included in both 2008interest expense. Unamortized debt issuance costs were $1.9 million as of December 31, 2011 and 2007.2008:2011 (dollars in millions): Total Less than 1 Year 1 - 3 Years 3 - 5 Years More than 5 Years $ 62.0 $ — $ — $ 62.0 $ — 1.2 1.2 — — — Letters of credit 23.7 23.7 — — — Operating leases 192.4 32.5 49.5 36.2 74.2 1.3 0.2 0.3 0.2 0.6 $ 280.6 $ 57.6 $ 49.8 $ 98.4 $ 74.8 (in millions) Total 2009 2010 2011 2012 2013 2014 and
Thereafter $ 30.0 $ — $ 30.0 $ — $ — $ — $ — 0.6 0.6 — — — — — 24.4 24.4 — — — — — 180.0 27.4 25.7 23.0 18.9 13.9 71.1 0.8 — — 0.1 0.1 0.1 0.5 $ 235.8 $ 52.4 $ 55.7 $ 23.1 $ 19.0 $ 14.0 $ 71.6 (1) Revolving Credit Facility which had a weighted-average interest rate of 3.8% as of2.2% for the year ended December 31, 2008.2011.(2) Our purchase obligations at December 31, 2011 were primarily related to delivery equipment. Purchase orders for the purchase of inventory and other services are not included in the table above because purchase orders represent authorizations to purchase rather than binding agreements. For the purposes of this table, contractual obligations for purchase of goods or services are defined as agreements that are enforceable and legally binding and that specify all significant terms, including: fixed or minimum quantities to be purchased; fixed, minimum or variable price provisions, and the approximate timing of the transaction. Our purchase orders are based on our current inventory needs and are fulfilled by our suppliers within short time periods. We also enter into contracts for outsourced services; however, the obligations under these contracts are not significant and the contracts generally contain clauses allowing for cancellation without significant penalty. As of December 31, 2008, $0.5 million represents information technology related purchase commitments, and $0.1 million represents estimated transportation equipment purchase commitments.(3) Represents refrigeration equipmentand other office and warehouse equipment. Current maturities of capital leases are included in an operating lease.accrued liabilities, and non-current maturities are included in long-term debt.(4) Claims Liabilitiesclaims liabilities of $31.3$27.8 million, net of current portion, which includes health and welfare, workers’workers' compensation and general and auto liabilities because it does not have a definite payout by year. They are included in a separate line in the Consolidated Balance Sheet and discussed in Note 2 -- Summary of Significant Accounting Policiesto our Consolidated Financial Statements in Item 8.consolidated financial statements.(5) 1312 -- Employee Benefit Plans to our Consolidated Financial Statements included in Item 8,consolidated financial statements, we have a $12.8$9.3 million long-term obligation arising from an underfunded pension plan. Future minimum pension funding requirements are not included in the schedule above as they are not available for all periods presented. The increase in the funding requirements between years has been driven by the underperformance of the pension plan assets primarily due to lower returns on invested plan assets as a result of the decline in the overall global economy during 2008.(6) computed under FIN 48 of $6.1$1.8 million because a reasonable and reliable estimate of the timing of future tax payments or settlements, if any, cannot be determined(Seesee Note 10—9 -- Income Taxes)Taxes to our consolidated financial statements).2008,2011, our standby letters of credit issued under our Credit Facility were $24.4$23.7 million related primarily to casualty insurance and tax obligations. The majority of the standby letters of credit expiremature in 2009.one year. However, in the ordinary course of our business, we will continue to renew or modify the terms of the letters of the credit to support business requirements. The liabilities underlying the letters of credit are reflected on our consolidated balance sheets.2021 (excluding2023, excluding renewal options).options. These leases generally require us to maintain, insure and pay any related taxes. In most instances, we expect the leases that expire will be renewed or replaced in the normal course of our business.$5.9$3.2 million based on current estimates. The amount of capital expenditures would vary depending on the timing of any exercise of such putsput right and does not include an estimate of the cost to purchase inventory because such purchases would simply replace other planned inventory purchases and would not represent an incremental cost.Management’sUnited States of America (GAAP).U.S. The preparation of our consolidated financial statements requires estimates and assumptions that affect the reported amounts of assets and liabilities as of the date of the financial statements and the reported amounts of net sales and expenses during the reporting period. The critical accounting polices used in the preparation of the consolidated financial statements are those that are important both to the presentation of financial condition and results of operations and require significant judgments with regards to estimates. We base our estimates on historical experience and on various assumptions we believe are reasonable under the circumstances, the results of which form the basis for making judgments about the carrying value of assets and liabilities that are not readily apparent from other sources. We believe the current assumptions and other considerations used to estimate amounts reflected in our financial statements are appropriate; however, actual results could differ from these estimates.customers’customers' inability to make required payments. We evaluate the collectability of accounts receivable and determine the appropriate allowance for doubtful accounts based on historical experience and a review of specific customer accounts. In determining the adequacy of allowances for customer receivables, we analyze factors such as the value of any collateral, customer financial statements, historical collection experience, aging of receivables, general economic conditions and other factors. It is possible that the accuracy of the estimation process could be materially affected by different judgments as to the collectability based on information considered and further deterioration of accounts. If circumstances change (i.e., further evidence of material adverse creditworthiness, additional accounts become credit risks, store closures or deterioration in general economic conditions), our estimates of the recoverability of amounts due us could be reduced by a material amount, including to zero.2008, 20072011, 2010 and 20062009 amounted to 6.0%4.2%, 6.9%,4.5% and 2.7%5.3%, respectively, of netgross trade accounts receivable. The increase from 2006 to 2007 was due primarily to two of our customers who filed for bankruptcy under Chapter 11 during the fourth quarter of 2007.$1.6$2.0 million for 2008, $6.92011, $1.4 million for 2007,2010 and $0.4$1.8 million for 2006. Bad debt expense for 2007 included a charge of $5.9 million related to two customers who declared bankruptcy in the fourth quarter of 2007.2009. As a percentage of net sales, our bad debt expense was 0.0%less than 0.1% for 2011, 0.1%2010 and 0.0% for 2008, 2007 and 2006, respectively.Inventories2009Our United States inventories are valued at the lower of cost or market. Cost of goods sold is determined on a last-in, first-out (LIFO) basis using producer price indices (PPIs) as published by the United States Department of Labor. PPIs are updated by the Department of Labor on a lag basis for manufacturer price increases or decreases implemented after the initial PPI has been published for a given month. When we are aware of material price increases or decreases from manufacturers we will estimate the PPI for the respective period in order to more accurately reflect inflation rates. The (PPIs) are applied to inventory which is grouped by merchandise having similar characteristics. Under the LIFO method, current costs of goods sold are matched against current sales. During periods of rising prices, the LIFO method of costing inventories generally results in higher costs being charged against income (LIFO expense), while lower costs are retained in inventories. To the extent inventories or prices decline significantly at the end of any period where there have been increasing prices in prior periods, under LIFO some older and potentially lower priced inventory is considered as having been sold, resulting in a lower cost of goods sold compared to current prices, and increased current gross profit (LIFO income).Vendors’ Discounts,Vendor Rebates and Allowances—Promotional Allowances -- Periodic payments from vendors in various forms including rebates, promotional allowances and volume or other purchase discounts are reflected in the carrying value of the related inventory when earned and as cost of goods sold as the related merchandise is sold. Up-front consideration received from vendors linked to purchase or other commitments is initially deferred and amortized ratably to cost of goods sold or as the performance of the activities specified by the vendor to earn the fee is completed. Cooperative advertisingmarketing incentives from suppliers are recorded as reductions to cost of goods sold to the extent the vendor considerations exceedsexceed the costs relating to the programs. These amounts are recorded in the period the related promotional or merchandising programs were provided. Some of theCertain vendor incentive promotions require that we make assumptions and judgments regarding, for example, the likelihood of achieving market share levels or attaining specified levels of purchases. Vendor incentives are at the discretion of our vendors and can fluctuate due to changes in vendor strategies and market requirements.Customers’Customers' Sales Incentives—Incentives -- We also provide sales rebates or discounts to our customers on a regular basis. The customers’customers' sales incentives are recorded as a reduction to net sales revenue as the “sales incentive” is earned by the customer. Additionally, we may provide racking and slotting allowances for the customers’customers' commitments to continue using us as the supplier of their products. These allowances may be paid at the inception of the contract or on a periodic basis. Allowances paid at the inception of the contract are capitalizedIncome TaxesIncome taxes are accounted for under the liability method in accordance with Statement of Financial Accounting Standards(SFAS) No. 109,Accounting for Income Taxes. Deferred tax assets and liabilities are recognized for the estimated future tax consequences attributable to differences between the financial statement carrying amounts of existing assets and liabilities and their respective tax basis and operating loss and tax credit carry-forwards. Deferred tax assets and liabilities are measured using enacted tax rates in effect for the year in which those temporary differences are expected to be recovered or settled. The effect on deferred tax assets and liabilities of a change in tax rates is recognized in income in the period that includes the enactment date. Deferred tax assets are reduced by a valuation allowance when management does not consider it more likely than not that some portion or all of the deferred tax assets will be realized. In assessing the need for a valuation allowance, our management evaluates all significant available positive and negative evidence, including historical operating results, estimates of future taxable income and the existence of prudent and feasible tax planning strategies. As of December 31, 2008, we had a valuation allowance of $0.1 million with respect to 100% of the deferred tax asset related to foreign tax credits. We believe that it is more likely than not we will be unable to utilize the foreign tax credits, which expire in years 2014 to 2016, due primarily to the relatively lower taxable income generated in Canada compared with the United States. Changes in the expectations regarding the realization of deferred tax assets could materially impact income tax expense in future periods.We adopted the provisions ofFinancial Interpretation No. 48 (FIN 48),Accounting for Uncertainty in Income Taxes, on January 1, 2007, which clarifies the accounting for uncertain tax positions. FIN 48 prescribes a process for the recognition and measurement of a tax position taken or expected to be taken in a tax return and requires us to make estimates of the likelihood that certain tax positions will be realized upon ultimate settlement. In evaluating the exposures connected with our various tax filing positions, we establish an accrual when, despite our belief that our tax return positions are supportable, we believe that certain positions may be successfully challenged and a loss is probable. To the extent that our view as to the outcome of these matters change, we will adjust income tax expense in the period in which such determination is made. We classify interest and penalties related to income taxes as income tax expense.workers’workers' compensation, general and auto liability and health and welfare programs that are principally self-insured. Our workers’workers' compensation, general and auto liability insuranceworkers’workers' compensation, general and auto insurance liabilities are estimated based on applying an actuarially derived loss development factor to our incurred losses, including losses for claims incurred but not yet reported. Actuarial projections of losses concerning workers’workers' compensation, general and auto insurance liabilities are subject to a high degree of variability. Among the causes of this variability are unpredictable external factors affecting future inflation rates, health care costs, litigation trends, legal interpretations, legislative reforms, benefit level changes and claim settlement patterns. Our reserve for health and welfare claims includes an estimate of claims incurred but not yet reported which is derived primarily from historical experience.off-set.offset. The following is a summary of our net reserves as of December 31, 20082011 and December 31, 2007:2010 (dollars in millions): 2011 2010 Current Long-Term Total Current Long-Term Total Gross claims liabilities: Workers' compensation liability $ 5.2 $ 26.5 $ 31.7 $ 5.5 $ 29.4 $ 34.9 Auto & general liability 1.1 1.0 2.1 0.9 0.9 1.8 Health & welfare liability 1.6 0.3 1.9 2.3 0.3 2.6 Total gross claims liabilities $ 7.9 $ 27.8 $ 35.7 $ 8.7 $ 30.6 $ 39.3 Insurance recoverables $ (2.2 ) $ (17.8 ) $ (20.0 ) $ (2.5 ) $ (19.5 ) $ (22.0 ) Reserves (net): Workers' compensation liability $ 3.3 $ 9.2 $ 12.5 $ 3.3 $ 10.3 $ 13.6 Auto & general liability 0.8 0.5 1.3 0.6 0.5 1.1 Health & welfare liability 1.6 0.3 1.9 2.3 0.3 2.6 Reserves (net): $ 5.7 $ 10.0 $ 15.7 $ 6.2 $ 11.1 $ 17.3 2008 2007 Current Long-
Term Total Current Long-
Term Total $ 5.7 $ 29.2 $ 34.9 $ 5.5 $ 29.8 $ 35.3 1.3 1.8 3.1 0.8 1.1 1.9 2.3 0.3 2.6 2.3 0.3 2.6 9.3 31.3 40.6 8.6 31.2 39.8 (2.9 ) (19.8 ) (22.7 ) (3.4 ) (20.7 ) (24.1 ) $ 3.2 $ 10.3 $ 13.5 $ 2.4 $ 9.7 $ 12.1 0.9 0.9 1.8 0.5 0.5 1.0 2.3 0.3 2.6 2.3 0.3 2.6 $ 6.4 $ 11.5 $ 17.9 $ 5.2 $ 10.5 $ 15.7 increasedecrease in these reserves for 20082011 is due primarily to a general increase in workers’better workers' compensation costs combined with an increase in severityclaims experience and settlement of certainseveral large dollar claims. The increase in our auto and general liability was due to an increase in our fleet size and severity of certain claims.workers’workers' compensation liability, general and auto insurance liability and health and welfare liability as of December 31, 20081986.1986 and certain employees of Fleming, our former parent company. As discussed in Note 12 -- Employee Benefit Plans to our consolidated financial statements, our qualified defined-benefit pension plan was underfunded by $9.3 million and $8.5 million at December 31, 2011 and 2010, respectively. There have been no new entrants to the pension or non-pension post-retirement benefit plans after those benefit plans were frozen on September 30, 1989. Pursuant to the plan of reorganization (May 2004) described in Exhibit 2.1 and incorporated by reference (see Part IV, Item 15, Exhibit Index of this Form 10-K), we were assigned the obligations for three former Fleming defined-benefit pension plans. All of theplans, and these plans were merged into our defined benefit pension and post-retirement benefit plans are collectively referred to as the “Pension Plans.”1312 to the consolidated financial statements and include, among other things, the weighted averageweighted-average discount rate, the expected weighted averagepostretirementpost-retirement obligations and the future expense.weighted averageweighted-average discount rates for each benefit plan as the rate at which the benefits could be effectively settled as of the measurement date. In selecting an appropriate weighted averageweighted-average discount rate we use a yield curve methodology, matching the expected benefits at each duration to the available high quality yields at that duration and calculating an equivalent yield, which is the ultimate discount rate used. The weighted averageweighted-average discount rate used to determine 2008 pension expense was 6.35%.5.04% and 5.73% in 2011 and 2010, respectively. A lower weighted averageweighted-average discount rate increases the present value of benefit obligations and increases pension expense. Expected return on pension plan assets is based on historical experience of our portfolio and the review of projected returns by asset class on broad, publicly traded equity and fixed-income indices, as well as target asset allocation. Our target asset allocation mix is designed to meet our long-term pension and post-retirement benefit plan requirements. For 2008 ourOur assumed weighted averageweighted-average rate of return was 7.5% on our assets.20082011 is as follows (dollars in millions): benefitobligationdecrease(increase) Benefit Obligation Decrease (Increase) decrease (increase) +/- .25 pt $0.0 /(0.0)/ (0.0) $0.1 / (0.1) rate—rate -- Pension+/- .25 pt $0.8 / (0.9) /0.8 $0.0 / (0.0) rate—rate -- Post-retirement+/- .25 pt $ (0.3) /0.10.1 / (0.1) $0.0 / (0.0) Stock-Based Compensationexpense stock-based compensation usingtest goodwill for impairment at the fair value method as permitted bySFAS No. 123R,Share-Based Payment.Determining the appropriate fair value model and calculatingend of each year, or whenever events or circumstances indicate that it is more likely than not that the fair value of a reporting unit is below its carrying amount. The tests to evaluate for impairment are performed at the operating division level and is a two-step process. In the first step, we compare the fair value of the operating division to its carrying value. If the fair value of the division is less than its carrying value, we perform a second step to determine the implied fair value of goodwill associated with the division. If the carrying value of goodwill exceeds the implied fair value of goodwill, such excess represents the amount of goodwill impairment for which an impairment loss would be recorded.grantfair values, net of estimated forfeitures, using the straight-line amortization method for awards with vesting based on service and ratably for awards based on performance conditions. The fair value for restricted stock units (RSUs) and performance shares is determined based upon the fair value of our stock price on the date of grant. Determining the fair value of stock options requires considerable judgment, including estimating stock price volatility, expected life of share awards and forfeiture rates. We develop our estimates based on historical data and market information which can change significantly over time. Currently we use the Black-Scholes option valuation model to value stock option awards.We recognize compensation expense using the straight-line amortization method for stock-based compensation awards with vesting based on service and ratably for awards based on performance conditions. If we were to use alternative valuation methodologies, the amount we expense for stock-based payments could be significantly differentdifferent. We have not issued a significant number of stock option grants since 2009 (Seesee Note 12—11 -- Stock-Based Compensation Plans)to our consolidated financial statements).Impact on our ConsolidatedStatementsAccounting Standards Board ("FASB") issued Fair Value MeasurementsASU No. 2011-05,September 2006,both choices, an entity is required to present each component of other comprehensive income along with a total for other comprehensive income, and a total amount for comprehensive income. The amendments in this update do not change the FASB issuedSFAS No. 157,Fair Value Measurements. SFAS No. 157 defines fair value as the price that would be received to sell an asset or paid to transfer a liability in an orderly transaction between market participants at the measurement date. The standard also establishes a framework for measuring fair value and provides for expanded disclosures about fair value measurements. In February 2008, the FASB issuedFASB Staff Position (“FSP”) No. FAS 157-1,Application of FASB Statement No. 157 to FASB Statement No. 13 and Other Accounting Pronouncements That Address Fair Value Measurements for Purposes of Lease Classification or Measurement under Statement 13 andFSP No. FAS 157-2,Effective Date of FASB Statement No. 157. FSP 157-1 amends SFAS No. 157 to remove certain leasing transactions from itsscope. FSP 157-2 delays the effective date of SFAS No. 157 to fiscal years beginning after November 15, 2008 for all non-financial assets and non-financial liabilities, except for items that are recognizedmust be reported in other comprehensive income or disclosed at fair value in the financial statements on a recurring basis (at least annually). SFAS No. 157when an item of other comprehensive income must be reclassified to net income. This pronouncement is effective for our fiscal yearthe Company beginning January 1, 2009. We do not expect the adoption of SFAS No. 157 to have a material impact on our consolidated financial statements.Fair Value Option for Financial Assets2012 and Financial LiabilitiesFebruary 2007,December 2011, the FASB issuedSFAS ASU 2011-12, which defers the requirements of presenting reclassification of items out of accumulated other comprehensive income by component as required by ASU 2011-05 and is effective beginning January 1, 2012. As ASU 2011-05 relates only to the presentation of comprehensive income, this amendment will only change the manner in which the Company presents comprehensive income.159,The Fair Value Option2011-08, Testing Goodwill for Financial Assets and Financial Liabilities, which provides companiesImpairment. ASU 2011-08 permits an optionentity to report selected financial assets and liabilities at fair value. SFAS 159 requires companiesfirst perform a qualitative assessment to provide information to assist financial statement users to understand the effect of a company’s choice to use fair value on its earnings, as well as to display on the face of the balance sheetdetermine whether it is more likely than not that the fair value of assets and liabilities chosen bya reporting unit is less than its carrying value. If it is concluded that this is the company for fair value accounting. SFAS 159case, it is necessary to perform the currently prescribed two-step goodwill impairment test. Otherwise, the two-step goodwill impairment test is not required. This pronouncement is effective for our fiscal yearthe Company beginning January 1, 2008. SFAS 159 had no material impact on our consolidated financial statements for 2008.2012.Accounting for Business Combinations and Non-Controlling InterestsIn December 2007, the FASB issuedSFAS No. 141R,Business Combinations, andSFAS 160, Noncontrolling Interests in Consolidated Financial Statements—An Amendment of ARB No. 51. SFAS 141R and SFAS 160 require most identifiable assets, liabilities, non-controlling interests, and goodwill acquired in a business combination to be recorded at “full fair value” and require non-controlling interests (previously referred to as minority interests) to be reported as a component of equity, which changes the accounting for transactions with non-controlling interest holders. Both Statements are effective for periods beginning on or after December 15, 2008, and earlier adoption is prohibited. SFAS 141R will be applied to business combinations occurring after the effective date. SFAS 160 will be applied prospectively to all non-controlling interests, including any that arose before the effective date. We do not expect the adoption of SFAS 141R and SFAS 160 to have a material impact on our consolidated financial statements.Disclosures about Derivative Instruments and Hedging ActivitiesIn March 2008, the FASB issuedSFAS No. 161,Disclosures about Derivative Instruments and Hedging Activities—an Amendment of SFAS No. 133(“SFAS 161”). SFAS 161 enhances required disclosures regarding derivatives and hedging activities, including enhanced disclosures regarding how: (a) an entity uses derivative instruments, (b) derivative instruments and related hedged items are accounted for under SFAS 133, and (c) derivative instruments and related hedged items affect an entity's financial position, financial performance, and cash flows. SFAS 161 is effective for fiscal years and interim periods beginning after November 15, 2008 and early adoption is permitted. We do not expect the adoption of SFAS 161 to have a material impact on the disclosures that accompany our consolidated financial statements.Employers’ Disclosures about Postretirement Benefit Plan AssetsIn December 2008, the FASB issuedFSP SFAS No. 132(R)-1,Employer’s Disclosures about Postretirement Benefit Plan Assets, which amends Statement 132(R). FSP FAS 132(R)-1 enhances required disclosures about employers’ plan assets, including employers’ investment strategies, major categories of plan assets, concentrations of risk within plan assets, and valuation techniques used to measure the fair value of plan assets. FSP FAS 132(R)-1 is effective for fiscal years ending after December 15, 2009 and early adoption is permitted. We do not expect the adoption of FSP FAS 132(R)-1 in 2009 to have a material impact on the disclosures that accompany our consolidated financial statements.Aggregate United States cigarette consumption has declined since 1980. Prior to 2007 our cigarette sales had benefitted from a shift in sales toconvenience retail segment, and as a result of this shift, convenience retail cigarette sales had not declined in proportion to the decline in overall consumption. However,industry, our cigarette carton sales have declined in 2007 and 2008.on average over the last four years on a comparable basis. We believe this trend is driven principally by an increasingoverall cigarette consumption will continue to decline in overall consumption due to factors such as increasingly more legislative controls which regulate where the consumer may or may not smoke, the accelerationincreases in the frequencyprices of cigarettes, restrictions on marketing and amountpromotions by cigarette manufacturers, increases in cigarette regulation and excise taxes, health concerns, increased pressure from anti-tobacco groups and other factors. We expect consumption trends of excise tax increases which reduces demandlegal cigarettes will continue to be negatively impacted by the factors described above. In addition, we expect rising prices may lead to a higher percentage of consumers purchasing cigarettes from illicit markets. If we are unable to sell other products to make up for these declines in cigarette unit sales, our operating results may suffer. However, we expect to offset the majority of the impact from these declines through market share expansion, growth in our food/non-food categories and incremental gross profit that results from cigarette manufacturer price increases. The shift inWe expect cigarette manufacturers will raise prices as carton sales fromdecline in order to maintain or enhance their overall profitability, which should allow us to sustain our gross profit per carton.channelstobacco product regulation. In addition, the FDA has been empowered to regulate changes to nicotine yields and the chemicals and flavors used in tobacco products (including cigars and pipe products), require ingredient listings be displayed on tobacco products, prohibit the use of certain terms which may attract youth or mislead users as to the convenience retail segmentrisks involved with using tobacco products, as well as limit or otherwise impact the marketing of tobacco products by requiring additional labels or warnings as well as pre-approval of the FDA. To date, this legislation and its associated regulations have not had a material impact on our business, however we cannot be certain as to what effect, if any, these new regulations may no longerhave on the demand for tobacco products in the future. In the future, legislation and related regulations could adversely impact the market for tobacco products and, accordingly, our sales of such products.adequatefiled. It is unclear at this time how such restrictions and lawsuits may affect Core-Mark and its Canadian operations.compensate for consumption declines.United StatesU.S. and Canada. Significant increases in cigarette-related taxes and/or fees have been levied by the taxing authorities in the past and are likely to continue to be levied in the future.future, especially as these governmental jurisdictions come under additional pressure to increase government revenues. Federal excise taxes are levied on the cigarette manufacturer, whereas state, local and provincial excise taxes are levied on the wholesaler. These tax increases are expected to continue and may negatively impact consumption or may cause a shift in sales from premium brands to discount brands or illicit channels as smokers seek lower priced options. We increase cigarette prices as state, local and provincial excise tax increases are assessed on cigarette products whichthat we sell. As a result, generally, increases in excise taxes generally reduce gross profit percentages. However, we do not increase the overall gross profit dollars in the same proportion, which, will result in a decline in overall gross profit percentage. In February 2009, the State Children’s Health Insurance Program (SCHIP) was signed into law. The SCHIP will be funded by an increase in federal cigarette excise taxes from 39¢ to $1.01 per pack of cigarettes effective April 1, 2009. We believe this increaseexpect increases in excise taxes willto negatively impact our liquidity, contribute to a further decline in consumer cigarette consumption which will adversely impact our cigarette carton sales and could result in a decrease of our gross profit asper carton.percentage of sales.Profits may earn higher gross profits on cigarette inventory and excise tax stamp quantities on hand either at the time cigarette manufacturers increase their prices or when states, localities or provinces increase their excise taxes and allow us to recognize cigarette inventory holding profits.gains. These profitsgains are recorded as an offset to cost of goods sold as the inventory is sold. OverOur cigarette inventory holding gains prior to 2009 averaged approximately $5.1 million per year, or on average 1.6% of gross profit, from 2005 to 2008 and represent a normal historical trend. For the past several years we have earnedyear ended December 31, 2009 our cigarette inventory holding gains, net of FET associated with the SCHIP legislation, were $25.2 million, or 6.3%, of our gross profit, as compared to $3.1 million, or 0.9%, of our gross profit for the same period in 2008. The significant cigarette inventory holding profits. For example,gains in 2009 were attributable to an average increase of approximately 28% of our cigarette manufacturer list prices, one of the largest increases we have seen in recent history. We believe these price increases were in response to the passage of the SCHIP legislation, and we have not included them in our average trends since they distort an average that we believe is more indicative of future trends. Our cigarette inventory holding profits for 2008, 2007 and 2006gains were $3.1$8.2 million, or 0.9%1.9%, $7.3 million, or 2.2%, $4.1 million, or 1.4%, respectively, of our gross profit. It is difficult to predict whether cigarette inventory holding profits will occur in the future since they are dependent on the actionsprofit for 2011 and $6.1 million, or 1.6%, of cigarette manufacturers and taxing authorities.Food and Non-FoodFood/Non-food Product Trendsproduct salesproducts typically earn higher profit margins than cigarette sales and ourcigarettes. Our goal is to continue to increase food/non-food product sales in the future to offset the potential decline in cigarette revenuescarton sales and the associated gross profits.Uncertain Recent market turmoil and uncertainincluding increases in food and fuel prices, changes in the creditU.S. and housing markets leading to the current financialCanada, including high unemployment and credit crisis, and actual and potential job losses among many sectors of the economy, significant declines in the stock market resulting in largeunderemployment rates, depressed real estate values, losses to consumer retirement and investment accounts and uncertainty regarding future federal taxincreases in food and economic policiesother commodity prices, have resulted in reducedweakened consumer confidence and curtailed consumer spending in certain sectors. If these economic conditions persist or deteriorate further, we expect that many convenience retail spending. As a result,convenience store operators maywill experience a reductioncontinued instability and reductions in same store sales, in subsequent quarters, which willwould adversely affect demand for our products and may result incould lead to reduced sales unless offset by other factors (such as an increaseandnumber or size of our customers’ stores, penetration of product offerings into existing stores serviced, or increases in our market share). These economic and market conditions, combined with continuing difficulties in the creditfinancial markets and the resulting pressures on liquidity may also place a number of our convenience storeretail customers under financial stress, which wouldcould increase our credit risk and potential bad debt exposure. If theThese economic conditions in our key markets deteriorate or do not show improvement, we may experiencehave a material adverse impacts toeffect on our business, financial condition and operating results.IncreasesHistorically, we have generally benefited from manufacturer price increases, both as a result of inventory holding gains and our cost plus pricing structure. However, significant increases in Fuel PricesIncreasescigarette product costs and cigarette excise taxes adversely impact our gross profit as a percentage of sales, because for cigarettes we are paid on a cents per carton basis. As a result, cigarette gross profit percentages typically decline from marked increases in the priceunderlying product costs or excise tax increases, regardless of fuel affect our business both indirectly and directly. Indirectly, they contributethe fact that absolute gross profit dollars on a cents per carton basis may have increased. This is due to reduced consumer confidence and curtailed retail spending. Directly, they increase our transportation and delivery costs. Although to date we have succeeded in passing through a substantial portion of these increased coststhe disparity in the formabsolute dollars of fuel surcharges, we have not been ablethe underlying product costs and excise tax compared to do so in all cases, and there is no assurancethe cents per carton that we will be able make in gross profit. We generally benefit from food/non-food price increases, because for these categories, we mostly mark up product costs using a percentage of cost of good sold.continue to do so in the future. Where we have imposed a surcharge, our recoveries typically lag our increased costs by some period of time. Accordingly, we have been adversely affected by increased fuel prices and expect this effect to continue so long as prices increase.ITEM 7.A.QUANTITATIVE AND QUALITATIVE DISCLOSURES ABOUT MARKET RISKmajormost significant exposure to market risk comes from changes in short-term interest rates on our variable rate debt. At December 31, 2008, all amounts borrowed under our Credit Facility represented variable rate debt. Depending upon the borrowing option chosen, the interest charged is generally based upon LIBOR or the prime rate or LIBOR plus an applicable margin. If interest rates increased 2231.2 basis points (which approximates 10% of the weighted averageweighted-average interest rate on our average borrowings during the year end outstanding balance)ended December 31, 2011), our results fromof operations and cash flows would not be materially affected.Canada. ToCanadian dollars. We record gains and losses within our shareholders' equity due to the extent that funds are moved to or from Canada, we would be exposed to fluctuationstranslation of the Canadian branches' financial statements into U.S. dollars. A 10% unfavorable change in the weighted average Canadian/United States exchange rate. The Canadian/United StatesU.S. dollar exchange rate basedfor 2011 would have negatively impacted our net sales for 2011 by 1.5% and would not have materially impacted our operating income. Additionally, we incur foreign currency transaction gains and losses related to the level of activity between the U.S. and Canada. A 10% unfavorable change in the Canadian/U.S. dollar noon exchange rate on the noon rate used for balance sheet translation was $1.2246, $0.9881, and $1.1653 as of December 31, 2008, 2007, and 2006, respectively.2011 would have resulted in a $1.6 million increase in foreign currency transaction losses for 2011 which are included in our Consolidated Statements of Operations. We dodid not engage in hedging transactions.ITEM 8.FINANCIAL STATEMENTS AND SUPPLEMENTARY DATA Page 49 50 51 52 53 54 • 20082011 and 2007,2010, and the related consolidated statements of operations, stockholders’stockholders' equity and comprehensive income, and cash flows for each of the three years in the period ended December 31, 2008.2011. Our audits also included the financial statement schedule listed in the Index at Item 8 (a) 8(a)(2). TheseWe also have audited the Company's internal control over financial reporting as of December 31, 2011, based on criteria established in Internal Control-Integrated Framework issued by the Committee of Sponsoring Organizations of the Treadway Commission. As described in Management's Report on Internal Control over Financial Reporting, management excluded from its assessment the internal control over financial reporting at the Forrest City division, which was acquired on May 2, 2011 and whose financial statements constitute less than 7% of total assets, and less than 5% of income before income taxes of the consolidated financial statement amounts as of and for the year ended December 31, 2011. Accordingly, our audit did not include the internal control over financial reporting at the Forrest City division. The Company's management is responsible for these financial statements and financial statement schedule, are the responsibilityfor maintaining effective internal control over financial reporting, and for its assessment of the Company’s management.effectiveness of internal control over financial reporting, included in the accompanying Management's Report on Internal Control over Financial Reporting. Our responsibility is to express an opinion on the consolidatedthese financial statements and financial statement schedule and an opinion on the Company's internal control over financial reporting based on our audits.misstatement. An audit includesmisstatement and whether effective internal control over financial reporting was maintained in all material respects. Our audits of the financial statements included examining, on a test basis, evidence supporting the amounts and disclosures in the financial statements. An audit also includesstatements, assessing the accounting principles used and significant estimates made by management, as well asand evaluating the overall financial statement presentation. We believe that our audits provide a reasonable basis for our opinion.In our opinion, such financial statements present fairly, in all material respects, the financial position of Core-Mark Holding Company, Inc. and subsidiaries as of December 31, 2008 and 2007, and the results of their operations and their cash flows for each of the three years then ended, in conformity with accounting principles generally accepted in the United States of America. Also, in our opinion, such financial statement schedule, when considered in relation to the basic consolidated financial statements taken as a whole, presents fairly, in all material respects, the information set forth therein.As discussed in Note 13 to the consolidated financial statements, on December 31, 2006, the Company adopted Statement of Financial Accounting Standards No. 158, “Employers’ Accounting for Defined Benefit Pension and Other Postretirement Plans.” As discussed in Note 10 to the consolidated financial statements, on January 1, 2007, the Company adopted Financial Accounting Standards Board Interpretation No. 48, “Accounting for Uncertainty in Income Taxes.”We have also audited, in accordance with the standards of the Public Company Accounting Oversight Board (United States), the Company’s internal control over financial reporting as of December 31, 2008, based on the criteria established inInternal Control—Integrated Framework issued by the Committee of Sponsoring Organizations of the Treadway Commission and our report dated March 13, 2009 expressed an unqualified opinion on the Company’s internal control over financial reporting./s/ Deloitte & Touche LLPSan Francisco, CaliforniaMarch 13, 2009CORE-MARK HOLDING COMPANY, INC. AND SUBSIDIARIESCONSOLIDATED BALANCE SHEETS(In millions, except share data) December 31,
2008 December 31,
2007 Assets $ 15.7 $ 21.3 11.4 11.5 146.9 135.7 34.1 32.1 238.4 216.4 26.5 36.9 12.2 8.4 485.2 462.3 74.2 69.3 12.1 7.2 3.7 2.8 37.4 35.5 $ 612.6 $ 577.1 Liabilities and Stockholders’ Equity $ 66.0 $ 54.3 17.8 21.1 103.2 94.2 58.1 56.7 1.6 — 246.7 226.3 30.8 29.7 11.1 13.7 31.3 31.2 19.1 9.7 $ 339.0 $ 310.6 $ 0.1 $ 0.1 209.3 202.6 (11.0 ) — 82.3 64.4 (7.1 ) (0.6 ) 273.6 266.5 $ 612.6 $ 577.1 The accompanying notes are an integral part of these consolidated financial statements.CORE-MARK HOLDING COMPANY, INC. AND SUBSIDIARIESCONSOLIDATED STATEMENTS OF OPERATIONS(In millions, except per share data) Year Ended December 31, 2008 2007 2006 $ 6,044.9 $ 5,560.9 $ 5,314.4 5,685.8 5,228.3 5,016.7 359.1 332.6 297.7 197.6 174.1 151.1 129.4 119.0 106.6 2.0 1.8 1.5 329.0 294.9 259.2 30.1 37.7 38.5 2.2 2.4 5.3 (1.0 ) (1.4 ) (1.1 ) 6.3 (0.9 ) 0.3 22.6 37.6 34.0 4.7 13.5 13.4 $ 17.9 $ 24.1 $ 20.6 $ 1.71 $ 2.30 $ 2.05 $ 1.64 $ 2.15 $ 1.87 10.5 10.5 10.0 10.9 11.2 11.0 The accompanying notes are an integral part of these consolidated financial statements.CORE-MARK HOLDING COMPANY, INC. AND SUBSIDIARIESCONSOLIDATED STATEMENTS OF STOCKHOLDERS’ EQUITYAND COMPREHENSIVE INCOME(In millions) Common Stock Additional
Paid-In
Capital Treasury
Stock Retained
Earnings Accumulated
Other
Comprehensive
Income (Loss) Total
Stockholders’
Equity Total
Comprehensive
Income Shares Amount 9.8 $ 0.1 $ 166.1 $ — $ 19.6 $ (1.2 ) $ 184.6 — — — — — 20.6 — 20.6 20.6 — — 4.4 — — — 4.4 — — — 3.2 — — — 3.2 — — — — — — 1.3 1.3 1.3 — — — — — (0.4 ) (0.4 ) — — — 1.8 — — — 1.8 — 0.4 — — — — — — — — — — — — 0.2 0.2 0.2 $ 22.1 10.2 0.1 175.5 — 40.2 (0.1 ) 215.7 — — — — 24.1 — 24.1 $ 24.1 — — 5.3 — — — 5.3 — — — 2.2 — — — 2.2 — — — 18.5 — 0.1 — 18.6 — — — — — — (1.0 ) (1.0 ) (1.0 ) — — 1.1 — — — 1.1 — 0.2 — — — — — — — — — — — — 0.5 0.5 0.5 $ 23.6 10.4 0.1 202.6 — 64.4 (0.6 ) 266.5 — — — — 17.9 — 17.9 $ 17.9 — — 3.9 — — — 3.9 — — — 2.5 — — — 2.5 — — — — — — (5.9 ) (5.9 ) (5.9 ) — — 0.3 — — — 0.3 — 0.7 — — — — — — — (0.4 ) — — (11.0 ) — — (11.0 ) — — — — — — (0.6 ) (0.6 ) (0.6 ) $ 11.4 10.7 $ 0.1 $ 209.3 $ (11.0 ) $ 82.3 $ (7.1 ) $ 273.6 The accompanying notes are an integral part of these consolidated financial statements.CORE-MARK HOLDING COMPANY, INC. AND SUBSIDIARIESCONSOLIDATED STATEMENTS OF CASH FLOWS(In millions) Year Ended December 31, 2008 2007 2006 $ 17.9 $ 24.1 $ 20.6 11.0 14.5 3.7 0.5 0.4 0.4 3.9 5.3 4.4 1.6 6.9 (1.2 ) 17.4 14.9 13.2 6.3 (0.9 ) 0.3 (4.9 ) (4.5 ) 3.2 (2.9 ) 9.2 (1.5 ) (4.2 ) 6.0 (4.9 ) (31.9 ) (7.1 ) (3.3 ) 4.4 (8.5 ) 5.7 13.8 2.3 4.9 16.2 22.7 2.7 6.2 (15.3 ) (11.8 ) 0.3 (3.4 ) 1.1 55.6 66.6 37.5 (2.2 ) (0.6 ) 1.5 (26.4 ) — (55.5 ) (19.9 ) (20.8 ) (12.8 ) (0.7 ) (2.0 ) — 0.1 0.1 0.2 (49.1 ) (23.3 ) (66.6 ) 0.1 (48.4 ) 18.4 (11.0 ) — — 2.5 2.2 3.2 0.6 1.1 1.8 (3.2 ) 5.6 (4.7 ) (11.0 ) (39.5 ) 18.7 (1.1 ) (2.4 ) 0.3 (5.6 ) 1.4 (10.1 ) 21.3 19.9 30.0 $ 15.7 $ 21.3 $ 19.9 $ 7.5 $ 28.1 $ 8.2 $ 1.7 $ 2.5 $ 5.5 The accompanying notes are an integral part of these consolidated financial statements.CORE-MARK HOLDING COMPANY, INC. AND SUBSIDIARIESNOTES TO CONSOLIDATED FINANCIAL STATEMENTS1.Summary of Company InformationNature of OperationsCore-Mark Holding Company, Inc. (Core-Mark), a Delaware corporation, and subsidiaries (referred herein as “we,” “us” “our,” “Core-Mark” or the “Company”), is one of the leading wholesale distributors to the convenience retail industry in North America in terms of annual sales, and provides sales and marketing, distribution and logistics services to customer locations across the United States and Canada, with revenues generated from the sale of cigarettes, tobacco products, candy, snacks, fast food, fresh products, groceries, dairy, non-alcoholic beverages, general merchandise and health and beauty care products. Our principal customers include traditional convenience stores, grocery stores, drug stores, liquor stores and other stores that carry convenience products. We operate a network of 26 distribution centers in the United States and Canada, distributing a diverse line of national and private label convenience store products to approximately 24,000 customer locations in all 50 states of the United States and 5 Canadian provinces. Our origin dates back to 1888, when Glaser Bros., a family-owned-and-operated candy and tobacco distribution business, was founded in San Francisco.2.Summary of Significant Accounting PoliciesBasis of Consolidation and PresentationThe consolidated financial statements include Core-Mark and its wholly-owned subsidiaries. All inter-company balances and transactions have been eliminated in the consolidated financial statements.Use of EstimatesThese financial statements have been prepared on the accrual basis of accounting in accordance with accounting principles generally accepted in the United States of America. This requires management to make certain estimates and assumptions that affect the reported amounts of assets and liabilities and the disclosure of contingent assets and liabilities at the date of the financial statements and the reported amounts of revenues and expenses during the reporting period. We consider the allowance for doubtful accounts, the allowance related to other receivables, inventory reserves, LIFO valuation, recoverability of goodwill and other long-lived assets, stock compensation expense, the realizability of deferred income taxes, uncertain tax positions, pension benefits and self-insurance reserves to be those estimates which involve a higher degree of judgment and complexity. Actual results could differ from those estimates.Revenue RecognitionWe recognize revenue at the point at which the product is delivered and title passes to the customer in accordance with the Securities and Exchange Commission (“SEC”) issuedStaff Accounting Bulleting No. 104 (SAB 104),“Revenue Recognition.”Revenues are reported net of customer incentives, discounts and returns, including an allowance for estimated returns. The allowance for sales returns is calculated based on our returns experience which has historically not been significant. We also earn management services fee revenue from operating third party distribution centers belonging to certain customers. The service fee revenue was approximately $3.0 million in 2008, $2.8 million in 2007 and $3.4 million in 2006. These revenues represented less than 1% of our total revenues for each of those years. The service fee revenue is recognized as earned on a monthly basis in accordance with the terms of the management service fee contracts, and is included in net sales on the accompanying consolidated statements of operations.CORE-MARK HOLDING COMPANY, INC. AND SUBSIDIARIESNOTES TO CONSOLIDATED FINANCIAL STATEMENTS—(Continued)Vendor and Sales IncentivesVendors’ Discounts, Rebates and Allowances—Periodic payments from vendors in various forms including volume or other purchase discounts are reflected in the carrying value of the related inventory when earned and as cost of goods sold as the related merchandise is sold. Up-front consideration received from vendors linked to purchase or other commitments is initially deferred and amortized ratably to cost of goods sold or as the performance of the activities specified by the vendor to earn the fee is completed. Cooperative advertising incentives from suppliers are recorded as reductions to cost of goods sold to the extent the vendor considerations exceeds the costs relating to the programs. These amounts are recorded in the period the related promotional or merchandising programs were provided. Some of the vendor incentive promotions require that we make assumptions and judgments regarding, for example, the likelihood of achieving market share levels or attaining specified levels of purchases. Vendor incentives are at the discretion of our vendors and can fluctuate due to changes in vendor strategies and market requirements.Customers’ Sales Incentives—We also provide sales rebates or discounts to our customers on a regular basis. These customers’ sales incentives are recorded as a reduction to sales revenue as the “sales incentive” is earned by the customer. Additionally, we may provide racking and slotting allowances for the customer’s commitment to continue using us as the supplier of their products. These allowances may be paid at the inception of the contract or on a periodic basis. Allowances paid at the inception of the contract are capitalized and amortized over the period of the distribution agreement as a reduction to sales.Excise TaxesExcise taxes on cigarettes and other tobacco products are a significant component of our net sales and our cost of sales. In 2008, 2007 and 2006 approximately 24%, 24% and 25%, respectively, of our net sales, and approximately 26% for each of those years of our cost of goods sold represented excise taxes.Foreign Currency TranslationThe operating assets and liabilities of our Canadian operations, whose functional currency is the Canadian dollar, are translated to US dollars at exchange rates in effect at period-end. Adjustments resulting from such translation are presented as foreign currency translation adjustments, net of applicable income taxes, and are included in other comprehensive income. The statements of operations, including income and expenses, of our Canadian operations are translated to US dollars at average exchange rates for the period for financial reporting purposes. We also recognize the gain or loss on foreign currency exchange transactions between our Canadian and U.S. operations, net of applicable income taxes, in the consolidated statements of operations.Cash, Cash Equivalents and Restricted CashCash and cash equivalents include cash, money market funds and all highly liquid investments with original maturities of three months or less. Restricted cash represents funds collected and set aside in trust as required by Canadian provincial taxing authorities. As of December 31, 2008, we had cash book overdrafts of $17.8 million as compared to $21.1 million as of December 31, 2007, reflecting issued checks that have not cleared through our banking system in the ordinary course of business for accounts payable. Our policy has been to fund these outstanding checks as they clear with cash held on deposit with other financial institutions or with borrowings under our line of credit.CORE-MARK HOLDING COMPANY, INC. AND SUBSIDIARIESNOTES TO CONSOLIDATED FINANCIAL STATEMENTS—(Continued)Financial InstrumentsThe carrying amount for our cash, cash equivalents, restricted cash, trade accounts receivable, other receivables, trade accounts payable, cigarette and tobacco taxes payable and other accrued liabilities approximates fair value because of the short maturity of these financial instruments. The carrying amount of our variable rate debt approximates fair value.Risks and ConcentrationsFinancial instruments, which potentially subject us to concentrations of credit risk, consist principally of temporary cash investments, accounts receivable and other receivables. We place our cash and cash equivalents in investment-grade, short-term instruments with high quality financial institutions and, by policy, limit the amount of credit exposure in any one financial instrument. We pursue amounts and incentives due from vendors, and in the normal course of business, and are often allowed to deduct these amounts and incentives from payments made to our vendors.A credit review is completed for new customers and ongoing credit evaluations of each customer’s financial condition are performed and prepayment or other guarantees are required whenever deemed necessary. Credit limits given to customers are based on a risk assessment of their ability to pay and other factors. We do not have individual customers that account for more than 10% of our total sales or for more than 10% of total accounts receivable. However, some of our distribution centers are dependent on relationships with a single customer or a few large customers.We have two significant suppliers: Philip Morris USA, Inc. and R.J. Reynolds Tobacco Company. Product purchases from Philip Morris USA, Inc., were approximately 27% for 2008, and 25% for both 2007 and 2006. Product purchases from R.J. Reynolds Tobacco Company were approximately 14% for 2008 and 2007, and 15% for 2006.Cigarette sales represented approximately 68.2%, 69.5%, and 71.2% of our revenues and contributed approximately 29.0%, 30.5%, and 33.1% of our gross profit in 2008, 2007 and 2006, respectively. United States cigarette consumption has declined since 1980. If cigarette consumption continues to decline and we do not make up for lost cigarette carton sales through cigarette price increases or by increasing our food/non-food sales, our results of operations would be materially and adversely affected.Accounts Receivable and Allowance for Doubtful AccountsAccounts receivable consists of trade receivables from customers. We evaluate the collectibility of accounts receivable and determine the appropriate allowance for doubtful accounts based on historical experience and a review of specific customer accounts. Account balances are charged off against the allowance when collection efforts have been exhausted and the receivable is deemed worthless.(See Note 5—Other Balance Sheet Accounts Detail, Allowance for Doubtful Accounts, Accounts Receivable).Other ReceivablesOther receivables consist primarily of amounts due from vendors for promotional and other incentives, which are accrued as earned. We evaluate the collectibility of amounts due from vendors and determine the appropriate allowance for doubtful accounts due from vendors based on historical experience and on a review of specific amounts outstanding. While we believe that such allowances are adequate, these estimates could change in the future depending upon our ability to collect these vendor receivables.CORE-MARK HOLDING COMPANY, INC. AND SUBSIDIARIESNOTES TO CONSOLIDATED FINANCIAL STATEMENTS—(Continued)InventoriesInventories consist of finished goods, including cigarettes and other tobacco products, food and other products, and related consumable products held for re-sale and are valued at the lower of cost or market. In the United States, cost is primarily determined on a last–in, first–out (LIFO) basis using producer price indices as determined by the Department of Labor, adjusted based on more current information if necessary. Under the LIFO method, current costs of goods sold are matched against current sales. Inventories in Canada are valued on a first–in, first–out (FIFO) basis as LIFO is not a permitted inventory valuation method in Canada. As of December 31, 2008, approximately 85% of our FIFO inventory was valued on a LIFO basis.During periods of rising prices, the LIFO method of costing inventories generally results in higher current costs being charged against income while lower costs are retained in inventories. Conversely, during periods of decreasing prices, the LIFO method of costing inventories generally results in lower current costs being charged against income and higher stated inventories. Liquidations of inventory may also result in the sale of low-cost inventory and a decrease of cost of goods sold. We reduce inventory value for spoiled, aged and unrecoverable inventory based on amounts on hand and historical experience. The impact of the LIFO layer decrements that occurred during 2008 was insignificant to cost of goods sold.Property and EquipmentProperty and equipment are recorded at cost, net of accumulated depreciation and amortization. Depreciation and amortization on new purchases are computed using the straight-line method over their estimated useful lives. Leasehold improvements are amortized using the straight-line method over the shorter of the estimated useful life of the property or the term of the lease including available renewal option terms if it is reasonably assured that those terms will be exercised. Upon retirement or sale, the cost and related accumulated depreciation are removed from the accounts and any related gain or loss is reflected in operations. Maintenance and repairs are charged to operations as incurred.We have determined the following useful lives for our fixed assets:Useful life inyearsDelivery equipment4 to 10Office furniture and equipment3 to 10Warehouse equipment3 to 15Leasehold improvements3 to 25Buildings25Impairment of Long-lived AssetsWe review our intangible and long-lived assets for potential impairment at least annually, based on projected undiscounted cash flows associated with these assets. Long-lived and intangible assets may also be included in impairment testing when events and circumstances exist that indicate the carrying amounts of those assets may not be recoverable. Measurement of impairment losses for long-lived assets that we expect to hold and use is based on the estimated fair value of those assets.We evaluate long-lived assets in accordance with the provisions ofSFAS No. 144,Accounting for the Impairment or Disposal of Long-Lived Assets.Long-lived assets consist primarily of land, buildings, furniture, fixtures and equipment, leasehold improvements and intangible assets. An impairment of long-lived assets existsCORE-MARK HOLDING COMPANY, INC. AND SUBSIDIARIESNOTES TO CONSOLIDATED FINANCIAL STATEMENTS—(Continued)when future undiscounted cash flows are less than an asset group’s carrying value over the estimated remaining useful life of the primary assets. Impairment is measured as the difference between carrying value and fair value. Fair value is based on appraised value or estimated sales value, similar assets in recent transactions or discounted cash flows. Assets to be disposed of are reported at the lower of carrying amount or fair value less the cost to sell such assets. During 2008 and 2007, we did not have impairment costs related to long-lived assets or assets identified for abandonment as a result of facility closures or facility relocation.Goodwill and Intangible AssetsWe review goodwill for impairment, in accordance withSFAS No. 142,Goodwill and Other Intangible Assets, on an annual basis or whenever significant events or changes occur in our business. The reviews are performed at the operating division level, which comprise our reporting units. The implied fair value of the reporting unit’s goodwill must be determined and compared to the carrying value of the goodwill. If the carrying value of a reporting unit’s goodwill exceeds its implied fair value, an impairment loss equal to the difference will be recorded. Based on the impairment tests performed as of November 30, 2008 and November 30, 2007, there was no impairment of goodwill in 2008 or 2007. There can be no assurance that future goodwill tests will not result in a charge to earnings. We do not amortize those intangible assets that have been determined to have indefinite useful lives. Information on other intangible assets is provided inNote 5—Other Balance Sheet Accounts Detail.Computer Software Developed or Obtained for Internal UseWe account for proprietary computer software systems, namely our Distribution Center Management System (DCMS), in accordance with theAmerican Institute of Certified Public Accountants (AICPA) Statement of Position No. 98-1,Accounting for the Costs of Computer Software Developed or Obtained for Internal Use.This statement specifies certain criteria under which costs associated with this software are either expensed or capitalized and amortized. During 2007 we completed the implementation of Hyperion Financial Management (HFM). The costs related to the implementation of HFM were either expensed or capitalized in accordance with this pronouncement. During 2008 and 2007 we capitalized approximately $0.7 million and $2.0 million, respectively, primarily for HFM and DCMS enhancements as well as other non-proprietary systems which are included in the consolidated balance sheets for the years then ended.Debt Issuance CostsIn accordance withAccounting Principles Board Opinion No. 21,Interest on Receivables and Payables,debt issuance costs have been deferred and are being amortized as interest expense over the five-year term of the related debt agreement using the effective interest method. Debt issuance costs are included in other non-current assets, net, on the accompanying consolidated balance sheets.Claims Liabilities and Insurance RecoverablesIn accordance withFASB Interpretation No. 39 (FIN 39),Offsetting of Amounts Related to Certain Contracts, claims liabilities and the related recoverables from insurance carriers for estimated claims in excess of deductible amounts and other insured events are presented in their gross amounts on the accompanying consolidated balance sheets because there is no right of off-set. The carrying values of claims liabilities and insurance recoverables are not discounted. Insurance recoverables are included in other receivables, net and other non-current assets, net. As of December 31, 2008, we had liabilities for workers’ compensation, auto and general liability related to both Core-Mark and Fleming (“former owner of Core-Mark” related to emergence from bankruptcy in 2004) self-insurance obligations of $31.3 million long-term and $9.3 million short-term.CORE-MARK HOLDING COMPANY, INC. AND SUBSIDIARIESNOTES TO CONSOLIDATED FINANCIAL STATEMENTS—(Continued)We maintain reserves related to health and welfare, workers’ compensation, auto and general liability programs that are principally self-insured. We have a per-claim ceiling of $500,000 for our workers’ compensation, general and auto liability self-insurance programs and a per-claim limit of $200,000 for our health and welfare program. We purchased insurance to cover the claims that exceed the ceiling up to policy limits. Self-insured reserves are for pending or future claims that fall outside the policy and reserves include an estimate of expected settlements on pending claims and a provision for claims incurred but not reported. Estimates for workers’ compensation, auto and general liability insurance are based on our assessment of potential liability using an annual actuarial analysis of available information with respect to pending claims, historical experience and current cost trends. Reserves for claims under these programs are included in accrued liabilities (current portion) and claims liabilities, net of current portion.Pension Costs and Other Post-retirement Benefit CostsIn accordance withSFAS No. 132R,Employers Accounting for Pensions and Other Postretirement Benefits, pension costs and other post-retirement benefit costs charged to operations are estimated on the basis of annual valuations by an independent actuary. Adjustments arising from plan amendments, changes in assumptions and experience gains and losses are amortized over the expected average remaining service life of the employee group. In addition, in September 2006, the FASB issuedSFAS No. 158, Employer’s Accounting for Defined Benefit Pension and Other Postretirement Plans.In accordance with SFAS No. 158, we recognized in the consolidated balance sheet an asset for a plan’s overfunded status or a liability for a plan’s underfunded status, measured the plan’s assets and its obligations to determine the plan’s funded status as of the end of the employer’s fiscal year, and recognized changes in the funded status of our defined benefit postretirement plan in the year in which the change occurred(See Note 13—Employee Benefit Plans).Income TaxesIncome taxes are accounted for under the liability method in accordance withSFAS No. 109,Accounting for Income Taxes.Deferred tax assets and liabilities are recognized for the estimated future tax consequences attributable to differences between the financial statement carrying amounts of existing assets and liabilities and their respective tax bases and operating loss and tax credit carry-forwards. The effect on deferred tax assets and liabilities of a change in tax rates is recognized in income in the period that includes the enactment date. Deferred tax assets are reduced by a valuation allowance when we do not consider it more likely than not that some portion or all of the deferred tax assets will be realized. As of December 31, 2008, we had a valuation allowance of $0.1 million related to foreign tax credits, which will expire in 2014 to 2016. In June 2006, the Financial Accounting Standards Board (“FASB”) issuedFinancial Interpretation No. 48 (FIN 48),Accounting for Uncertainty in Income Taxes,which clarifies the accounting for uncertainty in income taxes recognized in an enterprise’s financial statements in accordance withSFAS 109.We adopted the provisions of FIN 48 on January 1, 2007. FIN 48 provides guidance on measurement of unrecognized tax benefits and liabilities, de-recognition, classification, interest and penalties, accounting for interim periods, disclosure and transition(See Note 10—Income Taxes).Stock-Based CompensationWe expense stock-based compensation using the fair value method as required bySFAS No. 123 (R),Share-Based Payment(See Note 12—Stock-Based Compensation Plans). Determining the appropriate fair value model and calculating the fair value of stock-based awards at the grant date requires considerable judgment, including estimating stock price volatility, expected life of share awards, and forfeiture rates. We develop our estimates based on historical data and market information which can change significantly over time.CORE-MARK HOLDING COMPANY, INC. AND SUBSIDIARIESNOTES TO CONSOLIDATED FINANCIAL STATEMENTS—(Continued)Currently, we use the Black-Scholes option valuation model to value stock awards.We recognize compensation expense using the straight-line amortization method for stock-based compensation awards with vesting based on service and ratably for awards based on performance conditions.Total Comprehensive IncomeWe report comprehensive income in accordance withSFAS No. 130,Reporting Comprehensive Income. Total Comprehensive Income consists of two components: net income and other comprehensive income. Other comprehensive income refers to revenue, expenses, gains and losses that under generally accepted accounting principles are recorded directly as an element of stockholders’ equity, but are excluded from net income. Other comprehensive income is comprised of adjustments to minimum pension liability and currency translation adjustments relating to our foreign operations in Canada whose functional currency is not the U.S. dollar(See statements of stockholders’ equity and comprehensive income).Segment InformationWe report our segment information in accordance withSFAS No. 131,Disclosures about Segments of an Enterprise and Related Information, which establishes standards for reporting by public enterprises on information about product lines, geographical areas and major customers. The method of determining what information to report is based on the way we are organized for operational decisions and assessment of financial performance. From the perspective of our chief operating decision makers, we are engaged in the business of distributing packaged consumer products to convenience retail stores in the United States and Canada. Therefore, we have determined that we have two reportable segments based on geographical area-United States and Canada. We present our segment reporting information based on business operations and by major product category for each of the two geographic segments (See Note 16—Segment Information).Earnings Per ShareBasic earnings per share is calculated by dividing net income by the weighted average number of common shares outstanding during each period, excluding unvested restricted stock. Diluted earnings per share assumes the exercise of stock options and common stock warrants and the impact of restricted stock, when dilutive, using the treasury stock method(See Note 11—Earnings Per Share).Impact of New Accounting Pronouncements on our Consolidated Financial StatementsIn September 2006, the FASB issuedSFAS No. 157,Fair Value Measurements. SFAS No. 157 defines fair value as the price that would be received to sell an asset or paid to transfer a liability in an orderly transaction between market participants at the measurement date. The standard also establishes a framework for measuring fair value and provides for expanded disclosures about fair value measurements. In February 2008, the FASB issuedFASB Staff Position (“FSP”) No. FAS 157-1,Application of FASB Statement No. 157 to FASB Statement No. 13 and Other Accounting Pronouncements That Address Fair Value Measurements for Purposes of Lease Classification or Measurement under Statement 13 andFSP No. FAS 157-2,Effective Date of FASB Statement No. 157. FSP 157-1 amends SFAS No. 157 to remove certain leasing transactions from its scope. FSP 157-2 delays the effective date of SFAS No. 157 to fiscal years beginning after November 15, 2008 for all non-financial assets and non-financial liabilities, except for items that are recognized or disclosed at fair value in the financial statements on a recurring basis (at least annually). SFAS No. 157 is effective for our fiscal year beginning January 1, 2009. We do not expect the adoption of SFAS No. 157 to have a material impact on our consolidated financial statements.CORE-MARK HOLDING COMPANY, INC. AND SUBSIDIARIESNOTES TO CONSOLIDATED FINANCIAL STATEMENTS—(Continued)In February 2007, the FASB issuedSFAS No. 159,The Fair Value Option for Financial Assets and Financial Liabilities,which provides companies an option to report selected financial assets and liabilities at fair value. SFAS 159 requires companies to provide information to assist financial statement users to understand the effect of a company’s choice to use fair value on its earnings, as well as to display on the face of the balance sheet the fair value of assets and liabilities chosen by the company for fair value accounting. SFAS 159 was effective for our fiscal year beginning January 1, 2008. SFAS 159 had no material impact on our consolidated financial statements for 2008.In December 2007, the FASB issuedSFAS No. 141R,Business Combinations,andSFAS No. 160,Noncontrolling Interests in Consolidated Financial Statements—An Amendment of ARB No. 51. SFAS 141R and SFAS 160 require most identifiable assets, liabilities, non-controlling interests, and goodwill acquired in a business combination to be recorded at “full fair value” and require non-controlling interests (previously referred to as minority interests) to be reported as a component of equity, which changes the accounting for transactions with non-controlling interest holders. Both Statements are effective for periods beginning on or after December 15, 2008, and earlier adoption is prohibited. SFAS 141R will be applied to business combinations occurring after the effective date. SFAS 160 will be applied prospectively to all non-controlling interests, including any that arose before the effective date. We do not expect the adoption of SFAS 141R and SFAS 160 to have a material impact on our consolidated financial statements.In March 2008, the FASB issuedSFAS No. 161,Disclosures about Derivative Instruments and Hedging Activities—an Amendment of SFAS No. 133. SFAS 161 enhances required disclosures regarding derivatives and hedging activities, including enhanced disclosures regarding how: (a) an entity uses derivative instruments, (b) derivative instruments and related hedged items are accounted for under SFAS 133, and (c) derivative instruments and related hedged items affect an entity's financial position, financial performance, and cash flows. SFAS 161 is effective for fiscal years and interim periods beginning after November 15, 2008 and early adoption is permitted. We do not expect the adoption of SFAS 161 will have a material effect on the disclosures that accompany our consolidated financial statements.In December 2008, the FASB issuedFSP SFAS No. 132(R)-1,Employer’s Disclosures about Postretirement Benefit Plan Assets, which amends Statement 132(R). FSP FAS 132(R)-1 enhances required disclosures about employers’ plan assets, including employers’ investment strategies, major categories of plan assets, concentrations of risk within plan assets, and valuation techniques used to measure the fair value of plan assets. FSP FAS 132(R)-1 is effective for fiscal years ending after December 15, 2009 and early adoption is permitted. We do not expect the adoption of FSP FAS 132(R)-1 to have a material impact on the disclosures that accompany our consolidated financial statements.3.AcquisitionsOn June 23, 2008, we acquired substantially all of the assets of Auburn Merchandise Distributors, Inc., (“AMD”) located in Whitinsville, Massachusetts, a wholly-owned subsidiary of Warren Equities, Inc., for approximately $28.7 million, including transaction costs. The assets purchased include primarily accounts receivable, inventory, fixed assets and other intangibles, with no significant liabilities. Auburn operates out of a 130,000 sq. ft. facility and conducts business primarily in the Northeastern region of the United States. The purchase price exceeded the estimated fair value of net assets acquired by approximately $0.9 million, which has been recorded as goodwill. AMD will conduct operations as the “New England” division of Core-Mark. Results of operations of AMD have been included in Core-Mark’s consolidated statements of operations since the date of acquisition to December 31, 2008. We have determined that had the acquisition been completed as of the beginning of the period the impact would not have been material.CORE-MARK HOLDING COMPANY, INC. AND SUBSIDIARIESNOTES TO CONSOLIDATED FINANCIAL STATEMENTS—(Continued)On June 19, 2006, we completed the purchase of substantially all the assets and certain liabilities of Klein Candy Co. L.P. (the Pennsylvania division), a full service distributor of tobacco and grocery items to convenience stores and other retail store formats in nine Eastern and mid-Western states, for approximately $58.3 million. The purchase price was allocated primarily to working capital items, $9.7 million to property and equipment and $2.8 million to goodwill.We acquired Klein and AMD, to help build a national distribution capacity by expanding our presence into the Eastern United States.4.Victoria / Vancouver Facility ConsolidationWe consolidated business operations of our Victoria and Vancouver, British Columbia distribution centers in 2006 in order to reduce operating costs and improve service to customers. Total expenses related to the facility consolidation were $0.6 million in 2006. The facility closure costs were included in the consolidated statement of operations for 2006 under selling, general and administrative expenses.5.Other Balance Sheet Accounts DetailAllowance for Doubtful Accounts, Accounts ReceivableThe changes in the allowance for doubtful accounts due from customers consist of the following during the following periods (in millions): 2008 2007 $ 9.3 $ 4.0 1.6 6.9 (2.1 ) (1.6 ) $ 8.8 $ 9.3 During the fourth quarter of 2007, two of our customers filed for bankruptcy under Chapter 11. Based on management’s evaluation of the customers’ ability to make future payments, including the legal options available, we increased the allowance for doubtful accounts by $5.9 million in the last two quarters of 2007 to provide for the collection risks with respect to these two accounts receivable. The increase in the allowance for doubtful accounts was recognized in our selling, general and administrative expenses which is included in our operating expenses. We continually assess our collection risks and make appropriate adjustments, as deemed necessary, to the allowance for doubtful accounts to ensure that reserves for accounts receivable are adequate.Other Receivables, NetOther receivables, net consist of the following (in millions): December 31,
2008 December 31,
2007 $ 25.9 $ 27.5 2.9 3.4 5.3 1.2 $ 34.1 $ 32.1 The allowance for doubtful accounts due from vendors was $0.2 million as of December 31, 2008 and 2007.CORE-MARK HOLDING COMPANY, INC. AND SUBSIDIARIESNOTES TO CONSOLIDATED FINANCIAL STATEMENTS—(Continued)Deposits and PrepaymentsDeposits and prepayments consist of the following (in millions): December 31,
2008 December 31,
2007 $ 3.6 $ 3.6 22.9 33.3 $ 26.5 $ 36.9 Our deposits and prepayments include deposits related to workers’ compensation claims, prepayments relating to insurance policies, income taxes, product purchases, prepaid rent and rental deposits and up front consideration to customers.Other Non-Current Assets, NetOther non-current assets, net consist of the following (in millions): December 31,
2008 December 31,
2007 $ 4.7 $ 5.6 19.8 20.7 1.0 1.2 5.1 6.0 3.8 1.2 1.9 0.2 1.1 0.6 $ 37.4 $ 35.5 Intangible and Long-Lived Assets. Internally developed software with an average eight year life was $2.9 million at December 31, 2008 and $3.5 million at December 31, 2007, net of accumulated amortization. Other purchased software with an average life of one to five year amounted to $1.8 million at December 31, 2008 and $2.1 million at December 31, 2007, net of accumulated depreciation. The amortization of intangible assets, inclusive of non-compete agreements and customers’ list, recorded in the consolidated statement of operations was $2.0 million for 2008 and $1.8 million for 2007.Accrued LiabilitiesAccrued liabilities consist of the following (in millions): December 31,
2008 December 31,
2007 $ 17.5 $ 12.3 9.3 8.6 20.9 28.2 10.4 7.6 $ 58.1 $ 56.7 CORE-MARK HOLDING COMPANY, INC. AND SUBSIDIARIESNOTES TO CONSOLIDATED FINANCIAL STATEMENTS—(Continued)Our accrued payroll, retirement and other benefits include accruals for vacation, bonus, wages, 401(k) benefit matching and the current portion of pension and post-retirement benefit obligations. Our other accrued expenses include Canadian goods and services taxes, legal expenses, interest and other miscellaneous accruals.6.InventoriesInventories consist of the following (in millions): December 31,
2008 December 31,
2007 $ 274.7 $ 241.7 (36.3 ) (25.3 ) $ 238.4 $ 216.4 7.Property and EquipmentProperty and equipment consist of the following (in millions): December 31,
2008 December 31,
2007 $ 94.0 $ 73.7 1.0 — 9.1 14.7 12.5 12.1 116.6 100.5 (42.4 ) (31.2 ) $ 74.2 $ 69.3 For 2008, 2007 and 2006, depreciation and amortization expenses related to property and equipment were $12.8 million, $10.8 million and $9.5 million, respectively. Property and equipment includes accruals for construction in progress of $0.7 million in 2008, $3.3 million in 2007, and $1.4 million in 2006. During 2008, we reclassified approximately $6.5 million of leasehold improvements to delivery, warehouse and office equipment. This reclassification did not have any impact on our results of operations or financial position.8.Long-Term DebtTotal Long-term debt as presented in the consolidated balance sheets consists of the following (in millions): December 31,
2008 December 31,
2007 $ 30.0 $ 29.7 0.8 — $ 30.8 $ 29.7 In October 2005, we entered into a $250 million five-year revolving credit facility (“Credit Facility”). All obligations under the Credit Facility are secured by a first priority interest and liens upon substantially all of ourCORE-MARK HOLDING COMPANY, INC. AND SUBSIDIARIESNOTES TO CONSOLIDATED FINANCIAL STATEMENTS—(Continued)present and future assets. The terms of the Credit Facility permit prepayment without penalty at any time (subject to customary breakage costs with respect to LIBOR or CDOR-based loans prepaid prior to the end of an interest period).On March 12, 2008, we entered into a Second Amendment to our Credit Facility (the “Second Amendment”). This Amendment established our basket for permitted acquisitions made after the date of the Second Amendment at $100 million and increased our basket for permitted stock repurchases to $30 million.Net available borrowings, amounts borrowed and outstanding letters of credit under the Credit Facility were as follows (in millions): December 31,
2008 December 31,
2007 $ 186.0 $ 160.0 $ 30.0 $ 29.7 $ 24.4 $ 28.5 The Credit Facility contains restrictive covenants, including among others, limitations on dividends and other restricted payments, other indebtedness, liens, investments and acquisitions and certain asset sales. We are in compliance with all of the covenants under the facility.Our weighted average interest rate was calculated based on our daily cost of borrowing which was computed on a blend of prime and LIBOR rates. The weighted average interest rate on our revolving credit facility for the years ended December 31, 2008 and 2007 was 3.8% and 6.7%, respectively. We paid total unused facility fees of $0.5 million in both 2008 and 2007. Unamortized debt issuance costs were $1.0 million as of December 31, 2008 and $1.2 million at December 31, 2007.9.Commitments and ContingenciesPurchase CommitmentsPurchase agreements and commitments entered into in the ordinary course of business obligate us to make future purchases of transportation and information technology equipment. As of December 31, 2008, estimated transportation equipment purchase commitments were $0.1 million and estimated information technology purchase commitments were $0.5 million.Operating LeasesWe lease nearly all of our sales and warehouse facilities as well as tractors, trucks, vans, and certain equipment under operating lease agreements expiring at various dates through 2021, excluding renewal options. Rent expense is recorded in accordance withSFAS No. 13,Accounting for Leases, on a straight-line basis over the term of the lease including available renewal option terms if it is reasonably assured that the renewal options will be exercised. The operating leases generally require us to pay taxes, maintenance and insurance. In most instances, we expect the operating leases that expire will be renewed or replaced in the normal course of business.CORE-MARK HOLDING COMPANY, INC. AND SUBSIDIARIESNOTES TO CONSOLIDATED FINANCIAL STATEMENTS—(Continued)Future minimum rental payments under non-cancelable operating leases (with initial or remaining lease terms in excess of one year and excluding contracted vehicle maintenance costs) were as follows as of December 31, 2008: (in millions) $ 27.4 25.7 23.0 18.9 13.9 71.1 $ 180.0 For 2008, 2007 and 2006, rental expenses for operating and month-to-month leases, including contracted vehicle maintenance costs were $33.8 million, $29.1 million, and $23.9 million, respectively.Capital LeasesAs of December 31, 2008, we have approximately $0.8 million of refrigeration equipment leased under a capital lease.ContingenciesLitigationWe are subject to certain legal proceedings, claims, investigations and administrative proceedings in the ordinary course of our business. In accordance withSFAS No. 5,Accounting for Contingencies, we make a provision for a liability when it is both probable that the liability has been incurred and the amount of the liability can be reasonably estimated. These provisions, if any, are reviewed at least quarterly and adjusted to reflect the impacts of negotiations, settlements, rulings, advice of legal counsel, and other information and events pertaining to a particular case. At December 31, 2008, we were not involved in any material litigation.10.Income TaxesOur income tax provision consists of the following (in millions): Year ended December 31, 2008 2007 2006 $ 6.8 $ 13.5 $ 7.8 0.6 3.4 1.3 (0.1 ) 0.4 1.7 7.3 17.3 10.8 (1.6 ) (2.3 ) 2.2 (1.0 ) (0.4 ) 0.7 — (1.1 ) (0.3 ) (2.6 ) (3.8 ) 2.6 $ 4.7 $ 13.5 $ 13.4 CORE-MARK HOLDING COMPANY, INC. AND SUBSIDIARIESNOTES TO CONSOLIDATED FINANCIAL STATEMENTS—(Continued)A reconciliation of the statutory federal income tax rate to our effective income tax rate and income tax provision (in millions) follows: Year Ended December 31, 2008 2007 2006 $ 7.9 35.0 % $ 13.2 35.0 % $ 11.9 35.0 % 1.0 4.4 1.9 5.1 1.3 3.8 (2.5 ) (11.1 ) (0.8 ) (2.1 ) — — (0.1 ) (0.4 ) (0.8 ) (2.1 ) (0.3 ) (0.8 ) (1.6 ) (7.1 ) — — 0.4 1.1 — — — — 0.1 0.3 $ 4.7 20.8 % $ 13.5 35.9 % $ 13.4 39.4 % Deferred tax assets and liabilities are measured using enacted tax rates expected to apply to taxable income in the years in which those temporary differences are expected to be recovered or settled. The tax effects of significant temporary differences which comprise deferred tax assets and liabilities are as follows (in millions): December 31,
2008 December 31,
2007 $ 22.3 $ 14.7 3.4 2.8 2.5 1.6 1.1 0.9 1.7 1.4 0.8 1.5 2.0 3.5 33.8 26.4 (0.1 ) (1.7 ) $ 33.7 $ 24.7 $ 9.3 $ 5.2 1.5 1.9 1.7 2.0 $ 12.5 $ 9.1 $ 21.2 $ 15.6 10.7 8.4 $ 10.5 $ 7.2 At each balance sheet date, a valuation allowance was established against the deferred tax assets based on management’s assessment whether it is more likely than not that these deferred tax assets would not be realized. We had a valuation allowance of $0.1 million at December 31, 2008 and $1.7 million at December 31, 2007 related to foreign tax credits, which will expire in 2014 to 2016.In June 2006, the Financial Accounting Standards Board (FASB) issuedFinancial Interpretation No. 48 (FIN 48),Accounting for Uncertainty in Income Taxeswhich clarifies the accounting for uncertainty in income taxesCORE-MARK HOLDING COMPANY, INC. AND SUBSIDIARIESNOTES TO CONSOLIDATED FINANCIAL STATEMENTS—(Continued)recognized in an enterprise’s financial statements in accordance withSFAS No. 109,Accounting for Income Taxes.We adopted FIN 48 on January 1, 2007 which resulted in an increase in our stockholders’ equity of $18.6 million.At December 31, 2008, the total amount of unrecognized tax benefits which was included in other tax liabilities, related to federal, state and foreign taxes was approximately $6.1 million. A reconciliation of the beginning and ending amounts of unrecognized tax benefits for 2008 and 2007 follows (in millions): 2008 2007 $ 10.2 $ 10.5 (3.4 ) (0.9 ) (0.7 ) 0.6 $ 6.1 $ 10.2 The total amount of net unrecognized tax benefits that would impact the effective tax rate, if recognized, would be $5.3 million as of December 31, 2008. The unrecognized tax benefits of $6.1 million as of December 31, 2008 could be impacted further by the expiration of the statute of limitations for certain tax positions in future years. We estimate the impact could be up to $4.7 million through December 31, 2009.We file U.S., state and foreign income tax returns in jurisdictions with varying statutes of limitations. The 2005 to 2007 tax years remain subject to examination by federal and state tax authorities. The 2004 tax year is still open for certain state tax authorities. The 2000 to 2007 tax years remain subject to examination by the respective tax authority for the foreign jurisdictions. In 2007, the Canada Revenue Agency initiated an examination of our Canadian tax returns for 2003 and 2004. The examination has been completed and no adjustments have been proposed as of December 31, 2008.We recognize interest and penalties on income taxes in income tax expense. As of December 31, 2008, we recorded a liability of $3.1 million for estimated interest and penalties related to unrecognized tax benefits under FIN 48, consisting of $2.5 million for interest and $0.6 million of penalties.11.Earnings Per ShareThe following table sets forth the computation of basic and diluted net earnings per share (in millions, except per share amounts): Year Ended December 31, 2008 2007 2006
Per
Per
Per $ 17.9 10.5 $ 1.71 $ 24.1 10.5 $ 2.30 $ 20.6 10.0 $ 2.05 Effect of dilutive common share equivalents: Unvested restricted stock units — — — — 0.2 (0.03 ) Stock options 0.2 (0.03 ) 0.3 (0.06 ) 0.3 (0.06 ) Warrants 0.2 (0.04 ) 0.4 (0.09 ) 0.5 (0.09 ) Performance Shares — — — — — — Diluted EPS $ 17.9 10.9 $ 1.64 $ 24.1 11.2 $ 2.15 $ 20.6 11.0 $ 1.87 Note: Basic and diluted earnings per share are calculated based on unrounded actual amounts.CORE-MARK HOLDING COMPANY, INC. AND SUBSIDIARIESNOTES TO CONSOLIDATED FINANCIAL STATEMENTS—(Continued)Certain options to purchase common stock were outstanding but were not included in the computation of diluted earnings per share because the effect would be anti-dilutive. For 2008 and 2007 there were 249,453 and 121,475 anti-dilutive options, respectively. There were no anti-dilutive options in 2006.In May 2004, we issued an aggregate of 9,800,000 shares of our common stock and warrants to purchase an aggregate of 990,616 shares of our common stock to the Class 6(B) creditors of Fleming Inc. (our former parent company) pursuant to its plan of reorganization. We refer to the warrants we issued to the Class 6(B) creditors as the Class 6(B) warrants. We received no cash consideration for the issuance of common stock and the Class 6(B) warrants. The Class 6(B) warrants have an exercise price of $20.93 per share and may be exercised at the election of the holder at any time prior to August 23, 2011. The shares of common stock and the Class 6(B) warrants were issued pursuant to an exemption from registration under Section 1145(a) of the Bankruptcy Code. We also issued warrants to purchase an aggregate of 247,654 shares of our common stock to the holders of our Tranche B Notes, which we refer to as Tranche B warrants. The Tranche B warrants have an exercise price of $15.50 per share.The number of Class 6(B) warrants outstanding was 968,628 at the end of both 2008 and 2007, and 968,684 at the end of 2006. The number of Tranche B warrants outstanding was 126,716 at the end of 2008, 2007 and 2006. The Class 6(B) warrants and the Tranche B warrants have been classified as permanent equity under EITF 00-19, “Accounting for Derivative Financial Information Indexed to, and Potentially Settled in, a Company’s Own Stock.” We used the treasury stock method, as prescribed bySFAS No. 128,“Earnings Per Share,” to determine the shares of common stock due to conversion of outstanding warrants as of December 31, 2008.12.Stock-Based Compensation PlansWe account for stock-based compensation underSFAS No. 123(R),Share-Based Payment, an amendment ofSFAS No. 123,Accounting for Stock Based Compensation, using the modified prospective method. Under this method, compensation cost is recognized beginning with the effective date based on (a) the requirements of SFAS No. 123(R) for all share-based payment awards granted after the effective date, and (b) based on the requirements of SFAS No. 123 for awards granted to employees prior to the effective date that remain unvested on the effective date. Accordingly, prior period amounts are not restated. SFAS No. 123(R) requires all share-based payments to be recognized in the income statement based on their fair values.Total stock-based compensation cost recognized in the consolidated statements of operations for 2008, 2007 and 2006 was $3.9 million, $5.3 million and $4.4 million, respectively. Total unrecognized compensation cost related to non-vested share-based compensation arrangements was $4.8 million at December 31, 2008. This balance is expected to be recognized over a weighted average period of 1.8 years.Employee stock-based compensation expense recognized in 2008 was calculated based on awards ultimately expected to vest and has been reduced for estimated forfeitures. Our forfeiture experience since inception of our plans has been approximately 2.9% of the total grants. The historical rate of forfeiture is a component of the basis for predicting the future rate of forfeitures, which are also dependent on the remaining service period related to grants and on the limited number of approximately 79 plan participants. We issue new shares to satisfy stock option exercises.CORE-MARK HOLDING COMPANY, INC. AND SUBSIDIARIESNOTES TO CONSOLIDATED FINANCIAL STATEMENTS—(Continued)We maintain five stock-based compensation plans: the 2004 Long-Term Incentive Plan, the 2004 Directors’ Equity Incentive Plan, the 2005 Long-Term Incentive Plan, the 2005 Directors’ Equity Incentive Plan, and the 2007 Long-Term Incentive Plan. Number of securities to
be issued upon exercise of
outstanding options,
warrants, and
rights Number of securities
remaining available for
future issuance under
equity compensation
plans (excluding
securities reflected in
column 1) 635,269 2,543 38,472 134 30,000 — 15,000 — 373,635 680,162 (1)Includes non-qualified stock options, restricted stock units and performance shares.2004 Long-Term Incentive PlanThe 2004 Long-Term Incentive Plan (2004 LTIP) provides for issuance of up to 1,314,444 shares of non-qualified stock options and restricted stock units. For option grants, the exercise price equals the fair value of the Company’s common stock on the date of grant. For restricted stock grants, the exercise price is fixed at $0.01. Options and restricted stock units vest over a three-year period; one-third of the options and restricted stock units cliff-vest on the first anniversary of the vesting commencement date and the remaining options and restricted stock units vest in equal monthly and quarterly installments, respectively, over the two-year period following the first anniversary of the vesting commencement date. Stock options expire seven years after the date of grant. Restricted stock units do not have an expiration date. Restricted stock units are available for grant to officers and key employees. Stock-based compensation is being recognized ratably over the three-year vesting period of the stock options or restricted stock units using the straight-line method.2004 Directors’ Equity Incentive PlanThe 2004 Directors’ Equity Incentive Plan (2004 Directors’ Plan) consists of 30,000 non-qualified stock options that have been granted to non-employee Directors of the Company. This plan has terms and vesting requirements similar to those of the 2004 LTIP, except options vest quarterly after the first anniversary of the vesting commencement date. No stock options are available for future issuance.2005 Long-Term Incentive PlanThe 2005 Long-Term Incentive Plan (2005 LTIP) provides for the granting of restricted stock units to officers and key employees. The majority of restricted stock units issued under the 2005 LTIP generally vest over three years: one-third of the restricted stock units cliff vest on the first anniversary of the vesting commencement date and the remaining restricted stock units vest in equal quarterly installments over the two-year period following the first anniversary of the vesting commencement date. Restricted stock units do not have an expiration date. Based on a formula in the plan, the restricted stock units originally available for issuance were 171,315.2005 Directors’ Equity Incentive PlanThe 2005 Directors’ Equity Incentive Plan (2005 Directors’ Plan) consists of 15,000 non-qualified stock options that have been granted to non-employee Directors of the Company. The terms of the 2005 Directors’ Plan are similar to the 2004 Directors’ Plan. No stock options are available for future issuance.CORE-MARK HOLDING COMPANY, INC. AND SUBSIDIARIESNOTES TO CONSOLIDATED FINANCIAL STATEMENTS—(Continued)2007 Long-Term Incentive PlanThe 2007 Long-Term Incentive Plan (2007 LTIP) provides for the granting of awards of up to 1,202,350 shares of our common stock (including treasury shares) to officers, employees, and non-employee directors (40,000 shares are reserved for issuance to non-employee directors). The 2007 LTIP became effective on July 1, 2007. Awards may be made under the 2007 LTIP through June 30, 2017, which is 10 years from the effective date of the 2007 LTIP. We currently anticipate that substantially all of the shares available for grant under the 2007 LTIP will be granted prior to December 31, 2010 (within three and one-half years from the effective date of the 2007 LTIP).The available awards under the 2007 LTIP include: stock options, restricted stock units and performance shares. The annual award limits of the 2007 LTIP provide for options which are limited in any one plan year to 100,000 shares to any one participant, and performance shares which are also limited to 100,000 to any one participant in any one plan year. Restricted stock units, or RSUs, are awards that will be subject to certain restrictions and subject to a risk of forfeiture upon certain kinds of employment terminations. A RSU represents a right to receive a share of our common stock at the end of a specified period. Unless a grant agreement provides otherwise, a holder of a RSU has the right to receive accumulated dividends or distributions on the corresponding shares underlying the RSU on the date the RSU vests and thereafter until the underlying shares are issued. Performance shares may include (i) specific dollar-value target awards, (ii) performance units, the value of each unit being determined by the Compensation Committee at the time of issuance, and/or (iii) performance shares, the value of each such share being equal to the fair market value of a share of our common stock.If any grant of shares under the 2007 LTIP expires or is forfeited by the grantee (whether due to failure to satisfy vesting requirement or otherwise), then such forfeited shares will be withdrawn from the pool of shares available for grant under the 2007 LTIP.Assumptions Used for Fair ValueWe use the Black-Scholes multiple option-pricing model to determine the grant date fair value for each stock option. Option-pricing models require the input of assumptions that are estimated at the date of grant.The following table presents the assumptions used in the Black-Scholes option-pricing model to value the stock options granted during the period 2006 through 2008. Restricted stock units and performance shares were valued at the fair market value of our stock at date of grant. Year Ended December 31, 2008 2007 2006 4.0 4.0 4.0 2.55% 4.50%-5.00% 4.41%-5.13% 35% 30% 30% — — — $ 8.45 $ 11.39 $ — $ 25.80 $ 35.41 $ 34.85 $ 25.80 $ 36.95 $ — CORE-MARK HOLDING COMPANY, INC. AND SUBSIDIARIESNOTES TO CONSOLIDATED FINANCIAL STATEMENTS—(Continued)There is limited historical information available to support the estimate of certain assumptions required to value the stock options and restricted stock units as our shares began trading on the over-the-counter market in April 2005 and on the NASDAQ national market in December 2005. The expected volatility of our stock is based on a variety of factors including the volatility measures of other companies in relatively similar industries and the measures of companies which recently emerged from bankruptcy. The risk free rate for periods within the contractual life of the option is based on the United States Treasury yield curve in effect at the time of grant. The expected term of options granted represents the period of time we estimate that options granted are expected to be outstanding.The following table summarizes the activity for all stock options, restricted stock units, and performance shares under all of the plans for the year ended December 31, 2008: December 31, 2006 December 31, 2007 Activity during 2008 December 31, 2008 Outstanding Outstanding Granted Exercised Canceled/Reclass Outstanding Exercisable Plans Securities Number Price Number Price Number Price Number Price Number Price Number Price Number Price 2004
LTIP RSU 116,928 $ 0.01 74,627 $ 0.01 — $ — (32,649 ) $ 0.01 — $ — 41,978 $ 0.01 35,724 $ 0.01 2004
LTIP Options 840,372 15.50 753,546 16.99 3,869 25.81 (162,124 ) 15.50 (2,000 ) 36.03 593,291 17.39 567,366 16.61 2004
Plan Options 30,000 15.50 30,000 15.50 — — — — — — 30,000 15.50 30,000 15.50 2005
LTIP RSU 126,467 0.01 90,976 0.01 2,372 0.01 (54,825 ) 0.01 (51 ) 0.01 38,472 0.01 29,885 0.01 2005
Plan Options 15,000 27.03 15,000 27.03 — — — — — — 15,000 27.03 15.000 27.03 2007
LTIP RSU — — 59,871 0.01 125,585 0.01 (29,992 ) 0.01 (8,470 ) 0.01 146,994 0.01 5,238 0.01 Options — — 66,838 36.96 144,016 25.81 — — (11,709 ) 28.63 199,145 29.39 37,841 36.54 Perf. Shares — — 19,979 0.01 85,235 0.01 (20,938 ) 0.01 (56,776 ) 0.01 27,500 0.01 — 0.01 Note: Price is weighted average price per share.The aggregate intrinsic value of stock options exercised in 2008 was $2.1 million, $2.5 million in 2007, and $3.9 million in 2006. The aggregate intrinsic value of restricted stock units exercised in 2008 was $3.1 million, $3.2 million in 2007, and $4.1 million in 2006. The aggregate intrinsic value of performance shares exercised in 2008 was less than $0.1 million, and $0.5 million in 2007.CORE-MARK HOLDING COMPANY, INC. AND SUBSIDIARIESNOTES TO CONSOLIDATED FINANCIAL STATEMENTS—(Continued)The following tables summarize stock options, restricted stock units and performance shares that have vested and are expected to vest as of December 31, 2008: December 31, 2008 Outstanding Weighted Average
Remaining
Contractual Term
(years) Aggregate
Intrinsic
Value(1)
(in thousands) Plans Securities Vested Expected
to Vest(2) Vested Expected
to Vest(2) Vested 2004 LTIP RSU 35,724 6,076 — — $ 768 $ 131 2004 LTIP Options 567,366 25,186 2.8 5.3 3,231 — 2004 Directors’ Plan Options 30,000 — 2.6 — 181 — 2005 LTIP RSU 29,885 8,342 — — 643 179 2005 Directors’ Plan Options 15,000 — 3.6 — — — 2007 LTIP RSU 5,238 137,716 — — 113 2,962 Options 37,841 156,707 5.5 6.0 — — Perf. Shares — 25,313 — — — 544 (1)Aggregate intrinsic value is calculated based upon the difference between the exercise prices of options or restricted stock units and our closing common stock price on December 31, 2008 of $21.52, multiplied by the number of instruments that are vested or expected to vest. Options and restricted stock units having exercise prices greater than the closing stock price noted above are excluded from this calculation.(2)Options and restricted stock units that are expected to vest are net of estimated future forfeitures.The aggregate fair values of options vested in 2008, 2007 and 2006 were approximately $1.6 million, $6.7 million and $12.2 million, respectively. The aggregate fair value of restricted stock units vested in 2008, 2007 and 2006 was approximately $1.4 million, $2.7 million and $5.3 million, respectively. The aggregate fair value of performance shares vested in 2008 and 2007 was approximately $0.1 million and $0.6 million, respectively.13.Employee Benefit PlansPension PlansWe sponsored a qualified defined-benefit pension plan and a post-retirement benefit plan for employees hired before September 1986. There have been no new entrants to the pension or non-pension post-retirement benefit plans after those benefit plans were frozen on September 30, 1989. Pursuant to the plan of reorganization (May 2004) described in Exhibit 2.1 and incorporated by reference (see Part IV, Item 15, Exhibit Index of this Form 10-K), we were assigned the obligations for three former Fleming defined-benefit pension plans. All of these three pension benefit plans and post-retirement benefit plans are collectively referred to as the Pension Plans.Our defined-benefit pension plan is subject to the Employee Retirement Income Security Act of 1974 (ERISA). Under ERISA, the Pension Benefit Guaranty Corporation (PBGC) has the authority to terminate an underfunded pension plan under limited circumstances. In the event our pension plan is terminated for any reason while it is underfunded, we will incur a liability to the PBGC that may be equal to the entire amount of the underfunding. Our post-retirement benefit plan is not subject to ERISA. As a result, the post-retirement benefit plan is not required to be pre-funded, and, accordingly, has no plan assets.CORE-MARK HOLDING COMPANY, INC. AND SUBSIDIARIESNOTES TO CONSOLIDATED FINANCIAL STATEMENTS—(Continued)Pension costs and other post-retirement benefit costs charged to operations are estimated on the basis of annual valuations with the assistance of an independent actuary. Adjustments arising from plan amendments, changes in assumptions and experience gains and losses, are amortized over the average future life expectancy of inactive participants for the defined benefit plan, and expected average remaining service life of active participants for the post-retirement benefit plan.The following tables provide a reconciliation of the changes in the Pension Plans’ benefit obligations and fair value of assets over the two-year period ending December 31, 2008, and a statement of the funded status for the year ended December 31, 2008 and 2007 (in millions): Pension Benefits Other Post-retirement
Benefits December 31,
2008 December 31,
2007 December 31,
2008 December 31,
2007 $ 35.3 $ 36.2 $ 6.0 $ 5.2 2.2 2.1 0.4 0.4 0.1 (0.3 ) 0.5 0.7 (2.7 ) (2.7 ) (0.3 ) (0.3 ) $ 34.9 $ 35.3 $ 6.6 $ 6.0 $ 31.3 $ 31.9 $ — $ — (6.9 ) 0.8 — — 0.4 1.3 0.3 0.3 (2.7 ) (2.7 ) (0.3 ) (0.3 ) $ 22.1 $ 31.3 $ — $ — $ (12.8 ) $ (4.0 ) $ (6.6 ) $ (6.0 ) During 2008, the actual return on investments was below expectations, which was the primary reason for the increase in the underfunded status of the plan from 2007 to 2008. The expected return on pension plan assets for 2008 was a gain of $2.3 million compared with a realized loss of $6.9 million due to the economic recession and financial market turmoil which led to a significant decline in the market value of invested plan assets.The following table provides information for Pension Plans with an accumulated benefit obligation in excess of plan assets (in millions): December 31,
2008 December 31,
2007 $ 34.9 $ 35.3 34.9 35.3 22.1 31.3 CORE-MARK HOLDING COMPANY, INC. AND SUBSIDIARIESNOTES TO CONSOLIDATED FINANCIAL STATEMENTS—(Continued)The following table provides components of the net periodic pension cost (in millions): 2008 2007 2006 $ 2.2 $ 2.1 $ 2.0 (2.3 ) (2.3 ) (2.2 ) $ (0.1 ) $ (0.2 ) $ (0.2 ) The following table provides components of the net periodic other benefit cost (in millions): 2008 2007 2006 $ 0.4 $ 0.4 $ 0.3 0.1 0.2 0.1 $ 0.5 $ 0.6 $ 0.4 The prior-service costs, which includes interest, are amortized on a straight-line basis over the average future life expectancy of inactive participants. Gains and losses in excess of 10% of the greater of the benefit obligation and market-related value of assets are amortized over the average future life expectancy of inactive participants. Our measurement date was on December 31, 2008. We estimated that average future life expectancy is 18.0 years for the pension benefit plan and remaining service life of active participants is 7.6 years for post-retirement benefit plan.Assumptions Used:The following tables show weighted-average assumptions used in the measurement of: Pension Benefits Other Post-retirement Benefits December 31,
2008 December 31,
2007 December 31,
2008 December 31,
2007 6.26 % 6.35 % 6.07 % 6.43 % Pension Benefits Other Post-retirement Benefits December 31,
2008 December 31,
2007 December 31,
2008 December 31,
2007 6.35 % 5.80 % 6.43 % 5.80 % 7.50 % 7.50 % — — Assumed health care trend rates for the post-retirement benefit plans are as follows: December 31,
2008 December 31,
2007 8.00 % 9.00 % 5.00 % 5.00 % 2011 2011 The weighted average discount rates used to determine pension and post-retirement benefit plan obligations and expense are based on a yield curve methodology which matches the expected benefits at each duration to theCORE-MARK HOLDING COMPANY, INC. AND SUBSIDIARIESNOTES TO CONSOLIDATED FINANCIAL STATEMENTS—(Continued)available high quality yields at that duration and calculating an equivalent yield. At December 31, 2008, our discount rates were 6.26% and 6.07% related to our pension and post-retirement plan benefit obligations respectively compared with 6.35% and 6.43%, respectively, at December 31, 2007. The decrease in the discount rate for 2008 was due primarily to lower bond yields.Assumed health care cost trend rates have an effect on the amounts reported for the post-retirement health care plans. A 1% change in assumed health care cost trend rates would have the following effects (in millions): 1% Increase 1% Decrease $ 0.1 $ — $ 1.0 $ (0.8 ) We use a building block approach in determining the overall expected long-term return on assets. Under this approach, a weighted average expected rate of return is developed based on historical returns for each major asset class and the proportion of assets of the class held by the Pension Plans. We then review the results and may make adjustments in subsequent years to reflect expectations of future rates of return that may differ from those experienced in the past.Pension Plan weighted-average asset allocations by asset category are as follows: December 31,
2008 December 31,
2007 57 % 61 % 26 % 26 % 13 % 10 % 4 % 3 % 100 % 100 % Our investment guidelines allocation ranges are: 0-20% cash, 50-70% equity, and 30-50% fixed income. In addition to asset allocation, our investment guidelines set forth the requirement for diversification within asset class, types and classes for investment prohibited and permitted, specific indices to be used for benchmark in investment decisions, and criteria for individual security.We calculate the fair market value of plan assets. Debt and equity securities are recorded at their fair market value each year-end as determined by quoted closing market prices on national securities exchanges or other markets, as applicable. The insurance contracts are valued based on discounted cash flows of current yields of similar contracts with comparable duration.We contributed $0.4 million in 2008 and $1.3 million in 2007 to our defined benefit pension plan, and $0.3 million in both 2007 and 2008 to our post-retirement benefit plan. For 2009 we will have a carryover credit balance of approximately $0.9 million in our pension plan that we will have available to use against our 2009 expected contributions of approximately $0.7 million. If we elect to use it, then we will not need to make a cash contribution to the pension plan in 2009. We expect to contribute $0.3 million to our post-retirement benefits plan in 2009. The amount of estimated contributions for the pension plan is expected to increase in 2010 due to expected lower return on plan assets as a result of the recent economic downturn.CORE-MARK HOLDING COMPANY, INC. AND SUBSIDIARIESNOTES TO CONSOLIDATED FINANCIAL STATEMENTS—(Continued)Estimated future benefit payments reflecting future service are as follows (in millions): Pension Other
Post-retirement $ 2.9 $ 0.3 2.6 0.3 2.8 0.3 3.1 0.4 2.8 0.4 15.6 2.2 Amounts recognized in the consolidated statements of stockholders’ equity and comprehensive income (in millions): Pension
After Tax Other
Post-retirement
Benefits
After Tax $ 0.7 $ 0.3 $ 5.6 $ 0.2 Amounts recognized in the consolidated balance sheet (in millions): Pension Other
Post-retirement — (0.3 ) (4.0 ) (5.7 ) $ (4.0 ) $ (6.0 ) Pension Other
Post-retirement — (0.3 ) (12.8 ) (6.3 ) $ (12.8 ) $ (6.6 ) Expected amortizations for the year ending December 31, 2009 (in millions): Pension Other
Post-retirement $ 0.4 $ 0.2 Savings PlansWe maintain defined contribution plans in the United States, subject to Section 401(k) of the Internal Revenue Code, and in Canada, subject to the Department of National Revenue Taxation Income Tax Act. For the fiscal year ended December 31, 2008, eligible United States employees could elect to contribute on a tax-deferred basis from 1% to 75%, of their compensation to a maximum of $15,500. Eligible United States employees over 50 years of age could also contribute an additional $5,000 on a tax-deferred basis. In Canada, employees could elect to contribute up to a maximum of $20,000 Canadian dollars. Under the 401(k) plan, we match 100% of United States employeeCORE-MARK HOLDING COMPANY, INC. AND SUBSIDIARIESNOTES TO CONSOLIDATED FINANCIAL STATEMENTS—(Continued)contributions up to 2% of base salary, and match 25% of employee contributions from 2% to 6% of base salary. For Canadian employees, we match 50% of employee contributions up to 6% of base salary. For the year ended December 31, 2008, we made a matching payment of approximately $2.0 million in January 2009.14.Repurchase of Common StockOn March 12, 2008, our Board of Directors authorized a share repurchase program of up to $30 million designed to repurchase shares of our common stock in the open market or in privately negotiated transactions subject to market conditions. The number of shares to be purchased and the timing of the purchases will be based on market conditions, our cash and liquidity requirements, relevant securities laws and other factors. The share repurchase program may be discontinued or amended at any time. We plan to fund the majority of the share repurchases from available cash. Our Credit Facility was amended on March 12, 2008 to increase our basket for permitted stock repurchases to $30 million to allow us to execute the share repurchase program.We repurchased 396,716 shares of common stock under the share repurchase program as of December 31, 2008 at a total cost of $11.0 million.15.Quarterly Financial Data (Unaudited)The tables below provide our unaudited consolidated results of operations for each of the four quarters for the year ended December 31, 2008 and December 31, 2007 (in millions, except per share amounts): Three Months Ended
(unaudited)
(in millions, except per share data) December 31,
2008 September 30,
2008 June 30,
2008 March 31,
2008 $ 1,492.2 $ 1,672.7 $ 1,534.6 $ 1,345.4 1,028.5 1,144.9 1,032.4 919.0 463.7 527.8 502.2 426.4 1.5 0.2 1.3 0.1 92.9 (2) 93.9 91.1 81.2 46.4 54.3 51.0 (3) 45.9 (3) 33.9 (4) 30.5 30.9 (4) 34.1 (4) 12.1 8.6 8.7 0.7 0.6 0.7 0.4 0.5 (0.1 ) (0.2 ) (0.4 ) (0.3 ) 3.7 1.5 0.1 1.0 7.4 5.3 5.7 (0.5 ) $ 0.71 $ 0.51 $ 0.54 $ (0.05 ) $ 0.70 $ 0.49 $ 0.51 $ (0.05 ) 10.4 10.4 10.5 10.6 10.5 10.9 11.0 10.6 $ 4.5 $ 4.5 $ 4.0 $ 4.4 $ 1.1 $ 0.9 $ 0.9 $ 1.0 $ 370.6 $ 414.9 $ 364.0 $ 324.9 (1)Cigarette inventory holding profits relate to increases in manufacturer prices and excise taxes.(2)Includes a $1.4 million State of Texas OTP net tax refund which was recorded as a reduction to cost of goods sold during the fourth quarter of 2008.(3)Includes start up costs of $0.3 million for first quarter of 2008 and $0.1 million for the second quarter of 2008 related to the new Toronto division.CORE-MARK HOLDING COMPANY, INC. AND SUBSIDIARIESNOTES TO CONSOLIDATED FINANCIAL STATEMENTS—(Continued)(4)Includes start up costs of $0.4 million for first quarter of 2008, $0.1 million for the second quarter of 2008, and $0.1 million in the third and fourth quarters combined related to the new Toronto division.(5)Includes amortization of debt issuance costs, of approximately $0.1 million for each quarter in 2008.(6)Totals may not agree with full year amounts due to rounding and separate calculations for each quarter.(7)Warehousing and distribution expenses are not included as a component of the Company’s cost of goods sold which presentation may differ from that of other registrants.(8)Excise taxes are a component of Net Sales. Three Months Ended
(unaudited)
(in millions, except per share data) December 31,
2007 September 30,
2007 June 30,
2007 March 31,
2007 $ 1,373.3 $ 1,477.5 $ 1,434.0 $ 1,276.1 956.6 1,021.1 993.6 891.8 416.7 456.4 440.4 384.3 0.6 2.3 1.1 3.3 75.3 (2) 85.2 96.6 (5) 75.5 45.5 (3) 45.6 42.9 40.1 23.7 (4) 34.6 (4) 29.5 31.2 5.6 4.6 23.7 (5) 3.8 0.4 0.5 0.6 0.9 (0.7 ) (0.2 ) (0.3 ) (0.2 ) — (0.3 ) (0.7 ) 0.1 5.1 3.3 13.6 2.1 $ 0.49 $ 0.32 $ 1.31 $ 0.20 $ 0.46 $ 0.30 $ 1.20 $ 0.19 10.6 10.4 10.4 10.3 11.2 11.3 11.3 11.1 $ 4.1 $ 3.4 $ 3.9 $ 3.5 $ 1.2 $ 1.7 $ 1.2 $ 1.2 $ 338.9 $ 361.8 $ 345.5 $ 303.2 (1)Cigarette inventory holding profits relate to increases in manufacturer prices and excise taxes.(2)Reflects an increase in LIFO expense of $3.9 million resulting from higher annual producer price index estimates primarily for cigarettes, grocery, and confectionery products, and by $0.9 million in operational adjustments in the Calgary division related to excise taxes and rebates of which $0.5 million related to prior quarters in 2007.(3)Includes start up costs of $0.2 million related to the new Toronto division.(4)Includes bad debt charges of $5.2 million recorded in the third quarter of 2007 and $0.7 million in the fourth quarter of 2007 related to two customers who filed for bankruptcy in the fourth quarter of 2007. Also included in the fourth quarter of 2007 were start up costs of $0.5 million for the new Toronto division, offset by a $3.1 million reduction in workers’ compensation, general and auto insurance liabilities related to favorable claims experience for prior years.(5)Includes a $13.3 million State of Washington OTP tax refund which was recorded as a reduction to cost of goods sold during the second quarter of 2007.(6)Includes amortization of debt issuance costs, of approximately $0.1 million for each quarter in 2007.(7)Totals may not agree with full year amounts due to rounding and separate calculations for each quarter.(8)Warehousing and distribution expenses are not included as a component of the Company’s cost of goods sold which presentation may differ from that of other registrants.(9)Excise taxes are a component of Net Sales.CORE-MARK HOLDING COMPANY, INC. AND SUBSIDIARIESNOTES TO CONSOLIDATED FINANCIAL STATEMENTS—(Continued)16.Segment InformationWe are one of the leading wholesale distributors to the convenience retail industry in North America in terms of annual sales, and provide sales and marketing, distribution and logistics services to customer locations across the United States and Canada. We distribute consumable goods including cigarettes, tobacco, candy, snacks, fast food, groceries, fresh products, dairy, non-alcoholic beverages, general merchandise and health and beauty care products to customers in approximately 50 states and 5 Canadian provinces. We service a variety of store formats, including traditional convenience stores, grocery stores, drug stores, liquor stores, gift shops, specialty stores and other stores that carry convenience products.As of December 31, 2008, we operated 24 distribution centers (excluding two distribution facilities we operated as third party logistics provider) which support our wholesale distribution business. Out of the 24 distribution centers, 20 are located in the United States and four in Canada. Two of the facilities we operate in the United States are consolidating warehouses which buy products from our suppliers in bulk quantities and then distribute the products to our other distribution centers and the two third-party logistics provider.These distribution centers (operating divisions) produced almost all of our revenues and have been aggregated as operating segments, in accordance withSFAS 131,Disclosures About Segments of an Enterprise and Related Information, into two geographic reporting segments, United States and Canada, based on the different economic characteristics and regulatory environments of both countries. Corporate adjustments and eliminations include the net results after intercompany eliminations for our consolidating warehouses, corporate fees for service revenue, reclassifying adjustments, corporate allocations, and elimination of inter-company interest charges. Accounting policies for measuring segment assets and earnings before income taxes are substantially consistent with those described inNote 2—Summary of Significant Accounting Policies. Inter-segment revenues are not significant and no single customer accounted for 10% or more of our total revenues. Information about our business operations based on the two geographic reporting segments follows (in millions):CORE-MARK HOLDING COMPANY, INC. AND SUBSIDIARIESNOTES TO CONSOLIDATED FINANCIAL STATEMENTS—(Continued) 2008 2007 2006 $ 5,082.3 $ 4,771.3 $ 4,360.2 935.8 768.2 932.5 26.8 21.4 21.7 $ 6,044.9 $ 5,560.9 $ 5,314.4 $ 34.9 $ 18.1 $ 15.4 (5.6 ) (1.0 ) 3.1 (6.7 ) 20.5 15.5 $ 22.6 $ 37.6 $ 34.0 $ 20.6 $ 20.6 $ 21.9 0.9 — — (19.3 ) (18.2 ) (16.6 ) $ 2.2 $ 2.4 $ 5.3 $ 0.1 $ 0.2 $ 0.1 0.1 0.1 0.4 0.8 1.1 0.6 $ 1.0 $ 1.4 $ 1.1 $ 12.4 $ 11.2 $ 10.5 2.0 1.0 0.9 3.0 2.7 1.8 $ 17.4 $ 14.9 $ 13.2 Identifiable assets by geographic reporting segments (in millions): December 31,
2008 December 31,
2007 $ 530.7 $ 489.4 81.9 87.7 $ 612.6 $ 577.1 The net sales mix for our primary product categories is as follows (in millions): 2008 2007 2006 $ 4,124.8 $ 3,863.1 $ 3,783.8 710.1 596.7 522.4 401.3 349.8 318.3 402.7 353.4 322.6 220.1 206.2 187.7 180.9 186.4 174.3 5.0 5.3 5.3 1,920.1 1,697.8 1,530.6 $ 6,044.9 $ 5,560.9 $ 5,314.4 ITEM 9.CHANGES IN AND DISAGREEMENTS WITH ACCOUNTANTS ON ACCOUNTING AND FINANCIAL DISCLOSURE.None.ITEM 9.A.CONTROLS AND PROCEDURESEvaluation of Disclosure Controls and ProceduresWe conducted, under the supervision and with the participation of our management, including the chief executive officer and chief financial officer, an evaluation of the effectiveness of the design and operation of our disclosure controls and procedures (as defined in Rules 13a-15(e) and 15d-15(e) under the Securities Exchange Act of 1934, as amended). Based on our evaluation, the chief executive officer and chief financial officer concluded that, as of December 31, 2008, our disclosure controls and procedures were effective.Management’s Report on Internal Control over Financial ReportingOur management is responsible for establishing and maintaining adequate internal control over financial reporting as defined in Rule 13a-15(f) of the Securities Exchange Act of 1934. We assessed the effectiveness of our internal control over financial reporting as of December 31, 2008. In making this assessment, we used the criteria set forth by the Committee of Sponsoring Organizations of the Treadway Commission (COSO) in Internal Control—Integrated Framework, issued by the Committee of Sponsoring Organizations of the Treadway Commission. Management did not assess the internal control over financial reporting at our New England division, which we acquired on June 23, 2008 and which represented approximately 6% and 5% of our net and total assets, respectively, 3% of revenues and less than 5% of income before income taxes of the consolidated financial statements amounts on a FIFO basis as of and for the year ended December 31, 2008.Based on this assessment, we concluded that our internal control over financial reporting was effective as of December 31, 2008.Our assessment of the effectiveness of our internal control over financial reporting as of December 31, 2008 has been audited by Deloitte & Touche LLP, our independent registered public accounting firm, as stated in their report which appears herein.Changes in Internal Control over Financial ReportingThere were no changes in our internal control over financial reporting that occurred during the fourth quarter of the year ended December 31, 2008 that have materially affected, or are reasonably likely to materially affect, the internal control over financial reporting.REPORT OF INDEPENDENT REGISTERED PUBLIC ACCOUNTING FIRM ON INTERNAL CONTROL OVER FINANCIAL REPORTINGTo the Board of Directors and Stockholders ofCore-Mark Holding Company, Inc.:We have audited the internal control over financial reporting of Core-Mark Holding Company, Inc. and subsidiaries (the “Company”) as of December 31, 2008, based on criteria established inInternal Control—Integrated Framework issued by the Committee of Sponsoring Organizations of the Treadway Commission. As described in “Management’s Report on Internal Control over Financial Reporting,” management excluded from its assessment the internal control over financial reporting at the New England division, which was acquired on June 23, 2008 and whose financial statements constituted approximately 6% and 5% of net and total assets, respectively, 3% of revenues and less than 5% of income before income taxes of the consolidated financial statements amounts on a FIFO basis as of and for the year ended December 31, 2008. Accordingly, our audit did not include the internal control over financial reporting at the New England division. The Company’s management is responsible for maintaining effective internal control over financial reporting and for its assessment of the effectiveness of internal control over financial reporting including the accompanying “Management’s Report on Internal Control over Financial Reporting”. Our responsibility is to express an opinion on the Company’s internal control over financial reporting based on our audit.We conducted our audit in accordance with the standards of the Public Company Accounting Oversight Board (United States). Those standards require that we plan and perform the audit to obtain reasonable assurance about whether effective internal control over financial reporting was maintained in all material respects. Our audit included obtaining an understanding of internal control over financial reporting, assessing the risk that a material weakness exists, testing and evaluating the design and operating effectiveness of internal control based on the assessed risk, andrisk. Our audits also included performing such other procedures as we considered necessary in the circumstances. We believe that our audit providesaudits provide a reasonable basis for our opinion.company’scompany's internal control over financial reporting is a process designed by, or under the supervision of, the company’scompany's principal executive and principal financial officers, or persons performing similar functions, and effected by the company’scompany's board of directors, management, and other personnel to provide reasonable assurance regarding the reliability of financial reporting and the preparation of financial statements for external purposes in accordance with generally accepted accounting principles. A company’scompany's internal control over financial reporting includes those policies and procedures that (1) pertain to the maintenance of records that, in reasonable detail, accurately and fairly reflect the transactions and dispositions of the assets of the company; (2) provide reasonable assurance that transactions are recorded as necessary to permit preparation of financial statements in accordance with generally accepted accounting principles and that receipts and expenditures of the company are being made only in accordance with authorizations of management and directors of the company; and (3) provide reasonable assurance regarding prevention or timely detection of unauthorized acquisition, use, or disposition of the company’scompany's assets that could have a material effect on the financial statements.2008,2011, based on the criteria established inInternal Control—Control - Integrated Frameworkissued by the Committee of Sponsoring Organizations of the Treadway Commission./s/ Deloitte & Touche LLP San Francisco, California March 8, 2012 December 31, December 31, 2011 2010 Assets Current assets: Cash and cash equivalents $ 15.2 $ 16.1 Restricted cash 12.6 12.8 Accounts receivable, net of allowance for doubtful accounts of $9.6 and $8.7, respectively (Note 4) 215.7 179.3 Other receivables, net (Note 4) 42.0 43.5 Inventories, net (Note 5) 362.3 290.7 Deposits and prepayments (Note 4) 48.2 42.2 Deferred income taxes (Note 9) 6.2 3.6 Total current assets 702.2 588.2 Property and equipment, net (Note 6) 99.5 84.7 Goodwill 16.2 4.6 Other non-current assets, net (Note 4) 52.3 31.3 Total assets $ 870.2 $ 708.8 Liabilities and Stockholders’ Equity Current liabilities: Accounts payable $ 91.5 $ 57.3 Book overdrafts 27.1 6.5 Cigarette and tobacco taxes payable 173.4 166.8 Accrued liabilities (Note 4) 78.6 61.6 Deferred income taxes (Note 9) 0.3 0.3 Total current liabilities 370.9 292.5 Long-term debt (Note 7) 63.1 0.8 Deferred income taxes (Note 9) 9.8 2.2 Other long-term liabilities 9.5 7.7 Claims liabilities, net (Note 2) 27.8 30.6 Pension liabilities 13.6 12.3 Total liabilities 494.7 346.1 Commitments and contingencies (Note 8) Stockholders’ equity: Common stock; $0.01 par value (50,000,000 shares authorized, 12,382,724 and 11,613,525 shares issued; 11,344,947 and 11,118,163 shares outstanding at December 31, 2011 and 2010, respectively) 0.1 0.1 Additional paid-in capital 240.1 229.6 Treasury stock at cost (1,037,777 and 495,362 shares of common stock at December 31, 2011 and 2010, respectively) (32.2 ) (13.2 ) Retained earnings 171.6 147.3 Accumulated other comprehensive loss (4.1 ) (1.1 ) Total stockholders’ equity 375.5 362.7 Total liabilities and stockholders’ equity $ 870.2 $ 708.8 Year Ended December 31, 2011 2010 2009 Net sales $ 8,114.9 $ 7,266.8 $ 6,531.6 Cost of goods sold 7,680.8 6,881.5 6,130.0 Gross profit 434.1 385.3 401.6 Warehousing and distribution expenses 234.6 211.8 197.3 Selling, general and administrative expenses 150.8 142.5 137.3 Amortization of intangible assets 3.0 2.1 2.0 Total operating expenses 388.4 356.4 336.6 Income from operations 45.7 28.9 65.0 Interest expense (2.4 ) (2.6 ) (1.7 ) Interest income 0.4 0.4 0.3 Foreign currency transaction (losses) gains, net (0.5 ) 0.5 2.2 Income before income taxes 43.2 27.2 65.8 Provision for income taxes (Note 9) (17.0 ) (9.5 ) (18.5 ) Net income $ 26.2 $ 17.7 $ 47.3 Basic net income per common share (Note 10) $ 2.30 $ 1.64 $ 4.53 Diluted net income per common share (Note 10) $ 2.23 $ 1.55 $ 4.35 Basic weighted-average shares (Note 10) 11.4 10.8 10.5 Diluted weighted-average shares (Note 10) 11.7 11.4 10.9 Dividend declared and paid per common share $ 0.17 $ — $ — Common Stock Additional Accumulated Other Total Total Issued Paid-In Treasury Stock Retained Comprehensive Stockholders' Comprehensive Shares Amount Capital Shares Amount Earnings Income (Loss) Equity Income (Loss) Balance, December 31, 2008 10.7 $ 0.1 $ 209.3 (0.4 ) $ (11.0 ) $ 82.3 $ (7.1 ) $ 273.6 Net income — — — — — 47.3 — 47.3 $ 47.3 Stock-based compensation expense — — 5.1 — — — — 5.1 — Cash proceeds from exercise of common stock options and warrants — — 2.2 — — — — 2.2 — Minimum pension liability adjustment, net of taxes of $(1.5) — — — — — — 2.4 2.4 2.4 Excess tax deductions associated with stock-based compensation — — 0.1 — — — — 0.1 — Issuance of stock based instruments, net of shares withheld for employee taxes 0.3 — (0.5 ) — — — — (0.5 ) — Repurchases of common stock — — — (0.1 ) (2.2 ) — — (2.2 ) — Foreign currency translation adjustment — — — — — — 2.2 2.2 2.2 Total comprehensive income $ 51.9 Balance, December 31, 2009 11.0 0.1 216.2 (0.5 ) (13.2 ) 129.6 (2.5 ) 330.2 Net income — — — — — 17.7 — 17.7 $ 17.7 Stock-based compensation expense — — 4.8 — — — 4.8 — Cash proceeds from exercise of common stock options and warrants 0.5 — 8.3 — — — — 8.3 — Minimum pension liability adjustment, net of taxes of $(0.1) — — — — — — 0.2 0.2 0.2 Excess tax deductions associated with stock-based compensation — — 2.0 — — — — 2.0 — Issuance of stock based instruments, net of shares withheld for employee taxes 0.1 — (1.7 ) — — — — (1.7 ) — Foreign currency translation adjustment — — — — — — 1.2 1.2 1.2 Total comprehensive income $ 19.1 Balance, December 31, 2010 11.6 0.1 229.6 (0.5 ) (13.2 ) 147.3 (1.1 ) 362.7 Net income — — — — — 26.2 — 26.2 $ 26.2 Dividends declared — — — — — (1.9 ) — (1.9 ) — Stock-based compensation expense — — 5.1 — — — — 5.1 — Cash proceeds from exercise of common stock options and warrants 0.7 — 5.4 — — — — 5.4 — Minimum pension liability adjustment, net of taxes of $1.7 — — — — — — (2.7 ) (2.7 ) (2.7 ) Excess tax deductions associated with stock-based compensation — — 1.7 — — — — 1.7 — Issuance of stock based instruments, net of shares withheld for employee taxes 0.1 — (1.7 ) — — — — (1.7 ) — Repurchases of common stock — — — (0.5 ) (19.0 ) — — (19.0 ) — Foreign currency translation adjustment — — — — — — (0.3 ) (0.3 ) (0.3 ) Total comprehensive income $ 23.2 Balance, December 31, 2011 12.4 $ 0.1 $ 240.1 (1.0 ) $ (32.2 ) $ 171.6 $ (4.1 ) $ 375.5 Year Ended December 31, 2011 2010 2009 Cash flows from operating activities: Net income $ 26.2 $ 17.7 $ 47.3 Adjustments to reconcile net income to net cash provided by operating activities: LIFO and inventory provisions 18.2 16.5 7.1 Amortization of debt issuance costs 0.5 0.5 0.5 Stock-based compensation expense 5.5 4.8 5.1 Bad debt expense, net 2.0 1.4 1.8 Loss on disposals 0.2 0.7 — Depreciation and amortization 22.4 19.7 18.7 Foreign currency transaction losses (gains), net 0.5 (0.5 ) (2.2 ) Deferred income taxes (2.0 ) 5.2 14.5 Changes in operating assets and liabilities: Accounts receivable, net (20.0 ) 2.5 (13.8 ) Other receivables, net 1.9 (3.5 ) (4.3 ) Inventories, net (78.0 ) (18.8 ) (36.7 ) Deposits, prepayments and other non-current assets (12.4 ) 2.3 (16.7 ) Accounts payable 30.0 (6.4 ) (4.4 ) Cigarette and tobacco taxes payable 7.5 32.1 22.8 Pension, claims, accrued and other long-term liabilities 10.3 0.6 (6.6 ) Income taxes payable (1.5 ) 0.1 — Net cash provided by operating activities 11.3 74.9 33.1 Cash flows from investing activities: Acquisition of business, net of cash acquired (50.8 ) (35.9 ) — Restricted cash (0.1 ) 0.2 0.7 Additions to property and equipment, net (24.1 ) (13.9 ) (21.1 ) Capitalization of software (0.2 ) (1.0 ) (0.3 ) Proceeds from sale of fixed assets 0.1 0.1 0.1 Net cash used in investing activities (75.1 ) (50.5 ) (20.6 ) Cash flows from financing activities: Borrowings (repayments) under revolving credit facility, net 62.0 (19.2 ) (10.7 ) Payments of financing costs (0.7 ) (1.8 ) — Dividends paid (1.9 ) — — Repurchases of common stock (19.0 ) — (2.2 ) Proceeds from exercise of common stock options and warrants 5.4 8.3 2.2 Tax withholdings related to net share settlements of restricted stock units (1.7 ) (1.7 ) (0.5 ) Excess tax deductions associated with stock-based compensation 1.7 2.0 0.4 Increase (decrease) in book overdrafts 17.1 (12.9 ) 1.6 Net cash provided by (used in) financing activities 62.9 (25.3 ) (9.2 ) Effects of changes in foreign exchange rates — (0.7 ) (1.3 ) (Decrease) increase in cash and cash equivalents (0.9 ) (1.6 ) 2.0 Cash and cash equivalents, beginning of period 16.1 17.7 15.7 Cash and cash equivalents, end of period $ 15.2 $ 16.1 $ 17.7 Supplemental disclosures: Income taxes paid, net of refunds $ 11.8 $ 10.6 $ 11.7 Interest paid 2.0 1.7 1.0 Non-cash investing activities: Contingent consideration related to acquisition of business $ — $ 1.0 $ — 1. Summary of Company Information 2. Summary of Significant Accounting Policies Office furniture and equipment 3 to 10 Delivery equipment 4 to 10 Warehouse equipment 5 to 15 Leasehold improvements 3 to 25 Buildings 25 Cash $ 3.5 Accounts receivable 18.4 Other receivables 0.4 Inventory 13.0 Prepaid expenses 1.0 Property, plant and equipment 6.0 Intangible assets 18.4 Goodwill 11.6 Net deferred tax liabilities (7.2 ) Other liabilities (12.1 ) Total consideration $ 53.0 Cash $ 0.1 Accounts receivable 21.1 Inventory 9.9 Prepaid expenses 0.3 Property, plant and equipment 2.4 Intangible assets 3.6 Liabilities (1.4 ) Cash paid at closing $ 36.0 Contingent payments 1.0 Total consideration $ 37.0 4. Other Consolidated Balance Sheet Accounts Detail 2011 2010 2009 Balance, beginning of period $ 8.7 $ 9.1 $ 8.8 Net additions charged to operations 2.0 1.4 1.8 Less: Write-offs and adjustments (1.1 ) (1.8 ) (1.5 ) Balance, end of period $ 9.6 $ 8.7 $ 9.1 December 31, 2011 December 31, 2010 Vendor receivables, net $ 29.2 $ 31.1 Insurance recoverables, current 2.2 2.5 Other 10.6 9.9 Total $ 42.0 $ 43.5 December 31, 2011 December 31, 2010 Deposits $ 3.8 $ 4.4 Prepaid taxes 8.8 12.9 Vendor prepayments 22.7 14.1 Other prepayments 12.9 10.8 Total $ 48.2 $ 42.2 December 31, 2011 December 31, 2010 Internally developed and other purchased software, net $ 1.4 $ 2.6 Insurance recoverables, net of current portion 17.7 19.5 Debt issuance costs 1.5 1.2 Insurance deposits, net of current portion 2.9 2.7 Racking allowances, net 5.9 1.8 Other amortizable intangibles (net of accumulated amortization of $2.1 and $0.7, respectively) 19.9 2.7 Other assets 3.0 0.8 Total $ 52.3 $ 31.3 Customer relationships 10-15 Non-competition agreements 1-5 Software 3-8 December 31, 2011 December 31, 2010 Accrued payroll, retirement and other benefits $ 26.6 $ 22.2 Claims liabilities, current 7.9 8.7 Other accrued expenses 31.6 19.6 Accrued customer incentives payable 12.5 11.1 Total $ 78.6 $ 61.6 5. Inventories December 31, 2011 December 31, 2010 Inventories at FIFO, net of reserves $ 440.3 $ 350.4 Less: LIFO reserve (78.0 ) (59.7 ) Total inventories at LIFO, net of reserves $ 362.3 $ 290.7 December 31, 2011 December 31, 2010 Delivery, warehouse and office equipment $ 136.5 $ 118.5 Equipment under capital leases 1.6 1.2 Leasehold improvements 28.7 20.4 Land and buildings 15.2 12.8 182.0 152.9 Less: Accumulated depreciation and amortization (82.5 ) (68.2 ) Total $ 99.5 $ 84.7 December 31, 2011 December 31, 2010 Amounts borrowed (Credit Facility) $ 62.0 $ — Obligations under capital leases 1.1 0.8 Total $ 63.1 $ 0.8 December 31, 2011 December 31, 2010 Amounts borrowed $ 62.0 $ — Outstanding letters of credit $ 23.7 $ 26.2 Amounts available to borrow $ 106.2 $ 161.4 8. Commitments and Contingencies 2012 $ 32.5 2013 27.5 2014 22.0 2015 19.0 2016 17.2 2017 and Thereafter 74.2 $ 192.4 9. Income Taxes 2011 2010 2009 Current: Federal $ 13.7 $ 3.8 $ 7.6 State 3.6 0.5 (1.9 ) Foreign — — — Total current tax provision $ 17.3 $ 4.3 $ 5.7 Deferred: Federal $ 0.3 $ 5.1 $ 11.6 State (0.5 ) 0.9 2.3 Foreign (0.1 ) (0.8 ) (1.1 ) Total deferred tax (benefit) provision $ (0.3 ) $ 5.2 $ 12.8 Total income tax provision $ 17.0 $ 9.5 $ 18.5 Year Ended December 31, 2011 2010 2009 Federal income tax provision at the statutory rate $ 15.1 35.0 % $ 9.5 35.0 % $ 23.0 35.0 % Increase (decrease) resulting from: State income taxes, net of federal benefit 2.1 4.9 1.2 4.4 2.9 4.4 Decrease in unrecognized tax benefits (inclusive of related interest and penalty) (0.3 ) (0.7 ) (0.5 ) (1.8 ) (6.0 ) (9.1 ) Effect of foreign operations (0.1 ) (0.2 ) (0.8 ) (2.9 ) (1.1 ) (1.7 ) 0.3 0.7 — — — — (0.1 ) (0.3 ) 0.1 0.2 (0.3 ) (0.5 ) Income tax provision $ 17.0 39.4 % $ 9.5 34.9 % $ 18.5 28.1 % December 31, 2011 December 31, 2010 Deferred tax assets: Employee benefits, including post-retirement benefits $ 15.6 $ 15.5 Trade and other receivables 3.9 3.4 Goodwill and intangibles 2.6 1.7 Self-insurance reserves 0.6 0.6 Minimum tax credits — 2.1 Other 3.3 2.9 Subtotal 26.0 26.2 Less: valuation allowance (0.1 ) (0.1 ) Net deferred tax assets $ 25.9 $ 26.1 Deferred tax liabilities: Inventories $ 2.8 $ 7.1 Property and equipment 17.8 14.8 Prepaid and deposits 0.5 0.5 Deferred income 0.2 0.3 7.2 — Other 1.3 2.3 Total deferred tax liabilities $ 29.8 $ 25.0 Total net deferred tax (liabilities) assets $ (3.9 ) $ 1.1 Net current deferred tax assets 5.9 3.3 Net non-current deferred tax liabilities $ (9.8 ) $ (2.2 ) 2011 2010 2009 Balance at beginning of year $ 1.2 $ 1.5 $ 6.1 0.9 — — Lapse of statute of limitations (0.2 ) (0.4 ) (4.7 ) Other (0.1 ) 0.1 0.1 Balance at end of year $ 1.8 $ 1.2 $ 1.5 10. Earnings Per Share Year Ended December 31, 2011 2010 2009 Net Income Weighted-Average Shares Outstanding Net Income Per Common Share Net Income Weighted-Average Shares Outstanding Net Income Per Common Share Net Income Weighted-Average Shares Outstanding Net Income Per Common Share Basic EPS $ 26.2 11.4 $ 2.30 $ 17.7 10.8 $ 1.64 $ 47.3 10.5 $ 4.53 Effect of dilutive common share equivalents: Unvested restricted stock units — (0.01 ) 0.1 (0.01 ) — (0.02 ) Stock options 0.1 (0.02 ) 0.2 (0.03 ) 0.2 (0.07 ) Warrants 0.2 (0.04 ) 0.3 (0.05 ) 0.2 (0.08 ) Performance shares — — — — — (0.01 ) Diluted EPS $ 26.2 11.7 $ 2.23 $ 17.7 11.4 $ 1.55 $ 47.3 10.9 $ 4.35 11. Stock-Based Compensation Plans Number of securities to be issued upon exercise of outstanding options, warrants and rights Weighted-average exercise price of outstanding options, warrants and rights Number of securities remaining available for future issuance under equity compensation plans (excluding securities reflected in column 1) 2004 Long-Term Incentive Plan -Restricted stock units and options 41,265 $ 34.92 — 2005 Long-Term Incentive Plan -Restricted stock units 3,053 $ 0.01 — 2005 Directors' Equity Incentive Plan 7,500 $ 27.03 — 363,814 $ 19.37 — 173,224 $ 1.43 584,665 (1) Includes non-qualified stock options, restricted stock units and performance shares. Year Ended December 31, 2011 2010 2009 Expected life (years) 5.3 — 4.0 Risk-free interest rate 0.48 % — % 1.12 % Volatility 41 % — % 44 % Dividend yield 2 % — — Weighted-average fair value per share of grants: Stock options $ 9.88 $ — $ 7.14 Restricted stock units $ 34.12 $ 31.57 $ 19.18 Performance shares $ 34.12 $ — $ 19.18 December 31, 2010 Activity during 2011 December 31, 2011 Outstanding Granted Exercised Canceled Outstanding Exercisable Plans Securities Number Price Number Price Number Price Number Price Number Price Number Price 2004 LTIP RSUs 1,221 $ 0.01 — $ — (1,032 ) $ 0.01 (1 ) $ 0.01 188 $ 0.01 188 $ 0.01 Options 218,255 20.44 — — (172,982 ) 16.70 (4,196 ) 31.40 41,077 35.08 41,077 35.08 2004 Directors’ Plan Options 30,000 15.50 — — (30,000 ) 15.50 — — — — — — 2005 LTIP RSUs 15,772 0.01 — — (12,719 ) 0.01 — — 3,053 0.01 3,053 0.01 2005 Directors’ Plan Options 15,000 27.03 — — (7,500 ) 27.03 — — 7,500 27.03 7,500 27.03 RSUs 217,949 0.01 — — (139,440 ) 0.01 — — 78,509 0.01 31,164 0.01 Options 308,783 25.28 — — (34,749 ) 21.87 — — 274,034 25.71 274,034 25.71 Perf. shares 32,454 0.01 — — (21,183 ) 0.01 — — 11,271 0.01 11,271 0.01 RSUs — — 137,532 0.01 — — — — 137,532 0.01 — — Options — — 7,500 32.78 — — — — 7,500 32.78 — — Perf. shares — — 28,192 0.01 — — — — 28,192 0.01 — — Total 839,434 173,224 (419,605 ) (4,197 ) 588,856 368,287 (1) The 2007 and 2010 LTIPs are for officers, employees and non-employee directors. (2) All 28,192 performance shares granted during 2011 were earned based upon achievement of performance criteria. One-third of those shares vested on January 19, 2012, and the balance will vest in equal quarterly installments over a subsequent two-year period. December 31, 2011 Outstanding Weighted-Average Remaining Contractual Term (years) Plans Securities Vested Vested Vested 2004 LTIP RSUs 188 — — — $ 7 $ — Options 41,077 — 2.3 — 186 — 2005 LTIP RSUs 3,053 — — — 121 — 2005 Directors’ Plan Options 7,500 — 0.6 — 94 — 2007 LTIP RSUs 31,164 45,702 — — 1,234 1,809 Options 274,034 — 3.3 — 3,807 — Perf. shares 11,271 — — — 446 — 2010 LTIP RSUs — 132,760 — — — 5,256 Options — 7,240 — 6.8 — 49 Perf. shares — 27,214 — — — 1,077 Total 368,287 212,916 $ 5,895 $ 8,191 (1) (2) Options, restricted stock units and performance shares that are expected to vest are net of estimated future forfeitures. 12. Employee Benefit Plans December 31, 2011 December 31, 2010 December 31, 2011 December 31, 2010 Change in Benefit Obligation: Obligation at beginning of period $ 35.4 $ 35.2 $ 4.1 $ 4.4 Interest cost 1.8 1.9 0.2 0.2 Actuarial loss (gain) 2.9 0.3 0.5 (0.2 ) Benefit payments (2.1 ) (2.3 ) (0.2 ) (0.3 ) Change in plan provision — 0.3 — — Benefit obligation at end of period $ 38.0 $ 35.4 $ 4.6 $ 4.1 Change in Pension Plan Assets: Fair value of pension plan assets at beginning of period $ 26.9 $ 23.6 $ — $ — Actual return on plan assets 0.7 2.2 — — Employer contributions 3.2 3.4 0.2 0.3 Benefit payments (2.1 ) (2.3 ) (0.2 ) (0.3 ) Fair value of pension plan assets at end of period $ 28.7 $ 26.9 $ — $ — Funded Status: Funded status $ (9.3 ) $ (8.5 ) $ (4.6 ) $ (4.1 ) December 31, 2011 December 31, 2010 Projected benefit obligation $ 38.0 $ 35.4 Accumulated benefit obligation 38.0 35.4 Fair value of pension plan assets 28.7 26.9 2011 2010 2009 Interest cost $ 1.8 $ 1.9 $ 2.0 Expected return on plan assets (1.9 ) (1.7 ) (1.5 ) Amortization of net actuarial loss 0.3 0.2 0.3 Net periodic benefit cost $ 0.2 $ 0.4 $ 0.8 2011 2010 2009 Interest cost $ 0.2 $ 0.2 $ 0.5 Amortization of net actuarial loss — — 0.3 Amortization of prior service cost (credit) (0.1 ) (0.1 ) — Curtailment gain, net — — (0.8 ) Net periodic other benefit cost $ 0.1 $ 0.1 $ — Other Post-retirement Benefits December 31, December 31, 2011 2010 2009 2011 2010 2009 Benefit Obligations: Discount rate 4.72 % 5.04 % 5.58 % 4.74 % 5.08 % 5.88 % Net Periodic Benefit Costs: Discount rate 5.04 % 5.73 % 6.26 % 5.08 % 5.88 % 6.07 % Expected return on assets 7.35 % 7.35 % 7.35 % n/a n/a n/a December 31, 2011 December 31, 2010 Assumed current trend rate for next year for participants under 65 7.50% 6.50% Assumed current trend rate for next year for participants 65 and over 6.50% 6.50% Ultimate year trend rate 5.00% 5.00% Year that ultimate trend rate is reached for participants under 65 2016 2014 Year that ultimate trend rate is reached for participants 65 and over 2015 2014 1% Increase 1% Decrease Effect on total of service and interest cost components of net periodic post-retirement health care benefit cost $ — $ — Effect on the health care component of the accumulated post-retirement benefit obligation $ 0.4 $ (0.4 ) Asset Category Total Quoted Prices in Active Markets for Identical Assets (Level 1) Significant Observable Inputs (Level 2) Significant Unobservable Inputs (Level 3) Cash $ 1.5 $ 1.5 $ — $ — Equity securities: Mutual funds 6.4 6.4 — — Other equity securities, primarily U.S. companies 8.7 8.7 — — Government securities 3.4 3.4 — — Corporate and muni bonds: Other bonds 4.8 4.8 — — Mutual funds 0.3 0.3 — — Group annuity contract 3.6 — 3.6 — Total $ 28.7 $ 25.1 $ 3.6 $ — Asset Category Total Quoted Prices in Active Markets for Identical Assets (Level 1) Significant Observable Inputs (Level 2) Significant Unobservable Inputs (Level 3) Cash $ 3.1 $ 3.1 $ — $ — Equity securities: Mutual funds 6.5 6.5 — — Other equity securities, primarily U.S. companies 8.5 8.5 — — Government securities 2.4 2.4 — — Corporate and muni bonds: Other bonds 2.5 2.5 — — Mutual funds 0.5 0.5 — — Group annuity contract 3.4 — 3.4 — Total $ 26.9 $ 23.5 $ 3.4 $ — 2012 $ 2.9 $ 0.3 2013 2.7 0.3 2014 3.0 0.4 2015 2.7 0.3 2016 2.8 0.3 2017 through 2021 14.4 1.8 Other Post-retirement Benefits After Tax Net gain during 2009 $ 1.1 $ 1.3 Net gain during 2010 0.2 — Net loss during 2011 (2.3 ) (0.4 ) Pension December 31, 2011 December 31, 2010 December 31, 2011 December 31, 2010 Current liabilities $ — $ — $ (0.3 ) $ (0.3 ) Non-current liabilities (9.3 ) (8.5 ) (4.3 ) (3.8 ) Total $ (9.3 ) $ (8.5 ) $ (4.6 ) $ (4.1 ) Expected amortization of net loss $ 0.4 $ — Expected amortization of prior service cost (credit) — (0.1 ) Total expected amortizations for the year ending December 31, 2012 $ 0.4 $ (0.1 ) 13. Stockholders' Equity Year Ended December 31, 2011 2010 2009 Net sales: $ 6,865.5 $ 6,086.3 $ 5,519.2 Canada 1,220.5 1,158.0 992.9 Corporate adjustments and eliminations 28.9 22.5 19.5 Total $ 8,114.9 $ 7,266.8 $ 6,531.6 Income (loss) before income taxes: $ 50.4 $ 35.6 $ 70.0 Canada (1.4 ) (4.7 ) (3.2 ) Corporate adjustments and eliminations (5.8 ) (3.7 ) (1.0 ) Total $ 43.2 $ 27.2 $ 65.8 Interest expense: United States $ 23.5 $ 24.3 $ 20.9 Canada 0.9 0.9 0.8 Corporate adjustments and eliminations (22.0 ) (22.6 ) (20.0 ) Total $ 2.4 $ 2.6 $ 1.7 Interest income: United States $ — $ 0.1 $ 0.1 Canada 0.1 0.1 0.1 Corporate adjustments and eliminations 0.3 0.2 0.1 Total $ 0.4 $ 0.4 $ 0.3 Depreciation and amortization: United States $ 15.4 $ 13.9 $ 13.3 Canada 3.0 2.7 2.4 Corporate adjustments and eliminations 4.0 3.1 3.0 Total $ 22.4 $ 19.7 $ 18.7 (1) Net cigarette sales for 2010 include approximately $105.9 million of increased sales resulting from manufacturers' cigarette price increases in response to SCHIP legislation, compared to the same period in 2009. December 31, 2011 December 31, 2010 Identifiable assets: United States $ 768.6 $ 590.2 Canada 101.6 118.6 Total $ 870.2 $ 708.8 Year Ended December 31, 2011 2010 2009 Product Category Net Sales Net Sales Net Sales $ 5,710.6 $ 5,119.7 $ 4,589.1 Food 995.7 840.9 738.0 Candy 459.8 426.0 405.0 Other tobacco products 607.9 503.6 434.0 Health, beauty & general 237.5 220.6 209.5 Beverages 100.9 152.0 151.7 Equipment/other 2.5 4.0 4.3 Total food/non-food products 2,404.3 2,147.1 1,942.5 Total net sales $ 8,114.9 $ 7,266.8 $ 6,531.6 15. Quarterly Financial Data (Unaudited) Three Months Ended (unaudited) (dollars in millions, except per share data) December 31, September 30, June 30, March 31, 2011 2011 2011 2011 $ 1,490.7 $ 1,566.4 $ 1,430.5 $ 1,223.0 636.8 658.7 609.3 499.5 2,127.5 2,225.1 2,039.8 1,722.5 Cost of goods sold 2,017.7 2,102.9 1,930.0 1,630.2 109.8 122.2 109.8 92.3 61.2 61.7 57.8 53.9 39.0 38.6 36.5 36.7 Amortization of intangible assets 0.9 0.8 0.8 0.5 Total operating expenses 101.1 101.1 95.1 91.1 Income from operations 8.7 21.1 14.7 1.2 Interest expense (0.6 ) (0.6 ) (0.6 ) (0.6 ) Interest income — 0.2 0.1 0.1 Foreign currency gains (losses), net 0.1 (1.4 ) 0.2 0.6 Income before income taxes 8.2 19.3 14.4 1.3 Income tax provision (3.0 ) (7.3 ) (5.9 ) (0.8 ) Net income 5.2 12.0 8.5 0.5 $ 0.46 $ 1.05 $ 0.74 $ 0.04 $ 0.45 $ 1.03 $ 0.72 $ 0.04 Shares used to compute basic net income per common share 11.4 11.4 11.5 11.3 Shares used to compute diluted net income per common share 11.5 11.7 11.9 11.8 $ 494.0 $ 534.0 $ 496.5 $ 427.0 2.9 4.4 — 0.9 LIFO expense 5.8 5.0 4.6 2.9 Depreciation and amortization 6.3 5.4 5.6 5.1 Stock-based compensation 1.4 1.6 1.2 1.3 Capital expenditures 13.0 5.3 4.5 1.3 (1) Excise taxes are included as a component of net sales. (2) Includes for Q2 and Q3, respectively, approximately $4.2 million and $1.7 million of candy inventory holding gains resulting from manufacturer price increases. The candy inventory holding gains were estimated as the amount in excess of our normal manufacturer incentives for those products sold in 2011. (3) Includes a $0.8 million OTP tax settlement which was recorded as a decrease to cost of goods sold during Q1. (4) Warehousing and distribution expenses are not included as a component of the Company's cost of goods sold which presentation may differ from that of other registrants. (5) SG&A expenses include acquisition and transition costs related to FCGC, consisting of $0.8 million in Q4, $0.4 million in Q3, $0.8 million in Q2 and $0.7 million in Q1. SG&A expenses also include start-up costs of $0.4 million in Q4 and $1.4 million in Q3 related to related to the start-up of the Florida distribution center and other infrastructure costs to support the new distribution agreement with Couche-Tard. (6) Totals may not agree with full year amounts due to rounding and separate calculations for each quarter. (7) Cigarette inventory holding gains relate to income we earn on cigarette and excise tax stamp quantities on hand at the time cigarette manufacturers increase their prices or when states, localities or provinces increase their excise taxes and allow us to recognize cigarette inventory holding gains. Three Months Ended (unaudited) (dollars in millions, except per share data) December 31, September 30, June 30, March 31, 2010 2010 2010 2010 $ 1,321.5 $ 1,400.9 $ 1,283.5 $ 1,113.8 535.3 592.7 550.8 468.3 1,856.8 1,993.6 1,834.3 1,582.1 Cost of goods sold 1,762.5 1,887.5 1,737.2 1,494.3 Gross profit 94.3 106.1 97.1 87.8 54.8 55.8 52.1 49.1 38.7 36.2 32.2 35.4 Amortization of intangible assets 0.6 0.5 0.5 0.5 Total operating expenses 94.1 92.5 84.8 85.0 Income from operations 0.2 13.6 12.3 2.8 Interest expense (0.7 ) (0.8 ) (0.5 ) (0.6 ) Interest income 0.1 0.2 0.1 — Foreign currency gains (losses), net 0.7 0.4 (0.8 ) 0.2 Income before income taxes 0.3 13.4 11.1 2.4 Income tax (provision) benefit 0.6 (4.7 ) (4.4 ) (1.0 ) Net income 0.9 8.7 6.7 1.4 $ 0.08 $ 0.81 $ 0.62 $ 0.13 $ 0.08 $ 0.78 $ 0.59 $ 0.12 Shares used to compute basic net income per common share 11.0 10.8 10.8 10.7 Shares used to compute diluted net income per common share 11.7 11.3 11.3 11.4 $ 464.8 $ 492.7 $ 429.4 $ 369.6 3.1 — 2.4 0.6 LIFO expense 8.8 2.9 3.6 1.3 Depreciation and amortization 5.3 4.9 4.8 4.7 Stock-based compensation 1.1 1.1 1.2 1.4 Capital expenditures 4.6 3.8 2.5 3.0 (1) Excise taxes are included as a component of net sales. (2) Includes an out of period adjustment of $1.1 million related to the recognition of deferred vendor income, of which $0.7 million related to prior years. The adjustment is immaterial to any prior period. (3) Includes a $0.6 million OTP tax gain resulting from a state tax method change which was recorded as a reduction of cost of goods sold during the first quarter of 2010. (4) Warehousing and distribution expenses are not included as a component of the Company's cost of goods sold which presentation may differ from that of other registrants. (5) SG&A expenses include integration costs related to the acquisition of FDI, consisting of $1.5 million in Q4, $1.2 million in Q3 and $0.1 million in Q2. SG&A expenses also include costs related to the settlement of Fleming legacy insurance claims of $0.6 million in Q4 and $1.0 million in Q2, as well as $0.3 million and $0.8 million of expenses for advisory and due diligence activities necessary to analyze multiple offers from potential acquirers in Q3 and Q4, respectively. (6) Totals may not agree with full year amounts due to rounding and separate calculations for each quarter. (7) Cigarette inventory holding gains relate to income we earn on cigarette and excise tax stamp quantities on hand at the time cigarette manufacturers increase their prices or when states, localities or provinces increase their excise taxes and allow us to recognize cigarette inventory holding gains. ITEM 9. CHANGES IN AND DISAGREEMENTS WITH ACCOUNTANTS ON ACCOUNTING AND We have also audited, in accordance with Management did not assess the standardsinternal control over financial reporting at our Forrest City division, which we acquired on May 2, 2011 and which represented less than 7% of the Public Company Accounting Oversight Board (United States),our total assets, and less than 5% of income before income taxes of the consolidated financial statements and financial statement scheduleamounts as of and for the year ended December 31, 20082011.Company and our report dated March 13, 2009 expressed an unqualified opinion on those consolidatedyear ended December 31, 2011 that have materially affected, or are reasonably likely to materially affect, the internal control over financial statements and financial statement schedule and included an explanatory paragraph relating to the adoptionreporting./s/ Deloitte & Touche LLPITEM 10.San Francisco, CaliforniaMarch 13, 2009OTHER INFORMATIONNone.PART IIIITEM 10.DIRECTORS AND OFFICERS OF THE REGISTRANT2009Stock—SectionStock-Section 16(a) Beneficial Ownership Reporting Compliance.”EXECUTIVE COMPENSATION2009Directors—DirectorDirectors-Director Compensation,” “Board of Directors—CompensationDirectors-Compensation Committee Interlocks and Insider Participation,” “Compensation Discussion and Analysis,” “Compensation Committee Report,” and “Compensation of Named Executives.”SECURITY OWNERSHIP OF CERTAIN BENEFICIAL OWNERS AND MANAGEMENT AND RELATED STOCKHOLDER MATTERS2009
ITEM 13.CERTAIN RELATIONSHIPS AND RELATED TRANSACTIONS, AND DIRECTOR INDEPENDENCE |
The information required by this item is included in our Proxy Statement for the 2009