UNITED STATES
SECURITIES AND EXCHANGE COMMISSION
Washington, D.C. 20549
FORM 10-K
(Mark One)
| x | ANNUAL REPORT PURSUANT TO SECTION 13 OR 15(d) OF THE SECURITIES EXCHANGE ACT OF 1934 |
For the fiscal year ended December 27, 2008January 2, 2010
OR
| ¨ | TRANSITION REPORT PURSUANT TO SECTION 13 OR 15(d) OF THE SECURITIES EXCHANGE ACT OF 1934 |
For the transition period from to
Commission file number: 0-13470
NANOMETRICS INCORPORATED
(Exact name of registrant as specified in its charter)
| Delaware | 94-2276314 | |
| (State or other jurisdiction of incorporation or organization) | (I.R.S. Employer Identification Number) | |
1550 Buckeye Drive Milpitas, California | 95035 | |
| (Address of principal executive offices) | (Zip Code) | |
Registrant’s telephone number, including area code: (408) 545-6000
Securities registered pursuant to Section 12(b) of the Act:
Common Stock, $0.001 par value per share
The NASDAQ Stock Market LLC
(NASDAQ Global Market)
Securities registered pursuant to Section 12(g) of the Act:
None
Indicate by check mark if the Registrant is a well-known seasoned issuer as defined in Rule 405 of the Securities Act. Yes ¨ No x.
Indicate by check mark if the Registrant is not required to file reports pursuant to Section 13 or Section 15(d) of the Act. Yes ¨ No x.
Indicate by check mark whether the Registrant (1) has filed all reports required to be filed by Section 13 or 15(d) of the Securities Exchange Act of 1934 during the preceding 12 months (or for such shorter period that the Registrant was required to file such reports), and (2) has been subject to such filing requirements for the past 90 days. Yes x No ¨.
Indicate by check mark whether the registrant has submitted electronically and posted on its corporate Web site, if any, every Interactive Data File required to be submitted and posted pursuant to Rule 405 of Regulation S-T during the preceding 12 months (or for such shorter period that the registrant was required to submit and post such files). Yes ¨ No ¨.
Indicate by check mark if disclosure of delinquent filers pursuant to Item 405 of Regulation S-K is not contained herein, and will not be contained, to the best of Registrant’s knowledge, in definitive proxy or information statements incorporated by reference in Part III of this Form 10-K or any amendment to this Form 10-K. ¨
Indicate by check mark whether the Registrant is a large accelerated filer, an accelerated filer, a non-accelerated filer or a smaller reporting company. See definitions of “large accelerated filer”, “accelerated filer”, and “smaller reporting company” in Rule 12b-2 of the Exchange Act. (Check one):
Large accelerated filer¨ Accelerated filer¨ Non-accelerated filerx Smaller reporting company¨
Indicate by check mark whether the Registrant is a shell company (as defined by Rule 12b-2 of the Securities Exchange Act of 1934) Yes ¨ No x.
As of June 28, 2008,27, 2009, the last business day of the Registrant’s most recently completed second fiscal quarter, the aggregate market value of the common stock of Registrant held by non-affiliates, based upon the closing sales price for the Registrant’s common stock for such date, as quoted on the NASDAQ Global Market, was $47,263,063.$35,537,595. Shares of common stock held by each officer and director and by each person who owned 5% or more of the outstanding common stock have been excluded because such persons may be deemed to be “affiliates” as that term is defined under the rules and regulations of the Exchange Act. This determination of affiliate status is not necessarily a conclusive determination for any other purpose.
The number of shares of the Registrant’s common stock outstanding as of March 17, 200919, 2010 was 18,501,717.21,572,108.
DOCUMENTS INCORPORATED BY REFERENCE
The Registrant has incorporated by reference into Part III of this Annual Report on Form 10-K portions of its Proxy Statement for its 20092010 Annual Meeting of Stockholders to be filed pursuant to Regulation 14A. The Proxy Statement will be filed within 120 days of Registrant’s fiscal year ended December 27, 2008.
January 2, 2010.
FORM 10-K
FOR THE FISCAL YEAR ENDED DECEMBER 27, 2008JANUARY 2, 2010
TABLE OF CONTENTS
Forward-Looking Statements
Certain statements contained in this Annual Report on Form 10-K that are not purely historical are “forward-looking statements” within the meaning of the federal securities laws, including, without limitation, statements regarding our expectations, beliefs, anticipations, commitments, intentions and strategies regarding the future. In some cases you can identify forward-looking statements by terms such as “may,” “could,” “would,” “might,” “will,” “should,” “expect,” “plan,” “intend,” “forecast,” “anticipate,” “believe,” “estimate,” “predict,” “potential,” “continue” or the negative of these terms or other comparable terminology. Actual results could differ from those projected in any forward-looking statements for the reasons, among others, detailed in “Risk Factors” in Item 1A. The forward-looking statements are made as of the date of this Form 10-K and we assume no obligation to update the forward-looking statements, or to update the reasons why actual results could differ from those projected in the forward-looking statements.
3
| ITEM 1. | BUSINESS |
Overview
Nanometrics is a leading supplier of advanced process control metrology systems used primarily in the manufacturing of semiconductors, solar photovoltaics (PVs) and(“PV”), high-brightness LEDs (HB-LEDs)(“HB-LED”), advanced wafer scale packaging, as well as by customers in the silicon wafer and data storage industries. Nanometrics standalone and integrated metrology systems measure various thin film properties, critical dimensions, overlay control and optical, electrical and material properties, including the structural composition of silicon, compound semiconductor and PV devices, during various steps of the manufacturing process. These systems enable device manufacturers to improve yields, increase productivity and lower their manufacturing costs.
Nanometrics was incorporated in California in 1975, has been publicly traded since 1984 (NASDAQ: NANO), and reincorporated in Delaware in 2006. We have been a pioneer and innovator in the field of optical metrology. Nanometrics has an extensive installed base of over 6,000 systems in over 150 production factories worldwide. Our major customers and OEMoriginal equipment manufacturer (“OEM”) partners include Samsung Electronics Co. Ltd., Toshiba Semiconductor,Intel Corporation, Hynix Semiconductor, Inc., Western Digital Corporation, Toshiba Corporation, Applied Materials, Inc., Semiconductor Manufacturing International Corporation, Micron Technology, Inc., Intel CorporationTaiwan Semiconductor Manufacturing Company Limited, and Renesas Technology Corp.Philips Lumileds Lighting Company.
Additional information about Nanometrics is available on our website at http://www.nanometrics.com. The information that can be accessed through our website, however, is not part of this Annual Report. Our investor relations websiteweb page is located at http://www.nanometrics.com/investor.html. We make available free of charge through our investor relations website ourOur Annual Reports on Form 10-K, Quarterly Reports on Form 10-Q, Current Reports on Form 8-K and any amendments to those reports are available on our web page as soon as reasonably practicable after we electronically file or furnish such materials to the United States Securities and Exchange Commission (“SEC”).
Industry Background
We participate in one principle reporting segment metrology for semiconductor manufacturing. Semiconductor devices are primarily packaged as chips within electronic devices, including cell phones, MP3 players and personal computers. Chips are made up of semiconductor material layers integrating millions or billions of transistors and other electronic components, connected through a complex wiring scheme of small copper or aluminum wires, ultimately packaged into thin form factors to be mounted on circuit boards. Our core focus is the measurement and control of the structure, composition, and geometry of the devices from the transistor layer through advanced wafer-scale packaging to improve device performance and manufacturing yield. Our end customers manufacture many types of chips for a multitude of applications, each having unique manufacturing challenges. This includes chips to enable information management (logic chip), data storage (NAND, NOR, and DRAM memory), and analog devices (i.e. Wi-Fi and 3G radio chips).
Semiconductors are also the principle component in solar photovoltaic cells (Solar PV) for power generation and used in devices for power control (compound semiconductors) and HB-LEDs for consumer, architectural, and industrial lighting applications. Our systems measure properties of these devices for improving efficiency and manufacturing yield.
Demand for our products continues to be driven by our customers’ ever increasing desire for higher chip performance, improvements in power efficiency, logic processing capability, and the data storage volume of chips. To facilitate the manufacturing of these chips, our customers use more complex materials and processing methods in their manufacturing flow. The majority of our chip customers manufacture devices with features as small as 65nm-45nm. New materials and methods are being implemented in high volume manufacturing including high-k materials and double patterning lithography with features as small as 32nm. The use of these new materials and methods require additional levels of process control and metrology and increase demand for our products. Currently, next-generation devices based on 22nm are in development, which in turn will require new advancements in metrology capabilities.
Our Business
We offer a comprehensive line of metrology products and technologies to address the manufacturing requirements of the high-techsemiconductor manufacturing industry. Our systems measure and characterize the physical dimensions, material
composition, optical and electrical characteristics and other critical parameters of semiconductors from initial wafer substrate manufacturing through final packaging. For the photolithographic process, overlay and critical dimension systems provide control of layer alignment and device dimensions. Advanced packaging technology requires metrology systems to control wafer scale features for through silicon via (“TSV”) and flip chip technologies. Our metrology systems can be categorized as follows:for materials monitor the physical, optical, and electrical characteristics of materials including compound semiconductor, and silicon wafers.
We are continually working to strengthen our competitive position by developing new technologies and products in our market segment. We have expanded our product offerings to address growing applications within the semiconductor manufacturing industry. We have:
Standalone, fully automated systems for high-volume semiconductor manufacturing process control;
Integrated systems incorporated onto semiconductor and solar PV processing systems that provide real-time measurements and feedback to improve process control and increase total system productivity; and
Standalone, manual and semi-automated systems used to monitor material characteristics of various silicon and compound semiconductor devices and substrates.
We believe that there are numerous characteristics of the semiconductor, solar PV, high-brightness LED and other component manufacturing markets that drive a growing need for process control metrology. As films and film materials become thinner and more exotic, along with more demanding critical dimension control and overlay requirements, advanced process control metrology will continue to grow in importance, especially as wafers become more expensive to manufacture. We expect these factors will continue to drive the demand for our advanced standalone and integrated metrology products. Additionally, customers can deploy our products into their R&D lines to accelerate the process development cycle and enable faster production ramp.
Additional demands for better film uniformity, tighter dimensional and overlay control, tool-to-tool matching and within-tool chamber uniformity is driving the need for integrated process control metrology. TheseIntroduced new tool requirements will drive the need to place metrology inside the processing tools for real-time, integrated, process control metrology, using both feed-forward and feedback of the collected metrology data to control the process equipment.
We have made several strategic business decisions to enable us to further address these metrology trends, including:
Introducing new leading-edge products in every core product line and primary market served;
RestructuringRestructured our business and practices for operational and earnings leverage;
DiversifyingDiversified our product line and served markets through acquisitions, such as ourthe 2006 acquisition of Accent Optical Technologies, Inc. and our; the 2008 acquisition of Tevet Process Control Technologies (Tevet)(“Tevet”), an integrated metrology supplier serving both semiconductor and solar PV industries; and the acquisition of the Unifire™ product line from Zygo Corporation in June 2009;
The continuingContinued development of new integrated measurement technologies for advanced chemical mechanical planarization, or CMP, and photolithographicfabrication processes; and
ResearchingResearched innovative applications of existing technology to new market opportunities within the solar PV, industry.
Demand for our products continues to be driven by the increasing use of multiple thin film technologies by semiconductor manufacturers, and by the increased adoption of both integrated metrology and real-time process control. With feature sizes shrinking below 32 nanometers (nm), there is an increasing need for very tight process tolerances as well as productivity improvements in semiconductor fabrication facilities (fabs). As a result, semiconductor device and wafer manufacturers are investing in process control and metrology systems that improve their manufacturing efficiency by detecting process variations sooner and facilitating rapid diagnosis and corrective action. Our process control and metrology systems measure and characterize the physical dimensions, material composition, optical and electrical characteristics and other critical parameters of semiconductor devices during their fabrication. For the photolithography process, overlay and critical dimension systems provide enhanced control of layer alignment and device dimensions. For lattice engineering applications, metrology systems monitor the physical, optical, electrical and material characteristics of compound semiconductor, strained silicon and silicon-on-insulator (SOI) devices, including composition, crystal structure, layer thickness, dopant concentration, contamination and electron mobility.
Industry Background
Semiconductor Growth
The semiconductor industry continues to be driven by the need for increasingly higher performance chips as well as the need to produce these chips with increased production efficiencies at reduced costs. However, the semiconductor equipment industry is not immune to broader economic factors, and contracted in 2008 as a result of a net decline of 27% in capital spending by the semiconductor industry, down to $46.1 billion according to Gartner/Dataquest. However, we believe that the technology development cycles of our end customers will continue in the longer term, with an increasing focus on productivity and cost of ownership helping to drive demand for our products. Our product line was completely refreshed in 2008 with a focus on key markets for both productivity and advanced technology node metrology, and consequently we believe we are well positioned for future growth as the semiconductor industry recovers and as the markets for solar PVs and HB-LEDs continue to grow.
Semiconductor devices are enabling a wide variety of advanced computing, communications and consumer electronics products such as high-performance computing clusters, engineering workstations, routers, switches, cell phones, digital cameras, portable MP3 players, game consoles, DVD players, high-definition televisions, global positioning systems and flat panel displays. In the past, demand for Internet access, personal computers, telecommunications, and new consumer electronic products and services fueled growth of the semiconductor industry. New display technologies, consumer electronics, automotive electronics and personal electronics will likely continue as the primary drivers in the near-term for the semiconductor industry. We believe that consumer desire for high performance electronics drives technology advancement in semiconductor design and manufacturing and, in turn, promotes the purchasing of capital equipment featuring the latest advances in technology.
5
The two significant factors affecting demand for our semiconductor measurement systems are new construction or refurbishment of semiconductor manufacturing facilities and the increasing complexity of the manufacturing process as a result of the demand for higher performance semiconductor devices and integrated circuits. Demand from our customers in the solar PV, silicon wafer, high-brightness LEDHB-LED, and data storage industries is affected primarily by the increasing complexity of the manufacturing process.industries.
Drive toward Productivity and Control
Increased Use of Integrated Metrology in Manufacturing
We believe that continually rising wafer costs are forcing semiconductor manufacturers to re-evaluate their manufacturing strategies at all levels, from individual process steps to fab-wide process optimization. Many major semiconductor manufacturers are adopting feed-forward and feedback process control of film thickness and critical dimensions, or CDs, based on real-time data from metrology systems. Major benefits of these new metrology strategies are higher manufacturing efficiencies from reduced rework, reduced headcount to perform at the same quality level and increased device performance. Additional benefits include process tool matching and more precise control of the overall manufacturing process. This product line sampling increases with additional mask steps, tighter control requirements and greater process complexity due to ever-shrinking process node requirements, resulting in an escalating need for additional metrology.
Cluster Metrology for High-Throughput Monitoring
Many key process steps require more than one type of measurement, e.g. the need for both critical dimension control and overlay control in certain lithography processing steps. Traditionally, customers buy multiple separate measurement systems for these control steps. The additional time to process data for multiple steps is a significant contributor to total processing time and the drive for greater efficiency results in a need to reduce time and cost associated with process control. Our customers are employing APC (advanced process control) schemes, adding algorithms and increasing the amount of measurement and sampling to enable a greater degree of process control on key steps; however, these improvements on process control typically reduce fab productivity. To complement the APC schemes and enable higher levels of customer control as well as higher productivity, Nanometrics has developed a cluster metrology solution in the Lynx™ platform. The Lynx platform enables our customers to combine the key process monitoring steps onto one system to reduce data latency, reduce fab footprint and reduce process monitoring complexity. Key solutions for overlay, thin film, optical CD (“OCD®”) and others can be enabled for optimizing process monitoring in the various segments of the fab. The modules are also interchangeable with our Integrated Metrology® systems, enabling seamless support for the highest possible productivity.
Adoption of Immersion Lithography and Development of Double Patterning for Critical Photolithographic Layers
In an effort to reduce costs and increase device performance, semiconductor manufacturers are decreasing both the die size and feature size. Both immersion processing and double patterning techniques are being implemented to achieve the requisite device linear dimension and density. The additional rigors of these technologies increase the burden on overlay and registration capability as well as critical dimension monitoring and control. These techniques are shrinking total available process windows faster than the scaling predicted by Moore’s Law, resulting in the need for additional metrology and process control for both overlay and OCD systems.
Drive toward In-Device Metrology
For many years, semiconductor manufacturers have sought to improve performance by exerting additional levels of control on key processing steps. Traditionally, the thin film metrology segment has been a key aspect of our customers’ ability to drive process control. With recent changes in device requirements, the thin film market is experiencing a shift to metrology on structures. Nanometrics participates in this market with the deployment of our OCD scatterometry solutions. Our NanoCD™ suite extends our existing integrated and standalone products into these new market segments, giving our customers extended capability and applications for process metrology and control.
As device geometries continue to shrink, key parameters become increasingly difficult to measure and correlate to test structures. This is driving device manufactures to increase levels of understanding on actual device structures. Scatterometry metrology enables the user to directly measure and control key process steps that contribute to device performance and yield. By choosing systems that can measure directly on these structures, without any interaction, NanoCD metrology solutions increase productivity with faster time to results and additional levels of process information.
Nanometrics has deployed scatterometry solutions across key fab segments including traditional photolithography and etch steps, and has extended applications to key process steps in thin film deposition, CMP, and diffusion applications. Scatterometry technology for process metrology and control is in production for all semiconductor segments including DRAM, Flash, Logic/IDM (integrated device manufacturers) and Foundries, with key insertion points in 45nm and 32nm nodes.
Non-Traditional Market Growth Includes Solar PV and HB-LED Sectors
Growth in the non-traditional semiconductor markets was robust in 2008. According to industry research, market demand for HB-LEDs grew over 10%, driven mostly by the use of LEDs as backlighting in flat panel displays. Growth in the market for solar PVs was over 30%, with even higher growth in the emerging thin film sector. These adjacent markets are served by a broad range of products that are used in research and development for device optimization, and then are ramped into production due to the increasing focus of process control in these sectors. Our primary offerings in this market are photoluminescence systems for HB-LED monitoring (due to the ability to measure directly on customer structures) and FTIR (Fourier-Transform Infrared) systems primarily to measure epitaxial film thickness of SOI wafer substrates. In the solar PV sector we offer Trajectory™ integrated metrology systems for real-time integrated metrology into high-volume production lines.
Nanometrics OfferingsProducts
We offer a complete line of systems to address the broad range of metrology requirements of our customers. Our metrology systems can be categorized as follows:
Standalone, fully automated systems used for high-volume semiconductor manufacturing process control. We offer a broad line of fully automated thin film thickness, critical dimension, defect inspection and overlay measurement systems. These systems remove the dependence on human operators by incorporating reliable wafer handling robots and are designed to meet the speed, measurement, performance and reliability requirements that are essential for today’s semiconductor manufacturing facilities. Each of these measurement systems uses non-destructive, optical techniques to analyze and measure films. Our fully automated metrology product line also includes systems that are used to measure the critical dimensions and overlay registration accuracy of successive layers of semiconductor patterns on wafers in the photolithography process.
Integrated systems used to measure in-process wafers automatically and quickly without having to leave the enclosed wafer processing system. Our integrated metrology systems are compact and monitor a multitude of small test points on the wafer using sophisticated pattern recognition. Our integrated systems can be attached to film deposition, planarization, lithography, etch and other process tools to provide rapid monitoring of films on each wafer immediately before or after processing. Integrated systems can offer customers significantly increased operating efficiency and equipment utilization, lower manufacturing costs and higher throughput, as well as tighter process control wafer to wafer, lot to lot, and tool to tool.
Standalone, manual and semi-automated systems used to monitor material characteristics of various silicon and compound semiconductor devices and substrates. We offer a broad line of manual and semi-automated systems that are used to monitor the physical, optical, electrical and material characteristics of compound semiconductor, strained silicon and SOI devices. These characteristics include composition, crystal structure, layer thickness, dopant concentration, contamination and electron mobility.
7
|
2008 marked a year of several new product introductions and advancements in our core metrology lines.
Our latest IMPULSE™ integrated metrology module is an advanced OCD and thin film measurement system, offering the best example of enabling technology for process control. The compact size and speed of this technology enables the system to be fully integrated into the customer’s process tool, providing a complete, feed-forward and feedback process control solution for wafer-to-wafer closed loop control. By measuring the critical dimensions of developed photoresist, feeding this information back into the process and trimming the resist, the device manufacturer can adjust the final etched dimensions of a silicon gate-etch process, thereby achieving the shortest gate-length and the maximum possible microprocessor speed. In addition, new semiconductor process technologies, such as copper interconnects, require that new measurement technologies be developed in order to keep pace with the latest metrology demands. IMPULSE has the ability to plot copper conductor resistance across the wafer while the wafers are on-board the CMP system, reducing the need for costly and destructive testing. The IMPULSE integrated metrology module also provides a solution to the problem of measuring the remaining oxide film thickness as well as the loss of material over arrays of copper lines during the CMP process with the added capability of detecting residual films remaining after the polishing process. This technology has extended to applications in etch and photolithography processing steps.
Our recently introduced NanoCD Suite was developed to address the ever-demanding requirements of OCD metrology, which has proven to be an important application in the semiconductor manufacturing process. We offer our customers the ability to attach the NanoCD Suite of hardware and software solutions to our standalone and integrated metrology systems. Driven by proprietary analysis software and hardware, each product of the Suite greatly enhances a fab’s capability to drive toward advanced OCD application levels. The NanoCD Suite is composed of key components enabling scalable, fab-wide OCD metrology solutions, including the NanoGen™, NanoMatch™, NanoStation™, NanoDiffract™ and a new NanoGen cluster controller option. The Suite offers industry-proven modeling methods, as well as a next-generation run time engine, comprehensive offline analysis tools, and an intuitive GUI (graphical user interface) for structure definition and modeling. The system enables visualization of complex device structures to enable process control on the most demanding applications across DRAM, Flash, and Logic cell design.
Each component of the NanoCD Suite is designed to take full advantage of the inherent connectivity between Nanometrics’ standalone Atlas XP™ and Atlas-M™ systems for wafer and reticle metrology, and the IMPULSE/9010 integrated metrology systems. When combined with the NanoCD Suite, Nanometrics’ systems have the broadest scatterometry metrology solution for today’s semiconductor fabs.
Our new Lynx platform is the industry’s first compact 300mm cluster metrology platform to enable thin film, OCD and overlay measurements in a single system. The Lynx’s versatility provides for a range of custom configurations, from a streamlined single metrology platform to an expanded, high-productivity, multi-metrology platform. Modules can be easily installed or upgraded to extend system functionality, offering true mix-and-match capability. When deployed in the optimized configuration, our customers can achieve a 50% reduction in time to results for key production monitoring. The system can be scaled to enable high throughput and to reduce burden on overhead systems, further increasing productivity. When combined with the Caliper™, IMPULSE and NanoCD Suite, the Lynx platform enables turnkey solutions for every fab segment including CMP, etch, films, and demanding “double patterning” lithography applications.
Our latest Caliper 300mm overlay metrology system for monitoring microlithography stepper performance provides exceptional throughput and measurement performance required by today’s demanding 45nm overlay control applications. Our Caliper line provides a cost-effective solution for today’s most advanced overlay process technologies, enabling metrology on the industry’s most flexible and capable “mark set,” the Blossom.
To measure and control overlay at the required performance level, our customers place marks or measurement targets which comprise the “mark set” specifically designed for this purpose. The Blossom marks enable customers to balance demands of layout, performance, and process robustness without compromise. Additionally, the micro-Blossom mark extends the technology to enable in-device overlay metrology. The hardware system is optimized with the mark design to provide multi-generation lithography control.
Through our May 2008 acquisition of Tevet, we recently began offering the Trajectory integrated metrology system, which can be incorporated into numerous types of production equipment. The Trajectory technology leverages a fiber coupled design that lends itself to direct integration into both process chambers and interface chambers on various production tools. Applications include metrology for thin film and CVD (chemical vapor deposition) semiconductor production equipment, solar PV thin film metrology and monitoring, as well as emerging silicon ink applications. The Trajectory technology extends our spectroscopic reflectometry leadership position into high-volume process line monitoring. By providing a system that can quickly and cost-effectively monitor 100% of samples within a process tool with actionable metrology results, process engineers can respond promptly to line yield and process excursion events, thereby enabling our customers to continuously improve yields, lower costs and drive further process control improvement.
Technology
market. We believe that our engineering expertise, strategic acquisitions, supplier alliances and short-cycle production strategies enable us to develop and offer advanced process control solutions that address industry trends. By offering common metrology platforms that can be configured with a variety of measurement technologies, our customers can specify high-performance systems not easily offered by other suppliers as well as configure a system for a specific application as a cost saving measure.
Spectroscopic Reflectometry. We pioneered the use of micro-spot spectroscopic reflectometry for semiconductor film metrology in the late 1970s. Reflectometry is the measurement of reflected light. Spectroscopic reflectometry uses multiple wavelengths (colors) of light to obtain an array of data for analysis of film thickness and other film parameters. Today’s semiconductor manufacturers still depend on spectroscopic reflectometry for most film metrology applications. For film metrology, a wavelength spectrum in the visible region is commonly used. Light reflected from the surfaces of the film and the substrate is analyzed using computers and measurement algorithms. The analysis yields thickness information and other parameters without contacting or destroying the film. In the mid-1980s, we introduced a DUV reflectometer for material analysis. In 1991, we were awarded a patent for the determination of absolute reflectance in the ultraviolet region. This technology provides enhanced measurement performance for thinner films and for films stacked on top of one another.
Spectroscopic Ellipsometry. Like reflectometry, ellipsometry is a non-contact and non-destructive technique used to analyze and measure films. An ellipsometer analyzes the change in a polarized beam of light after reflection from a film’s surface and interface. Our systems are spectroscopic, providing ellipsometric data at many different wavelengths. Spectroscopic ellipsometry provides a wealth of information about a film, yielding very accurate and reliable measurements. In general, ellipsometers are used for thin films and complex film stacks, whereas reflectometers are used for thicker films and stacks.
Optical Critical Dimension Technology. Our OCD technology is a critical dimension measurement technology that is used to precisely determine the dimensions on the semiconductor wafer that directly control the resulting performance of the integrated circuit devices. Our non-destructive, scatterometry OCD measurement technology has been applied to 65nm and 45nm manufacturing technology and can be extended below 32nm for future requirements in both photolithography and etch applications. OCD combines non-contact optical technology with extremely powerful data analysis software to provide highly accurate measurement results for line width, height and sidewall angles. This technology is available in both standalone and integrated platforms.
9
Overlay Registration. Overlay registration refers to the relative alignment of two layers in the thin film photolithographic process. Our microscope-based imaging measurement technology utilizes a high magnification, low distortion optical system combined with proprietary software algorithms to numerically quantify the alignment. Customers use our overlay systems to measure vertical alignment of the layers on silicon wafers and MEMS structures.
Photoluminescence Mapping Technology. Our room-temperature photoluminescence imaging and mapping technology is used to detect metallic contamination such as copper, iron and heavy metals which create point defects (e.g. interstitial atoms, substitutional atoms, and precipitates), and line defects such as threading dislocations, misfit dislocations, pile ups, slip and stacking faults. Contamination at this level is common in silicon wafer processing and may result from multiple causes including cross contamination of metals during wafer handling, contamination from deposition tools, contamination after maintenance and incomplete cleaning of reclaimed wafers.
Fourier-Transform Infrared (FTIR) Spectroscopy Technology. Silicon producers around the world use our FTIR tools for the certification of silicon epitaxial, or epi, thickness in blanket epi layers, buried layer epi films and SOI epi films. The tools are also used for the precise measurement of interstitial oxygen and substitutional carbon in silicon substrates. Semiconductor device manufacturers use these FTIR systems for thin film metrology. BPSG (borophosphosilicate) films can be analyzed for the concentrations of boron and phosphorus; atomic hydrogen content in silicon nitride and silicon oxynitride can be estimated; low-K films can be characterized, such as fluorine content in FSG (fluorinated silicon oxide) films and carbon content in SiOC and SiCN films. The FTIR tools provide a rapid, non-contact method for the thin film metrology. The automated FTIR tools also provide full support for the factory automation needs of the device manufacturing community.
Lattice Metrology Technologies. We supply a wide array of lattice engineering metrology systems to semiconductor device and silicon wafer manufacturers. These products address specific yield challenges that arise when device and wafer manufacturers use advanced materials such as compound semiconductors or modify the lattice, or basic crystal structure of pure silicon, in order to achieve higher device performance characteristics.
NanoDiffract Software. Our NanoCD Suite is designed around our proprietary NanoDiffract software and was developed in order to optimize the capability and connectivity of Nanometrics’ Atlas and 9010 systems for OCD metrology. Our NanoDiffract software incorporates industry-proven modeling methods, real-time regression capability and comprehensive analysis tools, as well as a comprehensive GUI and input structure for true multi-variant modeling. The capabilities of our NanoDiffract software are delivered in intuitive and easy to deploy hardware form factors.
Products
Our products include thin film, optical critical dimension (OCD), overlay dimension, FTIR and photoluminescence (PL) metrology systems. Our measurement systems use microscope-based, non-contact spectroscopic reflectometry (SR), and some of our systems provide complementary scatterometry, spectroscopic ellipsometry (SE) and FTIR to measure the thickness and optical characteristics of films on a variety of substrates. We have a line of PL products for measuring properties of traditional silicon and compound semiconductor devices. In addition, we offer both integrated and standalone OCD metrology systems to measure critical dimensions of patterns on semiconductor wafers. We also manufacture a line of optical overlay registration systems that are used to determine the alignment accuracy of successive layers of semiconductor patterns on wafers in the photolithography process. Our products can be divided into three principle groups: standalone systems, integrated systems and materials characterization systems. We also introduced a new system platform in 2008, the Lynx. See Note 20 of the Notes to Consolidated Financial Statements for an analysis of our net revenues by principal product group.
|
| |||||||
| ||||||||
| ||||||||
| ||||||||
| ||||||||
| ||||||||
| ||||||||
| ||||||||
| ||||||||
| ||||||||
| ||||||||
| ||||||||
| ||||||||
| ||||||||
| ||||||||
| ||||||||
|
| |||||||
|
| |||||||
| ||||||||
| ||||||||
11
System Platform
Nanometrics Lynx Metrology Platform
The Lynx is the industry’s first compact 300mm cluster metrology platform to enable thin film, OCD and overlay measurements in a single system. The Lynx’s versatility provides for a range of custom configurations, from a streamlined single metrology platform to an expanded, high-productivity, multi-metrology platform. Modules can be easily installed or upgraded to extend system capabilities. Combinations of Nanometrics’ technology on the Lynx enable the highest possible throughput as well as improved process control opportunities by combining appropriate technologies for various semiconductor manufacturing steps. The Lynx enables extendibility to future nodes as well as adaptability in the configuration to suit changing metrology demands.
Automated Standalone Systems
Our standalone systems are made up of manual, semi-automated and fully automated metrology systems which are employed in high-volume and low-volume production environments. The automated systems incorporate automated material handling interface options for a variety of fab automation environments and implement multiple measurement technologies for a broad range of substrate sizes. The manual and semi-automated systems are used primarily in engineering labs where automated handling and high throughput are not required. Our automated systems range in price from approximately $200,000 to over $1,300,000, depending on substrate sizes, measurement technologies, material handling interfaces and other options. The manual and semi-automated systems range in price from $50,000 up to $1,000,000 depending upon configurations and options.
Atlas/Atlas XP and Atlas-M
The Nanometrics Atlas® XP/Atlas XP+ and Atlas-Mrepresent our line of high-performance metrology system combines up to four metrology technologies on a single platform,systems providing increased measurement capabilities in a small footprint design for reduced cost of ownership The combinations of technology include polarized, normal incidence spectroscopic ellipsometry for linewidth profile and critical dimensions, spectroscopic reflectometry for films and film stacks, ultra-violet (UV) and deep UV spectroscopic ellipsometry for ultra-thin films and film characterization, and film stress/wafer bow measurements. The Atlas offers high-accuracy, high-precision metrology for wafer characterization and can be configured for 150mm to 300mm wafer sizes or 6-inch masks and reticles. The Altas XP is the newest product line in the Atlas family and addresses thin film, and OCD for the 45nm and 32nm nodes currently in production and development, respectively. The Atlas-M further extends the versatility of this 300mm platform to provide fully-automated mask and reticle measurements. The systems are compatible with our NanoNetwafer stress, optical critical dimension (“OCD”®), an optionaland diffraction-based overlay (“DBO”) for transistor and interconnect metrology applications. The OCD technology is supported by ourNanoCD™ suite of solutions including ourNanoDiffract® software packageandNanoGen® scalable computing engine that enables users to synchronize standalonevisualization, modeling, and integrated metrology systems for remote process setup and monitoring.
analysis of complex structures. TheCaliper Mosaic
Our Caliper products represent our most advanced™ provides overlay metrology solutions, providing the most cost-effective solutionsolutions for today’s advanced 300mm overlay process technologies. Our most recently introduced Calipertechnologies, available on ourLynx™ platform. TheUnifire™ system extendsenables users to measure multiple parameters at any given process step in the production-proven élan™ platform with a refined optical metrology head coupled with advanced focusingpackaging process flow for critical dimension, overlay, and algorithms to provide increased productivity in both measurement (MAM) time and total measurement uncertainty (TMU).topography applications.
We continue to offer automated products for 200mm factories running nominally at 90nm nodes and above, as well as systems supporting micro-electrical mechanical systems (“MEMS”). OurQ240AT and IVS-185
The Q240ATis a 200mm overlay metrology system incorporating the same measurement technology as the Caliper, élan for advanced overlay measurement.extending the technology capability of our customers’ existing factories. The IVS-185 200mmIVS®-185 system supports critical dimension and overlay measurements for both semiconductor, MEMS, and MEMSHB-LED manufacturing. The IVS-185 delivers unsurpassed measurement performance and reliability with the lowest possible cost-of-ownership supporting technologies produced on 2”-8” specialized substrates.
NanoSpec® 9100
The NanoSpec 9100 standalone, automated thin film measurement system is capable of handling wafers ranging in size from 75 to 200 millimeters in diameter. diameter, and is used in all segments of semiconductor manufacturing, including data storage head manufacturing.
System Platform
The 9100 can be configured with a deep ultraviolet, or DUV,Lynxcluster metrology platform enables improved cost of ownership to near infrared spectroscopic ellipsometerour customers by combining ourCaliper Mosaic andIMPULSE® metrology systems in configurations to provide high throughput, reduced footprint systems for ultra-thin, multipleleading 300mm wafer metrology applications including OCD, DBO, overlay, and thin film stack and DUV lithography measurement applications. Other 9100 options include a standard mechanical interface with mini-environment enclosures for use in ultra-clean manufacturing facilities. The 9100 uses technologies from the integrated film thickness systems to allow easy transfer of measurement recipes between the integrated and standalone film metrology systems.process control.
Integrated Systems
Our integrated metrology (“IM”) systems are installed insidedirectly onto wafer processing equipment to provide near real-time measurements for improvingimproved process control and increasingmaximum throughput. Our integratedIM systems are available for wafer sizes up to 300 millimeters and offer DUV spectroscopic reflectometry and/or critical dimension measurement technologies. Our integrated metrology systems range in price from approximately $80,000 to $500,000 depending on features and technology and are sold directly to end customers and through our OEM channels.
The9000 Series Integrated Metrology PlatformIMPULSE
The 9000 Series of products are ultra-compact measurement systems designed for integration into semiconductor wafer processing equipment. The systems are primarily used for thickness control in CVD processing steps. In its basic configuration, the 9000series is equipped with visible wavelength spectroscopic reflectometry. Other products in the Series, which include solutions for both 200mm and 300mm wafer sizes, can be extended into deep ultraviolet wavelengths.
9010 Series Integrated Metrology Platform
The 9010b is the first integrated metrology tool to combine two measurement technologies on a single platform. The 9010b incorporates both ultra violet OCD spectroscopic ellipsometry and deep ultra violet (DUV) spectroscopic reflectometry. The 9010b provides thin film and film stack thickness measurements on pads as well as oxide, nitride and trench profile measurements on arrays in a single tool. The combined technologies provide a complete measurement solution over the entire range of measurement requirements for each process step. This complete metrology capability can be utilized across a number of lithography, deposition, copper planarization, dielectric planarization, poly-Si etch and dielectric etch applications.
The 9010b is also available as a SEMI BOLTS compatible, 300 millimeter based system that incorporates all the features of the integrated configuration of the 9010b. By conforming to the industry standard BOLTS mounting system, the 9010b BOLTS configuration is interchangeable with industry conforming load ports for simplified mechanical integration.
The 9010Tx is an advanced, integratedour latest metrology platform for OCD, measurementDBO, and profiling. The 9010Tx system is designed to be incorporated into semiconductor equipment requiring leading-edge CD metrology for semiconductor applications. The 9010Tx offers an extended wavelength range down to 210nm, extending the CD measurement capabilities for line width structures down to 45nm. The system also incorporates the UVthin film thickness function, and its improved design offers a faster, more cost effective integrated CD measurement solution with increased throughput. The system is also offered as the 9010Tx-BOLTS, in the SEMI, BOLTS configuration for easy installation directly onto the OEM process equipment’s standard 300mm loadport.
The 9010M utilizes our production-proven OCD metrology and enables non-destructive, real-time measurementhas been successfully qualified on numerous OEM platforms. Our90x0series is qualified for OEM and profiling of critical features on photomasksdirect sales supporting thin film and reticles without the limitationsOCD applications. OurNanoCDis sold in conjunction with ourIMPULSE and drawbacks associated with critical dimension scanning electron microscope, or CD-SEM, metrology.
13
Current CD-SEM technology appears to be reaching its theoretical limits for making critical dimension measurements on these substrates. Photoresist-on-chrome-on-glass features found on reticles and masks suffer severe charging during CD-SEM metrology making critical dimension measurements impossible. OCD is a non-destructive technology that provides information not available from CD-SEM measurements.
IMPULSE Series Integrated Metrology Platform90x0
systems. The IMPULSE is our newest metrology platform for OCD measurement and profiling as well as employing a DUV channel for film thickness. The combined technologies provide a complete measurement solution over the entire range of measurement requirements for each process step. This complete metrology capability can be utilized across a number of lithography, deposition, copper planarization, dielectric planarization, poly-Si etch and dielectric etch applications. The platform enables higher performance and higher reliability for both Integrated applications as well as on the Lynx platform as a standalone tool enabling cluster metrology for high throughput. IMPULSE leverages the success of the 9010 platform with improved process control beyond 45nm and higher throughput for lower cost of ownership.
Trajectory Integrated Metrology System
Our Trajectory integrated metrology™ system provides a robust and cost-effective solution for in-line measurement of absorber layer and transparent conducting oxide (TCO) layer thicknesslayers in thin film thickness and composition in solar cells where absorber layer thickness is directly relayed to cell efficiency. Trajectory systems are also qualified on several leading CVD equipment systems giving ultra fast measurements required on high throughput advanced CVD tools.and semiconductor applications.
Materials Characterization Systems
We also offer a broad line of manual and semi-automated thin film thickness, critical dimension, defect inspection and composition measurement systems. Each of these measurement systems uses non-destructive, optical techniques to analyze and measure films. TheseThe Materials Characterization products also include systems that are used to monitor the physical, optical, electrical and material characteristics of HB-LED, compound semiconductor, strained silicon and silicon-on-insulator (SOI)(“SOI”) devices, including composition, crystal structure, layer thickness, dopant concentration, contamination and electron mobility. Tabletop systems are used to manually or semi-automatically measure thin films in engineering and low-volume production environments. We have been a pioneer and leading supplier of tabletop thin film thickness measurement systems, which are used primarily in low-volume production environments such as failure analysis and engineering labs. Our tabletop models have multiple capabilities and several available configurations, depending on wafer handling, range of films to be measured, uniformity mapping and other customer needs.
OurSiPHER™VerteX
™ is a photoluminescence (“PL”) mapping system designed for high-volume compound semiconductor metrology applications. TheRPMBlue™ is our latest PL mapping system designed specifically for the HB-LED segment. We support Fourier-Transform Infrared (“FTIR”) automated and manual systems in theQS2200/3300andQS1200respectively. The FTIR systems are spectrometers designed for non-destructive wafer analysis for various applications. TheSiPHER is a fully automated photoluminescence metrology system for the detection and mapping of 300mm substrate defects and metallic contamination. SiPHER detects and quantifies near-surface and bulk metallic contamination in both bulk silicon and silicon epitaxial layers.
TheVerteX™NanoSpec
The VerteX is a rapid photoluminescence mapping system designed for high-volume compound semiconductor metrology applications such as volume LED manufacturing. The new VerteX with power density control provides improved matching to electrical test data, improved tool matching and improved reproducibility and repeatability. It also provides predictive metrics for the manufacturing process. In the caseline of high-brightness LED processing, VerteX enables accurate predictive processing metrics of green, blue and UV LED emission wavelengths atproducts includes the wafer level, a capability that we believe is unmatched in the industry.
QS2200/3300
The QS2200™ and QS3300™ are Fourier-Transform Infra-Red spectrometers designed for non-destructive wafer analysis. These systems are used for the characterization and measurement of semiconductor substrates as well as in device manufacturing. The QS2200 model is available in two configurations; an automated 200mm system with two open cassettes and an automated system with one SMIF indexer and one open cassette for high-volume wafer manufacturing. The QS2200 series incorporates a universal stage, which adjusts automatically to different wafer sizes including 100, 125, 150 and 200mm. The QS3300 is a production version FTIR system which supports high-volume 300mm manufacturing for various applications: boron and phosphorus concentration in BPSG films, atomic hydrogen concentrations in silicon nitride passivation layers, fluorine in FSG films, epitaxial thickness, concentrations of interstitial oxygen and substitutional carbon in silicon.
NanoSpec 3000 and 6100
The NanoSpec tabletop systems provide a broad range ofsupporting thin film measurement solutions at a lower entry price point. The NanoSpec 3000 is a basic, manual system while the 6100 models feature semi-automatic wafer handling or staging.
QS1200™across all segments in both low volume production and research applications.
The QS1200 incorporates allOur metrology systems can be categorized as follows: See Note 21 of the measurement capability found in the semi-automated and fully-automated FTIR metrology systems in a table-top configuration. The QS1200 FTIR metrology tool is used primarilyNotes to Consolidated Financial Statements for dopant monitoring, epi thickness measurement, and other epitaxial substrate applications. The QS1200 is specifically designed for advanced semiconductor fabs performing material characterization in silicon growing and device manufacturing areas. It provides a new levelan analysis of integration of the FTIR technique utilizing proven optical technology for SEMI standard wafers of 100, 125, 150, 200, and 300mm diameter as well as custom substrates up to 2mm in thickness.our net revenues by principal product group.
System | Market | Applications | ||
System Platform | ||||
| Lynx | Semiconductor | Platform | ||
| OCD Analysis | ||||
| NanoDiffract | Semiconductor | OCD | ||
| NanoGen | Semiconductor | OCD | ||
| Automated Standalone Systems | ||||
| AtlasXP/Atlas XP+/ AtlasXPM | Semiconductor | Film Thickness, Film Stress, CD | ||
| Caliper Mosaic | Semiconductor | Overlay | ||
| Unifire | Semiconductor | Film Thickness, Overlay, CD, and Advanced Packaging Applications | ||
| Q240AT | Semiconductor | Overlay | ||
| IVS-185 | Semiconductor, MEMS | Overlay, CD | ||
| NanoSpec 9100 | Semiconductor | Film Thickness | ||
| Integrated Systems | ||||
| IMPULSE | Semiconductor | Film Thickness, CD | ||
| 9010 Series | Semiconductor | Film Thickness, CD | ||
| 9000 Series | Semiconductor | Film Thickness | ||
| Trajectory | Semiconductor, Solar | Film Thickness, Composition | ||
| Materials Characterization Instruments | ||||
| RPMBlue | HB-LED | Epitaxial Layer Properties | ||
| VerteX | Compound Semiconductor, Solar PV, HB-LED | Epitaxial Layer Properties | ||
| QS1200 | Substrate Semiconductor, Solar PV | Substrate Properties, Film Composition and Thickness | ||
| QS2200/3300 | Substrate Semiconductor | Substrate Properties, Film Composition | ||
| SiPHER | Substrate Semiconductor | Substrate Defects, Metallic Contamination | ||
| NanoSpec 3000 | Semiconductor | Film Thickness (Tabletop) | ||
| NanoSpec 6100 | Semiconductor | Film Thickness (Tabletop) | ||
Customers
We sell our metrology systems worldwide to many of the major semiconductor manufacturers and equipment suppliers, as well as to producers of HB-LEDs, solar PV panels, data storage devices, silicon wafers and photomasks. The majority of our systems are sold to customers located in Asia and the United States. Two customers, Samsung Electronics Co. Ltd., and Toshiba Semiconductor,Intel Corporation, represented 16.1%33.4% and 11.0%10.4% of our total net revenues in 2008,2009, respectively. See Note 1920 of the Notes to Consolidated Financial Statements for information regarding our major customers.
The following is a list of our top 25 customers (categorized by type of customer), based on revenues, during 2008.
|
|
| ||
|
|
| ||
|
|
| ||
|
|
| ||
|
|
| ||
|
|
| ||
|
| |||
|
| |||
|
| |||
| ||||
| ||||
| ||||
| ||||
15
Sales and Marketing
We believe that the capability for direct sales and support is beneficial for developing and maintaining close customer relationships and for rapidly responding to changing customer requirements. We provide direct sales, service and application support locally from our corporate office in California for customersworldwide offices located in the United States. We also have a direct sales presence inUSA, South Korea, Japan, Europe, Taiwan, China and Singapore. We useSingapore and work with selected sales representatives in the United StatesUSA and other countries. We intend to continue monitoring our network, our existing and new offices, as well as developing additional distribution relationships when needed. We believe that growing our international distribution network can enhance our competitive position. We maintain a direct sales force of technically sophisticatedexperienced sales engineers who are knowledgeable in the use of metrology systems generally and with the unique features and advantages of our specific products. OurSupported by our technical applications team, our sales engineers are supported by applications scientists. Together, these highly trained individualsand support teams work closely with our customers to offer cost-effective solutions to complex measurement and process problems which our customers face.problems.
Direct exports of our metrology systems to our foreign customers and shipments to our subsidiaries require general export licenses. See Note 2021 of the Notes to Consolidated Financial Statements for information regarding total net revenues and long-lived assets of our foreign operations. See Item 1A, “Risk Factors” for information regarding risks related to our foreign operations.
In addition to our direct sales force, we address broader markets through various sales channels including established distributors and representatives within the United States, Europe, Taiwan, China, Japan and Russia.
Net revenues from customers located in the United States and in foreign countries, as a percentage of total net revenues, were as follows:
| 2008 | 2007 | 2006 | 2009 | 2008 | 2007 | |||||||||||||
South Korea | 39.1 | % | 20.5 | % | 13.8 | % | ||||||||||||
United States | 29.5 | % | 31.8 | % | 35.0 | % | 29.7 | % | 29.5 | % | 31.8 | % | ||||||
Japan | 28.0 | % | 27.8 | % | 17.4 | % | 14.7 | % | 28.0 | % | 27.8 | % | ||||||
South Korea | 20.5 | % | 13.8 | % | 26.3 | % | ||||||||||||
Taiwan | 5.8 | % | 7.8 | % | 5.4 | % | 4.7 | % | 5.8 | % | 7.8 | % | ||||||
China | 7.3 | % | 7.3 | % | 6.2 | % | 4.1 | % | 7.3 | % | 7.3 | % | ||||||
Europe | 5.2 | % | 10.0 | % | 7.2 | % | 5.0 | % | 5.2 | % | 10.0 | % | ||||||
All other countries | 3.7 | % | 1.5 | % | 2.5 | % | 2.7 | % | 3.7 | % | 1.5 | % | ||||||
In order to raise market awareness of our products, we advertise in trade publications, distribute promotional materials, publish technical articles, conduct marketing programs, issue corporate press releases and drive public relations through industry trade shows and various investor relations events. We also maintain a website at www.nanometrics.com.
Customer Service and Support
We believe that customer service and technical support for our measurement systems are important factors to distinguish us from our competitors and are essential to building and maintaining close, long-term relationships with our customers. We provide support of our measurement systems to our customers with factory technical support and globally deployed field service offices. The factory technical support operations provide both OEM and end-user customers with telephonic technical support access, direct training programs, operating manuals and other technical support information. Weinformation to enable effective use of our demonstration equipment for training programs,metrology and measurement instruments and systems. Our software is sold as well as foran adjunction to our salesmeasurement systems hardware, and marketing efforts. Our technical training department has metrologyis supported through the systems that are used for customer training.groups. We coordinate warranty and post-warranty field service and spare parts support from our corporate headquarters in Milpitas, California. We also have field service operations based in various locations throughout the United States and Europe. In Asia, service is provided by direct offices in Japan, South Korea, Taiwan and China.
We provide a standard one-year warranty on parts and labor for all of products. Service revenue, including sales of replacement parts, represented 26.0%35.9%, 13.8%,26.0% and 16.3%13.8% of total net revenues in 2009, 2008 and 2007, and 2006, respectively.
Backlog
As of January 2, 2010 and December 27, 2008, the end of fiscal year 2009 and December 29, 2007,2008, respectively, our backlog was $4.4$8.1 million and $14.0$4.4 million, respectively. Backlog includes orders for products that we expect to ship within 12 months. Orders from our customers are subject to cancellation or delay by the customer without penalty. Historically, order cancellations and order rescheduling have not been significant, with the number of incidents of rescheduled orders increasing somewhat in 2008 relative to historical levels.significant. However, orders presently in backlog could be canceled or rescheduled. As only a portion of our revenues for any fiscal quarter represent systems in backlog, we do not believe that backlog is necessarily an accurate indication of our future revenues or financial performance.
Competition
We haveoffer different products for the differentvarious sectors of semiconductor manufacturing, and several of our products extend across the same processing flow. However, in each of these markets, we have multiple competitors. In every segment in which we participate, the global semiconductor equipment industry is intensely competitive, driven by rapid technological adoption cycles. Our ability to compete depends upon our ability to continually improve our products and services, and our ability to develop new products and applications that meet constantly evolving customer requirements.
We believe that our competitive position in each of our markets is based on the ability of our products and services to address customer requirements related to numerous competitive factors. Competitive selections are based on many factors includinginvolving technological innovation, productivity, total cost of ownership of the system, including impact on end of line yield, price, product performance and throughput capability, quality, reliability and customer support.
In the standalone segment, our principal competitor is KLA-Tencor.competitors are KLA-Tencor and Nova Measuring Instruments. Our principal competitor in the integrated metrology segment is Nova Measuring Instruments. OurInstruments, while the HB-LED and solar PV markets are served by numerous competitors with no onesingle competitor establishing a majority position.
Manufacturing
In 2008, we consolidated manufacturing to our Milpitas, California facility and contract manufacturers. It is our strategy to outsource all assemblies that do not contain elements that lead to a direct competitive advantage. The majority of our standalone and integrated products are currently manufactured at our Milpitas California facility. To a lesser degree, we also manufacture products at our subsidiary in South Korea. We perform limited subassemblysub-assembly for certain products at our York, England facility. We also use contract manufacturers in China, Israel, Japan and the United States.USA. We combine proprietary measurement technology produced in our facilities with components and subassemblies obtained from outside suppliers. We currently do not expect our manufacturing operations to require us to make any additional major investments in capital equipment.
We have internalized the production of key parts and components. However, certain components, subassemblies and services necessary for the manufacture of our systems are obtained either from a sole supplier or limited group of suppliers. We do not maintain long-term supply agreements with any of our suppliers.
Research and Development
We continue to invest in R&D to ensure that Nanometrics’ products stay in the forefront of current and future market demands. Whether it is for an advancement of current technology, new technology, or the development of a new application in our core or emerging markets, Nanometrics iswe are committed to product excellence and longevity. We have several facilities located worldwide that focus on this objective.
We have extensive proprietary technologyIn 2009, many of the new products that we introduced to the market were adopted by customers in key segments, which we believe indicates that our R&D spending is targeted and expertise in such areas as spectroscopic reflectometry using our patented absolute reflectivity, robust pattern recognitionfocused on appropriate products and complex measurement software algorithms. We continue to add to our intellectual property portfolio, most recently in the areas of critical dimension measurement and integrated metrology. We also have extensive experience in systems integration engineering required to design compact, highly automated systems for advanced clean room environments.technologies.
17
Our research and developmentR&D expenditures for each of the last three fiscal years were as follows:
| Fiscal Year | Fiscal Year | |||||||||||||||||||||||
| 2008 | 2007 | 2006 | 2009 | 2008 | 2007 | |||||||||||||||||||
Research and Development | ||||||||||||||||||||||||
R&D Expenditures (in millions) | $ | 17.1 | $ | 18.6 | $ | 14.3 | $ | 14.7 | $ | 17.1 | $ | 18.6 | ||||||||||||
R&D Expenditures as percentage of revenues | 16.8 | % | 12.7 | % | 14.8 | % | 19.1 | % | 16.8 | % | 12.7 | % | ||||||||||||
Patents and Intellectual Property
Our success depends in large part on the technical innovation of our products and protecting such innovations through a variety of methods. We actively pursue a program of filing patent applications to seek protection of technologically sensitive features of our metrology systems. As of December 27, 2008, we held 86 United States patents with 40 patent applications pending. The patents we own in the United States have expiration dates ranging from 2009 to 2026. We believe that our success will depend to a greater degree upon innovation, technological expertise and our ability to adapt our products to new technology. While we attempt to establish our intellectual property rights through patents and trademarks and protect intellectual property rights through non-disclosure agreements, we may not be able to fully protect our technology, and competitors may be able to develop similar technology independently. Others may obtain patents and assert them against us. In addition, the laws of certain foreign countries may not protect our intellectual property to the same extent as do the laws of the United States. From time to time we receive communications from third parties asserting that our metrology systems may contain design features that are claimed to infringe their proprietary rights. We typically refer such matters to our legal counsel; see Item 3, “Legal Proceedings.”
We have registered the following trademarks with the U.S. Patent and Trademark Office: Nanometrics®, Atlas®, NanoSpec®, Integrated Metrology®, NanoNet®, OCD® and others. Additionally, we use a variety of other trademarks and trade names such as Caliper, Lynx, IMPULSE, NanoCD, NanoGen, NanoMatch, NanoStation, NanoDiffract, VerteX, SiPHER, Trajectory, Q240AT, IVS, the QS series, Accent and the Nanometrics logo. All other brand names, trade names and trademarks mentioned herein are the property of their respective holders. The effect of registering our trademarks is to further protect Nanometrics’ brand and corporate identity.
Environmental Matters
We are subject to a variety of governmental regulations related to the discharge or disposal of toxic, volatile or otherwise hazardous waste. Our compliance with federal, state and local provisions regulating the discharge of materials into the environment, and the remedial actions we have taken with respect to environmental regulations, have not had, and are not expected to have, a material effect on our business, financial condition, results of operations or cash flows.
Employees
At December 27, 2008,January 2, 2010, we employed 465399 persons worldwide with 6545 in manufacturing and manufacturing support, 137116 in customer service, 7264 in applications, 9282 in research and development, 39 in sales and marketing and 6053 in general administration and finance. None of our employees are represented by a union and we have never experienced a work stoppage as a result of union actions. Many of our employees have specialized skills that are of value to us. Our future success will depend in large part upon our ability to attract and retain highly skilled scientific, technical and managerial personnel, who are in great demand in our industry. We consider our employee relations to be good.
Our Executive Officers
The names of our executive officers and their ages, titles and biographies as of December 27, 2008January 2, 2010 are set forth below:
Name | Age | Position | ||
Timothy J. Stultz, Ph.D. | President, Chief Executive Officer and Director | |||
Bruce A. Crawford | Chief Operating Officer | |||
James P. Moniz | 52 | Chief Financial Officer |
Timothy J. Stultz, Ph.D., 61,62, has served as President, Chief Executive Officer and a director since August 2007. From June 2003 to August 2007, Dr. Stultz served as the President and Chief Executive Officer and a member of the board of directors of Imago Scientific Instruments Corporation, a supplier of proprietary 3-D atom probe microscopes to the research materials and microelectronics industries. Prior to Imago, Dr. Stultz served as President and Chief Executive Officer for ThauMDx, a developer of diagnostic systems and technologies for the analysis of biomolecules, drugs and chemicals. Dr. Stultz received his B.S., M.S. and Ph.D. in Materials Science and Engineering from Stanford UniversityUniversity.
Bruce A. Crawford, 56,57, has served as our Chief Operating Officer since July 2006 and was Chief Financial Officer on an interim basis from September 2008 until February 2009.2006. From July 2005 to July 2006, Mr. Crawford served as President and Chief Operating Officer of Accent Optical Technologies, Inc., a supplier of process control and metrology systems to the global semiconductor manufacturing industry, which we acquired in July 2006. From February 2003 to July 2005, Mr. Crawford served as Accent Optical’s Chief Operating Officer and Executive Vice President and from October 2000 to February 2003, he served as Vice President of Worldwide Operations. Mr. Crawford holds an A.S. degree from De Anza College.
Subsequent to our fiscal year end, James P. Moniz, 51,52, was appointed as Chief Financial Officer (and our principal accounting officer) on February 18, 2009. Prior to joining the Company, Mr. Moniz served as Chief Financial Officer of Photon Dynamics, Inc., a global supplier of flat panel display test equipment, from April 2008 until October 2008. From October 2000 until February 2008, Mr. Moniz was Chief Financial Officer, Treasurer and Assistant Secretary of Nextest Systems Corporation. Mr. Moniz holds bachelor’sbachelor degrees in both Accounting and Marketing, as well as an MBA in Finance, from San Jose State University.
| ITEM 1A. | RISK FACTORS |
In addition to the other information contained in this Annual Report on Form 10-K, we have identified the following risks and uncertainties that may have a material adverse affecteffect on our business, financial condition or results of operations. Investors should carefully consider the risks described below before making an investment decision. The risks described below are not the only ones we face. Additional risks not presently known to us or that we currently believe are immaterial may also impair our business operations. Our business could be harmed by any of these risks. The trading price of our common stock could decline due to any of these risks and investors may lose all or part of their investment. This section should be read in conjunction with the Consolidated Financial Statements and Notes thereto, and Management’s Discussion and Analysis of Financial Condition and Results of Operations contained in this Form 10-K.
The risks and uncertainties described below are not the only ones that we face. If any of the following risks actually occurs, our business, financial condition or operating results could be harmed. In such case, the trading price of our common stock could decline, and you could lose all or part of your investment.
We are exposedThe current severe slowing in the general economy and in the semiconductor industry have caused us recent losses and reductions in available cash, and may continue to risks associated with the ongoingnegatively impact our financial crisis and weakening global economy.performance.
The recent severe tightening of the credit markets, turmoilcurrent recession in the financial markets and weakening global economy are contributing to slowdownsand the current downturn in the industriessemiconductor industry have severely impacted and could further impact customer demand for our products and our financial performance. The degree of this impact will depend on a number of factors, including whether the U.S. economy and the global economy continue a prolonged recession. Demand for semiconductor equipment depends on consumer spending. Economic uncertainty may lead to a decrease in which we operate. The slowdowns are expectedconsumer spending and may cause certain customers to
19
worsen if these economic conditions are prolonged cancel or deteriorate further.delay placing orders. If we are unable to timely and appropriately adapt to changes resulting from the difficult economic environment, our business, financial condition and results of operations will be adversely affected, and we may be required to raise additional funds through public or private equity or debt financings. In that event, financing may not be available or we could be forced to obtain financing on terms that are not favorable to us and, in the case of an equity or convertible debt financing, which may result in dilution to our stockholders.
We may also experience supplier or customer issues as a result of current adverse macroeconomic conditions. If our customers have difficulties in obtaining capital or financing, this could result in lower sales. Customers with liquidity issues could also result in an increase in bad debt expense. These conditions could also affect our key suppliers, which could affect their ability to supply parts and result in delays of our customer shipments. These conditions make it difficult for us to accurately predict our business.
Because of the negative effects of the current recession, we may have to take further actions to reduce costs, which could reduce our ability to significantly invest in research and development at levels we believe are necessary. If we are unable to effectively align our cost structure with prevailing market conditions, we will experience additional losses and additional reductions in our cash and equivalents.
Our largest customers account for a substantial portion of our revenue, and our revenue would materially decline if one or more of these customers were to purchase significantly fewer of our systems.
Historically, a significant portion of our revenues in each quarter and each year has been derived from sales to relatively few customers, and we expect this trend to continue. There are only a limited number of large companies
operating in the semiconductor industry. Accordingly, we expect that we will continue to depend on a small number of large customers for a significant portion of our revenues for the foreseeable future. If our current relationships with our large customers are impaired, or if we are unable to develop similar collaborative relationships with important customers in the future, our-revenuesour revenues could significantly decline.
OurSome of our current and potential competitors have significantly greater resources than we do, and increased competition could impair sales of our products.
We operate in the highly competitive semiconductor industry and face competition from a number of companies, many of which have greater financial, engineering, manufacturing, marketing and customer support resources than we do. As a result, our competitors may be able to respond more quickly to new or emerging technologies or market developments by devoting greater resources to the development, promotion and sale of products, which could impair sales of our products. Moreover, there has been merger and acquisition activity among our competitors and potential competitors. These transactions by our competitors and potential competitors may provide them with a competitive advantage over us by enabling them to rapidly expand their product offerings and service capabilities to meet a broader range of customer needs. Many of our customers and potential customers in the semiconductor industry are large companies that require global support and service for their metrology systems. Some of our larger or more geographically diverse competitors might be better equipped to provide this global support.
We depend on OEM suppliers for sales of our integrated metrology systems, and the loss of our OEM suppliers as customers could harm our business.
We believe that sales of integrated metrology systems will continue to be an important source of our revenues. Sales of our integrated metrology systems depend upon the ability of OEMs to sell semiconductor manufacturing equipment products that include our metrology systems as components. If our OEMsOEM customers are unable to sell such products, or if they choose to focus their attention on products that do not integrate our systems, our business could suffer. If we were to lose our OEMs asOEM customers for any reason, our ability to realize sales from integrated metrology systems would be diminished, which would harm our business.
We obtain some of the components and subassemblies included in our systems from a single source or a limited group of suppliers, and the partial or complete loss of one of these suppliers could cause production delays and significant loss of revenue.
We rely on outside vendors to manufacture many components and subassemblies. Certain components, subassemblies and services necessary for the manufacture of our systems are obtained from a sole supplier or a limited group of suppliers. We do not maintain any long-term supply agreements with any of our suppliers. We have entered into arrangements with J.A. Woolam Co., Inc. for the purchase of the spectroscopic ellipsometer component incorporated ininto our advanced measurement systems. We also have supply agreements with MPA and
Spectral Systems, and subcontract manufacturing agreements with Fox Semiconductor, IFAT and Toho Technologies. In June 2009, we signed a supply agreement with Zygo Corporation to supply OEM interferometer sensors for incorporation into the Unifire™ line of products as well as Nanometrics’ family of automated metrology systems. Our reliance on a sole or a limited group of suppliers involves several risks, including the following:
we may be unable to obtain an adequate supply of required components;
we have reduced control over pricing and the timely delivery of components and subassemblies; and
our suppliers may be unable to develop technologically advanced products to support our growth and development of new systems.
Some of our suppliers have relatively limited financial and other resources. Because the manufacturing of certain of these components and subassemblies involves extremely complex processes and requires long lead times, we may experience delays or shortages caused by our suppliers. If we were forced to seek alternative sources of supply or to manufacture such components or subassemblies internally, we could be forced to redesign our systems, which could increase our cost structure, cause production delays and prevent us from shipping our systems to customers on a timely basis. Any inability to obtain adequate deliveries from our suppliers, or any other circumstance that would restrict our ability to ship our products, could damage relationships with current and prospective customers, harm our business and result in significant loss of revenue.
Our success depends on the performance of our senior management and on our ability to identify, hire and retain key management personnel.
Our Chief Executive Officer joined the Company in August 2007 and in September 2008, our former Chief Financial Officer and Vice President, Administration, who joined us in November 2007, was replaced, on an interim basis, by Bruce Crawford, our Chief Operating Officer. Our former Chief Accounting Officer also resigned in December 2008. James P. Moniz was appointed as Chief Financial Officer (and our principal accounting officer) on February 18, 2009. Although we have employment agreements with certain key members of our senior management team, including Messrs. Stultz, Crawford and Moniz, these individuals or other key employees may still leave us. We do not have key person life insurance on any of our executives. In addition, to support our future growth, we will need to attract and retain additional qualified employees. Competition for such personnel in our industry is intense, and we may not be successful in attracting and retaining qualified employees. If we fail to attract, motivate and retain qualified senior management personnel, our business could be harmed and our ability to implement our strategy could be compromised.compromised.
Restructuring of our operations may disrupt our business and adversely affect our financial condition and operating results.
Since 2007, we have taken steps, including reductions in force, facility closures, and internal reorganizations to reduce the size and cost of our operations and to better match our resources with our market opportunities. We may take similar steps in the future to improve efficiency and match our resources with market opportunities, and as a result of such actions, we may incur restructuring expenses. In the first and third quarters of 2008, we undertook a restructuring that involved a reduction of our global workforce by approximately 30 and 34 employees, respectively, which action caused us to record restructuring and reorganization charges of $870,000$0.9 million and $655,000,$0.6 million, respectively. In the first and second quarters of 2009, we reduced the global workforce further by 51 and 25 employees, respectively, and recorded restructuring charges of $0.7 million and $0.4 million, respectively.
Several factors could cause a restructuring to adversely affect our business, financial condition and results of operations. These include potential disruption of our operations, the development of our technology, our supply chain and other aspects of our business. Employee morale and productivity could also suffer and result in unintended employee attrition. Loss of sales, service and engineering talent, in particular, could damage our business. Any restructuring would require substantial management time and attention and may divert management from other important work. If we undertake further employee reductions or other restructuring activities, we will likely record restructuring and related expenses and accounting charges. Accounting charges
21
may include inventory and technology-related write-offs, workforce reduction costs and charges relating to consolidation of excess facilities, and if we are required to take a substantial charge related to any future restructuring activities, our results of operations would be adversely affected in the period in which we take such a charge. Moreover, we could encounter delays in executing any restructuring plans, which could cause further disruption and additional unanticipated expense.
Failure to achieve and maintain effective internal controls in accordance with Section 404 of the Sarbanes-Oxley Act of 2002 could have a material effect on our business.
As a publicly traded company, we are subject to rules adopted by the SEC pursuant to Section 404 of the Sarbanes-Oxley Act of 2002. Section 404 requires us to include an internal control report from management in our Annual Report on Form 10-K. The internal control report must include the following: (1) a statement of management’s responsibility for establishing and maintaining adequate internal control over financial reporting, (2) a statement identifying the framework used by management to conduct the required evaluation of the effectiveness of our internal control over financial reporting and (3) management’s assessment of the effectiveness of our internal control over financial reporting as of the end of each fiscal year, including a statement as to whether or not internal control over financial reporting is effective. A statement that our independent registered public accounting firm has issued an attestation report on management’s internal control over financial reporting was not required for 20082009 as we are not an accelerated filer.
Our assessment as of December 29, 2007 identified a material weakness in our internal controls over financial reporting, which also adversely impacted our disclosure controls and procedures. A material weakness is a deficiency, or a combination of deficiencies, in internal controls over financial reporting, The Company will be required to obtain such that there is a reasonable possibility that a material misstatement of the Company’s annual or interim financial statements will not be prevented or detected on a timely basis. The material weakness identified in 2007 was regarding our internal controlsan attestation report for the provision of income taxes in foreign jurisdictions.2010 fiscal year.
Since discovery of the material weakness in 2007, we performed extensive additional work and implemented several procedures to obtain reasonable assurance regarding the reliability of our financial statements. Based on our testing of these enhanced procedures, in the quarter ended December 27, 2008, management determined that as of December 27, 2008, we have remediated the material weakness in internal controls over financial reporting and the controls are now operating effectively. Even with this remediation complete, however, we could have material weaknesses in the future. For additional information refer to Item 9A “Controls and Procedures”.
If we deliver systems with defects, our credibility will be harmed, revenue from, and market acceptance of, our systems will decrease and we could expend significant capital and resources as a result of such defects.
Notwithstanding our internal quality specifications, our systems have sometimes contained errors, defects and bugs when introduced. If we deliver systems with errors, defects or bugs, our credibility and the market acceptance and sales of our systems would be harmed. Further, if our systems contain errors, defects or bugs, we may be required to expend significant capital and resources to alleviate such problems. Defects could also lead to product liability lawsuits against us or against our customers. We have agreed to indemnify our customers in some circumstances against liability arising from defects in our systems. In the event of a successful product liability claim, we could be obligated to pay damages significantly in excess of our product liability insurance limits.
If we experience significant delays in shipping our products to our customers, our business and reputation may suffer.
Our products are complex and require technical expertise to design and manufacture properly. Various problems occasionally arise during the manufacturing process that may cause delays and/or impair product
quality. Any significant delays stemming from the failure of our products to meet or exceed our internal quality specifications, or for any other reasons, would delay our shipments. Shipment delays could harm our business and reputation in the industry.
Successful infringement claims by third parties could result in substantial damages, lost product sales and the loss of important intellectual property rights by us.
Our commercial success depends, in part, on our ability to avoid infringing or misappropriating patents or other proprietary rights owned by third parties. From time to time we may receive communications from third parties asserting that our metrology systems may contain design features which are claimed to infringe on their proprietary rights. For example, in August 2005, we were served with a complaint by KLA-Tencor, or KLA, alleging that certain of our products infringe two of KLA’s patents, Patent No. 6,483,580 and Patent No. 6,590,656. In January 2006, KLA added Patent No. 6,611,330 to its claim. For additional information, refer to Part II,I, Item 1. Legal3 “Legal Proceedings.” Our new or current products may infringe valid intellectual property rights, but even if our products do not infringe, we may be required to expend significant sums of money to defend against infringement claims, or to actively protect our intellectual property rights through litigation.
Our intellectual property may be infringed by third parties despite our efforts to protect it, which could threaten our future success and competitive position and harm our operating results.
Our future success and competitive position depend in part upon our ability to obtain and maintain proprietary technology for our principal product families, and we rely, in part, on patent, trade secret and trademark law to protect that technology. If we fail to adequately protect our intellectual property, it will be easier for our competitors to sell competing products. We own or may license patents relating to our metrology systems, and have filed applications for additional patents. Any of our pending patent applications may be rejected, and we may not in the future be able to develop additional proprietary technology that is patentable. In addition, the patents we own, have been issued or licensed, may not provide us with competitive advantages and may be challenged by third parties. Third parties may also design around these patents.
In addition to patent protection, we rely upon trade secret protection for our confidential and proprietary information and technology. We routinely enter into confidentiality agreements with our employees. However, in the event that these agreements may be breached, we may not have adequate remedies. Our confidential and proprietary information and technology might also be independently developed by or become otherwise known to third parties. We may be required to initiate litigation in order to enforce any patents issued to or licensed by us, or to determine the scope or validity of a third party’s patent or other proprietary rights. Any such litigation, regardless of outcome, could be expensive and time consuming, and could subject us to significant liabilities or require us to re-engineer our product or obtain expensive licenses from third parties, any of which would adversely affect our business and operating results.
Our efforts to protect our intellectual property may be less effective in some foreign countries where intellectual property rights are not as well protected as in the United States.
In 2009, 2008 and 2007, 70.3%, 70.5% and 68.2%, respectively, of our total net revenues were derived from sales to customers in foreign countries, including certain countries in Asia, such as Japan, South Korea, China and Taiwan. The laws of some foreign countries do not protect our proprietary rights to as great an extent as do the laws of the United States, and many U.S. companies have encountered substantial problems in protecting their proprietary rights against infringement in such countries. If we fail to adequately protect our intellectual property in these countries, it would be easier for our competitors to sell competing products and our business would suffer.
Variations in the amount of time it takes for us to sell our systems may cause fluctuations in our operating results, which could cause our stock price to decline.
Variations in the length of our sales cycles could cause our revenues to fluctuate widely from period to period. Our customers generally take long periods of time to evaluate our metrology systems. We expend significant resources educating and providing information to our prospective customers regarding the uses and benefits of our systems. The length of time that it takes for us to complete a sale depends upon many factors, including:
the efforts of our sales force and our independent sales representatives;
the complexity of the customer’s metrology needs;
the internal technical capabilities and sophistication of the customer;
the customer’s budgetary constraints; and
the quality and sophistication of the customer’s current processing equipment.
Because of the number of factors influencing the sales process, the period between our initial contact with a customer and the time at which we recognize revenue from that customer, if at all, varies widely. Our sales cycles, including the time it takes for us to build a product to customer specifications after receiving an order, typically range from three to nine months. Occasionally our sales cycles can be much longer, particularly with customers in Asia who may require longer evaluation periods. During the sales cycles, we commit substantial resources to our sales efforts in advance of receiving any revenue, and we may never receive any revenue from a customer despite our sales efforts.
If we do complete a sale, customers often purchase only one of our systems and then evaluate its performance for a lengthy period of time before purchasing additional systems. The purchases are generally made through purchase orders rather than through long-term contracts. The number of additional products that a customer purchases, if any, depends on many factors, including a customer’s capacity requirements. The period between a customer’s initial purchase and any subsequent purchases is unpredictable and can vary from three months to a year or longer. Variations in the length of this period could cause fluctuations in our operating results, which could adversely affect our stock price.
23
Relatively small fluctuations in our system sales volume may cause our operating results to vary significantly each quarter.
During any quarter, a significant portion of our revenue is derived from the sale of a relatively small number of systems. Our automated metrology systems range in price from approximately $200,000 to over $1,300,000 per system, and our integrated metrology systems range in price from approximately $80,000 to $500,000 per system. Accordingly, a small change in the number or mix of systems that we sell could cause significant changes in our operating results.
We depend on orders that are received and shipped in the same quarter, and therefore our results of operations may be subject to significant variability from quarter to quarter.
Our net sales in any given quarter depend upon a combination of orders received in that quarter for shipment in that quarter and shipments from backlog. Our backlog at the beginning of each quarter does not include all systems sales needed to achieve expected revenues for that quarter. Consequently, we are dependent on obtaining orders for systems to be shipped in the same quarter that the order is received. Moreover, customers may reschedule shipments, and production difficulties could delay shipments. Accordingly, we have limited visibility into future product shipments, and our results of operations may be subject to significant variability from quarter to quarter.
Because of the high cost of switching equipment vendors in our markets, it may be difficult for us to attract customers from our competitors even if our metrology systems are superior to theirs.
We believe that once a semiconductor customer has selected one vendor’s metrology system, the customer generally relies upon that system and, to the extent possible, subsequent generations of the same vendor’s system, for the life of the application. Once a vendor’s metrology system has been installed, a customer must often make substantial technical modifications and may experience downtime in order to switch to another vendor’s metrology system. Accordingly, unless our systems offer performance or cost advantages that outweigh a customer’s expense of switching to our systems, it will be difficult for us to achieve significant sales from that customer once it has selected another vendor’s system for an application.
If we fail to develop new and enhanced metrology systems we will likely lose market share to our competitors.
We operate in an industry that is subject to technological changes, changes in customer demands and the introduction of new, higher performance systems with short product life cycles. To be competitive, we must continually design, develop and introduce in a timely manner new metrology systems that meet the performance and price demands of semiconductor manufacturers and suppliers. We must also continue to refine our current systems so that they remain competitive. We may experience difficulties or delays in our development efforts with respect to new systems, and we may not ultimately be successful in developing them. Any significant delay in releasing new systems could adversely affect our reputation, give a competitor a first-to-market advantage or allow a competitor to achieve greater market share.
Lack of market acceptance for our new products may affect our ability to generate revenue and may harm our business.
We have recentlyIn 2008, we introduced several products to the market including the NanoCD Suite, Impulse and the Lynx platform. In 2009, we introduced the Atlas XP+ system as the follow-on to our Atlas metrology system and our Caliper Mosaic Overlay system. We have invested substantial time and resources into the development of these products. However, we cannot accurately predict the future level of acceptance of our new products by our customers. As a result, we may not be able to generate anticipated revenue from sales of these products. While we anticipate that our new products will become an increasingly larger component of our business, their failure to gain acceptance with our customers could materially harm our business. Additionally, if our new products do gain market acceptance, our ability to sell our existing products may be impeded and our business would suffer.
Our intellectual property may be infringed by third parties despiteWe depend on new products and processes for our effortssuccess. Consequently, we are subject to protect it, which could threatenrisks associated with rapid technological change.
Rapid technological changes in semiconductor manufacturing processes subject us to increased pressure to develop technological advances enabling such processes. We believe that our future success and competitive position and harm our operating results.
Our future success and competitive position dependdepends in part upon our ability to obtaindevelop and maintain proprietary technologyoffer new products with improved capabilities and to continue to enhance our existing products. If new products have reliability or quality problems, our performance impacted by reduced orders, higher manufacturing costs, delays in acceptance and payment for our principal product families,new products, and we rely, in part, on patent, trade secretadditional service and trademark law to protect that technology. If we fail to adequately protect our intellectual property, it will be easier for our competitors to sell competing products.warranty expenses. We own or may license patents relating to our metrology systems, and have filed applications for additional patents. Any of our pending patent applications may be rejected, and we maymight not in the future be able to develop additional proprietary technologyand manufacture new products successfully, or new products that is patentable. In addition, the patents we own, have been issued or licensed,introduce may not provide us with competitive advantages and may be challenged by third parties. Third parties may also design around these patents.
In addition to patent protection, we rely upon trade secret protection for our confidential and proprietary information and technology. We routinely enter into confidentiality agreements with our employees. However,fail in the event thatmarketplace. Our failure to complete commercialization of these agreements may be breached, we may not have adequate remedies. Our confidentialnew products in a timely manner could result in unanticipated costs and proprietary information and technology might also be independently developed by or become otherwise known to third parties. We may be required to initiate litigation in order to enforce any patents issued to or licensed by us, or to determine the scope or validity of a third party’s patent or other proprietary rights. Any such litigation, regardless of outcome, could be expensive and time consuming, and could subject us to significant liabilities or require us to re-engineer our product or obtain expensive licenses from third parties, any ofinventory obsolescence, which would adversely affect our financial results.
In order to develop new products and processes, we expect to continue to make significant investments in R&D and to pursue joint development relationships with customers, suppliers or other members of the industry. We must manage product transitions and joint development relationships successfully, as introduction of new products could adversely affect our sale of existing products. Moreover, future technologies, processes or product developments may render our current product offerings obsolete, leaving us with non-competitive products, or obsolete inventory, or both.
We are subject to risks associated with our competitors’ strategic relationships and their introduction of new products and we may lack the financial resources or technological capabilities of certain of our competitors needed to capture increased market share.
We expect to face significant competition from multiple current and future competitors. We believe that other companies are developing systems and products that are competitive to our products and are planning to introduce new products, which may affect our ability to sell our existing products. We face a greater risk if our competitors enter into strategic relationships with leading semiconductor manufacturers covering products similar to those we sell or may develop, as this could adversely affect our ability to sell products to those manufacturers.
We believe that to remain competitive we will require significant financial resources to offer a broad range of products, to maintain customer service and support centers worldwide, and to invest in product and process R&D. Certain of our competitors have substantially greater financial resources and more extensive engineering, manufacturing, marketing and customer service and support resources than we do and therefore have the potential to increasingly dominate the semiconductor equipment industry. These competitors may deeply discount products similar to those that we sell, challenging or even exceeding our ability to make similar accommodations and threatening our ability to sell those products. As a result, we may fail to continue to compete successfully worldwide.
In addition, our competitors may provide innovative technology that may have performance advantages over systems we currently expect to offer. They may be able to develop products comparable or superior to those that we offer or may adapt more quickly to new technologies or evolving customer requirements. In particular, while we currently are developing additional product enhancements that we believe will address future customer requirements, we may fail in a timely manner to complete the development or introduction of these additional product enhancements successfully, or these product enhancements may not achieve market acceptance or be competitive. Accordingly, we may be unable to continue to compete in our markets and competition may intensify, or future competition, operating results, financial condition, and/or cash flows could suffer.
If we are unable to adjust the scale of our business in response to rapid changes in demand in the semiconductor equipment industry, our operating results and our ability to compete successfully may be impaired.
The business cycle in the semiconductor equipment industry has historically been characterized by frequent periods of rapid change in demand that challenge our management to adjust spending and resources allocated to operating results. In March 2006,activities. During periods of growth or decline in demand for our products and services, we filedface significant challenges in maintaining adequate financial and business controls, management processes, information systems and procedures and in training, managing, and appropriately sizing our supply chain, our work force, and other components of our business on a complaint against Nova Measuring Instruments for infringingtimely basis. Our success will depend, to a significant extent, on the ability of our Patent No. Re 34,783. In October 2006,executive officers and other members of our senior management to identify and respond to these challenges, our gross margins and earnings may be impaired during periods of demand decline, and we filed a new complaint against Nova for infringementmay lack the infrastructure and resources to scale up our business to meet customer expectations and compete successfully during periods of Patent No. 5,867,276 and 7,115,858. In April 2007, we and Nova agreed to dismiss, without prejudice, all pending patent litigation and entered into a covenant not to sue one another for any patent for a period of one year.demand growth.
If we choose to acquire new and complementary businesses, products or technologies instead of developing them ourselves, we may be unable to complete these acquisitions or may not be able to successfully integrate an acquired business in a cost-effective and non-disruptive manner.
Our success depends on our ability to continually enhance and broaden our product offerings in response to changing technologies, customer demands and competitive pressures. To achieve this, from time to time we have acquired complementary businesses, products, or technologies instead of developing them ourselves and may choose to do so in the future. For example, inOn June 17, 2009, we entered into a strategic partnership with Zygo under an exclusive OEM supply agreement to provide interferometer sensors to Nanometrics for incorporation into the Unifire™ line of products as well as Nanometrics’ family of automated metrology systems. In May 2008, we acquired Tevet Process Control Technologies, Ltd., an integrated metrology company serving the worldwide semiconductor and solar manufacturing industry. At the outset, weWe do not know if we will be able to complete any additional acquisitions, or whether we will be able to successfully integrate any acquired business, operate them profitably or retain their key employees. Integrating any business, product or technology that we acquire could be expensive and time consuming, disrupt our ongoing business and distract our management. In addition, in order to finance any acquisitions, we may be required to raise additional funds through public or private equity or debt financings. In that event, we could be forced to obtain financing on terms that are not favorable to us and, in the case of an equity or convertible debt financing, which may result in dilution to our stockholders. If we are unable to integrate any acquired entities, products or technologies effectively, our business will suffer.
We manufacture all of our systems at a limited number of facilities, and any prolonged disruption in the operations of those facilities could reduce our revenues.
We produce all of our systems in our manufacturing facilities located in Milpitas, California and to a lesser extent, we manufacture through our subsidiary in South Korea.California. We use contract manufacturers in China, Israel, Japan and the United States. In addition, we perform limited subassembly for certain products at our York, England facility. Our manufacturing processes are highly complex and require sophisticated, costly equipment and specially designed facilities. As a result, any prolonged disruption in the operations of our manufacturing facilities, such as those resulting from a severeacts of war, terrorism, political instability, health epidemics, fire, earthquake, flooding or earthquake,other natural disaster could seriously harm our ability to satisfy our customer order deadlines.
25
Our efforts to protect our intellectual property may be less effective in some foreign countries where intellectual property rights are not as well protected as in the United States.
In 2008, 2007 and 2006, 70.5%, 68.2% and 65.0%, respectively, of our total net revenues were derived from sales to customers in foreign countries, including certain countries in Asia, such as Japan, South Korea, China and Taiwan. The laws of some foreign countries do not protect our proprietary rights to as great an extent as do the laws of the United States, and many U.S. companies have encountered substantial problems in protecting their proprietary rights against infringement in such countries. If we fail to adequately protect our intellectual property in these countries, it would be easier for our competitors to sell competing products and our business would suffer.
Our results of operations could vary as a result of the methods, estimates and judgments we use in applying our accounting policies.
The methods, estimates and judgments we use in applying our accounting policies have a significant impact on our results of operations, see “Significant Accounting Policies” in Part II, Item 8, Note 1. Such methods, estimates and judgments are, by their nature, subject to substantial risks, uncertainties and assumptions, and factors may arise over time that leadleads us to change our methods, estimates and judgments. Changes in those methods, estimates and judgments could
significantly affect our results of operations. In particular, our operating results have been affected by adoption of SFAS No. 123(R) for the calculation of share-based compensation expense and by implementation of SFAS 142 and 144 regarding the testing and potential impairment of long-lived assets such as goodwill and other intangible assets. The process of evaluating potential impairments is highly subjective and requires significant judgment, and our results of operations could vary in the future if the forecasts used in subjective assessments are inaccurate.
Our operating results have varied in the past and probably will continue to vary significantly in the future, which will cause volatility in our stock price.
Our quarterly and annual operating results have varied significantly in the past and are likely to vary in the future, which volatility could cause our stock price to decline. Some of the factors that may influence our operating results and subject our stock to extreme price and volume fluctuations include:
changes in customer demand for our systems;
economic conditions in the semiconductor industries;
the timing, cancellation or delay of customer orders and shipments;
market acceptance of our products and our customers’ products;
our ability to recover the higher costs associated with meeting our customers’ increasing service demands;
competitive pressures on product prices and changes in pricing by our customers or suppliers;
the timing of new product announcements and product releases by us or our competitors and our ability to design, introduce and manufacture new products on a timely and cost-effective basis;
the occurrence of potential impairments of long-lived assets;
the timing of acquisitions of businesses, products or technologies;
the levels of our fixed expenses, relative to our revenue levels; and
fluctuations in foreign currency exchange rates, particularly the Japanese yen and the British pound sterling.
If our operating results in any period fall below the expectations of securities analysts and investors, the market price of our common stock would likely decline.
We incur significant costs as a result of complying with laws and regulations affecting public companies.
Compliance with laws and regulations affecting public companies, including the provisions of the Sarbanes-Oxley Act of 2002, has resulted in and, we expect, will continue to result in substantial accounting, legal and administrative costs. In particular, Section 404 of the Sarbanes-Oxley Act of 2002 and the rules of the SEC and the Public Company Accounting Oversight Board impose requirements with respect to the evaluation of the effectiveness of our internal controls. The cost of complying with these requirements is substantial.
We are highly dependent on international sales and operations, which exposes us to foreign political and economic risks.
We maintain facilities in Japan, Taiwan, the United Kingdom, South Korea, China, Israel and the European Union. We anticipate that international sales will continue to account for a significant portion of our revenues. International sales and operations carry inherent risks such as:
regulatory limitations imposed by foreign governments,governments;
obstacles to the protection of our intellectual property, political, military and terrorism risks,risks;
disruptions or delays in shipments caused by customs brokers or other government agencies,agencies;
unexpected changes in regulatory requirements, tariffs, customs, duties and other trade barriers,barriers;
difficulties in staffing and managing foreign operations,operations; and
and potentially adverse tax consequences resulting from changes in tax laws.
If any of these risks materialize and we are unable to manage them, our international sales and operations would suffer.
We are exposed to fluctuations in the exchange rates of foreign currency.
As a global concern, we face exposure to adverse movements in foreign currency exchange rates. With our operations in Japan, South Korea, the United Kingdom, Taiwan, China and Israel, a significant percentage of our cash flows are exposed to foreign currency risk. In 2009, 2008 and 2007, 70.3%, 70.5% and 68.2%, respectively, of our total net revenues were derived from sales to customers in foreign countries, including certain countries in Asia, such as Japan and South Korea. These exposures may change over time as business practices evolve and could have a material adverse impact on our financial results and cash flow.
We are subject to various environmental laws and regulations that could impose substantial costs upon us and may harm our business, operating results and financial condition.
Some of our operations use substances regulated under various federal, state, local, and international laws governing the environment, including those relating to the storage, use, discharge, disposal, labeling, and human exposure to hazardous and toxic materials. We could incur costs, fines and civil or criminal sanctions, third-party property damage or personal injury claims, or could be required to incur substantial investigation or remediation costs, if we were to violate or become liable under environmental laws. Liability under environmental laws can be joint and several and without regard to comparative fault. Compliance with current or future environmental laws and regulations could restrict our ability to expand our facilities or require us to acquire additional expensive equipment, modify our manufacturing processes, or incur other significant expenses. We may unintentionally violate environmental laws or regulations in the future as a result of human error, the inability to obtain permits, equipment failure or other causes.
Anti-takeover provisions in our charter documents and Delaware law could discourage, delay or prevent a change in control of our company and may affect the trading price of our common stock.
The anti-takeover provisions of the Delaware General Corporation Law may discourage, delay or prevent a change in control by limiting our ability to engage in a business combination with an interested stockholder for a period of three years after the person becomes an interested stockholder, even if a change of control would be
27
beneficial to our existing stockholders. In addition, our certificate of incorporation and bylaws may discourage, delay or prevent a change in our management or control over us that stockholders may consider favorable. Our certificate of incorporation and bylaws:
authorize the issuance of “blank check” preferred stock that could be issued by our board of directors to thwart a takeover attempt;
establish a classified board of directors, as a result of which it will be more difficult for our stockholders to change the composition of our board of directors in a relatively short period of time;
limit who may call special meetings of stockholders; and
prohibit stockholder action by written consent, requiring all actions to be taken at a meeting of the stockholders.
Political instability couldWe may experience periodic or prolonged disruption of our IT infrastructure, which may adversely affect our operations.
We rely on our Enterprise Resource Planning (“ERP”) system (SYSPRO) to manage our business and accurately and timely report key data with respect to our results of operations.
The ongoing threatoperations, financial position and cash flows. We may experience periodic or prolonged disruption of terrorism targeted at the United Statesour IT infrastructure arising out of general use of such systems, periodic upgrades and updates, or other regions where we conduct business increases the uncertainty inexternal factors that are outside of our markets and the economy in general. This uncertainty is likely to result in economic stagnation, which would harm our business. In addition, increased international political instability may hindercontrol. Any such disruption could adversely affect our ability to docomplete essential business by increasingprocesses, including our costsevaluation of operations. For example, our transportation costs, insurance costs and sales efforts may become more expensive as a resultinternal control over financial reporting pursuant to Section 404 of geopolitical tension. These tensions may also negatively affectthe Sarbanes-Oxley Act of 2002. If we encounter unforeseen problems with regard to our suppliers and customers. If this international economic and political instability continuesERP system or increases,other IT systems, our business, operations and results of operationsfinancial condition could be harmed.adversely affected.
We may not maintain NASDAQ listing requirements, which would adversely affect the price and liquidity of our common stock.
To maintain the listing of our common stock on The NASDAQ Global Market, we are required to meet certain listing requirements, including a minimum bid price of $1.00 per share. If our stock trades below the $1.00 minimum bid price for 30 consecutive business days, NASDAQ may choose to notify us that it may delist our common stock from The NASDAQ Global Market. If the closing bid price of our common stock did not thereafter regain compliance for a minimum of 10 consecutive trading days during the 180 days following notification by NASDAQ, NASDAQ could delist our common stock from trading on The NASDAQ Global Market. There can be no assurance that our common stock will remain eligible for trading on The NASDAQ Global Market. If our stock were delisted, the ability of our stockholders to sell any of our common stock at all would be severely, if not completely, limited, causing our stock price to continue to decline.
| ITEM 1B. | UNRESOLVED STAFF COMMENTS |
None.
| ITEM 2. | PROPERTIES |
At December 27, 2008,January 2, 2010, our owned or leased facilities included those described below:
Type | Location | Square Footage | Use | |||
Owned | Milpitas, California | 133,000 | Corporate headquarters and manufacturing | |||
Owned(1) | Pyongtaek-city, South Korea | 39,000 | ||||
Owned | Milpitas, California | 3,038 | Corporate housing | |||
Leased | Tokyo, Japan | 7,500 | Sales, service and corporate housing | |||
Leased | Kumamoto, Japan | 3,250 | Sales, service and engineering | |||
Leased | Osaka, Japan | 1,000 | Sales and service | |||
Leased | Yokkaichi, Japan | 1,750 | Sales and service | |||
Leased | York, England | 20,338 | Sales, service and engineering | |||
Leased | ||||||
| Whasung-City, South Korea | 4,780 | ||||
Leased | Dong-Guang, Taiwan | 9,400 | Sales and service | |||
Leased | Tainan, Taiwan | 1,100 | Sales and service | |||
Leased | Tainan, Taiwan | 700 | Sales and service | |||
Leased | Shanghai, China | 3,000 | Sales and service | |||
Leased | Redhill, Singapore | 1,000 | Sales and service | |||
Leased | Austin, Texas | 1,130 | Engineering, Sales and service | |||
Leased | Bend, Oregon | 5,200 | Engineering, sales and service | |||
Leased | ||||||
| ||||||
| Yokneam, Israel | 2,625 | Engineering, sales and | |||
Leased | Hillsboro, Oregon | 6,410 | Engineering, sales and service |
| (1) | Real estate improvements on this property are owned. The underlying land, however, is leased. |
We believe that our existing facilities are suitable and adequate for our current needs and anticipated growth.
| ITEM 3. | LEGAL PROCEEDINGS |
In August 2005, KLA-Tencor Corporation or KLA,(“KLA”) filed a complaint against usthe Company in the United States District Court for the Northern District of California. The complaint alleges that certain of ourthe Company’s products infringe two of KLA’s patents. On January 30, 2006, KLA added a third patent to their claim. The complaint seeks a preliminary and permanent injunction against the sale of these products as well as the recovery of monetary damages and attorneys’ fees. We do not believe that any of our products infringe the intellectual property of any third party and we intend to vigorously and aggressively defend ourselves in the litigation. As part of suchits defense, we havethe Company has filed a request for re-examination of two of the three allegedly infringed KLA patents with the U.S. Patent & Trademark Office or PTO.(“PTO”). In March 2006, wethe Company filed a motion for and werewas granted a stay in the patent litigation case until such re-examination is completed. On July 28, 2008, the PTO issued a Notice of Intent to issue a Reexamination Certificate for one of the KLA patents, and subsequently on June 23, 2009 issued an additional Notice of Intent to issue a Reexamination Certificate on the second of three patents. The other two patent reexaminations remain pending.reexamination of the final KLA patent-in-suit remains pending and on September 21, 2009 the Company filed an additional request for re-examination relating to this patent. The case has been stayed, and the Company is waiting for a response from the Patent and Trademark Office before taking any additional action. In all three of the reexamination proceedings, the PTO has issued Office Actions rejecting numerous claims and KLA has amended the claims in response.
| ITEM 4. |
No matters were submitted to a vote of security holders during the quarter ended December 27, 2008.
29
| ITEM 5. | MARKET FOR REGISTRANT’S COMMON EQUITY, RELATED STOCKHOLDER MATTERS AND ISSUER PURCHASES OF EQUITY SECURITIES |
Market Information for Common Stock
Our common stock is quoted on the NASDAQ Global Market under the symbol “NANO.” The following table sets forth, for the periods indicated, the high and low bid prices per share of our common stock as reported on the NASDAQ Global Market. These quotations represent prices between dealers and do not include retail markups, markdowns or commissions and may not necessarily represent actual transactions.
| High | Low | |||||
2008 | ||||||
First Quarter | $ | 9.93 | $ | 5.00 | ||
Second Quarter | $ | 8.50 | $ | 5.75 | ||
Third Quarter | $ | 6.09 | $ | 2.20 | ||
Fourth Quarter | $ | 3.04 | $ | 0.80 | ||
2007 | ||||||
First Quarter | $ | 8.51 | $ | 6.63 | ||
Second Quarter | $ | 6.94 | $ | 5.74 | ||
Third Quarter | $ | 9.00 | $ | 6.12 | ||
Fourth Quarter | $ | 11.71 | $ | 7.48 | ||
2009 | High | Low | ||||
First quarter | $ | 1.64 | $ | 1.08 | ||
Second quarter | $ | 2.50 | $ | 1.11 | ||
Third quarter | $ | 8.70 | $ | 2.56 | ||
Fourth quarter | $ | 13.27 | $ | 6.08 | ||
2008 | High | Low | ||||
First quarter | $ | 9.93 | $ | 5.00 | ||
Second quarter | $ | 8.50 | $ | 5.75 | ||
Third quarter | $ | 6.09 | $ | 2.20 | ||
Fourth quarter | $ | 3.04 | $ | 0.80 | ||
2007 | High | Low | ||||
First quarter | $ | 8.51 | $ | 6.63 | ||
Second quarter | $ | 6.94 | $ | 5.74 | ||
Third quarter | $ | 9.00 | $ | 6.12 | ||
Fourth quarter | $ | 11.71 | $ | 7.48 | ||
Stockholders
On March 17, 2009,19, 2010, the last reported sales price of our common stock on the NASDAQ Global Market was $1.18$8.57 per share and there were approximately 284256 holders of record of our common stock. Because brokers and the institutions on behalf of stockholders hold many of our shares of common stock, we are unable to estimate the total number of stockholders represented by these record holders.
Dividend Policy
We have never declared or paid any cash dividends on our capital stock. We currently expect to retain future earnings, if any, for use in the operation and expansion of our business and do not anticipate paying any cash dividends in the foreseeable future.
Equity Compensation Plan Information
The following table gives information about the common stock that may be issued under all of our existing equity compensation plans as of December 27, 2008.January 2, 2010.
Plan category | Number of securities to be issued upon exercise of outstanding options, warrants and rights | Weighted-average exercise price of outstanding options, warrants and rights | Number of securities remaining available for future issuance under equity compensation plans (excluding securities reflected in column) | Number of securities to be issued upon exercise of outstanding options, warrants and rights | Weighted-average exercise price of outstanding options, warrants and rights | Number of securities remaining available for future issuance under equity compensation plans (excluding securities reflected in first column) | ||||||||
Equity compensation plans approved by security holders | 3,073,069 | $ | 7.12 | 1,471,270 | 2,624,990 | $ | 5.72 | 1,506,555 | ||||||
Equity compensation plans not approved by security holders(1) | 489,368 | $ | 8.35 | 193,773 | 328,304 | $ | 7.71 | 266,674 | ||||||
Total | 3,562,437 | $ | 7.29 | 1,665,043 | 2,953,294 | $ | 5.95 | 1,773,229 | ||||||
| (1) | The material features of the 2002 Non-statutory Stock Plan, which was adopted without the approval of security holders, is set forth in Note |
Stock Performance Graph
The following graph presentation compares cumulative five-year stockholder returns on an indexed basis, assuming a $100 initial investment and reinvestment of dividends, of (a) Nanometrics Incorporated, (b) a broad-based equity market index and (c) an industry-specific index. The broad-based equity market index used is the NASDAQ Composite Index and the industry-specific index used is the RDG Technology Composite Index.
This performance graph shall not be deemed “filed” for purposes of Section 18 of the Securities Exchange Act of 1934, as amended or otherwise subject to the liabilities under that Section, and shall not be deemed to be incorporated by reference into any of our filings under the Securities Act of 1933, as amended or the Exchange Act.
31
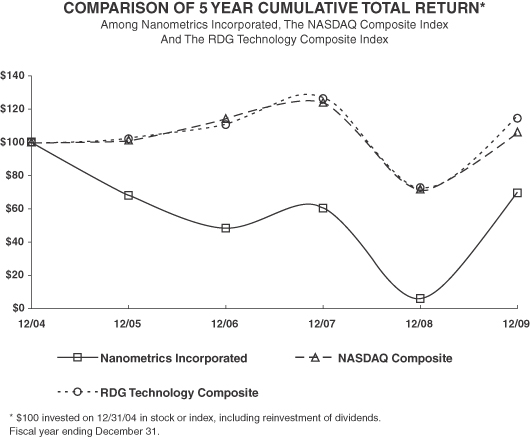
Recent Sales of Unregistered Securities
None.
Issuer Purchases of Equity Securities
We repurchased the followingdid not purchase any shares of our common stock during the three-month periodthree and twelve months periods ended December 27, 2008:January 2, 2010.
Issuer PurchaseOn July 26, 2007, our Board of Equity SecuritiesDirectors approved the repurchase of up to $4.0 million of our common stock. Share repurchases under this program may be made through open market and privately negotiated transactions, at times and in such amounts as management deems appropriate. The timing and actual number of shares repurchased will depend on a variety of factors including price, corporate and regulatory requirements and other market conditions. The stock repurchase program may be limited or terminated at any time without prior notice. As of January 2, 2010 there remained $1.3 million available for the future purchase of shares of our common stock.
Period | Total Number of Shares Purchased | Average Price Paid per Share | Total Number of Shares Purchased as Part of a Publicly Announced Programs(1) | Maximum Dollar Value of Shares that May Yet Be Purchased Under the Program(1) | ||||||
Month Ending October 25, 2008 | — | — | — | $ | 1,424,629 | |||||
Month Ending November 22, 2008 | 85,995 | $ | 1.22 | 85,995 | $ | 1,319,675 | ||||
Month Ending December 27, 2008 | — | — | — | $ | 1,319,675 | |||||
Total for the quarter ending December 27, 2008 | 85,995 | $ | 1.22 | 85,995 | $ | 1,319,675 | ||||
| ITEM 6. | SELECTED FINANCIAL DATA |
The selected consolidated financial data set forth below should be read in conjunction with “Management’s Discussion and Analysis of Financial Condition and Results of Operations” and the consolidated financial statements and statements and related notes included elsewhere in this Form 10-K.
| Fiscal Year | Fiscal Year | ||||||||||||||||||||||||||||||||||||||
| 2008 | 2007 | 2006(a) | 2005 | 2004(b) | 2009(a) | 2008 | 2007 | 2006(b) | 2005 | ||||||||||||||||||||||||||||||
| (in thousands, except per share data) | (in thousands, except per share data) | ||||||||||||||||||||||||||||||||||||||
Consolidated Statement of Operations Data: | |||||||||||||||||||||||||||||||||||||||
Net revenues: | |||||||||||||||||||||||||||||||||||||||
Products | $ | 75,596 | $ | 126,049 | $ | 80,636 | $ | 61,012 | $ | 62,147 | $ | 49,153 | $ | 75,596 | $ | 126,049 | $ | 80,636 | $ | 61,012 | |||||||||||||||||||
Service | 26,505 | 20,241 | 15,738 | 9,531 | 7,784 | 27,554 | 26,505 | 20,241 | 15,738 | 9,531 | |||||||||||||||||||||||||||||
Total net revenues | 102,101 | 146,290 | 96,374 | 70,543 | 69,931 | 76,707 | 102,101 | 146,290 | 96,374 | 70,543 | |||||||||||||||||||||||||||||
Costs of revenues: | |||||||||||||||||||||||||||||||||||||||
Cost of products | 38,692 | 63,938 | 44,016 | 28,917 | 27,812 | 26,594 | 38,692 | 63,938 | 44,016 | 28,917 | |||||||||||||||||||||||||||||
Cost of service | 18,675 | 20,717 | 16,610 | 10,695 | 8,404 | 13,992 | 18,675 | 20,717 | 16,610 | 10,695 | |||||||||||||||||||||||||||||
Total cost of net revenues | 57,367 | 84,655 | 60,626 | 39,612 | 36,216 | 40,586 | 57,367 | 84,655 | 60,626 | 39,612 | |||||||||||||||||||||||||||||
Gross profit | 44,734 | 61,635 | 35,748 | 30,931 | 33,715 | 36,121 | 44,734 | 61,635 | 35,748 | 30,931 | |||||||||||||||||||||||||||||
Operating expenses: | |||||||||||||||||||||||||||||||||||||||
Research and development | 17,110 | 18,577 | 14,253 | 12,533 | 12,827 | 14,672 | 17,110 | 18,577 | 14,253 | 12,533 | |||||||||||||||||||||||||||||
Selling | 17,798 | 19,561 | 16,977 | 10,945 | 11,748 | 15,072 | 17,798 | 19,561 | 16,977 | 10,945 | |||||||||||||||||||||||||||||
General and administrative | 19,689 | 21,704 | 21,305 | 11,882 | 5,137 | 15,168 | 19,689 | 21,704 | 21,305 | 11,882 | |||||||||||||||||||||||||||||
Amortization of intangible assets | 3,531 | 5,782 | 5,338 | 256 | — | 1,535 | 3,531 | 5,782 | 5,338 | 256 | |||||||||||||||||||||||||||||
Restructuring charge | 1,525 | 2,128 | — | — | — | 1,134 | 1,525 | 2,128 | — | — | |||||||||||||||||||||||||||||
Gain on sale of assets | — | (2,100 | ) | — | — | — | — | — | (2,100 | ) | — | — | |||||||||||||||||||||||||||
Merger termination fee | — | — | — | (8,300 | ) | — | — | — | — | — | (8,300 | ) | |||||||||||||||||||||||||||
Asset impairment and disposition | 68,545 | — | — | 2,232 | — | 1,899 | 68,545 | — | — | 2,232 | |||||||||||||||||||||||||||||
Total operating expenses | 128,198 | 65,652 | 57,873 | 29,548 | 29,712 | 49,480 | 128,198 | 65,652 | 57,873 | 29,548 | |||||||||||||||||||||||||||||
(Loss) income from operations | (83,464 | ) | (4,017 | ) | (22,125 | ) | 1,383 | 4,003 | (13,359 | ) | (83,464 | ) | (4,017 | ) | (22,125 | ) | 1,383 | ||||||||||||||||||||||
Other (expense) income, net | 1,174 | (22 | ) | (325 | ) | 346 | 122 | (3,532 | ) | 1,174 | (22 | ) | (325 | ) | 346 | ||||||||||||||||||||||||
Provision (benefit) for income taxes | 436 | (31 | ) | (323 | ) | 218 | 426 | (586 | ) | 436 | (31 | ) | (323 | ) | 218 | ||||||||||||||||||||||||
Net (loss) income | $ | (82,726 | ) | $ | (4,008 | ) | $ | (22,127 | ) | $ | 1,511 | $ | 3,699 | $ | (16,305 | ) | $ | (82,726 | ) | $ | (4,008 | ) | $ | (22,127 | ) | $ | 1,511 | ||||||||||||
Basic net (loss) income per share | $ | (4.46 | ) | $ | (0.22 | ) | $ | (1.47 | ) | $ | 0.12 | $ | 0.30 | $ | (0.87 | ) | $ | (4.46 | ) | $ | (0.22 | ) | $ | (1.47 | ) | $ | 0.12 | ||||||||||||
Diluted net (loss) income per share | $ | (4.46 | ) | $ | (0.22 | ) | $ | (1.47 | ) | $ | 0.11 | $ | 0.28 | $ | (0.87 | ) | $ | (4.46 | ) | $ | (0.22 | ) | $ | (1.47 | ) | $ | 0.11 | ||||||||||||
Shares used in per share computation: | |||||||||||||||||||||||||||||||||||||||
Basic | 18,546 | 18,099 | 15,075 | 12,760 | 12,320 | 18,639 | 18,546 | 18,099 | 15,075 | 12,760 | |||||||||||||||||||||||||||||
Diluted | 18,546 | 18,099 | 15,075 | 13,471 | 13,364 | 18,639 | 18,546 | 18,099 | 15,075 | 13,471 | |||||||||||||||||||||||||||||
| (a) |
| The fiscal year ended January |
| (b) | We adopted Statement of Financial Accounting Standards No 123(R) “Share-Based Payment”, as codified by ASC 718, effective January 1, 2006. |
Consolidated Balance Sheet Data: Cash, cash equivalents and short-term investments Working capital Total assets Long-term liabilities incl. current portion of debt obligation Total stockholders’ equity33 Fiscal Year End 2009 2008 2007 2006 2005 (in thousands) $ 43,526 $ 23,980 $ 14,919 $ 7,957 $ 45,394 76,771 57,901 57,062 49,721 76,731 147,470 123,854 207,076 212,376 136,300 15,317 14,140 1,560 1,807 1,796 106,754 92,767 175,844 174,631 120,343
| Fiscal Year End | |||||||||||||||
| 2008 | 2007 | 2006 | 2005 | 2004 | |||||||||||
| (in thousands) | |||||||||||||||
Consolidated Balance Sheet Data: | |||||||||||||||
Cash, cash equivalents and short-term investments | $ | 23,980 | $ | 14,919 | $ | 7,957 | $ | 45,394 | $ | 33,868 | |||||
Working capital | 57,739 | 57,062 | 49,721 | 76,731 | 68,588 | ||||||||||
Total assets | 123,854 | 207,076 | 212,376 | 136,300 | 133,769 | ||||||||||
Long-term liabilities incl. current portion of debt obligation | 14,140 | 1,560 | 1,807 | 1,796 | 4,164 | ||||||||||
Total stockholders’ equity | 92,767 | 175,844 | 174,631 | 120,343 | 116,829 | ||||||||||
| ITEM 7. | MANAGEMENT’S DISCUSSION AND ANALYSIS OF FINANCIAL CONDITION AND RESULTS OF OPERATIONS |
Overview
You should read the following discussion and analysis of our financial condition and results of operations together with “Selected Financial Data” and our consolidated financial statements and related notes appearing elsewhere in this Annual Report on Form 10-K. This discussion and analysis contains forward-looking statements that involve risks, uncertainties and assumptions. The actual results may differ materially from those anticipated in these forward-looking statements as a result of certain factors, including, but not limited to, those presented under “Risk Factors” in Item 1A and elsewhere in this Annual Report on Form 10-K.
We are an innovator in the field of metrology systems for the semiconductor manufacturing and other industries. Our systems are designed to precisely monitor film thickness and critical dimensions that are necessary to control the manufacturing process and provide increased production yields and performance.
Capital expenditures by manufacturers of semiconductors, especially in Asia, are critical to our success. Purchases of our systems by these manufacturers are driven by the expected market demand for their new products and new applications. The increasing complexity of the manufacturing processes for semiconductors is an important factor in the demand for our innovative metrology systems, as are the adoption of optical critical dimension (OCD)OCD metrology across fabrication processes, adoption of immersion lithography and double patterning, adoption of new types of thin film materials and the need for improved process control to drive process efficiencies. Our strategy is to continue to innovate organically as well to evaluate strategic acquisitions in order to address business challenges and opportunities.
Our revenues are primarily derived from product sales but are also derived from customer service and system upgrades for the installed base of our products. In 2008,2009, we derived 74.0%64.1% of our total net revenues from product sales and 26.0%35.9% of our total net revenues from services.
Important Themes and Significant Trends
The semiconductor equipment industry is characterized by cyclical growth. Changing trends in the semiconductor industry continue to drive the need for metrology as a major component of manufacturing systems. These trends include:
Adoption of Advanced Packaging Processes: Our customers use photolithographic, etching, metallization, and wafer thinning to enable next generation advanced packaging solutions for semiconductor devices. The new packages lead to increased functionality in smaller, less expensive form factors. The advanced packages can be broken down into high density flip chip or bump packages that increase pin density allowing for more complex I/O on advanced CPU parts. Additionally, similar or different devices can be stacked at the wafer level using a Through Silicon Via process. The TSV process enables high density small form factor parts, being primarily driven by mobile consumer products (i.e. cellular telephones with integrated CMOS camera sensors). Increasingly advanced packaging technologies are being adopted by our end customers.
Adoption of Optical Critical Dimension Metrology across Fabrication Processes. Our customers use photolithographic processes to create patterns on wafers. Critical dimensions must be carefully controlled during this process. In advanced node device definition, additional monitoring of thickness and profile dimensions on these patterned structures at CMP, Etch, and Thin Film processing is driving broader OCD adoption. Our proprietary OCD systems can provide the critical process control of these circuit dimensions that is necessary for successful manufacturing of these state of the art devices.
Adoption of Immersion Lithography and Development of Double Patterning for Critical Photolithographic Layers.In an effort to reduce costs and increase device performance, semiconductor manufacturers are decreasing both the die size and feature size. Both immersion processing and double patterning techniques are being implemented to achieve the requisite device linear dimension and density. The additional rigors of these technologies increase the burden on overlay and registration capability as well as critical dimension monitoring and control. These techniques are shrinking total available process windows faster than the scaling predicted by Moore’s Law, resulting in the need for additional metrology and process control for both overlay and OCD systems.
Adoption of New Types of Thin Film Materials. The need for ever increasing device circuit speed coupled with lower power consumption has pushed semiconductor device manufacturers to begin the replacement of the traditional aluminum etch back interconnect flows as well as conventional gate dielectric materials, all which drive a broader adoption of thin film and OCD metrology systems. To achieve greater semiconductor device speed, manufacturers have adopted copper in Logic/IDM and it is now proliferating in next generation DRAM and Flash nodes. Additionally, to achieve improved transistor performance in logic devices and higher cell densities in memory devices, new materials including high dielectric constant (or high-k) gate materials are increasingly being substituted for traditional silicon-oxide gate dielectric materials. High-k materials are comprised of complex thin films including layers of hafnium oxide and a bi-layer of thin film metals. Our advanced metrology solutions are required for thickness control of these layers, which is critical to enable the device performance improvements that these new materials allow.
Need for Improved Process Control to Drive Process Efficiencies. Competitive forces influencing semiconductor device manufacturers, such as price-cutting and shorter product life cycles, place pressure on manufacturers to rapidly achieve production efficiency. Device manufacturers are using our integrated and standalone metrology systems throughout the fab to ensure that manufacturing processes scale rapidly, are accurate and can be repeated on a consistent basis.
Reduced Number of Customers. Because of the escalating cost of 300mm manufacturing facilities, fewer semiconductor manufacturers can afford the significant investment in these next generation facilities. Therefore, fewer opportunities for semiconductors equipment companies exist. Given that the available number of potential customers is decreasing, pre-existing customer relationships, product positioning and critical mass take on greater importance.
Critical Accounting Policies
The preparation of our financial statements conforms to accounting principles generally accepted in the United States of America, which requires management to make estimates and judgments in applying our accounting policies that have an important impact on our reported amounts of assets, liabilities, revenue, expenses and related disclosures at the date of our financial statements. On an on-going basis, management evaluates its estimates including those related to bad debts, inventory valuations, warranty obligations and income taxes. Management bases its estimates and judgments on historical experience and on various other factors that are believed to be reasonable under the circumstances, the results of which form the basis for making judgments about the carrying values of assets and liabilities that are not readily apparent from other sources. Actual results may differ from management’s estimates. We believe that the application of the following accounting policies requires significant judgments and estimates on the part of management. For a summary of all of our accounting policies, including those discussed below, see Note 1 to The Consolidated Financial Statements.
Revenue Recognition – We recognize revenue when persuasive evidence of an arrangement exists, delivery has occurred or services have been rendered, the seller’s price is fixed or determinable, and collectibilitycollectability is reasonably assured. Product revenue includes hardware and also software that is incidental to the products as defined pursuant to AICPA Statement of Position (“SOP”) No. 97-2,Software Revenue Recognition. We derive
35
revenue from three sources—salesthe sale of process control metrology systems (“Product revenue”) as well as spare part sales, billable service, service contracts, and upgrades (together “Service revenue”). Upgrades are a group of parts that change the existing configuration of a product and are included in certain arrangements, separately stated service contracts. Service revenue. They are distinguished from Product revenue, includes product upgrades.which consists of complete, standalone process control metrology systems. Our systems consist of hardware and of software which is incidental to the systems. We periodically review the software element of our systems to ascertain that the software continues to be incidental. Our arrangements for sales of our systems often include customer-specified objective acceptance criteria. Our systems include hardware and software that is incidental to the system. We periodically review the software element of our equipment systems in accordance with AICPA Statement of Position (“SOP”) No. 97-2,Software Revenue Recognition,and Emerging Issues Task Force (“EITF”) Issue No. 03-05,Applicability of SOP 97-2 to Non-Software Deliverables in an Arrangement Containing More-than-Incidental Software, to ascertain that the software continues to be incidental.
For product sales to existing customers, revenue recognition occurs at the time title and risk of loss transfer, which usually occurs upon delivery, if we have reliably demonstrated that the product has successfully met the defined customer specified criteria, and all other recognition criteria has been met. This occurs at the time of shipment, as our terms are FOB shipping point. For initial sales of product where we have not previously met the defined customer acceptance criteria, product revenues are recognized upon the earlier of receipt of written customer acceptance or expiration of the contractual acceptance period. In Japan, where our contractual terms with the customer specify risk of loss and title transfers upon customer acceptance, revenue is recognized upon receipt of written customer acceptance, provided that all other recognition criteria have been met.
All of our products are assembled prior to shipment to our customers. We often perform installation for our customers; however such installation is inconsequential and perfunctory as it may also be performed by third parties and is not considered essential to the functionality of the equipment. Revenue related to spare partspart sales is recognized upon shipmentshipment. Revenue related to billable service is recognized as the services are performed and if billable service and spare parts are sold together, revenue is included as part ofrecognized when both the parts are delivered and the service revenue. Service revenue also includesis completed. For service contracts, spare parts, and non-warranty and billable repairs of systems, and product upgrades. Whereas service revenue related to service contracts is recognized ratably over the period underservice contract service revenue related to billable repairs of systemsperiod. Revenue on upgrades is recognized as services are performed and service parts are delivered.when the upgrade has been delivered to the customer. For initial upgrade sales where we have not previously met the defined customer acceptance criteria, if any, revenue is recognized upon the early of receipt of written customer acceptance or expiration of the contractual acceptance period. On occasion, customers request a warranty period longer than our standard 12 month warranty. In those instances where extended warranty services are separately quoted to the customer, we follow the guidance of Financial Accounting Standards Board Technical Bulletin 90-1,“Accounting for Separately Priced Extended Warranty and Product Maintenance Contracts,” associated revenue is deferred and recognized to incomeas service revenue ratably over the term of the contract. Unearned maintenanceThe portion of service contracts and service contract revenue isextended warranty services agreements that are uncompleted at the end of any reporting period are included in deferred revenue. Furthermore, we generally we do not provide our customers with any return rights.
The guidance in EITF No. 00-21,Revenue Arrangements with Multiple Deliverables,is considered inIn cases where certain elements of a sales arrangement are not delivered and accepted at the same time. In such cases,time, we defer the relative fair value of the undelivered element until that element is delivered and accepted by the customer.customer if we have fair value of all elements. In multiple-element arrangements where we only have fair value of the undelivered elements, then we apply the residual method. In order to recognize revenue associated with delivered elements, the following criteria must be met: (a) the delivered item(s) has value to the customer on a standalone basis; (b) there is objective and reliable evidence of the fair value of the undelivered item(s); and (c) delivery or performance of the undelivered item(s) is considered probable and substantially in our control. If the arrangement does not meet all the above criteria, the entire amount of the sales contract is deferred until the criteria have been met or all elements have been delivered to the customer. Objective and reliable evidence of the fair value is based on the amounts for which we sell equivalent products or services on a standalone basis. Upon recognition of product revenue, a liability is recorded for anticipated warranty costs. Service contracts may be purchased by the customer during or after the warranty period.
Allowance for Doubtful Accounts – We maintain allowances for estimated losses resulting from the inability of our customers to make required payments. Credit limits are established through a process of reviewing the financial history and stability of our customers. Where appropriate and available, we obtain credit rating reports and financial statements of customers when determining or modifying their credit limits. We regularly evaluate the collectibilitycollectability of our trade receivable balances based on a combination of factors such as the length of time the receivables are past due, customary payment practices in the respective geographies and our historical collection experience with customers. We believe that our allowance for doubtful accounts reflects our risk associated with
smaller rather than larger customers and that our reported allowances are adequate. If however, the financial conditions of customers were to deteriorate, resulting in their inability to make payments, we would assess the necessity to record additional allowances whichallowances. This would result in additional general and administrative expenses being recorded for the period in which such determination was made.
Inventories– Inventories are stated at the lower of standard cost (which approximates actual cost on a first-in, first-out basis), or market. We are exposed to a number of economic and industry factors that could result in portions of our inventory becoming either obsolete or in excess of anticipated usage, or saleable only for amounts that are less than their carrying amounts. These factors include, but are not limited to, technological changes in our market, our ability to meet changing customer requirements, competitive pressures in products and prices, and the availability of key components from our suppliers. We have established inventory reserves when conditions exist that suggest that our inventory may be in excess of anticipated demand or is obsolete based upon our assumptions about future demand for our products and market conditions. We regularly evaluate our ability to realize the value of our inventory based on a combination of factors including the following: historical usage rates, forecasted sales of usage, product end-of-life dates, estimated current and future market values and new product introductions. For demonstration inventory, we also consider the age of the inventory and potential cost to refurbish the inventory prior to sale. Demonstration inventory is amortized over its useful life and the amortization expense is included in total depreciation and amortization on our cash flow statement. When recorded, our reserves are intended to reduce the carrying value of our inventory to its net realizable value. If actual demand for our products deteriorates, or market conditions are less favorable than those that we project, additional reserves may be required.
Inventories – delivered systems – We reflect the cost of systems that were invoiced upon shipment but deferred for revenue recognition purposes separate from our inventory held for sale as “Inventories—delivered systems”.
Product Warranties – We sell the majority of our products with a twelve-month repair or replacement warranty from the date of acceptance which generally represents the date of shipment. We provide an accrual for estimated future warranty costs based upon the historical relationship of warranty costs to the cost of products sold. The estimated future warranty obligations related to product sales are reported in the period in which the related revenue is recognized. The estimated future warranty obligations are affected by the warranty periods, sales volumes, product failure rates, material usage and labor and replacement costs incurred in correcting a product failure. If actual product failure rates, material usage, labor or replacement costs differ from our estimates, revisions to the estimated warranty obligations would be required. For new product introductions where limited or no historical information exists, we may use warranty information from other previous product introductions to guide us in estimating our warranty accrual. The warranty accrual represents the best estimate of the amount necessary to settle future and existing claims on products sold as of the balance sheet date. We periodically assess the adequacy of our recorded warranty reserve and adjust the amounts in accordance with changes in these factors.
Goodwill and Intangible Assets – – Goodwill is initially recorded when the purchase price paid for an acquisition exceeds the estimated fair value of the net identified tangible and intangible assets acquired. Under Statement of Financial Accounting Standards (“SFAS”) No. 142, “Goodwill and Other Intangible Assets” (“SFAS 142”), intangible assets with finite lives are amortized over their useful lives while goodwill and indefinite lived assets are not amortized but tested annually for impairment. Our impairment review process is completed as of the last day of November of each year or whenever events or circumstances occur which indicate that an impairment might have occurred. SFAS 142The standard provides for a two-step approach to determining whether and by how much goodwill has been impaired. The first step requires a comparison of the fair value of Nanometrics’ reporting units (product and service) to its net book value. If the fair value is greater, then no impairment is deemed to have occurred. If the fair value is less, then the second step must be performed to determine the amount, if any, of actual impairment.
37
The process of evaluating the potential impairment of goodwill is highly subjective and requires significant judgment. In estimating the fair value of Nanometrics, we make estimates and judgments about future revenues and cash flows for each reporting unit. To determine the fair value, our review process includes the income method and is based on a discounted future cash flow approach that uses estimates including the following for each reporting unit: revenue, based on assumed market growth rates and our assumed market share; estimated costs; and appropriate discount rates based on the particular business’sbusiness’ weighted average cost of capital. Our estimates of market segment growth, our market segment share and costs are based on historical data, various internal estimates and certain external sources, and are based on assumptions that are consistent with the plans and estimates we are using to manage the underlying businesses. Our business consists of both established and emerging technologies and our forecasts for emerging technologies are based upon internal estimates and external sources rather than historical information. We also consider our market capitalization on the dates of our impairment tests in determining the fair value of the respective businesses. As part of the second step in determining the amount of goodwill impairment, if any, we allocate the fair value of the reporting units to all of its assets and liabilities as if the reporting units had been acquired in a business combination and the fair value of the reporting units was the price paid to acquire the reporting unit. The excess of the fair value of each reporting unit over the amount assigned to its assets and liabilities is the implied fair value of goodwill. When impairment is deemed to have occurred, we will recognize an impairment charge to reduce the carrying amount of our goodwill to its implied fair value.
Income Tax Assets and Liabilities – We account for income taxes based on SFAS 109, “Accounting for Income Taxes”, wherebysuch that deferred tax assets and liabilities must be recognized using enacted tax rates for the effect of temporary differences between the book and tax accounting for assets and liabilities. Also, deferred tax assets must be reduced by a valuation allowance if it is more likely than not that a portion of the deferred tax asset will not be realized in the future. We evaluate the deferred tax assets on a quarterly basis to determine whether or not a valuation allowance is appropriate. Factors used in this determination include future expected income and the underlying asset or liability which generated the temporary tax difference. Our income tax provision is primarily impacted by federal statutory rates, state and foreign income taxes and changes in our valuation allowance.
Stock-Based Compensation – Upon adoption of SFAS 123(R),“Share based payment”, on January 1, 2006, we began estimating–We estimate the value of employee stock options on the date of grant using the Black-Scholes model. The determination of fair value of share-based payment awards on the date of grant using an option-pricing model is affected by our stock price as well as assumptions regarding a number of highly complex and subjective variables. These variables include, but are not limited to the expected stock price volatility over the term of the awards, and actual and projected employee stock option exercise behaviors. The expected term of options granted is calculated based on the simplified method allowed by Staff Accounting Bulletin 107 and extended by Staff Accounting Bulletin 110.method. The expected volatility is based on the historical volatility of our stock price.
Restructuring Charge – During 2009, 2008 and 2007, we implemented a restructuring programprograms based on our business strategy and recorded significant accruals in connection with the restructuring program. In connection with the plan we have recorded estimated expenses for severance and other costs. In accordance with SFAS 146, “Accounting for Costs Associated with Exit or Disposal Activities”, generally costs associated with restructuring activities have been recognized when they are incurred rather than the date of a commitment to an exit or disposal plan. In addition post-employment benefits accrued for workforce reductions related to restructuring activities are accounted for under SFAS 112, “Employer’s Accounting Post-Employment Benefits”. A liability for post-employment benefits is recorded when payment is probable, the amount is reasonably estimable, and the obligation relates to rights that have vested or accumulated.
Given the significance and complexity of restructuring activities, and the timing of the execution of such activities, the restructuring process involves periodic reassessments of the estimates made at the time the original decisions were made, including evaluating market conditions for expected disposals of assets and vacancy of space. Although we believe that these estimates accurately reflect the costs of the restructuring programs, actual results may vary or differ, thereby requiring us to record additional provisions or reverse a portion of such provisions.
Recent Accounting Pronouncements
See Note 1 of the Consolidated Financial Statements for a description of recent accounting pronouncements, including the respective dates of adoption and effects on results of operations and financial condition.
Results of Operations
The following table presents our consolidated statements of operations data as a percentage of total net revenues for fiscal years ended January 2, 2010, December 27, 2008 and December 29, 2007 and December 30, 2006.2007.
| Fiscal Year | Fiscal Year | |||||||||||||||||
| 2008 | 2007 | 2006 | 2009 | 2008 | 2007 | |||||||||||||
Net revenues: | ||||||||||||||||||
Products | 74.0 | % | 86.2 | % | 83.7 | % | 64.1 | % | 74.0 | % | 86.2 | % | ||||||
Service | 26.0 | 13.8 | 16.3 | 35.9 | 26.0 | 13.8 | ||||||||||||
Total net revenues | 100.0 | 100.0 | 100.0 | 100.0 | 100.0 | 100.0 | ||||||||||||
Costs of net revenues: | ||||||||||||||||||
Cost of products | 37.9 | 43.7 | 45.7 | 34.7 | 37.9 | 43.7 | ||||||||||||
Cost of service | 18.3 | 14.2 | 17.2 | 18.2 | 18.3 | 14.2 | ||||||||||||
Total costs of net revenues | 56.2 | 57.9 | 62.9 | 52.9 | 56.2 | 57.9 | ||||||||||||
Gross profit | 43.8 | 42.1 | 37.1 | 47.1 | 43.8 | 42.1 | ||||||||||||
Operating expenses: | ||||||||||||||||||
Research and development | 16.8 | 12.7 | 14.8 | 19.1 | 16.8 | 12.7 | ||||||||||||
Selling | 17.4 | 13.4 | 17.6 | 19.6 | 17.4 | 13.4 | ||||||||||||
General and administrative | 19.3 | 14.8 | 22.1 | 19.8 | 19.3 | 14.8 | ||||||||||||
Amortization of intangibles | 3.5 | 3.9 | 5.5 | 2.0 | 3.5 | 3.9 | ||||||||||||
Restructuring charge | 1.5 | 1.5 | — | 1.5 | 1.5 | 1.5 | ||||||||||||
Gain on sale of assets | — | (1.4 | ) | — | — | — | (1.4 | ) | ||||||||||
Asset impairment | 67.1 | — | — | 2.5 | 67.1 | — | ||||||||||||
Total operating expenses | 125.6 | 44.9 | 60.0 | 64.5 | 125.6 | 44.9 | ||||||||||||
Loss from operations | (81.7 | ) | (2.8 | ) | (22.9 | ) | (17.4 | ) | (81.8 | ) | (2.8 | ) | ||||||
Other income (expense): | ||||||||||||||||||
Interest income | 0.2 | 0.1 | 0.9 | 0.1 | 0.2 | 0.1 | ||||||||||||
Interest expense | (0.6 | ) | (0.1 | ) | (0.1 | ) | (2.2 | ) | (0.6 | ) | (0.1 | ) | ||||||
Other, net | 1.6 | (0.0 | ) | (1.2 | ) | (2.5 | ) | 1.6 | — | |||||||||
Total other income (expense), net | 1.1 | (0.0 | ) | (0.4 | ) | (4.6 | ) | 1.2 | — | |||||||||
Loss before provision (benefit) for income taxes | (80.6 | ) | (2.8 | ) | (23.3 | ) | ||||||||||||
Loss before income taxes | (22.0 | ) | (80.6 | ) | (2.8 | ) | ||||||||||||
Provision (benefit) for income taxes | 0.4 | (0.1 | ) | (0.3 | ) | (0.7 | ) | 0.4 | (0.1 | ) | ||||||||
Net loss | (81.0 | )% | (2.7 | )% | (23.0 | )% | (21.3 | )% | (81.0 | )% | (2.7 | )% | ||||||
39
Fiscal years 2009, 2008 and 2007 and 2006 (ended January 2, 2010, December 27, 2008 and December 29, 2007, and December 30, 2006, respectively)
Total net revenues. Our net revenues were comprised of the following categories (in thousands, except percent):
| Fiscal Year | Fiscal Year | |||||||||||||||||||||||||
| 2008 | 2007 | Change | 2009 | 2008 | Change | |||||||||||||||||||||
Automated Metrology | $ | 40,623 | $ | 68,165 | $ | (27,542 | ) | (40 | )% | |||||||||||||||||
Materials Characterization | 19,009 | 28,960 | (9,951 | ) | (34 | )% | ||||||||||||||||||||
Automated Systems | $ | 46,386 | $ | 59,632 | $ | (13,246 | ) | (22.2 | )% | |||||||||||||||||
Integrated Systems | 15,964 | 28,924 | (12,960 | ) | (45 | )% | 2,767 | 15,964 | (13,197 | ) | (82.7 | )% | ||||||||||||||
Total product revenue | 75,596 | 126,049 | (50,453 | ) | (40 | )% | 49,153 | 75,596 | (26,443 | ) | (35.0 | )% | ||||||||||||||
Service | 26,505 | 20,241 | 6,264 | 31 | % | 27,554 | 26,505 | 1,049 | 4.0 | % | ||||||||||||||||
Total net revenues | $ | 102,101 | $ | 146,290 | $ | (44,189 | ) | (30 | )% | $ | 76,707 | $ | 102,101 | $ | (25,394 | ) | (24.9 | )% | ||||||||
| Fiscal Year | Fiscal Year | |||||||||||||||||||||||||
| 2007 | 2006 | Change | 2008 | 2007 | Change | |||||||||||||||||||||
Automated Metrology | $ | 68,165 | $ | 44,321 | $ | 23,844 | 54 | % | ||||||||||||||||||
Materials Characterization | 28,960 | 12,852 | 16,108 | 125 | % | |||||||||||||||||||||
Automated Systems | $ | 59,632 | $ | 97,125 | $ | (37,493 | ) | (38.6 | )% | |||||||||||||||||
Integrated Systems | 28,924 | 23,463 | 5,461 | 23 | % | 15,964 | 28,924 | (12,960 | ) | (44.8 | )% | |||||||||||||||
Total product revenue | 126,049 | 80,636 | 45,413 | 56 | % | 75,596 | 126,049 | (50,453 | ) | (40.0 | )% | |||||||||||||||
Service | 20,241 | 15,738 | 4,503 | 29 | % | 26,505 | 20,241 | 6,264 | (30.9 | )% | ||||||||||||||||
Total net revenues | $ | 146,290 | $ | 96,374 | $ | 49,916 | 52 | % | $ | 102,101 | $ | 146,290 | $ | (44,189 | ) | (30.2 | )% | |||||||||
In 2009, net revenues from automated systems decreased by $13.2 million compared to the comparable period in 2008, which decreases were primarily the result of a global reduction in capital spending by semiconductor manufacturers, though in the third and fourth quarters of 2009, we experienced an increase in revenues in automated metrology, in part due to increases in multi-system orders and technology upgrades in both the memory and logic sections, strong sales of our thin-film and OCD systems, increasing traction with our Caliper Mosaic™ overlay product, and further penetration into high-growth segments such as high-brightness LEDs. In 2009, integrated systems decreased by $13.2 million when compared to 2008 due primarily to reduced market demand. Sales of our integrated systems are highly dependent on, and driven by, manufacturing companies expanding their capacity. Given current global economic conditions, manufacturing companies have not been expanding their capacity; and therefore, sales of our systems to these companies have declined. Service revenue improved by $1.0 million over the comparable period in 2008, primarily due to higher in-the-field tool upgrades.
In 2008, net revenues from automated metrologysystems decreased by $28$37.5 million, and from integrated systems by $13$13.0 million when compared to 2007 due to global reductions in capital spending by the majority of semiconductor manufacturers. Service revenue improved by $6.3 million over 2007 primarily due to increased demand for OCD in-the-field upgrades to existing tools, as well as improved service field practices.
In 2007, net revenues from automated metrology increased $24 million as compared to 2006 reflecting demand for our automated and integrated products as semiconductor manufacturers continue to increase their manufacturing capacity. Also contributing to the higher revenues in 2007 was a full year of sales from Accent and Soluris related products. Incremental revenues from Accent and Soluris related products for 2007, over the comparable 2006 levels, was $14.1 million. Service revenue increased reflecting a full year of service activity from our Accent and Soluris acquisitions which contributed to higher sales of parts and services, due in part to a larger installed base of systems. In addition, we experienced a higher level of in-the-field tool upgrades than in the previous year.
Gross margins. Our gross margin breakdown was as follows (in percent):
| Fiscal Year | Fiscal Year | |||||||||||||||||
| 2008 | 2007 | 2006 | 2009 | 2008 | 2007 | |||||||||||||
Products | 48.8 | % | 49.3 | % | 45.4 | % | 45.9 | % | 48.8 | % | 49.3 | % | ||||||
Service | 29.5 | % | (2.4 | )% | (5.5 | )% | 49.2 | % | 29.5 | % | (2.4 | )% | ||||||
The product gross margin in 2009 moved downward from 2008, from 48.8% to 45.9%, as a result of lower revenues and also changes in product mix. Service gross margin improved in 2009 from 29.5% to 49.2% due to a significant increase in service upgrade revenues, which have a higher gross margin relative to our core service revenues. The continued operation of our core service department in a more efficient manner, including improvements to our job scheduling process also contributed to the improvement of our service gross margins.
The product gross margin in 2008 moved slightly downward from 2007, from 49.3% to 48.8%, as a result of lower volume partially offset by improved manufacturing efficiencies.spending cuts. Service gross margin improved in 2008 from (2.4)% to 29.5%, with the favorable contribution from in-the-field tool upgrades, which tend to achieve higher gross margins than our core service revenues, and our focus on controlling personnel-related expenses.
The product gross margin increased in 2007 as compared to 2006 due to improved efficiencies achieved from both higher volumes and the integration of manufacturing operations for Accent and Soluris related products. Also, contributing to the higher gross margin in 2007 were lower warranty expenses of $0.8 million due to improvements in product reliability. The improvement in gross margin for Service in 2007 reflects the favorable margin achieved from our in-the-field tool upgrades and our focus on controlling expenses including personnel, personnel related expenses and material costs as compared to 2006.
Operating expenses. Our operating expenses were comprised of the following categories (in thousands):
| Fiscal Year | |||||||||||||||||||||||||||||
| 2009 | 2008 | Change | |||||||||||||||||||||||||||
Research and development | $ | 14,672 | $ | 17,110 | $ | (2,438 | ) | (14.2 | )% | ||||||||||||||||||||
Selling | 15,072 | 17,798 | (2,726 | ) | (15.3 | )% | |||||||||||||||||||||||
General and administrative | 15,168 | 19,689 | (4,521 | ) | (23.0 | )% | |||||||||||||||||||||||
Amortization of intangible assets | 1,535 | 3,531 | (1,996 | ) | (56.5 | )% | |||||||||||||||||||||||
Operating expenses before restructuring or impairment | $ | 46,447 | $ | 58,128 | $ | (11,681 | ) | (20.1 | )% | ||||||||||||||||||||
Restructuring charge | 1,134 | 1,525 | (391 | ) | (25.6 | )% | |||||||||||||||||||||||
Asset impairment | 1,899 | 68,545 | (66,646 | ) | (97.2 | )% | |||||||||||||||||||||||
Total operating expenses | $ | 49,480 | $ | 128,198 | $ | (78,718 | ) | (61.4 | )% | ||||||||||||||||||||
| Fiscal Year | Fiscal Year | ||||||||||||||||||||||||||||
| 2008 | 2007 | Change | 2008 | 2007 | Change | ||||||||||||||||||||||||
Research and development | $ | 17,110 | $ | 18,577 | $ | (1,467 | ) | (7.9 | )% | $ | 17,110 | $ | 18,577 | $ | (1,467 | ) | (7.9 | )% | |||||||||||
Selling | 17,798 | 19,561 | (1,763 | ) | (9.0 | )% | 17,798 | 19,561 | (1,763 | ) | (9.0 | )% | |||||||||||||||||
General and administrative | 19,689 | 21,704 | (2,015 | ) | (9.3 | )% | 19,689 | 21,704 | (2,015 | ) | (9.3 | )% | |||||||||||||||||
Amortization of intangible assets | 3,531 | 5,782 | (2,251 | ) | (38.9 | )% | 3,531 | 5,782 | (2,251 | ) | (38.9 | )% | |||||||||||||||||
Operating expenses before restructuring, impairment or gain on asset sale | $ | 58,128 | $ | 65,624 | $ | (7,496 | ) | (11.4 | )% | $ | 58,128 | $ | 65,624 | $ | (7,496 | ) | (11.4 | )% | |||||||||||
Restructuring charge | 1,525 | 2,128 | (603 | ) | (28.3 | )% | 1,525 | 2,128 | (603 | ) | (28.3 | )% | |||||||||||||||||
Asset impairment | 68,545 | — | 68,545 | 100.0 | % | 68,545 | — | 68,545 | 100.0 | % | |||||||||||||||||||
Gain on sale of assets | — | (2,100 | ) | 2,100 | (100.0 | )% | — | (2,100 | ) | 2,100 | (100.0 | )% | |||||||||||||||||
Total operating expenses | $ | 128,198 | $ | 65,652 | $ | 62,546 | 95.3 | % | $ | 128,198 | $ | 65,652 | $ | 62,546 | 95.3 | % | |||||||||||||
| Fiscal Year | |||||||||||||||||||||||||||||
| 2007 | 2006 | Change | |||||||||||||||||||||||||||
Research and development | $ | 18,577 | $ | 14,253 | $ | 4,324 | 30.3 | % | |||||||||||||||||||||
Selling | 19,561 | 16,977 | 2,584 | 15.2 | % | ||||||||||||||||||||||||
General and administrative | 21,704 | 21,305 | 399 | 1.9 | % | ||||||||||||||||||||||||
Amortization of intangible assets | 5,782 | 5,338 | 444 | 8.3 | % | ||||||||||||||||||||||||
Operating expenses before restructuring or gain on asset sale | $ | 65,624 | $ | 57,873 | $ | 7,751 | 13.4 | % | |||||||||||||||||||||
Restructuring charge | 2,128 | — | 2,128 | 100.0 | % | ||||||||||||||||||||||||
Gain on sale of assets | (2,100 | ) | — | (2,100 | ) | 100.0 | % | ||||||||||||||||||||||
Total operating expenses | $ | 65,652 | $ | 57,873 | $ | 7,779 | 13.4 | % | |||||||||||||||||||||
Research and development.
Research and development costs decreased by $2.4 million in 2009 compared to 2008, primarily due to lower labor costs of $2.1 million as a result of headcount reduction from 92 to 82, respectively, and forced time off, and a $0.4 million reduction in travel costs.
The $1.5 million decrease in research and development expenses in 2008 compared to 2007 was primarily due to lower engineering materials costspatent legal fees of $0.5 million, lower stock-based compensation expense of $0.3 million and reduced outside consulting fees related to the development of next generation stages of $0.3 million.
The increase in research and development in 2007 of $4.3 million reflected expenses for the full year related to the additional headcount and related development expenses associated with our acquisitions of Accent in July 2006 and Soluris in March 2006, partially offset by lower stock-based compensation chargesproducts of $0.3 million.
Selling.
Selling expenses decreased by $2.7 million in 2009 primarily due to lower labor costs of $1.5 million as a result of headcount reduction from 111 to 103, respectively, and forced time off in 2009, reduction in travel costs of $0.7 million, and lower trade show expenses of $0.2 million.
Selling expenses decreased by $1.8 million in 2008 compared to 2007. Contributing to the decrease were lower commission expenses of $0.4 million, and lower freight out, supplies, taxes and otherselling labor costs of approximately $0.9$0.8 million, associated with the decrease in revenue. Depreciation expense decreasedlower depreciation expenses of $0.2 million for 2008 and lower costs for the Company’s TaiwanTaiwanese pension plan decreasedof $0.3 million for 2008.
41
million.
Selling expenses increased $2.6 million for the year 2007 over 2006, reflecting expenses for the full year related to the additional headcount and related expenses associated with the acquisitions of Accent in July 2006 and Soluris in March 2006, and also including higher commission expenses of $0.4 million associated with higher revenue levels.
General and administrative.
General and administrative expenses decreased by $4.5 million in 2009 primarily due to lower labor costs of $3.0 million as a result of headcount reduction from 60 to 53, respectively, and forced time off in 2009, lower stock- based compensation of $0.9 million, lower costs associated with regulatory and compliance accounting of $0.7 million, and lower travel costs of $0.3 million, offset by increased legal fees of $0.7 million primarily related to the Zygo acquisition, ongoing litigation and the Option Exchange Program.
General and administrative expenses decreased by $2.0 million in 2008 as a result of a $1.0 million decrease in litigation expenses, a $0.8 million decrease in headcount-related expenses as a result of a contraction of our administrative staff headcount, and a $0.6 million decrease in regulatory and compliance accounting costs. These decreases were offset by increased stock-based compensation expense of $0.4 million. The decrease in litigation expenses resulted from the settlement ofan agreement on our patent infringement lawsuit with Nova Measuring during 2007 and the granting of a stay pending re-examination of the patents-in-suit in the KLA-Tencor litigation.
General and administrative expenses in 2007 increased slightly overAmortization of intangible assets.
Amortization of intangible assets for 2009 decreased by $2.0 million from the comparable period of 2006in 2008, primarily as a result of termination charges for certain senior executives of $0.8 million, consulting, travel and recruiting expenses of $0.9 million and costs associated with enhancing our internal information technology infrastructure of $1.7 million. The 2007 increases were partially offset by lower legal expenses of $0.6 million as we settled the patent litigation with Novaan impairment charge taken against these assets in April 2007; lower regulatory and accounting compliance costs of $1.4 million and lower stock-based compensation charges of $0.7 million.
Amortization of intangible assets.2008.
Amortization of intangible assets for 2008 decreased $2.3 million from the comparable period in 2007 as impairment charges were recorded in the second and third quarters of 2008 to reflect.The reductions in the fair values were associated with certain brand names, customer relationships and developed technology at their fair valuetechnology.
Restructuring charge.
Restructuring costs decreased by $0.4 million in accordance2009. The restructuring charges associated with SFAS No. 144 “Accounting51 and 25 employees respectively for the Impairment or Disposalfirst and second quarter of Long-lived Assets”.Amortization associated with these intangible assets ceased2009 were $0.7 million and $0.4 million. Twelve (12) of the employees terminated in the second and third quarter of 2008 as we wrote off values to2009 were in connection with the asset impairment account.
Amortizationclosure of intangible assets for 2007 increased $0.4 million from the comparable periodour South Korea manufacturing facility. The higher restructuring costs in 2006 due primarily to incurring amortization charges for the full year in 2007 as2008, compared to incurring amortization for only a part2009, were attributed to workforce reduction of the year in 2006, as the Soluris acquisition closed in March 2006higher salaried and the Accent acquisition closed in July 2006.
Restructuring charge.longer tenure employees.
Restructuring costs decreased by $0.6 million in 2008. The restructuring charges associated with 30 and 34 employees respectively for the first and third quarter of 2008 were $0.9 million and $0.7 million. Costs in 2008 included amounts associated with reductions in our global workforce and was aimed at improving our variable to fixed cost ratio and elimination of overlap within our business entities. Costs in 2007 of $2.1 million were primarily associated with a write-down of our Milpitas, California machine shop and plating facility as part of a strategy to reverse manufacturing vertical integration and lower the breakeven point.
During the third quarter of 2007, we announced that we would close our Milpitas, California machine shop and plating facility as part of our mission to reverse our manufacturing vertical integration and lower our breakeven point. In conjunction with this closure, we recorded a restructuring charge of $2.1 million consisting of $1.9 million write-down of fixed assets, $0.1 million for professional fees and $0.1 million for severance payments. No restructuring charges were recorded in 2006.
Asset impairment.
Asset impairment charges of $68.5 million were recorded in 2008, resulting from write-downs of goodwill, intangible assets and property, plant and equipment.
Goodwill represents the excess of the purchase price paid over the fair value of tangible and identifiable intangible net assets acquired in a business combination. In accordance with SFAS 142 goodwill is reviewed annually or whenever events or circumstances occur which indicate that goodwill might be impaired. SFAS 142 provides for a two-step approach to determining whether and by how much goodwill has been impaired. The first step requires a comparison of the fair value of the Company (reporting units, product and service) to its net book value. If the fair value is greater, then no impairment is deemed to have occurred. If the fair value is less, then the second step must be performed to determine the amount, if any, of actual impairment. The process of evaluating the potential impairment of goodwill is highly subjective and requires significant judgment.
Prior to performing step one of the goodwill impairment testing process for a reporting unit under SFAS 142, if there is reason to believe that other non-goodwill related intangible assets (finite or indefinite lived) and/or long-lived assets may be impaired, these other intangible assets and long-lived assets must first be tested for impairment under SFAS 144. Assets governed by SFAS 144 require a recoverability test whereby the gross undiscounted cash flows are determined specific to the asset. If the sum of gross undiscounted cash flows for the fixed-life intangible asset or long-lived asset exceeds the carrying value of that asset, the test results in no impairment to the asset. If not, then the fair value of the asset must be determined and the impairment is measured by the differential between the fair value and the carrying value. For non-goodwill related indefinite-lived assets, a fair value determination is made. If the carrying value of the asset exceeds the fair value, then impairment occurs. The carrying values of these assets are impaired as necessary to provide the appropriate carrying value for the goodwill impairment calculation.
As a result of a significant decrease in our net revenues and stock price during the second quarter 2008, the Company determined that indicators of impairment existed for our goodwill and long-lived assets in the second quarter of 2008. Accordingly, in accordance with SFAS 142 and SFAS 144, the Company performed impairment tests relative to its long-lived assets and goodwill during the second quarter of 2008 for its reporting units, product and service. As a result of this testing, while the Company determined that there was no impairment of goodwill, the Company recorded a pre-tax, non-cash impairment charge of $11.8 million for intangible assets and $1.5 million for other long-lived assets during the second quarter 2008.
During the third quarter 2008, as a result of continued significant declines in the Company’s stock price and further evidence of the semiconductor industry being in a prolonged cyclical downturn, the Company determined that indicators of impairment existed for our goodwill and long-lived assets in the third quarter of 2008. Accordingly, in accordance with SFAS 142 and SFAS 144, the Company performed impairment tests to its long-lived assets and goodwill during the third quarter of 2008 for its reporting units, product and service. As a result of this testing, the Company determined and recorded a pre-tax, non-cash impairment charge of $54.0 million for goodwill and $1.4 million for intangible assets during the third quarter 2008. The $54.0 million represented 100% impairment of the goodwill balance. The Company also determined that there was no impairment of other long-lived assets at the end of third quarter 2008.
During the fourth quarter 2008, due to the continued and prolonged semiconductor cyclical downturn, the Company determined that indicators of impairment existed for our long-lived assets and, in accordance with SFAS 144, the Company performed impairment tests to its long-lived assets during the fourth quarter of 2008. The Company determined that no impairment existed as of the end of fourth quarter 2008 for its long-lived assets and intangible assets.
The process of evaluating the potential impairment of long-lived assets is highly subjective and requires significant judgment. In estimating the fair value of these assets, the Company made estimates and judgments about future revenues and cash flows. The Company’s forecasts were based on assumptions that are consistent with the plans and estimates the Company is using to manage the business. Changes in these estimates could change the Company’s conclusion regarding impairment of the long-lived assets and potentially result in future impairment charges for all or a portion of their balance at December 27, 2008.
43
Due to the decline in our forecasted revenues for certain product lines relating to specific intangible assets acquired in the 2006 acquisitions of Accent Optical Technologies, Inc. and Soluris, Inc., as well as the weakening conditions in the semiconductor equipment market, the Company performed an analysis in accordance with SFAS 144. The Company performed step one of the impairment test for certain of its long-lived assets as of June 28, 2008 and September 27, 2008, and determined that the net book value exceeded the undiscounted future cash flows for certain intangible assets. Accordingly, the Company completed step two of the impairment analysis utilizing a present value technique to estimate the fair value of the impaired assets. As a result of this analysis, in the second and third quarters of 2008 the Company recorded $13.1 million in impairment charges for intangible assets, of which $3.7 million was developed technology, $7.5 million was customer relationships, $1.6 million was brand names and $0.3 million was trade mark.
Also in accordance with SFAS 144, the Company performed impairment tests for other long-lived assets such as property, plant and equipment during 2008. The Company performed an impairment analysis on its long-lived assets associated with its machine shop and plating facility, which was subcontracted in 2007, due to the significant reduction in forecasted future cash flows resulting from the operational limitations of the facility. Due to these reduced forecasts, the Company performed step one of the impairment test for the machine shop and plating facility as of June 28, 2008, and determined that the net book value exceeded the undiscounted future cash flows. Accordingly, the Company completed step two of the impairment analysis utilizing a present value technique to estimate the fair value of the impaired assets. As a result of this analysis,2009, we recognized an impairment charge of $1.5$1.9 million was recorded infrom the second quarter of 2008 to reduce those assets to fair value. The Company also performed step one of the impairment test on the remainder of its long lived assets in the second, third, and fourth quarters of 2008, and determined that no impairment existed.
After considering the results of the intangible and long-lived asset impairments as determined under SFAS 144, the Company then proceeded with step one of its impairment testing of goodwill under SFAS 142. The Company compared the fair value of each reporting unit to its carrying value and determined whether or not the reporting units were impaired as of June 28, 2008 and September 27, 2008.
In 2008, in estimating the fair value of the Company, the Company made estimates and judgments about future revenues and cash flows for each reporting unit. To determine the fair value, the Company’s review process included the income method based on a discounted future cash flow approach that uses estimates including the following for each reporting unit: revenue, based on assumed market growth rates and its assumed market share; estimated costs; and appropriate discount rates based on the particular business’s weighted average cost of capital. The Company’s estimates of market segment growth, market segment share and costs are based on historical data, various internal estimates and certain external sources, and are based on assumptions that are consistent with the plans and estimates it uses to manage the underlying businesses. The Company’s business consists of both established and emerging technologies and its forecasts for emerging technologies are based upon internal estimates and external sources rather than historical information. The Company also considered its market capitalization on the dates of its impairment tests in determining the fair value of the respective businesses. The Company completed the first step of the SFAS 142 test of its goodwill at June 28, 2008 and determined that the fair value of its reporting units was in excess of the net book value on that date, and hence there was no impairment of goodwill as of the endclosure of our second quarter 2008.
In accordance with SFAS 142,South Korea manufacturing facility, which closure was primarily due to the Company concluded that events had occurred and circumstances had changed during the third quarter of 2008 which might indicate the existence of impairment indicators including a significant decline in the Company’s stock price and continued deterioration inchallenging economic conditions facing the semiconductor equipment market and the related impact on revenue forecasts of each reporting unit. Consistent with the Company’s approachindustry. See Note 4 for discussion in its annual impairment testing, in assessing the fair value of the reporting unit, the Company considered both the market approach and income approach. Under the market approach, the fair value of the reporting unit is based on quoted market prices and the number of shares outstanding of the Company’s common stock. Under the income approach, the fair value of the reporting unit is based on the present value of estimated future cash flows. At September 27,“Assets held for sale”.
During 2008, the Company determined that the fair value of its reporting units was
less than the net book value of the net assets of each reporting unit and accordingly, the Company performed step two of the impairment test.
In step two of the impairment test, the Company determined the implied fair value of the goodwill and compared it to the carrying value of the goodwill. With the assistance of a third party valuation firm, the Company allocated the fair value of the reporting units to all of its assets and liabilities as if the reporting unit had been acquired in a business combination and the fair value of the reporting units was the price paid to acquire the reporting unit. The excess of the fair value of the reporting unit over the amount assigned to its assets and liabilities is the implied fair value of goodwill. The Company’s step two analysis resulted in no implied fair value of goodwill, and therefore, the Companywe recognized an impairment charge of $54.0 million, in the third quarter of 2008, representing a write-off of the entire amount of the Company’sour previously recorded goodwill, including goodwill from the Tevet acquisition whichand an impairment charge $13.1 million was a partrecorded to reflect certain brand names and developed technology intangible assets at their fair value. We also recorded an impairment charge of the impaired reporting units.$1.5 million to account for machine shop related assets at its fair value.
Gain on the sale of assets.
In August 2007 we entered into a contract to sell a parcel of land and building in Japan and realized a gain on the sale of $1.1 million. In addition, the sale of a condominium in California was consummated in July 2007 and we realized a gain of $0.2 million in the third quarter of 2007. We also sold other non-strategic assets during the third quarter of 2007 realizing a gain of $0.8 million. We had no asset sale gains in 2008.2008 and 2009.
Other income (expense).
Our net other income (expense) consisted of the following categories (in thousands):
| Fiscal Year | Fiscal Year | |||||||||||||||||||||||||||||
| 2008 | 2007 | Change | 2009 | 2008 | Change | |||||||||||||||||||||||||
Interest income | $ | 185 | $ | 202 | $ | (17 | ) | (8.4 | )% | $ | 53 | $ | 185 | $ | (132 | ) | (71.4 | )% | ||||||||||||
Interest expense | (635 | ) | (211 | ) | 424 | 200.9 | % | (1,658 | ) | (635 | ) | (1,023 | ) | 161.1 | % | |||||||||||||||
Other income (expense) | 1,624 | (13 | ) | 1,637 | NM | * | (1,927 | ) | 1,624 | (3,551 | ) | NM | * | |||||||||||||||||
Total other income (expense), net | $ | 1,174 | $ | (22 | ) | $ | 1,196 | NM | * | $ | (3,532 | ) | $ | 1,174 | $ | (4,706 | ) | NM | * | |||||||||||
* NM = not meaningful | ||||||||||||||||||||||||||||||
| Fiscal Year | Fiscal Year | |||||||||||||||||||||||||||||
| 2007 | 2006 | Change | 2008 | 2007 | Change | |||||||||||||||||||||||||
Interest income | $ | 202 | $ | 851 | $ | (649 | ) | (76.3 | )% | $ | 185 | $ | 202 | $ | (17 | ) | (8.4 | )% | ||||||||||||
Interest expense | (211 | ) | (60 | ) | (151 | ) | 251.7 | % | (635 | ) | (211 | ) | (424 | ) | 200.9 | % | ||||||||||||||
Other income (expense) | (13 | ) | (1,116 | ) | 1,103 | (98.8 | )% | 1,624 | (13 | ) | 1,637 | NM | * | |||||||||||||||||
Total other income (expense), net | $ | (22 | ) | $ | (325 | ) | $ | 303 | (93.2 | )% | $ | 1,174 | $ | (22 | ) | $ | 1,196 | NM | * | |||||||||||
* NM = not meaningful | ||||||||||||||||||||||||||||||
We incurred higher interest expenses from the comparable period in 2008 due to the Company’s borrowing of $13.5 million in connection with a mortgage against our headquarter premises entered into during July 2008 and the imputed interest of $0.6 million on fair value of deferred payments to Zygo Corporation related to our acquisition of certain assets and entry into a supply agreement with Zygo Corporation. We incurred foreign exchange loss of $1.7 million due to exchange rate fluctuations associated with our intercompany balances among our various global entities.
Interest income decreased slightly in 2008 from the comparable period in 2007 as a result of slightly higher average cash and cash equivalent balances being offset by lower yields obtained on our investments. Higher interest expense in 2008 resulted from the issuance of debt obligations in the third quarter of 2008 and the sale of receivables without recourse in Japan. Other income (expense) includes foreign exchange gains/losses, commission income and rental income and miscellaneous expenses. Higher other income in 2008 resulted from foreign exchange gains due to exchange rate fluctuations associated with foreign entities’ balances denominated in non-US currencies that were settled during 2008, or for intercompany balances otherwise considered not permanent“non-permanent” investments.
In 2007, lower interest income is due to lower average cash and cash equivalent balances and lower yields obtained on our investments. Interest expenses relate to our debt obligations in Japan, which were fully paid in July 2007, and the United Kingdom. In addition we incur interest expense associated with the sale of our
45
accounts receivable. With the acquisition of Accent in 2006, we incurred foreign exchange losses due to exchange rate fluctuations associated with extensive intercompany balances assumed with the transaction.
Provision/Benefit for income taxes.
The Company’s benefit for income taxes for 2009 of $0.6 million was primarily a result of release of foreign income tax reserves and benefiting from refundable tax credits in the US and UK. A provision for income taxes for 2008 of $0.4 million was primarily a result of foreign income taxes. A benefit for income taxes in 2007 of $0.0 million and in 2006 of $0.3 millionis nominal, which was primarily due to benefiting the losses of certain foreign jurisdictions where sufficient deferred tax liabilities exist. Our effective tax rate was (3.4)%, 0.5%, and (0.8)% in 2009, 2008 and (1.4%) in 2008, 2007, and 2006, respectively. In the future, we will continue to review our expectations for future taxable income to determine the amount of valuation allowance necessary to reserve against deferred tax assets.
Liquidity and Capital Resources
At December 27, 2008,January 2, 2010, our cash and cash equivalents totaled $24.0$43.5 million compared to $14.9$24.0 million as of December 29, 2007.27, 2008. At December 27, 2008,January 2, 2010, we had working capital of $57.7$76.8 million compared to $57.1$57.9 million at December 29, 2007.27, 2008.
Operating activities used cash of $5.8 million for the twelve-month period ended January 2, 2010 primarily as a result of our net loss of $16.3 million, offset by certain non-cash charges including $6.1 million amortization and depreciation, $1.9 million of asset impairment, and $2.1 million of stock-based compensation. Operating activities provided cash of $4.0$2.4 million for the twelve-month period ended December 27, 2008 resulting from our $82.7 million net loss being offset by certain non-cash charges including $68.5 million of impairment charges for long-lived assets, $8.4 million of amortization and depreciation and $3.9 million in stock-based compensation, and increases attributable to changes in our net current assets and liabilities of $6.7 million. Operating activities provided cash of $2.7$2.9 million for the twelve-month period ended December 29, 2007 resulting from our net loss of $4.0 million being offset by certain non-cash charges such as $10.9 million of amortization and depreciation, $3.8 million of stock-based compensation and increases in working capital of $6.9$7.0 million due primarily to increases in accounts receivable of $9.5 million reflecting the increase in our revenues. Uses
Investing activities for the twelve-month period ended January 2, 2010 used cash of $0.6 million related to cash outlays of $0.8 million in capital equipment, offset by net cash for operating activities was $16.7 million for 2006 was comprisedreceived from the release of a net lossfunds held in escrow in connection with our acquisition of $22.1 million, increases in inventories of $11.3 million offset by reductions of accounts receivable of $4.2 million and non-cash expenses of $13.2 million. The non-cash expenses were comprised of $8.6 million in depreciation and amortization and stock-based compensation of $5.0 million.
Tevet Process Control Technologies, Ltd. (“Tevet”). Investing activities for the twelve-month period ended December 27, 2008 used cash of $6.0 million primarily related to cash outlays of $3.4 million for ourthe Tevet acquisition of Tevet Process Control Technologies, Ltd. (“Tevet”) and capital equipment acquisitions of $3.2 million. Investing activities provided net cash of $2.4 million in 2007 and used cash of $3.8 million in 2006.2007. In 2007, we received sales proceeds of $3.8 million from the sale of assets (see preceding discussion for “Gain on sale of assets”) offset by capital expenditures of $1.4 million. Cash used by investing
For the twelve-month period ended January 2, 2010, financing activities for 2006provided cash of $3.8$26.0 million. Proceeds were from a follow-on public offering of our common stock of $23.3 million, included cash outlayscombined with $3.0 million of $7.5 million relatedproceeds from the sale of Company shares to our acquisitions of Solurisemployees through the Company’s Stock Option and AccentStock Purchase plans, and capital expenditures of $1.1 millionwere offset by the net reduction in our short-term investments, primarily United States Treasury Bills$0.3 million for repayment of $5.0 million.
debt obligation. For the twelve-month period ended December 27, 2008, financing activities provided cash of $11.8 million. Proceeds were from the issuance of $13.2 million of debt, obligation (excluding issuance costs), as more fully described below, and $0.8 million from the sale of stock from employee stock plans and purchase plan and were offset by $1.9 million used for the repurchase of our common stock and $0.2 million for debt payments. Financing activities provided net cash of $1.8 million 2007 and used net cash of $13.2 million in 2006, respectively.2007. Cash provided by financing activities for 2007 resulted from the $4.1 million of proceeds of sale of common stock under our employee stock purchase and stock option plans offset by the repayment of debt of $1.5 million and repurchases of stock of $0.7 million. Cash used by financing activities for 2006 was due
In December 2009, we completed a public offering of our common stock resulting in the net proceeds of $23.3 million. We plan to repayments of short-term and long-term debt in Japan of $1.6 million and repayment of $14.0use approximately $2.0 million of debt assumed in the Accent acquisition. These amounts were partially offset bynet proceeds from the saleoffering to repay certain obligations related to the Company’s acquisition of stock fromcertain assets of Zygo Corporation in June 2009, with the exercise of employee stock options of $2.0 million.remainder to be used for general corporate purposes, including working capital.
In February 2007, we entered into a two-yeartwo year agreement subsequently extended until May 2009, for a revolving line of credit facility with a maximum principal amount of up to $15$15.0 million. On April 30, 2009, Nanometrics renegotiated its revolving line of credit facility and extended the term for an additional two years, to April 30, 2011. The instrument governing the facility includes certain financial covenants regarding minimum liquidity ratio and net tangible worth. All borrowings under this credit line bear interest, at our election, at a per annum rate equal to the bank’s prime referenced rate or at the London Interbank Offered Rate (or LIBOR) plus 2.25%.2.75% The revolving line of credit agreement includes a provision for the issuance of commercial or standby letters of credit by the bank on our behalf. The value of all letters of credit outstanding reduces the total line of credit available. We had no outstanding letters of credit against this line as of January 2, 2010. The revolving line of credit is collateralized by a blanket lien on all of our domestic assets excluding intellectual property and real estate. We may use the proceeds of any future borrowing under this credit facility for general corporate purposes. WhileOn June 15, 2009, we anticipate we will renewamended the linefinancial covenants governing the credit facility to reduce the net tangible worth requirements, effective as of credit,June 27, 2009.
We borrowed $7.0 million during fiscal year 2009 and also repaid the present economic conditionsamounts in the banking and financing industry are very volatile and uncertain. We may be unable to renew the line of credit under the same general terms and conditions under which we presently operate.full during fiscal year 2009.
In July 2008, we entered into a loan agreement pursuant to which we borrowed $13.5 million. The loan initially bears interest at the rate of 7.18% per annum, which rate will be reset after five years to 3.03% over the then weekly average yield of five-year U.S.U.S Dollar Interest Rate Swaps as published by the Federal Reserve. Monthly principal and interest payments are based on a twenty year amortization for the first sixty months and fifteenfifteen- year amortization thereafter. The remaining principal balance of the loan and any accrued but unpaid interest will be due on August 1, 2018. The loan is secured, in part, by a lien on and security interest in the building and land comprising our principal offices in Milpitas, California. We
On June 17, 2009, we announced a strategic business partnership with Zygo Corporation whereby Nanometrics has purchased inventory and certain other assets from Zygo Corporation and the two companies have entered into a supply agreement. The Company will usemake payments to Zygo Corporation (with a present value of $5.7 million as of January 2, 2010) over a period of time as acquired inventory is sold and other aspects of the loan for general corporate purposes.supply agreement are executed. A payment of $2.0 million of inventory and fixed assets was made to Zygo Corporation on January 7, 2010, in accordance with the terms of the acquisition agreement.
We have evaluated and will continue to evaluate the acquisitionacquisitions of products, technologies or businessesbusiness that are complementary to our business. These activities may result in product and business investments, which may affect our cash position and working capital balances. Some of these activities might require significant cash outlays. For example in the third quarter of 2007, our Board of Directors authorized a $4.0 million stock repurchase program, of up to $4 million, of which there remains $1.3 million available for future repurchases. However, wepurchases. We believe our working capital including cash and cash equivalents will be sufficient to meet our needs through the next twelve months.
Off-Balance Sheet Arrangements
None.
Contractual obligations
The following table summarizes our contractual cash obligations as of December 27, 2008,January 2, 2010, and the effect such obligations are expected to have on liquidity and cash flow in future periods (in thousands):
| Payments due by period | Payments due by period | |||||||||||||||||||||||||||||
| Total | Less than 1 Year | 1-3 Years | 3-5 Years | More than 5 Years | Total | Less than 1 Year | 1-3 Years | 3-5 Years | More than 5 Years | |||||||||||||||||||||
Debt obligations | $ | 13,496 | $ | 413 | $ | 711 | $ | 822 | $ | 11,550 | $ | 13,082 | $ | 343 | $ | 764 | $ | 884 | $ | 11,091 | ||||||||||
Fair value of deferred payments to Zygo Corporation related to acquisition | $ | 5,688 | $ | 3,655 | $ | 957 | $ | 930 | $ | 146 | ||||||||||||||||||||
Other long-term liabilities | $ | 644 | $ | — | $ | 162 | $ | — | $ | 482 | $ | 847 | $ | — | $ | 646 | $ | — | $ | 201 | ||||||||||
Operating lease obligations | $ | 1,689 | $ | 649 | $ | 604 | $ | 436 | $ | — | $ | 4,153 | $ | 1,317 | $ | 1,132 | $ | 691 | $ | 1,013 | ||||||||||
Total | $ | 23,770 | $ | 5,315 | $ | 3,499 | $ | 2,505 | $ | 12,451 | ||||||||||||||||||||
We maintain certain open inventory purchase agreements with our suppliers to ensure a smooth and continuous supply chain for key components. Our liability in these purchase commitments is generally restricted to a forecasted time-horizon as mutually agreed upon between the parties. This forecast time-horizon can vary among different suppliers. We estimate our open inventory purchase commitment as of December 27, 2008January 2, 2010 was approximately $7.8$13.4 million. Actual expenditures will vary based upon the volume of the transactions and length of contractual service provided. In addition, the amounts paid under these arrangements may be less in the event that the arrangements are renegotiated or cancelled. Certain agreements provide for potential cancellation penalties.
Recent Accounting Pronouncements
See Note 1 of the Consolidated Financial Statements for a description of recent accounting pronouncements, including the respective dates of adoption and effects on results of operations and financial condition.
47
| ITEM 7A. | QUANTITATIVE AND QUALITATIVE DISCLOSURES ABOUT MARKET RISK |
We are exposed to financial market risks related to foreign currency exchange rates and interest rates. We do not use derivative financial instruments.
Foreign Currency Risk
A substantial part of our business consists of sales made to customers outside the United States: 70.5%70.3%, 68.2%70.5% and 65.0%68.2% of sales in 2009, 2008 2007 and 2006,2007, respectively. A portion of the net revenues we receive from such sales is denominated in currencies other than the U.S. dollar. Additionally, portions of our costs of net revenues and our other operating expenses are incurred by our international operations and denominated in local currencies. Foreign currency transactions resulted in a loss for 2009 of $1.7 million, a gain for 2008 of $1.0$1.5 million, and a loss for years 2007 and 2006 of $0.2 million and $1.2 million, respectively. In addition, our exposure to foreign exchange rate fluctuations arises in part from current intercompany accounts in which costs from the United States and the United Kingdom are charged to our foreign subsidiaries. These current intercompany accounts are denominated in U.S. dollars, Japanese yen and British pounds sterling and the net payable from the United States parent amounted to $1.6$6.6 million as of December 27, 2008.January 2, 2010. A hypothetical 10% change in the foreign currency exchange rate at December 27, 2008January 2, 2010 would result in an increase or decrease of approximately $0.2$0.7 million in transaction gains or losses which would be included in our statement of operations.
In foreign locations we have $4.8$5.5 million of net liabilities, including long-term loans payable of $17.3$27.2 million to the United States. As of December 27, 2008, the $17.3 million in long-term loans between Japan and the U.S. are no longer being considered as permanently invested. A hypothetical 10% increase in the foreign currency exchange rate at December 27, 2008January 2, 2010 would result in $1.7$3.3 million in exchange losses in the statement of operations and a $1.2$2.7 million increase in other comprehensive income.
Interest Rate Risk
At January 2, 2010, December 27, 2008 and December 29, 2007, the Company did not hold investments in marketable securities. We have fixed-rate debt obligations in the United Kingdom that are denominated in British pounds sterling and have no interest rate risk. In July 2008, we entered into a loan agreement pursuant to which we borrowed $13.5 million. The loan initially bears interest at the rate of 7.18% per annum, which rate will be reset after five years to 3.03% over the then weekly average yield of five-year U.S. Dollar Interest Rate Swaps as published by the Federal Reserve. Monthly principal and interest payments are based on a twenty year amortization for the first sixty months and fifteen year amortization thereafter. The remaining principal balance of the loan and any accrued but unpaid interest will be due on August 1, 2018. The loan is secured, in part, by a lien on and security interest in the building and land comprising our principal offices in Milpitas, California. At January 2, 2010 and December 27, 2008, and December 29, 2007, our total debt obligation was $13.5$13.1 million and $0.3 million,$13.5million, respectively, with a long-term portion of $13.1$12.7 million and $0.1 million,$13.1million, respectively. A hypothetical 10% change in interest rates at December 27, 2008January 2, 2010, would have an impact of about $0.1 million on our results of operations.
| ITEM 8. | FINANCIAL STATEMENTS AND SUPPLEMENTARY DATA |
The information required by Item 8 of Form 10-K is presented here in the following order:
INDEX TO CONSOLIDATED FINANCIAL STATEMENTS
| Page | ||
Consolidated Statements of Stockholders’ Equity and Comprehensive | ||
49
Report of Independent Registered Public Accounting Firm
Board of Directors and Stockholders
Nanometrics Incorporated
Milpitas, California
We have audited the accompanying consolidated balance sheets of Nanometrics Incorporated as of January 2, 2010 and December 27, 2008, and December 29, 2007, and the related consolidated statements of operations, stockholders’ equity and comprehensive loss,income (loss), and cash flows for each of the three years in the period ended December 27, 2008.January 2, 2010. In connection with our audits of the financial statements, we have also audited the consolidated financial statement schedule listed in Item 15. These financial statements and schedule are the responsibility of the Company’s management. Our responsibility is to express an opinion on these financial statements and schedule based on our audits.
We conducted our audits in accordance with the standards of the Public Company Accounting Oversight Board (United States). Those standards require that we plan and perform the audit to obtain reasonable assurance about whether the financial statements are free of material misstatement. The Company is not required to have, nor were we engaged to perform, an audit of its internal control over financial reporting. Our audits included consideration of internal control over financial reporting as a basis for designing audit procedures that are appropriate in the circumstances, but not for the purpose of expressing an opinion on the effectiveness of the Company’s internal control over financial reporting. Accordingly, we express no such opinion. An audit also includes examining, on a test basis, evidence supporting the amounts and disclosures in the financial statements, assessing the accounting principles used and significant estimates made by management, as well as evaluating the overall presentation of the financial statements and schedule. We believe that our audits provide a reasonable basis for our opinion.
In our opinion, the consolidated financial statements referred to above present fairly, in all material respects, the financial position of Nanometrics Incorporated at January 2, 2010 and December 27, 2008, and December 29, 2007, and the results of its operations and its cash flows for each of the three years in the period ended December 27, 2008January 2, 2010, in conformity with accounting principles generally accepted in the United States of America.
Also, in our opinion, the financial statement schedule, when considered in relation to the basic consolidated financial statements taken as a whole, presentspresent fairly, in all material respects, the information set forth therein.
As discussed in Note 1 to the consolidated financial statements, the Company adopted FASB No. 141(R) Business Combinations, codified in ASC 805, Business Combinations, effective December 28, 2008.
/s/ BDO Seidman, LLP
San Francisco, California
March 27, 200926, 2010
CONSOLIDATED BALANCE SHEETS
(In thousands, except share amounts)
| December 27, 2008 | December 29, 2007 | January 2, 2010 | December 27, 2008 | |||||||||||||
| ASSETS | ||||||||||||||||
Current assets: | ||||||||||||||||
Cash and cash equivalents | $ | 23,980 | $ | 14,919 | $ | 43,526 | $ | 23,980 | ||||||||
Accounts receivable, net of allowances of $309 and $323, respectively | 17,143 | 34,855 | ||||||||||||||
Accounts receivable, net of allowances of $241 and $309, respectively | 23,047 | 17,143 | ||||||||||||||
Inventories | 31,583 | 33,343 | 31,472 | 31,583 | ||||||||||||
Inventories- delivered systems | 205 | 785 | 1,175 | 205 | ||||||||||||
Assets held for sale | 220 | — | ||||||||||||||
Prepaid expenses and other | 1,838 | 2,598 | 2,182 | 1,838 | ||||||||||||
Deferred income taxes | 350 | — | 245 | 350 | ||||||||||||
Total current assets | 75,099 | 86,500 | 101,867 | 75,099 | ||||||||||||
Property, plant and equipment, net | 40,136 | 44,419 | 36,365 | 40,136 | ||||||||||||
Goodwill and indefinite lived intangible asset | — | 52,532 | ||||||||||||||
Intangible assets, net | 6,901 | 21,820 | 7,067 | 6,901 | ||||||||||||
Deferred income tax assets – long term | 612 | — | ||||||||||||||
Other assets | 1,718 | 1,805 | 1,559 | 1,718 | ||||||||||||
Total assets | $ | 123,854 | $ | 207,076 | $ | 147,470 | $ | 123,854 | ||||||||
| LIABILITIES AND STOCKHOLDERS’ EQUITY | ||||||||||||||||
Current liabilities: | ||||||||||||||||
Revolving line of credit | $ | — | $ | — | $ | — | $ | — | ||||||||
Accounts payable | 4,824 | 13,931 | 5,762 | 4,824 | ||||||||||||
Accrued payroll and related expenses | 3,435 | 4,514 | 4,012 | 3,435 | ||||||||||||
Deferred revenue | 1,701 | 2,501 | 5,162 | 1,539 | ||||||||||||
Other current liabilities | 5,800 | 7,243 | 8,952 | 5,800 | ||||||||||||
Income taxes payable | 1,187 | 1,101 | 865 | 1,187 | ||||||||||||
Current portion of debt obligations | 413 | 148 | 343 | 413 | ||||||||||||
Total current liabilities | 17,360 | 29,438 | 25,096 | 17,198 | ||||||||||||
Deferred income taxes | — | 382 | ||||||||||||||
Deferred revenue | 646 | 162 | ||||||||||||||
Other long-term liabilities | 644 | 1,283 | 2,235 | 644 | ||||||||||||
Debt obligations | 13,083 | 129 | 12,739 | 13,083 | ||||||||||||
Total liabilities | 31,087 | 31,232 | 40,716 | 31,087 | ||||||||||||
Commitments and contingencies (See Note 12) | ||||||||||||||||
Commitments and contingencies (See Note 13) | ||||||||||||||||
Stockholders’ equity: | ||||||||||||||||
Preferred stock, $0.001 par value; 3,000,000 shares authorized; no shares issued or outstanding | — | — | — | — | ||||||||||||
Common stock, $0.001 par value per share; 47,000,000 shares authorized; 18,413,054 and 18,620,682 respectively, outstanding | 18 | 19 | ||||||||||||||
Common stock, $0.001 par value per share; 47,000,000 shares authorized; 21,506,791 and 18,413,054 respectively, outstanding | 21 | 18 | ||||||||||||||
Additional paid-in capital | 189,927 | 187,180 | 218,308 | 189,927 | ||||||||||||
Accumulated deficit | (96, 643 | ) | (13,917 | ) | (112,948 | ) | (96,643 | ) | ||||||||
Accumulated other comprehensive income (loss) | (535 | ) | 2,562 | 1,373 | (535 | ) | ||||||||||
Total stockholders’ equity | 92,767 | 175,844 | 106,754 | 92,767 | ||||||||||||
Total liabilities and stockholders’ equity | $ | 123,854 | $ | 207,076 | $ | 147,470 | $ | 123,854 | ||||||||
See notes to consolidated financial statements.
51
CONSOLIDATED STATEMENTS OF OPERATIONS
(In thousands, except per share amounts)
| Years Ended | Years Ended | |||||||||||||||||||||||
| December 27, 2008 | December 29, 2007 | December 30, 2006 | January 2, 2010 | December 27, 2008 | December 29, 2007 | |||||||||||||||||||
Net revenues: | ||||||||||||||||||||||||
Products | $ | 75,596 | $ | 126,049 | $ | 80,636 | $ | 49,153 | $ | 75,596 | $ | 126,049 | ||||||||||||
Service | 26,505 | 20,241 | 15,738 | 27,554 | 26,505 | 20,241 | ||||||||||||||||||
Total net revenues | 102,101 | 146,290 | 96,374 | 76,707 | 102,101 | 146,290 | ||||||||||||||||||
Costs of net revenues: | ||||||||||||||||||||||||
Cost of products | 38,692 | 63,938 | 44,016 | 26,594 | 38,692 | 63,938 | ||||||||||||||||||
Cost of service | 18,675 | 20,717 | 16,610 | 13,992 | 18,675 | 20,717 | ||||||||||||||||||
Total costs of net revenues | 57,367 | 84,655 | 60,626 | 40,586 | 57,367 | 84,655 | ||||||||||||||||||
Gross profit | 44,734 | 61,635 | 35,748 | 36,121 | 44,734 | 61,635 | ||||||||||||||||||
Operating expenses: | ||||||||||||||||||||||||
Research and development | 17,110 | 18,577 | 14,253 | 14,672 | 17,110 | 18,577 | ||||||||||||||||||
Selling | 17,798 | 19,561 | 16,977 | 15,072 | 17,798 | 19,561 | ||||||||||||||||||
General and administrative | 19,689 | 21,704 | 21,305 | 15,168 | 19,689 | 21,704 | ||||||||||||||||||
Amortization of intangibles assets | 3,531 | 5,782 | 5,338 | 1,535 | 3,531 | 5,782 | ||||||||||||||||||
Restructuring charge | 1,525 | 2,128 | — | 1,134 | 1,525 | 2,128 | ||||||||||||||||||
Gain on sale of assets | — | (2,100 | ) | — | — | — | (2,100 | ) | ||||||||||||||||
Asset impairment | 68,545 | — | — | 1,899 | 68,545 | — | ||||||||||||||||||
Total operating expenses | 128,198 | 65,652 | 57,873 | 49,480 | 128,198 | 65,652 | ||||||||||||||||||
Loss from operations | (83,464 | ) | (4,017 | ) | (22,125 | ) | (13,359 | ) | (83,464 | ) | (4,017 | ) | ||||||||||||
Other income (expense): | ||||||||||||||||||||||||
Interest income | 185 | 202 | 851 | 53 | 185 | 202 | ||||||||||||||||||
Interest expense | (635 | ) | (211 | ) | (60 | ) | (1,658 | ) | (635 | ) | (211 | ) | ||||||||||||
Other, net | 1,624 | (13 | ) | (1,116 | ) | (1,927 | ) | 1,624 | (13 | ) | ||||||||||||||
Total other income (expense), net | 1,174 | (22 | ) | (325 | ) | (3,532 | ) | 1,174 | (22 | ) | ||||||||||||||
| �� | ||||||||||||||||||||||||
Loss before income taxes | (82,290 | ) | (4,039 | ) | (22,450 | ) | (16,891 | ) | (82,290 | ) | (4,039 | ) | ||||||||||||
Provision (benefit) for income taxes | 436 | (31 | ) | (323 | ) | (586 | ) | 436 | (31 | ) | ||||||||||||||
Net loss | $ | (82,726 | ) | $ | (4,008 | ) | $ | (22,127 | ) | $ | (16,305 | ) | $ | (82,726 | ) | $ | (4,008 | ) | ||||||
Basic net loss per share | $ | (4.46 | ) | $ | (0.22 | ) | $ | (1.47 | ) | $ | (0.87 | ) | $ | (4.46 | ) | $ | (0.22 | ) | ||||||
Diluted net loss per share | $ | (4.46 | ) | $ | (0.22 | ) | $ | (1.47 | ) | $ | (0.87 | ) | $ | (4.46 | ) | $ | (0.22 | ) | ||||||
Shares used in per share computation: | ||||||||||||||||||||||||
Basic | 18,546 | 18,099 | 15,075 | 18,639 | 18,546 | 18,099 | ||||||||||||||||||
Diluted | 18,546 | 18,099 | 15,075 | 18,639 | 18,546 | 18,099 | ||||||||||||||||||
See notes to consolidated financial statements.
CONSOLIDATED STATEMENTS OF STOCKHOLDERS’ EQUITY AND
COMPREHENSIVE LOSS
(In thousands, except share amounts)
| Common Stock | Additional Paid-In Capital | Retained Earnings (Accumulated Deficit) | Accumulated Other Comprehensive Income (Loss) | Total Stockholders’ Equity | Comprehensive Loss | Common Stock | Additional Paid-In Capital | Accumulated Deficit | Accumulated Other Comprehensive Income (Loss) | Total Stockholders’ Equity | Comprehensive Income (Loss) | |||||||||||||||||||||||||||||||||||||||||||
| Shares | Amount | |||||||||||||||||||||||||||||||||||||||||||||||||||||
Balances, January 1, 2006 | 12,990,894 | $ | 107,294 | $ | — | $ | 12,218 | $ | 831 | $ | 120,343 | |||||||||||||||||||||||||||||||||||||||||||
Reincorporation in Delaware | (107,281 | ) | 107,281 | — | ||||||||||||||||||||||||||||||||||||||||||||||||||
Comprehensive loss: | ||||||||||||||||||||||||||||||||||||||||||||||||||||||
Net loss | — | — | — | (22,127 | ) | — | (22,127 | ) | $ | (22,127 | ) | |||||||||||||||||||||||||||||||||||||||||||
Other comprehensive income, net of tax: | ||||||||||||||||||||||||||||||||||||||||||||||||||||||
Foreign currency translation adjustments | — | — | — | — | 1,595 | 1,595 | 1,595 | |||||||||||||||||||||||||||||||||||||||||||||||
Comprehensive loss | — | — | — | — | — | — | $ | (20,532 | ) | |||||||||||||||||||||||||||||||||||||||||||||
Issuance of common stock under stock-based compensation plans | 285,481 | — | 1,970 | — | — | 1,970 | ||||||||||||||||||||||||||||||||||||||||||||||||
Stock-based compensation expense | — | — | 5,025 | — | — | 5,025 | ||||||||||||||||||||||||||||||||||||||||||||||||
Issuance of common stock in the Accent acquisition | 4,865,214 | 5 | 67,820 | — | — | 67,825 | ||||||||||||||||||||||||||||||||||||||||||||||||
| Shares | Amount | Additional Paid-In Capital | Accumulated Deficit | Accumulated Other Comprehensive Income (Loss) | Total Stockholders’ Equity | Comprehensive Income (Loss) | ||||||||||||||||||||||||||||||||||||||||||||||||
Balances, December 30, 2006 | 18,141,589 | $ | 18 | 182,096 | (9,909 | ) | 2,426 | 174,631 | 18,141,589 | $ | 18 | |||||||||||||||||||||||||||||||||||||||||||
Comprehensive loss: | ||||||||||||||||||||||||||||||||||||||||||||||||||||||
Net loss | — | — | — | (4,008 | ) | — | (4,008 | ) | $ | (4,008 | ) | — | — | — | (4,008 | ) | — | (4,008 | ) | $ | (4,008 | ) | ||||||||||||||||||||||||||||||||
Other comprehensive income, net of tax: | ||||||||||||||||||||||||||||||||||||||||||||||||||||||
Employee benefit plan adjustment | (345 | ) | (345 | ) | (345 | ) | (345 | ) | (345 | ) | (345 | ) | ||||||||||||||||||||||||||||||||||||||||||
Foreign currency translation adjustments | — | — | — | — | 481 | 481 | 481 | — | — | — | — | 481 | 481 | 481 | ||||||||||||||||||||||||||||||||||||||||
Comprehensive loss | — | — | — | — | — | $ | (3,872 | ) | — | — | — | — | — | — | $ | (3,872 | ) | |||||||||||||||||||||||||||||||||||||
Issuance of common stock under stock-based compensation plans | 717,374 | 1 | 4,093 | — | — | 4,094 | 717,374 | 1 | 4,093 | — | — | 4,094 | ||||||||||||||||||||||||||||||||||||||||||
Stock-based compensation expense | — | — | 3,767 | — | — | 3,767 | — | — | 3,767 | — | — | 3,767 | ||||||||||||||||||||||||||||||||||||||||||
Accent purchase price adjustment | (146,826 | ) | — | (2,037 | ) | — | — | (2,037 | ) | (146,826 | ) | — | (2,037 | ) | — | — | (2,037 | ) | ||||||||||||||||||||||||||||||||||||
Repurchases of common stock | (91,455 | ) | — | (739 | ) | — | — | (739 | ) | (91,455 | ) | — | (739 | ) | — | — | (739 | ) | ||||||||||||||||||||||||||||||||||||
Balances, December 29, 2007 | 18,620,682 | $ | 19 | $ | 187,180 | $ | (13,917 | ) | $ | 2,562 | $ | 175,844 | 18,620,682 | $ | 19 | $ | 187,180 | $ | (13,917 | ) | $ | 2,562 | $ | 175,844 | ||||||||||||||||||||||||||||||
Comprehensive loss: | ||||||||||||||||||||||||||||||||||||||||||||||||||||||
Net loss | — | — | — | (82,726 | ) | — | (82,726 | ) | $ | (82,726 | ) | — | — | — | (82,726 | ) | — | (82,726 | ) | $ | (82,726 | ) | ||||||||||||||||||||||||||||||||
Other comprehensive income, net of tax: | ||||||||||||||||||||||||||||||||||||||||||||||||||||||
Employee benefit plan adjustment | 157 | 157 | 157 | 157 | 157 | 157 | ||||||||||||||||||||||||||||||||||||||||||||||||
Foreign currency translation adjustments | — | — | — | — | (3,254 | ) | (3,254 | ) | (3,254 | ) | — | — | — | — | (3,254 | ) | (3,254 | ) | (3,254 | ) | ||||||||||||||||||||||||||||||||||
Comprehensive loss | — | — | — | — | — | $ | (85,823 | ) | — | — | — | — | — | $ | (85,823 | ) | ||||||||||||||||||||||||||||||||||||||
Issuance of common stock under stock-based compensation plans | 339,424 | 806 | — | — | 806 | 339,424 | — | 806 | — | — | 806 | |||||||||||||||||||||||||||||||||||||||||||
Stock-based compensation expense | — | — | 3,881 | — | — | 3,881 | — | — | 3,881 | — | — | 3,881 | ||||||||||||||||||||||||||||||||||||||||||
Repurchases of common stock | (547,052 | ) | (1 | ) | (1,940 | ) | — | — | (1,941 | ) | (547,052 | ) | (1 | ) | (1,940 | ) | — | — | (1,941 | ) | ||||||||||||||||||||||||||||||||||
Balances, December 27, 2008 | 18,413,054 | $ | 18 | $ | 189,927 | $ | (96,643 | ) | $ | (535 | ) | $ | 92,767 | 18,413,054 | $ | 18 | $ | 189,927 | $ | (96,643 | ) | $ | (535 | ) | $ | 92,767 | ||||||||||||||||||||||||||||
Comprehensive loss: | ||||||||||||||||||||||||||||||||||||||||||||||||||||||
Net loss | — | — | — | (16,305 | ) | — | (16,305 | ) | $ | (16,305 | ) | |||||||||||||||||||||||||||||||||||||||||||
Other comprehensive income, net of tax: | ||||||||||||||||||||||||||||||||||||||||||||||||||||||
Employee benefit plan adjustment | 110 | 110 | 110 | |||||||||||||||||||||||||||||||||||||||||||||||||||
Foreign currency translation adjustments | — | — | — | — | 1,798 | 1,798 | 1,798 | |||||||||||||||||||||||||||||||||||||||||||||||
Comprehensive loss | — | — | — | — | — | $ | (14,397 | ) | ||||||||||||||||||||||||||||||||||||||||||||||
Issuance of common stock under stock-based compensation plans | 786,585 | 1 | 3,037 | — | — | 3,038 | ||||||||||||||||||||||||||||||||||||||||||||||||
Common stock offering, net of $426 offering costs | 2,307,152 | 2 | 23,290 | — | — | 23,292 | ||||||||||||||||||||||||||||||||||||||||||||||||
Stock-based compensation expense | — | — | 2,054 | — | — | 2,054 | ||||||||||||||||||||||||||||||||||||||||||||||||
Balances, January 2, 2010 | 21,506,791 | $ | 21 | $ | 218,308 | $ | (112,948 | ) | $ | 1,373 | $ | 106,754 | ||||||||||||||||||||||||||||||||||||||||||
See notes to consolidated financial statements.
53
CONSOLIDATED STATEMENTS OF CASH FLOWS
(In thousands, except share amounts)
| Years Ended | Years Ended | |||||||||||||||||||||||
| December 27, 2008 | December 29, 2007 | December 30, 2006 | January 2, 2010 | December 27, 2008 | December 29, 2007 | |||||||||||||||||||
Cash flows from operating activities: | ||||||||||||||||||||||||
Net loss | $ | (82,726 | ) | $ | (4,008 | ) | $ | (22,127 | ) | $ | (16,305 | ) | $ | (82,726 | ) | $ | (4,008 | ) | ||||||
Reconciliation of net loss to net cash provided by (used in) operating activities: | ||||||||||||||||||||||||
Depreciation and amortization | 8,429 | 10,936 | 8,604 | 6,092 | 8,429 | 10,936 | ||||||||||||||||||
Stock-based compensation | 3,881 | 3,767 | 5,025 | 2,054 | 3,881 | 3,767 | ||||||||||||||||||
Asset impairment | 68,545 | — | — | 1,899 | 68,545 | — | ||||||||||||||||||
Loss (gain) on disposal of asset | (72 | ) | (2,100 | ) | 21 | 82 | (72 | ) | (2,100 | ) | ||||||||||||||
Accounts receivable reserves | 381 | — | — | |||||||||||||||||||||
Deferred taxes | (771 | ) | (847 | ) | (437 | ) | (426 | ) | (771 | ) | (847 | ) | ||||||||||||
Non-cash portion of restructuring charges | — | 1,910 | — | — | — | 1,910 | ||||||||||||||||||
Changes in assets and liabilities, net of effects of acquisitions: | ||||||||||||||||||||||||
Unrealized foreign exchange loss (gain) | 939 | (1,518 | ) | 216 | ||||||||||||||||||||
Fair value changes of deferred payments to Zygo Corporation related to acquisition | 596 | — | — | |||||||||||||||||||||
Changes in assets and liabilities, net of effects of assets acquired and liabilities assumed in acquisitions: | ||||||||||||||||||||||||
Accounts receivable | 18,304 | (9,519 | ) | 4,218 | (6,352 | ) | 18,304 | (9,519 | ) | |||||||||||||||
Inventories | (145 | ) | 1,905 | (7,945 | ) | 1,948 | (145 | ) | 1,905 | |||||||||||||||
Inventories – delivered systems | 580 | 3,427 | (3,307 | ) | (975 | ) | 580 | 3,427 | ||||||||||||||||
Prepaid expenses and other | 1,172 | 1,403 | (799 | ) | (113 | ) | 1,172 | 1,403 | ||||||||||||||||
Accounts payable, accrued and other liabilities | (12,714 | ) | 3,302 | (6,129 | ) | 775 | (12,714 | ) | 3,302 | |||||||||||||||
Deferred revenue | (777 | ) | (7,748 | ) | 6,223 | 3,941 | (777 | ) | (7,748 | ) | ||||||||||||||
Income taxes payable | 261 | 243 | (86 | ) | (291 | ) | 261 | 243 | ||||||||||||||||
Net cash provided by (used in) operating activities | 3,967 | 2,671 | (16,739 | ) | (5,755 | ) | 2,449 | 2,887 | ||||||||||||||||
Cash flows from investing activities: | ||||||||||||||||||||||||
Acquisitions of businesses and assets, net of cash acquired | (3,357 | ) | — | (7,538 | ) | |||||||||||||||||||
Sales/maturities of short-term investments | — | — | 4,949 | |||||||||||||||||||||
Cash received from Tevet on escrow settlement | 215 | — | — | |||||||||||||||||||||
Purchase of Tevet’s net assets, net of cash received | — | (3,357 | ) | — | ||||||||||||||||||||
Purchases of property, plant and equipment | (3,237 | ) | (1,434 | ) | (1,183 | ) | (822 | ) | (3,237 | ) | (1,434 | ) | ||||||||||||
Proceeds from sale of assets | 625 | 3,863 | — | |||||||||||||||||||||
Proceeds from sale of property, plant and equipment | 9 | 625 | 3,863 | |||||||||||||||||||||
Net cash provided by (used in) investing activities | (5,969 | ) | 2,429 | (3,772 | ) | (598 | ) | (5,969 | ) | 2,429 | ||||||||||||||
Cash flows from financing activities: | ||||||||||||||||||||||||
Proceeds from issuance of debt obligations, net of issuance costs | 13,203 | — | 424 | — | 13,203 | — | ||||||||||||||||||
Borrowings from line of credit | 7,000 | — | — | |||||||||||||||||||||
Repayment of line of credit | (7,000 | ) | — | — | ||||||||||||||||||||
Repayments of debt obligations | (243 | ) | (1,536 | ) | (15,578 | ) | (319 | ) | (243 | ) | (1,536 | ) | ||||||||||||
Repurchase of stock | (1,941 | ) | (739 | ) | — | — | (1,941 | ) | (739 | ) | ||||||||||||||
Proceeds from issuance of common stock under employee stock purchase and stock option plans | 806 | 4,094 | 1,970 | 3,038 | 806 | 4,094 | ||||||||||||||||||
Proceeds from issuance of common stock offering, net of $426 offering costs | 23,292 | — | — | |||||||||||||||||||||
Net cash provided by (used in) financing activities | 11,825 | 1,819 | (13,184 | ) | ||||||||||||||||||||
Net cash provided by financing activities | 26,011 | 11,825 | 1,819 | |||||||||||||||||||||
Effect of exchange rate changes on cash and cash equivalents | (762 | ) | 43 | 1,207 | (112 | ) | 756 | (173 | ) | |||||||||||||||
Net increase (decrease) in cash and cash equivalents | 9,061 | 6,962 | (32,488 | ) | ||||||||||||||||||||
Net increase in cash and cash equivalents | 19,546 | 9,061 | 6,962 | |||||||||||||||||||||
Cash and cash equivalents, beginning of year | 14,919 | 7,957 | 40,445 | 23,980 | 14,919 | 7,957 | ||||||||||||||||||
Cash and cash equivalents, end of year | $ | 23,980 | $ | 14,919 | $ | 7,957 | $ | 43,526 | $ | 23,980 | $ | 14,919 | ||||||||||||
Supplemental disclosure of cash flow information: | ||||||||||||||||||||||||
Cash paid for interest | $ | 623 | $ | 149 | $ | 46 | $ | 1,038 | $ | 623 | $ | 149 | ||||||||||||
Cash paid (received) for income taxes, net | $ | 797 | $ | 462 | $ | (22 | ) | |||||||||||||||||
Cash paid for income taxes | $ | 153 | $ | 797 | $ | 462 | ||||||||||||||||||
Capitalization of inventory as property, plant and equipment | $ | 255 | $ | 6,746 | $ | — | $ | 1,166 | $ | 255 | $ | 6,746 | ||||||||||||
Goodwill adjustment (Note 8) | $ | — | $ | 2,685 | $ | — | ||||||||||||||||||
Goodwill decrease – deferred tax liability adjustment and settlement of escrow shares related to Accent acquisition | $ | — | $ | — | $ | 2,685 | ||||||||||||||||||
Fair value of Nanometrics shares issued to former Accent stockholders | $ | — | — | $ | 67,481 | |||||||||||||||||||
Fair value of deferred payments to Zygo Corporation related to acquisition (see Note 3) | $ | 5,092 | $ | — | $ | — | ||||||||||||||||||
Fair value of Nanometrics shares issued to former Accent optionees | $ | — | — | $ | 344 | |||||||||||||||||||
See notes to consolidated financial statements.
NOTES TO CONSOLIDATED FINANCIAL STATEMENTS
Years Ended January 2, 2010, December 27, 2008 and December 29, 2007 and December 30, 2006
Note 1. Significant Accounting Policies
| Note 1. | Significant Accounting Policies |
Description of Business– Nanometrics Incorporated (“Nanometrics” or the “Company”) and its wholly owned subsidiaries design, manufacture, market, sell and support thin film, optical critical dimension and overlay dimension metrology systems used primarily in the manufacturing of semiconductors, solar photovoltaics (PVs)PVs and high-brightness LEDs (HB-LEDs),HB-LEDs, as well as by customers in the silicon wafer and data storage industries. These metrology systems precisely measure a wide range of film types deposited on substrates during manufacturing in order to control manufacturing processes and increase production yields in the fabrication of integrated circuits. The thin film metrology systems use a broad spectrum of wavelengths, high-sensitivity optics, proprietary software, and patented technology to measure the thickness and uniformity of films deposited on silicon and other substrates as well as their chemical composition. The Company’s optical critical dimension technology is a patented critical dimension measurement technology that is used to precisely determine the dimensions on the semiconductor wafer that directly control the resulting performance of the integrated circuit devices. The overlay metrology systems are used to measure the overlay accuracy of successive layers of semiconductor patterns on wafers in the photolithography process. The corporate headquarters of Nanometrics is located in Milpitas, California.
Basis of Presentation – The consolidated financial statements include Nanometrics Incorporated and its wholly-owned subsidiaries. The results of operations of our newly acquired Tevet Process Control Technologies (“Tevet”) were included in the Company’s consolidated statement of operations from the date of acquisition (see Note 2). All significant intercompany accounts and transactions have been eliminated in consolidation.
Fiscal Year – The Company uses a 52/53 week fiscal year ending on the Saturday nearest to December 31. Accordingly, 2009 consisted of 53 weeks ending January 2, 2010 (fiscal year 2009), 2008 consisted of 52 weeks ending December 27, 2008 (fiscal year 2008), and 2007 consisted of 52 weeks and ended on December 29, 2007 and 2006 consisted of 52 weeks and ended on December 30, 2006.(fiscal year 2007).
Reclassification – TheIn the cash flow statement for fiscal years 2008 and 2007, the Company reclassifies certain prior year amountsreclassified $(1.5) million and $0.2 million, respectively, from the effect of exchange rate changes on cash and cash equivalents line item to unrealized foreign exchange loss (gain) to conform to the current presentation. During 2008, the Company determined that amortization of demonstration systems, which was previously recorded on the cash flow statement as a reduction in the carrying value of its inventories, should be reclassified to the depreciation and amortization line item on the cash flow statement. Amortization of demonstration systems which was $1.2 million,reclassified for the year 2007 was $1.6 million and $0.8 million for fiscal years 2008, 2007 and 2006, respectively.million.
Use of Estimates– The preparation of financial statements in conformity with accounting principles generally accepted in the United States of America requires management to make estimates and assumptions that affect the reported amounts of assets and liabilities and disclosure of contingent assets and liabilities at the date of the financial statements and the reported amounts of revenues and expenses during the reportingreported period. Actual results could differ materially from those estimates. Estimates are used for, but not limited to, revenue recognition, the provision for doubtful accounts, the provision for excess, obsolete, or slow moving inventories, depreciation and amortization, valuation of intangible assets and long-lived assets, warranty reserves, income taxes, valuation of stock-based compensation, and contingencies.
Foreign Currency Translation – The assets and liabilities of foreign subsidiaries are translated from their respective local functional currencies at exchange rates in effect at the balance sheet date and income and expense accounts are translated at average exchange rates during the reporting period. Resulting translation adjustments are reflected in “Accumulated other comprehensive income,” a component of stockholders’ equity. Foreign currency transaction gains and losses are reflected in “Other income”income (expense)” in the consolidated statements of operations in the period incurred and consist of a loss for 2009 of $1.7 million, income for 2008 of $1.5 million, and a loss for 2007 of $0.2 million, respectively. As of December 27, 2008, the Company reclassified loans with our Japanese subsidiary from permanent to non-permanent in order to repatriate cash back to the U.S to fund the Company’s working capital requirements. When intercompany loans are no longer considered permanent, any changes in foreign currency rates for such loans are to be recorded as a period charge on the statement of operations rather than a component in equity. As a result of the loan reclassification and substantial strengthening of foreign currencies versus the dollar during the fiscal year ended 2009, there were expenses of $1.7 million included in “Other, net” expense on the statement of operations for that period, $0.9 million of which was “non-cash expense.”
55
NANOMETRICS INCORPORATED
NOTES TO CONSOLIDATED FINANCIAL STATEMENTS—(Continued)
Years Ended January 2, 2010, December 27, 2008 and December 29, 2007 and December 30, 2006
operations in the period incurred and consist of a gain for 2008 of $1.0 million and a loss for years 2007 and 2006 of $0.2 million and $1.2 million, respectively.
Revenue Recognition – The Company recognizesWe recognize revenue when persuasive evidence of an arrangement exists, delivery has occurred or services have been rendered, the seller’s price is fixed or determinable, and collectibilitycollectability is reasonably assured. We derive revenue from the sale of process control metrology systems (“Product revenue”) as well as spare part sales, billable service, service contracts, and upgrades (together “Service revenue”). Upgrades are a group of parts that change the existing configuration of a product and are included in Service revenue. They are distinguished from Product revenue, includeswhich consists of complete, standalone process control metrology systems. Our systems consist of hardware and alsoof software thatwhich is incidental to the products as defined pursuant to AICPA Statement of Position (“SOP”) No. 97-2,Software Revenue Recognition. The Company derives revenue from three sources—sales of its process control metrology systems, spare part sales and, in certain arrangements, separately stated service contracts. Service revenue includes product upgrades. The Company’s arrangements for sales of its systems often include customer-specified objective acceptance criteria. The Company’s systems include hardware and software that is incidental to the system. The Companysystems. We periodically reviewsreview the software element of its equipmentour systems in accordance with AICPA Statement of Position (“SOP”) No. 97-2,Software Revenue Recognition, and Emerging Issues Task Force (“EITF”) Issue No. 03-05,Applicability of SP 97-2 to Non-Software Deliverables in an Arrangement Containing More-Than-Incidental Software, to ascertain that the software continues to be incidental. Our arrangements for sales of our systems often include customer-specified objective acceptance criteria.
For product sales to existing customers, revenue recognition occurs at the time title and risk of loss transfer, which usually occurs upon delivery, if the Company haswe have reliably demonstrated that the product has successfully met the defined customer specified criteria, and all other recognition criteria has been met. This occurs at the time of shipment, as the Company’sour terms are FOB shipping point. For initial sales of product where the Company haswe have not previously met the defined customer acceptance criteria, product revenues are recognized upon the earlier of receipt of written customer acceptance or expiration of the contractual acceptance period. In Japan, where the Company’sour contractual terms with the customer specify risk of loss and title transfers upon customer acceptance, revenue is recognized upon receipt of written customer acceptance, provided that all other recognition criteria have been met.
All of the Company’sour products are assembled prior to shipment to itsour customers. The CompanyWe often performsperform installation for itsour customers; however such installation is inconsequential and perfunctory as it may also be performed by third parties and is not considered essential to the functionality of the equipment.
Revenue related to spare partspart sales is recognized upon shipmentshipment. Revenue related to billable service is recognized as the services are performed and if billable service and spare parts are sold together, revenue is included as part ofrecognized when both the parts are delivered and the service revenue. Service revenue also includesis completed. For service contracts, spare parts, and non-warranty and billable repairs of systems, and product upgrades. Whereas service revenue related to service contracts is recognized ratably over the period underservice contract service revenue related to billable repairs of systemsperiod. Revenue on upgrades is recognized as services are performed and service parts are delivered.when the upgrade has been delivered to the customer. For initial upgrade sales where we have not previously met the defined customer acceptance criteria, if any, revenue is recognized upon the early of receipt of written customer acceptance or expiration of the contractual acceptance period. On occasion, customers request a warranty period longer than the Company’sour standard 12 month warranty. In those instances where extended warranty services are separately quoted to the customer, the Company follows the guidance of Financial Accounting Standards Board Technical Bulletin 90-1,“Accounting for Separately Priced Extended Warranty and Product Maintenance Contracts,”associated revenue is deferred and recognized to incomeas service revenue ratably over the term of the contract. Unearned maintenanceThe portion of service contracts and service contract revenue isextended warranty services agreements that are uncompleted at the end of any reporting period are included in deferred revenue. Furthermore, we generally the Company doesdo not provide itsour customers with any return rights.
The guidance in EITF No. 00-21,Revenue Arrangements with Multiple Deliverables,is considered inIn cases where certain elements of a sales arrangement are not delivered and accepted at the same time. In such cases, the Company deferstime, we defer the relative fair value of the undelivered element until that element is delivered and accepted by the customer.customer if we have fair value of all elements. In multiple-element arrangements where we only have fair value of the undelivered elements, then we apply the residual method. In order to recognize revenue associated with delivered elements, the following criteria must be met: (a) the delivered item(s) has value to the customer on a standalone basis; (b) there is objective and reliable evidence of the fair value of the undelivered item(s); and (c) delivery or performance of the undelivered item(s)
NANOMETRICS INCORPORATED
NOTES TO CONSOLIDATED FINANCIAL STATEMENTS—(Continued)
Years Ended December 27, 2008, December 29, 2007 and December 30, 2006
is considered probable and substantially in the control of the Company.our control. If the arrangement does not meet all the above criteria, the entire amount of the sales contract is deferred until the criteria have been met or all elements have been delivered to the customer. Objective and reliable evidence of the fair value is based on the amounts for which the Company sellswe sell equivalent products or services on a standalone basis. Upon recognition of product revenue, a liability is recorded for anticipated warranty costs. Service contracts may be purchased by the customer during or after the warranty period.
Cash and Cash Equivalents – Cash and cash equivalents include cash andThe Company considers all highly liquid debt instrumentsinvestments with original maturities of three months or less when purchased.purchased to be cash equivalents.
Fair Value of Financial Instruments – Financial instruments include cash and cash equivalents, accounts receivable, accounts payable and debt obligations. Cash equivalents are stated at fair market value based on quoted market prices. The carrying values of accounts receivable and accounts payable approximate their fair values because of the short-term maturity of these financial instruments. The carrying values of long-term debt obligations approximate their fair value because the interest rate is fixed with a reset provision after five years.
NANOMETRICS INCORPORATED
NOTES TO CONSOLIDATED FINANCIAL STATEMENTS—(Continued)
Years Ended January 2, 2010, December 27, 2008 and December 29, 2007
Allowance for Doubtful Accounts – The Company maintains allowances for estimated losses resulting from the inability of its customers to make required payments. Credit limits are established through a process of reviewing the financial history and stability of its customers. Where appropriate and available, the Company obtains credit rating reports and financial statements of customers when determining or modifying their credit limits. The Company regularly evaluates the collectibilitycollectability of its trade receivable balances based on a combination of factors such as the length of time the receivables are past due, customary payment practices in the respective geographies and historical collection experience with customers. The Company believes that its allowance for doubtful accounts reflects the risk associated with smaller rather than larger customers and that reported allowances are adequate. If however, the financial conditions of customers were to deteriorate, resulting in their inability to make payments, the Company may need to record additional allowances which would result in additional general and administrative expenses being recorded for the period in which such determination was made.
Inventories – Inventories are stated at the lower of standard cost (which approximates actual cost on a first-in, first-out basis), or market. The Company is exposed to a number of economic and industry factors that could result in portions of inventory becoming either obsolete or in excess of anticipated usage, or saleable only for amounts that are less than their carrying amounts. These factors include, but are not limited to, technological changes in the market, the Company’s ability to meet changing customer requirements, competitive pressures in products and prices, and the availability of key components from suppliers. The Company has established inventory reserves when conditions exist that suggest that inventory may be in excess of anticipated demand or is obsolete based upon assumptions about future demand for the Company’s products and market conditions. The Company regularly evaluates its ability to realize the value of inventory based on a combination of factors including the following: historical usage rates, forecasted sales of usage, product end-of-life dates, estimated current and future market values and new product introductions. For demonstration inventory, the Company also considers the age of the inventory and potential cost to refurbish the inventory prior to sale. Demonstration inventory is amortized over its useful life and the amortization expense is included in total depreciation and amortization on the cash flow statement. When recorded, reserves are intended to reduce the carrying value of the Company’s inventory to its net realizable value. If actual demand for the Company’s products deteriorates, or market conditions are less favorable than those that the Company projects, additional reserves may be required.
57
NANOMETRICS INCORPORATED
NOTES TO CONSOLIDATED FINANCIAL STATEMENTS—(Continued)
Years Ended December 27, 2008, December 29, 2007 and December 30, 2006
Inventories – delivered systems – The Company reflects the cost of systems that were invoiced upon shipment but deferred for revenue recognition purposes separate from its inventory held for sale as “Inventories – delivered systems”.
Property, Plant and Equipment – Property, plant and equipment are stated at cost. Depreciation is computed using the straight–line method over the following estimated useful lives of the assets:
Building and improvements | 5–40 years | |
Machinery and equipment | 3–10 years | |
Furniture and fixtures | 3–10 years |
Goodwill and Intangible Assets – Goodwill is initially recorded when the purchase price paid for an acquisition exceeds the estimated fair value of the net identified tangible and intangible assets acquired. Under Statement of Financial Accounting Standards (“SFAS”) No. 142, “Goodwill and Other Intangible Assets” (“SFAS 142”), intangible assets with finite lives are amortized over their useful lives while goodwill and indefinite lived assets are not amortized but tested annually for impairment. The Company’s impairment review process is completed as of the last day of November of each year or whenever events or circumstances occur which indicate that an impairment might have occurred. SFAS 142 provides for aThe Company follows the two-step approach to determining whether and by how much goodwill has been impaired. The first step requires a comparison of the fair value of Nanometrics’ reporting units (product and service) to its net book value. If the fair value is greater, then no impairment is deemed to have occurred. If the fair value is less, then the second step must be performed to determine the amount, if any, of actual impairment.
The process of evaluating During 2008, the potential impairment of goodwill is highly subjective and requires significant judgment. In estimatingcompany wrote off the fair value of Nanometrics, the Company makes estimates and judgments about future revenues and cash flows for each reporting unit. To determine the fair value, the Company’s review process includes the income method and is based on a discounted future cash flow approach that uses estimates including the following for each reporting unit: revenue, based on assumed market growth rates and the Company’s assumed market share; estimated costs; and appropriate discount rates based on the particular business’s weighted average cost of capital. The Company’s estimates of market segment growth, market segment share and costs are based on historical data, various internal estimatesentire Goodwill and certain external sources, and are based on assumptions that are consistent with the plans and estimates the Company is using to manage the underlying businesses. The Company’s business consists of both established and emerging technologies and its forecasts for emerging technologies are based upon internal estimates and external sources rather than historical information. The Company also considers market capitalization on the dates of impairment tests in determining the fair value of the respective businesses. As part of the second step in determining the amount of goodwill impairment, if any, the Company allocates the fair value of the reporting units to all of its assets and liabilities as if the reporting units had been acquired in a business combination and the fair value of the reporting units was the price paid to acquire the reporting unit. The excess of the fair value of each reporting unit over the amount assigned to its assets and liabilities represents the implied fair value of goodwill. When impairment is deemed to have occurred, the Company will recognize an impairment charge to reduce the carrying amount of goodwill to its implied fair value.intangible assets. See Note 4,6, Goodwill and Long-Lived Asset Impairment.
Long-Lived Assets –The Company accounts for long-lived assets in accordance with the provisions of SFAS No. 144, “Accounting for the Impairment or Disposal of Long-Lived Assets”(“SFAS 144”). The statement requires the Company to evaluate its long-lived assets for impairment whenever events or changes in circumstances indicate that the carrying amount of an asset may not be recoverable. When the sum of the
NANOMETRICS INCORPORATED
NOTES TO CONSOLIDATED FINANCIAL STATEMENTS—(Continued)
Years Ended December 27, 2008, December 29, 2007 and December 30, 2006
undiscounted future net cash flows expected to result from the use of the asset and its eventual disposition is less than its carrying amount, impairment may exist. To determine the amount of impairment, the Company compares the fair value of the asset to its carrying value. If the carrying value of the asset exceeds its fair value, an impairment loss equal to the difference is recognized. See Note 4,6, Goodwill and Long-Lived Asset Impairment.
NANOMETRICS INCORPORATED
NOTES TO CONSOLIDATED FINANCIAL STATEMENTS—(Continued)
Years Ended January 2, 2010, December 27, 2008 and December 29, 2007
Restructuring Charge – During 2008 and 2007, theThe Company implemented a restructuring program based on its business strategy and recorded significant accruals in connection with the restructuring program. In connection with the plan the Company recordedrecords estimated expenses for severance and other costs. In accordance with SFAS 146, “Accounting forcosts as incurred as restructuring plans are executed. Costs Associated with Exit or Disposal Activities”, generally costs associated with restructuring activities have been recognized when they are incurred rather than the date of a commitment to an exit or disposal plan. In addition post-employment benefits accrued for workforce reductions related to restructuring activities are accounted for under SFAS 112, “Employer’s Accounting Post-Employment Benefits”. A liability for post-employment benefits is recorded when payment is probable, the amount is reasonably estimable, and the obligation relates to rights that have vested or accumulated. Given the significance and complexity of restructuring activities, and the timing of the execution of such activities, the restructuring process involves periodic reassessments of the estimates made at the time the original decisions were made, including evaluating market conditions for expected disposals of assets and vacancy of space. Although the Company believes that these estimates accurately reflect the costs of the restructuring programs, actual results may vary or differ, thereby requiring us to record additional provisions or reverse a portion of such provisions.
Income Tax Assets and Liabilities – The Company accounts for income taxes based on SFAS No. 109 “Accounting for Income Taxes” (“SFAS 109”), whereby deferred tax assets and liabilities must be recognized using enacted tax rates for the effect of temporary differences between the book and tax accounting for assets and liabilities. Also, deferred tax assets must be reduced by a valuation allowance to the extent that management concludes that it is more likely than not that a portion of the deferred tax asset will not be realized in the future. The Company evaluates the deferred tax assets on an annual basis to determine whether or not a valuation allowance is appropriate. Factors used in this determination include future expected income and the underlying asset or liability which generated the temporary tax difference. The income tax provision is primarily impacted by federal statutory rates, state and foreign income taxes and changes in the valuation allowance.
Accumulated Other Comprehensive Income (Loss) – AccumulatedThe composition of accumulated other comprehensive income (loss) of $(0.5) millionis as of December 27, 2008 consists of ($0.2) million and ($0.3) million of unrealized loss related to Taiwan pension activity and accumulated translation adjustments, respectively. Accumulated other comprehensive income of $2.6 million as of December 29, 2007 consists of ($0.3) million of unrealized loss related to Taiwan pension activity and accumulated translation adjustments, net of income taxes, of $2.9 million.follows:
| Years Ended | ||||||||||||
| Foreign Currency Translations | Defined Benefit Pension Plans | Accumulated Other Comprehensive Income | ||||||||||
Balance as of December 29, 2007 | $ | 2,907 | $ | (345 | ) | $ | 2,562 | |||||
Current period change | (3,254 | ) | 157 | (3,097 | ) | |||||||
Balance as of December 27, 2008 | (347 | ) | (188 | ) | (535 | ) | ||||||
Current period change | 1,798 | 110 | 1,908 | |||||||||
Balance as of January 2, 2010 | $ | 1,451 | $ | (78 | ) | $ | 1,373 | |||||
Product Warranties – The Company sells the majority of its products with a twelve-month12 month repair or replacement warranty from the date of acceptance which generally represents the date of shipment. The Company provides an accrual for estimated future warranty costs based upon the historical relationship of warranty costs to the cost of products sold. The estimated future warranty obligations related to product sales are reported in the period in which the related revenue is recognized. The estimated future warranty obligations are affected by the warranty periods, sales volumes, product failure rates, material usage and labor and replacement costs incurred in correcting a product failure. If actual product failure rates, material usage, labor or replacement costs differ from the Company’s estimates, revisions to the estimated warranty obligations would be required. For new product introductions where limited or no historical information exists, the Company may use warranty information from other previous product introductions to guide us in estimating the warranty accrual. The warranty accrual represents the best estimate of the amount necessary to settle future and existing claims on
59
NANOMETRICS INCORPORATED
NOTES TO CONSOLIDATED FINANCIAL STATEMENTS—(Continued)
Years Ended December 27, 2008, December 29, 2007 and December 30, 2006
products sold as of the balance sheet date. The Company periodically assesses the adequacy of its recorded warranty reserve and adjusts the amounts in accordance with changes in these factors.
A reconciliation of the changes to the Company’s warranty accrual for 2009, 2008 2007 and 20062007 is as follows (in thousands):
| Years Ended | Years Ended | |||||||||||||||||||||||
| December 27, 2008 | December 29, 2007 | December 30, 2006 | January 2, 2010 | December 27, 2008 | December 29, 2007 | |||||||||||||||||||
Balance as of beginning of period | $ | 4,545 | $ | 4,349 | $ | 1,440 | $ | 2,075 | $ | 4,545 | $ | 4,349 | ||||||||||||
Balance assumed through acquisitions | — | — | 1,330 | |||||||||||||||||||||
Actual warranty costs | (5,259 | ) | (3,207 | ) | (2,626 | ) | (2,376 | ) | (5,259 | ) | (3,207 | ) | ||||||||||||
Provision for warranty | 2,789 | 3,403 | 4,205 | 1,501 | 2,789 | 3,403 | ||||||||||||||||||
Balance as of end of period | $ | 2,075 | $ | 4,545 | $ | 4,349 | $ | 1,200 | $ | 2,075 | $ | 4,545 | ||||||||||||
NANOMETRICS INCORPORATED
NOTES TO CONSOLIDATED FINANCIAL STATEMENTS—(Continued)
Years Ended January 2, 2010, December 27, 2008 and December 29, 2007
Guarantees– In addition to product warranties, from time to time, in the normal course of business, the Company indemnifies certain customers with whom it enters into a contractual relationship. The Company has agreed to hold the other party harmless against third party claims that its products, when used for their intended purpose(s), infringe the intellectual property rights of such third party or other claims made against certain parties. It is not possible to determine the maximum potential amount of liability under these indemnification obligations due to the limited history of prior indemnification claims and the unique facts and circumstances that are likely to be involved in each particular claim. Historically, the Company has not made payments under these obligations and believes the estimated fair value of these agreements is minimal. Accordingly, no liabilities have been recorded for these obligations on the balance sheets as of January 2, 2010 and December 27, 2008 and December 29, 2007.2008.
Shipping and Handling Costs – Shipping and handling costs are included as a component of cost of revenues.
Advertising Costs – The Company expenses advertising costs as incurred. Advertising costs amounted to $0.07were immaterial in 2009, and were $0.1 million and $0.11 million duringin both 2008 and 2007, respectively, and did not include expenses related to trade shows.
Stock-Based Compensation – Upon adoption of SFAS 123(R)“Share Based Payments” on January 1, 2006, theThe Company began estimatingestimates the value of employee stock options on the date of grant using the Black-Scholes model. Prior to the adoption of SFAS 123(R), the value of each employee stock option was estimated on the date of grant using the Black-Scholes model for the purpose of the pro forma financial disclosure in accordance with SFAS 123. The determination of fair value of share-based payment awards on the date of grant using an option-pricing model is affected by the Company’s stock price as well as assumptions regarding a number of highly complex and subjective variables. These variables include, but are not limited to the expected stock price volatility over the term of the awards, and actual and projected employee stock option exercise behaviors. The expected term of options granted is calculated based on the simplified method allowed by Staff Accounting Bulletin (“SAB”) No. 107.the Staff. The expected volatility is based on the historical volatility of the Company’s stock price.
Defined Employee Benefit Plans –The Company maintains a defined benefit pension plan in Taiwan for which current service costs are charged to operations as they accrue based on services rendered by employees
NANOMETRICS INCORPORATED
NOTES TO CONSOLIDATED FINANCIAL STATEMENTS—(Continued)
Years Ended December 27, 2008, December 29, 2007 and December 30, 2006
during the year. Pension benefit obligations are determined by using management’s actuarial assumptions, including discount rates, assumed asset rates of return, compensation increases and employee turnover rates. ObligationsActuarial gains and losses are recorded under the corridor method in accordance with SFAS No. 158, “Employers Accounting for Defined Benefit Pension and Other Post Retirement Plans” (“SFAS 158”).method.
Net Income Per Share – Basic net income (loss) per share excludes dilution and is computed by dividing net income (loss) by the number of weighted average common shares outstanding for the period. Diluted net income (loss) per share reflects the potential dilution from outstanding dilutive stock options (using the treasury stock method) and shares issuable under the employee stock purchase plan. During 2009, 2008 2007 and 2006,2007, diluted net loss per share excludes common equivalent shares outstanding, as their effect is anti-dilutive. The total number of common equivalent shares outstanding during 2009, 2008 and 2007 and 2006 was 2.4 million, 3.0 million 2.3 million and 2.22.3 million, respectively. The total number of common equivalent shares includeincludes stock options with exercise prices in excess of the fair market value of our common stock, which are always excluded from diluted weighted average shares outstanding, as their effect is anti-dilutive. The reconciliation of the share denominator used in the basic and diluted net income per share computations is as follows (in thousands):
| Years Ended | Years Ended | |||||||||||
| December 27, 2008 | December 29, 2007 | December 30, 2006 | January 2, 2010 | December 27, 2008 | December 29, 2007 | |||||||
Weighted average shares outstanding – shares used in basic net income per share computation | 18,546 | 18,099 | 15,075 | 18,639 | 18,546 | 18,099 | ||||||
Dilutive effect of stock options, using the treasury stock method | — | — | — | — | — | — | ||||||
Shares used in diluted net income per share computation | 18,546 | 18,099 | 15,075 | 18,639 | 18,546 | 18,099 | ||||||
Certain Significant Risks and Uncertainties – Financial instruments which potentially subject the Company to concentration of credit risk consist of cash and cash equivalents, and accounts receivable (seereceivable. See Note 5).7, Sale of Accounts Receivable.
NANOMETRICS INCORPORATED
NOTES TO CONSOLIDATED FINANCIAL STATEMENTS—(Continued)
Years Ended January 2, 2010, December 27, 2008 and December 29, 2007
Cash equivalent deposits with financial institutions may, at times, exceed federally insured limits; however, the Company has not experienced any losses on such accounts. The Company maintains its cash and cash equivalents in deemed deposit accounts and money market accounts with large financial institutions.
The Company sells its products primarily to end users in the United States, Asia and Europe and, generally, does not require its customers to provide collateral or other security to support accounts receivable. Management performs ongoing credit evaluations of its customers’ financial condition and maintains an allowance for estimated potential bad debt losses. The Company’s customer base is highly concentrated and a relatively small number of customers have accounted for a significant portion of its revenues. Aggregate revenue from the Company’s top twenty five largest customers in 2009, 2008 and 2007 consisted of 83%, 75% and 76%, respectively, of its total net revenues. See Note 19,20, Major Customers.
The Company participates in a dynamic high technology industry and believes that changes in any of the following areas could have a material adverse effect on its future financial position, results of operations or cash flows: Advances and trends in new technologies and industry standards; competitive pressures in the form of new products or price reductions on current products; changes in product mix; changes in the overall demand for products offered; changes in third-party manufacturers; changes in key suppliers; changes in certain strategic relationships or customer relationships; litigation or claims against the Company based on intellectual property, patent, product, regulatory or other factors; fluctuations in foreign currency exchange rates; risk associated with
61
NANOMETRICS INCORPORATED
NOTES TO CONSOLIDATED FINANCIAL STATEMENTS—(Continued)
Years Ended December 27, 2008, December 29, 2007 and December 30, 2006
changes in domestic and international economic and/or political regulations; availability of necessary components or subassemblies; disruption of manufacturing facilities; and its ability to attract and retain employees necessary to support its growth.
Certain components and subassemblies used in the Company’s products are purchased from a sole supplier or a limited group of suppliers. In particular, the Company currently purchases its spectroscopic ellipsometer and robotics used in its advanced measurement systems from a sole supplier or a limited group of suppliers located in the United States. Any shortage or interruption in the supply of any of the components or subassemblies used in its products or its inability to procure these components or subassemblies from alternate sources on acceptable terms could have a material adverse effect on its business, financial condition and results of operations.
Recently Issued Accounting Pronouncements
In April 2008,September 2009, the FinancialFASB ratified Accounting Standards Board (“FASB”) issued FASB Staff Position (“FSP”)Update (ASU) 2009 -13 (ASU 2009-13) previously Emerging Issues Task Force (EITF) Issue No. 142-308-1,, “DeterminationRevenue Arrangements with Multiple Deliverables (ASC 605-25) which provides principles and application guidance on whether multiple deliverables exist, how the arrangement should be separated, and how the consideration should be allocated. It also requires an entity to allocate revenue in an arrangement using estimated selling prices of deliverables if a vendor does not have vendor-specific objective evidence or third-party evidence of the Useful Lifeselling price. The guidance eliminates the use of Intangible Assets”the residual method, requires entities to allocate revenue using relative pricing and significantly expands the disclosure requirements for multiple-deliverable revenue arrangements.
Also in September 2009, the FASB ratified ASU 2009-14 (previously EITF Issue No. 09-3,Certain Revenue Arrangement That Include Software Elements)., (“FSP 142-3”) ASU 2009-14 modifies the scope of Software Revenue Recognition to remove tangible products from the scope of the software revenue guidance if the products contain both software and non-software components that amendsfunction together to deliver a product’s essential functionality, and provides guidance on determining whether software deliverables in an arrangement that includes a tangible product are within the factors consideredscope of the software revenue guidance.
Both ASU 2009-13 and ASU 2009-14 have the same disclosure requirements, effective date, and transition methods. They are effective on a prospective basis for revenue arrangements entered into or materially modified in developing renewalfiscal years beginning on or extension assumptions usedafter June 15, 2010. Alternatively, an entity can elect to determineadopt on a retrospective basis. Early application is permitted; however, entities must adopt both ASU 2009-13 and ASU 2009-14 in the useful lifesame period using the same transition method. In the initial year of a recognized intangible asset under Statementapplication, companies are required to make qualitative and quantitative disclosures about the impact of Financialthe changes. The Company is currently evaluating the potential impact, if any, of these two standards and whether it will adopt the standards early.
In June 2009, the FASB issued SFAS No. 168,The FASB Accounting Standards (“SFAS”) SFAS No. 142, “GoodwillCodification and Other Intangible Assets”the Hierarchy of Generally Accepted Accounting Principles—a replacement of FASB Statement 162 (“SFAS 142”168”), as codified by ASC 105Generally Accepted Accounting Principles (ASC 105). FSP 142-3 requires a consistent approach betweenIn this standard, the useful lifeFASB Accounting Standards Codification
NANOMETRICS INCORPORATED
NOTES TO CONSOLIDATED FINANCIAL STATEMENTS—(Continued)
Years Ended January 2, 2010, December 27, 2008 and December 29, 2007
was established as the single source of a recognized intangible asset under SFAS 142 and the periodauthoritative accounting principles to be applied to financial statements of expected cash flows used to measure the fair value of an asset under SFAS No. 141 (R), “Business Combinations” (“SFAS 141R”). The FSP also requires enhanced disclosures when an intangible asset’s expected future cash flows are affected by an entity’s intent and/or ability to renew or extend the arrangement. FSP 142-3nongovernmental entities in conformity with U.S. General Accepted Accounting Principles. This standard is effective for financial statements issued for interim and annual periods ended after September 15, 2009. The provisions of this code were reflected starting with the filing of the Company’s Form 10-Q for the period ended September 26, 2009 and had no impact on the financial results of the Company.
In June 2009, the FASB issued FAS 166,Accounting for Transfers of Financial Assets—an amendment of FASB Statement No. 140 as codified by ASC 860Transfers and Servicing (ASC 860). ASC 860 removes the exemption from consolidation for Qualifying Special Purpose Entities. This Statement also limits the circumstances in which a financial asset, or portion of a financial asset, should be derecognized when the transferor has not transferred the entire original financial asset to an entity that is not consolidated with the transferor in the financial statements being presented and/or when the transferor has continuing involvement with the transferred financial asset. ASC 860 is applies to all transfers of financial assets occurring in the first fiscal yearsyear beginning after DecemberNovember 15, 20082009 and in interim periods in those years. Its disclosure requirements, however, apply to transfers before and after the effective date. Companies are not required to provide comparative disclosures for periods for which the information was not already required. The Company is currently evaluating the potential impact of this standard to the financial results of the Company.
In May 2009, the FASB issued SFAS No. 165, Subsequent Events, as codified by ASC 855Subsequent Events. This Statement sets forth: (1) the period after the balance sheet date during which management of a reporting entity should evaluate events or transactions that may occur for potential recognition or disclosure in the financial statements; (2) the circumstances under which an entity should recognize events or transactions occurring after the balance sheet date in its financial statements; and (3) the disclosures that an entity should make about events or transactions that occurred after the balance sheet date. This Statement is effective for interim and annual periods ending after June 15, 2009. The Company adopted this Statement in the quarter ended September 26, 2009. This Statement had no impact on the financial results of the Company.
In April 2009, the FASB issued FSP FAS 157-4,Determining Fair Value When the Volume and Level of Activity for the Asset or Liability Have Significantly Decreased and Identifying Transactions That Are Not Orderly(“FSP 157-4”), which amends SFAS No. 157,Fair Value Measurements(“SFAS 157”), as codified by ASC 820Fair Value Measurement (ASC 820). This standard provides additional guidance on estimating fair value when the volume and level of activity for an asset or liability have significantly decreased and is applied prospectively. Early adoption is prohibited.effective for interim and annual reporting periods ended after June 15, 2009. The Company does not expect theCompany’s adoption of FSP 142-3 to have a material impact on itsthis standard did not affect the Company’s consolidated results of operations or financial condition.
In March 2008,January 2010, the FASB issued SFAS No. 161 “ASU 2010-06,Improving Disclosures about Derivative InstrumentsFair Value Measurements, which amends ASC 820 to add two new disclosures: (1) transfers in and Hedging Activities an amendmentout of FASB Statement No. 133” (“SFAS 161”).Level 1 and 2 measurements and the reasons for the transfers, and (2) a gross presentation of activity within the Level 3 rollforward. The new standard requires additionalASU also includes clarifications to existing disclosure requirements on the level of disaggregation and disclosures regarding a company’s derivative instrumentsinputs and hedging activities by requiring disclosure of the fair values of derivative instruments and their gains and losses in a tabular format. It also requires disclosure of derivative features that are credit risk–related as well as cross-referencing within the notes to the financial statements to enable financial statement users to locate important information about derivative instruments, financial performance, and cash flows.valuation techniques. The standardASU is effective for interim and annual reporting periods beginning after December 15, 2009, except for the Company’sseparate disclosures about purchases, sales, issuances, and settlements in the roll forward of activity in Level 3 fair value measurements. Those disclosures are effective for fiscal yearyears beginning after December 15, 2010, and for interim periods within such year, beginning January 1, 2009, with early application encouraged. The Company doesthose fiscal years. In the period of initial adoption, entities will not anticipatebe required to provide the adoption of SFAS 161 will have a material impact on the Company’s consolidated financial position, results of operations or cash flows.amended disclosures for any previous periods presented for comparative purposes. However, comparative disclosures are required for periods ending after initial adoption.
In December 2007, the FASB issued SFAS 141R,141 (R), “Business Combinations” (“SFAS 141R”141(R)”), as codified by ASC 805Business Combinations (ASC 805). SFAS 141R will change the accounting for business combinations. Under SFAS 141R,In this standard, an acquiring entity will be required to recognize all the assets acquired and liabilities assumed in a transaction at the acquisition-date fair value with limited exceptions. SFAS 141R will change theThe accounting treatment for certain specific items including,will change: acquisition costs will generally be expensed as incurred, non-controlling interestinterests will be valued at fair value at the acquisition date, acquired contingent liabilities will be recorded at fair value at the acquisition date and subsequently measured at either the higher of such amount or the amount determined under existing guidance for non-acquired contingencies, in-process research and development will be recorded at fair value as an indefinite-lived intangible asset at the acquisition date, restructuring costs associated with a business combination will be generally expensed subsequent to the acquisition date, and changes in the deferred tax asset valuation allowances
NANOMETRICS INCORPORATED
NOTES TO CONSOLIDATED FINANCIAL STATEMENTS—(Continued)
Years Ended December 27, 2008, December 29, 2007 and December 30, 2006
and income tax uncertainties after the acquisition date generally will affect income tax expense. SFAS 141RThis standard also includes a substantial number of new disclosure requirements. SFAS 141RThe standard applies prospectively to business combinations for which the acquisition date is on or after the beginning of the first annual reporting period beginning on or after December 15, 2008, or the first quarter of 2009. Earlier adoption is prohibited. The Company will apply this standard prospectively to all business combinations consummated after
NANOMETRICS INCORPORATED
NOTES TO CONSOLIDATED FINANCIAL STATEMENTS—(Continued)
Years Ended January 2, 2010, December 27, 2008.2008 and December 29, 2007
In December 2007,April 2009, the FASB issued FSP SFAS No. 160, “141(R)-1,Non-controlling interests Accounting for Assets Acquired and Liabilities Assumed in Consolidated Financial Statementsa Business Combination That Arise from Contingencies—, as codified by ASC 805an amendmentBusiness Combination (ASC 805). This standard amends the provisions related to the initial recognition and measurement, subsequent measurement and disclosure of ARB No. 51” (“SFAS 160”). SFAS 160 requiresassets and liabilities arising from acquired contingencies in a business combination, thereby requiring that ownership interests in subsidiaries held by parties other than the parent, and the amount of consolidated net income,such contingencies be clearly identified, labeled, and presented in the consolidated financial statements. It also requires once a subsidiary is deconsolidated, any retained non-controlling equity investment in the former subsidiary be initially measuredrecognized at fair value. Sufficient disclosures are requiredvalue on the acquisition date if fair value can be reasonably estimated during the allocation period. Otherwise, entities would typically account for the acquired contingencies in accordance with SFAS No. 5,Accounting for Contingencies,as codified by ASC 450Contingencies. This standard applies prospectively to clearly identify and distinguish betweenbusiness combinations for which the interestsacquisition date is on or after the beginning of the parent and the interests of the non-controlling owners. It is effective for fiscal yearsfirst annual reporting period beginning on or after December 15, 2008, and requires retroactive adoptionor the first quarter of 2009. On June 17, 2009, the presentation and disclosure requirementsCompany completed a business combination with Zygo Corporation as discussed in Note 3, which is accounted for existing minority interests. All other requirements shall be applied prospectively. The Company currently do not have any non-controlling interests for the application of SFAS 160 and does not anticipate the adoption of SFAS 160 will have a material impact on the Company’s consolidated financial position, results of operations or cash flows.in accordance with ASC 805.
In September 2006, the FASB finalized SFAS No. 157, “Fair Value Measurements” (“SFAS 157”). This Statement defines fair value, establishes a framework for measuring fair value, and expands disclosures about fair value measurements; however, it does not require any new fair value measurements. In FebruaryApril 2008, the FASB issued FSP No. 157-2,FAS 142-3,Effective DateDetermination of FASB Statement 157” (“FSP 157-2”). Effective upon issuance, FSP 157-2 delays the Useful Life of Intangible Assets, as codified by ASC 350-30General Intangibles Other than Goodwill(ASC 350-30), which amended the factors to be considered in developing renewal or extension assumptions used to determine the useful life of a recognized intangible asset under ASC 350, Intangibles – Goodwill and Other. ASC 350-30 applies to intangible assets that are acquired, individually or with a group of other assets, in either a business combination or asset acquisition. ASC 350-30 is effective date of SFAS 157 for nonfinancial assets and nonfinancial liabilities tofinancial statements issued for fiscal years beginning after NovemberDecember 15, 2008. FSP 157-2 also covers2008, and interim periods within those fiscal years. Adoption of ASC 350-30 had no impact on the financial results of the Company.
In June 2008, the FASB issued FASB Staff Position EITF 03-6-1,Accounting for Determining Whether Instruments Granted in Share-Based Payment Transactions Are Participating Securities, as codified by ASC 260Determining Whether Instruments Granted in Shared-Based Payment Transactions Are Participating Securities (ASC 260). This standard addresses whether participating share based payment awards, that contain non-forfeitable rights to dividends or dividend equivalents (paid or unpaid) prior to vesting, should be included in the computation of earnings per share under the two-class method. This standard is effective for financial statements issued for fiscal years beginning after December 15, 2008. The Company’s adoption of this standard did not affect the Company’s consolidated results of operations or financial condition.
| Note 2. | Fair Value Measurements and Disclosures |
Fair value is defined as the price that would be received to sell an asset or paid to transfer a liability in an orderly transaction between market participants at the measurement date. The standard assumes that the transaction to sell the asset or transfer the liability occurs in the principal or most advantageous market for items within its scope. The delay is intended to allow the FASBasset or liability and its constituentsestablishes that the time to considerfair value of an asset or liability shall be determined based on the various implementation issues associated with SFAS 157. assumptions that market participants would use in pricing the asset or liability.
Fair Value Hierarchy
The Company determines the fair values of its financial instruments based on the fair value hierarchy established in ASC 820, which requires an entity to maximize the use of observable inputs and minimize the use of unobservable inputs when measuring fair value. The classification of a financial asset or liability within the hierarchy is currently evaluatingbased upon the impact of adopting SFAS 157lowest level input that is significant to the fair value measurement. The fair value hierarchy prioritizes the inputs into three levels that may be used to measure fair value:
Level 1 — Quoted prices in active markets for non-financialidentical assets or liabilities.
Level 2 — Inputs other than Level 1 that are observable, either directly or indirectly, such as quoted prices for similar assets and liabilities on its consolidatedin active markets or inputs that are observable for the asset or liability, either directly or indirectly through market corroboration, for substantially the full term of the financial statements.instrument.
Note 2. AcquisitionsLevel 3 — Unobservable inputs that are supported by little or no market activity and are significant to the fair value of the assets or liabilities. Such unobservable inputs include an estimated discount rate used in our discounted present value analysis of future cash flows, which reflects our estimate of debt with similar terms in the current credit markets. As there is currently minimal activity in such markets, the actual rate could be materially different.
NANOMETRICS INCORPORATED
NOTES TO CONSOLIDATED FINANCIAL STATEMENTS—(Continued)
Years Ended January 2, 2010, December 27, 2008 and December 29, 2007
The following table presents the Company’s fair value measurements that are measured at the estimated fair value, on a recurring basis, categorized in accordance with the fair value hierarchy (in thousands):
As of January 2, 2010 | Quoted Prices in Active Markets for Identical Assets (Level 1) | Significant Other Observable Inputs (Level 2) | Significant Unobservable Inputs (Level 3) | Total | ||||||||
Cash and cash equivalents (all short term): | ||||||||||||
Cash | $ | 8,609 | $ | — | $ | — | $ | 8,609 | ||||
Money market account | 34,917 | — | — | 34,917 | ||||||||
Total cash and cash equivalents | 43,526 | — | — | 43,526 | ||||||||
Total financial assets | $ | 43,526 | $ | — | $ | — | $ | 43,526 | ||||
Fair value of deferred payments to Zygo Corporation related to acquisition | $ | — | $ | — | $ | 5,688 | $ | 5,688 | ||||
Total financial liabilities | $ | — | $ | — | $ | 5,688 | $ | 5,688 | ||||
As of December 27, 2008 | Quoted Prices in Active Markets for Identical Assets (Level 1) | Significant Other Observable Inputs (Level 2) | Significant Unobservable Inputs (Level 3) | Total | ||||||||
Cash and cash equivalents (All short term): | ||||||||||||
Cash | $ | 19,717 | $ | — | $ | — | $ | 19,717 | ||||
Money market account | 4,263 | — | — | 4,263 | ||||||||
Total cash and cash equivalents | 23,980 | — | — | 23,980 | ||||||||
Total financial assets | $ | 23,980 | $ | — | $ | — | $ | 23,980 | ||||
Changes in the Company’s Level 3 liabilities for fiscal 2009 were as follows (in thousands):
| Level 3 | |||
Aggregate estimated fair value of Level 3 liability at December 27, 2008 | $ | — | |
Zygo Acquisition | 5,092 | ||
Total unrealized loss included in earnings | 596 | ||
Aggregate estimated fair value of Level 3 liability at January 2, 2010 | $ | 5,688 | |
NANOMETRICS INCORPORATED
NOTES TO CONSOLIDATED FINANCIAL STATEMENTS—(Continued)
Years Ended January 2, 2010, December 27, 2008 and December 29, 2007
As of January 2, 2010, the Company has a liability of $5.7 million resulting from the acquisition of certain assets from Zygo Corporation (“Zygo”) which is measured at fair value on a recurring basis. Of that amount, $3.7 million is included in other current liabilities and $2.0 million is included in other long-term liabilities on the Company’s consolidated balance sheet. The fair value of this liability was determined using level 3 inputs. See Note 3 for discussion of assumptions used to measure the fair value of the Zygo liability.
Certain assets are measured at fair value on a nonrecurring basis; that is, the instruments are not measured at fair value on an ongoing basis but are subject to fair value adjustments only in certain circumstances (for example, when there is evidence of impairment). During 2009 the Company recorded an impairment charge of $1.9 million related to the Company’s South Korean manufacturing facility. See Note 4 for discussion of the measurement criteria used. We classify these measurements as Level 3.
| Year ended January 2, 2010 | Quoted Prices in Active Markets for Identical Assets (Level 1) | Significant Other Observable Inputs (Level 2) | Significant Unobservable Inputs (Level 3) | Total Gains (Losses) | ||||||||||||
Assets held for sale | $ | 220 | $ | — | $ | — | $ | 220 | $ | (1,899 | ) | |||||
Other financial instruments include cash and cash equivalents, accounts receivable, accounts payable and debt obligations. Cash equivalents are stated at fair market value based on quoted market prices. The carrying values of accounts receivable and accounts payable approximate their fair values because of the short term maturity of these financial instruments. The carrying value of long-term debt obligations approximates their fair value because while the interest rate is fixed, it will reset after five years.
| Note 3. | Acquisitions |
Zygo acquisition
On June 17, 2009 (“acquisition date”), Nanometrics announced that it had purchased inventory and certain other assets of Zygo Corporation and that the two companies had entered into a supply agreement. The terms of the agreement is an exclusive OEM arrangement in which Zygo Corporation will provide interferometer sensors to Nanometrics for incorporation into the Unifire™ line of products as well as Nanometrics family of automated metrology systems. The arrangement is structured as an asset transfer and exclusive OEM supply agreement aimed at wafer-based markets. Nanometrics will assume all inventory and customer sales and support responsibilities and Zygo will provide measurement sensors for integration by Nanometrics. By completing this acquisition, Nanometrics anticipates expanding its served markets to include the high end of dimensional control metrology for the rapidly-growing back-end-of-line packaging market, while also enhancing our product offerings to front-end-of-line metrology customers. In addition to the applications currently addressed by Nanometrics and Zygo products, the business partnership allows for the joint development of additional technology solutions targeted at the semiconductor and related industries. This transaction met the conditions of a business combination. The results from the Unifire™ line of business were included in the Company’s consolidated statements of operations from the acquisition date.
NANOMETRICS INCORPORATED
NOTES TO CONSOLIDATED FINANCIAL STATEMENTS—(Continued)
Years Ended January 2, 2010, December 27, 2008 and December 29, 2007
The following table summarizes the fair value of consideration recorded and the fair value of acquired assets:
Fair value of purchase consideration transferred $5,092 (in thousands):
| Amounts | |||
Assets acquired: | |||
Inventories – raw materials | $ | 2,014 | |
Property, plant and equipment – machinery and equipment | 1,378 | ||
Total assets acquired: | 3,392 | ||
Other intangible assets: | |||
Developed technology | 1,362 | ||
Customer relationships | 338 | ||
Total other intangible assets: | 1,700 | ||
Net assets acquired | $ | 5,092 | |
The fair value of the purchase consideration at the time of the acquisition for the assets acquired was $5.1 million, which consisted of deferred payments to Zygo for inventory and fixed assets, as well as future royalty and sustaining engineering support fees. The future royalty and sustaining engineering support fees are considered contingent consideration. On the acquisition date, the acquisition did not involve any cash payments to Zygo. The fair value of purchase consideration transferred including contingent consideration was recorded as a liability on the Company’s consolidated balance sheet at January 2, 2010, with $3.1 million current and $2.0 million long-term.
The Company will be required to make payments to Zygo after each sale of the Company’s product which incorporates inventory acquired from Zygo. If the Company has not sold sufficient products which incorporate the acquired inventory from Zygo, within one year from the date of the acquisition, the Company must remit the remaining unpaid portion relating to inventory and fixed assets at that time. The purchase agreement also stipulated that if the Company received greater than $5.0 million in a financing transaction, then 20% of the financing proceeds, not to exceed $2 million, must be paid to Zygo for any unpaid portion of the amounts related to inventory and fixed assets. In December 2009 the Company completed a common stock offering with net proceeds of $23.3 million, therefore $2.0 million became immediately due. That $2.0 million payment was made to Zygo on January 7, 2010.
The fair value of the purchase consideration relating to the inventory and fixed assets was determined using an analysis based on management’s expected revenue from products which incorporate the acquired inventory from Zygo, discounted by 20 percent to arrive at the present value.
The fair value of the future royalty and sustaining engineering support fees was determined using a relief from royalty method based on the following: (a) amount of the acquired assets that business will generate, (b) a discount rate of 20 percent was utilized to adjust the purchase price payments to the present, based on the consideration of both a weighted average cost of capital calculation and venture capital rates. The Company will pay Zygo a royalty based on net revenues of approved products and the expected sustaining engineering payments based on volumes of heads purchased from Zygo starting in 2010 and over a 10 year period. The range of the undiscounted amounts Nanometrics could pay under the contingent consideration discussed here ranges from $3.4 million to $10.2 million.
The fair value of inventory acquired was $2.0 million consisting of raw materials. Recent purchases of raw material were considered a reasonable proxy for fair value. The fair value of demonstration equipment was $1.4 million as determined by considering the purchase date and recent usage of the products. Fair value of developed technology of $1.4 million and customer relationships of $0.3 million were determined by similar methodology used above for the contingent consideration, with the following assumptions of (a) royalty rate of 3 percent, and (b) discount rate of 30 percent, and have definite lives amortizable over a period of 10 years on a straight-line basis and accelerated basis amortized over a two-year period, respectively. The amortization expense of $0.2 million was recorded for the acquired intangible assets from the Zygo transaction for the year ended January 2, 2010.
A total of $0.2 million of legal expenses were incurred related to the net asset purchase and supply agreement of Zygo. These acquisition-related expenses are included in general and administrative expense of the consolidated statement of operations. Such acquisition-related costs are treated as goodwill for tax purposes and are expected to be deductible for tax purposes.
NANOMETRICS INCORPORATED
NOTES TO CONSOLIDATED FINANCIAL STATEMENTS—(Continued)
Years Ended January 2, 2010, December 27, 2008 and December 29, 2007
The fair value of the purchase contingent consideration is evaluated each reporting period with an appropriate adjustment to the recorded liability if required. As of January 2, 2010, the fair value of the purchase contingent consideration had increased by $0.6 million due mainly to the accelerated repayment of $2.0 million currently due as a result of the common stock offering. The $0.6 million is included in interest expense as the reason for the liability increase was due to financing activities of the Company.
The acquired Zygo business contributed no revenues and a net loss of $1.8 million to the consolidated results of operations for the period from June 17, 2009 to January 2, 2010. The following unaudited pro forma summary presents consolidated information of Nanometrics as if the business combination had occurred at the beginning of the respective periods (in thousands):
| Pro Forma Year Ended | ||||||||
| January 2, 2010 (unaudited) | December 27, 2008 (unaudited) | |||||||
Net revenues | $ | 78,864 | $ | 105,118 | ||||
Net income (loss) | (20,095 | ) | (91,797 | ) | ||||
Net loss per share: | ||||||||
Basic | $ | (1.08 | ) | $ | (4.95 | ) | ||
Diluted | $ | (1.08 | ) | $ | (4.95 | ) | ||
Tevet acquisition
On May 19, 2008, Nanometrics announced that it had acquired the assets and liabilities of Tevet Process Control Technologies, Ltd., (“Tevet”), an Israel-based privately held corporation. Nanometrics acquiredThe acquisition of Tevet, an integrated metrology company serving the worldwide semiconductor and solar PV manufacturing industry, in orderis expected to further Nanometrics’ strategy to offer a breadth of process control metrology solutions that address both advanced technology as well as cost of ownership. Under the terms of the asset purchase agreement, which was an all-cash transaction, the total consideration to purchase all assets and assume specified liabilities of Tevet was $3.6 million, including $0.2 million in transaction fees, which include legal, valuation and accounting fees. The asset purchase has been accounted for under the purchase method of accounting in accordance with SFAS 141, “Business Combinations”. Under the purchase method of accounting, the total estimated purchase price is allocated to the net tangible and identifiable intangible assets of Tevet acquired in connection with the transaction, based on their respective estimated fair values. When estimating fair values of assets acquired and liabilities assumed, management considered a number of factors, including valuations and appraisals. The results of operations of Tevet were included in the Company’s consolidated statements of operations from the date of the acquisition. The final allocation of the Tevet purchase price is summarized below (in thousands):
Assets acquired: Cash Accounts receivable Inventories Other assets Property, plant and equipment Total assets acquired: Liabilities assumed: Accounts payable Deferred revenue Other accrued liabilities Total liabilities assumed Net assets acquired Goodwill and other intangible assets: Goodwill Developed technology Backlog Total goodwill and other intangible assets: Net purchase price63 Amounts $ 448 12 467 24 62 1,013 129 250 393 772 241 1,848 1,269 230 3,347 $ 3,588
NANOMETRICS INCORPORATED
NOTES TO CONSOLIDATED FINANCIAL STATEMENTS—(Continued)
Years Ended January 2, 2010, December 27, 2008 and December 29, 2007 and December 30, 2006
The allocation of the Tevet purchase price is summarized below (in thousands):
Assets acquired: | |||
Cash | $ | 448 | |
Accounts receivable | 12 | ||
Inventories | 467 | ||
Other assets | 24 | ||
Property, plant and equipment | 62 | ||
Total assets acquired | 1,013 | ||
Liabilities assumed: | |||
Accounts payable | 129 | ||
Deferred revenue | 250 | ||
Other accrued liabilities | 393 | ||
Total liabilities assumed | 772 | ||
Net assets acquired | 241 | ||
Goodwill and other intangible assets: | |||
Goodwill | 1,848 | ||
Developed technology | 1,269 | ||
Backlog | 230 | ||
Total goodwill and other intangible assets | 3,347 | ||
Net estimated purchase price | $ | 3,588 | |
The purchase price of $3.6 million is still subject towas finalized on the finalescrow close date of escrow, which is expected to occurApril 7, 2009. A settlement of $0.2 million was received from Tevet by the end of May 2009.Company at the escrow close date. The developed technology and backlog are being amortized over their estimated useful lives of seven years and one year, respectively. In the third quarter of 2008, the Company recognized an impairment charge of $54.0 million, representing a write-off of the entire amount of the Company’s previously recorded goodwill, including the $1.8 million in goodwill arising from the Tevet acquisition. No impairment of intangible assets from the Tevet acquisition was deemed to have occurred in 2008. See Note 4, Goodwill and Long-Lived Asset Impairment.written off.
If the Company had acquired Tevet at the beginning of the periods presented, the Company’s unaudited pro forma net revenues, net income/lossincome (loss) and net income/lossincome (loss) per share from operations would have been as follows (in thousands, except per share amounts):
| Years Ended | ||||||||||||||||
| December 27, 2008 | December 29, 2007 | Pro Forma | ||||||||||||||
| (Unaudited) | (Unaudited) | Year Ended December 27, 2008 (unaudited) | Year Ended December 29, 2007 (unaudited) | |||||||||||||
Net revenues | $ | 102,644 | $ | 148,193 | $ | 102,644 | $ | 148,193 | ||||||||
Net income (loss) | (84,438 | ) | (7,020 | ) | ||||||||||||
Net income (loss) per share: | ||||||||||||||||
Net loss | (84,438 | ) | (7,020 | ) | ||||||||||||
Net loss per share: | ||||||||||||||||
Basic | $ | (4.55 | ) | $ | (0.38 | ) | $ | (4.55 | ) | $ | (0.38 | ) | ||||
Diluted | $ | (4.55 | ) | $ | (0.38 | ) | $ | (4.55 | ) | $ | (0.38 | ) | ||||
| Note 4. | Asset Held for Sale |
NANOMETRICS INCORPORATED
NOTES TO CONSOLIDATED FINANCIAL STATEMENTS—(Continued)
Years Ended December 27, 2008, December 29, 2007In May 2009, the management of Nanometrics decided to close the Pyeongtaek, South manufacturing facility due to the prevailing industry and economic conditions facing the semiconductor industry. The premises have effectively been vacated prior to the end of the second quarter 2009 and the Company began actively pursuing the sale of the facility and related manufacturing assets at that time. The Company also ceased recording depreciation on the facility at that time. The fair value of the South Korea manufacturing facility was determined using a cost approach and a sale comparison approach. The cost approach uses the characteristics of the facility to determine the cost of replacement if the facility were new, adjusted for depreciation to date considering the age of the facility. The sale comparison approach considers market comparable sales activity. An average of the two approaches was used to determine the facility fair value of approximately $0.2 million, which included an estimate for selling costs at 10% of the building fair value. An impairment loss of $1.9 million was recorded on the South Korea facility for the second quarter of 2009. The facility in South Korea remains an asset held for sale as January 2, 2010. On December 30, 20062009, the Company entered into a sale and purchase agreement with a buyer for approximately $0.4 million, of which $0.2 million was received as deposit and recorded as part of current liabilities. No gain on sale was recorded in 2009 as the sale transactions has not yet closed and the Company is not yet in receipt of the final $0.2 million.
| Note 5. | Stock-Based Compensation |
Note 3. Stock-Based Compensation
On January 1, 2006, theThe Company adopted SFAS No. 123 (revised 2004), “Share-Based Payment”, (“SFAS 123(R)”), which requires the measurementmeasured and recognitionrecognized of compensation expense for all share-based payment awards made to employees and directors including employee stock options and employee stock purchases related to the Employee Stock Purchase Plan (collectively “Employee Stock Purchases”) based on estimated fair values. SFAS 123(R) requires companies to estimate theThe fair value of share-based payment awards is estimated on the date of grant using an option-pricing model. The value of the portion of the award that is ultimately expected to vest is recognized as expense over the requisite service periods in the Company’s consolidated statement of operations.
Stock-based compensation expense recognized during the period is based on the value of the portion of share-based payment awards that is ultimately expected to vest during the period. Stock-based compensation expense recognized in the Company’s consolidated statement of operations for the years ended December 27, 2008, December 29, 2007 and December 30, 2006 included compensation expense for share-based payment awards granted prior to, but not yet vested as of December 30, 2005 based on the grant date fair value estimated in accordance with the pro forma provisions of SFAS 123 and compensation expense for the share-based payment awards granted subsequent to December 30, 2005 based on the grant date fair value estimated in accordance with the provisions of SFAS 123(R). As stock-based compensation expense recognized in the consolidated statement of operations for the years ended January 2, 2010, December 27, 2008 and December 29, 2007 and December 30, 2006 is based on awards ultimately expected to vest, it has been reduced for estimated forfeitures. SFAS 123(R) requires forfeitures to be estimated at the time of grant and revised, if necessary, in subsequent periods if actual forfeitures differ from those estimates. The Company’s estimated forfeiture rate in 2009, 2008 and 2007 of 19.5%, 19.7% and 2006 of 19.7%, 22.7%, and 14.4% respectively, was based on historical forfeiture experience. SFAS 123(R) requiresexperience, which the cash flows resulting fromCompany believes is the taxbest available information to estimate the future forfeiture rate. Tax benefits resulting from tax deductions in excess of the compensation cost recognized for those options were required to be classified as financing cash flows. There were no such tax benefits during fiscal 2009, 2008 2007 and 2006.2007.
NANOMETRICS INCORPORATED
NOTES TO CONSOLIDATED FINANCIAL STATEMENTS—(Continued)
Years Ended January 2, 2010, December 27, 2008 and December 29, 2007
Valuation and Expense Information under SFAS 123(R)
The fair value of stock-based awards to employees is calculated using the Black-Scholes option pricing model, even though this model was developed to estimate the fair value of freely tradable, fully transferable options without vesting restrictions, which differ significantly from the Company’s stock options. The Black-Scholes model requires subjective assumptions, including future stock price volatility and expected time to exercise, which greatly affect the calculated values. The expected term of options granted was calculated using the simplified method allowed by SAB 107.the Staff. The risk-free rate is based on the U.S Treasury rates in effect during the corresponding period of grant. The expected volatility is based on the historical volatility of Nanometrics’ stock price. These factors could change in the future, which would affect the stock-based compensation expense in future periods.
65
NANOMETRICS INCORPORATED
NOTES TO CONSOLIDATED FINANCIAL STATEMENTS—(Continued)
Years Ended December 27, 2008, December 29, 2007 and December 30, 2006
The weighted-average fair value of stock-based compensation to employees is based on the single option valuation approach. Forfeitures are estimated and it is assumed no dividends will be declared. The estimated fair value of stock-based compensation awards to employees is amortized using the straight-line method over the vesting period of the options. The weighted-average fair value calculations are based on the following average assumptions:
| Years Ended | ||||||||||||||||||
| December 27, 2008 | December 29, 2007 | December 30, 2006 | Fiscal Year 2009 | Fiscal Year 2008 | Fiscal Year 2007 | |||||||||||||
Stock Options: | ||||||||||||||||||
Expected life | 4.3 years | 4.4 years | 4.5 years | 4.1 years | 4.3 years | 4.4 years | ||||||||||||
Volatility | 56.9 | % | 59.3 | % | 71.2 | % | 67.6 | % | 56.9 | % | 59.3 | % | ||||||
Risk free interest rate | 2.22 | % | 4.96 | % | 4.80 | % | 2.08 | % | 2.22 | % | 4. 96 | % | ||||||
Dividends | — | — | — | — | — | — | ||||||||||||
Employee Stock Purchase Plan: | ||||||||||||||||||
Expected life | 0.5 years | 0.5 years | 0.5 years | 0.5 years | 0.5 years | 0.5 years | ||||||||||||
Volatility | 87.7 | % | 35.0 | % | 42.0 | % | 99.1 | % | 87.7 | % | 35.0 | % | ||||||
Risk free interest rate | 1.02 | % | 2.52 | % | 3.49 | % | 0.33 | % | 1.02 | % | 2.52 | % | ||||||
Dividends | — | — | — | — | — | — | ||||||||||||
The weighted average fair value per share of the stock options awarded in 2009, 2008 and 2007 of $2.84, $3.04 and 2006 of $3.04, $7.69, and $11.71, respectively, was based on the fair market value of the Company’s common stock on the grant dates.
The following table summarizes stock-based compensation expense for all share-based payment awards made to the Company’s employees and directors pursuant to the Employee Stock Purchases under SFAS 123(R) which was allocated as follows (in thousands):
| Years Ended | ||||||||||||||||||
| December 27, 2008 | December 29, 2007 | December 30, 2006 | Fiscal Year 2009 | Fiscal Year 2008 | Fiscal Year 2007 | |||||||||||||
Cost of products | $ | 310 | $ | 287 | $ | 354 | $ | 34 | $ | 310 | $ | 287 | ||||||
Cost of service | 363 | 337 | 305 | 180 | 363 | 337 | ||||||||||||
Research and development | 696 | 997 | 1,313 | 495 | 696 | 997 | ||||||||||||
Selling | 751 | 755 | 988 | 472 | 751 | 755 | ||||||||||||
General and administrative | 1,761 | 1,391 | 2,065 | 873 | 1,761 | 1,391 | ||||||||||||
Total stock-based compensation expense related to employee stock options and employee stock purchases | $ | 3,881 | $ | 3,767 | $ | 5,025 | $ | 2,054 | $ | 3,881 | $ | 3,767 | ||||||
During the fourth quarter 2009, the Company recorded an out of period adjustment with an impact of decreasing stock compensation by $0.2 million to correct errors in recording true-ups for forfeitures of stock options that were not material to any prior reporting period.
NANOMETRICS INCORPORATED
NOTES TO CONSOLIDATED FINANCIAL STATEMENTS—(Continued)
Years Ended January 2, 2010, December 27, 2008 and December 29, 2007 and December 30, 2006
A summary of activity under the Company’s stock option plans during 20082009 is as follows:
| Shares Available | Number of Shares | Weighted Average Exercise Price | Weighted Average Remaining Contractual Term (in Years) | Aggregate Intrinsic Value (in Thousands) | Shares Available for Grant (Options and RSUs) | Number of Shares Outstanding (Options) | Weighted Average Exercise Price | Weighted Average Remaining Contractual Term (in Years) | Aggregate Intrinsic Value (in Thousands) | |||||||||||||||||||
Options | ||||||||||||||||||||||||||||
Outstanding at December 29, 2007 | 1,607,911 | 3,120,467 | $ | 9.94 | ||||||||||||||||||||||||
Shares added through 2005 Equity Incentive Plan | 558,620 | — | — | |||||||||||||||||||||||||
Outstanding at December 27, 2008 | 1,665,043 | 3,562,437 | $ | 7.29 | ||||||||||||||||||||||||
Exercised | — | (35,978 | ) | 5.81 | — | (410,995 | ) | 5.93 | ||||||||||||||||||||
Granted | (1,339,666 | ) | 1,339,666 | 3.04 | (726,838 | ) | 726,838 | 5.82 | ||||||||||||||||||||
RSU allocation | (20,000 | ) | — | — | (62,000 | ) | — | — | ||||||||||||||||||||
Canceled | 858,178 | (861,718 | ) | 10.14 | 897,024 | (924,986 | ) | 11.03 | ||||||||||||||||||||
Outstanding at December 27, 2008 | 1,665,043 | 3,562,437 | $ | 7.29 | 5.1 | $ | 176 | |||||||||||||||||||||
Outstanding at January 2, 2010 | 1,773,229 | 2,953,294 | $ | 5.95 | 5.1 | $ | 16,692 | |||||||||||||||||||||
Exercisable at December 27, 2008 | 1,663,383 | $ | 10.05 | 3.6 | $ | 5 | ||||||||||||||||||||||
Exercisable at January 2, 2010 | 1,481,629 | $ | 7.54 | 4.3 | $ | 6,250 | ||||||||||||||||||||||
The Company granted 20,00062,000 and 90,00020,000 Restricted Stock Units (“RSU”) during the year-end January 2, 2010 and December 27, 2008, and December 29, 2007 respectively to key employees with vesting periods spanning from one to three years.
Prior to December 2008, the majority for options granted by the Compensation Committee vested at a rate of 33 1/3 percent over the first three years of the seven-year option term on each of the first, second and third anniversary of such grants. Starting in December 2008, the majority of the options granted for employees employed for less than one year vest one-third ( 1/3rd) of the shares subject to the option on the first anniversary of the grant date, and vest one thirty sixth ( 1/36th) each month for the following two years, for a total three year vesting period with a seven-year option term. Starting in November 2008, the majority of the options granted for employees employed for more than one year vest one thirty-sixth ( 1/36th) of the shares subject to the options in equal monthly installments starting on the monthly anniversary of the date of grant with a seven-year option term.
The aggregate intrinsic value in the preceding table represents the total pretax intrinsic value, based on the Company’s closing stock price of $1.15$11.33 as of December 27, 2008,January 2, 2010, which would have been received by the option holders had all option holders exercised their options as of that date. The total intrinsic value of options exercised during 2009, 2008 and 2007 and 2006 was $2.2 million, $0.1 million, $0.6 million, and $1.0$0.6 million, respectively. The fair value of options vested during 2009, 2008 and 2007 and 2006 was $3.4 million, $6.3 million $6.6 million and $5.5$6.6 million, respectively.
The following table summarizes significant ranges of outstanding and exercisable options as of December 27, 2008.January 2, 2010.
Range of Exercise Prices | Options Outstanding | Options Exercisable | ||||||||||
| Number Outstanding | Weighted Average Remaining Contractual Life (Years) | Weighted Average Exercise Price | Number Exercisable | Weighted Average Exercise Price | ||||||||
$0.49–$0.49 | 6,487 | 1.91 | $ | 0.49 | 6,487 | $ | 0.49 | |||||
$0.93–$0.93 | 665,700 | 6.93 | $ | 0.93 | — | — | ||||||
$0.98–$5.54 | 356,340 | 6.09 | $ | 3.19 | 37,005 | $ | 4.30 | |||||
$5.69–$6.12 | 443,580 | 3.87 | $ | 5.91 | 244,627 | $ | 5.84 | |||||
$6.25–$7.35 | 467,835 | 6.61 | $ | 7.03 | 184,085 | $ | 6.99 | |||||
$7.49–$8.89 | 533,063 | 4.47 | $ | 8.51 | 360,586 | $ | 8.64 | |||||
$9.07–$11.34 | 359,744 | 4.28 | $ | 9.80 | 217,260 | $ | 9.95 | |||||
$11.52 -$13.65 | 440,366 | 3.39 | $ | 12.94 | 365,179 | $ | 12.80 | |||||
$13.75–$19.08 | 282,322 | 3.67 | $ | 15.58 | 241,154 | $ | 15.52 | |||||
$20.14–$20.14 | 7,000 | 2.09 | $ | 20.14 | 7,000 | $ | 20.14 | |||||
$0.49–$20.14 | 3,562,437 | 5.07 | $ | 7.29 | 1,663,383 | $ | 10.05 | |||||
67
NANOMETRICS INCORPORATED
NOTES TO CONSOLIDATED FINANCIAL STATEMENTS—(Continued)
Years Ended December 27, 2008, December 29, 2007 and December 30, 2006
Exercise Prices | Options Outstanding | Options Exercisable | ||||||||||
| Number Outstanding | Weighted Average Remaining Contractual Life (Years) | Weighted Average Exercise Price | Number Exercisable | Weighted Average Exercise Price | ||||||||
$0.49–$0.49 | 3,311 | 1.01 | $ | 0.49 | 3,311 | $ | 0.49 | |||||
$0.93–$0.93 | 552,835 | 5.91 | $ | 0.93 | 159,153 | $ | 0.93 | |||||
$0.98–$1.50 | 300,000 | 5.92 | $ | 1.11 | 61,525 | $ | 1.01 | |||||
$1.88–$5.69 | 319,495 | 5.62 | $ | 4.18 | 60,238 | $ | 4.90 | |||||
$5.70–$6.25 | 312,874 | 2.77 | $ | 5.95 | 231,897 | $ | 5.92 | |||||
$6.27–$7.35 | 372,862 | 6.20 | $ | 7.13 | 238,489 | $ | 7.21 | |||||
$7.47–$7.50 | 308,338 | 6.27 | $ | 7.49 | 67,937 | $ | 7.50 | |||||
$7.63–$8.89 | 310,518 | 3.60 | $ | 8.63 | 298,780 | $ | 8.66 | |||||
$9.07–$13.08 | 318,119 | 4.31 | $ | 10.99 | 205,357 | $ | 10.28 | |||||
$13.10–$20.14 | 154,942 | 3.89 | $ | 15.27 | 154,942 | $ | 15.27 | |||||
$0.49–$20.14 | 2,953,294 | 5.09 | $ | 5.95 | 1,481,629 | $ | 7.54 | |||||
As of December 27, 2008January 2, 2010 the total unrecognized compensation costs related to unvested stock options was $3.0$2.1 million which is expected to be recognized as an expense over the weighted average remaining amortization period of 2.132.0 years.
NANOMETRICS INCORPORATED
NOTES TO CONSOLIDATED FINANCIAL STATEMENTS—(Continued)
Years Ended January 2, 2010, December 27, 2008 and December 29, 2007
In September 2009, the Company completed an offer to exchange certain employee stock options under Nanometrics’ Option Exchange Program (the “Option Exchange Program”). Under the Option Exchange Program, certain previously granted options were exchanged by eligible option holders for new options with a lower exercise price using the following exchange ratios: a) 2 replacement options were provided for every 3 options surrendered with an original exercise price less than or equal to $10.00, and b) 1 replacement option was provided for every 2 options surrendered with an original exercise price greater than $10.00.
As a result of the Option Exchange Program, a total of 448,945 options to purchase shares of common stock were tendered for exchange, and 237,838 options to purchase shares of common stock were issued. A total of 103 employees participated in the Option Exchange Program. Options granted pursuant to the Option Exchange Program have an exercise price of $7.50 based on the NASDAQ closing price of the Company’s common stock on September 3, 2009. For options granted pursuant to the Option Exchange Program, one third vested immediately on the re-grant date, and the remaining two thirds will vest on a monthly basis beginning on the 13th month anniversary through the 36th month anniversary provided that the individual remains employed by the Company during that period. The incremental stock based compensation from the Option Exchange Program was $0.2 million which will be recorded ratably over the requisite service period of three years.
Note 4. Goodwill and Long-Lived Asset Impairment
| Note 6. | Goodwill and Long-Lived Asset Impairment |
Goodwill represents the excess of the purchase price paid over the fair value of tangible and identifiable intangible net assets acquired in a business combination. In accordance with SFAS 142 goodwillGoodwill is reviewed annually or whenever events or circumstances occur which indicate that goodwill might be impaired. SFAS 142 provides for aA two-step approach is provided to determining whether and by how much goodwill has been impaired. The first step requires a comparison of the fair value of the Company (reporting units, product and service) to its net book value. If the fair value is greater, then no impairment is deemed to have occurred. If the fair value is less, then the second step must be performed to determine the amount, if any, of actual impairment. The process of evaluating the potential impairment of goodwill is highly subjective and requires significant judgment.
Prior to performing step one of the goodwill impairment testing process for a reporting unit, under SFAS 142, if there is reason to believe that other non-goodwill related intangible assets (finite or indefinite lived) and/or long-lived assets may be impaired, these other intangible assets and long-lived assets must first be tested for impairment under SFAS 144.impairment. Assets governed by SFAS 144 require a recoverability test whereby the gross undiscounted cash flows are determined specific to the asset. If the sum of gross undiscounted cash flows for the fixed-life intangible asset or long-lived asset exceeds the carrying value of that asset, the test results in no impairment to the asset. If not, then the fair value of the asset must be determined and the impairment is measured by the differential between the fair value and the carrying value. For non-goodwill related indefinite-lived assets, a fair value determination is made. If the carrying value of the asset exceeds the fair value, then impairment occurs. The carrying values of these assets are impaired as necessary to provide the appropriate carrying value for the goodwill impairment calculation.
As a result of a significant decrease in our net revenues and stock price during the second quarter 2008, the Company determined that indicators of impairment existed for our goodwill and long-lived assets in the second quarter of 2008. Accordingly, in accordance with SFAS 144, the Company performed impairment tests to its long-lived assets and goodwill during the second quarter of 2008 for its reporting units, product and service. As a result of this testing, while the Company determined that there was no impairment of goodwill, the Company recorded a pre-tax, non-cash impairment charge of $11.8 million for intangible assets and $1.5 million for other long-lived assets during the second quarter 2008.
During the third quarter 2008, as a result of continued significant declines in the Company’s stock price and further evidence of the semiconductor industry being in a prolonged cyclical downturn, the Company determined that indicators of impairment existed for our goodwill and long-lived assets in the third quarter of 2008. Accordingly, in accordance with SFAS 142 and SFAS 144, the Company performed impairment tests to its long-lived assets and goodwill during the third quarter of 2008 for its reporting units, product and service. As a result of this testing, the Company determined and recorded a pre-tax, non-cash impairment charge of $54.0 million for goodwill and $1.4 million for intangible assets during the third quarter 2008. The $54.0 million represented 100% impairment of the goodwill balance. The Company also determined that there was no impairment of other long-lived assets at the end of third quarter 2008.
During the fourth quarter 2008, due to the continued and prolonged semiconductor cyclical downturn, the Company determined that indicators of impairment existed for our long-lived assets and, in accordance with
NANOMETRICS INCORPORATED
NOTES TO CONSOLIDATED FINANCIAL STATEMENTS—(Continued)
Years Ended December 27, 2008, December 29, 2007 and December 30, 2006
SFAS 144, the Company performed impairment tests to its long-lived assets during the fourth quarter of 2008. The Company determined that no impairment existed as of the end of fourth quarter 2008 for its long-lived assets and intangible assets.
The process of evaluating the potential impairment of long-lived assets is highly subjective and requires significant judgment. In estimating the fair value of these assets, the Company made estimates and judgments about future revenues and cash flows. The Company’s forecasts were based on assumptions that are consistent with the plans and estimates the Company is using to manage the business. Changes in these estimates could change the Company’s conclusion regarding impairment of the long-lived assets and potentially result in future impairment charges for all or a portion of their balance at December 27, 2008.
Due to the decline in our forecasted revenues for certain product lines relating to specific intangible assets acquired in the 2006 acquisitions of Accent Optical Technologies, Inc. and Soluris, Inc., as well as the weakening conditions in the semiconductor equipment market, the Company performed an analysis in accordance with SFAS 144. The Company performed step one of the impairment test for certain of its long-lived assets as of June 28, 2008 and September 27, 2008, and determined that the net book value exceeded the undiscounted future cash flows for certain intangible assets. Accordingly, the Company completed step two of the impairment analysis utilizing a present value technique to estimate the fair value of the impaired assets. As a result of this analysis, in the second and third quarters of 2008 the Company recorded $13.1 million in impairment charges for intangible assets, of which $3.7 million was developed technology, $7.5 million was customer relationships, $1.6 million was brand names and $0.3 million was trade mark.
Also in accordance with SFAS 144, the Company performed impairment tests for other long-lived assets such as property, plant and equipment during 2008. The Company performed an impairment analysis on its long-lived assets associated with its machine shop and plating facility, which was subcontracted in 2007, due to the significant reduction in forecasted future cash flows resulting
NANOMETRICS INCORPORATED
NOTES TO CONSOLIDATED FINANCIAL STATEMENTS—(Continued)
Years Ended January 2, 2010, December 27, 2008 and December 29, 2007
from the operational limitations of the facility. Due to these reduced forecasts, the Company performed step one of the impairment test for the machine shop and plating facility as of June 28, 2008, and determined that the net book value exceeded the undiscounted future cash flows. Accordingly, the Company completed step two of the impairment analysis utilizing a present value technique to estimate the fair value of the impaired assets. As a result of this analysis, an impairment charge of $1.5 million was recorded in the second quarter of 2008 to reduce those assets to fair value. The Company also performed step one of the impairment test on the remainder of its long lived assets in the second, third, and fourth quarters of 2008, and determined that no impairment existed.
After considering the results of the intangible and long-lived asset impairments as determined under SFAS 144, the Company then proceeded with step one of its impairment testing of goodwill under SFAS 142. The Company compared the fair value of each reporting unit to its carrying value and determined whether or not the reporting units were impaired as of June 28, 2008 and September 27, 2008.
In 2008, in estimating the fair value of the Company, the Company made estimates and judgments about future revenues and cash flows for each reporting unit. To determine the fair value, the Company’s review process included the income method based on a discounted future cash flow approach that uses estimates including the following for each reporting unit: revenue, based on assumed market growth rates and its assumed market share; estimated costs; and appropriate discount rates based on the particular business’s weighted average cost of capital. The Company’s estimates of market segment growth, market segment share and costs are based on historical data, various internal estimates and certain external sources, and are based on assumptions that are consistent with the plans and estimates it uses to manage the underlying businesses. The Company’s business
69
NANOMETRICS INCORPORATED
NOTES TO CONSOLIDATED FINANCIAL STATEMENTS—(Continued)
Years Ended December 27, 2008, December 29, 2007 and December 30, 2006
consists of both established and emerging technologies and its forecasts for emerging technologies are based upon internal estimates and external sources rather than historical information. The Company also considered its market capitalization on the dates of its impairment tests in determining the fair value of the respective businesses. The Company completed the first step of the SFAS 142 test of its goodwill at June 28, 2008 and determined that the fair value of its reporting units was in excess of the net book value on that date, and hence there was no impairment of goodwill as of the end of our second quarter 2008.
In accordance with SFAS 142, the Company concluded that events had occurred and circumstances had changed during the third quarter of 2008 which might indicate the existence of impairment indicators including a significant decline in the Company’s stock price and continued deterioration in the semiconductor equipment market and the related impact on revenue forecasts of each reporting unit. Consistent with the Company’s approach in its annual impairment testing, in assessing the fair value of the reporting unit, the Company considered both the market approach and income approach. Under the market approach, the fair value of the reporting unit is based on quoted market prices and the number of shares outstanding of the Company’s common stock. Under the income approach, the fair value of the reporting unit is based on the present value of estimated future cash flows. At September 27, 2008, the Company determined that the fair value of its reporting units was less than the net book value of the net assets of each reporting unit and accordingly, the Company performed step two of the impairment test.
In step two of the impairment test, theunit. The Company determined the implied fair value of the goodwill and compared it to the carrying value of the goodwill. With the assistance of a third party valuation firm, the Company allocated the fair value of the reporting units to all of its assets and liabilities as if the reporting unit had been acquired in a business combination and the fair value of the reporting units was the price paid to acquire the reporting unit. The excess of the fair value of the reporting unit over the amount assigned to its assets and liabilities is the implied fair value of goodwill. The Company’s step two analysis resulted in no implied fair value of goodwill, and therefore, the Company recognized an impairment charge of $54.0 million in the third quarter of 2008, representing a write-off of the entire amount of the Company’s previously recorded goodwill including goodwill from the Tevet acquisition which was a part of the impaired reporting units.
Changes in the carrying amount of goodwill are as follows (in thousands):
| At | ||||||||
| January 2, 2010 | December 27, 2008 | |||||||
Goodwill | $ | 53,980 | $ | 52,132 | ||||
Accumulated impairment losses | (53,980 | ) | — | |||||
Net goodwill at beginning of period | — | 52,132 | ||||||
Goodwill acquired in the acquisition of Tevet | — | 1,848 | ||||||
Impairment charge | — | (53,980 | ) | |||||
Net goodwill at end of period | $ | — | $ | — | ||||
| Note 7. | Sale of Accounts Receivable |
Note 5. Sale of Accounts Receivable
The Company maintains arrangements under which eligible accounts receivable in Japan are sold without recourse to unrelated third-party financial institutions. These receivables were not included in the consolidated balance sheet as the criteria for sale treatment established by SFAS No. 140, “Accounting for Transfers and Servicing of Financial Assets and Extinguishments of Liabilities” (“SFAS 140”), had been met. Under SFAS 140, afterAfter a transfer of financial assets, an entity stops recognizing the financial assets when the control has been surrendered. The agreement met the criteria of a true sale of these assets since the acquiring party retained the title to these receivables and had assumed the risk that the receivables will be collectible. The Company pays administrative fees as well as interest ranging from 1.675%1.475% to 2.0%1.770% based on the anticipated length of time between the date the sale is consummated and the expected collection date of the receivables sold. In 2009, 2008 2007 and 20062007 there were no material gains or losses on the sale of such receivables. In 20082009 and 2007,2008, the Company sold $21.7$6.5 million and $22.4$21.7 million, respectively, of receivables under the terms of the agreement. There were no amounts due from the acquiring party financial institution at January 2, 2010 and December 27, 2008 and December 29, 2007.2008.
NANOMETRICS INCORPORATED
NOTES TO CONSOLIDATED FINANCIAL STATEMENTS—(Continued)
Years Ended January 2, 2010, December 27, 2008 and December 29, 2007 and December 30, 2006
Note 6. Inventories
| Note 8. | Inventories |
Inventories consist of the following (in thousands):
| At | At | |||||||||||
| December 27, 2008 | December 29, 2007 | January 2, 2010 | December 27, 2008 | |||||||||
Raw materials and subassemblies | $ | 19,113 | $ | 19,685 | ||||||||
Raw materials and sub-assemblies | $ | 19,006 | $ | 19,113 | ||||||||
Work in process | 3,662 | 7,134 | 4,286 | 3,662 | ||||||||
Finished goods | 8,808 | 6,524 | 8,180 | 8,808 | ||||||||
Total inventories | $ | 31,583 | $ | 33,343 | $ | 31,472 | $ | 31,583 | ||||
During 2007, the Company determined that certain demonstration/evaluation equipment would no longer be marketed to be sold. Accordingly, equipment totaling $6.7 million was transferred from inventory to property, plant and equipment. During 2008, an additional $0.3 million was transferred.
Note 7. Property, Plant and Equipment
| Note 9. | Property, Plant and Equipment |
Property, plant and equipment consistsconsist of the following (in thousands):
| At | At | |||||||||||||||
| December 27, 2008 | December 29, 2007 | January 2, 2010 | December 27, 2008 | |||||||||||||
Land | $ | 15,577 | $ | 15,597 | $ | 15,583 | $ | 15,577 | ||||||||
Building and improvements | 20,973 | 21,191 | 18,575 | 20,973 | ||||||||||||
Machinery and equipment | 15,427 | 17,234 | 14,424 | 15,427 | ||||||||||||
Furniture and fixtures | 2,142 | 2,184 | 2,295 | 2,142 | ||||||||||||
Capital in progress | 2,940 | 1,521 | 1,850 | 2,940 | ||||||||||||
| 57,059 | 57,727 | 52,727 | 57,059 | |||||||||||||
Accumulated depreciation and amortization | (16,923 | ) | (13,308 | ) | (16,362 | ) | (16,923 | ) | ||||||||
Total property, plant and equipment, net | $ | 40,136 | $ | 44,419 | $ | 36,365 | $ | 40,136 | ||||||||
The decrease in building and improvement was due primarily to the closure of the South Korea facility, where an asset impairment of $1.9 million was recorded during 2009 and the remaining fair value of the property was reclassified Asset Held for Sale (see Note 4).
Depreciation expense was $4.6 million, $4.9 million and $5.1 million for 2009, 2008 and $3.2 million for 2008, 2007, and 2006, respectively. The amounts associated with capital in progress for 2009 and 2008 and 2007 of $2.9$1.9 million and $1.5$2.9 million, respectively, were related to machinery and equipment projects.
Note 8. Goodwill
| Note 10. | Intangible Assets |
On June 17, 2009, Nanometrics announced that it had purchased inventory and Intangible Assets
Goodwill representscertain other assets of Zygo Corporation and that the excess of the purchase price paid over the fair value of tangible and identifiable intangible net assets acquired intwo companies have entered into a business combination. In accordance with SFAS 142, goodwill and indefinite-lived assets are reviewed annually or whenever events or circumstances occur which indicate that goodwill might be impaired.
Goodwill and Indefinite Lived Assets
The Company’s step two analysis (as described in the Note 4. Asset Impairment) resulted in no implied fair value of goodwill, and therefore,supply agreement, as a result, the Company recognizedrecorded $1.4 million of developed technology and $0.3 million of customer relationships, during second quarter period of 2009. The Company will amortize the developed technology on a straight line basis over a period of ten years and the customer relationships on an impairment chargeaccelerated basis over a period of $54.0 million in the third quarter of 2008, representing a write-off of the entire amount of the Company’s previously recorded goodwill
71
NANOMETRICS INCORPORATED
NOTES TO CONSOLIDATED FINANCIAL STATEMENTS—(Continued)
Years Ended December 27, 2008, December 29, 2007 and December 30, 2006
including goodwilltwo years from the Tevet acquisition which was a partdate of the impaired reporting units. Changes in goodwill are as follows (in thousands):
| At | ||||||||
| December 27, 2008 | December 29, 2007 | |||||||
Balance, beginning of period | $ | 52,132 | $ | 54,817 | ||||
Deferred tax liability adjustment | — | (648 | ) | |||||
Settlement of escrow shares | — | (2,037 | ) | |||||
Goodwill from Tevet acquisition | 1,848 | — | ||||||
Impairment | (53,980 | ) | — | |||||
Balance, end of period | $ | — | $ | 52,132 | ||||
Intangible Assetsacquisition.
Intangible assets with an indefinite life are evaluated annually for impairment or whenever events or circumstances occur which indicate that those assets might be impaired. On March 15, 2006, asAs a result of the Company’s acquisition of Soluris Inc., during 2006, the Company acquired a trademark with a value of $0.4 million with an indefinite life. During the first quarter of 2008, the Company determined the trademark no longer had an indefinite life. Accordingly,life, a remaining life of five years was assigned, and the Company began amortization ofamortizing the finite-lived intangible asset.
During the second quarter of Also, during 2008, the Company added $1.5 million of finite-lived intangible assets consisting of developed technology of $1.3 million and backlog of $0.2 million through its acquisition of Tevet.
NANOMETRICS INCORPORATED
NOTES TO CONSOLIDATED FINANCIAL STATEMENTS—(Continued)
Years Ended January 2, 2010, December 27, 2008 and December 29, 2007
Finite-lived intangible assets are recorded at cost, less accumulated amortization. Finite-lived intangible assets as of January 2, 2010 and December 27, 2008 and December 29, 2007 consist of the following (in thousands):
| Original Cost | Impairment & Tax Adjustment(a) | New Cost Basis | Accumulated Amortization | Net Intangible Assets | Adjusted basis as of December 27, 2008 | Additions during 2009 at cost | Adjusted basis as of January 2, 2010 | Accumulated amortization as of January 2, 2010 | Net carrying amount as of January 2, 2010 | |||||||||||||||||||||||
December 27, 2008 | ||||||||||||||||||||||||||||||||
Developed technology | $ | 11,069 | $ | (3,750 | ) | $ | 7,319 | $ | 3,147 | $ | 4,172 | $ | 7,319 | $ | 1,362 | $ | 8,681 | $ | (3,934 | ) | $ | 4,747 | ||||||||||
Customer relationships | 15,700 | (7,517 | ) | 8,183 | 6,330 | 1,853 | 8,183 | 338 | 8,521 | (6,924 | ) | 1,597 | ||||||||||||||||||||
Brand names | 3,600 | (1,673 | ) | 1,927 | 1,087 | 840 | 1,927 | — | 1,927 | (1,232 | ) | 695 | ||||||||||||||||||||
Patented technology | 1,790 | — | 1,790 | 1,790 | — | 1,790 | — | 1,790 | (1,790 | ) | — | |||||||||||||||||||||
Trade Mark | 400 | (320 | ) | 80 | 44 | 36 | ||||||||||||||||||||||||||
Trademark | 80 | — | 80 | (52 | ) | 28 | ||||||||||||||||||||||||||
Backlog | 3,361 | — | 3,361 | 3,361 | — | 3,361 | — | 3,361 | (3,361 | ) | — | |||||||||||||||||||||
Non-compete agreement | 50 | — | 50 | 50 | — | 50 | — | 50 | (50 | ) | — | |||||||||||||||||||||
Other | 250 | — | 250 | 250 | — | 250 | — | 250 | (250 | ) | — | |||||||||||||||||||||
Total | $ | 36,220 | $ | (13,260 | ) | $ | 22,960 | $ | 16,059 | $ | 6,901 | $ | 22,960 | $ | 1,700 | $ | 24,660 | $ | (17,593 | ) | $ | 7,067 | ||||||||||
December 29, 2007 | ||||||||||||||||||||||||||||||||
Developed technology | $ | 9,800 | $ | — | $ | 9,800 | $ | 2,037 | $ | 7,763 | ||||||||||||||||||||||
Customer relationships | 15,700 | — | 15,700 | 4,638 | 11,062 | |||||||||||||||||||||||||||
Brand names | 3,600 | — | 3,600 | 749 | 2,851 | |||||||||||||||||||||||||||
Patented technology | 1,790 | — | 1,790 | 1,646 | 144 | |||||||||||||||||||||||||||
Backlog | 3,131 | — | 3,131 | 3,131 | — | |||||||||||||||||||||||||||
Non-compete agreement | 50 | — | 50 | 50 | — | |||||||||||||||||||||||||||
Other | 250 | — | 250 | 250 | — | |||||||||||||||||||||||||||
Total | $ | 34,321 | $ | — | $ | 34,321 | $ | 12,501 | $ | 21,820 | ||||||||||||||||||||||
NANOMETRICS INCORPORATED
NOTES TO CONSOLIDATED FINANCIAL STATEMENTS—(Continued)
Years Ended December 27, 2008, December 29, 2007 and December 30, 2006
| Original amount | Impairment and tax adjustment during 2008 | Additions during 2008 at cost | Adjusted basis as of December 27, 2008 | Accumulated amortization as of December 27, 2008 | Net carrying amount as of December 27, 2008 | |||||||||||||||
Developed technology | $ | 9,800 | $ | (3,750 | ) | $ | 1,269 | $ | 7,319 | $ | (3,147 | ) | $ | 4,172 | ||||||
Customer relationships | 15,700 | (7,517 | ) | — | 8,183 | (6,330 | ) | 1,853 | ||||||||||||
Brand names | 3,600 | (1,673 | ) | — | 1,927 | (1,087 | ) | 840 | ||||||||||||
Patented technology | 1,790 | — | — | 1,790 | (1,790 | ) | — | |||||||||||||
Trademark | 400 | (320 | ) | — | 80 | (44 | ) | 36 | ||||||||||||
Backlog | 3,131 | — | 230 | 3,361 | (3,361 | ) | — | |||||||||||||
Non-compete agreement | 50 | — | — | 50 | (50 | ) | — | |||||||||||||
Other | 250 | — | — | 250 | (250 | ) | ��� | |||||||||||||
Total | $ | 34,721 | $ | (13,260 | ) | $ | 1,499 | $ | 22,960 | $ | (16,059 | ) | $ | 6,901 | ||||||
The amortization of finite-lived intangibles is computed using the straight-line method except for customer relationships which is computed using an accelerated method. Estimated lives of finite-lived intangibles range from five to ten years, except for the non-compete agreement and backlog which are amortized over one year. As of January 2, 2010, the weighted average amortization period of intangibles is 7 years. Total amortization expense was $1.5 million, $3.5 million and $5.8 million, $5.3 million for fiscal 2009, 2008 2007 and 2006,2007, respectively.
The estimated future amortization expense as of December 27, 2008January 2, 2010 is as follows (in thousands):
Fiscal Years | Amounts | |||||
2009 | $ | 1,350 | ||||
2010 | 1,267 | $ | 1,557 | |||
2011 | 1,108 | 1,319 | ||||
2012 | 972 | 1,112 | ||||
2013 | 811 | 951 | ||||
2014 | 809 | |||||
Thereafter | 1,393 | 1,319 | ||||
Total amortization | $ | 6,901 | $ | 7,067 | ||
NANOMETRICS INCORPORATED
NOTES TO CONSOLIDATED FINANCIAL STATEMENTS—(Continued)
Years Ended January 2, 2010, December 27, 2008 and December 29, 2007
Note 9. Other Current Liabilities
| Note 11. | Other Current Liabilities |
Other current liabilities consist of the following (in thousands):
| At | At | |||||||||||
| December 27, 2008 | December 29, 2007 | January 2, 2010 | December 27, 2008 | |||||||||
Accrued warranty | $ | 2,075 | $ | 4,545 | $ | 1,200 | $ | 2,075 | ||||
Accrued professional services | 883 | 529 | 1,021 | 883 | ||||||||
Customer deposits | 1,601 | 185 | ||||||||||
Fair value of deferred payments to Zygo Corporation related to acquisition | 3,655 | — | ||||||||||
Other | 2,842 | 2,169 | 1,475 | 2,657 | ||||||||
Total other current liabilities | $ | 5,800 | $ | 7,243 | $ | 8,952 | $ | 5,800 | ||||
Note 10. Debt Obligations
| Note 12. | Line of Credit and Debt Obligations |
Debt obligations consist of the following (in thousands):
| At | January 2, 2010 | December 27 2008 | ||||||||||||||
| December 27, 2008 | December 29, 2007 | |||||||||||||||
Line of Credit | ||||||||||||||||
Balance on line of credit | $ | — | $ | — | ||||||||||||
Debt Obligations | ||||||||||||||||
Milpitas building mortgage | $ | 13,400 | $ | — | 13,082 | 13,400 | ||||||||||
Equipment financing | 96 | 277 | — | 96 | ||||||||||||
Total debt obligations | 13,496 | 277 | 13,082 | 13,496 | ||||||||||||
Current portion of debt obligations | (413 | ) | (148 | ) | (343 | ) | (413 | ) | ||||||||
Long-term debt obligations | $ | 13,083 | $ | 129 | $ | 12,739 | $ | 13,083 | ||||||||
In February 2007, the Company entered into a two-year agreement for a revolving line of credit facility in a maximum principal amount of $15.0 million. On April 30, 2009, Nanometrics re-negotiated its revolving line of credit facility for an additional two years, to April 30, 2011. The instrument governing the facility includes certain financial covenants regarding net tangible worth. The revolving line of credit agreement includes a provision for the issuance of commercial or standby letters of credit by the bank on behalf of the Company. The value of all letters of credit outstanding reduces the total line of credit available. The revolving line of credit is collateralized by a blanket lien on all of the Company’s domestic assets excluding intellectual property and real estate. On June 15, 2009, we amended the financial covenants governing the credit facility to reduce the net tangible worth requirements, effective as of June 27, 2009
73
NANOMETRICS INCORPORATED
NOTES TO CONSOLIDATED FINANCIAL STATEMENTS—(Continued)
Years Ended December 27, 2008, December 29, 2007Borrowing is limited to the lesser of (a) $7.5 million plus the Borrowing Base or (b) $15.0 million. The Borrowing Base is calculated based on eligible receivables (determined by a formula considering specific customers, concentration of receivables, letters of credit, and December 30, 2006
the other factors) and was $13.9 million as of January 2, 2010. The entire $15.0 million was available for borrowing as of January 2, 2010. As of the end of the fiscal year of 2009, the Company had no borrowing on the line of credit. The minimum borrowing interest rate is 5.75% per annum. The maximum borrowing allowed on the line of credit is $15.0 million. The Company is not in breach of any restrictive covenants in connection with its line of credit and all debt obligations. No withdrawals have been made as of January 2, 2010. Although the Company has no current plans to request advances under this credit facility, it may use the proceeds of any future borrowing for general corporate purposes or for future acquisitions or expansion of the Company’s business.
In July 2008, the Company entered into a loan agreement pursuant to which we borrowed $13.5 million. The loan initially bears interest at the rate of 7.18% per annum, which rate will be reset after five years to 3.03% over the then weekly average yield of five-year U.S. Dollar Interest Rate Swaps as published by the Federal Reserve. Monthly principal and interest payments are based on a twenty year amortization for the first sixty months and fifteen year amortization thereafter. The remaining principal balance of the loan and any accrued but unpaid interest will be due on August 1, 2018. The loan is secured, in part, by a lien on and security interest in the building and land comprising of the Company’s principal offices in Milpitas, California.
The equipment financing was obtained in November 2006 by the Company’s subsidiary in the United Kingdom and is collateralized by the financed assets. The loan is denominated in British pounds sterling (£64,809 at December 27, 2008) and bears interest at 5.53% per annum. The loan is payable in monthly installments with unpaid principal and interest due in November 2009.
The Company is not in breach of any restrictive covenants in connection with its debt as of December 27, 2008. At December 27, 2008, future annual maturities of debt obligations were as follows (in thousands):
2009 | $ | 413 | |
2010 | 343 | ||
2011 | 368 | ||
2012 | 396 | ||
2013 | 426 | ||
Thereafter | 11,550 | ||
Total | $ | 13,496 | |
Note 11. Line of Credit
In February 2007, the Company entered into a two-year agreement for a revolving line of credit facility in a maximum principal amount of $15 million. This agreement was subsequently extended until May 2009 and all other original terms remain unchanged. The instrument governing the facility includes certain financial covenants regarding net tangible worth. The Company is in compliance with all covenants as of December 27, 2008. All borrowings under this credit line bear interest, at the Company’s election, at a per annum rate equal to the bank’s prime rate or at the London Interbank Offered Rate (or LIBOR) plus 2.25%. The revolving line of credit agreement includes a provision for the issuance of commercial or standby letters of credit by the bank on behalf of the Company. The value of all letters of credit outstanding reduces the total line of credit available. The revolving line of credit is collateralized by a blanket lien on all of the Company’s domestic assets excluding intellectual property. No withdrawals have been made as of December 27, 2008. Although the Company has no current plans to request advances under this credit facility, it may use the proceeds of any future borrowing for general corporate purposes or for future acquisitions or expansion of the Company’s business.
NANOMETRICS INCORPORATED
NOTES TO CONSOLIDATED FINANCIAL STATEMENTS—(Continued)
Years Ended January 2, 2010, December 27, 2008 and December 29, 2007 and December 30, 2006
At January 2, 2010, future annual maturities of all debt obligations were as follows (in thousands):
| Amounts | |||
2010 | $ | 343 | |
2011 | 368 | ||
2012 | 396 | ||
2013 | 426 | ||
2014 | 458 | ||
Thereafter | 11,091 | ||
Total | $ | 13,082 | |
Note 12. Commitments and Contingencies
| Note 13. | Commitments and Contingencies |
The Company leases facilities and certain equipment under non-cancellable operating leases. Rent expense, which is recorded on a straight-line basis over the term of the respective lease, for 2009, 2008 2007, and 20062007, was approximately $1.4 million, $2.2$1.4 million and $1.0$2.2 million, respectively. Future minimum lease payments under its operating leases are as follows (in thousands):
| Operating Leases | Operating Leases | |||||
2009 | $ | 649 | ||||
2010 | 357 | $ | 1,317 | |||
2011 | 247 | 630 | ||||
2012 | 229 | 502 | ||||
2013 | 207 | 352 | ||||
2014 | 339 | |||||
Thereafter | 1,013 | |||||
Total | $ | 1,689 | $ | 4,153 | ||
In August 2007,On February 22, 2010, the Compensation Committee (“The “Committee”) of the Board of Directors (the “Board”) of Nanometrics entered intoapproved, among other things, (i) an executive severance agreement withamendment to the Executive Severance Agreement between the Company and Bruce Crawford, the Company’s Chief Operating Officer, (the “Crawford Severance Agreement”), and (ii) an amendment to the Employment Agreement between the Company and James P. Moniz, the Company’s Chief Financial Officer, (the “Moniz Employment Agreement”). On February 23, 2010, the Board approved, among other things, an amendment to the Executive Severance Agreement between the Company and Timothy J. Stultz, Ph.D., President,; the Company’s Chief Executive OfficerOffice (the “Stultz Severance Agreement”).
As amended, the Stultz Severance Agreement, Crawford Severance Agreement and a director, which provides for certain severance benefits following aMoniz Employment Agreement each provide that, in the event of such officer’s termination without cause including in connection with a change in control. Specifically, Nanometrics agrees to pay Dr. Stultz (i) his annual salary, including bonuses earned or accrued, and reimbursements for his premium payments under COBRA for nine months from the date of separation in the event that Dr. Stultz’ employment with Nanometrics is terminated by us without cause or Dr. Stultz resigns for good reason during the period beginning one year and one day after Dr. Stultz’ hire date (which was August 27, 2007) until two years from Dr. Stultz’ hire date; (ii) his annual salary, including bonuses earned or accrued, and reimbursements for his premium payments under COBRA for six months from the date of separation in the event that Dr. Stultz’ employment with Nanometrics is terminated by us without cause or Dr. Stultz resigns for good reason during the period beginning two years and one day after Dr. Stultz’ hire date or thereafter; and (iii) his annual salary, including bonuses earned or accrued, and reimbursements for his premium payments under COBRA for twelve (12) months and 100% acceleration of all equity awards, from the date of separation in the event that Dr. Stultz’ employment with Nanometrics is terminated by us without cause or Dr. Stultz resignsresignation for good reason within twelve months following a change in control, provided that Dr. Stultz executes a general release.
In August 2007, Nanometrics entered into an executive severance agreement with Bruce A. Crawford, Chief Operating Officer, which provides for certain severance benefits following a termination without cause, including six months continuing salary at his then-effective annual rate, reimbursements for his premium payments under COBRA for twelve months and twelve months of partial equity award acceleration, provided that Mr. Crawford executes a general release.
In February 2009, Nanometrics entered into an executive severance agreement with James P. Moniz, Chief Financial Officer, which provides for certain severance benefits if Mr. Moniz is terminated without cause or he resigns for good reason within twelve12 months of a change of control, including six months continuingsuch officer shall receive (i) a payment equal to such officer’s then-current annual base salary, full(ii) a payment equal to the most recent bonus actually received by such officer, (iii) subject to such officer’s satisfaction of certain eligibility requirements, reimbursement of COBRA premiums for a period of one year, and (iv) acceleration of all of such officer’s outstanding equity awards and reimbursements for his premium payments under COBRA for up to twelve months,unvested shares; provided, that Mr. Moniz executesthe maximum amount that such officer is entitled to receive under (i) above (base salary severance) and (ii) above (bonus severance) shall not exceed two times such officer’s then-current base salary, calculated on a general release.pre-tax basis.
In August 2005, KLA-Tencor Corporation, or KLA, filed a complaint against us in the United States District Court for the Northern District of California. The complaint alleges that certain of the Company’s products infringe two of KLA’s patents. On January 30, 2007,2006, KLA added a third patent to their claim. The complaint
75
NANOMETRICS INCORPORATED
NOTES TO CONSOLIDATED FINANCIAL STATEMENTS—(Continued)
Years Ended December 27, 2008, December 29, 2007 and December 30, 2006
seeks a preliminary and permanent injunction against the sale of these products as well as the recovery of monetary damages and attorneys’ fees. The Company does not believe that any of its products infringe the intellectual property of any third party and intends to vigorously and aggressively defend itself in the litigation. As part of such defense, the Company filed a request for
NANOMETRICS INCORPORATED
NOTES TO CONSOLIDATED FINANCIAL STATEMENTS—(Continued)
Years Ended January 2, 2010, December 27, 2008 and December 29, 2007
re-examination of the three allegedly infringed KLA patents with the U.S. Patent & Trademark Office, or PTO. In March 2006, the Company filed a motion for and was granted a stay in the patent litigation case until such re-examination is completed. On July 28, 2008, the PTO issued a Notice of Intent to issue a Reexamination Certificate for one of the KLA patents. The other two patent reexaminations remain pending.reexamination of the final KLA patent-in-suit remains pending and on September 21, 2009 the Company filed an additional request for re-examination relating to this patent. The case has been stayed, and the Company is waiting to receive a response from the Patent and Trademark Office before it takes any additional action. In all three of the reexamination proceedings, the PTO has issued Office Actions rejecting numerous claims and KLA has amended the claims in response.
Note 13. Stockholders’ Equity
| Note 14. | Stockholders’ Equity |
Preferred and Common Stock
Nanometrics was incorporated in California in 1975. On September 29, 2006, the Company was reincorporated in the State of Delaware. As part of the reincorporation, each outstanding share of the California corporation, no par value common stock, was converted automatically to one share of the new Delaware corporation, $0.001 par value common stock. The authorized capital stock of Nanometrics consists of 47,000,000 shares of common stock, par value $0.001 per share, and 3,000,000 shares of preferred stock, par value $0.001 per share.
In December 2009, the Company completed a public offering of its common stock resulting in the issuance of 2,307,152 shares at net proceeds of $23.3 million. The Company plans to use approximately $2.0 million of the net proceeds from the offering to repay certain obligations related to the Company’s acquisition of certain assets of Zygo Corporation in June 2009, with the remainder to be used for general corporate purposes, including working capital.
Stock Option Plans
Options to acquire common stock generally vest at a rate of 33.3% upon each anniversary of the stock option grant, and generally expire between five and seven years from the date of grant. The Nanometrics option plans are as follows:
Plan Name | Participants | Shares Authorized | ||
2005 Equity Incentive Plan | Employees, consultants and directors | 2,692,594 | ||
2002 Non-statutory Stock Option Plan | Employees and consultants | 1,200,000 | ||
2000 Employee Stock Option Plan | Employees and consultants | 2,450,000 | ||
2000 Director Stock Option Plan | Non-employee directors | 250,000 | ||
1991 Stock Option Plan | Employees and consultants | 3,000,000 | ||
Accent Optical Technologies, Inc. Stock Incentive Plan | Employees and consultants | 205,003 |
See Note 35 above for information on option activity in 2008.2009.
Employee Stock Purchase Plan
Under the 2003 Employee Stock Purchase Plan (“ESPP”), eligible employees are allowed to have salary withholdings of up to 10% of their base compensation to purchase shares of common stock at a price equal to 85% of the lower of the market value of the stock at the beginning or end of each six-month offering period, subject to an annual limitation. At the end of the fiscal year ended December 27, 2008January 2, 2010 Nanometrics had 178,7541.0 million shares remaining for issuance under the ESPP. Shares issued under the ESPP were 352,356 shares, 267,649 shares, and 111,680 shares in 2009, 2008 at a weighted average price of $2.26, 111,680 inand 2007 at a weighted average price of $1.71, $2.26 and $5.30, and 71,432 in 2006 at a weighted average price of $9.38.
NANOMETRICS INCORPORATED
NOTES TO CONSOLIDATED FINANCIAL STATEMENTS—(Continued)
Years Ended December 27, 2008, December 29, 2007 and December 30, 2006
| Note 15. | Restructuring Charge |
In the first and second quarters of 2009, the Company reduced the global workforce by 51 and 25 employees, respectively, and recorded a restructuring charge of $0.7 million and $0.4 million in each respective quarter. Twelve (12) of the employees terminated in the second quarter of 2009 were in connection with the South Korea manufacturing facility closure.
NANOMETRICS INCORPORATED
NOTES TO CONSOLIDATED FINANCIAL STATEMENTS—(Continued)
Years Ended January 2, 2010, December 27, 2008 and December 29, 2007
Note 14. Restructuring Charge
| Severance and Other Benefits | Total | |||||||
Reserve balance at December 27, 2008 | $ | 80 | $ | 80 | ||||
Restructuring charges during 2009 | 1,134 | 1,134 | ||||||
Cash paid | (1,214 | ) | (1,214 | ) | ||||
Reserve balance at January 2, 2010 | $ | — | $ | — | ||||
During the first and third quarters of 2008, the Company reduced its global work force by approximately 30 and 34 employees, respectively. This reduction affected employees in each of the Company’s locations worldwide and was aimed at reducing its operating expenses.
| Professional Fees | Severance and other benefits | Other Charges | Total | ||||||||||||
Restructuring charges- First Quarter 2008 | $ | — | $ | 786 | $ | 84 | $ | 870 | |||||||
Restructuring charges- Second Quarter 2008 | — | 655 | — | 655 | |||||||||||
Cash paid | — | $ | (1,361 | ) | $ | (84 | ) | $ | (1,445 | ) | |||||
Reserve balance at December 27, 2008 | $ | — | $ | 80 | $ | — | $ | 80 | |||||||
The Company anticipates that the remaining restructuring reserve balance of $0.08 million will be paid or utilized by first quarter of fiscal 2009. The balance is reflected in “Other current liabilities” in the accompanying consolidated balance sheet.
| Severance and Other Benefits | Other Charges | Total | ||||||||||
Reserve balance at December 29, 2007 | $ | — | $ | — | $ | — | ||||||
Restructuring charges during 2008 | 1,441 | 84 | 1,525 | |||||||||
Cash paid | (1,361 | ) | (84 | ) | (1,445 | ) | ||||||
Reserve balance at December 27, 2008 | $ | 80 | $ | — | $ | 80 | ||||||
During the third quarter of 2007, the Company announced it would close its Milpitas, California machine shop and plating facility as part of its strategy to reverse its manufacturing vertical integration and lower its breakeven point. In conjunction with this closure, Nanometrics recorded a restructuring charge in an amount of $2.1 million consisting of $1.9 million write-down of property, plant and equipment, $0.1 million for professional fees and $0.1 million for severance payments. The remaining reserve balance was cleared during the quarter ended December 29, 2007.
| Professional Fees | Severance and other benefits | Other Charges | Total | Professional Fees | Severance and Other Benefits | Other Charges | Total | |||||||||||||||||||||||||
Restructuring charges | $ | 126 | $ | 92 | $ | 1,910 | $ | 2,128 | ||||||||||||||||||||||||
Reserve balance at December 30, 2006 | $ | — | $ | — | $ | — | $ | — | ||||||||||||||||||||||||
Restructuring charges during 2007 | 126 | 92 | $ | 1,910 | $ | 2,128 | ||||||||||||||||||||||||||
Non-cash charges | — | — | (1,910 | ) | (1,910 | ) | — | — | (1,910 | ) | (1,910 | ) | ||||||||||||||||||||
Cash paid | (126 | ) | (92 | ) | — | (218 | ) | (126 | ) | (92 | ) | — | (218 | ) | ||||||||||||||||||
Reserve balance at December 29, 2007 | $ | — | $ | — | $ | — | $ | — | $ | — | $ | — | $ | — | $ | — | ||||||||||||||||
Note 15. Gain on the Sale of Assets
| Note 16. | Gain on the Sale of Assets |
In August 2007, the Company sold land and a building in Japan and realized a gain on the sale of $1.1 million. In July 2007, the Company sold a condominium in California and realized a gain of $0.2 million in the third quarter of 2007. The Company also sold other non-strategic assets during 2007 realizing a gain of $0.8 million. Gain on sale of assets was insignificant during 20082009 and 2006.
77
2008.
NANOMETRICS INCORPORATED
NOTES TO CONSOLIDATED FINANCIAL STATEMENTS—(Continued)
Years Ended January 2, 2010, December 27, 2008 and December 29, 2007 and December 30, 2006
Note 16. Defined Benefit Pension Plan
| Note 17. | Defined Benefit Pension Plan |
Nanometrics sponsors a statutory defined benefit pension plan (the “Benefit Plan”) in Taiwan for its local employees. The funded status of the Benefit Plan was as follows for the fiscal years ended January 2, 2010, December 27, 2008 and December 29, 2007 (in thousands):
Change in fair value of plan assets
| For Years Ended | |||||||||||||||
| December 27, 2008 | December 29, 2007 | 2009 | 2008 | 2007 | |||||||||||
Fair value of plan assets at beginning of year | $ | 55 | $ | 23 | $ | 78 | $ | 55 | $ | 23 | |||||
Actual return on plan assets | 2 | 1 | 4 | 2 | 1 | ||||||||||
Employer contributions | 21 | 31 | 13 | 21 | 31 | ||||||||||
Fair value of plan assets at end of year | $ | 78 | $ | 55 | $ | 95 | $ | 78 | $ | 55 | |||||
Change in projected benefit obligations
| For Years Ended | ||||||||||||||||||
| December 27, 2008 | December 29, 2007 | 2009 | 2008 | 2007 | ||||||||||||||
Projected benefit obligation at the beginning of the year | $ | 808 | $ | 784 | $ | 560 | $ | 808 | $ | 784 | ||||||||
Interest cost | 18 | 24 | 14 | 18 | 24 | |||||||||||||
Actuarial gain/loss | (15 | ) | — | (88 | ) | (15 | ) | — | ||||||||||
Effects due to curtailment | (251 | ) | — | (189 | ) | (251 | ) | — | ||||||||||
Benefit obligation | $ | 560 | $ | 808 | $ | 297 | $ | 560 | $ | 808 | ||||||||
Funding deficiency | $ | 482 | $ | 753 | $ | 201 | $ | 482 | $ | 753 | ||||||||
The funding deficiency is reflected in other long-term liabilities on the balance sheet at January 2, 2010 and December 27, 2008, and December 29, 2007 respectively.
The accumulated benefit obligation as of January 2, 2010, December 27, 2008 and December 29, 2007 was $0.2 million, $0.4 million and $0.5 million, respectively.
The Company’s Pension Benefit Plan reflects a net gain of $0.1 million and, $0.2 million in 2009 and 2008, respectively, and a net loss of $ 0.2 and $0.3 million in accumulated other comprehensive income for the year ended January 2, 2010, December 27, 2008 and December 29, 2007, respectively.
NANOMETRICS INCORPORATED
NOTES TO CONSOLIDATED FINANCIAL STATEMENTS—(Continued)
Years Ended December 27, 2008, December 29, 2007 and December 30, 2006
Pension Benefit Expense
Nanometrics’ net pension benefit cost/cost (gain) were as follows for the years ended January 2, 2010, December 27, 2008 and December 29, 2007 (in thousands):
| For Years Ended | ||||||||||||||||||||
| December 27, 2008 | December 29, 2007 | 2009 | 2008 | 2007 | ||||||||||||||||
Interest cost | $ | 18 | $ | 24 | $ | 14 | $ | 18 | $ | 24 | ||||||||||
Amortization of transition obligation | 18 | 36 | 17 | 18 | 36 | |||||||||||||||
Amortization of net loss | (2 | ) | — | (2 | ) | (2 | ) | — | ||||||||||||
Expected return on plan assets | (2 | ) | — | (2 | ) | (2 | ) | — | ||||||||||||
Curtailment or settlement (gain)/loss | (146 | ) | — | |||||||||||||||||
Curtailment or settlement (gain) loss | (153 | ) | (146 | ) | — | |||||||||||||||
Actual return on plan assets | — | (1 | ) | — | — | (1 | ) | |||||||||||||
Service cost | — | — | ||||||||||||||||||
Net pension benefit cost/(gain) for the year | $ | (114 | ) | $ | 59 | |||||||||||||||
Net pension benefit cost (gain) for the year | $ | (126 | ) | $ | (114 | ) | $ | 59 | ||||||||||||
The weighted average assumptions used to calculate net benefit cost and obligations were as follows for the fiscal years ended January 2, 2010, December 27, 2008 and December 29, 2007 were:
| For Years Ended | |||||||||||||||
| December 27, 2008 | December 29, 2007 | 2009 | 2008 | 2007 | |||||||||||
Average increase in compensation levels | 2.0 | % | 3.0 | % | 1.5 | % | 2.0 | % | 3.0 | % | |||||
Discount rate | 2.5 | % | 3.0 | % | 2.3 | % | 2.5 | % | 3.0 | % | |||||
Expected long-term returns on the assets | 2.5 | % | 2.5 | % | 2.0 | % | 2.5 | % | 2.5 | % | |||||
As required by the law, the Company’s plan assets are deposited in Trust of Bank of Taiwan in the form of cash, where Trust of Bank of Taiwan is the assigned trustee for statutory retirement benefits. The expected long-term rate of return of assets for the plan reflects the expected returns for the bank accounts held with the government of Taiwan in which the plan invests.
Note 17. Income TaxesNANOMETRICS INCORPORATED
NOTES TO CONSOLIDATED FINANCIAL STATEMENTS—(Continued)
Years Ended January 2, 2010, December 27, 2008 and December 29, 2007
| Note 18. | Income Taxes |
Loss before provision (benefit) for income taxes consists of the following (in thousands):
| Years Ended | ||||||||||||
| December 27, 2008 | December 29, 2007 | December 30, 2006 | ||||||||||
Domestic | $ | (69,860 | ) | $ | (10,918 | ) | $ | (14,258 | ) | |||
Foreign | (12,430 | ) | 6,879 | (8,192 | ) | |||||||
Loss before income taxes | $ | (82,290 | ) | $ | (4,039 | ) | $ | (22,450 | ) | |||
79
NANOMETRICS INCORPORATED
NOTES TO CONSOLIDATED FINANCIAL STATEMENTS—(Continued)
Years Ended December 27, 2008, December 29, 2007 and December 30, 2006
| Years Ended | ||||||||||||
| January 2, 2010 | December 27, 2008 | December 29, 2007 | ||||||||||
Domestic | $ | (14,111 | ) | $ | (69,860 | ) | $ | (10,918 | ) | |||
Foreign | (2,780 | ) | (12,430 | ) | 6,879 | |||||||
Loss before income taxes | $ | (16,891 | ) | $ | (82,290 | ) | $ | (4,039 | ) | |||
The provision (benefit) for income taxes consists of the following (in thousands):
| Years Ended | Years Ended | |||||||||||||||||||||||
| December 27, 2008 | December 29, 2007 | December 30, 2006 | January 2, 2010 | December 27, 2008 | December 29, 2007 | |||||||||||||||||||
Current: | ||||||||||||||||||||||||
Federal | $ | (127 | ) | $ | — | $ | — | $ | (75 | ) | $ | (127 | ) | $ | — | |||||||||
State | 72 | 146 | 20 | 6 | 72 | 146 | ||||||||||||||||||
Foreign | 1,238 | 719 | 94 | (111 | ) | 1,238 | 719 | |||||||||||||||||
| 1,183 | 865 | 114 | (180 | ) | 1,183 | 865 | ||||||||||||||||||
Deferred: | ||||||||||||||||||||||||
Federal | (238 | ) | — | (437 | ) | — | (238 | ) | — | |||||||||||||||
State | — | — | — | — | — | — | ||||||||||||||||||
Foreign | (509 | ) | (896 | ) | — | (406 | ) | (509 | ) | (896 | ) | |||||||||||||
| (747 | ) | (896 | ) | (437 | ) | (406 | ) | (747 | ) | (896 | ) | |||||||||||||
Provision (benefit) for income taxes | $ | 436 | $ | (31 | ) | $ | (323 | ) | $ | (586 | ) | $ | 436 | $ | (31 | ) | ||||||||
Significant components of the Company’s deferred tax assets and liabilities are as follows (in thousands):
| At | At | |||||||||||||||
| December 27, 2008 | December 29, 2007 | January 2, 2010 | December 27, 2008 | |||||||||||||
Deferred tax assets – current: | ||||||||||||||||
Reserves and accruals not currently deductible | $ | 5,202 | $ | 9,287 | $ | 4,830 | $ | 5,202 | ||||||||
Capitalized inventory costs | 1,284 | 1,214 | 2,930 | 1,284 | ||||||||||||
Total gross deferred tax assets – current | 6,486 | 10,501 | 7,760 | 6,486 | ||||||||||||
Valuation allowance | (6,136 | ) | (10,501 | ) | (7,515 | ) | (6,136 | ) | ||||||||
Total net deferred tax assets – current | $ | 350 | $ | — | $ | 245 | $ | 350 | ||||||||
Deferred tax assets (liabilities) noncurrent: | ||||||||||||||||
Deferred tax assets noncurrent: | ||||||||||||||||
Tax credit carry-forwards | $ | 6,773 | $ | 6,669 | $ | 8,165 | $ | 6,773 | ||||||||
Depreciation | (460 | ) | (1,537 | ) | (109 | ) | (460 | ) | ||||||||
Reserves and accruals | 2,749 | 3,416 | 2,295 | 2,749 | ||||||||||||
Intangible assets | 3,025 | (1,859 | ) | 1,844 | 3,025 | |||||||||||
Net operating loss carry-forwards | 16,694 | 22,710 | 19,645 | 16,694 | ||||||||||||
Translation adjustments | — | — | ||||||||||||||
Business Combination | 402 | — | ||||||||||||||
Total net deferred tax assets (liabilities) – noncurrent | 28,781 | 29,399 | ||||||||||||||
Total net deferred tax assets – noncurrent | 32,242 | 28,781 | ||||||||||||||
Valuation allowance | (28,766 | ) | (29,781 | ) | (31,630 | ) | (28,766 | ) | ||||||||
Total net deferred tax assets (liabilities) – noncurrent | $ | 15 | $ | (382 | ) | |||||||||||
Total net deferred tax assets – noncurrent | $ | 612 | $ | 15 | ||||||||||||
As
NANOMETRICS INCORPORATED
NOTES TO CONSOLIDATED FINANCIAL STATEMENTS—(Continued)
Years Ended January 2, 2010, December 27, 2008 and December 29, 2007
The net deferred tax assets - noncurrent as of December 27, 2008 was included in “other assets” in the consolidated Balance Sheet.
As of January 2, 2010, the Company had net operating loss carry-forwards for federal income tax purposes of $34.3$35.5 million, which expire after 2023. Of the federal net operating loss carry-forwards, $1.2 million relate to stock options and will be credited to additional paid-in-capital when realized. As of December 27, 2008,January 2, 2010, the Company had net operating loss carry-forwards of $25.1$27.3 million in California, $1.1 million for other states and net operating loss carry forward of $5.2 million and $0.4$21.8 million in Japan and the United Kingdom,foreign countries, respectively.
NANOMETRICS INCORPORATED
NOTES TO CONSOLIDATED FINANCIAL STATEMENTS—(Continued)
Years Ended December 27, 2008, December 29, 2007 and December 30, 2006
As of December 27, 2008,January 2, 2010, the Company had available for carry-forward research and experimental tax credits, minimum tax credits and foreign tax credits for federal income tax purposes of $3.7$2.6 million, $0.3 million, and $1.3$2.9 million, respectively. Federal credit carry-forwards beginbegan to expire in 2008.
2023. As of December 27, 2008,January 2, 2010, the Company had available for carry-forward state research and experimental tax credits of $2.2$3.4 million. State research and experimental tax credits carry-forward indefinitely.
During the years ended January 2, 2010 and December 27, 2008 and December 29, 2007 the valuation allowance increased/(decreased)increased by $(5.4)$4.2 million and $15.6decreased by $5.4 million, respectively. The valuation allowance decreasedincreased in 20082009 due to the releaseincrease of the valuation allowance against foreignUS deferred taxes.
Changes in tax laws and tax rates could affect our recorded deferred tax assets and liabilities in the future. and the calculation of our tax liabilities involves dealing with uncertainties in the application of complex tax laws and regulations in a multitude of jurisdictions across our global operations, management is not aware of any such changes or factors that would have a material effect on the Company’s results of operations, cash flows or financial position.
In July 2006, tax benefit from an uncertain tax position may be recognized when it is more likely than not that the position will be sustained upon examination, including resolutions of any related appeals or litigation processes, based on the technical merits. Income tax positions must meet a more-likely-than-not recognition threshold at the effective date as of January 1, 2007 to be recognized and in subsequent periods. This interpretation also provides guidance on measurement, derecognition, classification, interest and penalties, accounting in interim periods, disclosure and transition.
We recognize tax liabilities and we adjust these liabilities when our judgment changes as a result of the evaluation of new information not previously available. Due to the complexity of some of these uncertainties, the ultimate resolution may result in a payment that is materially different from our current estimate of the tax liabilities. These differences will be reflected as increases or decreases to income tax expense in the period in which they are determined. Our unrecognized tax benefits include exposures from transfer pricing allocation of income between jurisdictions. The Company does not expect a material change in its unrecognized tax benefits within the next 12 months.
Differences between income taxes computed by applying the statutory federal income tax rate to income before income taxes and the provision (benefit) for income taxes consist of the following (in thousands):
| Years Ended | Years Ended | |||||||||||||||||||||||
| December 27, 2008 | December 29, 2007 | December 30, 2006 | January 2, 2010 | December 27, 2008 | December 29, 2007 | |||||||||||||||||||
Income taxes computed at U.S. statutory rate | $ | (28,804 | ) | $ | (1,373 | ) | $ | (7,588 | ) | $ | (5,912 | ) | $ | (28,804 | ) | $ | (1,373 | ) | ||||||
State income taxes | 72 | 144 | 20 | 6 | 72 | 144 | ||||||||||||||||||
Foreign tax provision higher than U.S. rates | 4,647 | (33 | ) | 79 | 1,389 | 4,647 | (33 | ) | ||||||||||||||||
Change in valuation allowance | 4,683 | 798 | 7,195 | 4,237 | 4,683 | 798 | ||||||||||||||||||
Tax credits | (83 | ) | — | (199 | ) | (691 | ) | (83 | ) | — | ||||||||||||||
Goodwill Impairment | 18,294 | — | — | |||||||||||||||||||||
Goodwill impairment | — | 18,294 | — | |||||||||||||||||||||
Other, net | 1,627 | 433 | 170 | 385 | 1,627 | 433 | ||||||||||||||||||
Provision (benefit) for income taxes | $ | 436 | $ | (31 | ) | $ | (323 | ) | $ | (586 | ) | $ | 436 | $ | (31 | ) | ||||||||
NANOMETRICS INCORPORATED
NOTES TO CONSOLIDATED FINANCIAL STATEMENTS—(Continued)
Years Ended January 2, 2010, December 27, 2008 and December 29, 2007
The Company does not provide for federal income taxes on the undistributed earnings of its foreign subsidiaries as such earnings are to be reinvested indefinitely.
In June 2006, the Financial Accounting Standards Board (FASB) issued interpretation No. 48, “Accounting for Uncertainty in income taxes” (“FIN 48”). FIN 48 clarifies theThe accounting for uncertainty in income taxes recognized in an enterprise’s financial statements in accordance with Statement of Financial Accounting Standards No, 109, “Accounting for Income Taxes” (“FAS109”). This interpretation prescribes a recognition threshold and measurement attribute for the financial statement recognition and measurement of a tax position taken or expected to be taken in a tax return. FIN 48 also provides guidance on de-recognitionreturn, and the derecognition of tax benefits, classification on the balance sheet, interest and penalties, accounting in interim periods, disclosure, and transition. The Company adopted FIN 48 effective January 1, 2007.
81
NANOMETRICS INCORPORATED
NOTES TO CONSOLIDATED FINANCIAL STATEMENTS—(Continued)
Years Ended December 27, 2008, December 29, 2007 and December 30, 2006
A reconciliation of the beginning and ending amount of unrecognized tax benefits is as follows (in thousands):
Unrecognized tax benefits – as of December 31, 2006 | $ | 463 | ||
Settlements | (120 | ) | ||
Unrecognized tax benefits – as of December 29, 2007 | $ | 343 | ||
Foreign Currency Movements | — | |||
Gross Increases – tax positions in prior period | 835 | |||
Gross Decreases – tax positions in prior period | — | |||
Gross increases – current period tax positions | 296 | |||
Settlements | — | |||
Lapse of statute of limitations | (100 | ) | ||
Unrecognized tax benefit – as of December 27, 2008 | $ | 1,374 | ||
| As of | ||||||||||||
| January 2, 2010 | December 27, 2008 | December 29, 2007 | ||||||||||
Unrecognized tax benefits – beginning of the period | $ | 1,374 | $ | 343 | $ | 463 | ||||||
Gross increases – tax positions in prior period | 15 | 835 | — | |||||||||
Gross decreases – tax positions in prior period | (345 | ) | — | — | ||||||||
Gross increases – current-period tax positions | 81 | 296 | — | |||||||||
Settlements | — | — | (120 | ) | ||||||||
Lapse of statute of limitations | (93 | ) | (100 | ) | — | |||||||
Unrecognized tax benefits – end of the period | $ | 1,032 | $ | 1,374 | $ | 343 | ||||||
As ofThe unrecognized tax benefits at January 2, 2010, December 27, 2008 the total amount of net unrecognized tax benefit isand December 29, 2007 was 1.0 million, $1.4 million and $0.3 million, of which $0.7$0.6 million, if recognized would affect$0.8 million and $0.3 million, respectively, will impact the effective tax rate.rate if the company elected to recognize these tax benefits. The Company accrues interest and penalties related to unrecognized tax benefits in its provision for income taxes. The total amount of penalties and interest is not material as of January 2, 2010, December 27, 2008. Additionally the2008 and December 29, 2007. The Company does not expect a material change in its unrecognized tax benefits within the next 12 months.
The Company is subject to taxation in the US and various states and foreign jurisdictions. Due to tax attribute carry-forward, the Company is subject to examination for tax years 20032004 forward for U.S. tax purposes. The Company was also subject to examination in various state jurisdiction for tax years 1996 forward, none of which were individually material. The Company is subject to examination for tax years 20032004 forward for various foreign jurisdictions.
Note 18. Bonus Plans
| Note 19. | Bonus Plans |
The Company incurred $1.1 million, $1.1 million and $1.4 million in bonuses for 2009, 2008 and 2007, respectively, under a Company-wide formal discretionary cash bonus plan, which covers all eligible employees. There was no expense underwere comprised of executive management bonuses and employee bonuses based on the Company-wide formal discretionary cash bonus plan for 2006.Company’s financial performance.
Note 19. Major Customers
| Note 20. | Major Customers |
The following customers accounted for 10% or more of total revenue:
| Years Ended | Years Ended | |||||||||||||||||
| December 27, 2008 | December 29, 2007 | December 30, 2006 | January 2, 2010 | December 27, 2008 | December 29, 2007 | |||||||||||||
Samsung Electronics Co. Ltd. | 16.1 | % | 15.7 | % | 14.3 | % | 33.4 | % | 16.1 | % | 15.7 | % | ||||||
Intel Corporation | 10.4 | % | *** | *** | ||||||||||||||
Toshiba Semiconductor | 11.0 | % | *** | *** | *** | 11.0 | % | *** | ||||||||||
Hynix Semiconductor, Inc. | *** | 10.6 | % | 13.5 | % | *** | *** | 10.6 | % | |||||||||
Applied Materials, Inc. | *** | *** | 20.1 | % | ||||||||||||||
| *** | The customer accounted for less than 10% of revenue |
The following customers accounted for 10% or more of total accounts receivable:
| ||||||
| ||||||
NANOMETRICS INCORPORATED
NOTES TO CONSOLIDATED FINANCIAL STATEMENTS—(Continued)
Years Ended January 2, 2010, December 27, 2008 and December 29, 2007 and December 30, 2006
The following customers accounted for 10% or more of total accounts receivable:
| At | ||||||
| January 2, 2010 | December 27, 2008 | |||||
Samsung Electronics Co. Ltd. | 30.5 | % | *** | |||
Intel Corporation | 16.1 | % | *** | |||
Hynix Semiconductor, Inc. | 12.7 | % | 27.0 | % | ||
| *** | The customer accounted for less than 10% of accounts receivable during the period. |
| Note 21. | Product, Segment and Geographic Information |
Note 20. Product, Segment and Geographic Information
The Company has one operating segment, as defined in SFAS No. 131, “Disclosures about Segments of an Enterprise and Related Information”. The Company’s operating segmentwhich is the sale, design, manufacture, marketing and support of thin film, optical critical dimension and overlay dimension metrology systems. The Chief Executive Officer has been identified as the Chief Operating Decision Maker (“CODM”) because he has the final authority over resource allocation decisions and performance assessment. The CODM does not receive discrete financial information about individual components of the Company’s business. For the years ended January 2, 2010, December 27, 2008 and December 29, 2007, and December 30, 2006, the Company recorded revenue from customers primarily in the United States, Asia and Europe. The following table summarizes total net revenues and long-lived assets (excluding intangible assets) attributed to significant countries (in thousands):
| Years Ended | Years Ended | |||||||||||||||||
| December 27, 2008 | December 29, 2007 | December 30, 2006 | January 2, 2010 | December 27, 2008 | December 29, 2007 | |||||||||||||
Total net revenues: | ||||||||||||||||||
South Korea | $ | 29,992 | $ | 20,944 | $ | 20,116 | ||||||||||||
United States | $ | 30,102 | $ | 46,712 | $ | 33,691 | 22,755 | 30,102 | 46,712 | |||||||||
Japan | 28,572 | 40,610 | 16,810 | 11,293 | 28,572 | 40,610 | ||||||||||||
South Korea | 20,944 | 20,116 | 25,308 | |||||||||||||||
Europe | 3,868 | 5,315 | 14,563 | |||||||||||||||
Taiwan | 5,871 | 11,447 | 5,158 | 3,615 | 5,871 | 11,447 | ||||||||||||
China | 7,470 | 10,675 | 5,972 | 3,157 | 7,470 | 10,675 | ||||||||||||
Europe | 5,315 | 14,563 | 6,937 | |||||||||||||||
All other | 3,827 | 2,167 | 2,498 | 2,027 | 3,827 | 2,167 | ||||||||||||
Total net revenues* | $ | 102,101 | $ | 146,290 | $ | 96,374 | $ | 76,707 | $ | 102,101 | $ | 146,290 | ||||||
| * | Net revenues are attributed to countries based on the customer’s deployment and service locations of systems. |
| At | At | |||||||||||
| December 27, 2008 | December 29, 2007 | January 2, 2010 | December 27, 2008 | |||||||||
Long-lived tangible assets: | ||||||||||||
United States | $ | 35,322 | $ | 37,758 | $ | 34,252 | $ | 35,322 | ||||
Japan | 1,138 | 1,165 | 819 | 1,138 | ||||||||
South Korea | 3,853 | 5,599 | 1,148 | 3,853 | ||||||||
Taiwan | 102 | 143 | 66 | 102 | ||||||||
China | 17 | 10 | 12 | 17 | ||||||||
Europe | 1,152 | 1,545 | 1,450 | 1,152 | ||||||||
All Other | 270 | 4 | 177 | 270 | ||||||||
Total long-lived assets | $ | 41,854 | $ | 46,224 | $ | 37,924 | $ | 41,854 | ||||
NANOMETRICS INCORPORATED
NOTES TO CONSOLIDATED FINANCIAL STATEMENTS—(Continued)
Years Ended January 2, 2010, December 27, 2008 and December 29, 2007
The Company’s product lines differ primarily based on the environment in which the systems will be used. Automated systems are used primarily in high-volume production environments. Materials characterization products are primarily used to measure the composition, band gap, structure, and other physical and electrical properties of semiconducting materials for high brightness LED and solar/photovoltaic structures in both development and high volume environments. Integrated systems are installed inside wafer processing equipment to provide near real-time measurements for improving process control and increasing throughput. Revenues by product type were as follows (in thousands):
| Years Ended | Years Ended | |||||||||||||||||
| December 27, 2008 | December 29, 2007 | December 30, 2006 | January 2, 2010 | December 27, 2008 | December 29, 2007 | |||||||||||||
Automated Metrology | $ | 40,623 | $ | 68,165 | $ | 44,321 | ||||||||||||
Materials Characterization | 19,009 | 28,960 | 12,852 | |||||||||||||||
Automated Systems | $ | 46,386 | $ | 59,632 | $ | 97,125 | ||||||||||||
Integrated Systems | 15,964 | 28,924 | 23,463 | 2,767 | 15,964 | 28,924 | ||||||||||||
Total product revenues | $ | 75,596 | $ | 126,049 | $ | 80,636 | $ | 49,153 | $ | 75,596 | $ | 126,049 | ||||||
83
NANOMETRICS INCORPORATED
NOTES TO CONSOLIDATED FINANCIAL STATEMENTS—(Continued)
Years Ended December 27, 2008, December 29, 2007 and December 30, 2006
Note 21. Selected Quarterly Financial Results (Unaudited)
| Note 22. | Selected Quarterly Financial Results (Unaudited) |
The following table sets forth selected consolidated quarterly results of operations for the year ended January 2, 2010, December 27, 2008 and December 29, 2007 (in thousands, except per share amounts):
| Quarters Ended | Quarters Ended | ||||||||||||||||||||||||||||||
| Dec. 27, 2008 | Sept. 27, 2008 | June 28, 2008 | March 29, 2008 | Jan. 2, 2010 | Sept. 26, 2009 | June 27, 2009 | March 28, 2009 | ||||||||||||||||||||||||
Total net revenues | $ | 20,475 | $ | 23,137 | $ | 23,761 | $ | 34,728 | $ | 26,319 | $ | 25,814 | $ | 14,517 | $ | 10,057 | |||||||||||||||
Gross profit | 8,630 | 10,209 | 10,067 | 15,828 | 13,335 | 13,933 | 6,007 | 2,846 | |||||||||||||||||||||||
Income (loss) from operations | (3,452 | ) | (60,023 | ) | (19,044 | ) | (945 | ) | 665 | 1,489 | (6,475 | ) | (9,038 | ) | |||||||||||||||||
Net loss | (2,641 | ) | (60,447 | ) | (18,914 | ) | (724 | ) | |||||||||||||||||||||||
Net loss per share: | |||||||||||||||||||||||||||||||
Net income (loss) | (282 | ) | 1,571 | (6,965 | ) | (10,628 | ) | ||||||||||||||||||||||||
Net income (loss) per share: | |||||||||||||||||||||||||||||||
Basic | $ | (0.14 | ) | $ | (3.25 | ) | $ | (1.02 | ) | $ | (0.04 | ) | $ | (0.01 | ) | $ | 0.08 | $ | (0.38 | ) | $ | (0.58 | ) | ||||||||
Diluted | $ | (0.14 | ) | $ | (3.25 | ) | $ | (1.02 | ) | $ | (0.04 | ) | $ | (0.01 | ) | $ | 0.08 | $ | (0.38 | ) | $ | (0.58 | ) | ||||||||
Shares used in per share computations: | |||||||||||||||||||||||||||||||
Basic | 18,385 | 18,574 | 18,632 | 18,590 | 19,017 | 18,598 | 18,526 | 18,415 | |||||||||||||||||||||||
Diluted | 18,385 | 18,574 | 18,632 | 18,590 | 19,017 | 19,398 | 18,526 | 18,415 | |||||||||||||||||||||||
| Quarters Ended | Quarters Ended | ||||||||||||||||||||||||||||||
| Dec. 29, 2007 | Sept. 29, 2007 | June 30, 2007 | March 31, 2007 | Dec. 27, 2008 | Sept. 27, 2008 | June 28, 2008 | March 29, 2008 | ||||||||||||||||||||||||
Total net revenues | $ | 33,193 | $ | 38,647 | $ | 37,335 | $ | 37,115 | $ | 20,475 | $ | 23,137 | $ | 23,761 | $ | 34,728 | |||||||||||||||
Gross profit | 14,625 | 17,083 | 16,124 | 13,156 | 8,630 | 10,209 | 10,067 | 15,828 | |||||||||||||||||||||||
Income (loss) from operations | (1,342 | ) | 1,723 | 292 | (4,690 | ) | |||||||||||||||||||||||||
Net income (loss) | (1,275 | ) | 2,008 | (130 | ) | (4,611 | ) | ||||||||||||||||||||||||
Net income (loss) per share: | |||||||||||||||||||||||||||||||
Loss from operations | (3,452 | ) | (60,023 | ) | (19,044 | ) | (945 | ) | |||||||||||||||||||||||
Net loss | (2,641 | ) | (60,447 | ) | (18,914 | ) | (724 | ) | |||||||||||||||||||||||
Net loss per share: | |||||||||||||||||||||||||||||||
Basic | $ | (0.07 | ) | $ | 0.11 | $ | (0.01 | ) | $ | (0.26 | ) | $ | (0.14 | ) | $ | (3.25 | ) | $ | (1.02 | ) | $ | (0.04 | ) | ||||||||
Diluted | $ | (0.07 | ) | $ | 0.11 | $ | (0.01 | ) | $ | (0.26 | ) | $ | (0.14 | ) | $ | (3.25 | ) | $ | (1.02 | ) | $ | (0.04 | ) | ||||||||
Shares used in per share computations: | |||||||||||||||||||||||||||||||
Basic | 18,604 | 18,278 | 17,857 | 17,658 | 18,385 | 18,574 | 18,632 | 18,590 | |||||||||||||||||||||||
Diluted | 18,604 | 18,676 | 17,857 | 17,658 | 18,385 | 18,574 | 18,632 | 18,590 | |||||||||||||||||||||||
NANOMETRICS INCORPORATED
NOTES TO CONSOLIDATED FINANCIAL STATEMENTS—(Continued)
Years Ended January 2, 2010, December 27, 2008 and December 29, 2007
| Quarters Ended | |||||||||||||||
| Dec. 29, 2007 | Sept 29, 2007 | June 30, 2007 | March 31, 2007 | ||||||||||||
Total net revenues | $ | 33,193 | $ | 38,647 | $ | 37,335 | $ | 37,115 | |||||||
Gross profit | 14,625 | 17,083 | 16,124 | 13,156 | |||||||||||
Income (loss) from operations | (1,342 | ) | 1,723 | 292 | (4,690 | ) | |||||||||
Net income (loss) | (1,275 | ) | 2,008 | (130 | ) | (4,611 | ) | ||||||||
Net income (loss) per share: | |||||||||||||||
Basic | $ | (0.07 | ) | $ | 0.11 | $ | (0.01 | ) | $ | (0.26 | ) | ||||
Diluted | $ | (0.07 | ) | $ | 0.11 | $ | (0.01 | ) | $ | (0.26 | ) | ||||
Shares used in per share computations: | |||||||||||||||
Basic | 18,604 | 18,278 | 17,857 | 17,658 | |||||||||||
Diluted | 18,604 | 18,676 | 17,857 | 17,658 | |||||||||||
* * * * *
| ITEM 9. | CHANGES IN AND DISAGREEMENTS WITH ACCOUNTANTS ON ACCOUNTING AND FINANCIAL DISCLOSURE |
None.
| ITEM 9A. | CONTROLS AND PROCEDURES |
Attached as exhibits to this Annual Report are certifications of the CEO and the CFO, which are required in accordance with Rule 13a-14 of the Securities Exchange Act of 1934, as amended (Exchange Act). This Controls and Procedures section includes the information concerning the controls evaluation referred to in the certifications and it should be read in conjunction with the certifications for a more complete understanding of the topics presented.
Evaluation of Disclosure Controls and Procedures
We maintain disclosure controls and procedures that are designed to ensure that information required to be disclosed in our reports under the Exchange Act is recorded, processed, summarized and reported within the time periods specified in the SEC’s rules and forms, and that such information is accumulated and communicated to management, including our Chief Executive Officer and Chief Financial Officer, as appropriate, to allow timely decisions regarding required disclosure. Our management, with participation of our Chief Executive Officer and Chief Financial Officer, has evaluated the effectiveness of the Company’s disclosure controls and procedures as of the end of the fiscal year covered by this Annual Report on Form 10-K.
As described below under “Report of Management on Internal Control over Financial Reporting,” we identified a material weakness in the internal control over financial reporting in the fiscal year ended December 29, 2007. Since discovery of the material weakness, we performed extensive additional work and implemented several procedures to obtain reasonable assurance regarding the reliability ofReporting”, based upon that evaluation, our financial statements. Based on our testing of these enhanced procedures, in the quarter ended December 27, 2008, management determined that as of December 27, 2008, we have remediated the material weakness in internal controls over financial reporting and the controls are now operating effectively.
Our Chief Executive Officer and Chief Financial Officer have concluded that, as of the end of the period covered byin this Annual Report on Form 10-K, the Company’sreport, our disclosure controls and procedures (as definedwere effective to ensure that information required to be disclosed by us in Rules 13a-15(e) and 15d-15(e)reports that we file or submit under the Exchange Act) were effective.
85
Act is recorded, processed, summarized, and reported within the time periods specified in Securities and Exchange Commission rules and forms and is accumulated and communicated to our management, including our principal executive officer and principal financial officer, as appropriate, to allow timely decisions regarding required disclosure.
Report of Management on Internal Control over Financial Reporting
Our management is responsible for establishing and maintaining adequate internal control over financial reporting as defined in Rules 13a-15(f) and 15d-15(f) under the Exchange Act. Our internal control over financial reporting was designed to provide reasonable, not absolute, assurance regarding the integrity, reliability and fair presentation of our financial reporting and the preparation of financial statements for external purposes in accordance with generally accepted accounting principles.
Internal control over financial reporting includes those policies and procedures that (i) pertain to the maintenance of records that in reasonable detail accurately and fairly reflect the transactions and dispositions of the assets of the Company; (ii) provide reasonable assurance that transactions are recorded as necessary to permit preparation of financial statements in accordance with generally accepted accounting principles, and that receipts and expenditures of the Company are being made only in accordance with authorizations of management and directors of the Company; and (iii) provide reasonable assurance regarding prevention or timely detection of unauthorized acquisition, use or disposition of the Company’s assets that could have a material effect on the financial statements.
A control system, no matter how well designed and operated, can provide only reasonable, not absolute, assurance that the control system’s objectives will be met. Further, the design of a control system must reflect the fact that there are resource constraints. Because of the inherent limitations in all control systems, no evaluation of controls can provide absolute assurance that all control issues and instances of fraud, if any, within our company have been detected. Under the supervision and with the participation of our management, including our Chief Executive Officer and Chief Financial Officer, we assessed the effectiveness of our internal control over financial reporting as of December 27, 2008.January 2, 2010. In making this assessment, we used the criteria established in the framework on Internal Control – Integrated Framework issued by the Committee of Sponsoring Organizations (“COSO”) of the Treadway Commission.
Based on our assessment, which was conducted according to the COSO criteria, we have concluded that our internal control over financial reporting was effective in achieving its objectives as of December 27, 2008.January 2, 2010.
Our assessment of the effectiveness of our internal control over financial reporting as of December 27, 2008,January 2, 2010, has not been audited by BDO Seidman LLP, our independent registered public accounting firm, as the Company is a non-accelerated filer as of December 27, 2008,January 2, 2010, as determined by the Company’s public float at the end of second quarter 2008,2009, and hence our independent registered accounting firm is not required to opine on our internal controls over financial reporting as of the end of our fiscal year 2008.2009.
Changes in Internal Control over Financial Reporting
The material weakness that existedNo change in our internal controls relating to international income tax accounting as of December 29, 2007 resulted in changes in the Company’s internal control over financial reporting (as defined in Rules 13a-15(f) and 15d-15(f) under the Exchange Act) occurred during the year ended December 27, 2008.
During the year ended December 27, 2008, we took the following steps to remediate the material weakness described above:
Completion of global transfer pricing study,
Increased oversight and monitoring of accounting procedures and review of our international tax accounting and,
Rationalization and simplification of the tax structures of our foreign entities.
Based on our testing of these enhanced procedures, in thefourth quarter ended December 27, 2008, management determinedJanuary 2, 2010, that as of December 27, 2008, we have remediated the material weakness inhas materially affected, or is reasonably likely to materially affect, our internal control over financial reporting and the controls are now operating effectively.reporting.
| ITEM 9B. | OTHER INFORMATION |
None.
| ITEM 10. | DIRECTORS, EXECUTIVE OFFICERS AND CORPORATE GOVERNANCE |
The information required by this Item concerning our directors, compliance with Section 16 of the Securities and Exchange Act of 1934, our code of ethics that applies to our principal executive officer, principal financial officer and principal accounting officer and our Audit Committee is incorporated by reference to the information set forth in the sections entitled “Proposal One—Election of Directors,” “Section 16(a) Beneficial Ownership Reporting Compliance” and “Corporate Governance” in our Proxy Statement for our 20092010 Annual Meeting of Stockholders to be filed with the Securities and Exchange Commission not later than 120 days after the end of our fiscal year (the “Proxy Statement”). Information regarding the Registrant’s executive officers is set forth at the end of Part I of this Annual Report on Form 10-K under the caption “Executive Officers of the Registrant.”
| ITEM 11. | EXECUTIVE COMPENSATION |
Information required by this Item is incorporated by reference to the information set forth under the caption “Executive Compensation” in the Proxy Statement.
| ITEM 12. | SECURITY OWNERSHIP OF CERTAIN BENEFICIAL OWNERS AND MANAGEMENT AND RELATED STOCKHOLDER MATTERS |
Information required by this Item is incorporated by reference to the information set forth under the sections entitled “Security Ownership of Beneficial Owners and Management” and “Equity Compensation Plan Information” in the Proxy Statement.
| ITEM 13. | CERTAIN RELATIONSHIPS AND RELATED TRANSACTIONS AND DIRECTOR INDEPENDENCE |
Information required by this Item is incorporated by reference to the information set forth under the caption “Certain Relationships and Related Transactions” and “Corporate Governance” in the Proxy Statement.
| ITEM 14. | PRINCIPAL ACCOUNTING FEES AND SERVICES |
The information required by this Item is incorporated by reference to the section entitled “Ratification of Appointment of Independent Registered Public Accounting Firm—Accounting Fees” in the Proxy Statement.
87
| ITEM 15. | EXHIBITS AND FINANCIAL STATEMENT SCHEDULE |
Consolidated Financial Statements.
See Index to Consolidated Financial Statements at Item 8 on page 4938 of this Annual Report on Form 10-K.
Consolidated Financial Statement Schedule.
The following consolidated financial statement schedule of Nanometrics Incorporated is filed as part of this Annual Report on Form 10-K and should be read in conjunction with the Consolidated Financial Statements:
Schedule | Page | |
Schedules not listed above have been omitted because they are not applicable or are not required or the information required to be set forth therein is included in the Consolidated Financial Statements or notes thereto.
Exhibits.
The following exhibits are filed or incorporated by reference withSee Exhibit Index beginning on page 80 of this Annual Report on Form 10-K:
|
| |
|
| |
89
Pursuant to the requirements of Section 13 or 15(d) of the Securities Exchange Act of 1934, the registrant has duly caused this report to be signed on its behalf by the undersigned, thereunto duly authorized.
Dated: March 27, 200926, 2010
| NANOMETRICS INCORPORATED | ||
By: | /S/ TIMOTHY J. STULTZ | |
Timothy J. Stultz President and Chief Executive Officer (Duly Authorized Officer and Principal Executive Officer) | ||
POWER OF ATTORNEY
KNOW ALL PERSONS BY THESE PRESENTS, that each person whose signature appears below constitutes and appoints Timothy J. Stultz and James P. Moniz jointly and severally, his attorneys-in-fact, each with the power of substitution, for him in any and all capacities, to sign any and all amendments to this Report on Form 10-K, and to file the same, with exhibits thereto and other documents in connection therewith, with the Securities and Exchange Commission, hereby ratifying and confirming all that said attorneys-in-fact, or his substitute or substitutes, may do or cause to be done by virtue hereof.
Pursuant to the requirements of the Securities Exchange Act of 1934, this Report on Form 10-K has been signed below by the following persons in the capacities and on the dates indicated.
Signature | Title | Date | ||
/S/ TIMOTHY J. STULTZ Timothy J. Stultz | President, Chief Executive Officer and Director (Principal Executive Officer) | March | ||
/S/ JAMES P. MONIZ James P. Moniz | Chief Financial Officer (Principal Financial Officer and Principal Accounting Officer) | March | ||
/S/ BRUCE C. RHINE Bruce C. Rhine | Chairman of the Board of Directors | March | ||
|
|
| ||
|
|
| ||
/S/ HOWARD A. BAIN III Howard A. Bain III | Director | March | ||
|
|
| ||
/S/ J. THOMAS BENTLEY J. Thomas Bentley | Director | March 26, 2010 | ||
Norman Coates | Director | March | ||
/S/ WILLIAM G. OLDHAM William G. Oldham | Director | March 26, 2010 | ||
/S/ STEPHEN J. SMITH Stephen J. Smith | Director | March 26, 2010 | ||
EXHIBIT INDEX
Exhibit No. |
| |
3.(i) | Certificate of Incorporation | |
3.1(1) | Certificate of Incorporation of the Registrant | |
3.(ii) | Bylaws | |
3.2(1) | Bylaws of the Registrant | |
4 | Instruments Defining the Rights of Security Holders, Including Indentures | |
4.1(2) | Form of Common Stock Certificate | |
10 | Material Contracts | |
| Management Contracts, Compensatory Plans, Contracts or Arrangements | ||
10.1(3) | Form of Indemnification Agreement between the Registrant and each of its directors and executive officers | |
10.2(4) | Registrant’s 1991 Stock Option Plan, as amended effective May 15, 1997, and form of Stock Option Agreement | |
10.3(5) | Registrant’s 2000 Employee Stock Option Plan and form of Stock Option Agreement | |
10.4(6) | Registrant’s 2000 Director Stock Option Plan and form of Stock Option Agreement | |
10.5(7) | Registrant’s 2002 Non-statutory Stock Option Plan and form of Stock Option Agreement | |
10.6(8) | Registrant’s Amended and Restated 2003 Employee Stock Purchase Plan | |
10.7(9) | Registrant’s Amended and Restated 2003 Employee Stock Purchase Plan form of Subscription Agreement | |
10.8(8) | Registrant’s Amended and Restated 2005 Equity Incentive Plan | |
10.9(6) | Registrant’s Amended and Restated 2005 Equity Incentive Plan forms of Stock Option and Restricted Stock Unit Agreements | |
10.10(10) | Form of Offer Letter to Timothy J. Stultz | |
10.11(10) | Form of Executive Severance Agreement between the Registrant and Timothy J. Stultz | |
10.12(10) | Form of Relocation Agreement between the Registrant and Timothy J. Stultz | |
10.13(11) | Form of Executive Severance Agreement between the Registrant and Bruce A. Crawford | |
10.14(12) | Form of Offer Letter to James P. Moniz | |
10.15(12) | Form of Executive Severance Agreement between the Registrant and James P. Moniz | |
Exhibit No. | Description | |
| All Other Material Contracts | ||
10.16(7) | Loan and Security Agreement effective as of February 14, 2007 by and between Comerica Bank, the Registrant, Accent Optical Technologies, Nanometrics, Inc. and Nanometrics IVS Division, Inc. | |
10.17(12) | Notice of Extension of the Maturity Date of the Loan and Security Agreement, dated as of February 14, 2009 | |
10.18(13) | First Amendment to the Loan and Security Agreement dated September 14, 2007 | |
10.19(13) | Second Amendment to the Loan and Security Agreement dated May 11, 2009, with an effective date of April 29, 2009 | |
10.20(14) | Third Amendment to the Loan and Security Agreement dated June 15, 2009 | |
10.21(15) | Security Agreement, Balloon Promissory Note, and Deed of Trust by and between GE Commercial Finance Business Property Corporation and the Registrant, each dated July 25, 2008 | |
10.22(14) | Asset Transfer Agreement by and between Zygo Corporation and the Registrant, dated June 17, 2009 | |
10.23(14) | Supply Agreement by and between Zygo Corporation and the Registrant dated June 17, 2009 | |
10.24 | 2010 Executive Performance Bonus Plan | |
10.25 | Amended and Restated Executive Severance Agreement between the Registrant and Timothy J. Stultz, Ph.D., dated February 23, 2010 | |
10.26 | Amended and Restated Executive Severance Agreement between the Registrant and Bruce Crawford, dated February 23, 2010 | |
10.27 | Amended and Restated Employment Agreement between the Registrant and James P. Moniz, dated February 23, 2010 | |
14 | Code of Ethics | |
14.1(16) | Registrant’s Code of Business Conduct and Ethics | |
21.1 | Subsidiaries | |
21.1 | Subsidiaries of the Registrant | |
23 | Consents of Experts and Counsel | |
23.1 | Consent of BDO Seidman, LLP, Independent Registered Public Accounting Firm | |
31 | Rule 13a-14(a)/15d-14(a) Certifications | |
31.1(17) | Certification of Timothy J. Stultz, principal executive officer of the Registrant, pursuant to Section 302 of the Sarbanes-Oxley Act of 2002 | |
31.2(17) | Certification of James P. Moniz, principal financial officer and principal accounting officer of the Registrant, pursuant to Section 302 of the Sarbanes-Oxley Act of 2002 | |
32 | Section 1350 Certifications | |
32.1(18) | Certification of Timothy J. Stultz, principal executive officer of the Registrant, and James P. Moniz, principal financial officer and principal accounting officer of the Registrant pursuant to Section 906 of the Sarbanes-Oxley Act of 2002 | |
91
| (1) | Incorporated by reference to exhibits filed with the Registrant’s Current Report on Form 8-K filed October 5, 2006. |
| (2) | Incorporated by reference to Exhibit 4.1 filed with the Registrant’s Quarterly Report on Form 10-Q filed November 9, 2006. |
| (3) | Incorporated by reference to Exhibit 10.1 filed with the Registrant’s Annual Report on Form 10-K filed March 15, 2007. |
| (4) | Incorporated by reference to Exhibit 4.1 filed with the Registrant’s Registration Statement on Form S-8 (File No. 333-33583) filed on August 14, 1997. |
| (5) | Incorporated by reference to Exhibit 4.2 filed with the Registrant’s Registration Statement on Form S-8 (File No. 333-40866) filed on July 6, 2000. |
| (6) | Incorporated by reference to exhibits filed with the Registrant’s Annual Report on Form 10-K filed March 13, 2008. |
| (7) | Incorporated by reference to exhibits filed with the Registrant’s Quarterly Report on Form 10-Q filed May 10, 2007. |
| (8) | Incorporated by reference to the appendices filed with the Registrant’s definitive proxy statement on Schedule 14A filed April 21, 2009. |
| (9) | Incorporated by reference to Exhibit 4.1 filed with the Registrant’s Registration Statement on Form S-8 (File No.333-108474) filed on September 3, 2003. |
| (10) | Incorporated by reference to exhibits filed with the Registrant’s Current Report on Form 8-K filed August 8, 2007. |
| (11) | Incorporated by reference to Exhibit 10.1 filed with the Registrant’s Quarterly Report on Form 10-Q filed November 8, 2007. |
| (12) | Incorporated by reference to exhibits filed with the Registrant’s Annual Report on Form 10-K filed on March 27, 2009. |
| (13) | Incorporated by reference to exhibits filed with the Registrant’s Quarterly Report on Form 10-Q filed May 12, 2009. |
| (14) | Incorporated by reference to exhibits filed with the Registrant’s Quarterly Report on Form 10-Q filed August 11, 2009. |
| (15) | Incorporated by reference to Exhibit 10.2 filed with the Registrant’s Quarterly Report on Form 10-Q filed November 6, 2008. |
| (16) | Incorporated by reference to Exhibit 14 filed with the Registrant’s Annual Report on Form 10-K filed April 1, 2004. |
| (17) | Filed herewith. |
| (18) | Furnished herewith. |
SCHEDULE I
NANOMETRICS INCORPORATED
VALUATION AND QUALIFYING ACCOUNTS
Allowance for Doubtful Accounts Receivable
Our allowance for doubtful accounts receivable consists of the following (in thousands):
Year Ended | Balance at beginning of period | Balance assumed through acquisitions | Charged to costs and expenses | Deductions – write-offs of accounts | Balance at end of period | Balance at beginning of period | Charged to costs and expenses | Deductions – write-offs of accounts | Balance at end of period | |||||||||||||||||
January 2, 2010 | $ | 309 | $ | 381 | $ | 449 | $ | 241 | ||||||||||||||||||
December 27, 2008 | $ | 323 | — | — | $ | 14 | $ | 309 | $ | 323 | — | $ | 14 | $ | 309 | |||||||||||
December 29, 2007 | $ | 841 | — | — | $ | 518 | $ | 323 | $ | 841 | — | $ | 518 | $ | 323 | |||||||||||
December 30, 2006 | $ | 592 | $ | 355 | — | $ | 106 | $ | 841 | |||||||||||||||||
9282