UNITED STATES
SECURITIES AND EXCHANGE COMMISSION
Washington, D.C. 20549
Form 10-K
(Mark One)
ANNUAL REPORT PURSUANT TO SECTION 13 OR 15(d) OF THE SECURITIES EXCHANGE ACT OF 1934 |
For the fiscal year ended May 31, 20092012
or
| ¨ | TRANSITION REPORT PURSUANT TO SECTION 13 OR 15(d) OF THE SECURITIES EXCHANGE ACT OF 1934 |
For the transition period from to
Commission File Number 1-8399
WORTHINGTON INDUSTRIES, INC.
(Exact Name of Registrant as Specified in its Charter)
Ohio | 31-1189815 | |
| (State or Other Jurisdiction of Incorporation or Organization) | (I.R.S. Employer Identification No.) | |
200 Old Wilson Bridge Road, Columbus, Ohio | 43085 | |
| (Address of Principal Executive Offices) | (Zip Code) | |
Registrant’s telephone number, including area code: | (614) 438-3210 | |
Securities registered pursuant to Section 12(b) of the Act:
Title of Each Class | Name of Each Exchange on Which Registered | |
Common Shares, Without Par Value |
New York Stock Exchange |
Securities registered pursuant to Section 12(g) of the Act: None
Indicate by check mark if the | Yes |
Indicate by check mark if the registrant
Indicate by check mark if the Registrant is not required to file reports pursuant to Section 13 or Section 15(d) of the Act.
Indicate by check mark whether the Indicate by check mark whether the Indicate by check mark if disclosure of delinquent filers pursuant to Item 405 of Regulation S-K (§229.405 of this chapter) is not contained herein, and will not be contained, to the best of Indicate by check mark whether the Large accelerated filer Indicate by check mark whether the The aggregate market value of the Common Shares (the only common Indicate the number of shares outstanding of each of the DOCUMENT INCORPORATED BY REFERENCE: Selected portions of the Registrant’s definitive Proxy Statement to be furnished to shareholders of the Registrant in connection with the Annual Meeting of Shareholders to be held on September
i Selected statements contained in this Annual Report on Form 10-K, including, without limitation, in “PART I – Item 1. – Business” and “PART II – Item 7. – Management’s Discussion and Analysis of Financial Condition and Results of Operations,” constitute “forward-looking statements” as that term is used in the Private Securities Litigation Reform Act of 1995 (the “Act”). Forward-looking statements reflect our current expectations, estimates or projections concerning future results or events. These statements are often identified by the use of forward-looking words or phrases such as “believe,” “expect,” “anticipate,” “may,” “could,” “intend,” “estimate,” “plan,” “foresee,” “likely,” “will,” “should” or other similar words or phrases. These forward-looking statements include, without limitation, statements relating to:
Because they are based on beliefs, estimates and assumptions, forward-looking statements are inherently subject to risks and uncertainties that could cause actual results to differ materially from those projected. Any number of factors could affect actual results, including, without limitation, those that follow:
ii
We note these factors for investors as contemplated by the Act. It is impossible to predict or identify all potential risk factors. Consequently, you should not consider the foregoing list to be a complete set of all potential risks and uncertainties. Any forward-looking statements in this Annual Report on Form 10-K are based on current information as of the date of this Annual Report on Form 10-K, and we assume no obligation to correct or update any such statements in the future, except as required by applicable law.
iii PART I General Overview Worthington Industries, Inc. is a corporation formed under the laws of the State of Ohio (individually, the “Registrant” or “Worthington Industries” or, collectively with the subsidiaries of Worthington Industries, Inc., “we,” “our,” Worthington is headquartered at 200 Old Wilson Bridge Road, Columbus, Ohio 43085, telephone (614) 438-3210. The common shares of Worthington Industries are traded on the New York Stock Exchange under the symbol WOR. Worthington Industries maintains an Internet web site at www.worthingtonindustries.com. This uniform resource locator, or URL, is an inactive textual reference only and is not intended to incorporate Worthington Industries’ web site into this Annual Report on Form 10-K. Annual Reports on Form 10-K, Quarterly Reports on Form 10-Q, Current Reports on Form 8-K and amendments to those reports, filed or furnished pursuant to Section 13(a) or 15(d) of the Securities Exchange Act of 1934, as amended (the “Exchange Act”), as well as Worthington Industries’ definitive annual meeting proxy materials filed pursuant to Section 14 of the Exchange Act, are available free of charge, on or through the Worthington Industries web site, as soon as reasonably practicable after such material is electronically filed with, or furnished to, the Securities and Exchange Commission (the “SEC”).
At the end of the fiscal year ended May 31,
the joint venture. As of August 31, 2011, all of the retained facilities had ceased operations. Accordingly, the financial results and operating performance of the retained facilities have been reported within Metal Framing through August 31, 2011. The contributed net assets, which were deconsolidated effective March 1, 2011, have been reported within Metal Framing on a historical basis. All other operating segments are combined and disclosed in the Other category, which also includes income and expense items not allocated to our reportable business segments. The Other category includes the Worthington Steelpac Systems, LLC (“Steel Packaging”) and Worthington Global Group, LLC (the “Global Group”) operating segments as well as the former Automotive Body Panels operating segment, on a historical basis, through May 9, 2011. On May 9, 2011, we closed an agreement to combine certain assets of The Gerstenslager Company (“Gerstenslager”) and International Tooling Solutions, LLC in a new joint venture, ArtiFlex Manufacturing, LLC (“ArtiFlex”). In exchange for the contributed net assets, we received a 50% noncontrolling ownership interest in the new joint venture in addition to certain cash and other consideration. We hold equity positions in 12 joint ventures, which are further discussed in theJoint Ventures section herein. The PSI Energy Solutions, LLC, Spartan, and WNCL joint ventures are consolidated with their operating results reported within the Other, Steel Processing and Pressure Cylinders reportable business segments, respectively. During fiscal 2012, the Steel Processing, Pressure Cylinders and Engineered Cabs operating segments served approximately 1,100, 4,100 and 100 customers, respectively, located primarily in the United States. Foreign operations accounted for approximately 8% of consolidated net sales during fiscal 2012 and were comprised primarily of sales to customers in Europe. No single customer accounted for over 10% of consolidated net sales during fiscal 2012. Refer to “Item 8. – Financial Statements and Supplementary Data – Notes to Consolidated Financial Statements – Note M – Segment Data” of this Annual Report on Form Recent Developments On March 22, 2012, we acquired a 75% ownership interest in PSI Energy Solutions, LLC (“PSI”). PSI is On January 10, 2012, we announced a voluntary recall of our MAP-PRO®, propylene and MAAP® cylinders and related hand torch kits. The recall was a precautionary step and involved a valve supplied by On December 29, 2011, we acquired the outstanding economic interests of Angus Industries, Inc. (“Angus”). Angus designs and manufactures high-quality, custom-engineered open and closed cabs and operator stations for a wide range of heavy mobile equipment. In connection with this acquisition, we established a new operating segment, Engineered Cabs, which is comprised of the operations of Angus and is considered a separate reportable segment. On December 1, 2011, we acquired the propane fuel cylinders business of The Coleman Company, Inc. (“Coleman Cylinders”). The acquired net assets became part of our Pressure Cylinders operating segment upon closing of the transaction. Subsequent to closing, we received a request from the Federal Trade Commission, asking us to provide, on a voluntary basis, certain information related to the acquisition and the industry as it conducts a preliminary investigation into the transaction. The acquisition fell below the threshold for pre-merger notification under the Hart-Scott-Rodino Act. On September 30, 2011, we completed the acquisition of Poland-based STAKO sp.Z o.o. (“STAKO”). STAKO manufactures liquefied natural gas, propane and butane fuel tanks for use in passenger cars, buses and trucks. The acquired business became part of our Pressure Cylinders operating segment upon closing of this transaction. On July 1, 2011, we purchased substantially all of the net assets (excluding accounts receivable) of the BernzOmatic business (“Bernz”) of Irwin Industrial Tool Company, a subsidiary of Newell Rubbermaid, Inc. Bernz is a leading manufacturer of hand held torches and accessories. The acquired net assets became part of our Pressure Cylinders operating segment upon closing of the transaction. Transformation Plan In our fiscal year ended May 31, 2008 (“fiscal 2008”), we initiated a We completed the transformation phases in each of the core facilities within our Steel Processing operating segment in fiscal 2011, and
As of May 31,
Steel Processing
Worthington Steel is one of
Worthington Steel buys coils of steel from integrated steel mills and mini-mills and processes them to the precise type, thickness, length, width, shape
pickling, a chemical process using an acidic solution to remove surface oxide which develops on hot-rolled steel;
slitting, which cuts steel to specific widths;
cold reducing, which achieves close tolerances of hot-dipped galvanizing, which coats steel with zinc and zinc alloys through a
hydrogen annealing, a thermal process that changes the hardness and certain metallurgical characteristics of steel;
cutting-to-length, which cuts flattened steel to exact lengths;
tension leveling, a method of applying pressure to achieve precise flatness tolerances for steel;
edging, which conditions the edges of the steel by imparting round, smooth or knurled edges;
non-metallic coating, including dry lubrication, acrylic and
configured blanking, which stamps steel into specific shapes. Worthington Steel also toll processes steel for steel mills, large end-users, service centers and other processors. Toll processing is different from typical steel processing in that the mill, end-user or other party retains title to the steel and has the responsibility for selling the end product. Toll processing enhances Worthington Steel’s participation in the market for wide sheet steel and large standard orders, which is a market generally served by steel mills rather than by intermediate steel processors. The steel processing industry is fragmented and highly competitive. There are many competitors, including other independent intermediate processors. Competition is primarily on the basis of price, product quality and the ability to meet delivery requirements. Technical service and support for material testing and customer-specific applications enhance the quality of products (See “Item 1. – Business – Technical Services”). However, the extent to which technical service capability has improved Worthington Steel’s competitive position has not been quantified. Worthington Steel’s ability to meet tight delivery schedules is, in part, based on the proximity of our facilities to customers, suppliers and one another. The extent to which plant location has impacted Worthington Steel’s competitive position has not been quantified. Processed steel products are priced competitively, primarily based on market factors, including, among other things,
Our Pressure Cylinders operating segment manufactures and
Alternative fuels: The sector includes Type I, II, and
Industrial and
While a large percentage of
In the United States and Canada, high-pressure and low-pressure cylinders are primarily manufactured in accordance with In the United States and Canada, Worthington Cylinders has one principal domestic competitor in the low-pressure non-refillable refrigerant market, one principal domestic competitor in the low-pressure LPG cylinder market and The Pressure Cylinders In connection with the acquisition of the propane fuel cylinders business of The Coleman Company, Inc. (“Coleman Cylinders”), we executed a trademark license agreement whereby we are required to make minimum annual royalty payments of $2,000,000 in exchange for the exclusive right to use certain Coleman trademarks within the United States and Canada in connection with our operation of the acquired business. As noted Engineered Cabs The Engineered Cabs operating segment consists of the Angus Industries business unit, which was acquired on December 29, 2011, and includes the Angus-Palm, Angus Engineering and ACT® brands. Angus is headquartered in Watertown, South Dakota and has additional operations in Iowa, South Carolina and Tennessee. In fiscal 2012, approximately 4% of consolidated net sales were generated by our Engineered Cabs operating segment. On an annualized basis, Engineered Cabs would have represented approximately 10% of net sales. Angus is North America’s leading non-captive designer and manufacturer of high-quality, custom-engineered operator cabs, operator stations and custom fabrications of mobile equipment used primarily in the agricultural, construction, mining and various other industries. Angus cabs are used in products ranging from small utility equipment to the largest earthmovers. Angus produces products for over 150 different equipment platforms for approximately 100 customers, although six customers have historically represented approximately 75% of this operating segment’s net sales. In addition to its cab products, Angus has the capability to provide a full suite of complementary products such as machine structural components, painted weldments, engine doors, boom components and complete frames, as well as a complete range of vacuum-formed plastic/acoustical trim components and assemblies under the ACT brand. Angus has the manufacturing capability for: Steel laser cutting; Steel bending and forming; Roll-form tube curving and bending; Machining; Welding – robotic and manual; Automated steel product cleaning and E-coating; Top coat painting; and Assembly. Key supplies include steel sheet and plate, steel tubing, hardware, controls, wiper systems, glazing materials (glass, polycarbonate), perishables (paint, urethane, caulk), electrical materials, HVAC systems and aesthetic materials (acoustical trim, plastics, foam) which are available from a variety of sources. Other The
Steel Packaging. The Steel Packaging operating segment consists of
Global Group. The purpose of the Global Group operating segment is to identify and develop potential growth platforms by applying our core competencies in metals manufacturing and construction methods. The Global Group operates a business platform that includes high density mid-rise residential construction in emerging and developed international markets and includes the Mid-Rise Construction, Military Construction and Commercial Stairs business units as well as the recently-formed Global Development Group and Worthington Energy Group business units. The Worthington Energy Group business unit includes our recently-acquired and 75%-owned joint venture, PSI, a services firm that develops cost-effective energy solutions for public and private entities throughout North America. Other operating activities of the Global Group include the design, supply and building/construction of mid-rise light gauge steel framed commercial structures and multi-family housing units; and the supply and construction of metal framing products for, and used in the framing of, single and multi-family housing, with a focus on domestic military bases. During the fourth quarter of fiscal 2012, we formalized plans to close the Commercial Stairs business unit. Segment Financial Data Financial information for the reportable business segments is provided in “Item 8. – Financial Statements and Supplementary Data – Notes to Consolidated Financial Statements – Note Financial Information About Geographic Areas
Suppliers The primary raw material purchased by Worthington is steel. We purchase steel from major primary producers of steel, both domestic and foreign. The amount purchased from any particular supplier varies from Technical Services
Seasonality and Backlog Sales are generally strongest in the fourth quarter of our fiscal year as our operating segments are generally operating at seasonal peaks. Historically, sales have generally been weaker in the third quarter of We do not believe backlog is a significant indicator of our business. Employees As of May 31, Joint Ventures As part of Consolidated
PSI is a 75%-owned consolidated joint venture with a subsidiary of Professional Supply, Inc. (20%) and Stonehenge Structured Finance Partners, LLC (5%) (together referred to as “PSI Partners”), located in Fremont, Ohio. PSI is a professional services company that develops cost-effective energy solutions for entities in North America. PSI designs solutions to minimize energy consumption, manages the energy solution installation, monitors and verifies energy usage, guarantees future energy savings and shares in these savings. Additionally, PSI utilizes certain patented products to further enhance energy savings. PSI’s financial results are reported within the Other category for reporting purposes. The equity owned by the PSI Partners is shown as non-controlling interest on our consolidated balance sheets and the PSI Partners’ portion of net earnings is included as net earnings attributable to non-controlling interest in our consolidated statements of earnings. Spartan is a 52%-owned consolidated joint venture with a subsidiary of Severstal North America, Inc. (“Severstal”), located in Monroe, Michigan. It operates a cold-rolled, hot-dipped galvanizing line for toll processing steel coils into galvanized and galvannealed products intended primarily for the automotive industry. WNCL is a 60%-owned consolidated joint venture with India-based Nitin Cylinders Limited (“Nitin”). WNCL manufactures high-pressure, seamless steel cylinders for compressed natural gas storage in motor vehicles, and produces cylinders for compressed industrial gases. WNCL’s financial results are fully consolidated within our Pressure Cylinders reportable business segment. The equity owned by Nitin is shown as non-controlling interest on Unconsolidated
ClarkDietrich, a 25%-owned joint venture with ClarkWestern Building Systems, LLC, is the industry leader in the manufacture and supply of light gauge steel framing products in the United States. ClarkDietrich manufactures a Gestamp Worthington Wind Steel, LLC (the “Gestamp JV”) is a 50%-owned joint venture with Gestamp Wind Steel U.S., Inc., that was formed with a focus on producing towers for wind turbines being constructed in the North American market. The Gestamp JV announced plans to construct its initial production facility in Cheyenne, Wyoming; however, due to the volatile political environment in the United States, particularly in regards to the Federal Production Tax Credit, construction of this facility has been placed on hold. Samuel Steel Pickling Company (“Samuel”), a
Serviacero Planos, TWB Company, L.L.C. (“TWB”), a 45%-owned joint venture with ThyssenKrupp Steel North America, Inc., is a leading North American supplier of tailor welded
Worthington Armstrong Venture (“WAVE”), a 50%-owned joint venture with Armstrong Ventures, Inc., a subsidiary of Armstrong World Industries, Inc., is one of the three largest global manufacturers
Worthington Specialty Processing (“WSP”), a 51%-owned joint venture with U.S. Steel, operates three steel processing facilities located in Canton, Jackson and Taylor, Michigan, which are managed by Worthington Steel. WSP serves primarily as a toll processor for U.S. Steel and others. Its services include slitting, blanking, cutting-to-length, laser welding, tension leveling and warehousing. WSP is considered to be jointly controlled and not consolidated due to substantive participating rights of the minority partner. See “Item 8. – Financial Statements and Supplementary Data – Notes to Consolidated Financial Statements – Note Environmental Regulation
Future results and the market price for Worthington Industries’ common shares are subject to numerous risks, many of which are driven by factors that cannot be controlled or predicted. The following discussion, as well as other sections of this Annual Report on Form 10-K, including Economic or Industry Downturns The The impacts of
The
The domestic auto industry Financial difficulties and bankruptcy filings by The
There is continued uncertainty particularly in Europe as to the sustainability of the recovery of the capital and credit markets. Further volatility in the United States or Raw Material Pricing and Availability The costs of manufacturing our products and Our future operating results may be affected by fluctuations in raw material at times availability and pricing can be volatile due to a number of factors beyond our costs and adversely impact our financial results. If our suppliers increase the prices of our critical raw materials, we may not have alternative sources of supply. In addition, in an environment of increasing prices for steel and other raw materials, competitive conditions may impact how much of the price increases we can pass on to our customers. To the extent we are unable to pass on future price increases in our raw materials to our customers, our financial results could be adversely affected. Also, if steel prices decrease, Inventories Our business could be harmed if we fail to maintain proper inventory levels. We are required to maintain sufficient inventories to accommodate the needs of our customers including, in many cases, short lead times and just-in-time delivery requirements. Although we typically have customer orders in hand prior to placement of our raw material orders for Steel Processing, we anticipate and forecast customer demand for a timely manner, we may experience inventory shortages. Inventory shortages Suppliers and Customers The loss of significant volume from our key customers could adversely affect us. In fiscal 2012, our largest customer accounted for approximately 5% of our consolidated net sales, and our ten largest customers accounted for approximately 24% of our consolidated net sales. A significant loss of, or decrease in, business from any of our key customers could have an adverse effect on our sales and financial results if we cannot obtain replacement business. Also, due to consolidation in the industries we serve, including the construction, automotive and retail industries, our sales may be increasingly sensitive to deterioration in the financial condition of, or other adverse developments with respect to, one or more of our top customers. In addition, certain of our top customers may be able to exert pricing and other influences on us, requiring us to market, deliver and promote our products in a manner that may be more costly to us. Moreover, we generally do not have long-term contracts with our customers. As a result, although our customers periodically provide indications of their product needs and purchases, they generally purchase our products on an order-by-order basis, and the relationship, as well as particular orders, can be terminated at any time. Many of our key industries, such as construction and automotive, are cyclical in nature. Many of our key industries, such as automotive and construction, are cyclical and can be impacted by both market demand and raw material supply, particularly with respect to steel. The demand for our products is directly related to, and quickly impacted by, customer demand in our industries, which can change as the result of changes in the general United States or worldwide economy and other factors beyond our control. Adverse changes in demand or pricing can have a negative effect on our business. Significant sales reductions for any of the Detroit Three automakers could have a negative impact on our business. Approximately half of the net sales of our Steel Processing operating segment and a significant amount of the net sales of certain joint ventures are to automotive-related customers. Although we do sell to the domestic operations of foreign automakers and their suppliers, a significant portion of our automotive sales are to Ford, General Motors, and Chrysler (the “Detroit Three automakers”) and their suppliers. A reduction in sales for any of the Detroit Three automakers could negatively impact our business. In addition, in 2011, automobile producers began taking steps toward complying with new Corporate Average Fuel Economy mileage requirements for new cars and light trucks that they produce. As automakers work to produce vehicles that comply with these new standards, they may reduce the amount of steel used in cars and trucks to improve fuel economy, thereby reducing demand for steel and resulting in further over-supply of steel in North America. The closing or relocation of customer facilities could adversely affect us. Our ability to meet delivery requirements and the overall cost of our products as delivered to customer facilities are important competitive factors. If customers close or move their production facilities further away from our manufacturing facilities which can supply them, it could have an adverse effect on our ability to meet competitive conditions, which could result in the loss of sales. Likewise, if customers move their production facilities overseas, it could result in the loss of potential sales for us. Sales conflicts with our customers and/or suppliers may adversely impact us. In some instances, we may compete with one or more of our customers and/or suppliers in pursuing the same business. Such conflicts may strain our relationships with those parties, which could adversely affect our future business with them. The closing or idling of steel manufacturing facilities could have a negative impact on us. As steel makers have reduced their production capacities by closing or idling production lines in light of the challenging economic conditions, the number of facilities from which we can purchase steel, in particular certain specialty steels, has decreased. Accordingly, if delivery from a supplier is disrupted, particularly with respect to certain types of specialty steel, it may be more difficult to obtain an alternate supply than in the past. These closures and disruptions could also have an adverse effect on our suppliers’ on-time delivery performance, which could have an adverse effect on our ability to meet our own delivery commitments and may have other adverse effects on our business. The loss of key supplier relationships could adversely affect us. Over the years, our various manufacturing operations have developed relationships with certain steel and other suppliers which have been beneficial to us by providing more assured delivery and a more favorable all-in cost, which includes price and shipping costs. If any of those relationships were disrupted, it could have an adverse effect on delivery times and the overall cost and quality of our raw materials, which could have a negative impact on our business. In addition, we do not have long-term contracts with any of our suppliers. If, in the future, we are unable to obtain sufficient amounts of steel and other products at competitive prices and on a timely basis from our traditional suppliers, we may be unable to obtain these products from alternative sources at competitive prices to meet our delivery schedule, which could have a material adverse affect on our results of operations. Competition Our business is highly competitive, and increased competition could negatively impact our financial results. Generally, the markets in which we conduct business are highly competitive. Our competitors include a variety of both domestic and foreign companies in all major markets. Competition for most of our products is primarily on the basis of price, product quality and our ability to meet delivery requirements. Depending on a variety of factors, including raw material, energy, labor and capital costs, government control of currency exchange rates and government subsidies of foreign steel producers, our business may be materially adversely affected by competitive forces. The Sales by competitors of light gauge metal framing products which are not code compliant could adversely affect us. Our unconsolidated metal framing joint venture, ClarkDietrich, is an industry leader in driving code compliance for light gauge metal framing. If our competitors offer cheaper products which are not code compliant, and certain customers are willing to purchase such non-compliant products, it may be difficult for ClarkDietrich to be cost competitive on these sales. Material Substitution If steel prices increase compared to certain substitute materials, the demand for our products could be negatively impacted, which could have an adverse effect on our financial results.In certain applications, steel competes with other materials, such as aluminum (particularly in the automobile industry), cement and wood (particularly in the construction industry), composites, glass and Freight and Energy Increasing energy and freight costs could increase our operating costs, which could have an adverse effect on our financial results. The availability and cost of freight and energy, such as electricity, natural gas and diesel fuel, is important in the manufacture and transport of our Information Systems We are subject to information system security risks and systems integration issues that could disrupt our internal operations. We are dependent upon information technology for the distribution of information internally and also to our customers and suppliers. This information technology is subject to damage or interruption from a variety of sources, including, Business Disruptions Disruptions to our business or the business of our customers or suppliers could adversely impact our operations and financial results. Business disruptions, including increased costs for, or interruptions in, the supply of energy or raw materials, resulting from shortages of supply or transportation, events (such as required maintenance shutdowns), could cause interruptions to our businesses as well as the operations of our customers and suppliers. While we maintain insurance coverage that can offset some losses relating to certain types of these events, Foreign Operations Economic, political and other risks associated with foreign operations could adversely affect our international financial results. Although the substantial majority of our business activity takes place in the United States, we derive a portion of our revenues and earnings from operations in foreign countries, and we are subject to risks associated with doing business internationally. We have wholly-owned facilities in Austria, Canada, the Czech Republic, Poland and Portugal and joint venture facilities in China, France, India, Mexico, Spain and the United
Joint Ventures A change in the relationship between the members of any of our joint ventures may have an adverse effect on that joint venture. Acquisitions We may Capital Expenditures Our business requires capital investment and maintenance expenditures, and our capital resources may not be adequate to provide for all of our cash requirements. Many of our operations are capital intensive. For the five-year period ended May 31, 2012, our total capital expenditures, including acquisitions and investment activity, were approximately $637.3 million. Additionally, at May 31, 2012, we were obligated to make aggregate lease payments of $27.5 million under operating lease agreements. Our business also requires expenditures for maintenance of our facilities. We currently believe that we have adequate resources (including cash and cash equivalents, cash provided by operating activities, availability under existing credit facilities and unused lines of credit) to meet our cash needs for normal operating costs, capital expenditures, debt repayments, dividend payments, future acquisitions and working capital for our existing business. However, given the current challenges, uncertainty and volatility in the domestic and global economies and financial markets, there can be no assurance that our capital resources will be adequate to provide for all of our cash requirements. Litigation We may be subject to legal proceedings or investigations, the resolution of which could negatively affect our results of operations and liquidity in a particular period. Our results of operations or liquidity in a particular period could be affected by an adverse ruling in any legal proceedings or investigations which may be pending against us or filed against us in the future. We are also subject to a variety of legal compliance risks, including, without limitation, potential claims relating to product liability, health and safety, environmental matters, intellectual property rights, taxes and compliance with U.S. and foreign export laws, anti-bribery laws, competition laws and sales and trading practices. While we believe that we have adopted appropriate risk management and compliance programs to address and reduce these risks, the global and diverse nature of our operations means that these risks will continue to exist and additional legal proceedings and contingencies may arise from time to time. A future adverse ruling or settlement or an unfavorable change in laws, rules or regulations could have a material adverse effect on our results of operations or liquidity in a particular period. For additional information regarding our pending legal proceedings and contingencies, refer to “Part I—Item 3.—Legal Proceedings” within this Annual Report on Form 10-K and “Note E – Contingent Liabilities and Commitments” to the Consolidated Financial Statements included in “Part II – Item 8. – Financial Statements and Supplementary Data” of this Annual Report on Form 10-K. Accounting We are required to make accounting and tax-related estimates, assumptions and judgments in preparing our consolidated financial judgments that we use. In preparing our consolidated financial statements in accordance with accounting principles generally accepted in the United States, we are required to make certain estimates and assumptions that affect the accounting for and recognition of assets, liabilities, revenues and expenses. These estimates and assumptions must be made because certain information that is used in the preparation of our consolidated financial statements is dependent on future events, or cannot be calculated with a high degree of precision from data Tax Laws and Regulations Tax increases or changes in tax laws could adversely affect our financial results. We are subject to tax and related obligations in the jurisdictions in which we operate or do business, including state, local, federal and foreign taxes. The taxing rules of the various jurisdictions in which we operate or do business often are complex and subject to varying interpretations. Tax authorities may challenge tax positions that we take or historically have taken, and may assess taxes where we have not made tax filings or may audit the tax filings we have made and assess additional taxes. Some of these assessments may be substantial, and also may involve the imposition of penalties and interest. In addition, governments could impose new taxes on us or increase the rates at which we are taxed in the future. The payment of substantial additional taxes, penalties or interest resulting from tax assessments, or the imposition of any new taxes, could materially and adversely impact our results of operations, financial condition and cash flows. In addition, our provision for income taxes and cash tax liability in the future could be adversely affected by changes in U.S. tax laws. Potential changes that may adversely affect our financial results include, without limitation, decreasing the ability of U.S. companies to receive a tax credit for foreign taxes paid or to defer the U.S. deduction of expenses in connection with investments made in other countries. Claims and Insurance Adverse claims experience, to the extent not covered by insurance, may have an adverse effect on our financial results. We self-insure a significant portion of our potential liability for Principal Shareholder Our principal shareholder may have the ability to exert significant influence in matters requiring a shareholder vote and could delay, deter or prevent a change in control of Worthington Industries. Pursuant to our charter documents, certain matters such as those in which a person would attempt to acquire or take control of the Company, must be approved by the vote of the holders of common shares representing at least 75% of Worthington Industries’ outstanding voting power. Approximately Key Employees If we lose our senior management or other key employees, our business may be adversely affected. Our ability to successfully operate, grow our business and implement our business strategies is largely dependent on the efforts, abilities and services of our senior management and other key employees. The loss of any of these individuals or our inability to attract, train and retain additional personnel could reduce the competitiveness of our business or otherwise impair our operations or prospects. Our future success will also depend, in part, on our ability to attract and retain qualified personnel, such as engineers and other skilled technicians, who have experience in the application of our products and are knowledgeable about our business, markets and products. We cannot assure that we will be able to retain our existing senior management personnel or other key employees or attract additional qualified personnel when needed. We have not entered into any formal employment agreements or change in control agreements with our executive officers, and the loss of any member of our management team could adversely impact our business and operations. Additionally, we may modify our management structure from time to time or reduce our overall workforce as we did in certain operating segments during the recent economic downturn, which may create marketing, operational and other business risks. Credit Ratings
Difficult Financial Markets Should we be required to raise capital in the Environmental, Health and Safety We may incur additional costs related to environmental and health and safety matters. Our operations and facilities are subject to a variety of federal, state, local and foreign laws and regulations relating to the environmental laws, we may be held liable for all remediation costs at a particular site, even with respect to contamination for which we are not responsible. Changes in environmental and human health and safety laws, rules, regulations or enforcement policies could have a material adverse effect on our business, financial condition or results of operations. Legislation and Regulation Certain proposed legislation and regulations may have an adverse impact on the economy in general and in our markets specifically, which may adversely affect our business. Our business may be negatively impacted by a variety of new or proposed legislation or regulations. For example, legislation and regulations proposing increases in taxation on, or heightened regulation of, carbon or other greenhouse gas emissions may result in higher prices for steel, higher prices for utilities required to run our facilities, higher fuel costs for us and our suppliers and distributors and other adverse impacts. See the immediately following risk factor for additional information regarding legislation and regulations concerning climate change and greenhouse gas emissions. To the extent that new legislation or regulations increase our costs, we may not be able to fully pass these costs on to our customers without a resulting decline in sales and adverse impact to our profits. Likewise, to the extent new legislation or regulations would have an adverse effect on the economy, our markets or the ability of domestic businesses to compete against foreign operations, it could also have an adverse impact on us. Legislation or regulations concerning climate change and greenhouse gas emissions may negatively affect our results of operations. Energy is a significant input in a number of our operations and products, and many believe that consumption of energy derived from fossil fuels is a contributor to global warming. A number of governments and governmental bodies have introduced or are contemplating legislative and regulatory changes in response to the potential impacts of climate change and greenhouse gas emissions. The European Union has established greenhouse gas regulations, and Canada has published details of a regulatory framework for greenhouse gas emissions. The U.S. Environmental Protection Agency has issued and proposed regulations addressing greenhouse gas emissions, including regulations which will require reporting of greenhouse gas emissions from large sources and suppliers in the United States. Legislation previously has been introduced in the U.S. Congress aimed at limiting carbon emissions from companies that conduct business that is carbon-intensive. Among other potential items, such bills could include a system of carbon emission credits issued to certain companies, similar to the European Union’s existing cap-and-trade system. Several U.S. states have also adopted, and other states may in the future adopt, legislation or regulations implementing state-wide or regional cap-and-trade systems that apply to some or all industries that emit greenhouse gases. It is impossible at this time to forecast what the final regulations and legislation, if any, will look like and the resulting effects on our business and operations. Depending upon the terms of any such regulations or legislation, however, we could suffer a negative financial impact as a result of increased energy, environmental and other costs necessary to comply with limitations on greenhouse gas emissions, and we may see changes in the margins of our greenhouse gas-intensive and energy-intensive assets. In addition, depending upon whether similar limitations are imposed globally, the regulations and legislation could negatively impact our ability to compete with foreign companies situated in areas not subject to such limitations. Many of our customers in the United States, Canada and Europe may experience similar impacts, which could result in decreased demand for our products. Seasonality Our operations have been subject to seasonal fluctuations that may impact our cash flows for a particular period. Sales are generally strongest in the fourth quarter of the fiscal year when all of our business segments are normally operating at seasonal peaks. Historically, our sales are generally weaker in the third quarter of the fiscal year, primarily due to reduced activity in the building and construction industry as a result of the colder, more inclement weather, as well as customer plant shutdowns in the automotive industry due to holidays. Our quarterly results may also be affected by the timing of large customer orders. Consequently, our cash flow from operations may fluctuate significantly from quarter to quarter. If, as a result of any such fluctuation, our quarterly cash flows were significantly reduced, we may be unable to service our indebtedness or maintain compliance with certain covenants under our credit facilities. A default under any of the documents governing our indebtedness could prevent us from borrowing additional funds, limit our ability to pay interest or principal and allow our lenders to declare the amounts outstanding to be immediately due and payable and to exercise certain other remedies. Impairment Charges Continued or enhanced weakness or instability in the economy, our markets Item 1B. — Unresolved Staff Comments None. General
Financial Condition and Results of Operations –Contractual Cash Obligations and Other Commercial Commitments” as well as “Item 8. – Financial Statements and Supplementary Data – Notes to Consolidated Financial Statements – Note Excluding joint ventures, Steel Processing
Engineered Cabs Our Engineered Cabs operating segment operates four owned manufacturing facilities containing a total of approximately 600,000 square feet. These facilities are located in Iowa, South Carolina, South Dakota, and Tennessee. This operating segment also operates one Other
Joint Ventures The Spartan consolidated joint venture owns and operates one manufacturing facility in Michigan, consolidated joint venture owns and operates a manufacturing facility in India. The unconsolidated joint ventures operate a total of
Notwithstanding the Item 4. —
Supplemental Item — Executive Officers of the Registrant Effective August 1, 2012, George P. Stoe will be retiring from his position as President and Chief Operating Officer of Worthington Industries and will continue serving the Company as Director of International Business Development and Non-Executive Chairman of Angus–Palm. Mark A. Russell, currently President of The Worthington Steel Company, will succeed Mr. Stoe as President and Chief Operating Officer of Worthington Industries effective August 1, 2012; and Geoffrey G. Gilmore, currently Vice President-Purchasing of Worthington Industries, will succeed Mr. Russell as President of The Worthington Steel Company effective August 1, 2012. The following table lists the names, positions held and ages of the
John P. McConnell has served as Worthington Industries’ Chief Executive Officer since June 1993, as a director of Worthington Industries continuously since 1990, and as Chairman of the Board of Worthington Industries since September 1996. Mr. McConnell serves as the Chair of the Executive Committee of Worthington Industries’ Board of Directors. He George P. Stoe has served as President and Chief Operating Officer of Worthington Industries since October
B. Andrew ‘Andy’ Rose has served as Vice President and Chief Dale T. Brinkman has served as Worthington Industries’ Vice President-Administration since December 1998 and as Worthington Industries’ General Counsel since September 1982. He has been Secretary of
Andrew J. Billman has served as President of Worthington Cylinder Corporation since August 2011. From February 2010 to August 2011, he served as Vice President-Purchasing for Worthington Industries. He served in various other positions with the Company from 1991 to February 2010. Geoffrey G. Gilmore was appointed to the position of President of The Worthington Steel Company effective August 1, 2012. Since July 2011, he has served as Vice President-Purchasing for Worthington Industries responsible for all purchasing efforts across the Company including steel, commodity and OEM purchasing, logistics and outside processing. From March 2010 to July 2011, he served as General Manager of The Worthington Steel Company’s Delta, Ohio facility, responsible for overseeing its manufacturing and sales operations; and from June 2006 to March 2010, he served as Director of automotive sales for The Worthington Steel Company. Mr. Gilmore served in various other positions with the Company from 1998 to June 2006. Matthew A. Lockard has served as Treasurer of Worthington Industries since February 2009 and as Vice President-Corporate Development of Worthington Industries since July 2005. From April 2001 to July 2005, Mr. Lockard served as Vice President-Global Business Development for Worthington Cylinder Corporation. Mr. Lockard served in various other positions with the Company from January 1994 to April 2001. Cathy M. Lyttle has served as Vice President of Communications and Investor Relations since April 2009. Ms. Lyttle has served as Vice President of Communications since January Eric M. Smolenski was appointed to the position of Chief Information Officer of Worthington Industries effective June, 2012. Mr. Smolenski served as Vice President-Human Resources of Worthington Industries from December 2005 through June 2012. From January 2001 to Richard G. Welch has served as the Corporate Controller of Worthington Industries since March 2000 and prior thereto, he served as Assistant Controller of Worthington Industries from August 1999 to March 2000. He served as Principal Financial Officer of Worthington Industries on an interim basis from Virgil L. Winland has served as Senior Vice President-Manufacturing of Worthington Industries since January 2001. He served in various other positions with Executive officers serve at the pleasure of the directors of the Registrant. There are no family relationships among any of the PART II Item 5.—Market for Common Shares Information The common shares of Worthington Industries, Inc. (“Worthington Industries”) trade on the New York Stock Exchange (“NYSE”) under the symbol
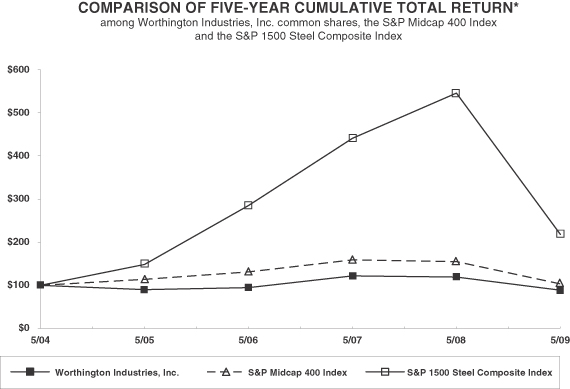
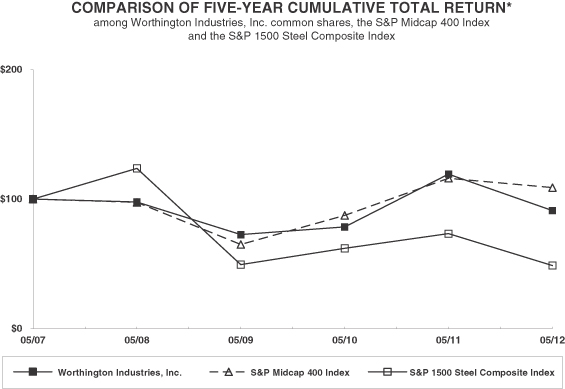
Dividends are declared at the discretion of Worthington Industries’ Board of Directors. Worthington Industries’ Board of Directors declared quarterly dividends of The Board of Directors reviews the dividend on a quarterly basis and establishes the dividend rate based upon Worthington Industries’ financial condition, results of operations, capital requirements, current and projected cash flows, business prospects and other factors which the directors may deem relevant. While Worthington Industries has paid a dividend every quarter since becoming a public company in 1968, there is no guarantee Shareholder Return Performance The following information in this Item 5 of this Annual Report on Form 10-K is not deemed to be “soliciting material” or to be “filed” with the Securities and Exchange Commission or subject to Regulation 14A or Regulation 14C under the Securities Exchange Act of 1934, as amended (the “Exchange Act”), or to the liabilities of Section 18 of the Exchange Act, and will not be deemed to be incorporated by reference into any filing under the Securities Act of 1933, as amended, or the Exchange Act, except to the extent we specifically incorporate such information into such a filing. The following graph compares the five-year cumulative return on Worthington Industries’ common shares, the S&P Midcap 400 Index and the S&P 1500 Steel Composite Index. The graph assumes that $100 was invested at May 31,
Data and graph provided by Zacks Investment Research, Inc. Copyright© Worthington Industries Issuer Purchases of Equity Securities
The common shares available for repurchase under the June 29, 2011 authorization may be purchased from time to time, with consideration given to the market price of the common shares, the nature of other investment opportunities, cash flows from operations, general economic conditions and other appropriate factors. Repurchases may be made on the open market or through privately negotiated transactions. | |||||||||||||||||||||||||||||||||||||||||||||||||||||||||||||||||||||||||||||||||||||||||||||||||||||||||||||||||||||||||||||||||||||||||||||||||||||||||||||||||||||||||||||||||||||||||||||||||||||||||||||||||||||||||||||||||||||||||||||||||||||||||||||||||||||||||||||||||||||||||||||||||||||||||||||||||||||||||||||||||||||||||||||||||||||||||||||||||||||||||||||||||||||||||||||||||||||||||||||||||||||||||||||||||||||||||||||||||||||||||||||||||||||||||||||||||||||||||||||||||||||||||||||||||||||||||||||||||||||||||||||||||||||||||||||||||||||||||||||||||||||||||||||||||||||||||||||||||||||||||||||||||||||||||||||||||||||||||||||||||||||||||||||||||||||||||||||||||||||||||||||||||||||||||||||||||||||||||||||||||||||||||||||||||||||||||||||||||||||||||||||||||||||||||||||||||||||||||||||||||||||||||||||||||||||||||||||||||||||||||||||||||||||||||||||||||||||||||||||||||||||||||||||||||||||||||||||||||||||||||||||||||||||||||||||||||||||||||||||||||||||||||||||||||||||||||||||||||||||||
Item 6. — Selected Financial Data
| Fiscal Year Ended May 31, | ||||||||||||||||||||
| In thousands, except per share | 2009 | 2008 | 2007 | 2006 | 2005 | |||||||||||||||
FINANCIAL RESULTS | ||||||||||||||||||||
Net sales | $ | 2,631,267 | $ | 3,067,161 | $ | 2,971,808 | $ | 2,897,179 | $ | 3,078,884 | ||||||||||
Cost of goods sold | 2,456,533 | 2,711,414 | 2,610,176 | 2,525,545 | 2,580,011 | |||||||||||||||
Gross margin | 174,734 | 355,747 | 361,632 | 371,634 | 498,873 | |||||||||||||||
Selling, general and administrative expense | 210,046 | 231,602 | 232,487 | 214,030 | 225,915 | |||||||||||||||
Goodwill impairment | 96,943 | - | - | - | - | |||||||||||||||
Restructuring charges and other | 43,041 | 18,111 | - | - | 5,608 | |||||||||||||||
Operating income (loss) | (175,296 | ) | 106,034 | 129,145 | 157,604 | 267,350 | ||||||||||||||
Miscellaneous income (expense) | (6,858 | ) | (6,348 | ) | (4,446 | ) | (1,524 | ) | (7,991 | ) | ||||||||||
Nonrecurring losses | - | - | - | - | - | |||||||||||||||
Gain on sale of unconsolidated affiliates | 8,331 | - | - | 26,609 | - | |||||||||||||||
Interest expense | (20,734 | ) | (21,452 | ) | (21,895 | ) | (26,279 | ) | (24,761 | ) | ||||||||||
Equity in net income of unconsolidated affiliates | 48,589 | 67,459 | 63,213 | 56,339 | 53,871 | |||||||||||||||
Earnings (loss) from continuing operations before income taxes | (145,968 | ) | 145,693 | 166,017 | 212,749 | 288,469 | ||||||||||||||
Income tax expense (benefit) | (37,754 | ) | 38,616 | 52,112 | 66,759 | 109,057 | ||||||||||||||
Earnings (loss) from continuing operations | (108,214 | ) | 107,077 | 113,905 | 145,990 | 179,412 | ||||||||||||||
Net earnings (loss) | $ | (108,214 | ) | $ | 107,077 | $ | 113,905 | $ | 145,990 | $ | 179,412 | |||||||||
Earnings (loss) per share – diluted: | ||||||||||||||||||||
Continuing operations | $ | (1.37 | ) | $ | 1.31 | $ | 1.31 | $ | 1.64 | $ | 2.03 | |||||||||
Net earnings (loss) per share | $ | (1.37 | ) | $ | 1.31 | $ | 1.31 | $ | 1.64 | $ | 2.03 | |||||||||
Continuing operations: | ||||||||||||||||||||
Depreciation and amortization | $ | 64,073 | $ | 63,413 | $ | 61,469 | $ | 59,116 | $ | 57,874 | ||||||||||
Capital expenditures (including acquisitions and investments) | 109,491 | 97,343 | 90,418 | 66,904 | 112,937 | |||||||||||||||
Cash dividends declared | 48,115 | 54,640 | 58,380 | 60,110 | 57,942 | |||||||||||||||
Per share | $ | 0.61 | $ | 0.68 | $ | 0.68 | $ | 0.68 | $ | 0.66 | ||||||||||
Average common shares outstanding – diluted | 78,903 | 81,898 | 87,002 | 88,976 | 88,503 | |||||||||||||||
FINANCIAL POSITION | ||||||||||||||||||||
Current assets | $ | 598,935 | $ | 1,104,970 | $ | 969,383 | $ | 996,241 | $ | 938,333 | ||||||||||
Current liabilities | 372,080 | 664,895 | 420,494 | 490,786 | 545,443 | |||||||||||||||
Working capital | $ | 226,855 | $ | 440,075 | $ | 548,889 | $ | 505,455 | $ | 392,890 | ||||||||||
Net fixed assets | $ | 521,505 | $ | 549,944 | $ | 564,265 | $ | 546,904 | $ | 552,956 | ||||||||||
Total assets | 1,363,829 | 1,988,031 | 1,814,182 | 1,900,397 | 1,830,005 | |||||||||||||||
Total debt | 239,393 | 380,450 | 276,650 | 252,684 | 388,432 | |||||||||||||||
Shareholders’ equity | 706,069 | 885,377 | 936,001 | 945,306 | 820,836 | |||||||||||||||
Per share | $ | 8.94 | $ | 11.16 | $ | 11.02 | $ | 10.66 | $ | 9.33 | ||||||||||
Common shares outstanding | 78,998 | 79,308 | 84,908 | 88,691 | 87,933 | |||||||||||||||
| Fiscal Year Ended May 31, | ||||||||||||||||||||
| (in thousands, except per share amounts) | 2012 | 2011 | 2010 | 2009 | 2008 | |||||||||||||||
FINANCIAL RESULTS | ||||||||||||||||||||
Net sales | $ | 2,534,701 | $ | 2,442,624 | $ | 1,943,034 | $ | 2,631,267 | $ | 3,067,161 | ||||||||||
Cost of goods sold | 2,201,833 | 2,086,467 | 1,663,104 | 2,456,533 | 2,711,414 | |||||||||||||||
|
|
|
|
|
|
|
|
|
| |||||||||||
Gross margin | 332,868 | 356,157 | 279,930 | 174,734 | 355,747 | |||||||||||||||
Selling, general and administrative expense | 225,069 | 235,198 | 218,315 | 210,046 | 231,602 | |||||||||||||||
Impairment of long-lived assets | 355 | 4,386 | 35,409 | 96,943 | - | |||||||||||||||
Restructuring and other expense | 5,984 | 2,653 | 4,243 | 43,041 | 18,111 | |||||||||||||||
Joint venture transactions | (150 | ) | (10,436 | ) | - | - | - | |||||||||||||
|
|
|
|
|
|
|
|
|
| |||||||||||
Operating income (loss) | 101,610 | 124,356 | 21,963 | (175,296 | ) | 106,034 | ||||||||||||||
Miscellaneous income (expense) | 2,319 | 597 | 1,127 | (2,329 | ) | 620 | ||||||||||||||
Gain on sale of investment in Aegis | - | - | - | 8,331 | - | |||||||||||||||
Interest expense | (19,497 | ) | (18,756 | ) | (9,534 | ) | (20,734 | ) | (21,452 | ) | ||||||||||
Equity in net income of unconsolidated affiliates | 92,825 | 76,333 | 64,601 | 48,589 | 67,459 | |||||||||||||||
|
|
|
|
|
|
|
|
|
| |||||||||||
Earnings (loss) before income taxes | 177,257 | 182,530 | 78,157 | (141,439 | ) | 152,661 | ||||||||||||||
Income tax expense (benefit) | 51,904 | 58,496 | 26,650 | (37,754 | ) | 38,616 | ||||||||||||||
|
|
|
|
|
|
|
|
|
| |||||||||||
Net earnings (loss) | 125,353 | 124,034 | 51,507 | (103,685 | ) | 114,045 | ||||||||||||||
Net earnings attributable to noncontrolling interest | 9,758 | 8,968 | 6,266 | 4,529 | 6,968 | |||||||||||||||
|
|
|
|
|
|
|
|
|
| |||||||||||
Net earnings (loss) attributable to controlling interest | $ | 115,595 | $ | 115,066 | $ | 45,241 | $ | (108,214 | ) | $ | 107,077 | |||||||||
|
|
|
|
|
|
|
|
|
| |||||||||||
Earnings (loss) per share—diluted: | ||||||||||||||||||||
Net earnings (loss) per share attributable to controlling interest | $ | 1.65 | $ | 1.53 | $ | 0.57 | $ | (1.37 | ) | $ | 1.31 | |||||||||
|
|
|
|
|
|
|
|
|
| |||||||||||
Depreciation and amortization | $ | 55,873 | $ | 61,058 | $ | 64,653 | $ | 64,073 | $ | 63,413 | ||||||||||
Capital expenditures (including acquisitions and investments) | 272,349 | 59,891 | 98,275 | 109,491 | 97,343 | |||||||||||||||
Cash dividends declared | 33,441 | 29,411 | 31,676 | 48,115 | 54,640 | |||||||||||||||
Per common share | $ | 0.48 | $ | 0.40 | $ | 0.40 | $ | 0.61 | $ | 0.68 | ||||||||||
Average common shares outstanding—diluted | 70,252 | 75,409 | 79,143 | 78,903 | 81,898 | |||||||||||||||
FINANCIAL POSITION | ||||||||||||||||||||
Total current assets | $ | 914,239 | $ | 891,635 | $ | 782,285 | $ | 598,935 | $ | 1,104,970 | ||||||||||
Total current liabilities | 658,263 | 525,002 | 379,802 | 372,080 | 664,895 | |||||||||||||||
|
|
|
|
|
|
|
|
|
| |||||||||||
Working capital | $ | 255,976 | $ | 366,633 | $ | 402,483 | $ | 226,855 | $ | 440,075 | ||||||||||
|
|
|
|
|
|
|
|
|
| |||||||||||
Total property, plant and equipment, net | $ | 443,077 | $ | 405,334 | $ | 506,163 | $ | 521,505 | $ | 549,944 | ||||||||||
Total assets | 1,877,797 | 1,667,249 | 1,520,347 | 1,363,829 | 1,988,031 | |||||||||||||||
Total debt | 533,714 | 383,210 | 250,238 | 239,393 | 380,450 | |||||||||||||||
Total shareholders’ equity—controlling interest | 697,174 | 689,910 | 711,413 | 706,069 | 885,377 | |||||||||||||||
Per share | $ | 10.27 | $ | 9.62 | $ | 8.98 | $ | 8.94 | $ | 11.16 | ||||||||||
Common shares outstanding | 67,906 | 71,684 | 79,217 | 78,998 | 79,308 | |||||||||||||||
The acquisition of our 75% ownership interest in PSI Energy Solutions, LLC has been reflected since March 2012. The acquisition of the outstanding voting interests of Angus Industries, Inc. has been reflected since December 2011. The acquisition of the propane fuel cylinders business of The Coleman Company, Inc. has been reflected since December 2011. The acquisition of the outstanding voting interests of STAKO sp. Z o.o.
has been reflected since September 2011. The acquisition of substantially all of the net assets of the BernzOmatic business of Irwin Industrial Tool Company has been reflected since July 2011. Our Automotive Body Panels operations have been excluded from consolidated operating results since their deconsolidation in May 2011. Our Metal Framing operations have been excluded from consolidated operating results since their deconsolidation in March 2011, except for our Metal Framing operations in Canada, which have been excluded since their disposition in November 2009. The acquisition of the net assets of three MISA Metals, Inc. steel processing locations has been reflected since March 2011. The acquisition of our 60% ownership interest in Nitin Cylinders Limited has been reflected since December 2010. The acquisition of the net assets of Hy-Mark Cylinders, Inc. has been reflected since June 2010. The acquisition of the steel processing assets of Gibraltar Industries, Inc. and its subsidiaries has been reflected since February 2010. The acquisition of the membership interests of Structural Composites Industries, LLC has been reflected since September 2009. The acquisition of the net assets related to the businesses of Piper Metal Forming Corporation, U.S. Respiratory, Inc. and Pacific Cylinders, Inc. has been reflected since June 2009. The acquisition of the net assets of Laser Products has been reflected since July 2008. The acquisition of the net assets of The Sharon Companies Ltd. assets has been reflected since June 2008. The acquisition of the capital stock of Precision Specialty Metals, Inc. has been reflected since August 2006. The acquisition of Western Industries, Inc. assets has been reflected since September 2004. The disposition of certain assets related to the Decatur, Alabama steel processing facility has been reflected since August 2004.
Item 7. — Management’s Discussion and Analysis of Financial Condition and Results of Operations
Selected statements contained in this “Item 7. – Management’s Discussion and Analysis of Financial Condition and Results of Operations” constitute “forward-looking statements” as that term is used in the Private Securities Litigation Reform Act of 1995. Such forward-looking statements are based, in whole or in part, on management’s beliefs, estimates, assumptions and currently available information. For a more detailed discussion of what constitutes a forward-looking statement and of some of the factors that could cause actual results to differ materially from such forward-looking statements, please refer to the “Safe Harbor Statement” in the beginning of this Annual Report on Form 10-K and “Part I – I—Item 1A. – —Risk Factors” of this Annual Report on Form 10-K.
Introduction
Worthington Industries, Inc., together with its subsidiaries (collectively, “we,” “our,” “Worthington,” or the “Company”), is primarily a diversified metal processingmetals manufacturing company, focused on value-added steel processing and manufactured metal products. Our manufactured metal products include: pressure cylinder products such as metalpropane, refrigerant, oxygen, compressed natural gas and industrial cylinders, scuba tanks, hand torches, and helium balloon kits; custom-engineered open and closed cabs and operator stations, weldments, kits accessories and cab components for a wide range of heavy mobile equipment; framing pressure cylinders, automotive past-systems and current-model year service stampingsstairs for mid-rise buildings; steel pallets and racks; and, through joint ventures, metal ceilingsuspension grid systems for concealed and lay-in panel ceilings; laser-welded blanks.blanks; light gauge steel framing for commercial and residential construction; and current and past model automotive service stampings. Our number one goal is to increase shareholder value, which we seek to accomplish by optimizing existing operations, developing and commercializing new products and applications, and pursuing strategic acquisitions and joint ventures.
As of May 31, 2009,2012, excluding our joint ventures, we operated 4135 manufacturing facilities worldwide, principally in threefour reportable business segments: Steel Processing, Pressure Cylinders, Engineered Cabs and, on an historical basis, Metal Framing and Pressure Cylinders.Framing. Other businessoperating segments, which are immaterial for purposes of separate disclosure, include Automotive Body Panels, Construction Services,Steel Packaging and Steel Packaging.the Worthington Global Group (the “Global Group”). We also held equity positions in six12 joint ventures, which operated 1944 manufacturing facilities worldwide, as of May 31, 2009.2012. For additional information regarding the formation of Engineered Cabs, refer to theRecent Business Developments section below.
Overview
During fiscal 2012, we benefited from the continued strengthening of the automotive market. Additionally, recent acquisitions by the Company, as discussed in theRecent Business Developments section below, have proven complementary to our existing businesses and contributed to earnings. ClarkWestern Dietrich Building Systems LLC (“ClarkDietrich”) and ArtiFlex Manufacturing LLC (“ArtiFlex”), joint ventures formed during the fourth quarter of fiscal 2011, also performed well, as did our joint ventures in general. ClarkDietrich and ArtiFlex are discussed in more detail below:
On March 1, 2011, we closed an agreement with Marubeni-Itochu Steel America, Inc. (“MISA”) to combine certain assets of Dietrich Metal Framing (“Dietrich”) and ClarkWestern Building Systems Inc. in a new joint venture, ClarkDietrich. We contributed our metal framing business, excluding the Vinyl division, to ClarkDietrich, including all of the related working capital and six of the 13 facilities. In exchange for the contributed net assets, we received the assets of certain MISA Metals, Inc. steel processing locations (the “MMI acquisition”) and a 25% noncontrolling ownership interest in ClarkDietrich. We retained and continued to operate the remaining metal framing facilities (the “retained facilities”), on a short-term basis, to support the transition of the business into the new joint venture. As of August 31, 2011, all of the retained facilities had ceased operations. In a separate transaction, the Vinyl division was sold to ClarkDietrich on October 31, 2011.
On May 9, 2011, we closed an agreement to combine certain assets of The Gerstenslager Company (“Gerstenslager”) and International Tooling Solutions, LLC in a new joint venture, ArtiFlex. In exchange for the contributed net assets, we received a 50% noncontrolling ownership interest in the new joint venture in addition to certain cash and other consideration.
As a result of these transactions (collectively, the “Joint Venture Transactions”), the contributed net assets of Dietrich (excluding the Vinyl division) and Gerstenslager were deconsolidated effective March 1, 2011 and May 9, 2011, respectively. Accordingly, the financial results and operating performance of these businesses are reported on a historical basis through the respective dates of deconsolidation, with our portion of the net earnings of ClarkDietrich and ArtiFlex reported within the equity in net income of unconsolidated affiliates (“equity income”) line item in our consolidated statements of earnings since the dates of deconsolidation.
For additional information on our business segments, pleaseregarding the Joint Venture Transactions, refer to “Item 1.8. – Business”Financial Statements and Supplementary Data – Notes to Consolidated Financial Statements – NOTE A – Summary of Part ISignificant Accounting Policies” of this Annual Report on Form 10-K.
OverviewRecent Business Developments
During
On March 22, 2012, we acquired a 75% ownership interest in PSI Energy Solutions, LLC (“PSI”) for cash consideration of $7.0 million. PSI is a professional services firm that develops cost-effective energy solutions for public and private entities throughout North America. The acquired net assets became part of our fiscal year ended May 31, 2009Global Group operating segment upon closing and will be reported in the “Other” category for segment reporting purposes.
| • | On January 10, 2012, we announced a voluntary recall of our MAP-PRO®, propylene and MAAP® cylinders and related hand torch kits. The recall was a precautionary step and involved a valve supplied by a third party that may leak when a torch or hose is disconnected from the cylinder. We are unaware of any incidence of fire or injury caused by this situation. For additional information regarding the recall, refer to “Item 8. – Financial Statements and Supplementary Data – Notes to Consolidated Financial Statements – NOTE E – Contingent Liabilities and Commitments” of this Annual Report on Form 10-K. |
On December 29, 2011, we acquired 100% of the outstanding economic interests of Angus Industries, Inc. (“fiscal 2009”Angus”), for cash consideration of approximately $132.9 million and the assumption of approximately $47.3 million of debt. Additionally, we experienced challenges and rapidly changing business conditions unlike any we have ever experienced. Record earnings in our first quarter, dueissued 382,749 restricted common shares to record high pricescertain former employees of hot-rolled steel, were erased by a large loss in our second quarter dueAngus who became employees of Worthington upon closing. Approximately $1.1 million of the $6.3 million fair value of these restricted common shares was attributed to the global financial crisispurchase price and recession. Demand in mostrecognized as goodwill. Angus designs and manufactures high-quality, custom-engineered open and closed cabs and operator stations for a wide range of heavy mobile equipment. In connection with this acquisition, we established a new operating segment, Engineered Cabs, which is considered a separate reportable segment.
On December 1, 2011, we acquired the propane fuel cylinders business of The Coleman Company, Inc. (“Coleman Cylinders”). The purchase price consisted of cash consideration of approximately $22.7 million. The acquired net assets became part of our markets plummeted, and steel prices underwentPressure Cylinders operating segment upon closing of the transaction. Subsequent to closing, we received a severe and rapid decline, producing an environment of selling high priced inventory into a declining price market. This requiredrequest from the Federal Trade Commission, asking us to write-down our steel inventoriesprovide, on a voluntary basis, certain information related to the lower-of-cost-or-market, an impactacquisition and the industry as it conducts a preliminary investigation into the transaction. The acquisition fell below the threshold for pre-merger notification under the Hart-Scott-Rodino Act.
On September 30, 2011, we completed the acquisition of $105.0 million, $4.4 millionPoland-based STAKO sp.Z o.o. (“STAKO”). STAKO manufactures liquefied natural gas, propane and butane fuel tanks for use in passenger cars, buses and trucks. The acquired business became part of which related to our Serviacero joint venture. In addition, the declining economy and construction market deterioration resulted in a $96.9 million write-offPressure Cylinders operating segment upon closing of this transaction.
On July 1, 2011, we purchased substantially all of the goodwill associated with our Metal Framing segment. Our third and fourth fiscal quarters saw a continued decline in steel prices and demand in mostnet assets (excluding accounts receivable) of the marketsBernzOmatic business (“Bernz”) of Irwin Industrial Tool Company, a subsidiary of Newell Rubbermaid, Inc. for cash consideration of approximately $41.0 million. In connection with this transaction, we serve.agreed to settle our ongoing dispute with Bernz, which was valued at $10.0 million. Bernz is a leading manufacturer of hand held torches and accessories. The acquired net assets became part of our Pressure Cylinders operating segment upon closing of the transaction.
Market & Industry Overview
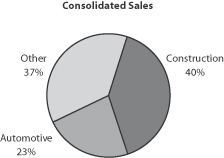
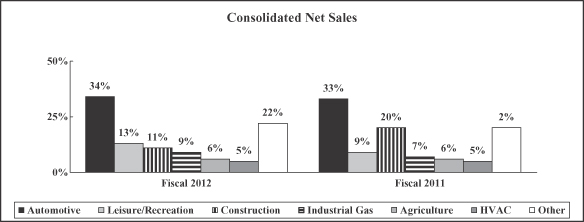
For fiscal 2009,We sell our products and services to a diverse customer base and a broad range of end markets. The breakdown of our net sales breakdown by end user market for fiscal 2012 and fiscal 2011 is illustrated byin the chart below. Substantially allfollowing chart:
The automotive industry is one of the largest consumers of flat-rolled steel, and thus the largest end market for our Steel Processing operating segment. Approximately 52% of the net sales of our Metal Framing business segment and the Construction Services business segment, as well as approximately 25% of the sales for the Steel Processing businessoperating segment are to the construction market, both residentialautomotive market. North American vehicle production, primarily by Chrysler, Ford and non-residential. We estimate that approximately 10%General Motors (the “Detroit Three automakers”), has a considerable impact on the activity within this operating segment. The majority of the net sales of five of our consolidatedunconsolidated affiliates, including the recently-formed ArtiFlex joint venture, were also to the automotive end market.
Approximately 44% and 11% of the net sales or one-fourth of our construction marketEngineered Cabs and Steel Processing operating segments, respectively, and substantially all of the net sales of our Global Group operating segment are to the residentialconstruction market. While the market price of steel significantly impacts this business,these businesses, there are other key indicators that are meaningful in analyzing construction market demand, including U.S. gross domestic product (“U.S. GDP”), the Dodge Index of construction contracts, and trends in the relative price of framing lumber and steel. ConstructionThe construction market is also the predominant end market for our largest joint venture, Worthington Armstrong Venture (“WAVE”). The sales of WAVE are not consolidated in our results; however, adding our ownership percentage of WAVE’s construction market sales to our reported sales would not materially change the sales breakdown in the chart.
The automotive industry is the largest consumer of flat-rolled steel and thus the largest end market for our Steel Processing operations. Approximately half of the sales of our Steel Processing business segment, and substantially all of the sales of the Automotive Body Panels business segment, are to the automotive market. North American vehicle production, primarily by Chrysler, Ford and General Motors (the “Big Three automakers”), has a considerable impact on the customers within these two segments. These segments are also impacted by the market price of steel and, to a lesser extent, the market price of commodities used in their operations, such as zinc, natural gas and diesel fuel. The majority of the sales of two of our unconsolidated joint ventures, also goWorthington Armstrong Venture (“WAVE”) and ClarkDietrich. The decrease in the portion of our total net sales to the automotive end market. These sales are not consolidated in our results; however, adding our ownership percentageconstruction market versus fiscal 2011 was primarily driven by the deconsolidation of joint venture automotive market sales to our reported sales would not materially changesubstantially all of the sales breakdown in the previous chart.net assets of Dietrich Metal Framing (“Dietrich”) on March 1, 2011, as more fully described herein.
The net sales of our Pressure Cylinders and Steel Packaging businessoperating segments, and approximately 30%56% and 37% of the net sales of our Engineered Cabs and Steel Processing business segment,operating segments, respectively, are to other markets such as appliance, leisure and recreation, distribution and transportation,industrial gas, HVAC, lawn and garden, agriculture, mining, forestry and consumer specialty products.appliance. Given the many different product linesproducts that make up these net sales and the wide variety of end markets, it is very difficult to listdetail the key market indicators that drive this portion of our business. However, we believe that the trend in U.S. GDP growth is a good economic indicator for analyzing these operating segments.
We use the following information to monitor our costs and demand in our major end markets:
| Fiscal Year Ended May 31, | Inc / (Dec) | |||||||||||||||||||
| 2009 | 2008 | 2007 | 2009 vs. 2008 | 2008 vs. 2007 | ||||||||||||||||
U.S. GDP (% growth year-over-year) | -1.0 | % | 2.4 | % | 2.1 | % | -3.4 | % | 0.3 | % | ||||||||||
Hot-Rolled Steel ($ per ton)1 | $ | 726 | $ | 636 | $ | 571 | $ | 90 | $ | 65 | ||||||||||
Big Three Auto Build (000s vehicles)2 | 5,606 | 8,643 | 9,509 | (3,037 | ) | (866 | ) | |||||||||||||
No. America Auto Build (000s vehicles)2 | 9,880 | 14,662 | 15,068 | (4,782 | ) | (406 | ) | |||||||||||||
Dodge Index | 98 | 130 | 139 | (32 | ) | (9 | ) | |||||||||||||
Framing Lumber ($ per 1,000 board ft)3 | $ | 230 | $ | 269 | $ | 286 | $ | (39 | ) | $ | (17 | ) | ||||||||
Zinc ($ per pound)4 | $ | 0.65 | $ | 1.24 | $ | 1.65 | $ | (0.59 | ) | $ | (0.41 | ) | ||||||||
Natural Gas ($ per mcf)5 | $ | 7.02 | $ | 7.66 | $ | 6.73 | $ | (0.64 | ) | $ | 0.93 | |||||||||
Retail Diesel Prices, All types ($ per gallon)6 | $ | 3.17 | $ | 3.41 | $ | 2.77 | $ | (0.24 | ) | $ | 0.64 | |||||||||
U.S. GDP (% growth year-over-year)1 Hot-Rolled Steel ($ per ton)2 Detroit Three Auto Build (000’s vehicles)3 No. America Auto Build (000’s vehicles)3 Zinc ($ per pound)4 Natural Gas ($ per mcf)5 On-Highway Diesel Fuel Prices ($ per gallon)6 Fiscal Year Ended May 31, Increase /
(Decrease) 2012 2011 2010 2012 vs.
2011 2011 vs.
2010 0.5 % 2.4 % 0.1 % -1.9 % 2.3 % $ 693 $ 680 $ 549 $ 13 $ 131 8,084 7,251 5,650 833 1,601 14,242 12,756 10,643 1,486 2,113 $ 0.96 $ 1.00 $ 0.94 ($ 0.04 ) $ 0.06 $ 3.61 $ 4.14 $ 4.35 ($ 0.53 ) ($ 0.21 ) $ 3.93 $ 3.35 $ 2.77 $ 0.58 $ 0.58
1 CRU Index; annual average2011 figures based on revised actuals 2 CSM AutobaseCRU Index; period average 3 Random Lengths; annual averageCSM Autobase 4 LME Zinc; annualperiod average 5 NYMEX Henry Hub Natural Gas; annualperiod average 6 Energy Information Administration; annualperiod average
U.S. GDP growth rate trends are generally indicative of the strength in demand and, in many cases, pricing for our products. Historically, we have seen that decreasingA year-over-year increase in U.S. GDP growth rates year-over-year can haveis indicative of a negative effect on our results, as a weakerstronger economy, which generally hurtsincreases demand and pricing for our products. The opposite is alsoConversely, decreasing U.S. GDP growth rates generally true.indicates a weaker economy. Changes in U.S. GDP growth rates can also signal changes in conversion costs related to production and in selling, general and administrative (“SG&A”) expenses. However, these are all general assumptions, which do not hold true in all cases.expense.
In recent quarters, the change in theThe market price of hot-rolled steel has beenis one of the most significant factors impacting our selling prices and has materially impactedoperating results. When steel prices fall, we typically have higher-priced material flowing through cost of goods sold, while selling prices compress to what the market will bear, negatively impacting our earnings. Inresults. On the other hand, in a rising price environment, such as we experienced during the first quarter of fiscal 2009, our results are generally favorably impacted, as lower-priced material purchased in previous periods flows through cost of goods sold, while our selling prices increase at a faster pace to cover current replacement costs. On
The following table presents the other hand, when steel prices fall, as they did during the second, third and fourth quartersaverage quarterly market price per ton of fiscal 2009, we typically have higher-priced material flowing through cost of goods sold while selling prices compress to what the market will bear, negatively impacting our results. Although the annual average steel price shown above was higher in fiscal 2009 than fiscal 2008, it was the 61% decline in the monthly average hot-rolled steel prices from September 2008 to May 2009 that affected our results.during fiscal 2012, fiscal 2011, and fiscal 2010:
| (Dollars per ton1) | Fiscal Year | Inc / (Dec) | ||||||||||||||||||||||||||
| 2012 | 2011 | 2010 | 2012 vs. 2011 | 2011 vs. 2010 | ||||||||||||||||||||||||
1st Quarter | $ | 709 | $ | 611 | $ | 439 | $ | 98 | 16.0 | % | $ | 172 | 39.2 | % | ||||||||||||||
2nd Quarter | $ | 660 | $ | 557 | $ | 538 | $ | 103 | 18.5 | % | $ | 19 | 3.5 | % | ||||||||||||||
3rd Quarter | $ | 718 | $ | 699 | $ | 549 | $ | 19 | 2.7 | % | $ | 150 | 27.3 | % | ||||||||||||||
4th Quarter | $ | 684 | $ | 851 | $ | 669 | ($ | 167 | ) | -19.6 | % | $ | 182 | 27.2 | % | |||||||||||||
Annual Avg. | $ | 693 | $ | 680 | $ | 549 | $ | 13 | 1.9 | % | $ | 131 | 23.9 | % | ||||||||||||||
1CRU Hot-Rolled Index
No single customer makes upcontributed more than 5%10% of our consolidated net sales.sales during fiscal 2012. While our automotive business is largely driven by Bigthe production schedules of the Detroit Three production schedules,automakers, our customer base is much broader and includes other domestic manufacturers and many of their suppliers as well. Seasonal automotive shutdowns in July and December can cause weaker demand in our first and third quarters.suppliers. During fiscal 2009,2012, we continued to benefit from improving automotive production schedules for domestic automakers were severely depressed, not only in July and December, but also throughoutfrom the second half of our fiscal year due to the uncertain financial markets, declining demand, the recessionary economic climate and the financial difficulties of General Motors and Chrysler. We continue to pursue customer diversification beyond the BigDetroit Three automakers, and their suppliers, and,which experienced an 11% increase in recent quarters, we have increased our business in other markets such as energy and agriculture.vehicle production over the prior year. Additionally, North American vehicle production during fiscal 2012 was up 12% over the prior year.
The Dodge Index represents the value of total construction contracts, including residential and non-residential building construction. This overall index serves as a broad indicator of the construction markets in which we participate, as it tracks actual construction starts. The relative pricing of framing lumber, an alternative construction material with which we compete, can also affect our Metal Framing business segment, as certain applications may permit the use of this alternative building material.
The market trends of certainCertain other commodities, such as zinc, natural gas and diesel fuel, can be important to us as they represent a significant portion of our cost of goods sold, both directly through our plant operations and indirectly through transportation and freight. A drop in the price of any of these commodities could decrease our cost of goods sold, and the reverse is also true. For fiscal 2009, any benefit recognized from lower commodity prices was more than offset by the drop in demand and steel pricing decline.
State of our Business
Our results reflect the rapid decline in demand and steel pricing associated with the global economic recession and its impact on end markets that first took hold in our second fiscal quarter. Steel pricing and demand continued to fall during the third and fourth quarters.
In fiscal 2008, we embarked on a cost reduction initiative that grew into a broader Transformation Plan (“the Plan”). In addition, the Plan has provided us with the strategy to combat the global economic recession. The Plan includes a focus on cost reduction, margin expansion, and organizational capability improvements, as well as an effort to develop excellence in three core competencies: sales, operations and supply chain management. The Plan is comprehensive in scope and includes aggressive diagnostic and implementation phases in our Steel Processing and Metal Framing business segments. The goal of the Plan is to increase our Company’s sustainable earnings potential.
Our initial cost reduction efforts identified opportunities for $39.0 million in annual savings in overhead expense reductions, early retirements, and plant closures. In addition, we have continued to focus on reducing costs, increasing asset utilization and driving improvements in our operations, from which we have seen positive results. However, given the current market and economic conditions, particularly those related to our Steel Processing and Metal Framing business segments, we face difficulties in the next quarter, especially since it is a historically slow seasonal quarter for the automotive industry. As a result of the Plan and in response to the challenging recessionary environment, we executed, or announced, the following structural changes to our business in fiscal 2009:
A workforce reduction of approximately 1,200 primarily in our Steel Processing and Metal Framing business segments through a combination of plant closings and permanent job reductions. These reductions are expected to be sustainable even when demand returns as a result of improving operating efficiency through the Plan diagnostics. Additionally, several locations are operating on a reduced work week.
The closure of three facilities, one Steel Processing (Louisville, Kentucky) and two Metal Framing (Renton, Washington and Lunenburg, Massachusetts). In addition, two Metal Framing facilities suspended operations indefinitely (Miami, Florida and Phoenix, Arizona). See “Item 8. – Financial Statements and Supplementary Data – Notes to Consolidated Financial Statements – Note N – Restructuring” for more information on headcount reductions and facility closures.
The sale of our interests in three joint ventures: our 49% equity interest in Canessa Worthington Slovakia s.r.o. (“Slovakia”); our 60% equity interest in Aegis Metal Framing, LLC (“Aegis”); and our 50% equity interest in Accelerated Building Technologies, LLC (“ABT”). See “Item 8. – Financial Statements and Supplementary Data – Notes to Consolidated Financial Statements – Note J – Investments in Unconsolidated Affiliates” for more information on these actions.
The expansion of our Worthington Specialty Processing (“WSP”) joint venture with United States Steel Corporation (“U.S. Steel”), which further consolidated more of the partners’ steel processing operations in eastern Michigan. U.S. Steel contributed Procoil Company, LLC, its steel processing facility in Canton, Michigan, and we contributed Worthington Steel Taylor, our steel processing subsidiary in Taylor, Michigan, plus $2.5 million of cash, increasing our ownership interest from 50% to 51%.
As a result of these and other reductions, we have incurred restructuring charges associated with the Plan totaling $61.2 million to date including charges of $43.0 million during fiscal 2009. We anticipate we will incur an additional $6.0 million in restructuring charges related to the Plan for our next fiscal year, which ends May 31, 2010 (“fiscal 2010”).
We have also implemented several cost reduction initiatives for the first quarter of fiscal 2010, which includes: a one week shut-down of four Steel Processing facilities; suspension of holiday pay for eligible employees; a pay-reduction of up to 20% for salaried employees with a 25% reduction for the Chief Executive Officer of Worthington; a 20% reduction in meeting fees for the board of directors; and a suspension of the Company’s 401(k) match for all employees. We reduced the fourth quarter dividend to $0.10 per share, a $0.07 reduction from the dividend of $0.17 per share declared in each of the first, second, and third quarters. On June 12, 2009, we redeemed $118.5 million of the $138.0 million outstanding 6.70% Notes due
December 1, 2009 (“Notes”) for $1,025 per $1,000 principal amount of Notes, plus accrued and unpaid interest. The repurchase was funded by a combination of cash on hand and borrowings under existing credit facilities in an effort to reduce interestfreight expense.
Results of Operations
Fiscal 20092012 Compared to Fiscal 20082011
Consolidated Operations
The following table presents consolidated operating results:results for the periods indicated:
| Fiscal Year Ended May 31, | ||||||||||||||||||
| Dollars in millions | 2009 | % of Net sales | 2008 | % of Net sales | Increase/ (Decrease) | |||||||||||||
Net sales | $ | 2,631.3 | 100.0 | % | $ | 3,067.2 | 100.0 | % | $ | (435.9 | ) | |||||||
Cost of goods sold | 2,456.6 | 93.4 | % | 2,711.5 | 88.4 | % | (254.9 | ) | ||||||||||
Gross margin | 174.7 | 6.6 | % | 355.7 | 11.6 | % | (181.0 | ) | ||||||||||
Selling, general and administrative expense | 210.0 | 8.0 | % | 231.6 | 7.6 | % | (21.6 | ) | ||||||||||
Goodwill impairment and restructuring charges | 140.0 | 5.3 | % | 18.1 | 0.6 | % | 121.9 | |||||||||||
Operating income (loss) | (175.3 | ) | -6.7 | % | 106.0 | 3.5 | % | (281.3 | ) | |||||||||
Gain on sale of Aegis Metal Framing, LLC | 8.3 | 0.3 | % | - | 0.0 | % | 8.3 | |||||||||||
Miscellaneous and interest expense | (27.6 | ) | -1.0 | % | (27.8 | ) | -0.9 | % | (0.2 | ) | ||||||||
Equity in net income of unconsolidated affiliates | 48.6 | 1.8 | % | 67.5 | 2.2 | % | (18.9 | ) | ||||||||||
Income tax (expense) benefit | 37.8 | 1.4 | % | (38.6 | ) | -1.3 | % | (76.4 | ) | |||||||||
Net earnings (loss) | $ | (108.2 | ) | -4.1 | % | $ | 107.1 | 3.5 | % | $ | (215.2 | ) | ||||||
| Fiscal Year Ended May 31, | ||||||||||||||||||||
| (Dollars in millions) | 2012 | % of Net sales | 2011 | % of Net sales | Increase/ (Decrease) | |||||||||||||||
Net sales | $ | 2,534.7 | 100.0 | % | $ | 2,442.6 | 100.0 | % | $ | 92.1 | ||||||||||
Cost of goods sold | 2,201.8 | 86.9 | % | 2,086.4 | 85.4 | % | 115.4 | |||||||||||||
|
|
|
|
|
|
|
|
|
| |||||||||||
Gross margin | 332.9 | 13.1 | % | 356.2 | 14.6 | % | (23.3 | ) | ||||||||||||
Selling, general and administrative expense | 225.1 | 8.9 | % | 235.2 | 9.6 | % | (10.1 | ) | ||||||||||||
Impairment of long-lived assets | 0.4 | 0.0 | % | 4.4 | 0.2 | % | (4.0 | ) | ||||||||||||
Restructuring and other expense | 6.0 | 0.2 | % | 2.6 | 0.1 | % | 3.4 | |||||||||||||
Joint venture transactions | (0.2 | ) | 0.0 | % | (10.4 | ) | -0.4 | % | 10.2 | |||||||||||
|
|
|
|
|
| |||||||||||||||
Operating income | 101.6 | 4.0 | % | 124.4 | 5.1 | % | (22.8 | ) | ||||||||||||
Miscellaneous income (expense) | 2.3 | 0.1 | % | 0.6 | 0.0 | % | 1.7 | |||||||||||||
Interest expense | (19.5 | ) | -0.8 | % | (18.8 | ) | -0.8 | % | 0.7 | |||||||||||
Equity in net income of unconsolidated affiliates | 92.8 | 3.7 | % | 76.3 | 3.1 | % | 16.5 | |||||||||||||
Income tax expense | (51.9 | ) | -2.0 | % | (58.5 | ) | -2.4 | % | (6.6 | ) | ||||||||||
|
|
|
|
|
| |||||||||||||||
Net earnings | 125.3 | 4.9 | % | 124.0 | 5.1 | % | 1.3 | |||||||||||||
Net earnings attributable to noncontrolling interest | (9.7 | ) | -0.4 | % | (8.9 | ) | -0.4 | % | 0.8 | |||||||||||
|
|
|
|
|
| |||||||||||||||
Net earnings attributable to controlling interest | $ | 115.6 | 4.6 | % | $ | 115.1 | 4.7 | % | $ | 0.5 | ||||||||||
|
|
|
|
|
| |||||||||||||||
Net earnings attributable to controlling interest for fiscal 2009 decreased $215.22012 increased $0.5 million from the prior year, resulting in a net loss of $108.2 million.over fiscal 2011. Net sales and operating highlights were as follows:
Net sales decreased $435.9 million to $2,631.3 million from the prior year. Decreased volumes, primarily in our Steel Processing and Metal Framing business segments, lowered sales by $736.6 million. Higher average selling prices throughout the first half of the year more than offset the dramatic drop in prices in the second half of the year, resulting in an increase to sales of $300.6 million.
| • | Net sales increased $92.1 million from fiscal 2011, driven primarily by higher average selling prices in response to the higher cost of steel, which favorably impacted net sales by $151.1 million. Selling prices are affected by the market price of steel, which averaged $693 per ton during fiscal 2012 versus an average of $680 per ton during fiscal 2011. Overall volumes decreased as a result of the Joint Venture Transactions, which negatively impacted net sales by $335.1 million. Excluding the impact of the Joint Venture Transactions, overall volumes increased by $276.1 million, $104.3 million of which was due to the Angus acquisition. Improved volumes were most notable in our Pressure Cylinders and Steel Processing operating segments, where net sales increased 22% and 12%, respectively, over fiscal 2011. The overall improvement in volumes for Pressure Cylinders was partially offset by an accrual for anticipated product returns related to the voluntary recall described in theRecent Business Developments section above, which negatively impacted net sales by $4.7 million. |
Gross margin decreased $181.0$23.3 million from fiscal 2011 as the increase in net sales was more than offset by higher manufacturing expenses and a lower spread between average selling prices and material costs due to inventory holding losses realized in fiscal 2012 versus inventory holding gains in the prior year primarily due to depressed volumes and declining spreads. Volumes declined 39%year. Gross margin was also negatively impacted by $9.7 million as a result of certain accruals recorded in Steel Processing and 31% in Metal Framing, which reducedconnection with the gross margin by $61.8 million and $40.5 million, respectively. In addition, the declining spreads resulted in inventory write-downs of $100.6 million.voluntary recall noted above.
SG&A expense decreased $21.6$10.1 million from the prior year. Profit sharing and bonus expenses were lower by $27.0 million, but were partially offset by increased bad debt expenses of $6.9 millionfiscal 2011, primarily due to automotive accountsthe impact of the Joint Venture Transactions, which reduced SG&A expense by $35.9 million. The overall decrease in SG&A expense was partially mitigated by the Steel Processing and Automotive Body Panels business segments.impact of acquisitions.
Goodwill impairmentRestructuring charges increased $3.4 million from fiscal 2011. Fiscal 2012 charges were primarily driven by professional fees resulting from our ongoing transformation efforts within Pressure Cylinders and severance accrued in connection with the previously announced closure of $97.0 million and pre-taxour Commercial Stairs business unit. For additional information regarding these restructuring charges, of $43.0 million were recognized for fiscal 2009 comparedrefer to $18.1 million in restructuring charges in fiscal 2008. The goodwill impairment for the Metal Framing business segment was recorded in the second quarter, as key assumptions used in previous valuations related to the economy and construction market no longer supported the goodwill balance. The restructuring charges in both years related to the Plan, and included costs related to professional fees, job reductions, and facility closures.
We recognized a pre-tax gain of $8.3 million on the sale of our interest in Aegis to our partner, MiTek Industries, Inc. in January 2009.
Equity in net income of unconsolidated affiliates of $48.6 million was largely made up of earnings from our WAVE joint venture, which were down 13%. Our other joint ventures also experienced declines in their earnings. Aegis earnings were down year over year largely because of the sale, WSP’s loss increased by $2.6 million and inventory write-downs at our Serviacero joint venture negatively impacted our results by $4.4 million. See “Item 8. – Financial Statements and Supplementary Data – Notes to Consolidated Financial Statements – Note JNOTE D – Investments in Unconsolidated Affiliates” for further information about our participation in unconsolidated joint ventures.Restructuring and Other Expense” of this Annual Report on Form 10-K.
Due toIn connection with the pre-tax loss for fiscal 2009, an income taxwind-down of our Metal Framing operating segment, we recognized a net benefit of $37.8$0.2 million or 25.9%within the joint venture transaction line in our consolidated statement of earnings. This amount consisted of $9.1 million of post-closure facility exit and other costs, offset by $8.3 million of net gains on asset disposals. In addition, the pre-tax loss,severance accrued in connection with the Joint Venture Transactions was recorded. This compares to the $38.6 million tax expense, or 26.5% of the pre-tax income, recorded in fiscal 2008. The change in the effective income tax rate is primarily due to the change in the mix of income among the jurisdictions in which we do business, as well as the portion of the goodwill impairment that is not deductible for tax purposes.
Segment Operations
Steel Processing
The following table presents a summary of operating results for the Steel Processing business segment for the periods indicated:
| Fiscal Year Ended May 31, | |||||||||||||||||
| Dollars in millions | 2009 | % of Net sales | 2008 | % of Net sales | Increase/ (Decrease) | ||||||||||||
Net sales | $ | 1,183.0 | 100.0 | % | $ | 1,463.2 | 100.0 | % | $ | (280.2 | ) | ||||||
Cost of goods sold | 1,167.4 | 98.7 | % | 1,313.5 | 89.8 | % | (146.1 | ) | |||||||||
Gross margin | 15.6 | 1.3 | % | 149.7 | 10.2 | % | (134.1 | ) | |||||||||
Selling, general and administrative expense | 79.8 | 6.7 | % | 92.8 | 6.3 | % | (13.0 | ) | |||||||||
Restructuring charges | 3.9 | 0.3 | % | 1.1 | 0.1 | % | 2.8 | ||||||||||
Operating income (loss) | $ | (68.1 | ) | -5.8 | % | $ | 55.8 | 3.8 | % | $ | (123.9 | ) | |||||
Material cost | $ | 991.4 | $ | 1,105.7 | $ | (114.3 | ) | ||||||||||
Tons shipped (in thousands) | 2,011 | 3,286 | (1,275 | ) | |||||||||||||
Net sales and operating income (loss) highlights were as follows:
Net sales decreased $280.2 million from the prior year to $1,183.0 million. The decrease was attributable to weakened demand in the automotive and construction markets, the two largest markets served by our Steel Processing business segment.
Operating income decreased by $123.9 million compared to last year,adjusted downward resulting in an operating loss of $68.1 million. Weakened demand, caused by the global recession, and a compressed spread between average selling prices and material costs resulted in inventory write-downs of $62.6$1.0 million and were the main drivers behind the operating loss. SG&A expense was $13.0 million lower than the prior year, primarily duecredit to lower profit sharing and bonus expenses. Restructuring charges in both years relatedearnings. For additional information, refer to the Plan.
Metal Framing
The following table presents a summary of operating results for the Metal Framing business segment for the periods indicated:
| Fiscal Year Ended May 31, | ||||||||||||||||||
| Dollars in millions | 2009 | % of Net sales | 2008 | % of Net sales | Increase/ (Decrease) | |||||||||||||
Net sales | $ | 661.0 | 100.0 | % | $ | 788.8 | 100.0 | % | $ | (127.8 | ) | |||||||
Cost of goods sold | 638.1 | 96.5 | % | 729.1 | 92.4 | % | (91.0 | ) | ||||||||||
Gross margin | 22.9 | 3.5 | % | 59.7 | 7.6 | % | (36.8 | ) | ||||||||||
Selling, general and administrative expense | 54.9 | 8.3 | % | 67.0 | 8.5 | % | (12.1 | ) | ||||||||||
Goodwill impairment and restructuring charges | 110.6 | 16.7 | % | 9.0 | 1.1 | % | 101.6 | |||||||||||
Operating loss | $ | (142.6 | ) | -21.6 | % | $ | (16.3 | ) | -2.1 | % | $ | (126.3 | ) | |||||
Material cost | $ | 502.1 | $ | 557.3 | $ | (55.2 | ) | |||||||||||
Tons shipped (in thousands) | 459 | 666 | (207 | ) | ||||||||||||||
Net sales and operating loss highlights were as follows:
Net sales decreased $127.8 million from the prior year to $661.0 million. Lower volumes reduced sales by $242.0 million, which more than offset the $114.2 million benefit from higher average selling prices realized primarily in the first half of the year.
The operating loss of $142.6 million increased from a $16.3 million loss last year and included a $97.0 million goodwill impairment charge recorded in the second fiscal quarter. In addition, rapidly declining steel prices resulted in an inventory write-down of $38.0 million. Weak volumes were partially offset by lower SG&A expenses realized from plant closures and headcount reductions.
Pressure Cylinders
The following table presents a summary of operating results for the Pressure Cylinders business segment for the periods indicated:
| Fiscal Year Ended May 31, | ||||||||||||||||
| Dollars in millions | 2009 | % of Net sales | 2008 | % of Net sales | Increase/ (Decrease) | |||||||||||
Net sales | $ | 537.4 | 100.0 | % | $ | 578.8 | 100.0 | % | $ | (41.4 | ) | |||||
Cost of goods sold | 429.8 | 80.0 | % | 457.2 | 79.0 | % | (27.4 | ) | ||||||||
Gross margin | 107.6 | 20.0 | % | 121.6 | 21.0 | % | (14.0 | ) | ||||||||
Selling, general and administrative expense | 45.4 | 8.4 | % | 51.5 | 8.9 | % | (6.1 | ) | ||||||||
Restructuring charges | 1.0 | 0.2 | % | 0.1 | 0.0 | % | 0.9 | |||||||||
Operating income | $ | 61.2 | 11.4 | % | $ | 70.0 | 12.1 | % | $ | (8.8 | ) | |||||
Material cost | $ | 257.5 | $ | 273.1 | $ | (15.6 | ) | |||||||||
Units shipped (in thousands) | 47,639 | 48,058 | (419 | ) | ||||||||||||
Net sales and operating income highlights were as follows:
Net sales of $537.4 million decreased by $41.4 million from fiscal 2008. An unfavorable change in the sales mix combined with lower North American volumes, reduced sales by $38.7 million. Weaker foreign currencies relative to the U.S. dollar negatively impacted reported U.S. dollar sales of the non-U.S. operations by $9.0 million compared to last year.
Operating income decreased $8.8 million from last year. Gross margin declined to 20.0% of net sales from 21.0% as lower volumes combined with a lower spread between average selling prices and material costs to result in a $14.0 million decline in gross margin for the year.
Other
The “Other” category includes the Automotive Body Panels, Construction Services and Steel Packaging business segments, which are immaterial for purposes of separate disclosure, along with income and expense items not allocated to the business segments.
The following table presents a summary of operating results for the periods indicated:
| Fiscal Year ended May 31, | ||||||||||||||||||
| Dollars in millions | 2009 | % of Net sales | 2008 | % of Net sales | Increase/ (Decrease) | |||||||||||||
Net sales | $ | 249.9 | 100.0 | % | $ | 236.4 | 100.0 | % | $ | 13.5 | ||||||||
Cost of goods sold | 221.3 | 88.6 | % | 211.8 | 89.6 | % | 9.5 | |||||||||||
Gross margin | 28.6 | 11.4 | % | 24.6 | 10.4 | % | 4.0 | |||||||||||
Selling, general and administrative expense | 29.9 | 12.0 | % | 20.2 | 8.5 | % | 9.7 | |||||||||||
Restructuring charges | 24.5 | 9.8 | % | 7.9 | 3.3 | % | 16.6 | |||||||||||
Operating loss | $ | (25.8 | ) | -10.3 | % | $ | (3.5 | ) | -1.5 | % | $ | (22.3 | ) | |||||
Net sales and operating loss highlights were as follows:
Net sales increased $13.5 million from fiscal 2008. Net sales in Construction Services increased $28.6 million over the prior year primarily due to the Worthington Stairs acquisition in June 2008, and higher volumes in both the mid-rise and military construction business units. This was partially offset by an $18.8 million decline in sales in Automotive Body Panels, which was negatively impacted by the downturn in the automotive market.
The operating loss widened by $22.3 million versus last year due to $24.5 million in restructuring charges related to the Plan, which included professional fees, employee severance and relocation expenses. In addition, SG&A expenses increased $9.7 million due to the acquisition of Worthington Stairs and higher bad debt expense in Automotive Body Panels. The results of Construction Services improved significantly over the prior year due to both its military and mid-rise construction end markets.
Fiscal 2008 Compared to Fiscal 2007
Consolidated Operations
The following table presents consolidated operating results:
| Fiscal Year Ended May 31, | ||||||||||||||||||
| Dollars in millions | 2008 | % of Net sales | 2007 | % of Net sales | Increase/ (Decrease) | |||||||||||||
Net sales | $ | 3,067.2 | 100.0 | % | $ | 2,971.8 | 100.0 | % | $ | 95.4 | ||||||||
Cost of goods sold | 2,711.5 | 88.4 | % | 2,610.2 | 87.8 | % | 101.3 | |||||||||||
Gross margin | 355.7 | 11.6 | % | 361.6 | 12.2 | % | (5.9 | ) | ||||||||||
Selling, general and administrative expense | 231.6 | 7.6 | % | 232.5 | 7.8 | % | (0.9 | ) | ||||||||||
Restructuring charges | 18.1 | 0.6 | % | - | 0.0 | % | 18.1 | |||||||||||
Operating income | 106.0 | 3.5 | % | 129.1 | 4.3 | % | (23.1 | ) | ||||||||||
Other expense, net | (6.3 | ) | -0.2 | % | (4.4 | ) | -0.1 | % | 1.9 | |||||||||
Interest expense | (21.5 | ) | -0.7 | % | (21.9 | ) | -0.7 | % | (0.4 | ) | ||||||||
Equity in net income of unconsolidated affiliate | 67.5 | 2.2 | % | 63.2 | 2.1 | % | 4.3 | |||||||||||
Income tax expense | (38.6 | ) | -1.3 | % | (52.1 | ) | -1.8 | % | (13.5 | ) | ||||||||
Net earnings | $ | 107.1 | 3.5 | % | $ | 113.9 | 3.8 | % | $ | (6.8 | ) | |||||||
Net earnings for fiscal 2008 decreased $6.8 million from fiscal 2007 to $107.1 million.
Net sales increased $95.4 million to $3,067.2 million from fiscal 2007. Most of the increase in net sales was due to higher volumes ($63.4 million), stronger foreign currencies relative to the U.S. dollar ($31.3 million) and a marginal increase in average selling prices. Volume increases boosted sales in nearly all of our business segments, especially Construction Services, where sales increased $36.5 million.
Gross margin decreased $5.9 million from fiscal 2007 primarily due to declines in our Pressure Cylinders business segment as a result of lower average selling prices in local currencies in Europe and increased material costs. All of our other business segments reported increased gross margin due to stronger volumes.
SG&A expense decreased $0.9 million from fiscal 2007. The Plan provided $15.2 million in SG&A savings, which was largely offset by increased compensation, depreciation and bad debt expense.
Restructuring charges of $18.1 million related to the Plan.
Equity in net income of unconsolidated affiliates of $67.5 million was largely made up of earnings from our WAVE joint venture, which increased $5.8 million over fiscal 2007. Increased earnings from WAVE and the addition of $3.1 million in earnings from Serviacero Worthington were offset by decreased earnings at WSP, TWB Company, L.L.C. (“TWB”), and certain other joint ventures. See “Item 8. – Financial Statements and Supplementary Data – Notes to Consolidated Financial Statements – Note JNOTE D – Restructuring and Other Expense” of this Annual Report on Form 10-K.
Interest expense of $19.5 million was $0.7 million higher than the prior fiscal year due to the impact of higher average debt levels.
Equity income increased $16.5 million from fiscal 2011. The majority of the equity income is generated by our WAVE joint venture, where our portion of net earnings increased $4.2 million, or 7%. ClarkDietrich and ArtiFlex, joint ventures formed during the fourth quarter of fiscal 2011, also contributed to the current year increase, providing $6.1 million and $5.2 million, respectively, of equity income in fiscal 2012. For additional financial information regarding our unconsolidated affiliates, refer to “Item 8. – Financial Statements and Supplementary Data – Notes to Consolidated Financial Statements – NOTE B – Investments in Unconsolidated Affiliates” for further information about our participation in unconsolidated joint ventures.of this Annual Report on Form 10-K.
Income tax expense fordecreased $6.6 million from fiscal 2008 decreased $13.5 million and the effective2011. Fiscal 2012 income tax expense reflects an effective tax rate was 26.5% comparedattributable to 31.4%controlling interest of 31.0% versus 33.7% in fiscal 2007. The decrease2011. These rates are calculated based on net earnings attributable to controlling interest, as reflected in income tax was primarily becauseour consolidated statements of lower earnings and a lower effective income tax rate.earnings. The decrease in the effective income tax rate attributable to controlling interest was due to more of the Company’s income qualifying for the production activities deduction, and certain one-time items. The 31.0% rate is lower than the federal statutory rate of 35% primarily becauseas a result of adjustmentsthe benefits from the qualified production activities deduction and lower tax rates on foreign income (collectively decreasing the rate by 5.0%). These impacts are partially offset by state and local income taxes of 1.6% (net of their federal tax benefit). For additional information, refer to our current“Item 8. – Financial Statements and deferred estimated tax liabilities and a change in the mixSupplementary Data – Notes to Consolidated Financial Statements – NOTE K – Income Taxes” of our foreign earnings.this Annual Report on Form 10-K.
Segment Operations
Steel Processing
The following table presents a summary of operating results for theour Steel Processing businessoperating segment for the periods indicated:
| Fiscal Year Ended May 31, | Fiscal Year Ended May 31, | |||||||||||||||||||||||||||||||||||
| Dollars in millions | 2008 | % of Net sales | 2007 | % of Net sales | Increase/ (Decrease) | |||||||||||||||||||||||||||||||
| (Dollars in millions) | 2012 | % of Net sales | 2011 | % of Net sales | Increase/ (Decrease) | |||||||||||||||||||||||||||||||
Net sales | $ | 1,463.2 | 100.0 | % | $ | 1,460.7 | 100.0 | % | $ | 2.5 | $ | 1,578.5 | 100.0 | % | $ | 1,405.5 | 100.0 | % | $ | 173.0 | ||||||||||||||||
Cost of goods sold | 1,313.5 | 89.8 | % | 1,313.2 | 89.9 | % | 0.3 | 1,399.9 | 88.7 | % | 1,216.5 | 86.6 | % | 183.4 | ||||||||||||||||||||||
|
|
| ||||||||||||||||||||||||||||||||||
Gross margin | 149.7 | 10.2 | % | 147.5 | 10.1 | % | 2.2 | 178.6 | 11.3 | % | 189.0 | 13.4 | % | (10.4 | ) | |||||||||||||||||||||
Selling, general and administrative expense | 92.8 | 6.3 | % | 92.1 | 6.3 | % | 0.7 | 109.1 | 6.9 | % | 111.6 | 7.9 | % | (2.5 | ) | |||||||||||||||||||||
Restructuring charges | 1.1 | 0.1 | % | - | 0.0 | % | 1.1 | |||||||||||||||||||||||||||||
Restructuring and other income | - | 0.0 | % | (0.3 | ) | 0.0 | % | 0.3 | ||||||||||||||||||||||||||||
Joint venture transactions | (2.1 | ) | -0.1 | % | - | 0.0 | % | (2.1 | ) | |||||||||||||||||||||||||||
|
|
| ||||||||||||||||||||||||||||||||||
Operating income | $ | 55.8 | 3.8 | % | $ | 55.4 | 3.8 | % | $ | 0.4 | $ | 71.6 | 4.5 | % | $ | 77.7 | 5.5 | % | $ | (6.1 | ) | |||||||||||||||
|
|
| ||||||||||||||||||||||||||||||||||
Material cost | $ | 1,105.7 | $ | 1,106.5 | $ | (0.8 | ) | $ | 1,159.3 | $ | 1,001.9 | $ | 157.4 | |||||||||||||||||||||||
Tons shipped (in thousands) | 3,286 | 3,282 | 4 | 2,898 | 2,589 | 309 | ||||||||||||||||||||||||||||||
Net sales and operating income highlights were as follows:
Net sales increased $2.5$173.0 million from fiscal 20072011. Higher base material prices throughout the year led to $1,463.2increased pricing for our products, favorably impacting net sales by $103.3 million. Overall volumes, aided by continued improvement in the automotive market, increased 12% over fiscal 2011, favorably impacting net sales by $69.7 million. The increasemix of direct versus toll tons processed was attributable51% to a full year of operations at our stainless steel processing facility, Precision Specialty Metals, Inc. (“PSM”), compared to nine and one-half months of operations49% in fiscal 2007. Increased sales at PSM were partially offset by decreases2012, compared with a 55% to 45% mix in net sales at our carbon steel processing facilities, due to decreased average selling prices early inthe prior fiscal 2008 and lower volumes.year.
Operating income increased $0.4decreased $6.1 million compared tofrom fiscal 2007. Gross margin improved $2.2 million due to an increased2011 as the increase in net sales was more than offset by a lower spread between average selling prices and material cost, largelycosts due to inventory holding losses realized in fiscal 2012 versus inventory holding gains in the fourth quarterprior year. Operating income was also adversely impacted by higher manufacturing expenses, primarily freight costs. The impact of these items was partially mitigated by a decrease in SG&A expense due to lower profit sharing and bonus expenses in the current fiscal year as well as a $2.1 million gain related to the disposal of two of the fiscal year, offset by higher freight expense, wages and utilities. SG&A expense was up slightly, primarily due to a higher allocation of corporate expenses. Restructuring charges of $1.1 million related to employee early retirements and severance.
Metal Framing
The following table presents a summary of operating results forthree steel processing facilities acquired in the Metal Framing business segment for the periods indicated:
| Fiscal Year Ended May 31, | ||||||||||||||||||
| Dollars in millions | 2008 | % of Net sales | 2007 | % of Net sales | Increase/ (Decrease) | |||||||||||||
Net sales | $ | 788.8 | 100.0 | % | $ | 771.4 | 100.0 | % | $ | 17.4 | ||||||||
Cost of goods sold | 729.0 | 92.4 | % | 711.7 | 92.3 | % | 17.3 | |||||||||||
Gross margin | 59.8 | 7.6 | % | 59.7 | 7.7 | % | 0.1 | |||||||||||
Selling, general and administrative expense | 67.0 | 8.5 | % | 68.9 | 8.9 | % | (1.9 | ) | ||||||||||
Restructuring charges | 9.0 | 1.1 | % | - | 0.0 | % | 9.0 | |||||||||||
Operating loss | $ | (16.2 | ) | -2.1 | % | $ | (9.2 | ) | -1.2 | % | $ | (7.0 | ) | |||||
Material cost | $ | 557.3 | $ | 547.6 | $ | 9.7 | ||||||||||||
Tons shipped (in thousands) | 666 | 644 | 22 | |||||||||||||||
Net sales and operating loss highlights were as follows:
Net sales increased $17.4 million from fiscal 2007 to $788.8 million. The increase in net sales was due to higher volumes ($28.3 million) offset by lower average selling prices ($10.9 million).
The operating loss of $16.2 million was $7.0 million worse than fiscal 2007 primarily due to $9.0 million in restructuring charges recorded in fiscal 2008. Metal Framing was able to return to operating profitability inMMI acquisition during the fourth quarter of fiscal 2008, but that2011. This gain was not enough to make up for the losses earlierincluded in the fiscal year. Overall volumes were up over fiscal 2007 contributing $8.9 millionjoint venture transactions line to gross margin; however, improved volumes were entirely offset by lower spreads between average selling prices and material cost and increased conversion costs. SG&A decreased $1.9 million as we began to recognize benefits from the Plan. Restructuring charges of $9.0 million were associatedcorrespond with the Plan.amounts previously recognized in connection with this transaction.
Pressure Cylinders
The following table presents a summary of operating results for theour Pressure Cylinders businessoperating segment for the periods indicated:
| Fiscal Year Ended May 31, | Fiscal Year Ended May 31, | |||||||||||||||||||||||||||||||||||
| Dollars in millions | 2008 | % of Net sales | 2007 | % of Net sales | Increase/ (Decrease) | |||||||||||||||||||||||||||||||
| (Dollars in millions) | 2012 | % of Net sales | 2011 | % of Net sales | Increase/ (Decrease) | |||||||||||||||||||||||||||||||
Net sales | $ | 578.8 | 100.0 | % | $ | 544.8 | 100.0 | % | $ | 34.0 | $ | 770.1 | 100.0 | % | $ | 591.9 | 100.0 | % | $ | 178.2 | ||||||||||||||||
Cost of goods sold | 457.2 | 79.0 | % | 411.1 | 75.5 | % | 46.1 | 641.8 | 83.3 | % | 474.8 | 80.2 | % | 167.0 | ||||||||||||||||||||||
|
|
| ||||||||||||||||||||||||||||||||||
Gross margin | 121.6 | 21.0 | % | 133.7 | 24.5 | % | (12.1 | ) | 128.3 | 16.7 | % | 117.1 | 19.8 | % | 11.2 | |||||||||||||||||||||
Selling, general and administrative expense | 51.5 | 8.9 | % | 49.1 | 9.0 | % | 2.4 | 83.1 | 10.8 | % | 68.1 | 11.5 | % | 15.0 | ||||||||||||||||||||||
Restructuring charges | 0.1 | 0.0 | % | - | 0.0 | % | 0.1 | |||||||||||||||||||||||||||||
|
|
| ||||||||||||||||||||||||||||||||||
Operating income | $ | 70.0 | 12.1 | % | $ | 84.6 | 15.5 | % | $ | (14.6 | ) | $ | 45.2 | 5.9 | % | $ | 49.0 | 8.3 | % | $ | (3.8 | ) | ||||||||||||||
|
|
| ||||||||||||||||||||||||||||||||||
Material cost | $ | 273.1 | $ | 251.1 | $ | 22.0 | $ | 386.7 | $ | 273.9 | $ | 112.8 | ||||||||||||||||||||||||
Units shipped (in thousands) | 48,058 | 44,891 | 3,167 | 71,777 | 59,037 | 12,740 | ||||||||||||||||||||||||||||||
Net sales and operating highlights were as follows:
| • | Net sales increased $178.2 million from fiscal 2011. Higher overall volumes favorably impacted net sales by $135.2 million, aided by the fiscal 2012 acquisitions, which contributed $122.9 million. Overall pricing for our products favorably impacted net sales by $43.0 million, as higher base material prices led to increased pricing for our products. The overall improvement in volumes was partially offset by an accrual for anticipated product returns related to the voluntary recall described in theRecent Business Developments section above, which negatively impacted net sales by $4.7 million. |
Operating income decreased $3.8 million from fiscal 2011 as the increase in gross margin was more than offset by higher SG&A expense. The increase in SG&A expense was driven by the impact of acquisitions and the absorption of a larger portion of corporate allocated expenses as a result of the Joint Venture Transactions partially offset by a $4.4 million settlement gain related to the Bernz acquisition. Refer to “Item 8. – Financial Statements and Supplementary Data – Notes to Consolidated Financial Statements – NOTE E – Contingent Liabilities and Commitments” and “NOTE N – Acquisitions” of this Annual Report on Form 10-K for additional detail. The increase in gross margin was driven by higher volumes, aided by the impact of acquisitions, and an increased spread between selling prices and material costs offset by $9.7 million of charges related to the voluntary recall described above.
Engineered Cabs
The following table presents a summary of operating results for our Engineered Cabs operating segment for the periods indicated:
| Fiscal Year Ended May 31, | ||||||||||||||||||
| (Dollars in millions) | 2012 | % of Net sales | 2011 | % of Net sales | Increase/ (Decrease) | |||||||||||||
Net sales | $ | 104.3 | 100.0 | % | $ | - | $ | 104.3 | ||||||||||
Cost of goods sold | 88.9 | 85.2 | % | - | 88.9 | |||||||||||||
|
|
|
|
|
| |||||||||||||
Gross margin | 15.4 | 14.8 | % | - | 15.4 | |||||||||||||
Selling, general and administrative expense | 10.5 | 10.1 | % | - | 10.5 | |||||||||||||
|
|
|
|
|
| |||||||||||||
Operating income | $ | 4.9 | 4.7 | % | $ | - | $ | 4.9 | ||||||||||
|
|
|
|
|
| |||||||||||||
Material cost | $ | 53.9 | $ | - | $ | 53.9 | ||||||||||||
Net sales and operating highlights were as follows:
Net sales reflected five months of $578.8 million increased by $34.0 million over fiscal 2007. Stronger foreign currencies relative to the U.S. dollar positively impacted reported U.S. dollar sales of the non-U.S. operations, by $26.9 million compared to fiscal 2007. Thisas this business was offset by a $9.8 million decline in sales from our European operations in local currencies, primarily as a result of lower average selling prices. The remaining increase in net sales was due to improved volumes in our 14.1 ounce and 16.4 ounce cylinders and higher selling prices across most North American product lines.acquired on December 29, 2011.
Current year operating income of $4.9 million was negatively affected by $5.0 million of non-recurring expenses associated with the write-up of inventory to fair value in connection with the application of purchase accounting and various acquisition-related costs.
Metal Framing
The following table summarizes the operating results of our Metal Framing operating segment for the periods indicated. The operating results of the net assets contributed to the ClarkDietrich joint venture are included on a historical basis through March 1, 2011, the date of deconsolidation. Fiscal 2012 operating results reflect the operations of the Vinyl division through October 31, 2011, the date this business was sold.
| Fiscal Year Ended May 31, | ||||||||||||||||||||
| (Dollars in millions) | 2012 | % of Net sales | 2011 | % of Net sales | Increase/ (Decrease) | |||||||||||||||
Net sales | $ | 4.4 | 100.0 | % | $ | 249.5 | 100.0 | % | $ | (245.1 | ) | |||||||||
Cost of goods sold | 4.4 | 100.0 | % | 225.8 | 90.5 | % | (221.4 | ) | ||||||||||||
|
|
|
|
|
| |||||||||||||||
Gross margin | - | 0.0 | % | 23.7 | 9.5 | % | (23.7 | ) | ||||||||||||
Selling, general and administrative expense | 1.9 | 43.2 | % | 31.6 | 12.7 | % | (29.7 | ) | ||||||||||||
Restructuring and other expense | 0.1 | 2.3 | % | 1.4 | 0.6 | % | (1.3 | ) | ||||||||||||
Joint venture transactions | 1.9 | 43.2 | % | (1.8 | ) | -0.7 | % | 3.7 | ||||||||||||
|
|
|
|
|
| |||||||||||||||
Operating loss | $ | (3.9 | ) | -88.6 | % | $ | (7.5 | ) | -3.0 | % | $ | 3.6 | ||||||||
|
|
|
|
|
| |||||||||||||||
Material cost | $ | 1.9 | $ | 161.0 | $ | (159.1 | ) | |||||||||||||
Tons shipped (in thousands) | 1 | 184 | (183 | ) | ||||||||||||||||
Operating income decreased $14.6 million fromhighlights were as follows:
Net sales during fiscal 2007. Gross margin declined to 21.0%2012 reflect the operations of sales from 24.5%the Vinyl division through October 31, 2011 as well as the lower average selling prices in European local currenciesoperations of the retained facilities through August 31, 2011, the date by which all of the retained facilities had ceased operations.
Fiscal 2012 operating loss of $3.9 million was driven primarily by $9.1 million of post-closure facility exit and increased materialother costs resulted in a $12.1offset by $6.2 million decline in gross margin for fiscal 2008.of gains related to the sale of the Vinyl division and of other equipment and real estate.
Other
The “Other”Other category includes the Automotive Body Panels, Construction Services andour Steel Packaging businessand Global Group operating segments, which are immaterialdo not meet the quantitative tests for purposes of separate disclosure, along withas well as certain income and expense items not allocated to our operating segments. The Other category also includes the business segments.results of our former Automotive Body Panels operating segment, on a historical basis, through May 9, 2011, the date of deconsolidation. The following table represents a summary of operating results for the Other operating segments for the periods indicated:
| Fiscal Year Ended May 31, | ||||||||||||||||||||
| (Dollars in millions) | 2012 | % of Net sales | 2011 | % of Net sales | Increase/ (Decrease) | |||||||||||||||
Net sales | $ | 77.4 | 100.0 | % | $ | 195.6 | 100.0 | % | $ | (118.2 | ) | |||||||||
Cost of goods sold | 66.8 | 86.5 | % | 169.3 | 86.6 | % | (102.5 | ) | ||||||||||||
|
|
|
|
|
| |||||||||||||||
Gross margin | 10.6 | 13.7 | % | 26.3 | 13.4 | % | (15.7 | ) | ||||||||||||
Selling, general and administrative expense | 20.4 | 26.5 | % | 23.6 | 12.1 | % | (3.2 | ) | ||||||||||||
Impairment of long-lived assets | - | -0.1 | % | 4.4 | 2.2 | % | (4.4 | ) | ||||||||||||
Restructuring and other expense | 6.3 | 8.0 | % | 1.6 | 0.8 | % | 4.7 | |||||||||||||
Joint Venture Transactions | - | -0.1 | % | (8.6 | ) | -4.4 | % | 8.6 | ||||||||||||
|
|
|
|
|
| |||||||||||||||
Operating income (loss) | $ | (16.1 | ) | -20.8 | % | $ | 5.3 | 2.7 | % | $ | (21.4 | ) | ||||||||
|
|
|
|
|
| |||||||||||||||
Net sales and operating highlights were as follows:
Net sales decreased $118.2 million from fiscal 2011, driven primarily by the deconsolidation of our former Automotive Body Panels operating segment during the fourth quarter of fiscal 2011. Excluding the impact of this transaction, net sales decreased $28.2 million, driven primarily by lower volumes in the Global Group operating segment.
Operating loss of $16.1 million represented a decrease of $21.4 million from operating income of $5.3 million in fiscal 2011, driven by the deconsolidation of our former Automotive Body Panels operating segment, higher restructuring charges, and lower volumes in the Global Group operating segment. Current year restructuring charges were primarily driven by professional fees resulting from our ongoing transformation efforts within Pressure Cylinders and severance accrued in connection with the previously announced closure of our Commercial Stairs business unit. Consistent with similar charges incurred in prior periods, the professional fees were not allocated to any of our operating segments.
Fiscal 2011 Compared to Fiscal 2010
Consolidated Operations
The following table presents consolidated operating results for the periods indicated.
| Fiscal Year Ended May 31, | ||||||||||||||||||||
| (Dollars in millions) | 2011 | % of Net sales | 2010 | % of Net sales | Increase/ (Decrease) | |||||||||||||||
Net sales | $ | 2,442.6 | 100.0 | % | $ | 1,943.0 | 100.0 | % | $ | 499.6 | ||||||||||
Cost of goods sold | 2,086.4 | 85.4 | % | 1,663.1 | 85.6 | % | 423.3 | |||||||||||||
|
|
|
|
|
| |||||||||||||||
Gross margin | 356.2 | 14.6 | % | 279.9 | 14.4 | % | 76.3 | |||||||||||||
Selling, general and administrative expense | 235.2 | 9.6 | % | 218.3 | 11.2 | % | 16.9 | |||||||||||||
Impairment of long-lived assets | 4.4 | 0.2 | % | 35.4 | 1.8 | % | (31.0 | ) | ||||||||||||
Restructuring and other expense | 2.6 | 0.1 | % | 4.2 | 0.2 | % | (1.6 | ) | ||||||||||||
Joint venture transactions | (10.4 | ) | -0.4 | % | - | 0.0 | % | (10.4 | ) | |||||||||||
|
|
|
|
|
| |||||||||||||||
Operating income | 124.4 | 5.1 | % | 22.0 | 1.1 | % | 102.4 | |||||||||||||
Miscellaneous income (expense) | 0.6 | 0.0 | % | 1.1 | 0.1 | % | (0.5 | ) | ||||||||||||
Interest expense | (18.8 | ) | -0.8 | % | (9.5 | ) | -0.5 | % | 9.3 | |||||||||||
Equity in net income of unconsolidated affiliates | 76.3 | 3.1 | % | 64.6 | 3.3 | % | 11.7 | |||||||||||||
Income tax expense | (58.5 | ) | -2.4 | % | (26.7 | ) | -1.4 | % | 31.8 | |||||||||||
|
|
|
|
|
| |||||||||||||||
Net earnings | 124.0 | 5.1 | % | 51.5 | 2.7 | % | 72.5 | |||||||||||||
Net earnings attributable to noncontrolling interest | (8.9 | ) | -0.4 | % | (6.3 | ) | -0.3 | % | (2.6 | ) | ||||||||||
|
|
|
|
|
| |||||||||||||||
Net earnings attributable to controlling interest | $ | 115.1 | 4.7 | % | $ | 45.2 | 2.3 | % | $ | 69.9 | ||||||||||
|
|
|
|
|
| |||||||||||||||
Net earnings attributable to controlling interest for fiscal 2011 were $115.1 million, an increase of $69.9 million from fiscal 2010.
Net sales increased $499.6 million from fiscal 2010 to $2,442.6 million. Higher volumes increased net sales by $271.3 million, most notably in our Steel Processing and Pressure Cylinders operating segments. Additionally, average selling prices increased over the prior fiscal year due to the higher cost of steel, favorably impacting net sales by $228.3 million in fiscal 2011. Selling prices were affected by the market price of steel, which averaged $680 per ton for fiscal 2011 as compared to an average of $549 per ton for fiscal 2010 (an increase of 24%).
Gross margin improved $76.3 million from fiscal 2010. The improvement in gross margin was primarily due to increased volumes in our Steel Processing and Pressure Cylinders operating segments, as well as an increase in the spread between average selling prices and the cost of steel, most notably in Steel Processing.
SG&A expense increased $16.9 million from fiscal 2010, primarily due to the impact of acquisitions and higher profit sharing and bonus expense, driven by the increase in net earnings during fiscal 2011.
Impairment charges decreased $31.0 million from fiscal 2010. Fiscal 2011 impairment charges of $4.4 million were comprised of the impairment of certain long-lived assets within our Global Group operating segment ($2.5 million) and our Steel Packaging operating segment ($1.9 million). This compares to impairment charges of $35.4 million in fiscal 2010, consisting primarily of the impairment of goodwill and other long-lived assets of our Commercial Stairs business unit reported as part of our then Construction Services operating segment ($32.7 million) as well as the impairment of certain long-lived assets within our Steel Packaging operating segment ($2.7 million). For additional information regarding these impairment charges, refer to “Item 8. – Financial Statements and Supplementary Data – Notes to Consolidated Financial Statements – Note P – Fair Value Measurements.”
Restructuring and other expense decreased $1.6 million from fiscal 2010. Substantially all of the activity in both fiscal 2011 and fiscal 2010 was associated with the Transformation Plan, which continued to progress through the remaining steel processing facilities as well as the metal framing facilities that are now part of ClarkDietrich. Restructuring charges incurred in fiscal 2011 consisted primarily of employee severance and facility exit costs. Restructuring charges incurred in fiscal 2010 also consisted of employee severance and facility exit costs as well as professional fees. For additional information regarding these restructuring charges, refer to “Item 8. – Financial Statements and Supplementary Data – Notes to Consolidated Financial Statements – Note D –Restructuring and Other Expense.”
Fiscal 2011 operating income was also favorably impacted by a one-time net gain of $10.4 million related to the contribution of certain net assets to our newly formed joint ventures, Artiflex and ClarkDietrich, and the corresponding deconsolidations of Gerstenslager and Dietrich. A one-time gain of approximately $8.6 million was recognized in connection with the deconsolidation of Gerstenslager, which was recorded net of impairment charges of approximately $6.4 million related to certain long-lived assets retained in the transaction. Similarly, a one-time gain of approximately $1.8 million was recognized in connection with the deconsolidation of Dietrich, which was recorded net of impairment charges of approximately $18.3 million and restructuring charges of approximately $11.2 million incurred in connection with the metal framing facilities retained. For additional information regarding the items classified as joint venture transactions in our consolidated statements of earnings, refer to “Item 8. – Financial Statements and Supplementary Data – Notes to Consolidated Financial Statements – Note A – Summary of Significant Accounting Policies.”
Interest expense increased $9.3 million from fiscal 2010 primarily due to higher interest rates as a result of the April 2010 issuance of 6.50% notes due April 15, 2020 with an aggregate principal amount of $150.0 million. Higher debt levels driven by acquisitions, share repurchases and increased working capital needs also contributed to the increase in interest expense in fiscal 2011.
Equity in net income of unconsolidated affiliates increased $11.7 million from fiscal 2010. The majority of our equity in net income of unconsolidated affiliates is attributed to our WAVE joint venture, where net income increased 7% from fiscal 2010. Four other joint ventures, TWB Company, Worthington Specialty Processing, Serviacero Worthington and Samuel Steel Pickling all contributed earnings and showed a combined improvement of $5.1 million over fiscal 2010. ClarkDietrich also contributed to the fiscal 2011 increase, providing $2.1 million of equity income
since its formation on March 1, 2011. For additional information regarding our unconsolidated affiliates, refer to “Item 8. – Financial Statements and Supplementary Data – Notes to Consolidated Financial Statements – Note B – Investments in Unconsolidated Affiliates.” |
Income tax expense increased $31.8 million from fiscal 2010. Fiscal 2011 income tax expense reflects an effective tax rate attributable to controlling interest of 33.7% versus 37.1% in fiscal 2010. These rates are calculated based on net earnings attributable to controlling interest, as reflected in our consolidated statements of earnings. The decrease in the effective tax rate attributable to controlling interest was due primarily to (i) various changes in the estimated valuation of deferred taxes, including a $3.0 million valuation allowance recorded during fiscal 2010 related to net operating losses previously reported in state income tax filings, and (ii) the change in the mix of income among the jurisdictions in which we do business, partially offset by the impact of a fiscal 2010 tax benefit associated with the previously mentioned impairment charges. The 33.7% rate is lower than the federal statutory rate of 35.0% primarily as a result of the benefits from lower tax rates on foreign income and the qualified production activities deduction (collectively decreasing the rate by 4.1%). These impacts were partially offset by state and local income taxes of 2.8% (net of their federal tax benefit). For additional information regarding the deviation from statutory income tax rates, refer to “Item 8. – Financial Statements and Supplementary Data – Notes to Consolidated Financial Statements – Note K – Income Taxes.”
Segment Operations
Steel Processing
The following table presents a summary of operating results for our Steel Processing operating segment for the periods indicated:
| Fiscal Year Ended May 31, | ||||||||||||||||||||
| (Dollars in millions) | 2011 | % of Net sales | 2010 | % of Net sales | Increase/ (Decrease) | |||||||||||||||
Net sales | $ | 1,405.5 | 100.0 | % | $ | 989.0 | 100.0 | % | $ | 416.5 | ||||||||||
Cost of goods sold | 1,216.5 | 86.6 | % | 853.2 | 86.3 | % | 363.3 | |||||||||||||
|
|
|
|
|
| |||||||||||||||
Gross margin | 189.0 | 13.4 | % | 135.8 | 13.7 | % | 53.2 | |||||||||||||
Selling, general and administrative expense | 111.6 | 7.9 | % | 84.9 | 8.6 | % | 26.7 | |||||||||||||
Restructuring and other income | (0.3 | ) | 0.0 | % | (0.5 | ) | -0.1 | % | 0.2 | |||||||||||
|
|
|
|
|
| |||||||||||||||
Operating income | $ | 77.7 | 5.5 | % | $ | 51.4 | 5.2 | % | $ | 26.3 | ||||||||||
|
|
|
|
|
| |||||||||||||||
Material cost | $ | 1,001.9 | $ | 685.3 | $ | 316.6 | ||||||||||||||
Tons shipped (in thousands) | 2,589 | 2,055 | 534 | |||||||||||||||||
Net sales and operating highlights were as follows:
Net sales increased by $416.5 million from fiscal 2010 to $1,405.5 million. Direct and toll volume increased 25% and 27%, respectively, accounting for $256.3 million of the increase in net sales during fiscal 2011. The increase in volume was driven by stronger economic conditions, especially in the automotive end market. Additionally, higher base material prices in fiscal 2011 led to increased pricing for our products, favorably impacting net sales by $160.2 million over fiscal 2010.
Operating income increased by $26.3 million from fiscal 2010 to $77.7 million. Higher volumes, aided by the impact of acquisitions, improved operating income by $53.9 million. The impact of higher volumes, however, was partially offset by higher manufacturing expenses. Additionally, SG&A expense increased $26.7 million during fiscal 2011 due to higher profit sharing and bonus expenses, the impact of acquisitions and an increase in the portion of allocated corporate expenses.
Pressure Cylinders
The following table presents a summary of operating results for our Pressure Cylinders operating segment for the periods indicated:
| Fiscal Year Ended May 31, | ||||||||||||||||||||
| (Dollars in millions) | 2011 | % of Net sales | 2010 | % of Net sales | Increase/ (Decrease) | |||||||||||||||
Net sales | $ | 591.9 | 100.0 | % | $ | 467.6 | 100.0 | % | $ | 124.3 | ||||||||||
Cost of goods sold | 474.8 | 80.2 | % | 376.0 | 80.4 | % | 98.8 | |||||||||||||
|
|
|
|
|
| |||||||||||||||
Gross margin | 117.1 | 19.8 | % | 91.6 | 19.6 | % | 25.5 | |||||||||||||
Selling, general and administrative expense | 68.1 | 11.5 | % | 61.2 | 13.1 | % | 6.9 | |||||||||||||
Restructuring and other expense | - | 0.0 | % | 0.3 | 0.1 | % | (0.3 | ) | ||||||||||||
|
|
|
|
|
| |||||||||||||||
Operating income | $ | 49.0 | 8.3 | % | $ | 30.1 | 6.4 | % | $ | 18.9 | ||||||||||
|
|
|
|
|
| |||||||||||||||
Material cost | $ | 273.9 | $ | 208.3 | $ | 65.6 | ||||||||||||||
Units shipped (in thousands) | 59,037 | 55,436 | 3,601 | |||||||||||||||||
Net sales and operating highlights were as follows:
Net sales increased by $124.3 million from fiscal 2010 to $591.9 million. Higher volumes increased net sales by $92.2 million driven by the continued recovery in the European industrial gas and automotive markets, stable market conditions in our North American operations and the impact of acquisitions. Additionally, higher overall pricing for our products increased net sales by $32.1 million over fiscal 2010.
Operating income increased $18.9 million from fiscal 2010 to $49.0 million. Strong results from our North American operations, and the improvement and return to profitability of our European operations were the primary drivers of the increase in fiscal 2011 operating income. SG&A expense increased $6.9 million in fiscal 2011 mainly due to higher profit sharing and bonus expenses, the impact of acquisitions and an increase in the portion of allocated corporate expenses.
Metal Framing
The following table summarizes the operating results of our Metal Framing operating segment for the periods indicated. The operating results of the net assets contributed to the ClarkDietrich joint venture are included on a historical basis through March 1, 2011, the date of deconsolidation.
| Fiscal Year Ended May 31, | ||||||||||||||||||||
| (Dollars in millions) | 2011 | % of Net sales | 2010 | % of Net sales | Increase/ (Decrease) | |||||||||||||||
Net sales | $ | 249.5 | 100.0 | % | $ | 330.6 | 100.0 | % | $ | (81.1 | ) | |||||||||
Cost of goods sold | 225.8 | 90.5 | % | 294.6 | 89.1 | % | (68.8 | ) | ||||||||||||
|
|
|
|
|
| |||||||||||||||
Gross margin | 23.7 | 9.5 | % | 36.0 | 10.9 | % | (12.3 | ) | ||||||||||||
Selling, general and administrative expense | 31.6 | 12.7 | % | 42.3 | 12.8 | % | (10.7 | ) | ||||||||||||
Restructuring and other expense | 1.4 | 0.6 | % | 3.9 | 1.2 | % | (2.5 | ) | ||||||||||||
Joint venture transactions | (1.8 | ) | -0.7 | % | - | 0.0 | % | 1.8 | ||||||||||||
|
|
|
|
|
| |||||||||||||||
Operating loss | $ | (7.5 | ) | -3.0 | % | $ | (10.2 | ) | -3.1 | % | $ | 2.7 | ||||||||
|
|
|
|
|
| |||||||||||||||
Material cost | $ | 161.0 | $ | 200.2 | $ | (39.2 | ) | |||||||||||||
Tons shipped (in thousands) | 184 | 278 | (94 | ) | ||||||||||||||||
Net sales and operating highlights were as follows:
Net sales decreased by $81.1 million from fiscal 2010 to $249.5 million. A 34% decline in volumes, driven by the contribution of our metal framing business to ClarkDietrich as well as depressed levels of demand in the commercial and residential construction markets, reduced net sales by $111.9 million. Higher base material prices led to increased pricing for our products, favorably impacting net sales by $30.8 million.
Operating loss decreased $2.7 million from fiscal 2010 to $7.5 million. Gross margin decreased $12.3 million in fiscal 2011 driven by lower volumes due to the contribution of our metal framing business to ClarkDietrich as well as depressed levels of demand. The impact of the decrease in gross margin during fiscal 2011 was partially mitigated by a $10.7 million decrease in SG&A expense, also driven by lower volumes.
Additionally, a one-time net gain of $1.8 million recognized in connection with the deconsolidation of certain net assets of Dietrich also favorably impacted fiscal 2011 operating results. This gain was recorded net of impairment and restructuring charges incurred in connection with certain metal framing facilities retained of $18.3 million and $11.2 million, respectively. For additional information regarding the items classified as joint venture transactions in our consolidated statements of earnings, refer to “Item 8. – Financial Statements and Supplementary Data – Notes to Consolidated Financial Statements – Note A – Summary of Significant Accounting Policies.”
Other
The Other category includes our Steel Packaging and Global Group operating segments, which do not meet the materiality tests for purposes of separate disclosure, as well as certain income and expense items not allocated to our operating segments. The Other category also includes the results of our former Automotive Body Panels operating segment, on a historical basis, through May 9, 2011, the date of deconsolidation. The following table presents a summary of operating results for the Other operating segments for the periods indicated:
| Fiscal Year ended May 31, | Fiscal Year Ended May 31, | |||||||||||||||||||||||||||||||||||||
| Dollars in millions | 2008 | % of Net sales | 2007 | % of Net sales | Increase/ (Decrease) | |||||||||||||||||||||||||||||||||
| (Dollars in millions) | 2011 | % of Net sales | 2010 | % of Net sales | Increase/ (Decrease) | |||||||||||||||||||||||||||||||||
Net sales | $ | 236.4 | 100.0 | % | $ | 194.9 | 100.0 | % | $ | 41.5 | $ | 195.6 | 100.0 | % | $ | 155.9 | 100.0 | % | $ | 39.7 | ||||||||||||||||||
Cost of goods sold | 211.9 | 89.6 | % | 174.2 | 89.4 | % | 37.7 | 169.3 | 86.8 | % | 139.5 | 89.5 | % | 29.8 | ||||||||||||||||||||||||
|
|
| ||||||||||||||||||||||||||||||||||||
Gross margin | 24.5 | 10.4 | % | 20.7 | 10.6 | % | 3.8 | 26.3 | 13.4 | % | 16.4 | 10.5 | % | 9.9 | ||||||||||||||||||||||||
Selling, general and administrative expense | 20.2 | 8.5 | % | 22.4 | 11.5 | % | (2.2 | ) | 23.6 | 12.2 | % | 29.8 | 19.1 | % | (6.2 | ) | ||||||||||||||||||||||
Restructuring charges | 7.9 | 3.3 | % | - | 0.0 | % | 7.9 | |||||||||||||||||||||||||||||||
Impairment of long-lived assets | 4.4 | 2.1 | % | 35.4 | 22.7 | % | (31.0 | ) | ||||||||||||||||||||||||||||||
Restructuring and other expense | 1.6 | 0.7 | % | 0.5 | 0.3 | % | 1.1 | |||||||||||||||||||||||||||||||
Joint venture transactions | (8.6 | ) | -4.5 | % | - | 0.0 | % | (8.6 | ) | |||||||||||||||||||||||||||||
|
|
| ||||||||||||||||||||||||||||||||||||
Operating loss | $ | (3.6 | ) | -1.5 | % | $ | (1.7 | ) | -0.9 | % | $ | (1.9 | ) | |||||||||||||||||||||||||
Operating income (loss) | $ | 5.3 | 2.7 | % | $ | (49.3 | ) | -31.6 | % | $ | 54.6 | |||||||||||||||||||||||||||
|
|
| ||||||||||||||||||||||||||||||||||||
Net sales and operating loss highlights were as follows:
The $41.5Net sales increased $39.7 million net sales increase in fiscal 2008 was almost entirely attributable2011 to $195.6 million, as volumes across all operating segments increased. Construction-related business units within the Construction Services businessGlobal Group operating segment, drivenhowever, were negatively affected by higher volumesthe weakness in the militarycommercial construction group.market.
TheOperating income improved $54.6 million from fiscal 2010 to $5.3 million. An increase in gross margin during fiscal 2011, aided by improvements in most operating loss widenedsegments, favorably impacted operating income by $1.9$9.9 million. Additionally, impairment charges decreased $31.0 million versus fiscal 2007 due to $7.9from
fiscal 2010. Fiscal 2011 impairment charges of $4.4 million were comprised of the impairment of certain long-lived assets within our Global Group operating segment ($2.5 million) and our Steel Packaging operating segment ($1.9 million). This compares to impairment charges of $35.4 million in fiscal 2010, consisting primarily of the impairment of goodwill and other long-lived assets of our previously reported Construction Services operating segment ($32.7 million) as well as the impairment of certain long-lived assets within our Steel Packaging operating segment ($2.7 million). |
Fiscal 2011 operating income was also favorably impacted by a one-time net gain of $8.6 million recognized in restructuring charges. Theseconnection with the deconsolidation of Gerstenslager. This gain was recorded net of impairment charges included professional fees and early retirement and severance costs largelyof approximately $6.4 million related to corporate employees. Gross margin improved $3.8 million duecertain long-lived assets of Gerstenslager that were retained. For additional information regarding the items classified as joint venture transactions in our consolidated statements of earnings, refer to the operating performance“Item 8. – Financial Statements and Supplementary Data – Notes to Consolidated Financial Statements – Note A –Summary of the Construction Services business segment, which improved significantly over fiscal 2007 due to a combination of higher volumes in the military construction group and stronger margins for the mid-rise construction projects.Significant Accounting Policies.”
Liquidity and Capital Resources
CashDuring fiscal 2012, we generated $173.7 million in cash from operating activities, received $37.1 million of proceeds from the sale of assets, invested $31.7 million in property, plant and equipment and spent $239.9 million on acquisitions, net of cash equivalents atacquired. Additionally, we repurchased 4,466,970 of our common shares for $73.4 million and paid $32.1 million of dividends. These activities were funded with $97.6 million of short-term borrowings as well as the end of fiscal 2009 decreased $17.5cash generated from operating activities and a $50.0 million compared to the end of fiscal 2008.one-time special dividend from our WAVE joint venture. The following table summarizes our consolidated cash flows.flows for each period shown:
| Fiscal Years Ended May 31, | Fiscal Years Ended May 31, | |||||||||||||||
Cash Flow Summary (in millions) | 2009 | 2008 | ||||||||||||||
| (in millions) | 2012 | 2011 | ||||||||||||||
Net cash provided by operating activities | $ | 254.3 | $ | 180.5 | $ | 173.7 | $ | 71.9 | ||||||||
Net cash used by investing activities | (53.3 | ) | (70.7 | ) | (188.6 | ) | (39.3 | ) | ||||||||
Net cash used by financing activities | (218.5 | ) | (74.3 | ) | (0.2 | ) | (35.4 | ) | ||||||||
|
| |||||||||||||||
Increase (decrease) in cash and cash equivalents | (17.5 | ) | 35.5 | |||||||||||||
Decrease in cash and cash equivalents | (15.1 | ) | (2.8 | ) | ||||||||||||
Cash and cash equivalents at beginning of period | 73.8 | 38.3 | 56.2 | 59.0 | ||||||||||||
|
| |||||||||||||||
Cash and cash equivalents at end of period | $ | 56.3 | $ | 73.8 | $ | 41.0 | $ | 56.2 | ||||||||
|
| |||||||||||||||
We believe we have access to adequate resources to meet our needs for normal operating costs, mandatory capital expenditures, mandatory debt redemptions, dividend payments and working capital for our existing businesses. These resources include cash and cash equivalents, cash provided by operating activities and unused lines of credit. GivenWe also believe we have adequate access to the financial markets to allow us to be in a position to sell long-term debt or equity securities. However, given the current uncertainty and volatility in the financial markets, our ability to access capital and the terms under which we can do so may change. Should
On July 3, 2012, we reached an agreement in principal to issue up to $150.0 million aggregate principal amount of senior unsecured notes in a private placement offering. These notes will mature 12 years from the Company be requiredissuance date and will bear interest at a rate of 4.60%. We expect to raise capital incomplete this environment, potential outcomes might include higher borrowing costs, lessprivate placement offering during the first quarter of fiscal 2013.
The cash and equivalents balance at May 31, 2012 included $29.5 million of cash held by subsidiaries outside of the United States. Although the majority of this cash is available capital, more stringent termsfor repatriation, bringing the money into the United States could trigger federal, state and tighter covenants, or in extreme conditions, an inabilitylocal income tax obligations. We do not have any intentions to raise capital.repatriate cash held by subsidiaries outside of the United States.
Operating activities
Our business is cyclical and cash flows from operating activities may fluctuate during the year and from year-to-yearyear to year due to economic and industry conditions. We rely on cash and short-term financingborrowings to meet cyclical increases in working capital needs. Cash requirementsThese needs generally rise during periods of increased economic activity or increasing raw material prices due to higher levels of inventory and accounts receivable. During economic slowdowns, or periods of decreasing raw material costs, cash requirementsworking capital needs generally decrease as a result of the reduction of inventories and accounts receivable. With lower cash requirements, we are typically able to reduce, or eliminate, short-term debt.
Net cash provided by operating activities was $254.3$173.7 million and $180.5during fiscal 2012 compared to $71.9 million in fiscal 2009 and fiscal 2008, respectively. A significant amount of cash2011. The difference was generated in fiscal 2009driven largely by a large decreasechange in net working capital. Inventories, receivables andthe classification of proceeds from our revolving trade accounts payable all decreased significantly due to lower current and projected sales volumes, coupled with lower raw material costs. Consolidated netreceivable securitization facility (the “AR Facility”) as short-term borrowings effective June 1, 2010 as well as overall changes in working capital was $226.9needs. Proceeds received from the AR Facility prior to June 1, 2010, were recorded as a reduction of accounts receivable. As a result, the $45.0 million of borrowings outstanding under the AR Facility at May 31, 2009, compared to $440.12010 were recorded as a reduction of accounts receivable, whereas the $135.0 million and $90.0 million of borrowings outstanding at May 31, 2008.
We review our receivables on an ongoing basis to ensure that they are properly valued. Based on this review, we have increased our allowances by $7.6 million to $12.5 million since May 31, 2008. This increase is principally tied to customers in the automotive industry;2012 and based on our current information, we believe our allowances are sized appropriately. However, if the economic environment and market conditions do not improve, particularly in the automotive and construction markets where our exposure is greatest, additional reserves may be required.
As noted above, while an economic slowdown adversely affects sales, it generally decreases working capital needs. As the impact or ramifications of the current economic slowdown become known, we will continue to adjust operating activities and cash needs accordingly.2011, respectively, were classified as short-term borrowings.
Investing activities
Net cash used by investing activities was $53.3$188.6 million and $70.7$39.3 million in fiscal 20092012 and fiscal 2008,2011, respectively. This increase of $149.3 million was caused by several factors, as explained below.
Capital expenditures by reportable business segment representreflect cash used for investment in property, plant and equipment and are presented below:below by reportable business segment (this information excludes cash flows related to acquisition and divestiture activity):
| Fiscal Year Ended May 31, | Fiscal Year Ended May 31, | |||||||||||||
| In millions | 2009 | 2008 | ||||||||||||
| (in millions) | 2012 | 2011 | ||||||||||||
Steel Processing | $ | 25.0 | $ | 7.2 | $ | 9.7 | $ | 6.1 | ||||||
Pressure Cylinders | 8.5 | 10.0 | ||||||||||||
Engineered Cabs | 4.6 | - | ||||||||||||
Metal Framing | 4.5 | 6.8 | - | 1.1 | ||||||||||
Pressure Cylinders | 26.6 | 16.5 | ||||||||||||
Other | 8.1 | 17.0 | 8.9 | 4.8 | ||||||||||
|
| |||||||||||||
Total Capital Expenditures | $ | 31.7 | $ | 22.0 | ||||||||||
| $ | 64.2 | $ | 47.5 |
|
| |||||||||
The Steel Processing business segment capitalCapital expenditures increased $17.8$9.7 million in fiscal 2009 compared to fiscal 2008,2012 due primarily to capacity expansion at our Delta, Ohio, steel galvanizing plant.activity associated with the addition of Angus and the purchase of an aircraft.
The Pressure Cylinders business segment capital expenditures increased $10.1 millionWe also used more cash for acquisitions in fiscal 2009 compared to fiscal 2008, due to an upgrade of2012, as the capabilities at our Austrian Pressurecash consideration paid for PSI, Angus, Coleman Cylinders, facility.
Capital expendituresBernz and STAKO in the current year was $208.1 million more than the aggregate price paid for the Other category decreased $8.9 millionassets of Hy-Mark and our 60% ownership interest in WNCL in fiscal 2009 compared to fiscal 2008. This was due primarily to decreased expenditures related to our enterprise resource planning system, based on2011. Partially offsetting the stage of the project, as well as decreases resulting from completion of other various projects and a conscious effort to reduce spendingoverall increase in this area.
Net cash used by investing activities decreased $17.4were $45.9 million during fiscal 2009 compared to fiscal 2008. This was due primarily to the fiscal 2009 receipt of distributions from an unconsolidated joint venture in excess of the Company’s cumulative equity in the earnings of that joint venture. This cash flow of $23.5 million was included in investing activities in the consolidated statements of cash flows due to the nature of the distribution as a return of investment, rather than a return on investment. Distributions from unconsolidated joint ventures that did not exceed the Company’s cumulative equity in the earnings of respective joint ventures are included as operating cash flows in the consolidated statements of cash flows. In fiscal year 2008, there were nonet distributions from unconsolidated affiliates driven by the $50.0 million one-time dividend from our WAVE joint ventures classified as investing cash flows. In fiscal 2009, lower acquisitions/investments also combined with higherventure. Higher proceeds from the sale of assets, which increased by $16.5 million in fiscal 2012, also helped to partially offset the year-over-year increase in capital spending noted above. The cash used in our acquisitionby investing activities. Current year asset disposals resulted primarily from the wind down of the assets of The Sharon Companies Ltd. in fiscal 2009 was slightly less than the cash used in the fiscal 2008 investment in the Serviacero Worthington joint venture. Additionally, the proceeds from the sale of our investments in the Aegis, Slovakia and ABT joint ventures, as well as the sales of other assets in fiscal 2009, were slightly higher than the proceeds received from the sale of short-term investments in fiscal 2008.retained metal framing facilities.
Investment activities are largely discretionary and future investment activities could be reduced significantly or eliminated as economic conditions warrant. We assess acquisition opportunities as they arise, and such opportunities may require additional financing. There can be no assurance, however, that any such opportunities will arise, that any such acquisitions will be consummated or that any needed additional financing will be available on satisfactory terms when required.
Financing activities
Net cash used by financing activities was $218.5$0.2 million and $74.3$35.4 million in fiscal 20092012 and fiscal 2008,2011, respectively. The increaseddecrease was driven primarily by common share repurchases, which declined $59.3 million in fiscal 2012, partially offset by lower net use of cash for financing activities of $144.2 million was largely driven by the payment of borrowings during fiscal 2009, versus the proceeds from issuanceshort-term borrowings. The $35.3 million decrease in fiscal 2008. The majoritynet proceeds from short-term borrowings resulted primarily from the repayment of that activity is reflecteddebt assumed in connection with the amounts outstanding under the revolving credit facility, as discussed below. The decreased levelacquisition of common share repurchase activity in fiscal 2009 compared to fiscal 2008, also discussed below, offsets, to some extent, the impact from net payments on borrowings.Angus.
Long-term debt –— Our senior unsecured long-term debt is rated “investment grade” by both Moody’s Investors Service, Inc. (Baa2) and Standard & Poor’s Ratings Group (BBB).Group. In January 2012, Standard & Poor’s reaffirmed their BBB stable rating. On March 28, 2012, Moody’s Investor Services downgraded its credit rating of Worthington from Baa2 to Baa3. We don’t anticipate that this will affect our borrowing rates under the current credit agreement as it provides for use of the higher rating in the event of a split. We typically use the net proceeds from long-term debt for acquisitions, refinancing outstanding debt, capital expenditures and general corporate purposes. As of May 31, 2009,2012, we were in compliance with our long-term debt covenants. Our long-term debt agreements do not include ratings triggers or material adverse change provisions.
Subsequent to May 31, 2009,On April 13, 2010, we completed a cash tender offer for our 6.7%issued $150.0 million aggregate principal amount of senior notes due December 1, 2009.April 15, 2020 (the “2020 Notes”). The Company purchased $118.5 million2020 Notes bear interest at a rate of 6.50%. The 2020 Notes were sold to the public at 99.890% of the principal amount thereof, to yield 6.515% to maturity. We used the net proceeds from the offering to repay a portion of the then $138.0 millionoutstanding borrowings under our revolving credit facility and amounts then outstanding under our revolving trade accounts receivable securitization facility. The proceeds on the issuance of the 2020 Notes were reduced for debt discount ($0.2 million), payment of debt issuance costs ($1.5 million) and settlement of a hedging instrument entered into in anticipation of the issuance of the 2020 Notes ($1.4 million).
In connection with the acquisition of Angus Industries, Inc. (“Angus”) on December 29, 2011, we assumed industrial revenue bonds (“IRBs”) issued by the South Dakota Economic Development Finance Authority that had outstanding principal amount.balances of $0.6 million and $2.5 million and mature in March 2013 (the “2013 IRBs”) and April 2019 (the “2019 IRBs”), respectively. The consideration paid2013 IRBs bear interest at rates between 3.75% and 5.25% and the 2019 IRBs bear interest at rates between 2.75% and 5.00%.
On April 27, 2012, we executed a $5.9 million seven-year term loan that matures on May 1, 2019. The loan bears interest at a rate of 2.49% and is secured by an aircraft that was $1,025 per $1,000purchased with its proceeds.
On July 3, 2012, we reached an agreement in principal to issue up to $150.0 million aggregate principal amount plus accruedof senior unsecured notes in a private placement offering. These notes will mature 12 years from the issuance date and unpaid interest.will bear interest at a rate of 4.60%. We expect to complete this private placement offering during the first quarter of fiscal 2013.
Short-term debtborrowings – We maintain a $435.0 million revolving credit facility, which expires in May 2013, except for a $35.0 million commitment by one lender, which expires in September 2010. We were in compliance with our short-term debt covenants at May 31, 2009. Our short-term debt agreements do not include ratings triggers or material adverse change provisions. Current borrowings under thisWe were in compliance with our short-term debt covenants at May 31, 2012.
On May 4, 2012, we executed a new $425.0 million multi-year revolving credit facility (the “Credit Facility”) with a group of lenders that matures in May 2017. The Credit Facility replaced our $400.0 million
facility that was set to expire in May 2013. Borrowings under the Credit Facility have maturities of less than one year and given that we intendour intention has been to repay them within the nexta year, they have been classified as notes payable.short-term borrowings within current liabilities on our consolidated balance sheets. However, we can also extend the term of amounts borrowed by renewing these borrowings for the term of the facility.Credit Facility. We have the option to borrow at rates equal to an applicable margin over the LIBOR, Prime or Fed Funds rates. The applicable margin is determined by our credit rating. At May 31, 2009,2012, $135.6 million of borrowings were outstanding under the revolving credit facilityCredit Facility and bore interest at rates based on LIBOR. We had $434.0 million available to us under this facilityThe average variable rate was 1.29% at May 31, 2009, compared to $309.6 million available to us at May 31, 2008.
Our most restrictive debt covenants require us to maintain an interest coverage ratio (adjusted EBITDA divided by interest expense, on a trailing 12-month basis) of at least 3.25 times and a consolidated indebtedness to capitalization ratio of not more than 55%. These covenants are tested at the end of each fiscal quarter. At May 31, 2009, the interest coverage ratio was 8.72 times and the consolidated indebtedness to capitalization ratio was 32%.2012.
We also have a $100.0 million revolving trade accounts receivable securitization facility, of which $60.0 million was utilized at May 31, 2009, and $100.0 million at May 31, 2008. See the description that follows under “Off-Balance Sheet Arrangements.” The securitization facility is backed by a committed liquidity facility that expires during January 2011.
We also provided $8.3approximately $11.0 million in letters of credit for third-party beneficiaries as of May 31, 2009.2012. The letters of credit secure potential obligations to certain bond and insurance providers. These letters can be drawn at any time at the option of the beneficiaries.beneficiaries, and while not drawn against at May 31, 2012 or 2011, these letters of credit are issued against and therefore reduce availability under the Credit Facility. We had $278.4 million available to us under the Credit Facility at May 31, 2012, compared to $349.5 million available to us under our prior credit facility at May 31, 2011.
We also maintain a revolving trade accounts receivable securitization facility, which expires in January 2013. The AR Facility was available throughout fiscal 2012 and fiscal 2011. During the third quarter of fiscal 2012, we increased our borrowing capacity under the AR Facility from $100.0 million to $150.0 million. Pursuant to the terms of the AR Facility, certain of our subsidiaries sell their accounts receivable without recourse, on a revolving basis, to Worthington Receivables Corporation (“WRC”), a wholly-owned, consolidated, bankruptcy-remote subsidiary. In turn, WRC may sell without recourse, on a revolving basis, up to $150.0 million of undivided ownership interests in this pool of accounts receivable to a multi-seller, asset-backed commercial paper conduit (the “Conduit”). Purchases by the Conduit are financed with the sale of A1/P1 commercial paper. We retain an undivided interest in this pool and are subject to risk of loss based on the collectability of the receivables from this retained interest. Because the amount eligible to be sold excludes receivables more than 90 days past due, receivables offset by an allowance for doubtful accounts due to bankruptcy or other cause, and concentrations over certain limits with specific customers and certain reserve amounts, we believe additional risk of loss is minimal. The book value of the retained portion of the pool of accounts receivable approximates fair value. As of May 31, 2012, the pool of eligible accounts receivable exceeded the $150.0 million limit and $135.0 million of undivided ownership interests in this pool of accounts receivable had been sold.
We also maintain a $9.5 million credit facility, through our consolidated joint venture, WNCL, that matures in November 2012. This credit facility bears interest at a variable rate, which was 2.50% at May 31, 2012.
Common shares – We maintained ourdeclared quarterly dividend declared during the first three quartersdividends of $0.12 per common share for each quarter of fiscal 2009 at $0.17 per common share. The dividend declared during the fiscal quarter ended May 31, 2009 was reduced2012 compared to $0.10 per common share.share for each quarter of fiscal 2011. We paid dividends on our common shares of $53.7$32.1 million and $55.6$30.2 million in fiscal 20092012 and fiscal 2008,2011, respectively.
At its meeting onOn September 27, 2006,26, 2007, the Board authorized the repurchase of Directors of Worthington Industries reconfirmed its authorization to repurchase up to 10,000,000 of Worthington’sour outstanding common shares of which had initially been announced on494,802 common shares remained available for repurchase at May 31, 2011. On June 13, 2005. This repurchase authorization was completed during December 2007. On September 26, 2007, Worthington announced that29, 2011, the Board of Directors had authorized the repurchase of up to an additional 10,000,000 of Worthington’sour outstanding common shares. Ashares, increasing the total number of 8,449,500 common shares remained available for repurchase to 10,494,802.
During fiscal 2012, we repurchased 4,466,970 of our common shares for $73.4 million, exhausting all of the common shares available for repurchase under thisthe September 26, 2007 authorization and leaving 6,027,832 of common shares available for repurchase authorization as of May 31, 2009. under the June 29, 2011 authorization.
The common shares available for repurchase under this authorizationthese authorizations may be purchased from time to time, with consideration given to the market price of the common shares, the nature of other investment opportunities, cash flows from operations, general economic conditions and other relevant considerations. Repurchases may be made on the open market or through privately negotiated transactions. During fiscal 2009 and fiscal 2008, we spent $12.4 million and $125.8 million, respectively, on common share repurchases.
Dividend Policy
We currently have no material contractual or regulatory restrictions on the payment of dividends. Dividends are declared at the discretion of theour Board of Directors of Worthington.Directors. The Board reviews the dividend quarterly and establishes the dividend rate based upon our financial condition, results of operations, capital requirements, current and projected cash flows, business prospects and other relevant factors. While we have paid a dividend every quarter since becoming a public company in 1968, there is no guarantee that this will continue in the future.
Contractual Cash Obligations and Other Commercial Commitments
The following table summarizes our contractual cash obligations as of May 31, 2009.2012. Certain of these contractual obligations are reflected onin our consolidated balance sheet, while others are disclosed as future obligations under accounting principles generally accepted in the United States.accordance with U.S. GAAP.
| Payments Due by Period | Payments Due by Period | ||||||||||||||||||||||||||||||||||
| In millions | Total | Less Than 1 Year | 1 - 3 Years | 4 - 5 Years | After 5 Years | ||||||||||||||||||||||||||||||
Notes payable | $ | 1.0 | $ | 1.0 | $ | - | $ | - | $ | - | |||||||||||||||||||||||||
Current maturities of long-term debt | 138.0 | 138.0 | - | - | - | ||||||||||||||||||||||||||||||
| (in millions) | Total | Less Than 1 Year | 1 - 3 Years | 4 - 5 Years | After 5 Years | ||||||||||||||||||||||||||||||
Short-term borrowings | $ | 274.9 | $ | 274.9 | $ | - | $ | - | $ | - | |||||||||||||||||||||||||
Long-term debt | 100.4 | - | - | 0.2 | 100.2 | 258.8 | 1.3 | 102.4 | 2.5 | 152.6 | |||||||||||||||||||||||||
Interest expense on long-term debt | 32.0 | 5.3 | 10.7 | 10.7 | 5.3 | 95.0 | 15.3 | 30.5 | 19.8 | 29.4 | |||||||||||||||||||||||||
Operating leases | 45.1 | 11.1 | 17.2 | 10.5 | 6.3 | 27.5 | 9.3 | 7.8 | 4.8 | 5.6 | |||||||||||||||||||||||||
Unconditional purchase obligations | 23.7 | 2.4 | 4.7 | 4.7 | 11.9 | 16.6 | 2.4 | 4.7 | 4.7 | 4.8 | |||||||||||||||||||||||||
Royalty obligations | 12.0 | 2.0 | 4.0 | 4.0 | 2.0 | ||||||||||||||||||||||||||||||
|
|
|
|
| |||||||||||||||||||||||||||||||
Total contractual cash obligations | $ | 340.2 | $ | 157.8 | $ | 32.6 | $ | 26.1 | $ | 123.7 | $ | 684.8 | $ | 305.2 | $ | 149.4 | $ | 35.8 | $ | 194.4 | |||||||||||||||
|
|
|
|
| |||||||||||||||||||||||||||||||
The interestInterest expense on long-term debt is computed by using the fixed rates of interest on the debt, including impacts of the related interest rate hedge. The unconditionalUnconditional purchase obligations are to secure access to a facility used to regenerate acid used in our Steel Processing facilitiesoperating segment through the fiscal year ending May 31, 2019. Royalty obligations relate to a trademark license agreement executed in connection with the acquisition of Coleman Cylinders in fiscal 2012. For additional information regarding this agreement, refer to “Item 8. – Financial Statements and Supplementary Data – Notes to Consolidated Financial Statements – NOTE E – Contingent Liabilities and Commitments” of this Annual Report on Form 10-K. Due to the uncertainty regarding the timing of future cash outflows associated with our unrecognized tax benefits of $3.9$4.4 million, we are unable to make a reliable estimate of the periods of cash settlement with the respective tax authorities and have not included suchthis amount in the contractual obligations table above.
During the fiscal quarter ended May 31, 2009, the Company redeemed $7.0 million of its then $145.0 million outstanding principal amount of 6.7% notes due December 1, 2009 (the “Notes”). Subsequent to May 31, 2009, we completed a cash tender offer for the Notes, redeeming an additional $118.5 million of outstanding principal amount. The consideration paid for the subsequent redemption was $1,025 per $1,000 principal amount, plus accrued and unpaid interest.
The following table summarizes our other commercial commitments as of May 31, 2009.2012. These commercial commitments are not reflected onin our consolidated balance sheet.
| Commitment Expiration by Period | Commitment Expiration by Period | ||||||||||||||||||||||||||||||||||
| In millions | Total | Less Than 1 Year | 1 - 3 Years | 4 - 5 Years | After 5 Years | ||||||||||||||||||||||||||||||
Guarantees (aircraft residual values) | $ | 17.9 | $ | 17.9 | $ | - | $ | - | $ | - | |||||||||||||||||||||||||
| (in millions) | Total | Less Than 1 Year | 1 - 3 Years | 4 - 5 Years | After 5 Years | ||||||||||||||||||||||||||||||
Guarantees | $ | 19.9 | $ | 14.9 | $ | - | $ | 5.0 | $ | - | |||||||||||||||||||||||||
Standby letters of credit | 8.3 | 8.3 | - | - | - | 11.0 | 10.4 | 0.6 | - | - | |||||||||||||||||||||||||
|
|
|
|
| |||||||||||||||||||||||||||||||
Total commercial commitments | $ | 26.2 | $ | 26.2 | $ | - | $ | - | $ | - | $ | 30.9 | $ | 25.3 | $ | 0.6 | $ | 5.0 | $ | - | |||||||||||||||
|
|
|
|
| |||||||||||||||||||||||||||||||
Off-Balance Sheet Arrangements
We maintain a $100.0 million revolving trade accounts receivable securitization facility which expires in January 2011. This facility was available throughout fiscal 2009 and fiscal 2008. Transactions under the facility have been accounted for as a sale under the provisions of SFAS No. 140,Accounting for Transfers and Servicing ofFinancial Assets and Extinguishments of Liabilities. Pursuant to the terms of the facility, certain of our subsidiaries sell their accounts receivable without recourse, on a revolving basis, to Worthington Receivables Corporation (“WRC”), a wholly-owned, consolidated, bankruptcy-remote subsidiary. In turn, WRC may sell without recourse, on a revolving basis, up to $100.0 million of undivided ownership interests in this pool of accounts receivable to a multi-sell, asset-backed commercial paper conduit (the “Conduit”). Purchases
by the Conduit are financed with the sale of A1/P1 commercial paper. We retain an undivided interest in this pool and are subject to risk of loss based on the collectability of the receivables from this retained interest. Because the amount eligible to be sold excludes receivables more than 90 days past due, receivables offset by an allowance for doubtful accounts because of bankruptcy or other cause, receivables from foreign customers, concentrations over limits with specific customers and certain reserve amounts, we believe additional risk of loss is minimal. The book value of the retained portion of the pool of accounts receivable approximates fair value. Accounts receivable sold under this facility are excluded from accounts receivable in the consolidated financial statements. As of May 31, 2009, the pool of eligible accounts receivable was $92.4 million, and $60.0 million of undivided ownership interests in this pool of accounts receivable had been sold.
We do not have guarantees or other off-balance sheet financing arrangements that we believe are reasonably likely to have a material current or future effect on our financial condition, changes in financial
condition, revenue or expenses, results of operations, liquidity, capital expenditures or capital resources. However, as of May 31, 2009, the Company was2012, we were party to an operating leaseslease for an aircraft in which the Company haswe have guaranteed a residual valuesvalue at the termination of the leases.lease. The maximum obligation under thesethe terms isof this guarantee was approximately $17.9$14.9 million at May 31, 2009.2012. We have also guaranteed the repayment of a $5.0 million term loan held by ArtiFlex, an unconsolidated joint venture. In addition, we had in place approximately $11.0 million of outstanding stand-by letters of credit as of May 31, 2012. These letters of credit were issued to third-party service providers and had no amounts drawn against them at May 31, 2012. Based on current facts and circumstances, the Company haswe have estimated the likelihood of payment pursuant to this guarantee,these guarantees, and determined that the fair value of theour obligation under each guarantee based on those likely outcomes is not material.
Recently Issued Accounting Standards
In September 2006,December 2011, new accounting guidance was issued that establishes certain additional disclosure requirements about financial instruments and derivatives instruments that are subject to netting arrangements. The new disclosures are required for annual reporting periods beginning on or after January 1, 2013, and interim periods within those periods. We do not expect the FASB issued SFAS No. 157,Fair Value Measurements, to establish a framework for measuring fair value and expand disclosures about fair value measurements. SFAS No. 157 was effective for financial assets and liabilities after May 31, 2008, and for non-financial assets and liabilities is effective after May 31, 2009. SFAS No. 157 has not had, and is not expectedadoption of this amended accounting guidance to have a material impact on our consolidated financial statements.position or results of operations.
In May 2011, amended accounting guidance was issued that resulted in common fair value measurements and disclosures under both U.S. GAAP and International Financial Reporting Standards. This amended guidance is explanatory in nature and does not require additional fair value measurements nor is it intended to result in significant changes in the application of current guidance. The amended guidance is effective for interim and annual periods beginning after December 2007,15, 2011. Our adoption of this amended accounting guidance on March 1, 2012, did not have a material impact on our financial position or results of operations.
In June 2011, new accounting guidance was issued regarding the FASB issued SFAS No. 141 (revised 2007) (“SFAS No. 141(R)”),Business Combinations,presentation of comprehensive income in financial statements prepared in accordance with U.S. GAAP. This new guidance requires entities to improvepresent reclassification adjustments included in other comprehensive income on the relevance, representational faithfulness and comparability of the information that a reporting entity provides in its financial reports about a business combination and its effects. SFAS No. 141(R) applies prospectively to business combinations after May 31, 2009, and will affect the accounting treatment of future acquisitions that we may consummate.
In December 2007, the FASB issued SFAS No. 160,Noncontrolling Interests In Consolidated Financial Statements – an amendment of ARB No. 51,to improve the relevance, comparability and transparencyface of the financial information that a reporting entity provides in its consolidated financial statements by establishing accounting and reporting standards forallows entities to present total comprehensive income, the noncontrolling interest (minority interest)components of net income and the components of other comprehensive income either in a subsidiary andsingle continuous statement of comprehensive income or in two separate but consecutive statements. It also eliminates the option for entities to present the deconsolidationcomponents of a subsidiary. SFAS No. 160other comprehensive income as part of the statement of equity. For public companies, this accounting guidance is effective for fiscal years (and interim periods within those fiscal years) beginning after December 15, 2011, with early adoption permitted. Retrospective application to prior periods is required. The adoption of this new guidance, effective for us on June 1, 2009, and2012, will require a change innot impact our financial position or results of operations. In December 2011, certain provisions of this new guidance related to the presentation of the minority interestreclassification adjustments out of accumulated other comprehensive income were temporarily deferred to a later date that has yet to be determined. We are in the consolidatedprocess of determining our method of presentation; however, we do not anticipate the adoption of this new accounting guidance will have a material impact on our financial statements.position or results of operations.
In April 2008, the FASBSeptember 2011, amended accounting guidance was issued FASB Staff Position (“FSP”) No. FAS 142-3,Determination of the Useful Life of Intangible Assets (“FSP No. 142-3”). FSP 142-3 amends thethat simplifies how an entity tests goodwill for impairment. The amended guidance allows an entity to first assess qualitative factors that should be considered in developing renewal or extension assumptions used to determine whether it is necessary to perform the useful lifetwo-step quantitative goodwill impairment test. The two-step quantitative impairment test is required only if, based on its qualitative assessment, an entity determines that it is more likely than not that the fair value of a recognized intangible asset under SFAS No. 142,Goodwill and Other Intangible Assets. FSP 142-3reporting unit is less than its carrying amount. The amended guidance is effective for financial statements issuedinterim and annual goodwill impairment tests performed for fiscal years beginning after December 15, 2008, as well as interim periods within those fiscal years. The adoption of this pronouncement will affect the accounting treatment of future acquisitions that we may consummate.
In November 2008, the FASB ratified EITF Issue 08-6,Equity Method Investment Accounting Considerations, (“EITF Issue 08-06”) which clarifies the accounting for certain transactions and impairment considerations involving equity method investments. EITF Issue 08-06 is effective for fiscal years beginning on or after December 15, 2008, and interim periods within those years.2011. We do not expect EITF Issue 08-06the adoption of this amended accounting guidance to have a material impact on our consolidated financial statements.
In December 2008, the FASB issued FSP No. FAS 132(R)-1,Employers’ Disclosures about Postretirement Benefit Plan Assets – an amendmentposition or results of FASB Statement No. 132(R) (“FSP FAS 132(R)-1”). FSP FAS 132(R)-1 expands the disclosure requirements under FASB Statement No. 132(R),Employers’ Disclosures about Pensions and Other Postretirement Benefits to include disclosure on investment policies and strategies, major categories of plan assets, fair value measurements for each major category of plan assets segregated by fair value hierarchy level as defined in SFAS 157, the effect of fair value measurements using Level 3 inputs on changes in plan assets for the period, and significant concentrations of risk within plan assets. FSP FAS 132(R)-1 is effective for financial statements issued for fiscal years ending after December 15, 2009. The adoption of this standard will require expanded disclosure in the notes to the Company’s consolidated financial statements but will not impact our consolidated financial statements.
In April 2009, the FASB issued FSP No. FAS 141(R)-1,Accounting for Assets Acquired and Liabilities Assumed in a Business Combination That Arise from Contingencies (“FSP No. 141(R)-1”). FSP No. 141(R)-1 requires that assets acquired and liabilities assumed in a business combination that arise from contingencies be recognized at fair value if fair value can be reasonably estimated. FSP No. 141(R)-1 is effective for business combinations with an acquisition date on or after June 1, 2009. The adoption of this pronouncement will affect the accounting treatment of future acquisitions that we may consummate.
In April 2009, the FASB issued FSP No. FAS 157-4,Determining Fair Value When the Volume and Level of Activity for the Asset or Liability Have Significantly Decreased and Identifying Transactions That Are Not Orderly (“FSP No. 157-4”). FSP No. 157-4 provides guidance on how to determine the fair value of assets and liabilities under SFAS No. 157 in the current economic environment and reemphasizes that the objective of a fair value measurement remains an exit price. If we were to conclude that there has been a significant decrease in the volume and level of activity of the asset or liability in relation to normal market activities, quoted market values may not be representative of fair value and we may conclude that a change in valuation technique or the use of multiple valuation techniques may be appropriate. FSP No. 157-4 is effective for interim and annual periods ending after June 15, 2009. We do not expect FSP No. 157-4 to have a material impact on our consolidated financial statements.
In April 2009, the FASB issued FSP FAS 115-2 and FAS 124-2,Recognition and Presentation of Other-Than-Temporary Impairments(“FSP No. 115-2 and 124-2”). FSP No. 115-2 and 124-2 amends the other-than-temporary impairment guidance for debt securities to improve presentation and disclosure of other-than-temporary impairments of debt and equity securities in the financial statements. FSP No. 115-2 and 124-2 is effective for all reporting periods ending after June 15, 2009. We do not expect FSP FSP No. 115-2 and 124-2 to have a material impact on our consolidated financial statements.
In April 2009, the FASB issued FSP No. FAS 107-1 and APB 28-1,Interim Disclosures about Fair Value of Financial Instruments(“FSP No. 107-1 and APB 28-1”). FSP No. 107-1 and APB 28-1 amends SFAS No. 107,Disclosures about Fair Value of Financial Instruments, to require disclosures about fair value of financial instruments in interim as well as in annual financial statements. FSP No. 107-1 and APB 28-1 also amends APB Opinion No. 28, “Interim Financial Reporting,” to require those disclosures in all interim financial statements. FSP No. 107-1 and APB 28-1 is effective for all reporting periods ending after June 15, 2009. We do not expect FSP No. 107-1 and APB 28-1 to have a material impact on our consolidated financial statements.
In May 2009, the FASB issued SFAS No. 165,Subsequent Events (“SFAS No. 165”). SFAS No. 165 establishes general standards of accounting for and disclosure of events that occur after the balance sheet date but before financial statements are issued. SFAS No. 165 is effective for interim or annual financial periods ending after June 15, 2009. We are currently evaluating the impact of this statement.
In June 2009, the FASB issued SFAS No. 166,Accounting for Transfers of Financial Assets – an amendment of FASB Statement No. 140(“SFAS No. 166”). SFAS No. 166 amends the guidance on transfers of financial assets and impacts new transfers of many types of financial assets (e.g., factoring arrangements and sales of trade
receivables, mortgages and installment loans). SFAS No. 166 is effective for fiscal years beginning after November 15, 2009, and in interim periods within those fiscal years. We are currently evaluating the impact of this statement.
In June 2009, the FASB issued SFAS No. 167,Amendments to FASB Interpretation No. 46(R)(“SFAS No. 167”). SFAS No. 167 amends the consolidation guidance for variable-interest entities (“VIE”) under FIN 46(R). SFAS No. 167 makes significant changes to the model for determining who should consolidate a VIE, and also addresses how often this assessment should be performed. SFAS No. 167 is effective for fiscal years beginning after November 15, 2009. We are currently evaluating the impact of this statement.
In June 2009, the FASB issued SFAS No. 168, The FASB Accounting Standards Codificationand the Hierarchy of Generally Accepted Accounting Principles – a replacement of FASB Statement No. 162 (“SFAS No. 168”). On the effective date of this Statement, the Codification will supersede all then-existing non-SEC accounting and reporting standards. All other non-grandfathered, non-SEC accounting literature not included in the Codification will become non-authoritative. This Statement is effective for financial statements issued for interim and annual periods ending after September 15, 2009. We do not expect this pronouncement to have a material impact on our consolidated financial statements.operations.
Environmental
We do not believe environmental issues have had or will not have a material effect on our capital expenditures, future results of operations or financial position.
Inflation
The effects of inflation on our operations were not significant during the periods presented in the consolidated financial statements.
Critical Accounting Policies
The discussion and analysis of our financial condition and results of operations are based upon our consolidated financial statements, which have been prepared in accordance with accounting principles generally accepted in the United States.U.S. GAAP. The preparation of these consolidated financial statements requires us to make estimates and assumptions that affect the reported amounts of assets and liabilities and the disclosure of contingent assets and liabilities at the date of the consolidated financial statements and the reported amounts of revenues and expenses during the reporting periods. We continually evaluate our estimates, including those related to our valuation of receivables, inventories, intangible assets, accrued liabilities, income and other tax accruals and contingencies and litigation. We base our estimates on historical experience and various other assumptions that we believe to be reasonable under the circumstances. These results form the basis for making judgments about the carrying values of assets and liabilities that are not readily apparent from other sources. Critical accounting policies are defined as those that reflect our significant judgments and uncertainties that could potentially result in materially different results under different assumptions and conditions. Although actual results historically have not deviated significantly from those determined using our estimates, as discussed below, our financial position or results of operations could be materially different if we were to report under different conditions or to use different assumptions in the application of such policies. We believe the following accounting policies are the most critical to us, sinceas these are the primary areas where financial information is subject to our estimates, assumptions and judgment in the preparation of our consolidated financial statements.
Revenue Recognition: We recognize revenue upon transfer of title and risk of loss provided evidence of an arrangement exists, pricing is fixed and determinable and the ability to collect is probable. In circumstances where the collection of payment is highly questionablenot probable at the time of shipment, we defer
recognition of revenue until payment is collected. We provide for returns and allowances based on historical experience and current customer activities. As of May 31, 2009 and May 31, 2008, we had deferred $9.3 million and $9.1 million, respectively, of revenue related to pricing disputes.
Within our Construction ServicesThe business units that comprise the Global Group operating segment, which representedhave contributed less than 5.0% of consolidated net sales for each of the last three fiscal years, recognize revenue is recognized on a percentage-of-completion method.
Receivables: We review our receivables on an ongoing basisIn order to ensure that theyour receivables are properly valued, and collectible. This is accomplished throughwe utilize two contra-receivable accounts: returns and allowances and allowance for doubtful accounts. Returns and allowances are used to record estimates of returns or other allowances resulting from quality, delivery, discounts or other issues affecting the value of receivables. This account is estimated based on historical trends and current market conditions, with the offset to net sales.
The allowance for doubtful accounts is used to record the estimated risk of loss related to the customers’ inability to pay. This allowance is maintained at a level that we consider appropriate based on factors that affect collectability, such as the financial health of the customer,our customers, historical trends of charge-offs and recoveries and current economic and market conditions. As we monitor our receivables, we identify customers that may have payment problems, and we adjust the allowance accordingly, with the offset to selling, general and administrative (“SG&A”) expense. Account balances are charged off against the allowance when recovery is considered remote.
We review our receivables on an ongoing basis to ensure that they are properly valued and collectible. Based on this review, we have increased our allowances by $7.6 million to $12.5 million since May 31, 2008. This increase is principally tied to customers in the automotive industry; and, based on our current information, we believe our allowancesrelated reserves are sized appropriately. However, if the economic environment and market conditions do not improve, particularly in the automotive and construction markets where our exposure is greatest, additional reserves may be required.The reserve for doubtful accounts decreased approximately $0.8 million during fiscal 2012 to $3.3 million.
While we believe our allowances are adequate, changes in economic conditions, the financial health of customers and bankruptcy settlements could impact our future earnings. If the economic environment and market conditions deteriorate, particularly in the automotive and construction end markets where our exposure is greatest, additional reserves may be required.
Inventory Valuation: Our inventory is valued at the lower of cost or market, with cost determined using a first-in, first-out method. To ensure that inventory is not stated above the current market valueThis assessment requires the significant use of significant estimates to determine the replacement cost, cost to complete, normal profit margin and ultimate selling price of the inventory. The rapid decline in steel prices during fiscal 2009 resulted in a situation where, based on our estimates,We believe that our inventories were recorded at values in excessvalued appropriately as of current market prices. As a result, we recorded charges of $105.0 million related to inventory write-downs during fiscal 2009.May 31, 2012, and May 31, 2011.
Impairment of Definite-Lived Long-Lived Assets: We review the carrying value of our long-lived assets, including intangible assets with finite useful lives, for impairment whenever events or changes in circumstances indicate that the carrying value of an asset or aasset group of assets may not be recoverable. WhenImpairment testing involves a potentialcomparison of the sum of the undiscounted future cash flows of the asset or asset group to its respective carrying amount. If the sum of the undiscounted future cash flows exceeds the carrying amount, then no impairment exists. If the carrying amount exceeds the sum of the undiscounted future cash flows, then a second step is indicated, accounting standards require a chargeperformed to determine the amount of impairment, if any, to be recognized in our consolidated statements of earnings. An impairment loss is recognized to the financial statements if the carrying amount of an asset or group of assets exceeds the fair value ofextent that asset or group of assets. The loss recognized would be the difference between the fair value and the carrying amount of the asset or asset group of assets.exceeds fair value.
Due to continued deterioration in business and market conditions during fiscal 2009, we determined that certain indicators of impairment were present, as defined by SFAS No. 144,Accounting for the Impairment or Disposal of Long-Lived Assets.Therefore, long-lived assets, including intangible assets with finite useful lives, were subsequently tested for impairment duringFiscal 2012: During the fourth quarter of fiscal 2009.2012, due largely to changes in the intended use of certain long-lived assets within our Global Group operating segment, we determined indicators of impairment were present. Recoverability of the identified asset group was tested using future cash flow projections based on management’s long range estimates of market conditions. The sum of these undiscounted future cash flows was less than the net book value of the asset group. The net book value was also determined to be in excess of fair value and, accordingly, the asset group was written down to its fair value of $0.2 million, resulting in an impairment charge of $0.4 million. This impairment loss was recorded within impairment of long-lived assets in our consolidated statement of earnings. Refer to “Item 8. – Financial Statements and Supplementary Data – Notes to Consolidated Financial Statements – Note P – Fair Value Measurements” for information regarding the determination of fair value for these assets.
Fiscal 2011: During the fourth quarter of fiscal 2011, due largely to changes in the intended use of certain long-lived assets within our former Automotive Body Panels operating segment that were not contributed to the ArtiFlex joint venture, we determined indicators of impairment were present. Recoverability of the identified asset group was tested using future cash flow projections based on management’s long range estimates of market conditions. The sum of these undiscounted future cash flows was less than the net carrying value of the asset group. The subsequent comparison of carrying value to fair value also indicated excess carrying value, resulting in an impairment charge of approximately $6.4 million. Consistent with the classification of the gain on deconsolidation, as more fully described in “Item 8. – Financial Statements and Supplementary Data – Notes to Consolidated Financial Statements – Note A – Summary of Significant Accounting Policies,” this impairment charge was recognized within the joint venture transactions line in our consolidated statements of earnings. Refer to “Item 8. – Financial Statements and Supplementary Data – Notes to Consolidated Financial Statements – Note P – Fair Value Measurements” for information regarding the determination of fair value for these assets.
During the fourth quarter of fiscal 2011, due largely to changes in the intended use of certain long-lived assets within our Metal Framing operating segment that were not contributed to the ClarkDietrich joint venture, we determined indicators of impairment were present. Recoverability of the identified assets was tested using future cash flow projections based on management’s estimate of market conditions. The sum of these undiscounted future cash flows was less than the net carrying value of the asset group. The subsequent comparison of carrying value to fair value also indicated excess carrying value, resulting in an impairment charge of approximately $18.3 million. Consistent with the classification of the gain on deconsolidation and related restructuring charges, as more fully described in “Item 8. – Financial Statements and Supplementary
Data – Notes to Consolidated Financial Statements – Note A – Summary of Significant Accounting Policies,” this impairment charge was recognized within the joint venture transactions line in our consolidated statements of earnings. Refer to “Item 8. – Financial Statements and Supplementary Data – Notes to Consolidated Financial Statements – Note P – Fair Value Measurements” for information regarding the determination of fair value for these assets.
During the fourth quarter of fiscal 2011, due largely to changes in the intended use of certain long-lived assets within our Commercial Stairs business unit, we determined indicators of impairment were present. Recoverability of the identified asset group was tested using future cash flow projections based on management’s long range estimates of market conditions. The sum of these undiscounted future cash flows was less than the net carrying value of the asset group. The subsequent comparison of carrying value to fair value also indicated excess carrying value, resulting in an impairment charge of approximately $2.5 million, which was recognized within impairment of long-lived assets in our consolidated statement of earnings. Refer to “Item 8. – Financial Statements and Supplementary Data – Notes to Consolidated Financial Statements – Note P – Fair Value Measurements” for information regarding the determination of fair value for these assets.
During the fourth quarter of fiscal 2011, due largely to changes in the intended use of certain long-lived assets within our Steel Packaging operating segment, we determined indicators of impairment were present. Recoverability of the identified asset group was tested using future cash flow projections based on management’s long range estimates of market conditions. The sum of these undiscounted future cash flows was less than the net book value of the asset group. The subsequent comparison of book value to fair value also indicated excess book value, resulting in an impairment charge of approximately $1.9 million, which was recognized within impairment of long-lived assets in our consolidated statement of earnings. Refer to “Item 8. – Financial Statements and Supplementary Data – Notes to Consolidated Financial Statements – Note P – Fair Value Measurements” for information regarding the determination of fair value for these assets.
During the third quarter of fiscal 2011, due largely to changes in the intended use of certain long-lived assets within our Metal Framing and Steel Packaging operating segments, we determined indicators of impairment were present. Recoverability of the identified asset groups was tested using future cash flow projections based on management’s long range estimates of market conditions. The sum of the undiscounted future cash flows related to each asset group was more than the net book value for each of the asset groups; therefore, no impairment losscharges were recognized.
During the second and third quarters of fiscal 2011, due largely to changes in the intended use of certain long-lived assets of our consolidated joint venture, Spartan, we determined indicators of impairment were present. Recoverability of the identified asset group was indicated at May 31, 2009.
We test our goodwill balancesImpairment of Indefinite-Lived Long-Lived Assets: Goodwill and intangible assets with indefinite lives are not amortized, but instead are tested for impairment annually, during the fourth quarter, andor more frequently if events or changes in circumstances indicate that goodwillimpairment may be impaired.present. Application of goodwill impairment testing involves judgment, including but not limited to, the identification of reporting units and estimation of the fair value of each reporting unit. A reporting unit is defined as an operating segment or one level below an operating segment. We test goodwill at the businessoperating segment level as we have determined that the characteristics of the reporting units within each businessoperating segment are similar and allow for their aggregation toin accordance with the business segment level for testing purposes. applicable accounting guidance.
The goodwill impairment test consists of determiningcomparing the fair value of the business segments,each operating segment, determined using discounted cash flows, and comparing the result to theeach operating segment’s respective carrying values of the business segments.value. If the estimated fair value of a businessan operating segment exceeds its carrying value, there is no impairment. If the carrying amount of the businessoperating segment exceeds its estimated fair value, ana goodwill impairment of the goodwill is indicated. The
amount of the impairment is determined by establishing the fair value of all assets and liabilities of the business segment, excluding the goodwill, and comparing the total to the estimated fair value of the business segment. The difference represents the fair value of the net assets of the operating segment, excluding goodwill, and if itto its estimated fair value, with the difference representing the implied fair value of the goodwill. If the implied fair value of the goodwill is lower than the bookits carrying value, of the goodwill, the difference is recorded as a lossan impairment charge in theour consolidated statements of earnings.
Due to industry changes, weakness in the construction market and the depressed results in the Metal Framing business segment over the last year, we tested the valueWe performed our annual impairment evaluation of goodwill related to this business segment for impairment on a quarterly basis. Given the significant decline in the economyand other indefinite-lived intangible assets during the second quarter of fiscal 2009 and its impact on the construction market, we revised the forecasted cash flows and discount rate assumptions used in our previous valuations of this business segment. The forecasted cash flows were revised downward due to the significant decline in, and the future uncertainty of, the economy. The discount rate, based on our current cost of debt and equity capital, was changed due to the increased risk in our forecast. After reviewing the revised valuation and the fair value estimates of the remaining assets, it was determined that the value of the business no longer supported its $96.9 million goodwill balance. As a result, the full amount of goodwill was written-off in the second quarter ended November 30, 2008.
Subsequent to the second quarter write-off noted above, and as of February 28, 2009, the total goodwill balance was $98.3 million. Of this amount, $73.6 million related to the Pressure Cylinders business segment and $24.7 million related to the Construction Services business segment, $18.0 million of which resulted from the June 2008 acquisition of substantially all of the assets of The Sharon Companies Ltd. (See “Item 8 – Financial Statements and Supplementary Data – Notes to Consolidated Financial Statements – Note Q – Acquisitions”). During the quarter ended February 28, 2009, we tested the value of the goodwill balances in the Construction Services business segment as weakness in the construction market continued. For the test, we assumed the revenue trend rate would range from down 1.1% to up 7.5% as we expect a recovery in the latter years of the forecast due to pent-up demand and future growth in the market share of our Construction Services business segment. We set the discount rate at 12%, up from the 10% used in the fiscal 2008 annual testing but lower than the 14% used for the Metal Framing business segment test in the second quarter of fiscal 2009. We believe this was appropriate due to increased uncertainty in the market place since the end of fiscal 2008, and the cash flows for the Construction Services business segment being more predictable than those of the Metal Framing business segment. Based on this test, there was no indication of impairment. We also performed the same test using a 14% discount rate, which also indicated no impairment.
During the fourth quarter of fiscal 2009,2012 and fiscal 2011 and concluded that the Company completedfair value of each reporting unit exceeded its annual test of goodwill. No additional impairmentscarrying value; therefore, no impairment charges were identified during the Company’s annual assessment of goodwill. Futurerecognized. However, future declines in the market and deterioration in earnings could lead to additional impairment of goodwill and other long-lived assets.charges in subsequent periods.
Accounting for Derivatives and Other Contracts at Fair Value: We use derivatives in the normal course of business to manage our exposure to fluctuations in commodity prices, foreign currency and interest rates. The fairFair values for these contracts are based upon valuation methodologies deemed appropriate in the circumstances; however, the use of different assumptions could affect the estimated fair values.
Stock-Based Compensation: All share-based awards to employees, including grants of employee stock options, are recorded as expense in the consolidated statements of earnings based on their fair values.
Income Taxes: In accordance with the provisions of Statement of Financial Accounting Standards (“SFAS”) No. 109,Accounting for Income Taxes (“SFAS 109”)authoritative accounting guidance, we account for income taxes using the asset and liability method. The asset and liability method requires the recognition of deferred tax assets and liabilities for expected future tax consequences of temporary differences that currently exist between the tax basis and financial reporting basis of our assets and liabilities. In assessing the realizability of deferred tax assets, we consider whether it is more likely than not that some, or a portion, of the deferred tax assets will not be realized. We provide a valuation allowance for deferred income tax assets when it is more likely than not that a portion of such deferred income tax assets will not be realized.
In accordance with FASB Interpretation No. 48,Accounting for Uncertaintyaccounting literature related to uncertainty in Income Taxes – an interpretation of FASB Statement No. 109,income taxes, tax benefits from uncertain tax positions that are recognized in the financial statements are measured based on the largest benefit that has a greater than fifty percent likelihood of being realized upon ultimate settlement.
We have reserves for taxes and associated interest and penalties that are determined in accordance with FIN 48, that may become payable in future years as a result of audits by taxing authorities. It is our policy to record these in income tax expense. While we believe the positions taken on previously filed tax returns are appropriate, we have established the tax and interest reserves in recognition that various taxing authorities may challenge our positions. The tax reserves are analyzed periodically, and adjustments are made as events occur to warrant adjustment to the reserves, such as lapsing of applicable statutes of limitations, conclusion of tax audits, additional exposure based on current calculations, identification of new issues, and release of administrative guidance or court decisions affecting a particular tax issue.
Self-Insurance Reserves: We are largely self-insured with respect to workers’ compensation, general and autoautomobile liability, property damage, employee medical claims and other potential losses. In order to reduce risk and better manage our overall loss exposure, we purchase stop-loss insurance that covers individual claims in excess of the deductible amounts. We maintain reserves for the estimated cost to settle open claims, which includes estimates of legal costs expected to be incurred, as well as an estimate of the cost of claims that have been incurred but not reported. These estimates are based on actuarial valuations that take into consideration the historical average claim volume, the average cost for settled claims, current trends in claim costs, changes in our business and workforce, general economic factors and other assumptions believed to be reasonable under the circumstances. The estimated reserves for these liabilities could be affected if future occurrences and claims differ from assumptions used and historical trends. Facility consolidations, a focus on safety initiatives and an emphasis on property loss prevention and product quality have resulted in an improvement in our loss history and the related assumptions used to analyze many of the current self-insurance reserves. This improvement resulted in reductions to these reserves of $1.2 million in fiscal 2009 and $5.3 million in fiscal 2008. We will continue to review these reserves on a quarterly basis, or more frequently if factors dictate a more frequent review is warranted.
The critical accounting policies discussed herein are not intended to be a comprehensive list of all of our accounting policies. In many cases, the accounting treatment of a particular transaction is specifically dictated by accounting principles generally accepted in the United States,U.S. GAAP, with noa lesser need for our judgment in their application. There are also areas in which our judgment in selecting an available alternative would not produce a materially different result.
Item 7A. — Quantitative and Qualitative Disclosures About Market Risk
In the normal course of business, we are exposed to various market risks. We continually monitor these risks and regularly develop appropriate strategies to manage them. Accordingly, from time to time, we may enter into certain derivative financial and commoditycommodity-based derivative instruments. These instruments are used solely to mitigate market exposure and are not used for trading or speculative purposes. Refer to “Item 8. – Financial Statements and Supplementary Data – Notes to Consolidated Financial Statements – Note O – Derivative Instruments and Hedging Activities” of this Annual Report on Form 10-K for additional information.
Interest Rate Risk
We entered into an interest rate swap in October 2004, which was amended December 17, 2004. The swap has a notional amount of $100.0 million to hedge changes in cash flows attributable to changes in the LIBOR rate associated with the December 17, 2004, issuance of the unsecured Floating Rate Senior Notes due December 17, 2014.2014 Notes. See “Item 8 – Financial Statements and Supplementary Data – Notes to Consolidated Financial Statements – Note CG – Debt”Debt and Receivables Securitization” of this Annual Report on Form 10-K. The critical terms of the derivative correspond with the critical terms of the underlying exposure. The interest rate swap was executed with a highly rated financial institution. No credit loss is anticipated. We pay a fixed rate of 4.46% and receive a variable rate based on the six-month LIBOR. A sensitivity analysis of changes in the interest rate yield curve associated with our interest rate swap indicates that a 10% parallel decline in the yield curve would not materially impact the fair value of our interest rate swap. A sensitivity analysis of changes in the interest rates on our variable rate debt indicates that a 10% increase in those rates would not have materially impacted our netreported results. Based on the terms of the noted derivative contract, such changes would also be expected to materially offset against each other.
We entered into a U.S. Treasury Rate-based treasury lock in April 2010, in anticipation of the issuance of $150.0 million principal amount of our 2020 Notes. Refer to “Item 8. – Financial Statements and Supplementary Data – Notes to Consolidated Financial Statements – Note G – Debt and Receivables Securitization” of this Annual Report on Form 10-K for additional information regarding the 2020 Notes. The treasury lock had a notional amount of $150.0 million to hedge the risk of changes in the semi-annual interest payments attributable to changes in the benchmark interest rate during the several days leading up to the issuance of the 10-year fixed-rate debt. Upon pricing of the 2020 Notes, the derivative was settled and resulted in a loss of approximately $1.4 million, which has been reflected within other comprehensive income on the consolidated statements of equity. That balance is being recognized in earnings, as an increase to interest expense, over the life of the related 2020 Notes.
Foreign Currency Risk
The translation of foreign currencies into United States dollars subjects us to exposure related to fluctuating exchange rates. Derivative instruments are not used to manage this risk; however, we do make use of forward contracts to manage exposure to certain inter-companyintercompany loans with our foreign affiliates. Such contracts limit exposure to both favorable and unfavorable currency fluctuations. At May 31, 2009,2012, the difference between the contract and book value of these instruments was not material to our consolidated financial position, results of operations or cash flows. A 10% change in the exchange rate to the U.S. dollar forward rate is not expected to materially impact our consolidated financial position, results of operations or cash flows. A sensitivity analysis of changes in the U.S. dollar on these foreign currency-denominated contracts indicates that if the U.S. dollar uniformly weakened by 10% against all of these currency exposures,
the fair value of these instruments would not be materially impacted. Any resulting changes in fair value would be offset by changes in the underlying hedged balance sheet position. A sensitivity analysis of changes in the currency exchange rates of our foreign locations indicates that a 10% increase in those rates would not have materially impacted our net results. The sensitivity analysis assumes a uniform shift in all foreign currency exchange rates. The assumption that exchange rates change in uniformity may overstate the impact of changing exchange rates on assets and liabilities denominated in a foreign currency.
Commodity Price Risk
We are exposed to market risk for price fluctuations on purchases of steel, natural gas, zinc (see additional information below regarding natural gas and zinc) and other raw materials andas well as our utility requirements. We attempt to negotiate the best prices for commodities and to competitively price products and services to reflect the fluctuations in market prices. Derivative financial instruments have been used to manage a portion of our exposure to fluctuations in the cost of certain commodities, including steel, natural gas, zinc and natural gas.other raw materials. These contracts covered periods commensurate with known or expected exposures through calendar 2008.throughout the fiscal year ended May 31, 2012. The derivative instruments were executed with highly rated financial institutions. No credit loss is anticipated. No derivatives are held for trading purposes, and no active commodity derivatives werepurposes.
A sensitivity analysis of changes in place at May 31, 2009.
FairThe fair values for theof our outstanding derivative positions as of May 31, 20092012 and 20082011 are summarized below. Fair values of thethese derivatives do not consider the offsetting impact of the underlying hedged item.
| Fair Value At May 31, | Change In Fair Value | |||||||||||
| In millions | 2009 | 2008 | ||||||||||
Zinc | $ | - | $ | 3.1 | $ | (3.1 | ) | |||||
Natural gas | - | 1.5 | (1.5 | ) | ||||||||
Foreign currency | 0.4 | (0.1 | ) | 0.5 | ||||||||
Interest rate | (7.9 | ) | (0.3 | ) | (7.6 | ) | ||||||
| $ | (7.5 | ) | $ | 4.2 | $ | (11.7 | ) | |||||
Fair Value At May 31, | ||||||||
| (in millions) | 2012 | 2011 | ||||||
Interest rate | $ | (10.7 | ) | $ | (12.4 | ) | ||
Foreign currency | 0.9 | (0.6 | ) | |||||
Commodity | (4.0 | ) | 1.1 | |||||
|
|
|
| |||||
| $ | (13.8 | ) | $ | (11.9 | ) | |||
|
|
|
| |||||
Safe Harbor
Quantitative and qualitative disclosures about market risk include forward-looking statements with respect to management’s opinion about risks associated with the use of derivative instruments. These statements are based on certain assumptions with respect to market prices and industry supply of, and demand for, steel products and certain raw materials. To the extent these assumptions prove to be inaccurate, future outcomes with respect to hedging programs may differ materially from those discussed in the forward-looking statements.
Item 8. — Financial Statements and Supplementary Data
Report of Independent Registered Public Accounting Firm
The Board of Directors and Shareholders
Worthington Industries, Inc.:
We have audited the accompanying consolidated balance sheets of Worthington Industries, Inc. and subsidiaries as of May 31, 20092012 and 2008,2011, and the related consolidated statements of earnings, shareholders’ equity, and cash flows for each of the years in the three-year period ended May 31, 2009.2012. In connection with our audits of the consolidated financial statements, we also have audited the financial statement schedule of valuation and qualifying accounts. These consolidated financial statements and financial statement schedule are the responsibility of the Company’s management. Our responsibility is to express an opinion on these consolidated financial statements and financial statement schedule based on our audits.
We conducted our audits in accordance with the standards of the Public Company Accounting Oversight Board (United States). Those standards require that we plan and perform the audit to obtain reasonable assurance about whether the financial statements are free of material misstatement. An audit includes examining, on a test basis, evidence supporting the amounts and disclosures in the financial statements. An audit also includes assessing the accounting principles used and significant estimates made by management, as well as evaluating the overall financial statement presentation. We believe that our audits provide a reasonable basis for our opinion.
In our opinion, the consolidated financial statements referred to above present fairly, in all material respects, the financial position of Worthington Industries, Inc. and subsidiaries as of May 31, 20092012 and 2008,2011, and the results of their operations and their cash flows for each of the years in the three-year period ended May 31, 2009,2012, in conformity with U.S. generally accepted accounting principles. Also in our opinion, the related financial statement schedule, when considered in relation to the basic consolidated financial statements taken as a whole, presents fairly, in all material respects, the information set forth therein.
We also have audited, in accordance with the standards of the Public Company Accounting Oversight Board (United States), Worthington Industries, Inc.’s internal control over financial reporting as of May 31, 2009,2012, based on criteria established inInternal Control – Integrated Framework issued by the Committee of Sponsoring Organizations of the Treadway Commission (COSO), and our report dated July 30, 2009,2012 expressed an unqualified opinion on the effectiveness of the Company’s internal control over financial reporting.
/s/ KPMG LLP |
Columbus, Ohio
July 30, 20092012
WORTHINGTON INDUSTRIES, INC.
CONSOLIDATED BALANCE SHEETS
(Dollars inIn thousands)
| May 31, | May 31, | |||||||||||||
| 2009 | 2008 | 2012 | 2011 | |||||||||||
ASSETS | ||||||||||||||
Current assets: | ||||||||||||||
Cash and cash equivalents | $ | 56,319 | $ | 73,772 | $ | 41,028 | $ | 56,167 | ||||||
Receivables, less allowances of $12,470 and $4,849 at May 31, 2009 and 2008 | 182,881 | 384,354 | ||||||||||||
Receivables, less allowances of $3,329 and $4,150 at May 31, 2012 and 2011, respectively | 400,869 | 388,550 | ||||||||||||
Inventories: | ||||||||||||||
Raw materials | 141,082 | 350,256 | 211,543 | 189,450 | ||||||||||
Work in process | 57,612 | 123,106 | 115,510 | 98,940 | ||||||||||
Finished products | 71,878 | 119,599 | 74,887 | 82,440 | ||||||||||
|
| |||||||||||||
Total inventories | 270,572 | 592,961 | 401,940 | 370,830 | ||||||||||
|
| |||||||||||||
Income taxes receivable | 29,749 | - | 892 | 1,356 | ||||||||||
Assets held for sale | 707 | 1,132 | 7,202 | 9,681 | ||||||||||
Deferred income taxes | 24,868 | 17,966 | 20,906 | 28,297 | ||||||||||
Prepaid expenses and other current assets | 33,839 | 34,785 | 41,402 | 36,754 | ||||||||||
|
| |||||||||||||
Total current assets | 598,935 | 1,104,970 | 914,239 | 891,635 | ||||||||||
|
| |||||||||||||
Investments in unconsolidated affiliates | 100,395 | 119,808 | 240,882 | 232,149 | ||||||||||
Goodwill | 101,343 | 183,523 | 156,681 | 93,633 | ||||||||||
Other intangible assets, net of accumulated amortization of $15,328 and $11,432 at May 31, 2009 and 2008 | 23,642 | 13,709 | ||||||||||||
Other intangible assets, net of accumulated amortization of $16,103 and $12,688 at May 31, 2012 and 2011, respectively | 100,333 | 19,958 | ||||||||||||
Other assets | 18,009 | 16,077 | 22,585 | 24,540 | ||||||||||
Property, plant and equipment: | ||||||||||||||
Land | 30,960 | 34,241 | 24,279 | 26,960 | ||||||||||
Buildings and improvements | 242,558 | 249,624 | 187,514 | 182,030 | ||||||||||
Machinery and equipment | 879,871 | 901,067 | 785,335 | 751,865 | ||||||||||
Construction in progress | 22,783 | 11,758 | 12,775 | 7,878 | ||||||||||
|
| |||||||||||||
Total property, plant and equipment | 1,176,172 | 1,196,690 | 1,009,903 | 968,733 | ||||||||||
Less accumulated depreciation | 654,667 | 646,746 | 566,826 | 563,399 | ||||||||||
|
| |||||||||||||
Total property, plant and equipment, net | 521,505 | 549,944 | 443,077 | 405,334 | ||||||||||
|
| |||||||||||||
Total assets | $ | 1,363,829 | $ | 1,988,031 | $ | 1,877,797 | $ | 1,667,249 | ||||||
|
| |||||||||||||
LIABILITIES AND SHAREHOLDERS' EQUITY | ||||||||||||||
Current liabilities: | ||||||||||||||
Accounts payable | $ | 136,215 | $ | 356,129 | ||||||||||
Notes payable | 980 | 135,450 | ||||||||||||
Accrued compensation, contributions to employee benefit plans and related taxes | 34,503 | 59,619 | ||||||||||||
Dividends payable | 7,916 | 13,487 | ||||||||||||
Other accrued items | 49,488 | 68,545 | ||||||||||||
Income taxes payable | 4,965 | 31,665 | ||||||||||||
Current maturities of long-term debt | 138,013 | - | ||||||||||||
Total current liabilities | 372,080 | 664,895 | ||||||||||||
Other liabilities | 65,400 | 49,785 | ||||||||||||
Long-term debt | 100,400 | 245,000 | ||||||||||||
Deferred income taxes | 82,986 | 100,811 | ||||||||||||
Total liabilities | 620,866 | 1,060,491 | ||||||||||||
Contingent liabilities and commitments – Note G | ||||||||||||||
Minority interest | 36,894 | 42,163 | ||||||||||||
Shareholders' equity: | ||||||||||||||
Preferred shares, without par value; authorized – 1,000,000 shares; issued and outstanding – none | - | - | ||||||||||||
Common shares, without par value; authorized – 150,000,000 shares; issued and outstanding, | - | - | ||||||||||||
Additional paid-in capital | 183,051 | 174,900 | ||||||||||||
Cumulative other comprehensive income, net of taxes of $3,251 and $78 at May 31, 2009 and 2008 | 4,457 | 24,633 | ||||||||||||
Retained earnings | 518,561 | 685,844 | ||||||||||||
Total shareholders' equity | 706,069 | 885,377 | ||||||||||||
Total liabilities and shareholders' equity | $ | 1,363,829 | $ | 1,988,031 | ||||||||||
See notes to consolidated financial statements.
WORTHINGTON INDUSTRIES, INC.
CONSOLIDATED BALANCE SHEETS
(In thousands)
| May 31, | ||||||||
| 2012 | 2011 | |||||||
LIABILITIES AND EQUITY | ||||||||
Current liabilities: | ||||||||
Accounts payable | $ | 252,334 | $ | 253,404 | ||||
Short-term borrowings | 274,923 | 132,956 | ||||||
Accrued compensation, contributions to employee benefit plans and related taxes | 71,271 | 72,312 | ||||||
Dividends payable | 8,478 | 7,175 | ||||||
Other accrued items | 38,231 | 52,023 | ||||||
Income taxes payable | 11,697 | 7,132 | ||||||
Current maturities of long-term debt | 1,329 | - | ||||||
|
|
|
| |||||
Total current liabilities | 658,263 | 525,002 | ||||||
Other liabilities | 72,371 | 56,594 | ||||||
Distributions in excess of investment in unconsolidated affiliate | 69,165 | 10,715 | ||||||
Long-term debt | 257,462 | 250,254 | ||||||
Deferred income taxes | 73,099 | 83,981 | ||||||
|
|
|
| |||||
Total liabilities | 1,130,360 | 926,546 | ||||||
|
|
|
| |||||
Shareholders’ equity – controlling interest: | ||||||||
Preferred shares, without par value; authorized – 1,000,000 shares; issued and outstanding – none | - | - | ||||||
Common shares, without par value; authorized – 150,000,000 shares; issued and outstanding, 2012 – 67,906,369 shares, 2011 – 71,683,876 shares | - | - | ||||||
Additional paid-in capital | 192,338 | 181,525 | ||||||
Accumulated other comprehensive income (loss), net of taxes of $10,749 and $5,456 at May 31, 2012 and 2011, respectively | (20,387 | ) | 3,975 | |||||
Retained earnings | 525,223 | 504,410 | ||||||
|
|
|
| |||||
Total shareholders’ equity – controlling interest | 697,174 | 689,910 | ||||||
Noncontrolling interest | 50,263 | 50,793 | ||||||
|
|
|
| |||||
Total equity | 747,437 | 740,703 | ||||||
|
|
|
| |||||
Total liabilities and equity | $ | 1,877,797 | $ | 1,667,249 | ||||
|
|
|
| |||||
See notes to consolidated financial statements.
WORTHINGTON INDUSTRIES, INC.
CONSOLIDATED STATEMENTS OF EARNINGS
(In thousands, except per share)share amounts)
| Fiscal Years Ended May 31, | ||||||||||||
| 2009 | 2008 | 2007 | ||||||||||
Net sales | $ | 2,631,267 | $ | 3,067,161 | $ | 2,971,808 | ||||||
Cost of goods sold | 2,456,533 | 2,711,414 | 2,610,176 | |||||||||
Gross margin | 174,734 | 355,747 | 361,632 | |||||||||
Selling, general and administrative expense | 210,046 | 231,602 | 232,487 | |||||||||
Goodwill impairment | 96,943 | - | - | |||||||||
Restructuring charges | 43,041 | 18,111 | - | |||||||||
Operating income (loss) | (175,296 | ) | 106,034 | 129,145 | ||||||||
Other income (expense): | ||||||||||||
Miscellaneous expense | (6,858 | ) | (6,348 | ) | (4,446 | ) | ||||||
Gain on sale of Aegis | 8,331 | - | - | |||||||||
Interest expense | (20,734 | ) | (21,452 | ) | (21,895 | ) | ||||||
Equity in net income of unconsolidated affiliates | 48,589 | 67,459 | 63,213 | |||||||||
Earnings (loss) before income taxes | (145,968 | ) | 145,693 | 166,017 | ||||||||
Income tax expense (benefit) | (37,754 | ) | 38,616 | 52,112 | ||||||||
Net earnings (loss) | $ | (108,214 | ) | $ | 107,077 | $ | 113,905 | |||||
Average common shares outstanding – basic | 78,903 | 81,232 | 86,351 | |||||||||
Earnings (loss) per share – basic | $ | (1.37 | ) | $ | 1.32 | $ | 1.32 | |||||
Average common shares outstanding – diluted | 78,903 | 81,898 | 87,002 | |||||||||
Earnings (loss) per share – diluted | $ | (1.37 | ) | $ | 1.31 | $ | 1.31 | |||||
| Fiscal Years Ended May 31, | ||||||||||||
| 2012 | 2011 | 2010 | ||||||||||
Net sales | $ | 2,534,701 | $ | 2,442,624 | $ | 1,943,034 | ||||||
Cost of goods sold | 2,201,833 | 2,086,467 | 1,663,104 | |||||||||
|
|
|
|
|
| |||||||
Gross margin | 332,868 | 356,157 | 279,930 | |||||||||
Selling, general and administrative expense | 225,069 | 235,198 | 218,315 | |||||||||
Impairment of long-lived assets | 355 | 4,386 | 35,409 | |||||||||
Restructuring and other expense | 5,984 | 2,653 | 4,243 | |||||||||
Joint venture transactions | (150 | ) | (10,436 | ) | - | |||||||
|
|
|
|
|
| |||||||
Operating income | 101,610 | 124,356 | 21,963 | |||||||||
Other income (expense): | ||||||||||||
Miscellaneous income | 2,319 | 597 | 1,127 | |||||||||
Interest expense | (19,497 | ) | (18,756 | ) | (9,534 | ) | ||||||
Equity in net income of unconsolidated affiliates | 92,825 | 76,333 | 64,601 | |||||||||
|
|
|
|
|
| |||||||
Earnings before income taxes | 177,257 | 182,530 | 78,157 | |||||||||
Income tax expense | 51,904 | 58,496 | 26,650 | |||||||||
|
|
|
|
|
| |||||||
Net earnings | 125,353 | 124,034 | 51,507 | |||||||||
Net earnings attributable to noncontrolling interest | 9,758 | 8,968 | 6,266 | |||||||||
|
|
|
|
|
| |||||||
Net earnings attributable to controlling interest | $ | 115,595 | $ | 115,066 | $ | 45,241 | ||||||
|
|
|
|
|
| |||||||
Basic | ||||||||||||
Average common shares outstanding | 69,651 | 74,803 | 79,127 | |||||||||
|
|
|
|
|
| |||||||
Earnings per share attributable to controlling interest | $ | 1.66 | $ | 1.54 | $ | 0.57 | ||||||
|
|
|
|
|
| |||||||
Diluted | ||||||||||||
Average common shares outstanding | 70,252 | 75,409 | 79,143 | |||||||||
|
|
|
|
|
| |||||||
Earnings per share attributable to controlling interest | $ | 1.65 | $ | 1.53 | $ | 0.57 | ||||||
|
|
|
|
|
| |||||||
See notes to consolidated financial statements.
WORTHINGTON INDUSTRIES, INC.
CONSOLIDATED STATEMENTS OF SHAREHOLDERS' EQUITY
(Dollars inIn thousands, except per share)share amounts)
| Additional Paid-in Capital | Cumulative Other Comprehensive Income (Loss), Net of Tax | Retained Earnings | Total | Controlling Interest | ||||||||||||||||||||||||||||||||||||||||||||||||||
| Common Shares | Common Shares | Additional Paid-in Capital | Accumulated Other Comprehensive Income (Loss), Net of Tax | Retained Earnings | Total | Noncontrolling Interest | Total | |||||||||||||||||||||||||||||||||||||||||||||||
| Shares | Amount | Shares | Amount | |||||||||||||||||||||||||||||||||||||||||||||||||||
Balance at June 1, 2006 | 88,691,204 | $ | - | $ | 159,328 | $ | 27,116 | $ | 758,862 | $ | 945,306 | |||||||||||||||||||||||||||||||||||||||||||
Comprehensive income: | ||||||||||||||||||||||||||||||||||||||||||||||||||||||
Balance at May 31, 2009 | 78,997,617 | - | 183,051 | 4,457 | 518,561 | 706,069 | 36,894 | 742,963 | ||||||||||||||||||||||||||||||||||||||||||||||
Comprehensive income (loss): | ||||||||||||||||||||||||||||||||||||||||||||||||||||||
Net earnings | - | - | - | - | 113,905 | 113,905 | - | - | - | - | 45,241 | 45,241 | 6,266 | 51,507 | ||||||||||||||||||||||||||||||||||||||||
Unrealized gain on investment | - | - | - | (296 | ) | - | (296 | ) | - | - | - | 5 | - | 5 | - | 5 | ||||||||||||||||||||||||||||||||||||||
Foreign currency translation | - | - | - | 4,507 | - | 4,507 | - | - | - | (13,739 | ) | - | (13,739 | ) | - | (13,739 | ) | |||||||||||||||||||||||||||||||||||||
Minimum pension liability | - | - | - | 34 | - | 34 | ||||||||||||||||||||||||||||||||||||||||||||||||
Cash flow hedges | - | - | - | (7,586 | ) | - | (7,586 | ) | ||||||||||||||||||||||||||||||||||||||||||||||
Total comprehensive income | 110,564 | |||||||||||||||||||||||||||||||||||||||||||||||||||||
Adjustment to initially apply SFAS 158 | - | - | - | (594 | ) | - | (594 | ) | ||||||||||||||||||||||||||||||||||||||||||||||
Common shares issued | 666,272 | - | 12,242 | - | - | 12,242 | ||||||||||||||||||||||||||||||||||||||||||||||||
Stock-based compensation | - | - | 3,480 | - | - | 3,480 | ||||||||||||||||||||||||||||||||||||||||||||||||
Purchases and retirement of common shares | (4,449,000 | ) | - | (8,142 | ) | - | (68,475 | ) | (76,617 | ) | ||||||||||||||||||||||||||||||||||||||||||||
Cash dividends declared ($0.68 per share) | - | - | - | - | (58,380 | ) | (58,380 | ) | ||||||||||||||||||||||||||||||||||||||||||||||
Balance at May 31, 2007 | 84,908,476 | - | 166,908 | 23,181 | 745,912 | 936,001 | ||||||||||||||||||||||||||||||||||||||||||||||||
Comprehensive income: | ||||||||||||||||||||||||||||||||||||||||||||||||||||||
Net earnings | - | - | - | - | 107,077 | 107,077 | ||||||||||||||||||||||||||||||||||||||||||||||||
Foreign currency translation | - | - | - | 13,080 | - | 13,080 | ||||||||||||||||||||||||||||||||||||||||||||||||
Pension liability adjustment | - | - | - | 590 | - | 590 | ||||||||||||||||||||||||||||||||||||||||||||||||
Cash flow hedges | - | - | - | (12,218 | ) | - | (12,218 | ) | ||||||||||||||||||||||||||||||||||||||||||||||
Pension liability adjustment, net of tax of $1,163 | - | - | - | 317 | - | 317 | - | 317 | ||||||||||||||||||||||||||||||||||||||||||||||
Cash flow hedges, net of tax of $854 | - | - | - | (1,671 | ) | - | (1,671 | ) | - | (1,671 | ) | |||||||||||||||||||||||||||||||||||||||||||
|
|
| ||||||||||||||||||||||||||||||||||||||||||||||||||||
Total comprehensive income | 108,529 | 30,153 | 6,266 | 36,419 | ||||||||||||||||||||||||||||||||||||||||||||||||||
|
|
| ||||||||||||||||||||||||||||||||||||||||||||||||||||
Common shares issued | 851,080 | - | 15,318 | - | - | 15,318 | 219,804 | - | 2,291 | - | - | 2,291 | - | 2,291 | ||||||||||||||||||||||||||||||||||||||||
Stock-based compensation | - | - | 4,010 | - | - | 4,010 | - | - | 4,576 | - | - | 4,576 | - | 4,576 | ||||||||||||||||||||||||||||||||||||||||
Gain from TWB Company, L.L.C. dilution | - | - | 1,944 | - | - | 1,944 | ||||||||||||||||||||||||||||||||||||||||||||||||
Purchases and retirement of common shares | (6,451,500 | ) | - | (13,280 | ) | - | (112,505 | ) | (125,785 | ) | ||||||||||||||||||||||||||||||||||||||||||||
Cash dividends declared ($0.68 per share) | - | - | - | - | (54,640 | ) | (54,640 | ) | ||||||||||||||||||||||||||||||||||||||||||||||
Dividends paid to noncontrolling interest | - | - | - | - | - | - | (4,539 | ) | (4,539 | ) | ||||||||||||||||||||||||||||||||||||||||||||
Cash dividends declared ($0.40 per share) | - | - | - | - | (31,676 | ) | (31,676 | ) | - | (31,676 | ) | |||||||||||||||||||||||||||||||||||||||||||
|
|
|
|
|
|
|
| |||||||||||||||||||||||||||||||||||||||||||||||
Balance at May 31, 2008 | 79,308,056 | - | 174,900 | 24,633 | 685,844 | 885,377 | ||||||||||||||||||||||||||||||||||||||||||||||||
Comprehensive loss: | ||||||||||||||||||||||||||||||||||||||||||||||||||||||
Net loss | - | - | - | - | (108,214 | ) | (108,214 | ) | ||||||||||||||||||||||||||||||||||||||||||||||
Balance at May 31, 2010 | 79,217,421 | - | 189,918 | (10,631 | ) | 532,126 | 711,413 | 38,621 | 750,034 | |||||||||||||||||||||||||||||||||||||||||||||
Comprehensive income: | ||||||||||||||||||||||||||||||||||||||||||||||||||||||
Net earnings | - | - | - | - | 115,066 | 115,066 | 8,968 | 124,034 | ||||||||||||||||||||||||||||||||||||||||||||||
Unrealized gain on investment | - | - | - | - | - | - | - | - | ||||||||||||||||||||||||||||||||||||||||||||||
Foreign currency translation | - | - | - | (9,866 | ) | - | (9,866 | ) | - | - | - | 13,006 | - | 13,006 | 40 | 13,046 | ||||||||||||||||||||||||||||||||||||||
Pension liability adjustment | - | - | - | (4,766 | ) | - | (4,766 | ) | ||||||||||||||||||||||||||||||||||||||||||||||
Cash flow hedges | - | - | - | (5,544 | ) | - | (5,544 | ) | ||||||||||||||||||||||||||||||||||||||||||||||
Pension liability adjustment, net of tax of $(760) | - | - | - | 1,442 | - | 1,442 | - | 1,442 | ||||||||||||||||||||||||||||||||||||||||||||||
Cash flow hedges, net of tax of $563 | - | - | - | 158 | - | 158 | - | 158 | ||||||||||||||||||||||||||||||||||||||||||||||
|
|
| ||||||||||||||||||||||||||||||||||||||||||||||||||||
Total comprehensive loss | (128,390 | ) | ||||||||||||||||||||||||||||||||||||||||||||||||||||
Total comprehensive income | 129,672 | 9,008 | 138,680 | |||||||||||||||||||||||||||||||||||||||||||||||||||
|
|
| ||||||||||||||||||||||||||||||||||||||||||||||||||||
Acquisition of Nitin Cylinders Limited | - | - | - | - | - | - | 14,156 | 14,156 | ||||||||||||||||||||||||||||||||||||||||||||||
Common shares issued | 339,561 | - | 3,875 | - | - | 3,875 | 421,153 | - | 4,827 | - | - | 4,827 | - | 4,827 | ||||||||||||||||||||||||||||||||||||||||
Stock-based compensation | 5,767 | 5,767 | - | - | 6,173 | - | - | 6,173 | - | 6,173 | ||||||||||||||||||||||||||||||||||||||||||||
Purchases and retirement of common shares | (650,000 | ) | - | (1,448 | ) | - | (10,954 | ) | (12,402 | ) | (7,954,698 | ) | (19,393 | ) | (113,371 | ) | (132,764 | ) | - | (132,764 | ) | |||||||||||||||||||||||||||||||||
Cash dividends declared ($0.61 per share) | - | - | - | - | (48,115 | ) | (48,115 | ) | ||||||||||||||||||||||||||||||||||||||||||||||
Other | - | - | (43 | ) | - | - | (43 | ) | ||||||||||||||||||||||||||||||||||||||||||||||
Dividends paid to noncontrolling interest | - | - | �� | - | - | - | - | (10,992 | ) | (10,992 | ) | |||||||||||||||||||||||||||||||||||||||||||
Cash dividends declared ($0.40 per share) | - | - | - | - | (29,411 | ) | (29,411 | ) | - | (29,411 | ) | |||||||||||||||||||||||||||||||||||||||||||
|
|
|
|
|
|
|
| |||||||||||||||||||||||||||||||||||||||||||||||
Balance at May 31, 2009 | 78,997,617 | $ | - | $ | 183,051 | $ | 4,457 | $ | 518,561 | $ | 706,069 | |||||||||||||||||||||||||||||||||||||||||||
Balance at May 31, 2011 | 71,683,876 | - | 181,525 | 3,975 | 504,410 | 689,910 | 50,793 | 740,703 | ||||||||||||||||||||||||||||||||||||||||||||||
Comprehensive income: | ||||||||||||||||||||||||||||||||||||||||||||||||||||||
Net earnings | - | - | - | - | 115,595 | 115,595 | 9,758 | 125,353 | ||||||||||||||||||||||||||||||||||||||||||||||
Foreign currency translation | - | - | - | (14,803 | ) | - | (14,803 | ) | (3,127 | ) | (17,930 | ) | ||||||||||||||||||||||||||||||||||||||||||
Pension liability adjustment, net of tax of $4,975 | - | - | - | (9,241 | ) | - | (9,241 | ) | - | (9,241 | ) | |||||||||||||||||||||||||||||||||||||||||||
Cash flow hedges, net of tax of $318 | - | - | - | (318 | ) | - | (318 | ) | - | (318 | ) | |||||||||||||||||||||||||||||||||||||||||||
|
|
| ||||||||||||||||||||||||||||||||||||||||||||||||||||
Total comprehensive income | 91,233 | 6,631 | 97,864 | |||||||||||||||||||||||||||||||||||||||||||||||||||
|
|
| ||||||||||||||||||||||||||||||||||||||||||||||||||||
Acquisition of PSI Energy Solutions, LLC | - | - | - | - | - | - | 2,333 | 2,333 | ||||||||||||||||||||||||||||||||||||||||||||||
Common shares issued | 689,463 | - | 11,428 | - | - | 11,428 | - | 11,428 | ||||||||||||||||||||||||||||||||||||||||||||||
Stock-based compensation | - | - | 11,462 | - | - | 11,462 | - | 11,462 | ||||||||||||||||||||||||||||||||||||||||||||||
Purchases and retirement of common shares | (4,466,970 | ) | (12,077 | ) | (61,341 | ) | (73,418 | ) | - | (73,418 | ) | |||||||||||||||||||||||||||||||||||||||||||
Dividends paid to noncontrolling interest, net | - | - | - | - | - | - | (9,494 | ) | (9,494 | ) | ||||||||||||||||||||||||||||||||||||||||||||
Cash dividends declared ($0.48 per share) | - | - | - | - | (33,441 | ) | (33,441 | ) | - | (33,441 | ) | |||||||||||||||||||||||||||||||||||||||||||
|
|
|
|
|
|
|
| |||||||||||||||||||||||||||||||||||||||||||||||
Balance at May 31, 2012 | 67,906,369 | $ | - | $ | 192,338 | $ | (20,387 | ) | $ | 525,223 | $ | 697,174 | $ | 50,263 | $ | 747,437 | ||||||||||||||||||||||||||||||||||||||
|
|
|
|
|
|
|
| |||||||||||||||||||||||||||||||||||||||||||||||
See notes to consolidated financial statements.
WORTHINGTON INDUSTRIES, INC.
CONSOLIDATED STATEMENTS OF CASH FLOWS
(Dollars inIn thousands)
| Fiscal Years Ended May 31, | Fiscal Years Ended May 31, | |||||||||||||||||||||||
| 2009 | 2008 | 2007 | 2012 | 2011 | 2010 | |||||||||||||||||||
Operating activities: | ||||||||||||||||||||||||
Net earnings (loss) | $ | (108,214 | ) | $ | 107,077 | $ | 113,905 | |||||||||||||||||
Adjustments to reconcile net earnings (loss) to net cash provided by operating activities: | ||||||||||||||||||||||||
Bad debt expense | 8,307 | 1,398 | (903 | ) | ||||||||||||||||||||
Net earnings | $ | 125,353 | $ | 124,034 | $ | 51,507 | ||||||||||||||||||
Adjustments to reconcile net earnings to net cash provided by operating activities: | ||||||||||||||||||||||||
Depreciation and amortization | 64,073 | 63,413 | 61,469 | 55,873 | 61,058 | 64,653 | ||||||||||||||||||
Goodwill impairment | 96,943 | - | - | |||||||||||||||||||||
Restructuring charges, non-cash | 8,925 | 5,169 | - | |||||||||||||||||||||
Impairment of long-lived assets | 355 | 4,386 | 35,409 | |||||||||||||||||||||
Restructuring and other expense, non-cash | - | 203 | 3,408 | |||||||||||||||||||||
Joint venture transactions, non-cash | - | (21,652 | ) | - | ||||||||||||||||||||
Provision for deferred income taxes | (25,479 | ) | (3,228 | ) | (3,068 | ) | 775 | 7,482 | (6,110 | ) | ||||||||||||||
Bad debt expense (income) | 339 | 1,236 | (900 | ) | ||||||||||||||||||||
Equity in net income of unconsolidated affiliates, net of distributions | 8,491 | (8,539 | ) | 68,510 | (1,019 | ) | (19,188 | ) | (12,007 | ) | ||||||||||||||
Minority interest in net income of consolidated subsidiaries | 4,529 | 6,969 | 5,409 | |||||||||||||||||||||
Net loss on sale of assets | 1,317 | 3,756 | 826 | |||||||||||||||||||||
Net loss (gain) on sale of assets | (5,918 | ) | 652 | (3,908 | ) | |||||||||||||||||||
Stock-based compensation | 5,767 | 4,173 | 3,480 | 11,742 | 6,173 | 4,570 | ||||||||||||||||||
Excess tax benefits – stock-based compensation | (433 | ) | (2,035 | ) | (2,370 | ) | ||||||||||||||||||
Gain on sale of Aegis | (8,331 | ) | - | - | ||||||||||||||||||||
Changes in assets and liabilities: | ||||||||||||||||||||||||
Excess tax benefits—stock-based compensation | (578 | ) | (674 | ) | (165 | ) | ||||||||||||||||||
Gain on acquisitions and sales of subsidiary investments | - | - | (891 | ) | ||||||||||||||||||||
Changes in assets and liabilities, net of impact of acquisitions: | ||||||||||||||||||||||||
Receivables | 226,690 | 5,569 | 8,312 | 956 | (96,056 | ) | (114,892 | ) | ||||||||||||||||
Inventories | 329,892 | (144,474 | ) | 20,491 | 17,310 | (24,261 | ) | (64,499 | ) | |||||||||||||||
Prepaid expenses and other current assets | (20,805 | ) | 8,252 | (2,078 | ) | 8,478 | (10,465 | ) | 30,425 | |||||||||||||||
Other assets | (643 | ) | (1,546 | ) | 4,898 | 4,141 | 922 | 205 | ||||||||||||||||
Accounts payable and accrued expenses | (321,798 | ) | 138,822 | (99,283 | ) | (45,847 | ) | 31,098 | 125,613 | |||||||||||||||
Other liabilities | (14,905 | ) | (4,255 | ) | 833 | 1,689 | 6,947 | (1,999 | ) | |||||||||||||||
|
|
| ||||||||||||||||||||||
Net cash provided by operating activities | 254,326 | 180,521 | 180,431 | 173,649 | 71,895 | 110,419 | ||||||||||||||||||
|
|
| ||||||||||||||||||||||
Investing activities: | ||||||||||||||||||||||||
Investment in property, plant and equipment, net | (64,154 | ) | (47,520 | ) | (57,691 | ) | (31,713 | ) | (22,025 | ) | (34,319 | ) | ||||||||||||
Acquisitions, net of cash acquired | (42,199 | ) | (2,225 | ) | (31,727 | ) | (239,851 | ) | (31,705 | ) | (63,098 | ) | ||||||||||||
Distributions from (investments in) unconsolidated affiliates, net | 20,362 | (47,598 | ) | (1,000 | ) | 45,879 | (6,161 | ) | (483 | ) | ||||||||||||||
Proceeds from sale of assets | 6,883 | 1,025 | 18,237 | 37,089 | 20,614 | 15,950 | ||||||||||||||||||
Proceeds from sale of unconsolidated affiliates | 25,863 | - | - | |||||||||||||||||||||
Purchases of short-term investments | - | - | (25,562 | ) | ||||||||||||||||||||
Sales of short-term investments | - | 25,562 | 2,173 | |||||||||||||||||||||
|
|
| ||||||||||||||||||||||
Net cash used by investing activities | (53,245 | ) | (70,756 | ) | (95,570 | ) | (188,596 | ) | (39,277 | ) | (81,950 | ) | ||||||||||||
|
|
| ||||||||||||||||||||||
Financing activities: | ||||||||||||||||||||||||
Net proceeds from (payments on) short-term borrowings | (142,385 | ) | 103,800 | 31,650 | ||||||||||||||||||||
Net proceeds from (payments of) short-term borrowings | 97,626 | 132,956 | (980 | ) | ||||||||||||||||||||
Proceeds from long-term debt | 5,880 | - | 146,942 | |||||||||||||||||||||
Principal payments on long-term debt | (7,241 | ) | - | (7,691 | ) | (342 | ) | - | (138,013 | ) | ||||||||||||||
Proceeds from issuance of common shares | 3,899 | 13,171 | 9,866 | 11,116 | 4,827 | 2,313 | ||||||||||||||||||
Excess tax benefits – stock-based compensation | 433 | 2,035 | 2,370 | |||||||||||||||||||||
Excess tax benefits—stock-based compensation | 578 | 674 | 165 | |||||||||||||||||||||
Payments to minority interest | (7,152 | ) | (11,904 | ) | (3,360 | ) | (9,494 | ) | (10,992 | ) | (4,539 | ) | ||||||||||||
Repurchase of common shares | (12,402 | ) | (125,785 | ) | (76,617 | ) | (73,418 | ) | (132,764 | ) | - | |||||||||||||
Dividends paid | (53,686 | ) | (55,587 | ) | (59,018 | ) | (32,138 | ) | (30,168 | ) | (31,660 | ) | ||||||||||||
|
|
| ||||||||||||||||||||||
Net cash used by financing activities | (218,534 | ) | (74,270 | ) | (102,800 | ) | (192 | ) | (35,467 | ) | (25,772 | ) | ||||||||||||
|
|
| ||||||||||||||||||||||
Increase (decrease) in cash and cash equivalents | (17,453 | ) | 35,495 | (17,939 | ) | (15,139 | ) | (2,849 | ) | 2,697 | ||||||||||||||
Cash and cash equivalents at beginning of year | 73,772 | 38,277 | 56,216 | 56,167 | 59,016 | 56,319 | ||||||||||||||||||
|
|
| ||||||||||||||||||||||
Cash and cash equivalents at end of year | $ | 56,319 | $ | 73,772 | $ | 38,277 | $ | 41,028 | $ | 56,167 | $ | 59,016 | ||||||||||||
|
|
| ||||||||||||||||||||||
See notes to consolidated financial statements.
WORTHINGTON INDUSTRIES, INC.
NOTES TO CONSOLIDATED FINANCIAL STATEMENTS
Fiscal Years Ended May 31, 2009, 20082012, 2011 and 20072010
Note A – Summary of Significant Accounting Policies
Consolidation: The consolidated financial statements include the accounts of Worthington Industries, Inc. and consolidated subsidiaries (collectively, “we,” “our,” “Worthington,” or the “Company”). Spartan Steel Coating, LLC (owned 52%) is fully consolidated with the equity owned by the other joint venture member shown as minority interest on the consolidated balance sheets, and its portion of net earnings (loss) eliminated in miscellaneous expense. Investments in unconsolidated affiliates are accounted for using the equity method. Significant intercompany accounts and transactions are eliminated.
Spartan Steel Coating, LLC (“Spartan”), in which we own a 52% controlling interest, Worthington Nitin Cylinders Limited (“WNCL”), in which we own a 60% controlling interest, and PSI Energy Solutions, LLC (“PSI”), in which we own a 75% controlling interest, are fully consolidated with the equity owned by the respective other joint venture member shown as noncontrolling interest in our consolidated balance sheets, and the respective other joint venture member’s portion of net earnings shown as net earnings attributable to noncontrolling interest in our consolidated statements of earnings.
Deconsolidation of The Gerstenslager Company: On May 9, 2011, The Gerstenslager Company (“Gerstenslager”), the business unit comprising our Automotive Body Panels operating segment, closed an agreement with International Tooling Solutions, LLC, a tooling design and build company, to combine certain assets in a newly-formed joint venture, ArtiFlex Manufacturing, LLC (“ArtiFlex”).
Our contribution to ArtiFlex included all of our automotive body panels operations. However, we retained the accounts receivable and employee benefit obligations outstanding as of the closing date. In addition, we retained the land and building of Gerstenslager’s manufacturing facility located in Wooster, Ohio (the “Wooster Facility”), which became the subject of a lease agreement with ArtiFlex upon closing of the transaction. As a result of the change in our intended use of these long-lived assets, an impairment charge of $6,414,000 was recorded within the joint venture transactions caption in our fiscal 2011 consolidated statement of earnings.
In exchange for the contributed net assets, we received a 50% interest in ArtiFlex and certain cash and other consideration. As more fully described in “Note B – Investments in Unconsolidated Affiliates,” our investment in ArtiFlex is accounted for under the equity method, as our ownership interest does not constitute a controlling financial interest. As we do not have a controlling financial interest in ArtiFlex, the contributed net assets were deconsolidated effective May 9, 2011, resulting in a one-time gain of $15,040,000. Consistent with the impairment charges incurred in connection with the transaction, this gain was recorded within the joint venture transactions caption in our fiscal 2011 consolidated statement of earnings.
The following table summarizes the consideration received, the consideration transferred and the resulting net gain on deconsolidation:
| (in thousands) | ||||
Consideration received (at fair value): | ||||
Interest in ArtiFlex | $ | 28,404 | ||
Cash and other consideration | 9,235 | |||
|
| |||
Total consideration received | 37,639 | |||
Consideration transferred (at book value) | 22,599 | |||
|
| |||
Gain on deconsolidation | 15,040 | |||
Less: Impairment of long-lived assets | 6,414 | |||
|
| |||
Net gain on deconsolidation | $ | 8,626 | ||
|
| |||
In accordance with the applicable accounting guidance, our interest in ArtiFlex was recorded at its fair value as of the closing date. For additional information regarding the fair value of our interest in ArtiFlex, refer to “Note P – Fair Value Measurements.”
Deconsolidation of Dietrich Metal Framing: On March 1, 2011, we closed an agreement with Marubeni-Itochu Steel America, Inc. (“MISA”) to combine certain assets of Dietrich Metal Framing (“Dietrich”) and ClarkWestern Building Systems, LLC, in a newly-formed joint venture, ClarkWestern Dietrich Building Systems LLC (“ClarkDietrich”).
Our contribution to ClarkDietrich consisted of our metal framing business, including all of the related working capital and six of the 13 facilities. We retained and continued to operate the remaining facilities through August 31, 2011, to support the transition of the business into the new joint venture. The building and equipment associated with the majority of these facilities were sold during fiscal 2012. The remaining facilities are expected to be sold during fiscal 2013 and actions to locate buyers are ongoing. As the other relevant criteria for classification as assets held for sale have been satisfied, the $7,202,000 carrying value of these asset groups, which consist primarily of property, plant and equipment, is presented separately in our consolidated balance sheet as of May 31, 2012.
As a result of the change in our intended use of these long-lived assets, an impairment charge of $18,293,000 was recognized within the joint venture transactions line in our consolidated statements of earnings during the fourth quarter of fiscal 2011. Refer to “Note P – Fair Value Measurements” for additional information regarding this impairment charge.
In connection with this transaction, approximately $11,216,000 of restructuring charges were recognized during the fourth quarter of fiscal 2011, consisting of $7,183,000 of employee severance and $4,033,000 post-closure facility exit and other costs. These restructuring charges were also recorded within the joint venture transactions line in our fiscal 2011 consolidated statement of earnings.
In exchange for the contributed net assets, we received a 25% interest in ClarkDietrich and the assets of certain MISA Metals, Inc. (“MMI”) steel processing locations. As more fully described in “Note B – Investments in Unconsolidated Affiliates,” our investment in ClarkDietrich is accounted for under the equity method, as our ownership interest does not constitute a controlling financial interest. As we do not have a controlling financial interest in ClarkDietrich, the contributed net assets were deconsolidated effective March 1, 2011, resulting in a one-time gain of $31,319,000. Consistent with the impairment and restructuring charges incurred in connection with this transaction, this gain was recorded within the joint venture transactions caption in our fiscal 2011 consolidated statement of earnings.
The following table summarizes the consideration received, the consideration transferred and the resulting net gain on the deconsolidation:
| (in thousands) | ||||
Consideration received (at fair value): | ||||
MMI steel processing assets | $ | 72,600 | ||
Interest in ClarkDietrich | 58,250 | |||
Receivable for excess working capital | 4,862 | |||
|
| |||
Total consideration received | 135,712 | |||
Consideration transferred (at book value) | 104,393 | |||
|
| |||
Gain on deconsolidation | 31,319 | |||
Less: Impairment of long-lived assets | 18,293 | |||
Restructuring charges | 11,216 | |||
|
| |||
Net gain on deconsolidation | $ | 1,810 | ||
|
| |||
In accordance with the applicable accounting guidance, our interest in ClarkDietrich was recorded at its fair value as of the closing date. For additional information regarding the fair value of our interest in ClarkDietrich, refer to “Note P – Fair Value Measurements.”
Refer to “Note N – Acquisitions” for additional information regarding the accounting for the MMI steel processing assets acquired.
Use of Estimates: The preparation of financial statements in conformity with accounting principles generally accepted in the United States (“U.S. GAAP”) requires management to make estimates and assumptions that affect the amounts reported in the financial statements and accompanying notes. Actual results could differ from those estimates.
Cash and Cash Equivalents: We consider all highly liquid investments purchased with an original maturity of three months or less to be cash equivalents.
Inventories: Inventories are valued at the lower of cost or market. Cost is determined using the first-in, first-out method for all inventories. The rapid decline in steel prices during fiscal 2009 resulted in a situation where, based on our estimates,We believe our inventories were recorded at values in excessvalued appropriately as of current market prices. As a result, we recorded $105,015,000 of write-downs in the value of our inventories during fiscal 2009. Of this amount, $100,604,000 related to the consolidated operations of the Steel ProcessingMay 31, 2012 and Metal Framing business segments and is recorded within the consolidated statement of earnings in cost of goods sold, while $4,411,000 related to our portion of the loss recorded by our Mexican steel processing joint venture, and is recorded in equity in net income of unconsolidated affiliates.May 31, 2011.
Derivative Financial Instruments: We do not engage in currency or commodity speculation and generally enter intoutilize derivative financial instruments to manage exposure to certain risks related to our ongoing operations. The primary risks managed through the use of derivative instruments only to hedge specificinclude interest foreignrate risk, currency orexchange risk and commodity transactions.price risk. All derivative instruments are accounted for using mark-to-market accounting. The accounting for changes in the fair value of a derivative instrument depends on whether it has been designated and qualifies as part of a hedging relationship and, if so, the reason for holding it. Gains and losses on fair value hedges are recognized in current period earnings in the same line item as the underlying hedged item. The effective portion of gains and losses on cash flow hedges are deferred as a component of cumulativeaccumulated other comprehensive income (“AOCI”) and are recognized in earnings at the time the hedged item affects earnings, in the same line itemfinancial statement caption as the underlying hedged item. Ineffectiveness of the hedges during the fiscal year ended May 31, 20092012 (“fiscal 2009”2012”), the fiscal year ended May 31, 20082011 (“fiscal 2008”2011”) and the fiscal year ended May 31, 20072010 (“fiscal 2007”2010”) was immaterial. TheClassification in the consolidated statements of earnings classification of gains and losses related to derivative instruments that do not qualify for hedge accounting is determined based on the underlying intent of the instruments. Cash flows related to derivative instruments are generally classified as operating activities in theour consolidated statements of cash flows within operating activities.flows.
ForIn order for hedging relationships to qualify for hedge accounting under Statement of Financial Accounting Standards (“SFAS”) No. 133,Accounting for Derivative Instruments and Hedging Activities (“SFAS 133”),current accounting guidance, we formally document theeach hedging relationship and its risk management objective andobjective. This documentation includes the hedge strategy, the hedging instrument, the hedgehedged item, the nature of the risk being hedged, how the hedge instrument effectiveness against offsetting the hedged risk will be assessed prospectively and retrospectively andas well as a description of the method of measuringused to measure hedge ineffectiveness.
Derivative instruments are executed only with highly rated financial institutions. No credit loss is anticipated on existing instruments, and no such material losses have been experienced to date. The Company continuesWe continue to monitor itsour positions, as well as the credit ratings of counterparties to those positions.
We discontinue hedge accounting when it is determined that the derivative instrument is no longer effective in offsetting cash flows of the hedged item, the derivative instrumentrisk, expires or is sold, is terminated or is no longer designated as a hedging instrument because it is unlikely that a forecasted transaction will occur or we determine that designation of the hedging instrument is no longer appropriate. In all situations in which hedge accounting is discontinued and the derivative instrument is retained, we continue to carry the derivative instrument at its fair value on the consolidated balance sheetssheet and recognize any subsequent changes in its fair value in net earnings.earnings immediately. When it is probable that a forecasted transaction will not occur, we discontinue hedge accounting and immediately recognize immediately in net earningsthe gains and losses that were accumulated in other comprehensive income.AOCI.
Refer to “Note TO – Derivative Instruments and Hedging Activities” for additional information regarding the consolidated balance sheetssheet location and the risk classification of the Company’sour derivative instruments.
Investments in Unconsolidated Affiliates: Securities and Exchange Commission (“SEC”) Staff Accounting Bulletin No. 51,Accounting for Sales of Stock by a Subsidiary (“SAB 51”), provides guidance on accounting for the effect of changes in an unconsolidated affiliate's stock or equity on the parent's investment in that unconsolidated affiliate. SAB 51 allows election of an accounting policy of recording such increases or decreases in a parent's investment either in net earnings or in equity. We record such increases or decreases to our equity as additional paid-in capital.
Fair Value of Financial Instruments: The non-derivative financial instruments included in the carrying amounts of cash and cash equivalents, receivables, income tax receivables, other assets, accounts and notes payable, accrued expenses and income taxes payable, approximate fair values. The fair value of long-term debt, including current maturities, based upon quoted market prices, was $242,136,000 and $252,073,000 at May 31, 2009 and 2008, respectively.
Risks and Uncertainties: As of May 31, 2009, the Company,2012, we, together with our unconsolidated affiliates, operated 6079 production facilities in 2219 states and 1012 countries. Our largest markets are the construction andmarket is the automotive markets,market, which comprised 40% and 23%,34% of our consolidated net sales in fiscal 2009.2012. Our foreign operations represented 9%8% of consolidated net sales, had4% of pre-tax earnings that offset 17% of consolidated domestic pre-tax lossattributable to controlling interest, and represented 24%30% of consolidated net assets. Approximately 13%assets as of and for the Company'syear ended May 31, 2012. As of May 31, 2012, approximately 6% of our consolidated labor force iswas represented by collective bargaining agents. This includes 352 employees whose labor contracts expire or will otherwise require renegotiation within the fiscal year ending May 31, 2010.agreements. The concentration of credit risks from financial instruments related to the markets served by the Companywe serve is not expected to have a material adverse effect on the Company'sour consolidated financial position, cash flows or future results of operations.
In fiscal 2009,2012, our largest customer accounted for approximately 4%5% of our consolidated grossnet sales, and our ten largest customers accounted for approximately 22%24% of our consolidated grossnet sales. A significant loss of, or decrease in, business from any of these customers could have an adverse effect on our sales and financial results if we cannot obtain replacement business. Also, due to consolidation inwithin the industries we serve, including the construction, automotive and retail industries, our gross sales may be increasingly sensitive to deterioration in the financial condition of, or other adverse developments with respect to, one or more of our toplargest customers.
The volatile domestic and global recessionary climate, the disruption in capital and credit markets, declines in real estate values and reduced consumer spending are having significant negative impacts on our business. The global recession has resulted in a significant decrease in customer demand throughout nearly all of our markets, including our two largest – construction and automotive.
Demand in the commercial and residential construction markets has weakened as it has become more difficult for companies and consumers to obtain credit for construction projects and the economic slowdown has caused delays in or cancellations of construction projects. Our automotive business is largely driven by the production schedules of General Motors, Ford and Chrysler, as well as their suppliers. The domestic auto industry is currently experiencing a very difficult operating environment, which has resulted in and will likely continue to result in lower levels of vehicle production and an associated decrease in demand for products sold to the automotive industry. Many automotive manufacturers and their suppliers are having financial difficulties and have reduced production levels and eliminated manufacturing capacity. Similar difficulties are being experienced in our other markets and by our customers in those markets. While the Company has taken actions to mitigate the impact of these conditions, if they persist, they could continue to adversely impact the Company’s consolidated position, cash flows and future results of operations.
Our principal raw material is flat-rolled steel, which we purchase from multiple primary steel producers. The steel industry as a whole has been cyclical, and at times availability and pricing can be volatile due to a number of factors beyond our control. This volatility can significantly affect our steel costs. In an environment of increasing prices for steel and other raw materials, in general, competitive conditions may impact how much of the price increases we can pass on to our customers. To the extent we are unable to pass on future price increases in our raw materials to our customers, our financial results could be adversely affected. Also, if steel prices decrease, in general, competitive conditions may impact how quickly we must reduce our prices to our customers and we could be forced to use higher-priced raw materials to complete orders for which the selling prices have decreased. Also, decreasedDeclining steel prices cancould also require the Companyus to write-down the value of its inventoryour inventories to reflect current market pricing, as was the case during fiscal 2009.pricing. Further, the number of suppliers has decreased in recent years due to industry consolidation and the financial difficulties of certain suppliers, and consolidation may continue. Accordingly, if delivery from a major steel supplier is disrupted, it may be more difficult to obtain an alternative supply than in the past.
Receivables: We review our receivables on an ongoing basis to ensure that they are properly valued and collectible. This is accomplished through two contra-receivable accounts: returns and allowances and allowance for doubtful accounts. Returns and allowances, including limited warranties on certain products, are used to record estimates of returns or other allowances resulting from quality, delivery, discounts or other issues affecting the value of receivables. This account is estimated based on historical trends and current market conditions, with the offset to net sales. The portion of the liability related to product warranties was immaterial at May 31, 2012 and 2011.
The allowance for doubtful accounts is used to record the estimated risk of loss related to the customers’ inability to pay. This allowance is maintained at a level that we consider appropriate based on factors that affect collectability, such as the financial health of the customer,our customers, historical trends of charge-offs and recoveries and current economic and market conditions. As we monitor our receivables, we identify customers that may have payment problems, and we adjust the allowance accordingly, with the offset to Selling,selling, general and administrative (“SG&A”) expense. Account balances are charged off against the allowance when recovery is considered remote. The allowance for doubtful accounts decreased approximately $821,000 during fiscal 2012 to $3,329,000.
Based on the ongoing review of receivables, we have increased our allowances by $7.6 million to $12.5 million since May 31, 2008. This increase is principally tied to customers in the automotive industry; and, based on our current information,
While we believe our allowances are sized appropriately. However, ifadequate, changes in economic conditions, the financial health of customers and bankruptcy settlements could impact our future earnings. If the economic environment and market conditions do not improve,deteriorate, particularly in the automotive and construction end markets where our exposure is greatest, additional reserves may be required.
Property and Depreciation: Property, plant and equipment are carried at cost and depreciated using the straight-line method. Buildings and improvements are depreciated over 10 to 40 years and machinery and equipment over 3 to 20 years. Depreciation expense was $60,178,000 for$50,644,000, $57,765,000 and $60,529,000 during fiscal 2009, $61,154,000 for2012, fiscal 2008,2011 and $59,478,000 for fiscal 2007.2010, respectively. The decrease in depreciation expense in fiscal 2012 and fiscal 2011 resulted largely from the deconsolidation of Dietrich and Gerstenslager in the fourth quarter of fiscal 2011. Accelerated depreciation methods are used for income tax purposes.
Goodwill and Other Long-Lived Assets: We use the purchase method of accounting for any business combinations initiated after June 30, 2002, and recognize amortizable intangible assets separately from
goodwill. The purchase price in an acquisition is allocated to the acquired assets and assumed liabilities in an acquisition are measured and recognized based on their estimated fair values at the date of acquisition, with goodwill representing the excess of the purchase price over the fair value allocatedof the identifiable net assets. A bargain purchase may occur, wherein the fair value of identifiable net assets exceeds the purchase price, and a gain is then recognized in the amount of that excess. Goodwill and intangible assets with indefinite lives are not amortized, but instead are tested for impairment annually, during the fourth quarter, or more frequently if events or changes in circumstances indicate that impairment may be present. Application of goodwill impairment testing involves judgment, including but not limited to, the identification of reporting units and estimation of the fair value of each reporting unit. A reporting unit is defined as an operating segment or one level below an operating segment. We test goodwill at the operating segment level as we have determined that the characteristics of the reporting units within each operating segment are similar and allow for their aggregation in accordance with the applicable accounting guidance.
The goodwill impairment test consists of comparing the fair value of each operating segment, determined using discounted cash flows, to each operating segment’s respective carrying value. If the estimated fair value of an operating segment exceeds its carrying value, there is no impairment. If the carrying amount of the operating segment exceeds its estimated fair value, a goodwill impairment is indicated. The amount of the impairment is determined by comparing the fair value of the net assets. Under SFAS No. 142,Goodwill and Other Intangible Assets,assets of the operating segment, excluding goodwill, to its estimated fair value, with the difference representing the implied fair value of the goodwill. If the implied fair value of the goodwill is lower than its carrying value, the difference is recorded as an impairment charge in our consolidated statements of earnings.
We performed our annual impairment evaluation of goodwill and other indefinite-lived intangible assets are no longer amortized but are reviewed for impairment. The annual impairment test is performed during the fourth quarter of fiscal 2012 and fiscal 2011 and concluded that the fair value of each fiscal year. We havereporting unit exceeded its carrying value; therefore, no intangible assets with indefinite lives other than goodwill.impairment charges were recognized. However, future declines in the market and deterioration in earnings could lead to impairment charges in subsequent periods.
We review the carrying value of our long-lived assets, including intangible assets with finite useful lives, for impairment whenever events or changes in circumstances indicate that the carrying value of an asset or aasset group of assets may not be recoverable. WhenImpairment testing involves a potential impairment is indicated, accounting standards require a charge to be recognized incomparison of the financial statements ifsum of the carrying amount of an asset or group of assets exceeds the fair value of that asset or group of assets. The loss recognized would be the difference between the fair value and the carrying amountundiscounted future cash flows of the asset or asset group to its respective carrying amount. If the sum of assets.the undiscounted future cash flows exceeds the carrying amount, then no impairment exists. If the carrying amount exceeds the sum of the undiscounted future cash flows, then a second step is performed to determine the amount of impairment, if any, to be recognized. The loss recognized is equal to the amount that the carrying value of the asset or asset group exceeds fair value.
The Company’sOur impairment testing for both goodwill and other long-lived assets, including intangible assets with finite useful lives, areis largely based on discounted cash flow models that require significant judgment and require assumptions about future volume trends, revenue and expense growth rates; and, in addition, external factors
such as changes in economic trends and cost of capital. Significant changes in any of these assumptions could impact the outcomes of the tests performed.
Planned Maintenance Activities: We use the deferral method to account See “Note C – Goodwill and Other Intangible Assets” for costs of planned maintenance shutdowns. Under this method, the costs of a qualifying shutdown are capitalizedadditional details regarding these assets and amortized on a straight-line basis into maintenance expense until the next anticipated shutdown. In no case will the amortization period exceed twelve months.related impairment testing.
Leases: Certain lease agreements contain fluctuating or escalating payments and rent holiday periods. The related rent expense is recorded on a straight-line basis over the length of the lease term. Leasehold improvements made by the lessee, whether funded by the lessee or by landlord allowances or incentives, are recorded as leasehold improvement assets and will be amortized over the shorter of the economic life or the lease term. These incentives are also recorded as deferred rent and amortized as reductions in rent expense over the lease term.
Capitalized Interest: We capitalize interest in connection with the construction of qualified assets. Under this policy, we capitalized interest of $346,000 in fiscal 2009, $146,000 in fiscal 2008, and $1,757,000 in fiscal 2007.
Stock-Based Compensation: At May 31, 2009,2012, we had stock-based compensation plans for our employees andas well as our non-employee directors which areas described more fully in “Note FI – Stock-Based Compensation.” All share-based awards, including grants of stock options, are recorded as expense in the consolidated statements of earnings based on their grant-date fair values.
Revenue Recognition: Recognition: We recognize revenue upon transfer of title and risk of loss provided evidence of an arrangement exists, pricing is fixed and determinable and collectabilitythe ability to collect is probable. We provide, through charges to net sales, for returns and allowances based on experience and current customer activities. We also provide, through charges to net sales, for customer rebates and sales discounts based on specific agreements and recent and anticipated levels of customer activity. In circumstances where the collection of payment is highly questionablenot probable at the time of shipment, we defer recognition of revenue until payment is collected. We provide for expected returns and allowances based on experience and current customer activities. As of May 31, 2009 and May 31, 2008, we had deferred $9,304,000 and $9,140,000, respectively, of revenue related to pricing disputes. Within
The business units that comprise the Construction Services businessWorthington Global Group (the “Global Group”) operating segment, which representedhave contributed less than 5% of consolidated net sales for each of the last three fiscal years, recognize revenue is recognized on a percentage-of-completion method. Taxes collected from customers on revenues are reported on a net basis (excluded from revenues).Refer to “Note M – Segment Data” for additional information.
Advertising Expense: We expense advertising costs as incurred. Advertising expense was $4,813,000, $4,220,000,$4,788,000, $3,817,000 and $4,117,000$3,838,000 for fiscal 2009,2012, fiscal 20082011 and fiscal 2007,2010, respectively.
Shipping and Handling Fees and Costs: Shipping and handling fees billed to customers are included in net sales, and shipping and handling costs incurred are included in cost of goods sold.
Environmental Costs: Environmental costs are capitalized if the costs extend the life of the property, increase its capacity, and/or mitigate or prevent contamination from future operations. Costs related to environmental contamination treatment and clean up are charged to expense.
Statements of Cash Flows: Supplemental cash flow information was as follows for the fiscal years ended May 31 is as follows:31:
| In thousands | 2009 | 2008 | 2007 | ||||||
Interest paid, net of amount capitalized | $ | 20,964 | $ | 21,442 | $ | 21,884 | |||
Income taxes paid, net of refunds | 41,679 | 29,641 | 49,600 | ||||||
| (in thousands) | 2012 | 2011 | 2010 | |||||||||
Interest paid, net of amount capitalized | $ | 18,281 | $ | 17,358 | $ | 9,814 | ||||||
Income taxes paid, net of (refunds) | 46,445 | 53,194 | (1,601 | ) | ||||||||
We use the “cumulative earnings” approach for determining cash flow presentation of distributions from our unconsolidated joint ventures. Distributions received on the investments are included in our consolidated statements of cash flows inas operating activities, unless the cumulative distributions exceed our portion of the cumulative equity in the net earnings of the joint venture, in which case the excess distributions are deemed to be returns of the investment and are classified as investing activityactivities in our consolidated statements of cash flows.
Income Taxes: In accordance with the provisions of SFAS No. 109,Accounting for Income Taxes (“SFAS 109”), weWe account for income taxes using the asset and liability method. The asset and liability method requires the recognition of deferred tax assets and liabilities for expected future tax consequences of temporary differences that currently exist between the tax basis and the financial reporting basis of our assets
and liabilities. In assessing the realizability of deferred tax assets, we consider whether it is more likely than not that some, or a portion, of the deferred tax assets will not be realized. We provide a valuation allowance for deferred income tax assets when it is more likely than not that a portion of such deferred income tax assets will not be realized.
In accordance with FASB Interpretation No. 48,Accounting for Uncertainty in Income Taxes—an interpretation of FASB Statement No. 109, taxTax benefits from uncertain tax positions that are recognized in the consolidated financial statements are measured based on the largest benefit that has a greater than fifty percent likelihood of being realized upon ultimate settlement.
We have reserves for taxes and associated interest and penalties that are determined in accordance with FIN 48, that may become payable in future years as a result of audits by taxing authorities. It is our policy to record these in income tax expense. While we believe the positions taken on previously filed tax returns are appropriate, we have established the tax and interest reserves in recognition that various taxing authorities may challenge our positions. The tax reserves are analyzed periodically, and adjustments are made as events occur to warrant adjustment to the reserves, such as lapsing of applicable statutes of limitations, conclusion of tax audits, additional exposure based on current calculations, identification of new issues and release of administrative guidance or court decisions affecting a particular tax issue.
Self-Insurance Reserves: We are largely self-insured with respect to workers’ compensation, general and automobile liability, property damage, employee medical claims and other potential losses. In order to reduce risk and better manage our overall loss exposure, we purchase stop-loss insurance that covers individual claims in excess of the deductible amounts. We maintain reserves for the estimated cost to settle open claims, which includes estimates of legal costs expected to be incurred, as well as an estimate of the cost of claims that has been incurred but not reported. These estimates are based on actuarial valuations that take into consideration the historical average claim volume, the average cost for settled claims, current trends in claim costs, changes in our business and workforce, general economic factors and other assumptions believed to be reasonable under the circumstances. The estimated reserves for these liabilities could be affected if future occurrences and claims differ from assumptions used and historical trends.
Recently Issued Accounting Standards: In September 2006,December 2011, new accounting guidance was issued that establishes certain additional disclosure requirements about financial instruments and derivatives instruments that are subject to netting arrangements. The new disclosures are required for annual reporting periods beginning on or after January 1, 2013, and interim periods within those periods. We do not expect the FASB issued SFAS No. 157,Fair Value Measurements, to establish a framework for measuring fair value and expand disclosures about fair value measurements. SFAS No. 157 was effective for financial assets and liabilities after May 31, 2008, and for non-financial assets and liabilities is effective after May 31, 2009. SFAS No. 157 has not had, and is not expectedadoption of this amended accounting guidance to have a material impact on our consolidated financial statements.
In December 2007, the FASB issued SFAS No. 141 (revised 2007) (“SFAS No. 141(R)”),Business Combinations,to improve the relevance, representational faithfulness and comparability of the information that a reporting entity provides in its financial reports about a business combination and its effects. SFAS No. 141(R) applies prospectively to business combinations after May 31, 2009, and is not expected to materially impact our consolidated financial position or results of operations.
In May 2011, amended accounting guidance was issued that resulted in common fair value measurements and disclosures under both U.S. GAAP and International Financial Reporting Standards. This amended guidance is explanatory in nature and does not require additional fair value measurements nor is it intended to result in significant changes in the application of current guidance. The amended guidance is effective for interim and annual periods beginning after December 15, 2011. Our adoption of this amended accounting guidance on March 1, 2012, did not have a material impact on our financial position or results of operations.
In December 2007,June 2011, new accounting guidance was issued regarding the FASB issued SFAS No. 160,Noncontrolling Interests In Consolidated Financial Statements – an amendmentpresentation of ARB No. 51,comprehensive income in financial statements prepared in accordance with U.S. GAAP. This new guidance requires entities to improvepresent reclassification adjustments included in other comprehensive income on the relevance, comparability and transparencyface of the financial information that a reporting entity provides in its consolidated financial statements by establishing accounting and reporting standards forallows entities to present total comprehensive income, the noncontrolling interest (minority interest)components of net income and the components of other comprehensive income either in a subsidiary andsingle continuous statement of comprehensive income or in two separate but consecutive statements. It also eliminates the option for entities to present the deconsolidationcomponents of a subsidiary. SFAS No. 160 is effective June 1, 2009, and will affect the accounting treatment of future acquisitions that we may consummate.
In April 2008, the FASB issued FASB Staff Position (“FSP”) No. FAS 142-3,Determinationother comprehensive income as part of the Useful Lifestatement of Intangible Assets (“FSP No. 142-3”). FSP 142-3 amends the factors that should be considered in developing renewal or extension assumptions used to determine the useful life of a recognized intangible asset under SFAS No. 142,Goodwill and Other Intangible Assets. FSP 142-3equity. For public companies, this accounting guidance is effective for fiscal years (and interim periods within those fiscal years) beginning after
December 15, 2011, with early adoption permitted. Retrospective application to prior periods is required. The adoption of this new guidance, effective for us on June 1, 2012, will not impact our financial statementsposition or results of operations. In December 2011, certain provisions of this new guidance related to the presentation of reclassification adjustments out of accumulated other comprehensive income were temporarily deferred to a later date that has yet to be determined. We are in the process of determining our method of presentation; however, we do not anticipate the adoption of this new accounting guidance will have a material impact on our financial position or results of operations.
In September 2011, amended accounting guidance was issued that simplifies how an entity tests goodwill for impairment. The amended guidance allows an entity to first assess qualitative factors to determine whether it is necessary to perform the two-step quantitative goodwill impairment test. The two-step quantitative impairment test is required only if, based on its qualitative assessment, an entity determines that it is more likely than not that the fair value of a reporting unit is less than its carrying amount. The amended guidance is effective for interim and annual goodwill impairment tests performed for fiscal years beginning after December 15, 2008, as well as interim periods within those fiscal years. We are currently in the process of evaluating the impact of adopting this pronouncement.
In November 2008, the FASB ratified EITF Issue 08-6,Equity Method Investment Accounting Considerations, (“EITF Issue 08-06”) which clarifies the accounting for certain transactions and impairment considerations involving equity method investments. EITF Issue 08-06 is effective for fiscal years beginning on or after December 15, 2008, and interim periods within those years.2011. We do not expect EITF Issue 08-06the adoption of this amended accounting guidance to have a material impact on our consolidated financial statements.position or results of operations.
Note B – Investments in Unconsolidated Affiliates
In December 2008,Our investments in affiliated companies that we do not control, either through majority ownership or otherwise, are accounted for using the FASB issued FSP No. FAS 132(R)-1,Employers’ Disclosures about Postretirement Benefit Plan Assets – an amendmentequity method. At May 31, 2012, these equity investments and the percentage interests owned consisted of: ArtiFlex (50%), ClarkDietrich (25%), Gestamp Worthington Wind Steel, LLC (the “Gestamp JV”) (50%), Samuel Steel Pickling Company (31%), Serviacero Planos, S. de R. L. de C.V. (50%), TWB Company, L.L.C. (45%), Worthington Armstrong Venture (“WAVE”) (50%), Worthington Modern Steel Framing Manufacturing Co., Ltd. (“WMSFMCo.”) (40%), and Worthington Specialty Processing (“WSP”) (51%). WSP is considered to be jointly controlled and not consolidated due to substantive participating rights of FASB Statement No. 132(R) (“FSP FAS 132(R)-1”). FSP FAS 132(R)-1 expands the disclosure requirements under FASB Statement No. 132(R),Employers’ Disclosures about Pensions and Other Postretirement Benefitsminority partner.
During January 2012, we sold our 49% equity interest in LEFCO Worthington, LLC, to include disclosure on investment policies and strategies, major categoriesthe other member of plan assets, fair value measurements for each major category of plan assets segregated by fair value hierarchy level as defined in SFAS 157, the effect of fair value measurements using Level 3 inputs on changes in plan assets for the period, and significant concentrations of risk within plan assets. FSP FAS 132(R)-1 is effective for financial statements issued for fiscal years ending after December 15, 2009.joint venture. The adoptionimpact of this standard will require expanded disclosuretransaction was immaterial.
On May 9, 2011, we joined with International Tooling Solutions, LLC to form ArtiFlex, a joint venture that provides an integrated solution for engineering, tooling, stamping, assembly and other services to customers primarily in the notes toautomotive industry. We contributed our automotive body panels business in exchange for a 50% ownership interest. Our investment in this joint venture is accounted for under the Company’s consolidatedequity method, as our ownership interest does not constitute a controlling financial statements but will not impactinterest.
In accordance with the applicable accounting guidance, our consolidated financial statements.
In April 2009, the FASB issued FSP No. FAS 141(R)-1,Accounting for Assets Acquired and Liabilities Assumedinvestment in a Business Combination That Arise from Contingencies (“FSP No. 141(R)-1”). FSP No. 141(R)-1 requires that assets acquired and liabilities assumed in a business combination that arise from contingencies beArtiFlex was recognized at fair value ifbased on the total enterprise fair value canof the joint venture of approximately $56,808,000. This amount exceeded the book value of the underlying equity in the net assets of the joint venture by approximately $31,098,000. Our share of this excess fair value, or cost, is included within the carrying value of our investment in the unconsolidated affiliate and recognized as an adjustment to equity income in periods subsequent to acquisition. We attributed this excess fair value to the following assets:
| (in thousands) | ||||
Inventories (1) | $ | 1,900 | ||
Intangible assets (2) | 8,200 | |||
Property, plant and equipment, net (3) | 8,198 | |||
|
| |||
Total identifiable assets | 18,298 | |||
Equity method goodwill (4) | 12,800 | |||
|
| |||
Total excess fair value | $ | 31,098 | ||
|
| |||
| (1) | Recognized as an adjustment to equity income as the related inventories are sold. |
| (2) | Includes $7,500,000 related to definite-lived intangible assets. This amount will be amortized to equity income over the estimated useful lives of those assets. The remaining $700,000 relates to intangible assets with indefinite useful lives, which will be reviewed for impairment in accordance with the applicable accounting guidance and, to the extent impaired, recognized as a reduction to equity income. |
| (3) | Recognized as an adjustment to equity income over the estimated useful lives of the related assets in a manner consistent with depreciation. |
| (4) | Will be reviewed for impairment in accordance with the applicable accounting guidance and, to the extent impaired, recognized as a reduction to equity income. |
On March 18, 2011, we joined with Gestamp Renewables group to create the Gestamp JV, a 50%-owned joint venture focused on producing towers for wind turbines being constructed in North America. The Gestamp JV planned to construct its initial production facility in Cheyenne, Wyoming; however, due to the volatile political environment in the United States, particularly in regards to the Federal Production Tax Credit, construction of this facility has been placed on hold. Our investment in this joint venture is accounted for under the equity method, as our ownership interest does not constitute a controlling financial interest.
On March 1, 2011, we joined with ClarkWestern Building Systems, Inc. to form ClarkDietrich, a joint venture that manufactures a full line of drywall studs and accessories, structural studs and joists, metal lath and accessories, and shaft wall studs and track used primarily in residential and commercial construction. We contributed our metal framing business and related working capital in exchange for a 25% ownership interest in ClarkDietrich in addition to the assets of certain MISA Metals, Inc. steel processing locations. Our investment in this joint venture is accounted for under the equity method, as our ownership interest does not constitute a controlling financial interest.
In accordance with the applicable accounting guidance, our investment in ClarkDietrich was recognized at fair value based on the total enterprise fair value of the joint venture of approximately $233,000,000. This amount exceeded the book value of the underlying equity in the net assets of the joint venture by approximately $20,320,000. Our share of this excess fair value, or cost, is included within the carrying value of our investment in the unconsolidated affiliate and recognized as an adjustment to equity income in periods subsequent to acquisition. We attributed this excess fair value to the following assets:
| (in thousands) | ||||
Inventories (1) | $ | 15,000 | ||
Intangible assets (2) | 14,400 | |||
Property, plant and equipment, net (3) | (10,180 | ) | ||
|
| |||
Total identifiable assets | 19,220 | |||
Equity method goodwill (4) | 1,100 | |||
|
| |||
Total excess fair value | $ | 20,320 | ||
|
| |||
| (1) | Recognized as an adjustment to equity income as the related inventories are sold. |
| (2) | Includes $8,960,000 related to definite-lived intangible assets. This amount will be amortized to equity income over the estimated useful lives of those assets. The remaining $5,440,000 relates to intangible assets with indefinite useful lives, which will be reviewed for impairment in accordance with the applicable accounting guidance and, to the extent impaired, recognized as a reduction to equity income. |
| (3) | Recognized as an adjustment to equity income over the estimated useful lives of the related assets in a manner consistent with depreciation. |
| (4) | Will be reviewed for impairment in accordance with the applicable accounting guidance and, to the extent impaired, recognized as a reduction to equity income. |
On November 19, 2010, we joined with Hubei Modern Urban Construction and Development Group Co., Ltd. to create WMSFMCo. We contributed approximately $6,100,000 of cash in exchange for a 40% ownership interest. The purpose of WMSFMCo. is to design, manufacture, assemble and distribute steel framing
materials and accessories for construction projects in five Central Chinese provinces and to provide project management and building design and construction supply services thereto. Our investment in this joint venture is accounted for under the equity method, as our ownership interest does not constitute a controlling financial interest.
Worthington acquired certain assets from Gibraltar Industries, Inc. and its subsidiaries (collectively, “Gibraltar”) on February 1, 2010. Included in the assets acquired was a 31.25% ownership interest in Samuel Steel Pickling Company, a joint venture which operates a steel pickling facility in Twinsburg, Ohio, and another in Cleveland, Ohio. Our investment in this joint venture is accounted for under the equity method, as our ownership interest does not constitute a controlling financial interest.
We received distributions from unconsolidated affiliates totaling $138,471,000, $57,146,000 and $52,970,000 in fiscal 2012, fiscal 2011 and fiscal 2010, respectively, including a one-time special dividend of $50,000,000 in connection with a refinancing transaction completed by WAVE in December 2011. We have received cumulative distributions from WAVE in excess of our investment balance, which resulted in an amount recorded within other liabilities on our consolidated balance sheets of $69,165,000 and $10,715,000 at May 31, 2012 and 2011, respectively. In accordance with the applicable accounting guidance, we reclassify the negative balance to the liability section of our consolidated balance sheet. We will continue to record our equity in the net income of WAVE as a debit to the investment account, and if it becomes positive, it will again be reasonably estimated. FSP No. 141(R)-1shown as an asset on our consolidated balance sheet. If it becomes probable that any excess distribution may not be returned (upon joint venture liquidation or otherwise), we will recognize any balance classified as a liability as income immediately.
We use the “cumulative earnings” approach for determining cash flow presentation of distributions from our unconsolidated joint ventures. Distributions received are included in our consolidated statements of cash flows as operating activities, unless the cumulative distributions exceed our portion of the cumulative equity in the net earnings of the joint venture, in which case the excess distributions are deemed to be returns of the investment and are classified as investing activities in our consolidated statements of cash flows.
The following table presents combined information of the financial position for affiliated companies accounted for using the equity method as of May 31, 2012 and 2011:
| (in thousands) | 2012 | 2011 | ||||||
Current assets | $ | 626,975 | $ | 597,222 | ||||
Noncurrent assets | 345,500 | 260,805 | ||||||
|
|
|
| |||||
Total assets | $ | 972,475 | $ | 858,027 | ||||
|
|
|
| |||||
Current liabilities | $ | 174,016 | $ | 184,467 | ||||
Current maturities of long-term debt | 5,305 | - | ||||||
Long-term debt | 289,308 | 150,229 | ||||||
Other noncurrent liabilities | 21,934 | 5,365 | ||||||
Equity | 481,912 | 517,966 | ||||||
|
|
|
| |||||
Total liabilities and equity | $ | 972,475 | $ | 858,027 | ||||
|
|
|
| |||||
The following table presents financial results of our three largest affiliated companies for the fiscal years ended May 31, 2012, 2011 and 2010. All other affiliated companies are combined and presented in the Other category.
| (in thousands) | 2012 | 2011 | 2010 | |||||||||
Net sales | ||||||||||||
WAVE | $ | 364,530 | $ | 346,717 | $ | 319,821 | ||||||
ClarkDietrich | 564,624 | 165,807 | - | |||||||||
TWB | 312,943 | 272,191 | 220,500 | |||||||||
Other | 443,646 | 249,716 | 168,458 | |||||||||
|
|
|
|
|
| |||||||
Total net sales | $ | 1,685,743 | $ | 1,034,431 | $ | 708,779 | ||||||
|
|
|
|
|
| |||||||
Gross margin | ||||||||||||
WAVE | $ | 163,563 | $ | 154,194 | $ | 146,045 | ||||||
ClarkDietrich | 61,703 | 17,115 | - | |||||||||
TWB | 42,124 | 34,756 | 29,753 | |||||||||
Other | 62,758 | 32,018 | 13,824 | |||||||||
|
|
|
|
|
| |||||||
Total gross margin | $ | 330,148 | $ | 238,083 | $ | 189,622 | ||||||
|
|
|
|
|
| |||||||
Operating income | ||||||||||||
WAVE | $ | 127,305 | $ | 116,295 | $ | 111,524 | ||||||
ClarkDietrich | 27,094 | 8,323 | - | |||||||||
TWB | 28,141 | 21,470 | 14,982 | |||||||||
Other | 38,473 | 22,056 | 4,660 | |||||||||
|
|
|
|
|
| |||||||
Total operating income | $ | 221,013 | $ | 168,144 | $ | 131,166 | ||||||
|
|
|
|
|
| |||||||
Depreciation and amortization | ||||||||||||
WAVE | $ | 4,142 | $ | 3,991 | $ | 3,767 | ||||||
ClarkDietrich | 14,271 | 8 | - | |||||||||
TWB | 3,259 | 3,900 | 3,783 | |||||||||
Other | 12,481 | 3,553 | 3,140 | |||||||||
|
|
|
|
|
| |||||||
Total depreciation and amortization | $ | 34,153 | $ | 11,452 | $ | 10,690 | ||||||
|
|
|
|
|
| |||||||
Interest expense | ||||||||||||
WAVE | $ | 3,427 | $ | 1,375 | $ | 1,366 | ||||||
ClarkDietrich | 3 | - | - | |||||||||
TWB | - | - | - | |||||||||
Other | 2,617 | 137 | 116 | |||||||||
|
|
|
|
|
| |||||||
Total interest expense | $ | 6,047 | $ | 1,512 | $ | 1,482 | ||||||
|
|
|
|
|
| |||||||
Income tax expense | ||||||||||||
WAVE | $ | 2,789 | $ | 2,669 | $ | 2,457 | ||||||
ClarkDietrich | - | - | - | |||||||||
TWB | 5,458 | 4,233 | 1,408 | |||||||||
Other | 6,867 | 3,224 | 1,760 | |||||||||
|
|
|
|
|
| |||||||
Total income tax expense | $ | 15,114 | $ | 10,126 | $ | 5,625 | ||||||
|
|
|
|
|
| |||||||
Net earnings | ||||||||||||
WAVE | $ | 121,261 | $ | 112,544 | $ | 107,776 | ||||||
ClarkDietrich | 27,203 | 8,331 | - | |||||||||
TWB | 22,952 | 18,022 | 14,469 | |||||||||
Other | 30,317 | 17,782 | 5,592 | |||||||||
|
|
|
|
|
| |||||||
Total net earnings | $ | 201,733 | $ | 156,679 | $ | 127,837 | ||||||
|
|
|
|
|
| |||||||
At May 31, 2012, $32,958,000 of our consolidated retained earnings represented undistributed earnings, net of tax, of our unconsolidated affiliates.
Note C — Goodwill and Other Intangible Assets
Goodwill
The following table summarized the changes in the carrying amount of goodwill during fiscal 2012 and fiscal 2011 by reportable business segment:
| Pressure Cylinders | Engineered Cabs | Metal Framing | Other | Total | ||||||||||||||||
| (in thousands) | ||||||||||||||||||||
Balance at May 31, 2010 | ||||||||||||||||||||
Goodwill | $ | 79,543 | $ | - | $ | 96,943 | $ | 24,651 | $ | 201,137 | ||||||||||
Accumulated impairment losses | - | - | (96,943 | ) | (24,651 | ) | (121,594 | ) | ||||||||||||
|
|
|
|
|
|
|
|
|
| |||||||||||
| 79,543 | - | - | - | 79,543 | ||||||||||||||||
Acquisitions and purchase accounting adjustments | 11,536 | - | - | - | 11,536 | |||||||||||||||
Translation adjustments | 2,554 | - | - | - | 2,554 | |||||||||||||||
|
|
|
|
|
|
|
|
|
| |||||||||||
Balance at May 31, 2011 | ||||||||||||||||||||
Goodwill | 93,633 | - | 96,943 | 24,651 | 215,227 | |||||||||||||||
Accumulated impairment losses | - | - | (96,943 | ) | (24,651 | ) | (121,594 | ) | ||||||||||||
|
|
|
|
|
|
|
|
|
| |||||||||||
| 93,633 | - | - | - | 93,633 | ||||||||||||||||
|
|
|
|
|
|
|
|
|
| |||||||||||
Acquisitions and purchase accounting adjustments | 17,730 | 45,230 | - | 5,651 | 68,611 | |||||||||||||||
Translation adjustments | (5,563 | ) | - | - | - | (5,563 | ) | |||||||||||||
|
|
|
|
|
|
|
|
|
| |||||||||||
Balance at May 31, 2012 | ||||||||||||||||||||
Goodwill | 105,800 | 45,230 | 96,943 | 30,302 | 278,275 | |||||||||||||||
Accumulated impairment losses | - | - | (96,943 | ) | (24,651 | ) | (121,594 | ) | ||||||||||||
|
|
|
|
|
|
|
|
|
| |||||||||||
| $ | 105,800 | $ | 45,230 | $ | - | $ | 5,651 | $ | 156,681 | |||||||||||
|
|
|
|
|
|
|
|
|
| |||||||||||
The increase in the carrying amount of goodwill during fiscal 2012 and fiscal 2011 resulted primarily from acquisitions completed during those respective fiscal years. For additional information regarding these acquisitions, refer to “Note N – Acquisitions.”
Other Intangible Assets
Intangible assets with definite lives are amortized on a straight-line basis over their estimated useful lives, which range from one to 20 years. The following table summarizes other intangible assets by class as of May 31, 2012 and 2011:
| 2012 | 2011 | |||||||||||||||
| (in thousands) | Cost | Accumulated Amortization | Cost | Accumulated Amortization | ||||||||||||
Indefinite-lived intangible assets: | ||||||||||||||||
Trademarks | $ | 27,581 | $ | - | $ | 850 | $ | - | ||||||||
|
|
|
|
|
|
|
| |||||||||
Total indefinite-lived intangible assets | 27,581 | - | 850 | - | ||||||||||||
Definite-lived intangible assets: | ||||||||||||||||
Patents and trademarks | 4,232 | 1,123 | 4,184 | 2,707 | ||||||||||||
Customer relationships | 74,521 | 12,032 | 23,587 | 7,935 | ||||||||||||
Non-compete agreements | 5,383 | 2,111 | 1,893 | 1,525 | ||||||||||||
Other | 4,719 | 837 | 2,132 | 521 | ||||||||||||
|
|
|
|
|
|
|
| |||||||||
Total definite-lived intangible assets | 88,855 | 16,103 | 31,796 | 12,688 | ||||||||||||
|
|
|
|
|
|
|
| |||||||||
Total intangible assets | $ | 116,436 | $ | 16,103 | $ | 32,646 | $ | 12,688 | ||||||||
|
|
|
|
|
|
|
| |||||||||
The increase in the carrying amount of other intangible assets resulted primarily from acquisitions completed during fiscal 2012. For additional information regarding these acquisitions, refer to “Note N – Acquisitions.”
Amortization expense of $5,229,000, $3,293,000 and $4,124,000 was recognized during fiscal 2012, fiscal 2011 and fiscal 2010, respectively.
Amortization expense for each of the next five fiscal years is effectiveestimated to be:
| (in thousands) | ||||
2013 | $ | 7,518 | ||
2014 | 7,503 | |||
2015 | 7,313 | |||
2016 | 7,021 | |||
2017 | 6,585 | |||
Note D — Restructuring and Other Expense
In fiscal 2008, we initiated a Transformation Plan (the “Transformation Plan”) with the overall goal to improve our sustainable earnings potential, asset utilization and operational performance. The Transformation Plan focuses on cost reduction, margin expansion and organizational capability improvements and, in the process, seeks to drive excellence in three core competencies: sales; operations; and supply chain management. The Transformation Plan is comprehensive in scope and includes aggressive diagnostic and implementation phases. As a result of the Transformation Plan and its related efforts, we have incurred certain asset impairments which have been included within restructuring and other expense in our consolidated statements of earnings. Asset impairment charges that are not a result of these efforts have been included within impairment of long-lived assets in our consolidated statements of earnings, except for the impairment charges incurred in connection with the formations of the unconsolidated joint ventures, ArtiFlex and ClarkDietrich, during the fourth quarter of fiscal 2011. As more fully discussed in “Note A – Summary of Significant Accounting Policies,” these impairment charges were recognized within the joint venture transactions line in our consolidated statements of earnings.
To date, we have completed the transformation phases in each of the core facilities within our Steel Processing operating segment, including the facilities of our Mexican joint venture. We also substantially completed the transformation phases at our metal framing facilities prior to their contribution to ClarkDietrich. Transformation efforts within our Pressure Cylinders operating segment, which began during the first quarter of fiscal 2012, are ongoing.
When this process began, we retained a consulting firm to assist in the development and implementation of the Transformation Plan. As the Transformation Plan progressed, we formed internal teams dedicated to this effort, and they ultimately assumed full responsibility for executing the Transformation Plan. Although the consulting firm was again engaged as we rolled out the Transformation Plan in our Pressure Cylinders operating segment, most of the work is now being done by our internal teams. These internal teams are now an integral part of our business combinations withand constitute what we refer to as the Centers of Excellence (“COE”). The COE will continue to monitor the performance metrics and new processes instituted across our transformed operations and drive continuous improvements in all areas of our operations. The majority of the expenses related to the COE will be included in selling, general and administrative expense going forward, except where they relate to a first time diagnostics phase of the Transformation Plan.
Since the initiation of the Transformation Plan, the following actions have been taken:
During the first quarter of fiscal 2008, an acquisition dateinitial headcount reduction plan was put into place, utilizing a combination of voluntary retirement and severance packages. A total of 63 individuals were impacted.
On September 25, 2007, we announced the closure or downsizing of five locations in our Metal Framing segment. These actions were completed as of May 31, 2008 and included headcount reductions of 165.
During the first quarter of fiscal 2009, the Metal Framing corporate offices were moved from Pittsburgh and Blairsville, Pennsylvania, to Columbus, Ohio. Headcount was reduced by 33.
On October 23, 2008, we announced the closure of two facilities, one Steel Processing (Louisville, Kentucky) and one Metal Framing (Renton, Washington), as well as headcount reductions of 282. The Louisville facility was closed on February 28, 2009, and the Renton facility closed on December 31, 2008. During the second quarter of fiscal 2010, the remaining assets of the Louisville facility were sold, resulting in a gain of $1,003,000. This gain has been classified within restructuring and other expense in our consolidated statements of earnings.
On December 5, 2008, we announced the closure and/or after June 1,suspension of operations at three Metal Framing facilities and headcount reductions in Steel Processing of 186. The Lunenburg, Massachusetts, facility closed and operations were suspended in Miami, Florida, and Phoenix, Arizona, on February 28, 2009. The adoptionassociated headcount impact for Metal Framing was a reduction of 125.
The decision was made during the first quarter of fiscal 2010 to close the Joliet, Illinois, Metal Framing facility. A majority of the roll forming operation located at that facility was moved to the Hammond, Indiana, facility during the third quarter of fiscal 2010. Approximately $1,717,000 of impairment was recognized during fiscal 2010 related to this closure.
During the third quarter of fiscal 2010, additional headcount reductions took place across locations within the Metal Framing, Military Construction and Mid-Rise Construction operating segments. A total of 113 individuals were impacted.
Execution of the Transformation Plan continued throughout several facilities in our Steel Processing and Metal Framing operating segments during fiscal 2011, resulting in $3,726,000 of expense, which was recorded within restructuring and other expense in our consolidated statements of earnings.
During fiscal 2011, certain assets within our Steel Processing operating segment classified as held for sale at May 31, 2010, were disposed of resulting in a net gain of $828,000. Also during fiscal 2011,
certain assets within our Metal Framing operating segment were disposed of resulting in a net gain of $245,000. These gains were recorded within restructuring and other expense in our consolidated statements of earnings. |
On March 1, 2011, as more fully described in “Note A – Summary of Significant Accounting Policies,” we completed the contribution of our metal framing business, including six of the 13 facilities, to ClarkDietrich. As a result of the planned closure of the retained facilities, approximately $7,183,000 of employee severance and $4,033,000 of post-closure facility exit and other costs were recognized during the fourth quarter of fiscal 2011.
During fiscal 2012, the following additional actions were taken in connection with the wind-down of our metal framing business:
Approximately $9,116,000 of facility exit and other costs were incurred in connection with the closure of the retained facilities.
The severance accrual was adjusted downward, resulting in a $998,000 credit to earnings.
Certain assets of the retained facilities classified as held for sale were disposed of for cash proceeds of approximately $14,005,000 resulting in a net gain of approximately $5,417,000.
The assets of our Vinyl division, which were also classified as held for sale, were sold to our unconsolidated affiliate, ClarkDietrich, for cash proceeds of approximately $6,125,000 resulting in a gain of approximately $766,000.
Certain steel processing assets acquired in connection with the formation of ClarkDietrich and classified as held for sale were disposed of for cash proceeds of approximately $10,948,000 resulting in a gain of approximately $2,102,000.
These items were recognized within the joint venture transactions caption in our consolidated statements of earnings to correspond with amounts previously recognized in connection with the formation of ClarkDietrich and the subsequent wind-down of our Metal Framing operating segment.
During fiscal 2012, we engaged a consulting firm to assist with the ongoing transformation efforts within our Pressure Cylinders operating segment. As a result, we incurred professional fees of $4,758,000, which were classified as restructuring and other expense in our consolidated statements of earnings. Services provided included assistance through diagnostic tools, performance improvement technologies, project management techniques, benchmarking information and insights that directly related to the Transformation Plan.
During the fourth quarter of fiscal 2012, we announced the closure of our commercial stairs business and accrued $1,143,000 of employee severance.
A progression of the liabilities created as part of the Transformation Plan, combined with a reconciliation to the restructuring and other expense line in our consolidated statement of earnings for fiscal 2011, is summarized as follows:
| (in thousands) | Beginning Balance | Expense | Payments | Adjustments | Ending Balance | |||||||||||||||
Early retirement and severance | $ | 893 | $ | 8,687 | $ | (2,371 | ) | $ | 11 | $ | 7,220 | |||||||||
Facility exit and other costs | 560 | 6,052 | (6,030 | ) | (173 | ) | 409 | |||||||||||||
|
|
|
|
|
|
|
|
|
| |||||||||||
| $ | 1,453 | 14,739 | $ | (8,401 | ) | $ | (162 | ) | $ | 7,629 | ||||||||||
|
|
|
|
|
|
|
|
|
| |||||||||||
Non-cash charges | 203 | |||||||||||||||||||
Net gain on dispositions | (1,073 | ) | ||||||||||||||||||
Joint venture transactions | (11,216 | ) | ||||||||||||||||||
|
| |||||||||||||||||||
Restructuring and other expense | $ | 2,653 | ||||||||||||||||||
|
| |||||||||||||||||||
A progression of the liabilities created as part of the Transformation Plan, combined with a reconciliation to the restructuring and other expense line in our consolidated statement of earnings for fiscal 2012, is summarized as follows:
| (in thousands) | Beginning Balance | Expense | Payments | Adjustments | Ending Balance | |||||||||||||||
Early retirement and severance | $ | 7,220 | $ | 245 | $ | (3,824 | ) | $ | 1,251 | $ | 4,892 | |||||||||
Facility exit and other costs | 409 | 9,116 | (9,630 | ) | 796 | 691 | ||||||||||||||
Professional fees | - | 4,758 | (4,758 | ) | - | - | ||||||||||||||
|
|
|
|
|
|
|
|
|
| |||||||||||
| $ | 7,629 | 14,119 | $ | (18,212 | ) | $ | 2,047 | $ | 5,583 | |||||||||||
|
|
|
|
|
|
|
| |||||||||||||
Net gain on dispositions | (8,285 | ) | ||||||||||||||||||
Joint venture transactions | 150 | |||||||||||||||||||
|
| |||||||||||||||||||
Restructuring and other expense | $ | 5,984 | ||||||||||||||||||
|
| |||||||||||||||||||
The adjustment to the early retirement and severance line item above relates primarily to the reclassification of severance costs to be reimbursed by MISA in connection with the ClarkDietrich formation to the assets section of the balance sheet during fiscal 2012.
Note E – Contingent Liabilities and Commitments
Legal Proceedings
On January 27, 2012, the Fifth Appellate District of the Ohio Court of Appeals upheld a lower court ruling against the Company for professional negligence regarding the wrongful death of an employee of a third-party freight company. The lower court’s ruling awarded damages to the plaintiff of approximately $3,700,000; however, our overall exposure related to this matter is limited under our stop-loss insurance policy. As a result, we accrued an additional pre-tax charge of $1,500,000, which was recorded within SG&A expense during fiscal 2012.
In connection with the acquisition of the BernzOmatic business (“Bernz”) of Irwin Industrial Tool Company, a subsidiary of Newell Rubbermaid, Inc., we settled a dispute over our early termination of a supply contract for $10,000,000. Reserves previously recognized in connection with this matter totaled $14,402,000. Refer to “NOTE N – Acquisitions” for additional information regarding our acquisition of Bernz.
We are defendants in certain other legal actions. In the opinion of management, the outcome of these actions, which is not clearly determinable at the present time, would not significantly affect our consolidated financial position or future results of operations. We also believe that environmental issues will not have a material effect on our capital expenditures, consolidated financial position or future results of operations.
Pressure Cylinders Voluntary Product Recall
On January 10, 2012, we announced a voluntary recall of our MAP-PRO®, propylene and MAAP® cylinders and related hand torch kits. The recall is a precautionary step and involves a valve supplied by a third party that may leak when a torch or hose is disconnected from the cylinder. There have been no reported incidents of fire or injury caused by this situation. In connection with this matter, we recorded certain accruals for our estimated probable costs during the quarter-ended November 30, 2011, consisting of $4,737,000 for product returns and $3,883,000 for recall-related costs. In addition, we wrote-off $1,051,000 of affected inventory.
A progression of the liabilities recorded in connection with this matter during fiscal 2012 is summarized in the following table:
| (in thousands) | Beginning Balance | Reserves Used | Changes in Estimates | Ending Balance | ||||||||||||
Product returns | $ | 4,737 | $ | (3,650 | ) | $ | (809 | ) | $ | 278 | ||||||
Recall-related costs | 3,883 | (4,692 | ) | 809 | - | |||||||||||
|
|
|
|
|
|
|
| |||||||||
Total | $ | 8,620 | $ | (8,342 | ) | $ | - | $ | 278 | |||||||
|
|
|
|
|
|
|
| |||||||||
We believe these liabilities are sufficient to absorb our remaining direct costs related to the recall, which we expect to be paid during the first quarter of fiscal 2013. Recoveries, if any, will not be recorded until an agreement is reached with the supplier.
Purchase Commitments
To secure access to a facility used to regenerate acid used in certain Steel Processing locations, we have entered into unconditional purchase obligations with a third party under which three of our Steel Processing facilities deliver their spent acid for processing annually through the fiscal year ending May 31, 2019. In addition, we are required to pay for freight and utilities used in regenerating the spent acid. Total net payments to this third party were $4,353,000, $4,347,000 and $4,270,000 for fiscal 2012, fiscal 2011 and fiscal 2010, respectively. At May 31, 2012, the aggregate amount of future payments required under this arrangement for the next five fiscal years and thereafter was as follows:
| (in thousands) | ||||
2013 | $ | 2,367 | ||
2014 | 2,367 | |||
2015 | 2,367 | |||
2016 | 2,367 | |||
2017 | 2,367 | |||
Thereafter | 4,734 | |||
|
| |||
Total | $ | 16,569 | ||
|
| |||
We may terminate the unconditional purchase obligations at any time by purchasing this facility at its then fair market value.
Royalty Agreements
In connection with the acquisition of the propane fuel cylinders business of The Coleman Company, Inc. (“Coleman Cylinders”), we executed a trademark license agreement whereby we are required to make minimum annual royalty payments of $2,000,000 in exchange for the exclusive right to use certain Coleman trademarks within the United States and Canada in connection with our operation of the acquired business. For additional information regarding the acquisition of Coleman Cylinders, refer to “Note N – Acquisitions.”
Note F – Guarantees
We do not have guarantees that we believe are reasonably likely to have a material current or future effect on our financial condition, changes in financial condition, revenues or expenses, results of operations, liquidity, capital expenditures or capital resources. However, as of May 31, 2012, we were party to an operating lease for an aircraft in which we have guaranteed a residual value at the termination of the lease. The maximum obligation under the terms of this pronouncement will affectguarantee was approximately $14,940,000 at May 31, 2012. We have also guaranteed the accounting treatmentrepayment of future acquisitionsa $5,000,000 term loan held by one of our unconsolidated affiliates, ArtiFlex. Based on current facts and circumstances, we have estimated the likelihood of payment pursuant to these guarantees, and determined that we may consummate.
In April 2009, the FASB issued FSP No. FAS 157-4,Determining Fair Value When the Volume and Level of Activity for the Asset or Liability Have Significantly Decreased and Identifying Transactions That Are Not Orderly (“FSP No. 157-4”). FSP No. 157-4 provides guidance on how to determine the fair value of assetsour obligation under each guarantee based on those likely outcomes is not material.
We also had in place $10,982,000 of outstanding stand-by letters of credit as of May 31, 2012. These letters of credit were issued to third-party service providers and liabilities under SFAS No. 157 in the current economic environment and reemphasizes that the objective of a fair value measurement remains an exit price. If we were to conclude that there has been a significant decrease in the volume and level of activity of the asset or liability in relation to normal market activities, quoted market values may not be representative of fair value and we may conclude that a change in valuation technique or the use of multiple valuation techniques may be appropriate. FSP No. 157-4 is effective for interim and annual periods ending after June 15, 2009. We do not expect FSP No. 157-4 to have a material impact on our consolidated financial statements.
In April 2009, the FASB issued FSP FAS 115-2 and FAS 124-2,Recognition and Presentation of Other-Than-Temporary Impairments(“FSP No. 115-2 and 124-2”). FSP No. 115-2 and 124-2 amends the other-than-temporary impairment guidance for debt securities to improve presentation and disclosure of other-than-
temporary impairments of debt and equity securities in the financial statements. FSP No. 115-2 and 124-2 is effective for all reporting periods ending after June 15, 2009. We do not expect FSP FSP No. 115-2 and 124-2 to have a material impact on our consolidated financial statements.
In April 2009, the FASB issued FSP No. FAS 107-1 and APB 28-1,Interim Disclosures about Fair Value of Financial Instruments(“FSP No. 107-1 and APB 28-1”). FSP No. 107-1 and APB 28-1 amends SFAS No. 107,Disclosures about Fair Value of Financial Instruments, to require disclosures abouthad no amounts drawn against them at May 31, 2012. The fair value of financialthese guarantee instruments, based on premiums paid, was not material at May 31, 2012.
Note G – Debt and Receivables Securitization
The following table summarizes our long-term debt and short-term borrowings outstanding at May 31:
| (in thousands) | 2012 | 2011 | ||||||
Short-term borrowings | $ | 274,923 | $ | 132,956 | ||||
Floating rate senior notes due December 17, 2014 | 100,000 | 100,000 | ||||||
6.50% senior notes due April 15, 2020 | 149,871 | 149,854 | ||||||
Industrial revenue bonds due March 2013 | 281 | - | ||||||
Industrial revenue bonds due April 2019 | 2,423 | - | ||||||
Secured term loan | 5,816 | - | ||||||
Other | 400 | 400 | ||||||
|
|
|
| |||||
Total debt | 533,714 | 383,210 | ||||||
Less: current maturities and short-term borrowings | 276,252 | 132,956 | ||||||
|
|
|
| |||||
Total long-term debt | $ | 257,462 | $ | 250,254 | ||||
|
|
|
| |||||
We maintain a revolving trade accounts receivable securitization facility (the “AR Facility”), which expires in interimJanuary 2013. The AR Facility was available throughout fiscal 2012 and fiscal 2011. During the third quarter of fiscal 2012, we increased our borrowing capacity under the AR Facility from $100,000,000 to $150,000,000. Pursuant to the terms of the AR Facility, certain of our subsidiaries sell their accounts receivable without recourse, on a revolving basis, to Worthington Receivables Corporation (“WRC”), a wholly-owned, consolidated, bankruptcy-remote subsidiary. In turn, WRC may sell without recourse, on a revolving basis, up to $150,000,000 of undivided ownership interests in this pool of accounts receivable to a multi-seller, asset-backed commercial paper conduit (the “Conduit”). Purchases by the Conduit are financed with the sale of A1/P1 commercial paper. We retain an undivided interest in this pool and are subject to risk of loss based on the collectability of the receivables from this retained interest. Because the amount eligible to be sold excludes receivables more than 90 days past due, receivables offset by an allowance for doubtful accounts
due to bankruptcy or other cause, and concentrations over certain limits with specific customers and certain reserve amounts, we believe additional risk of loss is minimal. The book value of the retained portion of the pool of accounts receivable approximates fair value. As of May 31, 2012, the pool of eligible accounts receivable exceeded the $150,000,000 limit, and $135,000,000 of undivided ownership interests in this pool of accounts receivable had been sold. In accordance with the applicable accounting guidance, the net proceeds received and outstanding at May 31, 2012 and 2011, or $135,000,000 and $90,000,000, respectively, have been classified as well asshort-term borrowings in annual financial statements. FSP No. 107-1our consolidated balance sheets. Facility fees of $1,232,000, $1,148,000 and APB 28-1$1,172,000 were incurred during fiscal 2012, fiscal 2011 and fiscal 2010, respectively.
Short-term borrowings at May 31, 2012, also amends APB Opinion No. 28, “Interim Financial Reporting,”included $135,610,000 of borrowings under our new $425,000,000 unsecured multi-year revolving credit facility (the “Credit Facility”) with a group of lenders, which was executed on May 4, 2012. The Credit Facility matures in May 2017 and replaced our $400,000,000 facility that was set to require those disclosuresexpire in all interim financial statements. FSP No. 107-1May 2013. Borrowings under the Credit Facility have maturities of less than one year. Interest rates on borrowings and APB 28-1 is effective for all reporting periods ending after June 15, 2009. We do not expect FSP No. 107-1 and APB 28-1 to have a material impactrelated facility fees are based on our senior unsecured long-term debt ratings as assigned by Standard & Poor’s Ratings Group and Moody’s Investors Service, Inc. The average variable rate was 1.29% at May 31, 2012. As discussed in “Note F – Guarantees,” we provided $10,982,000 in letters of credit for third-party beneficiaries as of May 31, 2012. While not drawn against at May 31, 2012, these letters of credit are issued against availability under the Credit Facility, leaving $278,408,000 available under the Credit Facility at May 31, 2012.
The remaining balance of short-term borrowings at May 31, 2012, consisted of $4,313,000 outstanding under a $9,500,000 credit facility maintained by our consolidated financial statements.joint venture, WNCL. This credit facility matures in November 2012 and bears interest at a variable rate. The applicable variable rate was 2.50% at May 31, 2012.
InAt May 2009,31, 2012, we had $100,000,000 aggregate principal amount of unsecured floating rate senior notes outstanding, which are due on December 17, 2014 (the “2014 Notes”) and bear interest at a variable rate equal to six-month LIBOR plus 80 basis points. However, we entered into an interest rate swap agreement whereby we receive interest on the FASB$100,000,000 notional amount at the six-month LIBOR rate and we pay interest on the same notional amount at a fixed rate of 4.46%, effectively fixing the interest rate at 5.26%. See “Note O – Derivative Instruments and Hedging Activities” for additional information regarding this interest rate swap agreement.
On April 13, 2010, we issued SFAS No. 165,Subsequent Events (“SFAS No. 165”$150,000,000 aggregate principal amount of unsecured senior notes due on April 15, 2020 (the “2020 Notes”). SFAS No. 165 establishes general standardsThe 2020 Notes bear interest at a rate of accounting6.50%. The 2020 Notes were sold to the public at 99.890% of the principal amount thereof, to yield 6.515% to maturity. We used the net proceeds from the offering to repay a portion of the then outstanding borrowings under our multi-year revolving credit facility and amounts then outstanding under our revolving trade accounts receivable securitization facility. The proceeds on the issuance of the 2020 Notes were reduced for debt discount ($165,000), payment of debt issuance costs ($1,535,000) and disclosuresettlement of events that occur aftera hedging instrument entered into in anticipation of the issuance of the 2020 Notes ($1,358,000). The debt discount, debt issuance costs and loss from treasury lock derivative are recorded on the consolidated balance sheet date but before financial statements are issued. SFAS No. 165 is effective for interim or annual financial periods ending after June 15, 2009. We are currently evaluating the impact of this statement.
In June 2009, the FASB issued SFAS No. 166,Accounting for Transfers of Financial Assets – an amendment of FASB Statement No. 140(“SFAS No. 166”). SFAS No. 166 amends the guidance on transfers of financialsheets within long-term debt as a contra-liability, short- and long-term other assets and impacts new transfersAOCI, respectively. Each will be recognized, through interest expense, in our consolidated statements of many typesearnings over the term of financial assets (e.g.the 2020 Notes.
In connection with the acquisition of Angus Industries, Inc. (“Angus”) on December 29, 2011, we assumed industrial revenue bonds (“IRBs”) issued by the South Dakota Economic Development Finance Authority that had outstanding principal balances of $620,000 and $2,490,000 and mature in March 2013 (the “2013 IRBs”) and April 2019 (the “2019 IRBs”), factoring arrangementsrespectively. The 2013 IRBs require monthly payments of $28,000 and salesbear interest at rates between 3.75% and 5.25%. The 2019 IRBs require monthly payments of trade receivables, mortgagesapproximately $31,000 and installment loans)bear interest at rates between 2.75% and 5.00%. SFAS No. 166Refer to “Note N – Acquisitions” for additional information regarding the acquisition of Angus.
On April 27, 2012, we executed a $5,880,000 seven-year term loan that matures on May 1, 2019 and requires monthly payments of $76,350. The loan bears interest at a rate of 2.49% and is effective forsecured by an aircraft that was purchased with its proceeds.
Maturities on long-term debt and short-term borrowings in the next five fiscal years, beginning after November 15, 2009, and in interim periods within those fiscal years. We are currently evaluating the impact of this statement.
In June 2009, the FASB issued SFAS No. 167,Amendments to FASB Interpretation No. 46(R)(“SFAS No. 167”). SFAS No. 167 amends the consolidation guidance for variable-interest entities (“VIE”) under FIN 46(R). SFAS No. 167 makes significant changes to the model for determining who should consolidate a VIE, and also addresses how often this assessment should be performed. We are currently evaluating the impact of this statement.
In June 2009, the FASB issued SFAS No. 168, The FASB Accounting Standards Codificationand the Hierarchy of Generally Accepted Accounting Principles – a replacement of FASB Statement No. 162 (“SFAS No. 168”). On the effective date of this Statement, the Codification will supersede all then-existing non-SEC accounting and reporting standards. All other non-grandfathered, non-SEC accounting literature not included in the Codification will become non-authoritative. This Statement is effective for financial statements issued for interim and annual periods ending after September 15, 2009. We do not expect this pronouncement to have a material impact on our consolidated financial statements.remaining years thereafter, are as follows:
| (in thousands) | ||||
2013 | $ | 276,252 | ||
2014 | 1,172 | |||
2015 | 101,202 | |||
2016 | 1,238 | |||
2017 | 1,274 | |||
Thereafter | 152,576 | |||
|
| |||
Total | $ | 533,714 | ||
|
| |||
Note B – Shareholders’H — Equity
Preferred Shares: The Worthington Industries, Inc. Amended Articles of Incorporation authorize two classes of preferred shares and their relative voting rights. The Board of Directors of Worthington Industries, Inc. is empowered to determine the issue prices, dividend rates, amounts payable upon liquidation and other terms of the preferred shares when issued. No preferred shares are issued or outstanding.
Common Shares:Shares At its meeting on September 27, 2006,: On June 29, 2011, the Board of Directors of Worthington Industries, Inc. reconfirmed its authorization to repurchase up to 10,000,000 of Worthington Industries, Inc.’s outstanding common shares, which had initially been announced on June 13, 2005. This repurchase authorization was completed during December 2007. On September 26, 2007, Worthington Industries, Inc. announced that the Board of Directors had authorized the repurchase of up to an additional 10,000,000 of Worthington Industries, Inc.’sour outstanding common shares. A total of 8,449,500At May 31, 2012, 6,027,832 common shares remained available for repurchase under this repurchase authorization as of May 31, 2009.authorization. The common shares available for purchase
repurchase under thisthe June 29, 2011 authorization may be purchased from time to time, with consideration given to the market price of the common shares, the nature of other investment opportunities, cash flows from operations and general economic conditions. Repurchases may be made on the open market or through privately negotiated transactions. During fiscal 2012 and fiscal 2011, we paid $73,418,000 and $132,764,000 to repurchase 4,466,970 and 7,954,698 of our common shares, respectively.
Accumulated Other Comprehensive Income (Loss):Income: The components of other comprehensive income (loss) and related tax effects for the years ended May 31, were as follows:
| In thousands | 2009 | 2008 | 2007 | |||||||||
Other comprehensive income (loss): | ||||||||||||
Unrealized loss on investment | $ | - | $ | - | $ | (296 | ) | |||||
Foreign currency translation, net of tax of $0, $0 and $212 in 2009, 2008 and 2007 | (9,866 | ) | 13,080 | 4,507 | ||||||||
Pension liability adjustment, net of tax of $14, $(44) and $(139) in 2009, 2008 and 2007 | (4,766 | ) | 590 | 34 | ||||||||
Cash flow hedges, net of tax of $3,187, $6,290 and $4,300 in 2008, 2007 and 2006 | (5,544 | ) | (12,218 | ) | (7,586 | ) | ||||||
Other comprehensive income (loss), net of tax | $ | (20,176 | ) | $ | 1,452 | $ | (3,341 | ) | ||||
The components of cumulative other comprehensive income,AOCI, net of tax, were as follows at May 31 were as follows:31:
| In thousands | 2009 | 2008 | ||||||||||||||
| (in thousands) | 2012 | 2011 | ||||||||||||||
Foreign currency translation | $ | 14,176 | $ | 24,042 | $ | (1,355 | ) | $ | 13,448 | |||||||
Defined benefit pension liability | (5,012 | ) | (246 | ) | (12,494 | ) | (3,253 | ) | ||||||||
Cash flow hedges | (4,707 | ) | 837 | (6,538 | ) | (6,220 | ) | |||||||||
|
| |||||||||||||||
Cumulative other comprehensive income, net of tax | $ | 4,457 | $ | 24,633 | ||||||||||||
Accumulated other comprehensive income (loss), net of tax | $ | (20,387 | ) | $ | 3,975 | |||||||||||
|
| |||||||||||||||
Reclassification adjustmentsA net loss of $1,245,000 (net of tax of $794,000), $2,431,000 (net of tax of $1,487,000) and $2,219,000 (net of tax of $1,222,000) were reclassified from AOCI for cash flow hedges in fiscal 2009,2012, fiscal 2008,2011, and fiscal 2007 were $445,000 (net of tax of $234,000), $7,514,000 (net of tax of $3,719,000), and $9,046,000 (net of tax of $4,617,000),2010, respectively.
The estimated net amount of the existing gains or losses in other comprehensive incomeAOCI at May 31, 20092012 expected to be reclassified into net earnings within the succeeding twelve months was $743,000$1,135,000 (net of tax of $391,000)$724,000). This amount was computed using the fair value of the cash flow hedges at May 31, 2009,2012, and will change before actual reclassification from other comprehensive incomeAOCI to net earnings during the fiscal year ending May 31, 2010.2013.
Note C – Debt
Debt at May 31 is summarized as follows:
| In thousands | 2009 | 2008 | ||||
Notes payable | $ | 980 | $ | 135,450 | ||
6.7% senior notes due December 1, 2009 | 138,000 | 145,000 | ||||
Floating rate senior notes due December 17, 2014 | 100,000 | 100,000 | ||||
Other | 413 | - | ||||
Total debt | 239,393 | 380,450 | ||||
Less current maturities and notes payable | 138,993 | 135,450 | ||||
Total long-term debt | $ | 100,400 | $ | 245,000 | ||
At May 31, 2009, notes payable consisted of $980,000 of borrowings under our revolving credit facility, described below. The average variable rate was 0.90% at May 31, 2009, and is based on our senior unsecured long-term debt ratings assigned by Standard & Poor’s Ratings Group and Moody’s Investors Service, Inc. At May 31, 2008, our notes payable consisted of $125,450,000 of borrowings under our revolving credit facility and $10,000,000 of borrowings on uncommitted credit lines. The average variable rate was 3.16% at May 31, 2008.
On May 6, 2008, we amended our $435,000,000 five-year revolving credit facility, which had been due to expire on September 29, 2010. The amendment extended the commitment date to May 6, 2013, except for a $35,000,000 commitment by one lender that will expire on September 29, 2010. In addition, the amendment increased the facility fees and applicable percentage for base rate and Eurodollar loans. Borrowings under this facility have maturities of less than one year. We pay facility fees on the unused commitment amount. Interest rates on borrowings and related facility fees are based on our senior unsecured long-term debt ratings as assigned by Standard & Poor's Ratings Group and Moody's Investors Service, Inc. We had $434,020,000 available to us under this facility at May 31, 2009, compared to $309,550,000 available to us at May 31, 2008.
The covenants in the revolving credit facility include, among others, maintenance of a consolidated indebtedness to capitalization ratio of not more than 55% at the end of any fiscal quarter and maintenance of an interest coverage ratio for any period of four consecutive quarters, calculated at the end of any fiscal quarter, of not less than 3.25 times through maturity. At May 31, 2009, the interest coverage ratio was 8.72 times while the consolidated indebtedness to capitalization ratio was 32%. We were in compliance with all covenants under the revolving credit facility at May 31, 2009.
As of May 31, 2009, we had $138,000,000 of 6.7% senior notes due December 1, 2009. During the fiscal quarter ended May 31, 2009, the Company redeemed $7,000,000 of its then $145,000,000 outstanding principal amount of 6.7% notes due December 1, 2009. See “Note V – Subsequent Events” for additional details regarding the 6.7% senior notes due December 1, 2009.
The floating rate senior notes are due on December 17, 2014 (“2014 Notes”) and bear interest at a variable rate equal to six-month LIBOR plus 80 basis points. This rate was 3.02% as of May 31, 2009. However, we entered into an interest rate swap agreement whereby we receive interest on the $100,000,000 notional amount at the six-month LIBOR rate and we pay interest on the same notional amount at a fixed rate of 4.46%, effectively fixing the interest rate at 5.26%. The 2014 Notes are callable at par, at our option. The covenants in the 2014 Notes, as amended December 19, 2006, include among others, maintenance of a consolidated indebtedness to capitalization ratio, calculated at the end of each fiscal quarter, of not more than 55% and maintenance of an interest coverage ratio, for any period of four consecutive quarters, calculated at the end of any fiscal quarter, of not less than 3.0 times through maturity. At May 31, 2009, the interest coverage ratio was 8.72 times while the consolidated indebtedness to capitalization ratio was 32%. We were in compliance with all covenants under the 2014 Notes at May 31, 2009.
Principal payments due on long-term debt in the next five fiscal years, and the remaining years thereafter, are as follows:
| In thousands | |||
2010 | $ | 138,013 | |
2011 | - | ||
2012 | - | ||
2013 | 80 | ||
2014 | 80 | ||
Thereafter | 100,240 | ||
Total | $ | 238,413 | |
Note D – Income Taxes
Earnings (loss) before income taxes for the years ended May 31 include the following components:
| In thousands | 2009 | 2008 | 2007 | |||||||
Pre-tax earnings (loss): | ||||||||||
United States based operations | $ | (174,934 | ) | $ | 95,418 | $ | 106,246 | |||
Non - United States based operations | 28,966 | 50,275 | 59,771 | |||||||
| $ | (145,968 | ) | $ | 145,693 | $ | 166,017 | ||||
Significant components of income tax expense (benefit) for the years ended May 31 were as follows:
| In thousands | 2009 | 2008 | 2007 | |||||||||
Current: | ||||||||||||
Federal | $ | (21,609 | ) | $ | 29,969 | $ | 38,644 | |||||
State and local | 3,146 | 2,617 | 1,617 | |||||||||
Foreign | 6,188 | 9,258 | 14,919 | |||||||||
| (12,275 | ) | 41,844 | 55,180 | |||||||||
Deferred: | ||||||||||||
Federal | (19,393 | ) | (3,038 | ) | (2,402 | ) | ||||||
State | (4,359 | ) | (1,601 | ) | (334 | ) | ||||||
Foreign | (1,727 | ) | 1,411 | (332 | ) | |||||||
| (25,479 | ) | (3,228 | ) | (3,068 | ) | |||||||
| $ | (37,754 | ) | $ | 38,616 | $ | 52,112 | ||||||
Tax benefits related to stock-based compensation that were credited to additional paid-in capital were $433,000, $2,035,000 and $2,370,000 for fiscal 2009, fiscal 2008 and fiscal 2007. Tax benefits (expenses) related to foreign currency translation adjustments that were credited to (deducted from) other comprehensive income were $0, $0 and $212,000 for fiscal 2009, fiscal 2008 and fiscal 2007. Tax benefits (expenses) related to defined benefit pension liability that were credited to (deducted from) other comprehensive income were $14,000, ($44,000) and $(139,000) for fiscal 2009, fiscal 2008 and fiscal 2007. Tax benefits (expenses) related to cash flow hedges that were credited to (deducted from) other comprehensive income were $3,187,000, $6,290,000 and $4,300,000 for fiscal 2009, fiscal 2008 and fiscal 2007. The tax benefits related to the gain from the dilution of our interest in TWB Company, L.L.C. (“TWB”), as a result of our partner’s contribution to this unconsolidated joint venture, credited to additional paid-in capital were $1,031,000 for fiscal 2008 (see “Note J – Investments in Unconsolidated Affiliates”).
A reconciliation of the federal statutory tax rate of 35 percent to total tax provisions (benefits) follows:
| 2009 | 2008 | 2007 | |||||||
Federal statutory rate | 35.0 | % | 35.0 | % | 35.0 | % | |||
State and local income taxes, net of federal tax benefit | 1.6 | 0.7 | 1.5 | ||||||
Change in income tax accruals for resolution of tax audits and change in estimate of deferred tax | (0.1 | ) | (1.7 | ) | 1.1 | ||||
Non-U.S. income taxes at other than 35% | 3.9 | (4.6 | ) | (3.6 | ) | ||||
Goodwill impairment non-deductible | (13.9 | ) | - | - | |||||
Other | (0.6 | ) | (2.9 | ) | (2.6 | ) | |||
Effective tax rate | 25.9 | % | 26.5 | % | 31.4 | % | |||
In June 2006, the FASB issued FASB Interpretation No. 48,Accounting for Uncertainty in Income Taxes – an interpretation of FASB Statement No. 109 (“FIN 48”). The interpretation addresses the determination of whether tax benefits claimed, or expected to be claimed, on a tax return should be recorded in the financial statements. Under FIN 48, a tax benefit may be recognized from an uncertain tax position only if it is more likely than not that the tax position will be sustained on examination by the taxing authorities, including resolution of any related appeals or litigation processes, based on the technical merits of the position. The tax benefits recognized in the financial statements from such a position should be measured based on the largest benefit that has a greater than fifty percent likelihood of being realized upon ultimate settlement. FIN 48 also provides guidance on income tax related issues such as derecognition, classification, interest and penalties, accounting treatment in interim periods and increased disclosure requirements.
On June 1, 2007, we adopted the provisions of FIN 48. There was no effect on our consolidated financial position or cumulative adjustment to our beginning retained earnings as a result of the implementation. However, certain amounts have been reclassified on the consolidated balance sheets in order to comply with the requirements of the interpretation.
The total amount of unrecognized tax benefits was $3,897,000, $2,093,000 and $16,826,000 as of May 31, 2009, May 31, 2008 and June 1, 2007, respectively. The total amount of unrecognized tax benefits that, if recognized, would affect the effective tax rate was $2,703,000 as of May 31, 2009. Unrecognized tax benefits are the differences between a tax position taken, or expected to be taken in a tax return, and the benefit recognized for accounting purposes pursuant to FIN 48. Accrued amounts of interest and penalties related to unrecognized tax benefits are recognized as part of income tax expense within our consolidated statement of earnings. As of May 31, 2009, May 31, 2008 and June 1, 2007, we had accrued liabilities of $1,143,000, $720,000 and $5,056,000, respectively, for interest and penalties within the unrecognized tax benefits.
A tabular reconciliation of unrecognized tax benefits follows:
Balance at June 1, 2008 | $ | 2,093 | ||
Increases – tax positions taken in prior years | 2,282 | |||
Decreases – tax positions taken in prior years | (170 | ) | ||
Increases – current tax positions | 185 | |||
Decreases – current tax positions | (74 | ) | ||
Settlements | 92 | |||
Lapse of statutes of limitations | (511 | ) | ||
Balance at May 31, 2009 | $ | 3,897 | ||
Approximately $806,000 of the liability for unrecognized tax benefits is expected to be settled in the next twelve months due to the expiration of statutes of limitations in various tax jurisdictions. While it is expected that the amount of unrecognized tax benefits will change in the next twelve months, any change is not expected to have a material impact on our consolidated financial position, results of operations or cash flows.
Following is a summary of the tax years open to examination by major tax jurisdiction:
U.S. Federal – 2000 – 2003; 2006 and forward
U.S. State and Local – 2002 and forward
Austria – 2002 and forward
Canada – 2005 and forward
We also adjusted our deferred taxes in fiscal 2009, fiscal 2008 and fiscal 2007, resulting in an increase (decrease) of $1,316,000, $(2,057,000), and $917,000 in income tax expense, respectively.
Taxes on Foreign Income – Pre-tax earnings attributable to foreign sources for fiscal 2009, fiscal 2008 and fiscal 2007 were as noted above. As of May 31, 2009, and based on the tax laws in effect at that time, it
remains our intention to continue to indefinitely reinvest our undistributed foreign earnings, except for the foreign earnings of our TWB joint venture. Accordingly, where this election has been made, no deferred tax liability has been recorded for those foreign earnings. Undistributed earnings of our consolidated foreign subsidiaries at May 31, 2009, amounted to $242,778,000. If such earnings were not permanently reinvested, a deferred tax liability of $29,823,000 would have been required.
The components of our deferred tax assets and liabilities as of May 31 were as follows:
| In thousands | 2009 | 2008 | ||||||
Deferred tax assets: | ||||||||
Accounts receivable | $ | 4,511 | $ | 2,300 | ||||
Inventories | 5,228 | 6,021 | ||||||
Accrued expenses | 17,941 | 18,609 | ||||||
Net operating loss carryforwards | 20,573 | 17,989 | ||||||
Tax credit carryforwards | 2,423 | 2,473 | ||||||
Stock-based compensation | 4,465 | 2,362 | ||||||
Derivative contracts | 2,465 | - | ||||||
Other | 754 | 1,041 | ||||||
Total deferred tax assets | 58,360 | 50,795 | ||||||
Valuation allowance for deferred tax assets | (14,729 | ) | (13,248 | ) | ||||
Net deferred tax assets | 43,631 | 37,547 | ||||||
Deferred tax liabilities: | ||||||||
Property, plant and equipment | 77,454 | 97,057 | ||||||
Derivative contracts | - | 1,247 | ||||||
Undistributed earnings of unconsolidated affiliates | 15,802 | 17,207 | ||||||
Income taxes | 273 | 862 | ||||||
Other | 1,010 | 380 | ||||||
Total deferred tax liabilities | 94,539 | 116,753 | ||||||
Net deferred tax liabilities | $ | 50,908 | $ | 79,206 | ||||
The above amounts are classified in the consolidated balance sheets as of May 31 as follows:
| In thousands | 2009 | 2008 | ||||
Current assets: | ||||||
Deferred income taxes | $ | 24,868 | $ | 17,966 | ||
Other assets: | ||||||
Deferred income taxes | 7,210 | 3,639 | ||||
Noncurrent liabilities: | ||||||
Deferred income taxes | 82,986 | 100,811 | ||||
Net deferred tax liabilities | $ | 50,908 | $ | 79,206 | ||
At May 31, 2009, we had tax benefits for federal net operating loss carryforwards of $258,000 that expire from fiscal 2010 to fiscal 2020. These net operating loss carryforwards are subject to utilization limitations. At May 31, 2009, we had tax benefits for state net operating loss carryforwards of $16,022,000 that expire from fiscal 2010 to fiscal 2030 and state credit carryforwards of $1,330,000 that expire from fiscal 2010 to fiscal 2024. At May 31, 2009, we had tax benefits for foreign net operating loss carryforwards of $4,293,000 for income tax purposes that expire from fiscal 2010 to fiscal 2029. At May 31, 2009, we had tax benefits for foreign tax credit carryforwards of $1,158,000 that expire in fiscal 2019.
A valuation allowance of $14,729,000 has been recognized to offset the deferred tax assets related to the net operating loss carryforwards and foreign tax credit carryforwards and certain state tax credits. The valuation allowance includes $1,153,000 for federal, $11,997,000 for state and $1,579,000 for foreign. The majority of the federal valuation allowance relates to the foreign tax credit with the remainder relating to the net operating loss carryforward. The majority of the state valuation allowance relates to owning the Decatur, Alabama facility while the foreign valuation allowance relates to operations in the Czech Republic and China. Based on our history of profitability and taxable income projections, we have determined that it is more likely than not that deferred tax assets are realizable, except for certain net operating loss carryforwards and tax credits.
Note E – Employee Pension Plans
We provide retirement benefits to employees mainly through contributory, deferred profit sharing plans. Contributions to the deferred profit sharing plans are determined as a percentage of our pre-tax income before profit sharing, with contributions guaranteed to represent at least 3% of the participants’ compensation. During fiscal 2009, fiscal 2008 and fiscal 2007, we matched employee contributions at 50% up to defined maximums. We also have one defined benefit plan, The Gerstenslager Company Bargaining Unit Employees’ Pension Plan (the “Gerstenslager Plan”). The Gerstenslager Plan is a non-contributory pension plan, which covers certain employees based on age and length of service. Our contributions comply with ERISA's minimum funding requirements.
Effective May 31, 2007, we adopted the recognition provisions of SFAS No. 158,Employers’ Accounting for Defined Benefit Pension and Other Postretirement Plans – an Amendment of FASB Statements No. 87, 88, 106 and 132(R) (“SFAS No. 158”), which required the recognition of actuarial gains or losses, prior service costs or credits and transition assets or obligations that had previously been deferred. The adoption did not materially impact our consolidated financial position or results of operations. Beginning with fiscal 2009, the Company adopted the measurement date provisions of SFAS No. 158. The measurement date provisions require plan assets and obligations to be measured as of the date of the year-end financial statements. The Company previously measured its pension benefits obligation as of March 31 each year. The adoption of the measurement date provisions of SFAS No. 158 did not have a material effect on the Company’s consolidated financial position or results of operations for fiscal 2009.
The following table summarizes the components of net periodic pension cost for the Gerstenslager Plan (the “defined benefit plan”) and the defined contribution plans for the years ended May 31:
| In thousands | 2009 | 2008 | 2007 | |||||||||
Defined benefit plan: | ||||||||||||
Service cost | $ | 615 | $ | 599 | $ | 610 | ||||||
Interest cost | 1,146 | 900 | 818 | |||||||||
Actual return on plan assets | (3,774 | ) | 496 | (1,257 | ) | |||||||
Net amortization and deferral | 2,501 | (1,538 | ) | 396 | ||||||||
Net periodic pension cost on defined benefit plan | 488 | 457 | 567 | |||||||||
Defined contribution plans | 8,455 | 11,641 | 9,694 | |||||||||
Total retirement plan cost | $ | 8,943 | $ | 12,098 | $ | 10,261 | ||||||
The following actuarial assumptions were used for our defined benefit plan:
| 2009 | 2008 | 2007 | |||||||
To determine benefit obligation: | |||||||||
Discount rate | 7.45 | % | 6.82 | % | 6.14 | % | |||
To determine net periodic pension cost: | |||||||||
Discount rate | 6.92 | % | 6.14 | % | 6.03 | % | |||
Expected long-term rate of return | 8.00 | % | 8.00 | % | 8.00 | % | |||
Rate of compensation increase | n/a | n/a | n/a |
To calculate the discount rate, we used the expected cash flows of the benefit payments and the Citigroup Pension Index. The expected long-term rate of return on the defined benefit plan in fiscal 2009, fiscal 2008 and fiscal 2007 was based on the actual historical returns adjusted for a change in the frequency of lump sum settlements upon retirement.
The following tables provide a reconciliation of the changes in the projected benefit obligation and fair value of plan assets and the funded status for the defined benefit plan during fiscal 2009 and fiscal 2008 as of the respective measurement dates:
| In thousands | May 31, 2009 | March 31, 2008 | ||||||
Change in benefit obligation | ||||||||
Benefit obligation, beginning of year | $ | 14,329 | $ | 14,626 | ||||
Service cost | 615 | 599 | ||||||
Interest cost | 1,146 | 900 | ||||||
Actuarial gain | (1,390 | ) | (1,577 | ) | ||||
Benefits paid | (400 | ) | (219 | ) | ||||
Benefit obligation, end of year | $ | 14,300 | $ | 14,329 | ||||
Change in plan assets | ||||||||
Fair value, beginning of year | $ | 15,420 | $ | 16,135 | ||||
Actual return on plan assets | (3,774 | ) | (496 | ) | ||||
Benefits paid | (400 | ) | (219 | ) | ||||
Fair value, end of year | $ | 11,246 | $ | 15,420 | ||||
Funded Status | $ | (3,054 | ) | $ | 1,091 | |||
Amounts recognized in the consolidated balance sheets consist of: | ||||||||
Noncurrent assets | $ | - | $ | 1,091 | ||||
Noncurrent liabilities | (3,054 | ) | - | |||||
Cumulative other comprehensive income | 4,527 | 869 | ||||||
Amounts recognized in cumulative other comprehensive income consist of: | ||||||||
Net loss | 4,527 | 650 | ||||||
Prior service cost | - | 219 | ||||||
Total | $ | 4,527 | $ | 869 | ||||
The following table shows other changes in plan assets and benefit obligations recognized in other comprehensive income during the fiscal year ended May 31:
| In thousands | 2009 | 2008 | ||||||
Net actuarial loss | $ | 3,877 | $ | 201 | ||||
Amortization of prior service cost | (219 | ) | (240 | ) | ||||
Total recognized in other comprehensive income | $ | 3,658 | $ | (39 | ) | |||
Total recognized in net periodic benefit cost and other comprehensive income | $ | 4,146 | $ | 417 | ||||
The estimated net loss and prior service cost for the defined benefit plan that will be amortized from accumulated other comprehensive income into net periodic pension cost over the fiscal year ending May 31, 2010 are $258,000 and $0, respectively.
Plan assets for the defined benefit plan consisted principally of the following as of the respective measurement dates:
| May 31, 2009 | March 31, 2008 | |||||
Asset category | ||||||
Equity securities | 61 | % | 68 | % | ||
Debt securities | 38 | % | 32 | % | ||
Other | 1 | % | - | |||
Total | 100 | % | 100 | % | ||
Equity securities include no employer stock. The investment policy and strategy for the defined benefit plan is: (i) long-term in nature with liquidity requirements that are anticipated to be minimal due to the projected normal retirement date of the average employee and the current average age of participants; (ii) to earn nominal returns, net of investment fees, equal to or in excess of the actuarial assumptions of the plan; and (iii) to include a strategic asset allocation of 60-80% equities, including international, and 20-40% fixed income investments. Employer contributions of $1,429,000 are expected to be made to the defined benefit plan during fiscal 2010. The following estimated future benefits, which reflect expected future service, as appropriate, are expected to be paid:
| In thousands | |||
2010 | $ | 330 | |
2011 | 364 | ||
2012 | 429 | ||
2013 | 520 | ||
2014 | 581 | ||
2015-2019 | 4,687 | ||
Commercial law requires us to pay severance and service benefits to employees at our Austrian Pressure Cylinders location. Severance benefits must be paid to all employees hired before December 31, 2002. Employees hired after that date are covered under a governmental plan that requires us to pay benefits as a percentage of compensation (included in payroll tax withholdings). Service benefits are based on a percentage of compensation and years of service. The accrued liability for these unfunded plans was $6,539,000 and $6,879,000 at May 31, 2009 and 2008, respectively, and was included in other liabilities on the consolidated balance sheets. Net periodic pension cost for these plans was $694,000, $587,000 and $588,000 for fiscal 2009, fiscal 2008 and fiscal 2007, respectively. The assumed salary rate increase was 3.5% for fiscal 2009, fiscal 2008 and fiscal 2007, respectively. The discount rate at May 31, 2009, 2008 and 2007 was 6.20%, 6.00% and 4.80%, respectively. This discount rate is based on a published corporate bond rate with a term approximating the estimated benefit payment cash flows and is consistent with European and Austrian regulations.
Note FI – Stock-Based Compensation
Stock-Based Compensation Plans
Under our employee and non-employee directorsdirector stock-based compensation plans, we may grant incentive or non-qualified stock options, restricted common shares and performance shares to employees and non-qualified stock options and restricted common shares to non-employee directors. We classify share-based compensation expense within SG&A expense to correspond with the same financial statement caption as the majority of the cash compensation paid to employees. A total of 16,749,000 shares23,249,000 of Worthingtonour common shares have been authorized for issuance in connection with the
stock-based compensation plans in place at May 31, 2009. The2012.
We recognized pre-tax stock-based compensation expense for stock options and restricted share awards of $11,742,000 ($7,871,000 after-tax), $6,173,000 ($4,163,000 after-tax) and $4,570,000 ($2,826,000 after-tax) during fiscal 2012, fiscal 2011 and fiscal 2010, respectively. At May 31, 2012, the total unrecognized compensation cost related to non-vested awards was $21,044,000, which will be expensed over the next four fiscal years.
Stock options may be granted to purchase common shares at not less than 100% of fair market value on the date of the grant. All outstanding stock options are non-qualified stock options. The exercise price of all stock options granted has been set at 100% of the fair market value of the underlying common shares on the date of grant. Generally, the stock options granted to employees vest and become exercisable at the rate of (i) 20% per year for options issued before June 30, 2011, and (ii) 33% per year for options issued on or after June 30, 2011, in each case beginning one year from the date of grant and expire ten years after the date of grant. The non-qualifiedNon-qualified stock options granted to non-employee directors vest and become exercisable on the first to occurearlier of (a) the first anniversary of the date of grant andor (b) as tothe date on which the next annual meeting of shareholders is held following the date of grant for any stock option granted as of the date of an annual meeting of shareholders of Worthington Industries, Inc., Stock options can be exercised through net-settlement, at the date on whichelection of the next annual meeting of shareholders is held following the date of grant. option holder.
In addition to the stock options, previously discussed, we have awarded performance shares to certain key employees performance shares that are contingent (i.e., vest) upon achieving corporate targets for cumulative corporate economic value added, earnings per share growth and, in the case of business unit executives, business unit operating income targets for the three-year periods ending May 31, 2009, 20102012, 2013 and 2011.2014. These performance share awards will be paid, to the extent earned, in common shares of Worthington Industries, Inc. in the fiscal quarter following the end of the applicable three-year performance period. The
We have also awarded restricted shares granted to certain employees and non-employee directorsdirectors. These restricted shares are valued at the closing market price of common shares of Worthington Industries, Inc. on the date of the grant. TheService-based restricted shares vest under the same parameters applicable to non-employee directoras the stock options discussed above. Vesting of market-based restricted shares is contingent upon our common shares reaching a specific price per share for a specific period of time as discussed more fully below,
Non-Qualified Stock Options
SFAS No. 123(R), Share-Based Payment (“SFAS No. 123(R)”)U.S. GAAP requires that all share-based awards, including grants of stock options, be recorded as expense in the statement of earnings based on their grant-date fair values. In adopting SFAS No. 123(R), we selected the modified prospective transition method. This method requires that compensation expense be recorded prospectively over the remaining vesting period of the stock options on a straight-line basis using the fair value of the stock options on the date of grant.
value. We calculate the fair value of theour non-qualified stock options using the Black-Scholes option pricing model and certain assumptions. The computation of fair values for all stock options useincorporates the following assumptions: The expected volatility is based(based on the historical volatility of theour common shares of Worthington Industries, Inc., and theshares); risk-free interest rate is based(based on the United States Treasury strip rate for the expected term of the stock options. Theoptions); expected term was developed using the(based on historical exercise experience. Theexperience); dividend yield is based(based on annualized current dividends and an average quoted price of Worthingtonour common shares over the preceding annual period.period).
The table below sets forth the non-qualified stock options granted during each of the last three fiscal years ended May 31. For each grant, the optionexercise price was equal to the closing market price of the underlying common shares at each respective grant date. The fair values of these stock options were based on the Black-Scholes option-pricing model, calculated at the respective grant dates. The calculated pre-tax stock-based compensation expense for these stock options, which is after an estimate forof forfeitures, will be recognized on a straight-line basis over the respective vesting periodperiods of the stock options.
| 2009 | 2008 | 2007 | |||||||
Granted (in thousands) | 606 | 1,849 | 799 | ||||||
Weighted average price, per share | $ | 18.75 | $ | 21.34 | $ | 18.15 | |||
Weighted average grant date fair value, per share | $ | 5.57 | $ | 6.24 | $ | 4.08 | |||
Pre-tax stock-based compensation (in thousands) | $ | 2,734 | $ | 9,346 | $ | 2,641 | |||
Granted Weighted average exercise price, per share Weighted average grant date fair value, per share Pre-tax stock-based compensation(in thousands, except per share amounts) 2012 2011 2010 600 2,437 993 $ 21.15 $ 12.27 $ 13.36 $ 7.42 $ 4.88 $ 4.85 $ 4,456 $ 9,715 $ 3,968
The weighted average fair value of stock options granted in fiscal 2009,2012, fiscal 20082011 and fiscal 20072010 was based on the Black-Scholes option pricing model with the following weighted average assumptions:
| 2009 | 2008 | 2007 | 2012 | 2011 | 2010 | ||||||||||||||||
Assumptions used: | |||||||||||||||||||||
Dividend yield | 3.40 | % | 3.28 | % | 3.60 | % | 2.70 | % | 2.80 | % | 3.10 | % | |||||||||
Expected volatility | 35.10 | % | 35.05 | % | 38.10 | % | 51.70 | % | 53.80 | % | 47.90 | % | |||||||||
Risk-free interest rate | 3.50 | % | 3.96 | % | 5.00 | % | 1.90 | % | 2.10 | % | 2.90 | % | |||||||||
Expected life (years) | 6.0 | 6.5 | 6.5 | 6.0 | 6.0 | 6.0 | |||||||||||||||
The following tables summarize our activities in respect of stock optionsoption activity for the years ended May 31:
| 2009 | 2008 | 2007 | 2012 | 2011 | 2010 | |||||||||||||||||||||||||||||||||||||
| In thousands, except per share | Stock Options | Weighted Average Price | Stock Options | Weighted Average Price | Stock Options | Weighted Average Price | ||||||||||||||||||||||||||||||||||||
| (in thousands, except per share) | Stock Options | Weighted Average Exercise Price | Stock Options | Weighted Average Exercise Price | Stock Options | Weighted Average Exercise Price | ||||||||||||||||||||||||||||||||||||
Outstanding, beginning of year | 5,958 | $ | 17.84 | 5,241 | $ | 16.33 | 5,588 | $ | 16.09 | 7,852 | $ | 16.29 | 6,172 | $ | 17.67 | 5,750 | $ | 18.16 | ||||||||||||||||||||||||
Granted | 606 | 18.75 | 1,849 | 21.34 | 799 | 18.15 | 600 | 21.15 | 2,437 | 12.27 | 993 | 13.36 | ||||||||||||||||||||||||||||||
Exercised | (318 | ) | 13.55 | (840 | ) | 15.72 | (673 | ) | 14.87 | (675 | ) | 16.87 | (422 | ) | 12.96 | (227 | ) | 12.75 | ||||||||||||||||||||||||
Expired | (200 | ) | 14.46 | (16 | ) | 18.61 | (174 | ) | 20.09 | - | - | - | - | - | - | |||||||||||||||||||||||||||
Forfeited | (296 | ) | 20.08 | (276 | ) | 18.99 | (299 | ) | 17.85 | (266 | ) | 15.55 | (335 | ) | 16.00 | (344 | ) | 16.69 | ||||||||||||||||||||||||
|
|
| ||||||||||||||||||||||||||||||||||||||||
Outstanding, end of year | 5,750 | 18.16 | 5,958 | 17.84 | 5,241 | 16.33 | 7,511 | 16.65 | 7,852 | 16.29 | 6,172 | 17.67 | ||||||||||||||||||||||||||||||
|
|
| ||||||||||||||||||||||||||||||||||||||||
Exercisable at end of year | 3,185 | 16.83 | 2,714 | 15.37 | 2,680 | 14.81 | 4,404 | 17.72 | 3,917 | 18.24 | 3,631 | 17.79 | ||||||||||||||||||||||||||||||
|
|
| ||||||||||||||||||||||||||||||||||||||||
| Number of Stock Options (in thousands) | Weighted Average Remaining Contractual Life (in years) | Aggregate Intrinsic Value (in thousands) | Number of Stock Options (in thousands) | Weighted Average Remaining Contractual Life (in years) | Aggregate Intrinsic Value (in thousands) | ||||||||||||||
May 31, 2009 | |||||||||||||||||||
May 31, 2012 | |||||||||||||||||||
Outstanding | 5,750 | 6.10 | $ | 12,663 | 7,511 | 5.53 | $ | 11,786 | |||||||||||
Exercisable | 3,185 | 4.63 | 10,551 | 4,404 | 4.12 | 3,381 | |||||||||||||
May 31, 2008 | |||||||||||||||||||
May 31, 2011 | |||||||||||||||||||
Outstanding | 5,958 | 6.47 | 15,116 | 7,852 | 6.30 | $ | 43,876 | ||||||||||||
Exercisable | 2,714 | 4.34 | 12,474 | 3,917 | 4.27 | 14,312 | |||||||||||||
May 31, 2007 | |||||||||||||||||||
May 31, 2010 | |||||||||||||||||||
Outstanding | 5,241 | 6.02 | 25,078 | 6,172 | 5.89 | $ | 2,671 | ||||||||||||
Exercisable | 2,680 | 4.52 | 16,907 | 3,631 | 4.41 | 1,268 | |||||||||||||
During fiscal 2009,2012, the total intrinsic value of stock options exercised was $1,424,000.$3,220,000. The total amount of cash received from employees exercisingthe exercise of stock options was $3,899,000$11,116,000 during fiscal 2009,2012, and the related netexcess tax benefit realized from the exercise of these stock options was $433,000 during the same period.$578,000.
The following table summarizes information about non-vested stock option awards for the year ended May 31, 2009:2012:
| Number of Stock Options (in thousands) | Weighted Average Grant Date Fair Value Per Share | Number of Stock Options (in thousands) | Weighted Average Grant Date Fair Value Per Share | |||||||||||
Non-vested, beginning of year | 3,244 | $ | 5.44 | 3,935 | $ | 5.14 | ||||||||
Granted | 606 | 5.57 | 600 | 7.50 | ||||||||||
Vested | (789 | ) | 5.51 | (1,160 | ) | 5.29 | ||||||||
Forfeited | (496 | ) | 4.74 | (268 | ) | 5.36 | ||||||||
| ||||||||||||||
Non-vested, end of year | 2,565 | $ | 5.59 | 3,107 | $ | 5.52 | ||||||||
| ||||||||||||||
Service-Based Restricted Common Shares
The table below sets forth the restricted common shares we granted during each of the last three fiscal years ended May 31. The fair values of these restricted common shares were equal to the closing market prices of the underlying common shares at their respective grant dates. The calculated pre-tax stock-based compensation expense for these restricted common shares will be recognized on a straight-line basis over their respective vesting periods.
| 2009 | 2008 | 2007 | 2012 | 2011 | 2010 | ||||||||||||||||
Granted | 22,850 | 11,150 | 11,150 | 514,974 | 26,100 | 21,750 | |||||||||||||||
Weighted average grant date fair value, per share | $ | 15.95 | $ | 22.95 | $ | 17.30 | $ | 14.57 | $ | 15.33 | $ | 13.90 | |||||||||
Pre-tax stock-based compensation (in thousands) | $ | 364 | $ | 256 | $ | 193 | $ | 7,501 | $ | 400 | $ | 302 | |||||||||
Market-Based Restricted Common Shares
During the first quarter of fiscal 2012, we granted 370,000 restricted common shares to certain key employees under our stock-based compensation plans. Vesting of these restricted common share awards is contingent upon the price of our common shares reaching $30.00 per share and remaining at or above that price for 30 consecutive days. The grant-date fair value of these restricted common shares, as determined by a Monte Carlo simulation model, was $19.53 per share. The Monte Carlo simulation model is a statistical technique that incorporates multiple assumptions to determine the probability that the market condition will be achieved. The following assumptions were used to determine the grant-date fair value and the derived service period for these restricted common shares:
Dividend yield | 2.3 | % | ||
Expected volatility | 52.6 | % | ||
Risk-free interest rate | 1.8 | % |
The calculated pre-tax stock-based compensation expense for these restricted common shares was determined to be $7,226,000 and the derived service period was determined to be 0.81 years.
On September 14, 2011, the award agreements for these restricted common shares were amended to include a three-year service-based vesting condition in addition to the market-based vesting condition established in the original agreements. The amended awards were accounted for as a modification of $5,767,000 ($3,777,000 after-tax) for fiscal 2009, $4,173,000 ($2,898,000 after-tax) for fiscal 2008 and $3,480,000 ($2,401,000 after-tax) for fiscal 2007the original awards in accordance with the applicable accounting guidance. No incremental compensation
expense was recordedrecognized in selling, general and administrative expense. At May 31, 2009,connection with the totalmodification, as the fair value of the modified awards did not exceed the fair value of the original awards. Accordingly, the remaining unrecognized compensation cost related to non-vestedexpense of the original awards was $10,371,000, whichas of the modification date, or $5,739,000, will be expensedrecorded on a straight-line basis over the next five fiscalmodified service period, or approximately three years.
Note GJ – Contingent Liabilities and CommitmentsEmployee Pension Plans
We provide retirement benefits to employees mainly through defined contribution retirement plans. Eligible participants make pre-tax contributions based on elected percentages of eligible compensation, subject to annual addition and other limitations imposed by the Internal Revenue Code and the various plans’ provisions. Company contributions consist of company matching contributions, annual or monthly employer contributions and discretionary contributions, based on individual plan provisions.
We also have one defined benefit plan, The Gerstenslager Company Bargaining Unit Employees’ Pension Plan (the “Gerstenslager Plan” or “defined benefit plan”). The Gerstenslager Plan is a non-contributory pension plan, which covers certain employees based on age and length of service. Our contributions have complied with ERISA’s minimum funding requirements. Effective May 9, 2011, in connection with the formation of the ArtiFlex joint venture, the Gerstenslager Plan was frozen, which qualified as a curtailment under the applicable accounting guidance. We did not recognize a gain or loss in connection with the curtailment of the Gerstenslager Plan. Refer to “Note A – Summary of Significant Accounting Policies” for additional information regarding the formation of ArtiFlex.
The following table summarizes the components of net periodic pension cost for the defined benefit plan and the defined contribution plans for the years ended May 31:
| (in thousands) | 2012 | 2011 | 2010 | |||||||||
Defined benefit plan: | ||||||||||||
Service cost | $ | - | $ | 575 | $ | 490 | ||||||
Interest cost | 1,213 | 1,140 | 1,059 | |||||||||
Actual return on plan assets | (789 | ) | 3,921 | 3,152 | ||||||||
Net amortization and deferral | (756 | ) | (4,825 | ) | (3,811 | ) | ||||||
|
|
|
|
|
| |||||||
Net periodic pension cost (benefit) on defined benefit plan | (332 | ) | 811 | 890 | ||||||||
Defined contribution plans | 8,643 | 9,870 | 8,817 | |||||||||
|
|
|
|
|
| |||||||
Total retirement plan cost | $ | 8,311 | $ | 10,681 | $ | 9,707 | ||||||
|
|
|
|
|
| |||||||
The following actuarial assumptions were used for our defined benefit plan:
| 2012 | 2011 | 2010 | ||||||||||
To determine benefit obligation: | ||||||||||||
Discount rate | 4.16 | % | 5.60 | % | 6.00 | % | ||||||
To determine net periodic pension cost: | ||||||||||||
Discount rate | 5.60 | % | 6.00 | % | 7.45 | % | ||||||
Expected long-term rate of return | 8.00 | % | 8.00 | % | 8.00 | % | ||||||
Rate of compensation increase | n/a | n/a | n/a | |||||||||
To calculate the discount rate, we used the expected cash flows of the benefit payments and the Citigroup Pension Index. The Gerstenslager Plan’s expected long-term rate of return in fiscal 2012, fiscal 2011 and fiscal 2010 was based on the actual historical returns adjusted for a change in the frequency of lump-sum settlements upon retirement. In determining our benefit obligation, we use the actuarial present value of the vested benefits to which each eligible employee is currently entitled, based on the employee’s expected date of separation or retirement.
The following tables provide a reconciliation of the changes in the projected benefit obligation and fair value of plan assets and the funded status for the Gerstenslager Plan during fiscal 2012 and fiscal 2011 as of the respective measurement dates:
| (in thousands) | May 31, 2012 | May 31, 2011 | ||||||
Change in benefit obligation | ||||||||
Benefit obligation, beginning of year | $ | 21,814 | $ | 19,451 | ||||
Service cost | - | 575 | ||||||
Interest cost | 1,213 | 1,140 | ||||||
Actuarial loss | 10,496 | 1,061 | ||||||
Benefits paid | (500 | ) | (413 | ) | ||||
|
|
|
| |||||
Benefit obligation, end of year | $ | 33,023 | $ | 21,814 | ||||
|
|
|
| |||||
Change in plan assets | ||||||||
Fair value, beginning of year | $ | 19,808 | $ | 14,993 | ||||
Actual return on plan assets | (789 | ) | 3,921 | |||||
Company contributions | 1,227 | 1,307 | ||||||
Benefits paid | (500 | ) | (413 | ) | ||||
|
|
|
| |||||
Fair value, end of year | $ | 19,746 | $ | 19,808 | ||||
|
|
|
| |||||
Funded status | $ | (13,277 | ) | $ | (2,006 | ) | ||
|
|
|
| |||||
Amounts recognized in the consolidated balance sheets consist of: | ||||||||
Other liabilities | $ | (13,277 | ) | $ | (2,006 | ) | ||
Accumulated other comprehensive income | 16,897 | 4,067 | ||||||
Amounts recognized in accumulated other comprehensive income consist of: | ||||||||
Net loss | 16,897 | 4,067 | ||||||
|
|
|
| |||||
Total | $ | 16,897 | $ | 4,067 | ||||
|
|
|
| |||||
The following table shows other changes in plan assets and benefit obligations recognized in OCI during the fiscal year ended May 31:
| (in thousands) | 2012 | 2011 | ||||||
Net actuarial gain (loss) | $ | (12,899 | ) | $ | 1,606 | |||
Amortization of prior service cost | 70 | 350 | ||||||
|
|
|
| |||||
Total recognized in other comprehensive income | $ | (12,829 | ) | $ | 1,956 | |||
|
|
|
| |||||
Total recognized in net periodic benefit cost and other comprehensive income | $ | (12,497 | ) | $ | 1,145 | |||
|
|
|
| |||||
The estimated net loss and prior service cost for the defined benefit plan that will be amortized from AOCI into net periodic pension cost over the fiscal year ending May 31, 2013 are defendants$439,000 and $0, respectively.
Pension plan assets are required to be disclosed at fair value in certain legal actions. In the opinionconsolidated financial statements. Fair value is defined in “Note P – Fair Value Measurements.” The pension plan assets’ fair value measurement level within the fair value hierarchy is based on the lowest level of management,any input that is significant to the outcomefair value measurement. Valuation techniques used need to maximize the use of observable inputs and minimize the use of unobservable inputs.
The following table sets forth, by level within the fair value hierarchy, a summary of the defined benefit plan’s assets measured at fair value on a recurring basis at May 31, 2012:
| (in thousands) | Fair Value | Quoted Prices in Active Markets (Level 1) | Significant Other Observable Inputs (Level 2) | Significant Unobservable Inputs (Level 3) | ||||||||||||
Investment: | ||||||||||||||||
Money Market Funds | $ | 74 | $ | 74 | $ | - | $ | - | ||||||||
Bond Funds | 6,350 | 6,350 | - | - | ||||||||||||
Equity Funds | 13,322 | 13,322 | - | - | ||||||||||||
|
|
|
|
|
|
|
| |||||||||
Totals | $ | 19,746 | $ | 19,746 | $ | - | $ | - | ||||||||
|
|
|
|
|
|
|
| |||||||||
The following table sets forth by level within the fair value hierarchy a summary of the defined benefit plan’s assets measured at fair value on a recurring basis at May 31, 2011:
| (in thousands) | Fair Value | Quoted Prices in Active Markets (Level 1) | Significant Other Observable Inputs (Level 2) | Significant Unobservable Inputs (Level 3) | ||||||||||||
Investment: | ||||||||||||||||
Money Market Funds | $ | 349 | $ | 349 | $ | - | $ | - | ||||||||
Bond Funds | 5,579 | 5,579 | - | - | ||||||||||||
Equity Funds | 13,880 | 13,880 | - | - | ||||||||||||
|
|
|
|
|
|
|
| |||||||||
Totals | $ | 19,808 | $ | 19,808 | $ | - | $ | - | ||||||||
|
|
|
|
|
|
|
| |||||||||
Fair values of the money market, bond and equity funds held by the defined benefit plan were determined by quoted market prices.
Plan assets for the defined benefit plan consisted principally of the following as of the respective measurement dates:
| May 31, 2012 | May 31, 2011 | |||||||
Asset category | ||||||||
Equity securities | 68 | % | 70 | % | ||||
Debt securities | 32 | % | 28 | % | ||||
Other | 0 | % | 2 | % | ||||
|
|
|
| |||||
Total | 100 | % | 100 | % | ||||
|
|
|
| |||||
Equity securities include no employer stock. The investment policy and strategy for the defined benefit plan is: (i) long-term in nature with liquidity requirements that are anticipated to be minimal due to the projected normal retirement date of the average employee and the current average age of participants; (ii) to earn nominal returns, net of investment fees, equal to or in excess of the actuarial assumptions of the plan; and (iii) to include a strategic asset allocation of 60-80% equities, including international, and 20-40% fixed income investments. Employer contributions of $1,259,000 are expected to be made to the defined benefit plan during fiscal 2013.
The following estimated future benefits, which reflect expected future service, as appropriate, are expected to be paid during the fiscal years noted:
| (in thousands) | ||||
2013 | $ | 597 | ||
2014 | 635 | |||
2015 | 695 | |||
2016 | 754 | |||
2017 | 852 | |||
2018-2021 | 6,278 | |||
Commercial law requires us to pay severance and service benefits to employees at our Austrian Pressure Cylinders location. Severance benefits must be paid to all employees hired before December 31, 2002. Employees hired after that date are covered under a governmental plan that requires us to pay benefits as a percentage of compensation (included in payroll tax withholdings). Service benefits are based on a percentage of compensation and years of service. The accrued liability for these actions, whichunfunded plans was $5,636,000 and $6,667,000 at May 31, 2012 and 2011, respectively, and was included in other liabilities on the consolidated balance sheets. Net periodic pension cost for these plans was $623,000, $506,000 and $728,000 for fiscal 2012, fiscal 2011 and fiscal 2010, respectively. The assumed salary rate increase was 3.0%, for fiscal 2012, fiscal 2011 and fiscal 2010. The discount rate at May 31, 2012, 2011 and 2010 was 4.50%, 5.50% and 5.00%, respectively. Each discount rate was based on a published corporate bond rate with a term approximating the estimated benefit payment cash flows and is consistent with European and Austrian regulations.
Note K – Income Taxes
Earnings before income taxes for the years ended May 31 include the following components:
| (in thousands) | 2012 | 2011 | 2010 | |||||||||
United States based operations | $ | 162,285 | $ | 166,137 | $ | 73,122 | ||||||
Non – United States based operations | 14,972 | 16,393 | 5,035 | |||||||||
|
|
|
|
|
| |||||||
Earnings before income taxes | �� | 177,257 | 182,530 | 78,157 | ||||||||
Less: Net earnings attributable to noncontrolling interests* | 9,758 | 8,968 | 6,266 | |||||||||
|
|
|
|
|
| |||||||
Earnings before income taxes attributable to controlling interest | $ | 167,499 | $ | 173,562 | $ | 71,891 | ||||||
|
|
|
|
|
| |||||||
| * | Net earnings attributable to noncontrolling interest are not taxable to Worthington. |
Significant components of income tax expense (benefit) for the years ended May 31 were as follows:
| (in thousands) | 2012 | 2011 | 2010 | |||||||||
Current | ||||||||||||
Federal | $ | 47,543 | $ | 47,698 | $ | 30,080 | ||||||
State and local | 2,756 | 1,246 | 1,333 | |||||||||
Foreign | 830 | 2,070 | 1,347 | |||||||||
|
|
|
|
|
| |||||||
| 51,129 | 51,014 | 32,760 | ||||||||||
|
|
|
|
|
| |||||||
Deferred | ||||||||||||
Federal | 67 | 3,950 | (6,804 | ) | ||||||||
State and local | (69 | ) | 3,599 | 1,399 | ||||||||
Foreign | 777 | (67 | ) | (705 | ) | |||||||
|
|
|
|
|
| |||||||
| 775 | 7,482 | (6,110 | ) | |||||||||
|
|
|
|
|
| |||||||
| $ | 51,904 | $ | 58,496 | $ | 26,650 | |||||||
|
|
|
|
|
| |||||||
Tax benefits related to stock-based compensation that were credited to additional paid-in capital were $32,000, $835,000, and $6,000 for fiscal 2012, fiscal 2011 and fiscal 2010, respectively. Tax benefits (expenses) related to defined benefit pension liability that were credited to (deducted from) other comprehensive income (loss) [“OCI”] were $4,975,000, ($760,000), and $1,163,000 for fiscal 2012, fiscal 2011 and fiscal 2010, respectively. Tax benefits related to cash flow hedges that were credited to OCI were $318,000, $563,000, and $854,000 for fiscal 2012, fiscal 2011 and fiscal 2010, respectively.
A reconciliation of the 35% federal statutory tax rate to total tax provision follows:
| 2012 | 2011 | 2010 | ||||||||||
Federal statutory rate | 35.0 | % | 35.0 | % | 35.0 | % | ||||||
State and local income taxes, net of federal tax benefit | 1.7 | 1.8 | (1.5 | ) | ||||||||
Change in state and local valuation allowances | (0.1 | ) | 1.0 | 5.0 | ||||||||
Change in income tax accruals for resolution of tax audits | - | 0.2 | 1.9 | |||||||||
Non-U.S. income taxes at other than 35% | (2.2 | ) | (2.2 | ) | (1.6 | ) | ||||||
Qualified production activities deduction | (2.8 | ) | (1.9 | ) | (2.1 | ) | ||||||
Other | (0.6 | ) | (0.2 | ) | 0.4 | |||||||
|
|
|
|
|
| |||||||
Effective tax rate attributable to controlling interest | 31.0 | % | 33.7 | % | 37.1 | % | ||||||
|
|
|
|
|
| |||||||
The above effective tax rate attributable to controlling interest excludes any impact from the inclusion of net earnings attributable to noncontrolling interests in our consolidated statements of earnings. The effective tax rates upon inclusion of net earnings attributable to noncontrolling interests were 29.3%, 32.0% and 34.1% for fiscal 2012, fiscal 2011 and fiscal 2010, respectively. The change in effective income tax rates, upon inclusion of net earnings attributable to noncontrolling interests, is primarily a result of our Spartan consolidated joint venture. The earnings attributable to the noncontrolling interest in Spartan do not generate tax expense to Worthington since the investors in Spartan are taxed directly based on the earnings attributable to them.
Under applicable accounting guidance, a tax benefit may be recognized from an uncertain tax position only if it is more likely than not that the tax position will be sustained on examination by the taxing authorities, including resolution of any related appeals or litigation processes, based on the technical merits of the position. Any tax benefits recognized in our financial statements from such a position were measured based on the largest benefit that has a greater than fifty percent likelihood of being realized upon ultimate settlement.
The total amount of unrecognized tax benefits were $4,410,000, $5,381,000, and $5,933,000 as of May 31, 2012, May 31, 2011 and May 31, 2010, respectively. The total amount of unrecognized tax benefits that, if recognized, would affect the effective tax rate attributable to controlling interest was $2,862,000 as of May 31, 2012. Unrecognized tax benefits are the differences between a tax position taken, or expected to be taken in a tax return, and the benefit recognized for accounting purposes. Accrued amounts of interest and penalties related to unrecognized tax benefits are recognized as part of income tax expense within our consolidated statements of earnings. As of May 31, 2012, May 31, 2011 and May 31, 2010, we had accrued liabilities of $1,219,000, $1,184,000 and $1,232,000, respectively, for interest and penalties related to unrecognized tax benefits.
A tabular reconciliation of unrecognized tax benefits follows:
| (In thousands) | ||||
Balance at June 1, 2011 | $ | 5,381 | ||
Increases - tax positions taken in prior years | 961 | |||
Decreases – tax positions taken in prior years | (540 | ) | ||
Increases (decreases) – current tax positions | - | |||
Settlements | (683 | ) | ||
Lapse of statutes of limitations | (709 | ) | ||
|
| |||
Balance at May 31, 2012 | $ | 4,410 | ||
|
| |||
Approximately $470,000 of the liability for unrecognized tax benefits is expected to be settled in the next twelve months due to the expiration of statutes of limitations in various tax jurisdictions and as a result of expected settlements with various tax jurisdictions. While it is expected that the amount of unrecognized tax benefits will change in the next twelve months, any change is not clearly determinable at the present time, would not significantly affectexpected to have a material impact on our consolidated financial position, or future results of operations. We believeoperations or cash flows.
The following is a summary of the tax years open to examination by major tax jurisdiction:
U.S. Federal – 2008 and forward
U.S. State and Local – 2005 and forward
Austria – 2006 and forward
Canada – 2008 and forward
Earnings before income taxes attributable to foreign sources for fiscal 2012, fiscal 2011 and fiscal 2010 were as noted above. As of May 31, 2012, and based on the tax laws in effect at that environmental issues will not have a material effect ontime, it remains our capital expenditures, consolidated financial position or future results of operations.
To secure accessintention to a facility usedcontinue to regenerate acid used in certain Steel Processing locations, we have entered into unconditional purchase obligations with a third party under which threeindefinitely reinvest our undistributed foreign earnings, except for the foreign earnings of our Steel Processing facilities deliver their spent acidTWB joint venture. Accordingly, no deferred tax liability has been recorded for processing annually through fiscal 2019. In addition, we are requiredthose foreign earnings, except those that pertain to pay for freight and utilities used in regenerating the spent acid. Total net payments to this third party were $4,948,000, $5,359,000 and $5,048,000 for fiscal 2009, fiscal 2008 and fiscal 2007, respectively. The aggregate amountTWB. Undistributed earnings of required future paymentsour foreign subsidiaries at May 31, 2009, is2012 were approximately $265,000,000. If such earnings were not permanently reinvested, a deferred tax liability of approximately $20,000,000 would have been required.
The components of our deferred tax assets and liabilities as follows (in thousands):of May 31 were as follows:
2010 | $ | 2,367 | |
2011 | 2,367 | ||
2012 | 2,367 | ||
2013 | 2,367 | ||
2014 | 2,367 | ||
Thereafter | 11,835 | ||
Total | $ | 23,670 | |
| (in thousands) | 2012 | 2011 | ||||||
Deferred tax assets | ||||||||
Accounts receivable | $ | 1,640 | $ | 1,870 | ||||
Inventories | 5,323 | 5,932 | ||||||
Accrued expenses | 30,403 | 29,227 | ||||||
Net operating and capital loss carry forwards | 21,664 | 22,501 | ||||||
Tax credit carry forwards | 1,044 | 1,265 | ||||||
Stock-based compensation | 10,771 | 7,187 | ||||||
Derivative contracts | 5,134 | 3,761 | ||||||
Other | 12 | 7 | ||||||
|
|
|
| |||||
Total deferred tax assets | 75,991 | 71,750 | ||||||
Valuation allowance for deferred tax assets | (22,025 | ) | (22,292 | ) | ||||
|
|
|
| |||||
Net deferred tax assets | 53,966 | 49,458 | ||||||
Deferred tax liabilities | ||||||||
Property, plant and equipment | (60,373 | ) | (58,606 | ) | ||||
Undistributed earnings of unconsolidated affiliates | (45,159 | ) | (43,947 | ) | ||||
Other | (666 | ) | (583 | ) | ||||
|
|
|
| |||||
Total deferred tax liabilities | (106,198 | ) | (103,136 | ) | ||||
|
|
|
| |||||
Net deferred tax liabilities | $ | (52,232 | ) | $ | (53,678 | ) | ||
|
|
|
| |||||
We may terminateThe above amounts are classified in the unconditional purchase obligations by purchasing this facility. consolidated balance sheets as of May 31 as follows:
| (in thousands) | 2012 | 2011 | ||||||
Current assets: | ||||||||
Deferred income taxes | $ | 20,906 | $ | 28,297 | ||||
Other assets: | ||||||||
Deferred income taxes | - | 2,006 | ||||||
Current liabilities: | ||||||||
Other accrued items | (39 | ) | - | |||||
Noncurrent liabilities: | ||||||||
|
|
|
| |||||
Deferred income taxes | (73,099 | ) | (83,981 | ) | ||||
|
|
|
| |||||
Net deferred tax liabilities | $ | (52,232 | ) | $ | (53,678 | ) | ||
|
|
|
| |||||
At May 31, 2009,2012, we had tax benefits for state net operating loss carry forwards of $18,102,000 that expire from fiscal 2014 to the costfiscal year ending May 31, 2032. At May 31, 2012, we had tax benefits for foreign net operating loss carry forwards of this purchase option was not expected$2,222,000 for income tax purposes that expire from fiscal 2013 to exceed certain debtthe fiscal year ending May 31, 2019. At May 31, 2012, we had a tax benefit for a foreign capital loss carry forward of $1,340,000 with no future expiration date. At May 31, 2012, we had tax benefits for foreign tax credit carry forwards of $1,032,000 that expire in the fiscal year ending May 31, 2022.
The valuation allowance for deferred tax assets of $22,025,000 at May 31, 2012, is associated primarily with the net operating and capital loss carry forwards and foreign tax credit carry forwards. The valuation allowance includes $1,032,000 for federal, $17,230,000 for state and $3,763,000 for foreign. The federal valuation allowance relates to foreign tax credits. The majority of the supplier relatedstate valuation allowance relates to Metal Framing operations in various states and our Decatur, Alabama facility, while the facility, whichforeign valuation allowance relates to operations in China, Canada, Poland, Luxembourg, India and the Czech Republic. Based on our history of profitability and taxable income projections, we have determined that it is more likely than not that the remaining net deferred tax assets are otherwise realizable.
Note L — Earnings Per Share
The following table sets forth the computation of basic and diluted earnings per share for the years ended May 31:
| (in thousands, except per share) | 2012 | 2011 | 2010 | |||||||||
Numerator (basic & diluted): | ||||||||||||
Net earnings attributable to controlling interest –income available to common shareholders | $ | 115,595 | $ | 115,066 | $ | 45,241 | ||||||
Denominator: | ||||||||||||
Denominator for basic earnings per share attributable to controlling interest – weighted average common shares | 69,651 | 74,803 | 79,127 | |||||||||
Effect of dilutive securities | 601 | 606 | 16 | |||||||||
|
|
|
|
|
| |||||||
Denominator for diluted earnings per share attributable to controlling interest – adjusted weighted average common shares | 70,252 | 75,409 | 79,143 | |||||||||
|
|
|
|
|
| |||||||
Basic earnings per share attributable to controlling interest | $ | 1.66 | $ | 1.54 | $ | 0.57 | ||||||
Diluted earnings per share attributable to controlling interest | 1.65 | 1.53 | 0.57 | |||||||||
Stock options covering 3,451,046, 3,620,287 and 5,820,514 common shares for fiscal 2012, fiscal 2011 and fiscal 2010, respectively, have been excluded from the computation of diluted earnings per share because the effect would have been anti-dilutive for those periods because the exercise price of the stock options was approximately $6,780,000.greater than the average market price of the common shares during the period.
Note H –M — Segment Data
In connection with the acquisition of Angus, as more fully described in “NOTE N – Acquisitions,” we established a new operating segment, Engineered Cabs, which is considered a separate reportable segment.
Our operations are managed principally on a products and services basis and include threefour reportable business segments: Steel Processing, Pressure Cylinders, Engineered Cabs and Metal Framing, each of which is comprised of a similar group of products and Pressure Cylinders.services. Factors used to identify thesereportable business segments include the nature of the products and services provided by each business, segment as well as the management reporting structure, used.similarity of economic characteristics and certain quantitative measures, as prescribed by authoritative guidance. A discussion of each of our reportable business segmentsegments is outlined below.
Steel Processing: The Steel Processing businessoperating segment consists of the Worthington Steel business unit.unit, and includes Precision Specialty Metals, Inc., a specialty stainless processor located in Los Angeles, California, and Spartan, a consolidated joint venture which operates a cold-rolled hot dipped galvanizing line. Worthington Steel is an intermediate processor of flat-rolled steel and stainless steel. This businessoperating segment’s processing capabilities include pickling; slitting; cold reducing; hot-dipped galvanizing; hydrogen annealing; cutting-to-length; tension leveling; edging; non-metallic coating, including dry lubrication, acrylic and paint; and configured blanking; and stamping.blanking. Worthington Steel sells to customers principally in the automotive, construction, lawn and garden, hardware, furniture, office equipment, electrical control, tubing, leisure and recreation, appliance, agricultural, HVAC, container and aerospace markets. Worthington Steel also toll processes steel for steel mills, large end-users, service centers and other processors. Toll processing is different from typical steel processing in that the mill, end-user or other party retains title to the steel and has the responsibility for selling the end product.
Metal Framing: The Metal Framing business segment consists of the Dietrich Metal Framing business unit, which designs and produces metal framing components and systems and related accessories Toll processing revenues were immaterial for the commercial and residential construction markets within the United States and Canada. Dietrich’s customers primarily consist of wholesale distributors, commercial and residential building contractors and mass merchandisers.all periods presented.
Pressure Cylinders: The Pressure Cylinders businessoperating segment consists of the Worthington Cylinders business unit. Worthingtonunit and WNCL, a consolidated joint venture based in India that manufactures high-pressure, seamless steel cylinders for compressed natural gas storage in motor vehicles as well as cylinders for
compressed industrial gases. Our Pressure Cylinders producesoperating segment manufactures and sells filled and unfilled pressure cylinders and various accessories for a diversified linenumber of pressureend-use market applications. The following is a detailed discussion of these markets:
| • | Retail: These products include liquefied petroleum gas (“LPG”) cylinders for barbecue grills and camping equipment, propane accessories, hand held torches and accessories including fuel cylinders, and Balloon Time® helium balloon kits. These products are sold primarily to mass merchandisers, cylinder exchangers and distributors. |
Alternative fuels: The sector includes Type I, II, and III cylinders including low-pressure liquefied petroleumfor containment of compressed natural gas (“LPG”) and refrigerant gas cylinders; high-pressurehydrogen for automobiles, buses, and industrial/specialty gas cylinders; airbrake tanks;light-duty trucks, as well as propane/autogas cylinders for automobiles.
Industrial and Other: This market sector includes industrial, refrigerant, and certain consumerLPG cylinders, as well as other specialty products. The LPGCylinders in these markets are generally sold to gas producers and distributors. Industrial cylinders hold fuel for uses such as cutting, welding, breathing (medical, diving and firefighting), semiconductor production, and beverage delivery. Refrigerant gas cylinders are used to hold fuel for gas barbecue grills, recreational vehicle equipment, residential and light commercial heating systems, industrial forklifts, hand held torches, propane-fueled camping equipment and commercial/residential cooking (the latter, generally outside North America). Refrigerant gas cylinders hold refrigerant gases for commercial, residential and automotive air conditioning and refrigeration systems. High-pressureLPG cylinders hold fuel for recreational vehicle equipment, residential and industrial/specialty
gas cylinders are containers for gases used in the following: cuttinglight commercial heating systems, industrial forklifts and welding metals; breathing (medical, diving and firefighting); semiconductor production; beverage delivery; and compressed natural gas systems. Worthington Cylinders also produces recovery tanks for refrigerant gases,commercial/residential cooking (the latter, generally outside North America). Specialty products include air reservoirs for truck and trailertruck trailers, which are sold to original equipment manufacturers, and non-refillable cylindersa variety of fire suppression and chemical tanks.
Engineered Cabs: This operating segment designs and manufactures high-quality, custom-engineered open and closed cabs and operator stations for “Balloon Timea wide range of heavy mobile equipment in a range of industries. Engineered Cabs also manufactures other specialty weldments, kits, accessories, and cab components. The segment’s core capabilities are organized into two categories: 1) design and engineering and 2) manufacturing. Design and engineering capabilities consist of filling key project management roles from the initial design phase, prototyping and through final manufacturing and delivery of the finished product. Manufacturing capabilities are facilitated by computer-aided design and manufacturing systems as well as a variety of technologically advanced cutting, bending, forming, welding and painting equipment. Products and services are sold principally to original equipment manufacturers located primarily in the United States.
®Metal Framing: The Metal Framing operating segment consists of the Dietrich Metal Framing business unit. As more fully described in “Note A – Summary of Significant Accounting Policies,” helium kits.on March 1, 2011, we contributed certain assets of Dietrich to ClarkDietrich, an unconsolidated joint venture. We retained seven of the 13 metal framing facilities, which continued to operate in support of the joint venture. , The financial results and operating performance of the retained facilities have been reported within the Metal Framing operating segment through August 31, 2011, the date by which all of the retained facilities had ceased operations and actions to locate buyers had been initiated. The contributed net assets, which were deconsolidated effective March 1, 2011, have been reported within Metal Framing on a historical basis.
Other: Included in the Other category are businessoperating segments that do not fit intomeet the reportable business segments,applicable aggregation criteria and are immaterialmateriality tests for purposes of separate disclosure and other corporate related entities. Theseas reportable business segments, are:as well as other corporate-related entities. Through May 9, 2011, these operating segments included Automotive Body Panels, Construction ServicesSteel Packaging, and the Global Group. On May 9, 2011, in connection with the contribution of our automotive body panels subsidiary, Gerstenslager, to the newly-formed joint venture, ArtiFlex, and resulting deconsolidation of the contributed net assets, we no longer maintain a separate Automotive Body Panels operating segment. Accordingly, subsequent to May 9, 2011, the operating segments comprising the Other category consist of Steel Packaging.Packaging and the Global Group. Each of these businessoperating segments is explained in more detail below.
We will continue to report the historical financial results and operating performance of our former Automotive Body Panels:Panels operating segment on a historical
basis through May 9, 2011. This businessformer operating segment consists of the Gerstenslager business unit which provides services including stamping, blanking, assembly, painting, packaging, die management, warehousing, distribution management and other services to customers, primarilyhas historically been reported in the automotive industry.
Construction Services: This business“Other” category for segment consistsreporting purposes, as it has not met the applicable aggregation criteria or materiality thresholds for separate disclosure. Accordingly, this organizational change did not impact the composition of the Worthington Integrated Building Systems (“WIBS”) business unit which includes Worthington Mid-Rise Construction, Inc., which designs and builds mid-rise light-gauge steel framed commercial structures and multi-family housing units; Worthington Military Construction, Inc., which is involved in the supply and construction of metal framing products for, and in the framing of, single family housing, with a focus on military; and Worthington Stairs, LLC, a manufacturer of pre-engineered steel egress stair solutions.our reportable segments.
Steel Packaging: This businessoperating segment consists of Worthington Steelpac Systems, LLC (“Steelpac”), which designs and manufactures reusable custom platforms, racks and pallets made of steel for supporting, protecting and handling products throughout the shipping process for customers in industries such as automotive, lawn and garden and recreational vehicles.
Global Group: This operating segment consists of our Mid-Rise Construction business unit, which designs, supplies and builds mid-rise light-gauge steel framed commercial structures and multi-family housing units; our Military Construction business unit, which is involved in the supply and construction of metal framing products for, and in the framing of, single family housing, with a focus on military housing; and our Commercial Stairs business unit, which will cease operations in fiscal 2013. Also included within the Global Group are the recently-formed Global Development Group and Worthington Energy Group business units. The Worthington Energy Group business unit includes the recently-acquired operations of PSI Energy Solutions, LLC (“PSI”), a services firm that develops cost-effective energy solutions for public and private entities throughout North America. The purpose of the Global Group is to provide new organic growth platforms by applying our core competencies in markets that have high growth opportunities.
The accounting policies of the reportable business segments and other operating segments are described in “Note A – Summary of Significant Accounting Policies.” We evaluate businessoperating segment performance based on operating income.income (loss). Inter-segment sales are not material.
SummarizedThe following table presents summarized financial information for our reportable business segments as of, and for the indicatedfiscal years ended, May 31, is shown in the following table.31:
| In thousands | 2009 | 2008 | 2007 | |||||||||||||||||||||
| (in thousands) | 2012 | 2011 | 2010 | |||||||||||||||||||||
Net sales | ||||||||||||||||||||||||
Steel Processing | $ | 1,183,013 | $ | 1,463,202 | $ | 1,460,665 | $ | 1,578,509 | $ | 1,405,492 | $ | 988,950 | ||||||||||||
Pressure Cylinders | 770,101 | 591,945 | 467,572 | |||||||||||||||||||||
Engineered Cabs | 104,272 | - | - | |||||||||||||||||||||
Metal Framing | 661,024 | 788,788 | 771,406 | 4,402 | 249,543 | 330,578 | ||||||||||||||||||
Pressure Cylinders | 537,373 | 578,808 | 544,826 | |||||||||||||||||||||
Other | 249,857 | 236,363 | 194,911 | 77,417 | 195,644 | 155,934 | ||||||||||||||||||
|
|
| ||||||||||||||||||||||
Total | $ | 2,631,267 | $ | 3,067,161 | $ | 2,971,808 | ||||||||||||||||||
Total net sales | $ | 2,534,701 | $ | 2,442,624 | $ | 1,943,034 | ||||||||||||||||||
|
|
| ||||||||||||||||||||||
Operating income (loss) | ||||||||||||||||||||||||
Steel Processing | $ | (68,149 | ) | $ | 55,799 | $ | 55,382 | $ | 71,578 | $ | 77,671 | $ | 51,353 | |||||||||||
Pressure Cylinders | 45,108 | 48,954 | 30,056 | |||||||||||||||||||||
Engineered Cabs | 4,878 | - | - | |||||||||||||||||||||
Metal Framing | (142,598 | ) | (16,215 | ) | (9,159 | ) | (3,913 | ) | (7,530 | ) | (10,186 | ) | ||||||||||||
Pressure Cylinders | 61,175 | 70,004 | 84,649 | |||||||||||||||||||||
Other | (25,724 | ) | (3,554 | ) | (1,727 | ) | (16,041 | ) | 5,261 | (49,260 | ) | |||||||||||||
|
|
| ||||||||||||||||||||||
Total | $ | (175,296 | ) | $ | 106,034 | $ | 129,145 | |||||||||||||||||
Total operating income | $ | 101,610 | $ | 124,356 | $ | 21,963 | ||||||||||||||||||
|
|
| ||||||||||||||||||||||
Depreciation and amortization | ||||||||||||||||||||||||
Steel Processing | $ | 25,944 | $ | 26,779 | $ | 25,662 | $ | 26,843 | $ | 27,632 | $ | 26,290 | ||||||||||||
Pressure Cylinders | 20,407 | 14,734 | 12,936 | |||||||||||||||||||||
Engineered Cabs | 3,540 | - | - | |||||||||||||||||||||
Metal Framing | 15,683 | 16,907 | 16,628 | 765 | 9,623 | 14,591 | ||||||||||||||||||
Pressure Cylinders | 10,680 | 10,454 | 9,858 | |||||||||||||||||||||
Other | 11,766 | 9,273 | 9,321 | 4,318 | 9,069 | 10,836 | ||||||||||||||||||
|
|
| ||||||||||||||||||||||
Total | $ | 64,073 | $ | 63,413 | $ | 61,469 | ||||||||||||||||||
Total depreciation and amortization | $ | 55,873 | $ | 61,058 | $ | 64,653 | ||||||||||||||||||
|
|
| ||||||||||||||||||||||
Pre-tax restructuring charges | ||||||||||||||||||||||||
Pre-tax restructuring and other expense (income) | ||||||||||||||||||||||||
Steel Processing | $ | 3,917 | $ | 1,096 | $ | - | $ | - | $ | (303 | ) | $ | (488 | ) | ||||||||||
Pressure Cylinders | 52 | - | 309 | |||||||||||||||||||||
Engineered Cabs | - | - | - | |||||||||||||||||||||
Metal Framing | 13,593 | 8,979 | - | - | 1,387 | 3,892 | ||||||||||||||||||
Pressure Cylinders | 1,045 | 103 | - | |||||||||||||||||||||
Other | 24,486 | 7,933 | - | 5,932 | 1,569 | 530 | ||||||||||||||||||
|
|
| ||||||||||||||||||||||
Total | $ | 43,041 | $ | 18,111 | $ | - | ||||||||||||||||||
Total pre-tax restructuring and other expense | $ | 5,984 | $ | 2,653 | $ | 4,243 | ||||||||||||||||||
|
|
| ||||||||||||||||||||||
Pre-tax impairment of long-lived assets | ||||||||||||||||||||||||
Steel Processing | $ | - | $ | - | $ | - | ||||||||||||||||||
Pressure Cylinders | - | - | - | |||||||||||||||||||||
Engineered Cabs | - | - | - | |||||||||||||||||||||
Metal Framing | - | - | - | |||||||||||||||||||||
Other | 355 | 4,386 | 35,409 | |||||||||||||||||||||
|
|
| ||||||||||||||||||||||
Total pre-tax impairment of long-lived assets | $ | 355 | $ | 4,386 | $ | 35,409 | ||||||||||||||||||
|
|
| ||||||||||||||||||||||
Joint venture transactions | ||||||||||||||||||||||||
Steel Processing | $ | (2,102 | ) | $ | - | $ | - | |||||||||||||||||
Pressure Cylinders | - | - | - | |||||||||||||||||||||
Engineered Cabs | - | - | - | |||||||||||||||||||||
Metal Framing | 1,952 | (1,810 | ) | - | ||||||||||||||||||||
Other | - | (8,626 | ) | - | ||||||||||||||||||||
|
|
| ||||||||||||||||||||||
Total joint venture transactions | $ | (150 | ) | $ | (10,436 | ) | $ | - | ||||||||||||||||
|
|
| ||||||||||||||||||||||
Total assets | ||||||||||||||||||||||||
Steel Processing | $ | 469,701 | $ | 942,885 | $ | 815,070 | $ | 703,336 | $ | 742,838 | $ | 674,953 | ||||||||||||
Pressure Cylinders | 575,250 | 481,361 | 393,639 | |||||||||||||||||||||
Engineered Cabs | 199,594 | - | - | |||||||||||||||||||||
Metal Framing | 226,285 | 527,446 | 476,100 | 7,688 | 37,069 | 203,072 | ||||||||||||||||||
Pressure Cylinders | 355,717 | 437,159 | 357,696 | |||||||||||||||||||||
Other | 312,126 | 80,541 | 165,316 | 391,929 | 405,981 | 248,683 | ||||||||||||||||||
|
|
| ||||||||||||||||||||||
Total | $ | 1,363,829 | $ | 1,988,031 | $ | 1,814,182 | ||||||||||||||||||
Total assets | $ | 1,877,797 | $ | 1,667,249 | $ | 1,520,347 | ||||||||||||||||||
|
|
| ||||||||||||||||||||||
Capital expenditures | ||||||||||||||||||||||||
Steel Processing | $ | 24,975 | $ | 7,157 | $ | 14,030 | ||||||||||||||||||
Metal Framing | 4,467 | 6,770 | 15,657 | |||||||||||||||||||||
Pressure Cylinders | 26,618 | 16,540 | 14,068 | |||||||||||||||||||||
Other | 8,094 | 17,053 | 13,936 | |||||||||||||||||||||
Total | $ | 64,154 | $ | 47,520 | $ | 57,691 | ||||||||||||||||||
Net
The following table presents net sales by geographic region for the years ended May 31 are shown in the following table:31:
| In thousands | 2009 | 2008 | 2007 | ||||||||||||||||
United States | $ | 2,395,430 | l | l | $ | 2,786,679 | l | l | $ | 2,719,240 | |||||||||
Canada | 66,467 | 74,623 | 60,340 | ||||||||||||||||
Europe | 169,370 | 205,859 | 192,228 | ||||||||||||||||
Total | $ | 2,631,267 | $ | 3,067,161 | $ | 2,971,808 | |||||||||||||
| (in thousands) | 2012 | 2011 | 2010 | |||||||||
United States | $ | 2,333,575 | $ | 2,256,579 | $ | 1,832,286 | ||||||
Canada | 29,097 | 32,891 | 39,751 | |||||||||
Europe | 150,458 | 116,071 | 70,997 | |||||||||
Other | 21,571 | 37,083 | - | |||||||||
|
|
|
|
|
| |||||||
Total | $ | 2,534,701 | $ | 2,442,624 | $ | 1,943,034 | ||||||
|
|
|
|
|
| |||||||
Net fixed assetsThe following table presents property, plant and equipment, net, by geographic region as of May 31 are shown in the following table:31:
| In thousands | 2009 | 2008 | 2007 | ||||||||||||||||||
| (in thousands) | 2012 | 2011 | 2010 | ||||||||||||||||||
United States | $ | 472,078 | $ | 505,988 | $ | 528,181 | $ | 371,269 | $ | 337,894 | $ | 459,174 | |||||||||
Canada | 2,567 | 8,025 | 8,995 | 1,270 | 1,368 | 1,055 | |||||||||||||||
Europe | 46,860 | 35,931 | 27,089 | 59,209 | 49,627 | 45,934 | |||||||||||||||
Other | 11,329 | 16,445 | - | ||||||||||||||||||
|
|
| |||||||||||||||||||
Total | $ | 521,505 | $ | 549,944 | $ | 564,265 | $ | 443,077 | $ | 405,334 | $ | 506,163 | |||||||||
|
|
| |||||||||||||||||||
Note I – Related Party TransactionsN — Acquisitions
We purchase from, and sell to, affiliated companies certain raw materials and services at prevailing market prices. Net sales to affiliated companies for fiscal 2009, fiscal 2008 and fiscal 2007 totaled $18,550,000, $25,962,000 and $34,915,000, respectively. Purchases from affiliated companies for fiscal 2009, fiscal 2008 and fiscal 2007 totaled $2,799,000, $10,680,000 and $6,394,000, respectively. Accounts receivable from affiliated companies were $3,301,000 and $5,107,000 at May 31, 2009 and 2008, respectively. Accounts payable to affiliated companies were $155,000 and $136,000 at May 31, 2009 and 2008, respectively.Fiscal 2012
Note J – Investments in Unconsolidated AffiliatesPSI Energy Solutions
Our investments in affiliated companies, which are not controlled through majority ownership or otherwise, are accounted for using the equity method. At May 31, 2009, these equity investments, and the percentage interest owned, consisted of: Worthington Armstrong Venture (“WAVE”) (50%), TWB Company, L.L.C. (45%), Worthington Specialty Processing (“WSP”) (51%), Serviacero Planos, S.A. de C.V. (50%) and LEFCO Worthington, LLC (49%). WSP is considered to be jointly controlled and not consolidated due to substantive participating rights of the minority partner.
During May 2009, we sold our 50% equity interest in Accelerated Building Technologies, LLC to NOVA Chemicals Corporation, the other member of the joint venture. The sales price and loss on the transaction were immaterial.
During January 2009, we sold our 60% equity interest in Aegis Metal Framing, LLC for approximately $24,000,000 to MiTek Industries, Inc., the other member of the joint venture. This resulted in a gain of $8,331,000.
During October 2008, we sold our 49% equity interest in Canessa Worthington Slovakia s.r.o. for approximately $3,700,000 to the Magnetto Group, the other member of the joint venture. The gain on the transaction was immaterial.
On October 1, 2008, we expanded and modified WSP, our joint venture with United States Steel Corporation (“U.S. Steel”). U.S. Steel contributed ProCoil Company, L.L.C., its steel processing facility in Canton, Michigan, and we contributed $2,500,000 of cash and Worthington Steel Taylor, our steel processing subsidiary in Taylor, Michigan, which had a book value of $13,851,000.
On June 2, 2008, we made an additional capital contribution of $392,000 to Viking & Worthington Steel Enterprise, LLC (“VWSE”). The other member in the joint venture did not make its contribution as required by the operating agreement. As a result, we now own 100% of VWSE, which has been fully consolidated in our financial statements since the beginning of fiscal 2009. VWSE has closed its manufacturing operations and its business is being handled by the consolidated operations of the Steel Processing business segment.
On March 1, 2008, our TWB joint venture acquired ThyssenKrupp Tailored Blanks S.A. de C.V., the Mexican laser welding subsidiary of ThyssenKrupp Steel North America, Inc. (“ThyssenKrupp”), to expand TWB’s
presence in Mexico. The acquisition was made through a contribution of capital by ThyssenKrupp, and as a result, ThyssenKrupp owns 55% of TWB, and Worthington owns 45%. This resulted in a dilution gain of $1,944,000 (net of taxes of $1,031,000) and was recorded as additional paid-in capital.
On October 25, 2007,22, 2012, we acquired a 49%75% ownership interest in cratePSI Energy Solutions, LLC (“PSI”) for cash consideration of $7,000,000. PSI is a professional services firm that develops cost-effective energy solutions for public and pallet maker LEFCO Industries, LLC, a minority business enterprise.private entities throughout North America. The resulting joint venture, called LEFCO Worthington, LLC, offers engineered wooden crates, specialty pallets and steel rack systems for a variety of industries.
On September 17, 2007, Worthington acquired a 50% interest in Serviacero Planos of central Mexico. This joint venture is known as Serviacero Planos, S.A de C.V. The purchase price of the investment was $41,767,000. The investment exceeded the book value of the underlying equity in net assets by $22,258,000. Of this excess amount, $12,828,000 was allocated based on the fair valuebecame part of those underlying net assetsour Global Group operating segment upon closing and will be amortized to equity in net income of unconsolidated affiliates over the remaining useful lives of those assets, with the remainder of $9,430,000 allocated to goodwill.
We received distributions from unconsolidated affiliates totaling $80,580,000, $58,920,000 and $131,723,000 in fiscal 2009, fiscal 2008 and fiscal 2007, respectively. During the fiscal year ended May 31, 2009, we received distributions from WAVE in excess of our investment balance, which created a negative balance in our investment account of $18,240,000 at May 31, 2009. The accounting treatment of excess distributions for a general partnership is to reclassify the negative balance to the liability section of the balance sheet, which was done during fiscal 2009. This liability is included in other liabilities on the consolidated balance sheet at May 31, 2009. We will continue to record equity in net income from WAVE as a debit to the investment account, and when it becomes positive, it will again be shown as an asset on the balance sheet. If it becomes obvious that any excess distribution may not be returned (upon joint venture liquidation or for other reasons), we will record any balancereported in the liability as immediate income or gain.
We use the “cumulative earnings” approach“Other” category for determining cash flow presentation of distributions from our unconsolidated joint ventures. Distributions received on the investments are included in our consolidated statements of cash flows in operating activities, unless the cumulative distributions exceed our portion of cumulative equity in earnings of the joint venture, in which case the excess distributions are deemed to be returns of the investment and included in our consolidated statements of cash flows as an investing cash flow. During fiscal 2009, the Company received distributions from an unconsolidated joint venture in excess of the Company’s cumulative equity in the earnings of that joint venture. This cash flow of $23.5 million was included in investing activities in the consolidated statements of cash flows due to the nature of the distribution as a return of investment, rather than a return on investment. In fiscal year 2008, there were no distributions from unconsolidated joint ventures classified as investing cash flows.
Combined financial information for affiliated companies accounted for using the equity method as of, and for the years ended, May 31, was as follows:
| In thousands | 2009 | 2008 | 2007 | ||||||
Cash | $ | 72,103 | $ | 79,538 | $ | 64,190 | |||
Other current assets | 165,615 | 225,469 | 154,797 | ||||||
Noncurrent assets | 167,779 | 194,169 | 102,261 | ||||||
Total assets | $ | 405,497 | $ | 499,176 | $ | 321,248 | |||
Current liabilities | $ | 57,995 | $ | 124,258 | $ | 81,439 | |||
Long-term debt | 150,596 | 101,411 | 124,214 | ||||||
Other noncurrent liabilities | 24,373 | 34,394 | 7,228 | ||||||
Equity | 172,533 | 239,113 | 108,367 | ||||||
Total liabilities and equity | $ | 405,497 | $ | 499,176 | $ | 321,248 | |||
Net sales | $ | 719,635 | $ | 745,437 | $ | 652,178 | |||
Gross margin | 175,832 | 206,927 | 183,603 | ||||||
Depreciation and amortization | 14,044 | 13,056 | 14,164 | ||||||
Interest expense | 3,708 | 7,575 | 3,701 | ||||||
Income tax expense | 7,101 | 8,974 | 6,674 | ||||||
Net earnings | 102,071 | 134,925 | 124,456 | ||||||
At May 31, 2009, cumulative distributions from our unconsolidated affiliates, net of tax, exceeded our share of the cumulative earnings from those affiliates by $7,360,000. This is due to the excess distributions, noted above, from WAVE.
Note K – Earnings (Loss) Per Sharesegment reporting purposes.
The following table sets forth the computation of basic and diluted earnings (loss) per share for the years ended May 31:
| In thousands, except per share | 2009 | 2008 | 2007 | |||||||
Numerator (basic & diluted): | ||||||||||
Net earnings (loss) – income available to common shareholders | $ | (108,214 | ) | $ | 107,077 | $ | 113,905 | |||
Denominator: | ||||||||||
Denominator for basic earnings (loss) per share –weighted average common shares | 78,903 | 81,232 | 86,351 | |||||||
Effect of dilutive securities | - | 666 | 651 | |||||||
Denominator for diluted earnings per share –adjusted weighted average common shares | 78,903 | 81,898 | 87,002 | |||||||
Earnings (loss) per share – basic | $ | (1.37 | ) | $ | 1.32 | $ | 1.32 | |||
Earnings (loss) per share – diluted | (1.37 | ) | 1.31 | 1.31 | ||||||
Stock options covering 5,979,781, 1,346,625 and 1,818,813 common shares for fiscal 2009, fiscal 2008 and fiscal 2007, respectively, have been excluded from the computation of diluted earnings per share because the effect would have been anti-dilutive for those periods.
Note L – Operating Leases
We lease certain property and equipment from third parties under non-cancelable operating lease agreements. Rent expense under operating leases was $15,467,000 $14,188,000 and $13,926,000 in fiscal 2009, fiscal 2008 and fiscal 2007, respectively. Future minimum lease payments for non-cancelable operating leases having an initial or remaining term in excess of one year at May 31, 2009, are as follows:
| In thousands | |||
2010 | $ | 11,094 | |
2011 | 9,434 | ||
2012 | 7,773 | ||
2013 | 6,215 | ||
2014 | 4,265 | ||
Thereafter | 6,339 | ||
Total | $ | 45,120 | |
Note M – Sale of Accounts Receivable
We maintain a $100,000,000 revolving trade accounts receivable securitization facility which expires in January 2011. Transactions under the facility have been accounted for as a sale under the provisions of SFAS No. 140,Accounting for Transfers and Servicing of Financial Assets and Extinguishments of Liabilities. Pursuant to the terms of the facility, certain of our subsidiaries sell their accounts receivable without recourse, on a revolving basis, to Worthington Receivables Corporation (“WRC”), a wholly-owned, consolidated, bankruptcy-remote subsidiary. In turn, WRC may sell without recourse, on a revolving basis, up to $100,000,000 of undivided ownership interests in this pool of accounts receivable to a multi-sell, asset-backed commercial paper conduit (the “Conduit”). Purchases by the Conduit are financed with the sale of A1/P1 commercial paper. We retain an undivided interest in this pool and are subject to risk of loss based on the collectability of the receivables from this retained interest. Because the amount eligible to be sold excludes receivables more than 90 days past due, receivables offset by an allowance for doubtful accounts because of bankruptcy or other cause, receivables from foreign customers, concentrations over limits with specific customers and certain reserve amounts, we believe additional risk of loss is minimal. Facility fees of $2,628,000, $341,000 and $580,000 were incurred during fiscal 2009, fiscal 2008 and fiscal 2007, respectively, and were recorded as miscellaneous expense. The book value of the retained portion of the pool of accounts receivable approximates fair value. We continue to service the accounts receivable sold to WRC.
As of May 31, 2009, the pool of eligible accounts receivable was $92,400,000, and $60,000,000 of undivided ownership interests in this pool of accounts receivable had been sold. The proceeds from the sale are reflected as a reduction of accounts receivable on the consolidated balance sheets and in net cash provided by operating activities in the consolidated statements of cash flows.
Note N – Restructuring
In the first quarter of fiscal 2008, we announced the initiation of a Transformation Plan (the “Plan”) with the overall goal to increase the Company’s sustainable earnings potential, asset utilization and operational performance. The Plan is being implemented over a three-year period and focuses on cost reduction, margin expansion and organizational capability improvements, and in the process seeks to drive excellence in three core competencies: sales, operations and supply chain management. The Plan is comprehensive in scope and includes aggressive diagnostic and implementation phases in the Steel Processing and Metal Framing business segments.
We retained a consulting firm to assist in the development and implementation of the Plan. The services provided by this firm include diagnostic tools, performance improvement technologies, project management
techniques, benchmarking information and insights that directly relate to the Plan. Accordingly, the fees of the consulting firm have been included in restructuring charges. The services began at the onset of the Plan and have concluded as of May 31, 2009. Internal transformation teams have been formed and are now dedicated to the Plan efforts.
To date, the following actions have been taken:
On September 25, 2007, we announced the closure or downsizing of five locations in our Metal Framing business segment. These actions were completed as of May 31, 2008.
We reduced headcount company-wide through a combination of voluntary retirement and severance packages.
On October 23, 2008, we announced the closure of two facilities, one Steel Processing (Louisville, Kentucky) and one Metal Framing (Renton, Washington), and headcount reductions of 282. The Louisville facility closed on February 28, 2009, and the Renton facility closed on December 31, 2008.
During the first quarter of fiscal 2009, the Metal Framing corporate offices were moved from Pittsburgh and Blairsville, Pennsylvania to Columbus, Ohio.
On December 5, 2008, we announced the closure and suspension of operations at three Metal Framing facilities and headcount reductions in Steel Processing of 186 and in Metal Framing of 125. The Lunenburg, Massachusetts facility closed on February 28, 2009, and operations were suspended in Miami, Florida and Phoenix, Arizona on February 28, 2009.
The positive results of these efforts, however, have been over-shadowed by the negative impact of the recessionary business conditions. The continuing focus of the Plan is to sustain the benefits already attained, to identify and implement additional initiatives, and to position the Company to improve profitability over historic levels as demand recovers in end-markets.
In connection with the Plan, a total of $61,152,000 has been recorded to date as restructuring charges in the consolidated statements of earnings: $43,041,000 was incurred in fiscal 2009, and $18,111,000 was incurred during fiscal 2008. Restructuring charges for fiscal 2009 are summarized as follows:
| In thousands | 5/31/2008 Liability | Expense | Payments | Adjustments | 5/31/2009 Liability | |||||||||||
Early retirement and severance | $ | 1,143 | $ | 8,242 | $ | (6,265 | ) | $ | 81 | $ | 3,201 | |||||
Professional Fees and Other costs | 1,710 | �� | 25,874 | (26,585 | ) | - | 999 | |||||||||
| $ | 2,853 | 34,116 | $ | (32,850 | ) | $ | 81 | $ | 4,200 | |||||||
Non-cash charges | 8,925 | |||||||||||||||
Total | $ | 43,041 | ||||||||||||||
Non-cash charges represent asset impairment charges and accelerated depreciation expense associated with strategic decisions made as part of the Plan. Cash expenditures of $32,850,000 associated with implementing the Plan were paid during fiscal 2009, with the remainder of 2009 cash restructuring charges to be paid during the first quarter of fiscal 2010. Certain cash payments associated with lease terminations, however, may be paid over the remaining lease terms. An estimated $6,000,000 million of additional restructuring charges are expected to be incurred in fiscal 2010, the majority of which will be incurred during the first quarter ending August 31, 2009. These expected remaining costs will not include a significant amount of professional fees, as responsibility for executing the Plan has been successfully transitioned to our internal transformation teams.
Note O – Goodwill and Other Long-Lived Assets
We use the purchase method of accounting for any business combinations initiated after June 30, 2002, and recognize amortizable intangible assets separately from goodwill. Under SFAS No. 142,Goodwill and Other Intangible Assets, goodwill and indefinite-lived intangible assets are no longer amortized but are reviewed for impairment. The annual impairment test is performed during the fourth quarter of each fiscal year. We have no intangible assets with indefinite lives other than goodwill.
We review the carrying value of our long-lived assets, including intangible assets with finite useful lives, whenever events or changes in circumstances indicate that the carrying value of an asset or a group of assets may not be recoverable. When a potential impairment is indicated, accounting standards require a charge to be recognized in the financial statements if the carrying amount of an asset or group of assets exceeds the fair value of that asset or group of assets. The loss recognized would be the difference between the fair value and the carrying amount of the asset or group of assets.
Due to continued deterioration in business and market conditions during fiscal 2009, we determined that certain indicators of impairment were present, as defined by SFAS No. 144,Accounting for the Impairment or Disposal of Long-Lived Assets.Therefore, long-lived assets, including intangible assets with finite useful lives, were subsequently tested for impairment during the fourth quarter of fiscal 2009. Recoverability of the identified asset groups was tested using future cash flow projections based on management’s long range estimates of market conditions. The sum of the undiscounted future cash flows related to each asset group was more than the net book value for each of the asset groups; therefore, no impairment loss was indicated at May 31, 2009.
We test our goodwill balances for impairment annually, during the fourth quarter, and more frequently if events or changes in circumstances indicate that goodwill may be impaired. We test goodwill at the business segment level as we have determined that the characteristics of the reporting units within each business segment are similar and allow for their aggregation to the business segment level for testing purposes. The test consists of determining the fair value of the business segments, using discounted cash flows, and comparing the result to the carrying values of the business segments. If the estimated fair value of a business segment exceeds its carrying value, there is no impairment. If the carrying amount of the business segment exceeds its estimated fair value, an impairment of the goodwill is indicated. The amount of the impairment is determined by establishing the fair value of all assetsacquired and liabilities of the business segment, excluding the goodwill, and comparing the total to the estimatedassumed were recognized at their acquisition-date fair value of the business segment. The difference represents the fair value of the goodwill and if it is lower than the book value of the goodwill, the difference is recorded as a loss in the consolidated statements of earnings.
Due to industry changes, weakness in the construction market and the depressed results in the Metal Framing business segment over the last year, we have tested this business segment for impairment on a quarterly basis. Given the significant decline in the economy during fiscal 2009 and its impact on the construction market, we revised the forecasted cash flows and discount rate assumptions used in our previous valuations of this business segment. The forecasted cash flows were revised downward due to the significant decline in, and the future uncertainty of, the economy. The discount rate, based on our current cost of debt and equity capital, was changed due to the increased risk in our forecast. After reviewing the revised valuation and the fair value estimates of the remaining assets, it was determined that the value of the business no longer supported its $96,943,000 goodwill balance. As a result, the full amount was written-off in the second quarter ended November 30, 2008.
Subsequent to the second quarter write-off noted above, and as of February 28, 2009, the total goodwill balance was $98,293,000. Of this amount, $73,643,000 related to the Pressure Cylinders business segment and $24,650,000 related to the Construction Services business segment, $17,950,000 of which resulted from the June 2008 acquisition of substantially all of the assets of The Sharon Companies Ltd. (See “Note Q –
Acquisitions”). During the quarter ended February 28, 2009, we tested the value of the goodwill balances in the Construction Services business segment as weakness in the construction market continued. For the test, we assumed the revenue trend rate would range from down 1.1% to up 7.5% as we expect a recovery in the latter years of the forecast due to pent-up demand and future growth in the market share of our Construction Services business segment. We set the discount rate at 12%, up from the 10% used in the fiscal 2008 annual testing but lower than the 14% used for the Metal Framing business segment test in the second quarter of fiscal 2009. We believe this was appropriate due to increased uncertainty in the market place since the end of fiscal 2008, and the cash flows for the Construction Services business segment being more predictable than those of the Metal Framing business segment. Based on this test, there was no indication of impairment. We also performed the same test using a 14% discount rate, which also indicated no impairment.
During the fourth quarter of fiscal 2009, the Company completed its annual test of goodwill. No additional impairments were identified during the Company’s annual assessment of goodwill. Future declines in the market and deterioration in earnings could lead to additional impairment of goodwill and other long-lived assets.
Goodwill by business segment is summarized as follows at May 31:
| In thousands | 2009 | 2008 | ||||
Metal Framing | $ | - | $ | 97,316 | ||
Pressure Cylinders | 76,692 | 79,507 | ||||
Other | 24,651 | 6,700 | ||||
Total | $ | 101,343 | $ | 183,523 | ||
The decrease in goodwill for the Pressure Cylinders business segment was due primarily to foreign currency impacts. The increase in goodwill for the Other category was due to the acquisition of substantially all of the assets of The Sharon Companies Ltd., as noted above.
Amortizable intangible assets are summarized as follows at May 31:
| 2009 | 2008 | |||||||||||
| In thousands | Cost | Accumulated Amortization | Cost | Accumulated Amortization | ||||||||
Patents and trademarks | $ | 14,119 | $ | 7,655 | $ | 11,364 | $ | 6,217 | ||||
Customer relationships | 19,981 | 5,845 | 12,258 | 4,534 | ||||||||
Non-compete agreement | 1,900 | 1,286 | 1,520 | 681 | ||||||||
Other | 2,970 | 542 | - | - | ||||||||
Total | $ | 38,970 | $ | 15,328 | $ | 25,142 | $ | 11,432 | ||||
The increase in amortizable intangible assets was due to the acquisition of substantially all of the assets of The Sharon Companies Ltd. on June 2, 2008 (See “Note Q – Acquisitions”). Amortization expense was $3,896,000, $2,258,000 and $1,991,000 for fiscal 2009, fiscal 2008 and fiscal 2007, respectively. These intangible assets are amortized on the straight-line method over their estimated useful lives, which range from 2 to 20 years.
Estimated amortization expense for these intangible assets for the next five fiscal years is as follows:
| In thousands | |||
2010 | $ | 3,681 | |
2011 | 2,749 | ||
2012 | 2,397 | ||
2013 | 1,989 | ||
2014 | 1,905 | ||
Note P – Guarantees and Warranties
The Company does not have guarantees that it believes are reasonably likely to have a material current or future effect on our financial condition, changes in financial condition, revenue or expenses, results of operations, liquidity, capital expenditures or capital resources. However, as of May 31, 2009, the Company was party to operating leases for aircraft in which the Company has guaranteed residual values, at the termination of the leases. The maximum obligation under these terms was approximately $17,938,000 million at May 31, 2009. Based on current facts and circumstances, the Company has estimated the likelihood of payment pursuant to these guarantees, and determined that the fair value of the obligations based on those likely outcomes is not material.
The Company also had in place $8,260,000 of outstanding stand-by letters of credit as of May 31, 2009. These letters of credit were issued to third party service providers and had no amounts drawn against them at May 31, 2009. Fair value of theses guarantee instruments, based on premiums paid, was not material at May 31, 2009.
We have established reserves for anticipated sales returns and allowances, including limited warranties on certain products. The liability for sales returns and allowances is primarily based on historical experience and current information. The liability amounts related to warranties were immaterial at May 31, 2009 and 2008.
Note Q – Acquisitions
On June 2, 2008, Worthington purchased substantially all of the assets of The Sharon Companies Ltd. (“Sharon Stairs”) for $37,150,000. Sharon Stairs, now referred to as Worthington Stairs, LLC, designs and manufactures steel egress stair systems for the commercial construction market, and operates one manufacturing facility in Akron, Ohio. It operates as part of the WIBS business segment. The purchase price was allocated to the acquired assets and assumed liabilities based on their estimated fair values at the date of acquisition, with goodwill representing the excess of the purchase price over the fair value allocated toof the net assets. identifiable assets acquired. In connection with the acquisition of PSI, we identified and valued the following identifiable intangible assets:
| (in thousands) | Amount | Useful Life (Years) | ||||||
| Category | ||||||||
Customer relationships | $ | 1,540 | 15-20 | |||||
Non-compete agreement | 180 | 3 | ||||||
Other | 1,670 | 10 | ||||||
|
| |||||||
Total acquired identifiable intangible assets | $ | 3,390 | ||||||
|
| |||||||
The purchase price allocatedincludes the fair values of other assets that were not identifiable, not separately recognizable under accounting rules (e.g., assembled workforce) or of immaterial value. The purchase price also includes a going-concern element that represents our ability to intangibleearn a higher rate of return on the group of assets than would be expected on the separate assets as determined during the valuation process. This additional investment value resulted in goodwill, which is expected to be deductible for income tax purposes.
The following table summarizes the consideration transferred for PSI and the fair value assigned to the assets acquired and liabilities assumed at the acquisition date:
| (in thousands) | ||||
Accounts receivable | $ | 784 | ||
Inventories | 407 | |||
Intangible assets | 3,390 | |||
Property, plant and equipment | 66 | |||
|
| |||
Total identifiable assets | 4,647 | |||
Accounts payable | (528 | ) | ||
Accrued liabilities | (437 | ) | ||
|
| |||
Net identifiable assets | 3,682 | |||
Goodwill | 5,651 | |||
|
| |||
Net assets | 9,333 | |||
Noncontrolling interest | (2,333 | ) | ||
|
| |||
Total consideration paid | $ | 7,000 | ||
|
| |||
Operating results of PSI have been included in our consolidated statements of earnings from the acquisition date, forward. Pro forma results, including the acquired business since the beginning of fiscal 2012 or fiscal 2011, would not be materially different than reported results.
Angus
On December 29, 2011, we acquired 100% of the outstanding economic interests of Angus for cash consideration of approximately $132,940,000 and the assumption of approximately $47,324,000 of debt, of which $44,341,000 was repaid prior to quarter-end. Additionally, we issued 382,749 restricted common shares to certain former employees of Angus who became employees of Worthington upon closing. These restricted common shares, which vest over a period of one or three years, had a grant-date fair value of approximately $6,300,000. Of this amount, approximately $1,100,000 was attributed to the purchase price. The remaining $5,200,000 will be amortizedrecognized as stock-based compensation expense on a straight-line basis over the applicable service period. Angus designs and manufactures high-quality, custom-engineered open and closed cabs and operator stations for a weighted average lifewide range of 13 years.heavy mobile equipment. The acquired net assets and related operations of Angus are included in our recently-formed operating segment, Engineered Cabs. In connection with the acquisition of Angus, we incurred approximately $780,000 of acquisition-related costs, which have been expensed as incurred and recognized within SG&A expense in our consolidated statements of earnings.
The allocation wasassets acquired and liabilities assumed were recognized at their acquisition-date fair values, with goodwill representing the excess of the purchase price over the fair value of the net identifiable assets acquired. In connection with the acquisition of Angus, we identified and valued the following identifiable intangible assets:
| (in thousands) | Amount | Useful Life (Years) | ||||||
Category | ||||||||
Trade name | $ | 19,100 | Indefinite | |||||
Customer relationships | 32,200 | 10-15 | ||||||
Non-compete agreement | 640 | 3 | ||||||
Other | 963 | 9 | ||||||
|
| |||||||
Total acquired identifiable intangible assets | $ | 52,903 | ||||||
|
| |||||||
The purchase price includes the fair values of other assets that were not identifiable, not separately recognizable under accounting rules (e.g., assembled workforce) or of immaterial value. The purchase price
also includes a going-concern element that represents our ability to earn a higher rate of return on the group of assets than would be expected on the separate assets as determined during the valuation process. This additional investment value resulted in goodwill, which is expected to be deductible for income tax purposes.
The following table summarizes the consideration transferred for Angus and the fair value assigned to the assets acquired and liabilities assumed at the acquisition date:
| (in thousands) | ||||
Cash and cash equivalents | $ | 2,540 | ||
Accounts receivable | 16,515 | |||
Inventories | 22,865 | |||
Prepaid expenses and other current assets | 1,281 | |||
Deferred income taxes | 398 | |||
Intangible assets | 52,903 | |||
Other noncurrent assets | 74 | |||
Property, plant and equipment | 57,570 | |||
|
| |||
Total identifiable assets | 154,146 | |||
Accounts payable | (9,581 | ) | ||
Accrued liabilities | (7,483 | ) | ||
Other current liabilities | (948 | ) | ||
Long-term debt and other short-term borrowings | (47,324 | ) | ||
|
| |||
Net identifiable assets | 88,810 | |||
Goodwill | 45,230 | |||
|
| |||
Total consideration transferred | $ | 134,040 | ||
|
| |||
Operating results of Angus have been included in our consolidated statements of earnings from the acquisition date, forward, and are disclosed in “Note M – Segment Operations.”
Pro forma net sales and net earnings of the combined entity had the acquisition occurred on June 1, 2010, are summarized as follows:
| In thousands | |||
Current assets | $ | 8,520 | |
Intangible assets | 12,440 | ||
Property, plant and equipment, net | 2,500 | ||
Total assets | 23,460 | ||
Current liabilities | 3,841 | ||
Other liabilities | 19 | ||
Long-term debt | 400 | ||
Identifiable net assets | 19,200 | ||
Goodwill | 17,950 | ||
Total purchase price | $ | 37,150 | |
| (unaudited, in thousands) | Net sales | Net earnings | ||||||
Supplemental pro forma from June 1, 2011—May 31, 2012 | $ | 2,667,478 | $ | 138,250 | ||||
Supplemental pro forma from June 1, 2010—May 31, 2011 | 2,573,251 | 128,191 | ||||||
Supplemental pro forma earnings for fiscal 2012 were adjusted to exclude $508,000 of acquisition-related costs and $2,347,000 of non-recurring expense related to the fair value adjustment to acquisition-date inventory. Supplemental pro forma earnings for fiscal 2011 were adjusted to include these charges.
Coleman Cylinders
On December 1, 2011, we acquired the propane fuel cylinders business of The Coleman Company, Inc. (“Coleman Cylinders”) for cash consideration of approximately $22,653,000. The acquired net assets became part of our Pressure Cylinders operating segment upon closing of the transaction. Subsequent to closing, we received a request from the Federal Trade Commission, asking us to provide, on a voluntary basis, certain information related to the acquisition and the industry as it conducts a preliminary investigation into the transaction. The acquisition fell below the threshold for pre-merger notification under the Hart-Scott-Rodino Act.
The assets acquired and liabilities assumed were recognized at their acquisition-date fair values, with goodwill representing the excess of the purchase price over the fair value of the net identifiable assets acquired. In connection with the acquisition of Coleman Cylinders, we identified and valued the following identifiable intangible assets:
| (in thousands) | Amount | Useful Life (Years) | ||||||
Category | ||||||||
Customer relationships | $ | 4,400 | 15 | |||||
Non-compete agreement | 160 | 5 | ||||||
|
| |||||||
Total acquired identifiable intangible assets | $ | 4,560 | ||||||
|
| |||||||
Cash flows used to determine the purchase price included strategic and synergistic benefits (investment value) specific to us, which resulted in a purchase price in excess of the fair value of identifiable net assets. The purchase price also includes a going-concern element that represents our ability to earn a higher rate of return on the group of assets than would be expected on the separate assets as determined during the valuation process. This additional investment value resulted in goodwill, which is expected to be deductible for income tax purposes.
The following table summarizes the consideration transferred for Coleman Cylinders and the fair value assigned to the assets acquired and liabilities assumed at the acquisition date:
| (in thousands) | ||||
Inventories | $ | 6,456 | ||
Intangible assets | 4,560 | |||
Property, plant and equipment | 9,726 | |||
|
| |||
Total identifiable assets | 20,742 | |||
Accounts payable | (3,719 | ) | ||
Accrued liabilities | (258 | ) | ||
|
| |||
Net identifiable assets | 16,765 | |||
Goodwill | 5,888 | |||
|
| |||
Total consideration paid | $ | 22,653 | ||
|
| |||
Operating results of Coleman Cylinders have been included in our consolidated statements of earnings from the acquisition date, forward. Pro forma results, including the acquired business since the beginning of fiscal 2012 or fiscal 2011, would not be materially different than reported results.
STAKO
On September 30, 2011, we completed the acquisition of Poland-based STAKO sp.Z o.o. (“STAKO”) for cash consideration of approximately $41,500,000. STAKO manufactures liquefied natural gas, propane and butane fuel tanks for use in passenger cars, buses and trucks. The acquired business became part of our Pressure Cylinders operating segment upon closing of this transaction.
The assets acquired and liabilities assumed were recognized at their acquisition-date fair values, with goodwill representing the excess of the purchase price over the fair value of the net identifiable assets acquired. In connection with the acquisition of STAKO, we identified and valued the following identifiable intangible assets:
| (in thousands) | Amount | Useful Life (Years) | ||||||
Category | ||||||||
Trade name | $ | 1,500 | 10 | |||||
Customer relationships | 2,500 | 10-15 | ||||||
Non-compete agreement | 400 | 3 | ||||||
|
| |||||||
Total acquired identifiable intangible assets | $ | 4,400 | ||||||
|
| |||||||
The purchase price includes the fair values of other assets that were not identifiable, not separately recognizable under accounting rules (e.g., assembled workforce) or of immaterial value. The purchase price also includes a going-concern element that represents our ability to earn a higher rate of return on the group of assets than would be expected on the separate assets as determined during the valuation process. This additional investment value resulted in goodwill, which is not expected to be deductible for income tax purposes.
The following table summarizes the consideration transferred for STAKO and the fair value assigned to the assets acquired and liabilities assumed at the acquisition date:
| (in thousands) | ||||
Cash and cash equivalents | $ | 2,715 | ||
Accounts receivable | 4,175 | |||
Inventories | 6,208 | |||
Other current assets | 75 | |||
Intangible assets | 4,400 | |||
Other noncurrent assets | 60 | |||
Property, plant and equipment | 23,770 | |||
|
| |||
Total identifiable assets | 41,403 | |||
Accounts payable | (2,813 | ) | ||
Accrued liabilities | (750 | ) | ||
Other liabilities | (2,182 | ) | ||
Deferred income taxes | (2,384 | ) | ||
|
| |||
Net identifiable assets | 33,274 | |||
Goodwill | 8,226 | |||
|
| |||
Total consideration paid | $ | 41,500 | ||
|
| |||
Operating results of STAKO have been included in our consolidated statements of earnings from the acquisition date, forward. Pro forma results, including the acquired business since the beginning of fiscal 2012 or fiscal 2011, would not be materially different than reported results.
Bernz
On July 1, 2011, we purchased substantially all of the net assets of Bernz (excluding accounts receivable) from Irwin Industrial Tool Company, a subsidiary of Newell Rubbermaid, Inc., for cash consideration of approximately $41,000,000. Bernz is a leading manufacturer of hand held torches and accessories. The acquired net assets became part of our Pressure Cylinders operating segment upon closing of the transaction.
As more fully described in “NOTE D – Contingent Liabilities,” in connection with this purchase transaction, both parties agreed to settle their litigation. In accordance with the applicable accounting guidance for the settlement of a pre-existing relationship between parties to a business combination, we recognized a settlement gain equal to the amount by which our previously recorded reserve exceeded the estimated fair value of the settlement. The components of the settlement gain are summarized in the following table:
| (in thousands) | ||||
Reserve | $ | 14,402 | ||
Less: Fair value of settlement | (10,000 | ) | ||
|
| |||
Settlement gain | $ | 4,402 | ||
|
| |||
The settlement gain was recognized within SG&A expense in our fiscal 2012 consolidated statement of earnings to correspond with the classification of the reserves previously recognized in connection with this matter. An income approach that incorporated market participant assumptions regarding the estimate of
future cash flows and the possible variations among those cash flows was used to measure fair value. In accordance with the accounting guidance for a business combination, the fair value of the settlement feature was excluded from the fair value of the consideration transferred for purposes of the purchase price allocation.
The assets acquired and liabilities assumed were recognized at their acquisition-date fair values, with goodwill representing the excess of the purchase price over the fair value of the net identifiable assets acquired. In connection with the acquisition of Bernz, we identified and valued the following identifiable intangible assets:
| (in thousands) | Amount | Useful Life (Years) | ||||||
Category | ||||||||
Trade name | $ | 8,481 | Indefinite | |||||
Customer relationships | 10,473 | 9-13 | ||||||
Non-compete agreements | 2,268 | 5 | ||||||
|
| |||||||
Total acquired identifiable intangible assets | $ | 21,222 | ||||||
|
| |||||||
Cash flows used to determine the purchase price included strategic and synergistic benefits (investment value) specific to us, which resulted in a purchase price in excess of the fair value of identifiable net assets. The purchase price also includes the fair values of other assets that were not identifiable, not separately recognizable under accounting rules (e.g., assembled workforce) or of immaterial value in addition to a going-concern element that represents our ability to earn a higher rate of return on the group of assets than would be expected on the separate assets as determined during the valuation process. This additional investment value resulted in goodwill, which is expected to be deductible for income tax purposes.
The following table summarizes the consideration transferred for Bernz and the fair value assigned to the assets acquired and liabilities assumed at the acquisition date:
| (in thousands) | ||||
Inventories | $ | 15,313 | ||
Intangible assets | 21,222 | |||
Property, plant and equipment | 7,884 | |||
|
| |||
Total identifiable assets | 44,419 | |||
Accounts payable | (6,167 | ) | ||
Accrued liabilities | (868 | ) | ||
|
| |||
Net identifiable assets | 37,384 | |||
Goodwill | 3,616 | |||
|
| |||
Total consideration paid | $ | 41,000 | ||
|
| |||
Operating results of Bernz have been included in our consolidated statements of earnings from the acquisition date, forward. Pro forma results, including the acquired business since the beginning of fiscal 2012 or fiscal 2011, would not be materially different than reported results.
Fiscal 2011
MISA Metals, Inc.
On March 1, 2011, we acquired, as partial consideration for the contribution of our metal framing business to ClarkDietrich, the net assets of certain MMI steel processing locations (the “MMI acquisition”). The acquired net assets became part of our Steel Processing operating segment upon closing of the transaction. During the fourth quarter of fiscal 2012, we sold the steel processing assets of two of the three acquired facilities.
As discussed in “Note A – Summary of Significant Accounting Policies,” in accordance with the accounting guidance for the deconsolidation of a subsidiary, the consideration received, including the steel processing assets of MMI, was recognized at fair value. Accordingly, the enterprise fair value of the acquired business, or $72,600,000, represents the purchase price for purposes of applying the purchase price allocation prescribed by the applicable accounting guidance. The assets acquired and liabilities assumed were recognized at their acquisition-date fair values. Intangible assets, consisting of customer relationships, are being amortized over their estimated useful life of 15 years.
The following table summarizes the consideration paid and the fair value assigned to the assets acquired and liabilities assumed at the acquisition date:
| (in thousands) | ||||
Accounts receivable | $ | 24,470 | ||
Inventories | 40,262 | |||
Other current assets | 7,426 | |||
Intangible assets | 300 | |||
Property, plant and equipment, net | 16,319 | |||
|
| |||
Total assets | 88,777 | |||
Accounts payable | (15,062 | ) | ||
Accrued liabilities | (1,115 | ) | ||
|
| |||
Identifiable net assets | 72,600 | |||
Goodwill | - | |||
|
| |||
Total purchase price | $ | 72,600 | ||
|
| |||
Nitin Cylinders Limited
On December 28, 2010, we acquired a 60% ownership interest in India-based Nitin Cylinders Limited for approximately $21,236,000 in cash to expand our presence in the alternative fuels cylinder market. Upon execution of the purchase agreement, the name of the company was changed to Worthington Nitin Cylinders Limited (“WNCL”), which operates as a consolidated joint venture due to our controlling financial interest. WNCL is a manufacturer of high-pressure, seamless steel cylinders for compressed industrial gases and compressed natural gas storage in motor vehicles. The acquired net assets became part of our Pressure Cylinders operating segment upon closing of this transaction.
The assets acquired and liabilities assumed were recognized at their acquisition-date fair values, with goodwill representing the excess of the purchase price over the fair value of the net identifiable assets acquired. In connection with the acquisition of WNCL, we identified and valued the following intangible assets:
| (in thousands) | Amount | Average Life (Years) | ||||||
Category | ||||||||
Trade name | $ | 850 | Indefinite | |||||
Customer relationships | 160 | 15-20 | ||||||
Other | 230 | 1-10 | ||||||
|
| |||||||
Total acquired intangible assets | $ | 1,240 | ||||||
|
| |||||||
Cash flows used to determine the purchase price included strategic and synergistic benefits (investment value) specific to us, which resulted in a purchase price in excess of the fair value of identifiable net assets. Since the fair values assigned to the acquired assets could only assume strategies and synergies of market
participants, that additional investment value specific to us was included in goodwill. The purchase price included fair values of other assets that were not identifiable, not separately recognizable under accounting rules (e.g., assembled workforce) or of immaterial value. Goodwill recorded in connection with this acquisition is not expected to be deductible for income tax purposes.
The following table summarizes the consideration paid and the fair value assigned to the assets acquired and liabilities assumed at the acquisition date, as well as the acquisition-date fair value of the noncontrolling interest:
| (in thousands) | ||||
Cash and cash equivalents | $ | 1,721 | ||
Accounts receivable | 2,499 | |||
Inventories | 9,916 | |||
Other current assets | 652 | |||
Intangible assets | 1,240 | |||
Property, plant and equipment | 14,450 | |||
|
| |||
Total identifiable assets | 30,478 | |||
Accounts payable | (1,227 | ) | ||
Accrued liabilities | (41 | ) | ||
Deferred income taxes | (992 | ) | ||
|
| |||
Net identifiable assets | 28,218 | |||
Goodwill | 7,174 | |||
|
| |||
Net assets | 35,392 | |||
Noncontrolling interest | (14,156 | ) | ||
|
| |||
Total consideration paid | $ | 21,236 | ||
|
| |||
Hy-Mark Cylinders, Inc.
On June 21, 2010, we acquired the assets of Hy-Mark Cylinders, Inc. (“Hy-Mark”) for cash of $12,175,000. Hy-Mark manufactured extruded aluminum cylinders for medical oxygen, scuba, beverage service, industrial, specialty, and professional racing applications. The acquired net assets became part of our Pressure Cylinders operating segment upon closing of this transaction. The assets of Hy-Mark were relocated to our pressure cylinders facility located in Mississippi subsequent to the acquisition date.
The assets acquired and liabilities assumed were measured and recognized based on their estimated fair values at the date of acquisition, with goodwill representing the excess of the purchase price over the fair value of the net identifiable assets acquired. Intangible assets, consisting mostly of customer lists, will be amortized on a straight-line basis over their estimated useful life of nine years.
Cash flows used to determine the purchase price included strategic and synergistic benefits (investment value) specific to us, which resulted in a purchase price in excess of the fair value of identifiable net assets. Since the fair values assigned to the acquired assets could only assume strategies and synergies of market participants, that additional investment value specific to us was included in goodwill. The purchase price included fair values of other assets that were not identifiable, not separately recognizable perunder accounting rules (e.g., assembled workforce), or of immaterial value. The purchase price also included a going-concern element that represents our ability to earn a higher rate of return on a group of assets than would be expected on the separate assets as determined during the valuation process. Goodwill of $17,950,000 related to the Sharon Stairs asset purchaserecorded in connection with this acquisition is expected to be deductible for income tax purposes.
On July 31, 2008, our Steelpac subsidiary purchased
The following table summarizes the consideration paid and the fair value assigned to the assets acquired and liabilities assumed at the acquisition date:
| (in thousands) | ||||
Inventories | $ | 3,053 | ||
Intangible assets | 2,660 | |||
Property, plant and equipment | 2,100 | |||
|
| |||
Identifiable net assets | 7,813 | |||
Goodwill | 4,362 | |||
|
| |||
Total purchase price | $ | 12,175 | ||
|
| |||
Note O – Derivative Instruments and Hedging Activities
We utilize derivative financial instruments to manage exposure to certain risks related to our ongoing operations. The primary risks managed through the use of Laser Products (“Laser”)derivative instruments include interest rate risk, currency exchange risk and commodity price risk. While certain of our derivative instruments are designated as hedging instruments, we also enter into derivative instruments that are designed to hedge a risk, but are not designated as hedging instruments and therefore do not qualify for $3,425,000. Laserhedge accounting. These derivative instruments are adjusted to current fair value through earnings at the end of each period.
Interest Rate Risk Management – We are exposed to the impact of interest rate changes. Our objective is a steel rack fabricator primarily servingto manage the auto industry. The purchase price was allocated to working capital, fixed assetsimpact of interest rate changes on cash flows and the customer list.market value of our borrowings. We utilize a mix of debt maturities along with both fixed-rate and variable-rate debt to manage changes in interest rates. In addition, we enter into interest rate swaps to further manage our exposure to interest rate variations related to our borrowings and to lower our overall borrowing costs.
Currency Exchange Risk Management – We conduct business in several major international currencies and are therefore subject to risks associated with changing foreign exchange rates. We enter into various contracts that change in value as foreign exchange rates change to manage this exposure. Such contracts limit exposure to both favorable and unfavorable currency fluctuations. The purchasetranslation of foreign currencies into United States dollars also subjects us to exposure related to fluctuating exchange rates; however, derivative instruments are not used to manage this risk.
Commodity Price Risk Management – We are exposed to changes in the price allocatedof certain commodities, including steel, natural gas, zinc and other raw materials, and our utility requirements. Our objective is to reduce earnings and cash flow volatility associated with forecasted purchases and sales of these commodities to allow management to focus its attention on business operations. Accordingly, we enter into derivative contracts to manage the customer list willassociated price risk.
We are exposed to counterparty credit risk on all of our derivative instruments. Accordingly, we have established and maintain strict counterparty credit guidelines and enter into derivative instruments only with major financial institutions. We do not have significant exposure to any one counterparty and management believes the risk of loss is remote and, in any event, would not be amortized over ten years.material.
On August 16, 2006, we purchased 100%Refer to “Note P – Fair Value Measurements” for additional information regarding the accounting treatment for our derivative instruments, as well as how fair value is determined.
The following table summarizes the fair value of our derivative instruments and the respective line in which they were recorded in the consolidated balance sheet at May 31, 2012:
| Asset Derivatives | Liability Derivatives | |||||||||||
| (in thousands) | Balance Sheet Location | Fair Value | Balance Sheet Location | Fair Value | ||||||||
Derivatives designated as hedging instruments: | ||||||||||||
Interest rate contracts | Receivables | $ | - | Accounts payable | $ | 1,859 | ||||||
| Other assets | - | Other liabilities | 8,825 | |||||||||
|
|
|
| |||||||||
| - | 10,684 | |||||||||||
|
|
|
| |||||||||
Commodity contracts | Receivables | - | Accounts payable | 249 | ||||||||
| Other assets | - | Other liabilities | - | |||||||||
|
|
|
| |||||||||
| - | 249 | |||||||||||
|
|
|
| |||||||||
Totals | $ | - | $ | 10,933 | ||||||||
|
|
|
| |||||||||
Derivatives not designated as hedging instruments: | ||||||||||||
Commodity contracts | Receivables | $ | 245 | Accounts payable | $ | 4,060 | ||||||
| Other assets | - | Other accrued items | - | |||||||||
|
|
|
| |||||||||
| 245 | 4,060 | |||||||||||
|
|
|
| |||||||||
Foreign exchange contracts | Receivables | 912 | Accounts payable | - | ||||||||
| Other assets | - | Other accrued items | - | |||||||||
|
|
|
| |||||||||
| 912 | - | |||||||||||
|
|
|
| |||||||||
Totals | $ | 1,157 | $ | 4,060 | ||||||||
|
|
|
| |||||||||
Total Derivative Instruments | $ | 1,157 | $ | 14,993 | ||||||||
|
|
|
| |||||||||
The following table summarizes the fair value of our derivative instruments and the respective line in which they were recorded in the consolidated balance sheet at May 31, 2011:
| Asset Derivatives | Liability Derivatives | |||||||||||
| (in thousands) | Balance Sheet Location | Fair Value | Balance Sheet Location | Fair Value | ||||||||
Derivatives designated as hedging instruments: | ||||||||||||
Interest rate contracts | Receivables | $ | - | Accounts payable | $ | 2,024 | ||||||
| Other assets | - | Other liabilities | 10,375 | |||||||||
|
|
|
| |||||||||
| - | 12,399 | |||||||||||
|
|
|
| |||||||||
Commodity contracts | Receivables | 194 | Accounts payable | - | ||||||||
| Other assets | - | Other liabilities | - | |||||||||
|
|
|
| |||||||||
| 194 | - | |||||||||||
|
|
|
| |||||||||
Totals | $ | 194 | $ | 12,399 | ||||||||
|
|
|
| |||||||||
Derivatives not designated as hedging instruments: | ||||||||||||
Commodity contracts | Receivables | $ | 944 | Accounts payable | $ | - | ||||||
| Other assets | - | Other accrued items | - | |||||||||
|
|
|
| |||||||||
| 944 | - | |||||||||||
|
|
|
| |||||||||
Foreign exchange contracts | Receivables | - | Accounts payable | - | ||||||||
| Other assets | - | Other accrued items | 573 | |||||||||
|
|
|
| |||||||||
| - | 573 | |||||||||||
|
|
|
| |||||||||
Totals | $ | 944 | $ | 573 | ||||||||
|
|
|
| |||||||||
Total Derivative Instruments | $ | 1,138 | $ | 12,972 | ||||||||
|
|
|
| |||||||||
Cash Flow Hedges
We enter into derivative instruments to hedge our exposure to changes in cash flows attributable to interest rate and commodity price fluctuations associated with certain forecasted transactions. These derivative instruments are designated and qualify as cash flow hedges. Accordingly, the effective portion of the capital stockgain or loss on the derivative instrument is reported as a component of PSM for $31,727,000, net of cash acquired. PSM is a specialty stainless steel processor locatedother comprehensive income (“OCI”) and reclassified into earnings in Los Angeles, Californiathe same line associated with the forecasted transaction and is included in our Steel Processing business segment.the same period during which the hedged transaction affects earnings. The purchase price is subject to change due to targeted earn-outs of up to $8,500,000 through August 2009. The purchase price was allocated to the acquired assets and assumed liabilities based on their estimated fair values at the date of acquisition and included the accrual of $4,784,000ineffective portion of the earn-outgain or loss on the derivative instrument is recognized in earnings immediately.
The following table summarizes our cash flow hedges outstanding at May 31, 2012:
| (Dollars in thousands) | Notional Amount | Maturity Date | ||||||
Commodity contracts | $ | 7,200 | November 2012 | |||||
Interest rate contracts | 100,000 | December 2014 | ||||||
The following table summarizes the gain (loss) recognized in OCI and the gain (loss) reclassified from accumulated OCI into earnings for derivative instruments designated as it was deemedcash flow hedges during the fiscal years ended May 31, 2012 and 2011:
| (in thousands) | Income (Loss) Recognized in OCI (Effective Portion) | Location of Income (Loss) Reclassified From Accumulated OCI (Effective Portion) | Income (Loss) Reclassified from Accumulated OCI (Effective Portion) | Location of Income (Loss) (Ineffective Portion) Excluded from Effectiveness Testing | Income (Loss) (Ineffective Portion) Excluded from Effectiveness Testing | |||||||||||
For the fiscal year ended | ||||||||||||||||
May 31, 2012: | ||||||||||||||||
Interest rate contracts | $ | (2,398 | ) | Interest expense | $ | (4,032 | ) | Interest expense | $ | - | ||||||
Commodity contracts | (213 | ) | Cost of goods sold | 1,993 | Cost of goods sold | - | ||||||||||
|
|
|
|
|
| |||||||||||
Totals | $ | (2,611 | ) | $ | (2,039 | ) | $ | - | ||||||||
|
|
|
|
|
| |||||||||||
For the fiscal year ended | ||||||||||||||||
May 31, 2011: | ||||||||||||||||
Interest rate contracts | $ | (5,724 | ) | Interest expense | $ | (4,043 | ) | Interest expense | $ | - | ||||||
Commodity contracts | 1,401 | Cost of goods sold | 125 | Cost of goods sold | - | |||||||||||
|
|
|
|
|
| |||||||||||
Totals | $ | (4,323 | ) | $ | (3,918 | ) | $ | - | ||||||||
|
|
|
|
|
| |||||||||||
The estimated net amount of the losses in AOCI at May 31, 2012 expected to be probablereclassified into net earnings within the succeeding twelve months is $1,135,000 (net of payment andtax of $724,000). This amount was computed using the fair value of the identifiablecash flow hedges at May 31, 2012, and will change before actual reclassification from other comprehensive income to net assets exceededearnings during the purchase price. In fiscal 2009 and fiscal 2008, adjustments to the future expected earn-out amounts were made based on actual earned amounts and related payments. The purchase price allocation was updated accordingly for these changes in the expected future earn-out.
The final allocation was as follows:
| In thousands | ||||
Current assets | $ | 15,732 | ||
Intangible assets | 5,965 | |||
Property, plant and equipment, net | 17,671 | |||
Total assets | 39,368 | |||
Current liabilities | 3,968 | |||
Identifiable net assets | 35,400 | |||
Earnout liability | 1,100 | |||
Total purchase price | 34,300 | |||
Less: cash acquired | (2,573 | ) | ||
Purchase price, net of cash | $ | 31,727 | ||
The purchase price allocated to intangible assets will be amortized over a weighted average life of 9 years.
Operating results of the above-mentioned businesses acquired have been included in the consolidated statements of earnings from the respective acquisition dates forward. Pro forma results, including the acquired businesses described above since the beginning of fiscal 2009, would not be materially different than actual results.year ended May 31, 2013.
Note R – Business InterruptionEconomic (Non-designated) Hedges
On January 5, 2008, Severstal North America, Inc. (“Severstal”) experienced a furnace outage. Severstal is a primary steel supplierWe enter into foreign currency contracts to manage our foreign exchange exposure related to inter-company and a minority partnerfinancing transactions that do not meet the requirements for hedge accounting treatment. We also enter into certain commodity contracts that do not qualify for hedge accounting treatment. Accordingly, these derivative instruments are adjusted to current market value at the end of each period through earnings.
The following table summarizes our economic (non-designated) derivative instruments outstanding at May 31, 2012:
| (Dollars in thousands) | Notional Amount | Maturity Date(s) | ||||||
Commodity contracts | $ | 25,750 | June 2012 -November 2013 | |||||
Foreign currency contracts | 71,750 | June 2012 - August 2012 | ||||||
The following table summarizes the gain (loss) recognized in our Spartan Steel Coating, LLC joint venture (“Spartan”). Severstal is also a steel supplier to some of our other Steel Processing locations and to our Pressure Cylinders business segment. Business interruption losses were incurred in the form of lost sales and added costsearnings for material, freight, scrap and other items. The additional expenses incurred for material costs, freight and scrap in excess of our deductible, have been offset by proceeds from our insurance company. Net proceeds of $5,749,000 from final settlement of the insurance claim were recorded in cost of goods soldeconomic (non-designated) derivative financial instruments during the third quarterfiscal years ended February 28, 2009 to offsetMay 31, 2012 and 2011:
| Income (Loss) Recognized in Earnings | ||||||||||
| (in thousands) | Location of Income (Loss) Recognized in Earnings | Fiscal Year Ended May 31, | ||||||||
| 2012 | 2011 | |||||||||
Commodity contracts | Cost of goods sold | $ | (7,873 | ) | $ | 488 | ||||
Foreign exchange contracts | Miscellaneous income (expense) | 9,855 | (7,497 | ) | ||||||
|
|
|
| |||||||
Total | $ | 1,982 | $ | (7,009 | ) | |||||
|
|
|
| |||||||
The gain (loss) on the reduced profit from lost sales at Spartan. Miscellaneous expense was increased $2,760,000, as our partner’s portion offoreign currency derivatives significantly offsets the net proceeds was eliminated from our consolidated earnings.gain (loss) on the hedged item.
Note SP – Fair Value Measurements
Effective June 1, 2008, we adopted SFAS No. 157,Fair Value Measurements (“SFAS No. 157”). SFAS No. 157 establishes a framework for measuring fair value and expands disclosures about fair value measurements. SFAS No. 157 was effective for our financial assets and liabilities after May 31, 2008, and is effective for our non-financial assets and liabilities after May 31, 2009. Adoption of SFAS No. 157 for our financial assets and liabilities did not have a material impact on our consolidated financial statements. Adopting SFAS No. 157 for our non-financial assets and liabilities is not expected to materially impact our consolidated financial statements.
SFAS No. 157 clarifies that fair value is an exitdefined as the price representing the amount that would be received to sell an asset or paid to transfer a liability in an orderly transaction between market participants.participants at the measurement date. Fair value shouldis an exit price concept that assumes an orderly transaction between willing market participants and is required to be determined based on assumptions that market participants would use in pricing an asset or a liability. SFAS No. 157 usesCurrent accounting guidance establishes a three-tier fair value hierarchy that classifies assetsas a basis for considering such assumptions and liabilities based onfor classifying the inputs used in the valuation methodologies. In accordance with SFAS No. 157, we measured our derivative instruments at fair value. We classified these as level 2 assets and liabilities for purposesThis hierarchy requires entities to maximize the use of SFAS No. 157 as they are based upon models utilizing market observable inputs and credit risk.minimize the use of unobservable inputs. The three levels of inputs used to measure fair values are as follows:
Level 1 | – | Observable prices in active markets for identical assets and liabilities. | ||||
Level 2 | – | Observable inputs other than quoted prices in active markets for identical assets and liabilities. | ||||
Level 3 | – | Unobservable inputs that are supported by little or no market activity and that are significant to the fair value of the assets and liabilities. | ||||
Recurring Fair Value Measurements
At May 31, 2009,2012, our financial assets and liabilities measured at fair value on a recurring basis were as follows:
| In thousands | Quoted Prices in Active Markets (Level 1) | Significant Other Observable Inputs (Level 2) | Significant Unobservable Inputs (Level 3) | Totals | ||||||||
Assets | ||||||||||||
Foreign currency derivative instruments | $ | - | $ | 1,135 | $ | - | $ | 1,135 | ||||
Liabilities | ||||||||||||
Foreign currency derivative instruments | $ | - | $ | 769 | $ | - | $ | 769 | ||||
Interest rate derivative instruments | - | 7,899 | - | 7,899 | ||||||||
Total liabilities | $ | - | $ | 8,668 | $ | - | $ | 8,668 | ||||
| (in thousands) | Quoted Prices in Active Markets (Level 1) | Significant Other Observable Inputs (Level 2) | Significant Unobservable Inputs (Level 3) | Totals | ||||||||||||
Assets | ||||||||||||||||
Derivative contracts | $ | - | $ | 1,157 | $ | - | $ | 1,157 | ||||||||
|
|
|
|
|
|
|
| |||||||||
Total assets | $ | - | $ | 1,157 | $ | - | $ | 1,157 | ||||||||
|
|
|
|
|
|
|
| |||||||||
Liabilities | ||||||||||||||||
Derivative contracts | $ | - | $ | 14,993 | $ | - | $ | 14,993 | ||||||||
|
|
|
|
|
|
|
| |||||||||
Total liabilities | $ | - | $ | 14,993 | $ | - | $ | 14,993 | ||||||||
|
|
|
|
|
|
|
| |||||||||
At May 31, 2011, our financial assets and liabilities measured at fair value on a recurring basis were as follows:
| (in thousands) | Quoted Prices in Active Markets (Level 1) | Significant Other Observable Inputs (Level 2) | Significant Unobservable Inputs (Level 3) | Totals | ||||||||||||
Assets | ||||||||||||||||
Derivative contracts | $ | - | $ | 1,138 | $ | - | $ | 1,138 | ||||||||
|
|
|
|
|
|
|
| |||||||||
Total assets | $ | - | $ | 1,138 | $ | - | $ | 1,138 | ||||||||
|
|
|
|
|
|
|
| |||||||||
Liabilities | ||||||||||||||||
Derivative contracts | $ | - | $ | 12,972 | $ | - | $ | 12,972 | ||||||||
|
|
|
|
|
|
|
| |||||||||
Total liabilities | $ | - | $ | 12,972 | $ | - | $ | 12,972 | ||||||||
|
|
|
|
|
|
|
| |||||||||
The fair value of our derivative contracts is based on the present value of the expected future cash flows considering the risks involved, including non-performance risk, using discount rates appropriate for the respective maturities. Market observable, Level 2 inputs are used to determine the present value of the expected future cash flows. Refer to “Note TO – Derivative Instruments and Hedging Activities” for additional information regarding our use of derivative instruments.
Non-Recurring Fair Value Measurements
At May 31, 2012, our assets measured at fair value on a non-recurring basis were categorized as follows:
| (in thousands) | Quoted Prices in Active Markets (Level 1) | Significant Other Observable Inputs (Level 2) | Significant Unobservable Inputs (Level 3) | Totals | ||||||||||||
Assets | ||||||||||||||||
Long-lived assets held and used (1) | $ | - | $ | 225 | $ | - | $ | 225 | ||||||||
|
|
|
|
|
|
|
| |||||||||
Total assets | $ | - | $ | 225 | $ | - | $ | 225 | ||||||||
|
|
|
|
|
|
|
| |||||||||
| (1) | During the fourth quarter of fiscal 2012, due largely to changes in the intended use of certain long-lived assets within our Global Group operating segment, we determined indicators of impairment were |
present. Recoverability of the identified asset group was tested using future cash flow projections based on management’s long range estimates of market conditions. The sum of these undiscounted future cash flows was less than the net book value of the asset group. The net book value was also determined to be in excess of fair value and, accordingly, the asset group was written down to its fair value of $225,000, resulting in an impairment charge of $355,000. This impairment loss was recorded within impairment of long-lived assets in our consolidated statement of earnings. Fair value was determined based on market prices for similar assets. |
At May 31, 2011, our assets measured at fair value on a non-recurring basis were categorized as follows:
| (in thousands) | Quoted Prices in Active Markets (Level 1) | Significant Other Observable Inputs (Level 2) | Significant Unobservable Inputs (Level 3) | Totals | ||||||||||||
Assets | ||||||||||||||||
Investments in unconsolidated affiliates (1) | $ | - | $ | - | $ | 86,654 | $ | 86,654 | ||||||||
Long-lived assets held and used (2) | - | 27,408 | - | 27,408 | ||||||||||||
Long-lived assets held for sale (3) | - | 9,681 | - | 9,681 | ||||||||||||
|
|
|
|
|
|
|
| |||||||||
Total assets | $ | - | $ | 37,089 | $ | 86,654 | $ | 123,743 | ||||||||
|
|
|
|
|
|
|
| |||||||||
| (1) | On March 1, 2011, as partial consideration for the net assets contributed to ClarkDietrich, we received a 25% interest in the newly-formed joint venture. In accordance with the applicable accounting guidance, our interest in ClarkDietrich was recorded at its acquisition-date fair value of $58,250,000. Additionally, on May 9, 2011, in connection with the contribution of our automotive body panels business to the ArtiFlex joint venture, we obtained a 50% interest in the newly-formed joint venture. In accordance with the applicable accounting guidance, our interest in ArtiFlex was recorded at its acquisition-date fair value of $28,404,000. |
A combination of the consolidated balance sheets locationincome approach and the risk classificationmarket approach was applied to measure the fair value of our interests in both ClarkDietrich and ArtiFlex. The income approach included the Company’s derivative instruments.
NOTE T – Derivative InstrumentsAn expectation regarding future revenue growth;
A perpetual long-term growth rate; and
A discount rate based on the estimated weighted average cost of capital.
The market approach was based on cash-free market multiples of selected comparable companies, adjusted for differences in size and Hedging Activitiesscale. Each approach resulted in a business enterprise value that was comparable.
Interest Rate Risk – We entered into an interest rate swap in October 2004, which was amended December 17, 2004. The swap had a notional amount
| (2) | During the fourth quarter of fiscal 2011, due largely to changes in the intended use of certain long-lived within our Metal Framing operating segment, we determined indicators of impairment were present. Recoverability of the identified assets was tested using future cash flow projections based on management’s estimate of market conditions. The sum of these undiscounted future cash flows was less than the net book value of the asset group. The net book value was also determined to be in excess of fair value and, accordingly, the asset group was written down to its fair value of $21,125,000, resulting in an impairment charge of $18,293,000. This impairment charge was recognized within the joint venture transactions line in our consolidated statement of earnings to correspond with amounts previously recognized in connection with the formation of ClarkDietrich. Fair value was determined based on market prices for similar assets. Certain assets retained subsequently met the criteria for classification as assets held for sale. In accordance with the applicable accounting guidance, the net assets of these |
facilities were presented separately as assets held for sale in our consolidated balance sheet as of May 31, 2011. As the related assets had previously been written down to their fair value of $3,797,000, no additional impairment charges were recognized. The results of these facilities continued to be reported within operating income as they did not qualify for classification as a discontinued operation. |
During the fourth quarter of $100,000,000 to hedge changes in cash flows attributablefiscal 2011, due largely to changes in the LIBOR rate associated with the December 17, 2004 issuanceintended use of certain long-lived assets within our former Automotive Body Panels operating segment, we determined indicators of impairment were present. Recoverability of the unsecured Floating Rate Senior Notes due December 17, 2014. See “Note C – Debt.” We pay a fixed rate of 4.46% and receive a variable rateidentified asset group was tested using future cash flow projections based on six-month LIBOR.management’s long range estimates of market conditions. The interest rate derivative is classified as asum of these undiscounted future cash flow hedge per SFAS 133. The effective portionflows was less than the net book value of the changeasset group. The net book value was also determined to be in excess of fair value and, accordingly, the asset group was written down to its fair value of $9,180,000, resulting in an impairment charge of $6,414,000. This impairment charge was recognized within the derivative is recordedjoint venture transactions line in other comprehensive income and is reclassifiedour consolidated statement of earnings to interest expensecorrespond with amounts previously recognized in connection with the formation of ArtiFlex. Fair value was determined based on market prices for similar assets.
During the fourth quarter of fiscal 2011, due largely to changes in the period in which earnings are impacted byintended use of certain long-lived assets within our Commercial Stairs business unit, we determined indicators of impairment were present. Recoverability of the hedged items or in the period that the transaction no longer qualifies as aidentified asset group was tested using future cash flow hedge.
Foreign Currency Risk –projections based on management’s long range estimates of market conditions. The translationsum of foreign currencies into United States dollars subjectsthese undiscounted future cash flows was less than the Company to exposure related to fluctuating exchange rates. Derivative instruments are not used to manage this risk; however,net book value of the Company does make use of forward contracts to manage exposure to certain inter-company loans with our foreign affiliates. Such contracts limit exposure to both favorable and unfavorable currency fluctuations. At May 31, 2009, the difference between the contract andasset group. The net book value was not materialalso determined to be in excess of fair value and, accordingly, the Company’sasset group was written down to its fair value of $400,000, resulting in an impairment charge of $2,473,000. This impairment loss was recorded within impairment of long-lived assets in our consolidated financial position, resultsstatement of operations or cash flows. Theearnings. Fair value was determined based on market prices for similar assets.
During the fourth quarter of fiscal 2011, due largely to changes in the intended use of certain long-lived assets within our Steel Packaging operating segment, we determined indicators of impairment were present. Recoverability of the identified asset group was tested using future cash flow projections based on management’s long range estimates of market conditions. The sum of these undiscounted future cash flows was less than the net book value of the asset group. The net book value was also determined to be in excess of fair value and, accordingly, the asset group was written down to its fair value of $500,000, resulting in an impairment charge of $1,913,000. This impairment loss was recorded within impairment of long-lived assets in our consolidated statement of earnings. Fair value was determined based on market prices for similar assets.
(3) During the derivative instruments are recorded eitherfourth quarter of fiscal 2011, we committed to plans to sell certain steel processing assets acquired in connection with the MMI acquisition, thereby meeting the criteria for classification as assets held for sale. In accordance with the applicable accounting guidance, these assets were presented separately as assets held for sale in our consolidated balance sheets under foreign currency translation or in net earnings in the same period in which foreign currency translation or net earnings are impacted by the hedged items.
Commodity Price Risk – The Company attempts to negotiate the best prices for commodities and to competitively price products and services to reflect the fluctuations in market prices. Derivative instruments are used to manage a portionsheet as of our exposure to fluctuations in the cost of steel, natural gas, zinc and other raw materials and utility requirements. These instruments cover periods commensurate with known or expected exposures, and no such instruments were in place at May 31, 2009. No derivatives instruments are held for trading purposes. The effective portion of2011. As the changes in theacquired assets were recorded at their acquisition-date fair value of cash flow derivatives are recorded in other comprehensive$5,884,000, no impairment charges were recognized. Fair value was determined based on market prices for similar assets. The results of these facilities continued to be reported within operating income and reclassified to cost of goods sold in the period in which earnings are impacted by the hedged items or in the period that the transaction no longer qualifies as a cash flow hedge. For derivative instruments that dothey did not qualify for hedgeclassification as a discontinued operation.
During the fourth quarter of fiscal 2011, the assets of certain of the retained metal framing facilities met the criteria for classification as assets held for sale. In accordance with the applicable accounting under SFAS 133, changesguidance, the net assets of these facilities are presented separately as assets held for sale in our consolidated balance sheet as of May 31, 2011. As the related assets had previously been written down to their fair value are recordedof $3,797,000, no additional impairment charges were recognized. Fair value was determined based on market prices for similar assets.
The non-derivative financial instruments included in costthe carrying amounts of goods sold.cash and cash equivalents, receivables, income taxes receivable, other assets, deferred income taxes, accounts payable, short-term
Refer
borrowings, accrued compensation, contributions to “Note A – Summary of Significant Accounting Policies”employee benefit plans and “Note S – Fair Value” for additional information regarding the accounting treatmentrelated taxes, other accrued expenses, income taxes payable and Company policy for derivative instruments, as well as howother liabilities approximate fair value is determined for the Company’s derivative instruments.due to their short-term nature. The fair value of derivative instrumentslong-term debt, including current maturities, based upon models utilizing market observable inputs and credit risk, was $274,754,000 and $265,239,000 at May 31, 2009 is summarized in the following table:
| (in thousands) | Balance Sheet Location | Fair Value | Balance Sheet Location | Fair Value | ||||||
Derivative instruments designated as hedging instruments under SFAS 133: | ||||||||||
Interest rate contracts | Receivables | $ | - | Accounts payable | $ | 1,134 | ||||
| Other assets | - | Other liabilities | 6,765 | |||||||
Totals | - | 7,899 | ||||||||
Derivative instruments not designated as hedging instruments under SFAS 133: | ||||||||||
Foreign exchange contracts | Receivables | 1,135 | Accounts payable | - | ||||||
| Other assets | - | Other accrued items | 769 | |||||||
Totals | 1,135 | 769 | ||||||||
Total Derivative Instruments | $ | 1,135 | $ | 8,668 | ||||||
2012 and 2011, respectively. The effectcarrying amount of derivative instruments on the consolidated statement of earnings is summarized in the following tables:
| (in thousands) | Gain (Loss) Recognized in OCI (Effective Portion) | Location of Gain (Loss) Reclassified from Accumulated OCI (Effective Portion) | Gain (Loss) Reclassified from Accumulated OCI (Effective Portion) | Location of Gain (Loss) (Ineffective Portion) Excluded from Effectiveness Testing | Gain (Loss) (Ineffective Portion) Excluded from Effectiveness Testing | ||||||||||
For the fiscal year ended May 31, 2009: | |||||||||||||||
Interest rate contracts | $ | (7,997 | ) | Interest expense | $ | (1,627 | ) | Interest expense | $ | - | |||||
Commodity contracts | (847 | ) | Cost of goods sold | 2,306 | Cost of goods sold | - | |||||||||
Totals | $ | (8,844 | ) | $ | 679 | $ | - | ||||||||
Derivative instruments not designated as hedging instruments under SFAS 133:
| Gain (Loss) Recognized in Earnings | ||||||
| (in thousands) | Location of Gain (Loss) Recognized in Earnings | Fiscal Year Ended May 31, 2009 | ||||
Commodity contracts | Cost of goods sold | $ | (1,433 | ) | ||
Foreign exchange contracts | Miscellaneous expense | 5,570 | ||||
Totals | $ | 4,137 | ||||
The gain (loss) on these derivative instruments significantly offset the gain (loss) on the hedged items.long-term debt, including current maturities, was $258,791,000 and $250,254,000 at May 31, 2012 and 2011, respectively.
Note UQ – Operating Leases
We lease certain property and equipment from third parties under non-cancelable operating lease agreements. Rent expense under operating leases was $14,433,000, $15,736,000 and $16,681,000 in fiscal 2012, fiscal 2011 and fiscal 2010, respectively. Future minimum lease payments for non-cancelable operating leases having an initial or remaining term in excess of one year at May 31, 2012, were as follows:
| (in thousands) | ||||
2013 | $ | 9,278 | ||
2014 | 5,039 | |||
2015 | 2,737 | |||
2016 | 2,403 | |||
2017 | 2,406 | |||
Thereafter | 5,619 | |||
|
| |||
Total | $ | 27,482 | ||
|
| |||
Note R – Related Party Transactions
We purchase from, and sell to, affiliated companies certain raw materials and services at prevailing market prices. Net sales to affiliated companies for fiscal 2012, fiscal 2011 and fiscal 2010 totaled $22,006,000, $14,627,000 and $9,336,000, respectively. Purchases from affiliated companies for fiscal 2012, fiscal 2011 and fiscal 2010 totaled $4,313,000, $5,916,000 and $4,701,000, respectively. Accounts receivable from affiliated companies were $5,024,000 and $23,211,000 at May 31, 2012 and 2011, respectively. Accounts payable to affiliated companies were $14,212,000 and $16,690,000 at May 31, 2012 and 2011, respectively.
Note S – Quarterly Results of Operations (Unaudited)
The following is a summary oftable summarizes the unaudited quarterly consolidated results of operations for fiscal 20092012 and fiscal 2008:2011:
| In thousands, except per share | Three Months Ended | |||||||||||||
| Fiscal 2009 | August 31 | November 30 | February 28 | May 31 | ||||||||||
Net sales | $ | 913,222 | $ | 745,350 | $ | 501,125 | $ | 471,570 | ||||||
Gross margin | 151,902 | (54,419 | ) | 39,921 | 37,330 | |||||||||
Net earnings (loss) | 68,624 | (164,654 | ) | 1,554 | (13,738 | ) | ||||||||
Earnings (loss) per share - basic | $ | 0.87 | $ | (2.09 | ) | $ | 0.02 | $ | (0.17 | ) | ||||
Earnings (loss) per share - diluted | 0.86 | (2.09 | ) | 0.02 | (0.17 | ) | ||||||||
| Fiscal 2008 | August 31 | November 30 | February 29 | May 31 | ||||||||||
Net sales | $ | 758,955 | $ | 713,664 | $ | 725,667 | $ | 868,875 | ||||||
Gross margin | 78,785 | 70,010 | 75,727 | 131,225 | ||||||||||
Net earnings | 20,168 | 14,740 | 18,302 | 53,867 | ||||||||||
Earnings per share - basic | $ | 0.24 | $ | 0.18 | $ | 0.23 | $ | 0.68 | ||||||
Earnings per share - diluted | 0.24 | 0.18 | 0.23 | 0.68 | ||||||||||
| (in thousands, except per share) | Three Months Ended | |||||||||||||||
| Fiscal 2012 | August 31 | November 30 | February 29 | May 31 | ||||||||||||
Net sales | $ | 602,387 | $ | 565,652 | $ | 611,255 | $ | 755,407 | ||||||||
Gross margin | 71,462 | 56,606 | 83,332 | 121,468 | ||||||||||||
Net earnings attributable to controlling interest | 25,653 | 11,985 | 25,880 | 52,077 | ||||||||||||
Earnings per share - basic | $ | 0.36 | $ | 0.17 | $ | 0.38 | $ | 0.76 | ||||||||
Earnings per share - diluted | 0.35 | 0.17 | 0.37 | 0.75 | ||||||||||||
| Fiscal 2011 | August 31 | November 30 | February 28 | May 31 | ||||||||||||
Net sales | $ | 616,805 | $ | 580,687 | $ | 569,439 | $ | 675,693 | ||||||||
Gross margin | 78,914 | 69,819 | 88,254 | 119,170 | ||||||||||||
Net earnings attributable to controlling interest | 22,354 | 14,469 | 26,326 | 51,917 | ||||||||||||
Earnings per share - basic | $ | 0.29 | $ | 0.20 | $ | 0.35 | $ | 0.71 | ||||||||
Earnings per share - diluted | 0.29 | 0.20 | 0.35 | 0.70 | ||||||||||||
The sum of the quarterly earnings (loss) per share data presented in the table may not equal the annual results due to rounding and the impact of dilutive securities on the annual versus the quarterly earnings (loss) per share calculations.
Results for the fourth quarter of fiscal 20092012 (ended May 31, 2009)2012) were negativelyfavorably impacted by $6,044,000 of restructuring expense.The restructuring expense primarily related to previously announced plant closures inhigher overall volumes, aided by the Metal Framing business segment and professional fees in the Other category. During the fourth quarter of fiscal 2009, results were also negatively impacted by an inventory write-down adjustment totaling $6,278,000. The inventory adjustment was necessitated by continued decline in demand and steel pricing within the Steel Processing business segment. The combined negative impact of these items was $0.15 per diluted share.acquisitions, offset by a lower spread between average selling prices and material costs and the impact of the Joint Venture Transactions.
Results for the third quarter of fiscal 20092012 (ended February 29, 2012) were negatively affected by the impact of lower volumes as a result of the Joint Venture Transactions and an unfavorable product mix in our Pressure Cylinders operating segment. Results were also negatively impacted by an accrual for certain legal expenses as well as increased restructuring charges as a result of the Joint Venture Transactions.
Results for the second quarter of fiscal 2012 (ended November 30, 2011) were negatively affected by the impact of lower volumes as a result of the Joint Venture Transactions and the impact of inventory holding losses within our Steel Processing operating segment. Results were also negatively impacted by an accrual for estimated product returns and other costs associated with the voluntary recall of our MAP-PRO®, propylene and MAAP® cylinders and related hand torch kits.
Results for the first quarter of fiscal 2012 (ended August 31, 2011) were negatively affected by the impact of lower volumes and an increase in restructuring charges as a result of the Joint Venture Transactions. The unfavorable impact of these items was offset by lower SG&A expenses also due to the impact of the Joint Venture Transactions and a one-time gain related to the settlement of the Bernz dispute.
Results for the fourth quarter of fiscal 2011 (ended May 31, 2011) were favorably impacted by higher volumes, most notably in the Steel Processing and Pressure Cylinders operating segments and an increased spread between average selling prices and the cost of steel. Our results were also favorably impacted by a one-time gain of $10,436,000 related to the formation of the ClarkDietrich and ArtiFlex joint ventures as more fully discussed in “Note A – Summary of Significant Accounting Policies.”
Results for the third quarter of fiscal 2011 (ended February 28, 2009)2011) were negativelyfavorably impacted by $16,309,000higher volumes across all of restructuring expense, or $0.10 per diluted share. The restructuring expense primarily related to previously announced plant closuresour operating segments, most notably in the Metal Framing business segmentSteel Processing and professional fees inPressure Cylinders operating segments, and an increased spread between average selling prices and the Other category.cost of steel.
Results for the second quarter of fiscal 20092011 (ended November 30, 2008)2010) were negatively impacted by $11,936,000higher SG&A expenses, the impact of restructuring expense, or $0.10 per diluted share. The restructuring expense primarily related to previously announced plant closures in the Metal Framing business segmentacquisitions, and professional fees in the Other category. During the second quarter of fiscal 2009, results were also negatively impacted by an inventory write-down adjustment totaling $98,021,000, or $0.86 per diluted share. The inventory adjustment was necessitated by the speedhigher profit sharing and severity of the decline in demand and steel pricing within the Steel Processing and Metal Framing business segments. Additionally, results for the second quarter of fiscal 2009 were negatively impacted by $96,943,000 of goodwill balance write-off, or $1.07 per diluted share. The goodwill balance write-off was the result of a revised valuation and the fair value estimates of the remaining assets of the Metal Framing business segment, where it was determined that the value of the business no longer supported the goodwill balance.bonus expenses.
Results for the first quarter of fiscal 20092011 (ended August 31, 2008),2010) were negativelyfavorably impacted by $8,752,000 of restructuring expense or $0.08 per diluted share. The restructuring expense primarily related to previously announced plant closureshigher volumes, most notably in the Metal Framing business segmentSteel Processing and professional feesPressure Cylinders operating segments, and an increased spread between average selling prices and the cost of steel. The favorable impact of these items was offset by higher SG&A expenses due to the impact of acquisitions and increased profit sharing and bonus expenses as a result of higher earnings.
Note T – Subsequent Events
On July 3, 2012, we reached an agreement in principal to issue up to $150,000,000 aggregate principal amount of senior unsecured notes in a private placement offering. These notes will mature 12 years from the Other category.issuance date and will bear interest at a rate of 4.60%. We expect to complete this private placement offering during the first quarter of fiscal 2013.
Results forOn June 27, 2012, our Board of Directors declared a quarterly dividend of $0.13 per share, which represents a $0.01 per share increase from the dividend declared in the fourth quarter of fiscal 2008 (ended May 31, 2008), were negatively impacted by $4,894,0002012. The dividend is payable on September 28, 2012, to shareholders of restructuring expense or $0.04 per diluted share.The restructuring expense primarily related to previously announced plant closures in the Metal Framing business segment and professional fees in the Other category. To maintain consistency in the treatmentrecord as of these professional fees, certain professional fees totaling $3,300,000 reported in the previous three quarters of fiscal 2008 in selling, general and administrative expense were reclassified to restructuring charges in those quarters.
Results for the third quarter of fiscal 2008 (ended February 29, 2008), were negatively impacted by $4,179,000 of restructuring expense or $0.03 per diluted share. The restructuring expense primarily related to previously announced plant closures in the Metal Framing business segment and professional fees in the Other category.
Results for the second quarter of fiscal 2008 (ended November 30, 2007), were negatively impacted by $4,602,000 of restructuring expense or $0.04 per diluted share. The restructuring expense primarily related to previously announced plant closures in the Metal Framing business segment and professional fees in the Other category.
Results for the first quarter of fiscal 2008 (ended August 31, 2007), were negatively impacted by $4,436,000 of restructuring expense or $0.04 per diluted share. The restructuring expense primarily related to previously announced plant closures in the Metal Framing business segment and professional fees in the Other category.
Note V – Subsequent Events
On June 12, 2009, we redeemed $118.5 million of the then $138.0 million outstanding 6.7% Notes due December 1, 2009 (“Notes”). The consideration paid for the Notes was $1,025 per $1,000 principal amount of Notes, plus accrued and unpaid interest. The repurchase was funded by a combination of cash on hand and borrowings under existing credit facilities in an effort to reduce interest expense.September 14, 2012.
WORTHINGTON INDUSTRIES, INC. AND SUBSIDIARIES
SCHEDULE II – VALUATION AND QUALIFYING ACCOUNTS
| COL. A. | COL. B. | COL. C. | COL. D. | COL. E. | ||||||||||||||||||
| Description | Balance at Beginning of Period | Additions | Deductions – Describe | Balance at End of Period | ||||||||||||||||||
| Charged to Costs and Expenses | Charged to Other Accounts – Describe | |||||||||||||||||||||
Year Ended May 31, 2009:
Deducted from asset accounts: Allowance for possible losses on trade accounts receivable | $4,849,000 | 8,472,000 | 217,000 (A) | 1,068,000 (B) | $12,470,000 | |||||||||||||||||
Year Ended May 31, 2008:
Deducted from asset accounts: Allowance for possible losses on trade accounts receivable | $3,641,000 | 1,496,000 | 127,000 (A) | 415,000 (B) | $4,849,000 | |||||||||||||||||
Year Ended May 31, 2007:
Deducted from asset accounts: Allowance for possible losses on trade accounts receivable | $4,964,000 | 399,000 | 1,000 (A) | 1,723,000 (B) | $3,641,000 | |||||||||||||||||
| COL. A. | COL. B. | COL. C. | COL. D. | COL. E. | ||||||||||||||||||||||||||||
| Description | Additions | |||||||||||||||||||||||||||||||
Balance at
| Charged to Costs and Expenses | Charged to Other Accounts – Describe (B) | Deductions – Describe (C) | Balance at End of Period | ||||||||||||||||||||||||||||
Year Ended May 31, 2012:
Deducted from asset accounts: Allowance for possible losses on trade accounts receivable | $ | 4,150,000 | $ | 339,000 | $ | 370,000 | $ | 1,530,000 | $ | 3,329,000 | ||||||||||||||||||||||
|
|
|
|
|
|
|
|
|
| |||||||||||||||||||||||
Year Ended May 31, 2011:
Deducted from asset accounts: Allowance for possible losses on trade accounts receivable | $ | 5,752,000 | $ | 1,236,000 | $ | 106,000 | $ | 2,732,000 | (D) | $ | 4,150,000 | |||||||||||||||||||||
|
|
|
|
|
|
|
|
|
| |||||||||||||||||||||||
Year Ended May 31, 2010:
Deducted from asset accounts: Allowance for possible losses on trade accounts receivable | $ | 12,470,000 | $ | (900,000 | ) (A) | $ | 29,000 | $ | 5,847,000 | $ | 5,752,000 | |||||||||||||||||||||
|
|
|
|
|
|
|
|
|
| |||||||||||||||||||||||
Note A – Net allowance reversal, adjusted through expense.
Note B – Miscellaneous amounts.
Note BC – Uncollectable accounts charged to the allowanceallowance.
Note D – Includes $686,000 related to the deconsolidation of our metal framing business.
See accompanying Report of Independent Registered Public Accounting FirmFirm.
Item 9. —– Changes in andinand Disagreements With Accountants on Accounting and Financial Disclosure
Not applicable.
Item 9A.—Controls and Procedures
Evaluation of Disclosure Controls and Procedures
We maintain disclosure controls and procedures [as defined in Rules 13a-15(e) and 15d-15(e) under the Securities Exchange Act of 1934, as amended (the “Exchange Act”)] that are designed to provide reasonable assurance that information required to be disclosed in the reports that we file or submit under the Exchange Act is recorded, processed, summarized and reported within the time periods specified in the Securities and Exchange Commission’s rules and forms, and that such information is accumulated and communicated to our management, including our principal executive officer and our principal financial officer, as appropriate to allow timely decisions regarding required disclosure.
Management, with the participation of our principal executive officer and our principal financial officer, performed an evaluation of the effectiveness of our disclosure controls and procedures as of the end of the fiscal year covered by this Annual Report on Form 10-K (the fiscal year ended May 31, 2009)2012). Based on that evaluation, our principal executive officer and our principal financial officer have concluded that such disclosure controls and procedures were effective at a reasonable assurance level as of the end of the fiscal year covered by this Annual Report on Form 10-K.
Changes in Internal Control Over Financial Reporting
There were no changes in our internal control over financial reporting that occurred in the last fiscal quarter (the fiscal quarter ended May 31, 2009)2012) that have materially affected, or are reasonably likely to materially affect, our internal control over financial reporting.
Annual Report of Management on Internal Control Over Financial Reporting
Management is responsible for establishing and maintaining adequate internal control over financial reporting to provide reasonable assurance regarding the reliability of our financial reporting and the preparation of financial statements for external purposes in accordance with accounting principles generally accepted in the United States. Internal control over financial reporting includes those policies and procedures that (i) pertain to the maintenance of records that, in reasonable detail, accurately and fairly reflect the transactions and dispositions of the assets of Worthington Industries, Inc. and our consolidated subsidiaries; (ii) provide reasonable assurance that transactions are recorded as necessary to permit preparation of financial statements in accordance with accounting principles generally accepted in the United States, and that receipts and expenditures of Worthington Industries, Inc. and our consolidated subsidiaries are being made only in accordance with authorizations of management and directors of Worthington Industries, Inc. and our consolidated subsidiaries, as appropriate; and (iii) provide reasonable assurance regarding prevention or timely detection of unauthorized acquisition, use or disposition of the assets of Worthington Industries, Inc. and our consolidated subsidiaries that could have a material effect on the financial statements.
Management, with the participation of our principal executive officer and our principal financial officer, evaluated the effectiveness of our internal control over financial reporting as of May 31, 2009,2012, the end of our fiscal year. Management based its assessment on criteria established inInternal Control – Control—Integrated Framework issued by the Committee of Sponsoring Organizations of the Treadway Commission. The scope of the assessment included all of the consolidated operations of the Company except for Angus Industries, Inc. (“Angus”), which was acquired on December 29, 2011. The net sales and total assets of Angus represented 4.1% and 10.6% of consolidated net sales and total assets of the Company for the year ended May 31, 2012, respectively. Management’s assessment included evaluation of such elements as the design and operating effectiveness of key financial reporting controls, process documentation, accounting policies and our overall control environment. This assessment is supported by testing and monitoring performed under the direction of management.
Because of its inherent limitations, internal control over financial reporting may not prevent or detect misstatements. Also, projections of any evaluation of effectiveness to future periods are subject to the risk that controls may become inadequate because of changes in conditions, or that the degree of compliance with the policies or procedures may deteriorate. Accordingly, even an effective system of internal control over financial reporting will provide only reasonable assurance with respect to financial statement preparation.
Based on the assessment of our internal control over financial reporting, management has concluded that our internal control over financial reporting was effective at a reasonable assurance level as of May 31, 2009.2012. The results of management’s assessment were reviewed with the Audit Committee of the Board of Directors of Worthington Industries, Inc.
Additionally, our independent registered public accounting firm, KPMG LLP, independently assessed the effectiveness of our internal control over financial reporting and issued the accompanying Attestation Report of Independent Registered Public Accounting Firm.
Report of Independent Registered Public Accounting Firm
The Board of Directors and Shareholders
Worthington Industries, Inc.:
We have audited Worthington Industries, Inc.’s internal control over financial reporting as of May 31, 2009,2012, based on criteria established inInternal Control – Integrated Framework issued by the Committee of Sponsoring Organizations of the Treadway Commission (COSO). Worthington Industries, Inc.’s management is responsible for maintaining effective internal control over financial reporting and for its assessment of the effectiveness of internal control over financial reporting, included in the accompanying Annual Report of Management on Internal Control Over Financial Reporting. Our responsibility is to express an opinion on the Company’s internal control over financial reporting based on our audit.
We conducted our audit in accordance with the standards of the Public Company Accounting Oversight Board (United States). Those standards require that we plan and perform the audit to obtain reasonable assurance about whether effective internal control over financial reporting was maintained in all material respects. Our audit included obtaining an understanding of internal control over financial reporting, assessing the risk that a material weakness exists, and testing and evaluating the design and operating effectiveness of internal control based on the assessed risk. Our audit also included performing such other procedures as we considered necessary in the circumstances. We believe that our audit provides a reasonable basis for our opinion.
A company’s internal control over financial reporting is a process designed to provide reasonable assurance regarding the reliability of financial reporting and the preparation of financial statements for external purposes in accordance with generally accepted accounting principles. A company’s internal control over financial reporting includes those policies and procedures that (1) pertain to the maintenance of records that, in reasonable detail, accurately and fairly reflect the transactions and dispositions of the assets of the company; (2) provide reasonable assurance that transactions are recorded as necessary to permit preparation of financial statements in accordance with generally accepted accounting principles, and that receipts and expenditures of the company are being made only in accordance with authorizations of management and directors of the company; and (3) provide reasonable assurance regarding prevention or timely detection of unauthorized acquisition, use, or disposition of the company’s assets that could have a material effect on the financial statements.
Because of its inherent limitations, internal control over financial reporting may not prevent or detect misstatements. Also, projections of any evaluation of effectiveness to future periods are subject to the risk that controls may become inadequate because of changes in conditions, or that the degree of compliance with the policies or procedures may deteriorate.
In our opinion, Worthington Industries, Inc. maintained, in all material respects, effective internal control over financial reporting as of May 31, 2009,2012, based on criteria established inInternal Control – Integrated Framework issued by the Committee of Sponsoring Organizations of the Treadway Commission.
Worthington Industries, Inc. acquired Angus Industries, Inc. during 2012, and management excluded from its assessment of the effectiveness of Worthington Industries, Inc.’s internal control over financial reporting as of May 31, 2012, Angus Industries, Inc.’s internal control over financial reporting associated with total assets of $200 million and net sales of $104 million included in the consolidated financial statements of Worthington Industries, Inc. as of and for the year ended May 31, 2012. Our audit of internal control over financial reporting of Worthington Industries, Inc. also excluded an evaluation of the internal control over financial reporting of Angus Industries, Inc.
We also have audited, in accordance with the standards of the Public Company Accounting Oversight Board (United States), the consolidated balance sheets of Worthington Industries, Inc. and subsidiaries as of May 31, 20092012 and 2008,2011, and the related consolidated statements of earnings, shareholders’ equity, and cash flows for each of the years in the three-year period ended May 31, 2009,2012, and our report dated July 30, 20092012, expressed an unqualified opinion on those consolidated financial statements.
/ |
Columbus, Ohio
July 30, 20092012
There is nothing to be reported under this Item 9B.
PART III
Item 10. —– Directors, Executive Officers and Corporate Governance
Directors, Executive Officers and Persons Nominated or Chosen to Become Directors or Executive Officers
The information required by Item 401 of SEC Regulation S-K concerning the directors of Worthington Industries, Inc. (“Worthington Industries” or the “Registrant”) and the nominees for re-election as directors of Worthington Industries at the Annual Meeting of Shareholders to be held on September 30, 200927, 2012 (the “2009“2012 Annual Meeting”) is incorporated herein by reference from the disclosure to be included under the caption “PROPOSAL 1: ELECTION OF DIRECTORS” in Worthington Industries’ definitive Proxy Statement relating to the 20092012 Annual Meeting (“Worthington Industries’ Definitive 20092012 Proxy Statement”), which will be filed pursuant to SEC Regulation 14A not later than 120 days after the end of Worthington Industries’ fiscal 20092012 (the fiscal year ended May 31, 2009)2012).
The information required by Item 401 of SEC Regulation S-K concerning the executive officers of Worthington Industries is incorporated herein by reference from the disclosure included under the caption “Supplemental Item – Executive Officers of the Registrant” in Part I of this Annual Report on Form 10-K.
Compliance with Section 16(a) of the Exchange Act
The information required by Item 405 of SEC Regulation S-K is incorporated herein by reference from the disclosure to be included under the caption “SECURITY OWNERSHIP OF CERTAIN BENEFICIAL OWNERS AND MANAGEMENT – Section 16(a) Beneficial Ownership Reporting Compliance” in Worthington Industries’ Definitive 20092012 Proxy Statement.
Procedures by which Shareholders may Recommend Nominees to Worthington Industries’ Board of Directors
Information concerning the procedures by which shareholders of Worthington Industries may recommend nominees to Worthington Industries’ Board of Directors is incorporated herein by reference from the disclosure to be included under the captions “PROPOSAL 1: ELECTION OF DIRECTORS – Committees of the Board – Nominating and Governance Committee” and “CORPORATE GOVERNANCE – Nominating Procedures” in Worthington Industries’ Definitive 20092012 Proxy Statement. These procedures have not materially changed from those described in Worthington Industries’ Definitivedefinitive Proxy Statement for the 20082011 Annual Meeting of Shareholders held on September 24, 2008.29, 2011.
Audit Committee Matters
The information required by Items 407(d)(4) and 407(d)(5) of SEC Regulation S-K is incorporated herein by reference from the disclosure to be included under the caption “PROPOSAL 1: ELECTION OF DIRECTORS – Committees–Committees of the Board – Audit Committee” in Worthington Industries’ Definitive 20092012 Proxy Statement.
Code of Conduct; Committee Charters; Corporate Governance Guidelines; Charter of Lead Independent Director
Worthington Industries’ Board of Directors has adopted Charters for each of the Audit Committee, the Compensation and Stock Option Committee, the Executive Committee and the Nominating and Governance Committee as well as Corporate Governance Guidelines as contemplated by the applicable sections of the New York Stock Exchange Listed Company Manual. Worthington Industries’ Board of Directors has also adopted a Charter of the Lead Independent Director of Worthington Industries’ Board of Directors.
In accordance with the requirements of Section 303A.10 of the New York Stock Exchange Listed Company Manual, the Board of Directors of Worthington Industries has adopted a Code of Conduct covering the directors, officers and employees of Worthington Industries and its subsidiaries, including Worthington Industries’ Chairman of the Board and Chief Executive Officer (the principal executive officer), Worthington Industries’ Vice President and Chief Financial Officer (the principal financial officer) and Worthington Industries’ Controller (the principal accounting officer). The Registrant will disclose the following events, if they occur, in a current report on Form 8-K to be filed with the SEC within the required four business days following their occurrence: (A) the date and nature of any amendment to a provision of Worthington Industries’ Code of Conduct that (i) applies to Worthington Industries’ principal executive officer, principal financial officer, principal accounting officer or controller, or persons performing similar functions, (ii) relates to any element of the “code of ethics” definition enumerated in Item 406(b) of SEC Regulation S-K, and (iii) is not a technical, administrative or other non-substantive amendment; and (B) a description of any waiver (including the nature of the waiver, the name of the person to whom the waiver was granted and the date of the waiver), including an implicit waiver, from a provision of the Code of Conduct granted to Worthington Industries’ principal executive officer, principal financial officer, principal accounting officer or controller, or persons performing similar functions, that relates to one or more of the elements of the “code of ethics” definition set forth in Item 406(b) of SEC Regulation S-K. In addition, Worthington Industries will disclose any waivers from the provisions of the Code of Conduct granted to a director or executive officer of Worthington Industries in a current report on Form 8-K to be filed with the SEC within the required four business days following their occurrence.
The text of each of the Charter of the Audit Committee, the Charter of the Compensation and Stock Option Committee, the Charter of the Executive Committee, the Charter of the Nominating and Governance Committee, the Charter of the Lead Independent Director, the Corporate Governance Guidelines and the Code of Conduct is posted on the “Corporate Governance” page of the “Investor Relations” section of Worthington Industries’ web site located at www.worthingtonindustries.com. Interested persons and shareholders of Worthington Industries may also obtain copies of each of these documents, without charge, by writing to the Investor Relations Department of Worthington Industries at Worthington Industries, Inc., 200 Old Wilson Bridge Road, Columbus, Ohio 43085, Attention: Catherine M. Lyttle. In addition, a copy of the Code of Conduct was filedas currently in effect is included as Exhibit 14 to the Registrant’s Quarterlythis Annual Report on Form 10-Q for the quarterly period ended February 28, 2009.10-K.
Item 11. — Executive Compensation
The information required by Item 402 of SEC Regulation S-K is incorporated herein by reference from the disclosure to be included under the captions “EXECUTIVE COMPENSATION” and “COMPENSATION OF DIRECTORS” in Worthington Industries’ Definitive 20092012 Proxy Statement.
The information required by Item 407(e)(4) of SEC Regulation S-K is incorporated herein by reference from the disclosure to be included under the caption “CORPORATE GOVERNANCE –— Compensation Committee Interlocks and Insider Participation” in Worthington Industries’ Definitive 20092012 Proxy Statement.
The information required by Item 407(e)(5) of SEC Regulation S-K is incorporated herein by reference from the disclosure to be included under the caption “EXECUTIVE COMPENSATION –— Compensation Committee Report” in Worthington Industries’ Definitive 20092012 Proxy Statement.
Item 12. — Security Ownership of Certain Beneficial Owners and Management and Related Stockholder Matters
Ownership of Common Shares of Worthington Industries
The information required by Item 403 of SEC Regulation S-K is incorporated herein by reference from the disclosure to be included under the caption “SECURITY OWNERSHIP OF CERTAIN BENEFICIAL OWNERS AND MANAGEMENT” in Worthington Industries’ Definitive 20092012 Proxy Statement.
Equity Compensation Plan Information
The information required by Item 201(d) of SEC Regulation S-K is incorporated herein by reference from the disclosure to be included under the caption “EQUITY COMPENSATION PLAN INFORMATION” in Worthington Industries’ Definitive 20092012 Proxy Statement.
Item 13. — Certain Relationships and Related Transactions, and Director Independence
Certain Relationships and Related Person Transactions
The information required by Item 404 of SEC Regulation S-K is incorporated herein by reference from the disclosure in respect of John P. McConnell to be included under the caption “SECURITY OWNERSHIP OF CERTAIN BENEFICIAL OWNERS AND MANAGEMENT” and from the disclosure to be included under the caption “TRANSACTIONS WITH CERTAIN RELATED PERSONS” in Worthington Industries’ Definitive 20092012 Proxy Statement.
Director Independence
The information required by Item 407(a) of SEC Regulation S-K is incorporated herein by reference from the disclosure to be included under the caption “CORPORATE GOVERNANCE – Director Independence” in Worthington Industries’ Definitive 20092012 Proxy Statement.
Item 14. — Principal Accountant Fees and Services
The information required by this Item 14 is incorporated herein by reference from the disclosure to be included under the captions “AUDIT COMMITTEE MATTERS – Independent Registered Public Accounting Firm Fees” and “AUDIT COMMITTEE MATTERS – Pre-Approval of Services Performed by the Independent Registered Public Accounting Firm.”
PART IV
Item 15. — Exhibits, Financial Statement Schedules
| (a) | The following documents are filed as a part of this Annual Report on Form 10-K: |
| (1) | Consolidated Financial Statements: |
The consolidated financial statements (and report thereon) listed below are filed as a part of this Annual Report on Form 10-K:
Report of Independent Registered Public Accounting Firm (KPMG LLP)
Consolidated Balance Sheets as of May 31, 20092012 and 20082011
Consolidated Statements of Earnings for the fiscal years ended May 31, 2009, 20082012, 2011 and 20072010
Consolidated Statements of Shareholders’ Equity for the fiscal years ended May 31, 2009, 20082012, 2011 and 20072010
Consolidated Statements of Cash Flows for the fiscal years ended May 31, 2009, 20082012, 2011 and 20072010
Notes to Consolidated Financial Statements – fiscal years ended May 31, 2009, 20082012, 2011 and 20072010
| (2) | Financial Statement |
Schedule II – Valuation and Qualifying Accounts
All other financial statement schedules for which provision is made in the applicable accounting regulations of the SEC are omitted because they are not required or the required information has been presented in the aforementioned consolidated financial statements or notes thereto.
| (3) | Listing of |
The exhibits listed on the “Index to Exhibits” beginning on page E-1 of this Annual Report on Form 10-K are filedincluded with this Annual Report on Form 10-K or incorporated in this Annual Report on Form 10-K by reference as noted in the “Index to Exhibits.” The “Index to Exhibits” specifically identifies each management contract or compensatory plan or arrangement required to be filedincluded as an exhibit to this Annual Report on Form 10-K or incorporated in this Annual Report on Form 10-K by reference.
| (b) |
|
| (c) | Financial Statement |
Pursuant to the requirements of Section 13 or 15(d) of the Securities Exchange Act of 1934, the Registrant has duly caused this report to be signed on its behalf by the undersigned, thereunto duly authorized.
| WORTHINGTON INDUSTRIES, INC. | ||||||
Date: July 30, | By: |
| ||||
John P. McConnell, | ||||||
Chairman of the Board and Chief Executive Officer | ||||||
Pursuant to the requirements of the Securities Exchange Act of 1934, this report has been signed below by the following persons on behalf of the Registrant and in the capacities and on the date indicated.
SIGNATURE | DATE | TITLE | ||
/s/ John P. McConnell John P. McConnell | July 30, | Director, Chairman of the Board and | ||
/s/ B. Andrew Rose B. Andrew Rose | July 30, | Vice President and Chief Financial | ||
/s/ Richard G. Welch Richard G. Welch | July 30, | Controller (Principal Accounting | ||
* Kerrii B. Anderson | * | Director | ||
* John B. Blystone | * | Director | ||
* Mark C. Davis | * | Director | ||
* Michael J. Endres | * | Director | ||
* Ozey K. Horton, Jr. | * | Director | ||
* Peter Karmanos, Jr. | * | Director | ||
| ||||
* Carl A. Nelson, Jr. | * | Director | ||
* Sidney A. Ribeau | * | Director | ||
* Mary Schiavo | * | Director | ||
*The undersigned, by signing his name hereto, does hereby sign this report on behalf of each of the above-identified directors of the Registrant pursuant to powers of attorney executed by such directors, which powers of attorney are filed with this report as exhibits.within Exhibit 24.
*By: | /s/ John P. McConnell | Date: July 30, | ||||
| John P. McConnell | ||||||
| Attorney-In-Fact |
Exhibit | Description | Location | ||||
| 2.1 | Stock Purchase Agreement, dated as of December 29, 2011, by and between Worthington Steel of Michigan, Inc. and each of (i) Angus Industries, Inc., (ii) Angus Industries, Inc. Employee Stock Ownership Trust, (iii) William Blair Mezzanine Capital Fund III, L.P. and (iv) Robert A. Kluver, not in his individual capacity but solely in his capacity as Phantom Unit Holder Representative? | Incorporated herein by reference to Exhibit 2.1 to the Current Report on Form 8-K of Worthington Industries, Inc., an Ohio corporation (the “Registrant”), dated January 4, 2012 and filed with the SEC on the same date (SEC File No. 001-08399) | ||||
| 3.1 | Amended Articles of Incorporation of Worthington Industries, Inc., as filed with the Ohio Secretary of State on October 13, 1998 | Incorporated herein by reference to Exhibit 3(a) to the “Registrant’s Quarterly Report on Form 10-Q | ||||
| 3.2 | Code of Regulations of Worthington Industries, Inc., as amended through September 28, 2000 [for SEC reporting compliance purposes only] | Incorporated herein by reference to Exhibit 3(b) to the Registrant’s Quarterly Report on Form 10-Q for the quarterly period ended August 31, 2000 (SEC File No. 1-8399) | ||||
| 4.1 |
|
| ||||
|
| |||||
|
| |||||
|
| |||||
|
| |||||
|
| |||||
|
| |||||
| Incorporated herein by reference to Exhibit 4.1 to the Registrant’s Current Report on Form 8-K dated May 8, | |||||
Note Purchase Agreement, dated December 17, 2004, between Worthington Industries, Inc. and Allstate Life Insurance Company, Connecticut General Life Insurance Company, United of Omaha Life Insurance Company and Principal Life Insurance Company | Incorporated herein by reference to Exhibit 4.1 to the Registrant’s Current Report on Form 8-K dated December 20, 2004 and filed with the SEC on December 21, 2004 (SEC File No. 1-8399) | |||||
Form of Floating Rate Senior Note due December 17, 2014 | Incorporated herein by reference to Exhibit 4.2 to the Registrant’s Current Report on Form 8-K dated December 20, 2004 and filed with the SEC on December 21, 2004 (SEC File No. 1-8399) | |||||
| ? | The Attachments, Exhibits and Disclosure Schedules referenced in the Stock Purchase Agreement have been omitted pursuant to Item 601(b)(2) of SEC Regulation S-K. Worthington Industries, Inc. hereby undertakes to furnish a copy of the omitted Attachments, Exhibits and Disclosure Schedules upon request by the SEC. |
First Amendment to Note Purchase Agreement, dated as of December 19, 2006, between Worthington Industries, Inc. and the purchasers named therein regarding the Note Purchase Agreement, dated as of December 17, 2004, and the $100,000,000 Floating Rate Senior Notes due December 17, 2014 | Incorporated herein by reference to Exhibit 4.2 to the Registrant’s Quarterly Report on Form 10-Q for the quarterly period ended November 30, 2006 (SEC File No. 1-8399) | |||||
| Indenture, dated as of April 13, 2010, between Worthington Industries, Inc. and U.S. Bank National Association, as Trustee | Incorporated herein by reference to Exhibit 4.1 to the Registrant’s Current Report on Form 8-K dated April 13, 2010 and filed with the SEC on the same date (SEC File No. 1-8399) | |||||
| 4.6 | First Supplemental Indenture, dated as of April 13, 2010, between Worthington Industries, Inc. and U.S. Bank National Association, as Trustee | Incorporated herein by reference to Exhibit 4.2 to the Registrant’s Current Report on Form 8-K dated April 13, 2010 and filed with the SEC on the same date (SEC File No. 1-8399) | ||||
| 4.7 | Form of 6.50% Global Note due April 15, 2020 (included in Exhibit 4.6) | Incorporated herein by reference to Exhibit 4.2 to the Registrant’s Current Report on Form 8-K dated April 13, 2010 and filed with the SEC on the same date (SEC File No. 1-8399) | ||||
| 4.8 | Agreement to furnish instruments and agreements defining rights of holders of long-term debt | Filed herewith | ||||
| 10.1 | Worthington Industries, Inc. Non-Qualified Deferred Compensation Plan effective March 1, 2000* | Incorporated herein by reference to Exhibit 10.1 to the Registrant’s Annual Report on Form 10-K for the fiscal year ended May 31, 2005 (SEC File No. 1-8399) | ||||
| 10.2 | Amendment to the Worthington Industries, Inc. Non-Qualified Deferred Compensation Plan (Amendment effective as of September 1, 2011)* | Incorporated herein by reference to Exhibit 10.8 to the Registrant’s Quarterly Report on Form 10-Q for the quarterly period ended August 31, 2011 (SEC File No. 1-8399) | ||||
| 10.3 | Worthington Industries, Inc. Amended and Restated 2005 Non-Qualified Deferred Compensation Plan (Restatement effective as of December 2008)* | Incorporated herein by reference to Exhibit 10.10 to the Registrant’s Quarterly Report on Form 10-Q for the quarterly period ended November 30, 2008 (SEC File No. 1-8399) | ||||
| First Amendment to the Worthington Industries, Inc. Amended and Restated 2005 Non-Qualified Deferred Compensation Plan (First Amendment effective as of September 1, 2011)* | Incorporated herein by reference to Exhibit 10.9 to the Registrant’s Quarterly Report on Form 10-Q for the quarterly period ended August 31, 2011 (SEC File No. 1-8399) | |||||
| 10.5 | Worthington Industries, Inc. Deferred Compensation Plan for Directors, as Amended and Restated, effective June 1, 2000* | Incorporated herein by reference to Exhibit 10(d) to the Registrant’s Annual Report on Form 10-K for the fiscal year ended May 31, 2000 (SEC File No. 1-8399) | ||||
| Amendment to the Worthington Industries, Inc. Deferred Compensation Plan for Directors, as Amended and Restated, effective June 1, 2000 (Amendment effective as of September 1, 2011)* | Incorporated herein by reference to Exhibit 10.10 to the Registrant’s Quarterly Report on Form 10-Q for the quarterly period ended August 31, 2011 (SEC File No. 1-8399) | |||||
| * | Indicates management contract or compensatory plan or arrangement. |
| 10.7 | Worthington Industries, Inc. Amended and Restated 2005 Deferred Compensation Plan for Directors (Restatement effective as of December 2008)* | Incorporated herein by reference to Exhibit 10.5 to the Registrant’s Quarterly Report on Form 10-Q for the quarterly period ended November 30, 2008 (SEC File No. 1-8399) | ||||
| First Amendment to the Worthington Industries, Inc. Amended and Restated 2005 Deferred Compensation Plan for Directors (First Amendment effective as of September 1, 2011)* | Incorporated herein by reference to Exhibit 10.11 to the Registrant’s Quarterly Report on Form 10-Q for the quarterly period ended August 31, 2011 (SEC File No. 1-8399) | ||||||||
| 10.9 | Worthington Industries, Inc. 1990 Stock Option Plan, as amended* | Incorporated herein by reference to Exhibit 10(b) to the Registrant’s Annual Report on Form 10-K for the fiscal year ended May 31, 1999 (SEC File No. 0-4016) | |||||||
Worthington Industries, Inc. Amended and Restated 1997 Long-Term Incentive Plan | Incorporated herein by reference to Exhibit 10.8 to the Registrant’s Quarterly Report on Form 10-Q for the quarterly period ended November 30, 2008 (SEC File No. 1-8399) | ||||||||
Form of | Incorporated herein by reference to Exhibit | ||||||||
Form of Restricted Stock Award Agreement under the Worthington Industries, Inc. Amended and Restated 1997 Long-Term Incentive Plan entered into and to be entered into by Worthington Industries, Inc. in order to evidence the grant of restricted stock to employees of Worthington Industries, Inc.* | Incorporated herein by reference to Exhibit 10.3 to the Registrant’s Quarterly Report on Form 10-Q for the quarterly period ended November 30, 2008 (SEC File No. 1-8399) | ||||||||
Form of Letter Evidencing Cash Performance Awards and Performance Share Awards Granted and to be Granted under the Worthington Industries, Inc. 1997 Long-Term Incentive Plan (now known as the Worthington Industries, Inc. Amended and Restated 1997 Long-Term Incentive Plan)* | Incorporated herein by reference to Exhibit | ||||||||
Form of | Incorporated herein by reference to Exhibit | ||||||||
| * | Indicates management contract or compensatory plan or arrangement. |
| 10.15 | Form of Restricted Stock Award Agreement entered into by Registrant with each of B. Andrew Rose and Mark A. Russell in order to evidence the grant effective as of June 30, 2011 of 185,000 common shares pursuant to the Worthington Industries, Inc. Amended and Restated 1997 Long-Term Incentive Plan [NOTE: Superseded by Exhibit 10.16]* | Incorporated herein by reference to Exhibit 10.3 to the Registrant’s Current Report on Form 8-K dated July 6, 2011 and filed with the SEC on the same date (SEC File No. 1-8399) | ||||
Form of | Incorporated herein by reference to Exhibit 10.1 to the Registrant’s | |||||
|
|
| ||||
| Worthington Industries, Inc. Amended and Restated 2000 Stock Option Plan for Non-Employee Directors | Incorporated herein by reference to Exhibit 10.7 to the Registrant’s Quarterly Report on Form 10-Q for the quarterly period ended November 30, 2008 (SEC File No. 1-8399) | ||||
| Form of Non-Qualified Stock Option Agreement for Non-Employee Directors for non-qualified stock options granted under the Worthington Industries, Inc. 2000 Stock Option Plan for Non-Employee Directors (now known as the Worthington Industries, Inc. Amended and Restated 2000 Stock Option Plan for Non-Employee Directors) from and after September 25, 2003* | Incorporated herein by reference to Exhibit 10.2 to the Registrant’s Quarterly Report on Form 10-Q for the quarterly period ended August 31, 2004 (SEC File No. 1-8399) | ||||
| Worthington Industries, Inc. Amended and Restated 2003 Stock Option Plan | Incorporated herein by reference to Exhibit 10.6 to the Registrant’s Quarterly Report on Form 10-Q for the quarterly period ended November 30, 2008 (SEC File No. 1-8399) | ||||
| Form of | Incorporated herein by reference to Exhibit | ||||
| Worthington Industries, Inc. Amended and Restated 2006 Equity Incentive Plan for Non-Employee Directors | Incorporated herein by reference to Exhibit 10.9 to the Registrant’s Quarterly Report on Form 10-Q for the quarterly period ended November 30, 2008 (SEC File No. 1-8399) | ||||
| * | Indicates management contract or compensatory plan or arrangement. |
| First Amendment to the Worthington Industries, Inc. Amended and Restated 2006 Equity Incentive Plan for Non-Employee Directors (amendment and restatement effective as of November 1, 2008) (First Amendment approved by shareholders on September 29, 2011)* | Filed herewith | ||||
| 10.23 | Form of Non-Qualified Stock Option and Award Agreement under the Worthington Industries, Inc. 2006 Equity Incentive Plan for Non-Employee Directors (now known as the Worthington Industries, Inc. Amended and Restated 2006 Equity Incentive Plan for Non-Employee Directors) entered into by Worthington Industries, Inc. in order to evidence the grant of non-qualified stock options to non-employee directors of Worthington Industries, Inc. on September 27, 2006 and | Incorporated herein by reference to Exhibit 10.2 to the Registrant’s Current Report on Form 8-K dated October 2, 2006 and filed with the SEC on the same date (SEC File No. 1-8399) | ||||
| Form of Notice of Grant of Stock Options and Option Agreement under the Worthington Industries, Inc. 2006 Equity Incentive Plan for Non-Employee Directors (now known as the Worthington Industries, Inc. Amended and Restated 2006 Equity Incentive Plan for Non-Employee Directors) to evidence the grant of non-qualified stock options to non-employee directors of Worthington Industries, Inc. on and after September 24, 2008* | Incorporated herein by reference to Exhibit 10.17 to the Registrant’s Annual Report on Form 10-K for the fiscal year ended May 31, 2010 (SEC File No. 1-8399) | |||||||
| 10.25 | Form of Restricted Stock Award Agreement under the Worthington Industries, Inc. 2006 Equity Incentive Plan for Non-Employee Directors (now known as the Worthington Industries, Inc. Amended and Restated 2006 Equity Incentive Plan for Non-Employee Directors) entered into by Worthington Industries, Inc. in order to evidence the grant of restricted stock on September 27, 2006 and September 26, 2007 to non-employee directors of Worthington Industries, Inc. | Incorporated herein by reference to Exhibit 10.3 to the Registrant’s Current Report on Form 8-K dated October 2, 2006 and filed with the SEC on the same date (SEC File No. 1-8399) | |||||||
|
|
| |||||||
| Form of Restricted Stock Award Agreement under the Worthington Industries, Inc. 2006 Equity Incentive Plan for Non-Employee Directors (now known as the Worthington Industries, Inc. Amended and Restated 2006 Equity Incentive Plan for Non-Employee Directors) entered into by Worthington | Incorporated herein by reference to Exhibit 10.3 to the Registrant’s Quarterly Report on Form 10-Q for the quarterly period ended August 31, 2008 (SEC File No. 1-8399) | |||||||
| * | Indicates management contract or compensatory plan or arrangement. |
| Industries, Inc. in order to evidence the grant of restricted stock to non-employee directors of Worthington Industries, Inc. on September 24, 2008 and to be entered into by Worthington Industries, Inc. in order to evidence future grants of restricted stock to non-employee directors of Worthington Industries, Inc.* | ||||||
| Worthington Industries, Inc. 2010 Stock Option Plan* | Incorporated herein by reference to Exhibit 10.1 to the Registrant’s Current Report on Form 8-K dated October 5, 2010 and filed with the SEC on the same date (SEC File No. 1-8399) | ||||
| 10.28 | Form of Non-Qualified Stock Option Award Agreement entered into by Registrant in order to evidence the grant of non-qualified stock options to executive officers of Registrant effective as of June 30, 2011 pursuant to the Worthington Industries, Inc. 2010 Stock Option Plan and to be entered into by Registrant in order to evidence future grants of non-qualified stock options to executive officers pursuant to the Worthington Industries, Inc. 2010 Stock Option Plan* | Incorporated herein by reference to Exhibit 10.1 to the Registrant’s Current Report on Form 8-K dated July 6, 2011 and filed with the SEC on the same date (SEC File No. 1-8399) | ||||
| 10.29 | Worthington Industries, Inc. Annual Incentive Plan for Executives (approved by shareholders on September 24, 2008)* | Incorporated herein by reference to Exhibit 10.1 to the Registrant’s Current Report on Form 8-K dated September 30, 2008 and filed with the SEC on the same date (SEC File No. 1-8399) | ||||
| Form of Letter Evidencing Cash Performance Bonus Awards Granted and to be Granted under the Worthington Industries, Inc. Annual Incentive Plan for |
| ||||
| Receivables Purchase Agreement, dated as of November 30, 2000, among Worthington Receivables Corporation, as Seller, Worthington Industries, Inc., as Servicer, members of various purchaser groups from time to time party thereto and PNC Bank, National Association, as Administrator | Incorporated herein by reference to Exhibit 10(h)(i) to the Registrant’s Annual Report on Form 10-K for the fiscal year ended May 31, 2001 (SEC File No. 1-8399) | ||||
| Amendment No. 1 to Receivables Purchase Agreement, dated as of May 18, 2001, among Worthington Receivables Corporation, as Seller, Worthington Industries, Inc., as Servicer, members of various purchaser groups from time to time party thereto and PNC Bank, National Association, as Administrator | Incorporated herein by reference to Exhibit 10(h)(ii) to the Registrant’s Annual Report on Form 10-K for the fiscal year ended May 31, 2001 (SEC File No. 1-8399) | |||||||
| * | Indicates management contract or compensatory plan or arrangement. |
| Amendment No. 2 to Receivables Purchase Agreement, dated as of May 31, 2004, among Worthington Receivables Corporation, as Seller, Worthington Industries, Inc., as Servicer, members of various purchaser groups from time to time party thereto and PNC Bank, National Association, as Administrator | Incorporated herein by reference to Exhibit 10(g)(x) to the Registrant’s Annual Report on Form 10-K for the fiscal year ended May 31, 2004 (File No. 1-8399) | ||||
| Amendment No. 3 to Receivables Purchase Agreement, dated as of January 27, 2005, among Worthington Receivables Corporation, as Seller, Worthington Industries, Inc., as Servicer, the members of the various purchaser groups from time to time party thereto and PNC Bank, National Association, as Administrator | Incorporated herein by reference to Exhibit 10.15 to the Registrant’s Annual Report on Form 10-K for the fiscal year ended May 31, 2005 (SEC File No. 1-8399) | ||||
| Amendment No. 4 to Receivables Purchase Agreement, dated as of January 25, 2008, among Worthington Receivables Corporation, as Seller, Worthington Industries, Inc., as Servicer, the members of the various purchaser groups from time to time party thereto and PNC Bank, National Association, as Administrator | Incorporated herein by reference to Exhibit 10.20 to the Registrant’s Annual Report on Form 10-K for the fiscal year ended May 31, 2008 (SEC File No. 1-8399) | ||||
| Amendment No. 5 to Receivables Purchase Agreement, dated as of January 22, 2009, among Worthington Receivables Corporation, as Seller, Worthington Industries, Inc., as Servicer, the members of the various purchaser groups from time to time party thereto and PNC Bank, National Association, as Administrator | Incorporated herein by reference to Exhibit 10.1 to the Registrant’s Quarterly Report on Form 10-Q for the quarterly period ended February 28, 2009 (SEC File No. 1-8399) | ||||
| Amendment No. 6 to Receivables Purchase Agreement, dated as of April 30, 2009, among Worthington Receivables Corporation, as Seller, Worthington Industries, Inc., as Servicer, the members of the various purchaser groups from time to time party thereto and PNC Bank, National Association, as Administrator |
| ||||
| Amendment No. 7 to Receivables Purchase Agreement, dated as of January 21, 2010, among Worthington Receivables Corporation, as Seller, Worthington Industries, Inc., as Servicer, the members of the various purchaser groups from time to time party thereto and PNC Bank, National Association, as Administrator | Incorporated herein by reference to Exhibit 10.1 to the Registrant’s Quarterly Report on Form 10-Q for the quarterly period ended February 28, 2010 (SEC File No. 1-8399) | ||||
| 10.39 | Amendment No. 8 to Receivables Purchase Agreement, dated as of April 16, 2010, among Worthington Receivables Corporation, as Seller, Worthington Industries, Inc., as Servicer, the members of the various purchaser groups from time to time party thereto and PNC Bank, National Association, as Administrator | Incorporated herein by reference to Exhibit 10.30 to the Registrant’s Annual Report on Form 10-K for the fiscal year ended May 31, 2010 (SEC File No. 1-8399) | ||||
| 10.40 | Amendment No. 9 to Receivables Purchase Agreement, dated as of January 20, 2011, among Worthington Receivables Corporation, as Seller, Worthington Industries, Inc., as Servicer, the members of the various purchaser groups from time to time party thereto and PNC Bank, National Association, as Administrator | Incorporated herein by reference to Exhibit 10.1 to the Registrant’s Quarterly Report on Form 10-Q for the quarterly period ended February 28, 2011 (SEC File No. 1-8399) | ||||
| 10.41 | Amendment No. 10 to Receivables Purchase Agreement, dated as of February 28, 2011, among Worthington Receivables Corporation, as Seller, Worthington Industries, Inc., as Servicer, the members of the various purchaser groups from time to time party thereto and PNC Bank, National Association, as Administrator | Incorporated herein by reference to Exhibit 10.2 to the Registrant’s Quarterly Report on Form 10-Q for the quarterly period ended February 28, 2011 (SEC File No. 1-8399) | ||||
| 10.42 | Amendment No. 11 to Receivables Purchase Agreement, dated as of May 6, 2011, among Worthington Receivables Corporation, as Seller, Worthington Industries, Inc., as Servicer, the members of the various purchaser groups from time to time party thereto and PNC Bank, National Association, as Administrator | Incorporated herein by reference to Exhibit 10.36 to the Registrant’s Annual Report on Form 10-K for the fiscal year ended May 31, 2011 (SEC File No. 1-8399) | ||||
| 10.43 | Amendment No. 12 to Receivables Purchase Agreement, dated as of January 19, 2012, among Worthington Receivables Corporation, as Seller, Worthington Industries, Inc., as Servicer, the members of the various purchaser groups from time to time party to the Receivables Purchase Agreement and PNC Bank, National Association, as Administrator | Incorporated herein by reference to Exhibit 10.1 to the Registrant’s Quarterly Report on Form 10-Q for the quarterly period ended February 29, 2012 (SEC File No. 1-8399) | ||||
| 10.44 | Purchase and Sale Agreement, dated as of November 30, 2000, between the various originators listed therein and Worthington Receivables Corporation | Incorporated herein by reference to Exhibit 10(h)(iii) to the Registrant’s Annual Report on Form 10-K for the fiscal year ended May 31, 2001 (SEC File No. 1-8399) | ||||
| Amendment No. 1, dated as of May 18, 2001, to Purchase and Sale Agreement, dated as of November 30, 2000, between the various originators listed therein and Worthington Receivables Corporation | Incorporated herein by reference to Exhibit 10(h)(iv) to the Registrant’s Annual Report on Form 10-K for the fiscal year ended May 31, 2001 (File No. 1-8399) | |||||||
| Amendment No. 2, dated as of August 25, 2006, to Purchase and Sale Agreement, dated as of November 30, 2000, between the various originators listed therein and Worthington Receivables Corporation | Incorporated herein by reference to Exhibit 10.5 to the Registrant’s Quarterly Report on Form 10-Q for the quarterly period ended August 31, 2006 (SEC File No. 1-8399) | |||||||
| Amendment No. 3, dated as of October 1, 2008, to Purchase and Sale Agreement, dated as of November 30, 2000, among the various originators listed therein, Worthington Taylor, Inc. and Worthington Receivables Corporation | Incorporated herein by reference to Exhibit 10.3 to the Registrant’s Quarterly Report on Form 10-Q for the quarterly period ended February 28, 2011 (SEC File No. 1-8399) | |||||||
| 10.48 | Amendment No. 4, dated as of February 28, 2011, to Purchase and Sale Agreement, dated as of November 30, 2000, among the various originators listed therein, Dietrich Industries, Inc. and Worthington Receivables Corporation | Incorporated herein by reference to Exhibit 10.4 to the Registrant’s Quarterly Report on Form 10-Q for the quarterly period ended February 28, 2011 (SEC File No. 1-8399) | ||||
| 10.49 | Amendment No. 5, dated as of May 6, 2011, to Purchase and Sale Agreement, dated as of November 30, 2000, among the various originators listed therein, The Gerstenslager Company and Worthington Receivables Corporation | Incorporated herein by reference to Exhibit 10.42 to the Registrant’s Annual Report on Form 10-K for the fiscal year ended May 31, 2011 (SEC File No. 1-8399) | ||||
| 10.50 | Amendment No. 6, dated as of January 19, 2012, to Purchase and Sale Agreement, dated as of November 30, 2000, among the various originators listed therein and Worthington Receivables Corporation | Incorporated herein by reference to Exhibit 10.2 to the Registrant’s Quarterly Report on Form 10-Q for the quarterly period ended February 29, 2012 (SEC File No. 1-8399) | ||||
| 10.51 | Summary of Cash Compensation for Directors of Worthington Industries, Inc., effective June 1, | Incorporated herein by reference to Exhibit 10.22 to the Registrant’s Annual Report on Form 10-K for the fiscal year ended May 31, 2006 (SEC File No. 1-8399) | ||||
| Summary of Cash Compensation for Directors of Worthington Industries, Inc., approved June 29, 2011 and effective September, 2011* | Incorporated herein by reference to Exhibit 10.44 to the Registrant’s Annual Report on Form 10-K for the fiscal year ended May 31, 2011 (SEC File No. 1-8399) | ||||
| 10.53 | Summary of Annual Base Salaries Approved for Named Executive Officers of Worthington Industries, Inc.* | Filed herewith | ||||
| Summary of Annual Cash Performance Bonus Awards, Long-Term Performance Awards and Stock Options granted | Incorporated herein by reference to Exhibit 10.37 to the Registrant’s Annual Report on Form 10-K for the fiscal year ended May 31, 2010 (SEC File No. 1-8399) | ||||
| 10.55 | Summary of Annual Cash Performance Bonus Awards, Long-Term Performance Awards, Stock Options and Restricted Shares granted in Fiscal 2012 for Named Executive Officers* | Incorporated herein by reference to Exhibit 10.47 to the Registrant’s Annual Report on Form 10-K for the fiscal year ended May 31, 2011 (SEC File No. 1-8399) | ||||
| 10.56 | Summary of Annual Cash Performance Bonus Awards, Long-Term Performance Awards, Stock Options and Restricted Shares granted in Fiscal 2013 for Named Executive Officers* | Filed herewith | ||||
|
|
| ||||
| Form of Indemnification Agreement entered into between Worthington Industries, Inc. and each director of Worthington Industries, Inc.* | Incorporated herein by reference to Exhibit 10.32 to the Registrant’s Annual Report on Form 10-K for the fiscal year ended May 31, 2008 (SEC File No. 1-8399) | ||||
| Form of Indemnification Agreement entered into between Worthington Industries, Inc. and each executive officer of Worthington Industries, Inc.* | Incorporated herein by reference to Exhibit 10.33 to the Registrant’s Annual Report on Form 10-K for the fiscal year ended May 31, 2008 (SEC File No. 1-8399) | ||||
| * |
|
| |||
|
|
| ||||
| ||||||
| 14 |
| Filed herewith | ||||
| Subsidiaries of Worthington Industries, Inc. | Filed herewith | ||||
| 23.1 | Consent of Independent Registered Public Accounting Firm (KPMG LLP) | Filed herewith | ||||
| 23.2 | Consent of Independent Auditor (KPMG LLP) with respect to consolidated financial statements of Worthington Armstrong Venture | Filed herewith | ||||
24 | Powers of Attorney of Directors and Executive Officers of Worthington Industries, Inc. | Filed herewith | ||||
31.1 | Rule 13a | Filed herewith | ||||
31.2 | Rule 13a | Filed herewith | ||||
32.1 |
| Furnished herewith | ||||
| 32.2 | Certifications of Principal Financial Officer Pursuant to 18 U.S.C. Section 1350, as Adopted Pursuant to Section 906 of the Sarbanes-Oxley Act of 2002 | Furnished herewith | ||||
| 99.1 | Worthington Armstrong Venture Consolidated Financial Statements as of December 31, 2011 and 2010 and for the years ended December 31, 2011, 2010 and 2009 | Filed herewith | ||||
|
|
| ||||
|
|
| ||||
| 101.CAL | XBRL Taxonomy Extension Calculation Linkbase Document | Submitted electronically herewith# | ||||
| 101.DEF | XBRL Taxonomy Definition Linkbase Document | Submitted electronically herewith# | ||||
| 101.LAB | XBRL Taxonomy Extension Label Linkbase Document | Submitted electronically herewith# | ||||
| 101.PRE | XBRL Taxonomy Extension Presentation Linkbase Document | Submitted electronically herewith# | ||||
# Attached as Exhibit 101 to this Annual Report on Form 10-K for the fiscal year ended May 31, 2012 of Worthington Industries, Inc. are the following documents formatted in XBRL (eXtensible Business Reporting Language):
| (i) | Consolidated Balance Sheets at May 31, 2012 and 2011; |
| (ii) |
|
| (iii) | Consolidated Statements of Equity for the fiscal years ended May 31, 2012, 2011 and 2010; |
E-9
| (iv) | Consolidated Statements of Cash Flows for the fiscal years ended May 31, 2012, 2011 and 2010; and |
| (v) | Notes to Consolidated Financial Statements – fiscal years ended May 31, 2012, 2011 and 2010. |
In accordance with Rule 406T of Regulation S-T, the XBRL related documents in Exhibit 101 to this Annual Report on Form 10-K for the fiscal year ended May 31, 2012 are deemed not filed or part of a registration statement or prospectus for purposes of Sections 11 or 12 of the Securities Act of 1933, as amended; are deemed not filed for purposes of Section 18 of the Securities Exchange Act of 1934, as amended; and otherwise are not subject to liability under these Sections.
E-10