UNITED STATES
SECURITIES AND EXCHANGE COMMISSION
Washington, D.C. 20549
FORM 10-K
(Mark One)
| x | ANNUAL REPORT PURSUANT TO SECTION 13 OR 15(d) |
OF THE SECURITIES EXCHANGE ACT OF 1934
For the fiscal year ended August 31, 20092010
OR
| ¨ | TRANSITION REPORT PURSUANT TO SECTION 13 OR 15(d) |
OF THE SECURITIES EXCHANGE ACT OF 1934
For the Transition period from to to
Commission File No. 1-11288
ACTUANT CORPORATION
(Exact name of Registrant as specified in its charter)
| Wisconsin | 39-0168610 | |
(State or other jurisdiction of incorporation or organization) | (I.R.S. Employer Identification No.) |
13000 WEST SILVER SPRING DRIVE
BUTLER, WISCONSIN 53007
Mailing address: P.O. Box 3241, Milwaukee, Wisconsin 53201
(Address of principal executive offices)
(414) 352-4160
(Registrant’s telephone number, including area code)
Securities registered pursuant to Section 12(b) of the Act:
(Title of each class) | (Name of each exchange on which registered) | |||
Class A Common Stock, par value $0.20 per share | New York Stock Exchange | |||
Securities registered pursuant to Section 12(g) of the Act:None
Indicate by checkmark if the registrant is a well-known seasoned issuer, as defined in Rule 405 of the Securities Act. Yes x No ¨
Indicate by check mark if the registrant is not required to file reports pursuant to Section 13 or Section 15d of the Act. Yes ¨ No x
Indicate by check mark whether the Registrant (1) has filed all reports required to be filed by Section 13 or 15(d) of the Securities Exchange Act of 1934 during the preceding 12 months, and (2) has been subject to such filing requirements for the past 90 days.YesxNo¨
Indicate by check mark whether the registrant has submitted electronically and posted on its corporate Web site, if any, every Interactive Data File required to be submitted and posted pursuant to Rule 405 of Regulation S-T (§232.405 of this chapter) during the preceding 12 months (or for such shorter period that the registrant was required to submit and post such files). Yes ¨ No ¨
Indicate by check mark if disclosure of delinquent filers pursuant to Item 405 of Regulation S-K is not contained herein, and will not be contained, to the best of Registrant’s knowledge, in definitive proxy or information statements incorporated by reference in Part III of this Form 10-K or any amendment to this Form 10-K. x
Indicate by check mark whether the registrant is a large accelerated filer, an accelerated filer, a non-accelerated filer or a smaller reporting company. See definition of “large accelerated filer”,filer,” “smaller reporting company” in Rule 12b-2 of the Exchange Act. (Check one):
| Large accelerated filer x | Accelerated filer ¨ | |
| Non-accelerated filer ¨ | Smaller-reporting company ¨ | |
| (do not check if a smaller reporting company) |
Indicate by check mark whether the registrant is a shell company (as defined in Rule 12b-2 of the Exchange Act.): Yes ¨ No x
There were 67,826,65068,161,060 shares of the Registrant’s Class A Common Stock outstanding as of September 30, 2009.2010. The aggregate market value of the shares of Common Stock (based upon the closing price on the New York Stock Exchange on February 28, 2009)2010) held by non-affiliates of the Registrant was approximately $566$1,207 million.
DOCUMENTS INCORPORATED BY REFERENCE
Portions of the definitive Proxy Statement for the Annual Meeting of Shareholders to be held on January 12, 201014, 2011 are incorporated by reference into Part III hereof.
Actuant Corporation provides free-of-charge access to our annual report on Form 10-K, quarterly reports on Form 10-Q, current reports on Form 8-K, and all amendments thereto, through our website, www.actuant.com, as soon as reasonably practical after such reports are electronically filed with the Securities and Exchange Commission.
FORWARD LOOKING STATEMENTS AND CAUTIONARY FACTORS
This annual report on Form 10-K contains certain statements that constitute forward-looking statements within the meaning of the Private Securities Litigation Reform Act of 1995 that involve risks and uncertainties. The terms “may,” “should,” “could,” “anticipate,” “believe,” “estimate,” “expect,” “objective,” “plan,” “project” and similar expressions are intended to identify forward-looking statements. Such forward-looking statements are subject to inherent risks and uncertainties that may cause actual results or events to differ materially from those contemplated by such forward-looking statements. In addition to the assumptions and other factors referred to specifically in connection with such statements, factors that may cause actual results or events to differ materially from those contemplated by such forward-looking statements include, without limitation, general economic conditions and market conditions in the truck, automotive, recreational vehicle, industrial production, oil & gas, power generation, marine, infrastructure and retail electrical Do-It-Yourself (“DIY”) industries, market acceptance of existing and new products, successful integration of acquisitions execution ofand related restructuring, activities, operating margin risk due to competitive pricing and operating efficiencies, supply chain risk, material, labor or overhead cost increases, foreign currency risk, interest rate risk, commodity risk, the impact of geopolitical activity on the economy, changes in government regulations such as income taxes, climate control initiatives and healthcare reform, the lengthtiming or strength of an economic downturnsrecovery in the Company’s markets, litigation matters, the Company’s ability to access capital markets and other factors that may be referred to or noted in the Company’s reports filed with the Securities and Exchange Commission from time to time. We disclaim any obligation to publicly update or revise any forward-looking statements as a result of new information, future events or any other reason.
When used herein, the terms “Actuant,” “we,” “us,” “our,” and the “Company” refer to Actuant Corporation and its subsidiaries.
General
Actuant Corporation, headquartered in Butler, Wisconsin, is a Wisconsin corporation incorporated in 1910. The Company is a global manufacturer of a broad range of industrial products and systems. The Company is organized into four operating and reportable segments as follows: Industrial, Energy, Electrical and Engineered Solutions.
The Industrial segment is primarily involved in the design, manufacture and distribution of branded hydraulic and mechanical tools to the maintenance, industrial, infrastructure and production automation markets. The Energy segment provides joint integrity products and services, as well as umbilical, rope and cable solutions to the global oil & gas, power generation and energy markets. The Electrical segment is primarily involved in the design, manufacture and distribution of a broad range of electrical products to the retail DIY, wholesale, original equipment manufacturer (“OEM”), utility and harsh environment markets. The Engineered Solutions segment provides highly engineered position and motion control systems to OEMs in various vehicle markets, as well as a variety of other industrial products.
Our long-term goal is to grow annual diluted earnings per share (“EPS”), excluding unusual or non-recurring items, faster than most multi-industry peers. We intend to leverage our leading market positions to generate annual internal sales growth that exceeds the annual growth rates of the gross domestic product in the geographic regions in which we operate. In addition to internal sales growth, we are focused on acquiring complementary businesses (tuck-in acquisitions).businesses. Following an acquisition, we seek to drive cost reductions, develop additional cross-selling opportunities and deepen customer relationships. We also focus on profit margin expansion and cash flow
generation to achieve our financial and EPS growth goal.goals. Our LEAD (“Lean Enterprise Across Disciplines”) process utilizes various continuous improvement techniques to drive out costs and improve efficiencies across all locations and functions worldwide, thereby expanding profit margins. Strong cash flow generation is achieved by maximizing returns on assets and minimizing primary working capital needs. The cash
flow that results from efficient asset management and improved profitability is used to reduce debt and fund additional acquisitions and internal growth opportunities.
A significant portion of our growth has come from business acquisitions and this will continue to be an important part of our strategy in the future. For further information, see Note 2, “Acquisitions” in the Notesnotes to Consolidated Financial Statements.consolidated financial statements.
Description of Business Segments
Industrial
We believe the Industrial business is a leading global supplier of branded hydraulic and mechanical tools to the maintenance, industrial, infrastructure and production automation markets. We design, produce and market our industrial tools primarily through our Enerpac, Simplex, Precision Sure-Lock, Milwaukee Cylinder and TTF brand names.
We believe Enerpac is a leading global supplier of specialized high-force hydraulic industrial tools operating at very high pressures of approximately 5,000 pounds per square inch to 12,000 pounds per square inch. The hydraulic tool line consists of a broad range of products that are generally sold by industrial and specialty fluid power distributors to customers in the infrastructure, mining, steel mill, cement, rail, oil & gas and general maintenance industries. While the majority of its customers are specialty fluid power distributors, Enerpac also worksgenerates approximately 20% of its revenue by working closely with major global infrastructure firms to supply products that are used in major infrastructure projects.projects such as bridges, stadiums, tunnels and offshore platforms. Enerpac and Simplex products allow users to apply controlled force and motion to increase productivity, reduce labor costs and make work safer and easier to perform. In addition to specialty fluid power distributors and global infrastructure firms, Enerpac maintains strong customer relationships with leading industrial distributors such as W.W. Grainger, Applied Industrial Technologies and MSC.MSC which collectively generate less than 10% of its sales.
We also believe Enerpac is a leading supplier of hydraulic workholding components and systems. Workholding products hold parts in position in metal cutting machine tools during the machining process. The products are marketed through distributors to the automotive, machine tool and fixture design markets.
In addition, Enerpac also offersprovides high-force hydraulic systems (integrated solutions) to meet customer specific requirements for safe and precise control of movement and positioning. These customized hydraulic products and systems that are sold to construction firms or directly to OEM customers. Our product development staff works closely with customers to develop hydraulic solutions for specific industrial, infrastructure or construction applications.
Precision Sure-Lock and TTF maintain a leading market position in the concrete pre- and post-tensioning product markets in the U.S. and Europe, respectively. Products include one-time use and reusable chucks and wedges, stressing jacks and anchors that are used by concrete tensioning system designers, fabricators and installers. Primary end markets include residential and commercial construction, railroad, bridges and infrastructure and underground mining and tunnels.
Energy
We believe our Energy business is a leading supplier of joint integrity products and services, as well as umbilical, rope and cable solutions to the global oil & gas, power generation and energy markets under the Hydratight, D.L. Ricci, Morgrip, Cortland, FibronBX, and Puget Sound Rope, Biach and Selantic brand names.
Joint integrity products include hydraulic torque wrenches, bolt tensioners and portable machining equipment, which are sold to asset owners, service providers and through distributors or rented to end users. These products are used in the maintenance of joints on oil rigs and platforms, wind turbines, refineries and pipelines, as well as fossil fuel and nuclear power plants to reduce customer downtime and provide increased safety and reliability. We also provide manpower services whereby our highly trained technicians
perform bolting, machining and joint integrity work for customers. The joint integrity business operates to world class safety standards while delivering productproducts and services through a localized infrastructure of rental and maintenance depots. Service, product sales and rental revenue each generate approximately one-third of our joint integrity product line sales.
Our Energy segment also provides custom engineered umbilicals, cable and high performance slings and synthetic rope to service providers and asset owners, which are used in the maintenance and installation of sub-sea oil & gas production equipment, as well as in oil & gas exploration. These customhighly engineered products provide the critical linkages between the surface and the ocean floor and must meet robust safety standards. Custom designed products are also sold into a variety of other niche markets including medical, defense and marine applications.
Energy segment sales and services are provided to customers in emerging markets, as well as in the North Sea, Middle East, South America, China, Asia, Gulf of Mexico and Canada. This business maintains strong relationships with a variety of leading firms such as Statoil, BJ Services, Petrobras, British Petroleum, CGG Veritas, Expro and Sercel.
Electrical
We believe the Electrical business is a leading supplier of a wide array of branded specialized electrical tools and supplies in North America and Europe to electrical wholesale distributors, catalog houses, retail home centers, hardware cooperatives, OEM’s, utilities and the retail marine distribution channel. Our Electrical businesses share core competencies in product branding, distribution and channel management, global sourcing and managing the logistics of SKU intensive product lines.
We believe our North American Electrical product linebusiness is a leading supplier of electrical tools and supplies to the Retail DIY, power transformation and harsh environment electrical markets. We provide the Retail DIY market with a variety of electrical tools and consumables such as cable ties, staples and wire management products under the Gardner Bender, Del City, A.W. Sperry and Calterm brands. These products are sold to leading retailers such as Lowe’s, The Home Depot, Menards, True Value and Ace Hardware. We also sell power transformation products such as low voltage, single-phase dry type transformers and custom toroidal transformers under the Acme Electric, Actown and Amveco brand names and high voltage switches under the Turner Electric brand name. The low voltage transformers are sold through electrical wholesale distributors, as well as directly to OEMs such as Siemens,Rockwell Automation, Powerware, Intermatic and General Electric. The high voltage switches are sold into the North American electrical utility market. The product line also includes a broad offering of electrical products and systems for the harsh environment electrical market under the Ancor, Marinco, Guest, AFI, Nicro and B.E.P Marine brand names. These products are primarily sold to various customers in the industrial, marine, power generation and retail markets. Customer examples includemarkets, including West Marine, Applied Materials and Kohler.
We believe our European Electrical product line is a leading supplier of electrical tools and supplies such as sockets, switches and wire management products to the German, Benelux and Austrian retail home center, wholesale distribution and OEM markets. European Electrical also sells its products in Eastern European markets such as Hungary, Poland, the Czech Republic and Scandinavia. The primary brands utilized in this business include Kopp and Dresco. Products are sold to leading retailers such as Praktiker (Metro Group), Rewe, Hornbach, Praxis, Gamma and Formido.
Engineered Solutions
We believe that the Engineered Solutions business is a leading global designer and assembler of customized position and motion control systems and other industrial products for OEMs in a variety of niche markets.
The Vehicle Systems product line primarily serves the truck, automotive, off-highway and specialty vehicle markets. Products include hydraulic cab-tilt and latching systems, electro-hydraulic convertible top latching and actuation systems, diesel engine air flow handling and turbocharger components and systems, as well as
hydraulic leveling solutions for specialty vehicles. We believe that the segment’s principal brands, Power-Packer,
Gits and Power Gear are recognized for their engineering quality and integrated custom design. A summary of the end markets, customers and products are as follows:
Our hydraulic cab-tilt and latching systems are sold to leading global heavy duty truck OEMs such as Volvo, Iveco, Scania and CNHTC.
The automotive convertible top actuation systems are utilized on both retractable soft and hard top vehicles manufactured by OEMs such as Daimler, Audi, Volkswagen, Renault, Peugeot, Saab, BMW, Volvo and Nissan. We maintain strong relationships with leading customers such as Wilhelm Karmann GmbH, CTS Dachsysteme Edscha and Webasto.Webasto-Edscha.
Our diesel engine air flow solutions, such as exhaust gas recirculation (EGR) systems are used by diesel engine and turbocharger manufacturers to reduce emissions, improve fuel efficiency and increase horsepower. Primary end markets include heavy duty truck and off-highway equipment serving customers such as Caterpillar, Detroit Diesel, Garrett Turbochargers, Holset Engineering, IHI and Borg Warner.
We also sell products under the Power-Packer and Power Gear brand names to specialty vehicle markets, principally in the defense and off-highway markets to customers such as Oshkosh, BAE Systems and Winnebago.
The Other product line within this segment provides a variety of products and engineered solutions to other niche markets. Maxima engineers, manufactures and markets electronic controls and instrumentation systems for severe-duty applications such as agriculture, construction and other specialty vehicles under the Datcon, Stewart Warner and AST brand names. Nielsen offers a comprehensive line of case, container and industrial hardware. Elliott produces custom designed flexible shafts and push pull cable assemblies for a variety of end markets including agriculture, aerospace, medical and other industrial markets. Sanlo designs and manufactures custom steel cable assemblies for aerospace, infrastructure, material handling, security and other niche markets.
International Business
Actuant is a global company. In fiscal 2009,2010, we derived approximately 49%52% of our net sales (continuing operations) from the United States, 40%33% from Europe, 8%11% from Asia, 1% from Canada and 2%3% from South America and other countries. International sales are influenced by fluctuations in exchange rates of foreign currencies, foreign economic conditions and other factors associated with foreign trade. We have implemented a global infrastructure for the manufacturing, sourcing, distribution and sale of our products. This infrastructure enables us to support our strong relationships with many global customers, who are leaders in their industries.
Distribution and Marketing
We have established a global network to source and distribute products and components effectively while maintaining ourefficient inventory at low levels. The Industrial segment sells products through distributors and OEM channels while the Energy segment sells products and services primarily to OEMs, maintenance and service organizations and energy producers. The Electrical segment sells its products through a combination of distributors, direct sales personnel and manufacturers’ representatives into the retail, distribution and OEM channels. Our distributor networks are one of our key competitive strengths in providing exceptional service to our end customers.
RetailRetail: We utilize a combination of internal account managers and independent manufacturers’ representatives to serve the retail customers of our Electrical segment, including home centers, marine and automotive retailers, mass merchandisers and hardware cooperatives. Sales and marketing personnel provide significant marketing support, including promotional planning, sales programs, retail point-of-purchase materials and displays, effective product packaging, strong advertising programs and state of the art merchandising.
Wholesale DistributionDistribution: The Industrial and portions of the Electrical segments sell products through thousands of wholesale distributors via internal direct sales managers dedicated to the distributor channel and independent sales representatives. Due to the fragmentation of the distribution channel, we rely extensively on independent manufacturers’ representatives to provide ongoing customer sales and service support.
OEMOEM: Sales to this channel are made through a combination of internal direct field sales representatives, independent sales representatives, catalogs, telemarketers and the internet.
Products in the Engineered Solutions segment are primarily marketed directly to OEMs through a direct technical sales organization. Product lines also have dedicated market managers, as well as a technical support organization. We utilize an experienced sales force that is organized by end-market, typically resides in the respective manufacturing facility and reports to market sales leaders. Within the Engineered Solutions segment, engineering capabilities, technical service, quality and established customer relationships are key competitive advantages in winning new contracts.
Product Development and Engineering
We have earned a reputation for design and engineering expertise and for the creation of highly engineered innovative products. WeWhile we generally do not operate stand-alone research and development centers, we maintain engineering staff at several locations that design new products and make improvements to existing product lines. Research and development costs consist primarily of an allocation of overall engineering and development resources and are expensed as incurred, and were approximately $15 million, $16 million $17 million and $11$17 million in fiscal 2010, 2009 2008 and 2007,2008, respectively. We also incur significant application engineering and development costs in connection with fulfilling custom customer orders and executing customer projects that are not captured in these allocated research and development costs. Through our advanced proprietary processes, with over 600 patents (including pending applications), we create products that satisfy specific customer needs and make jobs easier and more efficient for our customers.
Competition
We generally have numerous competitors in each of our markets, but believe that we are well positioned to compete successfully. Although we face larger competitors in some markets, the majority of our competition in our niche markets is primarily composed of small regional competitors who often lack the infrastructure and financial resources to support global customers. Given our diversity, we generally do not compete with the same competitorscompanies in more than one of our business segments. We believe that our global scale and infrastructure help to build and maintain strong relationships with major customers.
Patents and Trademarks
We own numerous United States and foreign patents and trademarks. NoHowever, no individual patent or trademark is believed to be of such importance that its termination would have a material adverse effect on our businesses.
Manufacturing and Operations
Our manufacturing primarily consists of light assembly operations. However, we do have plastic injection molding,stamping, extruding, machining, and automated welding and painting lines in certain businesses. We have implemented single piece flow methodology in most of our manufacturing plants, which reduces inventory levels, lowers “re-work” costs and shortens lead time to customers. We manufactureassemble the majority of the products we sell, but strategically outsource components and finished goods from an established global network of qualified suppliers. Components are purchased from a variety of suppliers, including those in low cost countries such as China.countries. We have built strong relationships with our key suppliers over many years, and while we single source many of our components, we believe that in most cases there are several qualified alternative sources.
Order Backlogs and Seasonality
Our Industrial, Energy and Electrical segments have relatively short order-to-ship cycles, while our OEM oriented Engineered Solutions segment has a longer cycle, and therefore typically has a larger backlog. We had an order backlog of approximately $163$204 million and $202$160 million at August 31, 20092010 and 2008,2009, respectively. Substantially all orders are expected to be completed prior to the end of fiscal 2010. Our consolidated sales are not subject to significant seasonal fluctuations.2011. The declinefluctuations in sales between the firstquarters during fiscal 2010 and second quarters in fiscal 2009 as shown in the following table, waswere primarily due to changes in the overall economic slow-downenvironment and not seasonality. Absent economic variations, sales in the second quarter of our fiscal year (December through February) are typically lower than other quarters due to holidays and weaker seasonal demand during winter months in the Northern Hemisphere.
Sales Percentages by Fiscal Quarter
| 2009 | 2008 | 2010 | 2009 | |||||||||
Quarter 1 | 30 | % | 25 | % | 23 | % | 30 | % | ||||
Quarter 2 | 24 | % | 24 | % | 23 | % | 24 | % | ||||
Quarter 3 | 23 | % | 27 | % | 27 | % | 23 | % | ||||
Quarter 4 | 23 | % | 24 | % | 27 | % | 23 | % | ||||
| 100 | % | 100 | % | 100 | % | 100 | % | |||||
Employees
At August 31, 2009,2010, we employed approximately 5,900 people.5,500 people in continuing operations. Our employees are not subject to collective bargaining agreements, with the exception of approximately 120125 U.S. production employees andas well as certain international employees covered by government mandated collective labor agreements. We believe working relationships with our employees are good.
Environmental Matters
Our operations, like those of allother industrial businesses, are subject to federal, state, local and foreign laws and regulations relating to the protection of the environment, including those regulating discharges of hazardous materials into the air and water, the storage and disposal of such materials and the clean-up of soil and groundwater contamination. Pursuant to certain environmental laws, a current or prior owner or operator of a site may be liable for the cost of an investigation and any remediation of contamination, while those who arrange for the disposal or treatment of hazardous materials may be liable for such costs at a disposal or treatment site, whether or not they owned or operated it. These laws impose strict, and under certain circumstances, joint and several liability.
We believe that we are in material compliance with applicable environmental laws. Compliance with these laws has and will require expenditures on an ongoing basis. Soil and groundwater contamination has been identified at a few facilities that we operate or formerly owned or operated. We are also a party to state and local environmental matters and have provided environmental indemnifications for certain divested business units, and as such retain responsibility for certain potential environmental liabilities.
We have facilities in numerous geographic locations that are subject to a range of environmental laws and regulations. Environmental expensescosts that have no future economic value are expensed. Liabilities are recorded when environmental remediation is probable and the costs are reasonably estimable. Environmental expenditures over the last three years have not been less than $0.5 million per year. We believematerial. Management believes that thesuch costs for known environmental matters arewill not likely to have a material adverse effect on ourthe Company’s financial position, results of operations or cash flows. Nevertheless, more stringent environmental laws, unanticipated or burdensome remedy requirements or discovery of previously unknown conditions could have a material adverse effect upon our financial position, results of operations or cash flows. Environmental remediation liabilities in our Consolidated Balance Sheetsconsolidated balance sheets are not significant. For further information, see Note 17, “Contingencies and Litigation” in the Notesnotes to Consolidated Financial Statements.consolidated financial statements.
Other
For additional information regarding revenues, profits and total assets of each business segment, geographicalgeographic financial information and information on customers, see Note 16, “Business Segment, Geographic and Customer Information” in the Notesnotes to Consolidatedconsolidated financial statements.
Executive Officers of the Registrant
The names, ages and positions of all of the executive officers of the Company as of August 31, 2010 are listed below.
Name | Age | Position | ||
Robert C. Arzbaecher | 50 | President and Chief Executive Officer; Chairman of the Board | ||
William L. Axline | 62 | Executive Vice President—Electrical Segment | ||
William S. Blackmore | 54 | Executive Vice President—Engineered Solutions Segment | ||
Gustav H.P. Boel | 65 | Executive Vice President; Director | ||
Mark E. Goldstein | 54 | Executive Vice President and Chief Operating Officer | ||
Brian K. Kobylinski | 44 | Executive Vice President—Industrial and Energy Segments | ||
Andrew G. Lampereur | 47 | Executive Vice President and Chief Financial Officer |
Robert C. Arzbaecher, President and Chief Executive Officer and Chairman of the Board of Directors. Mr. Arzbaecher was named President and Chief Executive Officer of the Company in August 2000. He served as Vice President and Chief Financial Statements.Officer of Actuant starting in 1994 and Senior Vice President in 1998. He served as Vice President, Finance of Tools & Supplies from 1993 to 1994. He joined Actuant in 1992 as Corporate Controller. From 1988 through 1991, Mr. Arzbaecher was employed by Grabill Aerospace Industries LTD, where he last held the position of Chief Financial Officer.
William L. Axline, Executive Vice President—Electrical Segment. Mr. Axline joined Actuant in January 2008 as Executive Vice President of the Electrical Segment. Prior to Actuant, Mr. Axline held the role of Executive Vice President, Chief Operating Officer of Fluidmaster, Inc. from 2003 to 2007. Prior to joining Fluidmaster, he served as President, Chief Executive Officer, of Distribution America, Inc. from 2001 to 2003 and held the role of Vice President, General Manager at Alltrade, Inc. from 1999 to 2000. Mr. Axline also had over 27 years of leadership experience with The Stanley Works.
William S. Blackmore, Executive Vice President—Engineered Solutions Segment. Mr. Blackmore has been the Executive Vice-President—Engineered Solutions Segment since fiscal year 2004. He joined the Company as leader of the Engineered Solutions-Americas business in fiscal year 2002. Prior to joining Actuant, he served as President of Integrated Systems—Americas at APW Ltd. from 2000 to 2001 and as President, Rexnord Gear and Coupling Products (“Rexnord”) from 1997 to 2000. Prior to 1997, Mr. Blackmore held various general management positions at Rexnord and Pillar Industries.
Gustav H.P. Boel, Executive Vice President and member of the Board of Directors. Mr. Boel has been associated with the Company for over 25 years, currently as a member of the Board of Directors and an Executive Vice President in charge of our LEAD initiatives. Following the spin-off of the Company’s Electronics segment in fiscal 2000, he left the Company as an employee but served as a member of the Board of Directors. During this time he was employed by APW Ltd., where he last held the position of Senior Vice President. In September 2002, he rejoined the Company as an employee and was named business leader of the European Electrical business in addition to his Board responsibilities. Prior to the spin-off, he held various positions with Actuant, including President of the Industrial business segment, President of Engineered Solutions Europe and President of Enerpac.
Mark E. Goldstein, Executive Vice President and Chief Operating Officer. Mr. Goldstein was appointed to the newly created position of Chief Operating Officer in fiscal 2007. He joined the Company in fiscal 2001 as the
leader of the Gardner Bender business and was appointed Executive Vice President—Tools and Supplies in 2003. Prior to joining Actuant, he spent over 20 years in sales, marketing and operations management positions at The Stanley Works, most recently as President, Stanley Door Systems.
Brian K. Kobylinski, Executive Vice President—Industrial and Energy Segments. Mr. Kobylinski joined Actuant in 1993 and progressed through a number of management roles within Gardner Bender and Del City. In 2000, Mr. Kobylinski was named Vice President of Gardner Bender and led the business’ sales and marketing. He became Vice President of Business Development for Actuant in 2002 and was named Global Business Leader, Hydratight in 2005. In 2007, he was promoted to the position of Industrial and Energy Segment Leader. Prior to Actuant, Mr. Kobylinski was employed by Fort Howard Corporation and Federated Insurance.
Andrew G. Lampereur, Executive Vice President and Chief Financial Officer. Mr. Lampereur joined Actuant in 1993 as Corporate Controller, a position he held until 1996 when he was appointed Vice President of Finance for Gardner Bender. In 1998, Mr. Lampereur was appointed Vice President, General Manager for Gardner Bender. He was appointed to his present position in August 2000. Prior to joining Actuant, Mr. Lampereur held a number of financial management positions at Terex Corporation.
Current worldwideWorldwide economic conditions have adversely affected our industry, business and results of operations.
InSince 2008 and 2009, general worldwide economic conditions experiencedthe global economy has undergone a significant downturnperiod of unprecedented volatility due to the effects of the subprime lending crisis, general credit market crisis, collateral effects on the finance and banking industries,issues, increased energy costs, concerns about inflation, slower economic activity, decreased consumer confidence, reduced corporate profits and capital spending, adverse business conditions and liquidity concerns. TheseThis had a significant impact on our operations in fiscal 2009 and 2010, resulting in lower sales and profits, which necessitated major restructuring actions. Certain of our businesses and served end markets are now experiencing improved customer demand and business conditions but there is continued uncertainty as the worldwide economy recovers. Conditions like these make it difficult for our customers, our vendors and us to accurately forecast and plan future business activities and they could cause U.S. and foreign businesses to slow spending on our products, which would delay and lengthen sales cycles. We cannot accurately predict the timing or duration of any economic slowdown or the timing or strength of a subsequent economic recovery, worldwide, or in the specific end markets we serve. Several of our principal markets including the vehicle, industrial, MRO, marine, energy and electrical markets experienced a significant deterioration due to these economic effects, and as a consequence, our business, financial condition and results of operations werehave been adversely affected. Changes in these general economic conditions also impact the expense and cash requirements associated with our defined benefit pension plans, which invest in fixed income and equity securities to fund related benefit obligations. If declinesDeclines in financial market conditions continue,could increase funding requirements and expense for these defined benefit pension plans will increase, whichplans. We cannot accurately predict the strength of the current economic recovery, or the timing or duration of a future economic slowdown. Changes in the worldwide economic and capital market conditions are beyond our control, are unpredictable and could have a material adverse effect on futureour results of operations or liquidity.
Market demand for our products may suffer cyclical declines.
The level of market demand for our products depends on the general economic condition of the markets in which we compete. A portion of our revenues are derived from customers in cyclical industries that have been significantly and adversely affected by the recent downward economic cycle, which has resulted in significantly lower demand for products in the affected business segments. For example, we generate sales in the infrastructure, marine, retail electrical DIY, heavy-duty truck, RV and automotive markets. In particular, the economic downturn has led to significant pressure on numerous industries in the United States and globally, causing some of our customers to file for bankruptcy or announce significant restructuring actions in the midst of unprecedented declines in the production levels and consumer demand. Further declines in consumer demand could negatively impact our sales and our ability to collect accounts receivables from our customers. The recent downturn in the global economy has(the “Great Recession”) resulted in a material decrease in the demand for our products in a number of these markets. A prolonged downturn or additional deterioration in the conditions in any of these
markets, as well as in any of the other industries in which we operate, could adversely affect our businesses. If consumer confidence continues to decline, consumer discretionary spending on vehicle purchases and remodeling and other construction projects would continue to be negatively impacted, adversely impacting our sales to customers in these markets.
Our restructuring program could negatively affect our financial performance.
In response to the deteriorating economic environment, we implemented various restructuring initiatives aimed at reducing our cost structure and improving operational performance. InDuring fiscal 2010 and 2009, we recordedrecognized restructuring charges of $24$17 million ($22and $21 million, included in selling, administrative and engineering expenses and $2 million included in cost of products sold)respectively, which included facility consolidations and workforce reductions to reduce costs in our business. We anticipate incurring an additional $10-12 million of restructuring charges in fiscal 2010 as we complete current restructuring efforts. However, unforeseenUnforeseen events may require additional restructuring costs. Although we expect that the related cost savings and realization of efficiencies will offset the restructuring related costs over time, we may not achieve the net benefits.
Our indebtedness could harm our operating flexibility and competitive position.
We have incurred, and may in the future incur, significant indebtedness in connection with acquisitions. We have, and will continue to have, a substantial amount of debt which will continue to require significant interest and principal payments. Our level of debt and the limitations imposed on us by our debt agreements could adversely affect our operating flexibility and put us at a competitive disadvantage. Our substantial debt level may adversely affect our future performance.
Our ability to make scheduled payments of principal of, to pay interest on, or to refinance our indebtedness, and to satisfy our other debt and lease obligations will depend upon our future operating performance and credit market conditions, which will be affected by factors beyond our control. In addition, there can be no assurance that future borrowings or equity financings will be available to us on favorable terms or at all for the payment or refinancing of our indebtedness. If we are unable to service our indebtedness, our business, financial condition and results of operations will be materially adversely affected.
Our ability to service our debt obligations would be harmed if we fail to comply with the financial and other covenants in our debt agreements.
Our amended senior credit agreement and our other debt agreements contain financial and other restrictive covenants. These covenants could adversely affect us by limiting our financial and operating flexibility as well as our ability to plan for and react to market conditions and to meet our capital needs. OurWhile we consider our relationships with our lenders to be very good, our failure to comply with these covenants could result in events of default which, if not cured or waived, could result in our being required to repay indebtedness before its due date, and we may not have the financial resources or be able to arrange alternative financing to do so. Borrowings under our amended senior credit facility are secured by most domestic personal property assets and are guaranteed by most of our domestic subsidiaries and by a pledge of the stock of most of our domestic subsidiaries and certain foreign subsidiaries. If borrowings under our amended senior credit facility were declared or became due and payable immediately as the result of an event of default and we were unable to repay or refinance those borrowings, the lenders could foreclose on the pledged assets and stock. Any event that requires us to repay any of our debt before it is due could require us to borrow additional amounts at unfavorable borrowing terms, cause a significant decrease in our liquidity and impair our ability to pay amounts due on our indebtedness. Moreover, if we are required to repay any of our debt before it becomes due, we may be unable to borrow additional amounts or otherwise obtain the cash necessary to repay that debt, when due, which could seriously harm our business.
Our businesses operate in highly competitive markets, so we may be forced to cut prices or incur additional costs.
Our businesses generally face substantial competition in each of their respective markets. We may be forced to reduce prices, incur increased costs or lose market share in certain business units. We compete on the basis of
product design, quality, availability, performance, customer service and price. Present or future competitors may have greater financial, technical or other resources which could put us at a disadvantage in the affected business or businesses.
Our international operations pose currency and other risks.
Our international operations present specialadditional risks, primarily from currency exchange rate fluctuations, exposure to local economic and political conditions, export and import restrictions, controls on repatriation of cash and exposure to local political conditions. In particular, our results of operations have been significantly affected by fluctuations in foreign currency exchange rates, especially the euro and British pound. For example, since nearly halfa meaningful strengthening of our revenue is generated in Europe, the appreciation ofChina RMB against the U.S. dollar against theor euro and British poundwould result in fiscal 2009 adversely impacted our resultshigher costs of operations due to the translation of non-U.S. dollar denominated revenues.products we source from China. In addition, there have been several proposals to reform international taxation rules in the United States. We earn a substantial portion of our income from international operations and therefore changes to United States international tax rules may have a material adverse effect on future results of operations or liquidity. To the extent that we expand our international presence, these risks may increase.
Our goodwill and other intangible assets represent a substantial amount of our total assets.
Our total assets reflect substantial intangible assets, primarily goodwill. At August 31, 2010, goodwill and other intangible assets totaled approximately $1,042 million, or about 64% of our total assets. The goodwill results from our acquisitions, representing the excess of cost over the fair value of the net tangible and other identifiable intangible assets we have acquired. At a minimum, we assess annually whether there has been impairment in the value of our goodwill or indefinite-lived intangible assets. If future operating performance at one or more of our acquired reporting units were to fall significantly below current levels, we could be required to recognize a non-cash charge to operating earnings for goodwill or other intangible asset impairment. Any significant goodwill or intangible asset impairment would negatively affect our financial condition and results of operations. We recognized goodwill and intangible asset impairment charges of $36 million and $58 million in fiscal 2010 and 2009, respectively. See Note 3, “Discontinued Operations” and Note 6, “Impairment Charges” in the notes to consolidated financial statements for more information regarding these impairment charges.
Our growth strategy includes strategic acquisitions. We may not be able to consummate future acquisitions or successfully integrate recent and future acquisitions.
A portion of our growth has come from strategic acquisitions of businesses. We plan to continue making acquisitions to enhance our global market position and broaden our product offerings. Although we have been successful with our acquisition strategies in the past, our ability to successfully execute acquisitions will be impacted by a number of factors, including the availability of financing for acquisitions on terms acceptable to us, our ability to identify acquisition candidates and increased competition for acquisitions, which may increase acquisition costs and affect our ability to consummate acquisitions on favorable terms. The process of integrating acquired businesses into our existing operations may result in unforeseen operating difficulties and may require additional financial resources and attention from management that would otherwise be available for the ongoing development or expansion of our existing operations. Furthermore, even if successfully integrated, the acquired business may not achieve the results we expected or produce expected benefits in the time frame planned. Failure to continue with our acquisition strategy or successfully integrate the acquired businesses could have an adverse effect on our business, results of operations, liquidity and financial condition.
We may not be able to realize the anticipated benefits from acquired companies.
We may not be able to realize the anticipated benefits from acquired companies. Achieving those benefits depends on the timely, efficient and successful execution of a number of post-acquisition events, including integrating the acquired business into our company. Factors that could affect our ability to achieve these benefits include:
difficulties in integrating and managing personnel, financial reporting and other systems used by the acquired businesses into our company;
the failure of acquired businesses to perform in accordance with our expectations;
failure to achieve anticipated synergies between our business units and the business units of acquired businesses;
the loss of acquired business customers; or
the loss of any of the key managers of acquired businesses.
If acquired businesses do not operate as we anticipate, it could materially harm our business, financial condition and results of operations. In addition, acquired businesses may operate in niche markets in which we have little or no experience. Accordingly, we will be highly dependent upon existing managers and employees to manage those businesses, and the loss of any key managers or employees of the acquired business could have a material adverse effect on our business.
The indemnification provisions of acquisition agreements by which we have acquired companies may not fully protect us and may result in unexpected liabilities.
Certain of the acquisition agreements from past acquisitions require the former owners to indemnify us against certain liabilities related to the operation of each of their companies before we acquired it. In most of these agreements, however, the liability of the former owners is limited and certain former owners may not be able to meet their indemnification responsibilities. These indemnification provisions may not fully protect us, and as a result we may face unexpected liabilities that adversely affect our profitability and financial position.
Our goodwillRegulatory and other intangible assets represent a substantial amount of our total assets.
Our total assets reflect substantial intangible assets, primarily goodwill. At August 31, 2009, goodwilllegal developments including changes to United States taxation rules, health care reform and other intangible assets totaled approximately $1,062 million, or about 68% of our total assets. The goodwill results from our acquisitions, representing the excess of cost over the fair value of the net tangible and other identifiable intangible assets we have acquired. At a minimum, we assess annually whether there has been impairment in the value of our goodwill or indefinite-lived intangible assets. If future operating performance at one or more of our reporting units were to fall significantly below current levels, werecent governmental climate change initiatives could be required to recognize a non-cash charge to operating earnings for goodwill or other intangible asset impairment. Any significant goodwill or intangible asset impairment would negatively affect our financial conditionperformance.
Our operations and the markets we compete in are subject to numerous federal, state, local and foreign governmental laws and regulations. Existing laws and regulations may be revised or reinterpreted and new laws and regulations, including taxation rules, health care reform and recent governmental climate change initiatives, may be adopted or become applicable to us or our customers. These regulations are complex, change frequently and have tended to become more stringent over time and may increase our costs and reduce profitability. We cannot predict the form any such new laws or regulations will take or the impact these laws and regulations will have on our business or operations. However, significant changes in governmental laws and regulations could adversely affect our future results of operations. During fiscal 2009, we recognized goodwill and intangible asset impairment charges of $26 million related to our RV business and $30 million related to our harsh environment electrical business. See Note 6 “Impairment Charges” in the Notes to the Consolidated Financial Statements for more information regarding goodwill and intangible asset impairments.
We may not be able to realize the anticipated benefits from acquired companies.
We may not be able to realize the anticipated benefits from acquired companies. Achieving those benefits depends on the timely, efficient and successful execution of a number of post-acquisition events, including integrating the acquired business into our company. Factors that could affect our ability to achieve these benefits include:
difficulties in integrating and managing personnel, financial reporting and other systems used by the acquired businesses into our company;
the failure of acquired businesses to perform in accordance with our expectations;
failure to achieve anticipated synergies between our business units and the business units of acquired businesses;
the loss of acquired business customers; or
the loss of any of the key managers of acquired businesses.
If acquired businesses do not operate as we anticipate, it could materially harm our business, financial condition and results of operations. In addition, acquired businesses may operate in niche markets in which we have little or no experience. Accordingly, we will be highly dependent upon existing managers and employees to manage those businesses, and the loss of any key managers or employees of the acquired business could have a material adverse effect on our business.
Environmental laws and regulations may result in additional costs.costs.
We are subject to federal, state, local and foreign laws and regulations governing public and worker health and safety. Any violations of these laws by us could cause us to incur unanticipated liabilities that could harm our operating results. Pursuant to such laws, governmental authorities have required us to contribute to the cost of investigating or remediating, or to investigate or remediate, third party as well as currently or previously owned and operated sites. In addition, we provided environmental indemnities in connection with the sale of certain businesses and product lines. Liability as an owner or operator, or as an arranger for the treatment or disposal of hazardous substances, can be joint and several and can be imposed without regard to fault. There is a risk that our costs relating to these matters could be greater than what we currently expect or exceed our insurance coverage, or that additional remediation and compliance obligations could arise which require us to make material expenditures. In particular, more stringent environmental laws, unanticipated remediation requirements or the discovery of previously unknown conditions could materially harm our financial condition and operating results. We are also required to comply with various environmental laws and maintain permits, some of which are subject to discretionary renewal from time to time, for many of our businesses, and our business operations could be restricted if we are unable to renew existing permits or to obtain any additional permits that we may require.
Any loss of key personnel and the inability to attract and retain qualified employees could have a material adverse impact on our operations.
We are dependent on the continued services of key executives such as our Chief Executive Officer, Chief Operating Officer, Chief Financial Officer and executives in charge of our segments. We currently do not have employment agreements with most of these or other officers. The departure of key personnel without adequate replacement could severely disrupt our business operations. Additionally, we need qualified managers and skilled employees with technical and manufacturing industry experience to operate our businesses successfully. From time to time there may be shortages of skilled labor which may make it more difficult and expensive for us to attract and retain qualified employees. If we are unable to attract and retain qualified individuals or our costs to do so increase significantly, our operations would be materially adversely affected.
If our intellectual property protection is inadequate, others may be able to use our technologies and tradenames and thereby reduce our ability to compete, which could have a material adverse effect on us, our financial condition and results of operations.
We regard much of the technology underlying our services and products and the trademarks under which we market our products as proprietary. The steps we take to protect our proprietary technology may be inadequate to prevent misappropriation of our technology, or third parties may independently develop similar technology. We rely on a combination of patents, trademark, copyright and trade secret laws, employee and third-party non-disclosure agreements and other contracts to establish and protect our technology and other intellectual property rights. The agreements may be breached or terminated, and we may not have adequate remedies for any breach, and existing trade secrets, patent and copyright law afford us limited protection. Policing unauthorized use of our intellectual property is difficult. A third party could copy or otherwise obtain and use our products or technology without authorization. Litigation may be necessary for us to defend against claims of infringement or
to protect our intellectual property rights and could result in substantial cost to us and diversion of our efforts. Further, we might not prevail in such litigation which could harm our business.
Our products could infringe on the intellectual property of others, which may cause us to engage in costly litigation and, if we are not successful, could cause us to pay substantial damages and prohibit us from selling our products.
Third parties may assert infringement or other intellectual property claims against us based on their patents or other intellectual property claims, and we may have to pay substantial damages, possibly including treble damages, if it is ultimately determined that our products infringe. We may have to obtain a license to sell our products if it is determined that our products infringe upon another party’s intellectual property. We might be prohibited from selling our products before we obtain a license, which, if available at all, may require us to pay substantial royalties. Even if infringement claims against us are without merit, defending these types of lawsuits takes significant time, may be expensive and may divert management attention from other business concerns.
Large or rapid increases in the costs of raw materials or substantial decreases in their availability could adversely affect our operations.
The primary raw materials that we use include steel, plastic resin, copper, brass, steel wire and rubber. Most of our suppliers are not currently parties to long-term contracts with us. Consequently, we are vulnerable to fluctuations in prices of such raw materials. If market prices for certain materials such as steel, plastic resin and copper rise, it could have a negative effect on our operating results and ability to manufacture our respective products on a timely basis. From time to time we have entered into derivative contracts to hedge our exposure to commodity risk, none of which derivative contracts havehas been material. Factors such as supply and demand, freight costs and transportation availability, inventory levels, the level of imports and general economic conditions may affect the prices of raw materials that we need. If we experience any significant increases in raw material prices, or if we are unable to pass along any increases in raw material prices to our customers, our results of operations could be adversely affected. In addition, an increasing portion of our products are sourced from low cost regions. Changes
in export laws, taxes and disruptions in transportation routes, especially in China, could adversely impact our results of operations.
Our products create the possibility of product liability lawsuits, which may negatively impact our business.
As a global manufacturer of a broad range of industrial products and systems, we face an inherent business risk related to product liability claims. Our businesses expose us to potential product liability claims associated with the design, manufacture and distribution of product. Certain of our products are included in integrated customer solutions or utilized in harsh environments (including various industrial and infrastructure applications), which could expose us to significant liability from the failure or defect of our products. Although we maintain strict quality control procedures and have liability insurance coverage, we cannot be certain that these will be adequate to cover all claims that may arise. In the event that we do not have adequate insurance coverage, our business, financial condition and results of operations may be materially adversely affected.
Geopolitical unrest and terrorist activities may cause the economic conditions in the U.S. or abroad to deteriorate, which could harm our business.
Terrorist attacks against targets in the U.S. or abroad, rumors or threats of war, other geopolitical activity or trade disruptions may impact our operations or cause general economic conditions in the U.S. and abroad to deteriorate. A prolonged economic slowdown or recession in the U.S. or in other areas of the world could reduce the demand for our products and, therefore, negatively affect our future sales. Any of these events could have a significant impact on our business, financial condition or results of operations.
Item 1B. Unresolved Staff Comments
None.
Our corporate headquarters is located in Butler, Wisconsin. As of August 31, 2009,2010, the Company operated the following facilities in its continuing operations (square footage in thousands):
| Number of Locations | Square Footage | Number of Locations | Square Footage | |||||||||||||||||||||||||||||||||
| Distribution / Sales | Distribution / Sales / Admin | |||||||||||||||||||||||||||||||||||
| Manufacturing | Total | Owned | Leased | Total | Manufacturing | Total | Owned | Leased | Total | |||||||||||||||||||||||||||
Industrial | 11 | 15 | 26 | 212 | 693 | 905 | 11 | 11 | 22 | 164 | 535 | 699 | ||||||||||||||||||||||||
Energy | 8 | 22 | 30 | 60 | 397 | 457 | 11 | 15 | 26 | 39 | 433 | 472 | ||||||||||||||||||||||||
Electrical | 13 | 18 | 31 | 868 | 978 | 1,846 | 6 | 6 | 12 | 153 | 706 | 859 | ||||||||||||||||||||||||
Engineered Solutions | 14 | 2 | 16 | 515 | 654 | 1,169 | 12 | 3 | 15 | 516 | 628 | 1,144 | ||||||||||||||||||||||||
Corporate and other | 1 | 4 | 5 | 353 | 96 | 449 | ||||||||||||||||||||||||||||||
| 46 | 57 | 103 | 1,655 | 2,613 | 4,377 | 41 | 39 | 80 | 1,225 | 2,398 | 3,623 | |||||||||||||||||||||||||
We consider our facilities suitable and adequate for the purposes for which they are used and do not anticipate difficulty in renewing existing leases as they expire or in finding alternative facilities. Our largest locations are located in the United States, Germany, the United Kingdom, the Netherlands and China. We also maintain a presence in Australia, Austria, Brazil, Canada, Czech Republic, France, Germany, Hong Kong, Hungary, India, Italy, Japan, Kazakhstan, Malaysia, Mexico, New Zealand, Norway, Poland, Russia, Singapore, South Korea, Spain, Tunisia, Turkey and the United Arab Emirates. See Note 10 “Leases” in the Notesnotes to the Consolidated Financial Statementsconsolidated financial statements for information with respect to our lease commitments.
In addition to the facilities above, we retain responsibility for approximately 17 owned or leased facilities that are now idle and available for sale or sublease.
We are a party to various legal proceedings that have arisen in the normal course of business, including product liability, environmental, labor, insurance and patent claims.
We have recorded reserves for estimated losses based on the specific circumstances of each case. Such reserves are recorded when it is probable that a loss has been incurred as of the balance sheet date, the amount of the loss can be reasonably estimated and the loss is not covered by insurance. In our opinion, the resolution of these contingencies is not likely to have a material adverse effect on our financial condition, results of operation or cash flows. For further information refer to Note 17, “Contingencies and Litigation” in the Notesnotes to Consolidated Financial Statements.consolidated financial statements.
Item 4. Submission of Matters to a Vote of Security Holders(Removed and Reserved)
None.
Executive Officers of the Registrant
The names, ages and positions of all of the executive officers of the Company as of August 31, 2009 are listed below.
|
| |||
| ||||
| ||||
| ||||
| ||||
| ||||
| ||||
|
Robert C. Arzbaecher, President and Chief Executive Officer and Chairman of the Board of Directors. Mr. Arzbaecher was named President and Chief Executive Officer of the Company in August 2000. He served as Vice President and Chief Financial Officer of Actuant starting in 1994 and Senior Vice President in 1998. He served as Vice President, Finance of Tools & Supplies from 1993 to 1994. He joined Actuant in 1992 as Corporate Controller. From 1988 through 1991, Mr. Arzbaecher was employed by Grabill Aerospace Industries LTD, where he last held the position of Chief Financial Officer.
William L. Axline, Executive Vice President—Electrical Segment. Mr. Axline joined Actuant in January 2008 as Executive Vice President of the Electrical Segment. Prior to Actuant, Mr. Axline held the role of Executive Vice President, Chief Operating Officer of Fluidmaster, Inc. from 2003 to 2007. Prior to joining Fluidmaster, he served as President, Chief Executive Officer, of Distribution America, Inc. from 2001 to 2003 and held the role of Vice President, General Manager at Alltrade, Inc. from 1999 to 2000. Mr. Axline also had over 27 years of leadership experience with The Stanley Works,
William S. Blackmore, Executive Vice President—Engineered Solutions Segment . Mr. Blackmore has been the Executive Vice-President—Engineered Solutions Segment since fiscal year 2004. He joined the Company as leader of the Engineered Solutions-Americas business in fiscal year 2002. Prior to joining Actuant, he served as President of Integrated Systems—Americas at APW Ltd. from 2000 to 2001 and as President, Rexnord Gear and Coupling Products (“Rexnord”) from 1997 to 2000. Prior to 1997, Mr. Blackmore held various general management positions at Rexnord and Pillar Industries.
Gustav H.P. Boel, Executive Vice President and member of the Board of Directors. Mr. Boel has been associated with the Company for over 25 years, currently as a member of the Board of Directors and an Executive Vice President in charge of our LEAD initiatives. Following the spin-off of the Company’s Electronics segment in fiscal 2000, he left the Company as an employee but served as a member of the Board of Directors. During this time he was employed by APW Ltd., where he last held the position of Senior Vice President. In September 2002, he rejoined the Company as an employee and was named business leader of the European Electrical business in addition to his Board responsibilities. Prior to the spin-off, he held various positions with Actuant, including President of the Industrial business segment, President of Engineered Solutions Europe and President of Enerpac.
Mark E. Goldstein, Executive Vice President and Chief Operating Officer. Mr. Goldstein was appointed to the newly created position of Chief Operating Officer in fiscal 2007. He joined the Company in fiscal 2001 as the leader of the Gardner Bender business and was appointed Executive Vice President—Tools and Supplies in 2003. Prior to joining Actuant, he spent over 20 years in sales, marketing and operations management positions at The Stanley Works, most recently as President, Stanley Door Systems.
Brian K. Kobylinski, Executive Vice President—Industrial and Energy Segments. Mr. Kobylinski joined Actuant in 1993 and progressed through a number of management roles within Gardner Bender and Del City. In 2000, Mr. Kobylinski was named Vice President of Gardner Bender and led the business’ sales and marketing. He became Vice President of Business Development for Actuant in 2002 and was named Global Business Leader, Hydratight in 2005. In 2007, he was promoted to the position of Industrial and Energy Segment Leader. Prior to Actuant, Mr. Kobylinski was employed by Fort Howard Corporation and Federated Insurance.
Andrew G. Lampereur, Executive Vice President and Chief Financial Officer. Mr. Lampereur joined Actuant in 1993 as Corporate Controller, a position he held until 1996 when he was appointed Vice President of Finance for Gardner Bender. In 1998, Mr. Lampereur was appointed Vice President, General Manager for Gardner Bender. He was appointed to his present position in August 2000. Prior to joining Actuant, Mr. Lampereur held a number of financial management positions at Terex Corporation.
| Item 5. | Market for Registrant’s Common Equity, Related Stockholder Matters, and Issuer Purchases ofEquity Securities |
The Company’s common stock is traded on the New York Stock Exchange under the symbol ATU. At September 30, 2009,2010, there were 2,3672,151 shareholders of record of Actuant Corporation common stock. The high and low sales prices of the common stock were as follows for the previous two fiscal years:
Fiscal | Period | High | Low | Period | High | Low | ||||||||||||
2010 | June 1, 2010 to August 31, 2010 | $ | 21.74 | �� | $ | 17.47 | ||||||||||||
| March 1, 2010 to May 31, 2010 | 23.87 | 18.10 | ||||||||||||||||
| December 1, 2009 to February 28, 2010 | 19.80 | 15.93 | ||||||||||||||||
| September 1, 2009 to November 30, 2009 | 17.31 | 13.37 | ||||||||||||||||
2009 | June 1, 2009 to August 31, 2009 | $ | 15.53 | $ | 10.20 | June 1, 2009 to August 31, 2009 | $ | 15.53 | $ | 10.20 | ||||||||
| March 1, 2009 to May 31, 2009 | 13.43 | 7.02 | March 1, 2009 to May 31, 2009 | 13.43 | 7.02 | |||||||||||||
| December 1, 2008 to February 28, 2009 | 20.18 | 9.92 | December 1, 2008 to February 28, 2009 | 20.18 | 9.92 | |||||||||||||
| September 1, 2008 to November 30, 2008 | 34.10 | 13.69 | September 1, 2008 to November 30, 2008 | 34.10 | 13.69 | |||||||||||||
2008 | June 1, 2008 to August 31, 2008 | $ | 37.15 | $ | 28.28 | |||||||||||||
| March 1, 2008 to May 31, 2008 | 36.73 | 26.18 | ||||||||||||||||
| December 1, 2007 to February 29, 2008 | 35.12 | 24.25 | ||||||||||||||||
| September 1, 2007 to November 30, 2007 | 35.09 | 28.07 | ||||||||||||||||
In fiscal 2010, the Company declared a dividend of $0.04 per common share payable on October 15, 2010 to shareholders of record on September 30, 2010. In fiscal 2009, the Company declared a dividend of $0.04 per common share payable on October 15, 2009 to shareholders of record on September 30, 2009. In fiscal 2008, the Company declared a dividend of $0.04 per common share payable on October 15, 2008 to shareholders of record on September 30, 2008.
Performance Graph:
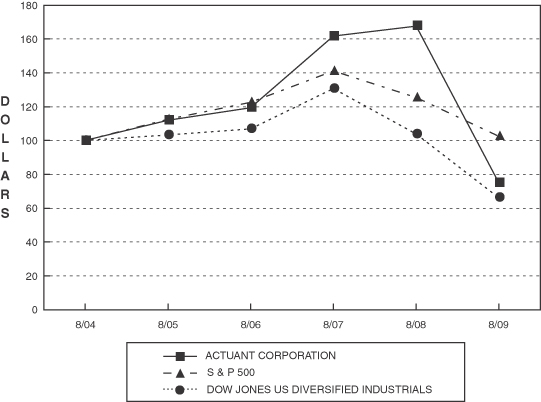
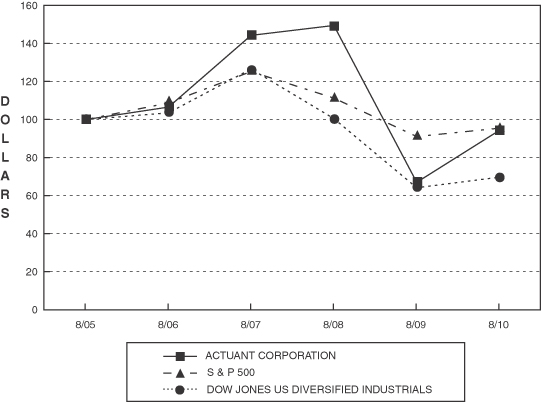
The graph below compares the cumulative 5-year total return of holders of Actuant Corporation’s common stock with the cumulative total returns of the S&P 500 index and the Dow Jones US Diversified Industrials index. The graph tracks the performance of a $100 investment in our common stock and in each of the indexes (with the reinvestment of all dividends) from August 31, 20042005 to August 31, 2009.2010.
COMPARISON OF 5 YEAR CUMULATIVE TOTAL RETURN*
Among Actuant Corporation, The S&P 500 Index
And The Dow Jones US Diversified Industrials Index
* $100 invested on 8/31/0405 in stock or index, including reinvestment of dividends.
Fiscal year ending August 31.
Copyright© 20092010 S&P, a division of The McGraw-Hill Companies Inc. All rights reserved.
Copyright© 20092010 Dow Jones & Co. All rights reserved.
| 8/04 | 8/05 | 8/06 | 8/07 | 8/08 | 8/09 | 8/05 | 8/06 | 8/07 | 8/08 | 8/09 | 8/10 | |||||||||||||||||||||||||
Actuant Corporation | $ | 100.00 | $ | 112.05 | $ | 119.42 | $ | 161.75 | $ | 167.56 | $ | 75.16 | $ | 100.00 | $ | 106.58 | $ | 144.36 | $ | 149.54 | $ | 67.07 | $ | 94.33 | ||||||||||||
S&P 500 | 100.00 | 112.56 | 122.56 | 141.11 | 125.38 | 102.50 | 100.00 | 108.88 | 125.36 | 111.40 | 91.06 | 95.53 | ||||||||||||||||||||||||
Dow Jones US Diversified Industrials | 100.00 | 103.25 | 106.88 | 130.70 | 103.78 | 66.24 | 100.00 | 103.52 | 126.59 | 100.52 | 64.16 | 69.71 | ||||||||||||||||||||||||
The stock price performance included in this graph is not necessarily indicative of future stock price performance.
Item 6. Selected Financial Data
The following selected historical financial data have been derived from the Consolidated Financial Statementsconsolidated financial statements of the Company. The data should be read in conjunction with these financial statements and “Management’s Discussion and Analysis of Financial Condition and Results of Operations.”
| Year Ended August 31, | Year Ended August 31, | |||||||||||||||||||||||||||||
| 2009 | 2008 | 2007 | 2006 | 2005 | 2010 | 2009 | 2008 | 2007 | 2006 | |||||||||||||||||||||
| (in millions, except per share data) | (in millions, except per share data) | |||||||||||||||||||||||||||||
Statement of Earnings Data(1)(2): | ||||||||||||||||||||||||||||||
Net sales | $ | 1,240 | $ | 1,613 | $ | 1,436 | $ | 1,187 | $ | 967 | $ | 1,161 | $ | 1,118 | $ | 1,446 | $ | 1,274 | $ | 1,041 | ||||||||||
Gross profit | 415 | 561 | 477 | 399 | 313 | 427 | 388 | 529 | 452 | 371 | ||||||||||||||||||||
Selling, administrative and engineering expenses | 276 | 331 | 279 | 235 | 187 | 268 | 250 | 298 | 247 | 207 | ||||||||||||||||||||
Restructuring charges | 22 | 10 | 5 | 5 | — | 15 | 19 | — | — | — | ||||||||||||||||||||
Impairment charges | 31 | — | — | — | — | — | 31 | — | — | — | ||||||||||||||||||||
Amortization of intangible assets | 20 | 14 | 11 | 7 | 5 | 22 | 20 | 14 | 10 | 7 | ||||||||||||||||||||
Operating profit | 65 | 206 | 182 | 152 | 121 | 122 | 68 | 217 | 195 | 157 | ||||||||||||||||||||
Earnings from continuing operations | 24 | 120 | 103 | 91 | 71 | 70 | 26 | 126 | 114 | 96 | ||||||||||||||||||||
Diluted earnings per share from continuing operations | 0.40 | 1.88 | 1.66 | 1.48 | 1.20 | $ | 0.97 | $ | 0.43 | $ | 1.98 | $ | 1.83 | $ | 1.56 | |||||||||||||||
Cash dividends per share declared | 0.04 | 0.04 | 0.04 | 0.04 | 0.04 | 0.04 | 0.04 | 0.04 | 0.04 | 0.04 | ||||||||||||||||||||
Balance Sheet Data(at end of period)(2): | ||||||||||||||||||||||||||||||
Total assets | $ | 1,568 | $ | 1,668 | $ | 1,501 | $ | 1,213 | $ | 996 | $ | 1,622 | $ | 1,568 | $ | 1,668 | $ | 1,501 | $ | 1,213 | ||||||||||
Total debt | 400 | 574 | 562 | 480 | 443 | 367 | 400 | 574 | 562 | 480 | ||||||||||||||||||||
| (1) |
| (2) | We have completed various acquisitions that impact the comparability of the selected financial data presented in the above table. The results of operations for these acquisitions are included in the selected financial data for the period subsequent to their acquisition date. The following table summarizes the significant acquisitions that were completed during the last five years: |
| Segment | Date Completed | Approximate Annual Sales(a) | |||||
| (in millions) | |||||||
The Cortland Companies | September 2009 | $ | 100 | ||||
Cortland Cable Company | Energy | ||||||
Sanlo, Inc. | Engineered Solutions | ||||||
Superior Plant Services, LLC | Energy | March 2008 | 25 | ||||
Templeton, Kenly & Co, Inc. | Industrial | September 2007 | 35 | ||||
BH Electronics, Inc. (b) | Electrical | July 2007 | 35 | ||||
T.T. Fijnmechanica B.V. | Industrial | April 2007 | 10 | ||||
Injectaseal Deutschland GmbH | Energy | January 2007 | 10 | ||||
Veha Haaksbergen B.V. | Industrial | January 2007 | 5 | ||||
Maxima Technologies | Engineered Solutions | December 2006 | 65 | ||||
Actown-Electrocoil, Inc. | Electrical | August 2006 | 35 | ||||
Precision Sure-Lock | Industrial | April 2006 | 25 | ||||
D.L. Ricci | Energy | April 2006 | 25 | ||||
B.E.P. Marine Ltd. | Electrical | December 2005 | 10 | ||||
Hydratight Sweeney | Energy | May 2005 | 50 | ||||
Hedley Purvis | Energy | January 2005 | 30 | ||||
Key Components, Inc. (“KCI”) | December 2004 | 220 | |||||
Power Distribution Products—Acme | Electrical | ||||||
Aerospace & Defense—Acme (b) | Engineered Solutions | ||||||
Air Handling / Turbocharger Components—Gits | Engineered Solutions | ||||||
Electrical Utility—Turner Electric | Electrical | ||||||
Flexible Shafts—B.W. Elliott | Engineered Solutions | ||||||
Specialty Electrical | Electrical | ||||||
A.W. Sperry Instruments | Electrical | December 2004 | 15 | ||||
Yvel S.A. | Engineered Solutions | September 2004 | 20 | ||||
| Segment | Date Completed | Approximate Annual Sales (a) | |||||
| (in millions) | |||||||
Selantic | Energy | June 2010 | $ | 10 | |||
Biach Industries | Energy | April 2010 | 5 | ||||
Hydrospex | Industrial | April 2010 | 25 | ||||
Team Hydrotec | Industrial | April 2010 | 5 | ||||
The Cortland Companies | September 2008 | ||||||
Cortland Cable Company | Energy | 75 | |||||
Sanlo, Inc. | Engineered Solutions | 25 | |||||
Superior Plant Services, LLC | Energy | March 2008 | 25 | ||||
Templeton, Kenly & Co, Inc. | Industrial | September 2007 | 35 | ||||
BH Electronics, Inc. | Electrical | July 2007 | 35 | ||||
T.T. Fijnmechanica B.V. | Industrial | April 2007 | 10 | ||||
Injectaseal Deutschland GmbH | Energy | January 2007 | 10 | ||||
Veha Haaksbergen B.V. | Industrial | January 2007 | 5 | ||||
Maxima Technologies | Engineered Solutions | December 2006 | 65 | ||||
Actown-Electrocoil, Inc. | Electrical | August 2006 | 35 | ||||
Precision Sure-Lock | Industrial | April 2006 | 25 | ||||
D.L. Ricci | Energy | April 2006 | 25 | ||||
B.E.P. Marine Ltd. | Electrical | December 2005 | 10 | ||||
| (a) | Represents approximate annual sales at the time of the completion of the transaction. |
Item 7. Management’s Discussion and Analysis of Financial Condition and Results of Operations
Background
As Discussed in Item 1, “Business,” we are a diversified global manufacturer of a broad range of industrial products and systems, organized into four reportable segments, Industrial, Energy, Electrical and Engineered Solutions. During the second quarter of fiscal 2009, our financial reporting segments were modified to reflect changes in the portfolio of businesses, due to acquisitions, as well as changes in business reporting lines. The Industrial segment is primarily involved in the design, manufacture and distribution of branded hydraulic and mechanical tools to the maintenance, industrial, infrastructure and production automation markets. The Energy segment provides joint integrity products and services, as well as umbilical, rope and cable solutions to the global oil & gas, power generation and energy markets. The Electrical segment is primarily involved in the design, manufacture and distribution of a broad range of electrical products to the retail DIY, wholesale, OEM, utility and harsh environment markets. The Engineered Solutions segment provides highly engineered position and motion control systems to OEMs in various vehicle markets, as well as a variety of other industrial products.
Business Update
DuringResults of operations for fiscal 2009, most2010 reflect improved sales trends, operating profit margin expansion driven by increased production volumes and savings from restructuring activities, strong cash flow generation, continued progress on restructuring projects and the completion of four tuck-in acquisitions. The following is a summary of the end markets that we serve saw sales declines as the overall economic environment continued to worsen. As a result of global economic uncertainties, significant declines in OEM production in vehicle and marine markets, decreased demand for electrical products, inventory destocking by industrial customers and delays in maintenance and capital projects in energy markets, we implemented various cost reduction programs across all four segments. These restructuring actions were initiated to reduce the impact of lower customer demand on our profitability. We incurred approximately $24 million of restructuring charges in fiscal 2009, closed or exited over twenty facilities and reduced headcount by approximately 20%. The significant deterioration of end market demand in the RV and harsh environment electrical markets also resulted in $58 million of non-cash goodwill and long-lived asset impairment charges during fiscal 2009. A summary of fiscal 2009 resultsrecent developments and trends by segment are as follows:in each of our segments:
Industrial: After a relatively strong first quarter of fiscal 2009 (core sales growth of 9%), economic conditions deteriorated dramatically, adversely impacting operating results in the Industrial segment during the remainder of fiscal 2009. Core sales declines, especially in the last two quarters of fiscal 2009, were broad based across the diverse end markets and geographic regions served. These declines in sales volumes coupled with restructuring charges and under-absorption of manufacturing overhead resulted in reduced year-over-year operating margins for the Industrial Segment.
Energy:Segment: Our Energy segment experienced sales growth in fiscal 2009 due to acquisitions (primarily the Cortland Companies) and core sales growth in the first three fiscal quarters. However, fourth quarter fiscal 2009 core sales declined 11% from the prior year, due to reduced demand in energy exploration markets and certain oil & gas installations deferring maintenance and capital projects. Operating margins in this segment have declined during fiscal 2009 as a result of unfavorable acquisition mix, reduced sales volumes and restructuring charges.
Electrical: Our Electrical segment experienced significant year-over-year core sales declines in each quarter of fiscal 2009 reflecting weak demand in retail DIY (due to sharp declines in consumer confidence), harsh environment electrical, transformer and utility markets. The significant sales declines necessitated considerable restructuring efforts to consolidate facilities, reduce headcount and exit low margin business. During the fourth quarter of fiscal 2009, we saw slight2010, the Industrial segment sales trend improved significantly, with core sales growth of 33% (compared to 20% core sales growth in the third quarter) driven by improved demand across all geographic regions. This segment continues to focus on driving sales growth through the introduction of new products, market share gains (penetration into emerging markets and geographies) and strategic acquisitions (including two business acquisitions completed during fiscal 2010). The considerable improvement in fourth quarter operating profit margins, despite unfavorable acquisition mix, was driven by increased sales levels, a reduced cost structure and the benefits from restructuring activities.
Energy Segment: Being a later cycle business, our Energy segment was the last of the four segments to be impacted by the global recession and generated core sales growth for the first three quarters of fiscal 2009. However, since then it has reported quarterly core sales declines in the 7% to 14% range. Similar to other energy service providers, sales trends forcontinue to be negatively impacted by the DIY channeldeferral of maintenance and capital spending activities by our customers, especially those in the refining business. In response to the reduced sales and profitability levels over the past several quarters, we initiated various restructuring actions to centralize certain selling and administrative functions and rationalize manufacturing operations within this segment. Despite the difficult market conditions that continue to exist in the Energy segment, operating profit margins (excluding restructuring costs) improved sequentially from the third to the fourth quarters of fiscal 2010.
Electrical Segment: The Electrical segment, which had experienced quarterly core sales declines since the first quarter of fiscal 2008, returned to positive core sales growth in the third and fourth quarters of fiscal 2010. The improvement in the core sales trend (7% core sales growth in the fourth quarter) was driven by improved end market demand from marine aftermarket (core sales were (19%)and transformer customers. Other served markets, including commercial construction and electric utilities, which are later cycle in nature, continue to be weak. In response to last year’s economic slow-down, this segment completed various actions to address its cost structure including reductions in workforce, consolidation of facilities and management, as well as product sourcing initiatives. The significant year-over-year and sequential improvement in operating profit (excluding restructuring costs) in the fourth quarter comparedare directly attributable to (30%) in the third quarter) and an improvement in operating margins as benefits fromthese restructuring programs were realized. During fiscal 2010, we will continue to focus on execution of restructuring programs in this segment to improve its operating performance.actions.
Engineered Solutions:Solutions Segment: Our Engineered Solutions segment core sales growth was hit hardest37% in the fourth quarter of fiscal 2010, which continued the recent trend of strong core sales growth. The improvement in core sales growth is the result of increased demand from vehicle OEMs (truck, auto and specialty) and prior year sales volumes being negatively impacted by significant inventory destocking by OEMs. A reduced cost
structure from previously completed restructuring actions and the unfavorableadditional sales volumes (improved absorption of manufacturing costs) resulted in incremental operating margins and higher profits during the fourth quarter.
Despite the challenging economic conditions that existed throughoutin early fiscal 2009. Significant declines in vehicle markets (including auto, truck, off-highway and specialty vehicle) have impacted this segment’s financial performance. The segment’s reduced operating margins were primarily due to lower sales volume, under-absorbed fixed overhead costs, non-cash impairment charges and restructuring charges. Significant restructuring actions have occurred in this segment, which are expected to improve margins and operating performance prospectively.
Despite these challenging economic conditions,2010, we continued to generate substantial cash flowflows from operations, including $147 million during fiscal 2009. This cash flow, coupled with $125 million of net proceeds fromdelivered improved financial results and completed key restructuring actions to reduce our cost structure and position the June 2009 follow-on equity offering and $38 million of net proceeds frombusiness for future growth as the divestiture of two businesses more than offset the $239 million of cash used to fund acquisitions.economy recovers. Our priorities in fiscal 20102011 include the continued strong executionpursuit of restructuring activities, investments instrategic acquisitions, cash flow generation and a focus on growth initiatives to capitalize on niche markets and cash flow generation.emerging economies, strengthen existing market positions and expand product offerings through new product development.
Results of Operations
Historical Financial Data (in millions)
| Year Ended August 31, | ||||||||||||||||||||||||||||||||||||||||||||
| 2009 | 2008 | 2007 | 2010 | 2009 | 2008 | |||||||||||||||||||||||||||||||||||||||
Statements of Earnings Data: | ||||||||||||||||||||||||||||||||||||||||||||
Net sales | $ | 1,240 | 100 | % | $ | 1,613 | 100 | % | $ | 1,436 | 100 | % | $ | 1,161 | 100 | % | $ | 1,118 | 100 | % | $ | 1,446 | 100 | % | ||||||||||||||||||||
Cost of products sold | 825 | 67 | % | 1,052 | 65 | % | 959 | 67 | % | 734 | 63 | % | 730 | 65 | % | 917 | 63 | % | ||||||||||||||||||||||||||
Gross profit | 415 | 33 | % | 561 | 35 | % | 477 | 33 | % | 427 | 37 | % | 388 | 35 | % | 529 | 37 | % | ||||||||||||||||||||||||||
Selling, administration and engineering expenses | 277 | 22 | % | 331 | 21 | % | 279 | 19 | % | |||||||||||||||||||||||||||||||||||
Selling, administrative, and engineering expenses | 268 | 23 | % | 250 | 22 | % | 298 | 21 | % | |||||||||||||||||||||||||||||||||||
Restructuring charges | 22 | 2 | % | 10 | 1 | % | 5 | 0 | % | 15 | 1 | % | 19 | 2 | % | — | 0 | % | ||||||||||||||||||||||||||
Impairment charges | 31 | 3 | % | — | 0 | % | — | 0 | % | — | 0 | % | 31 | 3 | % | — | 0 | % | ||||||||||||||||||||||||||
Amortization of intangible assets | 20 | 2 | % | 14 | 1 | % | 11 | 1 | % | 22 | 2 | % | 20 | 2 | % | 14 | 1 | % | ||||||||||||||||||||||||||
Operating profit | 65 | 5 | % | 206 | 13 | % | 182 | 13 | % | 122 | 11 | % | 68 | 6 | % | 217 | 15 | % | ||||||||||||||||||||||||||
Financing costs, net | 42 | 3 | % | 36 | 2 | % | 33 | 2 | % | 32 | 3 | % | 42 | 4 | % | 37 | 3 | % | ||||||||||||||||||||||||||
Other income, net | — | 0 | % | (3 | ) | 0 | % | — | 0 | % | ||||||||||||||||||||||||||||||||||
Other expense (income), net | 1 | 0 | % | (1 | ) | 0 | % | (2 | ) | 0 | % | |||||||||||||||||||||||||||||||||
Earnings from continuing operations before income tax expense (benefit) | 23 | 2 | % | 173 | 11 | % | 149 | 10 | % | |||||||||||||||||||||||||||||||||||
Income tax (benefit) expense | (1 | ) | 0 | % | 53 | 3 | % | 46 | 3 | % | ||||||||||||||||||||||||||||||||||
Earnings from continuing operations before income tax expense | 89 | 8 | % | 27 | 2 | % | 182 | 13 | % | |||||||||||||||||||||||||||||||||||
Income tax expense | 19 | 2 | % | 1 | 0 | % | 56 | 4 | % | |||||||||||||||||||||||||||||||||||
Earnings from continuing operations | 24 | 2 | % | 120 | 7 | % | 103 | 7 | % | 70 | 6 | % | 26 | 2 | % | 126 | 9 | % | ||||||||||||||||||||||||||
Earnings (loss) from discontinued operations, net of income taxes | (10 | ) | -1 | % | 3 | 0 | % | 2 | 0 | % | ||||||||||||||||||||||||||||||||||
Loss from discontinued operations, net of income taxes | (46 | ) | -4 | % | (12 | ) | -1 | % | (3 | ) | 0 | % | ||||||||||||||||||||||||||||||||
Net earnings | $ | 14 | 1 | % | $ | 123 | 8 | % | $ | 105 | 7 | % | $ | 24 | 2 | % | $ | 14 | 1 | % | $ | 123 | 9 | % | ||||||||||||||||||||
Other Financial Data: | ||||||||||||||||||||||||||||||||||||||||||||
Depreciation | $ | 31 | $ | 29 | $ | 25 | $ | 25 | $ | 30 | $ | 28 | ||||||||||||||||||||||||||||||||
Capital expenditures | 21 | 44 | 31 | 20 | 21 | 44 | ||||||||||||||||||||||||||||||||||||||
The comparability of the operating results for the fiscal years ended August 31, 2010, 2009 2008, and 20072008 has been significantly impacted by acquisitions. The financial results of operations for acquired businesses are included in our results of operations only since their respective acquisition dates. See Note 2, “Acquisitions” in Notesnotes to Consolidated Financial Statementsconsolidated financial statements for further discussion. In addition to the impact of acquisitions on operating results, foreign currency translation rates can also influence our reported results given that approximately half of our sales are denominated in currencies other than the USU.S. dollar. The strengthening of the US dollar
Consolidated net sales increased by approximately $43 million (4%) from $ 1,118 million in fiscal 2009 has unfavorably impacted resultsto $1,161 million in fiscal 2010. Excluding the $14 million of operations duesales from acquired businesses and the $12 million
favorable impact of foreign currency exchange rate changes, fiscal 2010 consolidated core sales increased 2% compared to the translation of non-US dollar denominated subsidiary results.
prior year. Consolidated net sales decreased by approximately $373$328 million, or 23%, from $ 1,613$1,446 million in fiscal 2008 to $1,240$1,118 million in fiscal 2009. Excluding the $64 million of sales from acquired businesses and the $94$76 million unfavorable impact of foreign currency exchange rate changes, fiscal 2009 consolidated core sales decreased approximately 23%. Consolidated net sales increased by approximately $177 million, or 12%, from $1,436 million in fiscal 200724% due primarily to $1,613 million in fiscal 2008. Excluding the $88 million of sales from acquired businesses and the $77 million favorable impact of foreign currency exchange rate changes, fiscal 2008 consolidated core sales increased approximately 1%.the recent recession. Changes in net sales at the segment level are discussed in further detail below.
Consolidated operating profit for fiscal 20092010 was $65$122 million, compared with $206$68 million and $182$217 million for fiscal 20082009 and 2007,2008, respectively. In addition to the impact of economic conditions, the comparability between periods is impacted by acquisitions, the $31 million non-cash impairment charge included in continuing operationsrecognized in fiscal 2009 and pre-tax restructuring charges of $24 million, $10$17 million and $5$21 million recognized in fiscal 2009, 20082010 and 2007,2009, respectively (see Note 4, “Restructuring” and Note 6 “Impairment Charges” in
Notes notes to Consolidated Financial Statementsconsolidated financial statements for further discussion). The changes in consolidated operating profit at the segment level are discussed in further detail below.
Most of our businesses and end markets started experiencing the impact of the economic downturn during the second quarter of fiscal 2009. In response to this slowdown in business, we took actions to address our cost structure, including workforce reductions, consolidation of facilities and the centralization of certain selling and administrative functions. Given the improved economic conditions in calendar 2010, the benefits of restructuring activities and the fact that we believe we have anniversaried the weakest point during the economic downturn, sales and profitability comparisons improved in the second half of fiscal 2010, reflecting the benefit of higher sales and improved profit margins.
Segment Results
Net Sales (in millions)
| Year Ended August 31, | Year Ended August 31, | ||||||||||||||||||||
| 2009 | 2008 | 2007 | 2010 | 2009 | 2008 | ||||||||||||||||
Industrial | $ | 287 | $ | 375 | $ | 279 | $ | 300 | $ | 287 | $ | 375 | |||||||||
Energy | 260 | 212 | 160 | 236 | 260 | 212 | |||||||||||||||
Electrical | 364 | 496 | 521 | 234 | 242 | 329 | |||||||||||||||
Engineered Solutions | 329 | 530 | 476 | 391 | 329 | 530 | |||||||||||||||
| $ | 1,240 | $ | 1,613 | $ | 1,436 | $ | 1,161 | $ | 1,118 | $ | 1,446 | ||||||||||
Fiscal 2010 compared to Fiscal 2009
Industrial Segment
Fiscal 2010 Industrial segment net sales increased by $13 million (5%) to $300 million, relative to the prior year. Excluding foreign currency rate changes (which favorably impacted sales comparisons by $6 million) and sales from acquired businesses, core sales decreased 1% during fiscal 2010. End markets in the Industrial segment were not significantly impacted by the global economic environment until the second quarter of fiscal 2009, and therefore fiscal 2010 core sales comparisons were unfavorable. However, sales levels and the core sales trend has improved significantly during the third and fourth quarters of fiscal 2010, primarily the result of increasing demand globally and comparatively lower sales levels in the prior year period (due to the impact of the recession in fiscal 2009).
Energy Segment
Energy segment net sales for fiscal 2010 were $236 million, a $24 million (9%) reduction compared to the prior year. Excluding sales from acquired businesses and foreign currency rate changes (which favorably impacted sales comparisons by $2 million), core sales decreased 10% during fiscal 2010. This decline reflects the
continued deferral of maintenance activities at certain existing oil & gas installations (especially in mature refinery markets) and lower capital project based revenue. The core sales trend has improved slightly during the second half of fiscal 2010 due to growth in emerging markets, alternative energy and adjacent markets.
Electrical Segment
Electrical segment net sales decreased by $8 million (3%) to $234 million in fiscal 2010. Foreign currency rate changes favorably impacted sales comparisons for fiscal 2010 by $2 million. Excluding foreign currency rate changes, core sales declined 4% for the year, reflecting lower demand in the first half of fiscal 2010 across all end markets, especially retail DIY, commercial construction and utility markets. However, the core sales trend has since improved, due to increased demand in early cycle markets including the marine and transformer markets.
Engineered Solutions Segment
Engineered Solutions segment net sales increased by $62 million (19%) to $391 million in fiscal 2010. Excluding the $2 million favorable impact of foreign currency rate changes and sales from acquired businesses, core sales increased 15% in fiscal 2010. The core sales increase was due to a strong rebound in demand in the Vehicle Systems product line (new automotive platforms, growth in China and Europe truck shipments and substantially higher recreational vehicle OEM production) and the impact of prior year inventory destocking by OEMs.
Fiscal 2009 compared to Fiscal 2008
Industrial Segment
Industrial segment net sales decreased by $88 million or 23%,(23%) from $375 million for fiscal 2008 to $287 million for fiscal 2009. Foreign currency rate changes negatively impacted sales comparisons for fiscal 2009 by $17 million. Excluding foreign currency rate changes and sales from the Templeton, Kenly & Co., Inc. (Simplex) acquisition, core sales declined 17%. The core sales decline reflects a significant weakening of end market demand across all geographic regions and customer inventory destocking.
Energy Segment
Energy segment net sales increased by $48 million or 22%,(22%) from $212 million for fiscal 2008 to $260 for fiscal 2009, reflecting core sales growth and the acquisitions of Superior Plant Services, LLC (“SPS”) in March 2008 and Cortland Cable Company (“Cortland”) in September 2008. Foreign currency rate changes on translated results negatively impacted sales comparisons for fiscal 2009 by $26 million. Excluding foreign currency rate changes and acquisitions, core sales increased 4% for fiscal 2009, reflecting increased market share and geographic expansion, which was partially offset by declining market conditions.
Electrical Segment
Electrical segment net sales decreased by $132$87 million or 27%,(27%) from $496$329 million for fiscal 2008 to $364$242 million for fiscal 2009. Foreign currency rate changes negatively impacted sales comparisons for fiscal 2009 by $21$3 million. Excluding foreign currency rate changes, core sales declined 23%26%, the result of substantially weaker demand in essentially all markets, driven by the global economic slowdown. Additionally, year-over-year comparisons are negatively affected by the loss of certain business with a major North Americanlarge DIY customer during the second half of fiscal 2008.
Engineered Solutions Segment
Engineered Solutions segment net sales decreased by $201 million or 38%,(38%) from $530 million for fiscal 2008 to $329 million for fiscal 2009. Foreign currency rate changes negatively impacted sales comparisons for fiscal
2009 by $30 million. Excluding foreign currency rate changes and sales from the Sanlo acquisition, core sales declined 37% for fiscal 2009. The core sales decline reflects sharply lower demandorders and production from vehicle OEMs serving the truck, automotive, RV, off-highway, construction and agricultural markets. Weak economic conditions globally and our customers’ inventory destocking resulted in a substantial reduction in customer production levels and adversely impacted our sales.
Operating Profit (in millions)
| Year Ended August 31, | ||||||||||||
| 2010 | 2009 | 2008 | ||||||||||
Industrial | $ | 66 | $ | 67 | $ | 114 | ||||||
Energy | 31 | 44 | 48 | |||||||||
Electrical | 20 | 4 | 35 | |||||||||
Engineered Solutions | 32 | (28 | ) | 51 | ||||||||
General Corporate | (27 | ) | (19 | ) | (31 | ) | ||||||
| $ | 122 | $ | 68 | $ | 217 | |||||||
Fiscal 20082010 compared to Fiscal 20072009
Industrial Segment
Industrial segment netoperating profit decreased by $1 million (2%) to $66 million for fiscal 2010. This decline in operating profit was primarily due to lower sales levels in the first half of fiscal 2010, $2 million of incremental restructuring costs in the current year (related to the consolidation of facilities), unfavorable acquisition mix and higher incentive compensation costs, somewhat offset by cost savings from restructuring actions.
Energy Segment
Energy segment operating profit decreased by $13 million (30%) to $31 million for fiscal 2010. Reduced operating profits are primarily due to lower sales volumes, unfavorable product mix and an additional $1 million of restructuring costs in fiscal 20082010, relative to the prior year period.
Electrical Segment
Electrical segment operating profit increased approximately $96by $16 million, or 34%, to $375 million from $279$20 million in fiscal 2007.2010, primarily as a result of the prior year period including a $5 million non-cash asset impairment charge related to the harsh environment electrical business and $2 million of incremental restructuring charges. Excluding sales fromthese charges, the three acquisitions completed sinceimprovement in operating profit primarily reflected restructuring related cost savings as we realized the beginningbenefits of fiscal 2007facility consolidations, reduced headcount and the $17movement of production and product sourcing to low cost countries.
Engineered Solutions Segment
Engineered Solutions segment operating profit increased by $60 million from an operating loss of $28 million in fiscal 2009 to an operating profit of $32 million in fiscal 2010. The loss from operations in fiscal 2009 included a $27 million non-cash asset impairment charge related the RV business and an incremental $5 million of restructuring charges, relative to the current year. Excluding these charges, operating profit improved during fiscal 2010 due to increased sales and production levels (higher absorption of fixed manufacturing costs), favorable product mix, the benefits of completed restructuring activities and the favorable impact of foreign currency rate changes, core sales grew 12% in 2008. The sales increase reflects a continuation of strong global demand for high force hydraulic and mechanical tools provided across all markets served, along with modest price increases.which were partially offset by increased incentive compensation costs.
Energy Segment
General Corporate
Energy segment net sales for 2008General Corporate expenses increased approximately $52by $8 million or 32%,(43%) to $212 million from $160$27 million in fiscal 2007, reflecting core sales2010 due to investments in growth and sales added from the two acquisitions completed since the beginning of fiscal 2007. Excludinginitiatives, transaction costs for business acquisitions and the $5 million favorable impact of foreign currency rate changes, core sales increased 18%, reflecting market share gains and continued strong demand for our joint integrity products, rental assets and manpower services across the global energy market.
Electrical Segment
Electrical segment net sales in fiscal 2008 decreased approximately $25 million, to $496 million from $521 million in fiscal 2007. Excluding the $24 million favorable impact of foreign currency rate changes, core sales declined 9% in 2008, the result of lower demand in the retail DIY, transformer and marine markets. Approximately 65% of the Electrical segment sales are generated in North America, where economic conditions started to weaken since August 31, 2007, partially reflecting a sharp decline in consumer confidence. Year-over-year comparisons were also negatively affectedannual incentive compensation costs, somewhat offset by the lossbenefits of business with a major North American DIY customercost reduction efforts and our strategic decision to exit low margin products in our European Electrical business.reduced discretionary spending.
Engineered Solutions Segment
Engineered Solutions segment net sales in fiscal 2008 increased approximately $54 million, or 11%, to $530 million from $476 million in fiscal 2007. Excluding the $32 million favorable impact of foreign currency rate changes and sales added from the Maxima Technologies acquisition, core sales were flat. This reflected the net impact of lower vehicle market sales volume, offset by strong demand in the container hardware and truck markets. Vehicle market sales volume declined as a result of lower sales to RV OEM’s due to weak consumer demand, which was partially offset by strong truck demand in Europe.
Operating Profit (in millions)
| Year Ended August 31, | ||||||||||||
| 2009 | 2008 | 2007 | ||||||||||
Industrial | $ | 67 | $ | 114 | $ | 86 | ||||||
Energy | 44 | 48 | 35 | |||||||||
Electrical | 1 | 24 | 37 | |||||||||
Engineered Solutions | (28 | ) | 51 | 45 | ||||||||
General Corporate | (19 | ) | (31 | ) | (21 | ) | ||||||
| $ | 65 | $ | 206 | $ | 182 | |||||||
Fiscal 2009 compared to Fiscal 2008
Industrial Segment
Industrial segment operating profit decreased by $47 million or 41%,(41%) from $114 million for fiscal 2008 to $67 million for fiscal 2009. Excluding the Simplex acquisition and the unfavorable impact of foreign currency rate changes, operating profit declined by 35% for fiscal 2009. This decline was due to lower sales, $4 million of restructuring charges and reduced profit margins, the latter of which resulted from unfavorable product mix and lower absorption of manufacturing costs due to lower production levels.
Energy Segment
Energy segment operating profit decreased by $4 million or 8%,(8%) from $48 million for fiscal 2008 to $44 million for fiscal 2009. Excluding the SPS and Cortland acquisitions and the unfavorable impact of foreign currency rate changes, operating profit for fiscal 2009 decreased 3%, which was primarily the result of $1 million of restructuring charges.
Electrical Segment
Electrical segment operating profit decreased by $23$31 million from $24$35 million for fiscal 2008 to $1$4 million for fiscal 2009. Fiscal 2009 operating profit was adversely impacted by $5 million of non-cash impairment charges related to the harsh environment electrical business and $10$7 million of restructuring charges. Similarly, fiscal 2008 operating profit included $10 million of European Electrical restructuring charges. Excluding these charges, the decline in operating profit for fiscal 2009 resulted from lower sales volumes and profit margins.
Engineered Solutions Segment
Engineered Solutions segment operating profit decreased by $79 million from $51 million for fiscal 2008 to an operating loss of $28 million for fiscal 2009. The operating results for fiscal 2009 waswere adversely impacted by $8 million of restructuring costs and a $27 million non-cash RV goodwill and intangible asset impairment charge. Fiscal 2009 operating results were also significantly impacted by lower sales and production levels (resulting in decreased absorption of fixed costs) and the unfavorable impact of foreign currency rate changes.
General Corporate
General Corporate expenses decreased by $12 million or 39%,(39%) from $31 million for fiscal 2008 to $19 million for fiscal 2009 due to lower incentive compensation expense, headcount reductions and the benefit of other General Corporate cost reduction efforts.
Fiscal 2008 compared to Fiscal 2007
Industrial Segment
Industrial segment operating profit in fiscal 2008 increased approximately $28 million, or 32%, to $114 million from $86 million in fiscal 2007. Excluding the favorable impact of foreign currency rate changes, operating profit rose by 25%. Operating profit grew as a result of increased sales volumes from existing businesses, higher production levels resulting in increased absorption of fixed costs, customer price increases, acquisitions, operating efficiencies resulting from continuous improvement initiatives and the favorable impact of foreign exchange rates. Partially offsetting these improvements were unfavorable sales and acquisition mix, higher intangible asset amortization and incentive compensation expense, increased raw material costs and investments in sales and marketing initiatives.
Energy Segment
Energy segment operating profit in fiscal 2008 increased approximately $13 million, or 37%, to $48 million from $35 million in fiscal 2007. Excluding the favorable impact of foreign currency rate changes, operating profit rose by 32%. Operating profit grew as a result of acquisitions, increased sales volumes in existing businesses, favorable sales mix and operating efficiencies, which were partially offset by higher intangible amortization, incentive compensation and investments in growth initiatives.
Electrical Segment
Electrical segment operating profit was $24 million in fiscal 2008, a $13 million decline from fiscal 2007. Excluding the favorable impact of foreign currency rate changes on translated results, operating profit declined by 19%. The lower profit resulted from lower sales, decreased production levels, European Electrical restructuring costs and other downsizing costs and unfavorable sales mix.
Engineered Solutions Segment
Engineered Solutions operating profit increased by $6 million, or 13%, from $45 million in fiscal 2007 to $51 million for fiscal 2008. The operating profit growth was due to higher sales volumes, the Maxima acquisition, customer price increases, the favorable impact of foreign currency rate changes and increased low cost country sourcing. Partially offsetting these items were facility consolidation costs, material cost increases and higher incentive compensation expense.
General Corporate
General Corporate expenses increased by approximately $10 million, to $31 million in fiscal 2008, the result of business expansion, higher incentive compensation and training expenses, tax consulting fees and start-up costs related to our new facility in Taicang, China.
Restructuring Charges
DuringIn fiscal 2010 and 2009, wethe Company committed to various restructuring initiatives including workforce reductions, plant consolidations to reduce manufacturing overhead, the continued movement of production and product sourcing to low cost countries and the centralization of certain supportselling and administrative functions. The totalTotal restructuring chargescosts for these activities were $24$17 million and $21 million for fiscal 2009. We estimate we will incur an additional $10-$12 million of restructuring charges in fiscal 2010.the year ended August 31, 2010 and 2009, respectively. We believe these restructuring actions, which were substantially complete by August 31, 2010, will better align our resources with strategic growth opportunities, optimize existing manufacturing
capabilities, improve our overall cost structure and deliver increased free cash flow and profitability. These restructuring actions are expected to generate $45 million of annual cost savings. See Note 4, “Restructuring” in the Notesnotes to the Consolidated Financial Statementsconsolidated financial statements for further discussion on restructuring charges.
During the second quarter of fiscal 2008, we completed a specific restructuring plan in our European Electrical business (Electrical segment), at a cumulative pre-tax cost of $21 million.discussion.
Impairment Charges
Significant adverse developments in the RV market during the first quarter of fiscal 2009, including sharply lower wholesale motorhome shipments by OEMs,OEM’s, decreased consumer confidence and the lack of financing available to RV dealers and retail customers negatively impacted the financial results of our RV business. As a result, during the first quarter of fiscal 2009, we recognized a $27 million non-cash impairment charge related to the goodwill and long-lived assets of the RV business. Poorbusiness (Engineered Solutions Segment).
Difficult economic conditions, low consumer confidence, increased unemployment and tight credit markets haveduring the third quarter of fiscal 2009, also negatively impacted consumer discretionary spending, resulting in a substantial reduction in recreational boating industry sales. During 2009, OEM boat builders responded to the
sharp drop in demand and high levels of finished goods inventory by temporarily suspending operations as well as eliminating brands and permanently closing facilities. As a result, in the third quarter of fiscal 2009, we recognized a $32 million non-cash asset impairment charge ($5 million included in continuing operations and $27 million included in discontinued operations) related to the goodwill, indefinite lived intangibles and long-lived assets of the harsh environment electrical businesses (includedbusiness (Electrical Segment). Approximately $27 million of the impairment charge is included in the Electrical Segment).Loss from Discontinued Operations. See Note 6, “Impairment Charges” in the Notesnotes to consolidated financial statements for further discussion.
As a result of an overall weak European economy, low consumer confidence and reduced demand in the Consolidated Financial Statementsretail DIY markets, the Company committed to a plan to divest its European Electrical business during the fourth quarter of fiscal 2010. The European Electrical business designs, manufactures and markets electrical sockets, switches and other tools and consumables, predominately in the European DIY retail market. This planned divestiture is also part of the Company’s portfolio management process to focus on businesses that create the most shareholder value. As a result, a $36 million non-cash asset impairment charge was recognized in the fourth quarter of fiscal 2010 to adjust the carrying value of the asset group to fair value. See Note 3, “Discontinued Operations” in the notes to consolidated financial statements for further discussion.
Financing Costs, Net
All debt is considered to be for general corporate purposes and therefore financing costs have not been allocated to our segments. The $6$10 million year-over-year increasedecrease in financing costs in fiscal 2009 reflected higher2010 reflects substantially lower average debt levels resulting from acquisitions, higher borrowing spreads pursuant to the amended credit agreement, as well as the write-off of $2 million of deferred financing costs due to the early extinguishment of our credit agreement term loan in the fourth quarter of fiscal 2009.and reduced interest rates on variable rate debt.
Income Tax Expense
Our income tax expense is impacted by a number of factors, including the amount of taxable earnings derived in foreign jurisdictions with tax rates that are higher or lower than the U.S. federal statutory rate, state tax rates in the jurisdictions where we do business, tax minimization planning and our ability to utilize various tax credits and net operating loss carryforwards. The effective income tax rate forwas 21.1% in fiscal 2010, compared to 2.3% and 31.0% in fiscal 2009 was (2.0%), compared to 31.0% and 30.7%2008, respectively. The income tax expense recognized in fiscal 20082010 benefited from foreign tax credits, increased taxable earnings in foreign jurisdictions (with statutory tax rates lower than the U.S. statutory rate) and 2007, respectively.favorable changes in valuation allowances offset somewhat by unfavorable provision to return adjustments and additional provisions for unrecognized tax benefits. The decrease in the effective tax rate in fiscal 2009, relative to the prior years,fiscal 2008, reflects the tax benefit on the impairment charges (Note 6, “Impairment Charges”) and restructuring charges (Note 4, “Restructuring”) being recognized at the domestic tax rate which is higher than our consolidated global effective tax rate. In addition, the effective income tax rate for fiscal 2009 includes the benefit of income tax reserve adjustments resulting from settling tax audits for amounts less than previously accrued and the lapsing of various tax statutes of limitations.
Discontinued Operations
As a result of our plan to divest the European Electrical business, the assets and liabilities of the business are considered held for sale at August 31, 2010 and therefore the financial results are reported as discontinued operations in the consolidated financial statements. Discontinued operations also reflect the results of the Acme Aerospace and BH Electronics, Inc. businesses, which were divested in the fourth quarter of fiscal 2009 for net cash proceeds of $38 million. See Note 3 “Discontinued Operations” in the Notesnotes to the Consolidated Financial Statementsconsolidated financial statements for further information. The following table summarizes the results of discontinued operations for the divested businesses (in millions):
| Year Ended August 31, | ||||||||||
| 2009 | 2008 | 2007 | ||||||||
Net sales | $ | 24 | $ | 51 | $ | 23 | ||||
Net gain on disposal | 18 | — | — | |||||||
Earnings (loss) from operations of divested businesses (1) | (31 | ) | 5 | 3 | ||||||
Income tax expense (benefit) | (3 | ) | 2 | 1 | ||||||
Earnings (loss) from discontinued operations, net of income tax | $ | (10 | ) | $ | 3 | $ | 2 | |||
| Year Ended August 31, | ||||||||||||
| 2010 | 2009 | 2008 | ||||||||||
Net sales | $ | 106 | $ | 146 | $ | 218 | ||||||
Net gain on disposal | — | 18 | — | |||||||||
Loss from operations of discontinued businesses (1) | (41 | ) | (34 | ) | (4 | ) | ||||||
Income tax expense (benefit) | 5 | (4 | ) | (1 | ) | |||||||
Loss from discontinued operations, net of income tax | $ | (46 | ) | $ | (12 | ) | $ | (3 | ) | |||
| (1) |
Liquidity and Capital Resources
The following table summarizes the cash flow attributable to operating, investing and financing activities for the three years ended August 31, 20092010 (in millions):
| Year Ended August 31, | Year Ended August 31, | |||||||||||||||||||||||
| 2009 | 2008 | 2007 | 2010 | 2009 | 2008 | |||||||||||||||||||
Net cash provided by operating activities | $ | 147 | $ | 170 | $ | 177 | $ | 121 | $ | 147 | $ | 170 | ||||||||||||
Net cash used in investing activities | (221 | ) | (140 | ) | (190 | ) | (57 | ) | (221 | ) | (140 | ) | ||||||||||||
Net cash provided by (used in) financing activities | (30 | ) | 5 | 72 | (37 | ) | (30 | ) | 5 | |||||||||||||||
Effect of exchange rates on cash | (7 | ) | 1 | 2 | ||||||||||||||||||||
Effect of exchange rate changes on cash | 2 | (7 | ) | 1 | ||||||||||||||||||||
Net increase (decrease) in cash and cash equivalents | $ | (111 | ) | $ | 36 | $ | 61 | $ | 29 | $ | (111 | ) | $ | 36 | ||||||||||
In fiscal 2010, cash flows from operating activities were $121 million. Excluding the $37 million negative impact on working capital due to the expiration of the accounts receivable securitization program, net cash provided by operating activities increased relative to the prior year as a result of increased earnings from continuing operations, effective working capital management and the receipt of income tax refunds. These operating cash flows and the $8 million of proceeds from the sale of a portion of the European Electrical product line in the second quarter, funded $46 million of acquisitions and $20 million of capital expenditures, while reducing net debt by $67 million.
Effective cash flow management during fiscal 2009 resulted in substantial cash flow from operating activities of $147 million and an improved financial position at August 31, 2009. Operating cash flows benefited from lower working capital requirements, especially accounts receivable, given the decline in sales levels. During fiscal 2009, cash flows from operations, along with the $125 million proceeds from the follow-on equity offering and $38 million of proceeds from the divestiture of two businesses, funded $239 million of strategic acquisitions (including the acquisition of the Cortland Companies), $21 million of capital expenditures and a net reduction in debt of $147 million.
In fiscal 2008, we generated $170 million of cash from operating activities, driven by net earnings of $122 million, which included non-cash expenses (principally depreciation and amortization) of $57 million. The net
earnings were somewhat offset by additional working capital requirements of $9 million. These operating cash flows funded our $44 million of capital expenditures and $110 million of capital deployment in two strategic acquisitions. Cash provided by financing activities was $5 million in fiscal 2008, consisting primarily of proceeds and the related tax benefits from stock option exercises. Borrowings on the revolving credit facility during fiscal 2008 were repaid by August 31, 2008.
In fiscal 2007, cash and cash equivalents increased $61 million as a result of strong free cash flow conversion. Record cash flows from operating activities of $177 million and the $72 million of cash provided from financing activities funded the $31 million of capital expenditures and the $163 million we paid to consummate strategic acquisitions. Operating cash flows benefited from $104 million of net earnings including $51 million of non-cash expenses and a $22 million reduction in working capital. The financing activities in fiscal 2007 primarily included proceeds from term loans and the $250 million Senior Note offering, offset by repayments of term loans.
Primary Working Capital Management
We use primary working capital (“PWC”) as a percentage of sales as a key indicator of working capital management. We define this metric as the sum of net accounts receivable, outstanding balances on the accounts receivable securitization facility, and net inventory less accounts payable, divided by the past three months sales annualized. The following table shows the components of the metric (amounts in millions):
| August 31, 2009 | August 31, 2008 | |||||||||||||
| $ | PWC % | $ | PWC % | |||||||||||
Accounts receivable, net | $ | 156 | $ | 227 | ||||||||||
Accounts receivable securitization | 37 | 53 | ||||||||||||
Total accounts receivable | 193 | 16 | % | 280 | 17 | % | ||||||||
Inventory, net | 161 | 14 | % | 215 | 13 | % | ||||||||
Accounts payable | (108 | ) | (9 | %) | (167 | ) | (10 | %) | ||||||
Net primary working capital | $ | 246 | 21 | % | $ | 328 | 20 | % | ||||||
Accounts receivable, net Accounts receivable securitization Total accounts receivable Inventory, net Accounts payable Net primary working capital August 31, 2010 August 31, 2009 $ PWC % $ PWC % $ 186 $ 156 — 37 186 15 % 193 16 % 146 12 % 161 14 % (130 ) (11 %) (108 ) (9 %) $ 202 16 % $ 246 21 %
Our net primary working capital percentage increased slightlydecreased year-over-year from 20%21% to 21% primarily as a16%, the combined result of the significant decreaseincrease in sales duringand the three months ended August 31, 2009 relativecontinued focus on effective working capital management. Excluding acquisitions and changes in foreign currency exchange rates, accounts receivable increased $15 million and inventory increased $8 million (due to the comparable periodaccelerated ramp up in the prior year. Despite the minor increaseproduction and improved economic conditions in PWC percentage, significant progress was made during fiscal 2009 to reduce working capital including a reduction in both accounts receivable and inventory. Accounts receivable balances, including amounts outstanding on the accounts receivable securitization facility, decreased $87 million during fiscal 2009 as a result of lower sales levels and increased collection efforts, while inventory levels declined $54 million during the same period, as a result of lower production levels and our efforts to destock inventory as demand incertain end markets slowed. The reduction in inventory levels also lead to a decrease in purchasing activity and tradewe serve), while accounts payable balances which declined $59 million in fiscal 2009.increased $32 million.
Liquidity
On June 10, 2009, we amended our existingThe Senior Credit Facility, to provide additional flexibility with respect to financial covenants. The amendment modified certain terms and financial covenants, increased the borrowing spread throughwhich matures on November 30, 2009 (from LIBOR plus 2.50% to LIBOR plus 3.75%, with subsequent increases or decreases based on the actual leverage ratio), increased the non-use fee to 0.5% and10, 2011, consists of a $400 million revolving credit facility, is secured by substantially all of our domestic personal property assets. The amended Senior Credit Facility, which matures on November 10, 2011, maintained the original borrowing capacity with a $400 million revolving credit facilityassets and $115 million term loan (the term loan was repaid in the fourth quarterbears interest of 2009 with proceeds from the follow-on equity offering)LIBOR plus 3.25%. The two financial covenants included in the amended Senior Credit Facility agreement are a maximum leverage ratio (which was increased from its then current limit of 3.5:1 to 4.0:1 through August 31, 2009 and to 4.5:1 through February 28, 2010, declining quarterly to 3.5:1 by November 30, 2010) and a minimum fixed charge coverage ratio (which was reduced from 1.75:1 toof 1.65:1).1. We were in compliance with all debt covenants as ofat August 31, 2009, and based on our forecast, continued compliance is expected through the term of the agreement. Our ability to comply with the covenants in the future depends on the global economy, credit market conditions and other factors.2010.
Holder’sHolders of our 2% Convertible Notes have the option to require us to repurchase, for cash, all or a portion of the 2% Convertible Notes for cash on November 15, 2010, November 15, 2013 and November 15, 2018 at a repurchase price equal to 100% of the principal amount of the notes, plus accrued interest. If certain conditions are met, holders may also convert the 2% Convertible Notes into shares of our common stock prior to the scheduledNovember 2023 maturity date. In addition, we may redeem all or part of the 2% Convertible Notes on or after November 20, 2010 at a cash redemption price equal to 100% of the principal amount, plus accrued interest. Any repurchasesWe will fund any “put” of the 2% Convertible Notes will be funded through existing cash and cash equivalents and availabilityrevolver borrowings under the Senior Credit Facility. In Augustthe fourth quarter of fiscal 2009 we repurchased on the open market $9 million of 2% Convertible Notes and during the first quarter of fiscal 2010, we repurchased an additional $23 million of 2% Convertible Notes. See Note 8, “Debt” in the notes to consolidated financial statements for cash.further discussion of the repurchases.
At August 31, 20092010, we had $11$40 million of cash and cash equivalents and $286no borrowings under our $400 million revolver. Approximately $325 million of the revolver was available liquidity under our Senior Credit Facility.for borrowing, based on credit agreement terms. We believe that thethis cash and revolver availability, under the Senior Credit Facility, combined with our existing cash on hand and funds generated from operations will be adequate to meet operating, debt service, acquisition funding and capital expenditure requirements for the foreseeable future. Senior Credit Facility borrowings increased subsequent to August 31, 2009 to fund the increased working capital requirements associated with the expiration of our accounts receivable securitization program on September 8, 2009 (see Note 5, “Accounts Receivable Securitization”) and the repurchase of an additional $23 million of 2% Convertible Notes (see Note 8, “Debt”).
Seasonality and Working Capital
We have met our working capital and capital expenditure requirements through a combination of operating cash flow and availability under our Senior Credit Facility. Although there are modest seasonal factors within certain of our businesses, on a consolidated basis, we do not experience material changes in seasonal working capital or capital resource requirements.
Our receivables are derived from a diverse customer base in a number of industries. We have noNo single customer which generated 5% or greatermore of fiscal 2010, 2009 and 2008 net sales.
Capital Expenditures
The majority of our manufacturing activities consist of the assembly of components which are sourced from a variety of vendors. We believe that our capital expenditure requirements are not as extensive as many other industrial companies given the assembly nature of our operations. Capital expenditures were $20 million, $21 million $44 million and $31$44 million in fiscal 2010, 2009 2008 and 2007,2008, respectively. Capital expenditures have historically been funded by operating cash flows and borrowings under the Senior Credit Facility. Reduced capital expenditures in fiscal 2009 resulted from a focused strategy to manage cash flows. Fiscal 2008 capital expenditures were unusually high and relateddue to the construction of a $15our new $17 million China manufacturing facility in Taicang, China.facility. Capital expenditures for fiscal 20102011 are expected to be approximately $20 – $25 million.
Commitments and Contingencies
We lease certain facilities, computers, equipment and vehicles under various operating lease agreements, generally over periods from one to twenty years. Under most arrangements, we pay the property taxes, insurance, maintenance and expenses related to the leased property. Many of the leases include provisions that enable us to renew the lease based upon fair value rental rates on the date of expiration of the initial lease. See Note 10, “Leases,” in the Notesnotes to Consolidated Financial Statementsconsolidated financial statements and the “Contractual Obligations” table below for further information.
We are contingently liable for certain lease agreements held by businesses included in our former Electronics segment, which was spun-off to shareholders in fiscal 2000. Some of these businesses were subsequently sold to third parties. If any of these businesses do not fulfill their obligations under the leases, we could be liable for such leases. The present value of future minimum lease payments for these leases was $5$3 million at August 31, 2009.2010.
We had outstanding letters of credit oftotaling $9 million and $6 million at August 31, 20092010 and 2008,2009, respectively, the majority of which secure self-insured workers compensation liabilities.
Off-Balance Sheet Arrangements
As more fully discussed in Note 5, “Accounts Receivable Securitization” in the Notesnotes to Consolidated Financial Statements,consolidated financial statements, we were a party to an accounts receivable securitization arrangement at August 31, 2009. Tradewhereby we sold certain trade receivables to a wholly owned bankruptcy-remote special purpose subsidiary, which in turn, sold and being serviced by us were $37 million and $53 million at August 31, 2009 and 2008, respectively.participating interests in the receivables to a third party financial institution. We did not renew the accounts receivable securitization program on its scheduledSeptember 9, 2009 maturity date of September 8, 2009 and, as a result, we utilized availability under the Senior Credit Facility to financefund the corresponding $37 million growthincrease in accounts receivable.
Contractual Obligations
The timing of payments due under our contractual commitments is as follows (in millions):
| Payments Due | Payments Due | ||||||||||||||||||||||||||||||||||||||||||||||||
| 2010 | 2011 | 2012 | 2013 | 2014 | Thereafter | Total | 2011 | 2012 | 2013 | 2014 | 2015 | Thereafter | Total | ||||||||||||||||||||||||||||||||||||
Long-term debt | $ | — | $ | 118 | $ | 33 | $ | — | $ | — | $ | 249 | $ | 400 | $ | — | $ | 118 | $ | — | $ | — | $ | — | $ | 249 | $ | 367 | |||||||||||||||||||||
Interest on long-term debt | 21 | 19 | 17 | 17 | 17 | 48 | 139 | 20 | 18 | 17 | 17 | 17 | 31 | 120 | |||||||||||||||||||||||||||||||||||
Operating leases | 21 | 14 | 11 | 9 | 8 | 28 | 91 | 18 | 14 | 12 | 9 | 7 | 22 | 82 | |||||||||||||||||||||||||||||||||||
Acquisition purchase price payable | 1 | — | 6 | — | — | — | 7 | ||||||||||||||||||||||||||||||||||||||||||
| $ | 42 | $ | 151 | $ | 61 | $ | 26 | $ | 25 | $ | 325 | $ | 630 | $ | 39 | $ | 150 | $ | 35 | $ | 26 | $ | 24 | $ | 302 | $ | 576 | ||||||||||||||||||||||
The above table excludes potential payments for acquisition earn-out payments, as the exact amountincludes deferred purchase price and timing of payments is not known.contingent consideration related to acquisitions, completed in fiscal 2010 and previous years. We made earn-out payments on past acquisitions totaling $2 million, $1 million $5 million, and $2$5 million in fiscal 2010, 2009 2008 and 2007,2008, respectively. For further information see Note 2, “Acquisitions” in the Notes of the Consolidated Financial Statements.
We have long-term obligations relatednotes to our deferred compensation, pension and postretirement plans at August 31, 2009. Our expected future contributions to these plans are provided in Note 11, “Employee Benefit Plans” in the Notes of the Consolidated Financial Statements.consolidated financial statements.
The contractual obligation schedule for long-term debt assumes we willdo not call the remaining 2% Convertible Notes or will have the notesthem put back to us in fiscal 2011. For further information, see Note 8, “Debt.” Interest for floating rate debt instruments, as calculated above, assumes August 31, 2009 interest rates remain constant.“Debt” in the notes to consolidated financial statements.
Our purchaseoperating lease obligations generally relate to amounts due under contracts with third party service providers. These contracts are primarily for real estate leases, information technology services including(including software and hardware support services and leasesleases) and telecommunications services. Those purchase obligations such as leases, that are not cancelable are included in the table.
We routinely issue purchase orders to numerous vendors for the purchase of inventory and other supplies. These purchase orders are generally cancelable with reasonable notice to the vendor, and as such, they are excluded from the contractual obligations table.
We have long-term obligations related to our deferred compensation, pension and postretirement plans at August 31, 2010 (excluded from the contractual obligations table). Our liabilities related to these plans are summarized in Note 11, “Employee Benefit Plans” in the notes to consolidated financial statements.
As discussed in Note 12 “Income Taxes” in the Notes of the Consolidated Financial Statements,notes to consolidated financial statements, we have unrecognized tax benefits of $29 million and $30$28 million at August 31, 2009 and 2008, respectively.2010. The liability for unrecognized tax benefits was not included in the table of contractual obligations above because the timing of the settlements of these uncertain tax positions cannot be reasonably estimated at this time.estimated.
Raw Material Costs and Inflation
We source a wide variety of materials and components from a network of global suppliers. While such materials are typically available from numerous suppliers, commodity raw materials, such as steel, plastic resin and copper, are subject to price fluctuations, which could have a negative impact on our results. Additionally, many of our components are sourced from low cost countries, in currencies different than the functional currency of the acquiring business. Potential changes in exchange rates also create variations in material costs that could reduce our profitability. We strive to offset such cost inflation by price increases to customers and driving operational cost reductions and improvement. We also selectively utilize commodity derivative contracts to hedge against changing raw material prices. However we did not have any significant derivative contracts in place at August 31, 20092010 or 2008.2009. See our Risk Factors for additional information on the Company’s commodity risks.
No meaningful measures of inflation are available because we have significant operations in countries with diverse rates of inflation and currency rate movements. However, we believe that the overall rate of inflation in recent years has been relatively low and has not had a significant effect on our results of operations, after factoring in price increases and other manufacturing cost reductions.
Critical Accounting Policies
We prepare our consolidated financial statements in conformity with U.S. generally accepted accounting principles (“GAAP”). This requires management to make estimates and assumptions that affect reported amounts and related disclosures. Actual results could differ from those estimates. The following policies are considered by management to be the most critical in understanding the judgments that are involved in the preparation of our consolidated financial statements and the uncertainties that could impact our results of operations, financial position and cash flows.
Inventories: Inventories are stated at the lower of cost or market. Inventory cost is determined using the last-in, first-out (“LIFO”) method for a portion of U.S. owned inventory (approximately 22%24% and 21%22% of total inventories at August 31, 20092010 and 2008,2009, respectively). The first-in, first-out or average cost method is used for all other inventories. If the LIFO method were not used, the inventory balance would be higher than the amount in the Consolidated Balance Sheetconsolidated balance sheet by approximately $5 million and $7 million at both August 31, 20092010 and 2008, respectively.2009. We perform an analysis of the historical sales usage of the individual inventory items on hand and a reserve is recorded to adjust inventory cost to market value. The inventory valuation assumptions used are based on historical experience. We believe that such estimates are made based on consistent and appropriate methods; however, actual results may differ from these estimates under different assumptions or conditions.
Goodwill and Long-Lived Assets: Goodwill is tested for impairment annually, or more frequently if events or changes in circumstances indicate that the asset might be impaired. We perform impairment reviews for our reporting units using a fair-valuefair value method based on our judgments and assumptions. The estimated fair value represents the amount at which a reporting unit could be bought or sold in a current transaction between willing parties on an arms-length basis. In estimating the fair value, we use a discounted cash flow model.model, which is dependent on a number of assumptions including estimated future revenues and expenses, weighted average cost of capital, capital expenditures and other variables. The estimated fair value is compared with the carrying amount of the reporting unit, including goodwill. The annual impairment testing performed at August 31, 20092010 for continuing operations indicated that the estimated fair value of each reporting unit exceeded its corresponding carrying amount and, as such, no impairment existed. Indefinite lived intangible assets are also subject to annual impairment testing. On an annual basis, the fair value of the indefinite lived assets, based on a relief of royalty model, are evaluated to determine if an impairment charge is required. We also review long-lived assets for impairment when events or changes in business circumstances indicate that the carrying amount of the assets may not be fully recoverable. If such indicators are present, we perform undiscounted operating cash flow analyses to determine if an impairment exists. If an impairment is determined to exist, any related impairment loss is calculated based on fair value. Refer to Note 3, “Discontinued Operations” and Note 6, “Impairment Charges” in the Notesnotes to the Consolidated Financial Statementsconsolidated financial statements for further discussion on impairment charges recognized in fiscal 2009.discussion.
A considerable amount of management judgment and assumptions are required in performing the impairment tests, principally in determining the fair value of each reporting unit and the indefinite lived intangible assets. While we believe our judgments and assumptions were reasonable,reasonable; different assumptions or adverse market developments could change the estimated fair values and, therefore, impairment charges could be required.
Employee Benefit Plans: We provide a variety of benefits to employees and former employees, including in some cases, pensions and postretirement health care.benefits. Plan assets and obligations are recorded based on an August 31 measurement date utilizing various actuarial assumptions such as discount rates, assumed rates of return and health care cost trend rates. The discount rate is based on the interest rate of non-callable high-quality corporate bonds, with appropriate consideration of local market factors, participant demographics and benefit payment terms. At August 31, 20092010 and 2008,2009, the weighted-average discount rate on domestic benefit plans was 5.60%4.60% and 6.50%5.60%, respectively. A change in the discount rate by 25 basis points would impact domestic benefit plan expense in fiscal 20102011 by less than $0.1 million. At August 31, 20092010 and 2008,2009, the weighted-average discount rate on foreign benefit plans was 5.53%4.28% and 5.59%5.53%, respectively. In estimating the expected return on plan assets, we consider the historical returns on plan assets, forward-looking considerations, inflation assumptions and the impact of the management of the plans’ invested assets. Domestic benefit plan assets consist primarily of participating units in common stock, index funds and bond funds. The expected return on domestic
benefit plan assets was 8.25%8.00% and 8.50%8.25% at August 31, 20092010 and 2008,2009, respectively. A 25 basis point change in this assumption would impact fiscal 20102011 domestic benefit plan expense by less than $0.1 million. Due to the lowlimited amount of foreign benefit plan assets, changes in the expected return on plan assets does not materially impact our results of operations.
We review actuarial assumptions on an annual basis and make modifications based on current rates and trends when appropriate. As required by U.S. GAAP, the effects of the modifications are recorded currently or amortized over future periods. Based on information provided by independent actuaries and other relevant sources, we believe that the assumptions used are reasonable; however, changes in these assumptions could impact our financial position, results of operations or cash flows. See Note 11, “Employee Benefit Plans” in the notes to consolidated financial statements for further discussion.
Income Taxes: We recognize deferred tax assets and liabilities for the future tax consequences attributable to differences between financial statement carrying amounts of existing assets and liabilities and their respective tax bases and operating loss and other loss carryforwards. Deferred tax assets and liabilities are measured using enacted tax rates expected to apply to taxable income in the years in which those temporary differences are expected to be recovered or settled. Income tax expense also reflects best estimates and assumptions regarding, among other things, the level of future taxable income and the effect of various tax planning strategies. Future tax
authority rulings and changes in tax laws, changes in projected levels of taxable income and future tax planning strategies could affect the actual effective tax rate and tax balances recorded.
Use of Estimates: We record reserves or allowances for customer returns and discounts, doubtful accounts, inventory, incurred but not reported medical claims, environmental matters, warranty claims, workers compensation claims, product and non-product litigation and incentive compensation. These reserves require the use of estimates and judgment. We base our estimates on historical experience, input from third party advisors and on various other assumptions that are believed to be reasonable under the circumstances. We believe that such estimates are made on a consistent basis and with appropriate assumptions and methods. However, actual results may differ from these estimates under different assumptions or conditions.estimates.
New Accounting Pronouncements
In September 2006,June 2008, the Financial Accounting Standards Board (FASB) issued Statement of Financialan update to Accounting Standards (SFAS)Codification (ASC) No. 157, “Fair Value Measurements.260, “Earnings Per Share,” SFAS No. 157 provides a common definition of fair value and establishes a framework to make the measurement of fair value in generally accepted accounting principles more consistent and comparable. SFAS No. 157 also requires expanded disclosures to provide information about the extent to which fair value is used to measure assets and liabilities, the methods and assumptions used to measure fair value, and the effect of fair value measures on earnings. We adopted SFAS No. 157 on September 1, 2008; see Note 9, “Fair Value Measurement” for disclosures required under SFAS No. 157. We have not adopted SFAS No. 157 for non-financial assets and liabilities as permitted by FASB Staff Position FAS 157-2, which provides a deferral of such provisions until our 2010 fiscal year.
In June 2008, the FASB issued Staff Position on EITF Issue 03-6-1 (“FSP 03-6-1”),“Determining Whether Instruments Granted in Share-Based Payment Transactions Are Participating Securities.” FSP 03-6-1 requiresconcluded that all outstanding unvested share-based payment awards that contain non-forfeitable rights to non-forfeitable dividends be consideredare participating securities in undistributed earnings with common shareholders. This staff position is effective for financial statements issued for fiscal years beginning after December 15, 2008, as well as interim periods within those years. We areand, therefore, must be included in the processcomputation of evaluatingearnings per share pursuant to the impact that will result from adopting FSP 03-6-1 on our resultstwo-class method. Outstanding unvested share-based awards (restricted stock awards) granted under the Actuant Corporation 2001 and 2002 Stock Plans are participating securities as they contain non-forfeitable rights to dividends. The application of operationsthe two-class method in computing basic and financial disclosures when the standard is adopted during the first quarter of fiscal 2010.
Effectivedilutive earnings per share, effective September 1, 2008, we adopted SFAS No. 159,“The Fair Value Option for Financial Assets and Financial Liabilities, including an amendment of SFAS No. 115,” which permits a company to choose to measure eligible items at fair value at specified election dates. We have not elected the fair value option for any of our financial assets or financial liabilities.
In March 2008, the FASB issued SFAS No. 161, “Disclosures about Derivative Instruments and Hedging Activities—an amendment of FASB Statement No. 133.” SFAS No. 161 is intended to improve financial reporting by requiring transparency about the nature, purpose, location and amounts of derivative instruments in an entity’s financial statements; how derivative instruments and related hedged items are accounted for under SFAS No. 133; and how derivative instruments and related hedged items affect its financial position, financial performance and cash flows. The adoption of SFAS No. 161 on December 1, 20082009, did not have anya material impact on our consolidated financial statements.the weighted average shares outstanding or earnings per share amounts.
In December 2007, the FASB issued SFASan update to ASC No. 160,“Noncontrolling Interests in Consolidated Financial Statements—an amendment of ARB No. 51.810, “Consolidations,” SFAS No. 160 establishes which changed the accounting and reporting standards for non-controlling (minority) interests. The Company has one joint venture with a noncontrollingnon-controlling interest, (minority interest) inwhich is not significant to the Company’s financial position and results of operations. As a subsidiary, requires expanded disclosures and changes inresult, the way the consolidated income statement is presented. SFAS No. 160 will be effective for us beginning in fiscal 2010. The adoption of SFAS No. 160 isthis guidance on September 1, 2009 did not expected to have a significant impactmaterial effect on the consolidated financial statements.
In May 2008, the FASB issued FSP APB No. 14-1,“Accounting for Convertible Debt Instruments That May be Settled in Cash upon Conversion (including Partial Cash Settlement)” (“FSP APB 14-1”). FSP APB 14-1 requires that the liability and equity components of convertible debt instruments that may be settled in cash upon conversion (including partial cash settlement) be separated to account for the fair value of the debt and equity components as of the date of issuance to reflect the issuer’s nonconvertible debt borrowing rate. Our convertible debt may not be settled in cash upon conversion and therefore the adoption of FSP APB 14-1 in fiscal 2010 will not impact the consolidated financial statements.
In December 2007, the FASB issued SFASan update to ASC No. 141 (Revised 2007), “Business Combinations.805, “Business Combinations,” The objectivewhich changed the accounting for certain aspects of SFAS No. 141(R) is to improvebusiness combinations, including the information provided in financial reports about a business combinationtreatment of contingent consideration, pre-acquisition contingencies, transaction costs, in-process research and its effects. SFAS No. 141(R) requires an acquirer to recognize the assets acquired, the liabilities assumeddevelopment and any non-controlling interest in the acquiree at the acquisition date, measured at their fair values as of that date. SFAS No. 141(R)restructuring costs. This guidance also requires adjustments associated with changes in deferred tax balances or tax contingencies, that occur after the acquirerone year measurement period, be recorded as adjustments to recognize and measureincome tax expense. ASC No. 805 was effective for the goodwill acquiredCompany for all acquisitions after September 1, 2009; however, the guidance in athis standard regarding the treatment of changes in income tax balances was applied retrospectively to all business combination or a gain from a bargain purchase and how to evaluate the nature and financial effects of the business combination. SFAS No. 141(R) will change our accounting treatment for business combinations made in fiscal 2010 and subsequent years.combinations.
Item 7A. Quantitative and Qualitative Disclosures About Market Risk
We are exposed to market risk from changes in foreign currency exchange rates and interest rates and, to a lesser extent, commodities. To reduce such risks, we selectively use financial instruments and other proactive management techniques. All hedging transactions are authorized and executed pursuant to clearly defined policies and procedures, which strictly prohibit the use of financial instruments for trading or speculative purposes. A discussion of our accounting policies for derivative financial instruments is included within Note 1, “Summary of Significant Accounting Policies” in Notesnotes to Consolidated Financial Statements.consolidated financial statements.
Currency Risk—We have exposure to foreign currency exchange fluctuations. Approximately 51%48%, 53%46% and 49%47% of our revenues for the years ended August 31, 2010, 2009 2008 and 2007,2008, respectively, were denominated in currencies other than the U.S. dollar. Of those non-U.S. dollar denominated amounts, approximately 58%49% were denominated in euro, with the remainder denominated in British pounds and various Asian and other currencies. Our identifiable foreign currency exchange exposure results primarily from the anticipated purchase of product from affiliates and third party suppliers and from the repayment of intercompany loans between subsidiaries denominated in foreign currencies. We periodically identify areas where we do not have naturally occurring offsetting positions and then may purchase hedging instruments to protect against anticipated exposures. At August 31, 20092010 and 2008,2009, there are no material hedging instruments related to the purchase of products from affiliates and third party suppliers. Our financial position is not materially sensitive to fluctuations in exchange rates as any gains or losses on foreign currency exposures are generally offset by gains and losses on underlying payables and receivables.
Interest Rate Risk—We have earnings exposure related to interest rate changes on our outstanding floating rate debt instruments that are based on LIBOR interest rates. We have periodically utilized interest rate swap agreements to manage overall financing costs and interest rate risk. A 25 basis pointSince substantially all of our debt at August 31, 2010 was fixed rate, an increase or decrease in the applicable interest rates would have no impact on our variable rate debt at August 31, 2009 would result in a change in financing costs, net of approximately $0.1 million on an annual basis.interest costs.
Commodity Risk—We source a wide variety of materials and components from a network of global suppliers. While such materials are typically available from numerous suppliers, commodity raw materials, such as steel, plastic resin and copper, are subject to price fluctuations, which could have a negative impact on our results. We strive to pass along such commodity price increases to customers to avoid profit margin erosion and utilize LEAD initiatives to further mitigate the impact of commodity raw material price fluctuations as improved efficiencies across all locations are achieved. We also selectively utilize commodity derivative contracts to hedge against changing raw material prices. (See also “Currency Risk” above). We did not have any significant derivative contracts in place at August 31, 20092010 or 20082009 to hedge exposure to commodity risk.
| Item 8. | Financial Statements and Supplementary Data |
All other schedules are omitted because they are not applicable, not required or because the required information is included in the Consolidated Financial Statementsconsolidated financial statements or notes thereto.
REPORT OF INDEPENDENT REGISTERED PUBLIC ACCOUNTING FIRM
To the Shareholders and Board of Directors of Actuant Corporation:
In our opinion, the consolidated financial statements listed in the accompanying index present fairly, in all material respects, the financial position of Actuant Corporation and its subsidiaries at August 31, 20092010 and August 31, 2008,2009, and the results of their operations and their cash flows for each of the three years in the period ended August 31 20092010 in conformity with accounting principles generally accepted in the United States of America. In addition, in our opinion, the financial statement schedule listed in the accompanying index presents fairly, in all material respects, the information set forth therein when read in conjunction with the related consolidated financial statements. Also in our opinion, the Company maintained, in all material respects, effective internal control over financial reporting as of August 31, 2009,2010, based on criteria established in Internal Control—Integrated Framework issued by the Committee of Sponsoring Organizations of the Treadway Commission (COSO). The Company’s management is responsible for these financial statements and financial statement schedule, for maintaining effective internal control over financial reporting and for its assessment of the effectiveness of internal control over financial reporting, included in management’s reportManagement’s Report on internal controlInternal Control over financial reportingFinancial Reporting appearing under Item 9A. Our responsibility is to express opinions on these financial statements, on the financial statement schedule, and on the Company’s internal control over financial reporting based on our integrated audits. We conducted our audits in accordance with the standards of the Public Company Accounting Oversight Board (United States). Those standards require that we plan and perform the audits to obtain reasonable assurance about whether the financial statements are free of material misstatement and whether effective internal control over financial reporting was maintained in all material respects. Our audits of the financial statements included examining, on a test basis, evidence supporting the amounts and disclosures in the financial statements, assessing the accounting principles used and significant estimates made by management, and evaluating the overall financial statement presentation. Our audit of internal control over financial reporting included obtaining an understanding of internal control over financial reporting, assessing the risk that a material weakness exists, and testing and evaluating the design and operating effectiveness of internal control based on the assessed risk. Our audits also included performing such other procedures as we considered necessary in the circumstances. We believe that our audits provide a reasonable basis for our opinions.
As discussed in Note 12 to the consolidated financial statements, the Company changed the manner in which it accounts for liabilities related to unrecognized tax benefits in 2008.
A company’s internal control over financial reporting is a process designed to provide reasonable assurance regarding the reliability of financial reporting and the preparation of financial statements for external purposes in accordance with generally accepted accounting principles. A company’s internal control over financial reporting includes those policies and procedures that (i) pertain to the maintenance of records that, in reasonable detail, accurately and fairly reflect the transactions and dispositions of the assets of the company; (ii) provide reasonable assurance that transactions are recorded as necessary to permit preparation of financial statements in accordance with generally accepted accounting principles, and that receipts and expenditures of the company are being made only in accordance with authorizations of management and directors of the company; and (iii) provide reasonable assurance regarding prevention or timely detection of unauthorized acquisition, use, or disposition of the company’s assets that could have a material effect on the financial statements.
Because of its inherent limitations, internal control over financial reporting may not prevent or detect misstatements. Also, projections of any evaluation of effectiveness to future periods are subject to the risk that controls may become inadequate because of changes in conditions, or that the degree of compliance with the policies or procedures may deteriorate.
As described in management’s reportManagement’s Report on internal controlInternal Control over financial reportingFinancial Reporting appearing under Item 9A, management has excluded The Cortland Companiescertain elements of the Selantic, Biach Industries, Hydrospex and Team Hydrotec businesses from its assessment of internal control over financial reporting as of August 31, 20092010 because it wasthey were acquired by the Company in a purchase business combinationcombinations during the year ended August 31, 2009.2010. Subsequent to the acquisition certain elements of the acquired businesses’ internal control over financial reporting and related processes were integrated into the Company’s existing systems and internal control over financial reporting. Those controls that were not integrated have been excluded from management’s assessment of the effectiveness of internal control over financial reporting as of August 31, 2010. We have also excluded The Cortland Companiesthese elements of the internal control over financial reporting of the acquired businesses from our audit of the Company’s internal control over financial reporting. The Cortland CompaniesSelantic, Biach Industries, Hydrospex and Team Hydrotec businesses are wholly-owned subsidiaries whose combined total assets and total revenues, excluding integrated elements, represent 16%5% and 6%1%, respectively, of the related consolidated financial statement amounts as of and for the year ended August 31, 2009.2010.
/S/ PRICEWATERHOUSECOOPERS LLP
Milwaukee, WI
October 28, 20092010
CONSOLIDATED STATEMENTS OF EARNINGS
(in thousands, except per share amounts)
| Year Ended August 31, | Year Ended August 31, | |||||||||||||||||||||||
| 2009 | 2008 | 2007 | 2010 | 2009 | 2008 | |||||||||||||||||||
Net sales | $ | 1,239,798 | $ | 1,613,190 | $ | 1,436,212 | $ | 1,160,508 | $ | 1,117,625 | $ | 1,446,140 | ||||||||||||
Cost of products sold | 825,124 | 1,052,141 | 959,435 | 733,256 | 729,398 | 917,027 | ||||||||||||||||||
Gross profit | 414,674 | 561,049 | 476,777 | 427,252 | 388,227 | 529,113 | ||||||||||||||||||
Selling, administrative and engineering expenses | 275,751 | 330,609 | 278,424 | 267,866 | 250,004 | 298,532 | ||||||||||||||||||
Restructuring charges | 22,426 | 10,473 | 5,395 | 15,597 | 19,530 | — | ||||||||||||||||||
Impairment charges | 31,321 | — | — | — | 31,321 | — | ||||||||||||||||||
Amortization of intangible assets | 19,724 | 13,933 | 10,555 | 22,017 | 19,644 | 13,941 | ||||||||||||||||||
Operating profit | 65,452 | 206,034 | 182,403 | 121,772 | 67,728 | 216,640 | ||||||||||||||||||
Financing costs, net | 41,849 | 36,409 | 33,001 | 31,859 | 41,849 | 36,409 | ||||||||||||||||||
Other expense (income), net | 209 | (2,991 | ) | 782 | 711 | (714 | ) | (2,049 | ) | |||||||||||||||
Earnings from continuing operations before income tax expense (benefit) and minority interest | 23,394 | 172,616 | 148,620 | |||||||||||||||||||||
Income tax (benefit) expense | (474 | ) | 53,416 | 45,632 | ||||||||||||||||||||
Minority interest, net of income taxes | 17 | 22 | (43 | ) | ||||||||||||||||||||
Earnings from continuing operations before income tax | 89,202 | 26,593 | 182,280 | |||||||||||||||||||||
Income tax expense | 18,846 | 611 | 56,489 | |||||||||||||||||||||
Earnings from continuing operations | 23,851 | 119,178 | 103,031 | 70,356 | 25,982 | 125,791 | ||||||||||||||||||
Earnings (loss) from discontinued operations, net of income taxes | (10,128 | ) | 3,366 | 1,921 | ||||||||||||||||||||
Loss from discontinued operations, net of income taxes | (46,325 | ) | (12,259 | ) | (3,247 | ) | ||||||||||||||||||
Net earnings | $ | 13,723 | $ | 122,544 | $ | 104,952 | $ | 24,031 | $ | 13,723 | $ | 122,544 | ||||||||||||
Earnings from continuing operations per share: | ||||||||||||||||||||||||
Basic | $ | 0.41 | $ | 2.14 | $ | 1.88 | $ | 1.04 | $ | 0.45 | $ | 2.25 | ||||||||||||
Diluted | $ | 0.40 | $ | 1.88 | $ | 1.66 | $ | 0.97 | $ | 0.43 | $ | 1.98 | ||||||||||||
Earnings per share: | ||||||||||||||||||||||||
Basic | $ | 0.24 | $ | 2.20 | $ | 1.92 | $ | 0.36 | $ | 0.24 | $ | 2.20 | ||||||||||||
Diluted | $ | 0.24 | $ | 1.93 | $ | 1.69 | $ | 0.35 | $ | 0.24 | $ | 1.93 | ||||||||||||
Weighted average common shares outstanding: | ||||||||||||||||||||||||
Basic | 58,047 | 55,813 | 54,751 | 67,624 | 58,047 | 55,813 | ||||||||||||||||||
Diluted | 66,064 | 64,833 | 63,628 | 74,209 | 66,064 | 64,833 | ||||||||||||||||||
The accompanying notes are an integral part of these consolidated financial statements.
CONSOLIDATED BALANCE SHEETS
(in thousands, except share and per share amounts)
| August 31, | August 31, | |||||||||||||||
| 2009 | 2008 | 2010 | 2009 | |||||||||||||
A S S E T S | ||||||||||||||||
Current Assets | ||||||||||||||||
Cash and cash equivalents | $ | 11,385 | $ | 122,549 | $ | 40,222 | $ | 11,385 | ||||||||
Accounts receivable, net | 155,520 | 226,564 | 185,693 | 155,520 | ||||||||||||
Inventories, net | 160,656 | 215,391 | 146,154 | 160,656 | ||||||||||||
Deferred income taxes | 20,855 | 11,870 | 30,701 | 20,855 | ||||||||||||
Prepaid expenses and other current assets | 15,246 | 16,092 | 12,578 | 15,246 | ||||||||||||
Current assets of discontinued operations | 44,802 | — | ||||||||||||||
Total Current Assets | 363,662 | 592,466 | 460,150 | 363,662 | ||||||||||||
Property, Plant and Equipment | ||||||||||||||||
Land, buildings, and improvements | 61,649 | 48,496 | 48,301 | 61,649 | ||||||||||||
Machinery and equipment | 254,591 | 254,262 | 228,270 | 254,591 | ||||||||||||
Gross property, plant and equipment | 316,240 | 302,758 | 276,571 | 316,240 | ||||||||||||
Less: Accumulated depreciation | (187,122 | ) | (168,208 | ) | (168,189 | ) | (187,122 | ) | ||||||||
Property, Plant and Equipment, net | 129,118 | 134,550 | 108,382 | 129,118 | ||||||||||||
Goodwill | 711,522 | 639,862 | 704,889 | 711,522 | ||||||||||||
Other Intangibles, net | 350,249 | 292,359 | 336,978 | 350,249 | ||||||||||||
Other Long-term Assets | 13,880 | 9,145 | ||||||||||||||
Other Long-term assets | 11,304 | 13,880 | ||||||||||||||
Total Assets | $ | 1,568,431 | $ | 1,668,382 | $ | 1,621,703 | $ | 1,568,431 | ||||||||
L I A B I L I T I E S AND S H A R E H O L D E R S’ E Q U I T Y | ||||||||||||||||
L I A B I L I T I E S A N D S H A R E H O L D E R S’ E Q U I T Y | ||||||||||||||||
Current Liabilities | ||||||||||||||||
Short-term borrowings | $ | 4,964 | $ | 339 | $ | — | $ | 4,964 | ||||||||
Trade accounts payable | 108,333 | 166,863 | 130,051 | 108,333 | ||||||||||||
Accrued compensation and benefits | 30,079 | 59,023 | 53,212 | 30,079 | ||||||||||||
Income taxes payable | 20,578 | 24,867 | 50,318 | 20,578 | ||||||||||||
Other current liabilities | 71,140 | 60,033 | 74,561 | 71,140 | ||||||||||||
Current liabilities of discontinued operations | 37,695 | — | ||||||||||||||
Total Current Liabilities | 235,094 | 311,125 | 345,837 | 235,094 | ||||||||||||
Long-term Debt, less Current Maturities | 400,135 | 573,818 | ||||||||||||||
Long-term Debt | 367,380 | 400,135 | ||||||||||||||
Deferred Income Taxes | 117,335 | 99,634 | 110,230 | 117,335 | ||||||||||||
Pension and Postretirement Benefit Liabilities | 37,662 | 27,641 | 28,072 | 37,662 | ||||||||||||
Other Long-term Liabilities | 30,835 | 26,658 | 30,463 | 30,835 | ||||||||||||
Shareholders’ Equity | ||||||||||||||||
Class A common stock, $0.20 par value per share, authorized 84,000,000 shares, issued and outstanding 67,718,207 and 56,002,228 shares, respectively | 13,543 | 11,200 | ||||||||||||||
Class A common stock, $0.20 par value per share, authorized 168,000,000 shares, issued and outstanding 68,056,387 and 67,718,207 shares, respectively | 13,610 | 13,543 | ||||||||||||||
Additional paid-in capital | (188,644 | ) | (324,898 | ) | (175,157 | ) | (188,644 | ) | ||||||||
Retained earnings | 947,070 | 936,055 | 968,373 | 947,070 | ||||||||||||
Accumulated other comprehensive (loss) income | (24,599 | ) | 7,149 | |||||||||||||
Accumulated other comprehensive loss | (67,105 | ) | (24,599 | ) | ||||||||||||
Stock held in trust | (1,766 | ) | (2,081 | ) | (1,934 | ) | (1,766 | ) | ||||||||
Deferred compensation liability | 1,766 | 2,081 | 1,934 | 1,766 | ||||||||||||
Total Shareholders’ Equity | 747,370 | 629,506 | 739,721 | 747,370 | ||||||||||||
Total Liabilities and Shareholders’ Equity | $ | 1,568,431 | $ | 1,668,382 | $ | 1,621,703 | $ | 1,568,431 | ||||||||
The accompanying notes are an integral part of these consolidated financial statements.
CONSOLIDATED STATEMENTS OF CASH FLOWS
(in thousands)
| Year Ended August 31, | Year Ended August 31, | |||||||||||||||||||||||
| 2009 | 2008 | 2007 | 2010 | 2009 | 2008 | |||||||||||||||||||
Operating activities | ||||||||||||||||||||||||
Net earnings | $ | 13,723 | $ | 122,544 | $ | 104,952 | $ | 24,031 | $ | 13,723 | $ | 122,544 | ||||||||||||
Adjustments to reconcile net earnings to cash provided by operating activities: | ||||||||||||||||||||||||
Depreciation and amortization | 51,978 | 44,709 | 35,974 | 51,875 | 51,978 | 44,709 | ||||||||||||||||||
Amortization of debt discount and debt issuance costs | 4,531 | 1,372 | 2,413 | 3,969 | 4,531 | 1,372 | ||||||||||||||||||
Stock-based compensation expense | 8,399 | 8,609 | 6,847 | |||||||||||||||||||||
Provision (benefit) for deferred income taxes | (2,876 | ) | (17,847 | ) | 5,912 | |||||||||||||||||||
Impairment charges | 58,274 | — | — | 36,139 | 58,274 | — | ||||||||||||||||||
Stock-based compensation expense | 8,609 | 6,847 | 5,475 | |||||||||||||||||||||
Net gain on disposal of businesses | (15,831 | ) | — | — | (334 | ) | (15,831 | ) | — | |||||||||||||||
(Gain)/Loss on disposal of assets | 1,585 | (1,576 | ) | (1,182 | ) | |||||||||||||||||||
Provision (benefit) for deferred income taxes | (17,847 | ) | 5,912 | 8,341 | ||||||||||||||||||||
Other non-cash adjustments | (855 | ) | 1,585 | (1,576 | ) | |||||||||||||||||||
Changes in components of working capital and other: | ||||||||||||||||||||||||
Accounts receivable | 87,052 | (13,929 | ) | (2,261 | ) | (14,507 | ) | 71,215 | (17,505 | ) | ||||||||||||||
Accounts receivable securitization | (15,837 | ) | (3,576 | ) | 6,460 | |||||||||||||||||||
Expiration of accounts receivable securitization program | (37,106 | ) | — | — | ||||||||||||||||||||
Inventories | 57,963 | (5,697 | ) | (4,900 | ) | (7,964 | ) | 57,963 | (5,697 | ) | ||||||||||||||
Prepaid expenses and other assets | 1,075 | 429 | (1,024 | ) | 3,817 | 1,075 | 429 | |||||||||||||||||
Trade accounts payable | (61,932 | ) | 7,586 | 14,740 | 32,727 | (61,932 | ) | 7,586 | ||||||||||||||||
Income taxes payable | (9,180 | ) | (576 | ) | (646 | ) | 16,000 | (9,180 | ) | (576 | ) | |||||||||||||
Other liabilities | (17,448 | ) | 6,052 | 8,768 | ||||||||||||||||||||
Accrued compensation and benefits | 27,361 | (25,836 | ) | 10,447 | ||||||||||||||||||||
Other accrued liabilities | (19,590 | ) | 8,388 | (4,395 | ) | |||||||||||||||||||
Cash provided by operating activities | 146,715 | 170,097 | 177,110 | 121,086 | 146,715 | 170,097 | ||||||||||||||||||
Investing activities | ||||||||||||||||||||||||
Proceeds from sale of property, plant and equipment | 1,862 | 14,065 | 4,570 | 1,236 | 1,862 | 14,065 | ||||||||||||||||||
Proceeds from sale of businesses, net of transaction costs | 38,455 | — | — | |||||||||||||||||||||
Proceeds from sale of businesses | 7,516 | 38,455 | — | |||||||||||||||||||||
Capital expenditures | (21,454 | ) | (44,407 | ) | (31,491 | ) | (19,966 | ) | (21,454 | ) | (44,407 | ) | ||||||||||||
Business acquisitions, net of cash acquired | (239,422 | ) | (110,109 | ) | (162,981 | ) | (45,866 | ) | (239,422 | ) | (110,109 | ) | ||||||||||||
Cash used in investing activities | (220,559 | ) | (140,451 | ) | (189,902 | ) | (57,080 | ) | (220,559 | ) | (140,451 | ) | ||||||||||||
Financing activities | ||||||||||||||||||||||||
Net borrowings (repayments) on revolver and short-term borrowings | 16,657 | 246 | (80,355 | ) | (14,313 | ) | 16,657 | 246 | ||||||||||||||||
Principal repayments on term loans and other debt | (270,000 | ) | (1,015 | ) | (251,737 | ) | — | (270,000 | ) | (1,015 | ) | |||||||||||||
Proceeds from issuance of term loans | 115,000 | — | 155,737 | — | 115,000 | — | ||||||||||||||||||
Proceeds from Senior Note offering, net of discount | — | — | 249,039 | |||||||||||||||||||||
Principal repayments on 2% Convertible Notes | (9,100 | ) | — | — | ||||||||||||||||||||
Open market repurchases of 2% Convertible Notes | (22,894 | ) | (9,100 | ) | — | |||||||||||||||||||
Debt issuance costs | (9,158 | ) | (265 | ) | (4,599 | ) | — | (9,158 | ) | (265 | ) | |||||||||||||
Proceeds from equity offering, net of transaction costs | 124,781 | — | — | — | 124,781 | — | ||||||||||||||||||
Stock option exercises, tax benefits and other | 4,024 | 8,294 | 6,279 | |||||||||||||||||||||
Stock option exercises, related tax benefits and other | 3,315 | 4,024 | 8,294 | |||||||||||||||||||||
Cash dividend | (2,251 | ) | (2,221 | ) | (2,187 | ) | (2,702 | ) | (2,251 | ) | (2,221 | ) | ||||||||||||
Cash provided by (used in) financing activities | (30,047 | ) | 5,039 | 72,177 | (36,594 | ) | (30,047 | ) | 5,039 | |||||||||||||||
Effect of exchange rate changes on cash | (7,273 | ) | 1,184 | 1,636 | 1,425 | (7,273 | ) | 1,184 | ||||||||||||||||
Net increase (decrease) in cash and cash equivalents | (111,164 | ) | 35,869 | 61,021 | 28,837 | (111,164 | ) | 35,869 | ||||||||||||||||
Cash and cash equivalents—beginning of year | 122,549 | 86,680 | 25,659 | 11,385 | 122,549 | 86,680 | ||||||||||||||||||
Cash and cash equivalents—end of year | $ | 11,385 | $ | 122,549 | $ | 86,680 | $ | 40,222 | $ | 11,385 | $ | 122,549 | ||||||||||||
The accompanying notes are an integral part of these consolidated financial statements.
CONSOLIDATED STATEMENTS OF SHAREHOLDERS’ EQUITY
(in thousands)
| Class A Common Stock | Additional Paid-in Capital | Retained Earnings | Accumulated Other Comprehensive Income (Loss) | Stock Held in Trust | Deferred Compensation Liability | Total Shareholders’ Equity | Class A Common Stock | Additional Paid-in Capital | Retained Earnings | Accumulated Other Comprehensive Income (Loss) | Stock Held in Trust | Deferred Compensation Liability | Total Shareholders’ Equity | ||||||||||||||||||||||||||||||||||||||||||||||||
| Shares | Amount | ||||||||||||||||||||||||||||||||||||||||||||||||||||||||||||
Balance at August 31, 2006 | 54,590 | $ | 10,920 | $ | (365,813 | ) | $ | 722,439 | $ | (4,581 | ) | $ | (1,355 | ) | $ | 1,355 | $ | 362,965 | |||||||||||||||||||||||||||||||||||||||||||
Net earnings | — | — | — | 104,952 | — | — | — | 104,952 | |||||||||||||||||||||||||||||||||||||||||||||||||||||
Currency translation adjustments | — | — | — | — | 12,800 | — | — | 12,800 | |||||||||||||||||||||||||||||||||||||||||||||||||||||
Fair value of derivatives, net of taxes | — | — | — | — | (971 | ) | — | — | (971 | ) | |||||||||||||||||||||||||||||||||||||||||||||||||||
Additional minimum pension liability, net of taxes | — | — | — | — | 2,802 | — | — | 2,802 | |||||||||||||||||||||||||||||||||||||||||||||||||||||
Total comprehensive income | 119,583 | ||||||||||||||||||||||||||||||||||||||||||||||||||||||||||||
Effect of SFAS No. 158 adoption, net of taxes | — | — | — | — | 2,826 | — | — | 2,826 | |||||||||||||||||||||||||||||||||||||||||||||||||||||
Company stock contribution to employee benefit plans | 210 | 40 | 4,767 | — | — | — | — | 4,807 | |||||||||||||||||||||||||||||||||||||||||||||||||||||
Restricted stock awards | 98 | 20 | (20 | ) | — | — | — | — | — | ||||||||||||||||||||||||||||||||||||||||||||||||||||
Cash dividend ($0.04 per share) | — | — | — | (2,226 | ) | — | — | — | (2,226 | ) | |||||||||||||||||||||||||||||||||||||||||||||||||||
Stock based compensation expense | — | — | 5,475 | — | — | — | — | 5,475 | |||||||||||||||||||||||||||||||||||||||||||||||||||||
Stock option exercises | 440 | 88 | 1,866 | — | — | — | — | 1,954 | |||||||||||||||||||||||||||||||||||||||||||||||||||||
Tax benefit on stock option exercises | — | — | 4,324 | — | — | — | — | 4,324 | |||||||||||||||||||||||||||||||||||||||||||||||||||||
Stock issued to, acquired for and distributed from rabbi trust | 11 | 2 | 211 | — | — | (389 | ) | 389 | 213 | ||||||||||||||||||||||||||||||||||||||||||||||||||||
| Shares | Amount | Additional Paid-in Capital | Retained Earnings | Accumulated Other Comprehensive Income (Loss) | Stock Held in Trust | Deferred Compensation Liability | Total Shareholders’ Equity | ||||||||||||||||||||||||||||||||||||||||||||||||||||||
Balance at August 31, 2007 | 55,349 | 11,070 | (349,190 | ) | 825,165 | 12,876 | (1,744 | ) | 1,744 | 499,921 | 55,349 | $ | 11,070 | ||||||||||||||||||||||||||||||||||||||||||||||||
Net earnings | — | — | — | 122,544 | — | — | — | 122,544 | — | — | — | 122,544 | — | — | — | 122,544 | |||||||||||||||||||||||||||||||||||||||||||||
Currency translation adjustments | — | — | — | — | (1,777 | ) | — | — | (1,777 | ) | — | — | — | — | (1,777 | ) | — | — | (1,777 | ) | |||||||||||||||||||||||||||||||||||||||||
Fair value of derivatives, net of taxes | — | — | — | — | (600 | ) | — | — | (600 | ) | — | — | — | — | (600 | ) | — | — | (600 | ) | |||||||||||||||||||||||||||||||||||||||||
Pension and postretirement plan funded status, net of taxes | — | — | — | — | (3,350 | ) | — | — | (3,350 | ) | — | — | — | — | (3,350 | ) | — | — | (3,350 | ) | |||||||||||||||||||||||||||||||||||||||||
Total comprehensive income | 116,817 | 116,817 | |||||||||||||||||||||||||||||||||||||||||||||||||||||||||||
Effect of FIN 48 adoption | — | — | — | (9,408 | ) | — | — | — | (9,408 | ) | — | — | — | (9,408 | ) | — | — | — | (9,408 | ) | |||||||||||||||||||||||||||||||||||||||||
Company stock contribution to employee benefit plans | 313 | 62 | 9,832 | — | — | — | — | 9,894 | 313 | 62 | 9,832 | — | — | — | — | 9,894 | |||||||||||||||||||||||||||||||||||||||||||||
Restricted stock awards | 20 | 4 | (4 | ) | — | — | — | — | — | 20 | 4 | (4 | ) | — | — | — | — | — | |||||||||||||||||||||||||||||||||||||||||||
Cash dividend ($0.04 per share) | — | — | — | (2,246 | ) | — | — | — | (2,246 | ) | — | — | — | (2,246 | ) | — | — | — | (2,246 | ) | |||||||||||||||||||||||||||||||||||||||||
Stock based compensation expense | — | — | 6,847 | — | — | — | — | 6,847 | — | — | 6,847 | — | — | — | — | 6,847 | |||||||||||||||||||||||||||||||||||||||||||||
Stock option exercises | 306 | 61 | 3,249 | — | — | — | — | 3,310 | 306 | 61 | 3,249 | — | — | — | — | 3,310 | |||||||||||||||||||||||||||||||||||||||||||||
Tax benefit on stock option exercises | — | — | 3,900 | — | — | — | — | 3,900 | |||||||||||||||||||||||||||||||||||||||||||||||||||||
Excess benefit on stock option exercises | — | — | 3,900 | — | — | — | — | 3,900 | |||||||||||||||||||||||||||||||||||||||||||||||||||||
Stock issued to, acquired for and distributed from rabbi trust | 14 | 3 | 468 | — | — | (337 | ) | 337 | 471 | 14 | 3 | 468 | — | — | (337 | ) | 337 | 471 | |||||||||||||||||||||||||||||||||||||||||||
Balance at August 31, 2008 | 56,002 | 11,200 | (324,898 | ) | 936,055 | 7,149 | (2,081 | ) | 2,081 | 629,506 | 56,002 | 11,200 | (324,898 | ) | 936,055 | 7,149 | (2,081 | ) | 2,081 | 629,506 | |||||||||||||||||||||||||||||||||||||||||
Net earnings | — | — | — | 13,723 | — | — | — | 13,723 | — | — | — | 13,723 | — | — | — | 13,723 | |||||||||||||||||||||||||||||||||||||||||||||
Currency translation adjustments | — | — | — | — | (24,940 | ) | — | — | (24,940 | ) | — | — | — | — | (24,940 | ) | — | — | (24,940 | ) | |||||||||||||||||||||||||||||||||||||||||
Fair value of derivatives, net of taxes | — | — | — | — | (535 | ) | — | — | (535 | ) | — | — | — | — | (535 | ) | — | — | (535 | ) | |||||||||||||||||||||||||||||||||||||||||
Pension and postretirement plan funded status, net of taxes | — | — | — | — | (6,273 | ) | — | — | (6,273 | ) | — | — | — | — | (6,273 | ) | — | — | (6,273 | ) | |||||||||||||||||||||||||||||||||||||||||
Total comprehensive loss | (18,025 | ) | (18,025 | ) | |||||||||||||||||||||||||||||||||||||||||||||||||||||||||
Company stock contribution to employee benefit plans | 228 | 46 | 5,198 | — | — | — | — | 5,244 | 228 | 46 | 5,198 | — | — | — | — | 5,244 | |||||||||||||||||||||||||||||||||||||||||||||
Restricted stock awards | 312 | 62 | (62 | ) | — | — | — | — | — | 312 | 62 | (62 | ) | — | — | — | — | — | |||||||||||||||||||||||||||||||||||||||||||
Issuance of common stock | 10,925 | 2,185 | 122,441 | — | — | — | — | 124,626 | 10,925 | 2,185 | 122,441 | — | — | — | — | 124,626 | |||||||||||||||||||||||||||||||||||||||||||||
Cash dividend ($0.04 per share) | — | — | — | (2,708 | ) | — | — | — | (2,708 | ) | — | — | — | (2,708 | ) | — | — | — | (2,708 | ) | |||||||||||||||||||||||||||||||||||||||||
Stock based compensation expense | — | — | 8,609 | — | — | — | — | 8,609 | — | — | 8,609 | — | — | — | — | 8,609 | |||||||||||||||||||||||||||||||||||||||||||||
Stock option exercises | 233 | 47 | (1,994 | ) | — | — | — | — | (1,947 | ) | 233 | 47 | (1,994 | ) | — | — | — | — | (1,947 | ) | |||||||||||||||||||||||||||||||||||||||||
Tax benefit on stock option exercises | — | — | 1,514 | — | — | — | — | 1,514 | |||||||||||||||||||||||||||||||||||||||||||||||||||||
Excess benefit on stock option exercises | — | — | 1,514 | — | — | — | — | 1,514 | |||||||||||||||||||||||||||||||||||||||||||||||||||||
Stock issued to, acquired for and distributed from rabbi trust | 18 | 3 | 548 | — | — | 315 | (315 | ) | 551 | 18 | 3 | 548 | — | — | 315 | (315 | ) | 551 | |||||||||||||||||||||||||||||||||||||||||||
Balance at August 31, 2009 | 67,718 | $ | 13,543 | $ | (188,644 | ) | $ | 947,070 | $ | (24,599 | ) | $ | (1,766 | ) | $ | 1,766 | $ | 747,370 | 67,718 | 13,543 | (188,644 | ) | 947,070 | (24,599 | ) | (1,766 | ) | 1,766 | 747,370 | ||||||||||||||||||||||||||||||||
Net earnings | — | — | — | 24,031 | — | — | — | 24,031 | |||||||||||||||||||||||||||||||||||||||||||||||||||||
Currency translation adjustments | — | — | — | — | (34,845 | ) | — | — | (34,845 | ) | |||||||||||||||||||||||||||||||||||||||||||||||||||
Fair value of derivatives, net of taxes | — | — | — | — | 15 | — | — | 15 | |||||||||||||||||||||||||||||||||||||||||||||||||||||
Pension and postretirement plan funded status, net of taxes | — | — | — | — | (7,676 | ) | — | — | (7,676 | ) | |||||||||||||||||||||||||||||||||||||||||||||||||||
Total comprehensive loss | (18,475 | ) | |||||||||||||||||||||||||||||||||||||||||||||||||||||||||||
Company stock contribution to employee benefit plans | 123 | 24 | 1,963 | — | — | — | — | 1,987 | |||||||||||||||||||||||||||||||||||||||||||||||||||||
Restricted stock awards | (24 | ) | (5 | ) | 5 | — | — | — | — | — | |||||||||||||||||||||||||||||||||||||||||||||||||||
Cash dividend ($0.04 per share) | — | — | — | (2,728 | ) | — | — | — | (2,728 | ) | |||||||||||||||||||||||||||||||||||||||||||||||||||
Stock based compensation expense | — | — | 8,875 | — | — | — | — | 8,875 | |||||||||||||||||||||||||||||||||||||||||||||||||||||
Stock option exercises | 228 | 46 | 1,686 | — | — | — | — | 1,732 | |||||||||||||||||||||||||||||||||||||||||||||||||||||
Excess benefit on stock option exercises | — | — | 756 | — | — | — | — | 756 | |||||||||||||||||||||||||||||||||||||||||||||||||||||
Stock issued to, acquired for and distributed from rabbi trust | 11 | 2 | 202 | — | — | (168 | ) | 168 | 204 | ||||||||||||||||||||||||||||||||||||||||||||||||||||
Balance at August 31, 2010 | 68,056 | $ | 13,610 | $ | (175,157 | ) | $ | 968,373 | $ | (67,105 | ) | $ | (1,934 | ) | $ | 1,934 | $ | 739,721 | |||||||||||||||||||||||||||||||||||||||||||
The accompanying notes are an integral part of these consolidated financial statements.
NOTES TO CONSOLIDATED FINANCIAL STATEMENTS
(in thousands, except share and per share amounts)
Note 1. Summary of Significant Accounting Policies
Nature of Operations: Actuant is a global manufacturer of a broad range of industrial products and systems, organized into four reportable segments. The Industrial segment is primarily involved in the design, manufacture and distribution of branded hydraulic and mechanical tools to the maintenance, industrial, infrastructure and production automation markets. The Energy segment provides joint integrity products and services, as well as umbilical, rope and cable solutions to the global oil & gas, power generation and energy markets. The Electrical segment is primarily involved in the design, manufacture and distribution of a broad range of electrical products to the retail DIY, wholesale, original equipment manufacturer (“OEM”), utility and harsh environment markets. The Engineered Solutions segment provides highly engineered position and motion control systems to OEMs in various vehicle markets, as well as a variety of other industrial products.
Consolidation and Presentation: The Consolidated Financial Statementsconsolidated financial statements include the accounts of Actuant Corporation and its consolidated subsidiaries (“Actuant” or the “Company”). Actuant consolidates companies in which it owns or controls more than fifty percent of the voting shares. The results of companies acquired or disposed of during the fiscal year are included in the Consolidated Financial Statementsconsolidated financial statements from the effective date of acquisition or until the date of disposal. All intercompany balances, transactions and profits have been eliminated in consolidation. Certain prior year amounts have been reclassified to conform to current year presentations,presentation, including amounts related to the change in the Company’s reportable segments (as discussed in Note 16, “Business Segment, Geographic and Customer Information”) and for discontinued operations presentation (as discussed in Note 3, “Discontinued Operations”). The Company has evaluated subsequent events through the date these financial statements were issued, October 28, 2009.operations.
Cash Equivalents: The Company considers all highly liquid investments with original maturities of 90 days or less to be cash equivalents.
Inventories: Inventories are comprised of material, direct labor and manufacturing overhead, and are stated at the lower of cost or market. Inventory cost is determined using the last-in, first-out (“LIFO”) method for a portion of the U.S. owned inventory (approximately 22%24% and 21%22% of total inventories in 20092010 and 2008,2009, respectively). The first-in, first-out or average cost methods are used for all other inventories. If the LIFO method were not used, inventory balances would be higher than the amounts in the Consolidated Balance Sheetsconsolidated balance sheets by approximately $4.8$4.9 million and $7.1$4.8 million at August 31, 20092010 and 2008,2009, respectively.
The nature of the Company’s products is such that they generally have a very short production cycle. Consequently, the amount of work-in-process at any point in time is minimal. In addition, many parts or components are ultimately either sold individually or assembled with other parts making a distinction between raw materials and finished goods impractical to determine. Other locations maintain and manage their inventories using a job cost system where the distinction of categories of inventory by state of completion is also not available. As a result of these factors, it is neither practical nor cost effective to segregate the amounts of raw materials, work-in-process or finished goods inventories at the respective balance sheet dates, as segregation would only be possible as the result of physical inventories which are taken at dates different from the balance sheet dates.
Property, Plant and Equipment: Property, plant and equipment are stated at cost. Plant and equipment are depreciated on a straight-line basis over the estimated useful lives of the assets, ranging from ten to twenty-fiveforty years for buildings and improvements and two to seven years for machinery and equipment. Leasehold improvements are amortized over the life of the related asset or the term of the lease, whichever is shorter.
ACTUANT CORPORATION
NOTES TO CONSOLIDATED FINANCIAL STATEMENTS—(Continued)
Impairment of Long-lived Assets: The Company reviews long-lived assets for impairment whenever events or changes in business circumstances indicate that the carrying amount of the assets may not be fully recoverable. In those cases, the Company performs undiscounted operating cash flow analyses to determine if an impairment exists for property, plant and equipment and other long-lived assets, excluding indefinite lived
ACTUANT CORPORATION
NOTES TO CONSOLIDATED FINANCIAL STATEMENTS—(Continued)
intangible assets. If an impairment is determined to exist, any related impairment loss is calculated based on fair value. See Note 3, “Discontinued Operations” and Note 6, “Impairment Charges” for details on long–lived asset impairment charges recognized in fiscal 2009.
Goodwill and Other Intangible Assets: Other intangible assets with definite lives, consisting primarily of purchased customer relationships, patents, trademarks and non-compete agreements, are amortized over periods from threetwo to twenty-five years. Goodwill and other intangible assets with indefinite lives are not subject to amortization, but are subject to annual impairment testing.
The Company’s goodwill is tested for impairment annually, at August 31, or more frequently if events or changes in circumstances indicate that goodwill might be impaired. The Company performs impairment reviews for its reporting units using a fair value method based on management’s judgments and assumptions. In estimating the fair value, we use a discounted cash flow model, which is dependent on a number of assumptions including estimated future revenues and expenses, weighted average cost of capital, capital expenditures and other variables. The estimated fair value of the reporting unit is compared to the carrying amount of the reporting unit, including goodwill. If the carrying value of the reporting unit exceeds its fair value, the goodwill is potentially impaired and the Company then determines the implied fair value of goodwill, which is compared to the carrying value to determine if impairment exists. Indefinite lived intangible assets are also subject to an annual impairment test. On an annual basis, or more frequently if events or changes in circumstances indicate that the asset might be impaired, the fair value of the indefinite lived intangible assets are evaluated by the Company to determine if an impairment charge is required. A considerable amount of management judgment and assumptions are required in performing the impairment tests, principally in determining the fair value of each reporting unit and the indefinite lived intangible assets. While management believes the judgments and assumptions were reasonable; different assumptions or adverse market developments could change the estimated fair values, and therefore, impairment charges could be required.
As discussed in Note 3, “Discontinued Operations” and Note 6, “Impairment Charges” the Company recognized goodwill and long-lived asset impairment charges of $36.1 million in fiscal 2010 (included in discontinued operations) and $58.3 million in fiscal 2009 ($31.3 million is included in continuing operations with the remainder in discontinued operations).
Product Warranty Costs: The Company recognizes the cost associated with its product warranties at the time of sale. The amount recognized is generally based on historical claims rates and current claim cost experience. The following is a reconciliationrollforward of the changes in accrued product warranty reserve for fiscal years 20092010 and 20082009 (in thousands):
| 2009 | 2008 | 2010 | 2009 | |||||||||||||
Beginning balance | $ | 9,309 | $ | 10,070 | $ | 8,989 | $ | 9,309 | ||||||||
Warranty reserves of acquired businesses | 1,461 | 50 | 920 | 1,461 | ||||||||||||
Provision for warranties | 7,800 | 9,720 | 5,153 | 7,800 | ||||||||||||
Warranty payments and costs incurred | (9,079 | ) | (10,725 | ) | (5,959 | ) | (9,079 | ) | ||||||||
Warranty reserves of divested businesses | (279 | ) | — | |||||||||||||
Warranty reserves of divested/discontinued businesses | (939 | ) | (279 | ) | ||||||||||||
Impact of changes in foreign currency rates | (223 | ) | 194 | (296 | ) | (223 | ) | |||||||||
Ending balance | $ | 8,989 | $ | 9,309 | $ | 7,868 | $ | 8,989 | ||||||||
Revenue Recognition: Customer sales are recognized as revenue when the risk of loss and title pass to the customer, which is generally upon shipment. Customer sales are recorded net of allowances for returns and discounts, which are recognized as a deduction from sales at the time of sale. The Company commits to one-time or on-going trade discounts and promotions with certain customers in some markets that require the Company to
ACTUANT CORPORATION
NOTES TO CONSOLIDATED FINANCIAL STATEMENTS—(Continued)
estimate and accrue the ultimate costs of such programs. The Company maintains an accrual at the end of each period for the earned, but unpaid costs related to the programs. The Company generally does not require collateral or other security and provides for an allowance for doubtful accounts based on historical experience and a review of its existing receivables. Accounts Receivable are presented net of an allowance for doubtful accounts of $8.6$7.7 million and $6.8$8.6 million at August 31, 2010 and 2009, and 2008, respectively.
Shipping and Handling Costs: The Company records costs associated with shipping its products within cost of products sold.
Research and Development Costs: Research and development costs consist primarily of an allocation of overall engineering and development resources and are expensed as incurred. Such costs incurred in the development of new products or significant improvements to existing products totaled approximately $14.5 million, $16.2 million $16.9 million and $11.2$16.9 million in fiscal 2010, 2009 2008 and 2007,2008, respectively. We also incur significant engineering and developmentapplication costs in connection with fulfilling custom customer orders and executing customer projects that are not captured in these allocated research and development costs.
Other Income/Expense: Other income and expense primarily consists of foreign exchange gains and losses and royalties. Net (gains)/losses resulting from foreign currency transactions were $0.2$(1.5) million, $(3.2)$1.1 million, and $0.7$2.3 million in fiscal 2010, 2009 and 2008, and 2007, respectively.
ACTUANT CORPORATION
NOTES TO CONSOLIDATED FINANCIAL STATEMENTS—(Continued)
Short-term Borrowings: Short-term borrowings consist of foreign and domestic subsidiary overdraft borrowings. Certain of the Company’s foreign subsidiaries are parties to unsecured non-committed lines of credit with various banks. Interest rates vary depending on the currency being borrowed.
Financing Costs: Financing costs represent interest expense, financing fees, amortization of debt issuance costs and accounts receivable financing costs, net of interest income.
Income Taxes: The provision for income taxes includes federal, state, local and non-U.S. taxes on income. Tax credits, primarily for non-U.S. earnings and export programs, are recognized as a reduction of the provision for income taxes in the year in which they are available for tax purposes. Deferred taxes are provided on temporary differences between assets and liabilities for financial and tax reporting purposes as measured by enacted tax rates expected to apply when temporary differences are settled or realized. Future tax benefits are recognized to the extent that realization of those benefits is considered to be more likely than not. A valuation allowance is established for deferred tax assets for which realization is not more likely than not of being realized. The Company has not provided for any residual U.S. income taxes on unremitted earnings of non-U.S. subsidiaries as such earnings are intended to be indefinitely reinvested. The Company recognizes interest and penalties related to unrecognized tax benefits in income tax expense.
Foreign Currency Translation: The financial statements of the Company’s foreign operations are translated into U.S. dollars using the exchange rate at each balance sheet date for assets and liabilities and an appropriate weighted average exchange rate for each applicable period for revenues, expenses, and gains and losses. Translation adjustments are reflected in the Consolidated Balance Sheetsconsolidated balance sheets and Consolidated Statementsconsolidated statements of Shareholders’ Equityshareholders’ equity caption “Accumulated other comprehensive income (loss).loss.”
Use of Estimates: The Company has recorded reserves or allowances for customer returns and discounts, doubtful accounts, inventory, incurred but not reported medical claims, environmental issues, warranty claims, workers compensation claims, product and non-product litigation and incentive compensation. These reserves require the use of estimates and judgment. The Company bases its estimates on historical experience, input from third party advisors and on various other assumptions that are believed to be reasonable under the circumstances. The Company believes that such estimates are made with consistent and appropriate methods. Actual results may differ from these estimates under different assumptions or conditions.estimates.
ACTUANT CORPORATION
NOTES TO CONSOLIDATED FINANCIAL STATEMENTS—(Continued)
Accounting for Derivatives and Hedging Activities: All derivatives are recognized on the balance sheet at their estimated fair value. On the date a derivative contract is entered into, the Company designates the derivative as a hedge of a recognized asset or liability (“fair value”(fair value hedge) or a hedge of a forecasted transaction or of the variability of cash flows to be received or paid related to a recognized asset or liability (“cash flow”(cash flow hedge). The Company does not enter into derivatives for speculative purposes. Changes in the value of a fair value hedge are recorded in earnings along with the gain or loss on the hedged asset or liability, while changes in the value of cash flow hedges are recorded in accumulated other comprehensive income (loss),loss, until earnings are affected by the variability of cash flows.
New Accounting Pronouncements: In September 2006,June 2008, the Financial Accounting Standards Board (FASB) issued Statement of Financialan update to Accounting Standards (SFAS)Codification (ASC) No. 157, “Fair Value Measurements.260, “Earnings Per Share,” SFAS No. 157 provides a common definition of fair value and establishes a framework to make the measurement of fair value in generally accepted accounting principles more consistent and comparable. SFAS No. 157 also requires expanded disclosures to provide information about the extent to which fair value is used to measure assets and liabilities, the methods and assumptions used to measure fair value and the effect of fair value measures on earnings. The Company adopted SFAS No. 157 on September 1, 2008; see Note 9, “Fair Value Measurements”
ACTUANT CORPORATION
NOTES TO CONSOLIDATED FINANCIAL STATEMENTS—(Continued)
for disclosures required under SFAS No. 157. The Company has not adopted SFAS No. 157 for non-financial assets and liabilities as permitted by FASB Staff Position FAS 157-2, which provides a deferral of such provisions until the Company’s 2010 fiscal year.
In June 2008, the FASB issued Staff Position on EITF Issue 03-6-1 (“FSP 03-6-1”),“Determining Whether Instruments Granted in Share-Based Payment Transactions Are Participating Securities.” FSP 03-6-1 requiresconcluded that all outstanding unvested share-based paymentequity awards that contain non-forfeitable rights to non-forfeitable dividends be consideredare participating securities in undistributed earnings with common shareholders. This staff position is effective for financial statements issued for fiscal years beginning after December 15, 2008, as well as interim periods within those years. The Company isand, therefore, must be included in the processcomputation of evaluatingearnings per share pursuant to the two-class method. Outstanding unvested share-based awards (restricted stock awards) granted under the Actuant Corporation 2001 and 2002 Stock Plans are participating securities as they contain non-forfeitable rights to dividends. The application of the two-class method in computing basic and dilutive earnings per share, effective September 1, 2009, did not have a material impact that will result from adopting FSP 03-6-1 on the Company’s results of operations and financial disclosures when the standard is adopted during the first quarter of fiscal 2010.weighted average shares outstanding or earnings per share amounts.
Effective September 1, 2008, the Company adopted SFAS No. 159,“The Fair Value Option for Financial Assets and Financial Liabilities, including an amendment of SFAS No. 115,” which permits a company to choose to measure eligible items at fair value at specified election dates. The Company has not elected the fair value option for any of its financial assets or financial liabilities.
In December 2007, the FASB issued SFASan update to ASC No. 160,“Noncontrolling Interests in Consolidated Financial Statements—an amendment of ARB No. 51.810, “Consolidations,” SFAS No. 160 establishes which changed the accounting and reporting standards for non-controlling (minority) interests. The Company has one joint venture with a noncontrollingnon-controlling interest, (minority interest) inwhich is not significant to the Company’s financial position and results of operations. As a subsidiary, requires expanded disclosures and changes inresult, the way the consolidated income statement is presented. SFAS No. 160 will be effective for the Company beginning in fiscal 2010. The adoption of SFAS No. 160 isthis guidance on September 1, 2009 did not expected to have a significant impactmaterial effect on the consolidated financial statements.
In March 2008, the FASB issued SFAS No. 161, “Disclosures about Derivative Instruments and Hedging Activities—an amendment of FASB Statement No. 133.” SFAS No. 161 is intended to improve financial reporting by requiring transparency about the nature, purpose, location and amounts of derivative instruments in an entity’s financial statements; how derivative instruments and related hedged items are accounted for under SFAS No. 133; and how derivative instruments and related hedged items affect its financial position, financial performance and cash flows. The adoption of SFAS No. 161 on December 1, 2008 did not have any impact on the Company’s consolidated financial statements.
In May 2008, the FASB issued FSP APB No. 14-1,“Accounting for Convertible Debt Instruments That May be Settled in Cash upon Conversion (including Partial Cash Settlement)” (“FSP APB 14-1”). FSP APB 14-1 requires that the liability and equity components of convertible debt instruments that may be settled in cash upon conversion (including partial cash settlement) be separated to account for the fair value of the debt and equity components as of the date of issuance to reflect the issuer’s nonconvertible debt borrowing rate. The Company’s convertible debt may not be settled in cash upon conversion and therefore the adoption of FSP APB 14-1 in fiscal 2010 will not impact the consolidated financial statements.
In December 2007, the FASB issued SFASan update to ASC No. 141 (Revised 2007), “Business Combinations.805, “Business Combinations,” The objectivewhich changed the accounting for certain aspects of SFAS No. 141(R) is to improvebusiness combinations, including the information provided in financial reports about a business combinationtreatment of contingent consideration, pre-acquisition contingencies, transaction costs, in-process research and its effects. SFAS No. 141(R) requires an acquirer to recognize the assets acquired, the liabilities assumeddevelopment and any non-controlling interest in the acquiree at the acquisition date, measured at their fair values as of that date. SFAS No. 141(R)restructuring costs. This guidance also requires adjustments associated with changes in deferred tax balances or tax contingencies, that occur after the acquirerone year measurement period, be recorded as adjustments to recognize and measureincome tax expense. ASC No. 805 was effective for the goodwill acquiredCompany for all acquisitions after September 1, 2009; however, the guidance in athis standard regarding the treatment of changes in income tax balances was applied retrospectively to all business combination or a gain from a bargain purchase and how to evaluate the nature and financial effects of the business combination. SFAS No. 141(R) will change the Company’s accounting treatment for business combinations made in fiscal 2010 and subsequent years.
ACTUANT CORPORATION
NOTES TO CONSOLIDATED FINANCIAL STATEMENTS—(Continued)
combinations.
Note 2. Acquisitions
The Company has completed several business acquisitions during each of the last three years. The resultsAll of operations for all of these transactions are included in the accompanying Consolidated Financial Statements only since their acquisition dates. Additionally, all of the acquisitions resulted in the recognition of goodwill in the Company’s Consolidated Financial Statementsconsolidated financial statements because the purchase prices reflect the future earnings and cash flow potential of these companies, as well as the complementary strategic fit and resulting synergies these businesses bring to existing operations. The Company is continuing to evaluate the initial purchase price allocations for the acquisitions completed within the past twelve months and will adjust the allocations asif additional information relative to the fair values of the assets and liabilities of the acquired businesses become known.
Fiscal 2010
During fiscal 2010, the Company completed four tuck-in acquisitions for $43.9 million of cash (net of cash acquired), $2.5 million of deferred purchase price and $4.5 million of contingent consideration. On April 9, 2010 the Company acquired Team Hydrotec, a Singapore based business that provides engineering and integrated solutions primarily to the infrastructure, energy and industrial markets. This was followed by the acquisition of
ACTUANT CORPORATION
NOTES TO CONSOLIDATED FINANCIAL STATEMENTS—(Continued)
Hydrospex on April 14, 2010. Headquartered in The Netherlands, Hydrospex is a leading provider of a broad range of heavy-lift technologies including strand jacks and gantries for the global infrastructure, power generation and other industrial markets. The products, technologies, engineering and geographic breadth of both Team Hydrotec and Hydrospex will further strengthen the market positions of the Industrial Segment. On April 27, 2010, the Company completed the acquisition of New Jersey based Biach Industries, which provides custom designed bolt and stud tensioning products and services, predominately for the North American nuclear market. Biach Industries, through its strong customer relationships, engineering expertise and customized products will broaden the product and service offerings of the Energy segment to the global power generation market. Finally, on June 11, 2010 the Company completed the acquisition of Norway based Selantic, which is included in the Energy Segment. Selantic provides custom designed high performance slings, tethers and related products for heavy lifting applications.
The purchase price allocations for fiscal 2010 acquisitions resulted in the recognition of $33.7 million of goodwill (a portion of which is deductible for tax purposes) and $18.2 million of intangible assets, including $14.5 million of customer relationships, $2.5 million of tradenames, $1.2 million of non-compete agreements and patents. The amounts assigned to customer relationships and non-compete agreements are amortized over 15 years and 3-5 years, respectively. The operating results of the acquired businesses (which were not significant during fiscal 2010) are included in the consolidated financial statements only since their respective acquisition dates. During fiscal 2010, the Company also paid $2.0 million of deferred purchase price for acquisitions completed in previous years and recognized acquisition transaction costs of $1.1 million in the consolidated statement of earnings related to various business acquisition activities.
The following table summarizes the estimated fair values of the assets acquired and the liabilities assumed at the date of acquisition for the businesses acquired during fiscal 2010 (in thousands):
| Total | ||||
Accounts receivable, net | $ | 7,395 | ||
Inventories | 10,996 | |||
Other current assets | 141 | |||
Property, plant & equipment | 2,250 | |||
Goodwill | 33,701 | |||
Other intangible assets | 18,230 | |||
Trade accounts payable | (3,242 | ) | ||
Other current liabilities | (14,667 | ) | ||
Deferred/contingent purchase price payable | (7,065 | ) | ||
Deferred income taxes | (3,667 | ) | ||
Other noncurrent liabilities | (206 | ) | ||
Cash paid, net of cash acquired | $ | 43,866 | ||
Fiscal 2009
On September 26, 2008, the Company completed the acquisition of the stock of The Cortland Companies (“Cortland”) for approximately $231.2 million in cash, net of cash acquired. Cortland is a global designer, manufacturer and distributor of custom-engineered electro-mechanical cables and umbilicals, high performance synthetic ropes and value-added steel cable assemblies. The majority of the Cortland businesses are included within the Energy segment, while the steel cable assembly business (Sanlo) is included in the Other product line within the Engineered Solutions segment. The preliminary purchase price allocation resulted in $129.1$131.1 million assigned to goodwill (a portion of which is deductible for tax purposes), $17.8 million to tradenames, $1.3 million to
ACTUANT CORPORATION
NOTES TO CONSOLIDATED FINANCIAL STATEMENTS—(Continued)
non-compete agreements, $4.3 million to patents and $81.4 million to customer relationships. The amounts assigned to non-compete agreements, patents and customer relationships are being amortized over 3, 8 and 15 years, respectively.
In addition to the acquisition of Cortland, the Company also completed several smaller product line acquisitions for an aggregate purchase price of $7.4 million of cash and a seller note payabledeferred purchase price of $2.5 million. During fiscal 2009, the Company also paid approximately $0.8 million in earn-out payments for acquisitions completed in previous years. The following table summarizes the estimated fair values of the assets acquired and the liabilities assumed at the date of acquisition for the businesses acquired during the fiscal year ended August 31, 2009 (in thousands):
| Total | ||||
Accounts receivable, net | $ | 13,246 | ||
Inventories | 16,625 | |||
Other current assets | 682 | |||
Property, plant & equipment | 15,565 | |||
Goodwill | 132,122 | |||
Other intangible assets | 111,012 | |||
Trade accounts payable | (9,213 | ) | ||
Other current liabilities | (13,164 | ) | ||
Deferred income taxes | (28,203 | ) | ||
Cash paid, net of cash acquired | $ | 238,672 | ||
Fiscal 2008
On March 3, 2008, the Company acquired Superior Plant Services, LLC, (“SPS”) for approximately $57.7 million of cash. SPS, which is included in the Energy Segment, is a specialized maintenance services company serving the North American oil & gas and nuclear power industries. Its services include field machining, flange weld testing, line isolation, bolting, heat treating and metal disintegration. The purchase price allocation resulted in $22.9 million assigned to goodwill (which is deductible for tax purposes), $0.2 million to trademarks,
ACTUANT CORPORATION
NOTES TO CONSOLIDATED FINANCIAL STATEMENTS—(Continued)
$1.5 $1.5 million to non-compete agreements and $25.3 million customer relationships. The amounts assigned to tradenames, non-compete agreements, and customer relationships are being amortized over 1, 5 and 15 years, respectively.
On September 13, 2007, the Company acquired Templeton, Kenly & Co, Inc. (“TK”) for approximately $47.3 million of cash. TK, which is included in the Industrial segment, manufactures hydraulic pumps and tools, mechanical jacks, wrenches and actuators. The purchase price allocation resulted in $14.4 million assigned to goodwill (which is deductible for tax purposes), $1.7 million to tradenames, $0.3 million to non-compete agreements, $0.3 to patents and $19.2 million assigned to customer relationships. The amounts assigned to non-compete agreements, patents and customer relationships are being amortized over 3, 5 and 15 years, respectively.
In addition to the $105.0 million of cash used for these two acquisitions in fiscal 2008, the Company paid approximately $5.1 million in earn-outcontingent consideration and other related payments for previous acquisitions, which resulted in additional goodwill.
Fiscal 2007
On June 29, 2007, the Company acquired BH Electronics, Inc. (“BH”) for approximately $30.0 million of cash. BH produced dashboard control panels and electronic assembly systems, primarily for the recreational boating market. The purchase price allocation resulted in $14.4 million assigned to goodwill (which is not deductible for tax purposes), $2.8 million to tradenames, $0.1 million to non-compete agreements and $9.3 million to customer relationships. As discussed in Note 3, “Discontinued Operations” the Company divested BH in the fourth quarter of fiscal 2009.
On April 16, 2007, the Company acquired T.T. Fijnmechanica B.V. (“TTF”) for approximately $23.0 million of cash. TTF, which is included in the Industrial segment, supplies products and systems for use in the bridge building, infrastructure, and heavy lifting markets. Products include wedges, anchor heads, multi-strand jacks and heavy lifting systems. The purchase price allocation resulted in $11.8 million assigned to goodwill (which is not currently deductible for tax purposes), $2.7 million to tradenames, $0.7 million to non-compete agreements and $6.8 million to customer relationships. The amounts assigned to non-compete agreements and customer relationships are being amortized over 3 and 15 years, respectively.
On January 22, 2007, the Company acquired all of the outstanding stock of Injectaseal Deutschland GmbH (“Injectaseal”) for $13.0 million of cash. Injectaseal, which is included in the Energy segment, provides leak management, on-site machining, pipeline intervention and safety valve testing services primarily to Western European oil & gas and power generation companies. The purchase price allocation resulted in $11.2 million assigned to goodwill (which is not currently deductible for tax purposes), $0.1 million to non-compete agreements and $1.8 million to customer relationships. The amounts assigned to the non-compete agreements and the customer relationships are being amortized over 3 years and 15 years, respectively.
On January 5, 2007, the Company acquired all of the outstanding stock of Veha Haaksbergen B.V. (“Veha”) for $5.0 million of cash. Veha, which is included in the Industrial segment, manufactures machined products including hydraulic cylinders. The purchase price allocation resulted in $2.2 million assigned to goodwill (which is not currently deductible for tax purposes), $0.2 million to non-compete agreements and $0.5 million to customer relationships. The amounts assigned to the non-compete agreements and customer relationships are being amortized over 3 years and 10 years, respectively.
On December 22, 2006, the Company acquired all of the outstanding stock of Maxima Technologies (“Maxima”) for $91.0 million, including the assumption of approximately $1.9 million of Maxima’s debt. Maxima, which is included in the Other product line in the Engineered Solutions segment, is a global electronics company specializing in custom-engineered and standard vehicle instrumentation, controls, components and
ACTUANT CORPORATION
NOTES TO CONSOLIDATED FINANCIAL STATEMENTS—(Continued)
systems for low-to-medium volume severe-duty applications. Maxima serves the marine, agricultural, construction equipment, industrial, specialty vehicle, and automotive aftermarket. The purchase price allocation resulted in $48.0 million to goodwill (which is not currently deductible for tax purposes), $7.7 million to tradenames, $6.8 million to patents and $19.3 million to customer relationships. The amounts assigned to patents and customer relationships are being amortized over periods of 10 and 15 years, respectively.
The following unaudited pro forma results of operations of the Company give effect to all acquisitions completed since September 1, 20062007 as though the transactions and related financing activities had occurred on September 1, 20062007 (in thousands, except per share amounts).
| Fiscal Year Ended August 31, | Fiscal Year Ended August 31, | ||||||||||||||||||||
| 2009 | 2008 | 2007 | 2010 | 2009 | 2008 | ||||||||||||||||
Net sales | |||||||||||||||||||||
As reported | $ | 1,239,798 | $ | 1,613,190 | $ | 1,436,212 | $ | 1,160,508 | $ | 1,117,625 | $ | 1,446,140 | |||||||||
Pro forma | 1,250,897 | 1,729,556 | 1,605,618 | 1,190,521 | 1,169,994 | 1,600,421 | |||||||||||||||
Earnings from continuing operations | |||||||||||||||||||||
As reported | $ | 23,851 | $ | 119,178 | $ | 103,031 | $ | 70,356 | $ | 25,982 | $ | 125,791 | |||||||||
Pro forma | 24,841 | 118,538 | 100,344 | 72,827 | 28,654 | 126,150 | |||||||||||||||
Basic earnings per share from continuing operations | |||||||||||||||||||||
As reported | $ | 0.41 | $ | 2.14 | $ | 1.88 | $ | 1.04 | $ | 0.45 | $ | 2.25 | |||||||||
Pro forma | 0.43 | 2.12 | 1.83 | 1.08 | 0.49 | 2.26 | |||||||||||||||
Diluted earnings per share from continuing operations | |||||||||||||||||||||
As reported | $ | 0.40 | $ | 1.88 | $ | 1.66 | $ | 0.97 | $ | 0.43 | $ | 1.98 | |||||||||
Pro forma | 0.41 | 1.87 | 1.62 | 1.01 | 0.47 | 1.98 | |||||||||||||||
ACTUANT CORPORATION
NOTES TO CONSOLIDATED FINANCIAL STATEMENTS—(Continued)
Note 3. Discontinued Operations
During the fourth quarter of fiscal 2009, as2010, the Company committed to a plan to divest its European Electrical business (Electrical segment), which designs, manufactures and markets electrical sockets, switches and other tools and consumables predominately in the European DIY retail market. This planned divestiture is part of its continuous process ofthe Company’s portfolio management process to focus on businesses that create the most shareholder value. Weak economic conditions throughout Europe and evaluationreduced demand in the retail DIY markets, combined with the decision to divest the business caused the Company to reduce the projected sales, operating profit and cash flows of strategic initiatives,the European Electrical business, which resulted in a $36.1 million non-cash asset impairment charge to adjust the carrying value of the asset group to fair value. The impairment charge consists of $24.5 million of goodwill, $2.3 million of intangible assets and $9.3 million of property, plant and equipment and other assets. As a result of the impairment charge there is no remaining goodwill or intangible assets of the European Electrical business.
The following is a summary of the August 31, 2010 assets and liabilities of discontinued operations (in thousands):
Accounts receivable, net | $ | 20,379 | ||
Inventories, net | 21,771 | |||
Other assets | 2,434 | |||
Property, plant & equipment, net | 218 | |||
Assets of discontinued operations | $ | 44,802 | ||
Trade accounts payable | $ | 9,428 | ||
Accrued compensation and benefits | 1,647 | |||
Other current liabilities | 8,020 | |||
Pension benefit accruals | 17,161 | |||
Other long-term liabilities | 1,439 | |||
Liabilities of discontinued operations | $ | 37,695 | ||
During the second quarter of fiscal 2010, the Company divested a portion of its European Electrical product line for $7.5 million of cash proceeds, which resulted in a net pre-tax gain on disposal of $0.3 million. In addition, during the fourth quarter of fiscal 2009, the Company sold the Acme Aerospace (Engineered Solutions Segment)segment) and BH Electronics (Electrical Segment)segment) businesses in separate transactions for total cash proceeds of $38.5 million, net of transaction costs. As a result of the sale transactions, the Company recognized a net pre-tax gain of $17.8 million in the fourth quarter of fiscal 2009. In accordance with the provisions of SFAS No. 144, “Accounting for the Impairment or Disposal of Long-Lived Assets,” theThe results of operations for the divested businesses have been reported as discontinued operations for all periods presented. The following table summarizes the results of discontinued operations for the divested businesses (in thousands, except per share amounts)thousands):
| Year Ended August 31, | ||||||||||
| 2009 | 2008 | 2007 | ||||||||
Net sales | $ | 23,756 | $ | 50,754 | $ | 22,536 | ||||
Net gain on disposal | 17,800 | — | — | |||||||
Earnings (loss) from operations of divested businesses (1) | (30,717 | ) | 5,315 | 3,070 | ||||||
Income tax expense (benefit) | (2,789 | ) | 1,949 | 1,149 | ||||||
Earnings (loss) from discontinued operations, net of income tax | $ | (10,128 | ) | $ | 3,366 | $ | 1,921 | |||
Earnings (loss) from discontinued operations per share: | ||||||||||
Basic | $ | (0.17 | ) | $ | 0.06 | $ | 0.04 | |||
Diluted | (0.16 | ) | 0.05 | 0.03 | ||||||
| 2010 | 2009 | 2008 | ||||||||||
Net sales | $ | 105,661 | $ | 145,929 | $ | 217,804 | ||||||
Net gain on disposal | 334 | 17,800 | — | |||||||||
Loss from operations of discontinued businesses (1) | (41,525 | ) | (33,933 | ) | (4,371 | ) | ||||||
Income tax expense (benefit) (2) | 5,134 | (3,874 | ) | (1,124 | ) | |||||||
Loss from discontinued operations, net of income tax | $ | (46,325 | ) | $ | (12,259 | ) | $ | (3,247 | ) | |||
| (1) |
| (2) | Fiscal 2010 includes incremental tax expense of $4.3 million related to |
ACTUANT CORPORATION
NOTES TO CONSOLIDATED FINANCIAL STATEMENTS—(Continued)
Note 4. Restructuring
In fiscal 2010 and 2009, the Company committed to various restructuring initiatives including workforce reductions, plant consolidations, to reduce manufacturing overhead, the continued movementtransfer of production and product sourcing to lowlower cost countriesplants or regions and the centralization of certain selling and administrative functions. The totalOf the 2010 and 2009 restructuring charges for these activities were $23.8costs recognized, $1.1 million (includingand $1.3 million, includedrespectively were recognized in Cost of Products Sold). TheseSold, with the remainder recognized in Selling, Administrative and Engineering Expenses in the consolidated statement of earnings. Total restructuring charges,costs recognized, which impact all reportable segments include $15.9 million of severance, $4.6 million of facility consolidation charges and $3.3 million other restructuring costs. are as follows (in thousands):
| Year Ended August 31, | ||||||||
| 2010 | 2009 | |||||||
Severance and facility consolidation | $ | 9,726 | $ | 15,733 | ||||
Product line rationalization | 1,096 | 1,313 | ||||||
Other restructuring costs | 5,872 | 3,797 | ||||||
| $ | 16,694 | $ | 20,843 | |||||
The remaining severance will be paid during the next twelve months, while the facility consolidation costs (primarily reserves for future minimum lease payments for vacated facilities) will be paid over the term of the lease. The Company expects to incur an additional $10-$12 million of restructuring charges in fiscal 2010 as current restructuring actions are completed. Afollowing is a rollforward of the restructuring reserve (included in Other Current Liabilities and Other Long Term Liabilities in the Consolidated Balance Sheet) is as followsconsolidated balance sheet) for fiscal years 2010 and 2009 (in thousands):
| 2009 | ||||
Beginning Balance | $ | — | ||
Restructuring charges | 23,753 | |||
Cash payments | (9,689 | ) | ||
Product line rationalization | (1,313 | ) | ||
Other non-cash uses of reserve | (1,658 | ) | ||
Impact of changes in foreign currency rates | 437 | |||
Ending Balance | $ | 11,530 | ||
During the second quarter of fiscal 2008, the Company completed a specific restructuring plan in its European Electrical business (Electrical segment) at a cumulative pre-tax cost of $20.8 million. The balance of the related restructuring reserve was $3.8 million and $5.1 million at August 31, 2009 and 2008, respectively. The decrease in the restructuring reserve is due to cash payments of $1.1 million and the impact of changes in foreign currency rates. The remaining restructuring reserve primarily relates to future minimum lease payments for vacated facilities, which will be paid over the term of the lease.
| 2010 | 2009 | |||||||
Beginning balance | $ | 9,282 | $ | — | ||||
Restructuring charges | 16,694 | 20,843 | ||||||
Cash payments | (14,914 | ) | (9,333 | ) | ||||
Product line rationalization | (1,096 | ) | (1,313 | ) | ||||
Other non-cash uses of reserve | (4,571 | ) | (1,658 | ) | ||||
Impact of changes in foreign currency rates | 1,122 | 743 | ||||||
Ending balance | $ | 6,517 | $ | 9,282 | ||||
Note 5. Accounts Receivable Securitization
TheHistorically, the Company maintainswas a party to an accounts receivable securitization program wherebypursuant to which it sellssold certain of its trade accounts receivable to a wholly owned,wholly-owned, bankruptcy-remote special purpose subsidiary which, in turn, sellssold participating interests in its pool of receivables to a third-partythird party financial institution (the “Purchaser”).institution. The Purchaser receives an ownership and security interest in the pool of receivables. New receivables are purchased by the special purpose subsidiary and participation interests are resold to the Purchaser as collections reduce previously sold participation interests. The Company has retained collection and administrative responsibilities on the participation interests sold. The Purchaser has no recourse against the Company for uncollectible receivables; however, the Company’s retained interest in the receivable pool is subordinate to the Purchaser and is recorded at fair value. Due to a short average collection cycle of approximately 60 days for such accounts receivable and the Company’s collection history, the fair value of the Company’s retained interest approximates book value. Book value of accounts receivable in the accompanying Consolidated Balance Sheets is comprised of the gross accounts receivable retained interest less a reserve for doubtful accounts, which is calculated based on a review of the specific receivable issues and supplemented by a general reserve based on past collection history. The retained interest recorded at August 31, 2009 and 2008 was $28.8 million and $47.7 million, respectively, and is included in Accounts Receivable in the accompanying Consolidated Balance Sheets. Subsequent to August 31, 2009, the Company did not renew the securitization program on its scheduledSeptember 9, 2009 maturity date of September 8, 2009. Working capital has increased since then, reflectingand as a result, utilized availability under the end of this arrangement.
ACTUANT CORPORATION
NOTES TO CONSOLIDATED FINANCIAL STATEMENTS—(Continued)
TradeSenior Credit Facility to fund the corresponding $37.1 million increase in accounts receivables sold and being serviced by the Company totaled $37.1 and $52.9 millionreceivable. The retained interest at August 31, 2009 was $28.8 million and 2008, respectively.
was included in Accounts Receivable, net in the accompanying consolidated balance sheets. Sales of trade receivables from the special purpose subsidiary totaled $352.7 million $457.9 million, and $403.2$457.9 million for the years ended August 31, 2009 and 2008, and 2007, respectively. Cashrespectively while related cash collections of trade accounts receivable balances induring the total receivable pool (including both sold and retained portions)same periods totaled $608.0 million and $803.4 million, respectively (included in operating activities in the consolidated statement of cash flows). Financing costs related to the accounts receivable securitization program were $1.6 million and $709.2$2.6 million for the years ended August 31, 2009 and 2008, and 2007, respectively.
The accounts receivables securitization program is accounted for as a sale in accordance with SFAS No. 140“Accounting for Transfers and Servicing of Financial Assets and Extinguishment of Liabilities—a Replacement of FASB Statement No. 125.” Sales of trade receivables are reflected as a reduction of accounts receivable in the accompanying Consolidated Balance Sheets and the proceeds received are included in cash flows from operating activities in the accompanying Consolidated Statements of Cash Flows.
The following table provides additional information about delinquencies and net credit losses for trade accounts receivable subject to the accounts receivable securitization program (in thousands).
| Balance Outstanding August 31, | Balance Outstanding 60 Days or More Past Due August 31, | Net Credit Losses Year Ended August 31, | ||||||||||||||||
| 2009 | 2008 | 2009 | 2008 | 2009 | 2008 | |||||||||||||
Trade accounts receivable subject to securitization program | $ | 65,898 | $ | 100,603 | $ | 5,719 | $ | 8,251 | $ | 1,755 | $ | 790 | ||||||
Trade accounts receivable balances sold | 37,106 | 52,943 | ||||||||||||||||
Retained interest | $ | 28,792 | $ | 47,660 | ||||||||||||||
Accounts receivable financing costs of $1.6 million, $2.6 million, and $3.2 million for the years ended August 31, 2009, 2008 and 2007, respectively, are included in Financing costs, net in the accompanying Consolidated Statements of Earnings.
Note 6. Impairment Charges
The Company’s goodwill is tested for impairment annually, at August 31, or more frequently if events or changes in circumstances indicate that goodwill might be impaired. The Company performs impairment reviews for its reporting units using the discounted cash flow method based on management’s judgments and assumptions. The estimated fair value of the reporting unit is compared to the carrying amount of the reporting unit, including goodwill. If the carrying value of the reporting unit exceeds its fair value, the goodwill is potentially impaired and the Company then determines the implied fair value of goodwill, which is compared to the carrying value to determine if impairment exists. Indefinite lived intangible assets are also subject to an annual impairment tests. On an annual basis, or more frequently if events or changes in circumstances indicate that the asset might be impaired, the fair value of the indefinite lived intangible assets are evaluated by the Company to determine if an impairment charge is required.
Significant adverse developments in the recreational vehicle (“RV”) market in the first quarter of fiscal 2009 had a dramatic effect on the Company’s RV business (included in the Engineered(Engineered Solutions segment). Its financial results were negatively impacted by lower wholesale motorhome shipments by OEM’s, decreased
ACTUANT CORPORATION
NOTES TO CONSOLIDATED FINANCIAL STATEMENTS—(Continued)
consumer confidence and the lack of financing as a result of the continued global credit crisis. These factors caused the Company to significantly
ACTUANT CORPORATION
NOTES TO CONSOLIDATED FINANCIAL STATEMENTS—(Continued)
reduce its projections for sales, operating profits and cash flows of the RV business, and resulted in the recognition of a $26.6 million non-cash asset impairment charge during the three months ended November 30, 2008. The asset impairment charge included the $22.2 million write-off of all remaining goodwill in the RV business. In addition, a $0.8 million impairment was recognized related to indefinite lived intangibles (tradenames). Due to the existing impairment indicators, management assessed the recoverability of the RV business fixed assets and amortizable intangible assets (customer relationships, patents and trademarks). An impairment charge of $3.6 million was recognized for the difference between the fair value and carrying value of such assets.
In addition, duringDuring the third quarter of fiscal 2009, the Company recorded a $31.7 million non-cash asset impairment charge related to the goodwill, indefinite lived intangibles and long-lived assets of the harsh environment electrical business (included in the Electrical(Electrical Segment). Approximately $27.0 million of the impairment charge is included in the Loss From Discontinued Operations for fiscal 2009 in the accompanied Consolidated Statementconsolidated statement of Earnings.earnings. Poor economic conditions, low consumer confidence, increased unemployment and tight credit markets have negatively impacted consumer discretionary spending, resulting in a substantial reduction in recreational boating industry sales. OEM boat builders have responded to the sharp drop in demand and high levels of finished goods inventory by suspending operations as well as eliminating brands and permanently closing facilities. These actions caused the Company to significantly reduce its projections for sales, operating profits and cash flows for the harsh environment electrical business, which resulted in a $14.4 million goodwill impairment charge and a $7.5 million impairment of indefinite lived intangibles (tradenames). As a result of the impairment charges there is no remaining goodwill or indefinite lived intangibles related to the marine OEM business. Due to the then existing indicators of impairment, management also assessed the recoverability of the related long-lived assets during the three months ended May 31, 2009 and recorded a $1.6 million impairment on fixed assets and an $8.2 million impairment of amortizable intangibles (customer relationships), for the difference between the fair value and carrying value. As discussed in Note 3, “Discontinued Operations,” the Company subsequently divested the marine OEM business, BH Electronics.Electronics, in the fourth quarter of fiscal 2009.
Note 7. Goodwill and other Intangible Assets
The changes in the carrying amount of goodwill for the years ended August 31, 20092010 and 20082009 are presented in the following table (in thousands):
| Industrial | Energy | Electrical | Engineered Solutions | Total | ||||||||||||||||||||||||||||||||||||
Balance as of August 31, 2007 | $ | 50,159 | $ | 113,731 | $ | 211,491 | $ | 224,460 | $ | 599,841 | ||||||||||||||||||||||||||||||
Businesses acquired | 14,416 | 22,573 | — | — | 36,989 | |||||||||||||||||||||||||||||||||||
Purchase accounting adjustments | (116 | ) | 2,212 | 1,019 | — | 3,115 | ||||||||||||||||||||||||||||||||||
Impact of changes in foreign currency rates | 878 | (5,359 | ) | 1,897 | 2,501 | (83 | ) | |||||||||||||||||||||||||||||||||
| Industrial | Energy | Electrical | Engineered Solutions | Total (1) | ||||||||||||||||||||||||||||||||||||
Balance as of August 31, 2008 | 65,337 | 133,157 | 214,407 | 226,961 | 639,862 | $ | 65,337 | $ | 133,157 | $ | 214,407 | $ | 226,961 | $ | 639,862 | |||||||||||||||||||||||||
Businesses acquired | — | 111,828 | — | 20,294 | 132,122 | — | 111,828 | — | 20,294 | 132,122 | ||||||||||||||||||||||||||||||
Purchase accounting adjustments | — | 331 | — | 750 | 1,081 | — | 331 | — | 750 | 1,081 | ||||||||||||||||||||||||||||||
Impairment charges | — | — | (14,440 | ) | (22,205 | ) | (36,645 | ) | — | — | (14,440 | ) | (22,205 | ) | (36,645 | ) | ||||||||||||||||||||||||
Business divested | — | — | — | (6,719 | ) | (6,719 | ) | — | — | — | (6,719 | ) | (6,719 | ) | ||||||||||||||||||||||||||
Impact of changes in foreign currency rates | (649 | ) | (16,782 | ) | (738 | ) | (10 | ) | (18,179 | ) | (649 | ) | (16,782 | ) | (738 | ) | (10 | ) | (18,179 | ) | ||||||||||||||||||||
Balance as August 31, 2009 | $ | 64,688 | $ | 228,534 | $ | 199,229 | $ | 219,071 | $ | 711,522 | 64,688 | 228,534 | 199,229 | 219,071 | 711,522 | |||||||||||||||||||||||||
Businesses acquired | 15,630 | 18,071 | — | — | 33,701 | |||||||||||||||||||||||||||||||||||
Purchase accounting adjustments | — | 1,581 | — | — | 1,581 | |||||||||||||||||||||||||||||||||||
Impairment charges | — | — | (24,542 | ) | — | (24,542 | ) | |||||||||||||||||||||||||||||||||
Impact of changes in foreign currency rates | (2,382 | ) | (7,596 | ) | (3,148 | ) | (4,247 | ) | (17,373 | ) | ||||||||||||||||||||||||||||||
Balance as August 31, 2010 | $ | 77,936 | $ | 240,590 | $ | 171,539 | $ | 214,824 | $ | 704,889 | ||||||||||||||||||||||||||||||
| (1) | Cumulative goodwill impairment charges were $61.2 million and $36.6 million at August 31, 2010 and 2009, respectively. |
ACTUANT CORPORATION
NOTES TO CONSOLIDATED FINANCIAL STATEMENTS—(Continued)
The gross carrying amount and accumulated amortization of the Company’s intangible assets that have defined useful lives and are subject to amortization as of August 31, 20092010 and 20082009 are as follows (in thousands):
| August 31, 2009 | August 31, 2008 | August 31, 2010 | August 31, 2009 | |||||||||||||||||||||||||||||||||||||||
| Gross Carrying Amount | Accumulated Amortization | Net Book Value | Gross Carrying Amount | Accumulated Amortization | Net Book Value | Gross Carrying Amount | Accumulated Amortization | Net Book Value | Gross Carrying Amount | Accumulated Amortization | Net Book Value | |||||||||||||||||||||||||||||||
Customer relationships | $ | 232,751 | $ | 37,396 | $ | 195,355 | $ | 163,956 | $ | 24,529 | $ | 139,427 | $ | 242,384 | $ | 53,013 | $ | 189,371 | $ | 232,751 | $ | 37,396 | $ | 195,355 | ||||||||||||||||||
Patents | 45,153 | 23,871 | 21,282 | 44,200 | 21,289 | 22,911 | 44,987 | 27,264 | 17,723 | 45,153 | 23,871 | 21,282 | ||||||||||||||||||||||||||||||
Trademarks | 6,258 | 4,928 | 1,330 | 6,556 | 3,640 | 2,916 | 6,205 | 5,103 | 1,102 | 6,258 | 4,928 | 1,330 | ||||||||||||||||||||||||||||||
Non-compete agreements | 5,277 | 2,817 | 2,460 | 3,914 | 1,784 | 2,130 | 6,220 | 4,171 | 2,049 | 5,277 | 2,817 | 2,460 | ||||||||||||||||||||||||||||||
Other | 792 | 549 | 243 | 656 | 318 | 338 | 721 | 584 | 137 | 792 | 549 | 243 | ||||||||||||||||||||||||||||||
| $ | 290,231 | $ | 69,561 | $ | 220,670 | $ | 219,282 | $ | 51,560 | $ | 167,722 | $ | 300,517 | $ | 90,135 | $ | 210,382 | $ | 290,231 | $ | 69,561 | $ | 220,670 | |||||||||||||||||||
The gross carrying amount of the Company’s intangible assets that have indefinite lives and are not subject to amortization as of August 31, 2010 and 2009 and 2008 are $129.6$126.6 million and $124.7$129.6 million, respectively. These assets are comprised of acquired tradenames.
The increase in the gross carrying amounts of goodwill and other intangible assets is the result of acquisitions completed in fiscal 2009 partially offset by divestitures, impairment charges and the impact of changes in foreign currency rates.
Amortization expense recorded on intangible assets for the years ended August 31, 2010, 2009 and 2008 and 2007 was $22.0 million, $19.7 million $13.9 million and $10.6$13.9 million respectively. Amortization expense for future years is estimated to be as follows: $22.0 million in fiscal 2010, $20.4$22.1 million in fiscal 2011, $18.6$19.9 million in fiscal 2012, $17.4$18.3 million in fiscal 2013, $16.9$17.6 million in fiscal 2014, $17.5 million in fiscal 2015, and $125.4$115.0 million thereafter. The future amortization expense amounts represent estimates, which may change based on future acquisitions or changes in foreign currency exchange rates.
Note 8. Debt
Long-term Debt: The following is a summary of the Company’s long-term indebtedness at the end of its two most recently completed fiscal years was as follows (in thousands):
| August 31, | ||||||
| 2009 | 2008 | |||||
Senior Credit Facility | ||||||
Revolver | $ | 10,000 | $ | — | ||
Term loan | — | 155,000 | ||||
6.875% Senior Notes | 249,235 | 249,137 | ||||
Fair Value of cross currency interest rate swap | — | 19,681 | ||||
Sub-total—Senior indebtedness | 259,235 | 423,818 | ||||
Convertible subordinated debentures (“2% Convertible Notes”) | 140,900 | 150,000 | ||||
| $ | 400,135 | $ | 573,818 | |||
| August 31, | ||||||||
| 2010 | 2009 | |||||||
Senior Credit Facility—Revolver | $ | — | $ | 10,000 | ||||
6.875% Senior notes | 249,334 | 249,235 | ||||||
Other debt | 203 | — | ||||||
Total Senior Indebtedness | 249,537 | 259,235 | ||||||
Convertible subordinated debentures (“2% Convertible Notes”) | 117,843 | 140,900 | ||||||
| $ | 367,380 | $ | 400,135 | |||||
The Company amended its Senior Credit Facility, which matures on November 10, 2008 and June 10, 2009. The first amendment extended the maturity to November 10, 2011, and increased total capacity by $110 million, while the June amendment provided additional flexibility with respect to financial covenants. The amended Senior Credit Facility provided forprovides a $400 million revolving credit facility and a $115 million term loan. However, the $115 million term loan was repaid in June 2009 with proceeds from the follow-on equity offering. All amended Senior
ACTUANT CORPORATION
NOTES TO CONSOLIDATED FINANCIAL STATEMENTS—(Continued)
Credit Facility borrowingsbears interest at LIBOR plus 3.25% (aggregating 3.56% at August 31, 2010). Borrowings are subject to a pricing grid, which can result in increases or decreases to the borrowing spread on a quarterly basis, depending on the Company’s debt to EBIDTA leverage ratio. Borrowings under the revolver bear interest at LIBOR plus 3.75% (aggregating 4.1% at August 31, 2009). In addition, a non-use fee is payable quarterly on the average unused credit line under the revolver. At August 31, 2009,2010, the non-use fee was 0.5% annually, and the unused credit line under the revolver was approximately $389.4$398.1 million, of which $285.5$325.0 million was available for borrowings. The amended Senior Credit Facility, which is secured by substantially all of the Company’s domestic personal property assets, also contains customary limits and restrictions concerning investments, sales of assets, liens on assets, dividends and other payments. The two financial covenants included in the amended Senior Credit Facility agreement are a maximum leverage ratio (which was increased from its then current limit of 3.5:1 to 4.0:1 through August 31, 2009 and to 4.5:1 through February 28, 2010, declining quarterly to 3.5:1 by November 30, 2010) and a minimum fixed charge coverage ratio (which was reduced from 1.75:1 toof 1.65:1).1. The Company was in compliance with all debt covenants as ofat August 31, 2009, and based on the Company’s forecast, continued compliance is expected through the term of the agreement. The Company’s ability to comply with the covenants in the future depends on the global economy, credit market conditions and other factors.2010.
ACTUANT CORPORATION
NOTES TO CONSOLIDATED FINANCIAL STATEMENTS—(Continued)
On June 12, 2007, the Company issued $250.0 million of 6.875% Senior Notes (the “Senior Notes”) at an approximate $1.0 million discount, generating net proceeds of $249.0 million. The Senior Notes were issued at a price of 99.607% to yield 6.93%, and require no principal installments prior to their June 15, 2017 maturity. The approximate $1.0 million initial issuance discount is being amortized through interest expense over the 10 year life of the Senior Notes. Semiannual interest payments on the Senior Notes are due in December and June of each year.
In November 2003, the Company issued $150.0 million of Senior Subordinated Convertible Debentures due November 15, 2023 (the “2% Convertible Notes”). The 2% Convertible Notes bear interest at a rate of 2.0% annually which is payable on November 15 and May 15 of each year. Beginning with the six-month interest period commencing November 15, 2010, holders will receive contingent interest if the trading price of the 2% Convertible Notes equals or exceeds 120% of their underlying principal amount over a specified trading period. If payable, the contingent interest shall equal 0.25% of the average trading price of the 2% Convertible Notes during the five days immediately preceding the applicable six-monthnine month interest periods. The Company may redeem all or part of the 2% Convertible Notes on or after November 20, 2010 for cash, at a cash redemption price equal to 100% of the principal amount, plus accrued interest. In addition, holder’sholders of the 2% Convertible Notes have the option to require the Company to repurchase all or a portion of their 2% Convertible Notes for cash on November 15, 2010, November 15, 2013 and November 15, 2018 at a repurchase price equal to 100% of the principal amount of the notes, plus accrued interest. Any “put” of 2% Convertible Notes will be funded through availability under the Senior Credit Facility (which matures on November 10, 2011); and therefore, the outstanding 2% Convertible Notes are classified as long-term indebtedness in the consolidated balance sheets. If certain conditions are met, holders may also convert their 2% Convertible Notes into shares of the Company’s Class A common stock prior to the scheduled maturity date. In Augustthe fourth quarter of fiscal 2009, the Company repurchased $9.1 million of 2% Convertible Notes and subsequent to August 31, 2009,in addition, repurchased an additional $23.1 million during the first quarter of 2% Convertible Notes.fiscal 2010. These cash repurchases were made at an average price of 99.3% of the par value of the 2% Convertible Notes. After considering these repurchases, thevalue. The remaining $117.8 million of 2% Convertible Notes, are convertible into 5,905,419 shares of the Company’s Class A common stock at a conversion rate of 50.1126 shares per $1,000 of principal amount, which equalsequates to a conversion price of approximately $19.96 per share (subject to adjustment).
In November 2008, the Company terminated its then existing cross-currency interest rate swap agreement (the “swap agreement”). At August 31, 2008 the fair value of the swap agreement was a $19.7 million liability, which was included in long-term debt in the accompanying Consolidated Balance Sheets. As a result of the strengthening of the U.S. dollar during the three months ended November 30, 2008, the Company received $2.1 million of cash from the counterparties upon termination of the swap agreement.
ACTUANT CORPORATION
NOTES TO CONSOLIDATED FINANCIAL STATEMENTS—(Continued)
share.
The Company made cash interest payments of $26.8 million, $36.1 million, $35.0 million, and $28.3$35.0 million in fiscal 2010, 2009 and 2008, and 2007, respectively.
Note 9. Fair Value Measurements
The Company adopted SFASIn accordance with ASC No. 157 on September 1, 2008, which requires expanded disclosure for financial assets820, “Fair Value Measurements and liabilities measured at fair value. TheDisclosures,” the Company assesses the inputs used to measure the fair value of financial assets and liabilities using a three-tier hierarchy. Level 1 inputs include quoted prices for identical instruments and are the most observable. Level 2 inputs include quoted prices for similar assets and observable inputs such as interest rates, foreign currency exchange rates, commodity rates and yield curves. Level 3 inputs are not observable in the market and include management’s own judgments about the assumptions market participants would use in pricing the asset or liability. At August 31, 2009, the financial assets and liabilities included in the Consolidated Balance Sheet that are measured at fair value, on a recurring basis, include cash equivalents of $0.7 million (Level 1), investments of $1.3 million (Level 1) and an asset for the fair value of derivative instruments of $0.8 million (Level 2). The Company has no financial assets or liabilities that are recorded at fair value using significant unobservable inputs (Level 3). The fair value of financial assets and liabilities included in the consolidated balance sheet are as follows (in thousands):
| August 31, | ||||||||
| 2010 | 2009 | |||||||
Level 1 Valuation: | ||||||||
Cash equivalents | $ | 5,092 | $ | 653 | ||||
Investments | 1,313 | 1,320 | ||||||
Level 2 Valuation: | ||||||||
Fair value of derivative instruments | $ | 207 | $ | 759 | ||||
ACTUANT CORPORATION
NOTES TO CONSOLIDATED FINANCIAL STATEMENTS—(Continued)
The fair value of the Company’s cash, and cash equivalents, accounts receivable, accounts payable, short-term borrowings and its variable rate long-term debt approximated book value as of August 31, 20092010 and 20082009 due to their short-term nature and the fact that the interest rates approximated year-end market rates of interest. The fair value of the Company’s outstanding $117.8 million and $140.9 million 2% Convertible Senior Subordinated DebenturesNotes at August 31, 2010 and 2009, respectively, was estimated to be$126.4 million and $139.5 million based on the quoted market prices.million. The fair value of the Company’s outstanding $250.0 million of Senior Notes at August 31, 2010 and 2009 was estimated to be$252.5 million and $228.1 million, respectively. The fair values of the 2% Convertible Notes and Senior Notes were based on the quoted market price.prices.
Note 10. Leases
The Company leases certain facilities, computers, equipment and vehicles under various lease agreements generally over periods of one to twenty years. Under most arrangements, the Company pays the property taxes, insurance, maintenance and expenses related to the leased property. Many of the leases include provisions that enable the Company to renew the lease based upon fair value rental rates on the date of expiration of the initial lease.
Future obligations under non-cancelable operating leases in effect at August 31, 20092010 are as follows: $20.5 million in fiscal 2010; $14.3$18.5 million in fiscal 2011; $11.2$14.1 million in fiscal 2012; $9.0$11.5 million in fiscal 2013; $7.4$8.8 million in fiscal 20142014; $6.7 million in fiscal 2015 and $28.4$22.3 million thereafter. Total rental expense under operating leases was $32.3$22.3 million, $31.5$28.8 million and $25.0$26.3 million in fiscal 2010, 2009 2008 and 2007,2008, respectively. As discussed in Note 17, “Contingencies and Litigation” the Company is also contingently liable for certain leases entered into by a former subsidiary.
ACTUANT CORPORATION
NOTES TO CONSOLIDATED FINANCIAL STATEMENTS—(Continued)
Note 11. Employee Benefit Plans
U.S. Defined Benefit Pension Plans
The Company has several defined benefit pension plans which cover certain existing and former employees of domestic businesses it acquired, that were entitled to those benefits prior to acquisition, or existing and former employees of foreign businesses. Mostacquisition. All of the U.S. defined benefit pension plans are frozen, and as a result, the majority of the plan participants no longer earn additional benefits, while most non-U.S. defined benefit plans continue to earn additional benefits. The following table provides detail of changes in the projected benefit obligations, the fair value of plan assets and the funded status of the Company’s U.S. defined benefit pension plans as of the Company’s August 31 measurement date (in thousands).
| U.S. Pension Plans | Non-U.S. Pension Plans | |||||||||||||||
| Year Ended August 31, | Year Ended August 31, | |||||||||||||||
| 2009 | 2008 | 2009 | 2008 | |||||||||||||
Reconciliation of benefit obligations: | ||||||||||||||||
Benefit obligation at beginning of year | $ | 36,692 | $ | 36,959 | $ | 28,217 | $ | 26,845 | ||||||||
Acquisitions | 2,097 | — | — | — | ||||||||||||
Service cost | — | 83 | 480 | 493 | ||||||||||||
Interest cost | 2,483 | 2,254 | 1,416 | 1,519 | ||||||||||||
Actuarial (gain) loss | 3,694 | (574 | ) | (926 | ) | 63 | ||||||||||
Benefits paid | (2,685 | ) | (2,030 | ) | (791 | ) | (1,045 | ) | ||||||||
Curtailments and settlements | — | — | — | (941 | ) | |||||||||||
Foreign exchange impact | — | — | (882 | ) | 1,283 | |||||||||||
Benefit obligation at end of year | $ | 42,281 | $ | 36,692 | $ | 27,514 | $ | 28,217 | ||||||||
Reconciliation of plan assets: | ||||||||||||||||
Fair value of plan assets at beginning of year | $ | 31,042 | $ | 33,453 | $ | 9,591 | $ | 6,035 | ||||||||
Acquisitions | 1,713 | — | — | — | ||||||||||||
Actual investment loss on plan assets | (3,489 | ) | (2,189 | ) | (6 | ) | (524 | ) | ||||||||
Company contributions | 205 | 1,808 | 1,069 | 5,436 | ||||||||||||
Benefits paid from plan assets | (2,685 | ) | (2,030 | ) | (791 | ) | (1,045 | ) | ||||||||
Foreign exchange impact | — | — | (486 | ) | (311 | ) | ||||||||||
Fair value of plan assets at end of year | 26,786 | 31,042 | 9,377 | 9,591 | ||||||||||||
Funded status of the plans | $ | (15,495 | ) | $ | (5,650 | ) | $ | (18,137 | ) | $ | (18,626 | ) | ||||
Amounts recognized in the balance sheet: | ||||||||||||||||
Non-current assets | $ | — | $ | — | $ | 46 | $ | 13 | ||||||||
Current liabilities | (166 | ) | (210 | ) | (14 | ) | (11 | ) | ||||||||
Non-current liabilities | (15,329 | ) | (5,440 | ) | (18,169 | ) | (18,628 | ) | ||||||||
Net liabilities | $ | (15,495 | ) | $ | (5,650 | ) | $ | (18,137 | ) | $ | (18,626 | ) | ||||
ACTUANT CORPORATION
NOTES TO CONSOLIDATED FINANCIAL STATEMENTS—(Continued)
| 2010 | 2009 | |||||||
Reconciliation of benefit obligations: | ||||||||
Benefit obligation at beginning of year | $ | 42,281 | $ | 36,692 | ||||
Acquisitions | — | 2,097 | ||||||
Interest cost | 2,306 | 2,483 | ||||||
Actuarial loss | 5,275 | 3,694 | ||||||
Benefits paid | (2,895 | ) | (2,685 | ) | ||||
Benefit obligation at end of year | $ | 46,967 | $ | 42,281 | ||||
Reconciliation of plan assets: | ||||||||
Fair value of plan assets at beginning of year | $ | 26,786 | $ | 31,042 | ||||
Acquisitions | — | 1,713 | ||||||
Actual return on plan assets | 1,233 | (3,489 | ) | |||||
Company contributions | 305 | 205 | ||||||
Benefits paid from plan assets | (2,895 | ) | (2,685 | ) | ||||
Fair value of plan assets at end of year | 25,429 | 26,786 | ||||||
Funded status of the plans (underfunded) | $ | (21,538 | ) | $ | (15,495 | ) | ||
Amounts recognized in the balance sheet: | ||||||||
Current liabilities | $ | (161 | ) | $ | (166 | ) | ||
Non-current liabilities | (21,377 | ) | (15,329 | ) | ||||
| $ | (21,538 | ) | $ | (15,495 | ) | |||
The following table provides detail on the Company’s net periodic benefit costs (in thousands):
| U.S. Pension Plans | Non-U.S. Pension Plans | |||||||||||||||||||||||||||||||||||
| Year ended August 31, | Year ended August 31, | Year ended August 31, | ||||||||||||||||||||||||||||||||||
| 2009 | 2008 | 2007 | 2009 | 2008 | 2007 | 2010 | 2009 | 2008 | ||||||||||||||||||||||||||||
Service cost | $ | — | $ | 83 | $ | 83 | $ | 480 | $ | 493 | $ | 619 | $ | — | $ | — | $ | 83 | ||||||||||||||||||
Interest cost | 2,483 | 2,254 | 2,200 | 1,416 | 1,519 | 1,337 | 2,306 | 2,483 | 2,254 | |||||||||||||||||||||||||||
Expected return on plan assets | (2,934 | ) | (2,807 | ) | (2,524 | ) | (511 | ) | (526 | ) | (266 | ) | ||||||||||||||||||||||||
Expected return on assets | (2,568 | ) | (2,934 | ) | (2,807 | ) | ||||||||||||||||||||||||||||||
Amortization of actuarial loss | 78 | 8 | 147 | 5 | 4 | 26 | 310 | 78 | 8 | |||||||||||||||||||||||||||
Other | — | — | — | — | — | (130 | ) | |||||||||||||||||||||||||||||
Net benefit cost (credit) | $ | (373 | ) | $ | (462 | ) | $ | (94 | ) | $ | 1,390 | $ | 1,490 | $ | 1,586 | $ | 48 | $ | (373 | ) | $ | (462 | ) | |||||||||||||
At August 31, 2010 and 2009, and 2008, $10.8$14.3 million and $4.9$10.4 million, respectively, related to pension plan actuarial gains and losses, which have not yet been recognized in net periodic benefit cost, were included in Accumulated Other Comprehensive Income,Loss, net of income taxes. During 2010, $0.2fiscal 2011, $0.4 million of these actuarial gains and losses are expected to be recognized in net periodic benefit cost, net of tax.
ACTUANT CORPORATION
NOTES TO CONSOLIDATED FINANCIAL STATEMENTS—(Continued)
Weighted-average assumptions used to determine benefit obligations as of August 31 and weighted-average assumptions used to determine net periodic benefit cost for the years ended August 31 are as follows:
| U.S. Pension Plans | Non-U.S. Pension Plans | |||||||||||||||||||||||||||||
| 2009 | 2008 | 2007 | 2009 | 2008 | 2007 | 2010 | 2009 | 2008 | ||||||||||||||||||||||
Assumptions for benefit obligations: | ||||||||||||||||||||||||||||||
Discount rate | 5.60 | % | 6.50 | % | 6.25 | % | 5.53 | % | 5.59 | % | 5.21 | % | 4.60 | % | 5.60 | % | 6.50 | % | ||||||||||||
Rate of compensation increase | n/a | n/a | n/a | 2.19 | % | 2.25 | % | 1.98 | % | |||||||||||||||||||||
Assumptions for net periodic benefit cost: | ||||||||||||||||||||||||||||||
Discount rate | 6.50 | % | 6.25 | % | 6.00 | % | 5.59 | % | 5.21 | % | 4.75 | % | 5.60 | % | 6.50 | % | 6.25 | % | ||||||||||||
Expected return on plan assets | 8.50 | % | 8.50 | % | 8.50 | % | 5.90 | % | 5.26 | % | 5.19 | % | 8.25 | % | 8.50 | % | 8.50 | % | ||||||||||||
Rate of compensation increase | n/a | n/a | n/a | 2.25 | % | 1.98 | % | 1.96 | % | |||||||||||||||||||||
The accumulated benefit obligation is the actuarial present value of benefits based on service rendered and current and past compensation levels. This differs from the projected benefit obligation in that it includes no assumption about future compensation levels. There is no difference between the accumulated and projected benefit obligations of the Company’s domestic defined benefit pension plans because the majority of these plans wereare frozen and plan participants no longer earn benefits under the Company’s defined benefit plans, however benefits are earned under the Company’s defined contribution plan. For the limited number of employees who do earn future pension benefits, the benefit is not based on future salary levels, and therefore, compensation changes do not impact the liability.plans.
The following table summarizes information related to the Company’s Non-U.S. pension plans with an accumulated benefit obligation (ABO) in excess of the fair value of plan assets as of August 31:
| 2009 | 2008 | |||||
Pension plans with ABOs in excess of fair value of plan assets: | ||||||
Accumulated benefit obligation | $ | 24,920 | $ | 25,819 | ||
Fair value of plan assets | $ | 7,107 | $ | 7,513 | ||
Number of plans | 9 | 8 | ||||
ACTUANT CORPORATION
NOTES TO CONSOLIDATED FINANCIAL STATEMENTS—(Continued)
The following table summarizes information related to the Company’s Non-U.S. pension plans with a projected benefit obligation (PBO) in excess of the fair value of plan assets as of August 31:
| 2009 | 2008 | |||||
Pension plans with PBOs in excess of fair value of plan assets: | ||||||
Projected benefit obligation | $ | 25,290 | $ | 26,152 | ||
Fair value of plan assets | $ | 7,107 | $ | 7,513 | ||
Number of plans | 9 | 8 | ||||
The Company employs a total return on investment approach for its pension plan assets whereby a mix of equities and fixed income investments are used to maximize the long-term return for plan assets, at a prudent level of risk. The investment portfolio contains a diversified blend of equity and fixed income investments. Within the equity allocation, a blend of growth and value investments are maintained in a variety of market capitalizations and diversified between U.S. and non-U.S. stocks. The Company’s targeted asset allocation as a percentage of total market value is 60% to 80% equity securities and the remainder fixed income securities and cash. Additionally, cash balances are maintained at levels adequate to meet near-term plan expenses and benefit payments. Investment risk is measured and monitored on an ongoing basis through semi-annual investment portfolio reviews.
At August 31, 2009,2010, Company’s overall expected long-term rate of return for assets in U.S. pension plans was 8.25%8.00%. The expected long-term rate of return is based on the portfolio as a whole and not on the sum of the returns on individual asset categories. The target return is based on historical returns adjusted to reflect the current view of the long-term investment market.
The Company’sfair value of all U.S. pension plan assetassets are determined based on quoted market prices and therefore all plan assets are determined based on Level 1 inputs, as defined in Note 9, “Fair Value Measurements”. The following table summarizes the U.S. pension plan investment allocations at August 31, 2009 and 2008, by asset category are summarized below (in thousands):
| August 31, 2009 | August 31, 2008 | |||||||||||
Equity securities | $ | 18,254 | 68 | % | $ | 20,813 | 67 | % | ||||
Fixed income securities | 7,845 | 29 | % | 9,243 | 30 | % | ||||||
Cash | 687 | 3 | % | 986 | 3 | % | ||||||
| $ | 26,786 | 100 | % | $ | 31,042 | 100 | % | |||||
| August 31, 2010 | % | August 31, 2009 | % | |||||||||||||
Cash and cash equivalents | $ | 470 | 1.9 | % | $ | 758 | 2.8 | % | ||||||||
Fixed Income securities: | ||||||||||||||||
Government bonds | 405 | 1.6 | 721 | 2.7 | ||||||||||||
Corporate bonds | 7,104 | 27.9 | 7,070 | 26.4 | ||||||||||||
Short term funds | 29 | 0.1 | — | — | ||||||||||||
| 7,538 | 29.6 | 7,791 | 29.1 | |||||||||||||
Equity Securities: | ||||||||||||||||
U.S. companies | 13,712 | 53.9 | 13,884 | 51.8 | ||||||||||||
International companies | 3,709 | 14.6 | 4,353 | 16.3 | ||||||||||||
| 17,421 | 68.5 | 18,237 | 68.1 | |||||||||||||
| $ | 25,429 | 100.0 | % | $ | 26,786 | 100.0 | % | |||||||||
ACTUANT CORPORATION
NOTES TO CONSOLIDATED FINANCIAL STATEMENTS—(Continued)
Projected benefit payments from plan assets to participants in the Company’s U.S. pension plans are approximately $2.5 million per year for fiscal 2011 through 2015 and $13.9 million in aggregate for fiscal 2016 through 2020. During fiscal 2011, the Company anticipates contributing $1.4 million to U.S. pension plans.
Non-U.S. Defined Benefit Pension Plans
The Company has several Non-U.S. defined benefit pension plans which cover certain existing and former employees of businesses outside the U.S. Most of the Non-U.S. defined benefit pension plans continue to earn additional benefits. The funded status of these plans (continuing operations) at August 31, 2010 and 2009 is summarized as follows:
| 2010 | 2009 | |||||||
Projected benefit obligation | $ | 8,892 | $ | 8,002 | ||||
Plan assets at fair value | 6,479 | 5,938 | ||||||
Funded status of plans (underfunded) | $ | (2,413 | ) | $ | (2,064 | ) | ||
Net periodic benefit cost for these Non-U.S. plans was $0.3 million, $0.4 million and $0.4 million in fiscal 2010, 2009 and 2008, respectively. The weighted average discount rate utilized for determining the benefit obligation at August 31, 2010 and 2009 was 4.3% and 5.5%, respectively. The plan assets of Non-U.S.these non-U.S. pension plans consist primarily of participating units in common stock and bond funds. The Company’s overall expected long-term rate of return on these investments is 5.93%4.5%. This expected long-term rate of return is based on the portfolio as a whole and not on the sum of the returns on individual asset categories.
Projected benefit payments to participants in the Company’s pension plans are as follows (in thousands):
| U.S. Pension Plans | Non-U.S. Pension Plans | |||||
Projected benefit payments: | ||||||
2010 | $ | 2,245 | $ | 1,049 | ||
2011 | 2,287 | 1,104 | ||||
2012 | 2,323 | 1,691 | ||||
2013 | 2,407 | 1,356 | ||||
2014 | 2,496 | 1,711 | ||||
2015-2019 (in total) | 13,743 | 9,677 | ||||
During 2010,fiscal 2011, the Company anticipates contributing $0.4$0.3 million to U.S.non-U.S. pension plans and $1.4 million to Non-U.S. pension plans.
ACTUANT CORPORATION
NOTES TO CONSOLIDATED FINANCIAL STATEMENTS—(Continued)
Other Post-Retirement Health Benefit Plans
The Company provides other post-retirement health benefits (“OPEB”) to certain existing and former employees of domesticU.S. businesses it acquired, that were entitled to those benefits prior to acquisition. These unfunded plans had a benefit obligation of $3.7 million and $3.5 million at both August 31, 2010 and 2009, and 2008.respectively. The valuation of these obligations utilized assumptions consistent with those used for U.S. pension plans and a health care cost trend rate of 7.5%7.0%, trending downward to 5% by the year 2014, and remaining level thereafter. A one percentage-point increase or decrease in the assumed health care cost trend rate would increase or decrease the postretirement benefit obligation by approximately $0.1$0.2 million and would not have a material effect on aggregate service and interest cost components. Net periodic benefit costs (credit) for the other post-retirement benefits were $(0.2) million for each of the three years ended August 31, 2010, 2009, 2008, and 2007.2008. Benefit payments from the plan are funded through participant contributions and Company contributions, the latter of which are projected to be $0.4$0.3 million for the year ended August 31, 2010.2011.
Defined Contribution Benefit Plans
The Company maintains a 401(k) Plan for substantially all full time U.S. employees (the “401(k) Plan”). Under plan provisions, the Company issues new shares of Class A Common Stock for its contributions and allocates such shares to accounts set aside for each employee’s retirement. Employees generally may contribute up to 50% of their compensation to individual accounts within the 401(k) Plan.Plan, subject to IRS limitations. While contributions vary, historically the Company mademakes core contributions to employee accounts that generally equaledequal 3% of each employee’s annual cash compensation, subject to IRS limitations. In addition, the Company matches approximately 25% of each employee’s contribution up to 6% of the employee’s eligible compensation. Expense recognized related to the 401(k) plan totaled approximately $2.7 million, $1.4 million $4.7 million and $4.9$4.7 million during the
ACTUANT CORPORATION
NOTES TO CONSOLIDATED FINANCIAL STATEMENTS—(Continued)
years ended August 31, 2010, 2009 2008 and 2007,2008, respectively. The reduction in expense for the year ended August 31, 2010 and 2009 iswas a result of the temporary suspension (due to adverse economic conditions) of the core contribution to participant accounts due to adverse economic conditions.for fiscal 2009 and the first half of fiscal 2010.
Deferred Compensation Plan
The Company maintains a deferred compensation plan to allow eligible U.S. employees to defer receipt of current compensation in order to provide future savings benefits. Eligibility is limited to employees that earn compensation that exceeds certain pre-defined levels. Participants have the option to invest their deferrals in a fixed income investment at a specified interest rate, in Actuant Common Stock, or a combination of the two. The fixed income portion of the plan is currently unfunded, and therefore all compensation deferred under the plan is held by the Company and commingled with its general assets. Liabilities of $12.6$13.0 million and $9.5$12.6 million are included in “Other long-term liabilities” on the Consolidated Balance Sheetsconsolidated balance sheets at August 31, 20092010 and 2008,2009, respectively, to reflect the unfunded portion of the deferred compensation liability. The Company recorded expense of $1.0 million, $0.9 million $0.7 million and $0.5$0.7 million for the years ended August 31, 2010, 2009 2008 and 2007,2008, respectively, related to interest on participant deferrals in the fixed income investment option. Actuant Common Stock issued by the Company to fund the plan is held in a rabbi trust. Company shares held by the rabbi trust are accounted for in a manner similar to treasury stock and are recorded at cost in “Stock held in trust” within shareholders’ equity with the corresponding deferred compensation liability also recorded within shareholders’ equity. Since no investment diversification is permitted within the trust, changes in fair value of Actuant common stock are not recognized. The shares held in the trust are included in both the basic and diluted earnings per share calculations. The cost of the shares held in the trust was $1.0 million and $0.8 million at August 31, 2010 and 2009, and 2008.respectively.
Long Term Incentive Plan
The Company adopted a long term incentive plan in July 2006 to provide certain executive officers with an opportunity to receive a lump sum cash incentive payment based on the attainment of a $50 per share Actuant
ACTUANT CORPORATION
NOTES TO CONSOLIDATED FINANCIAL STATEMENTS—(Continued)
Common Stock price appreciation target over an 8 year period. The Company recorded (income)/expense of $0.4 million, $(2.6) million $1.7 million and $1.1$1.7 million for the years ended August 31, 2010, 2009 and 2008, and 2007, respectively.respectively, pursuant to this plan. A related liability of $0.5$0.9 million and $3.1$0.5 million is included in “Other long-term liabilities” on the Consolidated Balance Sheetsconsolidated balance sheets at August 31, 20092010 and 2008,2009, respectively. The minimum and maximum paymentspayouts under the plan, depending on the attainment of the $50 per share stock price appreciation target, are $0 million and $20 million, respectively.
Other Non-U.S. Benefit Plans
The Company contributes to a number of other retirement programs, primarily government mandated, for employees outside the United States. Benefit expense under these programs amounted to approximately $4.7$3.5 million, $5.2$4.3 million and $4.6$4.4 million in fiscal 2010, 2009 2008 and 2007,2008, respectively.
ACTUANT CORPORATION
NOTES TO CONSOLIDATED FINANCIAL STATEMENTS—(Continued)
Note 12. Income Taxes
Income tax expense (benefit) from continuing operations is summarized below (in thousands):
| Year ended August 31, | Year ended August 31, | |||||||||||||||||||||
| 2009 | 2008 | 2007 | 2010 | 2009 | 2008 | |||||||||||||||||
Currently payable: | ||||||||||||||||||||||
Federal | $ | — | $ | 20,914 | $ | 19,995 | $ | 9,708 | $ | — | $ | 20,914 | ||||||||||
Foreign | 18,943 | 23,570 | 14,562 | 15,834 | 19,491 | 28,464 | ||||||||||||||||
State | (1,570 | ) | 2,180 | 2,501 | 784 | (1,570 | ) | 2,180 | ||||||||||||||
| 17,373 | 46,664 | 37,058 | 26,326 | 17,921 | 51,558 | |||||||||||||||||
Deferred: | ||||||||||||||||||||||
Federal | (12,439 | ) | 5,416 | 6,836 | (4,892 | ) | (12,439 | ) | 5,416 | |||||||||||||
Foreign | (8,590 | ) | 1,226 | 1,666 | (2,147 | ) | (8,053 | ) | (595 | ) | ||||||||||||
State | 3,182 | 110 | 72 | (441 | ) | 3,182 | 110 | |||||||||||||||
| (17,847 | ) | 6,752 | 8,574 | (7,480 | ) | (17,310 | ) | 4,931 | ||||||||||||||
| $ | (474 | ) | $ | 53,416 | $ | 45,632 | $ | 18,846 | $ | 611 | $ | 56,489 | ||||||||||
Income tax expense (benefit) from continuing operations recognized in the accompanying Consolidated Statementsconsolidated statements of Earningsearnings differs from the amounts computed by applying the Federal income tax rate to earnings from continuing operations before income tax expense. A reconciliation of income taxes at the Federal statutory rate to the effective tax rate is summarized in the following table:
| Year ended August 31, | |||||||||
| 2009 | 2008 | 2007 | |||||||
Federal statutory rate | 35.0 | % | 35.0 | % | 35.0 | % | |||
State income taxes, net of Federal effect | 2.3 | % | 1.3 | % | 1.7 | % | |||
Net effect of foreign tax rates and credits | (44.4 | )% | (11.0 | )% | (7.8 | )% | |||
Valuation allowance | 17.5 | % | 2.0 | % | 0.7 | % | |||
Other items (1) | (12.4 | )% | 3.5 | % | 1.0 | % | |||
Effective income tax rate | (2.0 | )% | 31.0 | % | 30.7 | % | |||
| Year ended August 31, | ||||||||||||
| 2010(1) | 2009(2) | 2008 | ||||||||||
Federal statutory rate | 35.0 | % | 35.0 | % | 35.0 | % | ||||||
State income taxes, net of Federal effect | 0.4 | 2.0 | 1.3 | |||||||||
Net effect of foreign tax rates and credits | (23.5 | ) | (39.3 | ) | (10.6 | ) | ||||||
Restructuring and valuation allowance | (1.9 | ) | 15.4 | 1.9 | ||||||||
Other items | 11.1 | (10.8 | ) | 3.4 | ||||||||
Effective income tax rate | 21.1 | % | 2.3 | % | 31.0 | % | ||||||
| (1) | Other items for the year ended August 31, 2010 of 11.1% includes provision to return adjustments and additional provisions for unrecognized tax benefits. |
| (2) | Other items for the year ended August 31, 2009 of |
ACTUANT CORPORATION
NOTES TO CONSOLIDATED FINANCIAL STATEMENTS—(Continued)
Temporary differences and carryforwards that gave rise to deferred tax assets and liabilities include the following items (in thousands):
| Year ended August 31, | Year ended August 31, | |||||||||||||||
| 2009 | 2008 | 2010 | 2009 | |||||||||||||
Deferred income tax assets: | ||||||||||||||||
Operating loss and tax credit carryforwards | $ | 28,181 | $ | 26,958 | $ | 21,391 | $ | 28,181 | ||||||||
Compensation related reserves | 4,365 | 6,010 | 12,766 | 4,365 | ||||||||||||
Postretirement benefit accruals | 8,655 | 4,402 | 11,126 | 8,655 | ||||||||||||
Inventory items | 6,414 | 3,990 | 6,522 | 6,414 | ||||||||||||
Restructuring expenses | 3,046 | 212 | 2,248 | 3,046 | ||||||||||||
Deferred income | 1,127 | 888 | 1,009 | 1,127 | ||||||||||||
Reserves and other items | 9,481 | 15,139 | ||||||||||||||
Book reserves and other items | 11,940 | 9,481 | ||||||||||||||
Total deferred income tax assets | 61,269 | 57,599 | 67,002 | 61,269 | ||||||||||||
Valuation allowance | (20,238 | ) | (21,952 | ) | (8,542 | ) | (20,238 | ) | ||||||||
Net deferred income tax assets | 41,031 | 35,647 | 58,460 | 41,031 | ||||||||||||
Deferred income tax liabilities: | ||||||||||||||||
Depreciation and amortization | (112,235 | ) | (105,768 | ) | (107,738 | ) | (112,235 | ) | ||||||||
2% Convertible Notes interest | (24,316 | ) | (17,563 | ) | (29,346 | ) | (24,316 | ) | ||||||||
Other items | (960 | ) | (80 | ) | (905 | ) | (960 | ) | ||||||||
Deferred income tax liabilities | (137,511 | ) | (123,411 | ) | (137,989 | ) | (137,511 | ) | ||||||||
Net deferred income tax liability | $ | (96,480 | ) | $ | (87,764 | ) | $ | (79,529 | ) | $ | (96,480 | ) | ||||
The valuation allowance at August 31, 2010 and 2009 primarily represents a reserve for domestic and foreign loss carryforwards for which utilization is uncertain. Domestic loss carryforwards expireThe reduction in various years through 2024. The majorityvaluation allowance from August 31, 2009 to August 31, 2010 is primarily attributable to amounts reclassified to assets and liabilities of the foreign loss carryforwards may be carried forward indefinitely.discontinued operations.
The deductibility for tax purposes of the 2% Convertible Notes interest may have to be recaptured, in part or in whole, if the notes are redeemed for cash instead of converted into the Company’s Class A common stock. If the 2% Convertible Notes are ultimately converted into the Company’s Class A common stock, the deferred tax liability would be eliminated through an adjustment to the Company’s shareholders’ equity and would not impact current tax accounts.
The Company adopted the provisions of FIN 48accounting for uncertain tax positions on September 1, 2007. Changes in the Company’s gross liability for unrecognized tax benefits, excluding interest and penalties, are as follows (in thousands):
| 2009 | 2008 | |||||||
Beginning balance | $ | 29,872 | $ | 20,801 | ||||
Increase for tax positions taken in a prior period | 4,633 | 9,158 | ||||||
Decrease for tax positions taken in a prior period | — | (87 | ) | |||||
Decrease due to settlements | (5,964 | ) | — | |||||
Ending balance | $ | 28,541 | $ | 29,872 | ||||
| 2010 | 2009 | 2008 | ||||||||||
Beginning balance | $ | 28,541 | $ | 29,872 | $ | 20,801 | ||||||
Increase for tax positions taken in a prior period | 2,868 | 4,633 | 9,158 | |||||||||
Decrease for tax positions taken in a prior period | (484 | ) | — | (87 | ) | |||||||
Decrease due to settlements | (2,700 | ) | (5,964 | ) | — | |||||||
Ending balance | $ | 28,225 | $ | 28,541 | $ | 29,872 | ||||||
ACTUANT CORPORATION
NOTES TO CONSOLIDATED FINANCIAL STATEMENTS—(Continued)
Substantially all of these unrecognized tax benefits, if recognized, would impact the effective income tax rate. As of August 31, 2010, 2009 and 2008, the Company had accrued approximatelyrecognized $4.2 million, $3.5 million and $3.23.2 million, respectively for the payment of interest and penalties related to unrecognized tax benefits. With few exceptions, the Company is no longer subject to U.S. federal, state and local and foreign income tax examinations by tax authorities in our major tax jurisdictions for years before fiscal 2005. The Company believes it is reasonably possible that the total amount of unrecognized tax benefits could decrease by a range of $2.5 million to $3.5 million within the next twelve months.
The Company’s policy is to remit earnings from foreign subsidiaries only to the extent any resultant foreign income taxes are creditable in the United States. Accordingly, the Company does not currently provide for the additional United States and foreign income taxes which would become payable upon remission of undistributed earnings of foreign subsidiaries. Undistributed earnings on which additional income taxes have not been provided amounted to approximately $253.0$387.5 million at August 31, 2009.2010. If all such undistributed earnings were remitted, an additional income tax provision of approximately $59.1$100.8 million would have been necessary as of August 31, 2009.2010.
Earnings before income taxes related to non-United States operations were $33.1 million, $43.9 million $105.3 million and $70.5$105.3 million for the years ended August 31, 2010, 2009 2008 and 2007,2008, respectively. Cash paid for income taxes (net of refunds) was $6.5 million, $20.1 million, $43.4 million, and $39.1$43.4 million during the years ended August 31, 2010, 2009 2008 and 2007,2008, respectively.
| Note 13. | Capital Stock |
The authorized common stock of the Company as of August 31, 20092010 consisted of 84,000,000168,000,000 shares of Class A Common Stock, $0.20 par value, of which 67,718,20768,056,387 shares were issued and outstanding; 1,500,000 shares of Class B Common Stock, $0.20 par value, none of which were issued and outstanding; and 160,000 shares of Cumulative Preferred Stock, $1.00 par value (“Preferred Stock”), none of which have been issued. Holders of both classes of the Company’s Common Stock are entitled to dividends, as the Company’s board of directors may declare out of funds legally available, subject to any contractual restrictions on the payment of dividends or other distributions on the Common Stock.distributions. If the Company were to issue any of its Preferred Stock, no dividends could be paid or set apartaside for payment on shares of Common Stock, unless paid in Common Stock, until dividends on all of the issued and outstanding shares of Preferred Stock had been paid or set apartaside for payment and provision had been made for any mandatory sinking fund payments.
In the fourth quarter of fiscal 2009, the Company completed a follow-on equity offering of 10,925,000 shares of its Class A common stock. Total proceeds from the offering, net of transactions costs, were $124.8 million, whichand were used to reduce Senior Credit Facility borrowings.
After considering the $23.1 million of 2% Convertible Notes repurchased subsequent to August 31, 2009 (seeAs described in Note 8, “Debt”),“Debt,” the remaining $117.8 million of 2% Convertible Notes are convertible into 5,905,419 shares of the Company’s Class A Common Stock if certain stock price targets or other conditions are met.
ACTUANT CORPORATION
NOTES TO CONSOLIDATED FINANCIAL STATEMENTS—(Continued)
Earnings Per Share
The following table sets forth the computation of basic and diluted earnings per share (in thousands, except per share amounts):
| Year Ended August 31, | Year Ended August 31, | ||||||||||||||||||||
| 2009 | 2008 | 2007 | 2010 | 2009 | 2008 | ||||||||||||||||
Numerator: | |||||||||||||||||||||
Net earnings | $ | 13,723 | $ | 122,544 | $ | 104,952 | $ | 24,031 | $ | 13,723 | $ | 122,544 | |||||||||
Plus: 2% Convertible Notes financings costs, net of taxes | 2,429 | 2,444 | 2,444 | 1,898 | 2,429 | 2,444 | |||||||||||||||
Net earnings for diluted earnings per share | $ | 16,152 | $ | 124,988 | $ | 107,396 | $ | 25,929 | $ | 16,152 | $ | 124,988 | |||||||||
Denominator: | |||||||||||||||||||||
Weighted average common shares outstanding for basic earnings per share | 58,047 | 55,813 | 54,751 | 67,624 | 58,047 | 55,813 | |||||||||||||||
Net effect of dilutive securities—employee stock compensation plans | 514 | 1,503 | 1,360 | 661 | 514 | 1,503 | |||||||||||||||
Net effect of 2% Convertible Notes based on the if-converted method | 7,503 | 7,517 | 7,517 | 5,924 | 7,503 | 7,517 | |||||||||||||||
Weighted average common and equivalent shares outstanding for diluted earnings per share | 66,064 | 64,833 | 63,628 | 74,209 | 66,064 | 64,833 | |||||||||||||||
Basic Earnings Per Share: | $ | 0.24 | $ | 2.20 | $ | 1.92 | $ | 0.36 | $ | 0.24 | $ | 2.20 | |||||||||
Diluted Earnings Per Share: | $ | 0.24 | $ | 1.93 | $ | 1.69 | $ | 0.35 | $ | 0.24 | $ | 1.93 | |||||||||
At August 31, 2010 and 2009, outstanding share-basedshare based awards to acquire 4,371,000 and 4,319,000 shares of common stock were not included in the Company’s computation of earnings per share because the effect would have been anti-dilutive. The increase in the weighted average common shares outstanding for the year ended August 31, 20092010 results from the 10,925,000 shares of common stock issued in connection with the follow-on equity offering in the fourth quarter of 2009.
| Note 14. | Stock Plans |
Stock optionsShare-based awards may be granted to officers and key employees under the Actuant Corporation 2009 Omnibus Incentive Plan (the Plan). At August 31, 2009, 3,000,0002010, 5,400,000 shares of Class A Common Stock were authorized for issuance under the Plan of which 1,425,4132,992,398 shares are available for future award grants. The Plan permits the Company to grant share-based awards, including stock options and restricted stock, to employees and directors. Options generally have a maximum term of ten years, an exercise price equal to 100% of the fair market value of the Company’s common stock at the date of grant and generally vest 50% after three years and 100% after five years. The provisions of share-based awards may vary by individual grant with respect to vesting period, dividend and voting rights, performance conditions and forfeitures, among other things.
ACTUANT CORPORATION
NOTES TO CONSOLIDATED FINANCIAL STATEMENTS—(Continued)
A summary of stock option activity under all plans as of August 31, 2009,2010, and changes during the fiscal year then ended is presented below:
| Shares | Weighted- Average Exercise Price (Per Share) | Weighted- Average Remaining Contractual Term | Aggregate Intrinsic Value | Shares | Weighted- Average Exercise Price (Per Share) | Weighted- Average Remaining Contractual Term | Aggregate Intrinsic Value | |||||||||||||||
Outstanding on September 1, 2008 | 5,216,333 | $ | 19.01 | |||||||||||||||||||
Outstanding on September 1, 2009 | 5,839,052 | $ | 19.71 | |||||||||||||||||||
Granted | 1,259,681 | 18.23 | 609,913 | 19.32 | ||||||||||||||||||
Exercised | (431,934 | ) | 4.70 | (228,184 | ) | 7.59 | ||||||||||||||||
Forfeited | (205,028 | ) | 24.51 | (287,793 | ) | 25.04 | ||||||||||||||||
Outstanding on August 31, 2009 | 5,839,052 | $ | 19.71 | 6.4 years | $ | 7.0 million | ||||||||||||||||
Outstanding on August 31, 2010 | 5,932,988 | $ | 19.87 | 5.8 years | $ | 15.3 million | ||||||||||||||||
Exercisable on August 31, 2009 | 2,575,924 | $ | 15.32 | 4.1 years | $ | 7.0 million | ||||||||||||||||
Exercisable on August 31, 2010 | 2,861,160 | $ | 16.94 | 3.5 years | $ | 13.3 million | ||||||||||||||||
Intrinsic value is the difference between the market value of the stock at August 31 and the exercise price which is aggregated for all options outstanding and exercisable. A summary of the weighted-average grant-date fair value of options, total intrinsic value of options exercised, and cash receipts from options exercised is shown below (in thousands, except per share amounts):
| Year Ended August 31, | Year Ended August 31, | |||||||||||||||||
| 2009 | 2008 | 2007 | 2010 | 2009 | 2008 | |||||||||||||
Weighted-average fair value of options granted (per share) | $ | 6.78 | $ | 10.39 | $ | 9.43 | $ | 7.56 | $ | 6.78 | $ | 10.39 | ||||||
Intrinsic value gain of options exercised | 5,881 | 6,575 | 11,478 | 2,607 | 5,881 | 6,575 | ||||||||||||
Cash receipts from stock option exercise | 365 | 3,310 | 1,911 | |||||||||||||||
Cash receipts from exercise of options | 1,732 | 365 | 3,310 | |||||||||||||||
A summary of the status of the Company’s restricted shares as of August 31, 2009,2010, and changes during the year then ended, is presented below:
| Number of Shares | Weighted- Average Fair Value at Grant Date (Per Share) | Number of Shares | Weighted- Average Fair Value at Grant Date (Per Share) | |||||||||
Outstanding on September 1, 2008 | 212,865 | $ | 29.59 | |||||||||
Outstanding August 31, 2009 | 484,724 | $ | 20.91 | |||||||||
Granted | 402,915 | 19.03 | 432,963 | 19.30 | ||||||||
Forfeited | (20,665 | ) | 26.13 | (49,969 | ) | 20.28 | ||||||
Vested | (110,391 | ) | 29.82 | (38,682 | ) | 27.88 | ||||||
Outstanding on August 31, 2009 | 484,724 | $ | 20.91 | |||||||||
Outstanding August 31, 2010 | 829,036 | $ | 19.78 | |||||||||
As of August 31, 2009,2010, there was $25.4$27.4 million of total unrecognized compensation cost related to share-based compensation for stock options and restricted stock outstanding. That cost is expected to be recognized over a weighted average period of 2.93.3 years. The total fair value of shares vested during the fiscal years ended August 31, 2010 and 2009 and 2008 was $3.3$0.7 million and $3.4$3.3 million, respectively. The Company issues previously unissued shares of Class A common stock to satisfy stock option exercises and restricted stock vesting.
ACTUANT CORPORATION
NOTES TO CONSOLIDATED FINANCIAL STATEMENTS—(Continued)
The Company generally records compensation expense (over the vesting period) for restricted stock awards based on the market value of Actuant common stock on the grant date. Stock based compensation expense was calculated using the Black-Scholes option pricing model for options granted in the first half of fiscal 2005 and a
ACTUANT CORPORATION
NOTES TO CONSOLIDATED FINANCIAL STATEMENTS—(Continued)
binomial pricing model for options granted thereafter. Assumptions used to determine the fair value of each option were based upon historical data and standard industry valuation practices and methodology. The following weighted-average assumptions were used for new grants in each fiscal year:
| Fiscal Year Ended August 31, | Fiscal Year Ended August 31, | |||||||||||||||||
| 2009 | 2008 | 2007 | 2010 | 2009 | 2008 | |||||||||||||
Dividend yield | 0.22 | % | 0.14 | % | 0.17 | % | 0.23 | % | 0.22 | % | 0.14 | % | ||||||
Expected volatility | 38.07 | % | 32.77 | % | 32.66 | % | 40.01 | % | 38.07 | % | 32.77 | % | ||||||
Risk-free rate of return | 1.70 | % | 3.24 | % | 5.99 | % | 2.76 | % | 1.70 | % | 3.24 | % | ||||||
Expected forfeiture rate | 15 | % | 15 | % | 15 | % | 15 | % | 15 | % | 15 | % | ||||||
Expected life | 6.0 years | 6.0 years | 6.0 years | 6.1 years | 6.0 years | 6.0 years | ||||||||||||
Outside Director Deferred Compensation Plan
The Company has a deferred compensation plan that enables non-employee directors, of its board of directors to defer the receipt of fees earned for their services in exchange for newly issued shares of Company common stock (which is placed in a rabbi trust). All distributions from the trust are required to be made in Company stock. Company shares held by the rabbi trust are accounted for in a manner similar to treasury stock and are recorded at cost as “stock held in trust” within shareholders’ equity with the corresponding deferred compensation liability also recorded within shareholders’ equity. Since no investment diversification is permitted within the trust, changes in fair value of Actuant common stock are not recognized. The shares held in the trust are included in both the basic and diluted earnings per share calculations. The cost of the shares held in the trust at August 31, 2010 and 2009 was $0.9 million and 2008 was $0.8 million, and $1.3 million, respectively.
Note 15. Accumulated Other Comprehensive Income (loss)
| Note 15. | Accumulated Other Comprehensive Income (loss) |
Accumulated Other Comprehensive Income (Loss)other comprehensive income (loss) in the accompanying Consolidated Balance Sheetsconsolidated balance sheets and Consolidated Statementsconsolidated statements of Shareholders Equityshareholders equity consists of the following (in thousands):
| 2009 | 2008 | 2010 | 2009 | |||||||||||||
Currency translation adjustments, net of tax | $ | (15,745 | ) | $ | 9,195 | $ | (50,590 | ) | $ | (15,745 | ) | |||||
Unrecognized pension and OPEB actuarial gains (losses), net of tax | (8,839 | ) | (2,566 | ) | (16,515 | ) | (8,839 | ) | ||||||||
Other items, net of tax | (15 | ) | 520 | — | (15 | ) | ||||||||||
| $ | (24,599 | ) | $ | 7,149 | $ | (67,105 | ) | $ | (24,599 | ) | ||||||
Note 16. Business Segment, Geographic and Customer Information
| Note 16. | Business Segment, Geographic and Customer Information |
The Company is a global manufacturer of a broad range of industrial products and systems and is organized into four reportable segments: Industrial, Energy, Electrical and Engineered Solutions.
During the second quarter of fiscal 2009, the Company’s financial reporting segments were modified to reflect changes in the portfolio of businesses, due to acquisitions, as well as changes in business reporting lines. The Company considered these changes as part of its ongoing assessment of segment reporting, and changed its operating and reportable segments to reflect four reportable segments: Industrial, Energy, Electrical and Engineered Solutions. All prior period amounts and disclosures have been adjusted to reflect the current reportable segments. The Industrial segment is primarily involved in the design, manufacture and distribution of
ACTUANT CORPORATION
NOTES TO CONSOLIDATED FINANCIAL STATEMENTS—(Continued)
branded hydraulic and mechanical tools to the maintenance, industrial, infrastructure and production automation markets. The Energy segment provides joint integrity products and services, as well as umbilical, rope and cable solutions to the global oil & gas, power generation and energy markets. The Electrical segment is primarily involved in the design, manufacture and distribution of a broad range of electrical products to the retail DIY, wholesale, OEM, utility and harsh environment markets. The Engineered Solutions segment provides highly engineered position and motion control systems to OEMs in various vehicle markets, as well as, a variety of other industrial products.
ACTUANT CORPORATION
NOTES TO CONSOLIDATED FINANCIAL STATEMENTS—(Continued)
The following tables summarize financial information by reportable segment and product line (in thousands).:
| Year Ended August 31, | Year Ended August 31, | |||||||||||||||||||||||
| 2009 | 2008 | 2007 | 2010 | 2009 | 2008 | |||||||||||||||||||
Net Sales by Segment: | ||||||||||||||||||||||||
Industrial | $ | 286,851 | $ | 374,498 | $ | 278,732 | $ | 299,983 | $ | 286,851 | $ | 374,498 | ||||||||||||
Energy | 259,490 | 212,400 | 160,410 | 235,723 | 259,490 | 212,400 | ||||||||||||||||||
Electrical | 364,161 | 496,445 | 521,519 | 233,702 | 241,988 | 329,395 | ||||||||||||||||||
Engineered Solutions | 329,296 | 529,847 | 475,551 | 391,100 | 329,296 | 529,847 | ||||||||||||||||||
| $ | 1,239,798 | $ | 1,613,190 | $ | 1,436,212 | $ | 1,160,508 | $ | 1,117,625 | $ | 1,446,140 | |||||||||||||
Net Sales by Reportable Product Line: | ||||||||||||||||||||||||
Industrial | $ | 286,851 | $ | 374,498 | $ | 278,732 | $ | 299,983 | $ | 286,851 | $ | 374,498 | ||||||||||||
Energy | 259,490 | 212,400 | 160,410 | 235,723 | 259,490 | 212,400 | ||||||||||||||||||
North American Electrical | 241,988 | 329,394 | 359,514 | |||||||||||||||||||||
European Electrical | 122,173 | 167,051 | 162,005 | |||||||||||||||||||||
Electrical | 233,702 | 241,988 | 329,395 | |||||||||||||||||||||
Vehicle Systems | 228,031 | 407,964 | 384,986 | 284,633 | 228,031 | 407,964 | ||||||||||||||||||
Other | 101,265 | 121,883 | 93,565 | 106,467 | 101,265 | 121,883 | ||||||||||||||||||
| $ | 1,239,798 | $ | 1,613,190 | $ | 1,439,212 | $ | 1,160,508 | $ | 1,117,625 | $ | 1,446,140 | |||||||||||||
Operating Profit: | ||||||||||||||||||||||||
Industrial | $ | 67,451 | $ | 113,808 | $ | 86,344 | $ | 66,344 | $ | 67,451 | $ | 113,808 | ||||||||||||
Energy | 44,098 | 47,985 | 34,941 | 30,702 | 44,092 | 47,985 | ||||||||||||||||||
Electrical | 1,046 | 24,539 | 37,324 | 19,853 | 3,327 | 35,145 | ||||||||||||||||||
Engineered Solutions | (28,431 | ) | 50,612 | 44,873 | 31,681 | (28,432 | ) | 50,614 | ||||||||||||||||
General Corporate | (18,712 | ) | (30,910 | ) | (21,079 | ) | (26,808 | ) | (18,710 | ) | (30,912 | ) | ||||||||||||
| $ | 65,452 | $ | 206,034 | $ | 182,403 | $ | 121,772 | $ | 67,728 | $ | 216,640 | |||||||||||||
Depreciation and Amortization: | ||||||||||||||||||||||||
Industrial | $ | 6,413 | $ | 5,222 | $ | 3,035 | $ | 6,571 | $ | 6,413 | $ | 5,222 | ||||||||||||
Energy | 17,322 | 11,466 | 8,563 | 17,276 | 17,322 | 11,466 | ||||||||||||||||||
Electrical | 8,594 | 9,334 | 8,784 | 10,470 | 8,594 | 9,334 | ||||||||||||||||||
Engineered Solutions | 16,763 | 17,365 | 14,701 | 14,898 | 16,763 | 17,365 | ||||||||||||||||||
General Corporate | 2,886 | 1,322 | 891 | 2,660 | 2,886 | 1,322 | ||||||||||||||||||
| $ | 51,978 | $ | 44,709 | $ | 35,974 | $ | 51,875 | $ | 51,978 | $ | 44,709 | |||||||||||||
Capital Expenditures: | ||||||||||||||||||||||||
Industrial | $ | 779 | $ | 2,804 | $ | 6,203 | ||||||||||||||||||
Energy | 7,212 | 5,568 | 9,228 | |||||||||||||||||||||
Electrical | 5,662 | 3,731 | 4,828 | |||||||||||||||||||||
Engineered Solutions | 4,517 | 1,568 | 10,642 | |||||||||||||||||||||
General Corporate | 1,796 | 7,783 | 13,506 | |||||||||||||||||||||
| $ | 19,966 | $ | 21,454 | $ | 44,407 | |||||||||||||||||||
| August 31, | ||||||||||||||||||||||||
| 2010 | 2009 | |||||||||||||||||||||||
Assets: | ||||||||||||||||||||||||
Industrial | $ | 241,036 | $ | 190,397 | ||||||||||||||||||||
Energy | 491,053 | 471,158 | ||||||||||||||||||||||
Electrical | 326,129 | 392,126 | ||||||||||||||||||||||
Engineered Solutions | 434,976 | 423,238 | ||||||||||||||||||||||
General Corporate | 83,707 | 91,512 | ||||||||||||||||||||||
Assets of discontinued operations | 44,802 | — | ||||||||||||||||||||||
| $ | 1,621,703 | $ | 1,568,431 | |||||||||||||||||||||
ACTUANT CORPORATION
NOTES TO CONSOLIDATED FINANCIAL STATEMENTS—(Continued)
| Year Ended August 31, | |||||||||
| 2009 | 2008 | 2007 | |||||||
Capital Expenditures: | |||||||||
Industrial | $ | 2,804 | $ | 6,203 | $ | 3,003 | |||
Energy | 5,568 | 9,228 | 7,700 | ||||||
Electrical | 3,731 | 4,828 | 3,823 | ||||||
Engineered Solutions | 1,568 | 10,642 | 10,873 | ||||||
General Corporate | 7,783 | 13,506 | 6,092 | ||||||
| $ | 21,454 | $ | 44,407 | $ | 31,491 | ||||
Assets: | |||||||||
Industrial | $ | 190,397 | $ | 251,384 | $ | 180,652 | |||
Energy | 471,158 | 306,833 | 242,932 | ||||||
Electrical | 392,126 | 464,105 | 471,410 | ||||||
Engineered Solutions | 423,238 | 520,579 | 486,693 | ||||||
General Corporate | 91,512 | 125,481 | 119,089 | ||||||
| $ | 1,568,431 | $ | 1,668,382 | $ | 1,500,776 | ||||
In addition to the impact of changes in foreign currency exchange rates, the comparability of the segment and product line datainformation is impacted by the acquisitions, discussed in Note 2, “Acquisitions”divestitures, restructuring costs and related benefits and the fiscal 2009non-cash asset impairment charges in fiscal 2009 of $26.6 million includedand $4.7 million in the Engineered Solutions segment and $4.7 million included in the Electrical Segment as discussed in Note 6, “Impairment Charges.”
segments, respectively. Corporate assets, which are not allocated, principally represent capitalized debt issuance costs, deferred income taxes, the fair value of derivative instruments and, prior to fiscal 2010, the retained interest in trade accounts receivable (subject to the accounts receivable securitization program discussed in Note 5, “Accounts Receivable Securitization”Securitization.”).
The following tables summarize financial information by geographic region (in thousands).:
| Year Ended August 31, | |||||||||
| 2009 | 2008 | 2007 | |||||||
Net Sales: | |||||||||
United States | $ | 608,783 | $ | 764,729 | $ | 734,744 | |||
Netherlands | 169,186 | 270,234 | 227,193 | ||||||
Germany | 107,748 | 139,394 | 125,980 | ||||||
United Kingdom | 114,342 | 111,010 | 93,152 | ||||||
All other | 239,739 | 327,823 | 255,143 | ||||||
| $ | 1,239,798 | $ | 1,613,190 | $ | 1,436,212 | ||||
| August 31, | |||||||||
| 2009 | 2008 | ||||||||
Long-Lived Tangible Assets: | |||||||||
United States | $ | 56,378 | $ | 57,779 | |||||
United Kingdom | 16,970 | | 13,226 | ||||||
Netherlands | 16,876 | 24,301 | |||||||
Germany | 4,397 | | 4,657 | ||||||
All other | 37,402 | 37,031 | |||||||
| $ | 132,023 | $ | 136,994 | ||||||
ACTUANT CORPORATION
NOTES TO CONSOLIDATED FINANCIAL STATEMENTS—(Continued)
| Year Ended August 31, | |||||||||
| 2010 | 2009 | 2008 | |||||||
Net Sales: | |||||||||
United States | $ | 602,546 | $ | 608,783 | $ | 764,729 | |||
Netherlands | 164,822 | 138,733 | 228,983 | ||||||
Germany | 42,882 | 44,647 | 58,962 | ||||||
United Kingdom | 98,027 | 114,342 | 111,010 | ||||||
All other | 252,231 | 211,120 | 282,456 | ||||||
| $ | 1,160,508 | $ | 1,117,625 | $ | 1,446,140 | ||||
| August 31, | |||||||||
| 2010 | 2009 | ||||||||
Long-Lived Assets: | |||||||||
United States | $ | 48,193 | $ | 56,378 | |||||
United Kingdom | 16,440 | 16,970 | |||||||
Netherlands | 12,014 | 16,876 | |||||||
Germany | 1,506 | 4,397 | |||||||
All other | 34,692 | 37,402 | |||||||
| $ | 112,845 | $ | 132,023 | ||||||
The Company’s largest customer accounted for 2.1%2.8%, 2.4%2.8%, and 3.5%2.4% of its sales in fiscal 2010, 2009 2008 and 2007,2008, respectively. Export sales from domestic operations were less than 7.9%7.2% of total net sales in each of the periods presented.
Note 17. Contingencies and Litigation
The Company had outstanding letters of credit of $8.9$9.1 million and $6.4$8.9 million at August 31, 20092010 and 2008,2009, respectively, the majority of which secure self-insured workers compensation liabilities.
The Company is a party to various legal proceedings that have arisen in the normal course of its business, whichbusiness. These legal proceedings typically include product liability, environmental, labor, insurance, patent claims and divestiture disputes. The Company has recorded reserves for loss contingencies based on the specific circumstances of each case. Such reserves are recorded when it is probable that a loss has been incurred as of the balance sheet date, the loss can be reasonably estimated and the loss is not covered by insurance. In the opinion of management, the resolution of these contingencies will not have a material adverse effect on the Company’s financial condition, results of operations or cash flows.
ACTUANT CORPORATION
NOTES TO CONSOLIDATED FINANCIAL STATEMENTS—(Continued)
The Company, in the normal course of business, enters into certain real estate and equipment leases or guarantees such leases on behalf of its subsidiaries. In conjunction with the spin-off of a former subsidiary in fiscal 2000, the Company assigned its rights in the leases used by the former subsidiary, but was not released as a responsible party from all such leases by the lessors. All of these businesses were subsequently sold. The Company remains contingently liable for those leases if any of these businesses are unable to fulfill their obligations thereunder. The discounted present value of future minimum lease payments for these leases was $4.5$3.3 million at August 31, 2009.2010.
The Company has facilities in numerous geographic locations that are subject to a range of environmental laws and regulations. Environmental costs that have no future economic value are expensed. Liabilities are recorded when environmental remediation is probable and the costs are reasonably estimable. Environmental expenditures over the last three years have not been material. Management believes that such costs will not have a material adverse effect on the Company’s financial position, results of operations or cash flows.
Note 18. Guarantor Subsidiaries
On June 12, 2007, Actuant Corporation (the “Parent”) issued $250.0 million of 6.875% Senior Notes. All of theour material domestic 100%wholly owned subsidiaries (the “Guarantors”) fully and unconditionally guarantee the 6.875% Senior Notes on a joint and several basis. There are no significant restrictions on the ability of the Guarantors to make distributions to the Parent. The following tables present the condensed results of operations, financial position and cash flows of Actuant Corporation and its subsidiaries, the Guarantor and non-Guarantor entities, and the eliminations necessary to arrive at the information for the Company on a consolidated basis.
General corporateCertain assets, liabilities and expenses have not been allocated to subsidiaries,the Guarantors and non-Guarantors and therefore are all included underin the Parent heading. Ascolumn in the accompanying consolidating financial statements. These items are of a matter of course, the Company retains certaincorporate or consolidated nature and include, but are not limited to, tax provisions and related assets and liabilities, at thecertain employee benefit obligations, prepaid and accrued insurance and corporate level (Parent columnindebtedness. Intercompany activity in the following tables) which are not allocated to subsidiariesconsolidating financial statements primarily includes loan activity, purchases and sales of goods or services and dividends. Intercompany balances also reflect certain non-cash transactions including but not limited to, certain employee benefits, insurance, financingtransfers of assets and tax liabilities. Income tax provisions for domestic subsidiaries are typically recorded using an estimate and finalized in total with an adjustment recorded atliabilities between the Parent, level. Net sales reported for eachGuarantor and non-Guarantor, allocation of non-cash expenses from the headings only includes salesParent to third parties; sales between entities arethe Guarantors and non-Guarantors, the impact of foreign currency rate changes and non-cash intercompany dividends.
Certain revisions have been made to correct the prior year presentation of parent, guarantor and non-guarantor operating, investing and financing cash flows (related entirely to the classification of changes in intercompany payables/receivables within the consolidating statement of cash flows) to conform to the current year presentation. The revisions increased parent cash flow from operating activities by $52.7 million and decreased guarantor and non-guarantor cash flow from operating activities by $47.1 million and $5.6 million, respectively, in fiscal 2009. Similarly, parent and non-guarantor cash flows from operating activities decreased by $38.9 million and $3.2 million, respectively while guarantor cash flows from operating activities increased by $35.7 million in fiscal 2008. Consolidated prior year cash flows from operating, investing and financing activities have not significant. Additionally, substantially all of the indebtedness of the Company has historically been, andchanged.
ACTUANT CORPORATION
NOTES TO CONSOLIDATED FINANCIAL STATEMENTS—(Continued)
continues to be, carried at the corporate level and is therefore included in the Parent column in the following tables. Substantially all accounts receivable of the Parent and Guarantors are sold into the accounts receivable program described in Note 5. “Accounts Receivable Securitization.” Allowances for doubtful accounts remains recorded at the Parent and Guarantors. Intercompany balances include receivables/payables incurred in the normal course of business in addition to investments and loans transacted between subsidiaries of the Company or with Actuant.
ACTUANT CORPORATION
NOTES TO CONSOLIDATED FINANCIAL STATEMENTS—(Continued)
CONDENSED CONSOLIDATING STATEMENTS OF EARNINGS
(In thousands)
| Year Ended August 31, 2009 | ||||||||||||||||||||
| Parent | Guarantors | Non-Guarantors | Eliminations | Consolidated | ||||||||||||||||
Net sales | $ | 139,389 | $ | 466,415 | $ | 633,994 | $ | — | $ | 1,239,798 | ||||||||||
Cost of products sold | 52,949 | 337,903 | 434,272 | — | 825,124 | |||||||||||||||
Gross profit | 86,440 | 128,512 | 199,722 | — | 414,674 | |||||||||||||||
Selling, administrative and engineering expenses | 54,189 | 90,944 | 130,618 | — | 275,751 | |||||||||||||||
Restructuring charges | 2,408 | 10,026 | 9,992 | — | 22,426 | |||||||||||||||
Impairment charges | — | 28,543 | 2,778 | — | 31,321 | |||||||||||||||
Amortization of intangible assets | — | 13,881 | 5,843 | — | 19,724 | |||||||||||||||
Operating profit (loss) | 29,843 | (14,882 | ) | 50,491 | — | 65,452 | ||||||||||||||
Financing costs, net | 41,025 | 141 | 683 | — | 41,849 | |||||||||||||||
Intercompany expense (income), net | (15,797 | ) | (1,942 | ) | 17,739 | — | — | |||||||||||||
Other expense (income), net | (194 | ) | (435 | ) | 838 | — | 209 | |||||||||||||
Earnings (loss) before income tax expense and minority interest | 4,809 | (12,646 | ) | 31,231 | — | 23,394 | ||||||||||||||
Income tax expense (benefit) | 4,117 | (8,872 | ) | 4,281 | — | (474 | ) | |||||||||||||
Minority interest, net of income taxes | — | — | 17 | — | 17 | |||||||||||||||
Earnings (loss) from continuing operations before equity in earnings of subsidiaries | 692 | (3,774 | ) | 26,933 | — | 23,851 | ||||||||||||||
Equity in earnings (loss) of subsidiaries | 398 | 26,286 | (7,678 | ) | (19,006 | ) | — | |||||||||||||
Earnings from continuing operations | 1,090 | 22,512 | 19,255 | (19,006 | ) | 23,851 | ||||||||||||||
Earnings (loss) from discontinuing operations, net of income taxes | 12,633 | 1,643 | (24,404 | ) | — | (10,128 | ) | |||||||||||||
Net earnings (loss) | $ | 13,723 | $ | 24,155 | $ | (5,149 | ) | $ | (19,006 | ) | $ | 13,723 | ||||||||
| Year Ended August 31, 2010 | ||||||||||||||||||||
| Parent | Guarantors | Non-Guarantors | Eliminations | Consolidated | ||||||||||||||||
Net sales | $ | 143,783 | $ | 456,961 | $ | 559,764 | $ | — | $ | 1,160,508 | ||||||||||
Cost of products sold | 47,370 | 333,829 | 352,057 | — | 733,256 | |||||||||||||||
Gross profit | 96,413 | 123,132 | 207,707 | — | 427,252 | |||||||||||||||
Selling, administrative and engineering expenses | 75,814 | 87,987 | 104,065 | — | 267,866 | |||||||||||||||
Restructuring charges | 2,054 | 7,418 | 6,125 | — | 15,597 | |||||||||||||||
Amortization of intangible assets | — | 14,463 | 7,554 | — | 22,017 | |||||||||||||||
Operating profit | 18,545 | 13,264 | 89,963 | — | 121,772 | |||||||||||||||
Financing costs, net | 31,589 | 17 | 253 | — | 31,859 | |||||||||||||||
Intercompany expense (income), net | (21,388 | ) | 2,610 | 18,778 | — | — | ||||||||||||||
Other expense (income), net | (55 | ) | 1,613 | (847 | ) | — | 711 | |||||||||||||
Earnings from continuing operations before income tax expense | 8,399 | 9,024 | 71,779 | — | 89,202 | |||||||||||||||
Income tax expense | 2,930 | 2,355 | 13,561 | — | 18,846 | |||||||||||||||
Net earnings from continuing operations before equity in earnings of subsidiaries | 5,469 | 6,669 | 58,218 | — | 70,356 | |||||||||||||||
Equity in earnings (loss) of subsidiaries | 18,562 | 2,011 | (3,920 | ) | (16,653 | ) | — | |||||||||||||
Earnings from continuing operations | 24,031 | 8,680 | 54,298 | (16,653 | ) | 70,356 | ||||||||||||||
Loss from discontinued operations | — | — | (46,325 | ) | — | (46,325 | ) | |||||||||||||
Net earnings | $ | 24,031 | $ | 8,680 | $ | 7,973 | $ | (16,653 | ) | $ | 24,031 | |||||||||
ACTUANT CORPORATION
NOTES TO CONSOLIDATED FINANCIAL STATEMENTS—(Continued)
CONDENSED CONSOLIDATING STATEMENTS OF EARNINGS
(In thousands)
| Year Ended August 31, 2009 | ||||||||||||||||||||
| Parent | Guarantors | Non-Guarantors | Eliminations | Consolidated | ||||||||||||||||
Net sales | $ | 139,389 | $ | 466,415 | $ | 511,821 | $ | — | $ | 1,117,625 | ||||||||||
Cost of products sold | 52,949 | 337,903 | 338,546 | — | 729,398 | |||||||||||||||
Gross profit | 86,440 | 128,512 | 173,275 | — | 388,227 | |||||||||||||||
Selling, administrative and engineering expenses | 54,189 | 90,944 | 104,871 | — | 250,004 | |||||||||||||||
Restructuring charges | 2,408 | 10,026 | 7,096 | — | 19,530 | |||||||||||||||
Impairment charges | — | 28,543 | 2,778 | 31,321 | ||||||||||||||||
Amortization of intangible assets | — | 13,881 | 5,763 | — | 19,644 | |||||||||||||||
Operating profit (loss) | 29,843 | (14,882 | ) | 52,767 | — | 67,728 | ||||||||||||||
Financing costs, net | 41,025 | 141 | 683 | — | 41,849 | |||||||||||||||
Intercompany expense (income), net | (15,797 | ) | (1,942 | ) | 17,739 | — | — | |||||||||||||
Other income, net | (194 | ) | (435 | ) | (85 | ) | — | (714 | ) | |||||||||||
Earnings (loss) from continuing operations before income tax expense (benefit) | 4,809 | (12,646 | ) | 34,430 | — | 26,593 | ||||||||||||||
Income tax expense (benefit) | 4,117 | (8,872 | ) | 5,366 | — | 611 | ||||||||||||||
Net earnings (loss) from continuing operations before equity in earnings of subsidiaries | 692 | (3,774 | ) | 29,064 | — | 25,982 | ||||||||||||||
Equity in earnings (loss) of subsidiaries | 398 | 26,286 | (7,678 | ) | (19,006 | ) | — | |||||||||||||
Earnings from continuing operations | 1,090 | 22,512 | 21,386 | (19,006 | ) | 25,982 | ||||||||||||||
Earnings (loss) from discontinued operations | 12,633 | 1,643 | (26,535 | ) | — | (12,259 | ) | |||||||||||||
Net earnings (loss) | $ | 13,723 | $ | 24,155 | $ | (5,149 | ) | $ | (19,006 | ) | $ | 13,723 | ||||||||
ACTUANT CORPORATION
NOTES TO CONSOLIDATED FINANCIAL STATEMENTS—(Continued)
CONDENSED CONSOLIDATING STATEMENTS OF EARNINGS
(In thousands)
| Year Ended August 31, 2008 | |||||||||||||||||||
| Parent | Guarantors | Non-Guarantors | Eliminations | Consolidated | |||||||||||||||
Net sales | $ | 180,212 | $ | 574,022 | $ | 858,956 | $ | — | 1,613,190 | ||||||||||
Cost of products sold | 66,589 | 416,013 | 569,539 | — | 1,052,141 | ||||||||||||||
Gross profit | 113,623 | 158,009 | 289,417 | — | 561,049 | ||||||||||||||
Selling, administrative and engineering expenses | 73,574 | 105,586 | 151,449 | — | 330,609 | ||||||||||||||
Restructuring charges | — | — | 10,473 | — | 10,473 | ||||||||||||||
Amortization of intangible assets | — | 10,167 | 3,766 | — | 13,933 | ||||||||||||||
Operating profit | 40,049 | 42,256 | 123,729 | — | 206,034 | ||||||||||||||
Financing costs, net | 33,806 | 244 | 2,359 | — | 36,409 | ||||||||||||||
Intercompany expense (income), net | (29,581 | ) | 20,690 | 8,891 | — | — | |||||||||||||
Other expense (income), net | 501 | 8,663 | (12,155 | ) | — | (2,991 | ) | ||||||||||||
Earnings before income tax expense and minority interest | 35,323 | 12,659 | 124,634 | — | 172,616 | ||||||||||||||
Income tax expense | 10,668 | 3,869 | 38,879 | — | 53,416 | ||||||||||||||
Minority interest, net of income taxes | — | — | 22 | — | 22 | ||||||||||||||
Earnings from continuing operations before equity in earnings of subsidiaries | 24,655 | 8,790 | 85,733 | — | 119,178 | ||||||||||||||
Equity in earnings of subsidiaries | 97,889 | 97,165 | 5,882 | (200,936 | ) | — | |||||||||||||
Earnings from continuing operations | 122,544 | 105,955 | 91,615 | (200,936 | ) | 119,178 | |||||||||||||
Earnings from discontinuing operations, net of income taxes | — | 1,855 | 1,511 | — | 3,366 | ||||||||||||||
Net earnings | $ | 122,544 | $ | 107,810 | $ | 93,126 | $ | (200,936 | ) | $ | 122,544 | ||||||||
ACTUANT CORPORATION
NOTES TO CONSOLIDATED FINANCIAL STATEMENTS—(Continued)
CONDENSED CONSOLIDATING STATEMENTS OF EARNINGS
(In thousands)
| Twelve Months Ended August 31, 2007 | Year Ended August 31, 2008 | |||||||||||||||||||||||||||||||||||||
| Parent | Guarantors | Non-Guarantors | Eliminations | Consolidated | Parent | Guarantors | Non-Guarantors | Eliminations | Consolidated | |||||||||||||||||||||||||||||
Net sales | $ | 171,596 | $ | 551,989 | $ | 712,627 | $ | — | $ | 1,436,212 | $ | 180,212 | $ | 574,022 | $ | 691,906 | $ | — | $ | 1,446,140 | ||||||||||||||||||
Cost of sales | 76,647 | 400,519 | 482,269 | — | 959,435 | |||||||||||||||||||||||||||||||||
Cost of products sold | 66,589 | 416,013 | 434,425 | — | 917,027 | |||||||||||||||||||||||||||||||||
Gross profit | 94,949 | 151,470 | 230,358 | — | 476,777 | 113,623 | 158,009 | 257,481 | — | 529,113 | ||||||||||||||||||||||||||||
Selling, administrative and engineering expenses | 62,866 | 88,363 | 127,195 | — | 278,424 | 73,574 | 105,586 | 119,372 | — | 298,532 | ||||||||||||||||||||||||||||
Restructuring charges | — | — | 5,395 | — | 5,395 | |||||||||||||||||||||||||||||||||
Amortization of intangible assets | — | 7,020 | 3,535 | — | 10,555 | — | 10,167 | 3,774 | — | 13,941 | ||||||||||||||||||||||||||||
Operating profit | 32,083 | 56,087 | 94,233 | — | 182,403 | 40,049 | 42,256 | 134,335 | — | 216,640 | ||||||||||||||||||||||||||||
Financing costs, net | 29,610 | 231 | 3,160 | — | 33,001 | 33,806 | 244 | 2,359 | — | 36,409 | ||||||||||||||||||||||||||||
Intercompany expense (income), net | (20,439 | ) | 21,109 | (670 | ) | — | — | (29,581 | ) | 20,690 | 8,891 | — | — | |||||||||||||||||||||||||
Other expense, net | 155 | 38 | 589 | — | 782 | |||||||||||||||||||||||||||||||||
Other (income) expense, net | 501 | 8,663 | (11,213 | ) | — | (2,049 | ) | |||||||||||||||||||||||||||||||
Earnings before income tax expense and minority interest | 22,757 | 34,709 | 91,154 | — | 148,620 | 35,323 | 12,659 | 134,298 | — | 182,280 | ||||||||||||||||||||||||||||
Income tax expense | 6,986 | 10,656 | 27,990 | — | 45,632 | 10,668 | 3,869 | 41,952 | — | 56,489 | ||||||||||||||||||||||||||||
Minority interest, net of income taxes | — | — | (43 | ) | — | (43 | ) | |||||||||||||||||||||||||||||||
Net earnings from continuing operations before equity in earnings of subsidiaries | 15,771 | 24,053 | 63,207 | — | 103,031 | |||||||||||||||||||||||||||||||||
Net earnings before equity in earnings of subsidiaries | 24,655 | 8,790 | 92,346 | — | 125,791 | |||||||||||||||||||||||||||||||||
Equity in earnings of subsidiaries | 89,181 | 81,952 | 1,042 | (172,175 | ) | — | 97,889 | 97,165 | 5,882 | (200,936 | ) | — | ||||||||||||||||||||||||||
Earnings from continuing operations | 104,952 | 106,005 | 64,249 | (172,175 | ) | 103,031 | 122,544 | 105,955 | 98,228 | (200,936 | ) | 125,791 | ||||||||||||||||||||||||||
Earnings from discontinued operations, net of income taxes | — | 1,548 | 373 | — | 1,921 | |||||||||||||||||||||||||||||||||
Earnings (loss) from discontinued operations | — | 1,855 | (5,102 | ) | — | (3,247 | ) | |||||||||||||||||||||||||||||||
Net earnings | $ | 104,952 | $ | 107,553 | $ | 64,622 | $ | (172,175 | ) | $ | 104,952 | $ | 122,544 | $ | 107,810 | $ | 93,126 | $ | (200,936 | ) | $ | 122,544 | ||||||||||||||||
ACTUANT CORPORATION
NOTES TO CONSOLIDATED FINANCIAL STATEMENTS—(Continued)
CONDENSED CONSOLIDATING BALANCE SHEETS
(In thousands)
| August 31, 2009 | August 31, 2010 | ||||||||||||||||||||||||||||||||||
| Parent | Guarantors | Non-Guarantors | Eliminations | Consolidated | Parent | Guarantors | Non-Guarantors | Eliminations | Consolidated | ||||||||||||||||||||||||||
ASSETS | |||||||||||||||||||||||||||||||||||
Current Assets | |||||||||||||||||||||||||||||||||||
Cash and cash equivalents | $ | 126 | $ | — | $ | 11,259 | $ | — | $ | 11,385 | $ | 5,055 | $ | — | $ | 35,167 | $ | — | $ | 40,222 | |||||||||||||||
Accounts receivable | 233 | 7,049 | 148,238 | — | 155,520 | ||||||||||||||||||||||||||||||
Inventories | 18,000 | 70,513 | 72,143 | — | 160,656 | ||||||||||||||||||||||||||||||
Accounts receivable, net | 16,467 | 61,675 | 107,551 | — | 185,693 | ||||||||||||||||||||||||||||||
Inventories, net | 23,680 | 69,172 | 53,302 | — | 146,154 | ||||||||||||||||||||||||||||||
Deferred income taxes | 21,891 | — | (1,036 | ) | — | 20,855 | 30,701 | — | — | — | 30,701 | ||||||||||||||||||||||||
Prepaid expenses and other current assets | 4,140 | 2,763 | 8,343 | — | 15,246 | 2,645 | 3,705 | 6,228 | — | 12,578 | |||||||||||||||||||||||||
Current assets of discontinued operations | — | — | 44,802 | — | 44,802 | ||||||||||||||||||||||||||||||
Total Current Assets | 44,390 | 80,325 | 238,947 | — | 363,662 | 78,548 | 134,562 | 247,050 | — | 460,150 | |||||||||||||||||||||||||
Property, Plant & Equipment, net | 6,829 | 47,488 | 74,801 | — | 129,118 | 5,166 | 41,226 | 61,990 | — | 108,382 | |||||||||||||||||||||||||
Goodwill | 68,969 | 416,785 | 225,768 | — | 711,522 | 68,969 | 417,914 | 218,006 | — | 704,889 | |||||||||||||||||||||||||
Other Intangibles, net | — | 256,494 | 93,755 | — | 350,249 | — | 242,310 | 94,668 | — | 336,978 | |||||||||||||||||||||||||
Intercompany Receivable | — | 227,792 | 212,847 | (440,639 | ) | — | |||||||||||||||||||||||||||||
Investment in Subsidiaries | 1,551,852 | 287,991 | 122,569 | (1,962,412 | ) | — | 1,511,103 | 319,196 | 115,846 | (1,946,145 | ) | — | |||||||||||||||||||||||
Other Long-term Assets | 13,014 | 24 | 842 | — | 13,880 | 8,421 | 130 | 2,753 | — | 11,304 | |||||||||||||||||||||||||
Total Assets | $ | 1,685,054 | $ | 1,089,107 | $ | 756,682 | $ | (1,962,412 | ) | $ | 1,568,431 | $ | 1,672,207 | $ | 1,383,120 | $ | 953,160 | $ | (2,386,784 | ) | $ | 1,621,703 | |||||||||||||
LIABILITIES & SHAREHOLDERS’ EQUITY | |||||||||||||||||||||||||||||||||||
Current Liabilities | |||||||||||||||||||||||||||||||||||
Short-term borrowings | $ | 3,291 | $ | — | $ | 1,673 | $ | — | $ | 4,964 | |||||||||||||||||||||||||
Trade accounts payable | 11,528 | 28,697 | 68,108 | — | 108,333 | $ | 16,055 | $ | 35,546 | $ | 78,450 | $ | — | $ | 130,051 | ||||||||||||||||||||
Accrued compensation and benefits | 7,488 | 5,318 | 17,273 | — | 30,079 | 22,057 | 11,083 | 20,072 | — | 53,212 | |||||||||||||||||||||||||
Income taxes payable | 15,691 | — | 4,887 | — | 20,578 | 43,822 | — | 6,496 | — | 50,318 | |||||||||||||||||||||||||
Other current liabilities | 20,672 | 20,311 | 30,157 | — | 71,140 | 20,898 | 14,354 | 39,309 | — | 74,561 | |||||||||||||||||||||||||
Current liabilities of discontinued operations | — | — | 37,695 | — | 37,695 | ||||||||||||||||||||||||||||||
Total Current Liabilities | 58,670 | 54,326 | 122,098 | — | 235,094 | 102,832 | 60,983 | 182,022 | — | 345,837 | |||||||||||||||||||||||||
Long-term Debt, less Current Maturities | 400,135 | — | — | — | 400,135 | 367,380 | — | — | — | 367,380 | |||||||||||||||||||||||||
Deferred Income Taxes | 80,972 | — | 36,363 | — | 117,335 | 84,694 | — | 25,536 | — | 110,230 | |||||||||||||||||||||||||
Pension and Postretirement Benefit Liabilities | 19,093 | 1,091 | 17,478 | — | 37,662 | ||||||||||||||||||||||||||||||
Pension and Post-retirement Benefit Liabilities | 27,144 | 972 | (44 | ) | — | 28,072 | |||||||||||||||||||||||||||||
Other Long-term Liabilities | 21,775 | 944 | 8,116 | — | 30,835 | 20,257 | 766 | 9,440 | — | 30,463 | |||||||||||||||||||||||||
Intercompany Payable (Receivable) | 357,039 | (271,329 | ) | (85,710 | ) | — | — | ||||||||||||||||||||||||||||
Intercompany Payable | 330,179 | — | 110,460 | (440,639 | ) | — | |||||||||||||||||||||||||||||
Shareholders’ Equity | 747,370 | 1,304,075 | 658,337 | (1,962,412 | ) | 747,370 | 739,721 | 1,320,399 | 625,746 | (1,946,145 | ) | 739,721 | |||||||||||||||||||||||
Total Liabilities and Shareholders’ Equity | $ | 1,685,054 | $ | 1,089,107 | $ | 756,682 | $ | (1,962,412 | ) | $ | 1,568,431 | $ | 1,672,207 | $ | 1,383,120 | $ | 953,160 | $ | (2,386,784 | ) | $ | 1,621,703 | |||||||||||||
ACTUANT CORPORATION
NOTES TO CONSOLIDATED FINANCIAL STATEMENTS—(Continued)
CONDENSED CONSOLIDATING BALANCE SHEETS
(In thousands)
| August 31, 2008 | August 31, 2009 | |||||||||||||||||||||||||||||||||||
| Parent | Guarantors | Non-Guarantors | Eliminations | Consolidated | Parent | Guarantors | Non-Guarantors | Eliminations | Consolidated | |||||||||||||||||||||||||||
ASSETS | ||||||||||||||||||||||||||||||||||||
Current Assets | ||||||||||||||||||||||||||||||||||||
Cash and cash equivalents | $ | 43,132 | $ | 213 | $ | 79,204 | $ | — | $ | 122,549 | $ | 126 | $ | — | $ | 11,259 | $ | — | $ | 11,385 | ||||||||||||||||
Accounts receivable, net | 325 | 9,039 | 217,200 | — | 226,564 | 233 | 7,049 | 148,238 | — | 155,520 | ||||||||||||||||||||||||||
Inventories, net | 26,273 | 87,835 | 101,283 | — | 215,391 | 18,000 | 70,513 | 72,143 | — | 160,656 | ||||||||||||||||||||||||||
Deferred income taxes | 12,835 | 36 | (1,001 | ) | — | 11,870 | 21,891 | — | (1,036 | ) | — | 20,855 | ||||||||||||||||||||||||
Prepaid expenses and other current assets | 4,651 | 2,541 | 8,900 | — | 16,092 | 4,140 | 2,763 | 8,343 | — | 15,246 | ||||||||||||||||||||||||||
Total Current Assets | 87,216 | 99,664 | 405,586 | — | 592,466 | 44,390 | 80,325 | 238,947 | — | 363,662 | ||||||||||||||||||||||||||
Property, Plant & Equipment, net | 9,463 | 46,209 | 78,878 | — | 134,550 | 6,829 | 47,488 | 74,801 | — | 129,118 | ||||||||||||||||||||||||||
Goodwill | 65,062 | 390,306 | 184,494 | — | 639,862 | 68,969 | 416,785 | 225,768 | — | 711,522 | ||||||||||||||||||||||||||
Other Intangibles, net | — | 228,099 | 64,260 | — | 292,359 | — | 256,494 | 93,755 | — | 350,249 | ||||||||||||||||||||||||||
Investment in Subsidiaries | 1,345,395 | 250,953 | 42,212 | (1,638,560 | ) | — | 1,551,852 | 287,991 | 122,569 | (1,962,412 | ) | — | ||||||||||||||||||||||||
Intercompany Receivable | 2,115,530 | 2,386,859 | 2,472,569 | (6,974,958 | ) | — | ||||||||||||||||||||||||||||||
Other Long-term Assets | 8,185 | 220 | 740 | — | 9,145 | 13,014 | 24 | 842 | — | 13,880 | ||||||||||||||||||||||||||
Total Assets | $ | 1,515,321 | $ | 1,015,451 | $ | 776,170 | $ | (1,638,560 | ) | $ | 1,668,382 | $ | 3,800,584 | $ | 3,475,966 | $ | 3,229,251 | $ | (8,937,370 | ) | $ | 1,568,431 | ||||||||||||||
LIABILITIES & SHAREHOLDERS’ EQUITY | ||||||||||||||||||||||||||||||||||||
Current Liabilities | ||||||||||||||||||||||||||||||||||||
Short-term borrowings | $ | — | $ | — | $ | 339 | $ | — | $ | 339 | $ | 3,291 | $ | — | $ | 1,673 | $ | — | $ | 4,964 | ||||||||||||||||
Trade accounts payable | 23,394 | 45,408 | 98,061 | — | 166,863 | 11,528 | 28,697 | 68,108 | — | 108,333 | ||||||||||||||||||||||||||
Accrued compensation and benefits | 19,431 | 10,664 | 28,928 | — | 59,023 | 7,488 | 5,318 | 17,273 | — | 30,079 | ||||||||||||||||||||||||||
Income taxes payable (receivable) | (6,702 | ) | 278 | 31,291 | — | 24,867 | ||||||||||||||||||||||||||||||
Income taxes payable | 15,691 | — | 4,887 | — | 20,578 | |||||||||||||||||||||||||||||||
Other current liabilities | 16,461 | 17,829 | 25,743 | — | 60,033 | 20,672 | 20,311 | 30,157 | — | 71,140 | ||||||||||||||||||||||||||
Total Current Liabilities | 52,584 | 74,179 | 184,362 | — | 311,125 | 58,670 | 54,326 | 122,098 | — | 235,094 | ||||||||||||||||||||||||||
Long-term Debt, less Current Maturities | 573,818 | — | — | — | 573,818 | 400,135 | — | — | — | 400,135 | ||||||||||||||||||||||||||
Deferred Income Taxes | 80,744 | (286 | ) | 19,176 | — | 99,634 | 80,972 | — | 36,363 | — | 117,335 | |||||||||||||||||||||||||
Pension and Post-retirement Benefit Liabilities | 9,628 | — | 18,013 | — | 27,641 | 19,093 | 1,091 | 17,478 | — | 37,662 | ||||||||||||||||||||||||||
Other Long-term Liabilities | 19,012 | 1,218 | 6,428 | — | 26,658 | 21,775 | 944 | 8,116 | — | 30,835 | ||||||||||||||||||||||||||
Intercompany Payable (Receivable) | 150,029 | (229,657 | ) | 79,628 | — | — | ||||||||||||||||||||||||||||||
Intercompany Payable | 2,472,569 | 2,115,530 | 2,386,859 | (6,974,958 | ) | — | ||||||||||||||||||||||||||||||
Shareholders’ Equity | 629,506 | 1,169,997 | 468,563 | (1,638,560 | ) | 629,506 | 747,370 | 1,304,075 | 658,337 | (1,962,412 | ) | 747,370 | ||||||||||||||||||||||||
Total Liabilities and Shareholders’ Equity | $ | 1,515,321 | $ | 1,015,451 | $ | 776,170 | $ | (1,638,560 | ) | $ | 1,668,382 | $ | 3,800,584 | $ | 3,475,966 | $ | 3,229,251 | $ | (8,937,370 | ) | $ | 1,568,431 | ||||||||||||||
ACTUANT CORPORATION
NOTES TO CONSOLIDATED FINANCIAL STATEMENTS—(Continued)
CONDENSED CONSOLIDATING STATEMENTS OF CASH FLOWS
(In thousands)
| Year Ended August 31, 2009 | ||||||||||||||||||||
| Parent | Guarantors | Non-Guarantors | Eliminations | Consolidated | ||||||||||||||||
Operating Activities | ||||||||||||||||||||
Net cash provided by operating activities | $ | 29,722 | $ | 70,016 | $ | 90,813 | $ | (43,836 | ) | $ | 146,715 | |||||||||
Investing Activities | ||||||||||||||||||||
Proceeds from sale of property, plant & equipment | — | 512 | 1,350 | — | 1,862 | |||||||||||||||
Capital expenditures | (489 | ) | (5,275 | ) | (15,690 | ) | — | (21,454 | ) | |||||||||||
Proceeds on divestiture of business | 38,455 | — | — | — | 38,455 | |||||||||||||||
Changes in intercompany receivables (payable) | 155,285 | (31,699 | ) | (123,586 | ) | — | — | |||||||||||||
Business acquisitions, net of cash acquired | (234,600 | ) | (3,066 | ) | (1,756 | ) | — | (239,422 | ) | |||||||||||
| �� | ||||||||||||||||||||
Cash used in investing activities | (41,349 | ) | (39,528 | ) | (139,682 | ) | — | (220,559 | ) | |||||||||||
Financing Activities | ||||||||||||||||||||
Net borrowings on revolving credit facilities and short-term borrowings | 15,325 | — | 1,332 | — | 16,657 | |||||||||||||||
Principal repayments on term loans | (279,100 | ) | — | — | — | (279,100 | ) | |||||||||||||
Proceeds from issuance of term loans | 115,000 | — | — | — | 115,000 | |||||||||||||||
Debt issuance and amendment costs | (9,158 | ) | — | — | — | (9,158 | ) | |||||||||||||
Proceeds from equity issuance | 124,781 | — | — | — | 124,781 | |||||||||||||||
Dividends paid | (2,251 | ) | (30,701 | ) | (13,135 | ) | 43,836 | (2,251 | ) | |||||||||||
All other | 4,024 | — | — | — | 4,024 | |||||||||||||||
Cash used in financing activities | (31,379 | ) | (30,701 | ) | (11,803 | ) | 43,836 | (30,047 | ) | |||||||||||
Effect of exchange rate changes on cash | — | — | (7,273 | ) | — | (7,273 | ) | |||||||||||||
Net decrease in cash and cash equivalents | (43,006 | ) | (213 | ) | (67,945 | ) | — | (111,164 | ) | |||||||||||
Cash and cash equivalents - beginning of period | 43,132 | 213 | 79,204 | — | 122,549 | |||||||||||||||
Cash and cash equivalents - end of period | $ | 126 | $ | — | $ | 11,259 | $ | — | $ | 11,385 | ||||||||||
| Year Ended August 31, 2010 | ||||||||||||||||||||
| Parent | Guarantors | Non-Guarantors | Eliminations | Consolidated | ||||||||||||||||
Operating Activities | ||||||||||||||||||||
Net cash provided by (used in) operating activities | $ | 137,143 | $ | (6,739 | ) | $ | 42,827 | $ | (52,145 | ) | $ | 121,086 | ||||||||
Investing Activities | ||||||||||||||||||||
Proceeds from sale of property, plant & equipment | 1 | 439 | 796 | — | 1,236 | |||||||||||||||
Proceeds from sale of businesses | — | — | 7,516 | — | 7,516 | |||||||||||||||
Capital expenditures | (1,219 | ) | (8,309 | ) | (10,438 | ) | — | (19,966 | ) | |||||||||||
Business acquisitions, net of cash acquired | — | (9,374 | ) | (36,492 | ) | — | (45,866 | ) | ||||||||||||
Cash used in investing activities | (1,218 | ) | (17,244 | ) | (38,618 | ) | — | (57,080 | ) | |||||||||||
Financing Activities | ||||||||||||||||||||
Net repayments on revolving credit facilities and other debt | (12,608 | ) | — | (1,705 | ) | — | (14,313 | ) | ||||||||||||
Open market repurchases of 2% Convertible Notes | (22,894 | ) | — | — | — | (22,894 | ) | |||||||||||||
Intercompany loan activity | (96,107 | ) | 55,378 | 40,729 | — | — | ||||||||||||||
Stock option exercises, related tax benefits and other | 3,315 | — | — | — | 3,315 | |||||||||||||||
Cash dividend | (2,702 | ) | (31,395 | ) | (20,750 | ) | 52,145 | (2,702 | ) | |||||||||||
Cash provided by (used in) financing activities | (130,996 | ) | 23,983 | 18,274 | 52,145 | (36,594 | ) | |||||||||||||
Effect of exchange rate changes on cash | — | — | 1,425 | — | 1,425 | |||||||||||||||
Net increase in cash and cash equivalents | 4,929 | — | 23,908 | — | 28,837 | |||||||||||||||
Cash and cash equivalents - beginning of period | 126 | — | 11,259 | 11,385 | ||||||||||||||||
Cash and cash equivalents - end of period | $ | 5,055 | $ | — | $ | 35,167 | $ | — | $ | 40,222 | ||||||||||
ACTUANT CORPORATION
NOTES TO CONSOLIDATED FINANCIAL STATEMENTS—(Continued)
CONDENSED CONSOLIDATING STATEMENTS OF CASH FLOWS
(In thousands)
| Year Ended August 31, 2008 | Year Ended August 31, 2009 | |||||||||||||||||||||||||||||||||||||||
| Parent | Guarantors | Non-Guarantors | Eliminations | Consolidated | Parent | Guarantors | Non-Guarantors | Eliminations | Consolidated | |||||||||||||||||||||||||||||||
Operating Activities | ||||||||||||||||||||||||||||||||||||||||
Net cash provided by operating activities | $ | 101,826 | $ | 86,238 | $ | 92,644 | $ | (110,611 | ) | $ | 170,097 | $ | 82,428 | $ | 22,960 | $ | 85,163 | $ | (43,836 | ) | $ | 146,715 | ||||||||||||||||||
Investing Activities | ||||||||||||||||||||||||||||||||||||||||
Proceeds from sale of property, plant & equipment | 1,491 | 8,328 | 4,246 | — | 14,065 | — | 512 | 1,350 | — | 1,862 | ||||||||||||||||||||||||||||||
Proceeds from sale of business | 38,455 | — | — | — | 38,455 | |||||||||||||||||||||||||||||||||||
Capital expenditures | (2,602 | ) | (8,385 | ) | (33,420 | ) | — | (44,407 | ) | (489 | ) | (5,275 | ) | (15,690 | ) | — | (21,454 | ) | ||||||||||||||||||||||
Changes in intercompany receivables (payable) | (39,697 | ) | (1,618 | ) | 41,315 | — | — | |||||||||||||||||||||||||||||||||
Business acquisitions, net of cash acquired | (47,390 | ) | (210 | ) | (62,509 | ) | — | �� | (110,109 | ) | (234,600 | ) | (3,066 | ) | (1,756 | ) | — | (239,422 | ) | |||||||||||||||||||||
Cash used in investing activities | (88,198 | ) | (1,885 | ) | (50,368 | ) | — | (140,451 | ) | (196,634 | ) | (7,829 | ) | (16,096 | ) | — | (220,559 | ) | ||||||||||||||||||||||
Financing Activities | ||||||||||||||||||||||||||||||||||||||||
Net borrowings on revolving credit facilities and short-term borrowings | (1,909 | ) | — | 2,155 | — | 246 | ||||||||||||||||||||||||||||||||||
Proceeds from term loan | — | — | (7 | ) | — | (7 | ) | |||||||||||||||||||||||||||||||||
Principal repayments on term loans | — | — | (1,008 | ) | — | (1,008 | ) | |||||||||||||||||||||||||||||||||
Dividends paid | (2,221 | ) | (84,140 | ) | (26,471 | ) | 110,611 | (2,221 | ) | |||||||||||||||||||||||||||||||
All other | 8,029 | — | — | — | 8,029 | |||||||||||||||||||||||||||||||||||
Net borrowings on revolving credit facilities and other debt | 15,325 | — | 1,332 | — | 16,657 | |||||||||||||||||||||||||||||||||||
Intercompany loan activity | 102,579 | 15,357 | (117,936 | ) | — | — | ||||||||||||||||||||||||||||||||||
Principal repayments on term loans and other debt | (279,100 | ) | — | — | — | (279,100 | ) | |||||||||||||||||||||||||||||||||
Proceeds from issuance of term loans | 115,000 | — | — | — | 115,000 | |||||||||||||||||||||||||||||||||||
Debt issuance costs | (9,158 | ) | — | — | — | (9,158 | ) | |||||||||||||||||||||||||||||||||
Proceeds from equity offering, net of transaction costs | 124,781 | — | — | — | 124,781 | |||||||||||||||||||||||||||||||||||
Stock option exercises, related tax benefits and other | 4,024 | — | — | — | 4,024 | |||||||||||||||||||||||||||||||||||
Cash dividend | (2,251 | ) | (30,701 | ) | (13,135 | ) | 43,836 | (2,251 | ) | |||||||||||||||||||||||||||||||
Cash provided by (used in) financing activities | 3,899 | (84,140 | ) | (25,331 | ) | 110,611 | 5,039 | 71,200 | (15,344 | ) | (129,739 | ) | 43,836 | (30,047 | ) | |||||||||||||||||||||||||
Effect of exchange rate changes on cash | — | — | 1,184 | — | 1,184 | — | — | (7,273 | ) | — | (7,273 | ) | ||||||||||||||||||||||||||||
Net increase in cash and cash equivalents | 17,527 | 213 | 18,129 | — | 35,869 | |||||||||||||||||||||||||||||||||||
Cash and cash equivalents—beginning of period | 25,605 | — | 61,075 | — | 86,680 | |||||||||||||||||||||||||||||||||||
Net decrease in cash and cash equivalents | (43,006 | ) | (213 | ) | (67,945 | ) | — | (111,164 | ) | |||||||||||||||||||||||||||||||
Cash and cash equivalents - beginning of period | 43,132 | 213 | 79,204 | — | 122,549 | |||||||||||||||||||||||||||||||||||
Cash and cash equivalents—end of period | $ | 43,132 | $ | 213 | $ | 79,204 | $ | — | $ | 122,549 | ||||||||||||||||||||||||||||||
Cash and cash equivalents - end of period | $ | 126 | $ | — | $ | 11,259 | $ | — | $ | 11,385 | ||||||||||||||||||||||||||||||
ACTUANT CORPORATION
NOTES TO CONSOLIDATED FINANCIAL STATEMENTS—(Continued)
CONDENSED CONSOLIDATING STATEMENTS OF CASH FLOWS
(In thousands)
| Year Ended August 31, 2007 | ||||||||||||||||||||
| Parent | Guarantors | Non-Guarantors | Eliminations | Consolidated | ||||||||||||||||
Operating Activities | ||||||||||||||||||||
Net cash provided by operating activities | $ | 83,584 | $ | 38,226 | $ | 96,656 | $ | (41,356 | ) | $ | 177,110 | |||||||||
Investing Activities | ||||||||||||||||||||
Proceeds from sale of property, plant & equipment | 2,454 | 160 | 1,956 | — | 4,570 | |||||||||||||||
Capital expenditures | (4,573 | ) | (3,734 | ) | (23,184 | ) | — | (31,491 | ) | |||||||||||
Changes in intercompany receivables (payable) | (10,286 | ) | (4,073 | ) | 14,359 | — | — | |||||||||||||
Business acquisitions, net of cash acquired | (119,452 | ) | — | (43,529 | ) | — | (162,981 | ) | ||||||||||||
Cash used in investing activities | (131,857 | ) | (7,647 | ) | (50,398 | ) | — | (189,902 | ) | |||||||||||
Financing Activities | ||||||||||||||||||||
Net repayments on revolving credit facilities and short-term borrowings | (80,229 | ) | — | (126 | ) | — | (80,355 | ) | ||||||||||||
Proceeds from Senior Note offering, net of discount | 249,039 | — | — | — | 249,039 | |||||||||||||||
Proceeds from issuance of term loans | 150,000 | — | 5,737 | — | 155,737 | |||||||||||||||
Principal repayments on term loans | (245,000 | ) | — | (6,737 | ) | — | (251,737 | ) | ||||||||||||
Dividends paid | (2,187 | ) | (30,579 | ) | (10,777 | ) | 41,356 | (2,187 | ) | |||||||||||
All other | 1,680 | — | — | — | 1,680 | |||||||||||||||
Cash provided by (used in) financing activities | 73,303 | (30,579 | ) | (11,903 | ) | 41,356 | 72,177 | |||||||||||||
Effect of exchange rate changes on cash | — | — | 1,636 | — | 1,636 | |||||||||||||||
Net increase in cash and cash equivalents | 25,030 | — | 35,991 | — | 61,021 | |||||||||||||||
Cash and cash equivalents—beginning of period | 575 | — | 25,084 | — | 25,659 | |||||||||||||||
Cash and cash equivalents—end of period | $ | 25,605 | $ | — | $ | 61,075 | $ | — | $ | 86,680 | ||||||||||
| Year Ended August 31, 2008 | ||||||||||||||||||||
| Parent | Guarantors | Non-Guarantors | Eliminations | Consolidated | ||||||||||||||||
Operating Activities | ||||||||||||||||||||
Net cash provided by operating activities | $ | 62,962 | $ | 121,996 | $ | 95,750 | $ | (110,611 | ) | $ | 170,097 | |||||||||
Investing Activities | ||||||||||||||||||||
Proceeds from sale of property, plant & equipment | 1,491 | 8,328 | 4,246 | — | 14,065 | |||||||||||||||
Capital expenditures | (2,602 | ) | (8,385 | ) | (33,420 | ) | — | (44,407 | ) | |||||||||||
Business acquisitions, net of cash acquired | (47,390 | ) | (210 | ) | (62,509 | ) | — | (110,109 | ) | |||||||||||
Cash used in investing activities | (48,501 | ) | (267 | ) | (91,683 | ) | — | (140,451 | ) | |||||||||||
Financing Activities | ||||||||||||||||||||
Net borrowings on revolving credit facilities and other debt | (1,909 | ) | — | 2,155 | — | 246 | ||||||||||||||
Intercompany loan activity | (833 | ) | (37,376 | ) | 38,209 | — | — | |||||||||||||
Principal repayments on term loans and other debt | — | — | (1,015 | ) | — | (1,015 | ) | |||||||||||||
Cash dividend | (2,221 | ) | (84,140 | ) | (26,471 | ) | 110,611 | (2,221 | ) | |||||||||||
Stock option exercises, related tax benefits and other | 8,029 | — | — | — | 8,029 | |||||||||||||||
Cash provided by (used in) financing activities | 3,066 | (121,516 | ) | 12,878 | 110,611 | 5,039 | ||||||||||||||
Effect of exchange rate changes on cash | — | — | 1,184 | — | 1,184 | |||||||||||||||
Net increase in cash and cash equivalents | 17,527 | 213 | 18,129 | — | 35,869 | |||||||||||||||
Cash and cash equivalents - beginning of period | 25,605 | — | 61,075 | — | 86,680 | |||||||||||||||
Cash and cash equivalents - end of period | $ | 43,132 | $ | 213 | $ | 79,204 | $ | — | $ | 122,549 | ||||||||||
ACTUANT CORPORATION
NOTES TO CONSOLIDATED FINANCIAL STATEMENTS—(Continued)
Note 19. Quarterly Financial Data (Unaudited)
Quarterly financial data for fiscal 20092010 and fiscal 20082009 is as follows:
| Year Ended August 31, 2009 | Year Ended August 31, 2010 | ||||||||||||||||||||||||||||||||||||||
| First | Second | Third | Fourth | Total | First | Second | Third | Fourth | Total | ||||||||||||||||||||||||||||||
Net sales | $ | 370,789 | $ | 293,799 | $ | 285,154 | $ | 290,056 | $ | 1,239,798 | $ | 272,640 | $ | 267,438 | $ | 310,068 | $ | 310,362 | $ | 1,160,508 | |||||||||||||||||||
Gross profit | 130,225 | 94,508 | 95,361 | 94,580 | 414,674 | 100,123 | 96,363 | 116,186 | 114,580 | 427,252 | |||||||||||||||||||||||||||||
Restructuring charges | 2,831 | 9,968 | 1,448 | 2,447 | 16,694 | ||||||||||||||||||||||||||||||||||
Earnings from continuing operations | 13,260 | 7,895 | 28,293 | 20,909 | 70,356 | ||||||||||||||||||||||||||||||||||
Loss from discontinued operations | (1,406 | ) | (738 | ) | (6,458 | ) | (37,723 | ) | (46,325 | ) | |||||||||||||||||||||||||||||
Net earnings (loss) | 11,854 | 7,157 | 21,835 | (16,814 | ) | 24,031 | |||||||||||||||||||||||||||||||||
Earnings from continuing operations per share: | |||||||||||||||||||||||||||||||||||||||
Basic | $ | 0.20 | $ | 0.12 | $ | 0.42 | $ | 0.31 | $ | 1.04 | |||||||||||||||||||||||||||||
Diluted | 0.19 | 0.11 | 0.39 | 0.29 | 0.97 | ||||||||||||||||||||||||||||||||||
Earnings (loss) from discontinued operations per share: | |||||||||||||||||||||||||||||||||||||||
Basic | (0.02 | ) | (0.01 | ) | (0.10 | ) | (0.56 | ) | (0.68 | ) | |||||||||||||||||||||||||||||
Diluted | (0.02 | ) | (0.01 | ) | (0.09 | ) | (0.51 | ) | (0.62 | ) | |||||||||||||||||||||||||||||
Net earnings (loss) per share | |||||||||||||||||||||||||||||||||||||||
Basic | 0.18 | 0.11 | 0.32 | (0.25 | ) | 0.36 | |||||||||||||||||||||||||||||||||
Diluted | 0.17 | 0.10 | 0.30 | (0.22 | ) | 0.35 | |||||||||||||||||||||||||||||||||
| Year Ended August 31, 2009 | |||||||||||||||||||||||||||||||||||||||
| First | Second | Third | Fourth | Total | |||||||||||||||||||||||||||||||||||
Net sales | $ | 335,274 | $ | 263,709 | $ | 257,620 | $ | 261,022 | $ | 1,117,625 | |||||||||||||||||||||||||||||
Gross profit | 121,934 | 88,304 | 89,759 | 88,230 | 388,227 | ||||||||||||||||||||||||||||||||||
Restructuring charges | 674 | 2,564 | 8,494 | 9,111 | 20,843 | ||||||||||||||||||||||||||||||||||
Earnings from continuing operations | 11,899 | 4,229 | 3,211 | 4,512 | 23,851 | 11,628 | 5,108 | 5,310 | 3,936 | 25,982 | |||||||||||||||||||||||||||||
Earnings (loss) from discontinued operations | (300 | ) | (985 | ) | (20,846 | ) | 12,003 | (10,128 | ) | (30 | ) | (1,864 | ) | (22,945 | ) | 12,580 | (12,259 | ) | |||||||||||||||||||||
Net earnings (loss) | 11,599 | 3,244 | (17,635 | ) | 16,515 | 13,723 | 11,598 | 3,244 | (17,635 | ) | 16,516 | 13,723 | |||||||||||||||||||||||||||
Earnings from continuing operations per share: | |||||||||||||||||||||||||||||||||||||||
Basic | $ | 0.21 | $ | 0.08 | $ | 0.06 | $ | 0.07 | $ | 0.41 | $ | 0.21 | $ | 0.09 | $ | 0.09 | $ | 0.06 | $ | 0.45 | |||||||||||||||||||
Diluted | 0.19 | 0.08 | 0.06 | 0.07 | 0.40 | 0.19 | 0.09 | 0.09 | 0.06 | 0.43 | |||||||||||||||||||||||||||||
Earnings (loss) from discontinued operations per share: | |||||||||||||||||||||||||||||||||||||||
Basic | 0.00 | (0.02 | ) | (0.37 | ) | 0.19 | (0.17 | ) | 0.00 | (0.03 | ) | (0.40 | ) | 0.20 | (0.21 | ) | |||||||||||||||||||||||
Diluted | 0.00 | (0.02 | ) | (0.33 | ) | 0.17 | (0.16 | ) | 0.00 | (0.03 | ) | (0.36 | ) | 0.18 | (0.19 | ) | |||||||||||||||||||||||
Net earnings (loss) per share: | |||||||||||||||||||||||||||||||||||||||
Net earnings (loss) per share | |||||||||||||||||||||||||||||||||||||||
Basic | 0.21 | 0.06 | (0.31 | ) | 0.26 | 0.24 | 0.21 | 0.06 | (0.31 | ) | 0.26 | 0.24 | |||||||||||||||||||||||||||
Diluted | 0.19 | 0.06 | (0.27 | ) | 0.24 | 0.24 | 0.19 | 0.06 | (0.27 | ) | 0.24 | 0.24 | |||||||||||||||||||||||||||
| Year Ended August 31, 2008 | |||||||||||||||||||||||||||||||||||||||
| First | Second | Third | Fourth | Total | |||||||||||||||||||||||||||||||||||
Net sales | $ | 400,999 | $ | 386,910 | $ | 431,811 | $ | 393,470 | $ | 1,613,190 | |||||||||||||||||||||||||||||
Gross profit | 137,172 | 130,907 | 150,719 | 142,251 | 561,049 | ||||||||||||||||||||||||||||||||||
Earnings from continuing operations | 26,325 | 21,498 | 37,773 | 33,582 | 119,178 | ||||||||||||||||||||||||||||||||||
Earnings from discontinued operations | 1,102 | 741 | 862 | 661 | 3,366 | ||||||||||||||||||||||||||||||||||
Net earnings | 27,427 | 22,239 | 38,635 | 34,243 | 122,544 | ||||||||||||||||||||||||||||||||||
Earnings from continuing operations per share: | |||||||||||||||||||||||||||||||||||||||
Basic | $ | 0.47 | $ | 0.39 | $ | 0.68 | $ | 0.60 | $ | 2.14 | |||||||||||||||||||||||||||||
Diluted | 0.42 | 0.34 | 0.59 | 0.53 | 1.88 | ||||||||||||||||||||||||||||||||||
Earnings from discontinued operations per share: | |||||||||||||||||||||||||||||||||||||||
Basic | 0.02 | 0.01 | 0.01 | 0.01 | 0.06 | ||||||||||||||||||||||||||||||||||
Diluted | 0.01 | 0.01 | 0.01 | 0.01 | 0.05 | ||||||||||||||||||||||||||||||||||
Net earnings per share | |||||||||||||||||||||||||||||||||||||||
Basic | 0.49 | 0.40 | 0.69 | 0.61 | 2.20 | ||||||||||||||||||||||||||||||||||
Diluted | 0.43 | 0.35 | 0.60 | 0.54 | 1.93 | ||||||||||||||||||||||||||||||||||
The sum of the quarters may not equal the total of the respective year’s earnings per share on either a basic or diluted basis due to changes in the weighted average shares outstanding during the year.
SCHEDULE II—VALUATION AND QUALIFYING ACCOUNTS
(in thousands)
| Additions | Deductions | Other | Balance at End of Period | Additions | Deductions | ||||||||||||||||||||||||||||||||||||
Description | Balance at Beginning of Period | Charged to Costs and Expenses | Net Acquired/ Divested | Accounts Written Off Less Recoveries | Balance at Beginning of Period | Charged to Costs and Expenses | Acquired/ (Divested)/ (Discontinued) | Accounts Written Off Less Recoveries | Other | Balance at End of Period | |||||||||||||||||||||||||||||||
Allowance for losses—Trade accounts receivable | Allowance for losses—Trade accounts receivable | ||||||||||||||||||||||||||||||||||||||||
August 31, 2010 | $ | 8,633 | $ | 2,437 | $ | (644 | ) | $ | (2,452 | ) | $ | (294 | ) | $ | 7,680 | ||||||||||||||||||||||||||
Allowance for losses—Trade accounts receivable | |||||||||||||||||||||||||||||||||||||||||
August 31, 2009 | $ | 6,830 | $ | 4,030 | $ | 117 | $ | (2,332 | ) | $ | (12 | ) | $ | 8,633 | 6,830 | 4,030 | 117 | (2,332 | ) | (12 | ) | 8,633 | |||||||||||||||||||
August 31, 2008 | 7,856 | 1,100 | 80 | (2,224 | ) | 18 | 6,830 | 7,856 | 1,100 | 80 | (2,224 | ) | 18 | 6,830 | |||||||||||||||||||||||||||
August 31, 2007 | 7,363 | 2,465 | 456 | (2,299 | ) | (129 | ) | 7,856 | |||||||||||||||||||||||||||||||||
Allowance for losses—Inventory | |||||||||||||||||||||||||||||||||||||||||
August 31, 2010 | $ | 24,297 | $ | 6,536 | $ | (92 | ) | $ | (8,076 | ) | $ | (683 | ) | $ | 21,982 | ||||||||||||||||||||||||||
Allowance for losses—Inventory | |||||||||||||||||||||||||||||||||||||||||
August 31, 2009 | $ | 17,603 | $ | 10,070 | $ | 1,529 | $ | (4,366 | ) | $ | (539 | ) | $ | 24,297 | 17,603 | 10,070 | 1,529 | (4,366 | ) | (539 | ) | 24,297 | |||||||||||||||||||
August 31, 2008 | 15,765 | 6,478 | 385 | (5,339 | ) | (314 | ) | 17,603 | 15,765 | 6,478 | 385 | (5,339 | ) | (314 | ) | 17,603 | |||||||||||||||||||||||||
August 31, 2007 | 16,977 | 2,327 | 6,757 | (10,336 | ) | 40 | 15,765 | ||||||||||||||||||||||||||||||||||
Valuation allowance—Income taxes | Valuation allowance—Income taxes | ||||||||||||||||||||||||||||||||||||||||
August 31, 2010 | $ | 20,238 | $ | 3,670 | $ | (8,633 | ) | $ | (6,601 | ) | $ | (132 | ) | $ | 8,542 | ||||||||||||||||||||||||||
Valuation allowance—Income taxes | |||||||||||||||||||||||||||||||||||||||||
August 31, 2009 | $ | 21,952 | $ | 11,350 | $ | — | $ | (12,950 | ) | $ | (115 | ) | $ | 20,238 | 21,952 | 11,350 | — | (12,950 | ) | (115 | ) | 20,238 | |||||||||||||||||||
August 31, 2008 | 17,993 | 4,466 | — | (645 | ) | 138 | 21,952 | 17,993 | 4,466 | — | (645 | ) | 138 | 21,952 | |||||||||||||||||||||||||||
August 31, 2007 | 14,191 | 6,392 | 183 | (3,622 | ) | 849 | 17,993 | ||||||||||||||||||||||||||||||||||
Note: valuation accounts are deducted from the related assets to which they apply in the Consolidated Balance Sheets.consolidated balance sheets.
| Item 9. | Changes in and Disagreements with Accountants on Accounting and Financial Disclosure |
None.
| Item 9A. | Controls and Procedures |
Disclosure Controls and Procedures
The Company’s management, with the participation of the Company’s Chief Executive Officer and Chief Financial Officer, have evaluated the effectiveness of the Company’s disclosure controls and procedures (as such term is defined in Rules 13a-15(e) and 15d-15(e) under the Securities Exchange Act of 1934, as amended (“the Exchange Act”)) as of the end of the period covered by this report. Based on such evaluation, the Company’s Chief Executive Officer and Chief Financial Officer have concluded that, as of the end of such period, the Company’s disclosure controls and procedures are effective in recording, processing, summarizing, and reporting, on a timely basis, information required to be disclosed by the Company in the reports that it files or submits under the Exchange Act, and that information is accumulated and communicated to the Chief Executive Officer and Chief Financial Officer, as appropriate, to allow timely discussions regarding required disclosure.
Management’s Report on Internal Control Over Financial Reporting
The Company’s management is responsible for establishing and maintaining adequate internal control over financial reporting, as such term is defined in Exchange Act Rule 13a-15(f). The Company’s management, with the participation of the Company’s Chief Executive Officer and Chief Financial Officer, has evaluated the effectiveness of the Company’s internal control over financial reporting based on the framework in Internal Control-Integrated Framework issued by the Committee of Sponsoring Organizations of the Treadway Commission. Based on this evaluation, the Company’s management has concluded that, as of August 31, 2009,2010, the Company’s internal control over financial reporting was effective.
Because of its inherent limitations, internal control over financial reporting may not prevent or detect misstatements. Also, projections of any evaluation of the effectiveness to future periods are subject to the risk that the controls may become inadequate because of changes in conditions, or that the degree of compliance with the policies or procedures may deteriorate.
Management has excluded certain elements of The Cortland CompaniesSelantic, Biach Industries, Hydrospex and Team Hydrotec from its assessment of internal control over financial reporting as of August 31, 20092010 because it wasthey were acquired by the Company in a purchase business combination during fiscal 2009.2010. Subsequent to the acquisition certain elements of the acquired businesses’ internal control over financial reporting and related processes were integrated into the Company’s existing systems and internal control over financial reporting. Those controls that were not integrated have been excluded from management’s assessment of the effectiveness of internal control over financial reporting as of August 31, 2009. The Cortland Companies2010. All of the fiscal 2010 acquisitions are wholly-owned subsidiaries whose total assets and total revenues, excluding integrated elements, represent 16%5% and 6%1%, respectively, of the related consolidated financial statement amounts as of and for the year ended August 31, 2009.2010.
PricewaterhouseCoopers LLP, an independent registered public accounting firm, has audited the Company’s consolidated financial statements and the effectiveness of internal controls over financial reporting as of August 31, 2009,2010, as stated in their report which is included herein.
Changes in Internal Control Over Financial Reporting
There were no changes in the Company’s internal control over financial reporting during the fourth quarter of fiscal 20092010 that materially affected, or are reasonably likely to materially affect, the Company’s internal control over financial reporting.
| Item 9B. | Other Information |
None.
| Item 10. | Directors; Executive Officers and Corporate Governance |
Information about the Company’s directors is incorporated by reference from the “Election of Directors” section of the Company’s Proxy Statement for its Annual Meeting of Shareholders to be held on January 12, 201014, 2011 (the “2010“2011 Annual Meeting Proxy Statement”). Information about compliance with Section 16(a) of the Exchange Act is incorporated by reference from the “Other Information—Section 16(a) Beneficial Ownership Reporting Compliance” section in the Company’s 20102011 Annual Meeting Proxy Statement. Information about the Company’s Audit Committee, including the members of the committee, and the Company’s Audit Committee financial experts, is incorporated by reference from the “Election of Directors” and “Corporate Governance Matters” sections of the Company’s 20102011 Annual Meeting Proxy Statement. Information about the Company’s executive officers required by this item is contained in the discussion entitled “Executive Officers of the Registrant” in Part I hereof.
The Company has adopted a code of ethics that applies to its senior executive team, including its chief executive officer, chief financial officer and corporate controller. The code of ethics is posted on the Company’s website and is available free of charge at www.actuant.com. The Company intends to satisfy the requirements under Item 5.05 of Form 8-K regarding disclosure of any amendments to, or waivers from, provisions of its code of ethics that apply to the chief executive officer, chief financial officer or corporate controller by posting such information on the Company’s website.
| Item 11. | Executive Compensation |
The information required by this item is incorporated by reference from the “Election of Directors,” “Corporate Governance Matters” and the “Executive Compensation” sections (other than the subsection thereof entitled “Report of the Audit Committee” ) of the 20102011 Annual Meeting Proxy Statement.
| Item 12. | Security Ownership of Certain Beneficial Owners and Management and Related StockholderMatters |
The information required by this item is incorporated by reference from the “Certain Beneficial Owners” and “Executive Compensation—Equity Compensation Plan Information” sections of the 20102011 Annual Meeting Proxy Statement.
| Item 13. | Certain Relationships and Related Transactions, and Director Independence |
The information required by this item is incorporated by reference from the “Certain Relationships and Related Party Transactions” section of the 20102011 Annual Meeting Proxy Statement.
| Item 14. | Principal Accountant Fees and Services |
The information required by this item is incorporated by reference from the “Other Information—Independent Public Accountants” section of the 20102011 Annual Meeting Proxy Statement.
| Item 15. | Exhibits, Financial Statement Schedules |
(a) Documents filed as part of this report:
1. Consolidated Financial Statements
See “Index to Consolidated Financial Statements” set forth in Item 8, “Financial Statements and Supplementary Data” for a list of financial statements filed as part of this report.
2. Financial Statement Schedules
See “Index to Financial Statement Schedule” set forth in Item 8, “Financial Statements and Supplementary Data”.
3. Exhibits
See “Index to Exhibits” beginning on page 80,77, which is incorporated herein by reference.
SIGNATURES
Pursuant to the requirements of Section 13 or 15(d) of the Securities Exchange Act of 1934, the Registrant has duly caused this report to be signed on its behalf by the undersigned, thereunto duly authorized.
ACTUANT CORPORATION (Registrant) | ||
| By: | /s/ ANDREW G. LAMPEREUR | |
| Andrew G. Lampereur | ||
| Executive Vice President and Chief Financial Officer | ||
| (Principal Financial Officer) | ||
Dated: October 28, 20092010
POWER OF ATTORNEY
KNOWN ALL MEN BY THESE PRESENTS, that each person whose signature appears below constitutes and appoints Robert C. Arzbaecher and Andrew G. Lampereur, and each of them, his true and lawful attorneys-in-fact and agents, with full power of substitution and resubstitution, for him and in his name, place and stead, in any and all capacities, to sign any and all amendments to this report, and to file the same, with all and any other regulatory authority, granting unto said attorneys-in-fact and agents, and each of them, full power and authority to do and perform each and every act and thing requisite and necessary to be done in and about the premises, as fully to all intents and purposes as he might or could do in person, hereby ratifying and confirming all that said attorneys-in-fact and agents or any of them, or their substitutes, may lawfully do or cause to be done by virtue hereof.
Pursuant to the requirements of the Securities Exchange Act of 1934, this report has been signed below by the following persons on behalf of the registrant and in the capacities and on the dates indicated.*
Signature | Title | |
/S/ ROBERT C. ARZBAECHER Robert C. Arzbaecher | Chairman of the Board, President and Chief | |
/S/ GUSTAV H.P. BOEL Gustav H.P. Boel | Director and Executive Vice President | |
/S/ GURMINDER S. BEDI Gurminder S. Bedi | Director | |
/S/ WILLIAM K. HALL William K. Hall | Director | |
/S/ THOMAS J. FISCHER Thomas J. Fischer | Director | |
Signature | Title | |
/S/ ROBERT A. PETERSON Robert A. Peterson | Director | |
/S/ DENNIS K. WILLIAMS Dennis K. Williams | Director | |
/S/ HOLLY A. VANDEURSEN Holly A. VanDeursen | Director | |
/S/ R. ALAN HUNTER, JR R. Alan Hunter, Jr. | Director | |
/S/ ANDREW G. LAMPEREUR Andrew G. Lampereur | Executive Vice President and Chief Financial | |
/S/
| Corporate Controller and Principal Accounting | |
| * | Each of the above signatures is affixed as of October 28, |
ACTUANT CORPORATION
(the “Registrant”)
(Commission File No. 1-11288)
ANNUAL REPORT ON FORM 10-K
FOR THE FISCAL YEAR ENDED AUGUST 31, 20092010
INDEX TO EXHIBITS
Exhibit | Description | Incorporated Herein By Reference To | Filed Herewith | |||
| 3.1 | (a) Amended and Restated Articles of Incorporation | Exhibit 4.9 to the Registrant’s Form 10-Q for quarter ended February 28, 2001 | ||||
| (b) Amendment to Amended and Restated Articles of Incorporation | Exhibit 3.1(b) of the Registrant’s Form 10-K for the fiscal year ended August 31, 2003 | |||||
| (c) Amendment to Amended and Restated Articles of Incorporation | Exhibit 3.1 to the Registrant’s Form 10-K for the fiscal year ended August 31, 2004 | |||||
| (d) Amendment to Amended and Restated Articles of Incorporation | Exhibit 3.1 to the Registrant’s Form 8-K filed on July 18, 2006 | |||||
| (e) Amendment to Amended and Restated Articles of Incorporation | Exhibit 3.1 to the Registrant’s Form 8-K filed on January 14, 2010 | |||||
| 3.2 | Amended and Restated Bylaws, as amended | Exhibit 3.1 to the Registrant’s Form 8-K filed on October 23, 2007 | ||||
| 4.1 | Indenture dated June 12, 2007 by and among Actuant Corporation, the subsidiary guarantors named therein and U.S. Bank National Association as trustee relating to $250,000,000 Actuant Corporation 6.875% Senior Notes due 2017 | Exhibit 4.1 to the Company’s Current Report on Form 8-K filed on June 15, 2007 | ||||
| 4.2 | Indenture, dated as of November 10, 2003, among Actuant Corporation as issuer and the Subsidiary Guarantors and U.S. Bank National Association relating to $150,000,000 Actuant Corporation 2% Convertible Senior Subordinated Notes Due 2023 | Exhibit 4.2 to the Registrant’s Form 10-Q for quarter ended November 30, 2003 | ||||
| 4.3 | ||||||
| Second Amended and Restated Credit Agreement dated November 10, 2008 among Actuant Corporation, the Lenders party thereto and JPMorgan Cash Bank, N.A. as the Agent | Exhibit | |||||
|
|
| |||||||
| Amendment No. 1 dated June 10, 2009 to Second Amended and Restated Credit Agreement dated November 10, 2008 among Actuant Corporation, the foreign subsidiary borrowers party thereto, the financial institutions party thereto and JPMorgan Chase Bank, N.A., as administrative agent | Exhibit 10.1 to the Registrant’s Form 8-K filed on June 10, 2009 | ||||||||
Exhibit | Description | Incorporated Herein By Reference To | Filed Herewith | |||
| 4.5 | Amendment No. 2 dated July 12, 2010 to Second Amended and Restated Credit Agreement dated November 10, 2008 among Actuant Corporation, the foreign subsidiary borrowers party thereto, the financial institutions party thereto and JPMorgan Chase Bank, N.A., as administrative agent | X | ||||
| 10.1 | Outside Directors’ Deferred Compensation Plan adopted by Board of Directors on May 4, 1995 | Exhibit 10.8 to the Registrant’s Form 10-K for fiscal year ended August 31, 1995 | ||||
| 10.2 | First Amendment of Actuant Corporation Outside Directors’ Deferred Compensation Plan dated December 25, 2008 | Exhibit 10.14 to the Registrant’s Form 10-Q for quarter ended November 30, 2008 | ||||
| 10.3 | Actuant Corporation Deferred Compensation Plan | Exhibit 99.1 to the Registrant’s Form S-8 filed on September | ||||
| 10.4 | Second Amendment of Actuant Corporation Deferred Compensation Plan dated December 25, 2008 | Exhibit 10.13 to the Registrant’s Form 10-Q for quarter ended November 30, 2008 | ||||
| 10.5 | (a) 1996 Stock Plan adopted by board of directors on August 8, 1996 and proposed for shareholder approval on January 8, 1997 | Annex A to the Registrant’s Proxy Statement dated November 19, 1996 for 1997 Annual Meeting of Shareholders | ||||
| (b) Amendment to 1996 Stock Plan adopted by board of directors on May 8, 1997 | Exhibit 10.10(b) to the | |||||
| 10.6 | Actuant Corporation | Exhibit
| ||||
| 10.7 | Actuant Corporation 2001 Stock Plan | Exhibit B to the Registrant’s Proxy Statement, dated December 1, 2000 for the 2001 Annual Meeting of Shareholders | ||||
| 10.8 | First Amendment to the Actuant Corporation 2001 Stock Plan dated December 25, 2008 | Exhibit 10.9 to the Registrant’s Form 10-Q for the quarter ended November 30, 2008 | ||||
| 10.9 | Actuant Corporation 2001 Outside Directors’ Stock Plan | Exhibit A to the Registrant’s Proxy Statement, dated December 5, 2005 for the 2006 Annual Meeting of Shareholders | ||||
| 10.10 | First Amendment to the Amended and Restated Actuant Corporation 2001 Outside Directors’ Stock Plan dated December 25, 2008 | Exhibit 10.10 to the Registrant’s Form 10-Q for the quarter ended November 30, 2008 | ||||
| 10.11 | Actuant Corporation 2002 Stock Plan, as amended (through third amendment) | Exhibit 10.26 to the Registrant’s Form 8-K filed on January 20, 2006 | ||||
| 10.12 | Fourth Amendment to the Actuant Corporation 2002 Stock Plan dated November 7, 2008 | Exhibit 10.11 to the Registrant’s Form 10-Q for quarter ended November 30, 2008 | ||||
Exhibit | Description | Incorporated Herein By Reference To | Filed Herewith | |||
| 10.13 | Actuant Corporation Long Term Incentive Plan | Exhibit 10.25 to the Registrant’s Form 8-K filed on July 12, 2006 | ||||
| 10.14 | Actuant Corporation 2009 Omnibus Incentive Plan | Exhibit | ||||
| 10.15 | Form of Indemnification Agreement for Directors and Officers | Exhibit 10.35 to the 2002 10-K | ||||
| 10.16 | ||||||
| Actuant Corporation Form of Change in Control Agreement for certain named executives | Exhibit | |||||
| 14 | Code of Ethics | Exhibit 14 of the Registrant’s Form 10-K for the fiscal year ended August 31, 2003 | ||||
| 21 | Subsidiaries of the Registrant | X | ||||
| 23 | Consent of PricewaterhouseCoopers LLP | X | ||||
|
|
| ||||
| 24 | Power of Attorney | See signature page of this report | ||||
| 31.1 | Certification of Chief Executive Officer pursuant to Section 302 of the Sarbanes-Oxley Act of 2002 | X | ||||
| 31.2 | Certification of Chief Financial Officer pursuant to Section 302 of the Sarbanes-Oxley Act of 2002 | X | ||||
| 32.1 | Certification of Chief Executive Officer pursuant to Section 906 of the Sarbanes-Oxley Act of 2002 | X | ||||
| 32.2 | Certification of Chief Financial Officer pursuant to Section 906 of the Sarbanes-Oxley Act of 2002 | X | ||||
8379