
For the fiscal year ended December 31, 2009 Commission file number 0-1402
| For the fiscal year ended December 31, 2012 | Commission file number 0-1402 | |
| Ohio | 34-1860551 | |||||||
(State or other jurisdiction of incorporation or organization) | (I.R.S. Employer Identification No.) | |||||||
| 22801 St. Clair Avenue, Cleveland, Ohio | 44117 | |||||||
| (Address of principal executive offices) | (Zip Code) | |||||||
| (216) 481-8100 |
| (Registrant's telephone number, including area code) |
(216) 481-8100
(Registrant’s telephone number, including area code)
| Common Shares, without par value | The NASDAQ Stock Market LLC | |||||||
| (Title of each class) | (Name of each exchange on which registered) | |||||||
þLarge accelerated filer | ¨Accelerated filer | ¨Non-accelerated filer | ||||
(Do not check if a smaller reporting company) | ¨ Smaller reporting company | |||||
information, which is incorporated herein by reference. general metal fabrication, power generation and process industry, structural steel construction (buildings and bridges), heavy equipment fabrication (farming, mining and rail), shipbuilding, automotive,PART IITEM 1.BUSINESSITEM 1. BUSINESSGeneralAs used in this report,Annual Report on Form 10-K, the term “Company,”"Company," except as otherwise indicated by the context, means Lincoln Electric Holdings, Inc., and its wholly-owned and majority-owned subsidiaries for which it has a controlling interest. The Lincoln Electric Company began operations in 1895 and was incorporated under the laws of the State of Ohio in 1906. During 1998, The Lincoln Electric Company reorganized into a holding company structure, and Lincoln Electric Holdings, Inc. became the publicly-held parent of Lincoln Electric subsidiaries worldwide, including The Lincoln Electric Company.The Company is one of only a few worldwide broad-line manufacturer and resellermanufacturers of welding, cutting and cuttingbrazing products. Welding products include arc welding power sources, wire feeding systems, robotic welding packages, fume extraction equipment, consumable electrodes and fluxes. The Company’s weldingCompany's product offering also includes computer numeric controlled ("CNC") plasma and oxy-fuel cutting systems and regulators and torches used in oxy-fuel welding, cutting and cutting.brazing. In addition, the Company has a leading global position in the brazing and soldering alloys market.The arc welding power sources and wire feeding systems manufactured by the Company range in technology from basic units used for light manufacturing and maintenance to highly sophisticated robotic applications for high volume production welding and fabrication. Three primary types of arc welding electrodes are produced: (1) coated manual or stick electrodes,electrodes; (2) solid electrodes produced in coil, reel or drum forms for continuous feeding in mechanized welding,welding; and (3) cored electrodes produced in coil form for continuous feeding in mechanized welding.The Company has, through wholly-owned subsidiaries or joint ventureventures, manufacturing facilities located in the United States, Australia, Brazil, Canada, China, Colombia, France, Germany, India, Indonesia, Italy, Mexico, the Netherlands, People’s Republic of China, Poland, Portugal, Russia, Turkey, the United Kingdom and Venezuela. Nearly allVenezuela, of the above facilitieswhich 34 are ISO 9001 certified.During the fourth quarter of 2009, theThe Company realignedhas aligned its business units into five operating segments to enhance the utilization of the Company’sCompany's worldwide resources and global end user and sourcing initiatives. The operating segments consist of North America Welding, Europe Welding, Asia Pacific Welding, South America Welding and The Harris Products Group. The North America Welding segment includes welding operations in the United States, Canada and Mexico. The Europe Welding segment includes welding operations in Europe, Russia and Africa. The other threetwo welding segments include welding operations in Europe, Asia Pacific and South America, respectively. The fifth segment, The Harris Products Group, includes the Company’sCompany's global cutting, soldering and brazing businesses as well as the retail business in the United States. See Note 35 to the Company’s Consolidated Financial StatementsCompany's consolidated financial statements for segment and geographic area information.CustomersThe Company’sCompany's products are sold in both domestic and international markets. In North America, products are sold principally through industrial distributors, retailers and also directly to users of welding products. Outside of North America, the Company has an international sales organization comprised of Company employees and agents who sell products from the Company’sCompany's various manufacturing sites to distributors and product users.The Company’sCompany's major end-user markets include:2
pipe mills and pipelines, and
offshore oil and gas exploration and extraction.
generally a mature industry in developed markets such as North America and Western Europe, and is cyclical in nature. Overall demand for arc welding and cutting products is largely determined by economic cycles and the level of capital spending in manufacturing and other industrial sectors. The Company experiences some variability in reported period-to-period results as demand for the Company's products are mildly seasonal with generally higher demand in the second and
3
development, which is incorporated herein by reference.
The number of persons employed by the Company worldwide at December 31, 20092012 was 8,950.approximately 10,000. See "Part I, Item 10 of Part III1C" for information regarding the Company’sCompany's executive officers, which is incorporated herein by reference.
4
The risksrisk factors and uncertainties described below, and all of the othertogether with information incorporated by reference or otherwise included elsewhere in this Annual Report on Form 10-K, should be carefully considered. These risks and uncertainties are not the only ones we face. Additional risks and uncertainties of which we are currently unaware or that we currently believe to be immaterial may also adversely affect our business.
distribution of our products and the loss of sales and customers. Insurance proceeds may not adequately compensate the Company for the losses.
components, our inability to timely or otherwise obtain substitutes for such items, or any deterioration in our relationships with or the financial viability of our suppliers could adversely affect our business.
Since January 1, 1995, we have been a co-defendant in manganese cases that have been resolved as follows: 13,471 of those claims were dismissed, 20 were tried to defense verdicts in favor of us and five were tried to plaintiff verdicts (four of which are being or will be appealed). In addition, 13 claims were resolved by agreement for immaterial amounts and one was decided in favor of us following a motion for summary judgment.
5
Defense costs remain significant.
Manganese is an essential element of steel and cannot be eliminated from welding consumables.
6
acquisitions, we may be required to raise additional financing, which may not be available to us on acceptable terms. Our current operational cash flow is sufficient to fund our current acquisition plans, but a significant acquisition could require access to the capital markets. Further, we may not be able to successfully integrate any acquired business with our existing businesses or recognize the expected benefits from any completed acquisition.
Moreover, social unrest, the absence of trained labor pools and the uncertainties associated with entering into joint ventures or similar arrangements in foreign countries have slowed our business expansion into some
7
developing economies. Our presence in emerging markets has been facilitated in part through joint venture agreements with local organizations. While this strategy has allowed us to gain a footprint in emerging markets while leveraging the experience of local organizations, it also presents corporate governance and management challenges.
Our foreign operations also subject us to the risks of international terrorism and hostilities and to foreign currency risks, including exchange rate fluctuations and limits on the repatriation of funds.
For example, during
2012, approximately 8% of our net sales were generated from China and approximately 19% of our property, plant and equipment were located there. If the Chinese economy were to experience a significant slowdown, it could adversely affect our financial condition, results of operations and cash flows.We are dependent
standards. Furthermore, the potential physical impacts of theorized climate change on the Company’sCompany's customers, and therefore on the Company’sCompany's operations, are speculative and highly uncertain, and would be particular to the circumstances developing in various geographical regions. These may include changes in weather patterns
8
(including (including drought and rainfall levels), water availability, storm patterns and intensities, and temperature levels. These potential physical effects may adversely impact the cost, production, sales and financial performance of the Company’s operations.
Company's operations which we are unable, at this time, to predict.
| Name | Age | Position | |||
| John M. Stropki, Jr. | 62 | Executive Chairman of the Board effective December 31, 2012; Chairman of the Board since October 13, 2004 to December 31, 2012; Director since 1998; Chief Executive Officer and President since June 3, 2004 to December 31, 2012; Chief Operating Officer from May 1, 2003 to June 3, 2004; Executive Vice President from 1995 to June 3, 2004; and President, North America from 1996 to 2003. | |||
| Christopher L. Mapes | 51 | President and Chief Executive Officer effective December 31, 2012; Chief Operating Officer from September 1, 2011 to December 31, 2012; Director since February 2010. Prior to his service with the Company, Mr. Mapes was Executive Vice President of A.O. Smith Corporation (a global manufacturer with a water heating and water treatment technologies business and an electric motor and motor solutions business) a position he held from 2006 through August 2011, and the President of its Electrical Products unit, a position he held from September 2004 through August 2011. | |||
| Vincent K. Petrella | 52 | Senior Vice President, Chief Financial Officer and Treasurer since October 7, 2005; Vice President, Chief Financial Officer and Treasurer from February 4, 2004 to October 7, 2005; and Vice President, Corporate Controller from 2001 to 2003. | |||
| Frederick G. Stueber | 59 | Senior Vice President, General Counsel and Secretary since 1996. | |||
| George D. Blankenship | 50 | Senior Vice President; President, Lincoln Electric North America since July 30, 2009; Senior Vice President, Global Engineering from October 7, 2005 to July 30, 2009; Vice President, Global Engineering from May 5, 2005 to October 7, 2005; President, Lincoln Electric North America of The Lincoln Electric Company since July 30, 2009; Senior Vice President; President, Lincoln Cleveland of The Lincoln Electric Company from January 8, 2008 to July 30, 2009; Senior Vice President, U.S. Operations of The Lincoln Electric Company from October 7, 2005 to January 8, 2008; Vice President, Cleveland Operations of The Lincoln Electric Company from June 6, 2005 to October 7, 2005; and Vice President, Engineering and Quality Assurance of The Lincoln Electric Company from 2000 to June 6, 2005. | |||
| Gabriel Bruno | 45 | Vice President, Chief Information Officer since May 1, 2012; Vice President, Corporate Controller from 2005 to May 1, 2012. | |||
| Gretchen A. Farrell | 50 | Senior Vice President, Human Resources and Compliance since July 30, 2009; Vice President, Human Resources from May 5, 2005 to July 30, 2009; and Vice President, Human Resources of The Lincoln Electric Company since March 5, 2003. | |||
| Thomas A. Flohn | 52 | Vice President; President, Lincoln Electric Europe, Middle East & Africa (EMEA) since July 1, 2010; Vice President; President, Lincoln Asia Pacific from January 1, 2005 to June 30, 2010; and Vice President of Sales and Marketing, Lincoln Electric Asia Pacific from May 1, 1999 to December 31, 2004. | |||
| Steven B. Hedlund | 46 | Vice President, Strategy and Business Development since September 15, 2008. Prior to his service with the Company, Mr. Hedlund was the Vice President, Growth and Innovations with Master Lock, LLC (a security products company) from June 1, 2005 to July 1, 2008. | |||
| David M. LeBlanc | 48 | Senior Vice President; President, Lincoln Electric International since July 30, 2009; Vice President; President, Lincoln Electric Europe and Russia from March 10, 2008 to July 30, 2009; Vice President; President, Lincoln Electric Europe from September 1, 2005 to March 10, 2008; and Vice President; President, Lincoln Electric Latin America from January 1, 2002 to August 31, 2005. | |||
None.
North | ||
United States | Cleveland and Fort Loramie, Ohio; | |
Canada | Toronto; Mississauga. | |
Mexico | Mexico City; Torreon. | |
| Port Talbot, Wales. | |
Europe Welding: | ||
| France | Grand-Quevilly. | |
Germany | Essen. | |
Italy | Genoa; Corsalone. | |
Netherlands | Nijmegen. | |
Poland | Bielawa; | |
Portugal | Lisbon. | |
Russia | Mtsensk. | |
| Turkey | Istanbul. | |
United Kingdom | ||
Asia Pacific Welding: | ||
| ||
India | Chennai. | |
Indonesia | Cikarang. | |
| ||
| ||
Brazil | Sao Paulo. | |
Colombia | Bogota. | |
Venezuela | Maracay. | |
The Harris Products Group: | ||
United States | Mason, Ohio; Gainesville, Georgia; Santa Fe Springs, California. | |
Brazil | Guarulhos. | |
Mexico | Tijuana. | |
Poland | Dzierzoniow. | |
9
At December 31, 2009,
On December 13, 2006, the Company filed a complainttax and interest assessment was made in U.S. District Court (Northern District of Ohio) against Illinois Tool Works, Inc. seeking a declaratory judgment that eight patents owned by the defendant relating to certain inverter power sources have not and are not being infringed and that the subject patents are invalid. Illinois Tool Works filed a motion to dismiss this action, which the Court denied on June 21, 2007. On September 7, 2007, the Court stayed the litigation, referencing pending reexaminations before the U.S. Patent and Trademark Office. On June 17, 2008, the Company filed a motion to amend its pleadings in the foregoing matter to include several additional counts, including specific allegations of fraud on the U.S. Patent and Trademark Office with respect to portable professional welding machines and resulting monopoly power in that market.
No matters were submitted to a vote of security holders during the quarter ended December 31, 2009.
10
2012. Any Canadian tax ultimately due will be creditable in the parent company's U.S. federal tax return. The Company expects to be able to utilize the full amount of foreign tax credits generated in the statutorily allowed carry-back and carry-forward periods. Accordingly, should the Company not prevail in this dispute, the income statement charge will approximate the deficiency interest, net of tax. The Company believes it will prevail on the merits of the tax position. In accordance with prescribed recognition and measurement thresholds, no income tax accrual has been made for any uncertain tax positions related to the CRA reassessment. An unfavorable resolution of this matter could have a material effect on the Company's financial statements in the period in which a judgment is reached.
The Company’sCompany's common shares are traded on The NASDAQ StockGlobal Select Market under the symbol “LECO.”"LECO." The number of record holders of common shares at December 31, 20092012 was 1,758.
1,699.
The December dividend that the Company would normally pay in January 2013 was paid on December 28, 2012.
| 2009 | 2008 | |||||||||||||||||
| Stock Price | Dividends Declared | Stock Price | Dividends Declared | |||||||||||||||
| High | Low | High | Low | |||||||||||||||
First quarter | $ | 56.22 | $ | 26.32 | $ | 0.27 | $ | 71.48 | $ | 53.32 | $ | 0.25 | ||||||
Second quarter | 45.96 | 30.88 | 0.27 | 86.97 | 64.07 | 0.25 | ||||||||||||
Third quarter | 52.81 | 32.97 | 0.27 | 86.47 | 59.78 | 0.25 | ||||||||||||
Fourth quarter | 56.71 | 42.90 | 0.28 | 65.11 | 34.27 | 0.27 | ||||||||||||
Source: The NASDAQ Stock Market
| 2012 | 2011 | |||||||||||||||||||||||
| Stock Price | Dividends Declared | Stock Price | Dividends Declared | |||||||||||||||||||||
| High | Low | High | Low | |||||||||||||||||||||
| First quarter | $ | 47.87 | $ | 38.96 | $ | 0.170 | $ | 38.50 | $ | 32.69 | $ | 0.155 | ||||||||||||
| Second quarter | 50.36 | 41.42 | 0.170 | 39.62 | 32.30 | 0.155 | ||||||||||||||||||
| Third quarter | 46.11 | 37.83 | 0.170 | 39.18 | 27.47 | 0.155 | ||||||||||||||||||
| Fourth quarter | 49.00 | 37.63 | 0.200 | 40.10 | 26.84 | 0.170 | ||||||||||||||||||
Period | Total Number of Shares Repurchased (1) | Average Price Paid Per Share | Total Number of Shares Repurchased as Part of Publicly Announced Plans or Programs | Maximum Number of Shares that May Yet be Purchased Under the Plans or Programs (2) | |||||
February 1-28, 2009 | 8,407 | $ | 40.85 | 8,407 | 3,784,610 | ||||
| Period | Total Number of Shares Repurchased | Average Price Paid Per Share | Total Number of Shares Repurchased as Part of Publicly Announced Plans or Programs | Maximum Number of Shares that May Yet be Purchased Under the Plans or Programs (2) | |||||||||
| October 1-31, 2012 | — | $ | — | — | 3,779,773 | ||||||||
| November 1-30, 2012 | 271,518 | (1) | 44.74 | 253,400 | 3,526,373 | ||||||||
| December 1-31, 2012 | 184,000 | 47.36 | 184,000 | 3,342,373 | |||||||||
| Total | 455,518 | 45.80 | 437,400 | ||||||||||
| (1) | The above |
| (2) | The |
11
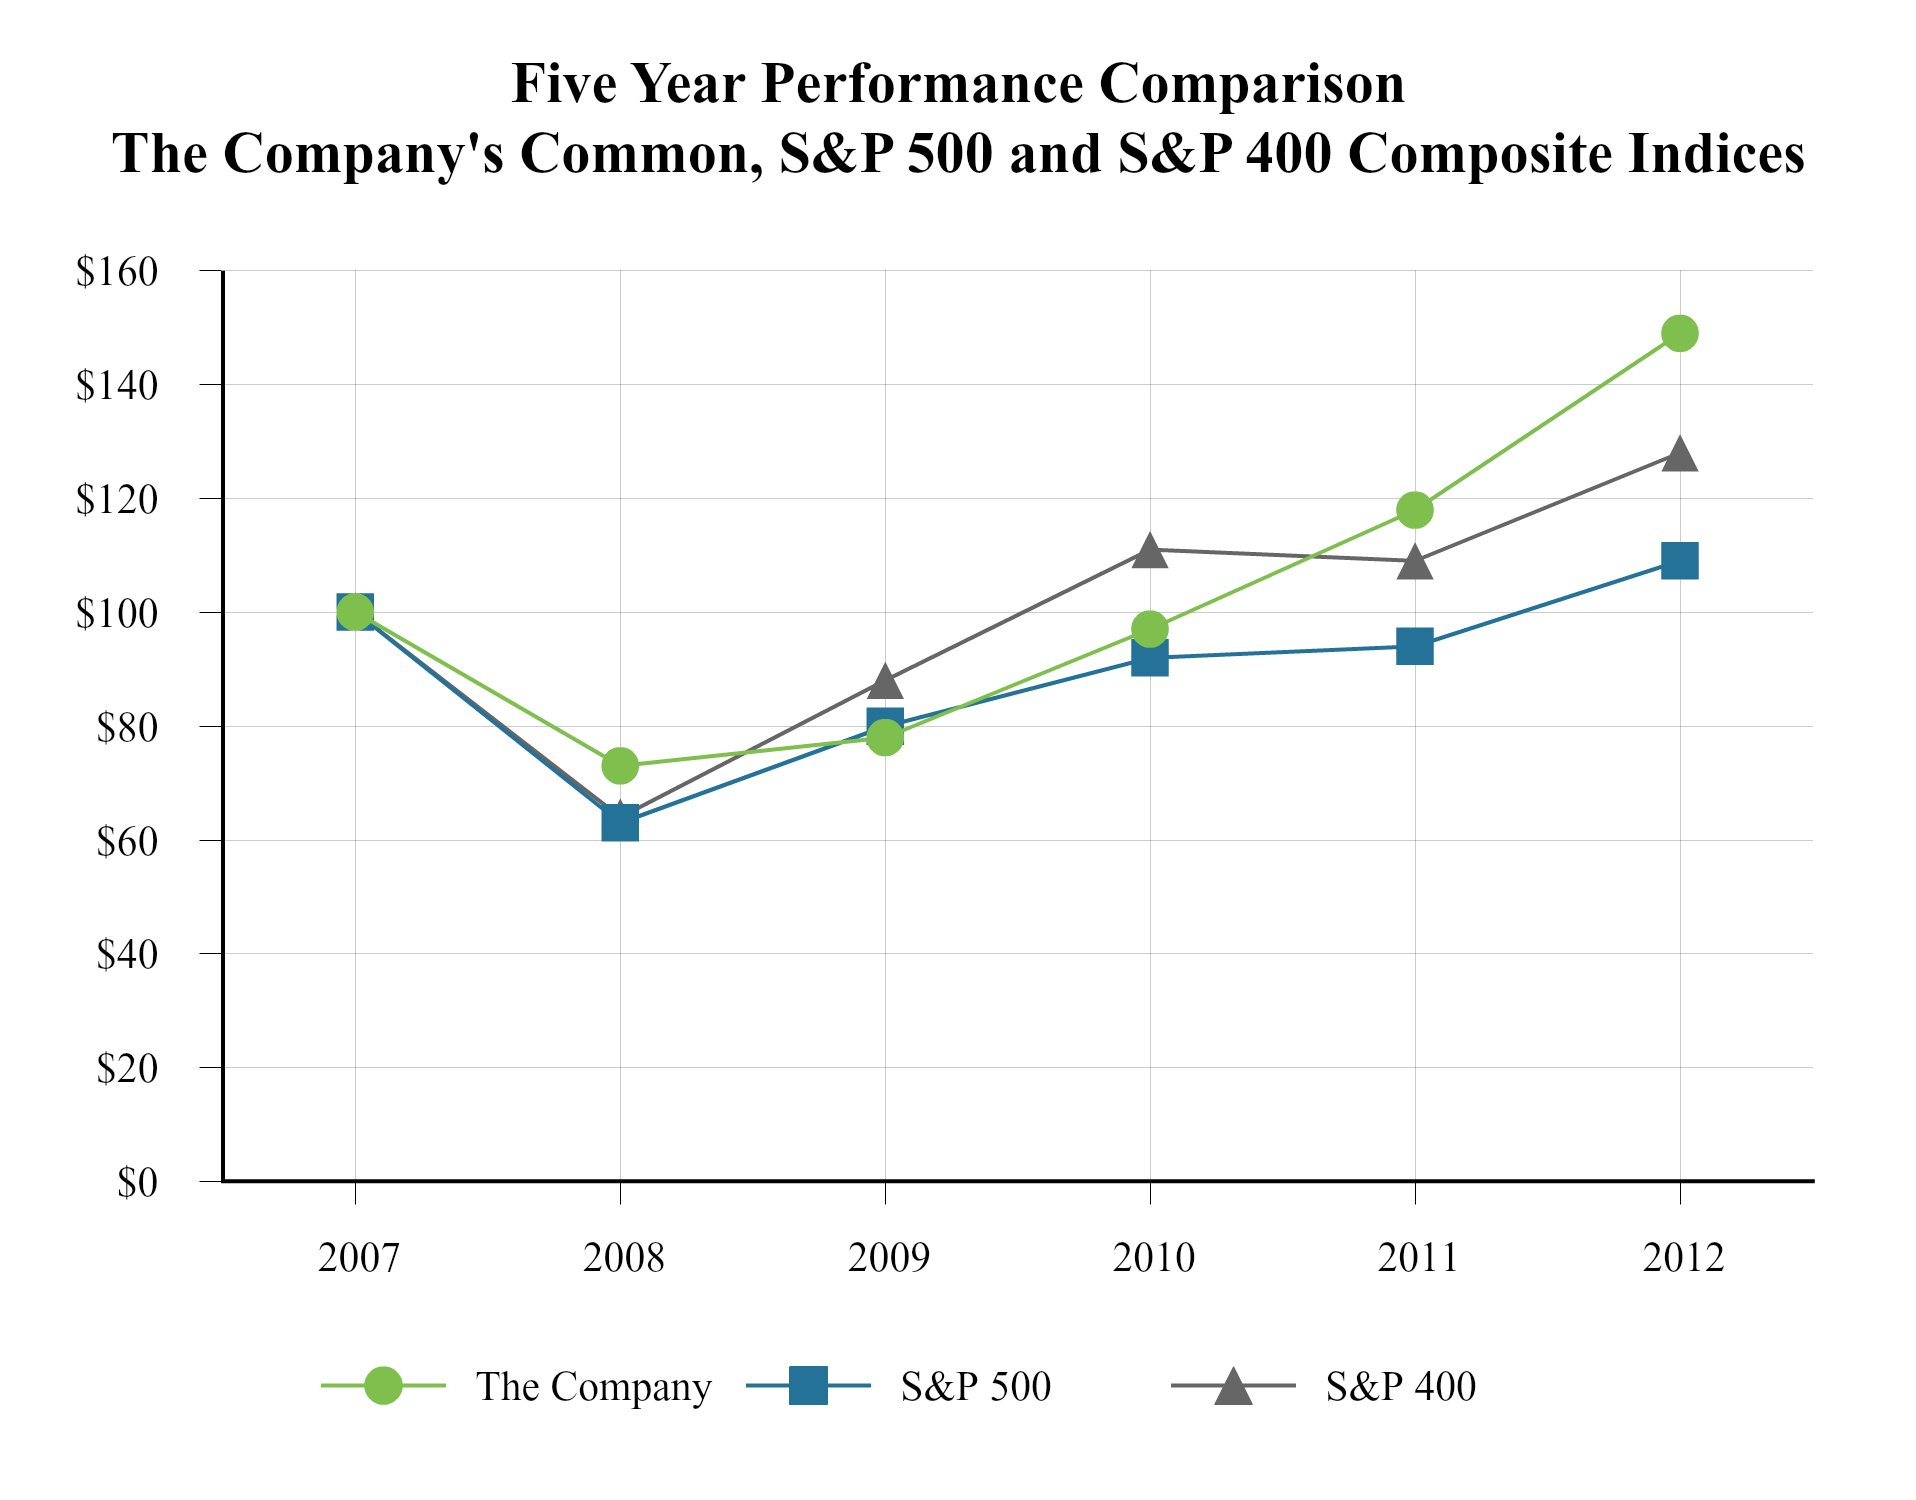
| 2007 | 2008 | 2009 | 2010 | 2011 | 2012 | |
| The Company | 100 | 73 | 78 | 97 | 118 | 149 |
| S&P 500 | 100 | 63 | 80 | 92 | 94 | 109 |
| S&P 400 | 100 | 64 | 88 | 111 | 109 | 128 |
| Year Ended December 31, | ||||||||||||||||||||
2012 (1) | 2011 (2) | 2010 (3) | 2009 (4) | 2008 (5) | ||||||||||||||||
| Net sales | $ | 2,853,367 | $ | 2,694,609 | $ | 2,070,172 | $ | 1,729,285 | $ | 2,479,131 | ||||||||||
| Net income | 257,411 | 217,186 | 130,244 | 48,576 | 212,286 | |||||||||||||||
| Basic earnings per share | 3.10 | 2.60 | 1.54 | 0.57 | 2.49 | |||||||||||||||
| Diluted earnings per share | 3.06 | 2.56 | 1.53 | 0.57 | 2.47 | |||||||||||||||
| Cash dividends declared per share | 0.710 | 0.635 | 0.575 | 0.545 | 0.510 | |||||||||||||||
| Total assets | 2,089,863 | 1,976,776 | 1,783,788 | 1,705,292 | 1,718,805 | |||||||||||||||
| Long-term debt | 1,599 | 1,960 | 84,627 | 87,850 | 91,537 | |||||||||||||||
| (1) |
| (2) | Results for 2011 include rationalization and asset impairment net charges of |
| Year Ended December 31, | |||||||||||||||
| 2009 | 2008 | 2007 | 2006 | 2005 | |||||||||||
Net sales | $ | 1,729,285 | $ | 2,479,131 | $ | 2,280,784 | $ | 1,971,915 | $ | 1,601,190 | |||||
Net income | 48,576 | 212,286 | 202,736 | 175,008 | 122,306 | ||||||||||
Basic earnings per share | $ | 1.15 | $ | 4.98 | $ | 4.73 | $ | 4.11 | $ | 2.93 | |||||
Diluted earnings per share | 1.14 | 4.93 | 4.67 | 4.07 | 2.90 | ||||||||||
Cash dividends declared | 1.09 | 1.02 | 0.91 | 0.79 | 0.73 | ||||||||||
Total assets | $ | 1,705,292 | $ | 1,718,805 | $ | 1,645,296 | $ | 1,394,579 | $ | 1,161,161 | |||||
Long-term debt | 87,850 | 91,537 | 117,329 | 113,965 | 157,853 | ||||||||||
12
Results for 2009 include rationalization and asset impairment charges of $29,897 ($23,789 after-tax). The Company’s rationalization activities to align the business to current market conditions resulted in charges of $29,018 ($23,193 after-tax) and impairment charges of $879 ($596 after-tax) were recognized for certain indefinite-lived intangible assets. Results also include a loss of $7,943 ($7,943 after-tax) associated with the acquisition of a business in China and the related disposal of an interest in Taiwan, a pension settlement gain of $1,543 ($1,543 after-tax) and a gain on the sale of a property by the Company’s joint venture in Turkey of $5,667 ($5,667 after-tax).
Results for 2008 include a charge of $2,447 ($1,698 after-tax) relating to the Company’s rationalization programs that began in the fourth quarter of 2008 designed to align the business to current market conditions. Results for 2008 also include $16,924 ($16,615 after-tax) in asset impairment charges including $13,194 of goodwill and $2,388 of long-lived assets related to two businesses in China (with no tax benefit) as well as an impairment charge of $1,342 ($1,033 after-tax) for intangible assets in North America and Europe.
Results for 2007 include a net gain of $188 ($107 after-tax) relating to the Company’s rationalization programs.
Results for 2006 include a charge of $3,478 ($3,478 after-tax) relating to the Company’s rationalization programs and a gain of $9,006 ($7,204 after-tax) on the sale of a facility in Ireland.
Results for 2005 include a charge of $1,761 ($1,303 after-tax) relating to the Company’s rationalization programs, a one-time state income tax benefit of $1,807 (net of federal benefit) relating to changes in Ohio tax laws, a favorable adjustment of $8,711 related to the resolution of prior years’ tax liabilities, a net favorable tax benefit of $1,146 associated with the repatriation of foreign earnings and a gain of $1,418 ($876 after-tax) on the settlement of legal disputes.
| (3) | Results for 2010 include rationalization and asset impairment net gains of |
The following discussions
| (4) | Results for 2009 include rationalization and asset impairment net charges of $29,897 ($23,789 after-tax). The net charges include rationalization charges of $26,957 ($21,529 after-tax) and impairment charges of $2,940 ($2,260 after-tax) for certain indefinite-lived intangible assets. Results also include a loss of $7,943 ($7,943 after-tax) associated with the acquisition of a business in China and the related disposal of an interest in Taiwan, a pension settlement gain of $2,144 ($2,144 after-tax), a charge of $601 after-tax in non-controlling interests associated with the pension settlement gain for a majority-owned consolidated subsidiary and a gain on the sale of a property by the Company's joint venture in Turkey of $5,667 ($5,667 after-tax). |
| (5) | Results for 2008 include a charge of $2,447 ($1,698 after-tax) relating to the Company's rationalization programs that began in the fourth quarter 2008. Results for 2008 also include $16,924 ($16,615 after-tax) in asset impairment charges including $13,194 of goodwill and $2,388 of long-lived assets related to two businesses in China (with no tax benefit) as well as an impairment charge of $1,342 ($1,033 after-tax) for intangible assets. |
13
general metal fabrication,
power generation and process industry,
structural steel construction (buildings and bridges),
heavy equipment fabrication (farming, mining and rail),
shipbuilding,
automotive,
pipe mills and pipelines, and
offshore oil and gas exploration and extraction.
During the fourth quarter of 2009, the
and geographic area information, which is incorporated herein by reference.
14
| Year Ended December 31, | |||||||||||||||||||||
| 2009 | 2008 | 2007 | |||||||||||||||||||
| Amount | % of Sales | Amount | % of Sales | Amount | % of Sales | ||||||||||||||||
Net sales | $ | 1,729,285 | 100.0 | % | $ | 2,479,131 | 100.0 | % | $ | 2,280,784 | 100.0 | % | |||||||||
Cost of goods sold | 1,273,017 | 73.6 | % | 1,758,980 | 71.0 | % | 1,633,218 | 71.6 | % | ||||||||||||
Gross profit | 456,268 | 26.4 | % | 720,151 | 29.0 | % | 647,566 | 28.4 | % | ||||||||||||
Selling, general & administrative expenses | 333,395 | 19.3 | % | 405,376 | 16.4 | % | 370,122 | 16.2 | % | ||||||||||||
Rationalization and asset impairment charges (gain) | 29,897 | 1.7 | % | 19,371 | 0.8 | % | (188 | ) | (0.0 | )% | |||||||||||
Operating income | 92,976 | 5.4 | % | 295,404 | 11.9 | % | 277,632 | 12.2 | % | ||||||||||||
Interest income | 3,462 | 0.2 | % | 8,845 | 0.4 | % | 8,294 | 0.4 | % | ||||||||||||
Equity (loss) earnings in affiliates | (5,025 | ) | (0.3 | )% | 6,034 | 0.2 | % | 9,838 | 0.4 | % | |||||||||||
Other income | 3,589 | 0.2 | % | 1,681 | 0.1 | % | 2,823 | 0.1 | % | ||||||||||||
Interest expense | (8,521 | ) | (0.5 | )% | (12,155 | ) | (0.5 | )% | (11,430 | ) | (0.5 | )% | |||||||||
Income before income taxes | 86,481 | 5.0 | % | 299,809 | 12.1 | % | 287,157 | 12.6 | % | ||||||||||||
Income taxes | 37,905 | 2.2 | % | 87,523 | 3.5 | % | 84,421 | 3.7 | % | ||||||||||||
Net income | $ | 48,576 | 2.8 | % | $ | 212,286 | 8.6 | % | $ | 202,736 | 8.9 | % | |||||||||
| Year Ended December 31, | |||||||||||||||||||||
| 2012 | 2011 | 2010 | |||||||||||||||||||
| Amount | % of Sales | Amount | % of Sales | Amount | % of Sales | ||||||||||||||||
| Net sales | $ | 2,853,367 | 100.0 | % | $ | 2,694,609 | 100.0 | % | $ | 2,070,172 | 100.0 | % | |||||||||
| Cost of goods sold | 1,986,711 | 69.6 | % | 1,957,872 | 72.7 | % | 1,506,353 | 72.8 | % | ||||||||||||
| Gross profit | 866,656 | 30.4 | % | 736,737 | 27.3 | % | 563,819 | 27.2 | % | ||||||||||||
Selling, general & administrative expenses | 495,221 | 17.4 | % | 439,775 | 16.3 | % | 377,773 | 18.2 | % | ||||||||||||
Rationalization and asset impairment charges (gains) | 9,354 | 0.3 | % | 282 | — | (384 | ) | — | |||||||||||||
| Operating income | 362,081 | 12.7 | % | 296,680 | 11.0 | % | 186,430 | 9.0 | % | ||||||||||||
| Interest income | 3,988 | 0.1 | % | 3,121 | 0.1 | % | 2,381 | 0.1 | % | ||||||||||||
| Equity earnings in affiliates | 5,007 | 0.2 | % | 5,385 | 0.2 | % | 3,171 | 0.2 | % | ||||||||||||
| Other income | 2,685 | 0.1 | % | 2,849 | 0.1 | % | 1,817 | 0.1 | % | ||||||||||||
| Interest expense | (4,191 | ) | (0.1 | %) | (6,704 | ) | (0.2 | %) | (6,691 | ) | (0.3 | %) | |||||||||
| Income before income taxes | 369,570 | 13.0 | % | 301,331 | 11.2 | % | 187,108 | 9.0 | % | ||||||||||||
| Income taxes | 112,354 | 3.9 | % | 84,318 | 3.1 | % | 54,898 | 2.7 | % | ||||||||||||
Net income including non-controlling interests | 257,216 | 9.0 | % | 217,013 | 8.1 | % | 132,210 | 6.4 | % | ||||||||||||
Non-controlling interests in subsidiaries' (loss) earnings | (195 | ) | — | (173 | ) | — | 1,966 | 0.1 | % | ||||||||||||
| Net income | $ | 257,411 | 9.0 | % | $ | 217,186 | 8.1 | % | $ | 130,244 | 6.3 | % | |||||||||
2011
Net sales for the North America Welding segment decreased 34.7%
Net sales for the Europe Welding segment decreased 35.7% to $346,383 in 2009 compared with $538,570 in 2008. This decrease reflects a decrease of $130,235 (24.2%) due to volume, a $22,510 (4.2%) decrease due to price, a $5,242 (1.0%) increase from acquisitions and a $44,684 (8.3%) unfavorable impact as a result of changes in foreign currency exchange rates.
Net sales for the Asia Pacific Welding segment decreased 9.7% to $208,280 in 2009 compared with $230,661 in 2008. This decrease reflects a decrease of $68,447 (29.7%) due to volume, a $5,471 (2.4%) decrease due to price, a $54,638, (23.7%) increase from acquisitions and a $3,101 (1.3%) unfavorable impact as a result of changes in foreign currency exchange rates.
Net sales for the South America Welding segment decreased 14.6% to $99,171 in 2009 compared with $116,061 in 2008. This decrease reflects a decrease of $23,831 (20.5%) due to volume, a $13,117 (11.3%) increase due to price and a $6,176 (5.3%) unfavorable impact as a result of changes in foreign currency exchange rates.
15
Net sales for The Harris Products Group segment decreased 22.4% to $217,271 in 2009 compared with $279,958 in 2008. This decrease reflects a decrease of $59,196 (21.1%) due to volume, a $14,178 (5.1%) decrease due to price, a $13,570, (4.8%) increase from acquisitions and a $2,883 (1.0%) unfavorable impact as a result of changes in foreign currency exchange rates.
2012.
$8,821.
Equity (Loss) Earnings in Affiliates: Equity loss in affiliates was $5,025 in 2009 compared with earnings of $6,034$542 in 2008. The equity lossChile being partially offset by an increase in 2009 includes a lossearnings of $7,943 associated with the acquisition of Jinzhou Jin Tai Welding and Metal Co, Ltd. (“Jin Tai”) and the related disposal of an interest$164 in Kuang Tai Metal Industrial Co., Ltd. (“Kuang Tai”), the Company’s Taiwanese joint venture, and income of $5,667 as the Company’s share of a gain realized on the sale of a property by the Company’s joint ventureTurkey.
Income Taxes:The Company recorded $37,905$112,354 of tax expense on pre-tax income of $86,481,$369,570, resulting in an effective tax rate of 43.8%30.4% for 2009.2012. The effective income tax rate exceedsis lower than the Company’sCompany's statutory rate primarily due to losses at certain non-U.S. entities, including the loss associated with the acquisition of Jin Taiincome earned in lower tax rate jurisdictions and related disposal of Kuang Tai of $7,943, with no tax benefit, partially offset by a benefit for the utilization of foreign tax credits.loss carry-forwards for which valuation allowances had been previously provided.
| Change in Net Sales due to: | ||||||||||||||||||||||||
Net Sales 2011 | Volume | Acquisitions | Price | Foreign Exchange | Net Sales 2012 | |||||||||||||||||||
| Operating Segments | ||||||||||||||||||||||||
| North America Welding | $ | 1,309,499 | $ | 112,898 | $ | 124,830 | $ | 37,124 | $ | (3,533 | ) | $ | 1,580,818 | |||||||||||
| Europe Welding | 508,692 | (36,199 | ) | 8,322 | 4,874 | (33,462 | ) | 452,227 | ||||||||||||||||
| Asia Pacific Welding | 376,276 | (54,289 | ) | — | 1,646 | 849 | 324,482 | |||||||||||||||||
| South America Welding | 156,684 | (1,284 | ) | — | 15,584 | (9,501 | ) | 161,483 | ||||||||||||||||
| The Harris Products Group | 343,458 | 13,683 | — | (13,427 | ) | (9,357 | ) | 334,357 | ||||||||||||||||
| Consolidated | $ | 2,694,609 | $ | 34,809 | $ | 133,152 | $ | 45,801 | $ | (55,004 | ) | $ | 2,853,367 | |||||||||||
| % Change | ||||||||||||||||||||||||
| North America Welding | 8.6 | % | 9.5 | % | 2.8 | % | (0.3 | %) | 20.7 | % | ||||||||||||||
| Europe Welding | (7.1 | %) | 1.6 | % | 1.0 | % | (6.6 | %) | (11.1 | %) | ||||||||||||||
| Asia Pacific Welding | (14.4 | %) | — | 0.4 | % | 0.2 | % | (13.8 | %) | |||||||||||||||
| South America Welding | (0.8 | %) | — | 9.9 | % | (6.1 | %) | 3.1 | % | |||||||||||||||
| The Harris Products Group | 4.0 | % | — | (3.9 | %) | (2.7 | %) | (2.6 | %) | |||||||||||||||
| Consolidated | 1.3 | % | 4.9 | % | 1.7 | % | (2.0 | %) | 5.9 | % | ||||||||||||||
| Twelve Months Ended | ||||||||||||||
| December 31, | ||||||||||||||
| 2012 | 2011 | $ Change | % Change | |||||||||||
| North America Welding: | ||||||||||||||
| Net sales | $ | 1,580,818 | $ | 1,309,499 | 271,319 | 20.7 | % | |||||||
| Inter-segment sales | 131,062 | 136,314 | (5,252 | ) | (3.9 | %) | ||||||||
| Total Sales | $ | 1,711,880 | $ | 1,445,813 | 266,067 | 18.4 | % | |||||||
| EBIT, as adjusted | $ | 293,070 | $ | 227,924 | 65,146 | 28.6 | % | |||||||
| As a percent of total sales | 17.1 | % | 15.8 | % | 1.3 | % | ||||||||
| Europe Welding: | ||||||||||||||
| Net sales | $ | 452,227 | $ | 508,692 | (56,465 | ) | (11.1 | %) | ||||||
| Inter-segment sales | 16,048 | 17,422 | (1,374 | ) | (7.9 | %) | ||||||||
| Total Sales | $ | 468,275 | $ | 526,114 | (57,839 | ) | (11.0 | %) | ||||||
| EBIT, as adjusted | $ | 37,299 | $ | 36,171 | 1,128 | 3.1 | % | |||||||
| As a percent of total sales | 8.0 | % | 6.9 | % | 1.1 | % | ||||||||
| Asia Pacific Welding: | ||||||||||||||
| Net sales | $ | 324,482 | $ | 376,276 | (51,794 | ) | (13.8 | %) | ||||||
| Inter-segment sales | 14,829 | 15,614 | (785 | ) | (5.0 | %) | ||||||||
| Total Sales | $ | 339,311 | $ | 391,890 | (52,579 | ) | (13.4 | %) | ||||||
| EBIT, as adjusted | $ | 7,247 | $ | 2,629 | 4,618 | 175.7 | % | |||||||
| As a percent of total sales | 2.1 | % | 0.7 | % | 1.4 | % | ||||||||
| South America Welding: | ||||||||||||||
| Net sales | $ | 161,483 | $ | 156,684 | 4,799 | 3.1 | % | |||||||
| Inter-segment sales | 38 | 494 | (456 | ) | (92.3 | %) | ||||||||
| Total Sales | $ | 161,521 | $ | 157,178 | 4,343 | 2.8 | % | |||||||
| EBIT, as adjusted | $ | 18,301 | $ | 12,895 | 5,406 | 41.9 | % | |||||||
| As a percent of total sales | 11.3 | % | 8.2 | % | 3.1 | % | ||||||||
| The Harris Products Group: | ||||||||||||||
| Net sales | $ | 334,357 | $ | 343,458 | (9,101 | ) | (2.6 | %) | ||||||
| Inter-segment sales | 8,549 | 8,496 | 53 | 0.6 | % | |||||||||
| Total Sales | $ | 342,906 | $ | 351,954 | (9,048 | ) | (2.6 | %) | ||||||
| EBIT, as adjusted | $ | 29,477 | $ | 25,151 | 4,326 | 17.2 | % | |||||||
| As a percent of total sales | 8.6 | % | 7.1 | % | 1.5 | % | ||||||||
16
| Change in Net Sales due to: | ||||||||||||||||||||||||
Net Sales 2010 | Volume | Acquisitions | Price | Foreign Exchange | Net Sales 2011 | |||||||||||||||||||
| Operating Segments | ||||||||||||||||||||||||
| North America Welding | $ | 1,013,193 | $ | 194,618 | $ | 54,452 | $ | 41,839 | $ | 5,397 | $ | 1,309,499 | ||||||||||||
| Europe Welding | 359,925 | 42,376 | 66,425 | 20,390 | 19,576 | 508,692 | ||||||||||||||||||
| Asia Pacific Welding | 324,092 | 26,198 | — | 3,305 | 22,681 | 376,276 | ||||||||||||||||||
| South America Welding | 117,419 | 24,209 | — | 11,618 | 3,438 | 156,684 | ||||||||||||||||||
| The Harris Products Group | 255,543 | 18,625 | — | 65,753 | 3,537 | 343,458 | ||||||||||||||||||
| Consolidated | $ | 2,070,172 | $ | 306,026 | $ | 120,877 | $ | 142,905 | $ | 54,629 | $ | 2,694,609 | ||||||||||||
| % Change | ||||||||||||||||||||||||
| North America Welding | 19.2 | % | 5.4 | % | 4.1 | % | 0.5 | % | 29.2 | % | ||||||||||||||
| Europe Welding | 11.8 | % | 18.5 | % | 5.7 | % | 5.4 | % | 41.3 | % | ||||||||||||||
| Asia Pacific Welding | 8.1 | % | — | 1.0 | % | 7.0 | % | 16.1 | % | |||||||||||||||
| South America Welding | 20.6 | % | — | 9.9 | % | 2.9 | % | 33.4 | % | |||||||||||||||
| The Harris Products Group | 7.3 | % | — | 25.7 | % | 1.4 | % | 34.4 | % | |||||||||||||||
| Consolidated | 14.8 | % | 5.8 | % | 6.9 | % | 2.6 | % | 30.2 | % | ||||||||||||||
| Twelve Months Ended | ||||||||||||||
| December 31, | ||||||||||||||
| 2011 | 2010 | $ Change | % Change | |||||||||||
| North America Welding: | ||||||||||||||
| Net sales | $ | 1,309,499 | $ | 1,013,193 | 296,306 | 29.2 | % | |||||||
| Inter-segment sales | 136,314 | 108,849 | 27,465 | 25.2 | % | |||||||||
| Total Sales | $ | 1,445,813 | $ | 1,122,042 | 323,771 | 28.9 | % | |||||||
| EBIT, as adjusted | $ | 227,924 | $ | 162,192 | 65,732 | 40.5 | % | |||||||
| As a percent of total sales | 15.8 | % | 14.5 | % | 1.3 | % | ||||||||
| Europe Welding: | ||||||||||||||
| Net sales | $ | 508,692 | $ | 359,925 | 148,767 | 41.3 | % | |||||||
| Inter-segment sales | 17,422 | 13,330 | 4,092 | 30.7 | % | |||||||||
| Total Sales | $ | 526,114 | $ | 373,255 | 152,859 | 41.0 | % | |||||||
| EBIT, as adjusted | $ | 36,171 | $ | 17,023 | 19,148 | 112.5 | % | |||||||
| As a percent of total sales | 6.9 | % | 4.6 | % | 2.3 | % | ||||||||
| Asia Pacific Welding: | ||||||||||||||
| Net sales | $ | 376,276 | $ | 324,092 | 52,184 | 16.1 | % | |||||||
| Inter-segment sales | 15,614 | 12,546 | 3,068 | 24.5 | % | |||||||||
| Total Sales | $ | 391,890 | $ | 336,638 | 55,252 | 16.4 | % | |||||||
| EBIT, as adjusted | $ | 2,629 | $ | 1,752 | 877 | 50.1 | % | |||||||
| As a percent of total sales | 0.7 | % | 0.5 | % | 0.2 | % | ||||||||
| South America Welding: | ||||||||||||||
| Net sales | $ | 156,684 | $ | 117,419 | 39,265 | 33.4 | % | |||||||
| Inter-segment sales | 494 | 1,216 | (722 | ) | (59.4 | %) | ||||||||
| Total Sales | $ | 157,178 | $ | 118,635 | 38,543 | 32.5 | % | |||||||
| EBIT, as adjusted | $ | 12,895 | $ | 7,554 | 5,341 | 70.7 | % | |||||||
| As a percent of total sales | 8.2 | % | 6.4 | % | 1.8 | % | ||||||||
| The Harris Products Group: | ||||||||||||||
| Net sales | $ | 343,458 | $ | 255,543 | 87,915 | 34.4 | % | |||||||
| Inter-segment sales | 8,496 | 6,641 | 1,855 | 27.9 | % | |||||||||
| Total Sales | $ | 351,954 | $ | 262,184 | 89,770 | 34.2 | % | |||||||
| EBIT, as adjusted | $ | 25,151 | $ | 12,311 | 12,840 | 104.3 | % | |||||||
| As a percent of total sales | 7.1 | % | 4.7 | % | 2.4 | % | ||||||||
| Year Ended December 31, | ||||||||||||
| 2012 | 2011 | 2010 | ||||||||||
| Operating income as reported | $ | 362,081 | $ | 296,680 | $ | 186,430 | ||||||
| Special items (pre-tax): | ||||||||||||
| Rationalization charges (gains) | 7,512 | 282 | (1,267 | ) | ||||||||
| Impairment charges | 1,842 | — | 883 | |||||||||
| Venezuela statutory severance obligation | 1,381 | — | — | |||||||||
| Venezuela – functional currency change and devaluation | — | — | 3,123 | |||||||||
| Adjusted operating income | $ | 372,816 | $ | 296,962 | $ | 189,169 | ||||||
| Year Ended December 31, | ||||||||||||
| 2012 | 2011 | 2010 | ||||||||||
| Net income as reported | $ | 257,411 | $ | 217,186 | $ | 130,244 | ||||||
| Special items (after-tax): | ||||||||||||
| Rationalization charges (gains) | 6,153 | 237 | (1,695 | ) | ||||||||
| Impairment charges | 1,289 | — | 801 | |||||||||
| Venezuela statutory severance obligation | 906 | — | — | |||||||||
| Venezuela – functional currency change and devaluation | — | — | 3,560 | |||||||||
Income from tax adjustment resulting from change in applicable tax regulations | — | — | (5,092 | ) | ||||||||
| Adjustment for tax audit settlements | — | (4,844 | ) | — | ||||||||
Non-controlling interests charges associated with special items | — | — | 1,782 | |||||||||
| Adjusted net income | $ | 265,759 | $ | 212,579 | $ | 129,600 | ||||||
| Diluted earnings per share as reported | $ | 3.06 | $ | 2.56 | $ | 1.53 | ||||||
| Special items per share | 0.10 | (0.05 | ) | (0.01 | ) | |||||||
| Adjusted diluted earnings per share | $ | 3.16 | $ | 2.51 | $ | 1.52 | ||||||
| Year Ended December 31, | |||||||
| 2009 | 2008 | ||||||
Operating income as reported | $ | 92,976 | $ | 295,404 | |||
Special items: | |||||||
Rationalization charges | 29,018 | 2,447 | |||||
Impairment charges | 879 | 16,924 | |||||
Pension settlement gain | (1,543 | ) | — | ||||
Adjusted Operating income excluding special items | $ | 121,330 | $ | 314,775 | |||
| Year Ended December 31, | |||||||
| 2009 | 2008 | ||||||
Net income as reported | $ | 48,576 | $ | 212,286 | |||
Special items (after-tax): | |||||||
Rationalization charges | 23,193 | 1,698 | |||||
Impairment charges | 596 | 16,615 | |||||
Pension settlement gain | (1,543 | ) | — | ||||
Loss associated with the acquisition of Jin Tai | 7,943 | — | |||||
Gain on sale of property | (5,667 | ) | — | ||||
Adjusted Net income excluding special items | $ | 73,098 | $ | 230,599 | |||
Diluted EPS | $ | 1.14 | $ | 4.93 | |||
Special items | 0.57 | 0.43 | |||||
Adjusted Diluted EPS excluding special items | $ | 1.71 | $ | 5.36 | |||
2008 Compared to 2007
Net Sales: Net sales for 2008 increased 8.7% to $2,479,131 from $2,280,784 initiated in 2007. The increase in Net sales reflects an $88,436 (3.9%) decrease due to volume, a $176,045 (7.7%) increase due to price, a $67,538 (3.0%) increase from acquisitions and a $43,200 (1.9%) favorable impact as a result of changes in foreign currency exchange rates.
Net sales for the North America Welding segment increased 5.2% to $1,313,881 in 2008 compared with $1,248,382 in 2007. This increase reflects a decrease of $57,607 (4.6%) due to volume, a $113,883 (9.1%) increase due to price and a $9,425 (0.8%) increase from acquisitions.
Net sales for the Europe Welding segment increased 13.5% to $538,570 in 2008 compared with $474,388 in 2007. This increase reflects a decrease of $1,592 (0.3%) due to volume, a $6,458 (1.4%) increase due to price, a $29,827 (6.3%) increase from acquisitions and a $29,489 (6.2%) favorable impact as a result of changes in foreign currency exchange rates.
17
Net sales for the Asia Pacific Welding segment increased 29.5% to $230,661 in 2008 compared with $178,120 in 2007. This increase reflects a $21,752 (12.2%) increase due to price, a $23,159 (13.0%) increase from acquisitions and a $7,699 (4.3%) favorable impact as a result of changes in foreign currency exchange rates.
Net sales for the South America Welding segment increased 14.4% to $116,061 in 2008 compared with $101,426 in 2007. This increase reflects a decrease of $10,444 (10.3%) due to volume, a $20,883 (20.6%) increase due to price and a $4,196 (4.1%) favorable impact as a result of changes in foreign currency exchange rates.
Net sales for The Harris Products Group segment increased 0.5% to $279,958 in 2008 compared with $278,468 in 2007. This increase reflects a decrease of $18,724 (6.7%) due to volume, a $13,069 (4.7%) increase due to price, a $5,127 (1.8%) increase from acquisitions and a $2,018 (0.7%) favorable impact as a result of changes in foreign currency exchange rates.
Gross Profit: Gross profit increased 11.2% to $720,151 during 2008 compared with $647,566 in 2007. As a percentage of Net sales, Gross profit increased to 29.0% in 2008 from 28.4% in 2007. This increase was primarily a result of favorable pricing leverage and improved operational effectiveness2012 partially offset by volume decreasesgains on the disposal of assets at rationalized operations, asset impairment charges of $1,289 and a net charge of $906 related to the continuing shiftchange in sales mix to traditionally lower margin geographies and businesses. Foreign currency exchange rates had a $10,621 favorable impact in 2008.
Selling, General & Administrative Expenses: SG&A expensesVenezuelan labor law, which provides for increased $35,254 (9.5%) in 2008 compared with 2007. The increase was primarily due to higher selling expenses of $10,543 resulting from increased sales activity, incremental selling, general and administrative expenses from acquisitions totaling $9,222, higher bonus expense of $5,706 and higher foreign currency transaction losses of $4,381. Foreign currency exchange rates had a $5,587 unfavorable impact.employee severance obligations.
In 2007, the Company recorded$801. Net income also includes a net gaincharge of $188 ($107 after-tax) to rationalization charges due to a gain of $816 ($735 after-tax)$3,560 related to the terminationchange in functional currency and devaluation of the Harris Ireland Pension Plan offsetting other chargesVenezuelan currency, income of $5,092 due to an adjustment in tax liabilities for a change in applicable tax regulations, a gain of $108 in non-controlling interests related to severance costs covering 66 employees at the Company’s facility in Ireland.
Interest Income: Interest income increased to $8,845 in 2008 from $8,294 in 2007. The increase wasimpairment of assets for a result of higher cash balances partially offset by lower interest rate investments in 2008 when compared with 2007.
Equity Earnings in Affiliates: Equity earnings in affiliates decreased to $6,034 in 2008 from $9,838 in 2007 as a result of lower earnings at the Company’s joint venture investments in Turkey and Taiwan.
Interest Expense: Interest expense increased to $12,155 in 2008 from $11,430 in 2007 as a result of a lower level of amortization of the gain associated with previously terminated interest rate swap agreements and higher debt levels.
Income Taxes: Income taxes for 2008 were $87,523 on income before income taxes of $299,809, an effective rate of 29.2%, compared with income taxes of $84,421 on income before income taxes of $287,157, or an effective rate of 29.4% for 2007. The decrease in the effective tax rate for 2008 from 2007 was a result of additional utilization of foreign tax credits from the repatriation of higher-taxed earnings partially offset by non-deductible asset impairment charges in China. The effective rate for 2008 and 2007 was lower than the Company’s statutory rate primarily because of the utilization of foreign tax credits, lower taxes on non-U.S. earnings and the utilization of foreign tax loss carryforwards, for which valuation allowances had been previously provided.
18
Net Income: Net income for 2008 was $212,286 compared with $202,736 in the prior year. Diluted EPS for 2008 was $4.93 compared with $4.67 per share in 2007. Foreign currency exchange rate movements had a $2,508majority-owned consolidated subsidiary and a $3,419 favorable effect on net incomecharge of $1,890 in non-controlling interests related to the disposal of assets for 2008 and 2007, respectively.a majority-owned consolidated subsidiary.
Non-GAAP Financial Measures: The Company reviews Operating income, Net income and Diluted EPS excluding special items, non-GAAP financial measures, in assessing and evaluating the Company’s underlying operating performance. The following tables present reconciliations of Operating income, Net income and Diluted EPS as reported to Operating income, Net income and Diluted EPS excluding special items.
| Year Ended December 31, | |||||||
| 2008 | 2007 | ||||||
Operating income as reported | $ | 295,404 | $ | 277,632 | |||
Special items: | |||||||
Rationalization charges (gain) | 2,447 | (188 | ) | ||||
Impairment charges | 16,924 | — | |||||
Adjusted Operating income excluding special items | $ | 314,775 | $ | 277,444 | |||
| Year Ended December 31, | |||||||
| 2008 | 2007 | ||||||
Net income as reported | $ | 212,286 | $ | 202,736 | |||
Special items (after-tax): | |||||||
Rationalization charges (gain) | 1,698 | (107 | ) | ||||
Impairment charges | 16,615 | — | |||||
Adjusted Net income excluding special items | $ | 230,599 | $ | 202,629 | |||
Diluted EPS | $ | 4.93 | $ | 4.67 | |||
Special items | 0.43 | — | |||||
Adjusted Diluted EPS excluding special items | $ | 5.36 | $ | 4.67 | |||
19
| Year Ended December 31, | $ Change | |||||||||||||||||||
| 2009 | 2008 | 2007 | 2009 vs. 2008 | 2008 vs. 2007 | ||||||||||||||||
Cash provided by operating activities: | $ | 250,350 | $ | 257,449 | $ | 249,832 | $ | (7,099 | ) | $ | 7,617 | |||||||||
Cash used by investing activities: | (63,581 | ) | (115,800 | ) | (79,705 | ) | 52,219 | (36,095 | ) | |||||||||||
Capital expenditures | (38,201 | ) | (72,426 | ) | (61,633 | ) | 34,225 | (10,793 | ) | |||||||||||
Acquisition of businesses, net of cash acquired | (25,449 | ) | (44,036 | ) | (18,773 | ) | 18,587 | (25,263 | ) | |||||||||||
Cash used by financing activities: | (89,072 | ) | (67,741 | ) | (77,586 | ) | (21,331 | ) | 9,845 | |||||||||||
(Payments) proceeds on short-term borrowings, net | (12,954 | ) | 6,104 | 2,826 | (19,058 | ) | 3,278 | |||||||||||||
(Payments) proceeds on long-term borrowings, net | (30,874 | ) | 319 | (40,142 | ) | (31,193 | ) | 40,461 | ||||||||||||
Proceeds from exercise of stock options | 705 | 7,201 | 8,644 | (6,496 | ) | (1,443 | ) | |||||||||||||
Tax benefit from exercise of stock options | 195 | 3,728 | 4,289 | (3,533 | ) | (561 | ) | |||||||||||||
Purchase of shares for treasury | (343 | ) | (42,337 | ) | (15,459 | ) | 41,994 | (26,878 | ) | |||||||||||
Cash dividends paid to shareholders | (45,801 | ) | (42,756 | ) | (37,744 | ) | (3,045 | ) | (5,012 | ) | ||||||||||
Increase in Cash and cash equivalents | 103,804 | 66,950 | 97,170 | 36,854 | (30,220 | ) | ||||||||||||||
| Year Ended December 31, | $ Change | |||||||||||||||||||
| 2012 | 2011 | 2010 | 2012 vs. 2011 | 2011 vs. 2010 | ||||||||||||||||
| Cash provided by operating activities | $ | 327,484 | $ | 193,518 | $ | 156,978 | $ | 133,966 | $ | 36,540 | ||||||||||
| Cash used by investing activities: | (187,471 | ) | (130,796 | ) | (69,400 | ) | (56,675 | ) | (61,396 | ) | ||||||||||
| Capital expenditures | (52,715 | ) | (65,813 | ) | (60,565 | ) | 13,098 | (5,248 | ) | |||||||||||
| Acquisition of businesses, net of cash acquired | (134,602 | ) | (66,229 | ) | (18,856 | ) | (68,373 | ) | (47,373 | ) | ||||||||||
| Proceeds from the sale of property, plant and equipment | 1,387 | 1,246 | 10,021 | 141 | (8,775 | ) | ||||||||||||||
| Other investing activities | (1,541 | ) | — | — | (1,541 | ) | — | |||||||||||||
| Cash used by financing activities: | (216,838 | ) | (63,370 | ) | (109,507 | ) | (153,468 | ) | 46,137 | |||||||||||
| (Payments) proceeds on short-term borrowings, net | (4,533 | ) | 8,981 | (18,599 | ) | (13,514 | ) | 27,580 | ||||||||||||
| Payments on long-term borrowings, net | (84,770 | ) | (1,032 | ) | (8,580 | ) | (83,738 | ) | 7,548 | |||||||||||
| Proceeds from exercise of stock options | 18,776 | 11,351 | 3,508 | 7,425 | 7,843 | |||||||||||||||
| Tax benefit from exercise of stock options | 7,819 | 2,916 | 1,210 | 4,903 | 1,706 | |||||||||||||||
| Purchase of shares for treasury | (81,018 | ) | (36,997 | ) | (39,682 | ) | (44,021 | ) | 2,685 | |||||||||||
| Cash dividends paid to shareholders | (73,112 | ) | (51,935 | ) | (47,364 | ) | (21,177 | ) | (4,571 | ) | ||||||||||
| Other financing activities | — | 3,346 | — | (3,346 | ) | 3,346 | ||||||||||||||
| Decrease in Cash and cash equivalents | (74,637 | ) | (5,092 | ) | (21,943 | ) | ||||||||||||||
2011
.The Company’s debt levels decreased from $142,230 at December 31, 2008, to $123,717 at December 31, 2009. Debt to total capitalization decreased to 10.2% at December 31, 2009 from 12.3% at December 31, 2008.
A total of $45,801 in
20
The Company has investments in Venezuela which currently require the approval of a government agency to convert local currency to U.S. dollars at official government rates. Government approval for currency conversion to satisfy U.S. dollar liabilities to foreign suppliers, including payables to Lincoln affiliates, has lagged payment due dates from time to time in the past, resulting in higher cash balances and higher past due U.S. dollar payables within our Venezuelan subsidiary. If the Company had settled its Venezuelan subsidiary’s U.S. dollar liabilities using unofficial parallel currency exchange mechanisms as of December 31, 2009, it would have resulted in a currency exchange gain of approximately $437.
Cumulative inflation in Venezuela over the preceding three year period reached 100% during the fourth quarter of 2009. As a result, the Company changed the functional currency of its Venezuelan subsidiary to the U.S. dollar as of January 1, 2010. During January 2010, the Venezuelan government announced the devaluation of the official exchange rate used for most foreign currency transactions common to the Company’s Venezuelan subsidiary from 2.15 to 4.30 Bolivars to the U.S. dollar.
The Company’s Venezuelan subsidiary’s net Bolivar denominated monetary liability position is expected to result in a gain of approximately $2,500 during the first quarter of 2010. The Company also expects that its Venezuelan subsidiary’s results of operations will decrease significantly in 2010 due to the new exchange rate. The impact of selling inventories carried at the previous exchange rate is expected to decrease gross profit by approximately $5,000.
Rationalization and Asset Impairments
The Company recorded rationalization and asset impairment charges of $29,897 for the year ended December 31, 2009. These charges include $27,142 primarily related to employee severance costs, $2,061 in long-lived asset impairment charges, $879 in indefinite-lived intangible asset impairment charges and a gain of $185 recognized in connection with the partial settlement of a pension plan.
In the fourth quarter of 2009, the Company determined that the carrying value of certain long-lived assets exceeded fair value at operations affected by rationalization activities initiated in the second and third quarters of 2009. As a result, asset impairment charges totaling $2,061 were recognized in “Rationalization and asset impairment charges (gain).” Of the total asset impairment charges, $253 were recognized in the Europe Welding segment, $1,515 in the Asia Pacific Welding segment and $293 in The Harris Products Group segment. Fair values of impaired long-lived assets were determined primarily by third party appraisal.
During the third quarter of 2009, the Company initiated various rationalization actions, including the closureDecember dividend payment of a manufacturing facility in Europe and the consolidation of certain manufacturing operations in the Europe Welding and Asia Pacific Welding segments. These actions impacted 80 employees in the Europe Welding segment, 175 employees in the Asia Pacific Welding segment and nine employees in the South America Welding segment. These actions are expected to cost approximately $12,000, of which the Company recorded rationalization charges of $8,333 for the year ended December 31, 2009. At December 31, 2009, a liability related to these actions of $3,912 was recorded in “Other current liabilities.” Costs related to these actions relate primarily to employee severance actions$16,533 that are expected to be substantially completed and paid over the next year.
During the second quarter of 2009, the Company initiated various rationalization actions including the closure of a manufacturing facility in The Harris Products Group segment. These actions affected eight employees in the North America Welding segment, 61 employees in the Europe Welding segment, 81 employees in the Asia Pacific Welding segment, 23 employees in the South America Welding segment and 58 employees in The Harris Products Group segment. The Company recorded rationalization charges of $6,684 for the year ended December 31, 2009 related to these actions. A liability related to these actions of $2,445 was recorded in “Other current liabilities” at December 31, 2009. These costs relate primarily to employee severance actions that are essentially complete and are expected towould generally be paid over the next year.
21
Rationalization actions taken during the first quarter of 2009 included a voluntary separation incentive program covering certain U.S.-based employees. These actions affected 408 employees in the North America Welding segment, 48 employees in the Europe Welding segment, 44 employees in the Asia Pacific Welding segment, 22 employees in the South America Welding segment and 46 employees in The Harris Products Group segment. The Company recorded rationalization charges of $12,092 for the year ended December 31, 2009 related to these actions. At December 31, 2009, all activities associated with these actions were completed.
Rationalization actions taken during the fourth quarter of 2008 affected 67 and 65 employees in The Harris Products Group and Europe Welding segments, respectively. The Company recorded rationalization charges of $2,447 at December 31, 2008 and $33 for the year ended December 31, 2009 related to these actions. At December 31, 2009, all activities associated with these actions were completed.
The Company continues evaluating its cost structure and additional rationalization actions may result in charges in subsequent quarters.
In the fourth quarter of 2008, the Company recorded asset impairment charges totaling $16,924 in “Rationalization and asset impairment charges (gain).”
In the fourth quarter of 2008, the Company determined that poor operating results and a dampened economic outlook indicated the potential for impairment at two of its businesses in China. Impairment testing determined that the carrying value of long-lived assets exceeded fair value at one of these businesses and the Company recorded a charge of $2,388. In addition, the carrying value of goodwill at both of these businesses exceeded the implied value of goodwill and the Company recorded a charge of $13,194.
The Company also tested indefinite-lived intangible assets and determined that the carrying value of certain intangible assets in the Europe Welding and North America Welding segments exceeded fair value. As a result, the Company recorded charges of $524 and $818, respectively.
Fair values of impaired assets were determined using projected discounted cash flows.
In 2005, the Company committed to a plan to rationalize manufacturing operations at Harris Calorific Limited (“Harris Ireland”). The Company incurred a total of $3,920 in charges related to this plan of which a gain of $188 was recorded in 2007. During 2009, the Company received cash of $1,740 related to the termination of the Harris Ireland pension plan and recognized a gain of $185.
AcquisitionsJanuary 2013.
On July 29, 2009, the Company completed the acquisition of 100% of Jin Tai, based in Jinzhou, China. This transaction expanded the Company’s customer base and gave the Company control of significant cost-competitive solid wire manufacturing capacity.
The Company previously held a 21% direct interest in Jin Tai and a further 27% indirect interest via its 35% interest in Kuang Tai. Under the terms of the agreement, the Company exchanged its 35% interest in Kuang Tai with a fair value of $22,723, paid cash of $35,531 and will pay an additional $4,181 in cash over a three-year period after close.
The fair value of the Company’s previous non-controlling direct interest in Jin Tai was $8,675. The carrying values of the Company’s interests in Kuang Tai and Jin Tai were $29,368 and $9,973, respectively. The excess carrying value over fair value of these interests resulted in a loss on the transaction of $7,943 recorded in “Equity (loss) earnings in affiliates.”
The Company previously reported its proportional share of Jin Tai’s net income under the equity method in “Equity (loss) earnings in affiliates.” Jin Tai’s sales were $186,774 in 2008 and $74,834 in 2009 prior to the acquisition. Jin Tai’s sales of $53,956 after the acquisition were included in “Net sales” for 2009. The pro forma impact on the results of operations if the acquisition had been completed as of the beginning of both 2009 and 2008 would not have been significant.
22
The identifiable assets acquired and liabilities assumed upon the acquisition of Jin Tai were as follows:
| July 29, 2009 | |||
Cash and cash equivalents | $ | 16,032 | |
Accounts receivable | 23,306 | ||
Inventory | 17,037 | ||
Other current assets | 18,932 | ||
Property, plant and equipment | 29,275 | ||
Intangibles | 15,201 | ||
Goodwill | 1,429 | ||
Other non-current assets | 5,585 | ||
Total assets acquired | 126,797 | ||
Amounts due banks | 28,833 | ||
Trade accounts payable | 2,306 | ||
Current liabilities | 7,839 | ||
Long-term liabilities | 15,459 | ||
Total liabilities assumed | 54,437 | ||
Net assets acquired | $ | 72,360 | |
All assets acquired and liabilities assumed were recorded at estimated fair value. Goodwill of $1,429 was allocated to the Asia Pacific Welding segment and is not deductible for income tax purposes under current tax law. Net assets acquired included a non-controlling interest in one of Jin Tai’s operations valued at $1,250. This non-controlling interest was subsequently acquired and accounted for as an equity transaction.
On October 1, 2008, the Company acquired a 90% interest in a leading Brazilian manufacturer of brazing products for approximately $24,000 in cash and assumed debt. The newly acquired company, based in Sao Paulo, is being operated as Harris Soldas Especiais S.A. This acquisition expanded the Company’s brazing product line and increased the Company’s presence in the South American market. Annual sales at the time of the acquisition were approximately $30,000.
On April 7, 2008, the Company acquired all of the outstanding stock of Electro-Arco S.A. (“Electro-Arco”), a privately held manufacturer of welding consumables headquartered near Lisbon, Portugal, for approximately $24,000 in cash and assumed debt. This acquisition added to the Company’s European consumables manufacturing capacity and widened the Company’s commercial presence in Western Europe. Annual sales at the time of the acquisition were approximately $40,000.
On November 30, 2007, the Company acquired the assets and business of Vernon Tool Company Ltd. (“Vernon Tool”), a privately held manufacturer of computer-controlled pipe cutting equipment used for precision fabrication purposes headquartered near San Diego, California, for approximately $12,434 in cash. This acquisition added to the Company’s ability to support its customers in the market for infrastructure development. Annual sales at the time of the acquisition were approximately $9,000.
On November 29, 2007, the Company announced that it had entered into a majority-owned joint venture with Zhengzhou Heli Welding Materials Company Ltd. (“Zhengzhou Heli”), a privately held manufacturer of subarc flux based in Zhengzhou, China. The Company has contributed $16,400 to Zhengzhou Heli. Annual sales at the time of the acquisition were approximately $8,000.
23
On July 20, 2007, the Company acquired Nanjing Kuang Tai Welding Materials Company, Ltd. (“Nanjing”), a manufacturer of stick electrode products based in Nanjing, China, for approximately $4,245 in cash and assumed debt. The Company previously owned 35% of Nanjing indirectly through its investment in Kuang Tai. Annual sales at the time of the acquisition were approximately $10,000.
On March 30, 2007, the Company acquired all of the outstanding stock of Spawmet Sp. z o.o. (“Spawmet”), a privately held manufacturer of welding consumables headquartered near Katowice, Poland, for approximately $5,000 in cash. This acquisition provided the Company with a portfolio of stick electrode products and broadened its distributor network in Poland and Eastern Europe. Annual sales at the time of the acquisition were approximately $5,000.
Acquired companies are included in the Company’s consolidated financial statements as of the date of acquisition.
decreased to 1.5% at December 31, 2012 from 8.0% at December 31, 2011. The decrease was predominantly due to the repayment of the Company's $80,000 senior unsecured note on March 12, 2012.
During March 2002, the Company entered into floating rate interest rate swap agreements totaling $80,000 to convert a portion of the Notes outstanding from fixed to floating rates. These swaps were designated as fair value hedges and, as such, the gains or losses on the derivative instrument, as well as the offsetting gains or losses on the hedged item attributable to the hedged risk, were recognized in earnings. Net payments or receipts under these agreements were recognized as adjustments to “Interest expense.” In May 2003, these swap agreements were terminated. The gain of $10,613 on the termination of these swaps was deferred and is being amortized as an offset to “Interest expense” over the remaining life of the Notes. The amortization of this gain reduced “Interest expense” by $313 in 2009, $958 in 2008 and $1,121 in 2007, and is expected to reduce annual “Interest expense” by $206 in 2010. At December 31, 2009, $442 remains to be amortized and is recorded in “Long-term debt, less current portion.”
During July 2003 and April 2004, the Company entered into various floating rate interest rate swap agreements totaling $110,000 to convert a portion of the Notes outstanding from fixed to floating rates based on the London Inter-Bank Offered Rate (“LIBOR”). These swaps were designated and qualified as fair value hedges and, as such, the gains or losses on the derivative instrument, as well as the offsetting gains or losses on the hedged item, were recognized in earnings. Net payments or receipts under these agreements were recognized as adjustments to “Interest expense.”
During February 2009, the Company terminated swaps with a notional value of $80,000 and realized a gain of $5,079. This gain was deferred and is being amortized over the remaining life of the Notes. The amortization of
24
this gain reduced “Interest expense” by $1,429 in 2009 and is expected to reduce annual “Interest expense” by $1,661the
During
2012.
On November 18, 2009, the
The Credit Agreement contains customary affirmative, negative and financial covenants for credit facilities of this type, including limitations on the Company with respect to liens, investments, distributions, mergers and acquisitions, dispositions of assets, transactions with affiliates and a fixed charges coverage ratio and total leverage ratio. As of December 31, 2009, there were no borrowings under the Credit Agreement.
25
| Payments Due By Period | ||||||||||||||||||||
| Total | 2013 | 2014 to 2015 | 2016 to 2017 | 2018 and Beyond | ||||||||||||||||
| Long-term debt, including current portion | $ | 1,788 | $ | 366 | $ | 622 | $ | 188 | $ | 612 | ||||||||||
| Interest on long-term debt | 160 | 38 | 49 | 30 | 43 | |||||||||||||||
| Capital lease obligations | 267 | 93 | 95 | 79 | — | |||||||||||||||
| Short-term debt | 18,220 | 18,220 | — | — | — | |||||||||||||||
| Interest on short-term debt | 844 | 844 | — | — | — | |||||||||||||||
| Operating leases | 46,219 | 12,624 | 16,257 | 10,256 | 7,082 | |||||||||||||||
Purchase commitments(1) | 155,480 | 154,823 | 482 | 158 | 17 | |||||||||||||||
| Total | $ | 222,978 | $ | 187,008 | $ | 17,505 | $ | 10,711 | $ | 7,754 | ||||||||||
| Payments Due By Period | |||||||||||||||
| Total | 2010 | 2011 to 2012 | 2013 to 2014 | 2015 and Beyond | |||||||||||
Long-term debt | $ | 82,209 | $ | 326 | $ | 80,457 | $ | 303 | $ | 1,123 | |||||
Interest on long-term debt | 13,209 | 5,235 | 7,828 | 53 | 93 | ||||||||||
Capital lease obligations | 2,839 | 964 | 1,652 | 83 | 140 | ||||||||||
Short-term debt | 34,577 | 34,577 | — | — | — | ||||||||||
Interest on short-term debt | 904 | 904 | — | — | — | ||||||||||
Operating leases | 34,709 | 9,923 | 12,559 | 4,995 | 7,232 | ||||||||||
Total contractual cash obligations | $ | 168,447 | $ | 51,929 | $ | 102,496 | $ | 5,434 | $ | 8,588 | |||||
| (1) | Purchase commitments include contractual obligations for raw materials and services. |
At
December 31, 2012, there were 2,517,228 common shares available for future grant under all plans.26
awards been exercised on that dateat
Costs
reduced trial activity.
claims.
Arrangements
In May 2009,face of the FASB issued ASC 855 (formerly SFAS 165, “Subsequent Events”). ASC 855 established general standards of accounting for disclosure of events that occur after the balance sheet date but before financial statements are issuedstatement where net income is presented or are available to be issued. In particular, ASC 855 sets forth the period after the balance sheet date during which management should evaluate events or transactions that may occur for potential recognition or disclosure in the financial statements, the circumstances under which an entity should recognize events or transactions occurring after the balance sheet date in its financial statements and the disclosures that an entity should make about events or transactions that occurred after the balance sheet date. ASC 855 was adopted in 2009 and did not have a significant impact on the Company’s financial statements.
In December 2008, the FASB issued ASC 715 (formerly FSP FAS 132(R)-1, “Employers’ Disclosures about Postretirement Benefit Plan Assets”). ASC 715 requires disclosure about an entity’s investment policies and
27
strategies, the categories of plan assets, concentrations of credit risk and fair value measurements of plan assets. The standard, effective for fiscal years ending after December 15, 2009, resulted in increased disclosures in the notes, tosignificant amounts reclassified out of accumulated other comprehensive income by the Company’s financial statements related torespective line items of net income but only if the assets of the Company’s defined benefit pension plans.
In November 2008, the FASB issued ASC 323-10 (formerly Emerging Issues Task Force (“EITF’) Issue 08-6, “Equity Method Investment Accounting Considerations”). ASC 323-10 addresses the impact that ASC 805 (formerly SFAS 141(R)), and ASC 810 (formerly SFAS 160), might have on the accounting for equity method investments including how the initial carrying value of an equity method investment should be determined, how it should be tested for impairment and how changes in classification from equity method to cost method should be treated. ASC 323-10amount reclassified is required under U.S. GAAP to be implemented prospectively and is effective for fiscal years beginning after December 15, 2008. The adoption of ASC 323-10 did not have a significant impact on the Company’s financial statements.
In June 2008, the FASB issued ASC 260-10 (formerly FSP EITF 03-6-1, “Determining Whether Instruments Grantedreclassified to net income in Share-Based Payment Transactions Are Participating Securities”). ASC 260-10 determined that unvested share-based payment awards that contain rights to receive nonforfeitable dividends or dividend equivalents (whether paid or unpaid) are participating securities, and thus, should be includedits entirety in the two-class method of computing earnings per share. This standard did not have a significant impact on the Company’s disclosure of earnings per share.
In April 2008, the FASB issued ASC 275-10 and ASC 350-30 (formerly FSP 142-3, “Determination of the Useful Life of Intangible Assets”). These standards amend the factorssame reporting period. For other amounts, an entity is required to cross-reference to other disclosures required under U.S. GAAP that should be considered in developing renewal or extension assumptions used to determine the useful life of a recognized intangible asset under ASC 350 (formerly SFAS 142, “Goodwill and Other Intangible Assets”). ASC 275-10 and ASC 350-30provide additional detail about those amounts. The amendments are effective for financial statements issued for fiscal years beginning after December 15, 2008 and interim periods within those fiscal years. ASC 275-10 and ASC 350-30 apply prospectively to intangible assets acquired after adoption. The adoption of ASC 275-10 and ASC 350-30 did not have a significant impact on the Company’s financial statements.
In March 2008, the FASB issued ASC 815 (formerly SFAS 161, “Disclosures about Derivative Instruments and Hedging Activities”). ASC 815 requires disclosures of how and why an entity uses derivative instruments, how derivative instruments and related hedged items are accounted for and how derivative instruments and related hedged items affect an entity’s financial position, financial performance and cash flows. ASC 815 is effective for fiscal years beginning after November 15, 2008 with early adoption permitted. The Company adopted these provisions as of January 1, 2009. See Note 10 for the Company’s disclosures pursuant to adoption.
In December 2007, the FASB issued ASC 810 (formerly SFAS 160, “Noncontrolling Interests in Consolidated Financial Statements”). ASC 810 clarifies that a noncontrolling interest in a subsidiary is an ownership interest in the consolidated entity that should be reported as equity in the consolidated financial statements. ASC 810 changes the way the consolidated statement of income is presented thus requiring consolidated net income to be reported at amounts that include the amounts attributable to both parent and the noncontrolling interest. This pronouncement is effective for fiscal years and interim periods within those fiscal years beginning on or after December 15, 2008. The Company adopted these provisions as of January 1, 2009, applying the presentation and disclosure requirements retrospectively resulting in reclassification of noncontrolling interests from “Other non-current liabilities” to “Total equity.” Income attributable to noncontrolling interests is included in “Selling, general and administrative expenses” in the Consolidated Statements of Income and is not material to the Company. Therefore, the Company did not present income attributable to non-controlling interests separately in the Consolidated Statements of Income.
In December 2007, the FASB issued ASC 805 (formerly SFAS 141 (revised 2007), “Business Combinations” which replaced SFAS 141, “Business Combinations”). ASC 805 retains the fundamental requirements in SFAS 141 that the acquisition method of accounting (which SFAS 141 called the purchase method) be used for all business combinations and for an acquirer to be identified for each business combination. ASC 805 defines the acquirer as the entity that obtains control of one or more businesses in the business combination and establishes
28
the acquisition date as the date that the acquirer achieves control. ASC 805 requires an acquirer to recognize the assets acquired, the liabilities assumed and any noncontrolling interest in the acquiree at the acquisition date measured at their fair values as of that date with limited exceptions specified in the statement. ASC 805 applies prospectively to business combinations for which the acquisition date is on or after the beginning of the first annual reporting period beginning on or after December 15, 2008.
New Accounting Standards to be Adopted:
In January 2010, the FASB issued Accounting Standards Update (“ASU”) No. 2010-06,“Fair Value Measurements and Disclosures (Topic 820) Improving Disclosures about Fair Value Measurements.”ASU 2010-06 amends ASC 820-10-50 to require additional information to be disclosed principally with respect to Level 3 fair value measurements and transfers to and from Level 1 and Level 2 measurements; in addition, enhanced disclosure is required concerning inputs and valuation techniques used to determine Level 2 and Level 3 fair value measurements. The new disclosures and clarifications of existing disclosures, as required by ASU 2010-06, are effective for interim and annual reporting periods beginning after December 15, 2009, except for the disclosures about purchases, sales, issuances and settlements in the roll forward of activity in Level 3 fair value measurements. Those disclosures are effective for fiscal years beginning after December 15, 2010, and for interim periods within those fiscal years. Earlier application is permitted. ASU No. 2010-06 is not expected to have a significant impact on the Company’s financial statements.
In December 2009, the FASB issued ASU No. 2009-17,“Consolidations (Topic 810) Improvements to Financial Reporting by Enterprises Involved with Variable Interest Entities an Amendment of the FASB Accounting Standards Codification.”In June 2009, the FASB issued ASC 810 (formerly SFAS 167,“Amendments to FASB Interpretation No. 46(R)”). The objective of ASC 810 is to amend certain requirements of FASB Interpretation 46 (R) (revised December 2003), “Consolidation of Variable Interest Entities,”to improve financial reporting by enterprises involved with variable interest entities and to provide more relevant and reliable information to users of financial statements. ASC 810 will be effective as of the beginning of each reporting entity’s first annual reporting period that begins after November 15, 2009, for interim periods within that first annual reporting period, and for interim and annual reporting periods thereafter. Earlier application is prohibited. ASU No. 2009-17 is not expected to have a significant impact on the Company’s financial statements.
In December 2009, the FASB issued ASU No. 2009-16, “Transfers and Servicing (Topic 860) Accounting for Transfers of Financial Assets an Amendment of the FASB Accounting Standards Codification.”In June 2009, the FASB issued ASC 860,“Transfers and Servicing,” (formerly SFAS 166,“Accounting for Transfers of Financial Assets, an amendment of FASB Statement No. 140”). The objective of ASC 860 is to improve the relevance, representational faithfulness and comparability of the information that a reporting entity provides in its financial reports about a transfer of financial assets; the effects of a transfer on its financial position, financial performance and cash flows; and a transferor’s continuing involvement in transferred financial assets. ASC 860 must be applied as of the beginning of each reporting entity’s first annual reporting period that begins after November 15, 2009, for interim periods within that first annual reporting period and for interim and annual reporting periods thereafter. Earlier application is prohibited. ASU No. 2009-16 must be applied to transfers occurring on or after the effective date. ASU No. 2009-16 is not expected to have a significant impact on the Company’s financial statements.
In October 2009, the FASB issued ASU No. 2009-13,“Revenue Recognition (Topic 605) Multiple-Deliverable Revenue Arrangements a consensus of the FASB Emerging Issues Task Force.” This update provides amendments to the criteria in Subtopic ASC 605-25. ASU No. 2009-13 provides principles for allocating consideration among multiple-elements and accounting for separate deliverables under an arrangement. ASC 605-25, as amended, introduces an estimated selling price method for valuing the elements of a bundled arrangement if vendor-specific objective evidence or third-party evidence of selling price is not available and significantly expands related disclosure requirements. This standard is effective on a prospective basis for revenue arrangements entered into or materially modified in fiscal years beginning on or after June 15, 2010. Alternatively, adoption may be on a retrospective basis and early application is permitted.2012. The Company is currently evaluating the impact of the adoption of ASU 2013-02 on the Company's financial statements.
29
See Note 12 to the Company's consolidated financial statements and "Item 3. Legal Proceedings" section of this Annual Report on Form 10-K for further discussion of tax contingencies.
30
31
For most domestic inventories, cost is determined principally by the last-in, first-out (“LIFO”("LIFO") method, and for non-U.S. inventories, cost is determined by the first-in, first-out (“FIFO”("FIFO") method. The valuation of LIFO inventories is made at the end of each year based on inventory levels and costs at that time. Accordingly, interim LIFO calculations are based on management's estimates of expected year-end inventory levels and costs. Actual year-end costs and inventory levels may differ from interim LIFO inventory valuations. The excess of current cost over LIFO cost amounted to $62,447was $72,173 at
Goodwill allocated to The Harris Products Group reporting unit at December 31, 2009 was $19,824.
32
Additionally, the Company had no outstanding borrowings under the Credit Agreement, therefore an interest rate increase would have no effect on interest expense.
33
term is defined in Rule 13a-15(e) of the Exchange Act. Based on this evaluation, the Chief Executive Officer and Chief Financial Officer concluded that the Company’sCompany's disclosure controls and procedures were effective as of the end of the period covered by this Annual Report on Form 10-K.
Management’s
2012
.elsewhere in this Annual Report on Form 10-K and is incorporated herein by reference.
34
The Company is expected to file its 2013. The information required by this item is incorporated by reference from the Plan Category Equity compensation plans: Approved by security holders Not approved by security holders Total The information required by this item is incorporated by reference from the The information required by this item is incorporated by reference from the Exhibit No. Description /s/ VINCENT K. PETRELLA /s/ /s/ VINCENT K. PETRELLA Officer /s/ JOHN M. STROPKI, JR. /s/ VINCENT K. PETRELLA /s/ VINCENT K. PETRELLA /s/ VINCENT K. PETRELLA /s/ VINCENT K. PETRELLA 2013 2013 ASSETS Current Assets Cash and cash equivalents Accounts receivable (less allowance for doubtful accounts of $8,174 in 2009; $7,673 in 2008) Inventories Raw materials Work-in-process Finished goods Total inventory Deferred income taxes Other current assets Total Current Assets Property, Plant and Equipment Land Buildings Machinery and equipment Less accumulated depreciation Property, Plant and Equipment, Net Other Assets Prepaid pensions Equity investments in affiliates Intangibles, net Goodwill Long-term investments Deferred income taxes Other non-current assets Total Other Assets TOTAL ASSETS Dollars in thousands) LIABILITIES AND SHAREHOLDERS’ EQUITY Current Liabilities Amounts due banks Trade accounts payable Accrued employee compensation and benefits Accrued expenses Accrued taxes, including income taxes Accrued pensions Dividends payable Other current liabilities Current portion of long-term debt Total Current Liabilities Long-Term Liabilities Long-term debt, less current portion Accrued pensions Deferred income taxes Accrued taxes Other long-term liabilities Total Long-Term Liabilities Shareholders’ Equity Preferred shares, without par value – at stated capital amount; authorized – 5,000,000 shares; issued and outstanding – none Common shares, without par value – at stated capital amount; authorized –120,000,000 shares; issued – 49,290,717 shares in 2009 and 2008; outstanding –42,637,247 shares in 2009 and 42,521,628 shares in 2008 Additional paid-in capital Retained earnings Accumulated other comprehensive loss Treasury shares, at cost – 6,653,470 shares in 2009 and 6,769,089 shares in 2008 Total Shareholders’ Equity Noncontrolling interests Total Equity TOTAL LIABILITIES AND EQUITY Dollars in thousands) Net sales Cost of goods sold Gross profit Selling, general & administrative expenses Rationalization and asset impairment charges (gain) Operating income Other (expense) income: Interest income Equity (loss) earnings in affiliates Other income Interest expense Total other (expense) income Income before income taxes Income taxes Net income Basic weighted average shares outstanding Effect of dilutive securities – stock options and awards Diluted weighted average shares outstanding Basic earnings per share Diluted earnings per share Cash dividends declared per share amounts) COMPREHENSIVE INCOME Balance January 1, 2007 Comprehensive income: Net income Unrecognized amounts from defined benefit pension plans, net of tax of $10,371 Unrealized loss on derivatives designated and qualifying as cash flow hedges, net of tax of $1,772 Currency translation adjustment Less comprehensive income attributable to non-controlling interests Total comprehensive income Cash dividends declared – $0.91 per share Issuance of shares under benefit plans Purchase of shares for treasury Adjustment to initially adopt FIN 48 (ASC 740) Balance December 31, 2007 Comprehensive income: Net income Unrecognized amounts from defined benefit pension plans, net of tax of $84,685 Unrealized gain on derivatives designated and qualifying as cash flow hedges, net of tax of $137 Currency translation adjustment Less comprehensive loss attributable to non-controlling interests Total comprehensive loss Cash dividends declared – $1.02 per share Issuance of shares under benefit plans Purchase of shares for treasury Balance December 31, 2008 Comprehensive income: Net income Unrecognized amounts from defined benefit pension plans, net of tax of $12,242 Unrealized gain on derivatives designated and qualifying as cash flow hedges, net of tax of $1,477 Currency translation adjustment Less comprehensive income attributable to non-controlling interests Total comprehensive income Cash dividends declared – $1.09 per share Issuance of shares under benefit plans Purchase of shares for treasury Balance December 31, 2009 amounts) EQUITY CASH FLOWS FROM OPERATING ACTIVITIES Net income Adjustments to reconcile net income to net cash provided by operating activities: Rationalization and asset impairment charges (gain) Depreciation and amortization Equity loss (earnings) of affiliates, net Deferred income taxes Stock-based compensation Amortization of terminated interest rate swaps Amortization of actuarial losses and prior service costs Other non-cash items, net Changes in operating assets and liabilities, net of effects from acquisitions: Decrease (increase) in accounts receivable Decrease (increase) in inventories Decrease (increase) in other current assets Decrease in accounts payable (Decrease) increase in other current liabilities Decrease in accrued pensions Net change in other long-term assets and liabilities NET CASH PROVIDED BY OPERATING ACTIVITIES CASH FLOWS FROM INVESTING ACTIVITIES Capital expenditures Acquisition of businesses, net of cash acquired Additions to equity investment in affiliates Proceeds from sale of property, plant and equipment NET CASH USED BY INVESTING ACTIVITIES CASH FLOWS FROM FINANCING ACTIVITIES Proceeds from short-term borrowings Payments on short-term borrowings Amounts due banks, net Proceeds from long-term borrowings Payments on long-term borrowings Proceeds from exercise of stock options Tax benefit from exercise of stock options Purchase of shares for treasury Cash dividends paid to shareholders NET CASH USED BY FINANCING ACTIVITIES Effect of exchange rate changes on cash and cash equivalents INCREASE IN CASH AND CASH EQUIVALENTS Cash and cash equivalents at beginning of year CASH AND CASH EQUIVALENTS AT END OF YEAR except per share amounts) The new exchange rate. 2011 Buildings Machinery and equipment Less: accumulated depreciation Net capital leases Balance as of January 1, 2008 Additions and adjustments Impairment charges Foreign currency translation Balance as of December 31, 2008 Additions and adjustments Foreign currency translation Balance as of December 31, 2009 Trademarks and trade names Customer relationships Patents Other Total Balance at beginning of year Charged to expense Deductions Foreign currency translation Balance at end of year " completion method, revenue recognition is based upon the ratio of costs incurred to date compared with estimated total costs to complete. The cumulative impact of revisions to total estimated costs is reflected in the period of the change, including anticipated losses. " amounts) Included in liabilities and operating loss and tax credit carry-forwards. In assessing the realizability of deferred tax assets, the Company assesses whether it is more likely than not that a portion or all of the deferred tax assets will not be realized. per share amounts) 2011. ASU 2011-04 was adopted by the Company on January 1, 2012 and did not have a significant impact on the Company's financial statements. Weartech International, Inc. (“Weartech”). Weartech, based in Anaheim, California, is a producer of cobalt-based hard facing and wear-resistant welding consumables. The acquisition added to the Company’s consumables portfolio. Sales for Weartech during 2011 were approximately net of cash acquired, and assumed debt. The fair value of oxy-fuel cutting systems. The Cash and cash equivalents Accounts receivable Inventory Other current assets Property, plant and equipment Intangibles Goodwill Other non-current assets Total assets acquired Amounts due banks Trade accounts payable Current liabilities Long-term liabilities Total liabilities assumed Net assets acquired approximately per share amounts) net assets acquired was Income is not material. Acquired companies are included in the segments consist of North America Welding, Europe Welding, Asia Pacific Welding, South America Welding and The Harris Products Group. The North America Welding segment includes welding operations in the United States, Canada and Mexico. The Europe Welding segment includes welding operations in Europe, Russia, Africa and the Middle East. The other For the year ended December 31, 2009 Net sales Inter-segment sales Total EBIT, as adjusted Special items EBIT Interest income Interest expense Income before income taxes Total assets Equity investments in affiliates Capital expenditures Depreciation and amortization For the year ended December 31, 2008 Net sales Inter-segment sales Total EBIT, as adjusted Special items EBIT Interest income Interest expense Income before income taxes Total assets Equity investments in affiliates Capital expenditures Depreciation and amortization For the year ended December 31, 2007 Net sales Inter-segment sales Total EBIT, as adjusted Special items EBIT Interest income Interest expense Income before income taxes Total assets Equity investments in affiliates Capital expenditures Depreciation and amortization In rationalized operation. 2012 Net sales: United States Foreign countries Total Property, plant and equipment, net: United States Foreign countries Eliminations Total Plans: future periods. The following Balance at December 31, 2008 Payments and other adjustments Charged to expense Balance at December 31, 2009 liabilities by segment for the years ended Balance January 1, 2007 Other comprehensive income (loss) Balance December 31, 2007 Other comprehensive (loss) income Balance December 31, 2008 Other comprehensive income (loss) Balance December 31, 2009 in non-controlling interests relates to foreign currency translation and amounted to Long-term debt Senior Unsecured Notes paid in 2009, interest at 5.89% Senior Unsecured Notes due 2012, interest at 6.36% Capital leases due through 2017, interest at .90% to 28.00% Other borrowings due through 2023, interest up to 10.59% Less current portion Total long-term debt Short-term debt Amounts due banks, interest at 8.35% (22.78% in 2008) Current portion long-term debt Total short-term debt Total debt 2012 Maturities of long-term debt, including payments under capital leases and amounts due banks, for the five years succeeding December 31, primary difference between interest expense and interest paid is the amortization of the gains on terminated interest rate swaps. Balance at beginning of year Shares granted Shares exercised Shares canceled Balance at end of year Exercisable at end of year . Expected volatility Dividend yield Risk-free interest rate Expected option life (years) Weighted average fair value per option granted during the year Balance at beginning of year Granted Vested Forfeited Balance at end of year Exercise Price Range $13.50 - $34.99 $35.00 - $39.99 Over $40.00 . Change in benefit obligations Benefit obligations at beginning of year Service cost Interest cost Plan participants’ contributions Actuarial loss Benefits paid Settlement/curtailment Currency translation Benefit obligations at end of year Change in plan assets Fair value of plan assets at beginning of year Actual return on plan assets Employer contributions Plan participants’ contributions Benefits paid Settlement Currency translation Fair value of plan assets at end of year Funded status at end of year Unrecognized net loss Unrecognized prior service cost Unrecognized transition assets, net Net amount recognized per share amounts) Prepaid pensions Accrued pension liability, current Accrued pension liability, long-term Accumulated other comprehensive loss, excluding tax effects Net amount recognized in the balance sheets Service cost Interest cost Expected return on plan assets Amortization of prior service cost Amortization of net loss Settlement/curtailment (gain) loss Pension cost for defined benefit plans 2012 for the Company's defined benefit plans increased as a result of an increase in amortization of net loss and settlement loss partially offset by an increase in expected return on plan assets. The higher settlement loss includes a charge of $742 related to the rationalization of the Company's Australia manufacturing operations. U.S. pension plans Projected benefit obligation Accumulated benefit obligation Fair value of plan assets Non-U.S. pension plans Projected benefit obligation Accumulated benefit obligation Fair value of plan assets 2011 Estimated Payments 2010 2011 2012 2013 2014 2015 through 2019 Weighted average assumptions used to measure the benefit obligation for the Discount rate Rate of increase in compensation Discount rate Rate of increase in compensation Expected return on plan assets Corporate stock (1) Insurance company nonpooled separate Cash and cash equivalents Corporate and other obligations Common trusts (3) Private equity funds Total assets at fair value Balance at the beginning of year Purchases, sales, issuances and settlements Realized and unrealized gains (losses) Balance at the end of year The amount of total (losses) gains during the period attributable to the change in unrealized (losses) gains relating to Level 3 net assets still held at the reporting date 2012 In 2006, the plan was amended to include a feature in which all participants receive an annual Company contribution ranging from U.S. Non-U.S. Total Current: Federal Non-U.S. State and local Deferred: Federal Non-U.S. State and local Total Statutory rate of 35% applied to pre-tax income Effect of state and local income taxes, net of federal tax benefit Taxes more (less) than the U.S. tax rate on non-U.S. earnings, including utilization of tax loss carryforwards, losses with no benefit and changes in non-U.S. valuation allowance Manufacturing deduction U.S. tax (benefit) cost of foreign source income Resolution of prior years’ tax liabilities Other Total Effective tax rate Balance at January 1 Increase related to current year tax provisions Increase related to prior years’ tax positions Increase related to acquisitions Decrease related to settlements with taxing authorities Resolution of prior years’ tax liabilities Other Balance at December 31 per share amounts) Deferred tax assets: Tax loss and credit carryforwards Inventory Other accruals Employee benefits Pension obligations Other Valuation allowance Deferred tax liabilities: Property, plant and equipment Intangible assets Inventory Pension obligations Other Total reinvested were not significant. 2012. The Company has short-term silver and copper forward contracts with recognized in Cost of goods sold. Derivatives by hedge designation Designated as hedging instruments: Foreign exchange contracts Not designated as hedging instruments: Foreign exchange contracts Commodity contracts Total derivatives Derivatives by hedge designation Classification of gains (losses) Fair value hedges: Interest rate swaps Not designated as hedges: Foreign exchange contracts Commodity contracts The effects of designated cash flow hedges on AOCI and the Company's Consolidated Total recognized in AOCI, Gain (loss) reclassified Foreign exchange contracts Commodity contracts Description Derivatives, net liability participants' underlying investment fund elections. " The decrease in the accrual for contingent liabilities is primarily due to a payment made in conjunction with the agreement entered into in January 2012 that provides for the dismissal with prejudice of substantially all of the pending manganese claims. The decrease in the asset for recoveries from insurance carriers reflects the collection of insurance receivables. as follows: 2009 Net sales Gross profit (Loss) income before income taxes Net (loss) income Basic (loss) earnings per share Diluted (loss) earnings per share 2008 Net sales Gross profit Income before income taxes Net income Basic earnings per share Diluted earnings per share The quarter ended December 31, Asia Pacific Welding segments. North America Welding segment. Description Allowance for doubtful accounts: Year ended December 31, 2009 Year ended December 31, 2008 Year ended December 31, 2007PART IIIITEM 10. DIRECTORS, EXECUTIVE OFFICERS AND CORPORATE GOVERNANCEITEM 10.DIRECTORS, EXECUTIVE OFFICERS AND CORPORATE GOVERNANCE20102013 proxy statement pursuant to Regulation 14A of the Exchange Act prior to April 30, 2010.Except for the information set forth belowwithin Part I, Item 1C section of this Annual Report on Form 10-K concerning our Executive Officers, the information required by this item is incorporated by reference from the 20102013 proxy statement.ITEM 11. EXECUTIVE OFFICERS OF THE REGISTRANTNameAgePositionJohn M. Stropki, Jr.59Chairman of the Board since October 13, 2004; Director since 1998; Chief Executive Officer and President since June 3, 2004; Chief Operating Officer from May 1, 2003 to June 3, 2004; Executive Vice President from 1995 to June 3, 2004 and President North America from 1996 to 2003.Vincent K. Petrella49Senior Vice President, Chief Financial Officer and Treasurer since October 7, 2005; Vice President, Chief Financial Officer and Treasurer from February 4, 2004 to October 7, 2005 and Vice President, Corporate Controller from 2001 to 2003.Frederick G. Stueber56Senior Vice President, General Counsel and Secretary since 1996.George D. Blankenship47Senior Vice President, President Lincoln Electric North America since July 30, 2009; Senior Vice President, Global Engineering from October 7, 2005 to July 30, 2009; Vice President, Global Engineering from May 5, 2005 to October 7, 2005; President, Lincoln Electric North America of The Lincoln Electric Company since July 30, 2009; Senior Vice President; President, Lincoln Cleveland of The Lincoln Electric Company from January 8, 2008 to July 30, 2009; Senior Vice President, U.S. Operations of The Lincoln Electric Company from October 7, 2005 to January 8, 2008; Vice President, Cleveland Operations of The Lincoln Electric Company from June 6, 2005 to October 7, 2005 and Vice President, Engineering and Quality Assurance of The Lincoln Electric Company from 2000 to June 6, 2005.Gretchen A. Farrell47Senior Vice President, Human Resources and Compliance since July 30, 2009; Vice President, Human Resources from May 5, 2005 to July 30, 2009 and Vice President, Human Resources of The Lincoln Electric Company since March 5, 2003.Thomas A. Flohn49Vice President; President, Lincoln Asia Pacific since January 1, 2005 and Vice President of Sales and Marketing, Lincoln Electric Asia Pacific from May 1, 1999 to December 31, 2004.David M. LeBlanc45Senior Vice President, President Lincoln Electric International since July 30, 2009; Vice President; President, Lincoln Electric Europe and Russia from March 10, 2008 to July 30, 2009; Vice President; President Lincoln Electric Europe from September 1, 2005 to March 10, 2008 and Vice President; President, Lincoln Electric Latin America from January 1, 2002 to August 31, 2005.The Company has been advised that there is no arrangement or understanding among any one of the officers listed and any other persons pursuant to which he or she was elected as an officer. The executive officers serve at the pleasure of the Board of Directors.COMPENSATION ITEM 11.EXECUTIVE COMPENSATION20102013 proxy statement.35Except for the information set forth below regarding our equity plans, the information required by this item is incorporated by reference from the 2010 proxy statement. Number of Securities
to be Issued
Upon Exercise of
Outstanding Options
(a) Weighted
Average
Exercise Price of
Outstanding
Options
(b) Number of Securities
Remaining Available for
Future Issuance Under Equity
Compensation
Plans (Excluding
Securities Reflected
in Column (a))
(c) 2,016,327 $ 45.49 3,264,886 — — — 2,016,327 $ 45.49 3,264,886 For further information on the Company’s equity compensation plans see Note 1 and Note 7 to the Company’s consolidated financial statements included in Item 8.ITEM 13.CERTAIN RELATIONSHIPS AND RELATED TRANSACTIONS, AND DIRECTOR INDEPENDENCE20102013 proxy statement.20102013 proxy statement.ITEM 14. PRINCIPAL ACCOUNTANT FEES AND SERVICESThe information required by this item is incorporated by reference from the 2013 proxy statement.PART IVITEM 15.EXHIBITS AND FINANCIAL STATEMENT SCHEDULESITEM 15. EXHIBITS AND FINANCIAL STATEMENT SCHEDULES(a)(1) Financial StatementsThe following consolidated financial statements of the Company are included in a separate section of this report following the signature page and certifications:Report of Independent Registered Public Accounting FirmReport of Independent Registered Public Accounting Firm on Internal Control Over Financial ReportingConsolidated Balance Sheets — – December 31, 20092012 and 20082011Consolidated Statements of Income —– Years ended December 31, 2009, 20082012, 2011 and 20072010Consolidated Statements of Shareholders’ Equity —Comprehensive Income – Years ended December 31, 2009, 20082012, 2011 and 20072010Consolidated Statements of Equity – Years ended December 31, 2012, 2011 and 2010Consolidated Statements of Cash Flows —– Years ended December 31, 2009, 20082012, 2011 and 20072010Notes to Consolidated Financial Statements(a)(2) Financial Statement SchedulesThe following consolidated financial statement schedule of the Company is included in a separate section of this reportfollowing the signature page:Schedule II —– Valuation and Qualifying AccountsAll other schedules for which provision is made in the applicable accounting regulation of the Securities and ExchangeCommission are not required under the related instructions or are inapplicable, and therefore, have been omitted.3633(a)(3) Exhibits 3.1 Amended and Restated Articles of Incorporation of Lincoln Electric Holdings, Inc. (filed as Annex BExhibit 3.1 to Form S-48-K of Lincoln Electric Holdings, Inc., Registration No. 333-50435, filed on April 17, 1998,September 27, 2011, SEC file No. 0-1402 and incorporated herein by reference and made a part hereof).3.2 Amended and Restated Code of Regulations of Lincoln Electric Holdings, Inc. (as Amended on November 3, 2009) (filed as Exhibit 3.2 to Form 10-Q of Lincoln Electric Holdings, Inc. for the three months ended September 30, 2009, SEC File No. 0-014020-1402 and incorporated herein by reference and made a part hereof).10.1 Amended and Restated Credit Agreement, dated November 18, 2009as of July 26, 2012, by and among Lincoln Electric Holdings, Inc., The Lincoln Electric Company, Lincoln Electric International Holding Company, J.W. Harris Co., Inc., Vernon Tool Co.Techalloy, Inc., Ltd.Wayne Trail Technologies, Inc., Lincoln Global, Inc., the financial institutions listed in Annex A thereof,Lenders and KeyBank National Association, as Letter of Credit Issuer and Administrative Agent (filed as Exhibit 10.1 to Form 8-K of Lincoln Electric Holdings, Inc. filed on November 20, 2009,July 31, 2012, SEC File No. 0-1402 and incorporated herein by reference and made a part hereof).10.2Note Purchase Agreement dated March 12, 2002 between Lincoln Electric Holdings, Inc. and The Lincoln Electric Company and the Purchasers listed in Schedule A thereof (filed as Exhibit 10(q) to Form 10-Q of Lincoln Electric Holdings, Inc. for the three months ended March 31, 2002, SEC File No. 0-1402 and incorporated herein by reference and made a part hereof).10.3Amended and Restated Note Purchase and Private Shelf Agreement between Lincoln Electric Holdings, Inc., The Lincoln Electric Company and The Prudential Insurance Company of America dated as of April 30, 2002 (filed as Exhibit 10(v) to Form 10-Q of Lincoln Electric Holdings, Inc. for the three months ended June 30, 2002, SEC File No. 0-1402 and incorporated herein by reference and made a part hereof).10.4Amendment No. 1 to the Amended and Restated Note Purchase and Private Shelf Agreement dated as of December 14, 2006 (filed as Exhibit 10(d) to Form 10-K of Lincoln Electric Holdings, Inc. for the year ended December 31, 2006, SEC File No. 0-1402 and incorporated herein by reference and made a part hereof).10.5* 10.2* 1998 Stock Plan (Amended, Restated and Renamed as of May 1, 2003) (filed as Appendix B to the Lincoln Electric Holdings, Inc. proxy statement dated March 31, 2003, SEC File No. 0-1402 and incorporated herein by reference and made a part hereof). 10.6* 10.3* Amendment No. 1 to the 1998 Stock Plan (Amended, Restated and Renamed Effective May 1, 2003) dated October 20, 2006 (filed as Exhibit 10.6 to Form 10-K of Lincoln Electric Holdings, Inc. for the year ended December 31, 2007, SEC File No. 0-1402 and incorporated herein by reference and made a part hereof). 10.7* 10.4* 1988 Incentive Equity Plan (filed as Exhibit 28 to the Form S-8 Registration Statement of The Lincoln Electric Company, SEC File No. 33-25209 and incorporated herein by reference and made a part hereof) as adopted and amended by Lincoln Electric Holdings, Inc. pursuant to an Instrument of Adoption and Amendment dated December 29, 1998 (filed as Exhibit 10(d) to Form 10-K of Lincoln Electric Holdings, Inc. for the year ended December 31, 1998, SEC File No. 0-1402 and incorporated herein by reference and made a part hereof). 10.8* 10.5* Amendment No. 2 to the 1988 Incentive Equity Plan dated October 20, 2006 (filed as Exhibit 10.8 to Form 10-K of Lincoln Electric Holdings, Inc. for the year ended December 31, 2007, SEC File No. 0-1402 and incorporated herein by reference and made a part hereof). 10.9* Form of Indemnification Agreement (filed as Exhibit A to The Lincoln Electric Company 1987 proxy statement, SEC File No. 0-1402, and incorporated herein by reference and made a part hereof).37Exhibit No.Description10.10* 10.6* Supplemental Executive Retirement Plan (Amended and Restated as of December 31, 2008) (filed as Exhibit 10.1 to Form 8-K of Lincoln Electric Holdings, Inc. filed on January 7, 2009, SEC File No. 0-1402 and incorporated herein by reference and made part hereof). 10.11* Deferred Compensation Plan for Executives (Amended and Restated as of January 1, 2004) (filed as Exhibit 10(h) to Form 10-K of Lincoln Electric Holdings, Inc. for the year ended December 31, 2003, SEC File No. 0-1402 and incorporated herein by reference and made a part hereof).10.12* Amendment No. 1 to the Deferred Compensation Plan for Executives (Amended and Restated as of January 1, 2004) (filed as Exhibit 10.2 to Form 8-K of Lincoln Electric Holdings, Inc. on February 1, 2005, SEC File No. 0-1402 and incorporated herein by reference and made a part hereof).10.13* Instrument of Termination of the Deferred Compensation Plan for Executives (filed as Exhibit 10.2 to Form 8-K of Lincoln Electric Holdings, Inc. filed on January 4, 2006, SEC File No. 0-1402 and incorporated herein by reference and made a part hereof).10.14* 10.7* Deferred Compensation Plan for Certain Retention Agreements and Other Contractual Arrangements (Amended and Restated as of January 1, 2004) (filed as Exhibit 10(i) to Form 10-K of Lincoln Electric Holdings, Inc. for the year ended December 31, 2003, SEC File No. 0-1402 and incorporated herein by reference and made a part hereof). 10.15* 10.8* Non-Employee Directors’Directors' Deferred Compensation Plan (Amended and Restated as of December 31, 2008) (filed as Exhibit 10.3 to Form 8-K of Lincoln Electric Holdings, Inc. filed on January 7, 2009, SEC File No. 0-1402 and incorporated herein by reference and made a part hereof).10.9* 2005 Deferred Compensation Plan for Executives (Amended and Restated as of August 1, 2011) (filed as Exhibit 10.1 to Form 8-K of Lincoln Electric Holdings, Inc. filed on August 4, 2011, SEC File No. 0-1402 and incorporated herein by reference and made a part hereof). 10.16* 10.10* Description of Management Incentive Plan (filed as Exhibit 10(e) to Form 10-K of The Lincoln Electric Company for the year ended December 31, 1995, SEC File No. 0-1402 and incorporated herein by reference and made a part hereof). 10.17* 10.11* Description of Long-Term Performance Plan (filed as Exhibit 10(f) to Form 10-K of The Lincoln Electric Company for the year ended December 31, 1997, SEC File No. 0-1402 and incorporated herein by reference and made a part hereof). 10.18* 10.12* Form of Severance Agreement (as entered into by the Company and the following executive officers: Messrs. Stropki, Mapes, Petrella, Stueber, LeBlanc and Flohn)Blankenship) (filed as Exhibit 10.1 to Form 10-Q of Lincoln Electric Holdings, Inc. for the three months ended June 30, 2009, SEC File No. 0-1402 and incorporated herein by reference and made a part hereof).10.19* 10.13* Stock Option Plan for Non-Employee Directors (filed as Exhibit 10(p) to Form 10-Q of Lincoln Electric Holdings, Inc. for the three months ended March 31, 2000, SEC File No. 0-1402 and incorporated herein by reference and made a part hereof). 10.20* 10.14* Amendment No. 1 to the Stock Option Plan for Non-Employee Directors dated October 20, 2006 (filed as Exhibit 10.26 to Form 10-K of Lincoln Electric Holdings, Inc. for the year ended December 31, 2007, SEC File No. 0-1402 and incorporated herein by reference and made a part hereof). 10.21* 10.15* Summary of Cash Long-Term Incentive Plan, as amended (filed as Exhibit 10.1 to Form 8-K of Lincoln Electric Holdings, Inc. filed on April 6, 2005, SEC File No. 0-1402 and incorporated herein by reference and made a part hereof). 3410.22* 10.16* Letter Agreement between John M. Stropki, Jr. and Lincoln Electric Holdings, Inc. dated October 12, 2004 (filed as Exhibit 10.1 to Form 8-K of Lincoln Electric Holdings, Inc. filed on October 18, 2004, SEC File No. 0-1402 and incorporated herein by reference and made a part hereof). 10.23* 2005 Deferred Compensation Plan for Executives (Amended and Restated as of December 31, 2008) (filed as Exhibit 10.2 to Form 8-K of Lincoln Electric Holdings, Inc. filed on January 7, 2009, SEC File No. 0-1402 and incorporated herein by reference and made a part hereof).38Exhibit No.Description10.24*10.17* 2006 Equity and Performance Incentive Plan (Restated as of March 3, 2011) (filed as Appendix BAnnex A to the Lincoln Electric Holdings, Inc. proxy statement dated March 28, 2006,18, 2011, SEC File No. 0-1402 and incorporated herein by reference and made a part hereof).10.25*Amendment No. 1 to the 2006 Equity and Performance Incentive Plan dated October 20, 2006 (filed as Exhibit 10.1 to Form 10-Q of Lincoln Electric Holdings, Inc. for the three months ended March 31, 2007, SEC File No. 0-1402 and incorporated herein by reference and made a part hereof).10.26*Amendment No. 2 to the 2006 Equity and Performance Incentive Plan (filed as Exhibit 10.5 to Form 8-K of Lincoln Electric Holdings, Inc. filed on January 7, 2009, SEC File No. 0-1402 and incorporated herein by reference and made a part hereof).10.27*10.18* 2006 Stock Plan for Non-Employee Directors (filed as Appendix C to the Lincoln Electric Holdings, Inc. proxy statement dated March 28, 2006, SEC File No. 0-1402 and incorporated herein by reference and made a part hereof). 10.28*10.19* Amendment No. 1 to the 2006 Stock Plan for Non-Employee Directors dated October 20, 2006 (filed as Exhibit 10.2 to Form 10-Q of Lincoln Electric Holdings, Inc. for the three months ended March 31, 2007, SEC file No. 0-1402 and incorporated herein by reference and made a part hereof). 10.29*10.20* Amendment No. 2 to the 2006 Stock Plan for Non-Employee Directors dated July 26, 2007 (filed as Exhibit 10.1 to Form 10-Q of Lincoln Electric Holdings, Inc. for the three months ended September 30, 2007, SEC file No. 0-1402 and incorporated herein by reference and made a part hereof). 10.30*10.21* 2007 Management Incentive Compensation Plan (Amended and Restated as of December 31, 2008) (filed as Exhibit 10.4 to Form 8-K of Lincoln Electric Holdings, Inc. filed on January 7, 2009, SEC File No. 0-1402 and incorporated herein by reference and made a part hereof). 10.22* Form of Restricted Shares Agreement for Non-Employee Directors (filed as Exhibit 10.1 to Form 10-Q of Lincoln Electric Holdings, Inc. for the three months ended September 30, 2010, SEC File No. 0-1402 and incorporated herein by reference and made a part hereof). 10.23* Form of Restricted Shares Agreement for Executive Officers (filed as Exhibit 10.2 to Form 10-Q of Lincoln Electric Holdings, Inc. for the three months ended September 30, 2010, SEC File No. 0-1402 and incorporated herein by reference and made a part hereof). 10.24* Form of Stock Option Agreement for Non-Employee Directors (filed as Exhibit 10.3 to Form 10-Q of Lincoln Electric Holdings, Inc. for the three months ended September 30, 2010, SEC File No. 0-1402 and incorporated herein by reference and made a part hereof). 10.25* Form of Stock Option Agreement for Executive Officers (filed as Exhibit 10.4 to Form 10-Q of Lincoln Electric Holdings, Inc. for the three months ended September 30, 2010, SEC File No. 0-1402 and incorporated herein by reference and made a part hereof). 10.26* Form of Restricted Shares Agreement for Non-Employee Directors (for awards made on or after December 1, 2010) (filed as Exhibit 10.35 to Form 10-K of the Lincoln Electric Holdings, Inc. for the year ended December 31, 2010, SEC File No. 0-1402 and incorporated herein by reference and made a part hereof). 10.27* Form of Restricted Shares Agreement for Executive Officers (for awards made on or after December 1, 2010) (filed as Exhibit 10.36 to Form 10-K of the Lincoln Electric Holdings, Inc. for the year ended December 31, 2010, SEC File No. 0-1402 and incorporated herein by reference and made a part hereof). 10.28* Form of Stock Option Agreement for Executive Officers (for awards made on or after December 1, 2010) (filed as Exhibit 10.37 to Form 10-K of the Lincoln Electric Holdings, Inc. for the year ended December 31, 2010, SEC File No. 0-1402 and incorporated herein by reference and made a part hereof). 10.29* Form of Restricted Stock Unit Agreement for Executive Officers (filed as Exhibit 10.2 to Form 8-K of Lincoln Electric Holdings, Inc. filed on August 4, 2011, SEC File No. 0-1402 and incorporated herein by reference and made a part thereof). 10.30* Form of Officer Indemnification Agreement (effective February 23, 2012) (filed as Exhibit 10.1 to Form 8-K of Lincoln Electric Holdings, Inc. filed on February 29, 2012, SEC File No. 0-1402 and incorporated herein by reference and made a part hereof).10.31* Form of Director Indemnification Agreement (effective February 23, 2012) (filed as Exhibit 10.1 to Form 8-K of Lincoln Electric Holdings, Inc. filed on February 29, 2012, SEC File No. 0-1402 and incorporated herein by reference and made a part hereof).21 Subsidiaries of the Registrant. 23 Consent of Independent Registered Public Accounting Firm. 24 Powers of Attorney. 31.1 Certification by the President and Chief Executive Officer pursuant to Rule 13a-14(a) of the Securities Exchange Act of 1934. 31.2 Certification by the Senior Vice President, Chief Financial Officer and Treasurer pursuant to Rule 13a-14(a) of the Securities Exchange Act of 1934. 32.1 Certifications pursuant to 18 U.S.C. Section 1350, as adopted pursuant to Section 906 of the Sarbanes-Oxley Act of 2002. 101.INS XBRL Instance Document 35101.SCH XBRL Taxonomy Extension Schema Document 101.CAL XBRL Taxonomy Extension Calculation Linkbase Document 101.LAB XBRL Taxonomy Extension Label Linkbase Document 101.PRE XBRL Taxonomy Extension Presentation Linkbase Document 101.DEF XBRL Taxonomy Extension Definition Linkbase Document * Reflects management contract or other compensatory arrangement required to be filed as an exhibit pursuant to Item 15(b) of this report. 3936SIGNATURESPursuant to the requirements of Section 13 or 15(d) of the Securities Exchange Act of 1934, the registrant has duly caused this report to be signed on its behalf by the undersigned, thereunto duly authorized.LINCOLN ELECTRIC HOLDINGS, INC. By: Vincent K. PetrellaSenior Vice President, Chief FinancialOfficer and Treasurer(principal financial and accounting officer)February 22, 201020134037Pursuant to the requirements of the Securities Exchange Act of 1934, this report has been signed below by the following persons on behalf of the registrant and in the capacities and on the dates indicated.JOHN M. STROPKI, JR. John M. Stropki, Jr., Chairman of theBoard, Christopher L. Mapes,President and Chief Executive (principal(principal executive officer)February 22, 20102013 Vincent K. Petrella,Senior Vice President, Chief Financial Officer andTreasurer (principal financial and accounting officer)February 22, 20102013/s/ VINCENT K. PETRELLA John M. Stropki, Jr.,Executive Chairman of the BoardFebruary 22, 2013 Vincent K. Petrella asAttorney-in-Fact forHarold L. Adams, DirectorFebruary 22, 2013 /s/ VINCENT K. PETRELLA Vincent K. Petrella asAttorney-in-Fact forHarold L. Adams, DirectorFebruary 22, 2010 Vincent K. Petrella asAttorney-in-Fact forDavid H. Gunning, DirectorFebruary 22, 2010Vincent K. Petrella as
Attorney-in-Fact for
Curtis E. Espeland
February 22, 2013 Vincent K. Petrella asAttorney-in-Fact forDavid H. Gunning, DirectorFebruary 22, 2013 /s/ VINCENT K. PETRELLA Vincent K. Petrella asAttorney-in-Fact forStephen G. Hanks, DirectorFebruary 22, 2010 Vincent K. Petrella asAttorney-in-Fact forKathryn Jo Lincoln, DirectorFebruary 22, 2010Vincent K. Petrella as
Attorney-in-Fact for
Stephen G. Hanks, Director
February 22, 2013 Vincent K. Petrella asAttorney-in-Fact forRobert J. Knoll, DirectorFebruary 22, 2013 /s/ VINCENT K. PETRELLA Vincent K. Petrella asAttorney-in-Fact forRobert J. Knoll, DirectorFebruary 22, 2010 Vincent K. Petrella asAttorney-in-Fact forHellene S. Runtagh, DirectorFebruary 22, 2010Vincent K. Petrella asAttorney-in-Fact forG. Russell Lincoln, DirectorFebruary 22, 2013 Vincent K. Petrella as
Attorney-in-Fact for
Kathryn Jo Lincoln, Director
February 22, 2013 /s/ VINCENT K. PETRELLA /s/ VINCENT K. PETRELLA Vincent K. Petrella asAttorney-in-Fact forG. Russell Lincoln, DirectorFebruary 22, 2010Vincent K. Petrella asAttorney-in-Fact forWilliam E. MacDonald, III, DirectorFebruary 22, 20102013Vincent K. Petrella asAttorney-in-Fact forHellene S. Runtagh, DirectorFebruary 22, 2013 /s/ VINCENT K. PETRELLA Vincent K. Petrella asAttorney-in-Fact forGeorge H. Walls, Jr., DirectorFebruary 22, 20102013 Vincent K. Petrella asAttorney-in-Fact forChristopher L. Mapes, DirectorFebruary 22, 20104138REPORT OF INDEPENDENT REGISTERED PUBLIC ACCOUNTING FIRMReport of Independent Registered Public Accounting FirmThe Board of Directors and Shareholders of Lincoln Electric Holdings, Inc.We have audited the accompanying consolidated balance sheets of Lincoln Electric Holdings, Inc. and subsidiaries as of December 31, 20092012 and 2008,2011, and the related consolidated statements of income, shareholders’comprehensive income, equity, and cash flows for each of the three years in the period ended December 31, 2009.2012. Our audits also included the financial statement schedule listed in the Index as Item 15 (a) (2). These financial statements and schedule are the responsibility of the Company’sCompany's management. Our responsibility is to express an opinion on these financial statements and schedule based on our audits.We conducted our audits in accordance with the standards of the Public Company Accounting Oversight Board (United States). Those standards require that we plan and perform the audit to obtain reasonable assurance about whether the financial statements are free of material misstatement. An audit includes examining, on a test basis, evidence supporting the amounts and disclosures in the financial statements. An audit also includes assessing the accounting principles used and significant estimates made by management, as well as evaluating the overall financial statement presentation. We believe that our audits provide a reasonable basis for our opinion.In our opinion, the financial statements referred to above present fairly, in all material respects, the consolidated financial position of Lincoln Electric Holdings, Inc. and subsidiaries at December 31, 20092012 and 2008,2011, and the consolidated results of their operations and their cash flows for each of the three years in the period ended December 31, 2009,2012, in conformity with U.S. generally accepted accounting principles. Also, in our opinion, the related financial statement schedule, when considered in relation to the basic financial statements taken as a whole, presents fairly in all material respects, the information set forth therein.As discussed in Note 1 to the consolidated financial statements, in 2009 the Company changed its method of accounting for business combinations and noncontrolling interests. Also as discussed in Note 9 to the consolidated financial statements, in 2007 the Company changed its method of accounting for uncertain tax positions.We also have audited, in accordance with the standards of the Public Company Accounting Oversight Board (United States), Lincoln Electric Holdings, Inc. and subsidiaries’subsidiaries' internal control over financial reporting as of December 31, 2009,2012, based on criteria established in Internal Control-Integrated Framework issued by the Committee of Sponsoring Organizations of the Treadway Commission and our report dated February 22, 20102013 expressed an unqualified opinion thereon./s/ ERNSTErnst & YOUNGYoung LLPCleveland, OhioFebruary 22, 2010F-1REPORT OF INDEPENDENT REGISTERED PUBLIC ACCOUNTING FIRMReport of Independent Registered Public Accounting FirmThe Board of Directors and Shareholders of Lincoln Electric Holdings, Inc.We have audited Lincoln Electric Holdings, Inc. and subsidiaries’subsidiaries' internal control over financial reporting as of December 31, 2009,2012, based on criteria established in Internal Control —– Integrated Framework issued by the Committee of Sponsoring Organizations of the Treadway Commission (the COSO criteria). Lincoln Electric Holdings, Inc. and subsidiaries’subsidiaries' management is responsible for maintaining effective internal control over financial reporting, and for its assessment of the effectiveness of internal control over financial reporting included in the accompanying Management’sManagement's Report on Internal Control over Financial Reporting in Item 9A. Our responsibility is to express an opinion on the company’scompany's internal control over financial reporting based on our audit.We conducted our audit in accordance with the standards of the Public Company Accounting Oversight Board (United States). Those standards require that we plan and perform the audit to obtain reasonable assurance about whether effective internal control over financial reporting was maintained in all material respects. Our audit included obtaining an understanding of internal control over financial reporting, assessing the risk that a material weakness exists, testing and evaluating the design and operating effectiveness of internal control based on the assessed risk, and performing such other procedures as we considered necessary in the circumstances. We believe that our audit provides a reasonable basis for our opinion.A company’scompany's internal control over financial reporting is a process designed to provide reasonable assurance regarding the reliability of financial reporting and the preparation of financial statements for external purposes in accordance with generally accepted accounting principles. A company’scompany's internal control over financial reporting includes those policies and procedures that (1) pertain to the maintenance of records that, in reasonable detail, accurately and fairly reflect the transactions and dispositions of the assets of the company; (2) provide reasonable assurance that transactions are recorded as necessary to permit preparation of financial statements in accordance with generally accepted accounting principles, and that receipts and expenditures of the company are being made only in accordance with authorizations of management and directors of the company; and (3) provide reasonable assurance regarding prevention or timely detection of unauthorized acquisition, use, or disposition of the company’scompany's assets that could have a material effect on the financial statements.Because of its inherent limitations, internal control over financial reporting may not prevent or detect misstatements. Also, projections of any evaluation of effectiveness to future periods are subject to the risk that controls may become inadequate because of changes in conditions, or that the degree of compliance with the policies or procedures may deteriorate.In our opinion, Lincoln Electric Holdings, Inc. and subsidiaries maintained, in all material respects, effective internal control over financial reporting as of December 31, 2009,2012, based on the COSO criteria.criteria.We also have audited, in accordance with the standards of the Public Company Accounting Oversight Board (United States), the consolidated balance sheets of Lincoln Electric Holdings, Inc. and subsidiaries as of December 31, 20092012 and 2008,2011, and the related consolidated statements of income, shareholders’comprehensive income, equity, and cash flows for each of the three years in the period ended December 31, 20092012 of Lincoln Electric Holdings, Inc. and subsidiaries and our report dated February 22, 20102013 expressed an unqualified opinion thereon./s/ ERNSTErnst & YOUNGYoung LLPCleveland, OhioFebruary 22, 2010F-2LINCOLN ELECTRIC HOLDINGS, INC.CONSOLIDATED BALANCE SHEETS(In thousands of dollars) December 31, 2009 2008 $ 388,136 $ 284,332 273,700 299,171 69,048 94,112 32,727 49,692 153,968 203,128 255,743 346,932 23,779 16,725 82,188 77,566 1,023,546 1,024,726 42,823 38,745 291,444 258,736 683,037 643,056 1,017,304 940,537 557,243 512,635 460,061 427,902 1,921 2,716 22,899 62,358 81,774 65,262 39,554 36,187 29,077 29,843 26,326 47,397 20,134 22,414 221,685 266,177 $ 1,705,292 $ 1,718,805 December 31, 2012 2011 ASSETS Current Assets Cash and cash equivalents $ 286,464 $ 361,101 Accounts receivable (less allowance for doubtful accounts of $8,654 in 2012; $7,079 in 2011) 360,662 386,197 Inventories Raw materials 119,963 117,194 Work-in-process 41,805 42,103 Finished goods 203,122 213,941 Total inventory 364,890 373,238 Deferred income taxes 16,670 15,102 Other current assets 104,130 83,632 Total Current Assets 1,132,816 1,219,270 Property, Plant and Equipment Land 44,510 42,891 Buildings 343,867 322,626 Machinery and equipment 732,461 724,801 1,120,838 1,090,318 Less accumulated depreciation 634,602 619,867 Property, Plant and Equipment, Net 486,236 470,451 Other Assets Equity investments in affiliates 24,606 24,618 Intangibles, net 132,902 94,471 Goodwill 132,903 65,101 Long-term investments 31,187 30,176 Deferred income taxes 44,639 57,568 Other non-current assets 104,574 15,121 Total Other Assets 470,811 287,055 TOTAL ASSETS $ 2,089,863 $ 1,976,776 See notes to these consolidated financial statements.F-3LINCOLN ELECTRIC HOLDINGS, INC.CONSOLIDATED BALANCE SHEETS(In thousands of dollars, except share data) December 31, 2009 2008 $ 34,577 $ 19,436 100,052 124,388 36,486 47,405 28,941 25,173 22,430 13,305 3,014 3,248 11,885 11,444 59,296 80,986 1,290 31,257 297,971 356,642 87,850 91,537 139,670 188,160 16,679 8,553 53,388 40,323 24,059 23,617 321,646 352,190 — — 4,929 4,929 159,440 155,538 1,239,004 1,236,810 (149,404 ) (218,254 ) (181,623 ) (183,807 ) 1,072,346 995,216 13,329 14,757 1,085,675 1,009,973 $ 1,705,292 $ 1,718,805 December 31, 2012 2011 LIABILITIES AND EQUITY Current Liabilities Amounts due banks $ 18,220 $ 19,922 Trade accounts payable 209,647 176,312 Accrued employee compensation and benefits 68,698 55,670 Accrued expenses 29,420 30,243 Accrued taxes, including income taxes 45,505 21,964 Accrued pensions 3,639 10,348 Dividends payable — 14,186 Customer advances 26,335 15,473 Other current liabilities 38,347 45,428 Current portion of long-term debt 456 81,496 Total Current Liabilities 440,267 471,042 Long-Term Liabilities Long-term debt, less current portion 1,599 1,960 Accrued pensions 216,189 232,175 Deferred income taxes 8,349 17,606 Accrued taxes 35,550 35,693 Other long-term liabilities 29,588 25,058 Total Long-Term Liabilities 291,275 312,492 Shareholders' Equity Preferred shares, without par value – at stated capital amount; authorized – 5,000,000 shares; issued and outstanding – none — — Common shares, without par value – at stated capital amount; authorized – 240,000,000 shares; issued – 98,581,434 shares in 2012 and 2011; outstanding – 82,944,817 shares in 2012 and 83,757,366 shares in 2011 9,858 9,858 Additional paid-in capital 205,124 179,104 Retained earnings 1,682,668 1,484,393 Accumulated other comprehensive loss (235,400 ) (247,881 ) Treasury shares, at cost – 15,636,617 shares in 2012 and 14,824,068 shares in 2011 (319,877 ) (248,528 ) Total Shareholders' Equity 1,342,373 1,176,946 Non-controlling interests 15,948 16,296 Total Equity 1,358,321 1,193,242 TOTAL LIABILITIES AND EQUITY $ 2,089,863 $ 1,976,776 See notes to these consolidated financial statements.F-4LINCOLN ELECTRIC HOLDINGS, INC.CONSOLIDATED STATEMENTS OF INCOME(In thousands, of dollars, except per share data) Year Ended December 31, 2009 2008 2007 $ 1,729,285 $ 2,479,131 $ 2,280,784 1,273,017 1,758,980 1,633,218 456,268 720,151 647,566 333,395 405,376 370,122 29,897 19,371 (188 ) 92,976 295,404 277,632 3,462 8,845 8,294 (5,025 ) 6,034 9,838 3,589 1,681 2,823 (8,521 ) (12,155 ) (11,430 ) (6,495 ) 4,405 9,525 86,481 299,809 287,157 37,905 87,523 84,421 $ 48,576 $ 212,286 $ 202,736 42,391 42,648 42,899 243 406 493 42,634 43,054 43,392 $ 1.15 $ 4.98 $ 4.73 $ 1.14 $ 4.93 $ 4.67 $ 1.09 $ 1.02 $ 0.91 Year Ended December 31, 2012 2011 2010 Net sales $ 2,853,367 $ 2,694,609 $ 2,070,172 Cost of goods sold 1,986,711 1,957,872 1,506,353 Gross profit 866,656 736,737 563,819 Selling, general & administrative expenses 495,221 439,775 377,773 Rationalization and asset impairment charges (gains) 9,354 282 (384 ) Operating income 362,081 296,680 186,430 Other income (expense): Interest income 3,988 3,121 2,381 Equity earnings in affiliates 5,007 5,385 3,171 Other income 2,685 2,849 1,817 Interest expense (4,191 ) (6,704 ) (6,691 ) Total other income (expense) 7,489 4,651 678 Income before income taxes 369,570 301,331 187,108 Income taxes 112,354 84,318 54,898 Net income including non-controlling interests 257,216 217,013 132,210 Non-controlling interests in subsidiaries' (loss) earnings (195 ) (173 ) 1,966 Net income $ 257,411 $ 217,186 $ 130,244 Basic earnings per share $ 3.10 $ 2.60 $ 1.54 Diluted earnings per share $ 3.06 $ 2.56 $ 1.53 Cash dividends declared per share $ 0.710 $ 0.635 $ 0.575 See notes to these consolidated financial statements.F-5LINCOLN ELECTRIC HOLDINGS, INC.CONSOLIDATED STATEMENTS OF SHAREHOLDERS’ EQUITY(In thousands, except per share data) Common
Shares
Outstanding Common
Stock Additional
Paid-In
Capital Retained
Earnings Accumulated
Other
Comprehensive
Income (Loss) Treasury
Shares Total 42,806 $ 4,929 $ 137,315 $ 906,074 $ (54,568 ) $ (140,689 ) $ 853,061 202,736 202,736 17,704 17,704 (2,989 ) (2,989 ) 55,779 55,779 (229 ) (229 ) 273,001 (39,120 ) (39,120 ) 378 8,939 8,673 17,612 (222 ) (15,459 ) (15,459 ) (429 ) (1,590 ) (2,019 ) 42,962 4,929 145,825 1,068,100 15,697 (147,475 ) 1,087,076 212,286 212,286 (142,422 ) (142,422 ) 842 842 (92,419 ) (92,419 ) 48 48 (21,665 ) (43,576 ) (43,576 ) 301 9,713 6,005 15,718 (741 ) (42,337 ) (42,337 ) 42,522 4,929 155,538 1,236,810 (218,254 ) (183,807 ) 995,216 48,576 48,576 21,287 21,287 1,444 1,444 46,968 46,968 (849 ) (849 ) 117,426 (46,382 ) (46,382 ) 123 3,902 2,527 6,429 (8 ) (343 ) (343 ) 42,637 $ 4,929 $ 159,440 $ 1,239,004 $ (149,404 ) $ (181,623 ) $ 1,072,346 Year Ended December 31, 2012 2011 2010 Net income including non-controlling interests $ 257,216 $ 217,013 $ 132,210 Other comprehensive income, net of tax: Unrealized (loss) gain on derivatives designated and qualifying as cash flow hedges, net of tax of $(201) in 2012; $264 in 2011; $302 in 2010 (832 ) 1,264 292 Defined pension plan activity, net of tax of $3,492 in 2012; $47,413 in 2011; $893 in 2010 (6,475 ) (79,936 ) (2,024 ) Currency translation adjustment 19,635 (26,773 ) 9,874 Other comprehensive income (loss) 12,328 (105,445 ) 8,142 Comprehensive income 269,544 111,568 140,352 Comprehensive (loss) income attributable to non-controlling interests (348 ) 315 2,652 Comprehensive income attributable to shareholders $ 269,892 $ 111,253 $ 137,700 See notes to these consolidated financial statements.F-6LINCOLN ELECTRIC HOLDINGS, INC.CONSOLIDATED STATEMENTS OF CASH FLOWS(In thousands, of dollars) Year Ended December 31, 2009 2008 2007 $ 48,576 $ 212,286 $ 202,736 2,940 19,371 (188 ) 56,598 56,925 52,610 8,554 (3,235 ) (7,208 ) (7,090 ) 7,367 (3,711 ) 5,432 4,738 4,679 (1,742 ) (958 ) (1,121 ) 25,064 1,706 4,690 2,027 4,758 (5,146 ) 60,913 30,130 (20,723 ) 127,739 (27,845 ) 36,011 10,222 (27,450 ) 2,354 (30,364 ) (26,768 ) (3,333 ) (22,778 ) 37,040 (1,798 ) (39,185 ) (25,975 ) (9,794 ) 3,444 (4,641 ) (226 ) 250,350 257,449 249,832 (38,201 ) (72,426 ) (61,633 ) (25,449 ) (44,036 ) (18,773 ) (488 ) — — 557 662 701 (63,581 ) (115,800 ) (79,705 ) 22,241 19,504 6,550 (34,779 ) (7,849 ) (1,004 ) (416 ) (5,551 ) (2,720 ) 531 1,352 — (31,405 ) (1,033 ) (40,142 ) 705 7,201 8,644 195 3,728 4,289 (343 ) (42,337 ) (15,459 ) (45,801 ) (42,756 ) (37,744 ) (89,072 ) (67,741 ) (77,586 ) 6,107 (6,958 ) 4,629 103,804 66,950 97,170 284,332 217,382 120,212 $ 388,136 $ 284,332 $ 217,382 CommonSharesOutstanding CommonShares AdditionalPaid-InCapital RetainedEarnings AccumulatedOtherComprehensiveIncome (Loss) TreasuryShares Non-controllingInterests Total Balance at December 31, 2009 85,274 $ 9,858 $ 154,511 $ 1,239,004 $ (149,404 ) $ (181,623 ) $ 13,329 $ 1,085,675 Net income 130,244 1,966 132,210 Unrecognized amounts from defined benefit pension plans, net of tax (2,024 ) (2,024 ) Unrealized gain on derivatives designated and qualifying as cash flow hedges, net of tax 292 292 Currency translation adjustment 9,188 686 9,874 Cash dividends declared – $0.575 per share (48,696 ) (48,696 ) Issuance of shares under benefit plans 374 7,936 3,893 11,829 Purchase of shares for treasury (1,406 ) (39,682 ) (39,682 ) Balance at December 31, 2010 84,242 9,858 162,447 1,320,552 (141,948 ) (217,412 ) 15,981 1,149,478 Net income 217,186 (173 ) 217,013 Unrecognized amounts from defined benefit pension plans, net of tax (79,936 ) (79,936 ) Unrealized gain on derivatives designated and qualifying as cash flow hedges, net of tax 1,264 1,264 Currency translation adjustment (27,261 ) 488 (26,773 ) Cash dividends declared – $0.635 per share (53,345 ) (53,345 ) Issuance of shares under benefit plans 593 16,657 5,881 22,538 Purchase of shares for treasury (1,078 ) (36,997 ) (36,997 ) Balance at December 31, 2011 83,757 9,858 179,104 1,484,393 (247,881 ) (248,528 ) 16,296 1,193,242 Net income 257,411 (195 ) 257,216 Unrecognized amounts from defined benefit pension plans, net of tax (6,475 ) (6,475 ) Unrealized loss on derivatives designated and qualifying as cash flow hedges, net of tax (832 ) (832 ) Currency translation adjustment 19,788 (153 ) 19,635 Cash dividends declared – $0.710 per share (59,136 ) (59,136 ) Issuance of shares under benefit plans 985 26,020 9,669 35,689 Purchase of shares for treasury (1,797 ) (81,018 ) (81,018 ) Balance at December 31, 2012 82,945 $ 9,858 $ 205,124 $ 1,682,668 $ (235,400 ) $ (319,877 ) $ 15,948 $ 1,358,321 See notes to these consolidated financial statements.F-7LINCOLN ELECTRIC HOLDINGS, INC.CONSOLIDATED STATEMENTS OF CASH FLOWS(In thousands) Year Ended December 31, 2012 2011 2010 CASH FLOWS FROM OPERATING ACTIVITIES Net income $ 257,411 $ 217,186 $ 130,244 Non-controlling interests in subsidiaries' (loss) earnings (195 ) (173 ) 1,966 Net income including non-controlling interests 257,216 217,013 132,210 Adjustments to reconcile Net income including non-controlling interests to Net cash provided by operating activities: Rationalization and asset impairment charges (gains) 1,740 23 (4,391 ) Depreciation and amortization 65,334 62,051 57,357 Equity loss (earnings) in affiliates, net 160 (1,971 ) (600 ) Deferred income taxes (2,137 ) 15,139 4,387 Stock-based compensation 8,961 6,610 8,213 Amortization of terminated interest rate swaps (430 ) (1,867 ) (1,867 ) Pension expense 35,515 26,370 29,123 Pension contributions and payments (69,646 ) (36,322 ) (47,205 ) Other, net 3,118 2,858 (1,491 ) Changes in operating assets and liabilities, net of effects from acquisitions: Decrease (increase) in accounts receivable 57,759 (67,518 ) (47,958 ) Decrease (increase) in inventories 28,286 (51,679 ) (28,912 ) (Increase) decrease in other current assets (9,506 ) (2,857 ) 4,956 Increase in accounts payable 16,110 8,672 47,323 Increase in other current liabilities 21,887 20,838 8,836 Net change in other long-term assets and liabilities (86,883 ) (3,842 ) (3,003 ) NET CASH PROVIDED BY OPERATING ACTIVITIES 327,484 193,518 156,978 CASH FLOWS FROM INVESTING ACTIVITIES Capital expenditures (52,715 ) (65,813 ) (60,565 ) Acquisition of businesses, net of cash acquired (134,602 ) (66,229 ) (18,856 ) Proceeds from sale of property, plant and equipment 1,387 1,246 10,021 Other investing activities (1,541 ) — — NET CASH USED BY INVESTING ACTIVITIES (187,471 ) (130,796 ) (69,400 ) CASH FLOWS FROM FINANCING ACTIVITIES Proceeds from short-term borrowings 2,518 23,224 13,319 Payments on short-term borrowings (4,293 ) (15,446 ) (12,896 ) Amounts due banks, net (2,758 ) 1,203 (19,022 ) Proceeds from long-term borrowings 918 909 150 Payments on long-term borrowings (85,688 ) (1,941 ) (8,730 ) Proceeds from exercise of stock options 18,776 11,351 3,508 Tax benefit from exercise of stock options 7,819 2,916 1,210 Purchase of shares for treasury (81,018 ) (36,997 ) (39,682 ) Cash dividends paid to shareholders (73,112 ) (51,935 ) (47,364 ) Other financing activities — 3,346 — NET CASH USED BY FINANCING ACTIVITIES (216,838 ) (63,370 ) (109,507 ) Effect of exchange rate changes on cash and cash equivalents 2,188 (4,444 ) (14 ) DECREASE IN CASH AND CASH EQUIVALENTS (74,637 ) (5,092 ) (21,943 ) Cash and cash equivalents at beginning of year 361,101 366,193 388,136 CASH AND CASH EQUIVALENTS AT END OF YEAR $ 286,464 $ 361,101 $ 366,193 See notes to these consolidated financial statements.F-8LINCOLN ELECTRIC HOLDINGS, INC.NOTES TO CONSOLIDATED FINANCIAL STATEMENTS(InDollars in thousands, of dollars, except share and per share data)amounts)NOTE 1 – SIGNIFICANT ACCOUNTING POLICIESPrinciples of ConsolidationThe consolidated financial statements include the accounts of Lincoln Electric Holdings, Inc., and its wholly-owned and majority-owned subsidiaries for which it has a controlling interest (the “Company”"Company") after elimination of all intercompanyinter-company accounts, transactions and profits.Subsequent EventsCumulative inflationGeneral InformationThe Company is a manufacturer of welding, cutting and brazing products. Welding products include arc welding power sources, wire feeding systems, robotic welding packages, fume extraction equipment, consumable electrodes and fluxes. The Company's product offering also includes CNC plasma and oxy-fuel cutting systems, regulators and torches used in oxy-fuel welding, cutting and brazing and consumables used in the brazing and soldering alloys market.Translation of Foreign CurrenciesAsset and liability accounts are translated into U.S. dollars using exchange rates in effect at the dates of the Consolidated Balance Sheets; revenue and expense accounts are translated at average monthly exchange rates. Translation adjustments are reflected as a component of Total equity. For subsidiaries operating in highly inflationary economies, both historical and current exchange rates are used in translating balance sheet accounts, and translation adjustments are included in Net income.The translation of assets and liabilities originally denominated in foreign currencies into U.S. dollars is for consolidation purposes, and does not necessarily indicate that the Company could realize or settle the reported value of those assets and liabilities in U.S. dollars. Additionally, such a translation does not necessarily indicate that the Company could return or distribute the reported U.S. dollar value of the net equity of its foreign operations to shareholders.Foreign currency transaction losses are included in Selling, general & administrative expenses and were $4,608, $4,904 and $118 in 2012, 2011 and 2010, respectively.Venezuela over the preceding three-year period reached 100% during the fourth quarter of 2009.– Highly Inflationary EconomyVenezuela is a highly inflationary economy under U.S. generally accepted accounting principles ("GAAP"). As a result, the financial statements of the Company's Venezuelan operation are reported under highly inflationary accounting rules as of January 1, 2010. Under highly inflationary accounting, the financial statements of the Company's Venezuelan operation have been remeasured into the Company's reporting currency and exchange gains and losses from the re-measurement of monetary assets and liabilities are reflected in current earnings. In remeasuring the financial statements, the official exchange rate for non-essential goods of 4.3 bolivars to the U.S. dollar (the "Non-Essential Rate") is used as this is the rate expected to be applicable to dividend repatriations.Future impacts to earnings of applying highly inflationary accounting for Venezuela on the Company's consolidated financial statements will be dependent upon movements in the applicable exchange rates between the bolivar and the U.S. dollar and the amount of monetary assets and liabilities included in the Company's Venezuelan operation's balance sheet. The bolivar-denominated monetary net asset position was $31,545 at December 31, 2012 and $6,826 at December 31, 2011. The increased exposure was due to the limited opportunities to convert bolivars into U.S. dollars.In 2010, the Company changedparticipated in Venezuelan sovereign debt offerings as a means of converting bolivars to U.S. dollars. The conversion of bolivars to U.S. dollars through Venezuelan sovereign debt offerings generated foreign currency transaction losses as the functional currencydebt was purchased at the Non-Essential Rate and subsequently sold at a discount. During 2010, the Company acquired $7,672 of its Venezuelan subsidiarysovereign debt at the Non-Essential Rate, which was immediately sold at a discount for $6,022. The sale of the Venezuelan sovereign debt resulted in a loss of $1,650 recognized in Selling, general and administrative expenses.The devaluation of the bolivar and the change to the U.S. dollar as the functional currency resulted in a foreign currency transaction gain of January 1,$2,632 in Selling, general & administrative expenses and higher Cost of goods sold of $5,755 due to the liquidation of inventory valued at the historical exchange rate for the year ended December 31, 2010. During January 2010,On February 8, 2013, the Venezuelan government announced the devaluation of the official exchange rate used for most foreignits currency transactions common to the Company’s Venezuelan subsidiary from 2.15 to 4.30 Bolivarsrelative to the U.S. dollar.Company’s Venezuelan subsidiary’s net Bolivar denominated monetary liability positionNon-Essential Rate moved from gainforeign currency transaction charge of approximately $2,500$8,500 in Selling, general & administrative expenses. This charge will be recognized during the first quarter of 2010. The Company also expects that its Venezuelan subsidiary’s results of operations will decrease significantly in 2010 due to the new exchange rate.2013. The impact of selling inventories carried at the previous exchange rate is expectedF-9LINCOLN ELECTRIC HOLDINGS, INC.NOTES TO CONSOLIDATED FINANCIAL STATEMENTS (Continued)(Dollars in thousands, except share and per share amounts)to decrease gross profit by approximately $5,000.Management has evaluated and disclosed all material events occurring subsequentdate of the financial statements up to February 22, 2010, the filing date of this Annual Report on Form 10-K.Cash EquivalentsThe Company considers all highly liquid investments with a maturity of three months or less when purchased to be cash equivalents.Accounts ReceivableThe Company maintains an allowance for doubtful accounts for estimated losses from the failure of its customers to make required payments for products delivered. The Company estimates this allowance based on the age of the related receivable, knowledge of the financial condition of customers, review of historical receivables and reserve trends and other pertinent information. If the financial condition of customers deteriorates or an unfavorable trend in receivable collections is experienced in the future, additional allowances may be required. Historically, the Company’sCompany's reserves have approximated actual experience.InventoriesInventories are valued at the lower of cost or market. Fixed manufacturing overhead costs are allocated to inventory based on normal production capacity and abnormal manufacturing costs are recognized as period costs. For most domestic inventories, cost is determined principally by the last-in, first-out (“LIFO”("LIFO") method, and for non-U.S. inventories, cost is determined by the first-in, first-out (“FIFO”("FIFO") method. At December 31, 2009 and 2008, approximately 31% and 35%, respectively, of total inventories were valued using the LIFO method. The excess of current cost over LIFO cost amounted to $62,447 at December 31, 2009 and $90,914 at December 31, 2008. A reduction in inventory levels resulted in a decrease to the LIFO reserve of $14,254.Reserves are maintained for estimated obsolescence or excess inventory equal to the difference between the cost of inventory and the estimated market value based upon assumptions about future demand and market conditions. Historically, the Company’sCompany's reserves have approximated actual experience.F-8LINCOLN ELECTRIC HOLDINGS, INC.NOTES TO CONSOLIDATED FINANCIAL STATEMENTS — (Continued)NOTE 1 – SIGNIFICANT ACCOUNTING POLICIES (continued)Equity InvestmentsInvestments in businesses in which the Company does not have a controlling interest and holds between a 20% and 50% ownership interest are accounted for using the equity method of accounting on a one-month lag basis. The Company’s Company's 50% ownership interest in equity investments includes investments in Turkey and Chile. The amount of retained earnings that represents undistributed earnings of 50% or less owned equity investments was $12,619$15,034 at December 31, 20092012 and $26,875$15,190 at December 31, 2008. The decrease from the prior year is due to the acquisition of a business in China in which the Company previously held a non-controlling interest and the related divestiture of a non-controlling interest in Taiwan. See Note 2 for additional information.Property, Plant and EquipmentProperty, plant and equipment are stated at cost and include improvements which significantly increase capacities or extend the useful lives of existing plant and equipment. Depreciation and amortization are computed using a straight-line method over useful lives ranging from three to 20 years for machinery, tools and equipment, and up to 50 years for buildings. Net gains or losses related to asset dispositions are recognized in earnings in the period in which dispositions occur.The following table summarizes assets held under capital leases and included in property, plant and equipment: December 31, 2009 2008 $ 6,663 $ 6,421 982 1,561 (2,184 ) (2,257 ) $ 5,461 $ 5,725 Routine maintenance, repairs and replacements are expensed as incurred. The Company capitalizes interest costcosts associated with long-term construction in progress.Goodwill and IntangiblesThe Company performs an annual impairment testGoodwill is recorded when the cost of acquired businesses exceeds the fair value of the identifiable net assets acquired. Intangible assets other than goodwill are recorded at fair value at the time acquired or at cost, if applicable. Intangible assets that do not have indefinite lives are amortized in line with the pattern in which the economic benefits of the intangible asset are consumed. If the pattern of economic benefit cannot be reliably determined, the intangible assets are amortized on a straight-line basis over the shorter of the legal or estimated life.Goodwill and indefinite-lived intangibleintangibles assets are not amortized, but are tested for impairment in the fourth quarter using the same dates each year or more frequently if changes in circumstances or the occurrence of events indicate potential impairment. The fair value of each indefinite-lived intangible asset is compared to its carrying value and an impairment charge is recorded if the carrying value exceeds the fair value. Goodwill is tested by comparing the fair value of each reporting unit with its carrying value. If the carrying value of the reporting unit exceeds its fair value, the implied value of goodwill is compared to its carrying value and impairment is recognized to the extent that the carrying value exceeds the implied fair value.Fair values are determined using established business valuation multiples and models developed by the Company which incorporate allocations of certain assets and cash flows among reporting units, estimates of market participant assumptions of future cash flows, future growth rates and the applicable discount rates to value estimated cash flows. Changes in economic and operating conditions impacting these assumptions could result in asset impairments in future periods.In 2009, the Company determined that certain indefinite-lived intangible assets were impaired and recognized an impairment charge of $879 to reduce the carrying value of these intangible assets to fair value and assigned definite lives to two of the intangible assets on a prospective basis.F-9F-10LINCOLN ELECTRIC HOLDINGS, INC.NOTES TO CONSOLIDATED FINANCIAL STATEMENTS — (Continued)NOTE 1 – SIGNIFICANT ACCOUNTING POLICIES (continued)In 2008, the Company determined that the carrying value of goodwill at two businesses(Dollars in China exceeded the implied value of goodwillthousands, except share and the Company recognized an impairment charge of $13,194. In addition, the Company determined that two indefinite-lived intangible assets were impaired. per share amounts)Long-Lived AssetsThe Company recognized an impairment charge of $1,342 to reduce the carrying value of these intangible assets to fair value and assigned a definite life to these intangible assets on a prospective basis.The changes in the carrying amount of goodwill by reportable segment for the years ended December 31, 2009 and 2008 were as follows: North
America
Welding Europe
Welding Asia
Pacific
Welding South
America
Welding The Harris
Products
Group Consolidated $6,212 $10,817 $12,387 $538 $12,773 $42,727 (1,118 ) 20 3,413 — 7,890 10,205 — — (13,194 ) — — (13,194 ) (327 ) (2,116 ) 879 (56 ) (1,931 ) (3,551 ) 4,767 8,721 3,485 482 18,732 36,187 (3 ) — 1,429 — (1,044 ) 382 229 571 — 49 2,136 2,985 $4,993 $9,292 $4,914 $531 $19,824 $39,554 Additions and adjustments to goodwill primarily reflect goodwill recognized in the acquisitions of Harris Soldas Especiais S.A. and Vernon Tool Company, Ltd. in 2008 and Jinzhou Jin Tai Welding and Metal Co, Ltd. (“Jin Tai”) in 2009 (See Note 2).Gross intangible assets other than goodwill by asset class as of December 31, 2009 and 2008 were as follows: December 31, 2009 2008 Gross
Amount Accumulated
Amortization Gross
Amount Accumulated
Amortization $30,001 $6,928 $26,973 $6,342 32,647 4,038 23,900 2,331 14,912 2,653 13,095 2,192 30,078 12,245 23,289 11,130 $107,638 $25,864 $87,257 $21,995 Intangible assets other than goodwill are recorded at fair value at the time acquired or at cost, if applicable. Intangible assets that do not have indefinite lives are amortized on a straight-line basis over the shorter of the legal or estimated life. Included in the above table are trademarks and trade names with indefinite lives totaling $17,071 and $16,960 at December 31, 2009 and 2008, respectively.The weighted average amortization period for trademarks and trade names, customer relationships, patents and other intangibles is 16, 19, 20 and 18 years, respectively. Aggregate amortization expense was $4,524, $3,432 and $2,349 for 2009, 2008 and 2007, respectively. Estimated annual amortization expense for intangible assets for each of the next five years is $5,128 in 2010, $4,983 in 2011, $4,927 in 2012, $4,365 in 2013 and $3,746 in 2014.F-10LINCOLN ELECTRIC HOLDINGS, INC.NOTES TO CONSOLIDATED FINANCIAL STATEMENTS — (Continued)NOTE 1 – SIGNIFICANT ACCOUNTING POLICIES (continued)Long-lived AssetsThe Company periodically evaluates whether current facts or circumstances indicate that the carrying value of its depreciable long-lived assets to be held and used may not be recoverable. If such circumstances are determined to exist, an estimate of undiscounted future cash flows produced by the long-lived asset, or the appropriate grouping of assets, is compared to the carrying value to determine whether impairment exists. If an asset is determined to be impaired, a loss is recognized to the extent that carrying value exceeds fair value. Fair value is measured based on quoted market prices in active markets, if available. If quoted market prices are not available, the estimate of fair value is based on various valuation techniques, including the discounted value of estimated future cash flows.Fair Value MeasurementsFinancial assets and liabilities, such as the Company's defined benefit pension plan assets and derivative contracts, are valued at fair value using the market and income valuation approaches. Fair value is defined as the price that would be received to sell an asset or paid to transfer a liability in an orderly transaction between market participants at the measurement date (exit price). The Company uses the market approach to value similar assets and liabilities in active markets and the income approach that consists of discounted cash flow models that take into account the present value of future cash flows under the terms of the contracts using current market information as of the reporting date. The following hierarchy is used to classify the inputs used to measure fair value:Level 1 Inputs to the valuation methodology are unadjusted quoted prices for identical assets or liabilities in active markets. Level 2 Inputs to the valuation methodology include: • Quoted prices for similar assets or liabilities in active markets; • Quoted prices for identical or similar assets or liabilities in inactive markets; • Inputs other than quoted prices that are observable for the asset or liability; and • Inputs that are derived principally from or corroborated by observable market data by correlation or other means. If the asset or liability has a specific (contractual) term, the Level 2 input must be observable for substantially the full term of the asset or liability. Level 3 Inputs to the valuation methodology are unobservable and significant to the fair value measurement. Product WarrantiesThe Company accrues for product warranty claims based on historical experience and the expected material and labor costs to provide warranty service. Warranty services are provided for periods up to three years from the date of sale. The accrual for product warranty claims is included in “Accrued"Accrued expenses.”The changes in the carrying amount of product warranty accruals for 2009, 2008 and 2007 were as follows: December 31, 2009 2008 2007 $ 13,736 $ 12,308 $ 9,373 11,359 14,022 12,460 (8,718 ) (11,974 ) (9,988 ) 391 (620 ) 463 $ 16,768 $ 13,736 $ 12,308 Warranty expense was 0.7%, 0.6% and 0.5% of sales for 2009, 2008 and 2007, respectively.Revenue RecognitionThe Company recognizes revenueSubstantially all of the Company's revenues are recognized when the risks and rewards of ownership and title to the product have transferred to the customer. Revenue is recognized in accordance with shipping termscustomer which is generally occurs at point of shipment. The Company recognizes any discounts, credits, returns, rebates and incentive programs based on reasonable estimates as a reduction of Sales to arrive at Net sales at the pointsame time the related revenue is recorded.For contracts accounted for under the percentage of shipment.Distribution CostsDistribution costs, including warehousing and freight related to product shipments, are included in “Cost"Cost of goods sold.”Stock-Based CompensationExpense is recognized for all awards of stock-based compensation by allocating the aggregate grant date fair value over the vesting period. No expense is recognized for any stock options, restricted or deferred shares or restricted stock units ultimately forfeited because the recipients fail to meet vesting requirements.F-11LINCOLN ELECTRIC HOLDINGS, INC.NOTES TO CONSOLIDATED FINANCIAL STATEMENTS — (Continued)NOTE 1 – SIGNIFICANT ACCOUNTING POLICIES (continued)Common stock issuable upon the exercise of employee stock options is excluded from the calculation of diluted earnings per share when the calculation of option equivalent shares is anti-dilutive. The calculation of diluted earningsF-11LINCOLN ELECTRIC HOLDINGS, INC.NOTES TO CONSOLIDATED FINANCIAL STATEMENTS (Continued)(Dollars in thousands, except share and per share excludes anti-dilutive shares of 709,512 in 2009, 232,044 in 2008 and 29,495 in 2007.Translation of Foreign CurrenciesAsset and liability accounts are translated into U.S. dollars using exchange rates in effect at the date of the consolidated balance sheet; revenue and expense accounts are translated at monthly exchange rates. Translation adjustments are reflected as a component of Shareholders’ equity. For subsidiaries operating in highly inflationary economies, both historical and current exchange rates are used in translating balance sheet accounts, and translation adjustments are included in net income.Foreign currency transaction losses are included in “Selling, general & administrative expenses” and were $226, $10,409 and $6,102 in 2009, 2008 and 2007, respectively.Financial InstrumentsThe Company uses forward contracts to hedge exposures to commodity prices and exchange rate fluctuations on certain purchase and sales transactions and balance sheet exposures. Contracts are generally written on a short-term basis but may cover exposures for up to two years and are not held for trading or speculative purposes. The Company uses interest rate swaps from time to time to hedge changes in the fair value of debt. The Company recognizes derivative instruments as either assets or liabilities at fair value. The accounting for changes in the fair value of derivative instruments depends on whether it has been designated and qualifies as part of a hedging relationship and on the type of hedging relationship.For derivative instruments that qualify as a fair value hedge (i.e., hedging the exposure to changes in the fair value of an asset or a liability), the gain or loss on the derivative instrument, as well as the offsetting loss or gain on the hedged item are recognized in earnings. For derivative instruments that qualify as a cash flow hedge (i.e., hedging the exposure to variability in expected future cash flows), the effective portion of the unrealized gain or loss on the derivative instrument is reported as a component of “Accumulated"Accumulated other comprehensive loss”loss" with offsetting amounts recorded as “Other"Other current assets,” “Other" "Other non-current assets,” “Other" "Other current liabilities”liabilities" or “Other"Other long-term liabilities”liabilities" depending on the position and the duration of the contract. At settlement, the realized gain or loss is reflected in earnings in the same period or periods during which the hedged transaction affects earnings. Any remaining gain or loss on the derivative instrument is recognized in earnings. For derivative instruments not designated as hedges, the gain or loss from changes in the fair value of the instruments is recognized in earnings. The Company does not hedge its net investments in foreign subsidiaries.Advertising CostsAdvertising costs are charged to “Selling,"Selling, general & administrative expenses” whenexpenses" as incurred and totaled $7,982, $10,337$12,376, $11,269 and $10,245$9,222 in 2009, 20082012, 2011 and 2007,2010, respectively.Research and DevelopmentResearch and development costs are charged to “Selling,"Selling, general & administrative expenses”expenses" as incurred and totaled $27,567, $26,736$37,305, $32,834 and $25,794$29,489 in 2009, 20082012, 2011 and 2007,2010, respectively.F-12LINCOLN ELECTRIC HOLDINGS, INC.NOTES TO CONSOLIDATED FINANCIAL STATEMENTS — (Continued)BonusNOTE 1 – SIGNIFICANT ACCOUNTING POLICIES (continued)Bonus“Selling,"Selling, general & administrative expenses”expenses" are the costs related to the Company’sCompany's discretionary employee bonus programs, which for certain U.S.- based employees are net of hospitalization costs. Bonus costs were $124,947 in 2012, $104,361 in 2011 and $73,197 in 2010.Income TaxesDeferred income taxes are recognized at currently enacted tax rates for certain U.S.-based employees,temporary differences between the financial reporting and income tax basis of $43,919 in 2009, $100,706 in 2008assets and $93,958 in 2007.EstimatesThe preparation of financial statements in conformity with U.S. generally accepted accounting principles (“GAAP”)GAAP requires management to make estimates and assumptions in certain circumstances that affect the amounts reported in the accompanying consolidated financial statements and notes. Actual results could differ from these estimates.ReclassificationCertain reclassifications have been made to prior year financial statements to conform to current year classifications.New Accounting PronouncementsNew Accounting Standards Adopted:In June 2009,September 2011, the Financial Accounting Standards Board (“FASB”("FASB") issued Accounting Standards Codification (“ASC”Update ("ASU") topic 105 (formerly StatementNo. 2011-08, "Intangibles – Goodwill and Other (Topic 350): Testing Goodwill for Impairment." ASU 2011-08 provides an entity the option to first assess qualitative factors to determine whether the existence of Financial Accounting Standards (“SFAS”) 168,“events or circumstance leads to the determination that it is more likely than not that the fair value of a reporting unit is less than its carrying amount. If the entity determines it is not more likely than not that the fair value is less than the carrying amount, then performing the two-step impairment test is unnecessary. However, if the entity concludes otherwise, it is required to perform the first step of the two-step impairment test. The FASB Accounting Standards Codificationamendments are effective for annual and the Hierarchy of Generally Accepted Accounting Principles”).ASC 105 established the FASB Accounting Standards Codification as the source of authoritative accounting principles recognizedinterim goodwill impairment tests performed for fiscal years beginning after December 15, 2011. ASU 2011-08 was adopted by the FASB to be applied by entities in the preparation of financial statements in conformity with GAAP. This pronouncement is effective for financial statements issued for interim and annual periods ending after September 15, 2009. The Company adopted this pronouncement in 2009. Adoption did not have a significant impact on the Company’s financial statements.In May 2009, the FASB issued ASC 855 (formerly SFAS 165, “Subsequent Events”). ASC 855 established general standards of accounting for disclosure of events that occur after the balance sheet date but before financial statements are issued or are available to be issued. In particular, ASC 855 sets forth the period after the balance sheet date during which management should evaluate events or transactions that may occur for potential recognition or disclosure in the financial statements, the circumstances under which an entity should recognize events or transactions occurring after the balance sheet date in its financial statements and the disclosures that an entity should make about events or transactions that occurred after the balance sheet date. ASC 855 was adopted in 2009January 1, 2012 and did not have a significant impact on the Company’sCompany's financial statements.In December 2008, the FASB issued ASC 715 (formerly FSP FAS 132(R)-1, “Employers’ Disclosures about Postretirement Benefit Plan Assets”). ASC 715 requires disclosure about an entity’s investment policies and strategies, the categories of plan assets, concentrations of credit risk and fair value measurements of plan assets. The standard, effective for fiscal years ending after December 15, 2009, resulted in increased disclosures in the notes to the Company’s financial statements related to the assets of the Company’s defined benefit pension plans.In November 2008, the FASB issued ASC 323-10 (formerly Emerging Issues Task Force (“EITF’) Issue 08-6, “Equity Method Investment Accounting Considerations”). ASC 323-10 addresses the impact that ASC 805 (formerly SFAS 141(R)), and ASC 810 (formerly SFAS 160), might have on the accounting for equity methodF-13F-12LINCOLN ELECTRIC HOLDINGS, INC.NOTES TO CONSOLIDATED FINANCIAL STATEMENTS — (Continued)NOTE 1 – SIGNIFICANT ACCOUNTING POLICIES (continued)investments including how the initial carrying value of an equity method investment should be determined, how it should be tested for impairment(Dollars in thousands, except share and how changes in classification from equity method to cost method should be treated. ASC 323-10 is to be implemented prospectively and is effective for fiscal years beginning after December 15, 2008. The adoption of ASC 323-10 did not have a significant impact on the Company’s financial statements.In June 2008,2011, the FASB issued ASC 260-10 (formerly FSP EITF 03-6-1,ASU No. 2011-05, “Determining Whether Instruments GrantedComprehensive Income (Topic 220): Presentation of Comprehensive Income.” This update provides amendments to Accounting Standards Codification (“ASC”) Topic 220, Comprehensive Income. ASU 2011-05 provides an entity the option to present the total of comprehensive income, the components of net income and the components of other comprehensive income either in Share-Based Payment Transactions Are Participating Securities”). ASC 260-10 determineda single continuous statement of comprehensive income or in two separate but consecutive statements. Under both options, an entity is required to present each component of net income along with total net income, each component of other comprehensive income along with a total for other comprehensive income and a total amount for comprehensive income. Further, ASU 2011-05 requires the presentation on the face of the financial statements items that unvested share-based payment awards that contain rightsare reclassified from other comprehensive income to receive nonforfeitable dividends or dividend equivalents (whether paid or unpaid) are participating securities, and thus, should be includednet income in the two-class methodstatement(s) where the components of computing earnings per share. This standard did not have a significant impact onnet income and the Company’s disclosurecomponents of earnings per share.In April 2008,other comprehensive income are presented. The amendment to present reclassification adjustments was deferred when the FASB issued ASC 275-10 and ASC 350-30 (formerly FSP 142-3, “Determination of the Useful Life of Intangible Assets”). These standards amend the factors thatASU 2011-12. ASU 2011-05 should be considered in developing renewal or extension assumptions used to determine the useful life of a recognized intangible asset under ASC 350 (formerly SFAS 142, “Goodwillapplied retrospectively and Other Intangible Assets”). ASC 275-10 and ASC 350-30 are effective for financial statements issued for fiscal years beginning after December 15, 2008 and interim periods within those fiscal years. ASC 275-10 and ASC 350-30 apply prospectively to intangible assets acquired after adoption. The adoption of ASC 275-10 and ASC 350-30 did not have a significant impact on the Company’s financial statements.In March 2008, the FASB issued ASC 815 (formerly SFAS 161, “Disclosures about Derivative Instruments and Hedging Activities”). ASC 815 requires disclosures of how and why an entity uses derivative instruments, how derivative instruments and related hedged items are accounted for and how derivative instruments and related hedged items affect an entity’s financial position, financial performance and cash flows. ASC 815 is effective for fiscal years beginning after November 15, 2008 with early adoption permitted. The Company adopted these provisions as of January 1, 2009. See Note 10 for the Company’s disclosures pursuant to adoption.In December 2007, the FASB issued ASC 810 (formerly SFAS 160, “Noncontrolling Interests in Consolidated Financial Statements”). ASC 810 clarifies that a noncontrolling interest in a subsidiary is an ownership interest in the consolidated entity that should be reported as equity in the consolidated financial statements. ASC 810 changes the way the consolidated statement of income is presented thus requiring consolidated net income to be reported at amounts that include the amounts attributable to both parent and the noncontrolling interest. This pronouncement is effective for fiscal years, and interim periods within those fiscal years, beginning on or after December 15, 2008.2011. The Company adopted these provisions as ofASU 2011-05, excluding deferred portions, on January 1, 2009, applying2012. Refer to the presentationconsolidated financial statements herein.In May 2011, the FASB issued ASU No. 2011-04, "Fair Value Measurement (Topic 820): Amendments to Achieve Common Fair Value Measurement and Disclosure Requirements in U.S. GAAP and IFRS's." ASU 2011-04 amends ASC Topic 820, resulting in common fair value measurement and disclosure requirements retrospectively resulting in reclassification of noncontrolling interests from “Other non-current liabilities” to “Total equity.” Income attributable to noncontrolling interests is included in “Selling, generalGAAP and administrative expenses” in the Consolidated Statements of Income and is not material to the Company. Therefore, the Company did not present income attributable to non-controlling interests separately in the Consolidated Statements of Income.In December 2007, the FASB issued ASC 805 (formerly SFAS 141 (revised 2007), “Business Combinations” which replaced SFAS 141, “Business Combinations”International Financial Reporting Standards ("IFRS"). ASC 805 retainsConsequently, the fundamentalamendments change the wording used to describe many of the requirements in SFAS 141 that the acquisition method of accounting (which SFAS 141 called the purchase method) be usedGAAP for all business combinationsmeasuring fair value and for an acquirerdisclosing information about fair value measurements. These amendments are to be identifiedapplied prospectively and are effective for each business combination. ASC 805 defines the acquirer as the entity that obtains control of one or more businesses in the business combinationfiscal years, and establishes the acquisition date as the date that the acquirer achieves control. ASC 805 requires an acquirer to recognize the assets acquired, the liabilities assumed and any noncontrolling interest in the acquiree at the acquisition dateF-14LINCOLN ELECTRIC HOLDINGS, INC.NOTES TO CONSOLIDATED FINANCIAL STATEMENTS — (Continued)NOTE 1 – SIGNIFICANT ACCOUNTING POLICIES (continued)measured at their fair values as of that date with limited exceptions specified in the statement. ASC 805 applies prospectively to business combinations for which the acquisition date is on or after theinterim periods within those years, beginning of the first annual reporting period beginning on or after December 15, 2008.New Accounting Standards to be Adopted:In January 2010,February 2013, the FASB issued Accounting Standards Update (“ASU”)ASU No. 2010-06,2013-02, “Fair Value Measurements and DisclosuresComprehensive Income (Topic 820) Improving Disclosures220): Reporting of Amounts Reclassified Out of Accumulated Other Comprehensive Income.” ASU 2013-02 requires an entity to provide information about Fair Value Measurements.”ASU 2010-06 amends ASC 820-10-50the amounts reclassified out of accumulated other comprehensive income by component. In addition, an entity is required to require additional informationpresent, either on the face of the statement where net income is presented or in the notes, significant amounts reclassified out of accumulated other comprehensive income by the respective line items of net income but only if the amount reclassified is required under U.S. GAAP to be disclosed principally with respectreclassified to Level 3 fair value measurements and transfers to and from Level 1 and Level 2 measurements;net income in addition, enhanced disclosureits entirety in the same reporting period. For other amounts, an entity is required concerning inputs and valuation techniques used to determine Level 2 and Level 3 fair value measurements.cross-reference to other disclosures required under U.S. GAAP that provide additional detail about those amounts. The new disclosures and clarifications of existing disclosures, as required by ASU 2010-06,amendments are effective prospectively for interim and annual reporting periods beginning after December 15, 2009, except for the disclosures about purchases, sales, issuances and settlements in the roll forward of activity in Level 3 fair value measurements. Those disclosures are effective for fiscal years beginning after December 15, 2010, and for interim periods within those fiscal years. Earlier application is permitted. ASU No. 2010-06 is not expected to have a significant impact on the Company’s financial statements.In December 2009, the FASB issued ASU No. 2009-17,“Consolidations (Topic 810) Improvements to Financial Reporting by Enterprises Involved with Variable Interest Entities an Amendment of the FASB Accounting Standards Codification.”In June 2009, the FASB issued ASC 810 (formerly SFAS 167,“Amendments to FASB Interpretation No. 46(R)”). The objective of ASC 810 is to amend certain requirements of FASB Interpretation 46 (R) (revised December 2003), “Consolidation of Variable Interest Entities,”to improve financial reporting by enterprises involved with variable interest entities and to provide more relevant and reliable information to users of financial statements. ASC 810 will be effective as of the beginning of each reporting entity’s first annual reporting period that begins after November 15, 2009, for interim periods within that first annual reporting period, and for interim and annual reporting periods thereafter. Earlier application is prohibited. ASU No. 2009-17 is not expected to have a significant impact on the Company’s financial statements.In December 2009, the FASB issued ASU No. 2009-16, “Transfers and Servicing (Topic 860) Accounting for Transfers of Financial Assets an Amendment of the FASB Accounting Standards Codification.”In June 2009, the FASB issued ASC 860,“Transfers and Servicing,” (formerly SFAS 166,“Accounting for Transfers of Financial Assets, an amendment of FASB Statement No. 140”). The objective of ASC 860 is to improve the relevance, representational faithfulness and comparability of the information that a reporting entity provides in its financial reports about a transfer of financial assets; the effects of a transfer on its financial position, financial performance and cash flows; and a transferor’s continuing involvement in transferred financial assets. ASC 860 must be applied as of the beginning of each reporting entity’s first annual reporting period that begins after November 15, 2009, for interim periods within that first annual reporting period and for interim and annual reporting periods thereafter. Earlier application is prohibited. ASU No. 2009-16 must be applied to transfers occurring on or after the effective date. ASU No. 2009-16 is not expected to have a significant impact on the Company’s financial statements.In October 2009, the FASB issued ASU No. 2009-13,“Revenue Recognition (Topic 605) Multiple-Deliverable Revenue Arrangements a consensus of the FASB Emerging Issues Task Force.” This update provides amendments to the criteria in Subtopic ASC 605-25. ASU No. 2009-13 provides principles for allocating consideration among multiple-elements and accounting for separate deliverables under an arrangement. ASC 605-25, as amended, introduces an estimated selling price method for valuing the elements of a bundled arrangement if vendor-specific objective evidence or third-party evidence of selling price is not available andF-15LINCOLN ELECTRIC HOLDINGS, INC.NOTES TO CONSOLIDATED FINANCIAL STATEMENTS — (Continued)NOTE 1 – SIGNIFICANT ACCOUNTING POLICIES (continued)significantly expands related disclosure requirements. This standard is effective on a prospective basis for revenue arrangements entered into or materially modified in fiscal years beginning on or after June 15, 2010. Alternatively, adoption may be on a retrospective basis and early application is permitted.2012. The Company is currently evaluating the impact of the adoption of ASU 2013-02 on the Company's financial statements.In July 2012, the FASB issued ASU No. 2009-13, but does2012-02, “Intangibles - Goodwill and Other (Topic 350): Testing Indefinite-Lived Intangible Assets for Impairment.” ASU 2012-02 permits an entity first to assess qualitative factors to determine whether it is more likely than not expectthat an indefinite-lived intangible asset is impaired as a basis for determining whether it is necessary to perform the quantitative impairment test in accordance with Subtopic 350-30, Intangibles - Goodwill and Other - General Intangibles Other than Goodwill. The more-likely-than-not threshold is defined as having a likelihood of more than 50 percent. In accordance with this update, an entity will have a significantan option not to calculate annually the fair value of an indefinite-lived intangible asset if the entity determines that it is not more likely than not that the asset is impaired. The amendments are effective for annual and interim impairment tests performed for fiscal years beginning after September 15, 2012. The Company is currently evaluating the impact of the adoption of ASU 2012-02 on the Company’sCompany's financial statements.In December 2011, the FASB issued ASU No. 2011-11, "Balance Sheet (Topic 210): Disclosures about Offsetting Assets and Liabilities." ASU 2011-11 requires an entity to disclose information about financial instruments and derivative instruments that are subject to offsetting, master netting or other similar arrangements, to illustrate the effect or potential effect of those arrangements on the Company's financial position. In January 2013, the FASB issued ASU No. 2013-01, “Balance Sheet (Topic 210): Clarifying the Scope of Disclosures about Offsetting Assets and Liabilities,” which clarifies the scope of ASU 2011-11. The amendments are effective for annual periods beginning on or after January 1, 2013 and interim periods within those annual periods. The amendments should be applied retrospectively for all prior periods presented. The Company is currently evaluating the impact of the adoption of ASU 2011-11 on the Company's financial statements.F-13LINCOLN ELECTRIC HOLDINGS, INC.NOTES TO CONSOLIDATED FINANCIAL STATEMENTS (Continued)(Dollars in thousands, except share and per share amounts)NOTE 2 - EARNINGS PER SHAREThe following table sets forth the computation of basic and diluted earnings per share: Year Ended December 31, 2012 2011 2010 Numerator: Net income $ 257,411 $ 217,186 $ 130,244 Denominator: Basic weighted average shares outstanding 83,087 83,681 84,407 Effect of dilutive securities - Stock options and awards 1,088 1,027 816 Diluted weighted average shares outstanding 84,175 84,708 85,223 Basic earnings per share $ 3.10 $ 2.60 $ 1.54 Diluted earnings per share $ 3.06 $ 2.56 $ 1.53 For the years ended December 31, 2012, 2011 and 2010, common shares subject to equity-based awards of 107,814, 626,135 and 1,504,346, respectively, were excluded from the computation of diluted earnings per share because the effect of their exercise would be anti-dilutive.NOTE 3 – ACQUISITIONSOn July 29, 2009,December 31, 2012, the Company completed the acquisition of 100% of Jin Tai,the privately-held automated systems and tooling manufacturer, Tennessee Rand, Inc. ("Tenn Rand"). Tenn Rand, based in Jinzhou, China. This transaction expandedChattanooga, Tennessee, is a leader in the design and manufacture of tooling and robotic systems for welding applications. The acquisition added tool design, system building and machining capabilities that will enable the Company to further expand its welding automation business. Annual sales for Tenn Rand in 2012 were approximately $35,000.On November 13, 2012, the Company completed the acquisition of the Kaliburn, Burny and Cleveland Motion Control businesses (collectively, "Kaliburn") from ITT Corporation. Kaliburn, headquartered in Ladson, South Carolina, is a designer and manufacturer of shape cutting solutions, producer of shape cutting control systems and manufacturer of web tension transducers and engineered machine systems. The acquisitions added to the Company's cutting business portfolio. Annual sales for Kaliburn at the date of acquisition were approximately $36,000.On May 17, 2012, the Company completed the acquisition of Wayne Trail Technologies, Inc. (“Wayne Trail”). Wayne Trail, based in Ft. Loramie, Ohio, is a manufacturer of automated systems and tooling, serving a wide range of applications in the metal processing market. The acquisition added to the Company’s customer basewelding and gaveautomated solutions portfolio. Annual sales for Wayne Trail at the date of acquisition were approximately $50,000.On March 6, 2012, the Company controlcompleted the acquisition of significant cost-competitive solid wire manufacturing capacity.The Company previously held a 21% direct interest in Jin Taiacquired Tenn Rand, Kaliburn, Wayne Trail and a further 27% indirect interest via its 35% interest in Taiwan-based Kuang Tai Metal Industrial Co., Ltd. (“Kuang Tai”). Under the terms of the agreement, the Company exchanged its 35% interest in Kuang Tai with a fair value of $22,723, paid cash of $35,531 and will pay an additional $4,181Weartech for approximately $143,504 in cash, over a three-year period after close.the Company’s previous non-controlling direct interestnet assets acquired was Jin Tai was $8,675. The carrying valuesgoodwill of $67,740. Some of the Company’s interestspurchase price allocations are preliminary and subject to final opening balance sheet adjustments.On July 29, 2011, the Company acquired substantially all of the assets of Techalloy Company, Inc. and certain assets of its parent company, Central Wire Industries Ltd. (collectively, "Techalloy"). Techalloy, based in Kuang TaiBaltimore, Maryland, was a privately-held manufacturer of nickel alloy and Jin Tai were $29,368 and $9,973, respectively.stainless steel welding consumables. The excess carrying value over fair value of these interests resulted in a loss on the transaction of $7,943 recorded in “Equity (loss) earnings in affiliates.”The Company previously reported its proportional share of Jin Tai’s net income under the equity method in “Equity (loss) earnings in affiliates.” Jin Tai’s sales were $186,774 in 2008 and $74,834 in 2009 prioracquisition added to the acquisition. Jin Tai’sCompany's consumables portfolio. Annual sales for Techalloy at the date of $53,956 after the acquisition were included in “Net sales” for 2009. The pro forma impact onapproximately On July 29, 2011, the results of operations if the acquisition had been completed asCompany acquired substantially all of the beginningassets of both 2009Applied Robotics, Inc. (d/b/a Torchmate) ("Torchmate"). Torchmate, based in Reno, Nevada, provides a wide selection of computer numeric controlled plasma cutter and 2008 would not have been significant.identifiable assets acquiredacquisition added to the Company's plasma and liabilities assumed uponoxy-fuel cutting product offering. Annual sales for Torchmate at the date of acquisition were approximately On March 11, 2011, the Company completed the acquisition of Jin TaiOOO Severstal-metiz: welding consumables ("Severstal"). Severstal is a leading manufacturer of welding consumables in Russia and was a subsidiary of OAO Severstal, one of the world's leading vertically integrated steel and mining companies. This acquisition expanded the Company's capacity and distribution channels in Russia and the Commonwealth of Independent States ("CIS"). Sales for Severstal during 2010 were as follows: July 29, 2009 $ 16,032 23,306 17,037 18,932 29,275 15,201 1,429 5,585 126,797 28,833 2,306 7,839 15,459 54,437 $ 72,360 F-16F-14LINCOLN ELECTRIC HOLDINGS, INC.NOTES TO CONSOLIDATED FINANCIAL STATEMENTS — (Continued)NOTE 2 – ACQUISITIONS (continued)All assets acquired(Dollars in thousands, except share and liabilities assumed were recorded at estimated fair value. Goodwill of $1,429 was allocated to the Asia Pacific Welding segment and is not deductible for income tax purposes under current tax law. Net assets acquired included a non-controlling interest in one of Jin Tai’s operations valued at $1,250. This non-controlling interest was subsequently acquired and accounted for as an equity transaction.On October 1, 2008,January 31, 2011, the Company acquired substantially all of the assets of SSCO Manufacturing, Inc. (d/b/a 90% interest inArc Products) ("Arc Products"). Arc Products was a leading Brazilianprivately-held manufacturer of brazing productsorbital welding systems and welding automation components based in Southern California. Orbital welding systems are designed to automatically weld pipe and tube in difficult to access locations and for mission-critical applications requiring high weld integrity and sophisticated quality monitoring capabilities. The acquisition will complement the Company's ability to serve global customers in the nuclear, power generation and process industries worldwide. Sales for Arc Products during 2010 were not significant.The Company acquired Techalloy, Torchmate, Severstal and Arc Products for approximately $24,000$65,321 in cash and assumed debt.debt and a contingent consideration liability fair valued at $3,806. The newly acquired company,contingent consideration is based in Sao Paulo, is being operated as Harris Soldas Especiais S.A. This acquisition expanded the Company’s brazing product line and increased the Company’s presence in the South American market. Annualupon estimated sales at the timerelated acquisition for the five-year period ending December 31, 2015 and will be paid in 2016 based on actual sales during the five-year period. The fair value of the acquisition were approximately $30,000.On April 7, 2008,October 29, 2010, the Company acquired all of the outstanding stock of Electro-Arco S.A. (“Electro-Arco”Mezhgosmetiz-Mtsensk OAO ("MGM"), a privately heldprivately-held welding wire manufacturer based in the Orel region of welding consumables headquartered near Lisbon, Portugal,Russia, for approximately $24,000$28,500 in cash and assumed debt. This acquisition addedrepresented the Company's first manufacturing operation in Russia as well as established distribution channels to serve the Company’s European consumables manufacturing capacitygrowing Russian and widened the Company’s commercial presence in Western Europe.CIS welding markets. Annual sales for MGM at the timedate of the acquisition were approximately $40,000.On November 30, 2007,Pro forma information related to these acquisitions has not been presented because the Company acquiredimpact on the assets and businessCompany's Consolidated Statements of Vernon Tool Company Ltd. (“Vernon Tool”), a privately held manufacturer of computer-controlled pipe cutting equipment used for precision fabrication purposes headquartered near San Diego, California, for approximately $12,434 in cash. This acquisition added to the Company’s ability to support its customers in the market for infrastructure development. Annual sales at the time of the acquisition were approximately $9,000.On November 29, 2007, the Company announced that it had entered into a majority-owned joint venture with Zhengzhou Heli Welding Materials Company Ltd. (“Zhengzhou Heli”), a privately held manufacturer of subarc flux based in Zhengzhou, China. The Company has contributed $16,400 to Zhengzhou Heli. Annual sales at the time of the acquisition were approximately $8,000.On July 20, 2007, the Company acquired Nanjing Kuang Tai Welding Materials Company, Ltd. (“Nanjing”), a manufacturer of stick electrode products based in Nanjing, China, for approximately $4,245 in cash and assumed debt. The Company previously owned 35% of Nanjing indirectly through its investment in Kuang Tai. Annual sales at the time of the acquisition were approximately $10,000.On March 30, 2007, the Company acquired all of the outstanding stock of Spawmet Sp. z o.o. (“Spawmet”), a privately held manufacturer of welding consumables headquartered near Katowice, Poland, for approximately $5,000 in cash. This acquisition provided the Company with a portfolio of stick electrode products and broadened its distributor network in Poland and Eastern Europe. Annual sales at the time of the acquisition were approximately $5,000.Company’sCompany's consolidated financial statements as of the date of acquisition.NOTE 4 – GOODWILL AND INTANGIBLESThe Company performs an annual impairment test of goodwill and indefinite-lived intangible assets in the fourth quarter using the same dates each year or more frequently if changes in circumstances or the occurrence of events indicate potential impairment. The fair value of each indefinite-lived intangible asset is compared to its carrying value and an impairment charge is recorded if the carrying value exceeds the fair value. Goodwill is tested by comparing the fair value of each reporting unit with its carrying value. If the carrying value of the reporting unit exceeds its fair value, the implied value of goodwill is compared to its carrying value and impairment is recognized to the extent that the carrying value exceeds the implied fair value.Fair values are determined using established business valuation multiples and models developed by the Company that incorporate allocations of certain assets and cash flows among reporting units, estimates of market participant assumptions of future cash flows, future growth rates and the applicable discount rates to value estimated cash flows. Changes in economic and operating conditions impacting these assumptions could result in asset impairments in future periods. The Company's annual impairment test of goodwill and indefinite-lived intangible assets in 2012 resulted in no impairment loss being recognized.The changes in the carrying amount of goodwill by reportable segment for the years ended December 31, 2012 and 2011 were as follows: NorthAmericaWelding EuropeWelding AsiaPacificWelding SouthAmericaWelding The HarrisProductsGroup Consolidated Balance as of January 1, 2011 $ 5,069 $ 16,379 $ 5,030 $ 565 $ 18,909 $ 45,952 Additions and adjustments 13,478 9,543 — — (1,247 ) 21,774 Foreign currency translation (33) (2,055 ) 178 (4 ) (711 ) (2,625 ) Balance as of December 31, 2011 18,514 23,867 5,208 561 16,951 65,101 Additions and adjustments 67,740 66 — — (1,109 ) 66,697 Foreign currency translation 23 1,424 40 53 (435 ) 1,105 Balance as of December 31, 2012 $ 86,277 $ 25,357 $ 5,248 $ 614 $ 15,407 $ 132,903 Additions to goodwill primarily reflect goodwill recognized in the acquisitions of Weartech, Wayne Trail, Kaliburn and Tenn Rand in 2012 and the acquisitions of Arc Products, Severstal, Torchmate and Techalloy in 2011 (see Note 3). Reductions to goodwill result from the tax benefit attributable to the amortization of tax deductible goodwill in excess of goodwill recorded for financial reporting purposes.F-15LINCOLN ELECTRIC HOLDINGS, INC.NOTES TO CONSOLIDATED FINANCIAL STATEMENTS (Continued)(Dollars in thousands, except share and per share amounts)Gross and net intangible assets other than goodwill by asset class as of December 31, 2012 and 2011 were as follows: December 31, 2012 WeightedAverage Life GrossAmount AccumulatedAmortization IndefiniteLived Assets Total Intangible,NetTrademarks and trade names 12 $ 30,611 $ 9,493 $ 18,276 $ 39,394 Customer relationships 16 63,906 12,099 — 51,807 Patents 19 20,882 5,103 — 15,779 Other 14 44,769 18,847 — 25,922 Total $ 160,168 $ 45,542 $ 18,276 $ 132,902 December 31, 2011 GrossAmount AccumulatedAmortization IndefiniteLived Assets Total Intangible,NetTrademarks and trade names $ 18,559 $ 8,020 $ 18,081 $ 28,620 Customer relationships 40,818 7,875 — 32,943 Patents 18,677 3,927 — 14,750 Other 33,148 14,990 — 18,158 Total $ 111,202 $ 34,812 $ 18,081 $ 94,471 Additions to gross and net intangible assets primarily reflect assets and related amortization recognized in the acquisitions of Weartech, Wayne Trail, Kaliburn and Tenn Rand in 2012. Aggregate amortization expense was $10,641, $6,661 and $5,390 for 2012, 2011 and 2010, respectively. Estimated annual amortization expense for intangible assets for each of the next five years is $12,282 in 2013, $10,512 in 2014, $10,099 in 2015, $9,320 in 2016 and $8,816 in 2017.NOTE 35 – SEGMENT INFORMATIONThe Company’sCompany's primary business is the design and manufacture of arc welding and cutting products, manufacturing a broad line of arc welding equipment, consumable welding products and other welding and cutting products. The Company also has a leading global position in the brazing and soldering alloys market.During the fourth quarter of 2009, the The Company realignedhas aligned its business units into Company’sCompany's worldwide resources and global end user and sourcing initiatives. The operatingF-17LINCOLN ELECTRIC HOLDINGS, INC.NOTES TO CONSOLIDATED FINANCIAL STATEMENTS — (Continued)NOTE 3 – SEGMENT INFORMATION (continued)threetwo welding segments include welding operations in Europe, Asia Pacific and South America, respectively. The fifth segment, The Harris Products Group, includes the Company’sCompany's global cutting, soldering and brazing businesses as well as the retail business in the United States. The segment information of prior periods has been recast to conform to the current segment presentation.Segment performance is measured and resources are allocated based on a number of factors, the primary profit measure being earnings before interest and income taxes (“EBIT”("EBIT"), as adjusted. Segment EBIT is adjusted for special items as determined by management such as the impact of rationalization activities, certain asset impairment charges and gains or losses on disposals of assets. The accounting principles applied at the operating segment level are generally the same as those applied at the consolidated financial statement level with the exception of LIFO. Segment assets include inventories measured on a FIFO basis while consolidated inventories are reported on a LIFO basis. Segment and consolidated income before interest and income taxes are reported on a LIFO basis. At December 31, 2009, 20082012, 2011 and 2007,2010, approximately 31%34%, 35%31% and 36%30%, respectively, of total inventories were valued using the LIFO method. LIFO is only used for certain domestic inventories included in the North America Welding segment. Inter-segment sales are recorded at agreed upon prices that approximate arm’sarm's length prices and are eliminated in consolidation. Corporate-level expenses are allocated to the operating segments on a basis that management believes to be reasonable. Certain corporate-level expenses may not be allocated to the operating segments and are reported as Corporate/Eliminations.F-18F-16LINCOLN ELECTRIC HOLDINGS, INC.NOTES TO CONSOLIDATED FINANCIAL STATEMENTS — (Continued)NOTE 3 – SEGMENT INFORMATION (continued)(Dollars in thousands, except share and per share amounts)Financial information for the reportable segments follows: North
America
Welding Europe
Welding Asia Pacific
Welding South
America
Welding The Harris
Products
Group Corporate /
Eliminations Consolidated $ 858,180 $ 346,383 $ 208,280 $ 99,171 $ 217,271 $ — $ 1,729,285 85,630 8,725 4,051 308 7,739 (106,453 ) — $ 943,810 $ 355,108 $ 212,331 $ 99,479 $ 225,010 $ (106,453 ) $ 1,729,285 $ 134,544 $ (2,196 ) $ (18,370 ) $ 10,648 $ 888 $ (3,344 ) $ 122,170 10,386 4,335 9,607 528 5,774 — 30,630 $ 124,158 $ (6,531 ) $ (27,977 ) $ 10,120 $ (4,886 ) $ (3,344 ) $ 91,540 3,462 (8,521 ) $ 86,481 $ 792,876 $ 379,449 $ 310,329 $ 81,734 $ 253,851 $ (112,947 ) $ 1,705,292 — 19,455 — 3,444 — — 22,899 13,726 7,543 15,887 796 2,457 (2,208 ) 38,201 31,097 9,779 9,397 1,543 4,642 140 56,598 $ 1,313,881 $ 538,570 $ 230,661 $ 116,061 $ 279,958 $ — $ 2,479,131 127,087 15,649 3,522 37 8,568 (154,863 ) — $ 1,440,968 $ 554,219 $ 234,183 $ 116,098 $ 288,526 $ (154,863 ) $ 2,479,131 $ 243,648 $ 55,998 $ 8,260 $ 9,984 $ 10,218 $ (5,618 ) $ 322,490 818 2,052 15,582 — 919 — 19,371 $ 242,830 $ 53,946 $ (7,322 ) $ 9,984 $ 9,299 $ (5,618 ) $ 303,119 8,845 (12,155 ) $ 299,809 $ 848,233 $ 428,690 $ 244,461 $ 81,093 $ 248,360 $ (132,032 ) $ 1,718,805 — 13,814 45,256 3,288 — — 62,358 39,486 13,956 14,788 2,172 2,406 (382 ) 72,426 32,383 11,065 6,631 1,501 5,145 200 56,925 $ 1,248,382 $ 474,388 $ 178,120 $ 101,426 $ 278,468 $ — $ 2,280,784 114,930 14,295 2,501 1,793 8,028 (141,547 ) — $ 1,363,312 $ 488,683 $ 180,621 $ 103,219 $ 286,496 $ (141,547 ) $ 2,280,784 $ 206,768 $ 57,495 $ (328 ) $ 8,804 $ 18,612 $ (1,246 ) $ 290,105 — — — — (188 ) — (188 ) $ 206,768 $ 57,495 $ (328 ) $ 8,804 $ 18,800 $ (1,246 ) $ 290,293 8,294 (11,430 ) $ 287,157 $ 859,828 $ 428,181 $ 215,946 $ 77,349 $ 229,973 $ (165,981 ) $ 1,645,296 — 16,154 40,787 2,782 — — 59,723 25,275 16,546 15,491 1,754 3,679 (1,112 ) 61,633 31,160 9,454 4,921 1,251 5,766 58 52,610 F-19 NorthAmericaWelding EuropeWelding AsiaPacificWelding SouthAmericaWelding The HarrisProductsGroup Corporate /Eliminations Consolidated For the Year Ended December 31, 2012 Net sales $ 1,580,818 $ 452,227 $ 324,482 $ 161,483 $ 334,357 $ — $ 2,853,367 Inter-segment sales 131,062 16,048 14,829 38 8,549 (170,526 ) $ — Total $ 1,711,880 $ 468,275 $ 339,311 $ 161,521 $ 342,906 $ (170,526 ) $ 2,853,367 EBIT, as adjusted $ 293,070 $ 37,299 $ 7,247 $ 18,301 $ 29,477 $ (4,886 ) $ 380,508 Special items charge (gain) 827 3,534 4,993 1,381 — — $ 10,735 EBIT $ 292,243 $ 33,765 $ 2,254 $ 16,920 $ 29,477 $ (4,886 ) $ 369,773 Interest income 3,988 Interest expense (4,191 ) Income before income taxes $ 369,570 Total assets $ 980,093 $ 451,654 $ 350,189 $ 134,650 $ 195,881 $ (22,604 ) $ 2,089,863 Equity investments in affiliates — 21,798 — 2,808 — — $ 24,606 Capital expenditures 36,834 5,372 8,833 899 831 (54 ) $ 52,715 Depreciation and amortization 33,479 11,008 15,102 1,878 3,934 (67 ) $ 65,334 For the Year Ended December 31, 2011 Net sales $ 1,309,499 $ 508,692 $ 376,276 $ 156,684 $ 343,458 $ — $ 2,694,609 Inter-segment sales 136,314 17,422 15,614 494 8,496 (178,340 ) $ — Total $ 1,445,813 $ 526,114 $ 391,890 $ 157,178 $ 351,954 $ (178,340 ) $ 2,694,609 EBIT, as adjusted $ 227,924 $ 36,171 $ 2,629 $ 12,895 $ 25,151 $ 426 $ 305,196 Special items charge (gain) — 392 (110 ) — — — $ 282 EBIT $ 227,924 $ 35,779 $ 2,739 $ 12,895 $ 25,151 $ 426 $ 304,914 Interest income 3,121 Interest expense (6,704 ) Income before income taxes $ 301,331 Total assets $ 771,315 $ 436,327 $ 380,282 $ 110,781 $ 181,916 $ 96,155 $ 1,976,776 Equity investments in affiliates — 20,500 — 4,118 — — $ 24,618 Capital expenditures 31,826 8,566 21,498 2,314 1,792 (183 ) $ 65,813 Depreciation and amortization 29,237 11,736 14,663 2,033 4,714 (332 ) $ 62,051 For the Year Ended December 31, 2010 Net sales $ 1,013,193 $ 359,925 $ 324,092 $ 117,419 $ 255,543 $ — $ 2,070,172 Inter-segment sales 108,849 13,330 12,546 1,216 6,641 (142,582 ) $ — Total $ 1,122,042 $ 373,255 $ 336,638 $ 118,635 $ 262,184 $ (142,582 ) $ 2,070,172 EBIT, as adjusted $ 162,192 $ 17,023 $ 1,752 $ 7,554 $ 12,311 $ (6,675 ) $ 194,157 Special items charge (gain) — 2,486 (3,741 ) 3,123 871 — $ 2,739 EBIT $ 162,192 $ 14,537 $ 5,493 $ 4,431 $ 11,440 $ (6,675 ) $ 191,418 Interest income 2,381 Interest expense (6,691 ) Income before income taxes $ 187,108 Total assets $ 611,725 $ 413,789 $ 350,975 $ 94,836 $ 193,474 $ 118,989 $ 1,783,788 Equity investments in affiliates — 19,194 — 3,715 — — $ 22,909 Capital expenditures 25,746 10,373 22,973 3,573 884 (2,984 ) $ 60,565 Depreciation and amortization 27,652 9,527 13,542 1,564 5,012 60 $ 57,357 F-17LINCOLN ELECTRIC HOLDINGS, INC.NOTES TO CONSOLIDATED FINANCIAL STATEMENTS — (Continued)(Dollars in thousands, except share and per share amounts)NOTE 3 – SEGMENT INFORMATION (continued)2009,2012, special items include net charges of $827, $3,637 and $3,151for rationalization actions in the North America Welding, segment a chargeEurope Welding and Asia Pacific Welding segments, respectively, primarily related to employee severance and other costs associated with the consolidation of $10,386 for rationalization actions.manufacturing operations. The Europe Welding segment includesspecial items also include a gain of $103 on the sale of assets. The Asia Pacific Welding segment special items also include a charge of $9,868$1,842 related to asset impairments. The South America Welding segment special item represents a charge of $1,381 related to a change in Venezuelan labor law, which provides for increased employee severance obligations.In 2011, special items include net charges of $188 and $93 for rationalization actions $134 in intangible asset impairment chargesthe Europe Welding and Asia Pacific Welding segments, respectively, primarily related to employee severance and other costs associated with the consolidation of manufacturing operations. The Europe Welding and Asia Pacific Welding segments special items also include a loss of $204 and a gain of $5,667$203, respectively, on the sale of assets at rationalized operations.In 2010, special items include a property.charge of $1,990 for rationalization actions and $496 in related asset impairment charges for the Europe Welding segment. The Asia Pacific Welding segment includes a gain of $4,555 related to the disposal of assets, a charge of $3,207$427 for rationalization actions a gain of $1,543 on the settlement of a pension obligation and a loss of $7,943 associated with the acquisition of Jin Tai and related divestiture of Kuang Tai.$387 in asset impairment charges. The South America Welding segment includes a net charge of $528 for rationalization actions.$3,123 related to the change in functional currency and devaluation of the Venezuelan currency. The Harris Products Group segment includes a net charge of $5,029 for rationalization actions and $745 in intangible asset impairment charges.In 2008, special items include forNorth America Welding segmentsale of property at a charge of $818 for the impairment of an intangible asset. The Europe Welding segment includes a charge of $1,528 for rationalization actions and a charge of $524 for the impairment of an intangible asset. The Asia Pacific Welding segment includes a charge of $15,582 for the impairment of goodwill and certain long-lived assets. The Harris Products Group segment includes a charge of $919 for rationalization actions.In 2007, special items include for The Harris Products Group segment a gain of $188 for rationalization actions.Export sales (excluding intercompanyinter-company sales) from the United States were $154,526$268,331 in 2009, $242,3122012, $242,380 in 20082011 and $194,476$197,057 in 2007.2010. No individual customer comprised more than 10% of the Company’sCompany's total revenues for any of the three years ended December 31, 2009.The geographic split of the Company’sCompany's net sales, based on the location of the customer, and property, plant and equipment were as follows: Year Ended December 31, 2009 2008 2007 $ 722,638 $ 1,072,593 $ 1,064,113 1,006,647 1,406,538 1,216,671 $ 1,729,285 $ 2,479,131 $ 2,280,784 December 31, 2009 2008 2007 $ 153,342 $ 169,764 $ 167,659 307,073 259,469 263,738 (354 ) (1,331 ) (1,453 ) $ 460,061 $ 427,902 $ 429,944 Net sales derived from customers and property, plant and equipment in any individual foreign country were not material.F-20LINCOLN ELECTRIC HOLDINGS, INC.NOTES TO CONSOLIDATED FINANCIAL STATEMENTS — (Continued) Year Ended December 31, 2012 2011 2010 Net sales: United States $ 1,283,066 $ 1,092,838 $ 825,371 China 229,996 286,121 250,981 Other foreign countries 1,340,305 1,315,650 993,820 Total $ 2,853,367 $ 2,694,609 $ 2,070,172 December 31, 2012 2011 2010 Property, plant and equipment, net: United States $ 170,831 $ 149,637 $ 149,185 China 92,744 96,374 87,722 Other foreign countries 223,050 224,801 242,084 Eliminations (389 ) (361 ) (425 ) Total $ 486,236 $ 470,451 $ 478,566 NOTE 46 – RATIONALIZATION AND ASSET IMPAIRMENTSThe Company recorded rationalization and asset impairmentnet charges of $29,897$9,354 and $282 for the years ended December 31, 2012 and 2011, respectively, and net gains of $384 for the year ended December 31, 2009. These2010. The 2012 net charges include $27,142$7,615 primarily related to employee severance costs, $2,061and $1,842 in long-lived asset impairment charges, $879 in indefinite-lived intangible asset impairment chargespartially offset by gains of $103 related to sale of assets. A description of each restructuring plan and a gain of $185 recognized in connection with the partial settlement of a pension plan.In the fourth quarter of 2009, the Company determined that the carrying value of certain long-lived assets exceeded fair value at operations affected by rationalization activities initiated in the second and third quarters of 2009. As a result, asset impairment charges totaling $2,061 were recognized in “Rationalization and asset impairment charges (gain).” Of the total asset impairment charges, $253 were recognized in the Europerelated costs follows:North America Welding segment, $1,515 in the Asia Pacific Welding segment and $293 in The Harris Products Group segment. Fair values of impaired long-lived assets were determined primarily by third party appraisal.During the third quarter of 2009,2012, the Company initiated various rationalization actions includingplans within the closure of a manufacturingNorth America Welding segment. Plans for the segment are to consolidate its Oceanside, California operations and its Reno, Nevada operations to another facility in Reno, Nevada and to consolidate its Baltimore, Maryland manufacturing operations into its current manufacturing operations in Cleveland, Ohio. These actions are expected to impact 72 employees within the North America Welding segment. During the year ended December 31, 2012, the Company recorded charges of $827 related to these activities. Charges represent employeeF-18LINCOLN ELECTRIC HOLDINGS, INC.NOTES TO CONSOLIDATED FINANCIAL STATEMENTS (Continued)(Dollars in thousands, except share and per share amounts)severance and other related costs. The Company expects additional charges in the range of $1,400 to $1,700 related to the completion of these activities.Europe Welding Plans:During 2012, the Company initiated various rationalization plans within the Europe Welding segment. Plans for the segment are to consolidate manufacturing facilities in Russia, relocate its Italian machine manufacturing operations to current facilities in Poland and to restructure headcount at various other manufacturing operations within the segment to better align the cost structure and capacity requirements with current economic needs and conditions. These actions are expected to impact 285 employees within the Europe Welding segment. During the year ended December 31, 2012, the Company recorded charges of $3,534 related to these activities. Charges represent employee severance and other related costs of $3,637, partially offset by gains from the sale of assets at rationalized operations of $103. At December 31, 2012, a liability relating to these actions of $1,836 was recognized in Other current liabilities, which will be substantially paid in 2013. The Company expects to incur additional charges in the range of $50 to $100 related to the completion of this plan.Asia Pacific Welding Plans:During 2012, the Company initiated various rationalization plans within the Asia Pacific Welding segment. Plans for the segment are to rationalize its Australian manufacturing operations and to restructure headcount at various other manufacturing operations within the segment to better align the cost structure and capacity requirements with current economic needs and conditions. These actions are expected to impact 268 employees within the Asia Pacific Welding segment. During the year ended December 31, 2012, the Company recorded charges of $4,993 related to these activities. Charges represent employee severance and other related costs of $3,151 and asset impairment charges of $1,842. At December 31, 2012, a liability relating to these actions of $1,044 was recognized in Other current liabilities, which are expected to be substantially paid in 2013. The Company expects additional charges up to $500 related to the completion of these activities.2009 Plans:During 2009, the Company initiated rationalization actions including the consolidation of certain manufacturing operations in the Europe Welding, and Asia Pacific Welding and The Harris Products Group segments. These actions impacted 80 employees in the Europe Welding segment, 175 employees in the Asia Pacific Welding segment and nine employees in the South America Welding segment. These actions are expected to cost approximately $12,000, of which the Company recorded rationalization charges of $8,333 for the year ended At December 31, 2009. At December 31, 2009,2012, a liability relatedrelating to these actions of $3,912$177 was recordedrecognized in “OtherOther current liabilities.” Costs related to The Company does not expect further costs associated with these actions relate primarily to employee severance actions that are expected to bein 2013 as they were substantially completed and paid over the next year.During the second quarter of 2009, the Company initiated various rationalization actions including the closure of a manufacturing facility in The Harris Products Group segment. These actions affected eight employees in the North America Welding segment, 61 employees in the Europe Welding segment, 81 employees in the Asia Pacific Welding segment, 23 employees in the South America Welding segment and 58 employees in The Harris Products Group segment. The Company recorded rationalization charges of $6,684 for the year ended December 31, 2009 related to these actions. A liability related to these actions of $2,445 was recorded in “Other current liabilities” at December 31, 2009. These costs relate primarily to employee severance actions that are essentially completeover the next year.Rationalization actions taken during the first quarter of 2009 included a voluntary separation incentive program covering certain U.S.-based employees. These actions affected 408 employees in the North America Welding segment, 48 employees in the Europe Welding segment, 44 employees in the Asia Pacific Welding segment, 22 employees in the South America Welding segment and 46 employees in The Harris Products Group segment. The Company recorded rationalization charges of $12,092 for the year ended December 31, 2009 related to these actions. At December 31, 2009, all activities associated with these actions were completed.Rationalization actions taken during the fourth quarter of 2008 affected 67 and 65 employees in The Harris Products Group and Europe Welding segments, respectively. The Company recorded rationalization charges of $2,447 at December 31, 2008 and $33 for the year ended December 31, 2009 related to these actions. At December 31, 2009, all activities associated with these actions were completed.The Company continues evaluating its cost structure and additional rationalization actions may result in charges in subsequent quarters.In the fourth quarter of 2008, the Company recorded asset impairment charges totaling $16,924 in “Rationalization and asset impairment charges (gain).”In the fourth quarter of 2008, the Company determined that poor operating results and a dampened economic outlook indicated the potential for impairment at two of its businesses in China. Impairment testing determinedF-21LINCOLN ELECTRIC HOLDINGS, INC.NOTES TO CONSOLIDATED FINANCIAL STATEMENTS — (Continued)NOTE 4 – RATIONALIZATION AND ASSET IMPAIRMENTS (continued)that the carrying value of long-lived assets exceeded fair value at one of these businesses and the Company recorded a charge of $2,388. In addition, the carrying value of goodwill at both of these businesses exceeded the implied value of goodwill and the Company recorded a charge of $13,194.The Company also tested indefinite-lived intangible assets and determined that the carrying value of certain intangible assets in the Europe Welding and North America Welding segments exceeded fair value. As a result, the Company recorded charges of $524 and $818, respectively.Fair values of impaired assets were determined using projected discounted cash flows.In 2005, the Company committed to a plan to rationalize manufacturing operations at Harris Calorific Limited (“Harris Ireland”). The Company incurred a total of $3,920 in charges related to this plan of which a gain of $188 was recorded in 2007. During 2009, the Company received cash of $1,740 related to the termination of the Harris Ireland pension plan and recognized a gain of $185.table summarizestables summarize the activity related to the rationalization liabilities: North
America
Welding Europe
Welding Asia
Pacific
Welding South
America
Welding The Harris
Products
Group Consolidated $ — $ 1,563 $ — $ — $ 739 $ 2,302 (10,386 ) (8,097 ) (861 ) (528 ) (3,215 ) (23,087 ) 10,386 9,615 1,692 528 4,921 27,142 $ — $ 3,081 $ 831 $ — $ 2,445 $ 6,357 North America Welding EuropeWelding AsiaPacificWelding The HarrisProductsGroup Consolidated Balance at December 31, 2011 $ — $ 173 $ — $ 82 $ 255 Payments and other adjustments (827 ) (1,797 ) (2,107 ) (82 ) (4,813 ) Charged to expense 827 3,637 3,151 — 7,615 Balance at December 31, 2012 $ — $ 2,013 $ 1,044 $ — $ 3,057 EuropeWelding AsiaPacificWelding The HarrisProductsGroup Consolidated Balance at December 31, 2010 $ 411 $ 90 $ 930 $ 1,431 Payments and other adjustments (404 ) (183 ) (848 ) (1,435 ) Charged to expense 166 93 — 259 Balance at December 31, 2011 $ 173 $ — $ 82 $ 255 F-19LINCOLN ELECTRIC HOLDINGS, INC.NOTES TO CONSOLIDATED FINANCIAL STATEMENTS (Continued)(Dollars in thousands, except share and per share amounts)NOTE 57 – ACCUMULATED OTHER COMPREHENSIVE (LOSS) INCOMEThe components of accumulatedAccumulated other comprehensive loss are as follows: December 31, 2012 2011 Defined benefit pension plans, net of tax $ (261,844 ) $ (255,369 ) Currency translation adjustment 26,364 6,576 Unrealized gain on derivatives designated and qualifying as cash flow hedges, net of tax 80 912 Total Accumulated other comprehensive loss $ (235,400 ) $ (247,881 ) The balance of Accumulated other comprehensive (loss) income are as follows: Defined
Benefit Plans,
net of tax Currency
Translation
Adjustment Unrealized Gain
(Loss) on
Derivatives
Designated and
Qualifying as
Cash
Flow Hedges,
net of tax Comprehensive
Loss (Income)
Attributable to
Non-controlling
Interests Total
Accumulated
Other
Comprehensive
(Loss) Income $ (69,978 ) $ 15,266 $ 59 $ 85 $ (54,568 ) 17,704 55,779 (2,989 ) (229 ) 70,265 (52,274 ) 71,045 (2,930 ) (144 ) 15,697 (142,422 ) (92,419 ) 842 48 (233,951 ) (194,696 ) (21,374 ) (2,088 ) (96 ) (218,254 ) 21,287 46,968 1,444 (849 ) 68,850 $ (173,409 ) $ 25,594 $ (644 ) $ (945 ) $ (149,404 ) F-22LINCOLN ELECTRIC HOLDINGS, INC.NOTES TO CONSOLIDATED FINANCIAL STATEMENTS — (Continued)NOTE 68 – DEBTAt December 31, 20092012 and 2008,2011, debt consisted of the following: December 31, 2009 2008 $ — $ 30,144 84,092 86,759 2,839 3,651 2,209 2,240 89,140 122,794 1,290 31,257 87,850 91,537 34,577 19,436 1,290 31,257 35,867 50,693 $ 123,717 $ 142,230 December 31, 2012 2011 Long-term debt Senior Unsecured Notes due 2012, interest at 6.36% $ — $ 80,358 Capital leases due through 2017, interest at 1.12% to 8.63% 267 901 Other borrowings due through 2023, interest up to 4.25% 1,788 2,197 2,055 83,456 Less current portion 456 81,496 Total long-term debt 1,599 1,960 Short-term debt Amounts due banks, interest at 11.32% (11.61% in 2011) 18,220 19,922 Current portion long-term debt 456 81,496 Total short-term debt 18,676 101,418 Total debt $ 20,275 $ 103,378 Senior Unsecured NotesDuring March 2002, the Company issued Senior Unsecured Notes (the “Notes”"Notes") totaling $150,000 through a private placement. The Notes have$150,000 with original maturities ranging from five to ten years withand a weighted-average interest rate of 6.1% and an average tenure of eight years. Interest is payable semi-annually in March and September.. The proceeds are beingwere used for general corporate purposes, including acquisitions, and arewere generally invested in short-term, highly liquid investments. The Notes contain certain affirmative and negative covenants, including restrictions on asset dispositions and financial covenants (interest coverage and funded debt-to-EBITDA, as defined in the Notes Agreement, ratios). As of December 31, 2009, the Company was in compliance with all of its debt covenants. The Company repaid the $40,000$40,000 Series A Notes andin March 2007, the $30,000$30,000 Series B Notes in March 20072009 and the $80,000 Series C Notes in March 2009, respectively, reducing the balance outstanding of the Notes to $80,000, which is due March 2012.During March 2002, the Company entered into floating rate interest rate swap agreements totaling $80,000 to convert a portion of the Notes outstanding from fixed to floating rates. These swaps were designated as fair value hedges and, as such, the gains or losses on the derivative instrument, as well as the offsetting gains or losses on the hedged item attributable to the hedged risk, were recognized in earnings. Net payments or receipts under these agreements were recognized as adjustments to “Interest expense.” In May 2003, these swap agreements were terminated. The gain of $10,613 on the termination of these swaps was deferred and is being amortized as an offset to “Interest expense” over the remaining life of the Notes. The amortization of this gain reduced “Interest expense” by $313 in 2009, $958 in 2008 and $1,121 in 2007, and is expected to reduce annual “Interest expense” by $206 in 2010. 2012At December 31, 2009, $442 remains to be amortized2012 and is recorded in “Long-term debt, less current portion.”F-23LINCOLN ELECTRIC HOLDINGS, INC.NOTES TO CONSOLIDATED FINANCIAL STATEMENTS — (Continued)NOTE 6 – DEBT (continued)2011During July 2003 and April 2004, the Company entered into various floating rate interest rate swap agreements totaling $110,000 to convert a portion of the Notes outstanding from fixed to floating rates based on the London Inter-Bank Offered Rate (“LIBOR”). These swaps were designated and qualified as fair value hedges and, as such, the gains or losses on the derivative instrument, as well as the offsetting gains or losses on the hedged item, were recognized in earnings. Net payments or receipts under these agreements were recognized as adjustments to “Interest expense.”During February 2009, the Company terminated swaps with a notional value of $80,000 and realized a gain of $5,079. This gain was deferred and is being amortized over the remaining life of the Notes. The amortization of this gain reduced “Interest expense” by $1,429 in 2009 and is expected to reduce annual “Interest expense” by $1,661 in 2010. At December 31, 2009, $3,650 remains to be amortized and is included in “Long-term debt, less current portion.”During March 2009, swaps designated as fair value hedges that converted the $30,000 Series B Notes from fixed to floating interest rates matured with the underlying Notes. The Company has no interest rate swaps outstanding at December 31, 2009. The weighted average effective rate on the Notes, net of the impact of swaps, was 4.1% and 4.6% for 2009 and 2008, respectively.At December 31, 2009 and 2008,, the fair value of long termlong-term debt, including the current portion, was approximately $91,365$1,919 and $124,446,$84,110, respectively, which was determined using available market information and methodologies requiring judgment. Since considerable judgment is required in interpreting market information, the fair value of the debt is not necessarily the amount which could be realized in a current market exchange.Revolving Credit AgreementOn November 18, 2009, theThe Company entered into anhas a line of credit totaling $300,000 through the Amended and Restated Credit Agreement (“Credit(the “Credit Agreement”) for a $150,000 revolving credit facility to be used for general corporate purposes. This Credit Agreement amended and restated the Company’s $175,000 revolving credit agreement that, which was entered into on July 26, 2012. The Credit Agreement contains customary affirmative, negative and financial covenants for credit facilities of this type, including limitations on the Company and its subsidiaries with respect to liens, investments, distributions, mergers and acquisitions, dispositions of assets, transactions with affiliates and a fixed charges coverage ratio and total leverage ratio. As of December 17, 200431, 2012, the Company was in compliance with all of its covenants and had a maturity date in December 2009.no outstanding borrowings under the Credit Agreement. The Credit Agreement has a three-yearfive-year term and may be increased, subject to certain conditions, by an additional amount up to $75,000 at any time not later than 180 days prior to the last day of the term.$100,000. The interest rate on borrowings is based on either LIBOR or the prime rate, plus a spread based on the Company’s leverage ratio, at the Company’s election. A quarterly facility fee is payable based upon the daily aggregate amount of commitmentsF-20LINCOLN ELECTRIC HOLDINGS, INC.NOTES TO CONSOLIDATED FINANCIAL STATEMENTS (Continued)(Dollars in thousands, except share and the Company’s leverage ratio.The Credit Agreement contains customary affirmative, negative and financial covenants for credit facilities of this type, including limitations on the Company with respect to liens, investments, distributions, mergers and acquisitions, dispositions of assets, transactions with affiliates and a fixed charges coverage ratio and total leverage ratio. As of per share amounts)Capital LeasesAt December 31, 2009, there were no borrowings under the Credit Agreement.Capital LeasesAt December 31, 2009 and 2008, $2,8392011, $267 and $3,651$901 of capital lease indebtedness was secured by property, plant and equipment, respectively.OtherOther20092012 are $35,867$18,679 in 2010, $1,2972013, $408 in 2011, $80,8122014, $309 in 2012, $1902015, $133 in 2013, $1962016, $134 in 20142017 and $1,262$612 thereafter. Total interest paid was $11,339$4,423 in 2009, $13,0372012, $6,979 in 20082011 and $11,537$7,446 in 2007.2010. TheF-24LINCOLN ELECTRIC HOLDINGS, INC.NOTES TO CONSOLIDATED FINANCIAL STATEMENTS — (Continued)NOTE 6 – DEBT (continued)The Company’sCompany's short-term borrowings included in “Amounts"Amounts due banks”banks" were $34,577$18,220 and $19,436$19,922 at December 31, 20092012 and 2008,2011, respectively, and represent the borrowings of foreign subsidiaries at weighted average interest rates of 8.35%11.3% and 22.78%11.6%, respectively. The decrease in the weighted average interest rate in 2009 is primarily due to the low interest rate short-term borrowings at Jin Tai offsetting higher interest rate borrowings at the Company’s subsidiary in Venezuela. The higher weighted average interest rate in 2008 was due to borrowings at the Company’s subsidiary in Venezuela.NOTE 79 – STOCK PLANSOn April 28, 2006, the shareholders of the Company approved the 2006 Equity and Performance Incentive Plan, as amended (“("EPI Plan”Plan"), which replaced the 1998 Stock Plan, as amended and restated in May 2003. The EPI Plan provides for the granting of options, appreciation rights, restricted shares, restricted stock units and performance-based awards up to an additional 3,000,0006,000,000 of the Company’sCompany's common shares. In addition, on April 28, 2006, the shareholders of the Company approved the 2006 Stock Plan for Non-Employee Directors, as amended (“("Director Plan”Plan"), which replaced the Stock Option Plan for Non-Employee Directors adopted in 2000. The Director Plan provides for the granting of options, restricted shares and restricted stock units up to an additional 300,000600,000 of the Company’sCompany's common shares. At December 31, 2009,2012, there were 3,264,8862,517,228 common shares available for future grant under all plans.Stock OptionsThe following table summarizes thestock option activity for each of the three years ended December 31, 2009,2012, under all Plans: Year Ended December 31, 2009 2008 2007 Shares Weighted
Average
Exercise
Price Shares Weighted
Average
Exercise
Price Shares Weighted
Average
Exercise
Price 1,716,017 $ 43.55 1,663,704 $ 41.63 1,747,050 $ 34.28 386,305 52.61 316,264 44.11 268,854 68.48 (66,669 ) 34.86 (235,650 ) 30.56 (348,450 ) 25.30 (19,326 ) 51.49 (28,301 ) 45.23 (3,750 ) 60.72 2,016,327 $ 45.49 1,716,017 $ 43.55 1,663,704 $ 41.63 1,334,346 $ 41.81 1,144,784 $ 39.14 1,152,545 $ 33.45 Year Ended December 31, 2012 2011 2010 Options WeightedAverageExercisePrice Options WeightedAverageExercisePrice Options WeightedAverageExercisePriceBalance at beginning of year 3,632,463 $ 26.05 3,779,824 $ 23.99 3,596,884 $ 22.28 Options granted 412,980 47.66 459,263 35.34 491,010 31.29 Options exercised (962,029 ) 19.52 (572,795 ) 19.82 (260,084 ) 13.49 Options canceled (22,470 ) 24.07 (33,829 ) 26.62 (47,986 ) 27.84 Balance at end of year 3,060,944 30.98 3,632,463 26.05 3,779,824 23.99 Exercisable at end of year 2,208,455 27.19 2,677,071 23.73 2,749,168 22.40 Options granted under both the EPI Plan and its predecessor plans may be outstanding for a maximum of ten10 years from the date of grant. The majority of options granted vest ratably over a period of three years from the grant date. The exercise prices of all options were equal to the quoted market price of the Company’sCompany's common shares at the date of grant. The Company issued shares of common stock from treasury upon all exercises of stock options in 2012, 2011and the granting of restricted stock awards in 2009, 2008 and 2007.Restricted shares are valued at the quoted market price on the grant date. The majority of restricted shares vest over a period of three to five years. Under the EPI Plan, the Company issued 85,943 restricted shares at a weighted average market price of $52.58 per share in 2009, 56,205 restricted shares at a market price of $44.03F-25LINCOLN ELECTRIC HOLDINGS, INC.NOTES TO CONSOLIDATED FINANCIAL STATEMENTS — (Continued)NOTE 7 – STOCK PLANS (continued)2010per share in 2008 and 25,690 restricted shares at a market price of $68.51 per share in 2007. The Company issued 8,532 restricted shares at a market price of $52.71 per share, 10,233 restricted shares at a market price of $43.97 per share and 7,102 restricted shares at a market price of $68.21 under the Director Plan in 2009, 2008 and 2007, respectively.The Company uses the Black-Scholes option pricing model for estimating fair values of options. In estimating the fair value of options granted, the expected option life is based on the Company’sCompany's historical experience. The expected volatility is based on historical volatility. The weighted average assumptions for each of the three years ended December 31, 20092012 were as follows: Year Ended December 31, 2012 2011 2010 Expected volatility 45.67 % 41.92 % 42.15 % Dividend yield 1.66 % 1.63 % 2.02 % Risk-free interest rate 0.70 % 0.80 % 1.64 % Expected option life (years) 4.5 4.3 4.9 Weighted average fair value per option granted during the year $ 15.87 $ 10.97 $ 10.01 F-21LINCOLN ELECTRIC HOLDINGS, INC.NOTES TO CONSOLIDATED FINANCIAL STATEMENTS (Continued)(Dollars in thousands, except share and per share amounts)The following table summarizes non-vested stock options for the year ended December 31, 2012: Year Ended December 31, 2012 Number ofOptions WeightedAverage FairValue at GrantDateBalance at beginning of year 929,382 $ 10.78 Granted 412,980 15.87 Vested (470,243 ) 10.19 Forfeited (19,630 ) 19.60 Balance at end of year 852,489 13.63 The aggregate intrinsic value of options outstanding and exercisable which would have been received by the optionees had all awards been exercised at December 31, 2012 was $54,178 and $47,464, respectively. The total intrinsic value of awards exercised during 2012, 2011 and 2010 was $18,776, $10,028 and $4,270, respectively.The following table summarizes information about awards outstanding as of December 31, 2012: Outstanding Exercisable Exercise Price Range Number ofStockOptions WeightedAverageExercisePrice Number ofStockOptions WeightedAverageExercisePrice WeightedAverageRemainingLife (years)Under $19.99 449,884 $ 18.59 449,884 $ 18.59 2.4 $20.00 - $32.99 1,389,730 27.79 1,284,025 27.50 6.5 Over $33.00 1,221,330 39.18 474,546 34.50 8.0 3,060,944 2,208,455 6.5 Restricted Share AwardsThe following table summarizes restricted share award activity for each of the three years ended December 31, 2012, under all Plans: Year Ended December 31, 2012 2011 2010 Shares WeightedAverageGrant DateFair Value Shares WeightedAverageGrant DateFair Value Shares WeightedAverageGrant DateFair ValueBalance at beginning of year 379,233 $ 28.06 523,730 $ 27.36 435,770 $ 26.61 Shares granted 20,099 47.81 22,779 35.55 112,864 31.05 Shares vested* (62,524 ) 32.10 (159,842 ) 26.97 (24,904 ) 31.07 Shares forfeited — — (7,434 ) 24.67 — — Balance at end of year 336,808 28.49 379,233 28.06 523,730 27.36 Year Ended December 31, 2009 2008 2007 40.48 % 33.80 % 23.05 % 2.15 % 3.09 % 1.57 % 2.04 % 1.63 % 3.50 % 4.7 4.5 4.3 $ 16.05 $ 9.85 $ 14.33 * Includes shares vested but not exercisable Restricted share awards are valued at the quoted market price on the grant date. The majority of restricted share awards vest over a period of three to five years. The Company issued shares of common stock from treasury upon the granting of restricted share awards in 2012, 2011 and 2010. Under the EPI Plan, the Company issued 82,992 restricted shares at a weighted average market price of $30.97 per share in 2010. The Company issued 20,099 restricted shares at a weighted average market price of $47.81 per share, 22,779 restricted shares at a weighted average market price of $35.55 per share and 29,872 restricted shares at a weighted average market price of $31.28 per share under the Director Plan in 2012, 2011 and 2010, respectively. The remaining weighted average life of all non-vested restricted share awards is 1.8 years as of December 31, 2012.F-22LINCOLN ELECTRIC HOLDINGS, INC.NOTES TO CONSOLIDATED FINANCIAL STATEMENTS (Continued)(Dollars in thousands, except share and per share amounts)The following table summarizes non-vested restricted share awards for the year ended December 31, 2012: Year Ended December 31, 2012 Number ofRestrictedShares WeightedAverageFair Valueat Grant DateBalance at beginning of year 355,933 $ 28.18 Granted 20,099 47.81 Vested (57,944 ) 31.93 Balance at end of year 318,088 28.74 Restricted Stock Units ("RSUs")The following table summarizes restricted stock unit activity for the years ended December 31, 2012 and 2011, under all Plans: Year Ended December 31, 2012 2011 Units WeightedAverageGrant DateFair Value Units WeightedAverageGrant DateFair ValueNon-vested at beginning of year 166,519 $ 34.55 — $ — Units granted 133,944 47.97 166,519 34.55 Units vested (10,499 ) 33.06 — — Units forfeited (1,295 ) 35.55 — — Non-vested at end of year 288,669 40.83 166,519 34.55 RSUs are valued at the quoted market price on the grant date. The majority of RSUs vest over a period of three to five years. The Company will issue shares of common stock from treasury upon the vesting of RSUs and any earned dividend equivalents. Conversion of 10,499 RSUs to common stock in 2012 were deferred as part of the 2005 Deferred Compensation Plan for Executives (the "2005 Plan"). As of December 31, 2012, 10,713 RSUs, including related dividend equivalents, have been deferred under the 2005 Plan. These units are reflected within dilutive shares in the calculation of earnings per share. Under the EPI Plan, the Company issued 133,944 and 166,519 restricted stock units at a weighted average market price of $47.97 and $34.55 per share in 2012 and 2011, respectively. Restricted stock units were not granted prior to 2011. The remaining weighted average life of all non-vested RSUs is 4.3 years as of December 31, 2012.Stock-Based Compensation ExpenseExpense is recognized for all awards of stock-based compensation by allocating the aggregate grant date fair value over the vesting period. No expense is recognized for any stock options, restricted or deferred shares or restricted stock units ultimately forfeited because recipients fail to meet vesting requirements. Total stock-based compensation expense recognized in the Consolidated Statements of Income for 2009, 20082012, 2011 and 20072010 was $5,432, $4,738$8,961, $6,610 and $4,679,$8,213, respectively. The related tax benefit for 2009, 20082012, 2011 and 20072010 was $2,058, $1,793$3,409, $2,515 and $1,789,$3,112, respectively. As of December 31, 2009,2012, total unrecognized stock-based compensation expense related to nonvestednon-vested stock options, restricted shares and restricted sharesstock units was $13,508,$23,718, which is expected to be recognized over a weighted average period of approximately 39 months.The following table summarizes nonvested stock options and restricted shares for the year ended December 31, 2009: December 31, 2009 Number of
Options and
Restricted
Shares Weighted
Average Fair
Value at
Grant Date 524,583 $ 22.96 386,305 24.99 (271,037 ) 17.35 (11,835 ) 11.70 628,016 $ 26.84 The aggregate intrinsic value of awards outstanding at December 31, 2009, based on the Company’s closing stock price of $53.46 as of the last business day in the year ended December 31, 2009, which would have been received by the optionees had all awards been exercised on that date was $32,367. The aggregate intrinsic value of awards exercisable at December 31, 2009, based on the Company’s closing stock price of $53.46 as of the lastF-26LINCOLN ELECTRIC HOLDINGS, INC.NOTES TO CONSOLIDATED FINANCIAL STATEMENTS — (Continued)NOTE 7 – STOCK PLANS (continued)37 monthsbusiness day in the year ended December 31, 2009, which would have been received by the optionees had all awards been exercised on that date was $19,385. The total intrinsic value of awards exercised during 2009 and 2008 was $2,236 and $10,366, respectively. Intrinsic value is the amount by which the fair value of the underlying stock exceeds the exercise price of the awards.The following table summarizes information about awards outstanding as of December 31, 2009: Outstanding Exercisable Number of
Awards Weighted
Average
Exercise
Price Number of
Awards Weighted
Average
Exercise
Price Weighted
Average
Remaining
Life
(years) 328,581 $ 23.42 328,581 $ 23.42 3.0 527,762 $ 37.64 525,727 $ 37.63 5.4 1,159,984 $ 55.32 480,038 $ 58.97 7.7 2,016,327 1,334,346 6.3 Lincoln Stock Purchase PlanThe 1995 Lincoln Stock Purchase Plan provides employees the ability to purchase open market shares on a commission-free basis up to a limit of ten thousand dollars annually. Under this plan, 400,000800,000 shares have been authorized to be purchased. Under this plan, sharesShares purchased were 3,8184,908 in 2009, 1,0852012, 4,466 in 20082011 and 6,8434,240 in 2007.2010.NOTE 10 – COMMON STOCK REPURCHASE PROGRAMThe Company has a share repurchase program for up to 30 million shares of the Company's common stock. At management's discretion, the Company repurchases its common stock from time to time in the open market, depending on market conditions, stock price and other factors. During the year ended December 31, 2012, the Company purchased 1,779,384 shares at an average cost per share of $45.06. As of December 31, 2012, 3,342,373 shares remained available for repurchase under the stock repurchase program. The treasury shares have not been retired.F-23LINCOLN ELECTRIC HOLDINGS, INC.NOTES TO CONSOLIDATED FINANCIAL STATEMENTS (Continued)(Dollars in thousands, except share and per share amounts)NOTE 811 – RETIREMENT ANNUITY AND GUARANTEED CONTINUOUS EMPLOYMENT PLANSThe Company maintains a number of defined benefit and defined contribution plans to provide retirement benefits for employees. These plans are maintained and contributions are made in accordance with the Employee Retirement Income Security Act of 1974 (“ERISA”("ERISA"), local statutory law or as determined by the Board of Directors. The plans generally provide benefits based upon years of service and compensation. Pension plans are funded except for a domestic non-qualified pension plan for certain key employees and certain foreign plans. The Company uses a December 31 measurement date for its plans.The Company does not have, and does not provide for, any postretirement or postemployment benefits other than pensions and certain non-U.S. statutory termination benefits.Defined Benefit PlansThe defined benefit plans generally provide benefits based upon years of service and compensation. The plans are funded except for a domestic non-qualified pension plan for certain key employees and certain foreign plans. The contributions are made in amounts sufficient to fund current service costs on a current basis and to fund past service costs, if any, over various amortization periods.F-27Obligations and Funded Status December 31, 2012 2011 Change in benefit obligations Benefit obligations at beginning of year $ 991,979 $ 851,948 Service cost 21,538 17,331 Interest cost 41,584 44,161 Plan participants' contributions 334 365 Plan amendments (3,681 ) — Actuarial loss 70,015 121,800 Benefits paid (86,722 ) (40,345 ) Settlement/curtailment (3,946 ) (2,434 ) Currency translation 2,624 (847 ) Benefit obligations at end of year 1,033,725 991,979 Change in plan assets Fair value of plan assets at beginning of year 749,456 726,474 Actual return on plan assets 83,156 29,470 Employer contributions 68,029 33,994 Plan participants' contributions 334 365 Benefits paid (85,238 ) (37,960 ) Settlement (3,798 ) (2,415 ) Currency translation 1,958 (472 ) Fair value of plan assets at end of year 813,897 749,456 Funded status at end of year (219,828 ) (242,523 ) Unrecognized actuarial net loss 422,042 408,474 Unrecognized prior service cost (4,101 ) (515 ) Unrecognized transition assets, net 26 41 Net amount recognized $ 198,139 $ 165,477 The Company's U.S. defined benefit plans were amended to allow participants, including those with deferred vested pension benefits, additional payment options including a lump sum and a five year payment option. Increased benefits paid primarily reflect the disbursements related to deferred vested participants taking lump sum payment options.F-24LINCOLN ELECTRIC HOLDINGS, INC.NOTES TO CONSOLIDATED FINANCIAL STATEMENTS — (Continued)NOTE 8 – RETIREMENT ANNUITY AND GUARANTEED CONTINUOUS EMPLOYMENT PLANS (continued)Obligations(Dollars in thousands, except share and Funded Status December 31, 2009 2008 $ 721,467 $ 699,129 12,755 16,501 43,097 42,615 408 550 35,289 15,372 (37,468 ) (38,970 ) (6,173 ) (14 ) 8,146 (13,716 ) 777,521 721,467 532,775 715,072 87,936 (159,522 ) 46,128 23,810 408 550 (34,366 ) (34,237 ) (3,746 ) — 7,623 (12,898 ) 636,758 532,775 (140,763 ) (188,692 ) 278,529 312,071 (872 ) (917 ) 78 109 $ 136,972 $ 122,571 The after-tax amounts of unrecognized actuarial net loss, prior service creditscosts and transition obligationsassets included in “AccumulatedAccumulated other comprehensive loss”loss at December 31, 20092012 were $173,861, $(512)$264,514, $(2,690) and $60,$20, respectively. The actuarial loss represents changes in the estimated obligation not yet recognized in the Consolidated Income Statement. Actuarial losses arising during 2012 are primarily attributable to a lower discount rate. The pre-tax amounts of unrecognized actuarial net loss, prior service credits and transition obligations expected to be recognized as components of net periodic benefit cost during 20102013 are $21,233, $(50)$32,314, $(615) and $5,$4, respectively.F-28LINCOLN ELECTRIC HOLDINGS, INC.NOTES TO CONSOLIDATED FINANCIAL STATEMENTS — (Continued)NOTE 8 – RETIREMENT ANNUITY AND GUARANTEED CONTINUOUS EMPLOYMENT PLANS (continued)Amounts Recognized in Consolidated Balance Sheets December 31, 2009 2008 $ 1,921 $ 2,716 (3,014 ) (3,248 ) (139,670 ) (188,160 ) 277,735 311,263 $ 136,972 $ 122,571 December 31, 2012 2011 Accrued pension liability, current $ (3,639 ) $ (10,348 ) Accrued pension liability, long-term (216,189 ) (232,175 ) Accumulated other comprehensive loss, excluding tax effects 417,967 408,000 Net amount recognized in the balance sheets $ 198,139 $ 165,477 Components of Pension Cost for Defined Benefit Plans Year Ended December 31, 2012 2011 2010 Service cost $ 21,538 $ 17,331 $ 15,371 Interest cost 41,584 44,161 42,730 Expected return on plan assets (58,754 ) (57,405 ) (50,424 ) Amortization of prior service cost (90 ) (62 ) (44 ) Amortization of net loss 31,085 21,816 20,830 Settlement/curtailment loss 895 529 660 Pension cost for defined benefit plans $ 36,258 $ 26,370 $ 29,123 Pension costs in Year Ended December 31, 2009 2008 2007 $ 12,755 $ 16,501 $ 17,829 43,097 42,615 40,621 (43,802 ) (56,954 ) (55,943 ) (23 ) 70 75 25,087 1,636 4,615 (2,340 ) 745 (937 ) $ 34,774 $ 4,613 $ 6,260 Pension Plans with Accumulated Benefit Obligations in Excess of Plan Assets December 31, 2009 2008 $ 714,455 $ 670,243 679,899 635,433 584,321 491,367 $ 49,862 $ 39,362 46,309 37,208 37,321 26,841 December 31, 2012 2011 U.S. pension plans Projected benefit obligation $ 956,837 $ 921,469 Accumulated benefit obligation 905,541 883,157 Fair value of plan assets 755,491 696,802 Non-U.S. pension plans Projected benefit obligation $ 76,884 $ 70,507 Accumulated benefit obligation 70,492 66,332 Fair value of plan assets 58,403 52,652 The total accumulated benefit obligation for all plans was $738,965$976,033 as of December 31, 20092012 and $685,565$949,489 as of December 31, 2008.F-29F-25LINCOLN ELECTRIC HOLDINGS, INC.NOTES TO CONSOLIDATED FINANCIAL STATEMENTS — (Continued)NOTE 8 – RETIREMENT ANNUITY AND GUARANTEED CONTINUOUS EMPLOYMENT PLANS (continued)(Dollars in thousands, except share and per share amounts)Contributions to PlansContributions to U.S. plans were $45,000 and $20,000 for the years ended December 31, 2009 and 2008, respectively. The Company expects to contribute $30,000approximately $103,000 to its defined benefit plans in the U.S. plans during 2010.United States in 2013. The actual amounts to be contributed to the pension plans in 20102013 will be determined at the Company’sCompany's discretion.Benefit Payments for PlansBenefits expected to be paid for the U.S. plans are as follows: $ 38,876 40,949 48,212 42,911 44,602 253,638 Estimated Payments 2013 $ 53,513 2014 61,080 2015 62,051 2016 58,608 2017 62,361 2018 through 2022 311,135 AssumptionsAssumptionsCompany’sCompany's significant defined benefit plans as of December 31, 20092012 and 20082011 were as follows: December 31, 2009 2008 5.8 % 6.2 % 4.0 % 4.1 % December 31, 2012 2011 Discount rate 3.8 % 4.2 % Rate of increase in compensation 4.0 % 4.0 % Weighted average assumptions used to measure the net periodic benefit cost for the Company’sCompany's significant defined benefit plans asfor each of the three years ended December 31, 2009, 2008 and 20072012 were as follows: December 31, 2009 2008 2007 6.2 % 6.3 % 5.9 % 4.0 % 4.1 % 4.1 % 8.2 % 8.2 % 8.4 % December 31, 2012 2011 2010 Discount rate 4.2 % 5.3 % 5.8 % Rate of increase in compensation 4.0 % 4.0 % 4.0 % Expected return on plan assets 7.7 % 7.9 % 7.9 % To develop the discount rate assumption to be used for U.S. plans, the Company refers to the yield derived from matching projected pension payments with maturities of a portfolio of available non-callable bonds rated AA- or better. The expected long-term rate of return assumption is based on the weighted average expected return of the various asset classes in the plans’plans' portfolio and the targeted allocation of plan assets. The asset class return is developed using historical asset return performance as well as current market conditions such as inflation, interest rates and equity market performance. The rate of compensation increase is determined by the Company based upon annual reviews.F-30LINCOLN ELECTRIC HOLDINGS, INC.NOTES TO CONSOLIDATED FINANCIAL STATEMENTS — (Continued)NOTE 8 – RETIREMENT ANNUITY AND GUARANTEED CONTINUOUS EMPLOYMENT PLANS (continued)Pension Plans’Plans' AssetsThe primary objective of the pension plans’plans' investment policy is to ensure sufficient assets are available to provide benefit obligations when such obligations mature. Investment management practices must comply with ERISA or any other applicable regulations and rulings. The overall investment strategy for the defined benefit pension plans’plans' assets is to achieve a rate of return over a normal business cycle relative to an acceptable level of risk that is consistent with the long-term objectives of the portfolio. The target allocation for plan assets is 60% to 70% equity securities and 30% to 40% debt securities.F-26LINCOLN ELECTRIC HOLDINGS, INC.NOTES TO CONSOLIDATED FINANCIAL STATEMENTS (Continued)(Dollars in thousands, except share and per share amounts)The following table sets forth, by level within the fair value hierarchy, the pension plans’ assets:plans' assets as of December 31, 2012: Pension Plans' Assets at Fair Value as of December 31, 2012 Quoted PricesinActive Marketsfor IdenticalAssets(Level 1) Significant OtherObservable Inputs(Level 2) SignificantUnobservableInputs(Level 3) Total Corporate stock (1) $ 107,763 $ — $ — $ 107,763 Cash and cash equivalents 5,170 — — 5,170 Corporate and other obligations (2) — 412 — 412 Common trusts and 103-12 investments (3) — 673,469 — 673,469 Private equity funds (4) — — 27,083 27,083 Total assets at fair value $ 112,933 $ 673,881 $ 27,083 $ 813,897 The following table sets forth, by level within the fair value hierarchy, the pension plans' assets as of December 31, 2011: Pension Plans' Assets at Fair Value as of December 31, 2011 Quoted PricesinActive Marketsfor IdenticalAssets(Level 1) Significant OtherObservable Inputs(Level 2) SignificantUnobservableInputs(Level 3) Total Corporate stock (1) $ 94,407 $ — $ — $ 94,407 Cash and cash equivalents 1,582 — — 1,582 Insurance company nonpooled separate account (5) Cash and cash equivalents — 15,371 — 15,371 Corporate and other obligations — 8,288 650 8,938 Common trusts and 103-12 investments (3) — 611,361 — 611,361 Private equity funds (4) — — 17,797 17,797 Total assets at fair value $ 95,989 $ 635,020 $ 18,447 $ 749,456 Pension Plans’ Assets at Fair Value as of December 31, 2009 Quoted Prices in
Active Markets
for Identical
Assets
(Level 1) Significant Other
Observable
Inputs
(Level 2) Significant
Unobservable
Inputs
(Level 3) Total $ 88,600 $ — $ — $ 88,600
account (2) — 33,547 — 33,547 — 11,793 1,699 13,492 — 496,600 — 496,600 — — 4,519 4,519 $ 88,600 $ 541,940 $ 6,218 $ 636,758 (1) This investment category includes publicly traded equity investments directly held by the plans. Investments are valued at the unadjusted quoted close prices reported on the reporting date. (2) The insurance company nonpooled separate accountThis investment category is focusedcomposed of publicly traded bonds and asset backed securities which are valued at the quoted closing market prices on capital preservation and invests in fixed-income securities and money market instruments.the reporting date.(3) Common trusts and 103-12 investments are comprised of a number of investment funds that invest in a diverse portfolio of assets including equity securities, corporate and governmental bonds, equity and credit indexes, and money markets. Trusts are valued at the net asset value ("NAV") as determined by their custodian. NAV represent the accumulation of the unadjusted quoted close prices on the reporting date for the underlying investments divided by the total shares outstanding at the reporting dates. (4) Private equity funds consist of four funds seeking capital appreciation by investing in private equity investment partnerships and venture capital companies. Funds are comprised of unrestricted and restricted publicly traded securities and privately held securities. Unrestricted securities are valued at the closing market price on the reporting date. Restricted securities may be valued at a discount from such closing public market price, depending on facts and circumstances. Privately held securities are valued at fair value as determined by the fund directors and general partners. (5) The insurance company nonpooled separate account is focused on capital preservation and invests in fixed-income securities and money market instruments. The account is composed of publicly traded and privately held corporate bonds, money market and mortgage backed assets. Publicly traded bonds, money market and mortgage backed securities are valued at the closing market price on the reporting date. Privately held bonds are valued at fair value as determined by the fund directors and general partners. F-27LINCOLN ELECTRIC HOLDINGS, INC.NOTES TO CONSOLIDATED FINANCIAL STATEMENTS (Continued)(Dollars in thousands, except share and per share amounts)The table below sets forth a summary of changes in the fair value of the Level 3 pension plans’plans' assets for the year ended December 31, 2009: Insurance
Company
Nonpooled
Separate
Account Private
Equity
Funds Total $ 1,638 $ 2,328 $ 3,966 (432 ) 2,473 2,041 493 (282 ) 211 $ 1,699 $ 4,519 $ 6,218 $ (283 ) $ 586 $ 303 F-31LINCOLN ELECTRIC HOLDINGS, INC.NOTES TO CONSOLIDATED FINANCIAL STATEMENTS — (Continued)NOTE 8 – RETIREMENT ANNUITY AND GUARANTEED CONTINUOUS EMPLOYMENT PLANS (continued): InsuranceCompanyNonpooledSeparateAccount PrivateEquityFunds Total Balance at the beginning of year $ 650 $ 17,797 $ 18,447 Purchases, sales, issuances and settlements (650 ) 7,318 6,668 Realized and unrealized gains — 1,968 1,968 Balance at the end of year $ — $ 27,083 $ 27,083 The amount of total gains during the period attributable to the change in unrealized gains relating to Level 3 net assets still held at the reporting date $ — $ 1,135 $ 1,135 Supplemental Executive Retirement PlanThe Company maintains a domestic unfunded supplemental executive retirement plan (“SERP”("SERP") under which non-qualified supplemental pension benefits are paid to certain employees in addition to amounts received under the Company’sCompany's qualified retirement plan which is subject to Internal Revenue Service (“IRS”("IRS") limitations on covered compensation. The annual cost of this program has been included in the determination of total net pension costs shown above and was $2,088, $2,598$2,254, $2,110 and $2,411$2,118 in 2009, 20082012, 2011 and 2007,2010, respectively. The projected benefit obligation associated with this plan is also included in the pension disclosure shown above and was $20,442, $18,764$25,646, $23,930 and $19,195$21,412 at December 31, 2009, 20082012, 2011 and 2007,2010, respectively.Defined Contribution PlansSubstantially all U.S. employees are covered under a 401(k) savings plan in which they may invest 1% or more of eligible compensation, limited to maximum amounts as determined by the IRS. For most participants the plan provides for Company matching contributions of 35% of the first 6% of employee compensation contributed to the plan. On January 1, 2009, the match provision was suspended for the 401(k) savingsThe plan as part of the Company’s actions to reduce costs in light of market conditions. In addition, the planalso includes a feature in which all participants hired after November 1, 1997 receive an annual Company contribution of 2% of their base pay. The plan allowed employees hired before November 1, 1997, at their election, to receive this contribution in exchange for forfeiting certain benefits under the pension plan.The annual costs recognized for defined contribution plans were $4,810, $8,471$9,405, $8,478 and $8,590$7,039 in 2009, 20082012, 2011 and 2007,2010, respectively.Multi-Employer PlansThe Company participates in multi-employer plans for several of its operations in Europe. Pension costsCosts for these plans are recognized as contributions are funded. The Company's risk of participating in these plans is limited to the annual premium as determined by the plan. The annual costs of these programs were $1,322, $1,509$972, $966 and $1,725$1,052 in 2009, 20082012, 2011 and 2007,2010, respectively.Other BenefitsThe Cleveland, Ohio, area operations have a Guaranteed Continuous Employment Plan covering substantially all employees which, in general, provides that the Company will provide work for at least 75% of every standard work week (presently 40 hours). This plan does not guarantee employment when the Company’sCompany's ability to continue normal operations is seriously restricted by events beyond the control of the Company. The Company has reserved the right to terminate this plan effective at the end of a calendar year by giving notice of such termination not less than six months prior to the end of such year.F-32LINCOLN ELECTRIC HOLDINGS, INC.NOTES TO CONSOLIDATED FINANCIAL STATEMENTS — (Continued)NOTE 912 – INCOME TAXESThe components of income (loss) before income taxes for the three years ended December 31, 20092012 were as follows: Year Ended December 31, 2009 2008 2007 $ 110,909 $ 223,672 $ 205,779 (24,428 ) 76,137 81,378 $ 86,481 $ 299,809 $ 287,157 The components of income tax expense (benefit) for the three years ended December 31, 2009 were as follows: Year Ended December 31, 2009 2008 2007 $ 25,688 $ 51,700 $ 61,277 15,943 21,880 20,313 3,364 6,576 6,542 44,995 80,156 88,132 (4,612 ) 8,622 (711 ) (2,735 ) (1,435 ) (3,712 ) 257 180 712 (7,090 ) 7,367 (3,711 ) $ 37,905 $ 87,523 $ 84,421 Year Ended December 31, 2012 2011 2010 U.S. $ 243,382 $ 204,667 $ 135,756 Non-U.S. 126,188 96,664 51,352 Total $ 369,570 $ 301,331 $ 187,108 F-28LINCOLN ELECTRIC HOLDINGS, INC.NOTES TO CONSOLIDATED FINANCIAL STATEMENTS (Continued)(Dollars in thousands, except share and per share amounts)The components of income tax expense (benefit) for the three years ended December 31, 2012 were as follows: Year Ended December 31, 2012 2011 2010 Current: Federal $ 72,809 $ 42,510 $ 30,642 Non-U.S. 33,510 19,970 15,532 State and local 8,172 6,699 4,337 114,491 69,179 50,511 Deferred: Federal (1,673 ) 12,140 6,802 Non-U.S. (750 ) 2,768 (2,640 ) State and local 286 231 225 (2,137 ) 15,139 4,387 Total $ 112,354 $ 84,318 $ 54,898 The differences between total income tax expense and the amount computed by applying the statutory Federalfederal income tax rate to income before income taxes for the three years ended December 31, 20092012 were as follows: Year Ended December 31, 2009 2008 2007 $ 30,268 $ 104,933 $ 100,505 2,443 4,454 4,964 21,646 (6,203 ) (11,881 ) (2,310 ) (4,170 ) (3,583 ) (14,486 ) (6,888 ) 1,151 (137 ) (4,309 ) (6,818 ) 481 (294 ) 83 $ 37,905 $ 87,523 $ 84,421 43.83 % 29.19 % 29.40 % Year Ended December 31, 2012 2011 2010 Statutory rate of 35% applied to pre-tax income $ 129,350 $ 105,466 $ 65,488 Effect of state and local income taxes, net of federal tax benefit 5,598 4,585 3,044 Taxes (less) more than the U.S. tax rate on non-U.S. earnings, including utilization of tax loss carry-forwards, losses with no benefit and changes in non-U.S. valuation allowance (11,263 ) (13,637 ) (1,417 ) Manufacturing deduction (6,287 ) (5,330 ) (3,900 ) U.S. tax cost (benefit) of foreign source income (4,766 ) 145 (3,282 ) Resolution and adjustments to uncertain tax positions (1,493 ) (5,103 ) (3,204 ) Other 1,215 (1,808 ) (1,831 ) Total $ 112,354 $ 84,318 $ 54,898 Effective tax rate 30.40 % 27.98 % 29.34 % The 2012 effective tax rate is impacted by the geographic mix of earnings and taxes at lower rates in foreign jurisdictions, including Canada, Mexico, Poland and the U.K., as well as loss utilization in other foreign jurisdictions. Total income tax payments, net of refunds, were $33,522$78,506 in 2009, $72,9232012, $62,600 in 20082011 and $83,950$40,970 in 2007.F-33F-29LINCOLN ELECTRIC HOLDINGS, INC.NOTES TO CONSOLIDATED FINANCIAL STATEMENTS — (Continued)NOTE 9 – INCOME TAXES (continued)Unrecognized Tax BenefitsIn 2007, the Company adopted FIN 48, subsequently codified(Dollars in ASC 740, which clarified the recognition thresholdthousands, except share and measurement attribute for the financial statement recognition and measurement of a tax position taken or expected to be taken in a tax return. The Company’s unrecognized tax benefits upon adoption were $28,997 and the cumulative effect of adoption was recorded as a decrease of $1,590 to retained earnings.Liabilities for unrecognized tax benefits are classified as “Accrued taxes” non-current unless expected to be paid in one year. The Company recognizes interest and penalties related to unrecognized tax benefits in “Income taxes.” For the years ended December 31, 2009 and 2008, current income tax expense included $2,194 and $1,044 of interest and penalties, respectively. For those same years, the Company’s accrual for interest and penalties related to unrecognized tax benefits totaled $10,547 and $6,141, respectively.The following table summarizes the activity related to unrecognized tax benefits: 2009 2008 $ 34,183 $ 29,215 3,973 7,646 710 2,734 6,617 — (1,685 ) — (1,200 ) (4,255 ) 242 (1,157 ) $ 42,840 $ 34,183 The total amount of unrecognized tax benefits that, if recognized, would affect the effective tax rate was $27,182 at December 31, 2009 and $19,945 at December 31, 2008.The Company files income tax returns in the U.S. and various state, local and foreign jurisdictions. With few exceptions, the Company is no longer subject to U.S. federal, state and local or non-U.S. income tax examinations by tax authorities for years before 2005. The Company anticipates no significant changes to its total unrecognized tax benefits through the end of 2010. The Company is currently subject to an IRS audit for the tax years 2005 – 2008 and an Indonesian tax audit for 2005 – 2006. The Company does not expect the results of these examinations to have a material effect on the consolidated financial statements.F-34LINCOLN ELECTRIC HOLDINGS, INC.NOTES TO CONSOLIDATED FINANCIAL STATEMENTS — (Continued)NOTE 9 – INCOME TAXES (continued)Deferred TaxesSignificant components of deferred tax assets and liabilities at December 31, 20092012 and 2008,2011, were as follows: December 31, 2009 2008 $ 44,634 $ 16,918 10,724 8,548 16,249 12,710 14,445 13,502 42,106 63,130 13,572 16,282 141,730 131,090 (34,095 ) (18,295 ) 107,635 112,795 35,316 31,338 13,766 10,998 11,012 10,970 2,016 2,052 12,104 10,314 74,214 65,672 $ 33,421 $ 47,123 December 31, 2012 2011 Deferred tax assets: Tax loss and credit carry-forwards $ 40,373 $ 32,313 Inventory 1,328 3,639 Other accruals 14,981 15,653 Employee benefits 17,904 17,600 Pension obligations 82,903 79,371 Other 12,686 7,111 Deferred tax assets, gross 170,175 155,687 Valuation allowance (38,799 ) (31,713 ) Deferred tax assets, net 131,376 123,974 Deferred tax liabilities: Property, plant and equipment 41,380 40,806 Intangible assets 19,545 13,251 Inventory 5,783 2,973 Pension obligations 2,940 1,676 Other 8,769 9,685 Deferred tax liabilities 78,417 68,391 Total Deferred taxes $ 52,959 $ 55,583 At December 31, 2009,2012, certain subsidiaries had tax loss carryforwardscarry-forwards of approximately $120,928$132,868 that will expire in various years from 20102013 through 2029,2030, except for $36,853$27,894 for which there is no expiration date.In assessing the realizability of deferred tax assets, the Company assesses whether it is more likely than not that a portion or all of the deferred tax assets will not be realized. The Company considers the scheduled reversal of deferred tax liabilities, tax planning strategies, and projected future taxable income in making this assessment. At December 31, 2009,2012, a valuation allowance of $34,095$38,799 was recorded against certain deferred tax assets based on this assessment. The Company believes it is more likely than not that the tax benefit of the remaining net deferred tax assets will be realized. The amount of net deferred tax assets considered realizable could be increased or decreased in the future if the Company’sCompany's assessment of future taxable income or tax planning strategies changes.The Company does not provide deferred income taxes on unremitted earnings of certain non-U.S. subsidiaries which are deemed permanently reinvested. It is not practicable to calculate the deferred taxes associated with the remittance of these earnings. Deferred income taxes of $283 have been provided onassociated with earnings of $1,831$3,776 that are not expected to be permanently reinvested.Unrecognized Tax BenefitsLiabilities for unrecognized tax benefits are classified as "Accrued taxes" non-current unless expected to be paid in one year. The Company recognizes interest and penalties related to unrecognized tax benefits in "Income taxes." Current income tax expense included an expense of $893 for the year ended December 31, 2012 and a benefit of $505 for the year ended December 31, 2011 for interest and penalties. For those same years, the Company's accrual for interest and penalties related to unrecognized tax benefits totaled $10,295 and $9,039, respectively.F-30LINCOLN ELECTRIC HOLDINGS, INC.NOTES TO CONSOLIDATED FINANCIAL STATEMENTS (Continued)(Dollars in thousands, except share and per share amounts)The following table summarizes the activity related to unrecognized tax benefits: 2012 2011 Balance at January 1 $ 26,656 $ 38,393 Increase related to current year tax provisions 3,838 2,221 Increase related to prior years' tax positions 212 3,250 Increase related to acquisitions 1,274 — Decrease related to settlements with taxing authorities (940 ) (3,424 ) Resolution of and other decreases in prior years' tax liabilities (5,964 ) (13,460 ) Other 179 (324 ) Balance at December 31 $ 25,255 $ 26,656 The total amount of unrecognized tax benefits that, if recognized, would affect the effective tax rate was $14,839 at December 31, 2012 and $17,325 at December 31, 2011.The Company files income tax returns in the U.S. and various state, local and foreign jurisdictions. With few exceptions, the Company is no longer subject to U.S. federal, state and local or non-U.S. income tax examinations by tax authorities for years before 2003. The Company is currently subject to various U.S. state audits and an Indonesian tax audit for 2003 - 2007.The Company is generally not able to precisely estimate the ultimate settlement amounts or timing until after the close of an audit. The Company evaluates its tax positions and establishes liabilities for uncertain tax positions that may be challenged by local authorities and may not be fully sustained.Unrecognized tax benefits are reviewed on an ongoing basis and are adjusted for changing facts and circumstances, including progress of tax audits and closing of statutes of limitations. Based on information currently available, management believes that additional audit activity could be completed and/or statutes of limitations may close relating to existing unrecognized tax benefits. It is reasonably possible there could be a further reduction of $5,045 in prior years' unrecognized tax benefits in 2013.In July 2012, the Company received a Notice of Reassessment from the Canada Revenue Agency (the “CRA”) for 2004 to 2011, which would disallow the deductibility of inter-company dividends. These adjustments would increase Canadian federal and provincial tax due by $62,120 plus approximately $17,156 of interest, net of tax. The Company disagrees with the position taken by the CRA and believes it is without merit. The Company will vigorously contest the assessment through the Tax Court of Canada. A trial date has not yet been scheduled.In connection with the litigation process, the Company is required to deposit no less than one-half of the tax and interest assessed by the CRA. The Company has elected to deposit the entire amount of the dispute in order to suspend the continuing accrual of a 5% interest charge. Additionally, deposited amounts will earn interest of approximately 1% due upon a favorable outcome. A deposit was made and is recorded as a non-current asset valued at $89,220 as of December 31, 2012. Any Canadian tax ultimately due will be creditable in the parent company's U.S. federal tax return. The Company expects to be able to utilize the full amount of foreign tax credits generated in the statutorily allowed carry-back and carry-forward periods. Accordingly, should the Company not prevail in this dispute, the income statement charge will approximate the deficiency interest, net of tax.The Company believes it will prevail on the merits of the tax position. In accordance with prescribed recognition and measurement thresholds, no income tax accrual has been made for any uncertain tax positions related to the CRA reassessment. An unfavorable resolution of this matter could have a material effect on the Company's financial statements in the quarter in which a judgment is reached.NOTE 1013 – DERIVATIVES AND FAIR VALUEThe Company uses derivatives to manage exposures to currency exchange rates, interest rates and commodity prices arising in the normal course of business. Derivative contracts to hedge currency and commodity exposures are generally written on a short-term basis but may cover exposures for up to two years while interest rate contracts may cover longer periods consistent with the terms of the underlying debt. The Company does not enter into derivatives for trading or speculative purposes.F-35LINCOLN ELECTRIC HOLDINGS, INC.NOTES TO CONSOLIDATED FINANCIAL STATEMENTS — (Continued)NOTE 10 – DERIVATIVES AND FAIR VALUE (continued)All derivatives are recordedrecognized at fair value on the balance sheet.Company's Consolidated Balance Sheets. The accounting for gains and losses resulting from changes in fair value depends on the use of the derivative and whether it is designated and qualifies for hedge accounting. The Company formally documents the relationship of the hedge with the hedged item as well as the risk-management strategy for all designated hedges. Both at inception and on an ongoing basis, the hedging instrument is assessed as to its effectiveness, when applicable. If and when a derivative is determined not to be highly effective as a hedge, or theF-31LINCOLN ELECTRIC HOLDINGS, INC.NOTES TO CONSOLIDATED FINANCIAL STATEMENTS (Continued)(Dollars in thousands, except share and per share amounts)underlying hedged transaction is no longer likely to occur, or the derivative is terminated, hedge accounting is discontinued. The cash flows from settled derivative contracts are recordedrecognized in operating activities in the Company's Consolidated Statements of Cash Flows. Hedge ineffectiveness was immaterial for the three years ended December 31, 2009.The Company is subject to the credit risk of the counterparties to derivative instruments. Counterparties include a number of major banks and financial institutions. The Company manages individual counterparty exposure by monitoring the credit rating of the counterparty and the size of financial commitments and exposures between the Company and the counterparty. None of the concentrations of risk with any individual counterparty was considered significant at December 31, 2009.2012. The Company does not expect any counterparties to fail to meet their obligations.Cash flow hedgesCertain foreign currency forward contracts wereare qualified and designated as cash flow hedges. The dollar equivalent gross notional amount of these short-term contracts was $3,570$39,597 at December 31, 20092012 and $35,807$65,721 at December 31, 2008.2011. The effective portions of the fair value gains or losses on these cash flow hedges were recordedare recognized in “AccumulatedAccumulated other comprehensive income” (“AOCI”income ("AOCI") and subsequently reclassified to “CostCost of goods sold”sold or “Sales”Sales for hedges of purchases and sales, respectively, as the underlying hedged transactions affected earnings. The Company reclassified a net loss of $61 from AOCI to earnings based on the probability of the forecasted transactions no longer occurring for the year ended December 31, 2009.Fair value hedgesIn February 2009, the Company terminated interest rate swaps that were qualified and designated as fair value hedges that converted notional amounts of $80,000 of debt from fixed to floating interest rates. The gain of $5,079 realized on termination was deferred and is being amortized as an offset to “Interest expense” over the remaining life of the Note. The fair value gains or losses on these contracts prior to settlement were recognized in earnings and offset by fair value losses or gains on the fixed-rate borrowings.In March 2009, interest rate swaps designated as fair value hedges that converted notional amounts of $30,000 of debt from fixed to floating interest rates matured with the underlying Note. The fair value gains or losses on these contracts were recognized in earnings and offset by fair value losses or gains on the fixed-rate borrowings.At December 31, 2008, the Company had interest rate swap agreements outstanding that effectively converted notional amounts of $110,000 of debt from fixed to floating interest rates. The fair value of the swaps was an unrealized gain of $6,148 at December 31, 2008.Derivatives not designated as hedging instrumentsThe Company has certain foreign exchange forward contracts which wereare not designated as hedges. These derivatives wereare held as economic hedges of certain balance sheet exposures. The dollar equivalent gross notional amount of these contracts was $102,410$189,259 at December 31, 20092012 and $65,040$161,026 at December 31, 2008.2011. The fair value gains or losses from these contracts wereare recognized currently in “Selling,Selling, general and administrative expenses,” offsetting the losses or gains on the exposures being hedged.F-36LINCOLN ELECTRIC HOLDINGS, INC.NOTES TO CONSOLIDATED FINANCIAL STATEMENTS — (Continued)NOTE 10 – DERIVATIVES AND FAIR VALUE (continued)The Company dedesignated commodity forward contracts at the inception of 2009 that had previously been designated and qualified as cash flow hedges. At December 31, 2009, the notional amounts, in thousands of pounds, of these contracts consisted of aluminium forward contracts of 450, copper forward contracts of 450 and nickel forward contracts of 54. The effective portion of the fair value gains or losses on these instruments were recorded in AOCI while the instruments were designated and qualified as cash flow hedges. Realized gains and losses were reclassified to earnings as the underlying hedged transactions affected earnings. For the year ended December 31, 2009, the Company reclassified a loss of $1,262 from AOCI to earnings based on the probability of the forecasted transactions no longer occurring. Subsequent to dedesignation, the fair value gains or losses on these instruments were recognized currently in earnings.At December 31, 2008, the notional amounts, in thousands of pounds, of the Company’s derivative contracts consisted of aluminium forward contracts of 3,125, copper forward contracts of 2,925 and nickel forward contracts of 276. These derivative financial instruments qualified and were designated as cash flow hedges.a notional amountamounts of 250,000275,000 troy ounces and 375,000 pounds, respectively, at December 31, 2012 and short-term silver forward contracts with notional amounts of 340,000 troy ounces at December 31, 2009.2011. Realized and unrealized gains and losses on these contracts were recorded to earnings.Fair values of derivative instruments in the Company's Consolidated Balance SheetSheets follow: December 31, 2009 Other
Current
Assets Other
Current
Liabilities $ 63 $ 12 133 1,017 611 186 $ 807 $ 1,215 At December 31, 2008, the fair value of the non-designated foreign exchange contracts, the designated cash flow hedges and the commodity forward contracts was an unrealized loss of $4,732, an unrealized gain of $3,076 and an unrealized loss of $7,708, respectively. December 31, 2012 December 31, 2011 Derivatives by hedge designation OtherCurrentAssets OtherCurrentLiabilities OtherCurrentAssets OtherCurrentLiabilitiesDesignated as hedging instruments: Foreign exchange contracts $ 352 $ 325 $ 801 $ 531 Not designated as hedging instruments: Foreign exchange contracts 510 902 726 1,026 Commodity contracts 731 — 1,559 — Total derivatives $ 1,593 $ 1,227 $ 3,086 $ 1,557 The effects of designated fair value hedges and undesignated derivative instruments on the Company's Consolidated StatementStatements of Income for the yearyears ended December 31, 20092012 and 2011 consisted of the following: Year Ended
December 31,
2009 Interest expense $ 181 Selling, general & administrative expenses (6,053 ) Cost of goods sold 3,613 F-37 Year Ended December 31, Derivatives by hedge designation Classification of gains (losses) 2012 2011 Not designated as hedges: Foreign exchange contracts Selling, general & administrative expenses $ 3,711 $ 92 Commodity contracts Cost of goods sold (1,117 ) 1,167 Commodity contracts Other income — (12 ) F-32LINCOLN ELECTRIC HOLDINGS, INC.NOTES TO CONSOLIDATED FINANCIAL STATEMENTS — (Continued)(Dollars in thousands, except share and per share amounts)NOTE 10 – DERIVATIVES AND FAIR VALUE (continued)StatementStatements of Income for the yearyears ended December 31, 20092012 and 2011 consisted of the following:
net of tax December 31, 2009
from AOCI to: Year Ended
December 31, 2009 $ (5 ) Sales $ (149 ) Cost of goods sold 1,851 (639 ) Cost of goods sold (6,150 ) December 31, Total gain recognized in AOCI, net of tax 2012 2011 Foreign exchange contracts $ 80 $ 912 The Company expects $644a gain of $80 related to existing contracts to be reclassified from AOCI, net of tax, to earnings over the next 12 months as the hedged transactions are realized.Financial Year Ended December 31, Derivative type Gain (loss) reclassified from AOCI to: 2012 2011 Foreign exchange contracts Sales $ 931 $ (91 ) Cost of goods sold 234 (1,292 ) NOTE 14 – FAIR VALUEThe following table provides a summary of fair value assets and liabilities such as the Company’sof December 31, 2012 measured at fair value on a recurring basis:Description Balance as of December 31, 2012 Quoted Prices inActive Markets forIdentical Assets orLiabilities(Level 1) Significant OtherObservable Inputs(Level 2) SignificantUnobservableInputs (Level 3)Assets: Foreign exchange contracts $ 862 $ — $ 862 $ — Commodity contracts 731 — 731 — Total assets $ 1,593 $ — $ 1,593 $ — Liabilities: Foreign exchange contracts $ 1,227 $ — $ 1,227 $ — Contingent consideration 4,894 — — 4,894 Deferred compensation 16,882 — 16,882 — Total liabilities $ 23,003 $ — $ 18,109 $ 4,894 The following table provides a summary of fair value assets and liabilities as of December 31, 2011 measured at fair value on a recurring basis:Description Balance as of December 31, 2011 Quoted Prices inActive Markets forIdentical Assets orLiabilities(Level 1) Significant OtherObservable Inputs(Level 2) SignificantUnobservableInputs (Level 3)Assets: Foreign exchange contracts $ 1,527 $ — $ 1,527 $ — Commodity contracts 1,559 — 1,559 — Total assets $ 3,086 $ — $ 3,086 $ — Liabilities: Foreign exchange contracts $ 1,557 $ — $ 1,557 $ — Contingent consideration 4,297 — — 4,297 Deferred compensation 14,936 — 14,936 — Total liabilities $ 20,790 $ — $ 16,493 $ 4,297 The Company's derivative contracts are valued at fair value using the market and income valuation approaches.approach. The Company usesmeasures the fair value of foreign exchange contracts using Level 2 inputs based on observable spot and forward rates in active markets. The CompanyF-33LINCOLN ELECTRIC HOLDINGS, INC.NOTES TO CONSOLIDATED FINANCIAL STATEMENTS (Continued)(Dollars in thousands, except share and per share amounts)measures the fair value of commodity contracts using Level 2 inputs through observable market approach to value similar assets and liabilitiestransactions in active markets provided by financial institutions. During the year ended December 31, 2012, there were no transfers between Levels 1, 2 or 3.In connection with an acquisition, the Company recorded a contingent consideration fair valued at $4,894 as of December 31, 2012, which reflects a $597 increase in the liability from December 31, 2011. The contingent consideration is based upon estimated sales for the five-year period ending December 31, 2015 and will be paid in 2016 based on actual sales during the income approach that consistsfive-year period. The fair value of the contingent consideration is a Level 3 valuation and fair valued using a probability weighted discounted cash flow models that take into accountanalysis. The discounted cash flow utilized weighted average inputs, including a risk based discount rate of 9.7% and a compounded annual revenue growth rate of 33.7%. The discount rate was determined using discount rates of 3.5% reflective of the presentCompany's cost of debt and 14.1% as a risk adjusted cost of capital and the compounded annual revenue growth rate was determined using various scenarios with growth ranging from remaining relatively flat to growth rates of up to 66.2%.The deferred compensation liability is the Company's obligation under its executive deferred compensation plan. The Company measures the fair value of future cash flows under the termsliability using the market values of the contracts using current market information as of the reporting date.The following hierarchy is used to classify the inputs used to measure fair value:Level 1Unadjusted quoted prices in active markets for identical assets or liabilities.Level 2Unadjusted quoted prices in active markets for similar assets or liabilities, or unadjusted quoted prices for identical or similar assets or liabilities in markets that are not active, or inputs other than quoted prices that are observable for the asset or liability.Level 3Unobservable inputs for the asset or liability.The following table provides a summary of fair value measurements: Fair Value Measurements at December 31, 2009 Using Balance as of
December 31, 2009 Quoted Prices in
Active Markets for
Identical Assets
(Level 1) Significant Other
Observable Inputs
(Level 2) Significant
Unobservable Inputs
(Level 3) $ 408 $ — $ 408 $ — The Company has various financial instruments, including cash and cash equivalents, short-and long-term debt and forward contracts. While these financial instruments are subject to concentrations of credit risk, the Company has minimized this risk by entering into arrangements with a number of major banks and financial institutions and investing in several high-quality instruments. The Company does not expect any counterparties to fail to meet their obligations. The fair value of cash"Cash and cash equivalents," "Accounts receivable," "Amounts due banks" and "Trade accounts payable" approximated book value due to the short-term nature of these instruments at both December 31, 20092012 and 2008.December 31, 2011. See Note 68 for the fair value estimate of debt.NOTE 1115 – OPERATINGINVENTORYFor most domestic inventories, cost is determined principally by the LIFO method, and for non-U.S. inventories, cost is determined by the FIFO method. The valuation of LIFO inventories is made at the end of each year based on inventory levels and costs at that time. Accordingly, interim LIFO calculations are based on management's estimates of expected year-end inventory levels and costs. Because these estimates are subject to many factors beyond management's control, annual results may differ from interim results as they are subject to the final year-end LIFO inventory valuation. At December 31, 2012 and 2011, approximately 34% and 31%, respectively, of total inventories were valued using the LIFO method. The excess of current cost over LIFO cost was $72,173 at December 31, 2012 and $78,292 at December 31, 2011.NOTE 16 – LEASESThe Company leases sales offices, warehouses and distribution centers, transportation equipment, office equipment and data processing equipment. Such leases, some of which are noncancelable and, in many cases, include renewals, expire at various dates. The Company pays most insurance, maintenance and taxes relating to leased assets. Rental expense was $14,275$17,751 in 2009, $14,6792012, $15,221 in 20082011 and $13,883$14,155 in 2007.2010.At December 31, 2009,2012, total future minimum lease payments for noncancelable operating leases were $9,923$12,624 in 2010, $7,2312013, $9,385 in 2011, $5,3282014, $6,872 in 2012, $2,7632015, $5,695 in 2013, $2,2322016, $4,561 in 20142017 and $7,232$7,082 thereafter.F-38LINCOLN ELECTRIC HOLDINGS, INC.NOTES TO CONSOLIDATED FINANCIAL STATEMENTS — (Continued)The following table summarizes assets held under capital leases and included in property, plant and equipment: December 31, 2012 2011 Buildings $ 441 $ 6,236 Machinery and equipment 209 179 Less: accumulated depreciation (163 ) (2,494 ) Net capital leases $ 487 $ 3,921 NOTE 1217 – CONTINGENCIESThe Company, like other manufacturers, is subject from time to time to a variety of civil and administrative proceedings arising in the ordinary course of business. Such claims and litigation include, without limitation, product liability claims and health, safety and environmental claims, some of which relate to cases alleging asbestos and manganese induced illnesses. The claimants in the asbestos and manganese cases seek compensatory and punitive damages, in most cases for unspecified amounts. The Company believes it has meritorious defenses to these claims and intends to contest such suits vigorously.F-34LINCOLN ELECTRIC HOLDINGS, INC.NOTES TO CONSOLIDATED FINANCIAL STATEMENTS (Continued)(Dollars in thousands, except share and per share amounts)The Company’s reserveCompany's accrual for contingent liabilities primarily for product liability claims, was $15,333$5,636 as of December 31, 20092012 and $12,308$11,312 as of December 31, 2008.2011. The reserveaccrual is included in “Other"Other current liabilities.”" The Company also hasrecognized an asset for recoveries from insurance carriers onrelated to the outstanding insured claims outstanding of $11,235$1,311 as of December 31, 20092012 and $11,041$4,516 as of December 31, 2008.2011. The asset is included in “Other"Other current assets.”The Company accrues its best estimate of the probable costs, after a review of the facts with management and counsel and taking into account past experience. If an unfavorable outcome is determined to be reasonably possible but not probable, or if the amount of loss cannot be reasonably estimated, disclosure is provided for material claims or litigation. Many of the current cases are in differing procedural stages and information on the circumstances of each claimant, which forms the basis for judgments as to the validity or ultimate disposition of such actions, varies greatly. Therefore, in many situations a range of possible losses cannot be made. Reserves are adjusted as facts and circumstances change and related management assessments of the underlying merits and the likelihood of outcomes change. Moreover, reserves only cover identified and/or asserted claims. Future claims could, therefore, give rise to increases to such reserves.Based on the Company’sCompany's historical experience in litigating product liability claims, including a significant number of dismissals, summary judgments and defense verdicts in many cases and immaterial settlement amounts, as well as the Company’sCompany's current assessment of the underlying merits of the claims and applicable insurance, the Company believes resolution of these claims and proceedings, individually or in the aggregate, (exclusive of defense costs), will not have a material adverse impact uponeffect on the Company’sCompany's consolidated financial statements.NOTE 18 – PRODUCT WARRANTY COSTSThe Company has provided a guarantee on loanschanges in the carrying amount of product warranty accruals for an unconsolidated joint venture of approximately $1,381 at December 31, 2009. The loans, maturing in July 2012, 2011 and 2010 were undertaken to fund the joint venture’s working capital and capital expansion needs. The Company would become liable for any unpaid principal and accrued interest if the joint venture were to default on payment at the respective maturity dates. The Company believes the likelihood is remote that any payment will be required under these arrangements based on the current financial condition of the joint venture. December 31, 2012 2011 2010 Balance at beginning of year $ 15,781 $ 16,879 $ 16,768 Accruals for warranties 10,872 10,395 11,406 Settlements (11,477 ) (11,260 ) (11,065 ) Foreign currency translation 128 (233 ) (230 ) Balance at end of year $ 15,304 $ 15,781 $ 16,879 NOTE 1319 – QUARTERLY FINANCIAL DATA (UNAUDITED) First Second Third Fourth $ 411,751 $ 413,283 $ 441,802 $ 462,449 90,248 106,391 125,131 134,498 (2,010 ) 23,865 24,231 40,395 (3,594 ) 15,068 12,757 24,345 $ (0.08 ) $ 0.36 $ 0.30 $ 0.57 $ (0.08 ) $ 0.35 $ 0.30 $ 0.57 $ 620,227 $ 699,826 $ 632,892 $ 526,186 177,451 204,714 196,878 141,108 78,991 95,100 92,882 32,836 53,477 70,128 69,211 19,470 $ 1.25 $ 1.64 $ 1.62 $ 0.46 $ 1.24 $ 1.62 $ 1.60 $ 0.46 F-39 First Second Third Fourth 2012 Net sales $ 727,122 $ 744,045 $ 697,552 $ 684,648 Gross profit 215,265 224,997 213,362 213,032 Income before income taxes 92,919 98,157 90,889 87,605 Net income 64,243 66,319 64,765 62,084 Basic earnings per share $ 0.77 $ 0.80 $ 0.78 $ 0.75 Diluted earnings per share $ 0.76 $ 0.79 $ 0.77 $ 0.74 2011 Net sales $ 599,179 $ 699,293 $ 701,624 $ 694,513 Gross profit 161,438 195,504 185,452 194,343 Income before income taxes 60,537 81,494 75,873 83,427 Net income 46,910 57,013 55,530 57,733 Basic earnings per share $ 0.56 $ 0.69 $ 0.66 $ 0.69 Diluted earnings per share $ 0.55 $ 0.68 $ 0.66 $ 0.68 F-35LINCOLN ELECTRIC HOLDINGS, INC.NOTES TO CONSOLIDATED FINANCIAL STATEMENTS — (Continued)(Dollars in thousands, except share and per share amounts)NOTE 13 – QUARTERLY FINANCIAL DATA (UNAUDITED) (continued)20092012 includes a chargerationalization and asset impairment net charges of $3,298 ($2,786$5,037 ($3,823 after-tax) primarily related to rationalization activities to alignemployee severance and other costs associated with the business to current market conditionsconsolidation of manufacturing operations in North America Welding, Europe Welding and impairment charges of $879 ($596 after-tax) to certain indefinite-lived intangible assets.The quarter ended September 30, 20092012 includes rationalization and asset impairment net charges of $3,059 ($2,704 after-tax) primarily related to employee severance and other costs associated with the consolidation of manufacturing operations in North America Welding, Europe Welding and Asia Pacific Welding segments.The quarter ended June 30, 2012 includes rationalization net charges of $1,258 ($915 after-tax) primarily related to employee severance and other costs associated with the consolidation of manufacturing operations in North America Welding, Europe Welding and Asia Pacific Welding segments and a charge of $7,144 ($6,340$1,381 ($906 after-tax) related to a change in Venezuelan labor law, which provides for increased employee severance obligations in the South America Welding segment.The quarter ended June 30, 2011 includes rationalization activitiesand asset impairment net gains of $75 ($44 after-tax) primarily related to align the businessgain on sale of assets at rationalized operations in the Asia Pacific Welding segment resulting from actions initiated in 2009.The quarter ended March 31, 2011 includes rationalization and asset impairment net charges of $357 ($281 after-tax) primarily related to current market conditions including the closure of a manufacturing facility in Europeemployee severance and other costs associated with the consolidation of certain manufacturing operations in the Europe Welding and Asia Pacific Welding segments and a loss of $7,943 ($7,943 after-tax) on the acquisition of Jin Tai.The quarter ended June 30,resulting from actions initiated in 2009 includes a charge of $6,877 ($6,639 after-tax) related to the Company’s rationalization activities to align the business to current market conditions including the closure of a manufacturing facility in The Harris Products Group segment, a pension settlement gain of $1,543 ($1,543 after-tax) and a gain on the sale of a property by the Company’s joint venture in Turkey of $5,667 ($5,667 after-tax).The quarter ended March 31, 2009 includes a charge of $11,699 ($7,428 after-tax)Company’s rationalization activities to align the business to current market conditions including a voluntary separation incentive program covering certain U.S.-based employees.The quarter ended December 31, 2008 includes a charge of $2,447 ($1,698 after-tax) related to the Company’s rationalization activities to align the business to current market conditions and $16,924 ($16,615 after-tax) in asset impairment charges including $13,194 of goodwill impairment with no tax benefit, $2,388 in impairment of long-lived assets with no tax benefit and $1,342 ($1,033 after-tax) in impairment of intangible assets.The quarterly earnings per share (EPS)("EPS") amounts are each calculated independently. Therefore, the sum of the quarterly EPS amounts may not equal the annual totals.F-40F-36SCHEDULE II – VALUATION AND QUALIFYING ACCOUNTSLINCOLN ELECTRIC HOLDINGS, INC. AND SUBSIDIARIES(In thousands) Additions Balance at
Beginning
of Period Charged to
Costs and
Expenses (1)
Charged to
Other
Accounts (2)
Deductions Balance
at End
of Period $ 7,673 $ 2,685 $ 368 $ 2,552 $ 8,174 7,424 3,986 (735 ) 3,002 7,673 8,484 3,115 630 4,805 7,424 Additions Description Balance atBeginningof Period Charged toCosts andExpenses (1)Charged toOtherAccounts (2)Deductions Balance at End of Period Allowance for doubtful accounts: Year Ended December 31, 2012 $ 7,079 $ 3,368 $ 68 $ 1,861 $ 8,654 Year Ended December 31, 2011 7,855 2,173 (303 ) 2,646 7,079 Year Ended December 31, 2010 8,174 3,146 (425 ) 3,040 7,855 (1) Currency translation adjustment. (2) Uncollectible accounts written-off, net of recoveries. F-41F-37QuickLinks