SECURITIES AND EXCHANGE COMMISSION
x
|
| |
| ý | ANNUAL REPORT PURSUANT TO SECTION 13 OR 15(d) OF THE SECURITIES EXCHANGE ACT OF 1934 |
For the fiscal year ended December 31,
20092011
¨
|
| |
| ¨ | TRANSITION REPORT PURSUANT TO SECTION 13 OR 15(d) OF THE SECURITIES EXCHANGE ACT OF 1934 |
For the transition period fromto Commission File Number 000-30975
(Exact Name of Registrant as Specified in its Charter)
|
| | |
| Delaware | | 91-1789357 |
(State or Other Jurisdiction of Incorporation or Organization) | | Identification Number) |
| |
Omaha, NE 68164
| | 68164 |
| (Address of Principal Executive Offices) | | (Zip Code) |
(Registrant’s Telephone Number, Including Area Code)
Securities registered pursuant to Section 12(b) of the Act:
|
| | |
Title of Each Class | | Name of Each Exchange On Which Registered |
None | | N/A |
Securities registered pursuant to Section 12(g) of the Act:
Common Stock, par value $.01 per share
Indicate by check mark if the registrant is a well-known seasoned issuer, as defined in Rule 405 of the Securities Act.
Indicate by check mark if the registrant is not required to file reports pursuant to Section 13 or Section 15(d) of the Exchange Act.
Indicate by check mark whether the registrant (1) has filed all reports required to be filed by Section 13 or 15(d) of the Securities Exchange Act of 1934 during the preceding 12 months (or for such shorter period that the registrant was required to file such reports), and (2) has been subject to such filing requirements for the past 90 days.
Indicate by check mark whether the registrant has submitted electronically and posted on its corporate Web site, if any, every Interactive Data File required to be submitted and posted pursuant to Rule 405 of Regulation S-T (§232.405 of this chapter) during the preceding 12 months (or for such shorter period that the registrant was required to submit and post such files).
Indicate by check mark if disclosure of delinquent filers pursuant to Item 405 of Regulation S-K is not contained herein, and will not be contained, to the best of registrant’s knowledge, in definitive proxy or information statements incorporated by reference in Part III of this Form 10-K or any amendment to this Form10-K
Indicate by check mark whether the registrant is a large accelerated filer, an accelerated filer, a non-accelerated filer or a smaller reporting company. See definition of “accelerated filer”, “large accelerated filer” and “smaller reporting company” in Rule 12b-2 of the Exchange Act. (Check one):
Large Accelerated Filer¨ Accelerated Filerý Non-Accelerated Filer ¨ Non-Accelerated Filer¨ Smaller Reporting Company
x¨ (Do not check if a smaller reporting company)
Indicate by check mark whether the registrant is a shell company (as defined in Exchange Act Rule 12b-2).
The aggregate market value of the voting and non-voting common equity held by non-affiliates of the registrant based on the last reported closing price per share of Common Stock as reported on the OTC Bulletin Board on the last business day of the registrant’s most recently completed second quarter was approximately
$14.5$86.2 million.
At
February 25, 2010,March 13, 2012, the registrant had
49,189,67271,625,725 shares of Common Stock outstanding.
DOCUMENTS INCORPORATED BY REFERENCE
Portions
Index to Form 10-K for the Fiscal Year Ended December 31, 20092011 | | |
| | | |
PART I | | | |
| PART I | | | | |
| | Item 1. | Business | | | K-2 |
| | Item 1A. | | Risk Factors | | K-6 |
| | Item 1B. | | Unresolved Staff Comments | | K-12 |
| | Item 2. | Properties | | | K-12 |
| | Item 3. | | Legal Proceedings | | K-13 |
| | Item 4. | Mine Safety Disclosures | |
| PART II | | K-13 |
PART II | | | | | | |
| | Item 5. | | Market for Registrant’s Common Equity, Related Stockholder Matters and Issuer Purchases of Equity Securities | | K-14 |
| | Item 6. | | Selected Consolidated Financial Data | | K-15 |
| | Item 7. | | Management’s Discussion and Analysis of Financial Condition and Results of Operations | | K-16 |
| | Item 7A. | | Quantitative and Qualitative Disclosures About Market Risk | | K-25 |
| | Item 8. | | Financial Statements and Supplementary Data | |
| | |
| | | | Report of Independent Registered Public Accounting Firm | |
| | K-26 |
| | | | Consolidated Balance Sheets as of December 31, 20092011 and 20082010 | |
| | K-27 |
| | | | Consolidated Statements of Operations for the Years Ended December 31, 20092011, 2010 and 20082009 | |
| | K-28 |
| | | | Consolidated Statements of Stockholders’ Equity for the Years Ended December 31, 20092011, 2010 and 20082009 | |
| | K-29 |
| | | | Consolidated Statements of Cash Flows for the Years Ended December 31, 20092011, 2010 and 20082009 | |
| | K-30 |
| | | | Notes to the Consolidated Financial Statements for the Years Ended December 31, 20092011, 2010 and 20082009 | | K-31 |
| | Item 9 | | Changes in and Disagreements with Accountants on Accounting and Financial Disclosures | | K-50 |
| | Item 9A(T).9A. | | Controls and Procedures | | K-50 |
| | Item 9B. | | Other Information | |
| PART III | | K-51 |
PART III | | | | | | |
| | Item 10. | | Directors, Executive Officers and Corporate Governance | | K-52 |
| | Item 11. | | Executive Compensation | | K-53 |
| | Item 12. | | Security Ownership of Certain Beneficial Owners and Management and Related Stockholder Matters | | K-53 |
| | Item 13. | | Certain Relationships and Related Transactions, and Director Independence | | K-53 |
| | Item 14. | | Principal Accounting Fees and Services | |
| PART IV | | K-53 |
PART IV | | | | | | |
| | Item 15. | | Exhibits, Financial Statement Schedules | |
| | K-53 |
| SIGNATURES | |
| | K-58 |
This Annual Report on Form 10-K references the following registered trademarks which are the property of Transgenomic, Inc.: DNASEP® Columns, Cartridges, WAVE® System, WAVEMAKER® Software, TRANSFORMING THE WORLDTRANSGENOMIC® for Laboratory Equipment, TRANSGENOMIC® and the Globe Logo
®; MutationDiscovery.com® Website, OLIGOSEP® Cartridges for Systems and Reagents, OPTIMASE® Polymerase, RNASEP® Columns, SURVEYOR Cartridges, WAVE OPTIMIZED® reagents, WAVE OPTIMIZED® reagents, and WAVE MD Systems, MitoScreen®TM MD Systems. Additionally, this Annual Report on Form 10-K references the following trademarks which are the property of Transgenomic, Inc.: MitoScreen™ Kits, ProtocolWriter™ProtocolWriterTM Software, Navigator™NavigatorTM Software, THE POWER OF DISCOVERY® for Lab Reagents and Educational Programs, and SURVEYOR Nuclease® Nuclease, and FAMILION®. All other trademarks or trade names referred to in this Annual Report on Form 10-K are the property of their respective owners.
FORWARD-LOOKING STATEMENTS
This report, including Management’s Discussion & Analysis, contains forward-looking statements. These statements are based on management’s current views, assumptions or beliefs of future events and financial performance and are subject to uncertainty and changes in circumstances. Readers of this report should understand that these statements are not guarantees of performance or results. Many factors could affect our actual financial results and cause them to vary materially from the expectations contained in the forward-looking statements. These factors include, among other things: our expected revenue,
income(loss)income (loss), receivables, operating expenses, supplier pricing, availability and prices of raw materials, Medicare/Medicaid/Insurance reimbursements, product pricing, foreign currency exchange rates, sources of funding operations and acquisitions, our ability to raise funds, sufficiency of available liquidity, future interest costs, future economic circumstances,
business strategy, industry conditions
and key trends, our ability to execute our operating plans, the success of our cost savings initiatives, competitive environment and related market conditions,
expected financial and other benefits from our organizational restructuring activities, actions of governments and regulatory factors affecting our business and other risks as described in our reports filed with the Securities and Exchange
Commission.Commission (the "SEC"). In some cases these statements are identifiable through the use of words such as “anticipate,” “believe,” “estimate,” “expect,” “intend,” “plan,” “project,” “target,” “can,” “could,” “may,” “should,” “will,” “would” and similar expressions.
You are cautioned not to place undue reliance on these forward-looking statements. The forward-looking statements we make are not guarantees of future performance and are subject to various assumptions, risks and other factors that could cause actual results to differ materially from those suggested by these forward-looking statements. Actual results may differ materially from those suggested by the forward-looking statements that we make for a number of reasons including those described in Item 1A, “Risk Factors,” and other factors identified by cautionary language used elsewhere in this report.
We expressly disclaim any obligation to update or revise any forward-looking statements, whether as a result of new information, future events or otherwise, except as required by law.
The following discussion should be read together with our financial statements and related notes contained in this report. Results for the year ended December 31, 20092011 are not necessarily indicative of results that may be attained in the future.
Transgenomic, Inc. (together with its Affiliates, the “Company” or “Transgenomic”) provides innovative products for the purification and analysis of nucleic acids usedis a global biotechnology company advancing personalized medicine in the life sciences industry for research focused ondetection and treatment of cancer and inherited diseases through its proprietary molecular geneticstechnologies and diagnostics. We also provide genetic variation analytical services to the medical research,world-class clinical and research services. We have three complementary business segments.
Clinical Laboratories. Our clinical laboratories specialize in genetic testing for cardiology, neurology, mitochondrial disorders, and oncology. Located in New Haven, Connecticut and Omaha, Nebraska the molecular clinical reference laboratories are certified under the Clinical Laboratory Improvement Amendment (CLIA) as high complexity labs and our Omaha facility is also accredited by the College of American Pathologists (CAP).
Pharmacogenomics Services. Our Contract Research Organization located in Omaha, Nebraska provides pharmacogenomics research services supporting Phase II and Phase III clinical trials conducted by our pharmaceutical
markets. Net sales are categorized as Instrument Related Businesscustomers. This lab specializes in pharmacogenomic, biomarker and
Laboratory Services.Instrument Related Business:
mutation discovery research serving the pharmaceutical and biomedical industries worldwide for disease research, drug and diagnostic development and clinical trial support. | ·
|
| • | | Bioinstruments.Diagnostic Tools. Our flagshipproprietary product is the WAVE® System which has broad applicability to genetic variation detection in both molecular genetic research and molecular diagnostics. There is a worldwide installed base of over 1,4751,500 WAVE Systems
|
| as of December 31, 2009.2011. We also distribute bioinstruments produced by other manufacturers (“OEM Equipment”) through our sales and distribution network. Service contracts to maintain installed systems are sold and supported by our technical support personnel. |
| ·
| | Bioconsumables. The installed WAVE base and some third-party installedOEM Equipment platforms generate a demand for consumables that are required for the continued operation of the bioinstruments. We develop, manufacture and sell these consumable products. In addition, we manufacture and sell consumable products that can be used on multiple, independent platforms. These products include SURVEYOR® Nuclease and a range of HPLC separationchromatography columns.
|
Laboratory Services:
| ·
| | Molecular Clinical Reference Laboratory. The molecular clinical reference laboratory specializes in mitochondrial and molecular diagnostic testing including genetic testing for oncology, hematology and inherited disorders. Located in Omaha, Nebraska the molecular clinical reference laboratory operates in a Good Laboratory Practices compliant environment, is certified under the Clinical Laboratory Improvement Amendment (CLIA) as a high complexity lab and is accredited by CAP (College of American Pathologists).
|
| ·
| | Pharmacogenomics Research Services. Pharmacogenomics research services are provided by our Contract Research Organization located in Omaha, Nebraska. It specializes in pharmacogenomic, biomarker and mutation discovery research serving the pharmaceutical and biomedical industries world-wide for disease research, drug and diagnostic development and clinical trial support.
|
Our business strategyprimary goal is to provide products and services to biomedical researchers, physicians, medical institutions, and diagnostic and pharmaceutical companies that are tied to advancements in the field of genomics and, increasingly, personalized medicine. Advances in genomics have fueled our efforts to understand individual differences in disease susceptibility, disease progression, and response to therapy. Accordingly,
The markets in which we compete require a principal componentwide variety of technologies, products, and capabilities. The combination of technological complexity and rapid change within our markets makes it difficult for a single company to develop all of the technological solutions that it desires to offer within its family of products and services. We work to broaden the range of products and services we deliver to customers in target markets through acquisitions, investments, and alliances. We employ the following strategies to address the need for new or enhanced products and services:
Developing new technologies and products internally
Acquire all or parts of other companies
Entering into joint-development efforts with other companies
Reselling other companies' products
Our strategy is to leverage the synergies of our strategy hasthree divisions, capitalizing on discoveries in our R&D and continuesPharmacogenomic Services labs to becreate “kits” or assays to establishdistribute through our WAVE SystemTools division, as an industry standardwell as tests to conduct in the biomedical research market andour Clinical Laboratories.
We will continue to develop
additional markets for the WAVE Systemnew technologies, such as
clinicalour ICECOLD-PCR, and capitalize on our expertise and intellectual properties to develop new ground-breaking tests, such as our PGxPredict®:CLOPIDOGREL Panel. We also continue to cultivate new and expanded relationships with industry leaders across the globe, such as A. Menarini in our Tools business, and a list of medical research
and diagnostics. For continued high quality support for our WAVE System and associated bioconsumables, we attained ISO90001:2000 certification for our Omaha manufacturing site in the fourth quarter of 2008 and have since been certified to the ISO9001:2008 standard in 2009.Over the last few years our strategy has grown to include increasing concentration offacilities working with our two Laboratorylaboratory divisions.
We continue to evaluate a range of acquisition targets, including smaller single-test labs as well as larger private and public entities, as well as divisions of entities. We acquired the Familion business in December, 2010, and quickly integrated it into our existing business, and believe we are skilled at such acquisition integrations.
Products
Our highly specialized genetics service and expertise are delivered by our Pharmacogenomic Services businesses. We have gained exposure to the translational and clinical research markets, laying the foundation for increasing our participation in the full value chain associated with activities ranging from basic biomedical research to development of diagnostic and therapeutic products to increasing opportunities for developing and manufacturing companion diagnostics. During the fourth quarter of 2005, our laboratoryLaboratory in Omaha, Nebraska was certified under theNE and in our Clinical Laboratory Improvement AmendmentsAct (CLIA)-certified Clinical Laboratories in Omaha and New Haven, CT. Our Pharmacogenomics Lab supports pharmaceutical companies in their clinical trials, primarily phase II and phase III trials. Our Clinical Laboratories division support medical professionals in the diagnosis and treatment of patients, primarily in the specialties of Cardiology, Neurology and Oncology with a range of tests within each medical specialty.
In cardiology, our FAMILION® family of tests focuses on detecting mutations that can cause cardiac channelopathies, cardiomyopathies and other rare, potentially lethal heart conditions. The specific diseases include Long QT Syndrome (LQTS), Familial Atrial Fibrillation (AF), Hypertrophic Cardiomyopathy (HCM), and Dilated Cardiomyopathy (DCM) . By reducing uncertainty and finding the specific genetic causes of cardiac channelopathies and cardiomyopathies, the FAMILION tests can:
Help diagnose a patient's disease
Guide treatment options
Determine whether family members are at risk
Also in cardiology, our PGxPredict®:CLOPIDOGREL Panel seeks to identify the approximately 50% of patients with a genetic deficiency that prevents them from receiving the expected pharmacological benefit from clopidogrel (Plavix®). Information from the PGxPredict®:CLOPIDOGREL Panel can be used by the health care provider to ensure the most appropriate anti-platelet therapy is being used in an effort to reduce adverse cardiac events.
In Neurology, we receivedhave a focus on mitochondrial disorders and epilepsy and epilepsy-like diseases. We employ a wide variety of technologies, including proprietary technologies such as the WAVE, and industry standards such as Sanger sequencing. In 2011 we introduced the NuclearMitome test, which is based on next-generation sequencing, currently run in a partner lab at Seattle Children's Hospital.
Our oncology tests are focused heavily on genetic mutations commonly associated with the major cancer types - Lung, Colorectal, Breast, and Prostate. We primarily test for mutations in the K-RAS, N-RAS, BRAF, and PIK3CA genes, all associated with the most common cancers. We also offer tests for hereditary cancer-predisposing syndromes.
Our lab expertise is leveraged into our first patient samplesDiagnostic Tools division, which focuses on assembly and delivery of highly sensitive mutation detection equipment, primarily our WAVE, WAVEmce, and Hanabi instruments, as well as the
bioconsumables used in these instruments for molecular-basedmolecular testing and cytogenetics. Transgenomic equipment systems offer discovery and detection of genetic variation at close to 100% sensitivity, making them among the most sensitive and accurate technologies for hematology, oncologydetection of known and certain inherited diseasesunknown mutations and single nucleotide polymorphisms (SNPs). These equipment systems are used throughout the world to screen for physicians and third-party laboratories to aida large variety of diseases. More than 350 human genes have been screened entirely or partly by Direct High Pressure Liquid Chromatography (DHPLC), the underlying technology used by our equipment systems. A multitude of other applications are being used with WAVE Systems in patient diagnoses or pharmaceutical drug developmentsuch diverse areas as plant genomics, microbial analysis, and drug clinical trials. In December of 2008 we were awarded an accreditation bysensitivity.
We continue to leverage the
Commission on Laboratory Accreditationsynergies of the
College of American Pathologists (CAP) basedthree divisions, capitalizing on
the results of an onsite inspection. We believethere is a significant opportunity for us to continue growing the demand for molecular-based personalized medicine by leveraging our technologies and experience gained from the genomic biomarker analysis that our Laboratory Services business has and will continue to provide to pharmaceutical and biopharmaceutical companies. In addition, we continue to seek out and evaluate new technologies and genomic based laboratory tests which will further extend our offeringsdiscoveries in our Molecular Diagnostics LaboratoryR&D and Pharmacogenomic Services labs to create “kits” or test assays to distribute through our Pharmacogenomics Services Lab.
Tools division, as well as tests to conduct in our Clinical Laboratories.
Our Sales and Support team consists of regionally based sales people, service engineers and applications scientists to support our sales and marketing activities worldwide. We have sold our products to customers in over 50 countries. We use a direct sales and support staff for sales in the U.S. and Europe. Our sales and support team consists of regionally-based sales people, engineers and applications scientists to support our sales and marketing activities throughout the U.S. and Europe. For the rest of the world, we sell our products through dealers and distributors within local markets. We have over 35 dealers and distributors.
Customers
Physicians requesting genetic tests for their patients are our primary source of laboratory services. Fees for laboratory testing services rendered for these physicians are billed either to the physician, the patient or the patient’s third-party payer such as an insurance company, Medicare or Medicaid. Billings are typically on a fee-for-service basis. The naturepatient or third-party payer is billed at our patient fee schedule. Commercial insurance providers are billed at contracted rates or other generally accepted market reimbursement rates. Revenues received from Medicare and Medicaid billings are based on government established fee schedules and reimbursement rules.
Our customers include a number of
our business does not generally lend itself to trackinglarge, established pharmaceutical, biotech and
reporting sales backlog.Customers
Customers include numerouscommercial companies as well as leading academic and medical institutions in the U.S. and abroad.institutions. In addition, our customers also include a number of large, established pharmaceutical, biotech and commercial companies both in the U.S. and abroad. No customer accounted for more than 10% of our consolidated net sales for the years ended December 31, 20092011, 2010 or 2009. Information regarding the revenues attributable to U.S. and 2008. Forinternational markets is set forth in Note P to the year ended December 31, 2009 one customer made up 20% of the Laboratory Services net sales. For the year ended December 31, 2008 four customers each made up more than 10% of the Laboratory Services net sales and combined they represent 56% of the Laboratory Services net sales.
footnotes to our consolidated financial statements.
We continue to invest in research and development in order to remain competitive and to take advantage of new business opportunities as they arise. We maintain a program of research and development with respect to instruments and services, engaging existing and new technologies to create scientific and medical applications that will haveadd value to patient care as well as significant commercial value. Major areas of focus include ultra-high(i) development of SURVEYOR® Nuclease based oncology mutation detection kits utilizing multiple instrument platforms for aid in therapeutic treatment decisions for cancers such as colorectal, melanoma, non small cell lung; (ii) a new discovery in high sensitivity DNA mutation detection buildingfor Sanger Sequencing; (iii) development of ICE COLD-PCR applications for ultra-high sensitivity mutation detection in our WAVEany tissue samples (fresh, frozen, FNA, FFPE, etc.) and SURVEYOR products;body fluids (plasma, serum, ascites); (iv) a “toolbox” of mitochondrial DNA assays to assess damage, copy number, deletion and mutation for applications ranging from toxicology to diabetes to aging; clinicaland (v) development of in-licensed diagnosticsa biomarker for FC Gamma receptor to aid in neurodegenerative diseases, including Alzheimer’s and Parkinson’s diseases; and development of oncology mutation kits using WAVE/SURVEYOR forthe selection of anti-cancer therapies.therapeutic options for monoclonal antibody cancer drugs. For the years ended December 31, 20092011, 2010 and 2008,2009, our research and development expenses were $3.2
$2.2 million, $2.3 million and $2.5$3.2 million, respectively. We manufacture bioconsumable products including our separation columns, liquid reagents, and enzymes. The major components of our WAVE Systems are manufactured for us by a third party. We integrate our
own hardware and software with these third party manufactured components. Our manufacturing facilities for
our WAVE Systems and bioconsumables are located in Omaha, Nebraska and San Jose, California.
To establish and protect our proprietary technologies and products, we rely on a combination of patent, copyright, trademark and trade-secret laws, as well aslicense agreements' contractual provisions and confidentiality provisions in our contracts.agreements. Our WAVE SystemSystems and related consumables are protected by patents and in-licensed technologies that expire in various periods beginning in 20132012 through 2027. 2030. As part of the FAMILION Acquisition, we acquired exclusive rights to the FAMILION family of
genetic tests for inherited disease, including the patents protecting this technology. As we expand our product offerings, we also extend our patent development efforts to protect such product offerings. Established competitors, as well as companies that purchase and enforce patents and other intellectual property, may already have patents covering similar products. There is no assurance that we will be able to obtain patents covering our products, or that we will be able to obtain licenses from such companies on favorable terms or at all. However, while patents are an important element of our success, our business as a whole is not significantly dependent on any one patent.
We will continue to file patent applications, and seek new licenses, as warrantedtake advantage of available copyright and trademark protections and implement appropriate trade-secret protocols to protect our intellectual property. Despite these precautions, there can be no assurance that misappropriation of our products and develop newproprietary technologies will not occur.
In addition to own products, we distribute or act as a sales agent for OEM Equipment developed by third parties. Our rights to those third-party products and the associated intellectual property rights are limited by the terms of interest tothe contractual agreement between us and the respective third-party.
Although we believe that our customer basedeveloped and licensed intellectual property rights do not infringe upon the proprietary rights of third parties, there can be no assurance that third parties will not assert infringement claims against us. Further, there can be no assurance that intellectual property protection will be available for our products in all foreign countries.
Like many companies in the
coming years.biotechnology and other high-tech industries, third parties have in the past and may in the future assert claims or initiate litigation related to patent, copyright, trademark or other intellectual property rights to business processes, technologies and related standards that are relevant to us and our customers. These assertions have increased over time as a result of the general increase in patent claims assertions, particularly in the United States. Third parties may also claim that their intellectual property rights are being infringed by our customers' use of a business process method that utilizes products in conjunction with other products, which could result in indemnification claims against us by our customers. Any claim against us, with or without merit, could be time-consuming, result in costly litigation, cause product delivery delays, require us to enter into royalty or licensing agreements or pay amounts in settlement, or require us to develop alternative non-infringing technology. We could also be required to defend or indemnify our customers against such claims. A successful claim by a third-party of intellectual property infringement by us or one of our customers could compel us to enter into costly royalty or license agreements, pay significant damages or even stop selling certain products and incur additional costs to develop alternative non-infringing technology.
Government Regulation
We are subject to a variety of federal, state and municipal environmental and safety laws based on our use of hazardous materials in both manufacturing and research and development operations. We believe that we are in material compliance with applicable environmental laws and regulations. If we cause contamination to the environment, intentionally or unintentionally, we could be responsible for damages related to the clean-up of such contamination or individual injury caused by such contamination. We cannot predict how changes in laws and regulations will impact how we conduct our business operations in the future or whether the costs of compliance will increase in the future.
Regulation by governmental authorities in the United States and other countries is not expected to be a significant factor in the manufacturing, labeling, distribution and marketing of our products and systems
The markets in which we operate are highly competitive and characterized by rapidly changing technological advances. A number of our competitors possess
substantially greater resources than us and
aremay be able to develop and offer a
much greater breadth of products and/or services, coupled with significant marketing and distribution capabilities. We compete principally on the basis of uniquely enabling
scientific technical advantages in specific but significant market segments.
Our Laboratory Services division faces competition from a number of companies offering contract DNA sequencing and other genomic analysis services, including Genzyme, SeqWright and others. In addition, several clinical diagnostics service providers, such as Labcorp, Quest, GeneDx and Baylor College of Medicine, also offer related laboratory services. Finally, additional competition arises from academic core laboratory facilities. Competition for our WAVE SystemsSystem arises primarily from DNA sequencing and genotyping technologies. Competitors in these areas include Applied Biosystems, Idaho Technologies,Qiagen, Roche, Sequenom, and others. Competition for some of our non-WAVE consumable products comes from numerous well-diversified life sciences reagents providers, including, among others, Invitrogen, Qiagen, Roche, Stratagene, and Promega. Our Laboratory Services division faces competition from a number
As of December 31,
20092011 and
2008,2010, we had employees focused in the following areas of
our operation:
| | | | |
| | | December 31, |
| | | 2009 | | 2008 |
Manufacturing and Laboratory | | 36 | | 42 |
Sales, Marketing and Administration | | 53 | | 65 |
Research and Development | | 14 | | 12 |
| | | | |
| | 103 | | 119 |
| | | | |
|
| | | | | | |
| | | December 31, |
| | | 2011 | | 2010 |
| Manufacturing and Laboratory | | 68 |
| | 62 |
|
| Sales, Marketing and Administration | | 92 |
| | 88 |
|
| Research and Development | | 9 |
| | 12 |
|
| | | 169 |
| | 162 |
|
Our employees were employed in the following geographical locations:
| | | | |
| | | December 31, |
| | | 2009 | | 2008 |
United States | | 78 | | 89 |
Europe (other than the United Kingdom) | | 12 | | 13 |
United Kingdom | | 13 | | 17 |
| | | | |
| | 103 | | 119 |
| | | | |
|
| | | | | | |
| | | December 31, |
| | | 2011 | | 2010 |
| United States | | 148 |
| | 136 |
|
| Europe (other than the United Kingdom) | | 10 |
| | 15 |
|
| United Kingdom | | 11 |
| | 10 |
|
| Canada | | — |
| | 1 |
|
| | | 169 |
| | 162 |
|
We were incorporated in Delaware on March 6, 1997. Our principal office is located at 12325 Emmet Street, Omaha, Nebraska 68164 (telephone: 402-452-5400). This facility
officeshouses our administrative staff and laboratories. We maintain manufacturing facilities in Omaha, Nebraska and San Jose, California. We maintain research and development offices in
Gaithersburg, MarylandOmaha, Nebraska. We maintain laboratories in Omaha, Nebraska and
Omaha, Nebraska.New Haven, Connecticut that have been certified under the Clinical Laboratory Improvement Amendments of 1988 ("CLIA").
Our Internet website is located at http://www.transgenomic.com. The information on our website is not a part of this annual report. We make reports filed by us with the SEC available free of charge on our website our annual report on Form 10-K, quarterly reports on Form 10-Q, current reports on Form 8-K and amendments to those reports filed or furnished pursuant to Section 13(a) or 15(d) of the Securities Exchange Act of 1934, as soon as reasonably practicable after thesewe electronically file such material with, or furnish it to, the Unite States Securities and Exchange Commission ("SEC"). Our SEC reports are filed. The addresscan be accessed through the investor relations section of our Internet website.
The public may also read and copy any materials we file with the SEC at the SEC's Public Reference Room at 100 F Street, NE, Washington, DC 20549. The public may obtain information on the operation of the Public Reference Room by calling the Securities and Exchange Commission at 1-800-SEC-0330. The SEC also maintains an Internet website that contains reports, proxy and information statements and other information regarding issuers that file electronically with the SEC. The SEC's Internet website iswww.transgenomic.com. Information located at http://www.sec.gov.
Executive Officers of the Registrant
Craig J. Tuttle. Mr. Tuttle, age 59, has served as our President and Chief Executive Officer since 2006. From 2004 to 2005, Mr. Tuttle was President and Chief Operating Officer of Duke Scientific. From 1999 to 2003, Mr. Tuttle served as President and Chief Executive Officer of Applied Biotech, Inc. The Board selected Mr. Tuttle to serve as a director because he is the Company's Chief Executive Officer. He has expansive knowledge and experience in the biotech industry, as well as relationships with chief executives and other senior management at biotechnology companies and leading research institutions.
Chad M. Richards. Mr. Richards, age 42, joined the Company in October 2007 as Senior Vice President, Sales and Marketing and was promoted to Chief Commercial Officer in January 2011. Before joining the Company, Mr. Richards was the National Sales Director for Anatomic Pathology with Quest Diagnostics. During his career with Quest Diagnostics, Mr. Richards held a variety of sales management roles in both their physician and hospital business segments. Before joining Quest Diagnostics, Mr. Richards held different marketing and sales management roles with Roche Diagnostics Ventana Medical Systems Division, one of the world’s leading developers and manufacturers of immunohistochemistry and in-situ hybridization instruments and
reagent systems. Before embarking on a career in diagnostics, Mr. Richards served in the United States Marine Corps.
Brett L. Frevert. Mr. Frevert, age 49, was appointed as our website,Chief Financial Officer by the Board of Directors on June 28, 2010. Mr. Frevert serves as Chief Financial Officer pursuant to the terms a letter agreement with CFO Systems, LLC (“CFO Systems”) and Brett L. Frevert. Under the letter agreement CFO Systems provides financial and consulting services to us. Since 2004 Mr. Frevert has been Managing Director of CFO Systems, which he founded. During that time he has served as CFO of several Midwestern companies, including any SEC report, is not partregistrants and private companies. Prior to founding CFO Systems, Mr. Frevert was Chief Financial Officer of this Annual Report on Form 10-K.a regional real estate firm and also served as Interim Chief Financial Officer of First Data Europe. Mr. Frevert began his career with Deloitte & Touche, serving primarily SEC-registered clients in the food and insurance industries.
Item 1A. Risk Factors
We may not have adequate financial resources to execute our business plan.
We have historically operated at a loss and have not consistently generated sufficient cash from operating activities to cover our operating and other cash expenses. While we have been able to historically finance our operating losses through borrowings or from the issuance of additional equity, we currently have no plans to borrow additional funds or to issue additional equity securities for this purpose. At December 31, 2009, we had cash and cash equivalents of $5.6 million. While we believe that existing sources of liquidity are sufficient to meet expected cash needs through 2010, we will need to increase our net sales or further reduce our operating expenses in order to be assured of meeting our liquidity needs on a long-term basis. However, we cannot assure you that we will be able to increase our net sales, further reduce our expenses, or raise further capital or equity and, accordingly, we may not have sufficient sources of liquidity to continue the operations of the Company indefinitely.
We have a history of operating losses and may incur losses in the future.
We have experienced annual losses from continuing operations since inception of our operations. Our netoperating loss for the yearyears ended December 31, 2011, 2010 and 2009 was $1.9 million. Our loss from continuing operations for the year ended December 31, 2008 was $0.5 million.were $3.0 million, $3.6 million and $1.9 million, respectively. These historical losses have been due principally to the high levels of research and development expenses and sales and marketing expenses that we have incurred in order to develop and market our products, the fixed nature of our manufacturing costs, restructuring charges, impairment charges and merger and acquisition costs.
We might enter into new acquisitions that are difficult to integrate, disrupt our business, dilute stockholder value or divert management attention.
Our success will depend in part on our ability to continually enhance and broaden our product offerings in response to changing technologies, customer demands and competitive pressures. We expect to seek to acquire businesses, technologies or products that will complement or expand our existing business, including acquisitions that could be material in size and scope. Any acquisition we might make in the future might not provide us with the benefits we anticipated upon entering into the transaction. Any future acquisitions involve various risks, including:
Difficulties in integrating the operations, technologies, products and personnel of the acquired entities;
The risk of diverting management’s attention from normal daily operations of the business;
Potential difficulties in completing projects associated with in-process research and development;
Risks of entering markets in which we have no or limited direct prior experience and where competitors in such markets have stronger market positions;
Initial dependence on unfamiliar supply chains or relatively small supply partners;
Unexpected expenses resulting from the acquisition;
Potential unknown liabilities associated with acquired businesses;
Insufficient revenues to offset increased expenses associated with the acquisition; and
The potential loss of key employees of the acquired entities.
An acquisition could result in the incurrence of debt, restructuring charges or large one-time write-offs. Acquisitions also could result in goodwill and other intangible assets that are subject to impairment tests, which might result in future impairment charges. In addition, marketsFurthermore, if we finance acquisitions by issuing convertible debt or equity securities, our existing stockholders may be diluted.
From time to time, we might enter into negotiations for acquisitions that are not ultimately consummated. Those negotiations could result in diversion of management time and potentially significant out-of-pocket costs. If we fail to evaluate and execute acquisitions accurately, we could fail to achieve our productsanticipated level of growth and servicesour business and operating results could be adversely affected.
Continued weakness in U.S. or global economic conditions could have developed more slowly than expectedan adverse effect on our businesses.
The economies of the United States and other regions of the world in
many cases and may continue towhich we do
so. As a result, we may incur operating lossesbusiness have experienced significant weakness, which, in the
future.Market demand is outsidecase of our control.
There are many factors thatthe U.S., has resulted in significant unemployment and slower growth in economic activity. A continued decline in economic conditions may adversely affect the market demand for our services and products, and services thatthus reducing our revenue. These conditions could also impair the ability of those with whom we cannot control. Demand for our WAVE System is affected by the needs and budgetary resources of research institutions, universities, hospitals and others who use the WAVE System for genetic-variation research. The WAVE System represents a significant expenditure by these types of customers and often requires a long sales cycle. Similarly, the sales cycle for the OEM equipment that we sell can also be lengthy. If net sales from the sales of our products and services continue at current levels, we may needdo business to take stepssatisfy their obligations to further reduce operating expenses or raise additional working capital. We cannot assure you that sales will increase or that we will be able to reduce operating expenses or raise additional working capital.
The current economy may decrease sales.
Demand for our instruments is affected by the budgetary resources of institutions that use our products. Potential customers may be unable to obtain the financing that they need to make such significant capital expenditures during these troubled economic times. In addition, potential customers may be under budgetary restrictions which do not allow for such capital expenditures in the foreseeable future.
us.
Sales
of our Laboratory Services have been variable.
Laboratory Services include services performed by both our Molecular Clinical Reference Laboratory and our Pharmacogenomics Research Services.
Testing volumes at the Molecularin our Clinical Reference Laboratory isare dependent on patient visits to doctors’ offices and other providers of
health care and tends to fluctuate on a seasonal basis. Volume of testingTesting volume generally declines during the year endyear-end holiday periods, other major holidays and the summer. The
Our Pharmacogenomics
Research Services depends on
project basedproject-based work
which will changethat changes from quarter to quarter. Therefore, comparison of the results of successive quarters may not accurately reflect trends or results for the full year.
Changes in payer mix could have a material adverse impact on our net sales and profitability.
Testing services are billed to physicians, patients, Medicare, Medicaid and insurance companies. Tests may be billed to different payers depending on a particular patient’s medical insurance coverage. Increases in the percentage of services billed to government payors could have an adverse impact on our net sales.
Governmental payers and health care plans have taken steps to control costs.
Medicare, Medicaid and private insurers have increased their efforts to control the costs of health care services, including clinical testing services. They may reduce fee schedules or limit/exclude coverage for types of tests that we perform. Medicaid reimbursement varies by state and is subject to administrative and billing requirements and budget pressures. We expect efforts to reduce reimbursements, impose more stringent cost controls and reduce utilization of testing services will continue. These efforts, including changes in law or regulations, may have a material adverse impact on our business.
Our Laboratory requires ongoing CLIA certification.
The Clinical Laboratory Improvement Amendments of 1988 (“CLIA”)
CLIA extended federal oversight to virtually all clinical laboratories by requiring that they be certified by the federal government or by a
federally-approvedfederally approved accreditation agency. CLIA requires that all clinical laboratories meet quality assurance, quality control and personnel standards. Laboratories
must also
must undergo proficiency testing and are subject to inspections.
The sanctions for failure to comply with CLIA requirements include suspension, revocation or limitation of a laboratory’s CLIA certificate, which is necessary to conduct business, cancellation or suspension of the laboratory’s approval to receive Medicare and/or Medicaid reimbursement, as well as significant fines and/or criminal penalties. The loss or suspension of a CLIA certification, imposition of a fine or other penalties, or future changes in the CLIA law or regulations (or interpretation of the law or regulations) could have a material adverse effect on us.
We believe that we are in compliance with all applicable laboratory requirements, but no assurances can be given that our laboratories will pass all future certification inspections.
Failure to comply with HIPAA could be costly.
The Health Insurance Portability and Accountability Act (HIPAA) and associated regulations protect the privacy and security of certain
protectedpatient health information and establish standards for electronic
healthcarehealth care transactions in the United States. These privacy regulations establish federal standards regarding the uses and disclosures of protected health information. Our Molecular
Clinical Reference Laboratory isLabs are subject to HIPAA and its associated regulations. If we fail to comply with these laws and regulations we could suffer civil and criminal penalties, fines, exclusion from participation in governmental
healthcarehealth care programs and the loss of various licenses, certificates and authorizations necessary to operate our Laboratory Services business. We could also incur liabilities from third party claims.
Our business could be adversely impacted by
healthcarehealth care reform.
Government attention to the healthcarehealth care industry in the United States is significant and may increase. There has been extensive public discussionThe Patient Protection and Affordable Care Act passed by Congress and signed into law by the President in March 2010 could adversely impact our business. While the ultimate impact of the legislation on healthcare reform. Whilethe health care industry is unknown, it is not possiblelikely to predict what changesbe extensive and could result in U.S. government regulationsignificant change.
We may be subject to client lawsuits.
Providers of healthcareclinical testing services may be subject to lawsuits alleging negligence or other legal claims. Potential suits could involve claims for substantial damages. Litigation could also have an adverse impact on our client base and reputation. We maintain liability insurance coverage for certain claims that could result from providing or failing to provide clinical testing services, including inaccurate testing results and other exposures. Our insurance coverage limits our maximum recovery on individual claims and, therefore, there is no assurance that such coverage will occur, orbe adequate.
Market demand is outside of our control.
There are many factors that affect the nature or impactmarket demand for our products and services that we cannot control. Demand
for our
business could be adversely impactedWAVE System is affected by the needs and budgetary resources of research institutions, universities, hospitals and others who use the WAVE System for genetic-variation research. The WAVE System represents a significant expenditure by these
changes.types of customers and often requires a long sales cycle. Similarly, the sales cycle for the OEM Equipment that we sell can be lengthy.
The sale of our products and business operations in international markets subjects us to additional risks.
During the past several years, international sales have represented
approximately 60%a significant portion of our total net sales. As a result, a major portion of our net sales are subject to risks associated with international sales and operations. These risks include:
payment cycles in foreign markets are typically longer than in the U.S., and capital spending budgets for research agencies can vary over time with foreign governments;
changes in foreign currency exchange rates can make our products more costly in local currencies since our foreign sales are typically paid for in British Pounds or the Euro;
the potential for changes in U.S. and foreign laws or regulations that result in additional import or export restrictions, higher tariffs or other taxes, more burdensome licensing requirements or similar impediments to our ability to sell products and services profitably in these markets; and
the fluctuation of foreign currency to the US Dollar and the Euro to the British Pound can cause our net sales and expenses to increase or decrease, which adds risk to our financial statements.
Our WAVE System includes hardware components and instrumentation manufactured by a single supplier and if we are no longer able to obtain these components and instrumentation our ability to manufacture our products could be impaired.
We rely on a single supplier, Hitachi High Technologies America, to provide the basic instrument modules used in our WAVE Systems. While other suppliers of instrumentation are available, we believe that our arrangement with Hitachi offers strategic advantages. We have successfully converted the latest model of WAVE Systems to utilize Hitachi’s newest instrument line. If we were required to seek alternative sources of supply, it could be
more time consuming
or expensive orand may require significant and costly modification of our WAVE System. Also, if we were unable to obtain instruments from Hitachi in sufficient quantities or in a timely manner, our ability to manufacture our products could be impaired, which could limit our future net sales.
The current economy may cause suppliers of products to not be able to perform.
We rely on various suppliers for products and materials needed to produce our products. In the event that they would be unable to deliver those items due to product shortage or business closure, we
wouldmay be unable to deliver our products
to our customers timely or may need to increase our prices. The current economy poses additional risk of our suppliers’ ability to continue their businesses as usual.
We may not have adequate top executive talent to execute our business plan.
In order to reduce our operating costs, we have reduced the number of employees in most areas of our business. In addition, we may lose key management, scientific, technical, sales and manufacturing personnel from time to time. It may be very difficult to recruit and retain executive management if they are needed in the future, and the loss of top executive talent could harm our business and operating results. We cannot assure you that our employee reductions will not impair our ability to continue to develop new products and refine existing products in order to remain competitive. In addition, these reductions could prevent us from successfully marketing our products and developing our customer base.
Our markets are very competitive.
Many of our competitors have greater resources than we do and may enjoy other competitive advantages. This may allow them to more effectively market their products to our customers or potential customers, to develop products that make our products obsolete or to produce and sell products less expensively than us. As a result of these competitive factors, demand for and pricing of our products and services could be negatively affected.
Our patents may not protect us from others using our technology
thatwhich could harm our business and competitive position.
Patent law relating to the scope of claims in the technology fields in which we operate is still evolving. The degree of future protection for our proprietary rights is uncertain. Furthermore, we cannot be certain that others will not independently develop similar or alternative products or technology, duplicate any of our products, or, if patents are issued to us, design around the patented products developed by us. Our patents or licenses could be challenged by litigation and, if the outcome of such litigation were adverse to us, our competitors could be free to use our technology. We may not be able to obtain additional patents for our technology, or if we are able to do so, patents may not provide us with adequate protection or be commercially beneficial. In addition, we could incur substantial costs in litigation if we are required to defend ourselves in patent suits brought by third parties or if we initiate such suits.
We cannot be certain that other measures taken to protect our intellectual property will be effective.
We rely upon trade secret protection,secrets, copyright and trademark laws, non-disclosure agreements and other contractual provisions for some of our confidential and proprietary information that is not subject matter for which patent protection is being sought. Such measures, however, may not provide adequate protection for our trade secrets or other proprietary information. If such measures do not protect our rights, third parties could use our technology and our ability to compete in the market would be
We are dependent upon
our licensed technologies and may need to obtain additional licenses in the future to offer our products and remain competitive.
We have licensed key components of our technologies from third parties. If these agreements were to terminate prematurely due to our breach of the terms of these licenses or we otherwise fail to maintain our rights to such technology, we may lose the right to manufacture or sell a substantial portion of our products. In addition, we may need to obtain licenses to additional technologies in the
future in order to keep our products competitive. If we fail to license or otherwise acquire necessary technologies, we may not be able to develop new products that we need to remain competitive.
The protection of intellectual property in foreign countries is uncertain.
A significant percentage of our sales are to customers located outside the U.S.
The patentPatent and other intellectual property laws of some foreign countries may not protect our intellectual property rights to the same extent as U.S. laws. We may need to bring proceedings to defend our patent rights or to determine the validity of our competitors’ foreign patents. These proceedings could result in substantial cost and diversion of our efforts. Finally, some of our patent protection in the U.S. is not available to us in foreign countries due to the laws of those countries.
Our products could infringe on the intellectual property rights of others.
There are a significant number of U.S. and foreign patents and patent applications submitted for technologies in, or related to, our area of business. As a result, any application or exploitation of our technology
by us could infringe patents or proprietary rights of others and any licenses that we might need as a result of such infringement might not be available to us on commercially reasonable terms, if at all. This may lead others to assert patent infringement or other intellectual property claims against us.
Our failure to comply with any applicable government regulations or otherwise respond to claims relating to improper handling, storage or disposal of hazardous chemicals that we use may adversely affect our results of operations.
Our research and development and manufacturing activities involve the controlled use of hazardous materials and chemicals. We are subject to federal, state, local and international laws and regulations governing the use, storage, handling and disposal of hazardous materials and waste products. If we fail to comply with applicable laws or regulations, we could be required to pay penalties or be held liable for any damages that result and this liability could exceed our financial resources. We cannot assure you that accidental contamination or injury will not occur. Any such accident could damage our research and manufacturing facilities and operations, resulting in delays and increased costs.
The price for our common stock is volatile and may drop.
The trading price for our common stock has fluctuated significantly over recent years. The volatility in the price of our stock is attributable to a number of factors, not all of which relate to our operating results and financial position. Our stock is traded on the OTC Bulletin Board (OTCBB). Continued volatility in the market price for our stock should be expected and we cannot assure you that the price of our stock will not decrease in the future. Fluctuations or further declines in the price of our stock may affect our ability to sell shares of our stock and to raise capital through future equity financing.
Our stock has been delisted from the Nasdaq Capital Market and is now trading on the OTC Bulletin Board (OTCBB).
On February 1, 2007, we received a staff determination letter from Nasdaq’s Listing Qualifications Department indicating that we no longer met the minimum bid price requirement for continued listing on the Nasdaq Capital Market. As a result, our common stock on the Nasdaq Capital
Market was ended on February 22, 2007. Trading information about our common stock became available on the OTC Bulletin Board beginning on February 26, 2007.
Our common stock is deemed to be “penny stock”
, which may make it more difficult for investors to sell their shares due to suitability requirements.
Our common stock is classified as a “penny stock” under the rules of the SEC. The
Securities and Exchange CommissionSEC has adopted Rule 3a51-1
whichthat establishes the definition of a “penny stock”
, for the purposes relevant to us, as any equity security that has a market price of less than $5.00 per share or with an exercise price of less than $5.00 per share, subject to certain exceptions. For any transaction involving a penny stock, unless exempt, Rule 15g-9
requires:requires that:a broker or dealer approve a person’s account for transactions in penny stocks; and
that the broker or dealer receives from the investor a written agreement to the transaction, setting forth the identity and quantity of the penny stock to be purchased.
In order to approve a person’s account for transactions in penny stocks, the broker or dealer must:
obtain financial information and investment experience objectives of the person; and
make a reasonable determination that the transactions in penny stocks are suitable for that person and the person has sufficient knowledge and experience in financial matters to be capable of evaluating the risks of transactions in penny stocks.
The broker or dealer must also deliver, prior to any transaction in a penny stock, a disclosure schedule prescribed by the SEC relating to the penny stock market, which
is in highlight form:
sets forth the basis on which the broker or dealer made the suitability determination; and
that the broker or dealer received a signed, written agreement from the investor prior to the transaction.
Generally, brokers may be less willing to execute transactions in securities subject to
the “penny stock” rules. This may make it more difficult for investors to dispose of our common stock and cause a decline in the market value of our stock.
Disclosure also has to be made about the risks of investing in penny stocks in both public offerings and in secondary trading and about the commissions payable to both the broker-dealer and the registered representative, current quotations for the securities and the rights and remedies available to an investor in cases of fraud in penny stock transactions. Finally, monthly statements have to be sent disclosing recent price information for the penny stock held in the account and information on the limited market in penny stocks.
We may issue a substantial amount of our common stock to holders of options and warrants and this could reduce the market price for our stock.
At December 31,
2009,2011, we had obligations to issue
11,309,88717,648,273 shares of common stock upon exercise of outstanding stock options,
representing 3,331,731 shares and warrants
representing7,978,156 shares.or conversion rights. The issuance of these additional shares of common stock may be dilutive to our current shareholders and could negatively impact the market price of our common stock.
Our common stock is thinly traded and a large percentage of our shares are held by a small group of unrelated, institutional owners.
At December 31,
2009,2011, we had
49,189,67249,625,725 shares of common stock outstanding.
Fewer than ten unrelated, institutional holders own more than 50% of these shares. The sale of
a significant
number of shares into the public market has
the potential to cause significant downward pressure on the price of our common stock. This is particularly the case if the shares being placed into the market exceed the market’s ability to absorb the
stock. Such an event could place further downward pressure on the price of our common stock. This presents an opportunity for short sellers to contribute to the further decline of our stock price. If there are significant short sales of our stock, the price decline that would result from this activity will cause the share price to decline more so, which, in turn, may cause long holders of the stock to sell their shares thereby contributing to sales of stock in the market.
|
| |
| Item 1B. | Unresolved Staff Comments |
We currently lease
a total of six facilities throughout the world under
non-cancelablenon-cancellable leases with various terms. The following table summarizes certain information regarding
theour leased facilities. Annual rent amounts presented in the table are reflected in thousands.
| | | | | | | | | |
Location | | Function | | Square
Footage | | 2010
Scheduled
Rent | | Lease Term
Expires |
Omaha, Nebraska | | WAVE and Consumable Manufacturing | | 25,000 | | $ | 138 | | July 2011 |
San Jose, California | | Consumable Manufacturing | | 14,360 | | $ | 165 | | October 2010 |
Glasgow, Scotland | | Multi Functional(1) | | 5,059 | | $ | 33 | | March 2012 |
Omaha, Nebraska | | Multi Functional(1) | | 18,265 | | $ | 196 | | July 2012 |
Paris, France | | Multi Functional(1) | | 4,753 | | $ | 102 | | February 2011(2) |
Gaithersburg, Maryland | | Multi Functional(1) | | 8,404 | | $ | 154 | | May 2012 |
|
| | | | | | | | | | | |
| Location | | Function | | Square Footage | | 2012 Scheduled Rent | | Lease Term Expires |
| Omaha, Nebraska | | WAVE and Consumable Manufacturing | | 25,000 |
| | $ | 139 |
| | July 2016 |
| San Jose, California | | Consumable Manufacturing | | 9,110 |
| | $ | 57 |
| | February 2016 |
| Glasgow, Scotland | | Multi Functional (1) | | 5,059 |
| | $ | 36 |
| | March 2017 |
| Omaha, Nebraska | | Multi Functional (1) | | 18,265 |
| | $ | 204 |
| | July 2022 |
| New Haven, Connecticut | | Laboratory | | 22,459 |
| | $ | 472 |
| | March 2018 |
| |
| (1) | Multi Functional facilities include functions related to manufacturing, services, sales and marketing, research and development and/or administration. |
(2) | This lease expiration assumes that we exercise the early termination clause which allows the lease to terminate in February 2011. The original lease expiration is February 2014. |
We occupy the leased facilities, with the exception of the Paris, France facility which we have vacated and are in the process of finding a tenant to sublease this facility. In the event we are unable to sublease the Paris, France facility, we will exercise the early termination clause which allows for the lease to terminate in February 2011. The original term of the lease expires on February 1, 2014. We have a reserve of $0.1 million in other accrued expenses for the remaining lease liability.
We believe that
ourthese facilities are
suitable and adequate
forto meet our current
level of operations.and planned needs. We believe that if additional space is needed in the future, we could find alternate space at competitive market rates without substantial increase in cost.
|
| |
| Item 3. | Legal Proceedings. |
The Company is
We are subject to a number of claims of various amounts which arise out of the normal course of our business. In our opinion, the disposition of pending claims will not
a party to any pending legal proceedings which, if decided adversely to the Company, will have a material adverse effect on our financial position, results of operations or cash flows.
|
| |
| Item 4. | Submission of Matters to a Vote of Security Holders.
Mine Safety Disclosures |
We did not submit any matters to our stockholders for a vote or other approval during the fourth quarter
Not applicable.
|
| |
| Item 5. | Market for Registrant’s Common Equity, Related Stockholder Matters and Issuer Purchases of Equity Securities. |
Market Information. Share price information for our common stock is available on the OTC Bulletin Board under the symbol TBIO.OB. Prior to February 22, 2007, our common stock was listed for trading on the Nasdaq Capital Market under the symbol TBIO. The following table sets forth the high and low closing prices for our common stock during each of the quarters of 20082011 and 2009. | | | | | | |
| | | High | | Low |
Year Ended December 31, 2008 | | | | | | |
First Quarter | | $ | 0.54 | | $ | 0.42 |
Second Quarter | | $ | 0.86 | | $ | 0.47 |
Third Quarter | | $ | 0.85 | | $ | 0.52 |
Fourth Quarter | | $ | 0.56 | | $ | 0.25 |
| | |
Year Ended December 31, 2009 | | | | | | |
First Quarter | | $ | 0.42 | | $ | 0.21 |
Second Quarter | | $ | 0.58 | | $ | 0.32 |
Third Quarter | | $ | 0.70 | | $ | 0.35 |
Fourth Quarter | | $ | 0.74 | | $ | 0.58 |
Holders. At2010. These prices reflect inter-dealer prices, without retail mark-up, mark-down or commission and may not necessarily represent actual transactions.
|
| | | | | | | | |
| | | High | | Low |
| Year Ended December 31, 2011 | | | | |
| First Quarter | | $ | 0.90 |
| | $ | 0.61 |
|
| Second Quarter | | $ | 1.75 |
| | $ | 0.82 |
|
| Third Quarter | | $ | 1.77 |
| | $ | 1.00 |
|
| Fourth Quarter | | $ | 1.44 |
| | $ | 1.07 |
|
| Year Ended December 31, 2010 | | | | |
| First Quarter | | $ | 0.88 |
| | $ | 0.61 |
|
| Second Quarter | | $ | 0.86 |
| | $ | 0.49 |
|
| Third Quarter | | $ | 0.59 |
| | $ | 0.33 |
|
| Fourth Quarter | | $ | 0.71 |
| | $ | 0.32 |
|
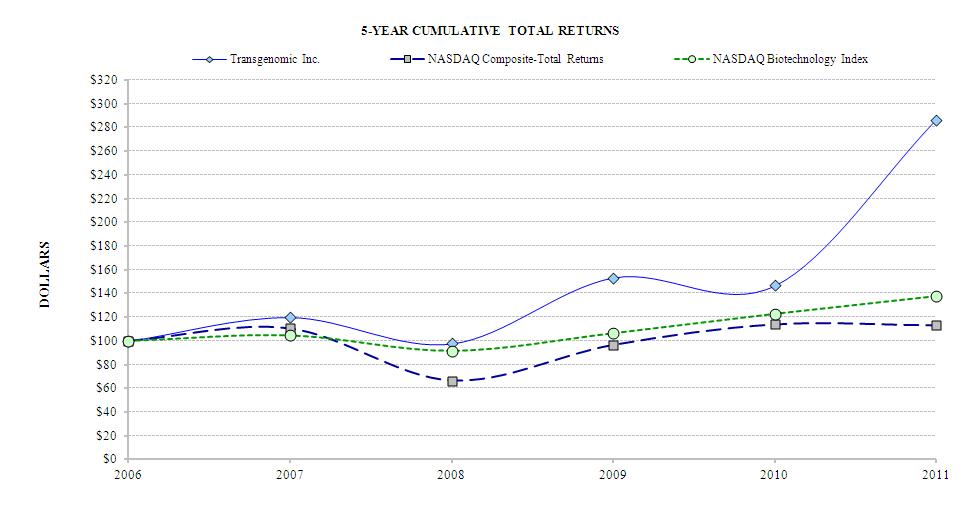
Company Stock Price Performance Graph.The following graph compares five-year cumulative total returns of the Company, the NASDAQ Composite Index and the NASDAQ Biotechnology Stock Index. The graph assumes $100 was invested in the common stock of Transgenomic, Inc. and each index as of December 31, 2009,2006 and that all dividends were re-invested.
The information contained in this Stock Performance Graph section shall not be deemed to be "soliciting material" or "filed" or incorporated by reference in future filings with the SEC, or subject to the liabilities of Section 18 of the Securities Exchange Act of 1934, except to the extent that the Company specifically incorporates it by reference into a document filed under
the Securities Act of 1933 (the "Securities Act") or the Securities Exchange Act of 1934.
Holders. At December 31, 2011, there are 49,189,67249,625,725 shares of our common stock outstanding and approximately 2,800 holders of record. Dividends. We have never declared or paid any cash dividends on our common stock and we do not anticipate paying any cash dividends on our common stock in the foreseeable future. We expect to retain all earnings, if any, for investment in our business. Dividends on our common stock will be paid only if and when declared by our Board of Directors. The Board’s ability to declare a dividend is subject to limits imposed by Delaware corporate law. In determining whether to declare dividends, the Board may consider our financial condition, results of operations, working capital requirements, future prospects and other relevant factors. The holders of our Series A Convertible Preferred Stock (the "Series A Preferred Stock") are entitled to receive quarterly dividends. Sale of Unregistered Securities.On December 29, 2010, the Company issued 2,586,205 shares of Series A Preferred Stock pursuant to applicable exemptions from the registration requirements of the Securities Act of 1933. The issuance of such Series A Preferred Stock was in connection with the FAMILION Acquisition. Please refer to the Series A Convertible Preferred Stock Purchase Agreement among the Company made no salesand Third Security Senior Staff 2008 LLC, Third Security Staff 2010 LLC and Third Security Incentive 2010, LLC ("Third Security Investors") dated December 29, 2010.
On November 8, 2011, the Company entered into an Amendment Agreement with the Third Security Investors, which are the holders of all of the outstanding shares of the Company's Series A Preferred Stock. Pursuant to the Amendment Agreement, the Third Security Investors and the Company agreed to amend the Certificate of Designation to eliminate certain features of the Series A Preferred Stock relating to (i) an anti-dilution adjustment to the conversion rate upon which the Series A Preferred Stock is convertible into the Company's common stock and (ii) an optional redemption of the Series A Preferred Stock by the Third Security Investors (the “Certificate Amendment”); subject to the requisite stockholder approval of the Certificate Amendment at the Company's next annual meeting of its stockholders. Pursuant to the Amendment Agreement, the Third Security Investors agreed to vote the Series A Preferred Stock and their common stock duringin favor of the years endedCertificate Amendment and agreed to waive their rights to the features of the Series A Preferred Stock being eliminated by the Certificate Amendment. In exchange for the Third Security Investors entering into the Amendment Agreement, the Company agreed to issue to the holders an aggregate of 245,903 shares of common stock having a market value of $0.3 million.
On December 30, 2011, the Company entered into a Convertible Promissory Note Purchase Agreement (the “Note Purchase Agreement”) with the Third Security Investors in the aggregate amount of $3.0 million. Under the Note Purchase Agreement, the Company sold to the Third Security Investors convertible notes that mature on March 31, 20092012. The Note Purchase Agreement and 2008 that werenotes provide for conversion of any amount remaining due to the Third Security Investors under the notes into equity securities of the Company of the same class(es) or series and at the same price as the equity securities of the Company sold in the Company's first sale or issuance of its equity securities after December 30, 2011, in the aggregate amount of at least $3.0 million. The notes and the equity securities into which the notes are convertible have not been registered under the Securities Act and applicable state securities laws, but have been offered and sold in the United States pursuant to applicable exemptions from registration requirements under the Securities Act and applicable state securities laws.
On February 2, 2012, the Company entered into a Securities Purchase Agreement with certain institutional and other accredited investors pursuant to which the Company: (i) sold to the investors an aggregate of 1933 (the “Securities Act”). 19,000,000 shares of the Company's common stock at a price per share of $1.00 for aggregate gross proceeds of approximately $19.0 million; and (ii) issued to the investors warrants to purchase up to an aggregate of 9,500,000 shares of common stock with an exercise price of $1.25 per share. The warrants may be exercised, in whole or in part, at any time from February 7, 2012 until February 7, 2017 and contain both cash and “cashless exercise” features. The warrants also impose penalties on the Company for failure to deliver the shares of common stock issuable upon exercise. The Securities Purchase Agreement also requires the filing by the Company of a registration statement with the SEC covering all shares issued and issuable under such Securities Purchase Agreement and imposes significant penalties for the failure to file such registration statement by March 23, 2012. The Company currently intends to use the net proceeds from the offering for general corporate and working capital purposes, primarily to accelerate development of several of the company's key initiatives. The common stock and warrants were issued pursuant to applicable exemptions from registration requirements under the Securities Act and applicable securities law.
As part of the offering and, in connection with the conversion of certain convertible promissory notes in the aggregate amount of $3.0 million issued by the Company on December 30, 2011 to the Third Security Investors, the Third Security Investors collectively received 3,000,000 shares of common stock and warrants to purchase up to 1,500,000 shares of common stock upon the same terms as the investors.
Information regarding saleswith respect to the securities of equity securitiesthe Company as described above sold by the Company during the year ended December 31, 2005period covered by this Annual Report and thereafter through the date of the filing of this Annual Report with the SEC that were not
registered under the Securities Act
of 1933 havehas previously been
previously reported byprovided in the
CompanyCompany's Current Reports on Form
8-Ks8-K filed
with the SEC on
March 18, 2005, March 30, 2005January 6, 2012, February 3, 2012 and
October 31, 2005.February 7, 2012.
Issuer Purchase of Equity Securities. The Company made no purchases of its common stock during the quarteryear ended December 31, 2008.2011. Therefore, tabular disclosure is not presented. |
| |
| Item 6. | Selected Consolidated Financial Data. |
The selected consolidated balance sheet data as of December 31, 20092011 and 20082010 and the selected consolidated statements of operations data for each year ended December 31, 20092011, 2010 and 20082009 have been derived from our audited consolidated financial statements that are included elsewhere in this Annual Report on Form 10-K. The selected consolidated balance sheet data as of December 31, 2007, 20062009, 2008 and 20052007 and the selected consolidated statements of operations data for each year ended December 31, 2007, 20062008 and 20052007 have been derived from our audited consolidated financial statements that are not included in this Annual Report on Form 10-K. Dollar amounts, except per share data, are presented in thousands. | | | | | | | | | | | | | | | | | | | | |
| | | Year Ended December 31, | |
| | | 2009 | | | 2008 | | | 2007 | | | 2006 | | | 2005 | |
Statement of Operations Data: | | | | | | | | | | | | | | | | | | | | |
Net sales | | $ | 22,023 | | | $ | 23,993 | | | $ | 23,176 | | | $ | 23,415 | | | $ | 25,828 | |
Cost of good sold | | | 10,418 | | | | 10,345 | | | | 10,483 | | | | 12,046 | | | | 13,497 | |
| | | | | | | | | | | | | | | | | | | | |
Gross profit | | | 11,605 | | | | 13,648 | | | | 12,693 | | | | 11,369 | | | | 12,331 | |
Selling, general and administrative | | | 10,319 | | | | 10,795 | | | | 11,466 | | | | 12,138 | | | | 12,218 | |
Research and development | | | 3,182 | | | | 2,465 | | | | 3,033 | | | | 2,362 | | | | 2,199 | |
Restructuring charges(1) | | | — | | | | 118 | | | | 1,516 | | | | — | | | | — | |
Impairment charges(2) | | | — | | | | 638 | | | | — | | | | — | | | | 425 | |
| | | | | | | | | | | | | | | | | | | | |
Operating expenses | | | 13,501 | | | | 14,016 | | | | 16,015 | | | | 14,500 | | | | 14,842 | |
Other income (expense)(3) | | | 18 | | | | 86 | | | | 1,391 | | | | 198 | | | | (2,447 | ) |
| | | | | | | | | | | | | | | | | | | | |
Loss before income taxes | | | (1,878 | ) | | | (282 | ) | | | (1,931 | ) | | | (2,933 | ) | | | (4,958 | ) |
Income tax expense | | | 42 | | | | 213 | | | | 243 | | | | 30 | | | | 26 | |
| | | | | | | | | | | | | | | | | | | | |
Loss from continuing operations | | | (1,920 | ) | | | (495 | ) | | | (2,174 | ) | | | (2,963 | ) | | | (4,984 | ) |
Income (Loss) from discontinued operations, net of tax(4) | | | — | | | | — | | | | 67 | | | | (468 | ) | | | (10,009 | ) |
| | | | | | | | | | | | | | | | | | | | |
Net Loss | | $ | (1,920 | ) | | $ | (495 | ) | | $ | (2,107 | ) | | $ | (3,431 | ) | | $ | (14,993 | ) |
| | | | | | | | | | | | | | | | | | | | |
Basic and diluted Loss per share:(4) | | | | | | | | | | | | | | | | | | | | |
From continuing operations | | $ | (0.04 | ) | | $ | (0.01 | ) | | $ | (0.04 | ) | | $ | (0.06 | ) | | $ | (0.14 | ) |
From discontinued operations(4) | | | — | | | | — | | | | — | | | | (0.01 | ) | | | (0.28 | ) |
| | | | | | | | | | | | | | | | | | | | |
| | $ | (0.04 | ) | | $ | (0.01 | ) | | $ | (0.04 | ) | | $ | (0.07 | ) | | $ | (0.42 | ) |
| | | | | | | | | | | | | | | | | | | | |
Basic and diluted weighted average shares outstanding | | | 49,190 | | | | 49,190 | | | | 49,190 | | | | 49,188 | | | | 35,688 | |
| |
| | | As of December 31, | |
| | | 2009 | | | 2008 | | | 2007 | | | 2006 | | | 2005 | |
Balance Sheet Data: | | | | | | | | | | | | | | | | | | | | |
Total assets | | $ | 16,004 | | | $ | 17,556 | | | $ | 19,090 | | | $ | 21,367 | | | $ | 25,340 | |
Total stockholders’ equity | | | 11,662 | | | | 13,205 | | | | 14,102 | | | | 16,038 | | | | 17,906 | |
This data should be read together with Item 7, "Management's Discussion and Analysis of Financial Condition and Results of Operations", and the consolidated financial statements and related notes included elsewhere in this Annual Report. The financial information below is not necessarily indicative of the results of future operations. Future results could differ materially from historical results due to may factors, including those discussed in Item 1A in the section entitled "Risk Factors."
|
| | | | | | | | | | | | | | | | | | | | |
| | | Year Ended December 31, |
| | | 2011 | | 2010 | | 2009 | | 2008 | | 2007 |
| Statement of Operations Data: | | | | | | | | | | |
| Net sales | | $ | 31,971 |
| | $ | 20,048 |
| | $ | 22,023 |
| | $ | 23,993 |
| | $ | 23,176 |
|
| Cost of good sold | | 13,534 |
| | 10,284 |
| | 10,418 |
| | 10,345 |
| | 10,483 |
|
| Gross profit | | 18,437 |
| | 9,764 |
| | 11,605 |
| | 13,648 |
| | 12,693 |
|
| Selling, general and administrative | | 19,150 |
| | 10,933 |
| | 10,319 |
| | 10,795 |
| | 11,466 |
|
| Research and development | | 2,218 |
| | 2,305 |
| | 3,182 |
| | 2,465 |
| | 3,033 |
|
Restructuring charges (1) | | 41 |
| | 138 |
| | — |
| | 118 |
| | 1,516 |
|
Impairment charges (2) | | — |
| | — |
| | — |
| | 638 |
| | — |
|
| Operating expenses | | 21,409 |
| | 13,376 |
| | 13,501 |
| | 14,016 |
| | 16,015 |
|
Other income (expense) (3) | | (6,765 | ) | | 628 |
| | 18 |
| | 86 |
| | 1,391 |
|
| Loss before income taxes | | (9,737 | ) | | (2,984 | ) | | (1,878 | ) | | (282 | ) | | (1,931 | ) |
| Income tax expense | | 45 |
| | 150 |
| | 42 |
| | 213 |
| | 243 |
|
| Loss from continuing operations | | (9,782 | ) | | (3,134 | ) | | (1,920 | ) | | (495 | ) | | (2,174 | ) |
Gain from discontinued operations, net of tax (4) | | — |
| | — |
| | — |
| | — |
| | 1,374 |
|
| Net loss | | $ | (9,782 | ) | | $ | (3,134 | ) | | $ | (1,920 | ) | | $ | (495 | ) | | $ | (800 | ) |
Preferred stock dividends and accretion (5) | | (1,010 | ) | | — |
| | — |
| | — |
| | — |
|
| Net loss available to common stockholders | | $ | (10,792 | ) | | $ | (3,134 | ) | | $ | (1,920 | ) | | $ | (495 | ) | | $ | (800 | ) |
| Basic and diluted loss per share: | | | | | | | | | | |
| From continuing operations | | $ | (0.22 | ) | | $ | (0.06 | ) | | $ | (0.04 | ) | | $ | (0.01 | ) | | $ | (0.05 | ) |
| From discontinued operations | | — |
| | — |
| | — |
| | — |
| | 0.03 |
|
| | | $ | (0.22 | ) | | $ | (0.06 | ) | | $ | (0.04 | ) | | $ | (0.01 | ) | | $ | (0.02 | ) |
| Basic and diluted weighted average shares outstanding | | 49,362 |
| | 49,244 |
| | 49,190 |
| | 49,190 |
| | 49,190 |
|
| | | As of December 31, |
| | | 2011 | | 2010 | | 2009 | | 2008 | | 2007 |
| Balance Sheet Data: | | | | | | | | | | |
| Working capital | | $ | 870 |
| | $ | 6,781 |
| | $ | 10,351 |
| | $ | 11,350 |
| | $ | 11,316 |
|
| Total assets | | 33,562 |
| | 32,027 |
| | 16,004 |
| | 17,556 |
| | 19,090 |
|
| Total liabilities and mezzanine equity | | 22,514 |
| | 23,527 |
| | 4,342 |
| | 4,351 |
| | 4,988 |
|
Total stockholders' equity (6) | | 11,048 |
| | 8,500 |
| | 11,662 |
| | 13,205 |
| | 14,102 |
|
| |
| (1) | Restructuring plans were implemented in 2010, 2008 and 2007 to reduce and align our expenses with current business prospects. The plans included employee terminations, office closures, termination of collaborations and write-offs of abandoned intellectual property. As a result, restructuring charges were recorded and are included in operating expenses. Refer to Note C to the accompanying consolidated financial statements. |
Refer to Note D to the accompanying consolidated financial statements.
| |
| (2) | Impairment charges in 2008 relate to the impairment of goodwill. Impairment charges in 2005 relate to the impairment of patent pursuits and write-down of inventory to net realizable value. |
| |
| (3) | Other income (expense) for all years presented primarily includes interest expense, interest income and interest income.in 2011, expense associated with the "Series A Preferred Stock" and warrants to purchase shares of Series A Preferred Stock (the "Series A Warrants") of $6.1 million, which is due to the change in fair value of the preferred stock conversion feature. The expense associated with the change in value of the preferred stock conversion feature is a non-cash item. Other income in 2011 and 2010 includes $0.2 million and $0.6 million net of consulting fees, respectively, awarded in a federal grant under the Qualifying Therapeutic Discovery Project Program related to 2009 projects. Other income in 2007 includes $.9$0.9 million from the sale of an investment security and $.2$0.2 million in insurance proceeds related to equipment destroyed in a fire at our Cramlington, England facility. The loss on debt extinguishment |
| |
| (4) | Discontinued Operations include a reclassification of $0.5$1.3 million in 2005for an adjustment to other comprehensive income related to the repaymentclosure of long-term debt and $2.9 million resulting from certain modifications to long-term borrowing agreements that were treated as extinguishments for financial reporting purposes. |
(4) | Duringthe Nucleic Acids segment. In the fourth quarter of 2005, we decidedimplemented a plan to exit ourthe Nucleic Acids operating segment which was primarily engaged in the manufacture of phosphoramadites and asthe raw materials to produce phosphoramadites which are used to produce synthetic DNA. The Nucleic Acids operating segment consisted primarily of a result, we recorded impairment and exit charges of $8.8 million consisting of valuation adjustments to reflect the carrying value of related net assets at estimated fair market value. The results of this business segment are shown as discontinued operations for all periods presented.
manufacturing facility in Glasgow, Scotland. |
| |
| (5) | For 2011, includes accrued dividends on Series A Preferred Stock of $0.6 million and Series A Preferred Stock accretion of $0.4 million. |
| |
| (6) | Reference Footnote Q. "Subsequent Events" to our accompanying consolidated financial statements for a pro forma analysis of our total stockholders' equity as of December 31, 2011 as the result of a private placement offering performed in February 2012 by the Company. |
Item 7. | Management’sItem 7. Management's Discussion and Analysis of Financial Condition and Results of Operations.
This Management Discussion and Analysis of Financial Condition and Results of Operations.
|
This report, including Management’s Discussion & Analysis contains forward-looking statements. These statements are based on management’s current views, assumptions or beliefsthat involve risks and uncertainties. Please see the section entitled "Forward-Looking Statements" at the beginning of future eventsItem 1 and financial performance and are subjectthe section entitled "Risk Factors" under Item 1A for important information to uncertainty and changes in circumstances. Readers of this report should understand that these statements are not guarantees of performance or results. Many factors could affect our actual financial results and cause them to vary materially from the expectations contained in the forward-lookingconsider when evaluating such statements. These factors include, among other things: our expected revenue, income(loss), receivables, operating expenses, supplier pricing, availability and prices of raw materials, Medicare/Medicaid/Insurance reimbursements, product pricing, foreign currency exchange rates, sources of funding operations and acquisitions, our ability to raise funds, sufficiency of available liquidity, future interest costs, future economic circumstances, industry conditions, our ability to execute our operating plans, the success of our cost savings initiatives, competitive environment and related market conditions, actions of governments and regulatory factors affecting our business and other risks as described in our reports filed with the Securities and Exchange Commission. In some cases these statements are identifiable through the use of words such as “anticipate,” “believe,” “estimate,” “expect,” “intend,” “plan,” “project,” “target,” “can,” “could,” “may,” “should,” “will,” “would” and similar expressions.
You are cautioned not to place undue reliance on these forward-looking statements. The forward-looking statements we make are not guarantees of future performance and are subject to various assumptions, risks and other factors that could cause actual results to differ materially from those suggested by these forward-looking statements.
Actual results may differ materially from those suggested by the forward-looking statements that we make for a number of reasons including those described in Item 1A, “Risk Factors,” and other factors identified by cautionary language used elsewhere in this report.We expressly disclaim any obligation to update or revise any forward-looking statements, whether as a result of new information, future events or otherwise, except as required by law.
Transgenomic, Inc. is a global biotechnology company advancing personalized medicine in the detection and treatment of cancer and inherited diseases through its proprietary molecular technologies and world-class clinical and research services. We have three complementary business segments.
Clinical Laboratories. Our continuing operations consistclinical laboratories specialize in genetic testing for cardiology, neurology, mitochondrial disorders, and oncology. Located in New Haven, Connecticut and Omaha, Nebraska the molecular clinical reference laboratories are certified under the Clinical Laboratory Improvement Amendment (CLIA) as high complexity labs and our Omaha facility is also accredited by the College of American Pathologists (CAP).
Pharmacogenomics Services. Our Contract Research Organization located in Omaha, Nebraska provides pharmacogenomics research services supporting Phase II and Phase III clinical trials conducted by our pharmaceutical customers. This lab specializes in pharmacogenomic, biomarker and mutation discovery research serving the pharmaceutical and biomedical industries world-wide for disease research, drug and diagnostic development and clinical trial support.
| |
| • | Diagnostic Tools. Our proprietary product is the WAVE® System which has broad applicability to genetic variation detection in both molecular genetic research and molecular diagnostics. There is a worldwide installed base of over 1,500 WAVE Systems as of December 31, 2011. We also distribute bioinstruments produced by other manufacturers |
(“OEM Equipment”) through our sales and distribution network. Service contracts to maintain installed systems are sold and supported by our technical support personnel. The installed WAVE base and some OEM Equipment platforms generate a demand for bioconsumables that are required for the continued operation of the Instrument Related Business (including thebioinstruments. We develop, manufacture and salesell these bioconsumable products. In addition, we manufacture and sell consumable products that can be used on multiple, independent platforms. These products include SURVEYOR® Nuclease and a range of our WAVE System and related consumable products) and the Laboratory Services (see the description of our business in Item 1). We have broken out our business into two reportable segments: Instrument Related business and Laboratory Services business. There are estimates involved in breaking out the expenses and other disclosures.chromatography columns.
The following discussion should be read together with our financial statements and related notes contained in this report. Results for the year ended December 31,
20092011 are not necessarily indicative of results that may be attained in the future.
Executive Summary
2011 Results
|
| | | | | | | | | | | | | | |
| 2011 vs. 2010 | Dollars in Thousands |
| | | | |
| | Years Ended | | Change |
| | 2011 | | 2010 | | $ | | % |
| Net sales | $ | 31,971 |
| | $ | 20,048 |
| | $ | 11,923 |
| | 59 | % |
| Gross profit | 18,437 |
| | 9,764 |
| | 8,673 |
| | 89 | % |
| Preferred stock and warrant expense | 6,066 |
| | — |
| | (6,066 | ) | | nm |
|
| Net loss | (9,782 | ) | | (3,134 | ) | | (6,648 | ) | | 212 | % |
Net sales for 2009 Results2011
Full year increased by $11.9 million or 59% compared to 2010. These results include revenues received from the FAMILION acquisition in our Clinical Laboratories segment. During 2011, net sales from Clinical Laboratories increased by $12.4 million compared to 2010. The Clinical Laboratories increase is a result of the revenue of $11.1 million related to the FAMILION acquisition. Net sales from Pharmacogenomics Services increased by $0.9 millionfor 20092011 compared to 2010. Net sales in Diagnostic Tools were down 9% or $1.4 million for 2011 compared to 2010. Our gross profit margin increased from 49% for 2010 to 58% for 2011. Clinical Laboratories gross margin increased from 41% in 2010 to 59% for 2011. Loss from operations was $3.0 million for 2011 compared to $3.6 million for 2010.
During 2011, the Company recorded non-cash expense of
$22.0$6.1 million
decreased by 8% comparedassociated with
total net sales for 2008the Series A Preferred Stock and Series A Warrants. Such expense is due to the change in fair value of
$24.0 million. The Instrument Related Business decreased 12% from 2008 to 2009. Thethe preferred stock conversion feature.
2012 Outlook
We anticipate continued growth in our Laboratory Services was 7% over the prior year. Overall gross margins decreased from 57% to 53%. Operating expenses2012 in 2008, exclusive of $1.0 million in foreign currency revaluation gains, a goodwill impairment write-off of $0.6 million, and $0.1 million of restructuring charges, were $14.3 million as compared to $13.2 million in 2009, exclusive of $0.3 million of revaluation losses. General and administrative costs, exclusive of foreign currency revaluation, are down by approximately $0.5 million, research and development costs are up by $0.7 million and sales and marketing costs are down by $1.3 million.We have taken significant steps to reduce our operating expenses. We generated a positive cash flow during the year largely due to inventory management and accounts receivable collection.
2010 Outlook
We continue to leverage our core instrument business for on-going instrument sales worldwide as well as employing our instruments and related expertise in our two laboratory services businesses. Challenges do exist for WAVE System and consumable sales growth in our traditional markets. We continue to look for emerging markets and novel applications to provide us with new opportunities for our WAVE System such as our newly launched KRAS mutation detection kit. We intend to continue to look for opportunities to diversify into new markets, including the personalized medicine market (particularly in oncology), where the sensitivitiesall three of our business units, Clinical Labs, Pharmacogenomic Services and Diagnostic Tools, as we commercialize new assay technologies are essential. In addition, we are also selling refurbished WAVE Systems in order to allow an opportunity for customers that may not be able to afford the cost of a new system. Additionally,and tests we have developed credibilityinternally or in-licensed, and momentum with third-party platforms that will allow us to leverage on our direct sales forceas we expand into other markets and distribution network.
Onregions worldwide.
The foundation of these efforts was a successful 2011, driven by top line growth and the Laboratory Services front, we have completed cancer pathway gene mutation projects for a number of high visibility pharmaceutical companies which have continued to demonstrate the unique sensitivity of detecting DNA mutations in cancer genes which are central to effective therapy selection for current and future cancer therapeutics. To this end, we are now gaining clinical trial program contracts which we believe will more rapidly impact our revenue opportunities from this segment. To compliment our mutation detection expertise, we also have strengthened our capabilities in biomarker development and mutation detection in novel cancer pathway genes which will aid in the development of true personalized medicine for our pharmaceutical partners. We recently licensed and are developing a new technology for even greater DNA mutation enrichment and detection sensitivity which should prove to be the highest sensitivity technology in the market. In our Molecular Clinical Reference Laboratory we have continued to seek out or develop new tests to further expand our menu and growth opportunities for this business.Although we have experienced declining sales and recurring net losses (resulting in an accumulated deficit of $130.2 million at December 31, 2009), management believes existing sources of liquidity, including cash and cash equivalents of $5.6 million, are sufficient to meet expected cash needs during 2010. We will need to increase net sales in order to meet our liquidity needs on a long-term basis. In future periods, there is no assurance that we will be able to increase net sales or further reduce expenses and, accordingly, we may not have sufficient sources of liquidity to continue operations indefinitely. The current economic conditions may have a negative impact on our net sales in 2010. The tightening of the credit market may make it difficult for customers to purchase instruments due to lack of funding. This was certainly true in 2009. In the event we do not have net sales growth, we expect to make cost reductions to align our expenses with our net sales.
Results of Continuing Operations
Years Ended December 31, 2009 and 2008
Net Sales. Net sales for the years ended December 31, 2009 and 2008 consisted of the following (dollars in thousands):
| | | | | | | | | | | | | |
| | | | | | | Change | |
| | | 2009 | | 2008 | | $ | | | % | |
Instrument Related Business: | | | | | | | | | | | | | |
Bioinstruments | | $ | 10,175 | | $ | 11,195 | | $ | (1,020 | ) | | (9 | )% |
Bioconsumables | | | 7,282 | | | 8,549 | | | (1,267 | ) | | (15 | )% |
| | | | | | | | | | | | | |
| | | 17,457 | | | 19,744 | | | (2,287 | ) | | (12 | )% |
Laboratory Services: | | | | | | | | | | | | | |
Molecular Clinical Reference Laboratory Services | | | 3,541 | | | 2,870 | | | 671 | | | 23 | % |
Pharmacogenomics Research Services | | | 1,025 | | | 1,379 | | | (354 | ) | | (26 | )% |
| | | | | | | | | | | | | |
| | | 4,566 | | | 4,249 | | | 317 | | | 7 | % |
| | | | | | | | | | | | | |
Total Net Sales | | $ | 22,023 | | $ | 23,993 | | $ | (1,970 | ) | | (8 | )% |
| | | | | | | | | | | | | |
Bioinstrument sales consist of salesbenefit of our WAVE System and associated equipment that we manufacture or assemble, net sales from service contracts that we enter into with purchasers of our instruments, as well as sales of instruments we distributeFAMILION acquisition. Revenues increased by 59% to $32 million for other manufacturers (“OEM equipment”). We also sell refurbished WAVE Systems in order to access customers that may not be able to afford new systems. Bioinstrument net sales are down $1.0 million, or 9% during the year ended December 31, 20092011.
Our FAMILION franchise, which we acquired in December 2010, includes eleven tests for inherited cardiac disorders. We continue to believe that there is significant opportunity to expand this business based on increased use of existing tests and the launch of new products into the marketplace. In May, the Heart Rhythm Society issued new diagnostic guidelines supporting the use of some of our key cardiac tests. In November 2011, we launched two new genetic tests at the annual American Heart Association meeting. These include our PGxPredict:CLOPIDOGREL Panel, a uniquely comprehensive test to predict a patient's response to clopidogrel (Plavix®), the most widely prescribed antiplatelet drug used to reduce the risks of death, stroke and heart attack, and a test for familial atrial fibrillation.
The clopidogrel response test, in particular, is a significant opportunity for Transgenomic, as it is the only test which analyzes the genes CYP2C19 and ABCB1 to help predict a patient's ability to absorb and metabolize clopidogrel. Clopidogrel is taken in an inactive form, known as a prodrug, and must be absorbed through the intestine and then metabolized by the liver to form the active drug in a process controlled by these genes. Patients with dysfunctional or lower functioning ABCB1 or CYP2C19 are at heightened risk for cardiovascular events than patients with normal protein function due to poorer availability of the active drug.
The risk associated with dysfunctional or lower functioning CYP2C19 prompted the FDA in 2010 to add a black box warning to the clopidogrel label.
In March of 2012, Transgenomic announced the publication of a new study by researchers at Vanderbilt University in the journal “Clinical Pharmacology and Therapeutics.” This large, independent study, the third such study examining CYP2C19 and ABCB1, demonstrated the importance of both genes in determining which patients would benefit from treatment with clopidogrel and which should pursue alternative treatment. ABCB1 is proprietary to Transgenomic, protected by an issued patent in Europe and pending patent in the US. There are approximately 6 million new patients prescribed Plavix each year, of which about 47% will not fully benefit from their therapy because of genetic variations in either CYP2C19 or ABCB1. This highlights a need for broad-based testing, and represents a potential multi-billion dollar opportunity for Transgenomic's Clinical Laboratories division.
In June 2011, we launched our Nuclear Mitome Test, a 400-gene screen of the nuclear genes linked to mitochondrial function that provides useful clinical information in understanding the underlying genetic causes of this spectrum of diseases. This test has been well-received by mitochondrial experts and physicians already and is assisting them to better diagnose this serious and difficult to discern set of disorders.
In our Pharmacogenomics Services Unit, we continue to perform cancer pathway gene mutation analysis and other associated genomics service testing for a number of pharmaceutical companies: both for pre-clinical drug discovery projects and phase II and III clinical trials. Although we may experience variability in quarter-to-quarter revenues based on the timing of projects or when specimens may arrive, we continue to experience growth in this area of the business. We can now analyze a patient's blood serum rather than a tumor to detect DNA mutations, using our ultra-sensitive DNA mutation detection technology, termed “ICE COLD-PCR”. This is a significant achievement, and we believe it should lead to faster growth of our pharmacogenomics research services as pharmaceutical companies adopt this novel approach for both drug and disease research.
In addition to ICE COLD-PCR, which offers sensitivity improvements as much as 1,000 times higher than routine DNA testing technology, we have recently discovered a technique to further improve mutation detection sensitivity of standard Sanger sequencing. We have termed this new discovery “BLOCker-Sequencing” and we are combining this new discovery with our ICE COLD-PCR program to bring what we believe to be the most accurate and sensitive mutation detection technology available in the market today.
Results of Continuing Operations
Net Sales.
Net sales consisted of the following:
|
| | | | | | | | | | | | | | |
| 2011 vs. 2010 | Dollars in Thousands |
| | | | |
| | Years Ended | | Change |
| | 2011 | | 2010 | | $ | | % |
| Clinical Laboratories | $ | 16,038 |
| | $ | 3,606 |
| | $ | 12,432 |
| | 345 | % |
| Pharmacogenomic Services | 2,280 |
| | 1,373 |
| | 907 |
| | 66 | % |
| Diagnostic Tools | 13,653 |
| | 15,069 |
| | (1,416 | ) | | (9 | )% |
| Total net sales | $ | 31,971 |
| | $ | 20,048 |
| | $ | 11,923 |
| | 59 | % |
Clinical Laboratories net sales increased $12.4 million during the year ended December 31, 2011, compared to the same period in 2008. We sold 32 WAVE Systems during the year ended December 31, 2009 compared to 30 systems during 2008. This increase resulted from higher demand in the Asia markets which is offset by our average sales price decreasing 30% from 2008 to 2009. This decrease in average sales price is largely due to the geographic makeup of the sales. We sold 11 OEM instruments during the year ended December 31, 2009 compared to 13 in the same period of 2008 with a 6%2010. Of this increase in the average sales price. There was a reduction in service contract net sales in the European market largely due to foreign currency exchange impact of $0.5 million. Service contract revenue, decreased in the United States due to fewer service contract renewals. Demand for WAVE Systems continues to be affected by significant competitive challenges from traditional (i.e. sequencing) and evolving technologies. Instrument related revenue is subject to many factors such as type of instrument sold and the country of sale. Due to these factors each period should be considered on a stand alone basis and is not indicative of future net sales streams.Bioconsumable net sales decreased during the year ended December 31, 2009 compared to 2008 by $1.3 million. The primary decrease in consumables$11.1 million is due to revenue from the negative impactFAMILION family of the foreign currency exchange rates, primarily the Great British Pound to the US Dollar and a smaller usage decline of the WAVE consumables. The foreign currency exchange impact included in this decrease was $0.8 million.
Laboratory Services net sales increased during the year endedgenetic tests, which we acquired on December 31, 2009 compared to 2008 by $0.3 million or 7%. Laboratory Services sales includes both the Molecular Clinical Reference Laboratory Services and the Pharmacogenomics Research Services. The Molecular Clinical Reference
Laboratory Services net sales of $3.5 million increased 23% over the year ended December 31, 2008. The Molecular Clinical Reference Laboratory net sales has increased due to increased test volume. Our test volume has29, 2010. In addition, our revenue increased by 45% due to$1.3 million in our increased sales focus. The average revenue per test has decreased by 15%neurology family of tests due to the mix of teststest performed and increased Medicare and Medicaid test volumes which drives lower reimbursements for these tests. The Pharmacogenomics Researchthe average revenue per test.
Pharmacogenomic Services had net sales of $1.0$2.3 million during 2009 decreased 26% over the year ended December 31, 2008. Pharmacogenomics Research revenue was lower during 2009 than2011, which increased $0.9 million compared to the same period in 20082010. The increase is due to fewer large projects completed in 2009. Thethe completion of a significant project with a pharmaceutical company client. Pharmacogenomics Research Services net sales have peaks due to the nature of project related business.project-related services performed on behalf of our clients. Each period for Pharmacogenomics Research Services should be considered on a stand alone basis and is not indicative of future net sales.
Diagnostic Tools net sales decreased $1.4 million, or 9%, during the year ended December 31, 2011, as compared to the same period in 2010. The decrease was due to fewer systems sold in the year ended December 31, 2011. We sold thirteen WAVE Systems in 2011 compared to twenty-five in 2010. Demand for WAVE Systems has been affected by significant competitive challenges from traditional (i.e. sequencing) and evolving technologies. Lower WAVE System sales are offset by slightly higher OEM Equipment sales in 2011. We sold fourteen OEM Equipment instruments in the year ended December 31, 2011 compared to ten in the same period in 2010. Bioconsumables net sales were down $0.6 million, during the year ended December 31, 2011 compared to the same period in 2010 due to lower volume in Europe.
|
| | | | | | | | | | | | | | |
| 2010 vs. 2009 | Dollars in Thousands |
| | | | |
| | Years Ended | | Change |
| | 2010 | | 2009 | | $ | | % |
| Clinical Laboratories | $ | 3,606 |
| | $ | 3,541 |
| | $ | 65 |
| | 2 | % |
| Pharmacogenomic Services | 1,373 |
| | 1,025 |
| | 348 |
| | 34 | % |
| Diagnostic Tools | 15,069 |
| | 17,457 |
| | (2,388 | ) | | (14 | )% |
| Total net sales | $ | 20,048 |
| | $ | 22,023 |
| | $ | (1,975 | ) | | (9 | )% |
Clinical Laboratories net sales were consistent during the year ended December 31, 2010, compared to the same period in 2009.
Pharmacogenomic Services had net sales of $1.4 million during the year ended December 31, 2010, which increased $0.3 million compared to the same period in 2009. The increase is due to an increase in the number of clients and average revenue billed per client for the year ended December 31, 2010 compared to same period in 2009. Pharmacogenomics Services net sales have peaks due to the nature of project-related services performed on behalf of our clients. Each period for Pharmacogenomics Services should be considered on a stand alone basis and is not indicative of future net sales.
Diagnostic Tools net sales decreased $2.4 million, or 14%, during the year ended December 31, 2010 as compared to the same period in 2009. The decrease was due to fewer instruments sold in the year ended December 31, 2010. We sold twenty-five WAVE instruments in 2010 compared to thirty-two WAVE instruments in 2009. Demand for WAVE Systems has been affected by significant competitive challenges from traditional (i.e. sequencing) and evolving technologies. We sold ten OEM Equipment instruments in the year ended December 31, 2010 compared to eleven in the same period in 2009. Bioconsumables net sales were down $0.5 million, during the year ended December 31, 2010 compared to the same period in 2009 due to lower volume our European market offset by higher volume in our U.S. market.
Costs of Goods Sold.
Costs of goods sold include material costs for the products that we sell and substantially all other costs associated with our manufacturing facilities (primarily personnel costs, rent and depreciation) as well as the wholesale price we pay manufacturers of OEM Equipment that we distribute. It also includes direct costs (primarily personnel costs, test outsourcing fees, rent, supplies and depreciation) associated with our LaboratoryClinical Laboratories and Pharmacogenomics Services operations. Cost
Gross Profit.
Gross profit and gross margins for each of goods sold forour business segments were as follows:
|
| | | | | | | | | | | | | |
| 2011 vs. 2010 | Dollars in Thousands |
| | | | |
| | Years Ended | | Margin % |
| | 2011 | | 2010 | | 2011 | | 2010 |
| Clinical Laboratories | $ | 9,478 |
| | $ | 1,481 |
| | 59 | % | | 41 | % |
| Pharmacogenomic Services | 1,050 |
| | (43 | ) | | 46 | % | | (3 | )% |
| Diagnostic Tools | 7,909 |
| | 8,326 |
| | 58 | % | | 55 | % |
| Gross profit | $ | 18,437 |
| | $ | 9,764 |
| | 58 | % | | 49 | % |
Gross profit was $18.4 million, or 58% , of total net sales during the yearsyear ended December 31, 2011, compared to $9.8
million, or 49%, during the same period of 2010. During the year ended December 31, 2009 and 2008 consisted2011, the gross margin for Clinical Laboratories was $9.5 million, or 59%, as compared to $1.5 million, or 41%, in the same period of 2010. The year ended December 31, 2011 includes gross profit from sales of the following (dollarsFAMILION family of genetic tests, which we acquired on December 29, 2010. Pharmacogenomics Services gross margin increased from a loss of less than $0.1 million, or (3)%, for the year ended December 31, 2010 to $1.1 million, or 46% for the year ended December 31, 2011. Pharmacogenomics Services have a relatively fixed-cost base so any increase or decrease in thousands):revenue directly impacts gross margins. In addition, operating supplies costs were lower in 2012 compared to 2011. Diagnostic Tools gross margin increased to | | | | | | | | | | | | | |
| | | | | | | Change | |
| | | 2009 | | 2008 | | $ | | | % | |
Instrument Related Business: | | | | | | | | | | | | | |
Bioinstruments | | $ | 3,801 | | $ | 4,046 | | $ | (245 | ) | | (6 | )% |
Bioconsumables | | | 3,779 | | | 3,982 | | | (203 | ) | | (5 | )% |
| | | | | | | | | | | | | |
| | | 7,580 | | | 8,028 | | | (448 | ) | | (6 | )% |
Laboratory Services: | | | | | | | | | | | | | |
Molecular Clinical Reference Laboratory Services | | | 2,018 | | | 1,647 | | | 371 | | | 23 | % |
Pharmacogenomics Research Services | | | 820 | | | 670 | | | 150 | | | 22 | % |
| | | | | | | | | | | | | |
| | | 2,838 | | | 2,317 | | | 521 | | | 22 | % |
| | | | | | | | | | | | | |
Total Cost of Goods Sold | | $ | 10,418 | | $ | 10,345 | | $ | 73 | | | 1 | % |
| | | | | | | | | | | | | |
58% in the year ended December 31, 2011 from 55% in the same period of 2010 due to the change in mix of types of instruments sold.
|
| | | | | | | | | | | | | |
| 2010 vs. 2009 | Dollars in Thousands |
| | | | |
| | Years Ended | | Margin % |
| | 2010 | | 2009 | | 2010 | | 2009 |
| Clinical Laboratories | $ | 1,481 |
| | $ | 1,523 |
| | 41 | % | | 43 | % |
| Pharmacogenomic Services | (43 | ) | | 205 |
| | (3 | )% | | 20 | % |
| Diagnostic Tools | 8,326 |
| | 9,877 |
| | 55 | % | | 57 | % |
| Gross profit | $ | 9,764 |
| | $ | 11,605 |
| | 49 | % | | 53 | % |
Gross profit equaled $11.6was $9.8 million or 53%49% of total net sales during the year ended December 31, 20092010, compared to $13.6$11.6 million, or 57%53%, during the same period of 2008. The decrease in2009. During the years ended December 31, 2010 and 2009, the gross profit as a percent of net sales is largely attributable to changes in the composition of products sold. Margins on bioinstruments declined from 64% to 63% from 2008 to 2009 due to the change in the geographic mix of instruments sold, a decline in service contract revenuemargin for Clinical Laboratories was $1.5 million for both years and obsolescence of $0.1 million related to an older low throughput instrument. Margins on bioconsumables41% and 43%, respectively. Pharmacogenomics Services gross margin decreased from 53% in 2008 to 48% in 2009 primarily related to an obsolescence reserve of $0.4$0.2 million, for control plasmids used in our SURVEYOR kits and the transition from a steel syringe delivery method to a disposable delivery method. The Laboratory Services business segment margins decreasedor 20% for the year ended December 31, 2009 to 38% as compared to 45%a loss of less than $0.1 million, or (3)% for the year ended December 31, 2008.2010. The margin declineerosion in the LaboratoryPharmacogenomics Services business segmentgross margin in 2010 compared to 2009 is driven by the decrease in Pharmacogenomics Research Services revenue. In addition, Laboratory Services haddue to higher operating supplies costcosts in 2009 than2010. Diagnostic Tools gross margin decreased to 55% for the year ended December 31, 2010 from 57% in the same period in 2008 relatedof 2009 due to lower bioconsumable sales, which also have a relatively fixed-cost base.
Operating expenses.
The following table summarizes operating expenses further described below for the
higher volume of testsyears ended December 31, 2011, 2010 and
work required on the Pharmacogenomic projects.2009:
|
| | | | | | | | | | | | |
| | Dollars in Thousands |
| | | | |
| | Years Ended |
| | 2011 | | 2010 | | 2009 | |
| Selling, general and administrative | $ | 19,150 |
| | $ | 10,933 |
| | $ | 10,319 |
| |
| Research and development | 2,218 |
| | 2,305 |
| | 3,182 |
| |
| Restructuring charges | 41 |
| | 138 |
| | — |
| |
| Total | $ | 21,409 |
| | $ | 13,376 |
| | $ | 13,501 |
| |
Selling, General and Administrative Expenses.
Selling, general and administrative expenses consist primarily includeof personnel costs, marketing, travel and entertainment costs, professional fees, and facilitycosts and costs. In addition, the effect of foreign currency revaluation. revaluation is included here. Our selling, general and administrative costs increased to $19.2 million, or 60% of net sales, from $10.9 million, or 55% of net sales, during the year ended December 31, 2011 compared to the same period in 2010. The increase in our selling, general and administrative costs is due primarily to (i) $4.9 million in expenses related to the FAMILION family of genetic tests, which we acquired on December 29, 2010, (ii) $1.0 million in expense related to the vesting of the employee stock option grants, (iii) $1.2 million in amortization of the acquired intangibles and (iv) bad debt expense of $1.7 million. Losses from foreign currency revaluation for the year ended December 31, 2011 were less than $0.1 million compared to losses of $0.3 million for the same period in 2010.
Selling, general and administrative expenses excluding foreign currency revaluation gains and losses, decreasedincreased as a percentage of net sales from 49%47% in 20082009 to 46%55% in 2009. SG&A2010. For the year ended December 31, 2010 we incurred $0.8 million in expenses related to our acquisition of the FAMILION family of genetic tests. Selling, general and administrative expenses would have been $10.0 million excluding the foreign currency revaluation expense of $0.3$10.1 million for the year ended December 31, 2009. SG&A would have been $11.8 million2010 excluding the $1.0 million foreign currency revaluation gaindeal costs to acquire the FAMILION family of genetic tests which would be comparable to selling, general and administrative expenses for the year ended December 31, 2008. These reductions 2009 of $10.3 million. Losses from foreign currency revaluation
were
primarily due$0.3 million in each of the periods ended December 31, 2010 and 2009. We recorded restructuring charges of $0.1 million in 2010 related to
open employmentthe consolidation of research and development into our facilities in Omaha, Nebraska which included closing the Gaithersburg, Maryland facility and the elimination of positions
not being filled and lower commissions, travel and stock option expenses.in our manufacturing group. There were no restructuring charges in 2009.
Research and Development Expenses.
Research and development expenses include primarily include personnel costs, collaboration costs, legal fees, outside services, collaboration expenses, supplies, and facility costs. Thesecosts and are expensed in the period in which they are incurred. During the year ended December 31, 2011 and 2010 these costs totaled $3.2$2.2 million and $2.3 million, respectively. Research and development expenses totaled 7% and 11% of net sales during the year ended December 31, 2011 and 2010, respectively. The decrease is due primarily to the consolidation of our research and development activities in Omaha, Nebraska, the benefit which is partially offset by legal costs to defend a patent.
Research and development expenses totaled $2.3 million during the year ended December 31,
20092010 compared to
$2.5$3.2 million during the same period of
2008, an increase2009, a decrease of
$0.7$0.9 million or
29%28%. The
increasedecrease is primarily due to
expenses in 2009 related to collaboration expenses
with Power3 for
their NuroPro assay development related to the diagnosis of Alzheimer’s and Parkinson’s diseases,
the Dana-Farber Cancer Institute related to the development of high sensitivity mutation detection technology called Cold-PCR and purchases of samples related to research work in progress. As a percentage of net sales, research and development expenses totaled
14%11% and
10%14% of net sales during the
yearyears ended December 31,
20092010 and
20082009 respectively. Research and development
expensescosts are expensed in the year in which they are incurred.
Restructuring Charges. There were no restructuring charges in 2009. We recorded restructuring charges of $0.1 million in 2008 related to the additional lease expense on the shut down of the Paris facility. This is due to changes in the market place causing our inability to sublease the facility of $0.3 million, which is offset by reserves for fixed assets and severance of $0.2 million not utilized. In addition, we took restructuring charges of less than $0.1 million in 2008 related to severance due to the relocation of the Pharmacogenomics Laboratory from Gaithersburg, Maryland to Omaha, Nebraska.Goodwill. As part of our 2008 impairment assessment we determined that goodwill was impaired and, accordingly, it was written off. The goodwill was attached to the WAVE related business. See goodwill discussion in Footnote B.
Other Income (Expense). Other
The following table summarizes other income consists primarily of interest income from cash and cash equivalents invested in overnight instruments. Other income(expense) for the years ended December 31, 20092011, 2010 and 20082009:
|
| | | | | | | | | | | | |
| | Dollars in Thousands |
| | | | |
| | Years Ended |
| | 2011 | | 2010 | | 2009 | |
| Interest income (expense) | $ | (958 | ) | | $ | (4 | ) | | $ | 15 |
| |
| Expense on preferred stock and warrants | (6,066 | ) | | — |
| | — |
| |
| Other, net | 259 |
| | 632 |
| | 3 |
| |
| Total other income (expense), net | $ | (6,765 | ) | | $ | 628 |
| | $ | 18 |
| |
Other expense for the year ended December 31, 2011 totaled $6.8 million. Other expense includes interest expense as well as the expense associated with the Series A Preferred Stock and Series A Warrants, which is due to (i) the change in fair value of the preferred stock conversion feature and (ii) the consideration given to the owners of the Series A Convertible Preferred Stock in exchange for the Series A Preferred Stock Certificate Amendment. The expenses associated with the Series A Preferred Stock are non-cash items. Other income (expense) includes an award of a federal grant under the Qualifying Therapeutic Discovery Project of $0.2 million, net of consulting fees.
Other income in the year ended December 31, 2010 includes $0.6 million, net of consulting gees, relating to an award of a federal grant under the Qualifying Therapeutic Discovery Project. Other income for the year ended December 31, 2009 was less than $0.1
million for each period.million.
Income Tax Expense. Expense (Benefit).
Income tax expense recorded during the years ended December 31, 20092011, 2010 and 20082009 related to income taxes in states, foreign countries and other local jurisdictions and totaled less than $0.1 million, and $0.2 million respectively. The 2009 income tax expense is partially offset by a refundable tax credit related to the 2008 federal and state income tax returns. This credit is anticipated to continue for 2009.less than $0.1 million, respectively. The effective tax rate for the year ended December 31, 20092011 is 2.3%0.5%, which is primarily the result of valuation allowances against net operating losses for the United States, partially adjusted by permanent differences related to inter-company foreign currency exchange of our subsidiary outside the United States. The effective tax rate for the years ended December 31, 2010 and 2009 were 5.0% and 2.2%, respectively. A net deferred tax liability was recorded during
20092011 and 2010 relating to the UK income taxes of less than $0.1 million
compared to a net deferred tax asset of $0.1 million at year end 2008. Due to our cumulative losses and inability to utilize any additional losses as carrybacks, we did not provide for an income tax benefit during the year ended December 31, 2009 based on our determination that it was more likely than not that such benefits would not be realized.. We will continue to assess the recoverability of deferred tax assets and the related valuation allowance. To the extent we begin to generate taxable income in future periods and determine that such valuation allowance is no longer
required, the tax benefit of the remaining deferred tax assets will be recognized at such time. Our net operating loss carryforwardscarry-forwards from continuing and
discontinued operations of
$107.2$104.4 million will expire at various dates from
20102012 through
2029,2031, if not utilized. We also had state income tax loss
carryforwardscarry-forwards from continuing and discontinued operations of
$41.0$46.0 million at December 31,
2009. We plan to do a study related to our federal and state net operating loss carryforwards in 2010 to determine if these have been limited due to change of control provisions.2011. These
carryforwardscarry-forwards will also expire at various dates if not utilized.
Liquidity and Capital Resources
Our working capital positions at December 31, 20092011 and 20082010 were as follows (in thousands): | | | | | | | | | | |
| | | December 31, | | | |
| | | 2009 | | 2008 | | Change | |
Current assets(including cash and cash equivalents of $5,642 and $4,771, respectively) | | $ | 14,454 | | $ | 15,585 | | $ | (1,131 | ) |
Current liabilities | | | 4,103 | | | 4,235 | | | (132 | ) |
| | | | | | | | | | |
Working capital | | $ | 10,351 | | $ | 11,350 | | $ | (999 | ) |
| | | | | | | | | | |
While
|
| | | | | | | | | | | | |
| | | December 31, | | |
| | | 2011 | | 2010 | | Change |
Current assets (including cash and cash equivalents of $4,946 and $3,454 respectively) | | $ | 17,198 |
| | $ | 15,034 |
| | $ | 2,164 |
|
| Current liabilities | | 16,328 |
| | 8,253 |
| | (8,075 | ) |
| Working capital | | $ | 870 |
| | $ | 6,781 |
| | $ | (5,911 | ) |
Working capital decreased from 2010 to 2011 primarily due to the following: 1) current maturities of long term debt increased $3.7 million, 2) the Company accrued dividends payable on its Series A Preferred Stock totaling $0.6 million, and 3) selected liability accounts including accounts payable, accrued compensation and other accrued liabilities increased on a net basis between year ends.
On December 30, 2011, the Company entered into a Convertible Promissory Note Purchase Agreement with the Third Security Investors in the aggregate amount of $3.0 million that automatically converted into shares of the Company's common stock and warrants to purchase such common stock on the same terms as all investors in the private placement described below.
On February 3, 2012 the Company entered into definitive agreements with institutional and other accredited investors to raise approximately $19.0 million (before offering costs and selling agent commissions) in a private placement. The funding occurred in February 2012. Pursuant to the terms of the private placement, we did generate cash in 2009, we have historically operatedissued an aggregate of 19,000,000 shares of the Company's common stock at a lossprice per share of $1.00 as well as five-year warrants to purchase up to an aggregate of 9,500,000 shares of common stock with an exercise price of $1.25 per share. As part of the private placement financing and have not consistently generated sufficient cash from operating activitiesin connection with the conversion of the convertible notes issued by the Company to cover our operatingthe Third Security Investors, we issued an aggregate of 3,000,000 shares of common stock and other cash expenses. In 2009 we had a net loss of $1.9 million1,500,000 warrants on the same terms as all investors in the private placement.
Please see the section entitled "Contractual Obligations and neededOther Commitments" that follows shortly in this document and Footnote G. "Debt" to use $0.4 million in investing activities which was offset by cash provided by operating activities. While we have been able to historically finance our operating losses through borrowings or from the issuance ofaccompanying consolidated financial statements for additional equity, we currently have no borrowingsinformation regarding the Company's outstanding debt and have no plans to issue additional equity securities for this purpose. debt servicing obligations. Additionally, see following paragraph describing subsequent funding received.
At December 31,
2009 and December 31, 2008,2011, we had cash and cash equivalents of
$5.6$4.9 million and
$4.8in February 2012we received approximately $17.5 million
respectively. While wein connection with the private placement. We believe that existing sources of liquidity
as of December 31, 2011 along with the net proceeds of the February 2012 private placement, are sufficient to meet expected cash
needs during 2010,needs. Accordingly, we
will need to increase our net sales, focus on receivables and inventory management or further reduce our operating expenses in order to be assured of meeting our liquidity needs on a long-term basis. However,believe we
cannot assure you that we will be able to increase our net sales or further reduce our expenses, or raise further capital or equity and, accordingly, we may not have sufficient
sources of liquidity to continue our operations
indefinitely.for the foreseeable future.
Analysis of Cash Flows
The following table presents a summary of our cash flows: |
| | | | | | | | | | | |
| | (amounts in thousands) |
| | 2011 | | 2010 | | 2009 |
| Net cash provided by (used for): | | | | | |
| Operating activities | $ | 220 |
| | $ | (1,718 | ) | | $ | 1,267 |
|
| Investing activities | (508 | ) | | (6,226 | ) | | (377 | ) |
| Financing activities | 1,726 |
| | 5,761 |
| | — |
|
| Effect of exchange rates on cash | 54 |
| | (5 | ) | | (19 | ) |
| Net increase (decrease) in cash and cash equivalents | $ | 1,492 |
| | $ | (2,188 | ) | | $ | 871 |
|
Years Ended December 31, 2009 and 2008Net Change in Cash and Cash Equivalents.Cash and cash equivalents increased by $1.5 million during 2011, decreased by $2.2 million during 2010 and increased by $0.9 million during 2009.
Cash Flows Provided By (Used In) Operating Activities. During 2011, the Company recorded non-cash, stock-based compensation expense totaling $1.0 million and $6.1 million of non-cash expense associated with the Series A Preferred Stock and
Series A Warrants. The Company recorded non-cash, stock-based compensation expense of $0.0 million and $0.2 million during 2010 and 2009, respectively. The Company recorded depreciation and amortization expense totaling $2.1 million, $0.7 million and $0.9 million during
the year ended December 31,2011, 2010 and 2009,
primarily as a result of $1.3 million being provided by operating activities and net cash used in investing activities of $0.4 million. Cash and cash equivalents decreased $1.0 million during the year ended December 31, 2008 as a result of net cash of $0.4 million being used by operating activities, changes in foreign currency exchange rates of $0.1 million and net cash used in investing activities of $0.4 million.respectively.
Cash Flows Provided In Operating Activities. Cash flows provided in operating activities totaled $1.3 million during the year ended December 31, 2009 compared to $0.4 million used in operating activities during the year ended December 31, 2008. We were able to generate cash flows from operating activities in 2009 due to our focus on accounts receivable collections and stronginventory management. The cash flows provided by operating activities in 2009 primarily relate to the increased accounts receivable collections of $1.1 million, the decrease in inventory of $1.3 million and noncash items of $1.1 million, offset by the loss of $1.9 million and lower accrued expenses of $0.4 million. The use in 2008 resulted from an increase in accounts receivable of $1.1 million and higher inventory levels of $0.7 million related primarily to the acquisition of OEM Equipment and a net loss of $0.5 million offset somewhat by non-cash charges of $1.9 million. Non-cash charges consisted of depreciation and amortization of $0.9 million, goodwill impairment of $0.6 million and non-cash stock based compensation of $0.4 million.
Cash Flows Used In Investing Activities. Cash flows used During 2010, the Company acquired the FAMILION family of genetic tests for $6.0 in investing activities totaled $0.4 million during the years ended December 31, 2009 and 2008. Cash flows used in investing activities in 2009 and 2008 consisted primarily ofcash consideration. The Company recorded purchases of property and equipment.equipment totaling $0.2 million, $0.2 million and $0.4 million during 2011, 2010 and 2009, respectively.
Cash Flows Used in Financing Activities. During 2011, the Company recorded proceeds from short term notes payable totaling $3.0 million. During 2010, the Company raised $6.0 million in the issuance Series A Preferred Stock and Series A Warrants, which was used in the financing of the acquisition of FAMILION. The Company recorded principal payments on capital leases totaling $0.4 million and $0.1 million during 2011 and 2010, respectively. The Company recorded principal payments on notes payable totaling $0.9 million during 2011.
Contractual Obligations and Other Commitments
As of December 31, 2011, our contractual obligations and other commitments were as follows:
|
| | | | | | | | | | | | | | | | | | | | | | | | | | | |
| | (Amounts in thousands) |
| | 2012 | | 2013 | | 2014 | | 2015 | | 2016 | | After 2016 | | Total |
Short term debt(1) | $ | 3,082 |
| | $ | — |
| | $ | — |
| | $ | — |
| | $ | — |
| | $ | — |
| | $ | 3,082 |
|
Long term debt(1) | 3,703 |
| | 4,937 |
| | — |
| | — |
| | — |
| | — |
| | 8,640 |
|
Interest(1) | 900 |
| | 307 |
| | | | | | | | | | 1,207 |
|
Capital lease obligations(2) | 378 |
| | 312 |
| | 97 |
| | — |
| | — |
| | — |
| | 787 |
|
Operating lease obligations(3) | 1,103 |
| | 1,023 |
| | 978 |
| | 914 |
| | 866 |
| | 2,094 |
| | 6,978 |
|
Purchase obligations(4) | 1,271 |
| | — |
| | — |
| | — |
| | — |
| | — |
| | 1,271 |
|
| | $ | 10,437 |
| | $ | 6,579 |
| | $ | 1,075 |
| | $ | 914 |
| | $ | 866 |
| | $ | 2,094 |
| | $ | 21,965 |
|
(1) See Note G - Debt
(2) See Note H - Capital Leases
(3) These amounts represent non-cancellable operating leases for equipment, vehicles and operating facilities
(4) These amounts represent purchase commitments, including all open purchase orders
Off Balance Sheet Arrangements
At December 31,
20092011 and
2008,2010, we did not have any
relationships with unconsolidated entities or financial partnerships, such as entities often referred to as structured finance or special purpose entities, which would have been established for the purpose of facilitating off-balance sheet arrangements
that have or
other contractually narroware reasonably likely to have a current or
limited purposes.future effect on our financial condition, changes in financial condition, revenues or expenses, results of operations, liquidity, capital expenditures or capital resources.
Critical Accounting Policies
Accounting policies used in the preparation of the consolidated financial statements may involve the use of management judgments and estimates. Certain of our accounting policies are considered critical as they are both important to the portrayal of our financial statements and they require significant or complex judgments on the part of
management. The preparation of consolidated financial statements requires management to make estimates and assumptions that affect the reported amounts of assets and liabilities and disclosure of contingent assets and liabilities at the date of the financial statements and the reported amounts of net sales and expenses during the reported period. In addition, estimates and assumptions associated with the determination of the fair value of certain assets and related impairments require considerable judgment by management. Our judgments and estimates are based on experience and assumptions that we believe are reasonable under the circumstances. Further, we evaluate our judgments and estimates from time to time as circumstances change. Actual financial results based on judgment or estimates may vary under different assumptions or circumstances. The following are certain critical accounting policies that may involve the use of judgment or estimates.
Allowance for Doubtful AccountAccounts and Contractual Allowances. While payment terms are generally 30 days, we have also provided extended payment terms of up to 90 days in certain cases. We operate globally and some of the international payment terms may be greater than 90 days. Accounts receivable are carried at original invoice amount and shown net of an allowance for doubtful accounts. In determining an allowance for doubtful accounts we considerand contractual allowances. The estimate made for doubtful accounts is based on a review of all outstanding amounts on a quarterly basis. We determine the ageallowance for doubtful accounts and contractual allowances by regularly evaluating individual customer receivables and considering a customer’s financial condition, credit history and current economic conditions. Accounts receivable are written off when deemed uncollectible. Recoveries of the accounts receivable customer credit history, customer financial information, reasons for non-payment, and our knowledge of the customer. If our customers’ financial condition were to deteriorate, resulting in a change in their ability to make payment, additional allowances may be required.previously written off are recorded when received.
Inventories. Inventories are stated at the lower of cost or market net of allowance for obsolete inventory. Cost is computed using standard costs for finished goods and average or latest actual cost for raw materials and work in process, which approximates the first-in, first-out (FIFO) method. We write down slow-moving and obsolete inventory by the difference between the value of the inventory and our estimate of the reduced value based on potential future uses, the likelihood that overstocked inventory will be sold and the expected selling prices of the inventory. If our ability to realize value on slow-moving or obsolete inventory is less favorable than assumed, additional write-downs of the inventory may be required. DepreciationProperty and Amortization of Long-Lived Assets. Our long-lived assets consist primarily of property and equipment, patents and intellectual property. We believe the useful lives we assigned to these assets are reasonable. If our assumptions about these assets change as a result of events or circumstances and we believe the assets may have declined in value we may record impairmentEquipment. charges resulting in an increase to operating expenses. Property and equipment are carried at cost. Depreciation and amortization areis computed usingby the straight-line method over the estimated useful lives of the related assets.
Goodwill. Goodwill is the excess of the purchase price over fair value of assets rangingacquired and is not amortized. Goodwill is tested for impairment annually. We perform this impairment analysis during the fourth quarter of each year or when a significant event occurs that may impact goodwill. Impairment occurs when the carrying value is determined to be not recoverable thereby causing the carrying value of the goodwill to exceed its fair value. If impaired, the asset’s carrying value is reduced to its fair value. No impairment existed at December 31, 2011 and 2010.
Intangibles.Intangibles include intellectual property, patents and acquired products.
1. Intellectual Property. Initial costs paid to license intellectual property from 1independent third parties are capitalized and amortized using the straight-line method over the license period. Ongoing royalties related to 10 years.such licenses are expensed as incurred.
2. Patents. We capitalize legal costs, and filing fees and other expenses associated with obtaining patents on our new discoveries and amortize these costs using the straight-line method over the shorter of the legal life of the patent or its economic life beginning on the date the patent is issued. Intellectual property is recorded at cost
3. Acquired Products. As a part of the FAMILION acquisition we acquired technology, in process technology, trademarks/tradenames and isthird party relationships. These costs will be amortized straight line over their estimated economic life of seven to eight years. See Footnote F.
The Company reviews its
estimated useful life.Impairment of Long-Lived Assets. We evaluate goodwillamortizable long lived assets annually for impairment on an annual basis. We assess the recoverability of long-lived assetsor whenever events or changes in circumstances indicate that the carrying amount of anthe asset may not be recoverable. An impairment loss would be recorded if the sum of the future undiscounted cash flows is less than the carrying amount of the asset. The amount of the loss would be determined by comparing the fair market values of the asset to the carrying amount of the asset. No loss has been recorded during the years ended December 31, 2011 or 2010. In 2009, we recorded less than $0.1 million related to accelerated amortization on two license agreements that we terminated in the first quarter of 2010.
Indefinite lived assets will be tested for impairment on an annual basis or when a significant event occurs, which may impact impairment. We recorded no impairment during the year ended December 31, 2011, 2010 or 2009.
Preferred Stock. Priorto the 2011 modification, the Series A Preferred Stock met the definition of mandatorily redeemable stock as it was preferred capital stock which was redeemable at the option of the holder and therefore was reported outside of equity. The Series A Preferred Stock was accreted to its redemption value. Prior to the 2011 modification, the Series A Warrants did not qualify to be treated as equity, and accordingly, was recorded as a liability. A preferred stock conversion feature was embedded within the Series A Preferred Stock that met the definition of a derivative. The Series A Preferred Stock, Series A Warrants liability and Series A Preferred Stock conversion feature were all recorded separately and were initially recorded at fair value using the Black Scholes model. We were required to record these instruments at fair value at each reporting date and changes were recorded as an adjustment to earnings. The Series A Warrant liability and Series A Preferred Stock conversion feature were considered level three financial instruments.
We entered into a transaction with the holders of the Series A Preferred Stock (the "Series A Holders"), pursuant to an
Agreement Regarding Preferred Stock (the “Amendment Agreement”), in which the Series A Holders agreed to (i) waive their rights to enforce the anti-dilution and redemption features of the Series A Preferred Stock and (ii) at the next annual shareholder meeting, vote to amend the Certificate of Designation for the Series A Preferred Stock to remove the anti-dilution and redemption features of the Series A Preferred Stock. In exchange, the Company issued shares of common stock to the Series A Holders having an aggregate market value of $0.3 million.
As parta result of the Amendment Agreement, the value of the Series A Preferred Stock and Series A Warrant, including the Series A Preferred Stock conversion feature and Series A Warrant liability, were reclassified into shareholders equity as of the date of the Amendment Agreement.
Stock Based Compensation. All stock options awarded to date have exercise prices equal to the market price of our 2008 impairment assessment,common stock on the date of grant and have ten-year contractual terms. Unvested options as of December 31, 2011 had vesting periods of one or three years from date of grant. None of the stock options outstanding at December 31, 2011 are subject to performance or market-based vesting conditions.
We measure and recognize compensation expense for all stock-based awards made to employees and directors, including stock options. Compensation expense is based on the calculated fair value of the awards as measured at the grant date and is expensed ratably over the service period of the awards (generally the vesting period).
Income Taxes.Deferred tax assets and liabilities are determined based on the differences between the financial reporting and tax basis of assets and liabilities at each balance sheet date using tax rates expected to be in effect in the year the differences are expected to reverse. Deferred tax assets are reduced by a valuation allowance to the extent that it is more likely than not that they will not be realized. We had no material unrecognized tax benefits, interest, or penalties during fiscal 2011 or fiscal 2010, and we determined that goodwill was impaired,do not anticipate any such items during the next twelve months. Our policy is to record interest and accordingly, it was written off.penalties directly related to income taxes as income tax expense in the Consolidated Statements of Operations.
Net Sales Recognition. Recognition.
Revenue is realized and earned when all of the following criteria are met:
Persuasive evidence of an arrangement exists
Delivery has occurred or services have been rendered
The seller’s price to the buyer is fixed or determinable, and
Collectability is reasonably assured.
Net sales from our Clinical Laboratories are recognized on an individual test basis and takes place when the test report is completed, reviewed and sent to the client less the reserve for insurance, Medicare and Medicaid contractual adjustments. There are no deferred net sales associated with our Clinical Laboratories. Adjustments to the allowances, based on actual receipts from third party payers, are recorded upon settlement.
In our Pharmacogenomics Services, we perform services on a project by project basis. When we receive payment in advance, we recognize revenue when we deliver the service. These projects typically do not extend beyond one year.
Net sales of
our instrument and bioconsumableDiagnostic Tools products are recognized in accordance with the terms of the sales arrangement. Such recognition is based on receipt of an unconditional customer order and transfer of title and risk of ownership to the customer, typically upon shipment of the
product.product under a purchase order. Our
normal sales terms do not provide for the right of return unless the product is damaged or defective. Net
Salessales from certain services associated with
ourthe analytical instruments, to be performed subsequent to shipment of the products, is deferred and recognized when the services are provided. Such services, mainly limited to installation and training services that are not essential to the functionality of the instruments, typically are performed in a timely manner subsequent to shipment of the instrument. We also enter into various service contracts that cover installed instruments. These contracts cover specific time
periodperiods and net sales associated with these contracts are deferred and
recognized ratably
recognized over the service period.
Net sales recognition for our Molecular Clinical Reference Laboratory is on an individual test basis and takes place when the test report is completed, reviewed and sent to the client less the reserve for insurance, Medicare and Medicaid expected reimbursement. Adjustments to the allowances, based on actual receipts from the third party payers, are recorded upon settlement.
In our Pharmacogenomics research group we perform services on a project by project basis. When we get payment in advance we recognize revenue when we deliver the service. These projects typically do not extend beyond one year.
Taxes collected from customers and remitted to government agencies for specific net sales producing transactions are recorded net with no effect on the income statement.
Recently IssuedResearch and Development. Research and development and various collaboration costs are charged to expense when incurred.
Translation of Foreign Currency. Our foreign subsidiary uses the local currency of the country in which it is located as its functional currency. Its assets and liabilities are translated into U.S. dollars at the exchange rates in effect at the balance sheet date. Revenues and expenses are translated at the average rates during the period.
Comprehensive Income. Accumulated other comprehensive income at December 31, 2011, 2010 and 2009 consisted of foreign currency translation adjustments, net of applicable tax of zero. We deem our foreign investments to be permanent in nature and do not provide for taxes on currency translation adjustments arising from converting investments in a foreign currency to U.S. dollars. During 2011, we reclassified $1.3 million from accumulated other comprehensive income (loss) to accumulated deficit with no effect on total stockholders' equity or net loss.
Earnings Per Share. Basic earnings per share is calculated based on the weighted-average number of common shares outstanding during each period. Diluted earnings per share include shares issuable upon exercise of outstanding stock options, warrants or conversion rights that have exercise or conversion prices below the market value of our common stock.
Recent Accounting Pronouncements
Recently adopted accounting pronouncements.
In October 2009, the Financial Accounting Standards Board ("FASB") issued ASU No. 2009-13, Revenue Recognition (ASC 605): Multiple-Deliverable Revenue Arrangements (a consensus of the FASB Emerging Issues Task Force); effective for years beginning after June 15, 2010. Vendors often provide multiple products and/or services to their customers as part of a single arrangement. These deliverables may be provided at different points in time or over different time periods. The existing guidance regarding how and whether to separate these deliverables and how to allocate the overall arrangement consideration to each was originally captured in EITF Issue No. 00-21, Revenue Arrangements with Multiple Deliverables, which is now codified at ASC 605-25, Revenue Recognition – Multiple-Element Arrangements. The issuance of ASU 2009-13 amends ASC 605-25 and represents a significant shift from the existing guidance that was considered abuse-preventative and heavily geared toward ensuring that revenue recognition was not accelerated. The application of this new guidance is expected to result in accounting for multiple-deliverable revenue arrangements that better reflects their economics as more arrangements will be separated into individual units of accounting. Our adoption of ASU No. 2009-13 did not have a material impact on our consolidated financial statements.
In October 2009, the FASB issued FASB ASC 105, Generally Accepted Accounting Principles, which establishesASU No. 2009-14, Software (ASC 985): Certain Revenue Arrangements That Include Software Elements (a consensus of the FASB Accounting Standards Codification asEmerging Issues Task Force); effective for years beginning after June 15, 2010. ASU 2009-14 modifies the sole source of authoritativegenerally accepted accounting principles. Pursuantexisting scope guidance in ASC 985-605,
Software Revenue Recognition, for revenue arrangements with tangible products that include software elements. This modification was made primarily due to the provisionschanges in ASC 605-25 noted previously, which further differentiated the separation and allocation guidance applicable to non-software arrangements as compared to software arrangements. Prior to the modification of FASB ASC 105,605-25, the Company has updated referencesseparation and allocation guidance for software and non-software arrangements was more similar. Under ASC 985-605, which was originally issued as AICPA Statement of position 97-2, Software Revenue Recognition, an arrangement to GAAPsell a tangible product along with software was considered to be in its financial statements issued forscope if the period ended September 30, 2009. Thesoftware was more than incidental to the product as a whole. Our adoption of FASB ASC 105ASU No. 2009-14 did not impact the Company’s financial position or results of operations.ASC 820, “Fair Value Measurement and Disclosures” defines fair value, establisheshave a framework for measuring fair value and expands disclosures about fair value measurements. We have adopted ASC 820 with nomaterial impact on our consolidated financial statements.
ASC 350, “Intangibles – Goodwill
In January 2010, the FASB issued guidance to amend the disclosure requirements related to fair value measurements, effective for years beginning after December 15, 2010. The guidance requires the disclosure of roll forward activities on purchases, sales, issuance, and Other” requires companies estimatingsettlements of the useful lifeassets and liabilities measured using significant unobservable inputs (Level Three fair value measurements). We adopted the new disclosure provisions with the filing of our Form 10-Q for the three months ended March 31, 2011.
In December 2010, the FASB issued an Accounting Standards Update (“ASU”) to address diversity in practice in interpreting the pro forma revenue and earnings disclosure requirements for business combinations. The ASU specifies that if a
recognized intangible asset to consider their historical experience in renewing or extending similar arrangements or, inpublic entity presents comparative financial statements, the
absenceentity should disclose revenue and earnings of
historical experience, to consider assumptions that market participants would use about renewal or extension. ASC 350 wasthe combined entity as though the current year business combination(s) had occurred as of the beginning of the comparable prior annual reporting period. We prospectively adopted
onthis ASU effective January 1,
2009 and had2011, with no
material impact on our
consolidated financial statements.
ASC 815-40, “Derivatives
Recently issued accounting pronouncements not yet adopted.
In June 2011, the FASB issued guidance on the presentation of comprehensive income. The new guidance eliminates the current option to report other comprehensive income and
Hedging” addresses freestanding contracts that are indexedits components in the statement of changes in equity. Instead, an entity will be required to
present either a continuous statement of net income and
potentially settledother comprehensive income or in
an entity’s own stock. We adopted ASC 815-40 on January 1, 2009. We have assessed our warrants and determined the fair value is $0 so there is no impact to our financialtwo separate but consecutive statements.
Accounting Standards Update No. 2009-13 addresses the accounting for multiple deliverable arrangements to enable vendors to account for products or services (deliverables) separately rather than as a combined unit. This update The new guidance is effective for fiscal years and interim periods within those fiscal years beginning after December 15, 2011 and will have presentation changes only.
In July 2011, the FASB issued guidance on orthe presentation of net patient service revenue. The new guidance requires a change in presentation of the statement of operations by reclassifying the provision for bad debts associated with patient service
revenue from an operating expense to a deduction from patient service revenue (net of contractual allowances and discounts). Additionally, enhanced disclosure about policies for recognizing revenue and assessing bad debts are required. Disclosures of patient service revenue (net of contractual allowances and discounts) as well as qualitative and quantitative information about changes in the allowance for doubtful accounts will be required. The new guidance is effective for fiscal years and interim periods within those fiscal years beginning after JuneDecember 15, 2010.2011. We are currently assessingin the impactfinal stages of analyzing this presentation of net patient service revenue.
In September 2011, the FASB issued guidance on intangibles including goodwill and other intangibles. The new guidance will allow an entity to
our financial statements.Accounting Standards Update No. 2009-05 provides amendmentsfirst assess qualitative factors to ASC Topic 820, “Fair Value Measurements and Disclosure” fordetermine whether it is necessary to perform the fair value measurement of liabilities. We have implemented ASU 2009-05 with no impact on our financial statements.
Accounting Standards Update No. 2009-14 addresses the accounting for revenue arrangements that contain tangible products and software. This updatetwo-step quantitative goodwill impairment test. The new guidance is effective for fiscal years beginning after December 15, 2011 and is expected to have no material impact on or after June 15, 2010. We are currently assessing the impact to our consolidated financial statements.
Use of Estimates
The preparation of consolidated financial statements requires management to make estimates and assumptions that affect the reported amounts of assets and liabilities and disclosure of contingent assets and liabilities at the date of the financial statements and the reported amounts of net sales and expenses during the reported period. In addition, estimates and assumptions associated with the determination of the fair value of certain assets and related impairments require considerable judgment by management. Actual results could differ from the estimates and assumptions used in preparing these financial statements.
This report, including Management’s Discussion & Analysis, contains forward-looking statements. These statements are based on management’s current views, assumptions or beliefs of future events and financial performance and are subject to uncertainty and changes in circumstances. Readers of this report should understand that these statements are not guarantees of performance or results. Many factors could affect our actual financial results and cause them to vary materially from the expectations contained in the forward-looking statements. These factors include, among other
things: our expected revenue, income(loss), receivables, operating expenses, supplier pricing, availability and prices of raw materials, Medicare/Medicaid/Insurance reimbursements, product pricing, foreign currency exchange rates, sources of funding operations and acquisitions, our ability to raise funds, sufficiency of available liquidity, future interest costs, future economic circumstances, industry conditions, our ability to execute our operating plans, the success of our cost savings initiatives, competitive environment and related market conditions, actions of governments and regulatory factors affecting our business and other risks as described in our reports filed with the Securities and Exchange Commission. In some cases these statements are identifiable through the use of words such as “anticipate”, believe”, “estimate”, “expect”, “intend”, “plan”, “project”, “target”, “can”, “could”, “may”, “should”, “will”, “would” and similar expressions.
You are cautioned not to place undue reliance on these forward-looking statements. The forward-looking statements we make are not guarantees of future performance and are subject to various assumptions, risks and other factors that could cause actual results to differ materially from those suggested by these forward-looking statements. Actual results may differ materially from those suggested by the forward-looking statements that we make for a number of reasons including those described in Part I, Item 1A, “Risk Factors”, of this report.
We expressly disclaim any obligation to update or revise any forward-looking statements, whether as a result of new information, future events or otherwise, except as required by law.
We do not believe that
price inflation
or deflationhas had a material
adverse effect on our
current business, financial condition or results of
operations duringoperations. If our costs were to become subject to significant inflationary pressures, for example, if the
periods presented.cost of our materials or the cost of shipping our products to customers were to incur substantial increases as a result of the rapid rise in the cost of oil, we may not be able to fully offset such higher costs through price increases. Our inability or failure to do so could harm our business, financial condition and results of operations.
|
| |
| Item 7A. | Quantitative and Qualitative Disclosure about Market Risk. |
Foreign Currency Translation Risk.During the last two fiscal years, our international sales have represented more than 60% of our net sales. These sales Sales of products in foreign countries are mainly completed in either British Pounds Sterling or the Euro. Additionally, the British Pound Sterling is the functional currency of our wholly owned subsidiary, Transgenomic Limited. Results of operationoperations and the Balance Sheet are translated from the functional currency of the subsidiary Great British Pounds, to our reporting currency of the US Dollar. Results of operations for the Company’s foreign subsidiaries are translated using the average exchange rate during the period. Assets and liabilities are translated at the exchange rate in effect at the balance sheet date. In addition, we have revaluation risk which occurs when the transaction is doneconsummated in a currency other than the British Pound.Pound Sterling. This transaction must be revalued within the Transgenomic Limited ledger, whose functional currency is the British Pound Sterling. The majority of the transactions on this ledger are in Euro. As a result we are subject to exchange rate risk. The foreign exchange rates have had large variances recently. At January 1, 2008 the Euro to Great British Pound exchange rate was .73650 as compared to December 31, 2009 rate of .9000. The Great British Pound to US Dollar exchange rate was 1.9970 at January 1, 2008 compared to 1.59280 at December 31, 2009. Such large changesrisk and we do not currently engage in foreign exchange rates may negatively impact our business in 2010.currency hedging activities.
REPORT OF INDEPENDENT REGISTERED PUBLIC ACCOUNTING FIRM
Report of Independent Registered Public Accounting Firm
To the Board of Directors and Stockholders
We have audited the accompanying consolidated balance sheets of Transgenomic, Inc. and
subsidiarySubsidiary (the Company) as of December 31,
20092011 and
2008,2010, and the related consolidated statements of operations,
stockholders’stockholders' equity, and cash flows for
each of the three years
then ended. Thesein the period ended December 31, 2011. We also have audited the Company's internal control over financial reporting as of December 31, 2011, based on criteria established in Internal Control - Integrated Framework issued by the Committee of Sponsoring Organizations of the Treadway Commission. The Company's management is responsible for these financial statements,
are the responsibilityfor maintaining effective internal control over financial reporting, and for its assessment of the
Company’s management.effectiveness of internal control over financial reporting included in the accompanying Management's Report on Internal Control Over Financial Reporting. Our responsibility is to express an opinion on these financial statements
and an opinion on the Company's internal control over financial reporting based on our audits.
We conducted our audits in accordance with the standards of the Public Company Accounting Oversight Board (United States). Those standards require that we plan and perform the
auditaudits to obtain reasonable assurance about whether the financial statements are free of material
misstatement. An audit includesmisstatement and whether effective internal control over financial reporting was maintained in all material respects. Our audits of the financial statements included examining, on a test basis, evidence supporting the amounts and disclosures in the financial
statements. An audit also includesstatements, assessing the accounting principles used and significant estimates made by management,
as well asand evaluating the overall financial statement presentation.
Our audit of internal control over financial reporting included obtaining an understanding of internal control over financial reporting, assessing the risk that a material weakness exists, and testing and evaluating the design and operating effectiveness of internal control based on the assessed risk. Our audits also included performing such other procedures as we considered necessary in the circumstances. We believe that our audits provide a reasonable basis for our
opinion.opinions.
A company's internal control over financial reporting is a process designed to provide reasonable assurance regarding the reliability of financial reporting and the preparation of financial statements for external purposes in accordance with generally accepted accounting principles. A company's internal control over financial reporting includes those policies and procedures that (a) pertain to the maintenance of records that, in reasonable detail, accurately and fairly reflect the transactions and dispositions of the assets of the company; (b) provide reasonable assurance that transactions are recorded as necessary to permit preparation of financial statements in accordance with generally accepted accounting principles, and that receipts and expenditures of the company are being made only in accordance with authorizations of management and directors of the company; and (c) provide reasonable assurance regarding prevention or timely detection of unauthorized acquisition, use, or disposition of the company's assets that could have a material effect on the financial statements.
Because of its inherent limitations, internal control over financial reporting may not prevent or detect misstatements. Also, projections of any evaluation of effectiveness to future periods are subject to the risk that controls may become inadequate because of changes in conditions, or that the degree of compliance with the policies or procedures may deteriorate.
In our opinion, the consolidated financial statements referred to above present fairly, in all material respects, the financial position of Transgenomic, Inc. and
subsidiarySubsidiary as of December 31,
20092011 and
2008,2010, and the results of
its their operations and their cash flows for
each of the years
thenin the three year period ended
December 31, 2011, in conformity with
U.S.accounting principles generally accepted
accounting principles.We were not engaged to examine management’s assessmentin the United States of the effectiveness ofAmerica. Also in our opinion, Transgenomic, Inc.’s and Subsidiary maintained, in all material respects, effective internal control over financial reporting as of December 31, 2009, included2011, based on criteria established in the accompanying Management’s Report on Internal Control Over Financial Reporting and, accordingly, we do not express an opinion thereon.
|
/s/ McGladrey & Pullen, LLP |
|
Omaha, Nebraska |
February 24, 2010 |
- Integrated Framework issued by the Committee of Sponsoring Organizations of the Treadway Commission.
/s/ McGladrey & Pullen, LLP
Omaha, Nebraska
March 14, 2012
TRANSGENOMIC, INC. AND
SUBSIDIARIESSUBSIDIARY
CONSOLIDATED BALANCE SHEETS
As of
December 31,
20092011 and
20082010
(Dollars in thousands except per share data)
| | | | | | | | |
| | | 2009 | | | 2008 | |
ASSETS | | | | | | | | |
CURRENT ASSETS: | | | | | | | | |
Cash and cash equivalents | | $ | 5,642 | | | $ | 4,771 | |
Accounts receivable (net of allowances for bad debts of $310 and $388, respectively) | | | 4,522 | | | | 5,385 | |
Inventories (net of allowances for obsolescence of $507 and $108, respectively) | | | 3,552 | | | | 4,775 | |
Prepaid expenses and other current assets | | | 738 | | | | 654 | |
| | | | | | | | |
Total current assets | | | 14,454 | | | | 15,585 | |
PROPERTY AND EQUIPMENT: | | | | | | | | |
Equipment | | | 9,972 | | | | 10,059 | |
Furniture, fixtures and leasehold improvements | | | 3,834 | | | | 3,920 | |
| | | | | | | | |
| | | 13,806 | | | | 13,979 | |
Less: accumulated depreciation | | | (12,839 | ) | | | (12,781 | ) |
| | | | | | | | |
| | | 967 | | | | 1,198 | |
OTHER ASSETS: | | | | | | | | |
Other assets (net of accumulated amortization of $525 and $425, respectively) | | | 583 | | | | 773 | |
| | | | | | | | |
| | $ | 16,004 | | | $ | 17,556 | |
| | | | | | | | |
LIABILITIES AND STOCKHOLDERS’ EQUITY | | | | | | | | |
CURRENT LIABILITIES: | | | | | | | | |
Accounts payable | | $ | 1,013 | | | $ | 905 | |
Other accrued expenses | | | 2,517 | | | | 2,810 | |
Accrued compensation | | | 573 | | | | 520 | |
| | | | | | | | |
Total current liabilities | | | 4,103 | | | | 4,235 | |
Other long term liabilities | | | 239 | | | | 116 | |
| | | | | | | | |
Total liabilities | | | 4,342 | | | | 4,351 | |
STOCKHOLDERS’ EQUITY: | | | | | | | | |
Preferred stock, $.01 par value, 15,000,000 shares authorized, none outstanding | | | — | | | | — | |
Common stock, $.01 par value, 100,000,000 shares authorized, 49,189,672 shares outstanding | | | 497 | | | | 497 | |
Additional paid-in capital | | | 139,703 | | | | 139,501 | |
Accumulated other comprehensive income | | | 1,645 | | | | 1,470 | |
Accumulated deficit | | | (130,183 | ) | | | (128,263 | ) |
| | | | | | | | |
Total stockholders’ equity | | | 11,662 | | | | 13,205 | |
| | | | | | | | |
| | $ | 16,004 | | | $ | 17,556 | |
| | | | | | | | |
|
| | | | | | | |
| | | | |
| | 2011 | | 2010 |
| ASSETS | | | |
| CURRENT ASSETS: | | | |
| Cash and cash equivalents | $ | 4,946 |
| | $ | 3,454 |
|
| Accounts receivable (net of allowances for bad debts of $1,088 and $334, respectively) | 7,573 |
| | 7,601 |
|
| Inventories (net of allowances for obsolescence of $511 and $518, respectively) | 3,859 |
| | 3,344 |
|
| Other current assets | 820 |
| | 635 |
|
| Total current assets | 17,198 |
| | 15,034 |
|
| PROPERTY AND EQUIPMENT: | | | |
| Equipment | 10,143 |
| | 9,820 |
|
| Furniture, fixtures & leasehold improvements | 3,682 |
| | 3,479 |
|
| | 13,825 |
| | 13,299 |
|
| Less: accumulated depreciation | (11,969 | ) | | (11,697 | ) |
| | 1,856 |
| | 1,602 |
|
| OTHER ASSETS: | | | |
| Goodwill | 6,440 |
| | 6,275 |
|
| Intangibles (net of accumulated amortization of $1,437 and $519, respectively) | 7,966 |
| | 8,962 |
|
| Other assets | 102 |
| | 154 |
|
| | $ | 33,562 |
| | $ | 32,027 |
|
| LIABILITIES AND STOCKHOLDERS’ EQUITY (DEFICIT) | | | |
| CURRENT LIABILITIES: | | | |
| Accounts payable | $ | 2,609 |
| | $ | 1,360 |
|
| Accrued compensation | 1,133 |
| | 875 |
|
| Short term debt | 3,082 |
| | 989 |
|
| Current maturities of long term debt | 3,703 |
| | — |
|
| Accrued expenses | 3,839 |
| | 3,231 |
|
| Other Liabilities | 1,042 |
| | 1,628 |
|
| Current portion of lease obligations | 320 |
| | 170 |
|
| Accrued preferred stock dividend | 600 |
| | — |
|
| Total current liabilities | 16,328 |
| | 8,253 |
|
| LONG TERM LIABILITIES: | | | |
| Long term debt less current maturities | 4,937 |
| | 8,640 |
|
| Preferred stock conversion feature | — |
| | 1,983 |
|
| Preferred stock warrant liability | — |
| | 2,351 |
|
| Other long-term liabilities | 1,249 |
| | 843 |
|
| Total liabilities | 22,514 |
| | 22,070 |
|
| Redeemable Series A convertible preferred stock, $.01 par value, 3,879,307 shares authorized, 0 and 2,586,205 shares issued and outstanding, respectively | — |
| | 1,457 |
|
| STOCKHOLDERS’ EQUITY: | | | |
| Series A preferred stock, $.01 par value, 15,000,000 shares authorized, 2,586,205 and 0 shares issued and outstanding, respectively | 26 |
| | — |
|
| Common stock, $.01 par value, 100,000,000 shares authorized, 49,625,725 and 49,289,672 shares issued and outstanding, respectively | 501 |
| | 498 |
|
| Additional paid-in capital | 152,987 |
| | 139,730 |
|
| Accumulated other comprehensive income | 336 |
| | 1,589 |
|
| Accumulated deficit | (142,802 | ) | | (133,317 | ) |
| Total stockholders’ equity | 11,048 |
| | 8,500 |
|
| | $ | 33,562 |
| | $ | 32,027 |
|
TRANSGENOMIC, INC. AND
SUBSIDIARIESSUBSIDIARY
CONSOLIDATED STATEMENTS OF OPERATIONS
Years Ended December 31, 20092011, 2010 and 20082009
(Dollars in thousands except per share data)
| | | | | | | | |
| | | 2009 | | | 2008 | |
NET SALES | | $ | 22,023 | | | $ | 23,993 | |
COST OF GOODS SOLD | | | 10,418 | | | | 10,345 | |
| | | | | | | | |
Gross profit | | | 11,605 | | | | 13,648 | |
OPERATING EXPENSES: | | | | | | | | |
Selling, general and administrative | | | 10,319 | | | | 10,795 | |
Research and development | | | 3,182 | | | | 2,465 | |
Restructuring charges | | | — | | | | 118 | |
Goodwill Impairment | | | — | | | | 638 | |
| | | | | | | | |
| | | 13,501 | | | | 14,016 | |
| | | | | | | | |
LOSS FROM OPERATIONS | | | (1,896 | ) | | | (368 | ) |
OTHER INCOME: | | | | | | | | |
Interest income | | | 15 | | | | 74 | |
Other, net | | | 3 | | | | 12 | |
| | | | | | | | |
| | | 18 | | | | 86 | |
| | | | | | | | |
LOSS BEFORE INCOME TAXES | | | (1,878 | ) | | | (282 | ) |
INCOME TAX EXPENSE | | | 42 | | | | 213 | |
| | | | | | | | |
NET LOSS | | $ | (1,920 | ) | | $ | (495 | ) |
| | | | | | | | |
| | |
BASIC AND DILUTED LOSS PER SHARE | | $ | (0.04 | ) | | $ | (0.01 | ) |
| | | | | | | | |
| | |
BASIC AND DILUTED WEIGHTED AVERAGE SHARES OUTSTANDING | | | 49,189,672 | | | | 49,189,672 | |
|
| | | | | | | | | | | |
| | | | | | |
| | | | | | |
| | 2011 | | 2010 | | 2009 |
| NET SALES | $ | 31,971 |
| | $ | 20,048 |
| | $ | 22,023 |
|
| COST OF GOODS SOLD | 13,534 |
| | 10,284 |
| | 10,418 |
|
| Gross profit | 18,437 |
| | 9,764 |
| | 11,605 |
|
| OPERATING EXPENSES: | | | | | |
| Selling, general and administrative | 19,150 |
| | 10,933 |
| | 10,319 |
|
| Research and development | 2,218 |
| | 2,305 |
| | 3,182 |
|
| Restructuring charges | 41 |
| | 138 |
| | — |
|
| | 21,409 |
| | 13,376 |
| | 13,501 |
|
| LOSS FROM OPERATIONS | (2,972 | ) | | (3,612 | ) | | (1,896 | ) |
| OTHER INCOME (EXPENSE): | | | | | |
| Interest income (expense), net | (958 | ) | | (4 | ) | | 15 |
|
| Expense on preferred stock | (6,066 | ) | | — |
| | — |
|
| Other, net | 259 |
| | 632 |
| | 3 |
|
| | (6,765 | ) | | 628 |
| | 18 |
|
| LOSS BEFORE INCOME TAXES | (9,737 | ) | | (2,984 | ) | | (1,878 | ) |
| INCOME TAX EXPENSE | 45 |
| | 150 |
| | 42 |
|
| NET LOSS | $ | (9,782 | ) | | $ | (3,134 | ) | | $ | (1,920 | ) |
| PREFERRED STOCK DIVIDENDS AND ACCRETION | (1,010 | ) | | — |
| | — |
|
| NET LOSS AVAILABLE TO COMMON STOCKHOLDERS | $ | (10,792 | ) | | $ | (3,134 | ) | | $ | (1,920 | ) |
| BASIC AND DILUTED LOSS PER COMMON SHARE | $ | (0.22 | ) | | $ | (0.06 | ) | | $ | (0.04 | ) |
| BASIC AND DILUTED WEIGHTED AVERAGE SHARES OF COMMON STOCK OUTSTANDING | 49,361,632 |
| | 49,243,839 |
| | 49,189,672 |
|
See notes to consolidated financial statements.
TRANSGENOMIC, INC. AND
SUBSIDIARIESSUBSIDIARY
CONSOLIDATED STATEMENTS OF STOCKHOLDERS’ EQUITY
Years Ended December 31, 20092011, 2010 and 20082009
(Dollars in thousands except share data)
| | | | | | | | | | | | | | | | | | | | |
| | | Common Stock | | Additional
Paid in
Capital | | Accumulated
Deficit | | | Accumulated
Other
Comprehensive
Income (Loss) | | | Total | |
| | | Outstanding
Shares | | Par
Value | | | | |
Balance, January 1, 2008 | | 49,189,672 | | $ | 497 | | $ | 139,099 | | $ | (127,768 | ) | | $ | 2,274 | | | $ | 14,102 | |
Other comprehensive income (loss): | | | | | | | | | | | | | | | | | | | | |
Net loss | | — | | | — | | | — | | | (495 | ) | | | (495 | ) | | | (495 | ) |
Foreign currency translation adjustment | | — | | | — | | | — | | | — | | | | (804 | ) | | | (804 | ) |
| | | | | | | | | | | | | | | | | | | | |
Comprehensive loss | | | | | | | | | | | | | | | (1,299 | ) | | | | |
| | | | | | | | | | | | | | | | | | | | |
Non-cash stock based compensation | | — | | | — | | | 402 | | | — | | | | — | | | | 402 | |
| | | | | | | | | | | | | | | | | | | | |
Balance, December 31, 2008 | | 49,189,672 | | $ | 497 | | $ | 139,501 | | $ | (128,263 | ) | | $ | 1,470 | | | $ | 13,205 | |
Other comprehensive income (loss): | | | | | | | | | | | | | | | | | | | | |
Net loss | | — | | | — | | | — | | | (1,920 | ) | | | (1,920 | ) | | | (1,920 | ) |
Foreign currency translation adjustment | | — | | | — | | | — | | | — | | | | 175 | | | | 175 | |
| | | | | | | | | | | | | | | | | | | | |
Comprehensive loss | | | | | | | | | | | | | | | (1,745 | ) | | | | |
| | | | | | | | | | | | | | | | | | | | |
Non-cash stock based compensation | | — | | | — | | | 202 | | | — | | | | — | | | | 202 | |
| | | | | | | | | | | | | | | | | | | | |
Balance, December 31, 2009 | | 49,189,672 | | $ | 497 | | $ | 139,703 | | $ | (130,183 | ) | | $ | 1,645 | | | $ | 11,662 | |
| | | | | | | | | | | | | | | | | | | | |
|
| | | | | | | | | | | | | | | | | | | | | | | | | | | | | |
| | Preferred Stock | | Common Stock | | | | | | | | |
| | Outstanding Shares | | Par Value | | Outstanding Shares | | Par Value | | Additional Paid-in Capital | | Accumulated Deficit | | Accumulated Other Comprehensive Income (Loss) | | Total |
| Balance, January 1, 2009 | — |
| | — |
| | 49,189,672 |
| | $ | 497 |
| | $ | 139,501 |
| | $ | (128,263 | ) | | $ | 1,470 |
| | $ | 13,205 |
|
| Net loss | — |
| | — |
| | — |
| | — |
| | — |
| | (1,920 | ) | | (1,920 | ) | | (1,920 | ) |
| Other comprehensive income (loss): | | | | | | | | | | | | | | | |
| Foreign currency translation adjustment, net of tax | — |
| | — |
| | — |
| | — |
| | — |
| | — |
| | 175 |
| | 175 |
|
| Comprehensive loss | | | | | | | | | | | | | $ | (1,745 | ) | | |
| Non-cash stock-based compensation | — |
| | — |
| | — |
| | — |
| | 202 |
| | — |
| | — |
| | 202 |
|
| Balance, December 31, 2009 | — |
| | — |
| | 49,189,672 |
| | $ | 497 |
| | $ | 139,703 |
| | $ | (130,183 | ) | | $ | 1,645 |
| | $ | 11,662 |
|
| Net loss | — |
| | — |
| | — |
| | $ | — |
| | $ | — |
| | $ | (3,134 | ) | | $ | (3,134 | ) | | $ | (3,134 | ) |
| Other comprehensive income (loss): | | | | | | | | | | | | |
|
| | |
| Foreign currency translation adjustment, net of tax | — |
| | — |
| | — |
| | — |
| | — |
| | — |
| | (56 | ) | | (56 | ) |
| Comprehensive loss | | | | | | | | | | | | | $ | (3,190 | ) | | |
| Non-cash stock-based compensation | — |
| | — |
| | — |
| | — |
| | (14 | ) | | — |
| | — |
| | (14 | ) |
| Issuance of shares of stock | — |
| | — |
| | 100,000 |
| | 1 |
| | 41 |
| | — |
| | — |
| | 42 |
|
| Balance, December 31, 2010 | — |
| | — |
| | 49,289,672 |
| | $ | 498 |
| | $ | 139,730 |
| | $ | (133,317 | ) | | $ | 1,589 |
| | $ | 8,500 |
|
| Net loss | — |
| | — |
| | — |
| | — |
| | — |
| | (9,782 | ) | | (9,782 | ) | | (9,782 | ) |
| Other comprehensive income (loss): | | | | | | | | | | | | | | | |
| Foreign currency translation adjustment, net of tax | — |
| | — |
| | — |
| | — |
| | — |
| | — |
| | 54 |
| | 54 |
|
| Comprehensive loss | | | | | | | | | | | | | $ | (9,728 | ) | | |
| Non-cash stock-based compensation | — |
| | — |
| | — |
| | — |
| | 1,010 |
| | — |
| | — |
| | 1,010 |
|
| Issuance of shares of common stock | — |
| | — |
| | 90,150 |
| | 1 |
| | 23 |
| | — |
| | — |
| | 24 |
|
| Preferred stock accretion | — |
| | — |
| | — |
| | — |
| | — |
| | (410 | ) | | — |
| | (410 | ) |
| Amendment of preferred stock agreement | 2,586,205 |
| | 26 |
| | 245,903 |
| | 2 |
| | 12,224 |
| | — |
| | — |
| | 12,252 |
|
| Reclassification of other comprehensive income (loss) | — |
| | — |
| | — |
| | — |
| | — |
| | 1,307 |
| | (1,307 | ) | | — |
|
| Dividends on preferred stock | — |
| | — |
| | — |
| | — |
| | — |
| | (600 | ) | | — |
| | (600 | ) |
| Balance, December 31, 2011 | 2,586,205 |
| | $ | 26 |
| | 49,625,725 |
| | $ | 501 |
| | $ | 152,987 |
| | $ | (142,802 | ) | | $ | 336 |
| | $ | 11,048 |
|
See notes to consolidated financial statements.
TRANSGENOMIC, INC. AND
SUBSIDIARIESSUBSIDIARY
CONSOLIDATED STATEMENTS OF CASH FLOWS
Years Ended December 31, 20092011, 2010 and 20082009
(Dollars in thousands)
| | | | | | | | |
| | | 2009 | | | 2008 | |
CASH FLOWS PROVIDED BY (USED IN) OPERATING ACTIVITIES: | | | | | | | | |
Net loss | | $ | (1,920 | ) | | $ | (495 | ) |
Adjustments to reconcile net loss to net cash flows provided by (used in) operating activities: | | | | | | | | |
Depreciation and amortization | | | 855 | | | | 882 | |
Non-cash stock based compensation | | | 202 | | | | 402 | |
(Gain)/loss on sale of fixed assets | | | (3 | ) | | | 2 | |
Goodwill Impairment | | | — | | | | 638 | |
Deferred income taxes | | | 22 | | | | (169 | ) |
Changes in operating assets and liabilities: | | | | | | | | |
Accounts receivable | | | 1,113 | | | | (1,114 | ) |
Inventories | | | 1,290 | | | | (665 | ) |
Prepaid expenses and other current assets | | | (60 | ) | | | (1 | ) |
Accounts payable | | | 60 | | | | (212 | ) |
Accrued expenses and accrued compensation | | | (401 | ) | | | 304 | |
Other long term liabilities | | | 109 | | | | 15 | |
| | | | | | | | |
Net cash flows provided by (used) in operating activities | | | 1,267 | | | | (413 | ) |
| | | | | | | | |
CASH FLOWS USED IN INVESTING ACTIVITIES: | | | | | | | | |
Purchase of property and equipment | | | (351 | ) | | | (325 | ) |
Change in other assets | | | (26 | ) | | | (74 | ) |
| | | | | | | | |
Net cash flows used in investing activities | | | (377 | ) | | | (399 | ) |
| | | | | | | | |
EFFECT OF FOREIGN CURRENCY EXCHANGE RATE CHANGES ON CASH | | | (19 | ) | | | (140 | ) |
| | | | | | | | |
NET CHANGE IN CASH AND CASH EQUIVALENTS | | | 871 | | | | (952 | ) |
CASH AND CASH EQUIVALENTS AT BEGINNING OF YEAR | | | 4,771 | | | | 5,723 | |
| | | | | | | | |
CASH AND CASH EQUIVALENTS AT END OF YEAR | | $ | 5,642 | | | $ | 4,771 | |
| | | | | | | | |
SUPPLEMENTAL CASH FLOW INFORMATION | | | | | | | | |
Cash paid during the year for: | | | | | | | | |
Interest | | $ | — | | | $ | — | |
Income taxes | | | 163 | | | | 71 | |
|
| | | | | | | | | | | |
| | 2011 | | 2010 | | 2009 |
| CASH FLOWS PROVIDED BY (USED IN) OPERATING ACTIVITIES: | | | | | |
| Net loss | $ | (9,782 | ) | | $ | (3,134 | ) | | $ | (1,920 | ) |
| Adjustments to reconcile net loss to net cash flows provided by (used in) operating activities: | | | | | |
| Depreciation and amortization | 2,101 |
| | 708 |
| | 852 |
|
| Non-cash, stock based compensation | 1,010 |
| | (14 | ) | | 202 |
|
| Provision for losses on doubtful accounts | 1,738 |
| | 28 |
| | (8 | ) |
| Provision for losses on inventory obsolescence | 48 |
| | 100 |
| | 482 |
|
| Preferred stock revaluation | 6,066 |
| | — |
| | — |
|
| Changes in operating assets and liabilities: | | | | | |
| Accounts receivable | (2,212 | ) | | 44 |
| | 1,121 |
|
| Inventories | (620 | ) | | (3 | ) | | 808 |
|
| Prepaid expenses and other current assets | 243 |
| | 95 |
| | (60 | ) |
| Accounts payable | 1,028 |
| | 364 |
| | 60 |
|
| Accrued liabilities | 332 |
| | 92 |
| | (401 | ) |
| Other long term liabilities | 401 |
| | (24 | ) | | 109 |
|
| Long term deferred income taxes | (133 | ) | | 26 |
| | 22 |
|
| Net cash flows provided by (used in) operating activities | 220 |
| | (1,718 | ) | | 1,267 |
|
| CASH FLOWS USED IN INVESTING ACTIVITIES: | | | | | |
| Acquisitions | — |
| | (6,000 | ) | | — |
|
| Purchase of property and equipment | (231 | ) | | (192 | ) | | (351 | ) |
| Change in other assets | (277 | ) | | (34 | ) | | (26 | ) |
| Net cash flows used in investing activities | (508 | ) | | (6,226 | ) | | (377 | ) |
| CASH FLOWS PROVIDED BY (USED IN) FINANCING ACTIVITIES: | | | | | |
| Issuance of preferred stock and related warrants | — |
| | 6,000 |
| | — |
|
| Stock issuance costs | — |
| | (209 | ) | | — |
|
| Proceeds from note payable | 3,000 |
| | — |
| | — |
|
| Principal payments on capital lease obligations | (391 | ) | | (72 | ) | | — |
|
| Issuance of common stock | 24 |
| | 42 |
| | — |
|
| Principal payment on note payable | (907 | ) | | — |
| | — |
|
| Net cash flows provided by financing activities | 1,726 |
| | 5,761 |
| | — |
|
| EFFECT OF FOREIGN CURRENCY EXCHANGE RATE CHANGES ON CASH | 54 |
| | (5 | ) | | (19 | ) |
| NET CHANGE IN CASH AND CASH EQUIVALENTS | 1,492 |
| | (2,188 | ) | | 871 |
|
| CASH AND CASH EQUIVALENTS AT BEGINNING OF PERIOD | 3,454 |
| | 5,642 |
| | 4,771 |
|
| CASH AND CASH EQUIVALENTS AT END OF PERIOD | $ | 4,946 |
| | $ | 3,454 |
| | $ | 5,642 |
|
| SUPPLEMENTAL CASH FLOW INFORMATION | | | | | |
| Cash paid during the period for: | | | | | |
| Interest | $ | 732 |
| | $ | 7 |
| | $ | — |
|
| Income taxes, net | 108 |
| | 29 |
| | 163 |
|
| SUPPLEMENTAL DISCLOSURE OF NON-CASH INFORMATION | | | | | |
| Acquisition of equipment through capital leases | $ | 756 |
| | $ | 394 |
| | $ | — |
|
| Dividends accrued on preferred stock | 600 |
| | — |
| | — |
|
| Common stock issued for elimination of derivatives on preferred stock | 300 |
| | — |
| | — |
|
| Goodwill purchase price adjustment | 165 |
| | — |
| | — |
|
See notes to consolidated financial statements.
TRANSGENOMIC, INC. AND
SUBSIDIARIESSUBSIDIARY
NOTES TO CONSOLIDATED FINANCIAL STATEMENTS
Years Ended December 31, 20092011, 2010 and 2008A. BUSINESS DESCRIPTION2009
Transgenomic, Inc. provides innovative products for the purification and analysis of nucleic acids usedis a global biotechnology company advancing personalized medicine in the life sciences industry for research focused ondetection and treatment of cancer and inherited diseases through its proprietary molecular geneticstechnologies and diagnostics. We also provide genetic variation analytical services to the medical research,world-class clinical and research services. Our operations are organized and reviewed by management along its product lines and presented in the following three complementary business segments.
Clinical Laboratories. Our clinical laboratories specialize in genetic testing for cardiology, neurology, mitochondrial disorders, and oncology. Located in New Haven, Connecticut and Omaha, Nebraska the molecular clinical reference laboratories are certified under the Clinical Laboratory Improvement Amendment (CLIA) as high complexity labs and our Omaha facility is also accredited by the College of American Pathologists (CAP).
Pharmacogenomics Services. Our Contract Research Organization located in Omaha, Nebraska provides pharmacogenomics research services supporting Phase II and Phase III clinical trials conducted by our pharmaceutical
markets. Net sales are categorized as Instrument Related Businesscustomers. This lab specializes in pharmacogenomic, biomarker and
Laboratory Services.Instrument Related Business:
mutation discovery research serving the pharmaceutical and biomedical industries world-wide for disease research, drug and diagnostic development and clinical trial support. | · |
| • | | Bioinstruments.Diagnostic Tools. Our flagshipproprietary product is the WAVE® System which has broad applicability to genetic variation detection in both molecular genetic research and molecular diagnostics. There is a worldwide installed base of over 1,4751,500 WAVE Systems as of December 31, 2009.2011. We also distribute bioinstruments produced by other manufacturers (“OEM Equipment”) through our sales and distribution network. Service contracts to maintain installed systems are sold and supported by our technical support personnel.
|
| · | | Bioconsumables. The installed WAVE base and some third-party installedOEM Equipment platforms generate a demand for consumables that are required for the continued operation of the bioinstruments. We develop, manufacture and sell these consumable products. In addition, we manufacture and sell consumable products that can be used on multiple, independent platforms. These products include SURVEYOR® Nuclease and a range of HPLC separationchromatography columns.
|
Laboratory Services:
| · |
| B. | | Molecular Clinical Reference Laboratory. The molecular clinical reference laboratory specializes in mitochondrial and molecular diagnostic testing including genetic testing for oncology, hematology and inherited disorders. Located in Omaha, Nebraska the molecular clinical reference laboratory operates in a Good Laboratory Practices compliant environment, is certified under the Clinical Laboratory Improvement Amendment (CLIA) as a high complexity lab and is accredited by CAP (College of American Pathologists).
SUMMARY OF SIGNIFICANT ACCOUNTING POLICIES |
| · | | Pharmacogenomics Research Services. Pharmacogenomics research services are provided by our Contract Research Organization located in Omaha, Nebraska. It specializes in pharmocogenomic, biomarker and mutation discovery research serving the pharmaceutical and biomedical industries world-wide for disease research, drug and diagnostic development and clinical trial support.
|
Although we have experienced declining sales and recurring net losses (resulting in an accumulated deficit of $130.2 million at December 31, 2009), management believes existing sources of liquidity, including cash and cash equivalents of $5.6 million, are sufficient to meet expected cash needs during 2010. Our business consolidation efforts have helped control our operating costs, however we will need to increase net sales in order to meet our liquidity needs on a long-term basis. If
TRANSGENOMIC, INC. AND SUBSIDIARIES
NOTES TO CONSOLIDATED FINANCIAL STATEMENTS - Continued
Years Ended December 31, 2009 and 2008
we cannot increase net sales, further reductions to operating expenses will be needed. In future periods, there is no assurance that we will be able to increase net sales or further reduce expenses and, accordingly, we may not have sufficient sources of liquidity to continue operations indefinitely.
B. SUMMARY OF SIGNIFICANT ACCOUNTING POLICIES
Principles of Consolidation.
The consolidated financial statements include the accounts of Transgenomic, Inc. and its
wholly-ownedwholly owned subsidiary. All
intercompanyinter-company balances and transactions have been eliminated in consolidation.
Certain risks and uncertainties are inherent in our day-to-day operations and to the process of preparing our financial statements. The more significant of those risks are presented below and throughout the notes to the financial statements.
Use of Estimates.
The preparation of consolidated financial statements requires management to make estimates and assumptions that affect the reported amounts of assets and liabilities and disclosure of contingent assets and liabilities at the date of the financial statements and the reported amounts of net sales and expenses during the reporting period. In addition, estimates and assumptions associated with the determination of the fair value of certain assets and related impairments require considerable judgment by management. Actual results could differ from the estimates and assumptions used in preparing these
consolidated financial statements.
2. | Concentration of Revenue Risk.
|
No customer accounted for more than 10% of consolidated net sales during the years ended December 31, 2009 and 2008. For the
Reclassifications.
Certain prior year
ended December 31, 2009 one customer made up more than 20% of the Laboratory Services net sales. For the year ended December 31, 2008 four customers each made up more than 10% of the Laboratory Services net sales and combined they represent 56% of the Laboratory Services net sales. Weamounts have
additional risk duebeen reclassified in order to conform to the
global economic crisis.current year presentation.
Unless otherwise specified, book value approximates fair market value.
The Series A Preferred Stock conversion feature and Series A Warrant liability are recorded at fair value. See Footnote N.
TRANSGENOMIC, INC. AND SUBSIDIARY
NOTES TO CONSOLIDATED FINANCIAL STATEMENTS—(Continued)
Years Ended December 31, 2011, 2010 and 2009
Cash and Cash Equivalents.
Cash and cash equivalents include cash and investments with original maturities at
the date of acquisition of three months or less. Such investments presently
consistingconsist of
only temporary overnight
investments.TRANSGENOMIC, INC. AND SUBSIDIARIES
NOTES TO CONSOLIDATED FINANCIAL STATEMENTS - Continued
Years Ended December 31, 2009 and 2008
investments
From time to time, we may maintain a cash position with financial institutions in amounts that exceed federally insured limits. We have not experienced any losses on such accounts as of December 31, 2009.2011
. The following is a summary of activity for the allowance for doubtful accounts during the yearsyear ended December 31, 200920112010 and 2008: | | | | | | | | | | | | | | |
| | | Dollars in Thousands |
| | | Beginning
Balance | | Provision | | | Write
Offs | | | Ending
Balance |
Year Ended December 31, 2009 | | $ | 388 | | $ | (8 | ) | | $ | (70 | ) | | $ | 310 |
Year Ended December 31, 2008 | | $ | 703 | | $ | 123 | | | $ | (438 | ) | | $ | 388 |
|
| | | | | | | | | | | | | | | |
| | Dollars in Thousands |
| | Beginning Balance | | Provision | | Write Offs | | Ending Balance |
| Year Ended December 31, 2011 | $ | 334 |
| | $ | 1,738 |
| | $ | (984 | ) | | $ | 1,088 |
|
| Year Ended December 31, 2010 | $ | 310 |
| | $ | 28 |
| | $ | (4 | ) | | $ | 334 |
|
| Year Ended December 31, 2009 | $ | 388 |
| | $ | (8 | ) | | $ | (70 | ) | | $ | 310 |
|
While payment terms are generally 30 days, we have also provided extended payment terms of up to 90 days in certain cases. We operate globally and some of the international payment terms may be greater than 90 days. Accounts receivable are carried at original invoice
amount and shown net of allowance for doubtful
accounts.accounts and contractual allowances. The estimate made for doubtful accounts is based on a review of all outstanding amounts on a quarterly basis. We determine the allowance for doubtful accounts
and contractual allowances by regularly evaluating individual customer receivables and considering a customer’s financial condition, credit history and current economic conditions.
Account receivablesAccounts receivable are written off when deemed uncollectible. Recoveries of
account receivablesaccounts receivable previously written off are recorded when received.
Inventories are stated at the lower of cost or market net of allowance for obsolete inventory. Cost is computed using standard costs for finished goods and average or latest actual cost for raw materials and work in process, which approximates the first-in, first-out (FIFO) method.
We write down slow-moving and obsolete inventory by the difference between the value of the inventory and our estimate of the reduced value based on potential future uses, the likelihood that overstocked inventory will be sold and the expected selling prices of the inventory. If our ability to realize value on slow-moving or obsolete inventory is less favorable than assumed, additional write-downs of the inventory may be required.
The following is a summary of activity for the allowance for obsolete inventory during the twelve monthsyear ended December 31, 20092011, 2010 and 2008: | | | | | | | | | | | | | |
| | | Dollars in Thousands |
| | | Beginning
Balance | | Provision | | Write
Offs | | | Ending
Balance |
Year Ended December 31, 2009 | | $ | 108 | | $ | 482 | | $ | (83 | ) | | $ | 507 |
Year Ended December 31, 2008 | | $ | 12 | | $ | 96 | | $ | — | | | $ | 108 |
|
| | | | | | | | | | | | | | | |
| | Dollars in Thousands |
| | Beginning Balance | | Provision | | Write Offs | | Ending Balance |
| Year Ended December 31, 2011 | $ | 518 |
| | $ | 48 |
| | $ | (55 | ) | | $ | 511 |
|
| Year Ended December 31, 2010 | $ | 507 |
| | $ | 100 |
| | $ | (89 | ) | | $ | 518 |
|
| Year Ended December 31, 2009 | $ | 108 |
| | $ | 482 |
| | $ | (83 | ) | | $ | 507 |
|
We determine the allowance for
obsoleteobsolescence by evaluating inventory
by quarterly
evaluating the inventory for items deemed to be slow moving or obsolete.
During the year ended December 31, 2009 we recorded $0.3 million related to control plasmids used for our SURVEYOR kits, $0.1 million related to our older low throughput instruments and $0.1 million related to the transition in our bioconsumables from a steel syringe delivery method to a disposable delivery method.
TRANSGENOMIC, INC. AND
SUBSIDIARIESSUBSIDIARY
NOTES TO CONSOLIDATED FINANCIAL
STATEMENTS - ContinuedSTATEMENTS—(Continued)
Years Ended December 31,
20092011, 2010 and
20082009
Property and equipment are carried at cost. Depreciation is computed by the straight-line method over the estimated useful lives of the related assets as follows:
|
| |
Leasehold improvements | | 1 to 10 years |
Furniture and fixtures | | 3 to 7 years |
Production equipment | | 3 to 7 years |
Computer equipment | | 3 to 7 years |
Research and development equipment | | 2 to 7 years |
Depreciation ofexpense related to property and equipment totaledduring the years ended December 31, 2011, 2010 and 2009 was $0.6 million, $0.4 million and $0.6 million, respectively. Included in bothdepreciation for the years ended December 31, 2011, 2010 and 2009 was $0.2 million, less than $0.1 million and 2008.$0.0 million, respectively, related to equipment acquired under capital leases.
Goodwill.
ASC 820 “Fair Value Measurements
Goodwill is the excess of the purchase price over fair value of assets acquired and
Disclosures” provides that goodwill willis not
be amortized, but will beamortized. Goodwill is tested for impairment annually. We
performedperform this impairment analysis during the fourth quarter of each year or when
a significant event
occurred whichoccurs that may impact
goodwill impairment.goodwill. Impairment occurs when the carrying value is determined to be not recoverable thereby causing the carrying
value of the goodwill to exceed
theits fair value. If impaired, the asset’s carrying value is reduced to its fair value.
Goodwill was impairedNo impairment existed at December 31,
20082011 and
was written off based on our analysis.Net sales in the WAVE related business, for which the goodwill was attached, declined over 15% during the four years ended December 31, 2008. We made no significant investment to expand the offering or upgrade the current WAVE instrument.
Other Assets.
Other assets2010.
Intangibles.
Intangibles include intellectual property, patents and
other long-term assets.acquired products.
1. Intellectual Property. Initial costs paid to license intellectual property from independent third parties are capitalized and amortized using the straight-line method over the license period. Ongoing royalties related to such licenses are expensed as incurred.
2. Patents. We capitalize legal costs, filing fees and other expenses associated with obtaining patents on new discoveries and amortize these costs using the straight-line method over the shorter of the legal life of the patent or its economic life beginning on the date the patent is issued.
Each
3. Acquired Products. As a part of thesethe FAMILION acquisition we acquired technology, in process technology, trademarks/tradenames and third party relationships. These costs will be amortized straight line over their estimated economic life of seven to eight years. See Footnote F.
The Company reviews its amortizable long lived assets annually for impairment or whenever events indicate that the carrying amount of the asset may not be recoverable. An impairment loss would be recorded if the sum of the future undiscounted cash flows is treated as long-lived assets. Long-livedless than the carrying amount of the asset. The amount of the loss would be determined by comparing the fair market values of the asset to the carrying amount of the asset. No loss has been recorded during the years ended December 31, 2011 or 2010. In 2009, we recorded less than $0.1 million related to accelerated amortization on two license agreements that we terminated in the first quarter of 2010.
Indefinite lived assets will be tested for impairment on an annual basis or when a significant event occurs, which may impact impairment. We quarterly review the carrying value of our long-lived assets to assess recoverability and impairment. We recorded no impairmentsimpairment during 2008. In 2009 wethe year ended December 31, 2011, 2010 or 2009.
Preferred Stock. Priorto the 2011 modification, the Series A Preferred Stock met the definition of mandatorily redeemable stock as it was preferred capital stock which was redeemable at the option of the holder and therefore was reported outside of equity. The Series A Preferred Stock was accreted to its redemption value. Prior to the 2011 modification, the Series A Warrants did not qualify to be treated as equity, and accordingly, was recorded less than $0.1 millionas a liability. A preferred stock conversion feature was embedded within the Series A Preferred Stock that met the definition of a derivative. The Series A Preferred Stock, Series A Warrants liability and Series A Preferred Stock conversion feature were all recorded separately and were initially recorded at fair value using the Black Scholes model. We were required to record these instruments at fair value at each reporting date and changes were recorded as an adjustment to earnings. The Series A Warrant liability and Series A Preferred Stock conversion feature were
TRANSGENOMIC, INC. AND
SUBSIDIARIESSUBSIDIARY
NOTES TO CONSOLIDATED FINANCIAL
STATEMENTS - ContinuedSTATEMENTS—(Continued)
Years Ended December 31,
20092011, 2010 and
2008related2009
considered level three financial instruments.
We entered into a transaction with the holders of the Series A Preferred Stock (the "Series A Holders"), pursuant to
accelerated amortization on two license agreements that we planan Agreement Regarding Preferred Stock (the “Amendment Agreement”), in which the Series A Holders agreed to
terminate in(i) waive their rights to enforce the
first quarteranti-dilution and redemption features of
2010.3. Other Long Term Assets. Other long term assets include US security depositsthe Series A Preferred Stock and deferred tax assets.
(ii) at the next annual shareholder meeting, vote to amend the Certificate of Designation for the Series A Preferred Stock to remove the anti-dilution and redemption features of the Series A Preferred Stock. In exchange, the Company issued shares of common stock to the Series A Holders having an aggregate market value of $0.3 million.
As a result of the Amendment Agreement, the value of the Series A Preferred Stock and Series A Warrant, including the Series A Preferred Stock conversion feature and Series A Warrant liability, were reclassified into shareholders equity as of the date of the Amendment Agreement.
Stock Based Compensation.
All stock options awarded to date have exercise prices equal to the market price of our common stock on the date of grant and have ten-year contractual terms. Unvested options as of December 31, 20092011 had vesting periods of one or three years from date of grant. None of the stock options outstanding at December 31, 20092011 are subject to performance or market-based vesting conditions. We measure and recognize compensation expense for all stock-based awards made to employees and directors, including stock options. Compensation expense is based on the calculated fair value of the awards as measured at the grant date and is expensed ratably over the service period of the awards (generally the vesting period).
For the year ended December 31, 2009, we recorded compensation expense of $0.2 million within selling, general and administrative expense as a result of the vesting of options exercisable for the purchase of 1.7 million shares during the year. For the year ended December 31, 2008, we recorded compensation expense of $0.4 million within selling, general and administrative expense as a result of the vesting of options exercisable for the purchase of 1.7 million shares. As of December 31, 2009, there was $0.1 million of unrecognized compensation expense related to unvested stock options, which is expected to be recognized over a weighted average period of nearly three years.
The fair value of the options granted during 2009 was estimated on their respective grant dates using the Black-Scholes option pricing model. The Black-Scholes model was used with the following assumptions: risk-free interest rates of 2.12% to 3.99%, based on the U.S. Treasury yield in effect at the time of grant; dividend yields of zero percent; expected lives of 5 to 10 years, based on historical exercise activity behavior; and volatility of 106.00% to 80.03% for grants made during the year ended December 31, 2009 based on the historical volatility of our stock over a time that is consistent with the expected life of the option. A small group of senior executives hold the majority of the stock options and are expected to hold the options until they are vested therefore no forfeitures have been assumed.
The fair value of the options granted during 2008 was estimated on their respective grant dates using the Black-Scholes option pricing model. The Black-Scholes model was used with the following assumptions: risk-free interest rates of 1.55% to 3.99%, based on the U.S. Treasury yield in effect at the time of grant; dividend yields of zero percent; expected lives of 2 to 10 years, based on historical exercise activity behavior; and volatility of 62.92% to 95.35% for grants made during the year ended December 31, 2008 based on the historical volatility of our stock over a time that is consistent with the expected life of the option. A small group of senior executives hold the majority of the stock options and are expected to hold the options until they are vested therefore no forfeitures have been assumed.
TRANSGENOMIC, INC. AND SUBSIDIARIES
NOTES TO CONSOLIDATED FINANCIAL STATEMENTS - Continued
Years Ended December 31, 2009 and 2008
Deferred tax assets and liabilities are determined based on the differences between the financial reporting and tax basis of assets and liabilities at each balance sheet date using tax rates expected to be in effect in the year the differences are expected to reverse. Deferred tax assets are reduced by a valuation allowance to the extent that it is more likely than not that they will not be realized.
We had no material unrecognized tax benefits, interest, or penalties during fiscal 2011 or fiscal 2010, and we do not anticipate any such items during the next twelve months. Our policy is to record interest and penalties directly related to income taxes as income tax expense in the Consolidated Statements of Operations.
Revenue is realized and earned when all of the following criteria are met:
Persuasive evidence of an arrangement exists
Delivery has occurred or services have been rendered
The seller’s price to the buyer is fixed or determinable, and
Collectability is reasonably assured.
Net sales from our Clinical Laboratories are recognized on an individual test basis and takes place when the test report is completed, reviewed and sent to the client less the reserve for insurance, Medicare and Medicaid contractual adjustments. There are no deferred net sales associated with our Clinical Laboratories. Adjustments to the allowances, based on actual receipts from third party payers, are recorded upon settlement.
In our Pharmacogenomics Services, we perform services on a project by project basis. When we receive payment in advance, we recognize revenue when we deliver the service. These projects typically do not extend beyond one year. At December 31, 2011 and 2010, deferred net sales associated with pharmacogenomics research projects, included in the balance sheet in other accrued expenses, was $0.1 million and less than $0.1 million, respectively.
Net sales of Diagnostic Tools products are recognized in accordance with the terms of the sales arrangement. Such recognition is based on receipt of an unconditional customer order and transfer of title and risk of ownership to the customer, typically upon shipment of the product under a purchase order. Our sales terms do not provide for the right of return unless the product is damaged or defective. Net sales from certain services associated with the analytical instruments, to be performed subsequent to shipment of the products, is deferred and recognized when the services are provided. Such services, mainly limited to installation and training services that are not essential to the functionality of the instruments, typically are performed in a timely manner subsequent to shipment of the instrument. We also enter into various service contracts that cover installed instruments. These contracts cover specific time periods and net sales associated with these contracts are deferred and recognized ratably recognized over the service period. At
TRANSGENOMIC, INC. AND SUBSIDIARY
NOTES TO CONSOLIDATED FINANCIAL STATEMENTS—(Continued)
Years Ended December 31, 20092011, 2010 and 2009
December 31, 2008,2011 and 2010, deferred net sales, mainly associated with our service contracts, included in the balance sheet in other current liabilities, was approximately $1.4 million and $1.5 million, respectively.Net Sales from our Molecular Clinical Reference Laboratory Services are recognized on an individual test basis and takes place when the test report is completed, reviewed and sent to the client less the reserve for insurance, Medicare and Medicaid expected reimbursement. There are no deferred net sales associated with our Molecular Clinical Reference Laboratory. Adjustments to the allowances, based on actual receipts from the third party payers, are recorded upon settlement. In our Pharmacogenomics Research Services Group, we perform services on a project by project basis. When we get payment in advance we recognize revenue when we deliver the service. These projects typically do not extend beyond one year. At December 31, 2009 and 2008, deferred net sales associated with the pharmacogenomics research projects included in the balance sheet in other accrued expenses was less than $0.1approximately $1.3 million for each period.
and $1.4 million, respectively.
Taxes collected from customers and remitted to government agencies for specific net sales producing transactions are recorded net with no effect on the income statement.
Research and Development.
Research and development and various collaboration costs are charged to expense when incurred.
Foreign Currency Transactions.
Financial statements
Preferred Stock.
The Series A Preferred Stock met the definition of mandatorily redeemable stock as it is preferred capital stock which is redeemable at the option of the subsidiaryholder and should be reported outside of equity. The Series A Preferred Stock is accreted to its redemption value. The Series A Warrants do not qualify to be treated as equity, and accordingly, are recorded as a liability. A preferred stock conversion feature is embedded within the U.S.Series A Preferred Stock that meets the definition of a derivative. The Series A Preferred Stock, Series A Warrants liability and Series A Preferred Stock conversion feature are measuredall recorded separately and were initially recorded at fair value using the Black Scholes model. We are required to record these instruments at fair value at each reporting date and changes will be recorded as an adjustment to earnings. The Series A Warrant liability and Series A Preferred Stock conversion feature are considered level three financial instruments.
We entered into a transaction with the holders of the Series A Preferred Stock (the "Series A Holders"), pursuant to an Agreement Regarding Preferred Stock (the “Amendment Agreement”), in which the Series A Holders agreed to (i) waive their rights to enforce the anti-dilution and redemption features of the Series A Preferred Stock and (ii) at the next annual shareholder meeting, vote to amend the Certificate of Designation for the Series A Preferred Stock to remove the anti-dilution and redemption features of the Series A Preferred Stock. In exchange, the Company issued shares of common stock to the Series A Holders having an aggregate market value of $0.3 million.
As a result of the Amendment Agreement, the value of the Series A Preferred Stock and Series A Warrant, including the Series A Preferred Stock conversion feature and Series A Warrant liability, were reclassified into shareholders equity as of the date of the Amendment Agreement.
Translation of Foreign Currency.
Our foreign subsidiary uses the local currenciescurrency of the country in which it is located as theits functional currency. The adjustments to translate those amountsIts assets and liabilities are translated into U.S. dollars areat the exchange rates in effect at the balance sheet date. A translation gain of $
TRANSGENOMIC, INC. AND SUBSIDIARIES0.1 millionNOTES TO CONSOLIDATED FINANCIAL STATEMENTS - Continued is reported in other comprehensive income on the accompanying consolidated balance sheet as of
Years Ended December 31, 2009 and 20082011
accumulated. A translation loss of $0.1 million was reported in a separate account in stockholders’ equity and are included in accumulated other comprehensive income. Foreignincome on the accompanying consolidated balance sheet as of December 31, 2010. Revenues and expenses are translated at the average rates during the period. For transactions that are not denominated in the functional currency, revaluation gains or losses resulting from changes inwe recognized less than $0.1million, $0.3 million and $0.3 million as foreign currency exchange rates are includedtransaction loss in the determination of net income. Foreign currency revaluation adjustments increased both operating expensesloss for the years ending December 31, 2011, 2010 and net loss by2009, respectively.
Expense on Preferred Stock.
For 2011, we recorded expense associated with the Series A Preferred Stock and Series A Warrants of $6.1 million, which is due to the change in fair value of the Series A Preferred Stock conversion feature and Series A Warrants liability of $5.8 million and the issuance of $0.3 million duringin common stock to the yearSeries A Investors. The expense associated with the change in value of the Series A Preferred Stock conversion feature is a non-cash item. There was no expense on preferred stock in 2010 or 2009.
Other Income.
Other income in the years ended December 31, 20092011 and decreased both operating expenses2010 includes an award of a federal grant under the Qualifying Therapeutic Discovery Project related to COLD-PCR, Surveyor Scan kit development for detecting key cancer pathway gene mutations and mtDNA damage assays. Income related to this federal grant net loss by $1.0of consulting fees was $0.2 million during the year ended December 31, 2008.and $0.6 million, respectively.
Accumulated other comprehensive income at December 31, 20092011, 2010 and 20082009 consisted of foreign currency translation
TRANSGENOMIC, INC. AND SUBSIDIARY
NOTES TO CONSOLIDATED FINANCIAL STATEMENTS—(Continued)
Years Ended December 31, 2011, 2010 and 2009
adjustments, net of applicable tax of zero. We deem our foreign investments to be permanent in nature and do not provide for taxes on currency translation adjustments arising from converting investments in a foreign currency to U.S. dollars.
During 2011, we reclassified $1.3 million from accumulated other comprehensive income (loss) to accumulated deficit with no effect on total stockholders' equity or net loss.
Basic earnings per share is calculated based on the weighted averageweighted-average number of common shares outstanding during each period. Diluted earnings per share include shares issuable upon exercise of outstanding stock options, warrants or conversion rights that have exercise or conversion prices below the market value of our common stock. Options, warrants and conversion rights pertaining to 11,309,88717,648,273, 18,607,229 and 11,524,78611,309,887 shares of our common stock have been excluded from the computation of diluted earnings per share at December 31, 20092011, 2010 and 2008,2009, respectively. The options, warrants and conversion rights that were exercisable in 20082011, 2010 and 2009 were not included because the effect would be anti-dilutive due to the net loss. As a result, none of our outstanding options, warrants or conversion rights affect the calculation of diluted earnings per share.
Recently Issued Accounting Pronouncements.
In October 2009, the Financial Accounting Standards Board (the "FASB") issued Accounting Standards Update ("ASU") No. 2009-13, Revenue Recognition (ASC 605): Multiple-Deliverable Revenue Arrangements (a consensus of the FASB Emerging Issues Task Force); effective for years beginning after June 15, 2010. Vendors often provide multiple products and/or services to their customers as part of a single arrangement. These deliverables may be provided at different points in time or over different time periods. The existing guidance regarding how and whether to separate these deliverables and how to allocate the overall arrangement consideration to each was originally captured in EITF Issue No. 00-21, Revenue Arrangements with Multiple Deliverables, which is now codified at ASC 605-25, Revenue Recognition – Multiple-Element Arrangements. The issuance of ASU 2009-13 amends ASC 605-25 and represents a significant shift from the existing guidance that was considered abuse-preventative and heavily geared toward ensuring that revenue recognition was not accelerated. The application of this new guidance is expected to result in accounting for multiple-deliverable revenue arrangements that better reflects their economics as more arrangements will be separated into individual units of accounting. Our adoption of ASU No. 2009-13 did not have a material impact on our consolidated financial statements.
In October 2009, the FASB issued FASB ASC 105, Generally Accepted Accounting Principles, which establishesASU No. 2009-14, Software (ASC 985): Certain Revenue Arrangements That Include Software Elements (a consensus of the FASB Accounting Standards Codification asEmerging Issues Task Force); effective for years beginning after June 15, 2010. ASU 2009-14 modifies the sole source of authoritative generally accepted accounting principles. Pursuantexisting scope guidance in ASC 985-605, Software Revenue Recognition, for revenue arrangements with tangible products that include software elements. This modification was made primarily due to the provisionschanges in ASC 605-25 noted previously, which further differentiated the separation and allocation guidance applicable to non-software arrangements as compared to software arrangements. Prior to the modification of FASB ASC 105,605-25, the Company has updated referencesseparation and allocation guidance for software and non-software arrangements was more similar. Under ASC 985-605, which was originally issued as AICPA Statement of position 97-2, Software Revenue Recognition, an arrangement to GAAPsell a tangible product along with software was considered to be in its financial statements issued forscope if the period ended September 30, 2009. Thesoftware was more than incidental to the product as a whole. Our adoption of FASB ASC 105ASU No. 2009-14 did not impact the Company’s financial position or results of operations.ASC 820, “Fair Value Measurement and Disclosures” defines fair value, establisheshave a framework for measuring fair value and expands disclosures about fair value measurements. We have adopted ASC 820 with nomaterial impact on our consolidated financial statements.
ASC 350, “Intangibles – Goodwill
In January 2010, the FASB issued guidance to amend the disclosure requirements related to fair value measurements, effective for years beginning after December 15, 2010. The guidance requires the disclosure of roll forward activities on purchases, sales, issuance, and Other” requires companies estimatingsettlements of the useful lifeassets and liabilities measured using significant unobservable inputs (Level Three fair value measurements). We adopted the new disclosure provisions with the filing of our Form 10-Q for the three months ended March 31, 2011.
In December 2010, the FASB issued an ASU to address diversity in practice in interpreting the pro-forma revenue and earnings disclosure requirements for business combinations. The ASU specifies that if a
recognized intangible asset to consider their historical experience in renewing or extending similar arrangements or, inpublic entity presents comparative financial statements, the
absenceentity should disclose revenue and earnings of
historical experience, to consider assumptions that market participants would use about renewal or extension. ASC 350 wasthe combined entity as though the current year business combination(s) had occurred as of the beginning of the comparable prior annual reporting period. We prospectively adopted
onthis ASU effective January 1,
2009 and had2011, with no
material impact on our
consolidated financial statements.
TRANSGENOMIC, INC. AND SUBSIDIARIES
NOTES TO CONSOLIDATED FINANCIAL STATEMENTS - Continued
Years Ended December 31, 2009
In June 2011, the FASB issued guidance on the presentation of comprehensive income. The new guidance eliminates the current option to report other comprehensive income and
2008ASC 815-40, “Derivativesits components in the statement of changes in equity. Instead, an entity will be required to present either a continuous statement of net income and Hedging” addresses freestanding contracts that are indexed to, and potentially settledother comprehensive income or in an entity’s own stock. We adopted ASC 815-40 on January 1, 2009. We have assessed our warrants and determined the fair value is $0 so there is no impact to our financialtwo separate but consecutive statements.
Accounting Standards Update No. 2009-13 addresses the accounting for multiple deliverable arrangements to enable vendors to account for products or services (deliverables) separately rather than as a combined unit. This update The new guidance is effective for fiscal years and interim periods within those fiscal years beginning after December 15, 2011 and will have presentation changes only.
TRANSGENOMIC, INC. AND SUBSIDIARY
NOTES TO CONSOLIDATED FINANCIAL STATEMENTS—(Continued)
Years Ended December 31, 2011, 2010 and 2009
In July 2011, the FASB issued guidance on
orthe presentation of net patient service revenue. The new guidance requires a change in presentation of the statement of operations by reclassifying the provision for bad debts associated with patient service revenue from an operating expense to a deduction from patient service revenue (net of contractual allowances and discounts). Additionally, enhanced disclosure about policies for recognizing revenue and assessing bad debts are required. Disclosures of patient service revenue (net of contractual allowances and discounts) as well as qualitative and quantitative information about changes in the allowance for doubtful accounts will be required. The new guidance is effective for fiscal years and interim periods within those fiscal years beginning after
JuneDecember 15,
2010.Accounting Standards Update No. 2009-05 provides amendments2011. We are in the final stages of analyzing this presentation of net patient service revenue.
In September 2011, the FASB issued guidance on intangibles including goodwill and other intangibles. The new guidance will allow an entity to
ASC Topic 820, “Fair Value Measurements and Disclosure” forfirst assess qualitative factors to determine whether it is necessary to perform the
fair value measurement of liabilities. We have implemented ASU 2009-05 with no impact on our financial statements.Accounting Standards Update No. 2009-14 addresses the accounting for revenue arrangements that contain tangible products and software. This updatetwo-step quantitative goodwill impairment test. The new guidance is effective for fiscal years beginning after December 15, 2011 and is expected to have no material impact on or after June 15, 2010.our consolidated financial statements.
C. ACQUISITION
In December 2010, we acquired the FAMILION family of genetic tests from PGxHealth, then a subsidiary of Clinical Data, Inc. with a sales price of $18.8 million. We secured $6.0 million of financing from Third Security Senior Staff 2008 LLC, Third Security Staff 2010 LLC, and Third Security Incentive 2010 LLC (the "Third Security Investors", affiliates of Third Security, LLC, a leading life sciences investment firm, to fund the cash portion of our acquisition. This strategic acquisition provided us with proprietary genetic commercial tests that have an established revenue base, proprietary biomarker assays, an additional CLIA-certified laboratory operation and established test reimbursement and coverage policies that offer access to testing. The acquired assets and liabilities assumed are currently assessingreported as a component of our laboratory services segment.
Under the impactterms of the financing with the Third Security Investors, we issued an aggregate of 2,586,205 shares of the Company’s Series A Preferred Stock to the Third Security Investors. Additionally we issued to the Third Security Investors, Series A Warrants to purchase an aggregate of up to 1,293,102 shares of Series A Preferred Stock at an exercise price of $2.32 per share. The shares of Series A Preferred Stock issuable pursuant to the purchase agreement and upon exercise of the Series A Warrants are convertible into shares of our common stock at a conversion price of $0.58 per share, for an aggregate of 15,517,228 million shares of common stock. Upon full exercise of the Series A Warrants, we will receive approximately $3.0 million. These securities were issued for an aggregate purchase price of $6.0 million.
We entered into two notes payable with PGxHealth as a part of the acquisition. The first note is a three year secured promissory note in the amount of $8.6 million with interest accruing at 10%. The second note is a one year secured promissory note for facility improvements of $1.0 million with interest payable at 6.5%. See further information in Note G to the financial statements. Certain liabilities were assumed and various contingent liabilities recorded. The contingent liabilities include payments owed upon the collection of certain accounts receivable, retention bonuses for certain employees and royalties due to vendors based on milestone considerations.
The following table summarizes the consideration for the acquired assets and liabilities assumed at the acquisition date.
|
| | | |
| | |
| Consideration | Dollars in Thousands |
| Cash | $ | 6,000 |
|
| Notes payable | 9,628 |
|
| Assumed liabilities | 452 |
|
| Contingent liabilities | 2,736 |
|
| | |
| Fair value of consideration transferred | $ | 18,816 |
|
| | |
Acquisition related costs included in selling, general and administrative expenses in our Statement of Operations for the year ended December 31, 2010 were $0.8 million. We incurred $0.2 million in acquisition related costs to issue Series A Preferred Stock which were recorded against the proceeds received upon the issuance of such Series A Preferred Stock.
TRANSGENOMIC, INC. AND SUBSIDIARY
NOTES TO CONSOLIDATED FINANCIAL STATEMENTS—(Continued)
Years Ended December 31, 2011, 2010 and 2009
|
| | | |
| | |
| Recognized Amounts of Identifiable Assets Acquired and Liabilities Assumed | Dollars in Thousands |
| Working capital, net | $ | 3,222 |
|
| Property and Equipment | 639 |
|
| Identifiable intangible assets | 8,680 |
|
| | |
| Total identifiable net assets | 12,541 |
|
| Goodwill | 6,275 |
|
| | |
| Total purchase price | 18,816 |
|
| | |
The fair value of the financial assets acquired includes accounts receivable with a fair value of $3.1 million. The gross amount due is $7.0 million, of which $3.9 million is expected to be uncollectible.
The goodwill arising from the acquisition primarily relates to synergies of the combined companies. The goodwill has been assigned to our
financial statements.C. RESTRUCTURING CHARGES
WeLaboratory Services segment and is expected to be deductible for tax purposes.
The intangible assets were each valued separately using valuation approaches most appropriate for each specific asset.
|
| | |
| | |
| Intangibles—acquired technology | | Income Approach - Multi-period Excess Earnings Method |
| Intangibles—third party payor relationships | | Cost Approach - Replacement Cost Method |
| Intangibles—assay royalties | | Income Approach - Multi-period Excess Earnings Method |
| Intangibles—tradenames and trademarks | | Income Approach - Relief from Royalty Method |
Income Approach
The income approach is based upon the economic principle of anticipation. In this approach, the value of the subject intangible asset is the present value of the expected economic income to be earned from that intangible asset. This expectation is then converted into a present value through the selection of an investor's required rate of return given the risk and/or uncertainty associated with the subject intangible asset. In valuing an intangible asset using the income approach, the following elements should be considered: (i) remaining useful life, (ii) legal rights, (iii) position of the intangible asset in its respective life cycle, (iv) appropriate capital charges, (v) allocations of income, and (vi) whether any tax amortization benefit should be included in the analysis.
Cost Approach
The cost approach to intangible asset analysis is based upon the economic principles of substitution and price equilibrium. These basic economic principles assert that an investor pay no more for an investment than the cost to obtain an investment of equal utility. Within the cost approach there are several related analytical methods. Two of the most common and widely accepted include the reproduction cost and replacement cost methods. All cost based approaches typically involve a comprehensive analysis of the relevant cost components, which typically include: (i) materials, (ii) labor, (iii) overhead, (iv) intangible asset developer's profit, and (v) an adequate return on the asset developer's capital.
Reproduction cost contemplates the construction of an exact replica of the subject intangible asset. Before appropriate adjustments are made for the purposes of deriving an indication of value, reproduction cost does not consider either the market demand for or the market acceptance of the subject intangible. Therefore, before the requisite adjustments, the reproduction cost estimate does not answer the question of whether anyone would be interested in an exact replica of the subject interest.
Unlike the reproduction cost method, the replacement cost method does consider market demand and market acceptance for the subject intangible. In other words, if there are elements or components of the subject intangible that generate little or no demand, they are not included in the subject intangible.
Excess Earnings Method
The Excess Earnings Method, a form of the Income Approach, reflects the present value of the projected cash flows that are expected to be generated by the intangible asset, less charges representing the contribution of other assets to those cash flows. As
TRANSGENOMIC, INC. AND SUBSIDIARY
NOTES TO CONSOLIDATED FINANCIAL STATEMENTS—(Continued)
Years Ended December 31, 2011, 2010 and 2009
part of our analysis, we determined individual rates of return applicable to each acquired asset and estimate the effective “capital charge” to be applied to the earnings of the identified intangibles.
Relief-from-Royalty Method
The Relief-from-Royalty method, a form of the Income Approach, estimates the cost of licensing the acquired intangible asset from an independent third party using a royalty rate. Since the company owns the intangible asset, it is relieved from making royalty payments. The resulting cash flow savings attributed to the owned intangible asset are estimated over the intangible asset's remaining useful life and discounted to present value.
The fair value of the Series A Preferred Stock and related securities issued as a part of the consideration paid was determined on the basis of the closing market price of our common stock on the acquisition date, December 29, 2010.
During 2011, we recorded restructuring chargesa net purchase price adjustment of $0.1$0.2 million, in 2008increasing the amount of goodwill recorded for the purchase transaction, related to the additional lease expense onadjustment in valuation of certain working capital accounts acquired.
The following table sets forth the shut downpro-forma revenue and earnings of the Paris facility duecombined entity if the acquisition had occurred as of the beginning of our prior fiscal year. No revenue or net income was included in our actual results for the year ended December 31, 2010 or 2009. These pro-forma amounts do not purport to changesbe indicative of the actual results that would have been obtained had the acquisition occurred at that time.
|
| | | | | | | | |
| | | Dollars in Thousands |
| | | Year Ended December 31, |
| | | 2010 | | 2009 |
| Revenue—Supplemental pro-forma results | | $ | 33,733 |
| | $ | 35,112 |
|
| Net loss—Supplemental pro-forma results | | (7,716 | ) | | (13,071 | ) |
D. RESTRUCTURING CHARGES
In the third quarter of 2010 we made a decision to consolidate our research and development activities in Omaha, Nebraska. We substantially completed the market place causing our inability to sublease it of $0.3 million which was offset by reserves for fixed assets and severance of $0.2 million not utilized. We had a reserve totaling $0.2 million in other accrued expensestransition at December 31, 2008 related to the Paris, France facility. These costs are related to our instrument related segment. In addition, we took2010. We have recognized expenses for restructuring, charges of less than $0.1 million relatedincluding but not limited to, severance, duefacility costs and costs to the relocation of the laboratorymove equipment from Gaithersburg, Maryland to Omaha, Nebraska. These costsrestructuring charges are relatedattributable to our laboratory services segment. No restructuring charges were recordedClinical Laboratories and Diagnostic Tools segments.
In the fourth quarter of 2010 we had a reduction in 2009. We have a reserve totalingworkforce of five employees with severance payments of less than $0.1 million in other accrued expenses atwhich was attributable to our Diagnostic Tools segment.
Restructuring charges include:
|
| | | | | | | | | | | | |
| | | Dollars in Thousands |
| Costs Incurred in the year ended December 31, 2011 | | Cumulative Costs Incurred at December 31, 2011 | | Total Expected Costs |
| Severance and related costs | | $ | — |
| | $ | 53 |
| | $ | 53 |
|
| Facility closure costs | | 28 |
| | 74 |
| | 74 |
|
| Other | | 13 |
| | 52 |
| | 52 |
|
| Restructuring charges | | $ | 41 |
| | $ | 179 |
| | $ | 179 |
|
TRANSGENOMIC, INC. AND SUBSIDIARY
NOTES TO CONSOLIDATED FINANCIAL STATEMENTS—(Continued)
Years Ended December 31,
2011, 2010 and 2009
related to the Paris, France facility.D.
Inventories (net of
allowancesallowance for obsolescence) consisted of the following:
| | | | | | | | |
| | | Dollars in Thousands | |
| | | December 31,
2009 | | | December 31,
2008 | |
Finished goods | | $ | 2,322 | | | $ | 2,911 | |
Raw materials and work in process | | | 1,588 | | | | 1,766 | |
Demonstration inventory | | | 149 | | | | 206 | |
| | | | | | | | |
| | $ | 4,059 | | | $ | 4,883 | |
Less allowance for obsolescence | | | (507 | ) | | | (108 | ) |
| | | | | | | | |
Total | | $ | 3,552 | | | $ | 4,775 | |
| | | | | | | | |
TRANSGENOMIC, INC.
|
| | | | | | | |
| | Dollars in Thousands |
| | December 31, 2011 |
| | December 31, 2010 |
|
| Finished goods | $ | 2,608 |
| | $ | 2,119 |
|
| Raw materials and work in process | 1,485 |
| | 1,531 |
|
| Demonstration inventory | 277 |
| | 212 |
|
| | $ | 4,370 |
| | $ | 3,862 |
|
| Less allowance for obsolescence | (511 | ) | | (518 | ) |
| Total | $ | 3,859 |
| | $ | 3,344 |
|
F. INTANGIBLES AND
SUBSIDIARIESNOTES TO CONSOLIDATED FINANCIAL STATEMENTS - Continued
Years Ended December 31, 2009 and 2008
E. OTHER ASSETS
Finite lived
Long-lived intangible assets and other assets consisted of the following:
| | | | | | | | | | | | | | | | | | |
| | | Dollars in Thousands |
| | | December 31, 2009 | | December 31, 2008 |
| | | Cost | | Accumulated
Amortization | | Net Book
Value | | Cost | | Accumulated
Amortization | | Net Book
Value |
Intellectual property | | $ | 310 | | $ | 284 | | $ | 26 | | $ | 310 | | $ | 195 | | $ | 115 |
Patents | | | 598 | | | 241 | | | 357 | | | 679 | | | 230 | | | 449 |
Other long term assets | | | 200 | | | — | | | 200 | | | 209 | | | — | | | 209 |
| | | | | | | | | | | | | | | | | | |
Total | | $ | 1,108 | | $ | 525 | | $ | 583 | | $ | 1,198 | | $ | 425 | | $ | 773 |
| | | | | | | | | | | | | | | | | | |
During 2009 we accelerated amortization on two intellectual property license agreements that we plan to terminate in the first quarter of 2010. In addition we accelerated amortization on another license agreement, however, we are not terminating that agreement. In total the change to the net book value of intellectual property was less than $0.1 million. We wrote off less than $0.1 million in patents that we are no longer using. During 2008 we wrote off several license agreements that were terminated and which were fully amortized.
|
| | | | | | | | | | | | | | | | | | | | | | | |
| | Dollars in Thousands |
| | December 31, 2011 | | December 31, 2010 |
| | Cost | | Accumulated Amortization | | Net Book Value | | Cost | | Accumulated Amortization | | Net Book Value |
| Intangibles—acquired technology | $ | 6,535 |
| | $ | 911 |
| | $ | 5,624 |
| | $ | 6,535 |
| | $ | — |
| | $ | 6,535 |
|
| Intangibles—assay royalties | 1,434 |
| | 205 |
| | 1,229 |
| | 1,434 |
| | — |
| | 1,434 |
|
| Intangibles—third party payor relationships | 367 |
| | — |
| | 367 |
| | 367 |
| | — |
| | 367 |
|
| Intangibles—tradenames and trademarks | 344 |
| | 49 |
| | 295 |
| | 344 |
| | — |
| | 344 |
|
| Patents | 703 |
| | 267 |
| | 436 |
| | 511 |
| | 245 |
| | 266 |
|
| Intellectual property | 20 |
| | 5 |
| | 15 |
| | 290 |
| | 274 |
| | 16 |
|
| | $ | 9,403 |
| | $ | 1,437 |
| | $ | 7,966 |
| | $ | 9,481 |
| | $ | 519 |
| | $ | 8,962 |
|
|
| |
| |
| Estimated Useful Life |
| Intellectual property | 10 years |
| Patents | 7 years |
| Intangibles—acquired technology | 7 – 8 years |
| Intangibles—third party payor relationships | Indefinite |
| Intangibles—assay royalties | 7 years |
| Intangibles—tradenames and trademarks | 7 years |
Other assets include
USU.S. security deposits and deferred tax
assets.assets, net of applicable valuation allowances.
Amortization expense for intangible assets was $1.3 million during the year ended December 31, 2011 and less than $0.1 million during botheach of the years ended December 31, 20092010 and 2008.2009. Amortization expense for intangible assets is expected to be less than $.1$1.2 million in each of the years 2012 through 2017.
TRANSGENOMIC, INC. AND SUBSIDIARY
NOTES TO CONSOLIDATED FINANCIAL STATEMENTS—(Continued)
Years Ended December 31, 2011, 2010 and
thereafter.2009
G. DEBT
|
| | | | | | | | |
| | | Dollars in Thousands |
| | | Year Ended December 31, |
| | | 2011 | | 2010 |
PGxHealth note payable (the "First Note") (1) | | $ | 8,640 |
| | $ | 8,640 |
|
PGxHealth note payable (the "Second Note") (2) | | 82 |
| | 989 |
|
Third Security Convertible Promissory Notes (3) | | 3,000 |
| | — |
|
| Total debt, including short term debt | | 11,722 |
| | 9,629 |
|
| Short term debt | | (3,082 | ) | | (989 | ) |
| Current maturities of long term debt | | (3,703 | ) | | — |
|
| Long-term debt, net of current maturities | | $ | 4,937 |
| | $ | 8,640 |
|
| |
| (1) | The First Note is a three year senior secured promissory note to PGxHealth, LLC entered into on December 29, 2010 in conjunction with our acquisition of the FAMILION family of genetic tests from PGxHealth. Interest is payable at 10% per year with quarterly interest payments through March 29, 2012. Thereafter, quarterly installments will include both principal and interest through December 30, 2013. |
| |
| (2) | The Second Note is a one year senior secured promissory note to PGxHealth, LLC entered into on December 31, 2010 for facility improvements made to the CLIA certified laboratory in New Haven, Connecticut. Interest is payable at 6.5% per year with the principal and interest payable in twelve monthly installments with the final payment made on January 3, 2012. |
The entire unpaid balance of both the First Note and the Second Note will become immediately due and payable if: (i) we fail to make timely payments under the Notes; (ii) we make an assignment for the benefit of creditors; (iii) we file for bankruptcy; or (iv) upon any event of default under the Security Agreement. Additionally, under the terms of the First Note, if we consummate an equity financing that involves the receipt by us of net proceeds of not less than $6,000,000, then we shall, upon the consummation of such equity financing, pay to PGxHealth the lesser of: (i) 25% of the gross proceeds received from such financing; and (ii) the then-outstanding balance under the First Note. Under the terms of the Second Note, in the event of a sale of all or substantially all of the assets of the Company, we shall pay PGxHealth the lesser of: (i) 100% of the proceeds, less certain fees, received pursuant to such sale; and (ii) the then-outstanding balance under the Second Note.
The notes are secured by the assets of Transgenomic.
(3) The Third Security Promissory Notes are convertible promissory notes to Third Security Senior Staff 2008 LLC, Third Security Staff 2010 LLC and Third Security Incentive 2010 LLC entered into on December 30, 2011 with a maturity date of March 31, 2012. Interest is payable at 16% per year. The Third Security Promissory Notes automatically converts into the same class(es) or series and at the same price as the equity securities of the Company sold upon the first sale or issuance of its equity securities, after December 30, 2011, in the aggregate amount of at least $3,000,000, and provides that it shall be due and payable if it has not been converted prior to March 31, 2012. In connection with a private placement conducted by the Company in February 2012, the Third Security Promissory Notes converted into equity securities of the Company on the same terms as issued to investors in the private placement. See Note R to the consolidated financial statements.
F.The aggregate minimum principal maturities of the debt for each of the fiscal years following December 31, 2011 are as follows:
|
| | | |
| | |
| 2012 | $ | 3,703 |
|
| 2013 | 4,937 |
|
| | $ | 8,640 |
|
| | |
TRANSGENOMIC, INC. AND SUBSIDIARY
NOTES TO CONSOLIDATED FINANCIAL STATEMENTS—(Continued)
Years Ended December 31, 2011, 2010 and 2009
H. CAPITAL LEASES
The following is an analysis of the property acquired under capital leases.
|
| | | | | | | |
| | Dollars in Thousands |
| | Asset Balances at |
| Classes of Property | December 31, 2011 |
| | December 31, 2010 |
|
| Equipment | $ | 1,052 |
| | $ | 394 |
|
| Less: Accumulated amortization | (164 | ) | | (13 | ) |
| Total | $ | 888 |
| | $ | 381 |
|
The following is a schedule by years of future minimum lease payments under capital leases together with the present value of the net minimum lease payments as of December 31, 2011.
Year ending December 31:
|
| | | |
| | Dollars in Thousands |
| 2012 | $ | 378 |
|
| 2013 | 312 |
|
| 2014 | 97 |
|
| 2015 | — |
|
| Total minimum lease payments | $ | 787 |
|
| Less: Amount representing interest | (99 | ) |
| Present value of net minimum lease payments | $ | 688 |
|
Included in depreciation for the year ended December 31, 2011 , 2010 and 2009 was $0.2 million, less than $0.1 million and $0.0 million, respectively, related to equipment acquired under capital leases.
I. COMMITMENTS AND CONTINGENCIES
We are subject to a number of claims of various amounts, which arise out of the normal course of business. In the opinion of management, the disposition of pending claims will not have a material adverse effect on our financial position, results of operations or cash flows.
We lease certain equipment, vehicles and operating facilities under non-cancellable operating leases that expire on various dates through 2014.2022. The future minimum lease payments required under these leases are approximately $1.1 million in 2012, $1.0 million in 2013, $1.0 million in 2014, $0.9 million in 2010, $0.62015 and $0.9 million in 2011, $0.3 million in 2012, $0.1 million in 2013 and $0.1 million in 2014.2016. Rent expense for each of the yearstwelve months ended December 31, 2011, 2010 and 2009 was $0.9 million, $0.8 million and 2008 was $0.8 million.We have entered into employment agreements with Craig J. Tuttle, our President and Chief Executive Officer, Debra A. Schneider, our Chief Financial Officer, Vice President, Secretary and Treasurer, and Eric P. Kaldjian M.D., our Chief Scientific Officer. The current term of Mr. Tuttle’s employment agreement ends on July 12, 2010. The current term of Ms. Schneider’s employment agreement ends on December 4, 2010. The current term of Dr. Kaldjian’s employment agreement ends onmillion, respectively.
At December 31, 2010. Each employment agreement provides that the executive officer will be entitled2011, firm commitments to receive severance payments from the Company if his or her employment is terminated involuntarilyvendors totaled
$1.3 million.
TRANSGENOMIC, INC. AND
SUBSIDIARIESSUBSIDIARY
NOTES TO CONSOLIDATED FINANCIAL
STATEMENTS - ContinuedSTATEMENTS—(Continued)
Years Ended December 31,
20092011, 2010 and
2008except if such termination is based on “just cause”, as that term is defined in the employment agreement. The severance payment payable in the event of involuntary termination without just cause is equal to their annual base salary at the time of termination and will be paid to them over a twelve-month period. The employment agreements provide that the severance payment provisions will be honored if the Company is acquired by, or merged into, another company and their positions are eliminated as a result of such acquisition or merger. In addition we have one employee who is entitled to a severance payment of less than $0.1 million if the employee’s position is eliminated prior to July 2012.
At December 31, 2009 firm commitments to vendors to purchase components used in WAVE Systems and instruments manufactured by others totaled $0.6 million.
G.
The Company’s provision for income taxes for the years ended December 31,
20092011, 2010 and
20082009 relates to income taxes in states, foreign countries and other local jurisdictions and differs from the amounts determined by applying the statutory Federal income tax rate to loss before income taxes for the following reasons:
| | | | | | | | |
| | | Dollars in Thousands | |
| | | 2009 | | | 2008 | |
Benefit at federal rate | | $ | (639 | ) | | $ | (96 | ) |
Increase (decrease) resulting from: | | | | | | | | |
State income taxes—net of federal benefit | | | (10 | ) | | | (65 | ) |
Foreign subsidiary tax rate difference | | | (50 | ) | | | (67 | ) |
FIN 48 | | | 48 | | | | 5 | |
Net operating loss expiration | | | 1,258 | | | | — | |
Miscellaneous permanent differences | | | 93 | | | | 29 | |
Other—net | | | (33 | ) | | | (104 | ) |
Valuation allowance | | | (625 | ) | | | 511 | |
| | | | | | | | |
Current income tax expense | | $ | 42 | | | $ | 213 | |
| | | | | | | | |
|
| | | | | | | | | | | | |
| | | Dollars in Thousands |
| | | 2011 | | 2010 | | 2009 |
| Benefit at federal rate | | $ | (3,311 | ) | | $ | (1,015 | ) | | $ | (639 | ) |
| Increase (decrease) resulting from: | | | | | | |
| State income taxes—net of federal benefit | | 2 |
| | 20 |
| | (10 | ) |
| Foreign subsidiary tax rate difference | | (94 | ) | | (27 | ) | | (50 | ) |
| Tax contingency | | 28 |
| | 45 |
| | 48 |
|
| Net operating loss expiration | | 988 |
| | — |
| | 1,258 |
|
| Earnings repatriation | | — |
| | 1,479 |
| | — |
|
| Miscellaneous permanent differences | | 332 |
| | 60 |
| | 93 |
|
| Other—net | | (53 | ) | | 86 |
| | (33 | ) |
| Valuation allowance | | 2,153 |
| | (498 | ) | | (625 | ) |
| Current income tax expense | | $ | 45 |
| | $ | 150 |
| | $ | 42 |
|
|
| | | | | | | | | | | | |
| | | Dollars in Thousands |
| | | 2011 | | 2010 | | 2009 |
| Federal: | | | | | | |
| Current | | $ | 16 |
| | $ | 4 |
| | $ | (58 | ) |
| Deferred | | — |
| | — |
| | — |
|
| Total Federal | | $ | 16 |
| | $ | 3 |
| | $ | (58 | ) |
| State: | | | | | | |
| Current | | $ | 3 |
| | $ | 29 |
| | $ | (16 | ) |
| Deferred | | — |
| | — |
| | — |
|
| Total State | | $ | 3 |
| | $ | 29 |
| | $ | (16 | ) |
| Foreign: | | | | | | |
| Current | | $ | 159 |
| | $ | 111 |
| | $ | (60 | ) |
| Deferred | | (133 | ) | | 6 |
| | 176 |
|
| Total Foreign | | $ | 26 |
| | $ | 117 |
| | $ | 116 |
|
| Total Tax Provision | | $ | 45 |
| | $ | 150 |
| | $ | 42 |
|
TRANSGENOMIC, INC. AND
SUBSIDIARIESSUBSIDIARY
NOTES TO CONSOLIDATED FINANCIAL
STATEMENTS - ContinuedSTATEMENTS—(Continued)
Years Ended December 31,
20092011, 2010 and
2008 | | | | | | | | |
| | | Dollars in Thousands | |
| | | 2009 | | | 2008 | |
Federal: | | | | | | | | |
Current | | $ | (58 | ) | | $ | — | |
Deferred | | | — | | | | — | |
| | | | | | | | |
Total Federal | | $ | (58 | ) | | $ | — | |
State: | | | | | | | | |
Current | | $ | (16 | ) | | $ | — | |
Deferred | | | — | | | | — | |
| | | | | | | | |
Total State | | $ | (16 | ) | | $ | — | |
Foreign: | | | | | | | | |
Current | | $ | (60 | ) | | $ | 318 | |
Deferred | | | 176 | | | | (105 | ) |
| | | | | | | | |
Total Foreign | | $ | 116 | | | $ | 213 | |
| | | | | | | | |
Total Tax Provision | | $ | 42 | | | $ | 213 | |
| | | | | | | | |
2009
The Company’s deferred income tax asset from continuing and discontinued operations at December 31,
20092011 and
20082010 is comprised of the following temporary differences:
| | | | | | | | |
| | | Dollars in Thousands | |
| | | 2009 | | | 2008 | |
Deferred Tax Asset: | | | | | | | | |
Net operating loss carryforward | | $ | 38,688 | | | $ | 39,449 | |
Research and development credit carryforwards | | | 1,355 | | | | 1,340 | |
Deferred net sales | | | 194 | | | | 253 | |
Inventory | | | 186 | | | | 41 | |
Other | | | 350 | | | | 323 | |
| | | | | | | | |
| | | 40,773 | | | | 41,406 | |
Less valuation allowance | | | (40,639 | ) | | | (41,264 | ) |
| | | | | | | | |
Deferred Tax Asset | | $ | 134 | | | $ | 142 | |
Deferred Tax Liability | | | | | | | | |
Uninstalled instruments | | $ | 183 | | | $ | 37 | |
| | | | | | | | |
Deferred Tax Liability | | $ | 183 | | | $ | 37 | |
| | |
Net Deferred Asset (Liability) | | $ | (49 | ) | | $ | 105 | |
| | | | | | | | |
|
| | | | | | | | |
| | | Dollars in Thousands |
| | | 2011 | | 2010 |
| Deferred Tax Asset: | | | | |
| Net operating loss carryforward | | $ | 38,154 |
| | $ | 38,201 |
|
| Unrealized gain | | 2,062 |
| | — |
|
| Research and development credit carryforwards | | 1,232 |
| | 1,232 |
|
| Deferred net sales | | 190 |
| | 151 |
|
| Inventory | | 184 |
| | 188 |
|
| Other | | 552 |
| | 473 |
|
| | | 42,374 |
| | 40,245 |
|
| Less valuation allowance | | (42,294 | ) | | (40,141 | ) |
| Deferred Tax Asset | | $ | 80 |
| | $ | 104 |
|
| Deferred Tax Liability: | | | | |
| Uninstalled instruments | | $ | 2 |
| | $ | 159 |
|
| Deferred Tax Liability | | $ | 2 |
| | $ | 159 |
|
| Net Deferred Asset (Liability) | | $ | 78 |
| | $ | (55 | ) |
At December 31,
2009,2011, we had total unused federal tax net operating loss carryforwards from continuing and discontinued operations of
$107.2$104.4 million of which
$2.9 million expires in 2010, $.9 million expires in 2011, $3.4$1.9 million expires in 2012, $1.8 million expires in 2018, $8.2 million expires in 2019, $9.7 million expires in 2020, $8.2 million expires in 2021, $16.9 million expires in 2022, $16.2 million expires in 2023, $17.4 million expires in 2024, $8.2 million expires in 2025, $6.8 million expires in 2026, $3.2 million expires in 2027, $1.3 million expires in 2028,
and $2.1 million expires in
TRANSGENOMIC, INC. AND SUBSIDIARIES
NOTES TO CONSOLIDATED FINANCIAL STATEMENTS - Continued
Years Ended December 31, 2009 2029, and 2008
2029.$2.5 million expires in 2031. Of these federal net operating loss carryforwards, $6.4$5.5 million were obtained in the acquisition of Annovis, Inc. and may be subject to certain restrictions. Remaining net operating loss carryforwards could be subject to limitations under section 382 of the Internal Revenue Code. At December 31, 2009,2011, we had unused state tax net operating loss carryforwards from continuing and discontinued operations of approximately $41.0$46.0 million that expire at various times beginning in 2010.2012. At December 31, 2009,2011, we had unused research and development credit carryforwards from continuing and discontinued operations of $1.4$1.2 million that expire at various times between 20102012 and 2024. A net deferred tax liability was recorded during 20092011 related to the UK income taxes for less than $0.1 million. A valuation allowance has been provided for the remaining deferred tax assets, due to the cumulative losses in recent years and an inability to utilize any additional losses as carrybacks. We will continue to assess the recoverability of deferred tax assets and the related valuation allowance. To the extent we begin to generate income in future years and it is determined that such valuation allowance is no longer required, the tax benefit of the remaining deferred tax assets will be recognized at such time.
We had no material unrecognized tax benefits, interest, or penalties during fiscal
20092011 or
fiscal 2008,2010, and we do not anticipate any such items during the next twelve months. Our policy is to record interest and penalties directly related to income taxes as income tax expense in the Consolidated Statements of Operations. We file income tax returns in the U.S. federal jurisdiction, various U.S. state jurisdictions and various foreign jurisdictions. We have statutes of limitation open for Federal income tax returns related to tax years
20072008, 2009, and
2008.2010. We have state income tax returns subject to examination primarily for tax years
20062007 through
2008.2010. Open tax years related to foreign jurisdictions remain subject to examination. Our primary foreign jurisdiction is the United Kingdom which has open tax years for
20062007 through
2008.2010.
During the years ended December 31,
20092011 and
2008,2010, there were no material changes to the liability for uncertain tax positions.
H. The liability for uncertain tax positions relates to potential uncertain tax positions in foreign jurisdictions.
We maintain an employee 401(k) retirement savings plan that allows for voluntary contributions into designated investment funds by eligible employees. Prior to JuneOctober 1, 20092010 we matched the employee’s contributions at the rate of 50% on
TRANSGENOMIC, INC. AND SUBSIDIARY
NOTES TO CONSOLIDATED FINANCIAL STATEMENTS—(Continued)
Years Ended December 31, 2011, 2010 and 2009
the first 6% of contributions. Effective
JuneOctober 1,
2009,2010, Transgenomic discontinued matching employee 401(k) contributions. We may, at the discretion of our Board of Directors, make additional contributions on behalf of the Plan’s participants.
There were no contributions to the 401(k) plan in the third and fourth quarters of 2009. Contributions to the 401(k) plan were
$0.0 million, $0.1 million and less than $0.1 million for the
yearyears ended December 31,
2009. Contributions to the 401(k) plan were $0.2 million for the year ended December 31, 2008.I.2011, 2010 and 2009, respectively.
L. STOCKHOLDERS’ EQUITY
Common Stock.
The Company’s Board of Directors is authorized to issue up to 100,000,000 shares of common stock, from time to time, as provided in a resolution or resolutions adopted by the Board of Directors.
TRANSGENOMIC, INC. AND SUBSIDIARIES
NOTES TO CONSOLIDATED FINANCIAL STATEMENTS - Continued
Years Ended December 31, 2009 and 2008
Common Stock Warrants.
No common stock warrants were issued or exercised during 2009 or 2008. At December 31, 2009, there were warrants outstanding which were exercisable to purchase 7,978,156 shares of common stock.
| | | | | | | | | |
Warrant Holder | | Issue Year | | Expiration Year | | Underlying Shares | | Exercise Price |
Various Institution Holders(1) | | 2005 | | 2010 | | 6,903,156 | | $ | 1.20 |
Laurus Master Fund, Ltd.(2) | | 2003 | | 2010 | | 200,000 | | $ | 1.92 |
Laurus Master Fund, Ltd.(2) | | 2003 | | 2010 | | 200,000 | | $ | 2.07 |
Laurus Master Fund, Ltd.(2) | | 2003 | | 2010 | | 150,000 | | $ | 2.35 |
Laurus Master Fund, Ltd.(2) | | 2004 | | 2011 | | 125,000 | | $ | 2.57 |
Laurus Master Fund, Ltd.(2) | | 2004 | | 2011 | | 400,000 | | $ | 1.18 |
| | | | | | | | | |
Total | | | | | | 7,978,156 | | | |
| | | | | | | | | |
| (1) | These warrants were issued in conjunction with a private placement of common stock in October 2005.
|
| (2) | These warrants were issued in conjunction with two loans that had been made to us by Laurus Master Fund, Ltd. (the “Laurus Loans”), and subsequent modifications of these loans. In conjunction with the 2005 private placement, the exercise prices of these warrants were adjusted according to repricing provisions contained in the original warrant agreements. While the Laurus Loans have been terminated, the warrants remain outstanding. Due to the repricing provision, these warrants are considered liabilities for financial reporting purposes.
|
The Company’s Board of Directors is authorized to issue up to 15,000,000 shares of preferred stock in one or more series, from time to time, with such designations, powers, preferences and rights and such qualifications, limitations and restrictions as may be provided in a resolution or resolutions adopted by the Board of Directors. The authority of the Board of Directors includes, but is not limited to, the determination or fixing of the following with respect to shares of such class or any series thereof: (i) the number of shares; (ii) the dividend rate, whether dividends shall be cumulative and, if so, from which date; (iii) whether shares are to be redeemable and, if so, the terms and amount of any sinking fund providing for the purchase or redemption of such shares; (iv) whether shares shall be convertible and, if so, the terms and provisions thereof; (v) what restrictions are to apply, if any, on the issue or reissue of any additional preferred stock; and (vi) whether shares have voting rights. The preferred stock may be issued with a preference over the common stock as to the payment of dividends. The Company has no current plans to issue any
series ofadditional preferred stock. Classes of stock such as the preferred stock may be used, in certain circumstances, to create voting impediments on extraordinary corporate transactions or to frustrate persons seeking to effect a merger or otherwise to gain control of the Company. For the foregoing reasons, any
additional preferred stock issued by the Company could have an adverse effect on the rights of the holders of the common stock.
On December 29, 2010, we entered into a transaction with the Third Security Investors, pursuant to the terms of Series A Convertible Preferred Stock Purchase Agreement (“Series A Purchase Agreement”), in which we: (i) sold an aggregate of 2,586,205 shares of Series A Preferred Stock at a price of $2.32 per share; and (ii) issued Series A Warrants to purchase up to an aggregate of 1,293,102 shares of Series A Preferred having an exercise price of $2.32 per share (the sale of Series A Preferred Stock and issuance of the Series A Warrants hereafter referred to as the “Financing”). The Series A Warrants may be exercised at any time from December 29, 2010 until December 28, 2015 and contains a “cashless exercise” feature. The gross proceeds from the Financing were $6.0 million. The $0.2 million of costs incurred to complete the Financing were recorded as a reduction in the value of the Series A Preferred Stock. We used the net proceeds from the financing to acquire the FAMILION family of genetic tests from PGxHealth, a subsidiary of Clinical Data, Inc. Until the November 2011modifications, the Series A Preferred Stock met the definition of mandatorily redeemable stock as it is preferred capital stock that is redeemable at the option of the holder through December 2015 and was reported outside of equity. The Series A Preferred Stock is accreted to its redemption value of $6.0 million. Until the November 2011 modifications, the Series A Warrants did not qualify to be treated as equity and, accordingly, was recorded as a liability. A preferred stock anti-dilution feature is embedded within the Series A Preferred Stock that meets the definition of a derivative.
In connection with the Financing, we filed a Certificate of Designation of Series A Convertible Preferred Stock (the “Certificate of Designation”) with the Secretary of State of the State of Delaware, designating 3,879,307 shares of our preferred stock as Series A Preferred Stock. The Series A Preferred Stock, including the Series A Preferred Stock issuable upon exercise of the Series A Warrants, is convertible into shares of our common stock at a rate of 4-for-1, which conversion rate is subject to further adjustment as set forth in the Certificate of Designation. Certain rights of the holders of the Series A Preferred Stock are senior to the rights of the holders of common stock. The Series A Preferred Stock has a liquidation preference equal to its original price per share, plus any accrued and unpaid dividends thereon. The holders of the Series A Preferred Stock are entitled to receive quarterly dividends, which accrue at the rate of 10.0% of the original price per share per annum, whether or not declared, shall compound annually and shall be cumulative. In any calendar quarter, we are required to pay from funds legally available a cash dividend in the amount of 50% of the distributable cash flow as defined in the Series A Purchase Agreement or the aggregate amount of dividends accrued on the Series A Preferred Stock. During the year ended December 31, 2011, we recorded $0.6 million in accrued dividends.
Generally, the holders of the Series A Preferred Stock are entitled to vote together with the holders of common stock, as a single group, on an as-converted basis. However, the Certificate of Designation provides that we shall not perform some activities, subject to certain exceptions, without the affirmative vote of a majority of the holders of the outstanding shares of Series A Preferred Stock. The holders of the Series A Preferred Stock also are entitled to elect or appoint, as a single group, two (2) of the five (5) directors of the Company.
TRANSGENOMIC, INC. AND
SUBSIDIARIESSUBSIDIARY
NOTES TO CONSOLIDATED FINANCIAL
STATEMENTS - ContinuedSTATEMENTS—(Continued)
Years Ended December 31, 20092011, 2010 and 20082009
In connection with the Financing, we also entered into a registration rights agreement with the Third Security Investors (the “Registration Rights Agreement”). Pursuant to the terms of the Registration Rights Agreement, the Company has granted the Third Security Investors certain demand, “piggyback” and S-3 registration rights covering the resale of the shares of common stock underlying the Series A Preferred Stock issued pursuant to the Series A Purchase Agreement and issuable upon exercise of the Series A Warrants and all shares of common stock issuable upon any dividend or other distribution with respect thereto.
In November 2011, we entered into a transaction with the Third Security Investors, pursuant to an Agreement Regarding Preferred Stock (the “Amendment Agreement”), in which the Third Security Investors agreed to (i) waive their rights to enforce the anti-dilution and redemption features of the Series A Preferred Stock and (ii) at the next annual shareholder meeting, vote to amend the Certificate of Designation to remove the anti-dilution and redemption features of the Series A Preferred Stock. In exchange, the Company issued shares of common stock to the Third Security Investors having an aggregate market value of $0.3 million.
As a result of the Amendment Agreement, the value of the Series A Preferred Stock and Series A Warrants, including the Series A Preferred Stock conversion feature and Series A Warrant liability, were reclassified into shareholders equity as of the date of the Amendment Agreement.
Common Stock.
The Company’s Board of Directors is authorized to issue up to 100,000,000 shares of common stock, from time to time, as provided in a resolution or resolutions adopted by the Board of Directors.
Common Stock Warrants.
No common stock warrants were issued during the year ended J.December 31, 2011. Laurus Master Fund, Ltd. exercised its warrants during 2011 in a cashless exercise for 60,150 shares of common stock. Warrants to purchase 5,172,408 shares of common stock was outstanding at December 31, 2011.
|
| | | | | | | | |
| Warrant Holder | | Issue Year | | Expiration | | Underlying Shares | | Exercise Price |
| Affiliates of Third Security, LLC (1) | | 2010 | | December 2015 | | 5,172,408 | | $0.58 |
| |
| (1) | Warrants issued in connection with the Financing. The number of shares shown reflects the post-conversion shares. |
The Company’s 2006 Equity Incentive Plan (the “Plan”) allows the Company to make awards of various types of equity-based compensation, including stock options, dividend equivalent rights (“DERs”), stock appreciation rights (“SARs”), restricted stock, restricted stock units, performance units, performance shares and other awards, to employees and directors of the Company. The
Company may issue 10,000,000 shares under the Plan; provided, that no more than 5,000,000 of such shares may be used for grants of restricted stock, restricted stock units, performance units, performance shares and other awards. The Plan was adopted in 2006 as a modification of the
Company’sCompany's 1997 Stock Option Plan (the “Prior Plan”). In addition to providing for additional types of equity-based awards, the Plan increased the total number of shares of common stock that the Company may issue from 7,000,000 under the Prior Plan to 10,000,000 shares under the Plan; provided, that no more than 5,000,000 of such shares may be used for grants of restricted stock, restricted stock units, performance units, performance shares and other awards.
The Plan is administered by the Compensation Committee of the Board of Directors (the “Committee”) which has the authority to set the number, exercise price, term and vesting provisions of the awards granted under the Plan, subject to the terms thereof. Either incentive or non-qualified stock options may be granted to employees of the Company, but only
nonqualifiednon-qualified stock options may be granted to
nonemployeenon-employee directors and advisors. However, in either case, the Plan requires that stock options must be granted at exercise prices not less than the fair market value of the common stock on the date of the grant. Options issued under the plan vest over periods as determined by the Compensation Committee and expire 10 years after the date the option was granted. To date, the only awards made under the Plan (and the Prior Plan) have been non-incentive stock options.
For the year ended December 31, 2011, we recorded compensation expense of $1.0 million within selling, general and administrative expense as a result of the vesting of options exercisable for the purchase of 3.0 million options. For the year ended December 31, 2010, we recorded compensation expense recovery of less than $0.1 million within selling, general and administrative
TRANSGENOMIC, INC. AND SUBSIDIARY
NOTES TO CONSOLIDATED FINANCIAL STATEMENTS—(Continued)
Years Ended December 31, 2011, 2010 and 2009
expense. Two executive officers departed during the second quarter of 2010. All stock options that were unvested were forfeited at the time of their departure as their requisite services periods were not completed. The vesting of options exercisable for the purchase of 1.3 million shares was offset by the expense recovery for stock options that were forfeited due to the requisite service not being rendered. For the year ended December 31, 2009, we recorded compensation expense of $0.2 million within selling, general and administrative expense as a result of the vesting of options exercisable for the purchase of 1.7 million shares during the year. For the year ended December 31, 2008, we recorded compensation expense of $0.4 million within selling, general and administrative expense as a result of the vesting of options exercisable for the purchase of 1.7 million shares. As of December 31, 2009,2011, there was $0.1$1.0 million of unrecognized compensation expense related to unvested stock options, which is expected to be recognized over a weighted average period of nearly three years. The fair value of the options granted during 2011 was estimated on their respective grant dates using the Black-Scholes option-pricing model. The Black-Scholes model was used with the following assumptions: risk-free interest rates of 0.92% to 2.16%, based on the U.S. Treasury yield in effect at the time of grant; dividend yields of zero percent; expected lives of three to five years, based on historical exercise activity; and volatility of 105% to 107% for grants made during the year ended December 31, 2011 based on the historical volatility of our stock over a time that is consistent with the expected life of the option. A small group of senior executives hold the majority of the stock options and are expected to hold the options until they are vested. Forfeitures of 1.1% to 3.6% have been assumed in the calculation.
The fair value of the options granted during 2010 was estimated on their respective grant dates using the Black-Scholes option-pricing model. The Black-Scholes model was used with the following assumptions: risk-free interest rates of 1.17% to 1.98%, based on the U.S. Treasury yield in effect at the time of grant; dividend yields of zero percent; expected lives of five years, based on historical exercise activity; and volatility of 103% to 105% for grants made during the year ended December 31, 2010 based on the historical volatility of our stock over a time that is consistent with the expected life of the option. A small group of senior executives hold the majority of the stock options and are expected to hold the options until they are vested. Forfeitures of 2.2% to 2.5% have been assumed in the calculation.
The fair value of the options granted during 2009 was estimated on their respective grant dates using the Black-Scholes option pricing model. The Black-Scholes model was used with the following assumptions: risk-free interest rates of 2.12% to 3.99%, based on the U.S. Treasury yield in effect at the time of grant; dividend yields of zero percent; expected lives of 5 to 10 years, based on historical exercise
activity behavior;activity; and volatility of 106.08% to 80.03% for grants made during the year ended December 31, 2009 based on the historical volatility of our stock over a time that is consistent with the expected life of the option. A small group of senior executives hold the majority of the stock options and are expected to hold the options until they are vested therefore minimal forfeitures
have been assumed.The fair value of the options granted during 2008 was estimated on their respective grant dates using the Black-Scholes option pricing model. The Black-Scholes model was used with the following assumptions: risk-free interest rates of 1.55% to 3.99%, based on the U.S. Treasury yieldwere assumed in effect at the time of grant; dividend yields of zero percent; expected lives of 2 to 10 years, based on historical
2009.
TRANSGENOMIC, INC. AND SUBSIDIARIESNOTES TO CONSOLIDATED FINANCIAL STATEMENTS - Continued
Years Ended December 31, 2009 and 2008
exercise activity behavior; and volatility of 62.92% to 95.35% for grants made during the year ended December 31, 2008 based on the historical volatility of our stock over a time that is consistent with the expected life of the option. A small group of senior executives hold the majority of the stock options and are expected to hold the options until they are vested therefore no forfeitures have been assumed.
The following table summarizes activity under the Plan (and the Prior Plan) during the year ended December 31, 2009:
| | | | | | | |
| | | Number of
Options | | | Weighted Average
Exercise Price | |
Balance at January 1, 2009: | | 3,531,064 | | | $ | 2.54 | |
Granted | | 70,000 | | | | .42 | |
Exercised | | — | | | | — | |
Forfeited | | (72,833 | ) | | | (1.3931 | ) |
Expired | | (196,500 | ) | | | (4.8530 | ) |
| | | | | | | |
Balance at December 31, 2009: | | 3,331,731 | | | $ | 2.39 | |
| | | | | | | |
Exercisable at December 31, 2009 | | 2,518,671 | | | $ | 2.96 | |
| | | | | | | |
2011:
|
| | | | | | | |
| | | Number of Options | | Weighted Average Exercise Price |
| Balance at January 1, 2011: | | 2,565,001 |
| | $ | 2.08 |
|
| Granted | | 2,440,500 |
| | 1.17 |
|
| Exercised | | (30,000 | ) | | (0.76 | ) |
| Forfeited | | (353,501 | ) | | (1.64 | ) |
| Expired | | (450,000 | ) | | (6.69 | ) |
| Balance at December 31, 2011: | | 4,172,000 |
| | $ | 1.10 |
|
| Exercisable at December 31, 2011 | | 2,131,045 |
| | $ | 1.05 |
|
TRANSGENOMIC, INC. AND SUBSIDIARY
NOTES TO CONSOLIDATED FINANCIAL STATEMENTS—(Continued)
Years Ended December 31, 2011, 2010 and 2009
The following table summarizes activity under the Plan (and the Prior Plan) during the year ended December 31, 2008: | | | | | | |
| | | Number of
Options | | | Weighted Average
Exercise Price |
Balance at January 1, 2008: | | 4,535,064 | | | $ | 3.26 |
Granted | | 350,000 | | | | .66 |
Exercised | | — | | | | — |
Forfeited/Expired | | (1,354,000 | ) | | | 4.44 |
| | | | | | |
Balance at December 31, 2008: | | 3,531,064 | | | $ | 2.54 |
| | | | | | |
Exercisable at December 31, 2008 | | 2,251,202 | | | $ | 3.62 |
| | | | | | |
2010
: |
| | | | | | | |
| | | Number of Options | | Weighted Average Exercise Price |
| Balance at January 1, 2010: | | 3,331,731 |
| | $ | 2.39 |
|
| Granted | | 125,000 |
| | 0.50 |
|
| Exercised | | (100,000 | ) | | (0.42 | ) |
| Forfeited | | (593,499 | ) | | (0.73 | ) |
| Expired | | (198,231 | ) | | (11.07 | ) |
| Balance at December 31, 2010: | | 2,565,001 |
| | $ | 2.08 |
|
| Exercisable at December 31, 2010 | | 2,358,334 |
| | $ | 2.22 |
|
The following table summarizes activity under the Plan (and the Prior Plan) during the year ended December 31, 2009:
|
| | | | | | | |
| | | Number of Options | | Weighted Average Exercise Price |
| Balance at January 1, 2009: | | 3,531,064 |
| | $ | 2.54 |
|
| Granted | | 70,000 |
| | 0.42 |
|
| Exercised | | — |
| | — |
|
| Forfeited | | (72,833 | ) | | (1.39 | ) |
| Expired | | (196,500 | ) | | (4.85 | ) |
| Balance at December 31, 2009: | | 3,331,731 |
| | $ | 2.39 |
|
| Exercisable at December 31, 2009 | | 2,518,671 |
| | $ | 2.96 |
|
The following table summarizes the stock options that were issued during the year ended December 31, 2009: | | | | | |
| | | Number of
Options | |
Exercise Price |
January 15, 2009 | | 25,000 | | $ | 0.36 |
May 20, 2009 | | 45,000 | | $ | 0.45 |
| | | | | |
| | 70,000 | | | |
| | | | | |
2011
: |
| | | | | | | |
| | | Number of Options | | Exercise Price |
| March 2, 2011 | | 130,000 |
| | $ | 0.74 |
|
| May 18, 2011 | | 2,205,500 |
| | $ | 1.19 |
|
| December 2, 2011 | | 105,000 |
| | $ | 1.28 |
|
| | | 2,440,500 |
| | |
The weighted average grant date fair value per share of options granted during the years ended December 31, 20092011, 2010 and 20082009 was $0.83, $0.38 and $0.33 and $0.53 respectively. TRANSGENOMIC, INC. AND SUBSIDIARIESNOTES TO CONSOLIDATED FINANCIAL STATEMENTS - Continued
Years Ended December 31, 2009 and 2008
The following summarizes all stock options outstanding at December 31, 2009:
| | | | | | | | |
Exercise Price Range | | Number of Options
Outstanding | | Remaining Weighted-Average
Contractual Life | | Weighted–
Average Exercise Price | | Number of Options
Exercisable |
$ 0.00—$ 1.30 | | 2,313,667 | | 6.9 years | | $ 0.76 | | 1,500,607 |
$ 1.31—$ 2.60 | | 318,333 | | 3.4 years | | $ 1.94 | | 318,333 |
$ 2.61—$ 3.90 | | 10,000 | | 2.8 years | | $ 2.90 | | 10,000 |
$ 5.21—$ 6.50 | | 448,000 | | 1.4 years | | $ 6.10 | | 448,000 |
$ 7.81—$ 9.10 | | 10,000 | | 1.4 years | | $ 9.00 | | 10,000 |
$ 9.11—$10.40 | | 84,500 | | 1.5 years | | $ 9.90 | | 84,500 |
$11.71—$13.00 | | 147,231 | | .3 years | | $12.85 | | 147,231 |
| | | | | | | | |
| | 3,331,731 | | | | | | 2,518,671 |
| | | | | | | | |
2011:
|
| | | | | | | | | | |
| Exercise Price Range | | Number of Options Outstanding | | Remaining Weighted-Average Contractual Life | | Weighted–Average Exercise Price | | Number of Options Exercisable |
| $ 0.00—$ 1.30 | | 3,934,167 |
| | 7.5 years | | $1.03 | | 1,893,212 |
|
| $ 1.31—$ 2.60 | | 223,333 |
| | 1.6 years | | $1.89 | | 223,333 |
|
| $ 5.21—$ 6.50 | | 7,000 |
| | .3 years | | $6.16 | | 7,000 |
|
| $ 9.11—$10.00 | | 7,500 |
| | .1 years | | $9.63 | | 7,500 |
|
| | | 4,172,000 |
| | | | | | 2,131,045 |
|
All stock options outstanding were issued to employees,
officers or outside directors.
The aggregate intrinsic value of stock options exercisable was less than $0.1$0.7 million at December 31, 2009.2011. The aggregate intrinsic value of stock options outstanding was $1.0 million at December 31, 2011. The aggregate intrinsic value of options exercised at
TRANSGENOMIC, INC. AND SUBSIDIARY
NOTES TO CONSOLIDATED FINANCIAL STATEMENTS—(Continued)
Years Ended December 31, 2011, 2010 and 2009
December 31, 2011 and December 31, 2010 was less than $0.1 million at December 31, 2009.in each year. No stock options were exercised in 2009.
N. FAIR VALUE
FASB guidance on fair value measurements, which defines fair value, establishes a framework for measuring fair value, and expands disclosures about fair value measurements for our financial assets and liabilities, as well as for other assets and liabilities that are carried at fair value on a recurring basis in our consolidated financial statements.
FASB guidance establishes a three-level fair value hierarchy based upon the assumptions (inputs) used to price assets or liabilities. The three levels of inputs used to measure fair value are as follows:
Level 1—Unadjusted quoted prices in active markets for identical assets or liabilities,
Level 2—Observable inputs other than those included in Level 1, such as quoted prices for similar assets and liabilities in active markets or quoted prices for identical assets or liabilities in inactive markets, and
Level 3—Unobservable inputs reflecting our own assumptions and best estimate of what inputs market participants would use in pricing the asset or liability.
Prior to November 2011, the preferred stock warrant liability and preferred stock conversion feature were recorded separately at fair value. We were required to record these instruments at fair value at each reporting date and changes were recorded as an adjustment to earnings. The gains or losses included in earnings are reported in other income (expense) in our Statement of Operations.
In November 2011, we entered into a transaction with the Third Security Investors, pursuant to an Agreement Regarding Preferred Stock (the “Amendment Agreement”), in which the investors agreed to (i) waive their rights to enforce the anti-dilution and redemption features of the Series A Preferred Stock and (ii) at the next annual shareholder meeting, vote to amend the Certificate of Designation to remove the anti-dilution and redemption features of the Series A Preferred Stock. In exchange, the Company issued shares of common stock to the investors having an aggregate market value of $0.3 million.
As a result of the Amendment Agreement, the value of the Series A Preferred Stock and Series A Warrants, including the Series A Preferred Stock conversion feature and Series A Warrant liability, were reclassified into shareholders equity as of the date of the Amendment Agreement.
The Series A Warrant liability and Series A Preferred Stock conversion feature are considered Level 3 financial instruments and were valued using the Black Scholes call option pricing formula, which approximates a binomial model for the preferred stock conversion feature. This method is among the most common and widely used valuation approaches for call options. The model relates an option's value to five variables: the current price of the underlying asset, the strike price of the option, the time to expiration or exercise of the option, a risk free interest rate, and the volatility of the underlying asset.
The following assumptions were used in the November 8, 2011 valuation of the Series A Preferred Stock conversion feature: the closing share price of our stock on November 8, 2011 discounted 15% due to the lack of marketability and liquidity, an exercise price of $0.39, expected term of 4.00 years, risk-free interest rate of 0.65% based on a linear interpolation of 3 year and 5 year U.S. Treasury rates and volatility of 50%.
The following assumptions were used in the November 8, 2011 valuation of the Series A Warrants: an exercise price of $2.32, expected term of 1.0 year, risk-free interest rate of 0.25% based on a 1 year U.S. Treasury and volatility of 50%.
TRANSGENOMIC, INC. AND SUBSIDIARY
NOTES TO CONSOLIDATED FINANCIAL STATEMENTS—(Continued)
Years Ended December 31, 2011, 2010 and 2009
During the year ended December 31, 2011, the changes in the fair value of the liabilities measured using significant unobservable inputs (Level 3) were comprised of the following:
|
| | | | | | | | | | | |
| | Dollars in Thousands |
| | For the year ended |
| | December 31, 2011 |
| | Preferred Stock Conversion Feature | | Preferred
Stock
Warrant
Liability | | Total |
| Beginning balance at January 1, 2011 | $ | 1,983 |
| | $ | 2,351 |
| | $ | 4,334 |
|
| Total gains or losses: | | | | | |
| Recognized in earnings | 5,317 |
| | 449 |
| | 5,766 |
|
| Balance as of November 8, 2011 | 7,300 |
| | 2,800 |
| | 10,100 |
|
| Reclassification to shareholders' equity due to Amendment Agreement | $ | (7,300 | ) | | $ | (2,800 | ) | | $ | (10,100 | ) |
| Balance as of December 31, 2011 | $ | — |
| | $ | — |
| | $ | — |
|
During 2011, we recorded expense associated with the Series A Preferred Stock and Series A Warrants of $6.1 million, which is due to the change in fair value of the preferred stock conversion feature of $5.8 million and the issuance of $0.3 million in common stock to the Third Security Investors.
During the year ended December 31, 20092010, the changes in the fair value of the liabilities measured using significant unobservable inputs (Level 3) were comprised of the following:
|
| | | | | | | | | | | |
| | Dollars in Thousands |
| | For the year ended |
| | December 31, 2010 |
| | Preferred Stock Conversion Feature | | Preferred
Stock
Warrant
Liability | | Total |
| Beginning balance at January 1, 2010 | $ | — |
| | $ | — |
| | $ | — |
|
| | | | | | |
| Issuance | 1,983 |
| | 2,351 |
| | 4,334 |
|
| Balance at December 31, 2010 | $ | 1,983 |
| | $ | 2,351 |
| | $ | 4,334 |
|
There were no purchases, sales, or settlements of Level 3 liabilities in the year ended December 31, 2011 and 2008.K.2010, respectively. The unrealized gains or losses of Level 3 liabilities are included in earnings are reported in other income (expense) in our Statement of Operations.
TRANSGENOMIC, INC. AND SUBSIDIARY
NOTES TO CONSOLIDATED FINANCIAL STATEMENTS—(Continued)
Years Ended December 31, 2011, 2010 and 2009
O. SELECTED QUARTERLY FINANCIAL DATA (UNAUDITED)
|
| | | | | | | | | | | | | | | |
| | In thousands except per share data |
| | March 31 | | June 30 | | September 30 | | December 31 |
| 2011 | | | | | | | |
| Net Sales | $ | 7,480 |
|
| $ | 7,667 |
|
| $ | 8,253 |
|
| $ | 8,571 |
|
| Gross Profit | 4,154 |
| | 4,555 |
| | 4,445 |
|
| 5,283 |
|
| Net Income (Loss) | (2,778 | ) | | (5,998 | ) | | (1,270 | ) | | 264 |
|
| Basic and diluted loss per common share | $ | (0.06 | ) | | $ | (0.13 | ) | | $ | (0.03 | ) | | $ | — |
|
| | | | | | | |
|
|
| 2010 | | | | | | | |
| Net Sales | $ | 5,442 |
| | $ | 5,095 |
| | $ | 4,419 |
| | $ | 5,092 |
|
| Gross Profit | 2,884 |
| | 2,487 |
| | 2,017 |
| | 2,376 |
|
| Net Loss | (324 | ) | | (1,146 | ) | | (898 | ) | | (767 | ) |
| Basic and diluted loss per common share | $ | (0.01 | ) | | $ | (0.02 | ) | | $ | (0.02 | ) | | $ | (0.01 | ) |
P. OPERATING SEGMENT AND GEOGRAPHIC INFORMATION
Our company’s chief
operating decision-maker
as defined in FAS 131, Disclosures about Segments of an Enterprise and Related Information, is the Chief Executive Officer, who regularly evaluates our performance based on net sales and gross profit. The preparation of this segment analysis
requiredrequires management to make estimates and assumptions around
expenseexpenses below the gross profit level. While we believe the segment information to be directionally correct, actual results could differ from the estimates and assumptions used in preparing this information.
We have three reportable operating segments, Clinical Laboratories, Pharmacogenomic Services and Diagnostic Tools. During the third quarter of 2011, we changed the manner in which we report segment results internally. Accordingly, segment results of the prior period have been reclassified to reflect these changes. Beginning with the third quarter of 2011 our company's chief operating decision-maker is now reviewing our business as having three segments. The change in segments was driven by our corporate strategy to advance personalized medicine through proprietary molecular technologies and world-class clinical and research services. These lines of business are complementary with the Pharmacogenomics Services driving innovation and leading to kit production in our Diagnostic Tools segment and new tests in our Clinical Laboratories.
The accounting policies of the segments are the same as the policies discussed in Footnote B – Summary of Significant Accounting Policies.
TRANSGENOMIC, INC. AND
SUBSIDIARIESSUBSIDIARY
NOTES TO CONSOLIDATED FINANCIAL
STATEMENTS - ContinuedSTATEMENTS—(Continued)
Years Ended December 31,
20092011, 2010 and
20082009
Segment information for the years ended December 31,
20092011, 2010 and
20082009 is as follows:
| | | | | | | | | | | | | | | | | | | | | | |
| | | Dollars in Thousands | |
| | | 2009 | | | 2008 | |
| | | Instrument
Business | | Lab
Services | | | Total | | | Instrument
Business | | Lab
Services | | | Total | |
Net Sales | | $ | 17,457 | | $ | 4,566 | | | $ | 22,023 | | | $ | 19,744 | | $ | 4,249 | | | $ | 23,993 | |
Gross Profit | | | 9,877 | | | 1,728 | | | | 11,605 | | | | 11,716 | | | 1,932 | | | | 13,648 | |
Net Income/(Loss) before Taxes | | | 395 | | | (2,273 | ) | | | (1,878 | ) | | | 411 | | | (693 | ) | | | (282 | ) |
Income Taxes | | | 42 | | | — | | | | 42 | | | | 213 | | | — | | | | 213 | |
| | | | | | | | | | | | | | | | | | | | | | |
Net Income/(Loss) | | $ | 353 | | $ | (2,273 | ) | | $ | (1,920 | ) | | $ | 198 | | $ | (693 | ) | | $ | (495 | ) |
| | | | | | | | | | | | | | | | | | | | | | |
Depreciation/Amortization | | | 450 | | | 296 | | | | 746 | | | | 566 | | | 206 | | | | 772 | |
Restructure | | | — | | | — | | | | — | | | | 110 | | | 8 | | | | 118 | |
Goodwill Impairment | | | — | | | — | | | | — | | | | 638 | | | — | | | | 638 | |
Interest Income | | | 11 | | | 4 | | | | 15 | | | | 61 | | | 13 | | | | 74 | |
Net Assets | | | 8,547 | | | 7,457 | | | | 16,004 | | | | 10,226 | | | 7,330 | | | | 17,556 | |
We have two reportable operating segments. Net sales by product were as follows:
| | | | | | |
| | | Dollars in Thousands |
| | | Years Ended December 31, |
| | | 2009 | | 2008 |
Instrument Related Business: | | | | | | |
Bioinstruments | | $ | 10,175 | | $ | 11,195 |
Bioconsumables | | | 7,282 | | | 8,549 |
| | | | | | |
| | | 17,457 | | | 19,744 |
Laboratory Services: | | | | | | |
Molecular Clinical Reference Laboratory | | | 3,541 | | | 2,870 |
Pharmacogenomics Research Services | | | 1,025 | | | 1,379 |
| | | | | | |
| | | 4,566 | | | 4,249 |
| | | | | | |
Total Net Sales | | $ | 22,023 | | $ | 23,993 |
| | | | | | |
|
| | | | | | | | | | | | | | | |
| | Dollars in Thousands |
| | 2011 |
| | Clinical Laboratories | | Pharmacogenomic Services | | Diagnostic
Tools | | Total |
| Net Sales | $ | 16,038 |
| | $ | 2,280 |
| | $ | 13,653 |
| | $ | 31,971 |
|
| Gross Profit | 9,478 |
| | 1,050 |
| | 7,909 |
| | 18,437 |
|
| Net Income (Loss) before Taxes | (11,016 | ) | | (354 | ) | | 1,633 |
| | (9,737 | ) |
| Income Tax Expense (Benefit) | — |
| | — |
| | 45 |
| | 45 |
|
| Net Income (Loss) | $ | (11,016 | ) | | $ | (354 | ) | | $ | 1,588 |
| | $ | (9,782 | ) |
| Depreciation/Amortization | 1,568 |
| | 242 |
| | 235 |
| | 2,045 |
|
| Restructure | 29 |
| | — |
| | 12 |
| | 41 |
|
| Interest Income (Expense) | (959 | ) | | — |
| | — |
| | (959 | ) |
| | December 31, 2011 |
| Total Assets | $ | 22,032 |
| | $ | 1,636 |
| | $ | 9,894 |
| | $ | 33,562 |
|
| Goodwill | 6,440 |
| | $ | — |
| | $ | — |
| | $ | 6,440 |
|
|
| | | | | | | | | | | | | | | |
| | Dollars in Thousands |
| | 2010 |
| | Clinical
Laboratories | | Pharmacogenomic
Services | | Diagnostic
Tools | | Total |
| Net Sales | $ | 3,606 |
| | $ | 1,373 |
| | $ | 15,069 |
| | $ | 20,048 |
|
| Gross Profit | 1,481 |
| | (43 | ) | | 8,326 |
| | 9,764 |
|
| Net Loss before Taxes | (1,829 | ) | | (696 | ) | | (459 | ) | | (2,984 | ) |
| Income Tax Expense (Benefit) | — |
| | — |
| | 150 |
| | 150 |
|
| Net Loss | $ | (1,829 | ) | | $ | (696 | ) | | $ | (609 | ) | | $ | (3,134 | ) |
| Depreciation/Amortization | 119 |
| | 186 |
| | 190 |
| | 495 |
|
| Restructure | 65 |
| | — |
| | 73 |
| | 138 |
|
| Interest Income (Expense) | (1 | ) | | — |
| | (3 | ) | | (4 | ) |
| | December 31, 2010 |
| Total Assets | $ | 22,945 |
| | $ | 1,686 |
| | $ | 7,396 |
| | $ | 32,027 |
|
| Goodwill | 6,275 |
| | $ | — |
| | $ | — |
| | $ | 6,275 |
|
|
| | | | | | | | | | | | | | | |
| | Dollars in Thousands |
| | 2009 |
| | Clinical
Laboratories | | Pharmacogenomic
Services | | Diagnostic
Tools | | Total |
| Net Sales | $ | 3,541 |
| | $ | 1,025 |
| | $ | 17,457 |
| | $ | 22,023 |
|
| Gross Profit | 1,523 |
| | 205 |
| | 9,877 |
| | 11,605 |
|
| Net Loss before Taxes | (1,763 | ) | | (510 | ) | | 395 |
| | (1,878 | ) |
| Income Tax Expense (Benefit) | — |
| | — |
| | 42 |
| | 42 |
|
| Net Loss | $ | (1,763 | ) | | $ | (510 | ) | | $ | 353 |
| | $ | (1,920 | ) |
| Depreciation/Amortization | 146 |
| | 151 |
| | 450 |
| | 747 |
|
| Restructure | — |
| | — |
| | — |
| | — |
|
| Interest Income (Expense) | 4 |
| | — |
| | 11 |
| | 15 |
|
| | December 31, 2009 |
| Total Assets | $ | 6,796 |
| | $ | 661 |
| | $ | 8,547 |
| | $ | 16,004 |
|
TRANSGENOMIC, INC. AND
SUBSIDIARIESSUBSIDIARY
NOTES TO CONSOLIDATED FINANCIAL
STATEMENTS - ContinuedSTATEMENTS—(Continued)
Years Ended December 31,
20092011, 2010 and
2008Net cost of goods sold were as follows:
| | | | | | |
| | | Dollars in Thousands |
| | | Years Ended December 31, |
| | | 2009 | | 2008 |
Instrument Related Business: | | | | | | |
Bioinstruments | | $ | 3,801 | | $ | 4,046 |
Bioconsumables | | | 3,779 | | | 3,982 |
| | | | | | |
| | | 7,580 | | | 8,028 |
Laboratory Services: | | | | | | |
Molecular Clinical Reference Laboratory | | | 2,018 | | | 1,647 |
Pharmacogenomics Research Services | | | 820 | | | 670 |
| | | | | | |
| | | 2,838 | | | 2,317 |
| | | | | | |
Total Cost of Goods Sold | | $ | 10,418 | | $ | 10,345 |
| | | | | | |
2009
Net sales for the year ended December 31,
2011, 2010 and 2009 by country were as follows:
| | | | | | |
| | | Dollars in Thousands |
| | | Years Ended December 31, |
| | | 2009 | | 2008 |
United States | | $ | 8,777 | | $ | 9,399 |
Italy | | | 3,683 | | | 2,913 |
France | | | 1,545 | | | 2,393 |
Netherlands | | | 1,464 | | | 584 |
Germany | | | 1,383 | | | 1,770 |
United Kingdom | | | 842 | | | 1,290 |
All Other Countries | | | 4,329 | | | 5,644 |
| | | | | | |
Total | | $ | 22,023 | | $ | 23,993 |
| | | | | | |
|
| | | | | | | | | | | | | |
| | | | Dollars in Thousands |
| | | | Years ended December 31, |
| | | | 2011 | | 2010 | | 2009 |
| United States | | | $ | 22,626 |
| | $ | 8,729 |
| | $ | 8,777 |
|
| Italy | | | 3,152 |
| | 3,294 |
| | 3,683 |
|
| United Kingdom | | | 778 |
| | 1,412 |
| | 842 |
|
| Germany | | | 750 |
| | 1,366 |
| | 1,383 |
|
| France | | | 758 |
| | 1,160 |
| | 1,545 |
|
| Netherlands | | | 97 |
| | 56 |
| | 1,464 |
|
| All Other Countries | | | 3,810 |
| | 4,031 |
| | 4,329 |
|
| Total | | | $ | 31,971 |
| | $ | 20,048 |
| | $ | 22,023 |
|
No other country accounted for more than 5% of total net sales.
No customer accounted for more
More than
10% of consolidated net sales during the years ended December 31, 2009 and 2008. For the year ended December 31, 2009 one customer made up 20% of the Laboratory Services net sales. For the year ended December 31, 2008 four customers each made up more than 10% of the Laboratory Services net sales and combined they represent 56% of the Laboratory Services net sales.Approximately 80%95% of our long-lived assets are located within the United States. Substantially all of the remaining long-lived assets are located within Europe.
Q. RELATED PARTY AND SUBSEQUENT EVENTS
On December 29, 2010, the Company issued 2,586,205 shares of Series A Preferred Stock that were not registered under the Securities Act of 1933 (the “Securities Act”). The issuance of such Series A Preferred Stock was related to the financing for the Company's acquisition of assets from PGxHealth. Please refer to the Series A Convertible Preferred Stock Purchase Agreement with the Third Security Investors dated December 29, 2010.
On November 8, 2011, the Company entered into an Amendment Agreement with the Third Security Investors, which are the holders of all of the outstanding shares of the Company's Series A Preferred Stock. Pursuant to the Amendment Agreement, the Third Security Investors and the Company agreed to amend the Certificate of Designation to eliminate certain features of the Series A Preferred Stock relating to (i) an anti-dilution adjustment to the conversion rate upon which the Series A Preferred Stock is convertible into the Company's common stock and (ii) an optional redemption of the Series A Preferred Stock by the Third Security Investors (the “Certificate Amendment”); subject to the requisite stockholder approval of the Certificate Amendment at the Company's next annual meeting of its stockholders. Pursuant to the Amendment Agreement, the Third Security Investors agreed to vote the Series A Preferred Stock and their common stock in favor of the Certificate Amendment and agreed to waive their rights to the features of the Series A Preferred Stock being eliminated by the Certificate Amendment. In exchange for the Third Security Investors entering into the Amendment Agreement, the Company agreed to issue to the holders an aggregate of $0.3 million market value of common stock or 245,903 shares of common stock.
On December 30, 2011, the Company entered into a Convertible Promissory Note Purchase Agreement (the “Note Purchase Agreement”) with the Third Security Investors in the aggregate amount of $3.0 million. The Third Security Investors currently own all the outstanding shares of the Company's Series A Preferred Stock. Under the Note Purchase Agreement, the Company sold to each of the Third Security Investors a convertible note which matures on March 31, 2012. The Note Purchase Agreement and notes provide for conversion of any amount remaining due to the Third Security Investors under the notes into equity securities of the Company of the same class(es) or series and at the same price as the equity securities of the Company sold in the Company's first sale or issuance of its equity securities after December 30, 2011, in the aggregate amount of at least $3.0 million. The notes and the equity securities into which the notes are convertible have not been registered under the Securities Act and applicable state securities laws, but have been offered and sold in the United States pursuant to applicable exemptions from registration requirements under the Securities Act and applicable state securities laws.
On February 2, 2012, the Company entered into a Securities Purchase Agreement with certain institutional and other accredited investors pursuant to which the Company: (i) sold to the investors an aggregate of 19,000,000 shares of the Company's common stock at a price per share of $1.00 for aggregate gross proceeds of approximately $19.0 million; and (ii) issued to the investors warrants to purchase up to an aggregate of 9,500,000 shares of common stock with an exercise price of $1.25 per share. The warrants may be exercised, in whole or in part, at any time from February 7, 2012 until February 7, 2017 and contain both cash and “cashless exercise” features. The warrants also impose penalties on the Company for failure to deliver the shares of
TRANSGENOMIC, INC. AND
SUBSIDIARIESSUBSIDIARY
NOTES TO CONSOLIDATED FINANCIAL
STATEMENTS - ContinuedSTATEMENTS—(Continued)
Years Ended December 31,
20092011, 2010 and
2008K. SUBSEQUENT EVENTS
Events2009
common stock issuable upon exercise. The Company currently intends to use the net proceeds from the offering for general corporate and working capital purposes, primarily to accelerate development of several of the company's key initiatives.
As part of the offering, in connection with the conversion of certain convertible promissory notes in the aggregate amount of $3.0 million issued by the Company on December 30, 2011 to Third Security Investors, the Third Security Investors collectively received 3,000,000 shares of common stock and warrants to purchase up to 1,500,000 shares of common stock upon the same terms as the investors.
The Registration Rights Agreement requires the Company to file an initial registration statement on Form S-1 with the SEC on or transactionsbefore March 23, 2012. If the initial registration statement is not filed with the SEC on or before March 23, 2012 the Company shall pay to each holder an amount in cash, as liquidated damages, equal to 1.5% of the aggregate purchase price paid by such holder and again on each 30 day anniversary that occur afterthe deadline is not met. In no event shall the aggregate amount of liquidated damages payable to a holder exceed 10% of the purchase price.
The following pro-forma balance sheet does not contemplate the impact of the valuation of the preferred stock warrants.
The following table set forth a summary of the balance sheet date, but beforeas reported and pro-forma as if the private placement financing had occurred on December 31, 2011:
|
| | | | | | |
| | Actual | | Pro-Forma |
| | Dollars in Thousands |
| | December 31, 2011 | | December 31, 2011 |
|
| Total Assets | $33,562 | | $51,129 |
| Total Liabilities | 22,514 |
| | 19,514 |
|
| Total Stockholders' Equity | 11,048 |
| | 31,615 |
|
| | $ | 33,562 |
| | 51,129 |
|
Effective June 30, 2010, we entered into a letter agreement with CFO Systems, LLC and Brett L. Frevert. Under the letter agreement CFO Systems will provide financial
statements are complete, are reviewedand consulting services to
determine if they should be recognized.us at rates of $75 to $150 per hour depending on the level of expertise involved. The services will include providing Chief Financial Officer duties and other financial and accounting expertise on a time share basis. CFO Systems, LLC or the Company may terminate the agreement upon thirty days written notification. In connection with the letter agreement, Mr. Frevert agreed to serve as our Chief Financial Officer. We
have no material subsequent events to be disclosed.were charged $405,763 and $126, 459 for the services provided by CFO Systems, LLC during 2011 and 2010, respectively.
|
| |
| Item 9. | Changes in and Disagreements with Accountants on Accounting and Financial Disclosures. |
|
| |
Item 9A(T).9A. | Controls and Procedures. |
(a) Evaluation of Disclosure Controls and Procedures As of the end of the period covered by this Annual Report, management performed, with the participation of our Chief Executive Officer and Chief Financial Officer, an evaluation of the effectiveness of our disclosure controls and procedures as defined in Rules 13a-15(e) and 15d-15(e) of the Exchange Act. Our disclosure controls and procedures are designed to provide reasonable assurance that information required to be disclosed in the reportreports we file or submit under the Exchange Act is recorded, processed, summarized, and reported within the time periods specified in the SEC’s rules and forms, and that such information is accumulated and communicated to our management including our Chief Executive Officer and our Chief Financial Officer, to allow timely decisions regarding required disclosures. Based on the evaluation, the Company’s Chief Executive Officer and our Chief Financial Officer concluded that, as of December 31, 2009, Transgenomic’s2011, the Company's disclosure controls and procedures were effective. (b) Management’s Report on Internal Control Over Financial ReportingManagement
Our management is responsible for establishing and maintaining an adequate system of internal control over financial reporting. Our system of internal control over financial reporting as defined in Rules 13a-15(f) and 15d-15(f) of the Exchange Act. Internal control over financial reporting is a process designed to provide reasonable assurance regarding the reliability of financial reporting and the preparation of financial statements for external purposes in accordance with GAAP. accounting principles generally accepted in the United States of America.
Our internal control over financial reporting includes those policies and procedures that:
pertain to the maintenance of records that, in reasonable detail, accurately and fairly reflect our transactions and dispositions of our assets;
provide reasonable assurance that our transactions are recorded as necessary to permit preparation of our financial statements in accordance with accounting principles generally accepted in the United States of America, and that our receipts and expenditures are being made only in accordance with authorizations of our management and our directors; and
provide reasonable assurance regarding prevention or timely detection of unauthorized acquisition, use, or disposition of our assets that could have a material effect on the financial statements.
Because of its inherent limitations,
a system of internal control over financial reporting
can provide only reasonable assurance and may not prevent or detect misstatements.
Also, projection of any evaluation of effectiveness to future periods is subject to the risk that controls may become inadequateFurther, because of changes in conditions,
or that the degreeeffectiveness of
compliance with the policies or proceduresinternal controls over financial reporting may
deteriorate.vary over time. Our system contains self-monitoring mechanisms, and actions are taken to correct deficiencies as they are identified.
Management has conducted, with the participation of our Chief Executive Officer and our Chief Financial Officer, an assessment, including testing of the effectiveness of our internal control over financial reporting as of December 31, 2009.2011. Management’s assessment of internal control over financial reporting was conducted using the criteria inInternal Control—Integrated Framework issued by the Committee of Sponsoring Organizations of the Treadway Commission (“COSO”). Based on that assessment, Managementmanagement has concluded that the Company’s internal control over financial reporting was effective as of December 31, 2009.2011.This Annual Report does not include
McGladrey & Pullen, LLP, an attestation report of Transgenomic’sindependent registered public accounting firm, regarding internal control overhas audited the Company's financial reporting. Management’sstatements included in this report was not subject to attestation byon Form 10-K and issued its report on the Company’s registered public accounting firm pursuant to temporary ruleseffectiveness of the Securities and Exchange Commission that permit the Company to provide only management’s report in this Annual Report.(c) Remediation of Material Weaknesses in Internal Control Over Financial Reporting
In Item 9A of our Annual Report on Form 10K for the fiscal year ended December 31, 2008, management reported a material weakness in its internal control over financial reporting:
Management’s evaluation of the design and operating effectiveness of our internal controls over financial reporting identified a material weakness resulting from the combination of more than one significant deficiency. Based on this evaluation, our Chief Executive Officer and Chief Financial Officer concluded that, because of the material weakness in our internal control over financial reporting, ourCompany's internal control over financial reporting as defined rule 13a-15(f) was not effective. Policies and procedures that were not formally documented, lack of segregation of duties, access authorization to our computer systems and financial reporting all were areas that were assessed as having a significant deficiency. A “material weakness”
December 31, 2011, which is defined as a significant deficiency or combination of significant deficiencies, that results in more than a remote likelihood that a material misstatement of the annual or interim financial statements will not be prevented or detected on a timely basis.Management’s remediation plan to address the material weakness described above was substantially completed in 2009 and included the following steps taken to strengthen internal control over financial reporting:
| herein. (c) · | | We have strengthened both the design, and our evaluation of the operating effectiveness of internal controls.
|
| · | | We have documented formal security and business policies and procedures.
|
| · | | We have reviewed the functions of the employees in the accounting department to determine the cost benefit associated with proper segregation of duties. Certain functions were re-aligned, and additional review and approval procedures were implemented to mitigate remaining segregation of duties conflicts.
|
| · | | We have developed standard procedures for granting user access to our computer system.
|
| · | | We have developed additional procedures to ensure proper financial reporting, including additional review steps by senior financial management during our period end financial close process.
|
(d) Changes in internal control over financial reporting
Other than the remediation actions noted above, there
There have been no changes in internal control over financial reporting that occurred during the quarter ended December 31, 20092011 that have materially affected, or are reasonably likely to materially affect, Transgenomic’sthe Company's internal control over financial reporting.
|
| |
| Item 9B. | Other Information. |
|
| |
| Item 10. | Directors, Executive Officers and Corporate Governance. |
Information relating
Our Board of Directors
Our Board of Directors (“Board”) consists of five directors. The Board of Directors is divided into three classes with directors in each class serving for a term of three years. The terms of office of the current Class I, Class II and Class III directors will expire in 2013, 2014 and 2012, respectively. The holders of our Preferred Stock (the "Preferred Stockholders") are entitled, as a separate voting group, to elect two (2) of the five directors (“Preferred Stock Directors”). The common stockholders are entitled, as a separate voting group, to elect the three (3) remaining directors (“Common Stock Directors”). There is one Common Stock Director in each class of directors. There is one Preferred Stock Director in each of Class I and Class II, but not a Preferred Stock Director in Class III.
Robert M. Patzig is the current Preferred Stock Director in the Class I directors and Doit L. Koppler II is the current Preferred Stock Director in the Class II directors.
Our Class III director, Rodney S. Markin, M.D., Ph.D, is nominated and standing for election at our upcoming 2012 Annual Meeting of Stockholders.
Certain biographical information regarding our directors, including their ages and dates that they were first elected to our Board, is set forth below. In each individual's biography we have highlighted specific experience, qualifications, and skills that led the Board to conclude that each individual should serve as a director of our Board. In addition to these specific attributes, all of our directors have significant expertise in one or more areas of importance to our business and have high-level managerial experience in relatively complex organizations or are accustomed to dealing with complex problems. We believe all of our directors are individuals of high character and integrity, are able to work well with others, and have sufficient time to devote to the affairs of our company.
|
| | | | | | | | |
| Name | | Age | | Principal Occupation | | Director Since | | Term to Expire |
| | | | | | | | | |
| CLASS I DIRECTORS |
| Robert M. Patzig, Preferred Stock Director | | 43 | | Senior Managing Director and Chief Investment Officer, Third Security, LLC | | 2010 | | 2013 |
| | | | | | | | | |
| Craig J. Tuttle, Common Stock Director | | 59 | | President and Chief Executive Officer of Transgenomic, Inc. | | 1997 | | 2013 |
| | | | | | | | | |
| CLASS II DIRECTORS |
| Doit L. Koppler II, Preferred Stock Director | | 48 | | Managing Director and Treasurer, Third Security, LLC | | 2010 | | 2014 |
| | | | | | | | | |
| Antonius P Schuh, Ph.D, Common Stock Director | | 48 | | Chief Executive Officer of Sorrento Therapeutics, Inc. | | 2009 | | 2014 |
| | | | | | | | | |
| CLASS III DIRECTORS |
| Rodney S. Markin, M.D., Ph.D, Common Stock Director | | 55 | | Chairman of the Board, Transgenomic, President of University of Nebraska Medical Center Physicians | | 2007 | | 2015 |
Robert M. Patzig. Mr. Patzig joined Third Security upon the company's inception in 1998. Mr. Patzig's responsibilities include identifying and researching investment opportunities for Third Security and its funds, securities valuation and portfolio management. Mr. Patzig is a Director of the Virginia Biotechnology Association, a non-profit industry advocacy group, and a member of the Virginia Tech English Department Distinguished Alumni. Mr. Patzig has served as Chairman of the Board of Intrexon Corporation and Cyntellect, Inc. and served as a member of the Board of Directors of Synchrony, Inc. Mr. Patzig served as the head of the Investment Committee for Howe and Rusling, Inc., a registered investment advisor, from 2001 until its sale in 2006. Mr. Patzig served as the Chief Executive Officer and Chief Compliance Officer of New River Advisors LLC from June of 2003 until August of 2007. Prior to the formation of Third Security, Mr. Patzig served as Director of Market Research and Analysis at GIV Holdings, Inc. and Director of Research Services at General Injectables & Vaccines, Inc. Mr. Patzig received a B.A. in Philosophy and English from Virginia Tech.The Board select Mr. Patzig as a director because of his substantial biotech industry experience as well as his securities and investment expertise.
Craig J. Tuttle. Mr. Tuttle has served as our President and Chief Executive Officer since 2006. From 2004 to 2005, Mr. Tuttle was President and Chief Operating Officer of Duke Scientific. From 1999 to 2003, Mr. Tuttle served as President and Chief Executive Officer of Applied Biotech, Inc. The Board selected Mr. Tuttle to serve as a director because he is the Company's Chief Executive Officer. He has expansive knowledge and experience in the biotech industry, as well as relationships with chief
executives and other senior management at biotech companies.
Doit L. Koppler, II. Mr. Koppler joined Third Security in 2001 and manages the finance function of Third Security and is involved with several portfolio companies of Third Security's managed investment funds. Mr. Koppler currently serves as Vice President, Treasurer and a member of the Board of Directors of Vital Diagnostics Holding Corp., a global supplier of products and services for the clinical laboratory in the traditional in vitro diagnostics market with a focus on the physician's office, hospital and small-to-medium sized laboratory segments. Mr. Koppler served as Chairman and Chief Executive Officer of New River Funds, a family of no-load mutual funds, from its inception in 2003 through 2008 and as the Chief Investment Officer of New River Advisers, LLC, the investment adviser to New River Small Cap Fund, predecessor to Southern Sun Small Cap Fund. Mr. Koppler served as a member of the Board of Directors of IntelliMat, Inc. from November 2006 to July 2008. Prior to joining Third Security, Mr. Koppler served as Vice President and Controller of General Injectables & Vaccines, Inc., a $120 million distributor of injectable biologics and vaccines primarily to outpatient physician offices, from 1992-2000. From 1987-1992, he was a Manager in the audit practice of Ernst & Young LLP. Mr. Koppler is a Certified Public Accountant and a Member of the American Institute of Certified Public Accountants. He has also held Series 7 and Series 66 securities registrations. Mr. Koppler received a B.S. in Accounting from Salem International University. The Board selected Mr. Koppler to serve as a director because of his valuable financial expertise, including his public accounting and financial reporting experience.
Antonius P. Schuh, Ph.D. Dr. Schuh co-founded Sorrento Therapeutics, Inc. (NASDAQ: SRNE) in January 2006 and has served as its Chairman since such time and as its Chief Executive Officer since November 2008. From April 2006 to September 2008 Dr. Schuh served as CEO of AviaraDx, Inc. (now bioTheranostics, Inc., a bioMerieux Company). From March 2005 to April 2006 Dr. Schuh was CEO of Arcturus Bioscience, Inc. As of January 23, 2012, Dr. Schuh also serves as a director of TrovaGene, Inc. (PK: TROV), a molecular diagnostics company. In addition, Dr. Schuh was a director of Sequenom, Inc. (NASDAQ: SQNM) from May 2000 to February 2005. The Board selected Dr. Schuh to serve as a director because it believes he possesses valuable biotech experience and extensive executive management experience in the industry which brings a unique and valuable perspective to the Board.
Rodney S. Markin, M.D., Ph.D. Dr. Markin is Professor of Pathology and Microbiology and Surgery, Senior Associate Dean for Clinical Affairs, College of Medicine at the University of Nebraska Medical Center and Chairman and President of UNMC Physicians (the UNMC medical practice). Dr. Markin is also a director of Nebraska Surgical Solutions, Inc. The Board selected Dr. Markin to serve as a director because he has valuable executive experience in the healthcare business. Dr. Markin also has extensive experience serving on other boards. His ability to communicate and encourage discussion makes him an effective Chairman for the Board.
Our Executive Officers
The following provides certain biographical information regarding our executive officers, including their ages and dates that they first joined our Company; provided that information regarding Craig
J. Tuttle, our President and Chief Executive Officer,
who is also a director, and other information related to corporate governance, required by this item is incorporated by reference to the Proxy Statement for the Company’s 2010 Annual Meeting of Stockholders (the “Proxy Statement”) under the caption “Board of Directors and Committees.” Information regarding our other executive officers who are not directors is set forth
below.Debra A Schneider. Ms. Schneider, age 51, joined Transgenomic Inc. in December, 2006 and currently serves as Vice President and Chief Financial Officer. She also is its Secretary and Treasurer. Prior to joining Transgenomic, Ms. Schneider spent seventeen years at First Data Corporation in a numberthe section above entitled “Our Board of roles, including finance, planning, accounting and Chief Financial Officer roles for various business units. Most recently, she served as Senior Vice President of Finance. Prior to her tenure at First Data Corporation, she worked as Controller at Creative Financing, Inc. and as an accountant with KPMG LLP.
Directors.”
Eric Kaldjian, M.D. Dr. Kaldjian, age 48, joined Transgenomic in December 2007 as Chief Scientific Officer. Dr. Kaldjian earned his MD and residency training in pathology at the University of Michigan before his fellowship training at the national Cancer Institute, NIH. His experience includes a broad range of responsibilities in pharmaceutical research in drug discovery, toxicology, and exploratory and full clinical development at Pfizer, Parke-Davis and Hoffman-LaRoche, where he participated in successful filings of oncology and transplant drugs. Immediately prior to Transgenomic, Dr. Kaldjian served as Executive Director, Medical Sciences at Gene Logic, Inc., directing programs that included clinical genomics, biomarkers and molecular diagnostics development. He is board certified in Anatomic Pathology.Chad Richards. Mr. Richards, age 40,42, joined Transgenomicthe Company in October 2007 as Senior Vice President, Sales and Marketing.Marketing and was promoted to Chief Commercial Officer in January 2011. Before joining Transgenomic,the Company, Mr. Richards was the National Sales Director for Anatomic Pathology with Quest Diagnostics. During his career with Quest Diagnostics, Mr. Richards held a variety of sales management roles in both their physician and hospital business segments. Before joining Quest Diagnostics, Mr. Richards held different marketing and sales management roles with Roche Diagnostics Ventana Medical Systems Division, one of the world’sworld's leading developers and manufacturers of immunohistochemistry and in-situ hybridization instruments and reagent systems. Before embarking on a career in diagnostics, Mr. Richards served in the United States Marine Corps.
Item 11. | Executive Compensation. |
Certain information required
Brett Frevert. Mr. Frevert, age 49, was appointed as our Chief Financial Officer by this Item is incorporated by referencethe Board of Directors on June 28, 2010. Mr. Frevert's serves as Chief Financial Officer pursuant to the terms a letter agreement with CFO Systems, LLC (“CFO Systems”) and Brett L. Frevert. Under the letter agreement CFO Systems provides financial and consulting services to us. Since 2004 Mr. Frevert has been Managing Director of CFO Systems, which he founded in 2004. During that time he has served as CFO of several Midwestern companies, including SEC registrants and private companies. Prior to founding CFO Systems, Mr. Frevert was CFO of a regional real estate firm and also served as Interim CFO of First Data Europe. Mr. Frevert began his career with Deloitte & Touche, serving primarily SEC clients in the food and insurance industries.
There is no family relationship between any of the directors or executive officers and any other director or executive officer of the Company.
Business Ethics Policy
Our Board of Directors has adopted a code of ethical conduct that applies to our principal executive officer, principal financial officer and senior financial officers. This code of ethical conduct is embodied within our Business Ethics Policy, which applies to all persons associated with the Company, including our directors, officers, and employees (including our principal executive officer, principal financial officer, principal accounting officer and controller). The Business Ethics Policy is available in the investor relations section of our website at www.transgenomic.com. We will disclose amendments to, or waivers of, certain provisions of our Business Ethics Policy relating to our chief executive officer, chief financial officer, chief accounting officer, controller or persons performing similar functions on our website promptly following the adoption of any such amendment or waiver.
Corporate Governance
Board Leadership Structure
Our Board has determined that having an independent director serve as the Chairman of the Board is in the best interests of our stockholders. Our Chairman of the Board is Rodney S. Markin, Ph.D. Our President and CEO, Mr. Tuttle, is the only member of our Board who is not an independent director. We believe that this leadership structure enhances the accountability of our President and CEO to the Board and strengthens the Board's independence from management. While both leaders are actively engaged on significant matters affecting the Company, such as long-term strategy, we believe splitting these leadership positions enables Mr. Tuttle to focus his efforts on running our business and managing the Company while permitting Dr. Markin to focus more on the governance of the Company, including oversight of our Board.
Director Attendance at Meetings.
Our Board conducts its business through meetings of the Board, both in person and telephonic, and actions taken by written consent in lieu of meetings. During the year ended December 31, 2011, the Board of Directors held six meetings and acted by written consent in lieu of a meeting three times. All directors attended at least 75% of the meetings of the Board of Directors and of the committees of the Board of Directors on which they served during 2011.
Our Board strongly encourages all directors to attend our annual meetings of stockholders unless it is not reasonably practicable for a director to do so. All of the directors serving as of May 18, 2011 attended our 2011 Annual Meeting of Stockholders.
Committees of our Board of Directors
Our Board has established and delegated certain responsibilities to its standing Audit Committee and a Compensation Committee. We do not have a standing nominating committee.
Audit Committee.
We have a separately designated Audit Committee established in accordance with Section 3(a)(58)(A) of the Exchange Act. The Audit Committee's primary duties and responsibilities include monitoring the integrity of our financial statements, monitoring the independence and performance of our external auditors, and monitoring our compliance with applicable legal and regulatory requirements. The functions of the Audit Committee also include reviewing periodically with independent auditors the performance of the services for which they are engaged, including reviewing the scope of the annual audit and its results, reviewing with management and the auditors the adequacy of our internal accounting controls, reviewing with management and the auditors the financial results prior to the filing of quarterly and annual reports, reviewing fees charged by our independent auditors and reviewing any transactions between the Company and related parties. Our independent auditors report directly and are accountable solely to the Audit Committee. The Audit Committee has the sole authority to hire and fire the independent auditors and is responsible for the oversight of the performance of their duties, including ensuring the independence of the independent auditors. The Audit Committee also approves in advance the retention of, and all fees to be paid to, the independent auditors. The rendering of any auditing services and all non-auditing services by the independent auditors is subject to the approval in advance of the Audit Committee.
The Audit Committee operates under a written charter which is available on our website at www.transgenomic.com. The Audit Committee is required to be composed of directors who are independent of the Company under the rules of the SEC and the NASDAQ listing standards.
The current members of the Audit Committee are directors Dr. Markin and Dr. Schuh each of whom has been determined by the Board of Directors to be independent under the rules adopted by the SEC and NASDAQ listing standards. The Board of Directors has determined that Dr. Markin qualifies as an “audit committee financial expert” under the rules adopted by the SEC and the Sarbanes Oxley Act of 2002. The Audit Committee met four times during 2011.
Compensation Committee.
The Compensation Committee reviews and approves our compensation policy, changes in salary levels and bonus payments to our executive officers and other management and determines the timing and terms of equity awards under our equity incentive plans. The Compensation Committee operates under a written charter which is available on our website at www.transgenomic.com.
The Compensation Committee currently consists of directors Dr. Schuh, Dr. Markin and Mr. Patzig each of whom has been determined by the Board of Directors to be independent under the NASDAQ listing standards. The Compensation Committee met four times during 2011.
Oversight of Risk Management.
Risk is inherent with every business, and how well a business manages risk can ultimately determine its success. We face a number of risks, including economic risks, financial risks, legal and regulatory risks, and others, such as the impact of competition. Management is responsible for the day-to-day management of the risks that we face, while the Board, as a whole and through its committees, has responsibility for the oversight of risk management. In its risk oversight role, our Board is responsible for satisfying itself that the risk management processes designed and implemented by management are adequate and functioning as designed. Our Board assesses major risks facing the Company and options for their mitigation in order to promote its stockholders' interests in the long-term health and the overall success of the Company and its financial strength. A fundamental part of risk management is not only understanding the risks a company faces and what steps management is taking to manage those risks, but also understanding what level of risk is appropriate for the Company. The involvement of our full Board in the risk oversight process allows our Board to assess management's appetite for risk and also determine what constitutes an appropriate level of risk for the Company. Our Board regularly includes agenda items at its meetings relating to its risk oversight role and meets with various members of management on a range of topics, including corporate governance and regulatory obligations, operations and significant transactions, risk management, insurance, pending and threatened litigation and significant commercial disputes.
While our Board is ultimately responsible for risk oversight, various committees of the Board oversee risk management in their respective areas and regularly report on their activities to our entire Board. In particular, the Audit Committee has the primary responsibility for the oversight of financial risks facing the Company. The Audit Committee's charter provides that it will discuss our major financial risk exposures and the steps we have taken to monitor and control such exposures. The Board has also delegated primary responsibility of the oversight of all executive compensation and the Company's employee benefit programs to the Compensation Committee. The Compensation Committee strives to create incentives that encourage a level of risk-taking behavior consistent with the Company's business strategy.
We believe the division of risk management responsibilities described above is an effective approach for addressing the risks facing the Company and that our Board leadership structure provides appropriate checks and balances against undue risk taking.
Section 16(a) Beneficial Ownership Reporting Compliance
Section 16(a) of the Exchange Act and the rules of the SEC require our directors, certain officers and beneficial owners of more than 10% of our outstanding common stock to file reports of their ownership and changes in ownership of our common stock with the SEC. We believe all Section 16 reports were filed in a timely manner during 2011, except that one Form 4 to report option grants made on May 18, 2011 was not filed timely by Mr. Tuttle, Mr. Richards and Mr. Frevert each.
|
| |
| Item 11. | Executive Compensation. |
COMPENSATION DISCUSSION AND ANALYSIS
Our compensation philosophy is designed to support our key objective of creating value for our stockholders by growing our revenues, growing our earnings, increasing our total market capitalization and growing our share price.
This Compensation Discussion and Analysis explains our compensation objectives, policies and practices with respect to Craig Tuttle, President and Chief Executive Officer; Brett Frevert, Chief Financial Officer, and Chad Richards, Chief Commercial Officer, whom are collectively referred to as the "named executive officers" or, in this “Compensation Discussion and Analysis” section, our executives.
Objectives of Our Executive Compensation Programs
Our compensation programs for our named executive officers are designed to achieve the following objectives:
• attract and retain high performing and experienced executives;
• motivate and reward executives whose knowledge, skills and performance are critical to our success;
align the interests of our executives and stockholders by motivating executives to increase stockholder value and rewarding executives when stockholder value increases;
• foster a shared commitment among executives by coordinating their goals;
motivate our executives to manage our business to meet our short and long-term objectives, and reward them for meeting these objectives.
Role of our Compensation Committee
We have a Compensation Committee that has the primary purpose of providing oversight of all executive compensation and the Company's employee benefit programs. The Compensation Committee's responsibilities include, but are not limited to, the direct responsibility for the following:
Review and approve corporate goals and objectives relevant to CEO and other executive officers' compensation, evaluate performance in light of these goals and objectives, and determine and approve the compensation level for the CEO and other executive officers based on this evaluation.
Make recommendations to the Board of Directors with respect to incentive-compensation plans and equity-based plans.
Adoption of stock option and other long-term incentive plans and approval of individual grants and awards.
Adoption of executive annual incentive plans and approval of total incentive payments and individual awards to the President, CEO and other executive officers.
Adoption of benefit plans, including profit sharing and supplemental retirements plans.
Adoption of executive perquisite programs.
Annual evaluation and appraisal of President and CEO performance.
Approval of all employment agreements for President, CEO and other executives.
Annual review of non-employee Director compensation programs and recommendation of changes to the Board of Directors when appropriate.
Our Chief Executive Officer makes recommendations to our Compensation Committee regarding the compensation of all executive officers, excluding his own, but our Compensation Committee is ultimately responsible for approving this compensation.
Role of Our CEO and Executive Management
Our CEO annually evaluates the performance of each executive and, based on that review, may recommend changes in the executive's compensation to the Compensation Committee. This review includes a performance appraisal that takes into consideration various factors, including, without limitation, the following:
|
| | |
| • | the ability of the executive to drive results for the Company; |
| | |
| • | the executive's understanding of the Company's business and his/her organizational savvy; |
| | |
| • | the ability of the executive to make complex decisions and his/her strategic abilities; |
| | |
| • | the executive's ability to manage work process; |
| | |
| • | the communication skills of the executive; and |
| | |
| • | the executive's ability to manage diversity and ethics. |
The CEO's review also includes a determination of each executive's leadership attributes along with other key accomplishments during the review period. Our Company is an evolving company, and executives' roles and scope of work, and the size and geographical diversity of the groups they manage are subject to change. As an executive's role changes, our CEO may recommend changes to the executive's compensation to the Compensation Committee.
The CEO's compensation recommendations may include changes in base salary and incentive bonus, additional equity grants or modifications to standard vesting schedules that are deemed to be in the best interest of the Company.
Peer Group Information and Benchmarking
In connection with compensation decisions in 2011, our Compensation Committee, with the assistance of the Chief Executive Officer and other Company employees, reviewed market compensation data paid by companies in the biopharmaceutical industry as reported by Top 5 Data Services, Inc. (the “2011 Competitive Analysis”). The 2011 Competitive Analysis contained data from 342 publicly traded companies within the biopharmaceutical industry covering the details of compensation for 1,249 top executives. Our Chief Executive Officer, in consultation with the Chairman of the Compensation Committee, reviewed all of the data contained in the 2011 Competitive Analysis and then selected companies with annual revenue of between $25 million and $149.9 million and between 100 and 500 employees to be used as peer group companies for purposes of benchmarking.
The Compensation Committee and management used the peer group compensation data selected from the 2011 Competitive Analysis primarily to ensure that the total direct compensation for our executives and senior management is within a reasonable range of comparative pay of our peer group companies. While this market data provides a useful starting point for compensation decisions, our Compensation Committee also takes into account factors such as level of individual responsibility, prior experience and performance in arriving at final compensation decisions.
Generally, neither management nor the Compensation Committee utilizes the services of independent compensation consultants in connection with the establishment of executive compensation other than to obtain independent third-party benchmarking surveys similar to the 2011 Competitive Analysis discussed above.
Elements of 2011 Executive Compensation
Our executive compensation program is comprised of the following principal elements, each of which is described in more detail below:
|
| | |
| Element of Compensation | Purpose | Pay-for-Performance Considerations |
| Cash and Short-Term Variable Compensation: |
| Base Compensation | Provides competitive, fixed compensation to attract and retain exceptional executive talent | Adjustments to base salary consider the individual's overall performance, contribution to the business and internal and external comparisons |
| Cash Bonus | Encourages and rewards achievement of strong financial, operational and strategic performance by the Company | The amount of any discretionary bonus received by an executive officer, if any, depends on the degree we achieve strong annual financial, operational or strategic performance and the extent to which the executive officer contributes to the achievement |
| Long-Term Compensation: |
| Stock Options | Encourages executive officers to focus on the long-term performance of the Company, links an executive officer's incentives to our stockholders' interests in increasing our stockholder value, encourages significant ownership of our common stock and promotes long-term retention of our executives officers | The potential appreciation in our stock price above the exercise price for stock options motivates our executives to build stockholder value as the executive officer only realizes value from the stock option if the stock price appreciates |
| Other Elements: |
| Health, Retirement and Other Benefits | Provides broad-based market competitive employee benefits program such as participation in benefit plans generally available to our employees, including, employee stock purchase plan, 401(k) retirement plan, life, health and dental insurance and short-term and long-term disability plans | Not applicable |
Base Compensation
We pay our Chief Executive Officer and Chief Commercial Officer a base salary, which we review and determine annually. We believe that a competitive base salary is a necessary element of any compensation program that is designed to attract and retain talented and experienced executives. We also believe that attractive base salaries can motivate and reward executives for their overall performance. Although base salaries are established in part based on the individual experience, skills and expected contributions during the coming year as well as each executive's performance during the prior year, we do not view base salaries as primarily serving our objective of paying for performance. Our Chief Financial Officer does not receive a base salary directly from the Company. We pay our Chief Financial Officer in accordance with a letter agreement with CFO Systems, LLC, under which CFO Systems provides financial leadership and consulting services to us. See "Agreements with Our Named Executive Officers - CFO Systems Letter Agreement."
It is our goal to maintain a base compensation structure among our executives that, in our judgment, appropriately reflects their respective roles and responsibilities. Our executives' base compensation reflects the initial amounts that we negotiated with each of our executives at the time of his or her initial employment or promotion and our subsequent adjustments to these amounts, to reflect market increases, our growth, the individual executives' performance and increased experience, any changes in the individual executives' roles and responsibilities and other factors. Generally, the base compensation of our executives is based on our understanding of compensation for comparable positions at similarly situated companies at the time, the individual experience and skills of, and expected contribution from each executive, the roles and responsibilities of the executive, the base compensation of our existing executives and other factors.
2011 Cash Incentive Bonus
During 2011, the Compensation Committee relied on a discretionary bonus program for its executives which left the decision of whether an executive, including a named executive officer, received a bonus to the discretion of the Compensation Committee. In exercising this discretion, the Compensation Committee had the authority to set desired goals and targets for the executive officer or consider other performance goals, current economic conditions and exceptional and/or inadequate performances by each executive officer when evaluating whether and to what extent to award bonuses. The discretionary bonus awards earned by our named executive officers in 2011 are set forth in the “Summary Compensation Table” below and in the section below entitled "Analysis of Named Executive Officer Compensation."
2012 Bonus Plan
In 2012, the Compensation Committee established an incentive bonus plan (the “2012 Bonus Plan”) which provides variable incentive compensation to our executives, including our named executive officers, and senior management. The 2012 Bonus Plan provides bonus opportunities tied to specific corporate-level and individual goals for payments ranging from 0% of the applicable bonus opportunity, if the threshold performance levels are not attained, to 225% of the applicable bonus opportunity, if all performance is above the levels established to qualify for maximum payouts. Performance attainment levels of the targeted performance objectives range from 5% to 60% and correspond to payment levels ranging from 0% to 225% of the target bonus opportunity.
The 2012 Bonus Plan provides that payments senior management, excluding our named executive officers, will be paid as cash bonuses. However, with respect to our named executive officers, the plan provides that our named executive officers will be paid as follows:
|
| |
| Target Attainment Percentage | Form of Payment |
| 100% | Cash |
| Above 100% | 50% Cash 50% Restricted Stock |
The Compensation Committee believes that providing for payment of a portion of the incentive compensation earned by our named executive officers supports links the executives' incentives to our stockholders' interests in increasing stockholder value and provides executive officers with incentives to stay. We also believe that the payment of on-target performance, and a portion of above-target performance as a cash incentive supports our pay for performance philosophy and encourages an executive officer's contribution to, and rewards an executive officer for, Company-wide performance and the attainment of specific operational and financial goals that are controlled by or can be directly impacted by the executive officer.
Individualized bonus plans are established for each participant, including our named executive officers, with performance metrics and related targets that include a mix of company-level financial metrics and business unit or individual metrics tailored to include the important factors under the executive's control. The company-level metrics consist of net revenue, MEBITDA and a p/s multiple.The individual performance metrics are specific operational and financial goals that are controlled by or can be directly impacted by the individual and include for instance, objectives related implementation of investment relations, product initiatives and other corporate strategies, organizational development, targeted product revenues as well as other objectives tailored to the individual The objective of the 2012 Bonus Plan is to encourage executives to contribute toward the attainment of the Company's consolidated financial and performance goals for fiscal year 2012. See “Analysis of Named Executive Officer Compensation” below for the on-target bonus opportunities awarded to our named executive officers under the 2012 Bonus Plan.
Long-Term Equity Incentive Compensation
We grant long-term equity incentive awards in the form of stock options to executives as part of our total compensation package. We place a significant emphasis on performance-based incentive compensation. These awards generally represent a significant portion of total executive compensation. We use long-term equity incentive awards in order to align the interests of our executives and our stockholders by providing our executives with strong incentives to increase stockholder value and a significant reward for doing so. Our decisions regarding the amount and type of long-term equity incentive compensation and relative weighting of these awards among total executive compensation have also been based on our understanding of market practices and take into account additional factors such as level of individual responsibility, experience and performance.
Stock option awards provide our executive officers with the right to purchase shares of our common stock at a fixed exercise price typically for a period of up to ten years, subject to continued employment with our Company. Stock options are earned based on continued service to us and generally vest over three years, with one-third vesting on each anniversary of the date grant.
All our stock options awards are granted pursuant to our 2006 Equity Incentive Plan (the “2006 Incentive Plan”) and the exercise price of each stock option granted under our 2006 Incentive Plan is based on the fair market value of our common stock on the grant date. Under the term of the 2006 Incentive Plan, when the Company is not listed on a national stock exchange but traded on an over-the-counter market, fair market value is defined as the average of the bid and ask price of our common stock on the trading date immediately preceding the grant date. See “Equity Incentive Plan and Other Compensation Plans - 2006 Equity Incentive Plan” for additional information on the 2006 Incentive Plan.
Broad-Based Benefits Programs
All full-time employees in the United States, including our named executive officers, may participate in our health and welfare benefit programs, including medical coverage, dental coverage, disability insurance, life insurance and our 401(k) plan. We offer similar plans in foreign countries.
Equity Incentive Plan and Other Compensation Plans
2006 Equity Incentive Plan.
The Company's 2006 Incentive Plan allows the Company to make awards of various types of equity-based compensation, including stock options, dividend equivalent rights (“DERs”), stock appreciation rights, restricted stock, restricted stock units, performance units, performance shares and other awards, to employees and directors of the Company. The 2006 Incentive Plan provides that the total number of shares of common stock that the Company may issue is 10,000,000 shares under the 2006 Incentive Plan; provided, that no more than 5,000,000 of such shares may be used for grants of restricted stock, restricted stock units, performance units, performance shares and other awards. As of March 7, 2012, there were 4,157,333 outstanding options granted under the 2006 Incentive Plan, of which 2,251,378 may be exercised at this time.
The 2006 Incentive Plan is administered by the Compensation Committee of the Board of Directors which has the authority to set the number, exercise price, term and vesting provisions of the awards granted under the 2006 Incentive Plan, subject to the terms thereof. Either incentive or non-qualified stock options may be granted to employees of the Company, but only non-qualified stock options may be granted to non-employee directors and advisors. However, in either case, the 2006 Incentive Plan requires that stock options must be granted at exercise prices not less than the fair market value of the common stock on the date of the grant. Options issued under the 2006 Incentive Plan vest over periods as determined by the Compensation Committee and expire ten years after the date the option was granted. Compensation expense is based on the calculated fair value of the awards as measured at the grant date and is expensed ratably over the service period of the awards (generally the vesting period).
Employee Savings Plan.
The Company maintains an employee savings plan that is intended to qualify as a tax-qualified plan under Section 401(k) of the Internal Revenue Code. This plan allows for voluntary contributions up to statutory maximums by eligible employees. Historically, we matched a specific proportion of these contributions, subject to limitations imposed by law. We may make additional contributions to the savings plan on behalf of our employees if our Board of Directors decides to do so. For the year ended December 31, 2009 we discontinued matching 401(k) contributions for the third and fourth quarters due to our expense reduction initiatives. We reinstated matching 401(k) contributions for the first three quarters of 2010; however, effective October 1, 2010, we again discontinued matching 401(k) contributions. Our named executive officers are eligible to participate in the 401(k) retirement plan. We did not make any matching contributions to any employees, including our named executive officers, during 2011.
Analysis of Named Executive Officer Compensation
In connection with establishment of 2011 compensation for our named executive officers, our Chief Executive Officer and the Compensation Committee reviewed the market compensation data contained in the 2011 Competitive Analysis. Our Chief Executive Officer, in consultation with the Chairman of our Compensation Committee, identified the comparable positions for each of our named executive officers in the 2011 Competitive Analysis based on their positions and responsibilities. Our Chief Executive Officer then made compensation recommendations for our executives, excluding his own, and senior management. Although our Chief Executive Officer makes executive compensation recommendations to the Compensation Committee, the Compensation Committee is ultimately responsible for approving all executive compensation.
The Compensation Committee considered the Chief Executive Officer recommendations and also reviewed the 2011 Competitive Analysis to ensure that the compensation programs for our key senior managers, including our named executive
officers, are consistent with our compensation philosophy and remain within broadly competitive norms.
In addition to reviewing competitive market data, the Compensation Committee also believes that individual compensation should reflect an executive officer's position and value to our organization considering individual contribution to business results, knowledge and skills, and market value and that individual compensation should also take into consideration long-term potential of the executive officer to contribute to our financial position and retention concerns, if any, for individual executives.
In determining our Chief Executive Officer's compensation, in addition to a review of the 2011 Competitive Analysis, the Compensation Committee specifically considers the Board of Director's evaluation of the his performance.
After reviewing the 2011 Competitive Analysis and considering the recommendations made by our Chief Executive Officer, the Compensation Committee determined the terms and amount of compensation to pay to each of our executive officers.
Set forth below is a summary of the decisions related to 2011 executive compensation for each of our named executive officers made during 2011 as well as additional information regarding decisions made related to the 2012 executive compensation for our named executive officers.
Craig J. Tuttle, President and Chief Executive Officer
The Compensation Committee reviews our Chief Executive Officer's compensation and the terms of his employment agreement on an annual basis in connection with the review of all other executive officers' compensation. See “Agreements with Our Named Executive Officers - CEO Employment Agreement” for additional information on the Mr. Tuttle's employment agreement. Based on a review of the 2011 Competitive Analysis, Mr. Tuttle received a grant of 500,000 stock option awards but he did not receive an increase to his base salary; therefore, his base salary of $325,000 remained the same. The Compensation Committee also awarded a discretionary cash bonus to Mr. Tuttle in the amount of $10,000 in recognition of his performance during 2011, including, without limitation, his integration of the FAMILION product line into the Company's operations and his effective management of costs.
In 2012, based on a review of the performance of Mr. Tuttle during 2011 and the first quarter of 2012 which included the cost effective management and the successful completion of a private placement offering, the Compensation Committee increased Mr. Tuttle's base salary from $325,000 to $350,000, a 7.7% increase, effective March 1, 2012 which reflects the first increase in Mr. Tuttle's base salary since 2008. Under the 2012 Bonus Plan, Mr. Tuttle's annual on-target bonus opportunity is $175,000.
Brett L. Frevert, Chief Financial Officer
Mr. Frevert serves as Chief Financial Officer pursuant to the terms a letter agreement with CFO Systems and therefore, Mr. Frevert does not receive a base salary; rather, payments for Mr. Frevert's services are paid directly to CFO Systems. See “Agreements with Our Named Executive Officers - CFO Systems Letter Agreement” for additional information on the terms of this letter agreement. During 2011, we paid CFO Systems $242,250 Mr. Frevert's services. Based on a review of the 2011 Competitive Analysis, Mr. Frevert received a grant of 250,000 stock option awards. The Compensation Committee also awarded a discretionary cash bonus to Mr. Frevert in the amount of $5,000 in recognition of his performance during 2011, including, without limitation, his support of the integration of the FAMILION business into the Company's operations, the successful audit of the FAMILION line of business and his cost effective management of the senior financial officers and our financial resources.
Under the 2012 Bonus Plan, Mr. Frevert's annual on-target bonus opportunity is $125,000.
Chad M. Richards, Chief Commercial Officer
Based on a review of the 2011 Competitive Analysis, the Compensation Committee increased Mr. Richards' base salary from $188,708 to $199,167, a 5.5% increase and he received a grant of 250,000 stock options. During 2011, Mr. Richards also participated in the Company's 2011 sales incentive plan which was available for all Company sales personnel. This plan provided Mr. Richards with an opportunity to receive incentive compensation based on total net sales as reported in the Company's quarterly financial statements. Mr. Richards' annual on-target incentive opportunity under this plan was $100,000. Because the Company did not achieve the net sales performance target, Mr. Richards did not receive any compensation under this plan. The Compensation Committee also awarded a discretionary cash bonus to Mr. Richards in the amount of $6,000 in recognition of his performance during 2011, including, without limitation, his effective integration of the FAMILION product line into the Company's operations.
During 2012, Mr. Richards will not participate in the Company's sales incentive plan, but he will participate in the 2012 Bonus Plan. Under the 2012 Bonus Plan, Mr. Richards' annual on-target bonus opportunity is $125,000.
Tax and Accounting Implications
Deductibility of Executive Compensation
Section 162(m) of the Internal Revenue Code, as amended (the “Code”) limits the deductibility of compensation in excess of $1 million paid to our named executive officers, unless the compensation qualifies as “performance-based compensation.” Among other things, in order to be deemed performance-based compensation, the compensation must be based on the achievement of pre-established, objective performance criteria and must be pursuant to a plan that has been approved by our stockholders. It is intended that all performance-based compensation paid in 2011 to our named executive officers under the plans and programs described above will qualify for deductibility, either because the compensation is below the threshold for non-deductibility provided in Section 162(m) of the Code, or because the payment of amounts in excess of $1 million qualify as performance-based compensation under the provisions of Section 162(m) of the Code.
We believe that it is important to continue to be able to take all available company tax deductions with respect to the compensation paid to our named executive officers. Therefore, we believe we have taken all actions that may be necessary under Section 162(m) of the Code to continue to qualify for all available tax deductions related to executive compensation. However, we also believe that preserving flexibility in awarding compensation is in our best interest and that of our stockholders, and we may determine, in light of all applicable circumstances, to award compensation in a manner that will not preserve the deductibility of such compensation under Section 162(m) of the Code.
Accounting for Share-Based Compensation
We account for share-based compensation awards, including our stock options, in accordance with the requirements of Financial Accounting Standards Board Accounting Standards Codification Topic 718, Compensation - Stock Compensation (formerly FASB Statement 123R, “Share-Based Payment”). Before we grant stock-based compensation awards, we consider the accounting impact of the award as structured and under various other scenarios in order to analyze the expected impact of the award.
Agreements with Our Named Executive Officers
CEO Employment Agreement
The Company has entered into an employment agreement dated July 12, 2008 with Craig J. Tuttle, our President and Chief Executive Officer. The employment agreement provides that the term of the agreement will be one year, but shall be automatically extended for additional one year terms unless either the Company or Mr. Tuttle provides written notice to the other of an intention not to extend no later than sixty (60) days prior to the end of the then current term. The employment agreement automatically renewed for an additional year ending on July 12, 2012.
The employment agreement provides that Mr. Tuttle will be entitled to receive severance payments from the Company if his employment is terminated involuntarily except if such termination is based on “just cause”, as that term is defined in the employment agreement. The severance payment payable in such circumstances is equal to his annual base salary at the time of termination and will be paid to him over a twelve-month period. The employment agreement provides that the severance payment provisions will be honored if the Company is acquired by, or merged into, another company and his position is eliminated as a result of such acquisition or merger. This severance payment is designed to provide him with an amount of cash sufficient to provide for living expenses and other needs which would normally be paid from his monthly base salary payments in situations where the executive officer's employment was not terminated voluntarily or for just cause. In addition, the payments are designed so as to not exceed the maximum amount which may be paid without imposition of the excise tax imposed by Section 4999 of the Internal Revenue Code or resulting in a loss of the Company's income tax deduction for any portion of these payments under Section 280G of the Internal Revenue Code if such payments are made after, or in contemplation of, a change of control transaction.
CFO Systems Letter Agreement
Effective June 30, 2010, we entered into a letter agreement with CFO Systems and Brett L. Frevert. Under the letter agreement CFO Systems will provide financial and consulting services to us at rates of $75 to $150 per hour depending on the level of expertise involved. The services will include providing Chief Financial Officer duties and other financial and accounting expertise on a time share basis. The letter agreement provides that either CFO Systems or the Company may terminate the agreement upon thirty (30) days written notification. In connection with the letter agreement, Mr. Frevert agreed to serve as our Chief Financial Officer. We were charged $405,763 and $126,459 for the services provided by CFO Systems during 2011 and 2010, respectively. The 2011 fees included $242,250 for Mr. Frevert's services and $150,327 for other professionals services, primarily related to support the audit of the FAMILION business and the integration of it into our ongoing business.
Compensation Risk Analysis
We have reviewed our material compensation policies and practices for all employees and have concluded that these policies and practices are not reasonably likely to have a material adverse effect on the Company. While risk-taking is a necessary part of growing a business, our compensation philosophy, as discussed above is focused on aligning compensation with the long-term interests of our stockholders as opposed to rewarding short-term management decisions that could pose long-term risks.
REPORT OF THE COMPENSATION COMMITTEE
We, the Compensation Committee of the Board of Directors of the Company, have reviewed and discussed the Compensation Discussion and Analysis set forth above with the management of the Company, and, based on such review and discussion, have recommended to the Board of Directors inclusion of the Compensation Discussion and Analysis in the Company's Annual Report on Form 10-K for the year ended December 31, 2011 and its Proxy Statement for the 2012 Annual Meeting of Stockholders.
|
|
| MEMBERS OF THE COMPENSATION COMMITTEE: |
|
| Antonius P. Schuh, Ph.D. |
| Rodney .S. Markin, MD, Ph,D. |
| Robert M. Patzig |
Compensation Committee Interlocks And Insider Participation
No member of the Compensation Committee was at any time during 2011, or at any other time, an officer or employee of the Company. No executive officer of the Company serves as a member of the board of directors or compensation committee of any entity that has one or more executive officers serving as a member of our Board or its Compensation Committee.
2011 EXECUTIVE COMPENSATION
Summary Compensation Table
The following table sets forth compensation awarded to, paid to, or earned by our "named executive officers" for services rendered during fiscal years 2011, 2010 and 2009.
|
| | | | | | | | | | | | | | | | | | | | | | |
| Name and Principal Position | | Year | | Salary ($) | | Bonus ($) | | Option Awards(1) $ | | All Other Compensation ($) | | Total ($) |
Craig J. Tuttle (2) | | 2011 | | $ | 325,000 |
| | $ | 10,000 |
| | $ | 457,950 |
| | $ | 12,102 |
| | $ | 805,052 |
|
| President and | | 2010 | | 325,000 |
| | — |
| | — |
| | 18,377 |
| (3) | 343,377 |
|
| Chief Executive Officer | | 2009 | | 325,000 |
| | — |
| | — |
| | 17,559 |
| (3) | 342,559 |
|
| | | | | | | | | | | | | |
Brett L. Frevert (4) | | 2011 | | — |
| | 5,000 |
| | 228,975 |
| | 242,250 |
| (4) | 476,225 |
|
| Chief Financial Officer | | 2010 | | — |
| | — |
| | — |
| | 96,225 |
| (4) | 96,225 |
|
| | | | | | | | | | | | | |
Chad M. Richards(5) | | 2011 | | 199,167 |
| | 6,000 |
| | 228,975 |
| | 9,338 |
| (6) | 443,480 |
|
| Chief Commercial Officer | | 2010 | | 188,708 |
| | — |
| | — |
| | 13,476 |
| (6) | 202,184 |
|
| | | 2009 | | 182,250 |
| | — |
| | — |
| | 11,340 |
| (6) | 193,590 |
|
(1) The amounts in this column reflect the aggregate grant date fair value of the stock option awards granted during the respective fiscal year as computed in accordance with Financial Accounting Standards Board Accounting Standards Codification Topic 718, Compensation--Stock Compensation ("FASB ASC Topic 718"), excluding the effect of estimated forfeitures. The amounts shown do not correspond to the actual value that will be recognized by the named executive officer. The assumptions used in the calculation of these amounts are included in footnote B. to the Company's audited financial statements for the fiscal year ended December
31, 2011 included in this Annual Report. See the "2011 Grants of Plan-Based Awards" table for information on stock options granted in 2011.
(2) See “Agreements with Our Named Executive Officers--CEO Employment Agreement” for a description of Mr. Tuttle's employment agreement with the Company.
(3) Amounts paid to Mr. Tuttle in 2011 consisted of an automobile allowance as provided in his employment agreement, group life insurance and long term disability insurance. Amounts paid to Mr. Tuttle in 2010 and 2009 consisted of an automobile allowance as provided in his Employment Agreement, a 401(k) matching contribution, group life insurance and long term disability insurance.
(4) Mr. Frevert began serving as our Chief Financial Officer effective June 30, 2010 when we entered into a letter agreement with CFO Systems relating to his service. All compensation received by Mr. Frevert represents amounts paid to CFO Systems for Mr. Frevert's services as our Chief Financial Officer. See “Agreements with Our Named Executive Officers - Letter Agreement with CFO Systems” for a description of the arrangement with CFO Systems.
(5) Mr. Richards joined the Company as Senior Vice President, Sales and Marketing on October 8, 2007 and was promoted to Chief Commercial Officer in January 2011.
(6) Amounts paid to Mr. Richards in 2011 consisted of group life insurance and long term disability insurance Amounts paid to Mr. Richards in 2010 and 2009 consisted of a 401(k) matching contribution, group life insurance and long term disability insurance.
2011 Grants of Plan-Based Awards
The following table sets forth certain information with respect to grants of plan-based awards in fiscal year 2011 to our named executives. The option awards granted to our named executive officers in fiscal year 2011 were granted under our 2006 Incentive Plan. The option awards during 201l have time-based vesting, with one-third vesting occurring evenly during each of the first three years from the date of grant. Each option award has a term of ten years.
|
| | | | | | | | | | | | | |
| Name | | Grant Date | | All Other Option Awards: Number of Securities Underlying Options (#) | | Exercise or Price of Option Awards ($/sh) (1) | | Grant Date Fair Value of Option Awards ($)(2) |
| Craig J. Tuttle | | 5/18/2011 | | 500,000 |
| | $ | 1.19 |
| | $ | 457,950 |
|
| Brett L. Frevert | | 5/18/2011 | | 250,000 |
| | $ | 1.19 |
| | 228,975 |
|
| Chad M. Richards | | 5/18/2011 | | 250,000 |
| | $ | 1.19 |
| | 228,975 |
|
(1)The exercise price of stock options awarded represents the fair market value of our common stock on the date of grant as defined in our 2006 Incentive Plan.
(2) The amounts in this column reflect the aggregate grant date fair value of the stock option awards granted during the respective fiscal year as computed in accordance with FASB ASC Topic 718, excluding the effect of estimated forfeitures. The amounts shown do not correspond to the actual value that will be recognized by the named executive officer. The assumptions used in the calculation of these amounts are included in footnote B. to the Company's audited financial statements for the fiscal year ended December 31, 2011 included in this Annual Report.
Outstanding Equity Awards at Fiscal 2011 Year-End
The following table provides certain information concerning outstanding option awards held by our named executive officers as of December 31, 2011.
|
| | | | | | | | | | | | | | |
| | | | | Option Awards |
| | Name | Option Award / Grant Date | | Number of Securities Underlying Unexercised Options (#) Exercisable | | Number of Securities Underlying Unexercised Options (#) Unexercisable | | Option Exercise Price ($) | | Option Expiration Date |
| |
| | Craig J. Tuttle | 9/1/2006 | | 200,000 |
| | — |
| | $ | 0.69 |
| | 8/31/2016 |
| | Craig J. Tuttle | 1/17/2007 | | 200,000 |
| | — |
| | 0.75 |
| | 1/16/2017 |
| | Craig J. Tuttle | 7/12/2007 | | 200,000 |
| | — |
| | 0.66 |
| | 7/11/2017 |
| | Craig J. Tuttle | 5/18/2011 | | — |
| | 500,000 |
| | 1.19 |
| | 5/17/2021 |
| | Brett L. Frevert | 5/18/2011 | | — |
| | 250,000 |
| | 1.19 |
| | 5/17/2021 |
| | Chad M. Richards | 10/8/2007 | | 200,000 |
| | | | 0.69 |
| | 10/7/2017 |
| | Chad M. Richards | 5/18/2011 | | — |
| | 250,000 |
| | 1.19 |
| | 5/17/2021 |
Fiscal Year 2011 Option Exercises and Stock Vested
No stock options were exercised by any of our named executive officers during fiscal year 2011.
POTENTIAL PAYMENTS UPON TERMINATION OR CHANGE OF CONTROL
Except for the employment agreement with Mr. Tuttle and the letter agreement with CFO Systems and Mr. Frevert described above, none of our named executive officers have employment or severance agreements with the Company and their employment may be terminated at any time; provided; however, the services of Mr. Frevert are governed by a letter agreement between the Company, CFO Systems and Mr. Frevert which requires thirty days written notice prior to termination.
2006 Equity Incentive Plan
Stock Options. The 2006 Incentive Plan provides that if an optionee, including a named executive officer, voluntarily terminates employment with the Company, all unvested stock options will terminate and the optionee will have three months from the date of termination to exercise any vested stock options granted under the caption “Executive Compensation.”Securities authorized2006 Incentive Plan. However, the 2006 Incentive Plan also provides that if the optionee's employment terminates due to death, disability or retirement, all stock options will immediately vest upon the optionee's death or disability and the optionee (or his or her estate or personal representative) will have twelve months from the date of death, disability or retirement to exercise the stock options; provide, such optionee had continuously served as an employee, director or advisor for issuanceat least three years, or such shorter period as the Compensation Committee may prescribe. The plan also provides that all stock options will immediately vest upon the occurrence of a change-in-control of the Company.
Potential Post Termination Benefits Table
The tables below quantify certain compensation that would have become payable to our named executive officers in the event such executive officer's employment had terminated on December 31, 2011 under equityvarious circumstances. The estimates set forth in the table below are based on our named executive officers' compensation plans.and service levels as of such date and, if applicable, the closing stock price of our common stock on that date which was $1.29. These benefits are in addition to benefits generally available to salaried employees such as distributions under our 401(k) Plan, disability benefits and accrued vacation pay.
Due to the number of factors that affect the nature and amount of any benefits provided upon the events discussed below, any actual amounts paid or distributed to our named executive officers may be different. Factors that could affect these amounts
include the timing of any such event, our stock price and the executive's age.
|
| | | | | | | | | | | | | | | | | | | | | | | | | | | | | | |
| Name | | Benefit | | Cause | | Without Cause(1) | | Voluntary Termination | | Change in Control(2) | | Death(2) | | Disability(2) | | Retirement(2) |
| Craig. J. Tuttle | | Cash | | $ | — |
| | $ | 350,000 |
| | $ | — |
| | $ | 350,000 |
| | $ | — |
| | $ | — |
| | $ | — |
|
| | | Stock options | | — |
| | 354,000 |
| | — |
| | 404,000 |
| | 404,000 |
| | 404,000 |
| | 404,000 |
|
| | | Benefits | | — |
| | — |
| | — |
| | — |
| | — |
| | — |
| | — |
|
| | | Total | | $ | — |
| | $ | 704,000 |
| | $ | — |
| | $ | 754,000 |
| | $ | 404,000 |
| | $ | 404,000 |
| | $ | 404,000 |
|
| | | | | | | | | | | | | | |
| | |
| Brett L. Frevert | | Cash | | $ | — |
| | $ | — |
| | $ | — |
| | $ | — |
| | $ | — |
| | $ | — |
| | $ | — |
|
| | | Stock options | | — |
| | — |
| | — |
| | 25,000 |
| | 25,000 |
| | 25,000 |
| | 25,000 |
|
| | | Benefits | | — |
| | — |
| | — |
| | — |
| | — |
| | — |
| | — |
|
| | | Total | | $ | — |
| | $ | — |
| | $ | — |
| | $ | 25,000 |
| | $ | 25,000 |
| | $ | 25,000 |
| | $ | 25,000 |
|
| | | | | | | | | | | | | | | | | |
| Chad M. Richards | | Cash | | $ | — |
| | $ | — |
| | $ | — |
| | $ | — |
| | $ | — |
| | $ | — |
| | $ | — |
|
| | | Stock options | | — |
| | 120,000 |
| | — |
| | 145,000 |
| | 145,000 |
| | 145,000 |
| | 145,000 |
|
| | | Benefits | | — |
| | — |
| | — |
| | — |
| | — |
| | — |
| | — |
|
| | | Total | | $ | — |
| | $ | 120,000 |
| | $ | — |
| | $ | 145,000 |
| | $ | 145,000 |
| | $ | 145,000 |
| | $ | 145,000 |
|
(1) The amount reflected for stock options is equal to the number of stock options exercisable as of December 31, 2011 multiplied by the difference between the stock price as of that date ($1.29) and the stock option exercise price. The value represents the net proceeds the named executive would have earned as of that date assuming exercise of the stock options.
(2) The amount reflected for stock options is equal to the total number of stock options outstanding as of December 31, 2011 multiplied by the difference between the stock price as of that date ($1.29) and the stock option exercise price. The value represents the net proceeds the named executive would have earned as of that date assuming exercise of the stock options.
DIRECTOR COMPENSATION
It is our Board's general policy that compensation for independent directors should be a mix of cash and equity-based compensation. As part of a director's total compensation, and to create a direct linkage with corporate performance and stockholder interests, our Board believes that a meaningful portion of a director's compensation should be provided in, or otherwise based on, the value of appreciation in our common stock.
Our Board of Directors has the authority to approve all compensation payable to our directors, although our Compensation Committee is responsible for making recommendations to our Board regarding this compensation. Additionally, our Chief Executive Officer may also make recommendations or assist our Compensation Committee in making recommendations regarding director compensation. Our Board of Directors and Compensation Committee annually review our director compensation. In connection with director compensation decisions in 2011, our Board and the Compensation Committee reviewed market director compensation data paid by companies in the life sciences industry as reported by Top 5 Data Services, Inc. (the “2011 Director Competitive Analysis”). The 2011 Director Competitive Analysis contained data for 217 publicly traded medical device (“MD) companies and 331 biopharmaceutical companies, with 65 companies assigned to both sectors based on their mix of products. Based on its review of the 2011 Director Competitive Analysis, the Board made changes to our director compensation program which are further discussed below.
Cash Compensation
Directors who are also employees of the Company are not separately compensated for serving on the Board of Directors
other than reimbursement for out-of-pocket expenses related to attendance at Board and committee meetings. Independent directors are paid an annual retainer of $20,000 and they receive reimbursement for out-of-pocket expenses related to attendance at Board and committee meetings. Independent directors serving on any committee of the Board of Directors are paid an additional annual retainer of $2,500 unless they are also a chairman of a committee. The chairman of the Audit Committee receives an additional annual retainer of $8,000 and the chairman of any other committee receives an additional annual retainer of $4,000. All directors' fees paid annually or quarterly were prorated for partial periods. In addition, any independent director who attends more than four meetings per quarter, which includes committee meetings, receives $500 for each meeting attended over the four.
Equity-Based Compensation
Our practice during 2010 was to grant each new independent director an option to purchase 15,000 shares of common stock under our 2006 Incentive Plan at the next Compensation Committee meeting following a director's initial appointment to the Board. The options granted to an independent director upon initial appointment to the Board vested at the rate of 33 1/3% per year of service on the Board.
Beginning in 2011, our practice changed to grant each new independent director an option to purchase 40,000 shares of common stock under our 2006 Incentive Plan at the next Compensation Committee meeting following a director's initial appointment to the Board, which option vests after one (1) year.
Our practice during 2010 was to grant annually to each continuing independent director an option to purchase 5,000 shares of common stock, which option vested after three (3) years.
Our practice changed in 2011 to grant annually to each continuing independent director an option to purchase 25,000 shares of common stock, which option vests after one (1) year. Additional annual grants of options will be made each year by the Compensation Committee in its sole discretion. All options granted to independent directors have exercise prices that represented the fair market value of our stock on the grant date.
On March 2, 2011 (the grant date), our independent directors were each granted a non-qualified option to purchase 25,000 shares of our common stock with an exercise price equal to $0.74.
Director Summary Compensation Table
The following table provides information regarding the Company's compensation for non-employee directors during the year ended December 31, 2011. Directors who are employees of the Company do not receive compensation for serving on the Board of Directors or its committees.
|
| | | | | | | |
| Name | | Fees Earned or Paid in Cash ($) | | Option Awards $ (1) | | Total ($) |
| | | | | | | |
| Doit Koppler | | $21,000 | | $23,309 | | $44,309 |
| Robert Patzig | | 18,750 | | 23,309 |
| | 42,059 |
| Rodney Markin, M.D., Ph.D. | | 25,375 | | 14,568 |
| | 39,943 |
| Antonius Schuh, Ph.D | | 23,625 | | 14,568 |
| | 38,193 |
(1) The amounts reflected in this column reflect the grant date fair value of each option award granted during 2011, as determined in accordance with FASB ASC Topic 718.The amounts shown do not correspond to the actual value that will be realized by the independent director. The assumptions used in the calculation of these amounts are included in footnote B. to the Company's audited financial statements for the fiscal year ended December 31, 2011, included in this Annual Report. The grant date fair value of the options granted to our independent directors on March 2, 2011 was $0.58 per option. The aggregate grant date fair value for all options granted to our independent directors on March 2, 2011 was $75,754.
The following table sets forth each independent director's aggregate number of option awards outstanding as of December 31, 2011:
|
| | | | | | | | | |
| Name | | Vested Stock Option Awards | | Unvested Stock Option Awards | | Aggregate Stock Option Awards |
| Doit Koppler, II | | — |
| | 40,000 |
| | 40,000 |
|
| Robert Patzig | | — |
| | 40,000 |
| | 40,000 |
|
| Rodney Markin, M.D., Ph.D | | 20,000 |
| | 35,000 |
| | 55,000 |
|
| Antonius Schuh, Ph.D | | 10,000 |
| | 35,000 |
| | 45,000 |
|
|
| |
| Item 12. | Security Ownership of Certain Beneficial Owners and Management and Related Stockholder Matters. |
Equity Compensation Plan Information
The following equity compensation plan information summarizes plans and securities approved and not approved by security holders as of December 31,
2009. | | | | | | | |
| | | (a) | | (b) | | (c) |
| PLAN CATEGORY | | Number of securities to be issued upon exercise of outstanding options, warrants and rights | | Weighted-average exercise price of outstanding options, warrants and rights | | Number of securities remaining available for future issuance under equity compensation plans (excluding securities reflected in column (a) |
| Equity compensation plans approved by security holders (1) | | 3,331,731 | | $ | 2.39 | | 5,914,500 |
| | | |
| Equity compensation plans not approved by security holders | | — | | | — | | — |
| | |
| Total | | 3,331,731 | | $ | 2.39 | | 5,914,500 |
| | |
|
| | | | | | | | | | | | | | | |
| | | (a) | | | (b) | | (c) |
| PLAN CATEGORY | | Number of securities to be issued upon exercise of outstanding options, warrants and rights | | | Weighted-average exercise price of outstanding options, warrants and rights | | Number of securities remaining available for future issuance under equity compensation plans (excluding securities reflected in column (a) ) |
Equity compensation plans approved by security holders (1) | | 4,172,000 |
| | | $ | 1.10 |
| | | 4,944,231 |
| |
| Equity compensation plans not approved by security holders | | — |
| | | — |
| | | | — |
|
| Total | | 4,172,000 |
| | | $ | 1.10 |
| | | 4,944,231 |
| |
| |
| (1) | Consists of our 2006 Equity Compensation Plan |
Item 12. | Security Ownership of Certain Beneficial Owners and Management and Related Stockholder Matters. |
Information required
Beneficial Ownership of Common Stock
As of March 7, 2012, there were 71,625,725 issued and outstanding shares of our common stock. Each share of common stock is entitled to one vote on each matter to be voted on by the holders of our common stock at the 2012 Annual Meeting of Stockholders. Common stockholders do not have the right to cumulate votes in the election of directors.
The following table provides information known to us with respect to beneficial ownership of our common stock by our directors and all nominees for director, by those of our executive officers who are named in the Summary Compensation Table, by all of our current executive officers and directors as a group, and by each person we believe beneficially owns more than 5% of our outstanding common stock as of March 7, 2012. Except as indicated in the footnotes to this Itemtable, to our knowledge the persons named in the table below have sole voting and investment power with respect to all of common stock of the Company beneficially owned and such shares are owned directly by such person. The number of shares beneficially owned by each person or group as of March 7, 2012 includes shares of common stock that such person or group had the right to acquire on or within 60 days after March 7, 2012, including, but not limited to, upon the exercise of options or warrants to purchase common stock or the conversion of securities into common stock. Beneficial ownership information of persons other than our current executive officers and directors is incorporatedbased on available information including, but not limited to, Schedules 13D, 13F or 13G filed with the SEC or information supplied by referencethese persons.
|
| | | | | | |
Name and Address of Beneficial Owner(1) | | Number of Shares Beneficially Owned | | | Percent of Class |
| | | | | | |
| Directors and Executive Officers | | | | | |
| Craig J. Tuttle, President and Chief Executive Officer, Director | | 600,000 |
| (2) | | * |
| Brett L. Frevert, Chief Financial Officer | | — |
| (3) | | * |
| Chad M. Richards, Chief Commercial Officer | | 243,800 |
| (4) | | * |
| Doit L. Koppler II, Director | | 107,500 |
| (5) | | * |
| Rodney S. Markin, M.D., Ph.D, Director | | 45,000 |
| (6) | | * |
| Robert M. Patzig, Director | | 92,500 |
| (7) | | * |
| Antonius P. Schuh, Ph.D, Director | | 35,000 |
| (8) | | * |
| All directors and executive officers as a group (7 persons) | | 1,123,800 |
| (9) | | 1.5% |
| | | | | | |
| Other Stockholders | | | | | |
| LeRoy C. Kopp | | 14,156,661 |
| (10) | | 19.8% |
| AMH Equity, LLC and Leviticus Partners, L.P. | | 4,621,181 |
| (11) | | 6.5% |
| Kevin Douglas | | 4,000,000 |
| (12) | | 5.6% |
| Austin W. Marxe and David M. Greenhouse | | 5,250,000 |
| (13) | | 7.2% |
| Randal J. Kirk | | 20,263,131 |
| (14) | | 22.1% |
*Represents less than 1% of the outstanding common stock of the Company.
(1) The address for all of our directors and executive officers is the address of the Company's principal executive offices located at 12325 Emmet Street, Omaha, Nebraska 68164.
(2) Includes 600,000 shares issuable upon the exercise of options that are exercisable or will become exercisable within 60 days after March 7, 2012.
(3) Includes 0 shares issuable upon the exercise of options that are exercisable or will become exercisable within 60 days after March 7, 2012.
(4) Includes 43,800 shares owned by Mr. Richards and includes 200,000 shares issuable upon the exercise of options that are exercisable or will become exercisable within 60 days after March 7, 2012.
(5) Includes 50,000 shares owned by Mr. Koppler and includes 57,500 shares issuable upon the exercise of options and warrants that are exercisable or will become exercisable within 60 days after March 7, 2012.
(6) Includes 45,000 shares issuable upon the exercise of options that are exercisable or will become exercisable within 60 days after March 7, 2012.
(7) Includes 40,000 shares owned by Mr. Patzig and includes 52,500 shares issuable upon the exercise of options and warrants that are exercisable or will become exercisable within 60 days after March 7, 2012.
(8) Includes 35,000 shares issuable upon the exercise of options that are exercisable or will become exercisable within 60 days after March 7, 2012.
(9) Includes shares which may be acquired by executive officers and directors as a group within 60 days after March 7, 2012 through the exercise of stock options or warrants.
(10) Consists of shares owned directly by Mr. Kopp, shares held in individual retirement accounts established for Mr. Kopp and
his spouse; shares held in the Kopp Family Foundation of which he is a director; and shares held in discretionary client accounts managed by Kopp Investment Advisors, LLC of which he is the Chief Executive Officer. The business address of each of these beneficial owners is 7701 France Avenue South, Suite 500, Edina, Minnesota 55435.
(11) Consists of shares held by AMH Equity, LLC which is the general partner of Leviticus Partners, L.P. The business address of this beneficial owner is 60 East 42nd Street, Suite 901, New York, New York 10165.
(12) Mr. Douglas has dispositive power over all of the shares owned by the Douglas affiliates. The Douglas affiliates include shares owned directly by James E. Douglas,III as well as shares held in the following trusts: K&M Douglas Trust, Douglas Family Trust and the Douglas Irrevocable Descendants Trust . The business address of this beneficial owner is 125 East Sir Francis Drake Boulevard, Suite 400, Larkspur, California, 94939.
(13) Includes 3,500,000 shares owned and 1,750,000 shares issuable upon the exercise of warrants that are exercisable or will become exercisable within 60 days after March 7, 2012. MGP is the general partner of the Special Situations Fund III, QP, L.P. AWM Investment Company, Inc. (“AWM”) is the general partner of MGP and the investment adviser to the Proxy Statement underSpecial Situations Fund III, QP, L.P., Special Situations Private Equity Fund, L.P. and Special Situations Life Sciences Fund, L.P. Austin W. Marxe and David M. Greenhouse are the caption “Voting Securitiesprincipal owners of MGP and AWM. Through their control of MGP and AWM, Messrs. Marxe and Greenhouse share voting and investment control over the portfolio securities of each of the funds listed above. The business address of these beneficial owner is 527 Madison Avenue, Suite 2600, New York, New York 10022.
(14) Includes 3,245,903 shares owned and consists of (i) warrants to purchase 1,500,000 shares of common stock; (ii) shares of Series A Convertible Preferred Stock (the “Preferred Stock”) convertible into 10,344,820 shares of common stock; and (iii) warrants to purchase shares of the Preferred Stock which are convertible into 5,172,408 shares of common stock. These shares and warrants are held 40% by Third Security Senior Staff 2008 LLC, 40% by Third Security Staff 2010 LLC and 20% by Third Security Incentive 2010 LLC, which companies are affiliated with the beneficial owner. Mr. Randal J. Kirk could be deemed to have indirect beneficial ownership of these shares. The business address of these beneficial owners is 1881 Grove Avenue, Radford, Virginia 24141.
Beneficial Ownership of Preferred Stock
As of March 7, 2012, there were 2,586,205 issued and outstanding shares of our Preferred Stock. Each share of Preferred Stock is entitled to one vote on each matter to be voted on by Principalthe Preferred Stockholders at the Annual Meeting.
The following table provides information known to us with respect to beneficial ownership of the Preferred Stock by each person we believe beneficially owns more than 5% of our outstanding Preferred Stock as of March 7, 2012. The number of shares of Preferred Stock beneficially owned by each person or group as of March 7, 2012 includes shares of Preferred Stock that such person or group had the right to acquire on or within 60 days after March 7, 2012, including, but not limited to, upon the exercise of warrants to purchase Preferred Stock. Except as indicated in the footnotes to this table, to our knowledge the persons named in the table below have sole voting and
our Directorsinvestment power with respect to all of the Preferred Stock beneficially owned and
Officers.”such shares are owned directly by such person. Beneficial ownership information of such persons is based on available information including, but not limited to, Schedules 13D, 13F or 13G filed with the SEC or information supplied by these persons.
|
| | | | | | | |
| Name and Address of Beneficial Owner | | Number of Shares Beneficially Owned | | | Percent of Class |
| Randal J. Kirk | | 3,879,307 |
| (1) | | 100 | % |
(1) Includes warrants to purchase 1,293,102 shares of the Preferred Stock. These shares of the Preferred Stock and warrants are held 40% by Third Security Senior Staff 2008 LLC, 40% by Third Security Staff 2010 LLC and 20% by Third Security Incentive 2010 LLC, which companies are affiliated with the beneficial owner. Mr. Randal J. Kirk could be deemed to have indirect beneficial ownership of these shares. The business address of these beneficial owners is 1881 Grove Avenue, Radford, Virginia 24141.
|
| |
| Item 13. | Certain Relationships and Related Transactions, and Director Independence. |
Information required by this Item is incorporated by reference
Review and Approval of Related Person Transactions
We recognize that related person transactions can present potential or actual conflicts of interest and create the appearance
that our decisions are based on considerations which may not be in our best interests or the best interests of our stockholders. Accordingly, as a general matter, we prefer to avoid related person transactions. Nevertheless, we recognize that there are situations where related person transactions may be in, or may not be inconsistent with, our best interests. Pursuant to the Proxy Statement underAudit Committee Charter, the captions “Certain RelationshipsAudit Committee must review in advance and approve or reject all material transactions between the Company and a related party. The Audit Committee reviews and considers each transaction in light of the specific facts and circumstances presented. Related Transactions”persons include our directors or executive officers and “Boardtheir respective immediate family members and 5% beneficial owners of our common stock. Our Board of Directors will also review related party transactions in accordance with applicable law and the provisions of our Third Amended and Restated Certificate of Incorporation.
In addition, our Business Ethics Policy establishes a policy on potential conflicts of interest. Under our Business Ethics Policy our directors and employees, including our executive officers, must promptly report any transaction, relationship or circumstance that creates or could be reasonably expected to create a conflict of interest. Members of our senior management, including our executive officers, and our Board of Directors may not engage in any activity giving rise to an actual or potential conflict of interest without the prior approval of the Audit Committee. Any waiver of this policy relating to our executive officers or directors may only be made by the Board of Directors and Committees”will be promptly disclosed to our stockholders as required by law or applicable exchange rules.
Third Security Convertible Promissory Notes and Conversion
On December 30, 2011, we entered into a Convertible Promissory Note Purchase Agreement (the “Note Purchase Agreement”) with Third Security Senior Staff 2008 LLC, a Virginia limited liability company, Third Security Staff 2010 LLC, a Virginia limited liability company, and Third Security Incentive 2010 LLC, a Virginia limited liability company (collectively, the “Third Security Entities”), in the aggregate amount of $3,000,000. The Third Security Entities are currently the holders of 100% of our Preferred Stock and collectively represent a more than 10% beneficial ownership interest in our common stock.
Under the Note Purchase Agreement, the Company sold to each of the Third Security Entities a convertible note which with a March 31, 2012 maturity date (collectively, the “Convertible Notes”).
The Note Purchase Agreement and Convertible Notes provided for conversion of any amount remaining due to the Third Security Entities under the Convertible Notes into equity securities of the Company of the same class(es) or series and at the same price as the equity securities of the Company sold in the Company's first sale or issuance of its equity securities after December 30, 2011, in the aggregate amount of at least $3,000,000.
A majority of the disinterested directors approved the Company's entrance into the Note Purchase Agreement and issuance of the Convertible Notes to the Third Security Entities.
On February 2, 2012, we entered into a Securities Purchase Agreement (the “Purchase Agreement”) with certain institutional and other accredited investors (the “Investors”) pursuant to which the Company: (i) sold to the Investors an aggregate of 19,000,000 shares of the Company's Common Stock at a price per share of $1.00 (the “Common Shares”) for aggregate gross proceeds of approximately $19,000,000; and (ii) issued to the Investors warrants (the “Warrants”) to purchase up to an aggregate of 9,500,000 shares of Common Stock with an exercise price of $1.25 per share (collectively, the “Offering”). The Warrants may be exercised, in whole or in part, at any time from February 7, 2012 until February 7, 2017 and contain both cash and “cashless exercise” features.
As part of the Offering, in connection with the conversion of the Convertible Notes, the Third Security Entities received an aggregate of 3,000,000 Common Shares (the “Third Security Common Shares”) and Warrants to purchase up to 1,500,000 shares of Common Stock (the “Third Security Warrants”) upon the same terms as the Investors. As part of the Offering, our Preferred Stock Directors, Doit L. Koppler, II and Robert M. Patzig, purchased shares Common Shares and Warrants on the same terms as the other Investors.
In connection with the Offering, we also entered into a registration rights agreement with the Investors and the Third Security Entities (the “Registration Rights Agreement”). The Registration Rights Agreement requires that the Company file a registration statement with the SEC within forty-five (45) days of the closing date of the Offering for the resale by the Investors and the Third Security Entities of all of the Common Shares, the shares of Common Stock issuable upon exercise of the Warrants, the Third Security Common Shares, the shares of Common Stock issuable upon exercise of the Third Security Warrants and all shares of Common Stock issuable upon any stock split, dividend or other distribution, recapitalization or similar event with respect thereto.
A majority of the disinterested directors approved the Company's entrance into the Note Purchase Agreement, the issuance of the Convertible Notes to the Third Security Entities and the terms of the Offering.
Director Independence
The Company is governed by our Board of Directors. Currently, each member of our Board, other than our President and Chief Executive Officer, Craig J. Tuttle, is an independent director and all standing committees of the Board are composed entirely of independent directors, in each case under NASDAQ's independence definition. For a director to be considered independent, the Board must determine that the director has no relationship which, in the opinion of the Board, would interfere with the exercise of independent judgment in carrying out the responsibilities of a director. Members of the Audit Committee also must satisfy a separate SEC independence requirement, which provides that they may not accept directly or indirectly any consulting, advisory or other compensatory fee from the Company or any of its subsidiaries other than their directors' compensation. In addition, under SEC rules, an Audit Committee member who is an affiliate of the issuer (other than through service as a director) cannot be deemed to be independent. The four independent members of the Board of Directors are Rodney S. Markin, M.D., Ph.D, Doit L. Koppler, II, Robert M. Patzig and Antonius P. Schuh, Ph.D.
|
| |
| Item 14. | Principal AccountingAccountant Fees and Services. |
Information required
The following table shows information about fees paid, were billed or were expected to be billed by this Item is incorporatedMcGladrey & Pullen LLP, our independent auditor, during the fiscal years ended December 31, 2011 and 2010.
|
| | | | | | | | |
| | | 2011 | | 2010 |
| Audit fees | | $ | 321,005 |
| | $ | 205,315 |
|
| Audit-related fees | | 25,999 |
| | 127,200 |
|
| Tax fees | | 30,190 |
| | 34,055 |
|
| All other fees | | — |
| | — |
|
| Total fees | | $ | 377,194 |
| | $ | 366,572 |
|
Audit Fees. McGladrey & Pullen LLP billed us for professional services rendered for the audit of our annual financial statements for those fiscal years and to review our interim financial statements included in Quarterly Reports on Form 10-Q filed by referenceus with the SEC during that year.
Audit-Related Fees. McGladrey & Pullen LLP billed us for audit-related services. Audit-related services generally include fees for the audits of our employee benefit plans and fees incurred in connection with services associated with SEC registration statements, periodic reports and other documents filed with the SEC. In 2010 we incurred fees related to the Proxy Statement underaudits, review and consultation for our acquisition of the caption “Accounting FeesFAMILION family of genetic tests.
Tax Fees. McGladrey & Pullen LLP billed us for tax services. Tax services consist primarily of planning, advice and Services.”compliance, or return preparation, for U.S. federal, state and local, as well as international jurisdictions.
All Other Fees. McGladrey & Pullen LLP did not render any services other than the services described above in 2011 or 2010.
Pre-Approval of Audit and Non-Audit Services
Under the Audit Committee Charter, the Audit Committee is required to pre-approve all audit and non-audit services to be provided to us by our independent auditor and its member firms. All services provided by our independent auditor in 2011 were pre-approved by the Audit Committee.
|
| |
| Item 15. | Exhibits, Financial Statement Schedules. |
| |
| (a) | The following documents are filed as part of this report: |
|
| 1. |
| 1 | Financial Statements. The following financial statements of the Registrant are included in response to Item 8 of this report: |
Report of Independent Registered Public Accounting Firm.
Consolidated Balance Sheets of the Registrant and Subsidiary as of December 31,
20092011 and
2008.2010.
Consolidated Statements of Operations of the Registrant and Subsidiary for the years ended December 31,
20092011, 2010 and
2008.2009.
Consolidated Statements of Stockholders’ Equity of the Registrant and Subsidiary for the years ended December 31,
20092011. 2010 and
2008.2009.
Consolidated Statements of Cash Flows of the Registrant and Subsidiary for the years ended December 31,
20092011, 2010 and
2008.2009.
Notes to Consolidated Financial Statements of the Registrant and Subsidiary.
|
| 2. |
| 2 | Financial Statement Schedules. |
None.
All financial statement schedules are omitted because the information is inapplicable or presented in the notes to the financial statements.
|
| 3. |
| 3 | Exhibits. The following exhibits were filed as required by Item 15(a)(3) of this report. Exhibit numbers refer to the paragraph numbers under Item 601 of Regulation S-K: |
3.1 Third Amended and Restated Certificate of Incorporation of the Registrant (incorporated by reference to Exhibit 3.1 to
Registrant’sRegistrant's Report on Form 10-Q
(Registration No. 000-30975) filed on November 14, 2005.
3.2
Amended and Restated Bylaws of the Registrant
(incorporated by reference to Exhibit 3.2 to Registration Statement on Form S-1 (Registration No. 333-32174) filed on March 10, 2000)(filed herewith).
4.
4.1 Form of Certificate of the
Registrant’sRegistrant's Common Stock (incorporated by reference to Exhibit 4 to Registration Statement on Form S-1 (Registration No. 333-32174) filed on March 10, 2000).
| |
| 4.2 | Certificate of Designation of Series A Convertible Preferred Stock dated as of December 28, 2010 (incorporated by reference to Exhibit 3.1 to the Registrant's Report on Form 8-K filed on January 4, 2011). |
*10.1 2006 Equity Incentive Plan of the Registrant (incorporated by reference to Exhibit 4(b) to Registration on Form S-8 (Registration No. 333-139999) filed on January 16, 2007.
*10.2 1999 UK Approved Stock Option Sub Plan of the Registrant (incorporated by reference to Exhibit 10.7 to Registration Statement on Form S-1 (Registration No. 333-32174) filed on March 10, 2000).
*10.3
Employee Stock Purchase Plan of the Registrant (incorporated by reference to Exhibit 4(b) to Registration Statement on Form S-8 (Registration No. 333-71866) filed on October 19, 2001).10.4 Employment Agreement between the Company and Craig J. Tuttle dated July 12, 2006 (incorporated by reference to Exhibit 10.1 to Registrant’sRegistrant's Report on Form 8-K (Registration No. 000-30975) filed on July 12, 2006.
10.5
*10.4 Amendment No. 1 to the Employment Agreement between the Company and Craig J. Tuttle, effective July 12, 2006 (incorporated by reference to Exhibit 10.1 to
Registrant’sRegistrant's Report on Form 10-Q
(Registration No. 000-30975) filed on November 14, 2006.
10.6 Employment Agreement between the Company and Debra A. Schneider, effective December 4, 2006, (incorporated by reference to Exhibit 10.1 to Registrant’s Report on Form 8-K (Registration No. 000-30975) filed on November 15, 2006.
10.7
10.5 License Agreement, dated September 1, 1994, between Registrant and Professor Dr. Gunther Bonn, et. al. and Amendment thereto, dated March 14, 1997 (incorporated by reference to Exhibit 10.14 to Registration Statement on Form S-1 (Registration No. 333-32174) filed on March 10, 2000).
10.8
10.6 License Agreement, dated August 20, 1997, between the Registrant and Leland Stanford Junior University (incorporated by reference to Exhibit 10.15 to Registration Statement on Form S-1 (Registration No. 333-32174) filed on March 10, 2000).
10.9
10.7 License Agreement, dated December 1, 1989, between Cruachem Holdings Limited (a wholly owned subsidiary of the Registrant) and Millipore Corporation (incorporated by reference to Exhibit 10.13 to
Registrant’sRegistrant's Annual Report on Form 10-K filed on March 25, 2002).
10.10 ��
10.8 Sublicense Agreement, dated October 1, 1991, between Cruachem Holdings Limited (a wholly owned subsidiary of the Registrant) and Applied Biosystems, Inc. (incorporated by reference to Exhibit 10.14
to
Registrant’sRegistrant's Annual Report on Form 10-K filed on March 25, 2002).
10.11
10.9 Missives, dated May 17, 2002, between Cruachem Limited (a wholly-owned subsidiary of the Registrant) and Robinson Nugent (Scotland) Limited (incorporated by reference to Exhibit 10.1 to
Registrant’sRegistrant's Quarterly Report on Form 10-Q filed on August 14, 2002).
10.12
10.10 License Amendment Agreement, dated June 2, 2003, by and between Geron Corporation and the Registrant (incorporated by reference to Exhibit 10.2 to
Registrant’sRegistrant's Quarterly Report on Form 10-Q filed on August 12, 2003).
10.13
10.11 Supply Agreement, dated January 1, 2000, between the Registrant and Hitachi Instruments (incorporated by reference to Exhibit 10.16 to Registration Statement on Form S-1 (Registration No. 333-32174) filed on March 10, 2000).
10.14
10.12 Common Stock Purchase Warrant by and between the Registrant and Laurus Master Fund, Ltd., dated December 3, 2003 (incorporated by reference to Exhibit 10.4 to the Registration Statement on Form S-3 of the Registrant (Registration No. 333-111442) filed on December 22, 2003).
10.15
10.13 Registration Rights Agreement by and between the Registrant and Laurus Master Fund, Ltd., dated December 3, 2003 (incorporated by reference to Exhibit 10.5 to the Registration Statement on Form S-3 of the Registrant (Registration No. 333-111442) filed on December 22, 2003).
10.16 Common Stock Purchase Warrant by and between the Registrant and TN Capital Equities, Ltd., dated December 3, 2003 (incorporated by reference to Exhibit 10.6 to the Registration Statement on Form S-3 of the Registrant (Registration No. 333-111442) filed on December 22, 2003).
10.17
10.14 Securities Purchase Agreement by and between the Registrant and Laurus Master Fund, Ltd., dated February 19, 2004, as amended on April 15, 2004 (incorporated by reference to Exhibit 10.1 to the Registration Statement on Form S-3 of the Registrant (Registration No. 333-114661) filed on April 21, 2004).
10.18
10.15 Amendment to Securities Purchase Agreement and Related Document by and between the Registrant and Laurus Master Fund, Ltd., dated August 31, 2004 (incorporated by reference to Exhibit 10.1 to the Registration Statement on Form S-3 (Registration No. 333-118970) as filed on September 14, 2004).
10.19
10.16 Common Stock Purchase Warrant by and between the Registrant and Laurus Master Fund, Ltd., dated February 19, 2004, as amended on April 15, 2004 (incorporated by reference to Exhibit 10.3 to the Registration Statement on Form S-3 of the Registrant (Registration No. 333-114661) filed on April 21, 2004).
10.20
10.17 Registration Rights Agreement by and between the Registrant and Laurus Master Fund, Ltd., dated February 19, 2004 (incorporated by reference to Exhibit 10.4 to the Registration Statement on Form S-3 of the Registrant (Registration No. 333-114661) filed on April 21, 2004).
10.21 Common Stock Purchase Warrants by and between the Registrant and TN Capital Equities, Ltd., dated March 1, 2004 (incorporated by reference to Exhibit 10.2 to the Registration Statement on Form S-3 of the Registrant (Registration No. 333-114661) filed on April 21, 2004).
10.22
10.18 Common Stock Purchase Warrant by and between the Registrant and Laurus Master Fund, Ltd., dated August 31, 2004 (incorporated by reference to Exhibit 10.3 to the Registration Statement on Form S-3 (Registration No. 333-118970) as filed on September 14, 2004).
10.23
10.19 Form of Securities Purchase Agreement by and between the Registrant and various
counterpartiescounter-parties dated September 22, 2005 (incorporated by reference to Exhibit 10.1 to the Registrants Quarterly Report on Form 10-Q filed on November 14, 2005).
10.24
10.20 Common Stock Purchase Warrant by and between the Registrant and Oppenheimer & Co., Inc. dated October 27, 2005 (incorporated by reference to Exhibit 10.34 to the Registrants Annual Report on Form 10-K filed on March 31, 2006).
10.25
10.21 Letter Agreement by and between the Registrant and Laurus Master Fund, Ltd. dated October 31, 2005 (incorporated by reference to Exhibit 10.36 to the Registrants Annual Report on Form 10-K filed on March 31, 2006).
10.26
* 10.22 Employment Agreement Extension between the Company and Craig Tuttle dated July 12, 2008 (incorporated by reference to
Registrant’sRegistrant's Report on Form 8-K
(Registration No. 000-30975) filed on July 16, 2008).
10.27
10.23 License Agreement between the Company and the Dana-Farber Cancer Institute dated October 8, 2009 (incorporated by reference to Exhibit 10.1 to the
Registrant’sRegistrant's Quarterly Report on Form 10-Q filed on November 5, 2009).
10.28
10.24 License Agreement between the Company and Power3 Medical Products, Inc. dated January 23, 2009 (incorporated by reference to Exhibit 10.2 to the
Registrant’sRegistrant's Quarterly Report on Form 10-Q filed on November 5, 2009).
| |
| +10.25 | Asset Purchase Agreement, dated November 29, 2010, by and among PGxHealth, LLC, Clinical Data, Inc. and Transgenomic, Inc. (incorporated by reference to Exhibit 2.1 to the Registrant's Current Report on Form 8-K filed on January 4, 2011). |
| |
| +10.26 | Amendment to Asset Purchase Agreement, dated December 29, 2010, by and among PGxHealth, LLC, Clinical Data, Inc. and Transgenomic, Inc. (incorporated by reference to Exhibit 2.2 to the Registrant's Current Report on Form 8-K filed on January 4, 2011). |
10.27 Series A Convertible Preferred Stock Purchase Agreement with Third Security dated December 29, 2010 (incorporated by reference to Exhibit 4.1 to the Registrant's Current Report on Form 8-K filed on January 4, 2011).
| |
| 10.28 | Form of Series A Convertible Preferred Stock Warrant issued to Third Security Senior Staff 2008 LLC, Third Security Staff 2010 LLC, and Third Security Incentive 2010 LLC on December 29, 2010 (incorporated by reference to Exhibit 4.2 to the Registrant's Current Report on Form 8-K filed on January 4, 2011). |
| |
| 10.29 | Registration Rights Agreement, dated December 29, 2010, by and among Transgenomic, Inc., Third Security Senior Staff 2008 LLC, Third Security Staff 2010 LLC, and Third Security Incentive 2010 LLC (incorporated by reference to Exhibit 4.3 to the Registrant's Current Report on Form 8-K filed on January 4, 2011). |
| |
| 10.30 | Secured Promissory Note, issued December 29, 2010 by Transgenomic, Inc. in favor of PGxHealth, LLC (incorporated by reference to Exhibit 4.4 to the Registrant's Current Report on Form 8-K filed on January 4, 2011). |
| |
| 10.31 | Secured Promissory Note, issued December 29, 2010 by Transgenomic, Inc. in favor of PGxHealth, LLC (incorporated by reference to Exhibit 4.5 to the Registrant's Current Report on Form 8-K filed on January 4, 2011). |
| |
| 10.32 | Sublease Agreement, dated December 29, 2010, by and between Transgenomic, Inc. and Clinical Data, Inc. (incorporated by reference to Exhibit 10.1 to the Registrant's Current Report on Form 8-K filed on January 4, 2011). |
| |
| 10.33 | Noncompetition and Nonsolicitation Agreement, dated December 29, 2010, by and among PGxHealth, LLC, Clinical Data, Inc. and Transgenomic, Inc. (incorporated by reference to Exhibit 10.2 to the Registrant's Current Report on Form 8-K filed on January 4, 2011). |
| |
| 10.34 | Security Agreement, dated December 29, 2010, by and between PGxHealth, LLC and Transgenomic, Inc. (incorporated by reference to Exhibit 10.3 to the Registrant's Current Report on Form 8-K filed on January 4, 2011). |
| |
| 10.35 | First Amendment to Registration Rights Agreement dated November 8, 2011 (incorporated by reference to Exhibit 4.2 to the Registrant's Current Report on Form 8-K filed on November 14, 2011). |
| |
| 10.36 | Agreement Regarding Preferred Stock dated November 8, 2011 (incorporated by reference to Exhibit 10.1 to the Registrant's Current Report on Form 8-K filed on November 14, 2011). |
| |
| 10.37 | Convertible Promissory Note Purchase Agreement by and among the Company; Third Security Senior Staff 2008 LLC; Third Security Staff 2010 LLC; and Third Security Incentive 2010 LLC dated December 30, 2011 (incorporated by referenced to Exhibit 10.1 to the Registrant's Current Report on Form 8-K filed on January 6, 2012). |
| |
| 10.38 | Convertible Promissory Note by and between Transgenomic, Inc. and Third Security Senior Staff 2008 |
LLC dated December 30, 2011(incorporated by referenced to Exhibit 10.2 to the Registrant's Current Report on Form 8-K filed on January 6, 2012).
| |
| 10.39 | Convertible Promissory Note by and between Transgenomic, Inc. and Third Security Staff 2010 LLC dated December 30, 2011 (incorporated by referenced to Exhibit 10.3 to the Registrant's Current Report on Form 8-K filed on January 6, 2012). |
| |
| 10.40 | Convertible Promissory Note by and between Transgenomic, Inc. and Third Security Incentive 2010 LLC dated December 30, 2011(incorporated by referenced to Exhibit 10.4 to the Registrant's Current Report on Form 8-K filed on January 6, 2012). |
| |
| 10.41 | Securities Purchase Agreement entered into by and among the Company and the Investors dated February 2, 2012 (incorporated by reference to Exhibit 10.1 to the Registrant's Current Report on Form 8-K filed on February 7, 2012). |
| |
| 10.42 | Form of Warrant issued by the Company to the Third Securities Entities on February 7, 2012(incorporated by referenced to Exhibit 10.2 to the Registrant's Current Report on Form 8-K filed on February 7, 2012). |
| |
| 10.43 | Form of Warrant issued by the Company to the Investors on February 7, 2012 (incorporated by reference to Exhibit 10.3 to the Registrant's Current Report on Form 8-K filed on February 7, 2012). |
| |
| 10.44 | Form of Registration Rights Agreement entered into by and among the Company, the Third Securities Entities and the Investors dated February 2, 2012 (incorporated by reference to Exhibit 10.4 to the Registrant's Current Report on Form 8-K filed on February 7, 2012). |
21 Subsidiaries of the Registrant.
23 Consent of Independent Registered Public Accounting Firm.
31 Certifications pursuant to Section 302 of the Sarbanes-Oxley Act of 2002.
** 32 Certifications pursuant to Section 906 of the Sarbanes-Oxley Act of 2002.
|
| | |
| 101.INS | | XBRL Instance Document *** |
| | |
| 101.SCH | | XBRL Taxonomy Extension Schema Document *** |
| | |
| 101.CAL | | XBRL Taxonomy Extension Calculation Linkbase Document *** |
| | |
| 101.DEF | | XBRL Taxonomy Extension Definition Linkbase Document *** |
| | |
| 101.LAB | | XBRL Taxonomy Extension Label Linkbase Document *** |
| | |
| 101.PRE | | XBRL Taxonomy Extension Presentation Linkbase Document *** |
| | |
| |
| * | Denotes exhibit that constitutes a management contract, or compensatory plan or arrangement. |
| |
| ** | This certification is not deemed “filed” for purposes of Section 18 of the Securities Exchange Act of 1934, or otherwise subject to the liability of that section. Such certification will not be deemed to be incorporated by reference into any filing under the Securities Act of 1933 or the Securities Exchange Act of 1934, except to the extent that the Company specifically incorporates it by reference. |
| |
| *** | XBRL information is furnished and not filed for purposes of Sections 11 and 12 of the Securities Act of 1933 and Section 18 of the Securities Act of 1934, and is not subject to liability under those sections, is not part of any registration statement or prospectus to which it relates and is not incorporated or deemed to be incorporated by |
reference into any registration statement, prospectus or other document.
| |
| + | Confidential treatment has been requested with respect to certain portions of this exhibit. Omitted portions have been filed separately with the SEC. |
Pursuant to the requirements of Section 13 or 15(d) of the Securities Exchange Act of 1934, the registrant has duly caused this report to be signed on its behalf by the undersigned, thereunto duly authorized on this
25th14th day of
February 2010.March 2012. |
| | |
TRANSGENOMIC, INC.
|
| |
By:
| | |
| TRANSGENOMIC, INC. |
| |
| By: | | /s/ CRAIG J. TUTTLE |
| | President and Chief Executive Officer |
Pursuant to the requirements of Section 13 or 15(d) of the Securities Exchange Act of 1934, this report has been signed below by the following persons on behalf of the registrant and in the capacities indicated on this
25th14th day of
February 2010.March 2012. | | | | |
| | |
Signature
| | |
| |
| Signature | | Title |
| | |
Craig J. Tuttle | | | | Director, President and Chief Executive Officer (Principal Executive Officer) |
| | |
/s/ DEBRA A. SCHNEIDERDebra A. Schneider
BRETT L. FREVERTBrett L. Frevert | | | | Chief Financial Officer (Principal Financial Officer and Principal Accounting Officer) |
| | |
Rodney S. Markin | | | | Director
|
| | |
/s/ GREGORY T. SLOMA*
Gregory T. Sloma
| | | | Director |
| | |
/s/ JEFFREY L. SKLAR*Jeffrey L. Sklar
| | ANTONIUS P. SCHUH* Antonius P. Schuh | | Director |
| | |
/s/ MICHAEL B. McNULTY*Michael B. McNulty
| | ROBERT M. PATZIG* Robert M. Patzig | | Director |
| | |
/s/ ANTONIUS P. SCHUH*Antonius P. Schuh
| | DOIT L. KOPPLER II* Doit L. Koppler II | | Director |
| | |
| *By Craig J. Tuttle, as attorney-in-fact | | |
| | |
| | |
Attorney-in-fact for the individuals as indicated. | | | | |
K-58