


UNITED STATES
SECURITIES AND EXCHANGE COMMISSION
Washington, D.C. 20549
Form 10-K
| x | ANNUAL REPORT PURSUANT TO SECTION 13 OR 15(d) OF THE SECURITIES EXCHANGE ACT OF 1934 |
For the fiscal year ended December 31, 20092010
OR
| ¨ | TRANSITION REPORT PURSUANT TO SECTION 13 OR 15(d) OF THE SECURITIES EXCHANGE ACT OF 1934 |
For the transition period from to
Commission File No. 1-11442
CHART INDUSTRIES, INC.
(Exact Name of Registrant as Specified in its Charter)
| Delaware | 34-1712937 | |
(State or Other Jurisdiction of Incorporation or Organization) | (IRS Employer Identification No.) |
| One Infinity Corporate Centre Drive, | ||
| Suite 300, Garfield Heights, Ohio | 44125-5370 | |
| (Address of Principal Executive Offices) | (Zip Code) |
Registrant’s telephone number, including area code:
(440) 753-1490
Securities registered pursuant to Section 12(b) of the Act:
Title of Each Class | Name of Each Exchange on Which Registered | |
| Common Stock, par value $0.01 | The NASDAQ Stock Market LLC |
Securities registered pursuant to Section 12(g) of the Act:
None
Indicate by check mark if the registrant is a well-known seasoned issuer, as defined in Rule 405 of the Securities Act. Yes ¨x No x¨
Indicate by check mark if the registrant is not required to file reports pursuant to Section 13 or Section 15(d) of the Act. Yes ¨ No x
Indicate by check mark whether the registrant: (1) has filed all reports required to be filed by Section 13 or 15(d) of the Securities Exchange Act of 1934 during the preceding 12 months (or for such shorter period that the registrant was required to file such reports), and (2) has been subject to such filing requirements for the past 90 days. Yes x No ¨
Indicate by check mark whether the registrant has submitted electronically and posted on its corporate Web site, if any, every Interactive Data File required to submitted and posted pursuant to Rule 405 of Regulation S-T (§ 232.405 of this chapter) during the preceding 12 months (or for such shorter period that the registrant was required to submit and post such files). Yes ¨x No ¨
Indicate by check mark if disclosure of delinquent filers pursuant to Item 405 of Regulation S-K (§229.405) is not contained herein, and will not be contained, to the best of registrant’s knowledge, in definitive proxy or information statements incorporated by reference in Part III of this Form 10-K or any amendment to this Form 10-K. x
Indicate by check mark whether the registrant is a large accelerated filer, an accelerated filer, a non-accelerated filer or a smaller reporting company. See definition of “large accelerated filer,” “accelerated filer” and “smaller reporting company” in Rule 12b-2 of the Exchange Act. (Check one):
| Large accelerated filer | Accelerated filer | |||||
| Non-accelerated filer | ¨ (Do not check if a smaller reporting company) | Smaller reporting company | ¨ | |||
Indicate by check mark whether the registrant is a shell company (as defined in Rule 12b-2 of the Exchange Act). Yes ¨ No x
The aggregate market value of the voting common equity held by non-affiliates computed by reference to the price of $18.18$15.58 per share at which the common equity was last sold, as of the last business day of the registrant’s most recently completed second fiscal quarter, was $510,957,936.$440,266,729.
As of February 15, 2010,2011, there were 28,491,24628,884,838 outstanding shares of the Company’s common stock, par value $0.01 per share.
Documents Incorporated by Reference
Portions of the following document are incorporated by reference into Part III of this Annual Report on Form 10-K: the definitive Proxy Statement to be used in connection with the Registrant’s Annual Meeting of Stockholders to be held on May 27, 201026, 2011 (the “2010“2011 Proxy Statement”).
Except as otherwise stated, the information contained in this Annual Report on Form 10-K is as of December 31, 2009.2010.
PART I
| Item 1. | Business. |
THE COMPANY
Overview
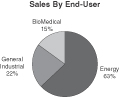
Chart Industries, Inc., a Delaware corporation incorporated in 1992 (the “Company,” “Chart” or “we”), is a leading independent global manufacturer of highly engineered equipment used in the production, storage and end-use of hydrocarbon and industrial gases, based on our sales and the estimated sales of our competitors. We supply engineered equipment used throughout the global liquid gas supply chain. The largest portion of end-use applications for our products is energy-related, accounting for approximately 63%47% of sales and 46%49% of orders in 2009,2010, and 70%71% of backlog at December 31, 2009.2010. We are a leading manufacturer of standard and engineered equipment primarily used for low-temperature and cryogenic applications. We have developed an expertise in cryogenic systems and equipment, which operate at low temperatures sometimes approaching absolute zero (0 kelvin; -273° Centigrade; -459° Fahrenheit). The majority of our products, including vacuum insulated containment vessels, heat exchangers, cold boxes and other cryogenic components, are used throughout the liquid gas supply chain for the purification, liquefaction, distribution, storage and end-use of hydrocarbon and industrial gases.
Our primary customers are large, multinational producers and distributors of hydrocarbon and industrial gases and their suppliers. We sell our products and services to more than 2,000 customers worldwide. We have developed long-standing relationships with leading companies in the gas production, gas distribution, gas processing, liquefied natural gas or LNG, chemical and industrial gas industries, including Air Products, Praxair, Airgas, Air Liquide, The Linde Group or Linde, JGC Corporation or JGC, Bechtel Corporation, Jacobs Engineering Group, Inc. or Jacobs, ExxonMobil, British Petroleum or BP, ConocoPhillips, Saudi Aramco, Shaw Stone & Webster, ABB Lummus, Uhde, CTCI Corporation or CTCI, Toyo, Samsung, Technip, Daelim, and Energy World Corporation or EWC, many of whom have been purchasing our products for over 20 years.
We have attained this position by capitalizing on our low-cost global manufacturing footprint, technical expertise and know-how, broad product offering, and reputation for quality, and by focusing on attractive, growing markets. We have an established sales and customer support presence across the globe and low cost manufacturing operations in the United States, Central Europe and China. For the years ended December 31, 2010, 2009, 2008, and 2007,2008, we generated sales of $591.5$555.5 million, $744.3$597.5 million, and $666.4$753.1 million, respectively.
The following charts show the proportion of our revenues generated by each operating segment as well as our estimate of the proportion of revenue generated by end-user for the year ended December 31, 2009.2010.
| |
Segments and Products
We operate in three segments: (i) Energy & Chemicals or E&C, (ii) Distribution and Storage or D&S and (iii) BioMedical. While each segment manufactures and markets different cryogenic equipment and systems to distinct end-users, they all share a reliance on our heat transfer and low temperature storage know-how and
2
expertise. The E&C and D&S segments manufacture products used primarily in energy-related and general industrial applications, such as the separation, liquefaction, distribution and storage of hydrocarbon and industrial gases. Through our BioMedical segment, we supply cryogenic and other equipment used in the storage and
2
distribution of biological materials and oxygen, used primarily in the medical, biological research and animal breeding industries. Further information about these segments is located in Note K to the Company’s consolidated financial statements included in Item 8 of this Annual Report on Form 10-K.
Energy and Chemicals Segment
Our principal products within the E&C segment, which accounted for 43%25% of sales for the year ended December 31, 2009,2010, are focused on engineered equipment and systems for the energy and chemicals markets, primarily heat exchangers, Core-in-Kettles®, cold boxes, process systems and LNG vacuum insulated pipe. These products are used by major natural gas, petrochemical processing and industrial gas companies in the production of their products. Our products in the E&C segment include the following:
Heat Exchangers and Core-in-Kettles®
We are a leading designer and manufacturer of cryogenic brazed aluminum and air cooled heat exchangers. Using technology pioneered by us, our brazed aluminum heat exchangers are incorporated into assemblies and cold boxes to facilitate the progressive cooling and liquefaction of air or hydrocarbon mixtures for the subsequent recovery or purification of component gases. In hydrocarbon processing industries, our brazed aluminum heat exchangers allow producers to obtain purified hydrocarbon by-products, such as methane, ethane, propane and ethylene, which are commercially marketable for various industrial or residential uses. In the industrial gas market, our brazed aluminum heat exchangers are used to obtain high purity atmospheric gases, such as oxygen, nitrogen and argon, which have diverse industrial applications.
Our air cooled heat exchangers are used in multiple markets to cool fluids to allow for further processing or to provide condensing of fluids, including hydrocarbon, petrochemical, natural gas processing, and power generation. Our compact Core-in-Kettle® heat exchangers are designed to replace shell-and-tube exchangers, offering significantly more heat transfer surface per unit volume and greatly improving the efficiency of chillers, vaporizers, reboilers and condensers in hydrocarbon applications including ethylene, propylene and LNG. Brazed aluminum and air cooled heat exchangers are engineered to the customer’s requirements and range in price from $20,000 to $2.5 million or more depending on the scope and complexity of the project.
Our heat exchanger demand is primarily driven by activity in the LNG and natural gas segments of the hydrocarbon processing market, as well as the Asian industrial gas market. Other key global drivers involve developing Gas to Liquids, or GTL, and clean coal processes including Coal to Liquids, or CTL, and Integrated Gasification and Combined Cycle, or IGCC, power projects. In the future, management believes that continuing efforts by petroleum producing countries to better utilize stranded natural gas and previously flared gases, as well as efforts to broaden their industrial base, and the developing clean coal initiatives globally present a promising source of demand for our heat exchangers and cold box systems. In addition, demand for heat exchangers and cold boxes in developed countries is expected to continue as firms upgrade their facilities for greater efficiency and regulatory compliance.
Our principal competitors for brazed aluminum heat exchangers are Linde, Sumitomo, Kobe and Fives, and we face competition from a variety of competitors for air cooled heat exchangers. Management believes that we are the only producer of large brazed aluminum heat exchangers in the United States and that we are a leader in the global cryogenic heat exchanger market. Major customers for our heat exchangers in the industrial gas market include Air Liquide, Air Products, Praxair, Hangyang, Kaifeng AireAir Separation and Sichuan Air Separation. In the hydrocarbon processing market, major customers and end-users include BP, ExxonMobil, Saudi Aramco, ConocoPhillips and contractors such as JGC, Bechtel, Jacobs, Kellogg Brown Root or KBR, Technip, ABB Lummus, Toyo, The Shaw Stone and WebsterGroup and Samsung.
3
Cold Boxes
We are a leading designer and fabricator of cold boxes. Cold boxes are highly engineered systems used to significantly reduce the temperature of gas mixtures to the point where component gases liquefy and can be separated and purified for further use in multiple industrial, scientific and commercial applications. In the hydrocarbon processing market, our cold box systems are used in natural gas processing and in the petrochemical industry. In the industrial gas market, cold boxes are used to separate air into its major atmospheric components, including nitrogen, oxygen and argon, where the gases are used in a diverse range of applications such as metal production and heat treating, enhanced oil and gas production, coal gasification, chemical and oil refining, the quick-freezing of food, wastewater treatment and industrial welding. The construction of a cold box generally consists of one or more brazed aluminum heat exchangers and other equipment packaged in a “box” consisting of a structural metal framing andframe encasing a complex system of piping, valves and valves.instrumentation. Cold boxes, which are designed and fabricated to order, sell in the price range of $1 million to $20 million, with the majority of cold boxes priced between $1 million and $5 million.
We have a number of competitors for fabrication of cold boxes, including Linde, Air Products, Praxair, Air Liquide and many smaller fabrication-only facilities around the world. Principal customers and end-users for our cold boxes include Air Liquide, ABB Lummus, BP, Bechtel, Saudi Aramco, Jacobs, JGC, Technip, Toyo, The Shaw Stone and Webster,Group, Samsung and KBR.
Process Systems
We are a leading designer, engineerleader in the design and manufacturermanufacturing of highly engineered hydrocarbon process systems specifically for those markets requiring proprietary cryogenic processing technology. These “Concept-to-Reality” process systems incorporate many of our ownChart’s core products, including brazed aluminum heat exchangers, Core-in-Kettles®,cold boxes, vessels, pipe work and air cooled heat exchangers. These systems, which are custom engineered and manufactured to order, typically sell in the price range of $5 million to over $100 million, depending on the scope and complexity of the project, with the majority of the systems priced between $5 million and $60$25 million.
Our principal markets include LNG, nitrogen rejection, or NRU,ammonia purification, propane dehydrogenation or PDH, HYCO/hydrogen recovery, LNG and Ryan-Holmes CO2 bulk removal technology for enhanced oil recovery and CO2 sequestration.
We have a number of competitors for our process systems including Linde, Air Products, and other smaller engineering, procurement and construction, or EPC, firms to whom we also act as a supplier of equipment including heat exchangers and cold boxes. Principal customers and end-users for our process systems include EWC, ABB Lummus, ExxonMobil, Jacobs, and the Shaw Stone and Webster,Group, CTCI, Samsung, Uhde and KBR.
LNG Vacuum Insulated Pipe
This product line consists of vacuum insulated pipe, or VIP, used for LNG transportation within both export and import terminals. This is expected to be a long-term growth market despite the current global economic crisis as new LNG infrastructure is added around the world. LNG VIP is fabricated to order with projects varying in size from $500,000 to $25 million. Our competitors in the LNG VIP market include Technip and ITP. In general, our customers are the major EPC firms, such as Technip and Bechtel. LNG VIP competes directly with mechanically insulated pipe which takes longer to install and requires higher maintenance over its life.
4
Distribution and Storage Segment
Through our D&S segment, which accounted for 42%48% of our sales for the year ended December 31, 2009,2010, we are a leading supplier of cryogenic equipment to the global bulk and packaged industrial gas markets. Demand for the products supplied by this segment is driven primarily by the significant installed base of users of
4
cryogenic liquids as well as new applications and distribution technologies for cryogenic liquids. Our products span the entire spectrum of the industrial gas market from small customers requiring cryogenic packaged gases to large users requiring custom engineered cryogenic storage systems. Our products in the D&S segment include the following:
Cryogenic Bulk Storage Systems
We are a leading supplier of cryogenic bulk storage systems of various sizes ranging from 500 gallons to 180,000250,000 gallons. Using sophisticated vacuum insulation systems placed between inner and outer vessels, these bulk storage systems are able to store and transport liquefied industrial gases and hydrocarbon gases at temperatures from -100° Fahrenheit to temperatures nearing absolute zero. End use customers for our cryogenic storage tanks include industrial gas producers and distributors, chemical producers, manufacturers of electrical components, health care organizations, food processors and businesses in the oil and natural gas industries. Prices for our cryogenic bulk storage systems range from $10,000 to $1 million. Global industrial gas producers and distributors, including Air Products, Air Liquide, Linde, Airgas, Praxair and Messer, are significant customers for our cryogenic bulk storage systems. On a worldwide basis, we compete primarily with Taylor-Wharton International or Taylor-Wharton in this product area. In the European and Asian markets, we compete with several suppliers owned by the global industrial gas producers as well as independent regional suppliers.
Cryogenic Packaged Gas Systems
We are a leading supplier of cryogenic packaged gas systems of various sizes ranging from 160 liters to 3,000 liters. Cryogenic liquid cylinders are used extensively in the packaged gas industry to allow smaller quantities of liquid to be easily delivered to the customers of industrial gas distributors on a full-for-empty or fill-on-site basis. Principal customers for our liquid cylinders are the same global industrial gas producers and the North American industrial gas distributors who purchase our cryogenic bulk storage systems. We compete on a worldwide basis primarily with Taylor-Wharton in this product area. We have developed two technologies in the packaged gas product area: ORCA Micro-Bulk systems and Tri-fecta® Laser Gas assist systems. ORCA Micro-Bulk systems bring the ease of use and distribution economics of bulk gas supply to customers formerly supplied by high pressure or cryogenic liquid cylinders. The ORCA Micro-Bulk system is the substantial market leader in this growing product line. The Tri-fecta® Laser Gas assist system was developed to meet the “assist gas” performance requirements for new high powered lasers being used in the metal fabrication industry.
Cryogenic Systems and Components
Our line of cryogenic components, including VIP, engineered bulk gas installations, specialty liquid nitrogen, or LN2, end-use equipment and cryogenic flow meters are recognized in the market for their reliability, quality and performance. These products are sold to industrial gas producers, as well as to a diverse group of distributors, resellers and end users. We compete with a number of suppliers of cryogenic systems and components, including Acme Cryogenics, Vacuum Barrier Corporation and others. Additionally, in 2010 we completed the acquisition of Cryotech which is a manufacturer of LN2 dosing systems for food and beverage packaging applications located in San Jose, California. Cryotech expands our expertise in LN2 end use applications and distributes its products globally.
LNG Applications
We supply cryogenic solutions for the storage, distribution, vaporization, and application of LNG. LNG may be utilized as a primary source of heat or power at industrial or residential complexes located away from a natural gas pipeline. LNG may also be used for peak shaving or as a back upbackup supply at remote locations. We refer to this as a Virtual Pipeline“Virtual Pipeline” as the natural gas pipeline is replaced with cryogenic containersdistribution to deliver the gas to the end user. We supply cryogenic trailers, bulk storage tanks, tap-off facilities, and vaporization equipment
5
specially configured for LNG into Virtual Pipeline applications. LNG may also be used as a fuel to power vehicles.
5
vehicles or ships. LNG vehicle fueling applications consist of LNG and liquid/compressed natural gas refueling systems for centrally fueled fleets of vehicles powered by natural gas, such as fleets operated by metropolitan transportation authorities, refuse haulers and heavy-duty truck fleets. We sell LNG applications around the world from all D&S facilities to numerous end users, energy companies, and gas distributors. Competition for LNG applications is based primarily on product design, customer support and service, dependability and price. Our competitors tend to be regionally focused or product specific while Chart is able to supply a broad range of solutions required by LNG applications.
Beverage Liquid CO2 Systems
This product line consists primarily of vacuum insulated, bulk liquid CO2 containers used for beverage carbonation in restaurants, convenience stores and cinemas, in sizes ranging from 100 pounds to 750 pounds of liquid CO2storage. We also manufacture and market non-insulated, bulk fountain syrup containers for side-by-side installation with our CO2 systems. Our beverage systems are sold to national restaurant chains, soft drink companies and CO2 distributors. Our primary competitors for our bulk liquid CO2 beverage delivery systems are Taylor-Wharton and other producers of high-pressure gaseous CO2 cylinders.
Cryogenic Services
We operate locations in the United States and Europe providing installation, service, repair and maintenance of cryogenic products including storage tanks, liquid cylinders, cryogenic trailers, cryogenic pumps, cryogenic flow meters and VIP. In 2010, we opened a comprehensive service facility in McCarran, Nevada that allows us to provide a full range of repair services for equipment located west of the Rocky Mountains.
BioMedical Segment
The BioMedical segment, which accounted for 15%27% of our sales for the year ended December 31, 2009,2010, consists of various product lines built around our core competencies in cryogenics, but with a focus on the respiratory and biological users of the liquids and gases instead of the large producers and distributors of cryogenic liquids. Our products in the BioMedical segment include the following:
Respiratory Products
Our respiratory oxygen product line is comprised of a limited range of medical respiratory products, including liquid oxygen systems and ambulatory oxygen systems, both of which are used primarily for the in-home supplemental oxygen treatment of patients with chronic obstructive pulmonary diseases, such as bronchitis, emphysema and asthma. We further expanded our respiratory product offering in 2010 by acquiring SeQual Technologies, Inc., which designs, manufactures, and services portable oxygen concentrators, stationary concentrators, and emergency medical products.
Individuals for whom supplemental oxygen is prescribed generally receive an oxygen system from a home healthcare provider, medical equipment dealer, or gas supplier. The provider or physician usually selects which type of oxygen system to recommend to its customers: liquid oxygen systems, oxygen concentrators or high-pressure oxygen cylinders. Of these modalities, physicians generally believe that liquid oxygen offers greater long-term therapeutic benefits by providing the option of increased patient ambulation.
We believe that competition for liquid oxygen systems is based primarily upon product quality, performance, reliability, ease-of-use and price, and we focus our marketing strategies on these considerations. Furthermore, competition also includes the impact of other modalities including concentrators, homefill and cylinders in the broader respiratory market.
6
Biological Storage Systems
This product line consists of vacuum insulated containment vessels for the storage of biological materials. The primary markets for this product line include medical laboratories, biotech/pharmaceutical, research
6
facilities, blood and tissue banks, veterinary laboratories, large-scale repositories and artificial insemination, particularly in the beef and dairy industry.
The significant competitors for biological storage systems include a few large companies worldwide, such as Taylor-Wharton, Air Liquide and Ind-Burma Petroleum Company, or IBP. These products are sold through multiple channels of distribution specifically applicable to each market sector. The distribution channels range from highly specialized cryogenic storage systems providers to general supply and catalogue distribution operations to breeding service providers. Historically, competition in this field has been focused on design, reliability and price. Alternatives to vacuum insulated containment vessels include mechanical, electrically powered refrigeration.
Engineering and Product Development
Our engineering and product development activities are focused primarily on developing new and improved solutions and equipment for the users of cryogenic liquids. Our engineering, technical and marketing employees actively assist customers in specifying their needs and in determining appropriate products to meet those needs. Portions of our engineering expenditures typically are charged to customers, either as separate items or as components of product cost.
Competition
We believe we can compete effectively around the world and that we are a leading competitor in our markets. Competition is based primarily on performance and the ability to provide the design, engineering and manufacturing capabilities required in a timely and cost-efficient manner. Contracts are usually awarded on a competitive bid basis. Quality, technical expertise and timeliness of delivery are the principal competitive factors within the industry. Price and terms of sale are also important competitive factors. Because independent third-party prepared market share data is not available, it is difficult to know for certain our exact position in our markets, although we believe we rank among the leaders in each of the markets we serve. We base our statements about industry and market positions on our reviews of annual reports and published investor presentations of our competitors and augment this data with information received by marketing consultants conducting competition interviews and our sales force and field contacts.
Marketing
We market our products and services throughout the world primarily through direct sales personnel and through independent sales representatives and distributors. The technical and custom design nature of our products requires a professional, highly trained sales force. While each salesperson and sales representative is expected to develop a highly specialized knowledge of one product or group of products within one of our segments, each salesperson and certain sales representatives are able to sell many products from different segments to a single customer. We use independent sales representatives and distributors to market our products and services in certain foreign countries that we serve and in certain North American markets. These independent sales representatives supplement our direct sales force in dealing with language and cultural matters. Our domestic and foreign independent sales representatives earn commissions on sales, which vary by product type.
Backlog
The dollar amount of our backlog as of December 31, 2010, 2009 and 2008 and 2007 was $236.4 million, $185.1 million $398.8 million and $475.3$398.8 million, respectively. Backlog is comprised of the portion of firm signed purchase orders or other written contractual commitments received from customers that we have not recognized as revenue under the percentage of completion method or based upon shipment. Backlog can be significantly affected by the
7
timing of orders for large products, particularly in the E&C segment, and the amount of backlog at December 31, 20092010 described above is not necessarily indicative of future backlog levels or the rate at which backlog will be
7
recognized as sales. Orders included in our backlog may include customary cancellation provisions under which the customer could cancel all or part of the order, potentially subject to the payment of certain costs and/or penalties. For further information about our backlog, including backlog by segment, see Item 7. “Management’s Discussion and Analysis of Financial Condition and Results of Operations.”
Customers
We sell our products primarily to gas producers, distributors and end-users across the industrial gas, hydrocarbon and chemical processing industries in countries throughout the world. Sales to our top ten customers accounted for 47%38%, 48%47% and 45%48% of consolidated sales in 2010, 2009 and 2008, and 2007, respectively. Sales to Air Liquide in 2008 and 2007 represented approximately 10% of our consolidated sales each year. No single customer exceeded 10% of consolidated sales in 2009.2010. Our sales to particular customers fluctuate from period to period, but the global producers and distributors of hydrocarbon and industrial gases and their suppliers tend to be a consistently large source of revenue for us. Our supply contracts are generally contracts for “requirements” only. While our customers may be obligated to purchase a certain percentage of their supplies from us, there are generally no minimum requirements. Also, many of our contracts may be cancelled on as little as one month’s notice. To minimize credit risk from trade receivables, we review the financial condition of potential customers in relation to established credit requirements before sales credit is extended and monitor the financial condition of customers to help ensure timely collections and to minimize losses. In addition, for certain domestic and foreign customers, particularly in the E&C segment, we require advance payments, letters of credit and other such guarantees of payment. Certain customers also require us to issue letters of credit or performance bonds, particularly in instances where advance payments are involved, as a condition of placing the order. We believe our relationships with our customers are generally good.
Intellectual Property
Although we have a number of patents, trademarks and licenses related to our business, no one of them or related group of them is considered by us to be of such importance that its expiration or termination would have a material adverse effect on our business. In general, we depend upon technological capabilities, manufacturing quality control and application of know-how, rather than patents or other proprietary rights, in the conduct of our business.
Raw Materials and Suppliers
We manufacture most of the products we sell. The raw materials used in manufacturing include aluminum products (including sheets, bars, plate and piping), stainless steel products (including sheets, plates, heads and piping), palladium oxide, carbon steel products (including sheets, plates and heads), 9% nickel steel products (including heads and plates), valves and gauges and fabricated metal components. Most raw materials are available from multiple sources of supply. We believe our relationships with our raw material suppliers and other vendors are generally good. During the first half of 2009, commodity metals used by us experienced significant cost reductions due to the depressed business climate and global financial crisis. Raw material prices began increasinghave remained fairly stable during the second half of 20092010, but we expect them to increase somewhat during 2011 as the global economy showed early signs of improvement.markets continue to improve. Subject to certain risks related to our suppliers as discussed under Item 1A. “Risk Factors,” we foresee no acute shortages of any raw materials that would have a material adverse effect on our operations.
Employees
As of January 31, 2010,2011, we had 2,5173,013 employees, including 1,4471,735 domestic employees and 1,0701,278 international employees. These employees consisted of 1,0131,271 salaried, 208216 bargaining unit hourly and 1,2961,526 non-bargaining unit hourly.
8
We are a party to one collective bargaining agreement with the International Association of Machinists and Aerospace Workers covering 208216 employees at our La Crosse, Wisconsin heat exchanger facility. On February 6, 2010, we entered into a new three-year agreement to replace the previous agreement, which expired at that time.
8
Environmental Matters
Our operations have historically included and currently include the handling and use of hazardous and other regulated substances, such as various cleaning fluids used to remove grease from metal, that are subject to federal, state and local environmental laws and regulations. These regulations impose limitations on the discharge of pollutants into the soil, air and water, and establish standards for their handling, management, use, storage and disposal. We monitor and review our procedures and policies for compliance with environmental laws and regulations. Our management is familiar with these regulations and supports an ongoing program to maintain our adherence to required standards.
We are involved with environmental compliance, investigation, monitoring and remediation activities at certain of our owned or formerly owned manufacturing facilities and at one owned facility that is leased to a third party. We believe that we are currently in substantial compliance with all known environmental regulations. We accrue for certain environmental remediation-related activities for which commitments or remediation plans have been developed or for which costs can be reasonably estimated. These estimates are determined based upon currently available facts regarding each facility. Actual costs incurred may vary from these estimates due to the inherent uncertainties involved. Future expenditures relating to these environmental remediation efforts are expected to be made over the next 1817 years as ongoing costs of remediation programs. Although we believe we have adequately provided for the cost of all known environmental conditions, additional contamination, the outcome of disputed matters or changes in regulatory posture could result in more costly remediation measures than budgeted, or those we believe are adequate or required by existing law. We believe that any additional liability in excess of amounts accrued which may result from the resolution of such matters will not have a material adverse effect on our financial position, liquidity, cash flows or results of operations.
Available Information
Additional information about the Company is available at http://www.chart-ind.com.www.chartindustries.com. On the Investor Relations page of the website, the public may obtain free copies of the Company’s Annual Report on Form 10-K, Quarterly Reports on Form 10-Q, Current Reports on Form 8-K and any amendments to those reports filed or furnished pursuant to Section 13(a) or 15(d) of the Securities Exchange Act of 1934 as soon as reasonably practicable following the time that they are filed with, or furnished to, the Securities and Exchange Commission (“SEC”). Additionally, the Company has posted its Code of Ethical Business Conduct and Officer Code of Ethics on its website, which are also available free of charge to any shareholder interested in obtaining a copy. This Form 10-K and reports filed with the SEC are also accessible through the SEC’s website at www.sec.gov.
9
| Item 1A. | Risk Factors. |
Investing in our common stock involves substantial risk. You should carefully consider the risks described below as well as the other information contained in this Annual Report on Form 10-K in evaluating your investment in us. If any of the following risks actually occur, our business, financial condition, operating results or cash flows could be harmed materially. Additional risks, uncertainties and other factors that are not currently known to us or that we believe are not currently material may also adversely affect our business, financial condition, operating results or cash flows. In any of these cases, you may lose all or part of your investment in us.
Risks Related to our Business
The markets we serve are subject to cyclical demand and vulnerable to economic downturn, which could harm our business and make it difficult to project long-term performance.
Demand for our products depends in large part upon the level of capital and maintenance expenditures by many of our customers and end users, in particular those customers in the global hydrocarbon and industrial gas markets. These customers’ expenditures historically have been cyclical in nature and vulnerable to economic downturns. Decreased capital and maintenance spending by these customers could have a material adverse effect on the demand for our products and our business, financial condition and results of operations. In addition, this historically cyclical demand limits our ability to make accurate long-term predictions about the performance of our company. Even if demand starts to improve, it is difficult to predict whether any improvement represents a long-term improving trend or the extent or timing of improvement. There can be no assurance that historically improving cycles are representative of future actual demand.
While we experienced growth in demand from 2003 until mid-2008 in the global hydrocarbon and industrial gas markets, we experienced a significant decline in orders from mid-2008 until mid-2009. While there has been some recent improvement in orders for some of our businesses, certain businesses such as our E&C Process Systems business have not yet experienced improving orders and we cannot predict when they will or whether business performance may be better or worse in the future. We also cannot predict generally when demand will begin to increase substantially from the significant decline in orders that we experienced in 2009 in D&S and E&C as a result of the uncertainty associated with the global credit crisis and economic downturn, the decline in overall energy prices and the decline in capital expenditures by our customers.
The global economic and financial crisis has had and will continue to have a negative effect on our business, financial condition and results of operations.
The global economic and financial market crisis has caused, among other things, a general tightening in the credit markets, lower levels of liquidity, increases in the rates of default and bankruptcy, and reduced corporate profits and capital spending, all of which has had and will continue to have a negative effect on our business, results of operations and financial condition. Demand for our products depends in large part upon the level of capital and maintenance expenditures by many of our customers and end users. Recent economic conditions have reduced the willingness or ability of our customers and prospective customers to commit funds to purchase our products and services, and may reduce their ability to pay for our products and services after purchase. Similarly, our suppliers may not be able to supply us with needed raw materials or components on a timely basis, may increase prices or go out of business, which could result in our inability to meet customer demand, fulfill our contractual obligations or affect our gross margins. See “— We depend on the availability of certain key suppliers; if we experience difficulty with a supplier, we may have difficulty finding alternative sources of supply.” We cannot predict the timing or duration of these negative market conditions or the timing or strength of any economic recovery. If the economy or markets in which we operate remain weak or deteriorate further, our business, financial condition and results of operations will be materially and adversely impacted.
10
The loss of, or significant reduction or delay in, purchases by our largest customers could reduce our revenues and profitability.
A small number of customers has accounted for a substantial portion of our historical net sales. For example, sales to our top ten customers accounted for 47%38%, 48%47% and 45%48% of consolidated sales in 2010, 2009 2008 and 2007,2008, respectively. We expect that a limited number of customers will continue to represent a substantial portion of our sales for the foreseeable future. While our sales to particular customers fluctuate from period to period, the global producers and distributors of hydrocarbon and industrial gases and their suppliers tend to be a consistently large source of revenue for us.
The loss of any of our major customers or a decrease or delay in orders or anticipated spending by such customers could materially reduce our revenues and profitability. Our largest customers could also engage in business combinations, which could increase their size, reduce their demand for our products as they recognize synergies or rationalize assets and increase or decrease the portion of our total sales concentration to any single customer. For example, Linde and BOC engaged in a business combination in 2006, which reduced our sales concentration to these customers. More recently, on February 5, 2010 Air Products announced an offer to acquire Airgas.
Decreases in the marketenergy prices of oil and natural gas may decrease demand for some of our products and cause downward pressure on the prices we charge, which could materially and adversely affectharm our business, financial condition and results of operations.
A significant amount of our sales are to customers in the energy production and supply industry. We estimate that 63%47% of our revenue for the year ended December 31, 20092010 was generated by end-users in the energy industry. Accordingly, demand for a significant portion of our products depends upon the level of capital expenditure by companies in the oil and gas industry, which depends, in part, on energy prices. Following August 2008, theWhile some applications for our products could see greater demand if prices of oil andfor natural gas declined significantly from their highs earlierremain relatively low compared
10
to oil prices, a sustained decline in 2008. Theenergy prices and a resultant downturn in energy production activities has adversely affectedcould negatively affect the demand for somecapital expenditures of our products and could continue to do so if there is a sustained decline in energy prices. In addition, there can be no assurance that the current level of energy prices will not decline in the future.customers. Any significant decline in the capital expenditures of our customers, whether due to a decrease in the market price of energy or otherwise, may decrease demand for our products and cause downward pressure on the prices we charge. Accordingly, if there is a downturn in the energy production and supply industry, experiences continued weakness at current levels or deteriorates further, our business, financial condition and results of operations could be materiallyadversely affected.
Governmental energy policies could change, or expected changes could fail to materialize, which could adversely affect our business or prospects.
Energy policy can develop rapidly in the markets we serve, including the United States. Within the last few years, significant developments have taken place, primarily in international markets that we serve with respect to energy policy and adversely affected.related regulations. We anticipate that energy policy will continue to be an important regulatory priority globally as well as on a national, state and local level. As energy policy continues to evolve, the existing rules and incentives that impact the energy-related segments of our business may change. It is difficult, if not impossible, to predict whether changes in energy policy might occur in the future and the timing of potential changes and their impact on our business. The elimination or reduction of favorable policies for our energy-related business, or the failure of expected policies that would benefit our business to be adopted, could negatively impact our revenues and profitability. For example, China’s 12th Five-Year Plan promotes the use of natural gas, and our business prospects in China could be harmed if China changed that policy. Likewise, if the United States does not adopt a law such as the proposed Natural Gas Act, we would not benefit from any resultant expansion of the LNG infrastructure in the United States.
We may be unable to compete successfully in the highly competitive markets in which we operate.
Although many of our products serve niche markets, a number of our direct and indirect competitors in these markets are major corporations, some of which have substantially greater technical, financial and marketing resources than we,Chart, and other competitors enter these markets from time to time. Any increase in competition may cause us to lose market share or compel us to reduce prices to remain competitive, which could result in reduced sales and earnings. Companies, or their divisions, that operate in our industry include Air Products, Kobe, Linde, Nordon, Sumitomo, CVA and Taylor-Wharton. Additionally, we compete with several suppliers owned by global industrial gas producers and many smaller fabrication-only facilities around the world. Increased competition with these companies could prevent the institution of price increases or could require price reductions or increased spending on research and development, and marketing and sales, any of which could materially reduce our revenues, profitability or both. Moreover, during an industry downturn, competition in some of the product lines we serve increases as a result of over-capacity, which may result in downward pricing pressure. Further, customers who typically outsource their need for cryogenic systems to us may use their excess capacity to produce such systems themselves. We also compete in the sale of a limited number of products with certain of our major customers. If we are unable to compete successfully, our results of operations, cash flows and financial condition could be negatively affected.
A downturn in economic and financial conditions has had and may have in the future a negative effect on our business, financial condition and results of operations.
The global economic and financial market crisis in 2008 and 2009 caused a general tightening in the credit markets, lower levels of liquidity, increases in the rates of default and bankruptcy, and reduced corporate profits and capital spending, all of which had a negative effect on our business, results of operations and financial condition. Demand for our products depends in large part upon the level of capital and maintenance expenditures by many of our customers and end users. While general economic conditions improved throughout 2010, a downturn in economic conditions may reduce the willingness or ability of our customers and prospective customers to commit funds to purchase our products and services, and may reduce their ability to pay for our products and services after purchase. Similarly, our suppliers may not be able to supply us with needed raw materials or components on a timely basis, may increase prices or go out of business, which could result in our
11
inability to meet customer demand, or fulfill our contractual obligations or could affect our gross margins. See “We depend on the availability of certain key suppliers; if we experience difficulty with a supplier, we may have difficulty finding alternative sources of supply” below. We cannot predict the timing or duration of negative market conditions. If the economy or markets in which we operate deteriorate or financial markets weaken, our business, financial condition and results of operations could be adversely impacted.
A substantial portion of our sales has historically been derived from fixed-price contracts for large system projects, which may involve long-term fixed price commitments to customers which are sometimes difficult to execute. We have experienced difficulties in executing large contracts of this kind in the past, including cost overruns, storm damage, supplier failures and customer disputes. While we believe our contract management processes are strong, our staff reduction initiatives during the recent downturn increase the risk that our future execution on fixed-priced contracts could result in future difficulties.
To the extent that any of our fixed-price contracts are delayed, our subcontractors fail to perform, contract counterparties successfully assert claims against us, the original cost estimates in these or other contracts prove to be inaccurate or the contracts do not permit us to pass increased costs on to our customers, profitability from a particular contract may decrease or project losses may be incurred, which, in turn, could decrease our revenues and overall profitability. The uncertainties associated with our fixed-price contracts make it more difficult to predict our future results and exacerbate the risk that our results will not match expectations, which has happened in the past.
We depend on the availability of certain key suppliers; if we experience difficulty with a supplier, we may have difficulty finding alternative sources of supply.
The cost, quality and availability of raw materials and certain specialty metals used to manufacture our products are critical to our success. The materials and components we use to manufacture our products are sometimes custom made and may be available only from a few suppliers, and the lead times required to obtain these materials and components can often be significant. We rely on sole suppliers or a limited number of suppliers for some of these materials, including special grades of aluminum used in our brazed aluminum heat exchangers. While we have not historically encountered problems with availability, this does not mean that we will continue to have timely access to adequate supplies of essential materials and components in the future or that supplies of these materials and components will be available on satisfactory terms when needed. If our vendors for these materials and components are unable to meet our requirements, fail to make shipments in a timely manner or ship defective materials or components, we could experience a shortage or delay in supply or fail to meet our contractual requirements, which would adversely affect our results of operations and negatively impact our cash flow and profitability.
Our backlog is subject to modification or termination of orders, which could negatively impact our sales.
Our backlog is comprised of the portion of firm signed purchase orders or other written contractual commitments received from customers that we have not recognized as revenue. The dollar amount of backlog as of December 31, 20092010 was $185.1$236.4 million. Our backlog can be significantly affected by the timing of orders for large products, particularly in our E&C segment, and the amount of our backlog at December 31, 20092010 is not necessarily indicative of future backlog levels or the rate at which backlog will be recognized as sales. Although in the last few yearshistorically the amount of modifications and terminations of our orders has not been material compared to our total contract volume and is partially offset by cancellation penalties, customers can, and sometimes do, terminate or modify these orders. We experienced an increase in order cancellations after the onset of the global economic and financial crisis in the fall of 2008, but cancellation rates decreased substantially by mid-2009. We cannot predict however, whether cancellations will accelerate or diminish in the future. Cancellations of purchase orders or reductions of product quantities in existing contracts could substantially and materially reduce our backlog and, consequently, our future sales. Our failure to replace canceled or reduced backlog could negatively impact our sales and results of operations.
We are subject to potential insolvency or financial distress of third parties.
We are exposed to the risk that third parties to various arrangements who owe us money or goods and services, or who purchase goods and services from us, will not be able to perform their obligations or continue to place orders due to insolvency or financial distress. If third parties fail to perform their obligations under arrangements with us, we may be forced to replace the underlying commitment at current or above market prices or on other terms that are less favorable to us or we may have to write off receivables in the case of customer failures to pay. If this happens, whether as a result of the insolvency or financial distress of a third party or otherwise, we may incur losses, or our results of operations, financial position or liquidity could otherwise be adversely affected.
12
Health care reform or other changes in government and other third-party payor reimbursement levels and practices could negatively impact our revenues and profitability.
Our recent acquisitionacquisitions of Covidien’s oxygen therapy business and SeQual Technologies Inc., among others, have significantly increased the size and impact on our financial results of our respiratory products business in our BioMedical segment. Many of our BioMedical segment’s customers are reimbursed for products and services by third-party payors, such as government programs, including Medicare and Medicaid, private insurance plans and managed care programs in the U.S, and by similar programs and entities in the other countries in which we operate or sell our equipment. If third-party payors deny coverage, make the reimbursement process or documentation requirements more uncertain or reduce levels of reimbursement, it could negatively affect our revenues and profitability. Any
In March 2010, significant reforms to the healthcare system were adopted in the United States. The new law includes provisions that, among other things, reduce and/or limit Medicare reimbursement, require all individuals to have health careinsurance (with limited exceptions) and impose new and/or increased taxes. Specifically, the law imposes a 2.3% excise tax on U.S. sales of most medical devices beginning in 2013 which will impact certain of our BioMedical sales. Various healthcare reform legislation that is adopted byproposals have also emerged at the U.S. government may negativelystate level. The new law and these proposals could impact the demand for our revenuesproducts or the prices at which we sell our products. In addition, the excise tax could increase our cost of doing business. The impact of this law and profitability.these proposals could have a material adverse effect on our business, results of operations and/or financial condition.
12
As a global business, we are exposed to economic, political and other risks in different countries which could materially reduce our revenues, profitability or cash flows, or materially increase our liabilities.
Since we manufacture and sell our products worldwide, our business is subject to risks associated with doing business internationally. In 2010, 2009 and 2008, 57%, 59% and 2007, 59%, 65% and 58%, respectively, of our sales were made in international markets. Our future results could be harmed by a variety of factors, including:
changes in foreign currency exchange rates;
exchange controls and currency restrictions;
changes in a specific country’s or region’s political, social or economic conditions, particularly in emerging markets;
civil unrest, turmoil or outbreak of disease in any of the countries in which we operate;operate or sell our products;
tariffs, other trade protection measures and import or export licensing requirements;
potentially negative consequences from changes in U.S. and international tax laws;
difficulty in staffing and managing geographically widespread operations;
differing labor regulations;
requirements relating to withholding taxes on remittances and other payments by subsidiaries;
different regulatory regimes controlling the protection of our intellectual property;
restrictions on our ability to own or operate subsidiaries, make investments or acquire new businesses in these jurisdictions;
restrictions on our ability to repatriate dividends from our foreign subsidiaries;
difficulty in collecting international accounts receivable;
difficulty in enforcement of contractual obligations under non-U.S. law;
transportation delays or interruptions;
changes in regulatory requirements; and
the burden of complying with multiple and potentially conflicting laws.
13
Our international operations and sales also expose us to different local political and business risks and challenges. For example, we are faced with potential difficulties in staffing and managing local operations and we have to design local solutions to manage credit and legal risks of local customers and distributors. In addition, because some of our international sales are to suppliers that perform work for foreign governments, we are subject to the political risks associated with foreign government projects. For example, certain foreign governments may require suppliers for a project to obtain products solely from local manufacturers or may prohibit the use of products manufactured in certain countries.
International growth and expansion into emerging markets, such as China, Central and Eastern Europe, India, and the Middle East and Latin America, may cause us difficulty due to greater regulatory barriers than in the United States, the necessity of adapting to new regulatory systems, problems related to entering new markets with different economic, social and political systems and conditions, and significant competition from the primary participants in these markets, some of which may have substantially greater resources than us. For example, unstable political conditions or civil unrest, including the recent political instability in North Africa and the Middle East and any expansion of that unrest, could negatively impact our order levels and sales in a region or our ability to collect receivables from customers or operate or execute projects in a region.
Our international operations also depend upon favorable trade relations between the United States and those foreign countries in which our customers and suppliers have operations. A protectionist trade environment in either the United States or those foreign countries in which we do business or sell products, such as a change in the current tariff structures, export compliance, government subsidies or other trade policies, may materially and adversely affect our ability to sell our products or do business in foreign markets.
13
Our overall success as a global business depends, in part, upon our ability to succeed in differing economic, social and political conditions. We may not succeed in developing and implementing policies and strategies to counter the foregoing factors effectively in each location where we do business and the foregoing factors may cause a reduction in our revenues, profitability or cash flows, or cause an increase in our liabilities.
Fluctuations in exchange and interest rates may affect our operating results and impact our financial condition.
Fluctuations in the value of the U.S. dollar may increase or decrease our sales or earnings. Because our consolidated financial results are reported in U.S. dollars, if we generate sales or earnings in other currencies, the translation of those results into U.S. dollars can result in a significant increase or decrease in the amount of those sales or earnings. We also bid for certain foreign projects in U.S. dollars or euros. If the U.S. dollar or euro strengthens relative to the value of the local currency, we may be less competitive on those projects. In addition, our debt service requirements are primarily in U.S. dollars and a portion of our cash flow is generated in euros or other foreign currencies. Significant changes in the value of the foreign currencies relative to the U.S. dollar could limitimpair our ability to meet interestcash flow and principal payments on our debt and impair our financial condition.
In addition, fluctuations in currencies relative to the U.S. dollar may make it more difficult to perform period-to-period comparisons of our reported results of operations. For purposes of accounting, the assets and liabilities of our foreign operations, where the local currency is the functional currency, are translated using period-end exchange rates, and the revenues and expenses of our foreign operations are translated using average exchange rates during each period.
In addition to currency translation risks, we incur currency transaction risk whenever we or one of our subsidiaries enters into either a purchase or a sales transaction using a currency other than the functional currency of the transacting entity. Given the volatility of exchange rates, we may not be able to effectively manage our currency and/or translation risks. Volatility in currency exchange rates may decrease our revenues and profitability and impair our financial condition. We have purchased and may continue to purchase foreign currency forward buy and sell contracts to manage the risk of adverse currency fluctuations and if the contracts are inconsistent with currency trends we could experience exposure related to foreign currency fluctuations.
14
We are also exposed to general interest rate risk. If interest rates increase, our interest expense could increase significantly, affecting earnings and reducing cash flow available for working capital, capital expenditures, acquisitions, and other purposes. In addition, changes by any rating agency to our outlook or credit ratings could increase our cost of borrowing.
If we are unable to effectively control our costs while maintaining our customer relationships and core resources, our business, results of operations and financial condition could be adversely affected.
It is critical for us to appropriately align our cost structure with prevailing market conditions, to minimize the effect of economic downturns on our operations, and in particular, to continue to maintain our customer relationships, core resources and manufacturing capacity while protecting profitability and cash flow. If we are unable to align our cost structure in response to economic downturns on a timely basis, or if implementation of any cost structure adjustments has an adverse impact on our business or prospects, then our financial condition, results of operations and cash flows may be negatively affected.
Conversely, adjusting our cost structure to fit economic downturn conditions may have a negative effect on us during an economic upturn or periods of increasing demand for our products. If we have too aggressively reduced our costs, we may not have, or may not be able to obtain in a timely manner, sufficient engineering or manufacturing resources to capture new orders and meet customer demand. If we are unable to meet production or delivery schedules during a period of escalating demand because we have failed to effectively manage our resources or because we cut costs too aggressively, our relationships with our key customers could be adversely affected and there could be a material adverse effect on our business, financial condition, results of operations and cash flows.
14
If we are unable to successfully manage our planned operational expansions, it may place a significant strain on our management and administrative resources and lead to increased costs and reduced profitability.
We expect to continue to expand our operations, particularly in China, the Middle East, Europe and the United States in markets where we perceive the opportunity for profitable expansion. Our ability to operate our business successfully and implement our strategies depends, in part, on our ability to allocate our resources optimally in each of our facilities in order to maintain efficient operations as we expand. Ineffective management of our growth could cause manufacturing inefficiencies, increase our operating costs, place significant strain on our management and administrative resources and prevent us from implementing our business plan.
For example, we have invested or plan to invest approximately $15-$20 million in new capital expenditures in 2010 related to the expected growth of selective parts of each of BioMedical, E&C and D&S segments. If we fail to implement these projects in a timely and effective manner, we may lose the opportunity to obtain some customer orders. Even if we effectively implement these projects, the orders needed to support the capital expenditure may not be obtained, may be delayed, or may be less than expected, which may result in sales or profitability at lower levels than anticipated. For example, while we invested significantly in the expansion of our E&C segment in recent years, we experienced delay in some of the orders initially anticipated to support the cold box portion of that expansion, which resulted in the underutilization of some of our capacity. In addition, potential cost overruns, delays or unanticipated problems in any capital expansion could make the expansion more costly than originally predicted or cause us to miss windows of opportunity.
We may fail to successfully acquire or integrate companies that provide complementary products or technologies.
A component of our business strategy is the acquisition of businesses that complement our existing products and services. Such a strategy involves the potential risks inherent in assessing the value, strengths, weaknesses, contingent or other liabilities and potential profitability of acquisition candidates and in integrating the operations of acquired companies. In addition, any acquisitions of foreign business may increase our exposure to certain risks inherent in doing business outside the United States.
From time to time, we may have acquisition discussions with potential target companies both domestically and internationally. If a large acquisition opportunity arises and we proceed, a substantial portion of our cash and surplus borrowing capacity could be used for the acquisition or we may seek additional debt or equity financing.
Potential acquisition opportunities become available to us from time to time, and we engage periodically in discussions or negotiations relating to potential acquisitions, including acquisitions that may be material in size or scope to our business. Any acquisition may or may not occur and, if an acquisition does occur, it may not be successful in enhancing our business for one or more of the following reasons:
Any business acquired may not be integrated successfully and may not prove profitable;
The price we pay for any business acquired may overstate the value of that business or otherwise be too high;
Liabilities we take on through the acquisition may prove to be higher than we expected;
We may fail to achieve acquisition synergies; or
The focus on the integration of operations of acquired entities may divert management’s attention from the day-to-day operation of our businesses.
Inherent in any future acquisition is the risk of transitioning company cultures and facilities. The failure to efficiently and effectively achieve such transitions could increase our costs and decrease our profitability.
We are subject to potential insolvency or financial distress of third parties.
We are exposed to the risk that third parties to various arrangements who owe us money or goods and services, or who purchase goods and services from us, will not be able to perform their obligations or continue to place orders due to insolvency or financial distress. If third parties fail to perform their obligations under arrangements with us, we may be forced to replace the underlying commitment at current or above market prices or on other terms that are less favorable to us or we may have to write off receivables in the case of customer failures to pay. If this happens, whether as a result of the insolvency or financial distress of a third party or otherwise, we may incur losses, or our results of operations, financial position or liquidity could otherwise be adversely affected.
If we are unable to effectively control our costs while maintaining our customer relationships and core resources, our business, results of operations and financial condition could be adversely affected.
It is critical for us to appropriately align our cost structure with prevailing market conditions, to minimize the effect of economic fluctuation on our operations, and in particular, to continue to maintain our customer relationships, core resources and manufacturing capacity while protecting profitability and cash flow. If we are
15
unable to align our cost structure in response to prevailing economic conditions on a timely basis, or if implementation or failure to implement any cost structure adjustments has an adverse impact on our business or prospects, then our financial condition, results of operations and cash flows may be negatively affected.
We expect to continue to expand our operations, particularly in China, Europe and the United States in markets where we perceive the opportunity for profitable expansion. Our ability to operate our business successfully and implement our strategies depends, in part, on our ability to allocate our resources optimally in each of our facilities in order to maintain efficient operations as we expand. Ineffective management of our growth could cause manufacturing inefficiencies, increase our operating costs, place significant strain on our management and administrative resources and prevent us from implementing our business plan.
For example, we have invested or plan to invest approximately $15-20 million in new capital expenditures in 2011 related to the expected growth of selective parts of each of BioMedical, E&C and D&S segments. If we fail to implement these projects in a timely and effective manner, we may lose the opportunity to obtain some customer orders. Even if we effectively implement these projects, the orders needed to support the capital expenditure may not be obtained, may be delayed, or may be less than expected, which may result in sales or profitability at lower levels than anticipated. For example, while we invested significantly in the expansion of our E&C segment in recent years, we experienced delay in some of the orders initially anticipated to support the cold box portion of that expansion, which resulted in the underutilization of some of our capacity. In addition, potential cost overruns, delays or unanticipated problems in any capital expansion could make the expansion more costly than originally predicted or cause us to miss windows of opportunity.
Difficulties in implementing a new Enterprise Resource Planning system could disrupt our business.
WeSince 2009 we have begunbeen implementing a new Enterprise Resource Planning, or “ERP,” system worldwide. Primarily as a result of the complexities and business process changes associated with this implementation, there can be no assurance that we will not experience disruptions or inefficiencies in our business operations as a result of this new system implementation, the final phases of which are scheduled to be completed in 2011.
If we lose our senior management or other key employees, our business may be adversely affected.
Our ability to successfully operate and grow our business and implement our strategies is largely dependent on the efforts, abilities and services of our senior management and other key employees. Our future success will also depend on, among other factors, our ability to attract and retain qualified personnel, such as engineers and other skilled labor, either through direct hiring or the acquisition of other businesses employing such professionals. Our products, many of which are highly engineered, represent specialized applications of cryogenic or low temperature technologies and know-how, and many of the markets we serve represent niche markets for these specialized applications. Accordingly, we rely heavily on engineers, salespersons, business unit leaders, senior management and other key employees who have experience in these specialized applications and are knowledgeable about these niche markets, our products, and our company. Additionally, we may modify our management structure from time to time as we did in 2007 and 2009 in our E&C segment, or substantially reduce our overall workforce as we did in 2009,certain sectors of our business during the recent economic downturn, which may create marketing, operational and other business risks. The loss of the services of these senior managers or other key employees any modification of our management structure or the failure to attract or retain other qualified personnel could reduce the competitiveness of our business or otherwise impair our business prospects.
Fluctuations in the prices and availability of raw materials could negatively impact our financial results.
The pricing and availability of raw materials for use in our businesses can be volatile due to numerous factors beyond our control, including general, domestic and international economic conditions, labor costs,
16
production levels, competition, consumer demand, import duties and tariffs and currency exchange rates. This volatility can significantly affect the availability and cost of raw materials for us, and may, therefore, increase the short-term or long-term costs of raw materials.
The commodity metals we use, including aluminum and stainless steel, have experienced significant fluctuations in price in recent years. Prices rose quickly in the period prior to the presentrecent global economic downturn, and many prices have subsequently declined since the onset ofduring the economic downturn.downturn, and more recently have been increasing again. On average, over half of our cost of sales has historically been represented by the cost of commodities metals. We have generally been able to recover the cost increases through price increases to our customers; however, during periods of rising prices of raw materials, we may not always be unableable to pass increases on to our customers. Conversely, when raw material prices decline, customer demands for lower prices could result in lower sale prices and, to the extent we have existing inventory, lower margins. As a result, fluctuations in raw material prices could result in lower revenues and profitability.
Our exposure to fixed-price contracts, including exposure to fixed pricing on long-term customer contracts, could negatively impact our financial results.
A substantial portion of our sales has historically been derived from fixed-price contracts for large system projects, which may involve long-term fixed price commitments to customers. We have experienced difficulties in executing contracts of this kind. In the past, for example, we executed two large projects each involving over $30 million of revenue on which our margins deteriorated significantly. On one of these projects, we experienced significant cost overruns that resulted in significant project losses. The other project was disrupted by a storm and related damage, and the customer made the decision to repair the damage through costly purchases of new replacement materials and required us to share responsibility for these and other repairs. Our recent staff reduction initiatives increase the risk that our future execution on fixed-priced contracts could result in future difficulties.
16
To the extent that any of our fixed-price contracts are delayed, our subcontractors fail to perform, contract counterparties successfully assert claims against us, the original cost estimates in these or other contracts prove to be inaccurate or the contracts do not permit us to pass increased costs on to our customers, profitability from a particular contract may decrease or project losses may be incurred, which, in turn, could decrease our revenues and overall profitability. The uncertainties associated with our fixed-price contracts make it more difficult to predict our future results and exacerbate the risk that our results will not match expectations, which has happened in the past.
Due to the nature of our business and products, we may be liable for damages based on product liability and warranty claims.
Due to the high pressures and low temperatures at which many of our products are used, the inherent risks associated with concentrated industrial and hydrocarbon gases, and the fact that some of our products are relied upon by our customers or end users in their facilities or operations, or are manufactured for relatively broad industrial, transportation or consumer use, we face an inherent risk of exposure to claims in the event that the failure, use or misuse of our products results, or is alleged to result, in death, bodily injury, property damage or economic loss. We believe that we meet or exceed existing professional specification standards recognized or required in the industries in which we operate. We are subject to claims from time to time, some of which are substantial but none of which historically have had a material adverse effect on our financial condition or results of operations, and we may be subject to claims in the future. Although we currently maintain product liability coverage, which we believe is adequate for the continued operation of our business, such insurance may become difficult to obtain or be unobtainable in the future on terms acceptable to us, it includes customary exclusions and conditions, it may not cover certain specialized applications, such as aerospace-related applications, and it generally does not cover warranty claims. A successful product liability claim or series of claims against us, including one or more consumer claims purporting to constitute class actions or claims resulting from extraordinary loss events, in excess of or outside our insurance coverage or a significant warranty claim or series of claims against us could materially decrease our liquidity, impair our financial condition and adversely affect our results of operations.
Some of our products are subject to regulation by the U.S. Food and Drug Administration and other governmental authorities.
Some of our products are subject to regulation by the U.S. Food and Drug Administration and other national, supranational, federal and state governmental authorities. It can be costly and time consuming to obtain regulatory approvals to market a medical device, such as those sold by our BioMedical segment. Approvals might not be granted for new devices on a timely basis, if at all. Regulations are subject to change as a result of legislative, administrative or judicial action, which may further increase our costs or reduce sales. Our failure to maintain approvals or obtain approval for new products could adversely affect our business, results of operations, financial condition and cash flows.
In addition, we are subject to regulations covering manufacturing practices, product labeling and advertising and adverse-event reporting that apply after we have obtained approval to sell a product. Many of our facilities and procedures and those of our suppliers are subject to ongoing oversight, including periodic inspection by governmental authorities. Compliance with production, safety, quality control and quality assurance regulations is costly and time-consuming, and while we seek to be in full compliance, noncompliance could arise from time
17
to time. If we fail to comply, our operations, financial condition and cash flows could be adversely affected, including through the imposition of fines, costly remediation or plant shutdowns as a result of noncompliance.
We carry significant goodwill and indefinite-lived intangible assets on our balance sheet, which are subject to impairment testing and could subject us to significant charges to earnings in the future if impairment occurs.
As of December 31, 2009,2010, we had goodwill and indefinite-lived intangible assets of $299.1$316.2 million, which represented approximately 32.3%33.1% of our total assets. The value of these assets may increase in the future if we complete acquisitions as part of our overall business strategy. Goodwill and indefinite-lived intangible assets are
17
not amortized, but are tested for impairment annually on October 1st or more often if events or changes in circumstances indicate a potential impairment may exist. Factors that could indicate that our goodwill or indefinite-lived intangible assets are impaired include a decline in stock price and market capitalization, lower than projected operating results and cash flows, and slower growth rates in our industry. Our stock price historically has fluctuated significantly in response to market and other factors. For example, it declined significantly from mid-2008 untilto early 2009.2009 and then increased sharply in late 2010. Declines in our stock price in the future could increase the risk of goodwill impairment if the price of our stock does not recover. To test for impairment, a model to estimate the fair market value of our reporting segments has been developed. This fair market value model incorporates our estimates of future operating results and cash flows, estimates of allocations of certain assets and cash flows among reporting segments, estimates of future growth rates and our judgment regarding the applicable discount rates to use to discount those estimated operating results and cash flows. If an impairment is determined to exist, it may result in a significant non-recurring non-cash charge to earnings and lower shareholders’ equity.
We may be required to make material expenditures in order to comply with environmental, health and safety laws and climate change regulations, or incur additional liabilities under these laws and regulations.
We are subject to numerous environmental, health and safety laws and regulations that impose various environmental controls on us or otherwise relate to environmental protection and various health and safety matters, including the discharge of pollutants in the air and water, the handling, use, treatment, storage and clean-up of solid and hazardous materials and wastes, the investigation and remediation of soil and groundwater affected by hazardous substances and the requirement to obtain and maintain permits and licenses. These laws and regulations often impose strict, retroactive and joint and several liability for the costs of, and damages resulting from, cleaning up our, or our predecessors’, past or present facilities and third party disposal sites. Compliance with these laws generally increases the costs of transportation and storage of raw materials and finished products, as well as the costs of storing and disposing waste, and could decrease our liquidity and profitability and increase our liabilities. Health and safety and other laws in the jurisdictions in which we operate impose various requirements on us including state licensing requirements that may benefit our customers. If we are found to have violated any of these laws, we may become subject to corrective action orders and fines or penalties, and incur substantial costs, including substantial remediation costs and commercial liability to our customers. Further, we also could be subject to future liability resulting from conditions that are currently unknown to us that could be discovered in the future.
We are currently remediating or developing work plans for remediation of environmental conditions involving certain current or former facilities. For example, the discovery of contamination arising from historical industrial operations at our Clarksville, Arkansas property, which is currently being leased to a third party business, has exposed us, and in the future may continue to expose us, to remediation obligations. We have also been subject to environmental liabilities for other sites where we formerly operated or at locations where we or our predecessors did or are alleged to have operated. To date, our environmental remediation expenditures and costs for otherwise complying with environmental laws and regulations have not been material, but the uncertainties associated with the investigation and remediation of contamination and the fact that such laws or
18
regulations change frequently makes predicting the cost or impact of such laws and regulations on our future operations uncertain. Stricter environmental, safety and health laws, regulations or enforcement policies could result in substantial costs and liabilities to us and could subject us to more rigorous scrutiny. Consequently, compliance with these laws could result in significant expenditures as well as other costs and liabilities that could decrease our liquidity and profitability and increase our liabilities.
There is a growing political and scientific belief that emissions of greenhouse gases (“GHG”) alter the composition of the global atmosphere in ways that are affecting the global climate. Various stakeholders, including legislators and regulators, shareholders and non-governmental organizations, as well as companies in many business sectors, are considering ways to reduce GHG emissions. There is growing consensus that some form of U.S. regulation will be forthcoming at the federal level with respect to GHG emissions. Such regulation could result in regulatory or product standard requirements for the Company’s global businesses but because any impact is dependent on the design of the mandate or standard, the Company is unable to predict its significance at this time.
18
Furthermore, the potential physical impacts of theorized climate change on the Company’s customers, and therefore on the Company’s operations, are speculative and highly uncertain, and would be particular to the circumstances developing in various geographical regions. These may include changes in weather patterns (including drought and rainfall levels), water availability, storm patterns and intensities, and temperature levels. These potential physical effects may adversely impact the cost, production, sales and financial performance of the Company’s operations.
Increases in labor costs, potential labor disputes and work stoppages at our facilitiesstoppage could materially decrease our revenues and profitability.
Our financial performance is affected by the availability of qualified personnel and the cost of labor. As of January 31, 2010,2011, we had 2,5173,013 employees, including 1,0131,271 salaried, 208216 bargaining unit hourly and 1,2961,526 non-bargaining unit hourly employees. Employees represented by a union are subject to one collective bargaining agreement in the United States that expires in February 2013. We have experienced one work stoppage in the recent past.2007. Although we recently entered into a new labor agreement with our unionized employees at this facility in 2010, if we are unable to enter into new, satisfactory labor agreements with our unionized employees when necessary in the future or other labor controversies or union organizing efforts arise, we could experience a significant disruption to our operations, lose business or experience an increase in our operating expenses, which could reduce our profit margins.
Increased Furthermore, increased U.S. federal regulation or significant modifications to existing labor regulations, could potentially increase our labor costs. For example, in 2007, the Employee Free Choice Act of 2007: H.R. 800 (“EFCA”) was passed in the U.S. House of Representatives. The EFCA would amend the National Labor Relations Act, among other ways, by making it easier for unions to organize and by increasing the penalties employers may incur if they engage in labor practices in violation of the National Labor Relations Act. This bill or a variation of it could be enacted in the future. Having a larger percentage of our workforce unionized could cause an increase in our operating expenses and have an adverse impact on our business.
Additional liabilities related to taxes, including any new taxes imposed on us as a result of any health care reform legislation, could adversely impact our financial results, financial condition and cash flow.
We are subject to tax and related obligations in the jurisdictions in which we operate or do business, including state, local, federal and foreign taxes. The taxing rules of the various jurisdictions in which we operate or do business often are complex and subject to varying interpretations. Tax authorities may challenge tax positions that we take or historically have taken, and may assess taxes where we have not made tax filings or may audit the tax filings we have made and assess additional taxes, as they have done from time to time in the past. Some of these assessments may be substantial, and also may involve the imposition of substantial penalties and interest. In addition, governments could impose new taxes on us in the future. For example, recent health care reform proposals in the United States have included proposedincludes new taxes on manufacturers of medical devicedevices such as the respiratory therapy equipment manufactured by our BioMedical segment. The payment of substantial additional taxes, penalties or interest resulting from tax assessments, or the imposition of any new taxes, could materially and adversely impact our results of operations, financial condition and cash flow.
Our pension plan is currently underfunded.
Certain U.S. hourly and salaried employees are covered by our defined benefit pension plan. The plan has been frozen since February 2006. As of December 31, 2009,2010, the projected benefit obligation under our pension
19
plan was approximately $41.6$44.7 million and the value of the assets of the plan was approximately $31.0$33.2 million, resulting in our pension plan being underfunded by approximately $10.6$11.5 million. As of December 31, 2008, our pension obligations were underfunded by approximately $15.2 million. We attribute the decrease in the amount of underfunding since December 31, 2008 to higher returns earned on our pension investments in 2009. We are also a participant in a multiemployer plan which is underfunded. If the performance of the assets in our pension plan or the multiemployer plan dodoes not meet expectations or if other actuarial assumptions are modified, our
19
required pension contributions for future years could be higher than we expect, which may negatively impact our results of operations, cash flows and financial condition.
If we are unable to continue our technological innovation and successful introduction of new commercial products, our profitability could be adversely affected.
The industries we serve, including the energy, industrial gas and biomedical industries, experience ongoing technological change and product improvement. Manufacturers periodically introduce new generations of products or require new technological capacity to develop customized products or respond to industry developments or needs. Our future growth will depend on our ability to gauge the direction of the commercial and technological progress in our markets, as well as our ability to acquire new product technologies or fund and successfully develop, manufacture and market products in this constantly changing environment. We must continue to identify, develop, manufacture and market innovative products on a timely basis to replace existing products in order to maintain our profit margins and competitive position. We may not be successful in acquiring and developing new products or technologies and any of our new products may not be accepted by our customers. If we fail to keep pace with evolving technological innovations in the markets we serve, our profitability may decrease.
Failure to protect our intellectual property and know-how could reduce or eliminate any competitive advantage and reduce our sales and profitability, and the cost of protecting our intellectual property may be significant.
We rely on a combination of internal procedures, nondisclosure agreements, intellectual property rights assignment agreements, as well as licenses, patents, trademarks and copyright law to protect our intellectual property and know-how. Our intellectual property rights may not be successfully asserted in the future or may be invalidated, circumvented or challenged. For example, we frequently explore and evaluate potential relationships and projects with other parties, which often requires that we provide the potential partner with confidential technical information. While confidentiality agreements are typically put in place, there is a risk the potential partner could violate the confidentiality agreement and use our technical information for its own benefit or the benefit of others or compromise the confidentiality. In addition, the laws of certain foreign countries in which our products may be sold or manufactured do not protect our intellectual property rights to the same extent as the laws of the United States. For example, we are increasing our manufacturing capabilities and sales in China, where laws may not protect our intellectual property rights to the same extent as in the United States. Failure or inability to protect our proprietary information could result in a decrease in our sales or profitability.
We have obtained and applied for some U.S. and foreign trademark and patent registrations and will continue to evaluate the registration of additional trademarks and patents, as appropriate. We cannot guarantee that any of our pending applications will be approved. Moreover, even if the applications are approved, third parties may seek to oppose or otherwise challenge them. A failure to obtain registrations in the United States or elsewhere could limit our ability to protect our trademarks and technologies and could impede our business. Further, the protection of our intellectual property may require expensive investment in protracted litigation and the investment of substantial management time and there is no assurance we ultimately would prevail or that a successful outcome would lead to an economic benefit that is greater than the investment in the litigation. The patents in our patent portfolio are scheduled to expire between 20102011 and 2029.2030.
In addition, we may be unable to prevent third parties from using our intellectual property rights and know-how without our authorization or from independently developing intellectual property that is the same as or similar to ours, particularly in those countries where the laws do not protect our intellectual property rights as fully as in the United States. We compete in a number of industries (for example, heat exchangers and cryogenic
20
storage) that are small or specialized, which makes it easier for a competitor to monitor our activities and increases the risk that ideas will be stolen. The unauthorized use of our know-how by third parties could reduce or eliminate any competitive advantage we have developed, cause us to lose sales or otherwise harm our business or increase our expenses as we attempt to enforce our rights.
20
We may be subject to claims that our products or processes infringe the intellectual property rights of others, which may cause us to pay unexpected litigation costs or damages, modify our products or processes or prevent us from selling our products.
Although it is our intention to avoid infringing or otherwise violating the intellectual property rights of others, third parties may nevertheless claim (and in the past have claimed) that our processes and products infringe their intellectual property and other rights. For example, a third party claimed in the past that we may infringe certain patents related to cryogenic pipe technology and may have breached an undertaking relating to same, although we believe that these claims are without merit. In addition, our BioMedical business manufactures products for relatively broad consumer use, is actively marketing these products in multiple jurisdictions internationally and risks infringing technologies that may be protected in one or more of these international jurisdictions as the scope of our international marketing efforts expands. Our strategies of capitalizing on growing international demand as well as developing new innovative products across multiple business lines present similar infringement claim risks both internationally and in the United States as we expand the scope of our product offerings and markets. We compete with other companies for contracts in some small or specialized industries, which increases the risk that the other companies will develop overlapping technologies leading to an increased possibility that infringement claims will arise. Whether or not these claims have merit, we may be subject to costly and time-consuming legal proceedings, and this could divert our management’s attention from operating our businesses. In order to resolve such proceedings, we may need to obtain licenses from these third parties or substantially re-engineer or rename our products in order to avoid infringement. In addition, we might not be able to obtain the necessary licenses on acceptable terms, or at all, or be able to re-engineer or rename our products successfully.
Our operations could be impacted by the effects of hurricanes or other severe weather, which could be more severe than the damage and impact that our Louisiana operations encountered from hurricanes in 2005 and 2008.
Some of our operations, including our operations in New Iberia, Louisiana and Houston, Texas, are located in geographic regions and physical locations that are susceptible to physical damage and longer-term economic disruption from hurricanes or other severe weather. We also could make significant future capital expenditures in hurricane-susceptible or other severe weather locations from time to time. These weather events can disrupt our operations, result in damage to our properties and negatively affect the local economy in which these facilities operate. In early September 2008, for example, our New Iberia, Louisiana facility was forced to close as a result of heavy rainfall, evacuations, strong winds and power outages resulting from Hurricane Gustav. Two weeks after Hurricane Gustav, winds and flooding from Hurricane Ike damaged our New Iberia, Louisiana, Houston, Texas and The Woodlands, Texas operations and offices, and those facilities were also closed for a period of time. In 2005, our New Iberia operations encountered damage and were disrupted from the storm surge and flooding caused by Hurricane Rita. Future hurricanes or other severe weather may cause production or delivery delays as a result of the physical damage to the facilities, the unavailability of employees and temporary workers, the shortage of or delay in receiving certain raw materials or manufacturing supplies and the diminished availability or delay of transportation for customer shipments, any of which may have an adverse affect on our revenues and profitability. Additionally, the potential physical impact of theorized climate change could include more frequent and intense storms, which would heighten the risk to our operations in areas that are susceptible to hurricanes and other severe weather. Although we maintain insurance subject to certain deductibles, which may cover some of our losses, that insurance may become unavailable or prove to be inadequate.
We operate in many different jurisdictions and we could be adversely affected by violations of the U.S. Foreign Corrupt Practices Act and similar worldwide anti-corruption laws.
The U.S. Foreign Corrupt Practices Act (FCPA) and similar worldwide anti-corruption laws generally prohibit companies and their intermediaries from making improper payments to non-U.S. officials for the
21
purpose of obtaining or retaining business. Our internal policies mandate compliance with these anti-corruption laws. We operate in many parts of the world that have experienced governmental corruption to some degree, and
21
in certain circumstances, strict compliance with anti-corruption laws may conflict with local customs and practices. Despite our training and compliance programs, we cannot assure you that our internal control policies and procedures always will protect us from reckless or criminal acts committed by our employees or agents. Our continued expansion outside the U.S., including in developing countries, could increase the risk of such violations in the future. Violations of these laws, or allegations of such violations, could disrupt our business and result in a material adverse effect on our results of operations or financial condition.
Increased government regulation could adversely affect our financial results, financial condition and cash flow.
The Dodd-Frank Wall Street Reform and Consumer Protection Act (the “Dodd-Frank Act”) institutes a wide range of reforms, some of which may impact us. Among other things, the Dodd-Frank Act contains significant corporate governance and executive compensation-related provisions that authorize or require the SEC to adopt additional rules and regulations in these areas, such as shareholder “say on pay” voting and proxy access. The impact of these provisions on our business is uncertain. The Dodd-Frank Act also provides for new statutory and regulatory requirements for derivative transactions, including foreign exchange and interest rate hedging transactions. Certain transactions will be required to be cleared on exchanges, and cash collateral will be required for those transactions. While the Dodd-Frank Act provides for a potential exception from these clearing and cash collateral requirements for commercial end-users, the exception is subject to future rule making and interpretation by regulatory authorities. We enter into foreign exchange contracts, interest rate swaps and foreign currency forward contracts from time to time to manage our exposure to commodity price risk, foreign currency exchange risk and interest rate risk. If, in the future, we are required to provide cash collateral for our hedging transactions, it could reduce our ability to execute strategic hedges. In addition, the contractual counterparties in hedging arrangements will be required to comply with the Dodd-Frank Act’s new requirements, which could ultimately result in increased costs of these arrangements.
We are subject to regulations governing the export of our productsproducts..
Due to our significant foreign sales, our export activities are subject to regulation, including the U.S. Treasury Department’s Office of Foreign Assets Control’s regulations. While we believe we are in compliance with these regulations and maintain programs intended to achieve compliance, we may currently or may in the future be in violation of these regulations. Any violations may subject us to government scrutiny, investigation and civil and criminal penalties and may limit our ability to export our products.
As a provider of products to the U.S. government, we are subject to federal rules, regulations, audits and investigations, the violation or failure of which could adversely affect our business.
We sell certain of our products to the U.S. government and, therefore, we must comply with and are affected by laws and regulations governing purchases by the U.S. government. Government contract laws and regulations affect how we do business with our government customers and, in some instances, impose added costs on our business. For example, a violation of specific laws and regulations could result in the imposition of fines and penalties or the termination of our contracts or debarment from bidding on contracts. In some instances, these laws and regulations impose terms or rights that are more favorable to the government than those typically available to commercial parties in negotiated transactions.
22
Risks Related to our Leverage
Our leverage and future debt service obligations could adversely affect our financial condition, limit our ability to raise additional capital to fund our operations, limit our ability to react to changes in the economy or our industry, impact the way we operate our business, expose us to interest rate risk to the extent of our variable rate debt and prevent us from fulfilling our debt service obligations.
We are leveraged and have future debt service obligations. Our financial performance could be affected by our leverage. As of December 31, 2009,2010, our total indebtedness was $243.2$224.9 million. In addition, at that date, we had $26.8$22.0 million of letters of credit and bank guarantees outstanding and borrowing capacity of approximately $83.2$113.0 million under the revolving portion of our senior secured credit facility, after giving effect to the letters of credit and bank guarantees outstanding. $5.0 million of our borrowing capacity may be unavailable to us as a result of the bankruptcy of one of our revolving credit lenders. See Item 7. “Management’s Discussion and Analysis of Financial Condition and Results of Operations — Liquidity and Capital Resources — Debt Instruments and Related Covenants.” While we had $211.1$165.1 million in cash at December 31, 2009,2010, which we believe mitigates the risk related to our leverage, there is no assurance that we will continue to be profitable in the future or that we will not use our available cash in ways other than those that reduce our leverage or mitigate the risk related to our leverage. We may also incur additional indebtedness in the future. Our level of indebtedness could have important negative consequences to us and you, including:
we may have difficulty generating sufficient cash flow to pay interest and satisfy our debt obligations;
we may have difficulty obtaining financing in the future for working capital, capital expenditures, acquisitions or other purposes;
we will need to use a substantial portion of our available cash flow to pay interest and principal on our debt, which will reduce the amount of money available to finance our operations and other business activities;
some of our debt, including our borrowings under our senior secured credit facility, has variable rates of interest, which exposes us to the risk of increased interest rates;
22
our debt level increases our vulnerability to general economic downturns and adverse industry conditions;
our debt level could limit our flexibility in planning for, or reacting to, changes in our business and in our industry in general;
our debt and the amount we must pay to service our debt obligations could place us at a competitive disadvantage compared to our competitors that have less debt;
our customers may react adversely to our debt level and seek or develop alternative suppliers; and
our failure to comply with the financial and other restrictive covenants in our debt instruments which, among other things, require us to maintain specified financial ratios and limit our ability to incur debt and sell assets, could result in an event of default that, if not cured or waived, could have a material adverse effect on our business or prospects.
Our net cash flow generated from operating activities was $86.9 million, $97.8 million and $82.5 million for the years 2009, 2008 and 2007, respectively. Our cash flow generated from operating activities declined in 2009 from 2008 as we dealt with the fallout from the global economic downturn. Our current level of indebtedness requires that we use a substantial portion of our cash flow from operations to pay interest on our indebtedness, which will reduce the availability of cash to fund working capital requirements, capital expenditures, research and development or other general corporate or business activities, including future acquisitions.
In addition, a portion of our indebtedness bears interest at variable rates. If market interest rates increase, debt service on our variable-rate debt will rise, which would adversely affect our cash flow.
Our business may not generate sufficient cash flow from operations and future borrowings may not be available to us under our senior secured credit facility or otherwise in an amount sufficient to permit us to pay the principal and interest on our indebtedness or fund our other liquidity needs. In addition, a portion of our indebtedness bears interest at variable rates. If market interest rates increase, debt service on our variable-rate debt will rise, which would adversely affect our cash flow. We may be unable to refinance any of our debt, including our senior secured credit facility or our senior subordinated notes, on commercially reasonable terms. See Item 7. “Management’s Discussion and Analysis of Financial Condition and Results of Operations — Liquidity and Capital Resources.”
If our cash flows and capital resources are insufficient to fund our debt service obligations, we may be forced to sell assets, seek additional capital or seek to restructure or refinance our indebtedness. These alternative measures may not be successful and may not permit us to meet our scheduled debt service obligations. Our senior secured credit facility and the indenture under which our senior subordinated notes were issued restrict our
23
ability to use the proceeds from asset sales. We may be unable to consummate those asset sales to raise capital or sell assets at prices that we believe are fair and proceeds that we do receive may be inadequate to meet any debt service obligations then due.
We may still be able to incur substantially more debt. This could further exacerbate the risks that we face.
We may be able to incur substantial additional indebtedness in the future. The terms of our debt instruments do not fully prohibit us from doing so. The revolving credit portion of our senior secured credit facility provides commitments of up to $115.0$135.0 million, approximately $83.2$113.0 million of which would have been available for future borrowings (after giving effect to letters of credit and bank guarantees outstanding) as of December 31, 2009.2010. See Item 7. “Management’s Discussion and Analysis of Financial Condition and Results of Operations — Liquidity and Capital Resources — Debt Instruments and Related Covenants.” We may also further increase the size of our senior secured credit facility or refinance with higher borrowing limits. If new debt is added to our current debt levels, the related risks that we now face could intensify.
23
The senior secured credit facility and the indenture governing our senior subordinated notes contain a number of restrictive covenants which limit our ability to finance future operations or capital needs or engage in other business activities that may be in our interest.
The senior secured credit facility and the indenture governing our senior subordinated notes impose, and the terms of any future indebtedness may impose, operating and other restrictions on us and our subsidiaries. Such restrictions affect or will affect, and in many respects limit or prohibit, among other things, our ability and the ability of our subsidiaries to:
incur additional indebtedness;
create liens;
pay dividends and make other distributions in respect of our capital stock;
redeem or buy back our capital stock;
make certain investments or certain other restricted payments;
sell certain kinds of assets;
enter into certain types of transactions with affiliates; and
affect mergers or consolidations.
The senior secured credit facility also requires us to achieve certain financial and operating results and maintain compliance with specified financial ratios. Our ability to comply with these ratios may be affected by events beyond our control.
The restrictions contained in the senior secured credit facility and the indenture governing our senior subordinated notes could:
limit our ability to plan for or react to market or economic conditions or meet capital needs or otherwise restrict our activities or business plans; and
adversely affect our ability to finance our operations, acquisitions, investments or strategic alliances or other capital needs or to engage in other business activities that would be in our interest.
A breach of any of these covenants or our inability to comply with the required financial ratios could result in a default under our senior secured credit facility and/or the indenture governing our senior subordinated notes. If an event of default occurs under our senior secured credit facility, which includes an event of default under the indenture governing our senior subordinated notes, the lenders could elect to:
declare all borrowings outstanding, together with accrued and unpaid interest, to be immediately due and payable;
24
require us to apply all of our available cash to repay the borrowings; or
prevent us from making debt service payments on the senior subordinated notes;
any of which would result in an event of default under our senior subordinated notes. The lenders will also have the right in these circumstances to terminate any commitments they have to provide further financing.
If we were unable to repay or otherwise refinance these borrowings when due, our lenders could sell the collateral securing the senior secured credit facility, which constitutes substantially all of our domestic wholly-owned subsidiaries’ assets.
24
We may be required to amend or refinance our revolving credit commitments during 2010, and our ability and the cost to do so are subject to our financial performance and condition and debt market conditions.
The $115.0 million revolving credit facility portion of our senior secured credit facility expires on October 17, 2010. While we had adequate cash at December 31, 2009 so as not to require borrowing on the revolving credit facility, we had $26.8 million of letters of credit and bank guarantees outstanding supported by the revolving credit facility. We expect that we will continue to utilize our revolving credit facility for the issuance of letters of credit and bank guarantees, and may borrow as needed from time to time, in the future in the ordinary course of business. Our business, including our ability to provide the assurances required on some projects by customers or vendors, would be harmed if we could not obtain letters of credit, bank guarantees or revolving credit. Accordingly, we may need to amend or refinance our revolving credit commitments and the related senior secured credit facility before the revolving credit facility portion expires in 2010. Our cost to obtain an amendment or refinancing, the covenants and conditions that would apply, and other terms will depend on our financial performance, our financial condition and debt market conditions. A deterioration in our financial performance or condition, or in debt market conditions and debt availability, could increase our costs of maintaining revolving credit or other borrowings or make revolving or other credit unavailable to us or available to us only on terms less favorable than our present terms. If this happened, it would have a negative impact on our results of operations, cash flow and financial condition.
We are a holding company and we may depend upon cash from our subsidiaries to service our debt. If we do not receive cash from our subsidiaries, we may be unable to meet our obligations.
We are a holding company and all of our operations are conducted through our subsidiaries. Accordingly, we may be dependent upon the earnings and cash flows from our subsidiaries to provide the funds necessary to meet our debt service obligations. If we could not have access to the cash flows of our subsidiaries, we may be unable to pay the principal or interest on our debt. In addition, certain of our subsidiaries are holding companies that rely on subsidiaries of their own as a source of funds to meet any obligations that might arise.
Generally, the ability of a subsidiary to make cash available to its parent is affected by its own operating results and is subject to applicable laws and contractual restrictions contained in its debt instruments and other agreements. Moreover, there may be restrictions on payments by our subsidiaries to us under applicable laws, including laws that require companies to maintain minimum amounts of capital, to make payments to shareholders only from profits and restrictions on our ability to repatriate dividends from our foreign subsidiaries. As a result, although our subsidiaries may have cash, we may be unable to obtain that cash to satisfy our obligations and make payments to our stockholders, if any.
Risks Related to the Trading Market for Our Common Stock
Provisions in our amended and restated certificate of incorporation and amended and restated bylaws and Delaware law may discourage a takeover attempt.
Provisions contained in our amended and restated certificate of incorporation and amended and restated bylaws and Delaware law could make it more difficult for a third party to acquire us. Provisions of our amended and restated certificate of incorporation and amended and restated bylaws and Delaware law impose various procedural and other requirements, which could make it more difficult for stockholders to effect certain corporate actions. For example, our amended and restated certificate of incorporation authorizes our board of directors to determine the rights, preferences, privileges and restrictions of unissued series of preferred stock, without any vote or action by our stockholders. Therefore, our board of directors can authorize and issue shares of preferred stock with voting or conversion rights that could adversely affect the voting or other rights of holders of our common stock. These rights may have the effect of delaying or deterring a change of control of our company. These provisions could limit the price that certain investors might be willing to pay in the future for shares of our common stock.
25
Our common stock has experienced, and may continue to experience, price volatility.
Our common stock has at times experienced substantial price volatility as a result of many factors, including the general volatility of stock market prices and volumes, changes in securities analysts’ estimates of our financial performance, variations between our actual and anticipated financial results, fluctuations in order or backlog levels, changes in accounting policies or procedures as have been required by the Financial Accounting Standards Board or other regulatory agencies, or uncertainty about current global economic conditions. For these reasons, among others, the price of our stock may continue to fluctuate.
25
| Item 1B. | Unresolved Staff Comments. |
Not Applicable.
| Item 2. | Properties. |
We occupy 2432 principal facilities totaling approximately 2.42.5 million square feet, with the majority devoted to manufacturing, assembly and storage. Of these manufacturing facilities, approximately 1.7 million square feet are owned and 0.70.8 million square feet are occupied under operating leases. We lease approximately 15,20017,500 square feet for our corporate office in Garfield Heights, Ohio. Our major owned facilities in the United States are subject to mortgages securing our senior secured credit facility.
The following table sets forth certain information about significant facilities occupied by us as of January 31, 2010:2011:
Location | Segment | Square Feet | Ownership | Use | ||||||
La Crosse, Wisconsin | Energy & Chemicals | 149,000 | Owned | Manufacturing/Office | ||||||
New Iberia, Louisiana | Energy & Chemicals | 62,400 | Leased | Manufacturing | ||||||
The Woodlands, Texas | Energy & Chemicals | 29,000 | Leased | Office | ||||||
Tulsa, Oklahoma | Energy & Chemicals | 58,500 | Owned | Manufacturing/Office | ||||||
Tulsa, Oklahoma | Energy & Chemicals | 140,000 | Leased | Manufacturing/Office | ||||||
Tulsa, Oklahoma | Energy & Chemicals | 68,000 | Leased | Manufacturing/Office | ||||||
Wolverhampton, United Kingdom | Energy & Chemicals | 1,600 | Leased | Office | ||||||
Changzhou, China | Distribution & Storage/Energy & Chemicals | 260,000 | Owned | Manufacturing/Office | ||||||
Anaheim, California | Distribution & Storage | 6,100 | Leased | Office/Manufacturing | ||||||
Anaheim, California | Distribution & Storage | 2,000 | Leased | Manufacturing | ||||||
Decin, Czech Republic | Distribution & Storage | 638,000 | Owned | Manufacturing/Office | ||||||
Houston, Texas | Distribution & Storage | 22,000 | Owned | Service | ||||||
| Distribution & Storage | 42,300 | Owned | Service | ||||||
New Prague, Minnesota | Distribution & Storage | 31,000 | Leased | |||||||
Plaistow, New Hampshire | Distribution & Storage | 2,600 | Leased | Office | ||||||
San Jose, California | Distribution & Storage | 20,800 | Leased | Office/Manufacturing | ||||||
Solingen, Germany | Distribution & Storage | 13,400 | Leased | Manufacturing/Office/ Service/Warehouse | ||||||
Canton, Georgia | Distribution & Storage/BioMedical | 154,000 | Owned | Manufacturing/Office | ||||||
Canton, Georgia | Distribution & Storage/BioMedical | 20,800 | Leased | Office | ||||||
Jasper, Georgia | Distribution & Storage/BioMedical | 32,500 | Leased | Warehouse/Service | ||||||
New Prague, Minnesota | Distribution & Storage/BioMedical | 237,000 | Owned | Manufacturing/Service | ||||||
| ||||||||||
Chengdu, China | BioMedical | 176,000 | Owned | Office/Manufacturing | ||||||
| ||||||||||
Lidcombe, Australia | BioMedical | 2,400 | Leased | Office/Warehouse | ||||||
Plainfield, Indiana | BioMedical | 141,000 | Leased | Office/Manufacturing | ||||||
Padova, Italy | BioMedical | 11,800 | Leased | Service | ||||||
San Diego, California | BioMedical | 46,200 | Leased | Office/Manufacturing | ||||||
Tokyo, Japan | BioMedical | 1,600 | Leased | Office | ||||||
Toulouse, France | BioMedical | 9,000 | Leased | Service | ||||||
Wokingham, United Kingdom | BioMedical | 10,000 | Leased | Office/Warehouse/Service | ||||||
Wuppertal, Germany | BioMedical | 104,900 | Leased | Office/Warehouse/Service | ||||||
Garfield Heights, Ohio | Corporate | 17,500 | Leased | Office | ||||||
Luxembourg, Luxembourg | Corporate | 1,900 | Leased | Office | ||||||
Denver, | Discontinued operation | 109,000 | Owned | Held for Sale | ||||||
Clarksville, | Discontinued operation | 110,000 | Owned | Manufacturing/Office | ||||||
| (1) | At December 31, 2010, there is a signed contract for the sale of this facility. |
| (2) | This facility is leased from us, with a purchase option, by the company that owns certain assets of the former Greenville Tube LLC business. |
26
Regulatory Environment
We are subject to federal, state and local regulations relating to the discharge of materials into the environment, production and handling of our hazardous and regulated materials and our products and the conduct and condition of our production facilities. We do not believe that these regulatory requirements have had a material effect upon our capital expenditures, earnings or competitive position. We are not anticipating any material capital expenditures in 20102011 that are directly related to regulatory compliance matters. We are also not aware of any pending or potential regulatory changes that would have a material adverse impact on our business.
| Item 3. | Legal Proceedings. |
We are occasionally subject to various legal actions related to performance under contracts, product liability, environmental liability, taxes, employment, intellectual property and other matters, several of which actions claim substantial damages, in the ordinary course of its business. Based on the Company’s historical experience in litigating these claims, as well as the Company’s current assessment of the underlying merits of the claims and applicable insurance, if any, we currently believe the resolution of these legal claims will not have a material adverse effect on our financial position, liquidity, cash flows or results of operations. Future developments may, however, result in resolution of these legal claims in a way that could have a material adverse effect. See Item 1A. “Risk Factors.”
| Item |
Not Applicable.
| Executive Officers of the Registrant*. |
The name, age and positions of each Executive Officer of the Company as of February 1, 20102011 are as follows:
Name | Age | Position | ||||
Samuel F. Thomas | 59 | Chairman, Chief Executive Officer and President | ||||
Michael F. Biehl | 55 | Executive Vice President, | ||||
Matthew J. Klaben | 41 | Vice President, General Counsel and Secretary | ||||
| ||||||
Kenneth J. Webster | 48 | Vice President, Chief Accounting Officer and Controller | ||||
| * | Included pursuant to Instruction 3 to Item 401(b) of Regulation S-K. |
Samuel F. Thomaswas electedhas served as Chairman of our Board of Directors insince March 2007 and has served as our Chief Executive Officer and President and as a member of our Board of Directors since October 2003. Prior to joining our company, Mr. Thomas was Executive Vice President of Global Consumables at ESAB Holdings Ltd., a provider of welding consumables and equipment. In addition to his most recent position at ESAB, Mr. Thomas was responsible for ESAB North America during his employment at ESAB Holdings Ltd. Prior to joining ESAB in February 1999, Mr. Thomas was Vice President of Friction Products for Federal Mogul, Inc. Prior to its acquisition by Federal Mogul in 1998, Mr. Thomas was employed by T&N plc from 1976 to 1998, where he served from 1991 as chief executive of several global operating divisions, including industrial sealing, camshafts and friction products.
Michael F. Biehlhas been our Executive Vice President since April 2006, served as our Chief Accounting Officer from October 2002 until March 2006, and has been our Chief Financial Officer since July 2001. Until December 16, 2008, Mr. Biehl was also Chart’s Treasurer.Treasurer and assumed that role again effective August 23, 2010. Prior to joining us, Mr. Biehl served as Vice President, Finance and Treasurer at Oglebay Norton Company, an industrial minerals mining and processing company. Prior to joining Oglebay Norton in 1992, Mr. Biehl worked in the audit practice of Ernst & Young LLP in Cleveland, Ohio from 1978 to 1992.
27
Matthew J. Klabenis our Vice President, General Counsel and Secretary. Prior to joining us in March 2006, Mr. Klaben was a partner at the law firm of Calfee, Halter & Griswold LLP in Cleveland, Ohio from January
27
2005 until March 2006, and an associate from April 1998 until December 2004. Before that, Mr. Klaben was an associate at the law firm of Jones Day in Cleveland, Ohio from September 1995 until April 1998.
James H. Hoppel, Jr.was named Treasurer of the Company on December 16, 2008 and has served as our Vice President of Corporate Development since March 1, 2008. Prior to that, Mr. Hoppel served as our Chief Accounting Officer, Controller and Assistant Treasurer since April 2006. Mr. Hoppel joined Chart in November 2004 as our Controller. Prior to joining us, Mr. Hoppel held various finance and accounting positions with different organizations, including the transaction services and audit practices of Pricewaterhouse Coopers LLP in Cleveland, Ohio.
Kenneth J. Webster is our Vice President, Chief Accounting Officer and Controller and has served in that capacity since May 27, 2010. Prior to that, Mr. Webster was Chief Accounting Officer and Controller since March 1, 2008. Mr. Webster joined the Company in July 2006 and until becoming our Chief Accounting Officer and Controller, he wasas the Company’s Director of Internal Audit. Prior to joining Chart, Mr. Webster served as Assistant Corporate Controller for International Steel Group, an integrated steel manufacturer, from March 2004 to April 2005, at which time International Steel Group was acquired by Mittal Steel USA, Inc. Following the acquisition, Mr. Webster continued to serve in his capacity as Assistant Corporate Controller for Mittal Steel USA, Inc. until July 2006. Before that, Mr. Webster served in various accounting and finance positions with Bethlehem Steel.
28
PART II
| Item 5. | Market for Registrant’s Common Equity, Related Stockholder Matters and Issuer Purchases of Equity Securities. |
The Company’s common stock is traded on the Nasdaq Global Select Market under the symbol “GTLS.” Prior to 2008, the common stock traded on the Nasdaq Global Market. The high and low sales prices for the shares of common stock for the periods indicated are set forth in the table below.
| High and Low Sales Price | High and Low Sales Price | |||||||||||||||||||||||||||
| 2009 | 2008 | 2010 | 2009 | |||||||||||||||||||||||||
| High | Low | High | Low | High | Low | High | Low | |||||||||||||||||||||
First quarter | $ | 12.09 | $ | 5.17 | $ | 37.97 | $ | 21.84 | $ | 21.80 | $ | 15.50 | $ | 12.09 | $ | 5.17 | ||||||||||||
Second quarter | 24.62 | 7.39 | 49.79 | 31.39 | 26.43 | 15.44 | 24.62 | 7.39 | ||||||||||||||||||||
Third quarter | 22.75 | 15.36 | 55.73 | 24.12 | 20.69 | 13.85 | 22.75 | 15.36 | ||||||||||||||||||||
Fourth quarter | 23.92 | 15.60 | 28.81 | 6.42 | 35.34 | 19.89 | 23.92 | 15.60 | ||||||||||||||||||||
Year | $ | 24.62 | $ | 5.17 | $ | 55.73 | $ | 6.42 | $ | 35.34 | $ | 13.85 | $ | 24.62 | $ | 5.17 | ||||||||||||
As of February 1, 2010,2011, there were 1672 holders of record of our common stock. Since many holders hold shares in “street name,” we believe that there are a significantly larger number of beneficial owners of our common stock than the number of record holders.
We do not currently intend to pay any cash dividends on our common stock, and instead intend to retain earnings, if any, for future operations, potential acquisitions and debt reduction. The amounts available to us to pay cash dividends are restricted by our senior secured credit facility. The indenture governing the notes also limits our ability to pay dividends. Any decision to declare and pay dividends in the future will be made at the discretion of our board of directors and will depend on, among other things, our results of operations, financial condition, cash requirements, contractual restrictions and other factors that our board of directors may deem relevant.
Cumulative Total Return Comparison
Set forth below is a line graph comparing the cumulative total return of a hypothetical investment in the shares of common stock of Chart Industries with the cumulative return of a hypothetical investment in each of the S&P SmallCap 600 Index, andthe 2009 Peer Group Index comprised of eight oil field equipment/service and industrial companies and our new Peer Group Index based on the respective market prices of each such investment on the dates shown below, assuming an initial investment of $100 on July 31, 2006, including reinvestment of dividends. Trading in Chart common stock commenced July 26, 2006, following a public offering.
29
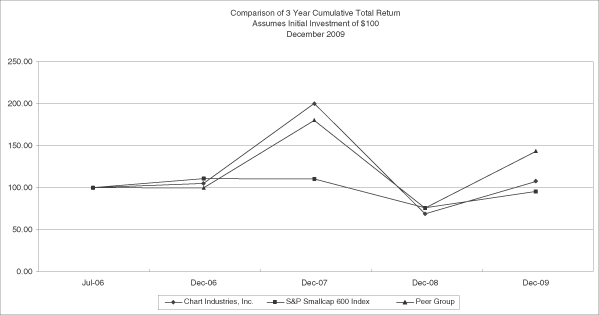
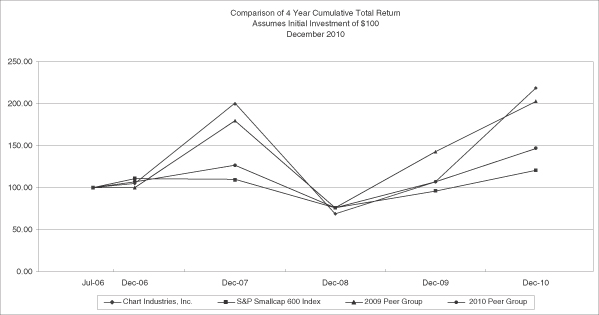
| 7/31/2006 | 12/31/2006 | 12/31/2007 | 12/31/2008 | 12/31/2009 | 7/31/2006 | 12/31/2006 | 12/31/2007 | 12/31/2008 | 12/31/2009 | 12/31/2010 | |||||||||||||||||||||||||||||
Chart Industries, Inc. | $ | 100.00 | $ | 105.26 | $ | 200.65 | $ | 69.03 | $ | 107.27 | $ | 100.00 | $ | 105.26 | $ | 200.65 | $ | 69.03 | $ | 107.27 | $ | 219.35 | |||||||||||||||||
S&P SmallCap 600 Index | 100.00 | 110.70 | 110.37 | 76.08 | 95.53 | 100.00 | 110.70 | 110.37 | 76.08 | 95.53 | 120.66 | ||||||||||||||||||||||||||||
Peer Group Index | 100.00 | 99.95 | 180.42 | 75.71 | 143.30 | ||||||||||||||||||||||||||||||||||
2009 Peer Group Index | 100.00 | 99.95 | 180.42 | 75.71 | 143.30 | 202.84 | |||||||||||||||||||||||||||||||||
2010 Peer Group Index | 100.00 | 107.51 | 127.20 | 77.50 | 106.66 | 147.76 | |||||||||||||||||||||||||||||||||
The Company selects the peer companies that comprise the Peer Group Index solely on the basis of objective criteria. These criteria result in an index composed of eight oil field equipment/service and comparable industrial companies. TheWe changed our Peer Group Index this year. The companies comprising the old Peer Group Index (“2009 Peer Group”) had not changed since our initial public offering in 2006 and some of the 2009 Peer Group companies were only loosely comparable to the Company in size and industry. To create a Peer Group Index that was more closely comparable to the Company in 2010, the Company substantially modified its peer group to include companies whose current lines of business are more comparable to the Company’s. The updated 2010 Peer Group Index (“2010 Peer Group”) members are Dresser-Rand Group Inc., Gardner Denver Inc., Idex Corp., Graco Inc., Lufkin Industries Inc., Powell Industries Inc., Robbins & Meyers Inc., Colfax Corp., Barnes Group Inc., Enpro Industries Inc., Esco Technologies Inc., and Kaydon Corp. The 2009 Peer Group was comprised of Dresser-Rand Group Inc., Idex Corp., FMC Technologies Inc., Pentair Inc., Cameron International Corp., Dril-Quip Inc., National Oilwell Varco Co., and Gardner Denver Inc. Originally, Grant-Prideco Inc. was included in the peer group, however, it was acquired by National Oilwell Varco Co. in 2008 and therefore has been eliminated from the Peer Group. In accordance with SEC rules, both the 2009 Peer Group and 2010 Peer Group are represented in the above graph.
| Item 6. | Selected Financial Data. |
The financial statements referred to as the Predecessor Company financial statements include the consolidated audited financial statements of Chart Industries, Inc. and its subsidiaries prior to the Acquisition, as defined below. The financial statements referred to as the Company financial statements include the consolidated audited financial statements of Chart Industries, Inc. and its subsidiaries after the Acquisition.
On August 2, 2005, we entered into an agreement and plan of merger with certain of our stockholders, First Reserve Fund X, L.P. or First Reserve, and CI Acquisition, Inc., which provided for the sale of shares of Chart by certain of its stockholders to CI Acquisition, Inc. and the merger of CI Acquisition, Inc. with and into Chart, with Chart surviving the merger as a wholly-owned indirect subsidiary of First Reserve. We refer to the stock purchase, merger and related financing thereof collectively as the “Acquisition.” The Acquisition closed on October 17, 2005.
The following table sets forth the selected historical consolidated financial information as of the dates and for each of the periods indicated. The Predecessor Company selected historical consolidated financial data for the period from January 1, 2005 to October 16, 2005 is derived from audited financial statements for such period, which has been audited by Ernst & Young LLP, and which is not included in this Annual Report on Form 10-K. The Company selected historical consolidated financial data as of December 31, 2005 and 2006 and for the
30
period October 17, 2005 to December 31, 2005 and the year years ended December 31, 2006 and 2007 are derived from our audited financial statements for such period,periods, which have been audited by Ernst & Young LLP, and which are not included in this Annual Report on Form 10-K. The Company selected historical financial consolidated data as of and for the years ended December 31, 2007, 2008, 2009 and 20092010 are derived from our audited financial statements for such periods incorporated by reference into Item 8 of this Annual Report on Form 10-K, which have been audited by Ernst & Young LLP.
30
You should read the following table together with Item 7. “Management’s Discussion and Analysis of Financial Condition and Results of Operations” and our consolidated financial statements and related notes, included elsewhere in this Annual Report on Form 10-K.
| Predecessor Company | Company | |||||||||||||||||||||||||||||||||||||||||||||
| January 1, 2005 to October 16, 2005 | October 17, 2005 to December 31, 2005 | Year Ended December 31, | Year Ended December 31, | |||||||||||||||||||||||||||||||||||||||||||
| 2006 | 2007 | 2008 | 2009 | 2006 | 2007 | 2008 | 2009 | 2010 | ||||||||||||||||||||||||||||||||||||||
Statement of Operations Data: | ||||||||||||||||||||||||||||||||||||||||||||||
Sales | $ | 305,497 | $ | 97,652 | $ | 537,454 | $ | 666,395 | $ | 744,363 | $ | 591,516 | $ | 545,185 | $ | 675,459 | $ | 753,086 | $ | 597,458 | $ | 555,455 | ||||||||||||||||||||||||
Cost of sales(1) | 217,284 | 75,733 | 382,535 | 476,854 | 504,975 | 389,635 | 390,266 | 485,918 | 513,698 | 395,577 | 390,156 | |||||||||||||||||||||||||||||||||||
Gross profit | 88,213 | 21,919 | 154,919 | 189,541 | 239,388 | 201,881 | 154,919 | 189,541 | 239,388 | 201,881 | 165,299 | |||||||||||||||||||||||||||||||||||
Selling, general and administrative expenses(2)(3)(4) | 59,826 | 16,632 | 87,652 | 104,056 | 106,035 | 103,132 | 88,048 | 104,360 | 106,035 | 107,547 | 117,795 | |||||||||||||||||||||||||||||||||||
Restructuring expenses, net | 7,528 | 217 | 396 | 304 | — | 4,415 | ||||||||||||||||||||||||||||||||||||||||
| 67,354 | 16,849 | 88,048 | 104,360 | 106,035 | 107,547 | |||||||||||||||||||||||||||||||||||||||||
Operating income(5) | 20,859 | 5,070 | 66,871 | 85,181 | 133,353 | 94,334 | 66,871 | 85,181 | 133,353 | 94,334 | 47,504 | |||||||||||||||||||||||||||||||||||
Interest expense, net | 4,164 | 5,556 | 26,997 | 23,820 | 19,810 | 17,433 | 26,997 | 23,820 | 19,810 | 17,433 | 19,259 | |||||||||||||||||||||||||||||||||||
Other expense (income)(6) | 659 | 409 | (533 | ) | 42 | 3,948 | (7,641 | ) | (533 | ) | 42 | 3,948 | (7,641 | ) | (253 | ) | ||||||||||||||||||||||||||||||
| 4,823 | 5,965 | 26,464 | 23,862 | 23,758 | 9,792 | 26,464 | 23,862 | 23,758 | 9,792 | 19,006 | ||||||||||||||||||||||||||||||||||||
Income (loss) before income taxes and noncontrolling interest | 16,036 | (895 | ) | 40,407 | 61,319 | 109,595 | 84,542 | |||||||||||||||||||||||||||||||||||||||
Income tax expense (benefit) | 7,159 | (441 | ) | 13,044 | 17,319 | 30,489 | 23,386 | |||||||||||||||||||||||||||||||||||||||
Net income (loss) | 8,877 | (454 | ) | 27,363 | 44,000 | 79,106 | 61,156 | |||||||||||||||||||||||||||||||||||||||
Income before income taxes and noncontrolling interest | 40,407 | 61,319 | 109,595 | 84,542 | 28,498 | |||||||||||||||||||||||||||||||||||||||||
Income tax expense | 13,044 | 17,319 | 30,489 | 23,386 | 7,993 | |||||||||||||||||||||||||||||||||||||||||
Net income | 27,363 | 44,000 | 79,106 | 61,156 | 20,505 | |||||||||||||||||||||||||||||||||||||||||
Noncontrolling interest, net of taxes | 19 | 52 | 468 | (156 | ) | 182 | 145 | 468 | (156 | ) | 182 | 145 | 345 | |||||||||||||||||||||||||||||||||
Net income (loss) attributable to Chart Industries, Inc. | $ | 8,858 | $ | (506 | ) | $ | 26,895 | $ | 44,156 | $ | 78,924 | $ | 61,011 | |||||||||||||||||||||||||||||||||
Net income attributable to Chart Industries, Inc. | $ | 26,895 | $ | 44,156 | $ | 78,924 | $ | 61,011 | $ | 20,160 | ||||||||||||||||||||||||||||||||||||
Earnings (loss) per share data(7): | ||||||||||||||||||||||||||||||||||||||||||||||
Earnings (loss) per share data: | ||||||||||||||||||||||||||||||||||||||||||||||
Basic earnings (loss) per share | $ | 1.65 | $ | (0.06 | ) | $ | 1.70 | $ | 1.64 | $ | 2.78 | $ | 2.14 | $ | 1.70 | $ | 1.64 | $ | 2.78 | $ | 2.14 | $ | 0.71 | |||||||||||||||||||||||
Diluted earnings (loss) per share | $ | 1.57 | $ | (0.06 | ) | $ | 1.65 | $ | 1.61 | $ | 2.72 | $ | 2.11 | $ | 1.65 | $ | 1.61 | $ | 2.72 | $ | 2.11 | $ | 0.69 | |||||||||||||||||||||||
Weighted average shares — basic | 5,366 | 7,952 | 15,835 | 26,872 | 28,354 | 28,457 | 15,835 | 26,872 | 28,354 | 28,457 | 28,534 | |||||||||||||||||||||||||||||||||||
Weighted average shares — diluted | 5,649 | 7,952 | 16,269 | 27,493 | 29,008 | 28,981 | 16,269 | 27,493 | 29,008 | 28,981 | 29,255 | |||||||||||||||||||||||||||||||||||
Cash Flow Data: | ||||||||||||||||||||||||||||||||||||||||||||||
Cash provided by operating activities | $ | 15,641 | $ | 14,635 | $ | 36,398 | $ | 82,507 | $ | 97,812 | 86,926 | $ | 36,398 | $ | 82,507 | $ | 97,812 | $ | 86,926 | $ | 38,574 | |||||||||||||||||||||||||
Cash used in investing activities | (20,799 | ) | (362,250 | ) | (38,664 | ) | (18,541 | ) | (65,676 | ) | (802 | ) | (38,664 | ) | (18,541 | ) | (65,676 | ) | (802 | ) | (64,215 | ) | ||||||||||||||||||||||||
Cash provided by (used in) financing activities | 1,708 | 348,489 | 9,235 | 7,444 | (4,061 | ) | 776 | 9,235 | 7,444 | (4,061 | ) | 776 | (19,302 | ) | ||||||||||||||||||||||||||||||||
Other Financial Data: | ||||||||||||||||||||||||||||||||||||||||||||||
Depreciation and amortization(8) | $ | 6,808 | $ | 4,396 | $ | 22,449 | $ | 20,352 | $ | 23,170 | $ | 23,028 | ||||||||||||||||||||||||||||||||||
Depreciation and amortization(7) | $ | 22,449 | $ | 20,352 | $ | 23,170 | $ | 23,028 | $ | 26,640 | ||||||||||||||||||||||||||||||||||||
31
| Company | ||||||||||||||||||||||||||||||||||||||||
| As of December 31, 2005 | As of December 31, 2006 | As of December 31, 2007 | As of December 31, 2008 | As of December 31, 2009 | As of December 31, 2006 | As of December 31, 2007 | As of December 31, 2008 | As of December 31, 2009 | As of December 31, 2010 | |||||||||||||||||||||||||||||||
Balance Sheet Data: | ||||||||||||||||||||||||||||||||||||||||
Cash, cash equivalents and investments | $ | 11,326 | $ | 18,854 | $ | 92,869 | $ | 154,429 | $ | 211,168 | $ | 18,854 | $ | 92,869 | $ | 154,429 | $ | 211,168 | $ | 165,112 | ||||||||||||||||||||
Working capital(9) | 59,561 | 73,290 | 61,484 | 60,360 | 59,299 | |||||||||||||||||||||||||||||||||||
Working capital(8) | 73,290 | 61,484 | 60,360 | 59,299 | 76,301 | |||||||||||||||||||||||||||||||||||
Total assets | 635,641 | (10) | 724,875 | (11) | 825,754 | (12) | 909,427 | (13) | 926,503 | (14) | 724,875 | (9) | 825,754 | (10) | 909,427 | (11) | 926,503 | (12) | 954,839 | (13) | ||||||||||||||||||||
Long-term debt | 345,000 | 290,000 | 250,000 | 243,175 | 243,175 | 290,000 | 250,000 | 243,175 | 243,175 | 218,425 | ||||||||||||||||||||||||||||||
Total debt | 347,304 | 290,750 | 250,000 | 243,175 | 243,175 | 290,750 | 250,000 | 243,175 | 243,175 | 224,925 | ||||||||||||||||||||||||||||||
Shareholders’ equity | 116,330 | 219,734 | 327,991 | 403,960 | 475,561 | 219,734 | 327,991 | 403,960 | 475,561 | 499,164 | ||||||||||||||||||||||||||||||
| (1) | Includes |
31
| (2) | Includes amortization expense related to intangible assets for the |
| (3) | Includes |
| (4) | Includes reversal of contingent liabilities on insolvent former subsidiary of $6.5 million for the year ended December 31, 2008. |
| (5) | Includes $4.9 million of unusual costs for customer settlements and facility shutdown costs for the year ended December 31, 2008. |
| (6) | Includes |
| (7) |
| Includes financing costs amortization for |
| Working capital is defined as current assets excluding cash and short term investments minus current liabilities excluding short-term debt. |
| Includes $247.1 million of goodwill and $146.6 million of finite-lived and indefinite-lived intangible assets as of December 31, 2006. |
| Includes $248.5 million of goodwill and $135.7 million of finite-lived and indefinite-lived intangible assets as of December 31, 2007. |
| Includes $261.5 million of goodwill and $129.5 million of finite-lived and indefinite-lived intangible assets as of December 31, 2008. |
| Includes $264.5 million of goodwill and $123.8 million of finite-lived and indefinite-lived intangible assets as of December 31, 2009. |
| (13) | Includes $275.3 million of goodwill and $144.3 million of finite-lived and indefinite-lived intangible assets as of December 31, 2010. |
32
| Item 7. | Management’s Discussion and Analysis of Financial Condition and Results of Operations. |
You should read the following discussion of our results of operations and financial condition in conjunction with the “Selected Financial Data” section and our consolidated financial statements and related notes appearing elsewhere in this Annual Report on Form 10-K. This discussion contains forward-looking statements. Actual results may differ materially from those discussed below. See “Forward-Looking Statements” at the end of this discussion and Item 1A. “Risk Factors” for a discussion of the uncertainties, risks and assumptions associated with these statements.
Overview
We are a leading independent global manufacturer of highly engineered equipment used in the production, storage and end-use of hydrocarbon and industrial gases. The largest portion of end-use applications for our products is energy-related. We are a leading manufacturer of standard and engineered equipment primarily used for low-temperature and cryogenic applications. We have developed an expertise in cryogenic systems and equipment, which operate at low temperatures sometimes approaching absolute zero (0 kelvin; -273° Centigrade; -459° Fahrenheit). The majority of our products, including vacuum insulated containment vessels, heat exchangers, cold boxes and other cryogenic components, are used throughout the liquid gas supply chain for the purification, liquefaction, distribution, storage and end-use of hydrocarbon and industrial gases.
General economic conditions improved throughout 2010 as evidenced by our improving quarterly order trends and financial performance. Orders for the year ended December 31, 20092010 were $377.4$604.5 million compared
32
to $682.6$377.4 million for the year ended December 31, 2008,2009, representing a decreasean increase of $305.2$227.1 million, or 44.7%60.2%. Our end markets were adversely impacted byRecently completed acquisitions accounting for $58.2 million of the order increase coupled with improving global economic crisis including depressed energy prices and weakened credit markets. This impacted orders, particularlyconditions in all of our D&S and E&C segments. Backlog as of December 31, 2009 was $185.1 million as comparedbusiness segments, led to $398.8 million as of December 31, 2008, representing a decrease of $213.7 million, or 53.6%. Backlog decreased from 2008 levels largely due to a reductionsignificant year over year order improvement. Orders in orders in our E&C and D&S segments during 2009 and the completion of several large projects in E&C during 2009. Although overall orders remain relatively weak, order intake began to improve somewhat during the thirdfourth quarter of 2009 leading to2010 were the first sequentialstrongest quarterly order improvementintake since the second quarter of 2008. This order improvement continued during the fourth quarter of 2009, although in our E&C segment in particular order entry remains weak and potential projects continue to be delayed. Sales, gross profit and operating income for 2009 decreased compared to the year ended December 31, 2008. A substantial portion of this decline was due to lower volume and pricing in our D&S segment. In addition, declining order rates and the completion of several large LNG systems projects in our E&C segment contributed to the decline. Orders in our E&C segment typically fluctuate due to project size and it is not unusual to see order intake vary significantly between periods as a result. Backlog as of December 31, 2010 was $236.4 million as compared to $185.1 million as of December 31, 2009, representing an increase of $51.3 million, or 27.7%. Backlog increased in all business segments as a result of improved economic conditions. Sales for 20092010 were $591.5$555.5 million compared to sales of $744.3$597.5 million for 2008,2009, reflecting a decrease of $152.8$42.0 million, or 20.5%7%. The reduction in sales occurred in our E&C segment due to the completion of several large projects in 2009. This was partially offset by sales from recently completed acquisitions which provided $58.5 million in additional sales largely in our BioMedical segment. Gross profit for the year ended December 31, 20092010 was $201.9$165.3 million, or 34.1%29.8% of sales, as compared to $239.3$201.9 million, or 32.2%33.8% of sales, for the year ended December 31, 2008.2009. Lower volume and pricing drove margins lower in our E&C segment during 2010. Operating income for the year ended December 31, 20092010 was $94.3$47.5 million compared to $133.3$94.3 million for the year ended December 31, 2008.2009.
In anticipation of weakening business conditions that began late in the third quarter of 2008, we implemented cost reduction initiatives to align our cost structure with anticipated market conditions. These initiatives included reductions in our workforce and other costs as well as the shutdown of the Denver BioMedical facility as the result of our exit from the Magnetic Resonance Imaging (“MRI”) business. As a result of these initiatives, our total work force, excluding increases due to acquisitions at December 31, 2009 was down 27.5% from levels at December 31, 2008. In addition, restructuring costs of $8.0 million were recorded during 2009 as a result of the actions.
33
Operating Results
The following table sets forth the percentage relationship that each line item in our consolidated statements of operations represents to sales for the years ended December 31, 2007, 2008, 2009 and 2009.2010.
| 2007 | 2008 | 2009 | 2008 | 2009 | 2010 | |||||||||||||
Sales | 100.0% | 100.0% | 100.0% | 100.0 | % | 100.0 | % | 100.0 | % | |||||||||
Cost of sales | 71.6 | 67.8 | 65.9 | 68.2 | 66.2 | 70.2 | ||||||||||||
Gross profit | 28.4 | 32.2 | 34.1 | 31.8 | 33.8 | 29.8 | ||||||||||||
Selling, general and administrative expense(1)(2) | 14.0 | 12.7 | 16.2 | 12.6 | 16.0 | 18.9 | ||||||||||||
Amortization expense | 1.6 | 1.5 | 1.8 | 1.5 | 1.8 | 2.0 | ||||||||||||
Loss on sale or disposal of assets | 0.1 | 0.1 | 0.2 | |||||||||||||||
Impairment/loss on sale or disposal of assets | 0.1 | 0.2 | 0.3 | |||||||||||||||
Operating income | 12.8 | 17.9 | 15.9 | 17.6 | 15.8 | 8.6 | ||||||||||||
Interest expense, net | 3.3 | 2.4 | 2.7 | 2.4 | 2.6 | 2.9 | ||||||||||||
Financing costs amortization | 0.2 | 0.3 | 0.3 | 0.2 | 0.3 | 0.6 | ||||||||||||
Other expense (income)(3) | 0.1 | 0.5 | (1.3) | 0.5 | (1.3 | ) | 0.1 | |||||||||||
Income tax expense | 2.6 | 4.1 | 3.9 | 4.0 | 3.9 | 1.4 | ||||||||||||
Net income before noncontrolling interest | 6.6 | 10.6 | 10.3 | 10.5 | 10.2 | 3.6 | ||||||||||||
Noncontrolling interest, net of taxes | — | — | — | — | — | — | ||||||||||||
Net income attributable to Chart Industries, Inc. | 6.6 | 10.6 | 10.3 | 10.5 | 10.2 | 3.6 | ||||||||||||
| (1) | Includes stock-based compensation expense of |
| (2) | Includes reversal of contingent liabilities related to secondary obligations of an insolvent former subsidiary of $6.5 million for the year ended December 31, 2008. |
| (3) | Includes |
34
Segment Information
The following table sets forth sales, gross profit, gross profit margin and operating income or loss for our operating segments for the last three years:
| Year Ended December 31, | Year Ended December 31, | |||||||||||||||||||||||
| 2007 | 2008 | 2009 | 2008 | 2009 | 2010 | |||||||||||||||||||
Sales | ||||||||||||||||||||||||
Energy & Chemicals | $ | 253,672 | $ | 312,502 | $ | 254,920 | $ | 312,683 | $ | 255,074 | $ | 137,801 | ||||||||||||
Distribution and Storage | 322,565 | 335,916 | 247,044 | 343,703 | 252,197 | 269,293 | ||||||||||||||||||
BioMedical | 90,158 | 95,945 | 89,552 | 96,700 | 90,187 | 148,361 | ||||||||||||||||||
Total | $ | 666,395 | $ | 744,363 | $ | 591,516 | $ | 753,086 | $ | 597,458 | $ | 555,455 | ||||||||||||
Gross Profit | ||||||||||||||||||||||||
Energy & Chemicals | $ | 58,102 | $ | 103,085 | $ | 94,652 | $ | 103,085 | $ | 94,652 | $ | 31,005 | ||||||||||||
Distribution and Storage | 100,673 | 101,340 | 74,119 | 101,340 | 74,119 | 77,194 | ||||||||||||||||||
BioMedical | 30,766 | 34,963 | 33,110 | 34,963 | 33,110 | 57,100 | ||||||||||||||||||
Total | $ | 189,541 | $ | 239,388 | $ | 201,881 | $ | 239,388 | $ | 201,881 | $ | 165,299 | ||||||||||||
Gross Profit Margin | ||||||||||||||||||||||||
Energy & Chemicals | 22.9 | % | 33.0 | % | 37.1 | % | 33.0 | % | 37.1 | % | 22.5 | % | ||||||||||||
Distribution and Storage | 31.2 | % | 30.2 | % | 30.0 | % | 29.5 | % | 29.4 | % | 28.7 | % | ||||||||||||
BioMedical | 34.1 | % | 36.4 | % | 37.0 | % | 36.2 | % | 36.7 | % | 38.5 | % | ||||||||||||
Total | 28.4 | % | 32.2 | % | 34.1 | % | 31.8 | % | 33.8 | % | 29.8 | % | ||||||||||||
Operating Income (Loss) | ||||||||||||||||||||||||
Energy & Chemicals | $ | 33,821 | $ | 70,752 | $ | 61,852 | $ | 70,752 | $ | 61,852 | $ | 6,121 | ||||||||||||
Distribution & Storage | 66,167 | 63,770 | 39,888 | 63,770 | 39,888 | 41,934 | ||||||||||||||||||
BioMedical | 17,788 | 20,742 | 15,912 | 20,742 | 15,912 | 30,698 | ||||||||||||||||||
Corporate | (32,595 | ) | (21,911 | ) | (23,318 | ) | (21,911 | ) | (23,318 | ) | (31,249 | ) | ||||||||||||
Total | $ | 85,181 | $ | 133,353 | $ | 94,334 | $ | 133,353 | $ | 94,334 | $ | 47,504 | ||||||||||||
Results of Operations for the Year Ended December 31, 2010 Compared to the Year Ended December 31, 2009
Sales
Sales for 2010 were $555.5 million compared to $597.5 million for 2009, reflecting a decrease of $42.0 million, or 7.0%. E&C segment sales were $137.8 million for 2010 compared to $255.1 million for 2009, representing a decrease of $117.3 million, or 46.0%. This decline in sales occurred primarily in the systems product line due to the lack of significant new orders and the completion of several large projects in 2009. Brazed aluminum heat exchangers sales also declined due to reduced volume and lower pricing. Although the global economic environment improved throughout 2010, the delay of large energy related projects continued to have an unfavorable impact on E&C volume and pricing during 2010. D&S segment sales were $269.3 million for the year ended December 31, 2010 compared to $252.2 million for 2009, reflecting an increase of $17.1 million, or 6.8%. Increased D&S segment sales were primarily driven by package gas systems sales, which increased $16.4 million in 2010 compared to 2009 primarily as a result of increased demand both domestically and in China. BioMedical segment sales for the year ended December 31, 2010 were $148.4 million, representing an increase of $58.2 million, or 64.5%, compared to sales of $90.2 million in 2009. Medical respiratory product sales increased $54.2 million largely due to our acquisition of Covidien’s oxygen therapy business in November 2009, which we refer to as the Covidien Acquisition, which added $50.4 million in sales during 2010. Biological storage systems sales increased $8.4 million primarily as a result of increased global demand. These increases were partially offset by the discontinuation of magnetic resonance imaging (“MRI”) component sales in 2009.
34
Gross Profit and Margin
Gross profit for the year ended December 31, 2010 was $165.3 million, or 29.8% of sales compared to $201.9 million, or 33.8% of sales for the year ended December 31, 2009, reflecting a decrease of $36.6 million. E&C segment gross profit decreased $63.7 million and the related margin percent decreased 14.6 percentage points, respectively, in 2010 compared with 2009. The decrease in gross profit was primarily attributable to lower volume and price due to the completion of several projects during 2009 and continued delay of any new large energy related orders creating underutilized capacity in both the brazed aluminum heat exchangers and process system business. D&S segment gross profit increased $3.1 million in 2010 compared to 2009 while the related margin percent remained relatively constant. The gross profit increase was largely attributable to increased sales volume and favorable product mix. In addition, 2009 costs included restructuring charges of $2.0 million related to workforce reductions. BioMedical segment gross profit increased $24.0 million and its related margin percent increased 1.8 percentage points in 2010 compared to 2009 primarily due to higher sales volume and favorable mix for medical respiratory sales driven by the Covidien Acquisition. These increases were partially offset by non-cash inventory valuation charges of $2.4 million related to the write up of acquired inventory from the Covidien Acquisition to fair value that was sold during the year ended December 31, 2010. Increased volume in biological storage systems also contributed to the increased gross profit.
Selling, General and Administrative (“SG&A”) Expenses
SG&A expenses for 2010 were $105.0 million, or 18.9% of sales compared to $95.6 million, or 16.0% of sales for 2009. E&C segment SG&A expenses were $21.2 million, or 15.4% of sales for 2010 versus $29.1 million, or 11.4% of sales for 2009. The decrease of $7.9 million is primarily the result of lower variable compensation and sales commission expense as a result of lower sales volume and decreased bad debt expense. D&S segment SG&A expenses in 2010 were $30.3 million, or 11.3% of sales, compared to $29.2 million, or 11.6% of sales, in 2009. The increase of $1.1 million was primarily attributable to higher compensation costs due to the acquisition of Cryotech during 2010 and higher marketing and sales commission expense due to improving business conditions as well as targeting new growth opportunities. SG&A expenses for the BioMedical segment were $22.8 million, or 15.4% of sales for 2010, representing an increase of $8.8 million as compared to SG&A expenses for 2009 of $14.0 million, or 15.5% of sales. The increase is primarily due to the increased employee, integration, and restructuring costs as a result of several completed acquisitions over the last year and a half in the BioMedical segment. Corporate SG&A expenses for 2010 were $30.7 million compared to $23.3 million for 2009. The increase of $7.4 million was primarily driven by higher stock-based compensation costs, employee related costs and consulting fees related to acquisitions and an Enterprise Resource Planning (“ERP”) system implementation.
Amortization Expense
Amortization expense for 2010 was $11.0 million, or 2.0% of sales, compared to $10.7 million, or 1.8% of sales, for 2009. Amortization expense increased as a result of amortization of intangible assets acquired as part of the Chengdu Golden Phoenix Liquid Nitrogen Container Company, Ltd. (“Golden Phoenix”) and Covidien Acquisitions completed in June and November 2009, respectively. For 2010, amortization expense for the E&C, D&S and BioMedical segments was $3.7 million, $5.0 million and $2.3 million, respectively, compared to $3.7 million, $5.1 million and $1.9 million, respectively, for 2009.
Asset Impairment/Losses on Disposal of Assets
For the year ended December 31, 2010, asset impairment expense of $1.8 million was recorded as a result of the write-down to fair value of the land and building in Denver, Colorado and the land in Plaistow, New Hampshire, which are assets held for sale, and the write down to fair value of certain leasehold improvements in the Plainfield, Indiana facility. For the year ended December 31, 2009, the Company recognized asset impairment expense of $1.2 million related to the write down to fair value of the land and buildings in Denver, Colorado and land in Plaistow, New Hampshire, which were assets held for sale at December 31, 2009. Also,
35
included in asset impairment expense are losses on sales or disposal of equipment of $0.2 million and $0.3 million in 2010 and 2009, respectively, primarily as a result of equipment sales related to the closures of the BioMedical facilities in Plainfield, Indiana and Denver, Colorado.
Operating Income
As a result of the foregoing, operating income for 2010 was $47.5 million, or 8.6% of sales, representing a decrease of $46.8 million compared to operating income of $94.3 million, or 15.8% of sales for 2009. For 2010, operating income (loss) for the E&C, D&S and BioMedical segments and Corporate were $6.1 million, or 4.4% of sales, $41.9 million, or 15.6% of sales, $30.7 million, or 20.7% of sales, and ($31.2) million, respectively. For 2009, operating income (loss) for the E&C, D&S and BioMedical segments and Corporate were $61.8 million, or 24.2% of sales, $39.9 million, or 15.8% of sales, $15.9 million, or 17.6% of sales, and ($23.3) million, respectively.
Gain on Acquisition of Business
For the year ended December 31, 2010, the Company recognized a $1.1 million gain as a result of the acquisition of Covidien Japan Inc.’s liquid oxygen therapy business in April 2010, which we refer to as the Covidien Japan Acquisition. For the year ended December 31, 2009, the Company recognized a $7.0 million gain as a result of the acquisition of Covidien’s oxygen therapy business in November 2009. The purchase price was allocated to the assets acquired and liabilities assumed based on estimates of fair value at the date of acquisition. The estimates of fair value exceeded the cash paid and, accordingly, resulted in a gain on acquisition of business.
Interest Expense, Net
For the year ended December 31, 2010, net interest expense was $16.2 million compared to $15.8 million for the year ended December 31, 2009. The increase of $0.4 million was primarily attributable to higher average variable interest rates on the term loan portion of our senior secured credit facility of 2.7% during 2010 as compared to 2.4% during 2009. The effect of the higher variable interest rates was partially offset by lower average debt outstanding on the term loan as a result of $18.3 million in payments during the year ended December 31, 2010. Further information regarding the Company’s debt is located in Note C to the Company’s consolidated financial statements included in Item 8 of this Annual Report on Form 10-K.
Other Expense and Income
For the years ended December 31, 2010 and 2009, amortization of deferred financing costs was $3.1 million and $1.6 million, respectively. The increase of $1.5 million was attributable to the $1.7 million write off of the remaining deferred financing fees related to the former senior credit facility, which was refinanced in May 2010. For the years ended December 31, 2010 and 2009, foreign currency losses of $0.9 million and gains of $0.7 million, respectively, were recognized by the Company. The losses in 2010 were the result of increased volatility in foreign exchange rates impacting transactions denominated in foreign currencies and the marked to market gains and losses on the Company’s foreign currency forward contracts.
Income Tax Expense
Income tax expense for 2010 was $8.0 million and the effective tax rate was 28.0% compared to income tax expense for 2009 of $23.4 million and an effective tax rate of 27.7%. The increase in the effective tax rate in 2010 is largely due to an increase in state income tax expense primarily as a result of the various acquisitions.
Net Income
As a result of the foregoing, net income for the year ended December 31, 2010 was $20.2 million compared to net income of $61.0 million for the year ended December 31, 2009, representing a decrease of 66.9%.
36
Results of Operations for the Year Ended December 31, 2009 Compared to the Year Ended December 31, 2008
Sales
Sales for 2009 were $591.5$597.5 million compared to $744.3$753.1 million for 2008, reflecting a decrease of $152.8$155.6 million, or 20.5%20.7%. E&C segment sales were $254.9$255.1 million for 2009 compared to $312.5$312.7 million for 2008, representing a decrease of $57.6 million, or 18.4%. This decrease in E&C sales for 2009 was primarily due to lower volume in both brazed aluminum heat exchangers and process systems resulting from a decline in large project orders as a result of the global economic crisis. In addition, a number of large LNG system projects were completed and orders cancelled in the brazed aluminum heat exchangers business, which contributed to the decline. These declines were partially offset by increased volume in air cooled heat exchangers as this business has continued to grow with demand from the U.S. domestic natural gas compression segment as well as new applications in the power industry. D&S segment sales were $247.0$252.2 million for the year ended December 31, 2009 compared to $335.9$343.7 million for 2008, reflecting a decrease of $88.9$91.5 million, or 26.5%26.6%. Bulk storage sales decreased $38.5$39.8 million and package gas systems sales decreased $50.4$51.7 million in 2009 compared to 2008 as a result of lower prices and volume as industrial gas customers limited their capital spending as a result of the economic downturn. BioMedical segment sales for the year ended December 31, 2009 were $89.6$90.2 million, representing a decrease of $6.3$6.5 million, or 6.6%6.7%, compared to sales of $95.9$96.7 million in 2008. Medical respiratory product sales increased $4.6 million due to increased demand in Europe and the Covidien Acquisition which added $2.9 million in sales since acquisition. Biological storage systems sales decreased $3.3 million primarily
35
due to lower volume in domestic and international markets partially offset by sales of $2.2 million from the acquisition of Chengdu Golden Phoenix Liquid Nitrogen Container Company, Ltd. (“Golden Phoenix”) in June 2009. MRI and other product sales decreased $7.6 million largely due to the discontinuation of the MRI product line and the shutdown of the Denver, Colorado BioMedical facility, which was completed during the third quarter of 2009.
Gross Profit and Margin
Gross profit for the year ended December 31, 2009 was $201.9 million, or 34.1%33.8% of sales compared to $239.3 million, or 32.2%31.8% of sales for the year ended December 31, 2008, reflecting a decrease of $37.4 million. E&C segment gross profit decreased $8.4 million while the related margin increased 4.1 percentage points, respectively, in 2009 compared with 2008. The decrease in gross profit was primarily attributable to lower volumes for brazed aluminum heat exchangers and process systems. The declines in volume were partially offset by increased volume and efficiency for air cooled heat exchangers. Process systems margin benefited from improved project execution and project cost performance. D&S segment gross profit decreased $27.2 million in 2009 compared to 2008 while the related margin remained relatively constant. The gross profit decrease iswas largely attributable to lower sales volume, pricing and restructuring charges of $2.0 million related to workforce reductions, partially offset by lower material costs and other cost reduction initiatives. BioMedical segment gross profit decreased $1.8 million in 2009 compared to 2008 primarily due to lower sales volume for biological storage systems and restructuring charges of $1.5 million related to workforce reductions and closure of the Denver, Colorado facility. BioMedical segment gross profit margin increased in 2009 by 0.60.5 percentage points compared to 2008. This increase was primarily due to a more favorable mix and lower material costs.
Selling, General and Administrative (“SG&A”) Expenses
SG&A expenses for 2009 were $95.6 million, or 16.2%16.0% of sales compared to $100.8 million, or 13.5%13.4% of sales for 2008. E&C segment SG&A expenses were $29.1 million, or 11.4% of sales for 2009 versus $27.9 million, or 8.9% of sales for 2008. The increase of $1.2 million iswas primarily the result of higher bad debt expense. The expense was partially offset by lower sales commissions and variable incentive compensation expense as a result of lower sales volume. D&S segment SG&A expenses in 2009 were $29.2 million, or 11.8%11.6% of sales, compared to $32.0 million, or 9.5%9.3% of sales, in 2008. This decrease was primarily attributable to lower compensation costs, lower outside marketing and consulting services as well as reduced travel costs, partially
37
offset by restructuring charges of $1.2 million related to workforce reductions. SG&A expenses for the BioMedical segment were $14.0 million, or 15.6%15.5% of sales for 2009, representing an increase of $1.5 million as compared to SG&A expenses for 2008 of $12.5 million, or 13.0%12.9% of sales. The increase is primarily due to the acquisition of Covidien’s oxygen therapy business at the end of November 2009. Corporate SG&A expenses for 2009 were $23.3 million compared to $28.4 million for 2008. The decrease of $5.1 million was primarily driven by lower compensation, outside consulting services and travel costs as a result of cost reduction initiatives.
Amortization Expense
Amortization expense for 2009 was $10.7 million, or 1.8% of sales, compared to $11.0 million, or 1.5% of sales, for 2008. Amortization expense decreased as a result of certain intangible assets becoming fully amortized during 2009 partially offset by the amortization of intangible assets acquired as part of the Golden Phoenix and Covidien Acquisitions completed in June and November 2009, respectively. For 2009, amortization expense for the E&C, D&S and BioMedical segments was $3.7 million, $5.1 million and $1.9 million, respectively, compared to $3.7 million, $5.6 million and $1.7 million, respectively, for 2008.
Asset Impairment
For the year ended December 31, 2009, the Company recognized asset impairment expense of $1.2 million related to the write down to fair value of the land and buildings in Denver, Colorado and land in Plaistow, New Hampshire, which are assets held for sale at December 31, 2009. The Company also recognized in 2009 a loss on
36
the sale of equipment in conjunction with the closure of the BioMedical facility in Denver. For the year ended December 31, 2008, the Company recognized a $0.7 million loss primarily related to a leased facility that was shut down by the Company’s E&C segment.
Operating Income
As a result of the foregoing, operating income for 2009 was $94.3 million, or 15.9%15.8% of sales, representing a decrease of $39.0 million compared to operating income of $133.3 million, or 17.9%17.7% of sales for 2008. For 2009, operating income (loss) for the E&C, D&S and BioMedical segments and Corporate were $61.8 million, or 24.2% of sales, $39.9 million, or 16.2%15.8% of sales, $15.9 million, or 17.7%17.6% of sales, and ($23.3) million, respectively. For 2008, operating income (loss) for the E&C, D&S and BioMedical segments and Corporate were $70.7 million, or 22.6% of sales, $63.8 million, or 19.0%18.6% of sales, $20.7 million, or 21.6%21.4% of sales, and ($21.9) million, respectively.
Gain on Acquisition of Business
For the year ended December 31, 2009, the Company recognized a $7.0 million gain as a result of the acquisition of Covidien’s oxygen therapy business in November 2009. The purchase price was allocated to the assets acquired and liabilities assumed based on estimates of fair value at the date of acquisition. The estimates of fair value exceeded the cash paid and, accordingly, resulted in a gain on acquisition of business.
Interest Expense, Net
For the year ended December 31, 2009, net interest expense was $15.8 million compared to $17.9 million for the year ended December 31, 2008. The decrease of $2.1 million is partially attributable to lower average interest rates on our variable rate senior secured credit facility of 2.4% during 2009 as compared to 5.4% during 2008. Also contributing to the decrease in net interest expense was lower debt outstanding as a result of the repurchase of $6.8 million in outstanding senior subordinated notes during the third quarter of 2008. Further information regarding the Company’s debt is located in Note C to the Company’s consolidated financial statements included in Item 8 of this Annual Report on Form 10-K.
38
Other Expense and Income
For the years ended December 31, 2009 and 2008, amortization of deferred financing costs was $1.6 million and $1.9 million, respectively. The decrease in amortization expense was attributable to the $0.2 million write off of deferred loan costs in conjunction with the purchase of $6.8 million of our senior subordinated notes during 2008. For the years ended December 31, 2009 and 2008, foreign currency gains of $0.7 million and losses of $3.9 million, respectively, were recognized by the Company. The gains during 2009 were the result of less volatility in foreign exchange rates which affected the marked to market gains and losses on foreign currency forward contracts, specifically in our Czech Republic subsidiary. Most of the 2008 currency loss occurred during the fourth quarter due to significant currency volatility that largely impacted our euro denominated transactions, cash balances and marked-to-market forward currency contracts.
Income Tax Expense
Income tax expense for 2009 was $23.4 million and the effective tax rate was 27.7% compared to income tax expense for 2008 of $30.5 million and an effective tax rate of 27.8%. The decrease in the effective tax rate in 2009 was primarily attributable to a permanent tax difference on the gain on acquisition of business related to the acquisition of Covidien’s oxygen therapy business.
Net Income
As a result of the foregoing, net income for the year ended December 31, 2009 was $61.0 million compared to net income of $78.9 million for the year ended December 31, 2008, representing a decrease of 22.7%.
37
Results of Operations for the Year Ended December 31, 2008 Compared to the Year Ended December 31, 2007
Sales
Sales for 2008 were $744.3 million compared to $666.4 million for 2007, reflecting an increase of $77.9 million, or 11.7%. E&C segment sales were $312.5 million for 2008 compared to $253.7 million for 2007, representing an increase of $58.8 million, or 23.2%. This increase in E&C sales for 2008 resulted primarily from a more favorable project mix and higher throughput for both brazed aluminum and air cooled heat exchangers. Sales increases were also driven by continued growth in the LNG and natural gas segments of the hydrocarbon processing market during the first half of 2008. D&S segment sales were $335.9 million for the year ended December 31, 2008 compared to $322.5 million for 2007, reflecting an increase of $13.4 million, or 4.1%. Bulk storage sales decreased $8.5 million in 2008 compared to 2007 as a result of lower volume partially offset by favorable currency translation from the strengthening of the euro, Czech koruna and Chinese yuan during 2008 compared to 2007. Packaged gas system sales increased $15.1 million for 2008 as a result of higher prices and favorable foreign currency translation as well. In addition, D&S sales benefited $6.8 million from the acquisition of Flow Instruments and Engineering GmbH (“Flow”) in April 2008. BioMedical segment sales for the year ended December 31, 2008 were $95.9 million, representing an increase of $5.7 million, or 6.3%, compared to sales of $90.2 million in 2007. Biological storage systems sales increased $4.9 million primarily due to higher volume in both the U.S. and international markets as well as favorable currency translation from euro denominated sales. Medical respiratory product sales increased $1.1 million primarily as a result of higher volume in international markets, partially offset by decreased demand in the U.S. market.
Gross Profit and Margin
Gross profit for the year ended December 31, 2008 was $239.3 million, or 32.2% of sales compared to $189.5 million, or 28.4% of sales for the year ended December 31, 2007, reflecting an increase of $49.8 million. E&C segment gross profit increased $45.0 million and the related margin increased 10.1 percentage points, respectively, in 2008 compared with 2007. The increase in gross profit was attributable to increased throughput for brazed aluminum heat exchangers and increased volume and efficiency for air cooled heat exchangers. Process systems margin benefited from improved project mix and project execution. In addition, a number of performance incentives and change orders were earned as a result of improved project execution enhancing margins in process systems. These improvements were partially offset by customer settlements related to projects substantially completed in prior periods. These customer settlements included disputed costs for an installation project completed during 2007 and repair costs on another project that was shipped in 2006 and 2007. D&S segment gross profit increased $0.6 million in 2008 compared to 2007 while the related margin decreased 1.0 percentage points. The decrease in margin is largely attributable to lower sales volume for bulk storage systems. BioMedical segment gross profit increased $4.2 million in 2008 compared to 2007 primarily due to higher prices across all product lines, higher volume in biological storage systems and favorable currency impact from euro denominated sales. BioMedical segment gross profit margin increased in 2008 by 2.3 percentage points compared to 2007 primarily due to improved product mix in biological storage systems.
SG&A Expenses
SG&A expenses for 2008 were $100.8 million, or 13.5% of sales compared to $92.6 million, or 13.9% of sales for 2007. E&C segment SG&A expenses were $27.9 million, or 8.9% of sales for 2008 versus $19.8 million, or 7.8% of sales, for 2007. The increase of $8.1 million reflected higher employee-related expenses including variable incentive compensation due to improved operating performance as well as marketing and sales costs to support business growth. D&S segment SG&A expenses in 2008 were $32.0 million, or 9.5% of sales compared to $29.0 million, or 9.0% of sales, in 2007. This increase was primarily due to higher employee-related expenses to support business growth and the acquisition of Flow in April 2008. BioMedical segment SG&A expenses were $12.5 million, or 13.0% of sales for 2008, representing an increase of $1.3 million for employee related expenses as compared to SG&A expenses for 2007 of $11.2 million, or 12.4% of sales. Corporate SG&A expenses for 2008 were $28.4 million compared to $32.6 million for 2007. The
38
decrease of $4.2 million was primarily driven by the inclusion in 2007 of $7.9 million of stock-based compensation expense related mostly to the vesting of performance-based options in conjunction with the secondary stock offering completed in June 2007 and other expenses. The stock-based compensation expense decrease was partially offset by increased employee-related, infrastructure and acquisition costs to support our overall business growth strategy.
Amortization Expense
Amortization expense for 2008 was $11.0 million, or 1.5% of sales, compared to $10.9 million, or 1.6% of sales, for 2007. Amortization expense increased due to the addition of intangible assets related to the acquisition of Flow in April 2008. For 2008, amortization expense for the E&C, D&S and BioMedical segments was $3.7 million, $5.6 million and $1.7 million, respectively, compared to $4.1 million, $5.1 million and $1.7 million, respectively, for 2007.
Employee Separation and Plant Closure Costs
For 2007, employee separation and plant closure costs were $0.3 million. These costs were related to an idled D&S segment facility in Plaistow, New Hampshire that was sold in the fourth quarter of 2007.
Loss on Disposal of Assets, Net
For the year ended December 31, 2008, the Company recognized a $0.7 million loss primarily related to a leased facility that has since been shut down by the Company’s E&C segment. The Company also recognized a $0.5 million loss for the year ended December 31, 2007 related to a leased facility that was vacated by the E&C segment during 2007.
Operating Income
As a result of the foregoing, operating income for 2008 was $133.3 million, or 17.9% of sales, representing an increase of $48.1 million compared to operating income of $85.2 million, or 12.8% of sales for 2007. For 2008, operating income (loss) for the E&C, D&S and BioMedical segments and Corporate were $70.7 million, or 22.6% of sales, $63.8 million, or 19.0% of sales, $20.7 million, or 21.6% of sales, and ($21.9) million, respectively. For 2007, operating income (loss) for the E&C, D&S and BioMedical segments and Corporate were $33.8 million, or 13.3% of sales, $66.2 million, or 20.5% of sales, $17.8 million, or 19.7% of sales, and ($32.6) million, respectively.
Interest Expense, Net
For the year ended December 31, 2008, net interest expense was $17.9 million compared to $22.2 million for the year ended December 31, 2007. The decrease of $4.3 million is partially attributable to the reduction in the outstanding balance of the term loan portion of our senior secured credit facility as a result of a voluntary principal payment during 2007 of $40.0 million, funded primarily by proceeds from the secondary stock offering completed in June 2007. Average interest rates on our variable rate senior secured credit facility were 5.4% during 2008 as compared to 7.58% during 2007 and interest income increased $0.6 million in 2008 compared to 2007 as a result of higher cash balances. Further information regarding the Company’s debt is located in Note C to the Company’s consolidated financial statements included in Item 8 of this Annual Report on Form 10-K.
Other Expense and Income
For the years ended December 31, 2008 and 2007, amortization of deferred financing costs was $1.9 million and $1.6 million, respectively. This increase in amortization expense was attributable to the $0.2 million write off of deferred loan costs in conjunction with the purchase of $6.8 million of our senior subordinated notes during
39
2008. For the years ended December 31, 2008 and 2007, foreign currency losses were $3.9 million and $0.1 million, respectively. Most of the currency loss occurred during the fourth quarter of 2008 due to significant currency volatility that largely impacted our euro denominated transactions, cash balances and marked-to-market forward currency contracts.
Income Tax Expense
Income tax expense for 2008 was $30.5 million and the effective tax rate was 27.8% compared to income tax expense for 2007 of $17.3 million and an effective tax rate of 28.2%. The decrease in the effective tax rate in 2008 was primarily attributable to the reversal of the contingent liabilities related to an insolvent former subsidiary partially offset by an increase in the mix of U.S. earnings, which are taxed at a higher rate than foreign earnings.
Net Income
As a result of the foregoing, net income for the year ended December 31, 2008 was $78.9 million compared to net income of $44.2 million for the year ended December 31, 2007, representing an increase of 78.5%.
Orders and Backlog
We consider orders to be those for which we have received a firm signed purchase order or other written contractual commitment from the customer. Backlog is comprised of the portion of firm signed purchase orders or other written contractual commitments received from customers that we have not recognized as revenue upon shipment or under the percentage of completion method. Backlog can be significantly affected by the timing of orders for large projects, particularly in the E&C segment, and is not necessarily indicative of future backlog levels or the rate at which backlog will be recognized as sales. Orders included in our backlog may include customary cancellation provisions under which the customer could cancel part or all of the order, potentially subject to the payment of certain costs and/or penalties. Our backlog as of December 31, 2010, 2009 and 2008 and 2007 was $236.4 million, $185.1 million $398.8 million and $475.3$398.8 million, respectively.
The table below sets forth orders and backlog by segment for the periods indicated:
| Year Ended December 31, | Year Ended December 31, | ||||||||||||||||||||
| 2009 | 2008 | 2007 | 2010 | 2009 | 2008 | ||||||||||||||||
Orders | |||||||||||||||||||||
Energy & Chemicals | $ | 75,788 | $ | 220,833 | $ | 408,020 | $ | 165,827 | $ | 75,788 | $ | 220,833 | |||||||||
Distribution & Storage | 208,851 | 367,556 | 324,698 | 287,819 | 208,851 | 367,556 | |||||||||||||||
BioMedical | 92,746 | 94,214 | 94,045 | 150,864 | 92,746 | 94,214 | |||||||||||||||
Total | $ | 377,385 | $ | 682,603 | $ | 826,763 | $ | 604,510 | $ | 377,385 | $ | 682,603 | |||||||||
Backlog | |||||||||||||||||||||
Energy & Chemicals | $ | 87,816 | $ | 265,900 | $ | 358,784 | $ | 115,972 | $ | 87,816 | $ | 265,900 | |||||||||
Distribution & Storage | 87,727 | 125,929 | 107,011 | 108,665 | 87,727 | 125,929 | |||||||||||||||
BioMedical | 9,518 | 7,013 | 9,483 | 11,779 | 9,518 | 7,013 | |||||||||||||||
Total | $ | 185,061 | $ | 398,842 | $ | 475,278 | $ | 236,416 | $ | 185,061 | $ | 398,842 | |||||||||
39
Orders for 2010 were $604.5 million compared to $377.4 million for 2009, representing an increase of $227.1 million, or 60.2%. E&C segment orders were $165.8 million in 2010, an increase of $90.0 million compared to 2009. Orders in the E&C segment experienced increases in all businesses including process systems, brazed aluminum heat exchangers, and air cooled heat exchangers due to improving global economic conditions, although the absence of any large energy related orders still kept order trends below historical peak levels. In addition, E&C orders fluctuate due to project size and it is not unusual to see order intake vary significantly between quarters and years as a result. D&S segment orders for 2010 were $287.8 million compared to $208.9 million for 2009, an increase of $78.9 million, or 37.8%. D&S order entry improved as capital spending from industrial gas customers began to improve during 2010. D&S order intake improved sequentially each quarter during 2010 with the fourth quarter of 2010 being the strongest in over two years. Bulk storage system and packaged gas system orders for the year were $177.2 million and $110.6 million, respectively, representing an increase of 47.8% in bulk storage systems and 24.3% in packaged gas system orders. Orders for the BioMedical segment for 2010 were $150.9 million compared to orders of $92.7 million for the year ended December 31, 2009. Medical respiratory orders increased $50.7 million primarily as a result of the Covidien Acquisition in November 2009. Biological storage system orders also increased $11.6 million as global demand continued to improve.
Orders for 2009 were $377.4 million compared to $682.6 million for 2008, representing a decrease of $305.2 million, or 44.7%. E&C segment orders were $75.8 million in 2009, a decrease of $145.0 million compared to 2008. Orders in the E&C segment experienced a significant decline as a result of the global economic crisis and depressed energy prices with order cancellations occurring and potential new project timing delayed due to the lack of project financing. In addition, E&C orders fluctuate due to project size and it is not
40
unusual to see order intake vary significantly between quarters and years as a result. D&S segment orders for 2009 were $208.9 million compared to $367.5 million for 2008, a decline of $158.6 million, or 43.2%. D&S order entry was also significantly impacted by the global economic downturn with declines in all product lines. Our industrial gas customers, particularly in North America and Western Europe, restricted their purchases as they were impacted by de-installation rates with their customers due to facility shutdowns and low industrial production activity. Bulk storage system and packaged gas system orders for the year were $115.0$119.9 million and $89.0 million, respectively, representing a decline of 48.9%48.2% in bulk storage systems and 34.7% in packaged gas system orders. Orders for the BioMedical segment for 2009 were $92.7 million compared to orders of $94.2 million for the year ended December 31, 2008. Orders have remained relatively constant throughout the global economic downturn in the BioMedical segment. In addition, the acquisition of Covidien’s oxygen therapy business in November 2009 and Golden Phoenix added $6.5 million in orders during 2009. Orders for medical respiratory products were $44.8 million and orders for biological storage systems were $43.8 million for the year ended December 31, 2009.
Orders for 2008 were $682.6 million compared to $826.8 million for 2007, representing a decrease of $144.2 million, or 17.4%. E&C segment orders were $220.8 million in 2008, a decrease of $187.2 million compared to 2007. E&C orders fluctuate due to project size and it is not unusual to see order intake vary significantly between quarters and years as a result. For example, during 2007 E&C was awarded a significant order in excess of $130 million from EWC for four LNG liquefaction trains. In addition, the E&C segment experienced a decline in order levels during the fourth quarter as a result of the global economic downturn and some order cancellations occurred and potential new project timing was delayed due to lack of project financing. D&S segment orders for 2008 were $367.5 million compared to $324.7 million for 2007, an increase of $42.8 million, or 13.2%. Bulk storage system and packaged gas system orders for the year were $225.1 million and $136.2 million, respectively, representing increases in both product lines. The acquisition of Flow in April 2008 also contributed to the increase in orders. Although orders on a year over year basis did increase, D&S also experienced weak order intake during the fourth quarter of 2008 as a result of the global economic downturn. Orders for the BioMedical segment for 2008 were $94.2 million compared to orders of $94.1 million for the year ended December 31, 2007. Orders for medical respiratory products, biological storage systems, and MRI components and other liquid oxygen products were $37.1 million, $48.1 million and $9.0 million, respectively. The medical respiratory products and biological systems orders were driven by continued penetration and growth in international markets.
Liquidity and Capital Resources
TheOn May 18, 2010, the Company hascompleted the refinancing of its prior credit facility with a $240.0$200.0 million senior secured credit facility consisting(“Senior Credit Facility”). The new Senior Credit Facility consists of a $180.0$65.0 million term loan facility and a $115.0$135.0 million revolving credit facility of which the entire $115.0 million may be used for letters of credit and bank guarantees and $55.0 million may be used for letters of credit extending more than one year from theirwith a scheduled maturity date of issuance. TheMay 18, 2015. Under the terms of the new facility, 10% of the $65 million term loan facility matures on October 17, 2012 andis payable in quarterly installments of $1.6 million with the revolving credit facility matures on October 17, 2010. The Company plans on taking advantage of the current favorable credit market conditions to refinance its senior secured credit facility prior to the maturity of its existing revolving credit facility. This will ensure that the Company continues to have uninterrupted access to revolving credit to meet working capital and strategic needs, including letters of credit related to our execution on new and existing major projects.
On June 12, 2007, the Company completed a secondary stock offering of 12.6 million shares. The secondary shares were sold by FR X Chart Holdings LLC and certain members of the Company’s management. Our underwriters exercised their option to acquire 1.9 million shares to cover over-allotmentsbalance due in full as2015. As part of the offering. The net proceeds of $38.0 million received byrefinancing, the Company from the exerciseused cash to pay off $15.0 million of the over-allotment option were used to make a $40.0its prior $80.0 million voluntary principal payment underterm loan. The balance due on the term loan portion of the senior secured credit facility.was $61.7 million at December 31, 2010.
Debt Instruments and Related Covenants
As of December 31, 2009,2010, the Company had $80.0 million outstanding under the term loan portion of its senior secured credit facility (the “Senior Credit Facility”), $163.2 million outstanding under its senior
41
subordinated notes (the “Subordinated(“Subordinated Notes”) and $26.8$22.0 million of letters of credit and bank guarantees supported by the revolving portion of the Senior Credit Facility (“Revolver”).Facility. The Company is in compliance with all covenants, including its financial covenants, under the Senior Credit Facility and Subordinated Notes. Availability on the revolving portion of the Senior Credit Facility was $83.2$113.0 million at December 31, 2009.2010.
During the twelve months ended December 31, 2008, the Company retired $6.8 million of its Subordinated Notes in open market purchases.
On October 5, 2008, Lehman Commercial Paper Inc (“LCPI”), a subsidiary of Lehman Brothers Holdings Inc. and a lender under the Revolver, filed for bankruptcy protection in Chapter 11 of the United States Bankruptcy Code. LCPI provides $5.0 million in commitments, or approximately 4.3% of total commitments, on the Revolver. A representative of LCPI has orally disclosed to the Company that it will not honor its obligation under the Senior Credit Facility. Accordingly, the total borrowing capacity under the Revolver is effectively limited to $110.0 million. The loss of the $5.0 million in effective capacity does not have a material effect on meeting the liquidity and capital resources need of the Company.40
Chart Ferox, a.s., or Ferox, our wholly-owned subsidiary that operates in the Czech Republic, maintains secured revolving credit facilities with borrowing capacity including overdraft protection, of up to 200.0150.0 million Czech korunas (“CSK”), of which 50.0 million CSK is available only for letters of credit and bank guarantees. Under the revolving credit facilities, Ferox may make borrowings in CSK, euros and U.S. dollars.
Our debt and related covenants are further described in Note C to our consolidated financial statements included elsewhere in this report.
Sources and Uses of Cash
Years Ended December 31, 2010 and 2009
Our cash and cash equivalents totaled $165.1 million as of December 31, 2010, a decrease of $46.1 million from the balance at December 31, 2009. Cash equivalents are invested in money market funds that invest in high quality, short-term instruments, such as U.S. government obligations, certificates of deposit, repurchase obligations and commercial paper issued by corporations that have been highly rated by at least one nationally recognized rating organization. Based on the foregoing, we believe that there is low risk that our cash and cash equivalents will not be a source of liquidity for us.
Cash provided by operating activities for the year ended December 31, 2010 was $38.6 million compared to cash provided of $86.9 million for the year ended December 31, 2009. The decrease of $48.3 million was driven by decreased net income of $40.7 million and a reduction in customer advances and billings in excess of contract revenue due to reduced project backlog in E&C.
Cash used by investing activities for the years ended December 31, 2010 and 2009 was $64.2 million and $0.8 million, respectively. Capital expenditures for 2010 were $16.9 million compared with $13.2 million for 2009. The 2010 capital expenditures were primarily for the completion of the new industrial gas equipment repair center in McCarran, Nevada, a new BioMedical manufacturing facility in Canton, Georgia and the continuing implementation of a new ERP system for the Company. During 2010, $43.8 million was used for three acquisitions: Covidien’s Japanese liquid oxygen therapy business, substantially all of the assets of Cryotech International, Inc., and SeQual Technologies, Inc. The final deferred purchase payments for the 2009 acquisition of Golden Phoenix of $4.1 million were paid in 2010. $1.0 million in proceeds was received in 2010 from the sale of certain operating equipment at the BioMedical segment’s Plainfield, Indiana facility. Short term investments of $32.3 million matured during 2009 which had been invested during 2008 in short term investments with original maturities of less than six months. Capital expenditures in 2009 were primarily for a new industrial gas equipment repair center in McCarran, Nevada, a new BioMedical segment facility in Wuppertal, Germany and the implementation of a new ERP system for the Company. During 2009, $18.1 million, net of cash acquired, was used for three acquisitions: the equity interests of Golden Phoenix, the oxygen therapy business of Covidien and substantially all of the assets of Tri-Thermal, Inc.
For the year ended December 31, 2010, cash used by financing activities was $19.3 million compared to cash provided of $0.8 million for the year ended December 31, 2009. During 2010, principal debt payments of $18.3 million were made of which $15.0 million was a voluntary payment on the term loan portion of the prior credit facility as part of the refinancing. The additional $3.3 million in principal payments were scheduled quarterly payments on the term loan portion of the new Senior Credit Facility. $2.8 million in financing costs related to the refinancing were also paid during 2010. The exercise of stock options provided $1.0 million and $0.8 million in 2010 and 2009, respectively.
Years Ended December 31, 2009 and 2008
Cash provided by operating activities for the year ended December 31, 2009 was $86.9 million compared to cash provided of $97.8 million for the year ended December 31, 2008. The decrease of $10.9 million was driven
41
by decreased net income of $17.9 million and a reduction in customer advances and billings in excess of contract revenue due to reduced order rates and project backlog in E&C.
Cash used by investing activities for the years ended December 31, 2009 and 2008 was $0.8 million and $65.7 million, respectively. Short term investments of $32.3 million matured during 2009 which had been invested during 2008 in short term investments with original maturities of less than six months. Capital expenditures for 2009 were $13.2 million compared with $14.0 million for 2008. Capital expenditures in 2009 were primarily for a new industrial gas equipment repair center in Reno,McCarran, Nevada, a new BioMedical segment facility in Wuppertal, Germany and the implementation of a new ERP system for the Company. The 2008 capital expenditures were primarily for the D&S segment facility expansions and improvements mainly in China and the Czech Republic to support business growth and normal equipment purchases and replacements to increase automation and improve efficiency across all facilities. During 2009, $18.1 million, net of cash acquired, was used for three acquisitions: the equity interests of Golden Phoenix, the oxygen therapy business of Covidien and substantially all of the assets of Tri-Thermal, Inc. In 2008, $18.8 million of cash, net of cash acquired was used to purchase Flow and $0.6 million was contributed to a joint venture in Saudi Arabia for the manufacture of air cooled heat exchangers.
For the year ended December 31, 2009, cash provided by financing activities was $0.8 million, from the exercise of stock options, compared to cash used of $4.1 million for the year ended December 31, 2008. During 2008, $6.8 million in cash was used to purchase a portion of our outstanding Subordinated Notes in September on the open market offset by cash received from the exercise of stock options.
42
Years Ended December 31, 2008 and 2007
Cash provided by operating activities for the year ended December 31, 2008 was $97.8 million compared to cash provided of $82.5 million for the year ended December 31, 2007. The increase of $15.3 million was driven by increased net income of $34.7 million partially offset by increases in inventory and decreases in accounts payable.
Cash used by investing activities for the years ended December 31, 2008 and 2007 was $65.7 million and $18.5 million, respectively. $32.3 million during 2008 was invested in short term investments with original maturities of less than six months. Capital expenditures for 2008 were $14.0 million compared with $19.0 million for 2007. The 2008 capital expenditures were primarily for the D&S segment facility expansions and improvements mainly in China and the Czech Republic to support business growth and normal equipment purchases and replacements to increase automation and improve efficiency across all facilities. Capital expenditures in 2007 were primarily for the E&C segment brazed aluminum heat exchanger facility in La Crosse, Wisconsin and the expansion of the D&S manufacturing facility in China. In 2008, $18.8 million of cash, net of cash acquired was used to purchase Flow and $0.6 million was contributed to a joint venture in Saudi Arabia for the manufacture of air cooled heat exchangers. In 2007, $1.6 million was used to purchase the remaining interest of Chart Ferox a.s. and $2.1 million of cash proceeds were received from the sale of the Plaistow, New Hampshire facility that was closed in 2004.
For the year ended December 31, 2008, cash used by financing activities was $4.1 million compared to cash provided of $7.4 million for the year ended December 31, 2007. During 2008, $6.8 million in cash was used to purchase a portion of our outstanding Subordinated Notes on the open market offset by cash received from the exercise of stock options. During 2007, $38.3 million of proceeds were received from the exercise of the underwriters’ over-allotment option in conjunction with the Company’s secondary stock offering completed in June, 2007 and $4.8 million in proceeds were received from the exercise of stock options. In May 2007, the Company received $1.3 million in contributions from its joint venture partners to fund a new joint venture based in China for manufacture of cryogenic trailers. Also in 2007, $40.0 million of cash was used for a voluntary principal prepayment under the term loan portion of our Senior Credit Facility.
Cash Requirements
The Company does not anticipate any unusual cash requirements for working capital needs for the year ending December 31, 2010.2011. Management anticipates the Company will be able to satisfy cash requirements for its ongoing business with cash generated by operations, existing cash balances and, if necessary, borrowings under our credit facilities. We expect capital expenditures for 20102011 to be in the range of $15.0$15 to $20.0$20 million primarily for continued automation, process improvements and/or expansions at existing manufacturing facilities, support of anticipated business growth in specific product lines and acquisition integration. In addition, we are anticipating an approximately $1.1 million contingency payment related to the earn-out on the acquisition of Cryotech.
In 2010,2011, the Company is forecasting to use approximately $17.7$17.0 million for scheduled interest payments under the Senior Credit Facility and Subordinated Notes. We are not required to make any scheduledquarterly principal payments in 2010of $1.6 million under the term loan portion of our Senior Credit Facility or Subordinated Notes, but we may consider making voluntary principal payments from time to time on our Senior Credit Facility. We may also from time to time seek to purchase a portion of our Subordinated Notes outstanding through cash purchases on the open market, privately negotiated transactions or otherwise. Such purchases, if any, will depend on prevailing market conditions, our liquidity requirements and our debt covenants. In addition, we are forecasting to use approximately $11.4$25.0 to $12.0$27.0 million of cash to pay U.S. and foreign income taxes and approximately $0.5$2.0 million of cash to fund our defined benefit pension plans under ERISA funding requirements.
43
Contractual Obligations
Our known contractual obligations as of December 31, 20092010 and cash requirements resulting from those obligations are as follows:
| Payments Due by Period | Payments Due by Period | ||||||||||||||||||||||||||||||||||
| Total | 2010 | 2011-2012 | 2013-2014 | 2015 and Thereafter | Total | 2011 | 2012-2013 | 2014-2015 | 2016 and Thereafter | ||||||||||||||||||||||||||
| (Dollars in thousands) | (Dollars in thousands) | ||||||||||||||||||||||||||||||||||
Long-term debt | $ | 243,175 | $ | — | $ | 80,000 | $ | — | $ | 163,175 | $ | 224,925 | $ | 6,500 | $ | 13,000 | $ | 205,425 | $ | — | |||||||||||||||
Interest on long-term debt(1) | 99,050 | 17,729 | 36,652 | 29,779 | 14,890 | ||||||||||||||||||||||||||||||
Interest on long-term debt(1) | 84,891 | 16,993 | 34,773 | 33,125 | — | ||||||||||||||||||||||||||||||
Deferred acquisition payments | 5,173 | 4,457 | 716 | — | — | 695 | 695 | — | — | — | |||||||||||||||||||||||||
Acquisition contingent consideration | 6,900 | 1,055 | 5,845 | — | — | ||||||||||||||||||||||||||||||
Operating leases | 25,775 | 6,591 | 9,370 | 6,916 | 2,898 | 23,917 | 6,671 | 8,744 | 4,809 | 3,693 | |||||||||||||||||||||||||
Pension obligations(2) | 8,236 | 536 | 3,200 | 3,000 | 1,500 | ||||||||||||||||||||||||||||||
Pension obligations(2) | 9,076 | 2,176 | 3,700 | 2,500 | 700 | ||||||||||||||||||||||||||||||
Total contractual cash obligations | $ | 381,409 | $ | 29,313 | $ | 129,938 | $ | 39,695 | $ | 182,463 | $ | 350,404 | $ | 34,090 | $ | 66,062 | $ | 245,859 | $ | 4,393 | |||||||||||||||
| (1) | The interest payments in the above table were estimated based upon our existing debt structure at December 31, |
| (2) | The planned funding of the pension obligations was based upon actuarial and management estimates taking into consideration the current status of the plans. |
Not included in the above table are unrecognized tax benefits of $1,470$2,468 at December 31, 2009.2010.
Our commercial commitments as of December 31, 2009,2010, which include standby letters of credit and bank guarantees, represent potential cash requirements resulting from contingent events that require performance by us or our subsidiaries pursuant to funding commitments, and are as follows:
| Total | 2010 | 2011-2012 | Total | 2011 | 2012-2014 | ||||||||||||||||
| (Dollars in thousands) | (Dollars in thousands) | ||||||||||||||||||||
Standby letters of credit | $ | 14,577 | $ | 14,577 | $ | — | $ | 9,632 | $ | 6,065 | $ | 3,567 | |||||||||
Bank guarantees | 15,974 | 15,616 | 358 | 16,390 | 12,237 | 4,153 | |||||||||||||||
Total commercial commitments | $ | 30,551 | $ | 30,193 | $ | 358 | $ | 26,022 | $ | 18,302 | $ | 7,720 | |||||||||
Off-Balance Sheet Arrangements
We do not have any off-balance sheet arrangements as defined in the Securities Act.
Contingencies
We are involved with environmental compliance, investigation, monitoring and remediation activities at certain of our operating facilities or formerly owned manufacturing facilities, and accrue for these activities when commitments or remediation plans have been developed and when costs are probable and can be reasonably estimated. Historical annual cash expenditures for these activities have been charged against the related environmental reserves. Future expenditures relating to these environmental remediation efforts are expected to be made over the next 1817 years as ongoing costs of remediation programs. Management believes that any additional liability in excess of amounts accrued, which may result from the resolution of such matters should not have a material adverse effect on our financial position, liquidity, cash flows or results of operations.
We are occasionally subject to various legal claims related to performance under contracts, product liability, taxes, employment matters, environmental matters, intellectual property and other matters, several of which claims assert substantial damages, in the ordinary course of our business. Based on our historical experience in
44
litigating these claims, as well as our current assessment of the underlying merits of the claims and applicable insurance, if any, we believe the resolution of these other legal claims will not have a material adverse effect on our financial position, liquidity, cash flows or results of operations. Future developments may, however, result in resolution of these legal claims in a way that could have a material adverse effect. See Item 1A. “Risk Factors.”
Foreign Operations
During 2009,2010, we had operations in Australia, China, the Czech Republic, GermanyAsia and the United Kingdom,Europe, which accounted for approximately 26.3%37.2% of consolidated sales and 23.3%28.6% of total assets at December 31, 2009.2010. Functional currencies used by these operations include the Australian dollar, the Chinese yuan, the Czech koruna, the euro, Japanese yen, and the British pound. We are exposed to foreign currency exchange risk as a result of transactions by these subsidiaries in currencies other than their functional currencies, and from transactions by our domestic operations in currencies other than the U.S. dollar. The majority of these functional currencies and the other currencies in which we record transactions are fairly stable. The use of these currencies, combined with the use of foreign currency forward purchase and sale contracts, has enabled us to be sheltered from significant gains or losses resulting from foreign currency transactions. This situation could change if these currencies experience significant fluctuations or the volume of forward contracts changes.
Application of Critical Accounting Policies
Our consolidated financial statements have been prepared in accordance with U.S. generally accepted accounting principles and are based on the selection and application of significant accounting policies, which require management to make estimates and assumptions about future events that affect the amounts reported in the financial statements and accompanying notes. Actual results could differ materially from those estimates. Management believes the following are some of the more critical judgmental areas in the application of its accounting policies that affect its financial position and results of operation.
Allowance for Doubtful Accounts. We evaluate the collectibility of accounts receivable based on a combination of factors. In circumstances where we are aware of a specific customer’s inability to meet its financial obligations (e.g., bankruptcy filings, substantial downgrading of credit scores), a specific reserve is recorded to reduce the receivable to the amount we believe will be collected. We also record allowances for doubtful accounts based on the length of time the receivables are past due and historical experience. If circumstances change (e.g., higher than expected defaults or an unexpected material adverse change in a customer’s ability to meet its financial obligations), our estimates of the collectibility of amounts due could be changed by a material amount.
Inventory Valuation Reserves. We determine inventory valuation reserves based on a combination of factors. In circumstances where we are aware of a specific problem in the valuation of a certain item, a specific reserve is recorded to reduce the item to its net realizable value. We also recognize reserves based on the actual usage in recent history and projected usage in the near-term. If circumstances change (e.g., lower than expected or higher than expected usage), estimates of the net realizable value could be changed by a material amount.
Long-Lived Assets. We monitor our long-lived assets for impairment indicators on an ongoing basis. If impairment indicators exist, we perform the required analysis and record impairment charges in accordance with the accounting guidance. In conducting our analysis, we compare the undiscounted cash flows expected to be generated from the long-lived assets to the related net book values. If the undiscounted cash flows exceed the net book value, the long-lived assets are not impaired. If the net book value exceeds the undiscounted cash flows, an impairment loss is measured and recognized. An impairment loss is measured as the difference between the net book value and the fair value of the long-lived assets. Fair value is estimated based upon either discounted cash flow analyses or estimated salvage values. Cash flows are estimated using internal forecasts as well as assumptions related to discount rates. Changes in economic or operating conditions impacting these estimates and assumptions could result in the impairment of long-lived assets.
45
Goodwill and Other Indefinite-Lived Intangible Assets. We evaluate goodwill and indefinite-lived intangible assets for impairment on an annual basis, and on an interim basis, if necessary. As of October 1, 2010, the estimated fair values substantially exceeded the carrying value for all reporting units. To test for impairment, we are required to estimate the fair market value of each of our reporting units. The reporting units are also the reportable segments: Energy & Chemicals, Distribution & Storage, and BioMedical. We use the income and market approaches to develop fair value estimates, which are weighted equally to arrive at a fair value estimate for each reporting unit. This approach has been consistently applied between years. With respect to the income approach, we developed a model to estimate the fair market value of each of our reporting units. This fair market value model incorporates our estimates of future cash flows, estimates of allocations of certain assets and cash flows among reporting units, estimates of future growth rates and management’s judgment regarding the applicable discount rates to use to discount those estimated cash flows. With respect to the market approach, we use the guideline company method selecting companies with similar assets or businesses to estimate fair value of each reporting unit. Changes to these judgments and estimates could result in a significantly different estimate of the fair market value of the reporting units, which could result in a different assessment of the recoverability of goodwill and other indefinite-lived intangible assets.
Pensions. We sponsor one defined benefit pension plan which has been frozen since February 2006. The funded status is measured as the difference between the fair value of the plan assets and the projected benefit obligation. The Company recognizes the change in the funded status of the plan in the year in which the change occurs through accumulated other comprehensive income. Our funding policy is to contribute at least the minimum funding amounts required by law. We have chosen policies according to accounting guidance that allow the use of a calculated value of plan assets (which is further described below), which generally reduces the volatility of pension (income) expense from changes in pension liability discount rates and the performance of the pension plans’ assets.
A significant element in determining our pension expense in accordance with accounting guidance is the expected return on plan assets. We have assumed that the expected long-term rate of return on plan assets as of December 31, 2010 and 2009 will be 7.75% compared to 7.25% at December 31, 2008.. These expected return assumptions were developed using a simple averaging formula based upon the plans’ investment guidelines, mix of asset classes and the historical returns of equities and bonds. We believe our assumptions for expected future returns are reasonable. However, we cannot guarantee that we will achieve these returns in the future. The assumed long-term rate of return on assets is applied to the market value of plan assets. This produces the expected return on plan assets that reduces pension expense. The difference between this expected return and the actual return on plan assets is deferred. The net deferral of past asset gains or losses affects the calculated value of plan assets and, ultimately, future pension income or expense.
At the end of each year, we determine the rate to be used to discount plan liabilities. The discount rate reflects the current rate at which the pension liabilities could be effectively settled at the end of the year. In estimating this rate, we look to rates of return on high quality, fixed-income investments that receive one of the two highest ratings given by a recognized rating agency and the expected timing of benefit payments under the plan. At December 31, 2009 and 2008,2010, we determined this rate to be 5.5% as compared to 6.0%. in 2009. Changes in discount rates over the past three years have not materially affected pension (income) expense, and the net effect of changes in the discount rate, as well as the net effect of other changes in actuarial assumptions and experience, have been deferred and amortized over the expected future service of participants.
At December 31, 2009,2010, our consolidated net pension liability recognized was $10.6$11.5 million, a decreasean increase of $4.6$0.9 million from December 31, 2008.2009. This decreaseincrease in liability was due to reduced gains in the value of the plan assets dueas a more conservative asset allocation was developed to performance ofavoid large losses in the overall market and employerfuture like those experienced in 2008. Employer contributions to the plan of $0.9$0.6 million which were partially offset by benefit payments of $1.4$1.6 million. For the years ended December 31, 2010, 2009 2008 and 2007,2008, we recognized approximately $0.4 million and $1.2 million of pension expense, $0.5 million and $0.7$0.5 million of pension income, respectively. See Note G to our financial statements included elsewhere in this report for further discussion.
45
Environmental Remediation Obligations. Our obligations for known environmental problems at our current and former manufacturing facilities have been recognized on an undiscounted basis on estimates of the cost of investigation and remediation at each site. Management along with our consultants reviews our environmental remediation sites quarterly to determine if additional cost adjustments or disclosures are required. The characteristics of environmental remediation obligations, where information concerning the nature and extent of clean-up activities is not immediately available and changes in regulatory requirements frequently occur, result in
46
a significant risk of increase to the obligations as they mature. Expected future expenditures are not discounted to present value and potential insurance recoveries are not recognized until realized.
Product Warranty Costs. We estimate product warranty costs and accrue for these costs as products are sold. The warranty reserve includes both a general reserve component, calculated based upon historical experience over the warranty period for each product and a specific reserve component for any specifically identified warranty issues. Due to the uncertainty and potential volatility of these warranty estimates, changes in assumptions could materially affect net income.
Revenue Recognition — Long-Term Contracts. We recognize revenue and gross profit as work on long-term contracts progresses using the percentage of completion method of accounting, which relies on estimates of total expected contract revenues and costs. We follow this method since reasonably dependable estimates of the revenue and costs applicable to various stages of a contract can be made. Since the financial reporting of these contracts depends on estimates, which are assessed continually during the term of the contract, recognized revenues and profit are subject to revisions as the contract progresses toward completion. Revisions in profit estimates are reflected in the period in which the facts that give rise to the revision become known. Accordingly, favorable changes in estimates result in additional profit recognition, and unfavorable changes will result in the reversal of previously recognized revenue and profits. When estimates indicate a loss is expected to be incurred under a contract, cost of sales is charged with a provision for such loss. As work progresses under a loss contract, revenue and cost of sales continue to be recognized in equal amounts, and the excess of costs over revenues is charged to the contract loss reserve. Change orders resulting in additional revenue and profit are recognized upon approval by the customer based on the percentage that incurred costs to date bear to total estimated costs at completion. Pre-contract costs relate primarily to salaries and benefits incurred to support the selling effort and, accordingly, are expensed as incurred. Certain contracts include incentive-fee arrangements clearly defined in the agreement and are not recognized until earned. We use the percentage of completion method of accounting primarily in the E&C segment.
Stock-based Employee Compensation. Stock compensation expense is calculated based on the estimated fair value of our stock options and performance stock units. The fair value of the stock options and certain of the performance stock units is calculated using the Black-Scholes pricing model and the fair value of the remaining performance stock units which vest based on market condition is calculated using the Monte Carlo Simulation model. The grant date fair value calculation requires the use of variables such as exercise term of the option, future volatility, dividend yield and risk-free interest rate. Compensation expense is recognized over the vesting period of the option or term of the stock award after consideration of the estimated forfeiture rates.
Recently Adopted Accounting Standards
Effective JanuaryJuly 1, 2009,2010, the Company adopted the new accounting guidance issued by the Financial Accounting Standards Board (“FASB”) regarding Business Combinations.disclosures about the credit quality of financing receivables This guidance requires an entity to provide disclosures about financing receivables on a disaggregated basis and provide additional disclosures related to credit quality indicators, aging, troubled debt restructurings, and significant purchases and sales of financing receivables during the acquiring entity in a business combination to recognizereporting period. Trade accounts receivable with maturities of less than one year are exempt from the full fair value of the assets acquired and liabilities assumed in the transaction at the acquisition date, the immediate recognition of acquisition-related transaction costs, the recognition of contingent consideration arrangements at their acquisition date fair value and determines what information to disclose to enable users of the financial statements to evaluate the nature and financial effects of the business combination.disclosure requirements. The adoption of this guidance impacteddid not have a material impact of the Company’s financial statements relating to the three acquisitions that the Company completed during 2009.position or results of operations.
Effective January 1, 2009,2010, the Company adopted the new accounting and disclosure guidance related to noncontrolling (formerly known as minority) interests in subsidiaries. The newimproving disclosures about fair value measurements. This guidance requires new disclosures about transfers in and out of Levels 1 and 2; an
46
entity should disclose separately the amounts of significant transfers in and out of Level 1 and Level 2 fair value measurements and describe the reasons for the transfers. The guidance also requires new disclosures about activity in Level 3 fair value measurements whereby an entity should present separately information about purchases, sales, issuances, and settlements on a gross basis rather that as one net number. The guidance clarifies existing disclosures related to the level of disaggregation used for each class of assets and liabilities measured at fair value and requires disclosures about the valuation techniques and inputs used to measure fair value for both recurring and nonrecurring fair value measurements that fall in either Level 2 or Level 3. With the exception of the Level 3 activity requirements which are effective for the fiscal year beginning after December 15, 2010, the adoption of this guidance did not have a noncontrolling interest in a subsidiary should be accounted for as a separate component of shareholders’ equitymaterial impact on the balance sheet. Additionally, it requires disclosureCompany’s financial position or results of consolidated net income attributable to the parent and to the noncontrolling interest on the face of the income statement. The Company reclassified $1,492 of noncontrolling interests from other long-term liabilities to shareholders’ equity on its balance sheet as of December 31, 2008.operations.
47
Recently Issued Accounting Standards
In December 2008,2010, the FASB issued an amendmentamendments related to its accounting guidance on Employers’ Disclosures about Pensionsthe disclosures of supplementary pro forma information for business combinations. These amendments specify that a public entity should disclose revenue and Other Postretirement Benefit Plan Assets”. This guidance requires additionalearnings of the combined entity as though the business combination(s) that occurred during the current year had occurred as of the beginning of the comparable prior annual reporting period only. The amendments also expand the supplemental pro forma disclosures about plan assets, including employers’ investment strategies, major categoriesto include a description of assets, concentrationsthe nature and amount of risk within plan assets,material, nonrecurring pro forma adjustments directly attributable to the business combination included in the reported pro forma revenue and valuation techniques used to measure the fair value of plan assets. The new disclosure requirementsearnings. These amendments are effective for acquisitions that occur on or after the beginning of the fiscal years endingyear beginning on or after December 15, 2009. Early application2010. These amendments will not impact the Company’s financial position and results of operations for any business combinations entered into after the date of adoption.
In October 2009, the FASB issued ASU 2009-13, “Revenue Recognition (Topic 605) — Multiple-Deliverable Revenue Arrangements”. This ASU eliminates the requirement that all undelivered elements must have objective and reliable evidence of fair value before a company can recognize the portion of the requirementsconsideration that is attributable to items that already have been delivered. This may allow some companies to recognize revenue on transactions that involve multiple deliverables earlier than under the current requirements. Additionally, under the new guidance, the relative selling price method is required to be used in allocating consideration between deliverables and the residual value method will no longer be permitted. This ASU is effective prospectively for revenue arrangements entered into or materially modified beginning in fiscal 2011 although early adoption is permitted. A company may elect, but will not be required, to adopt the amendments in this ASU retrospectively for all prior periods. The Company has evaluated the ASU and does not believe it will have a material impact on the consolidated financial statements.
Forward-Looking Statements
This Annual Report on Form 10-K includes “forward-looking statements.” These forward-looking statements include statements relating to our business. In some cases, forward-looking statements may be identified by terminology such as “may,” “should,” “expects,” “anticipates,” “believes,” “projects,” “forecasts,” “continue” or the negative of such terms or comparable terminology. Forward-looking statements contained herein (including future cash contractual obligations, liquidity, cash flow, orders, results of operations, and trends, among other matters) or in other statements made by us are made based on management’s expectations and beliefs concerning future events impacting us and are subject to uncertainties and factors relating to our operations and business environment, all of which are difficult to predict and many of which are beyond our control, that could cause our actual results to differ materially from those matters expressed or implied by forward-looking statements. We believe that the following factors, among others (including those described in Item 1A. “Risk Factors”), could affect our future performance and the liquidity and value of our securities and cause our actual results to differ materially from those expressed or implied by forward-looking statements made by us or on our behalf:
the cyclicality of the markets which we serve and the vulnerability of those markets to economic downturns;
the impact of the recent global economic and financial crisis;
the loss of, or a significant reduction or delay in purchases by our largest customers;
47
the fluctuations in the price of oil and natural gas;energy prices;
governmental energy policies could change, or expected changes could fail to materialize;
competition in our markets;
the impact of global economic and financial conditions;
our ability to manage our fixed-price contract exposure;
our reliance on the availability of key suppliers and services;
degradation of our backlog as a result of modification or termination of orders;
financial distress of third parties;
changes in government health care reform or changes in health care payorregulations and reimbursement levels and practices;policies;
general economic, political, business and market risks associated with our global operations;
fluctuations in foreign currency exchange and interest rates;
our ability to successfully acquire or integrate companies that provide complementary products or technologies;
financial distress of third parties;
our ability to control our costs while maintaining customer relationships and core business resources;
our ability to successfully manage our planned operational expansions;
our ability to successfully acquire or integrate companies that provide complementary products or technologies;
difficulties in implementing a new ERP system;
the loss of key employees;
the pricing and availability of raw materials;
our ability to manage our fixed-price contract exposure;
48
litigation and disputes involving us, including the extent of product liability, warranty, pension, employment and environmental claims asserted against us;
FDAUnited States Food and Drug Administration regulation of our products;
the impairment of our goodwill and other indefinite-lived intangible assets;
the costs of compliance with environmental, health and safety laws and responding to potential liabilities under these laws;
labor costs and disputes and the deterioration of our relations with our employees;
additional liabilities related to taxes;
the underfunded status of our pension plan;
our ability to continue our technical innovation in our product lines;
our ability to protect our intellectual property and know-how;
claims that our products or processes infringe intellectual property rights of others;
disruptions in our operations due to hurricanes or other severe weather;
potential violations of the Foreign Corrupt Practices Act;
increased government regulation;
regulations governing the export of our products;products and other regulations applicable to us as a supplier of products to the U.S. government;
risks associated with our indebtedness, leverage, debt service and liquidity, including our ability to refinance our existing credit arrangements;liquidity;
fluctuations in the price of our stock; and
other factors described in this Annual Report.
48
There may be other factors that may cause our actual results to differ materially from the forward-looking statements.
All forward-looking statements attributable to us or persons acting on our behalf apply only as of the date of this Annual Report and are expressly qualified in their entirety by the cautionary statements included in this Annual Report. We undertake no obligation to update or revise forward-looking statements which may be made to reflect events or circumstances that arise after the date made or to reflect the occurrence of unanticipated events.
| Item 7A. | Quantitative and Qualitative Disclosures About Market Risk |
In the normal course of business, our operations are exposed to continuing fluctuations in foreign currency values and interest rates that can affect the cost of operating and financing. Accordingly, we address a portion of these risks through a program of risk management.
Our primary interest rate risk exposure results from the current Senior Credit Facility’s various floating rate pricing mechanisms. If interest rates were to increase 200 basis points (2%) from December 31, 20092010 rates, and assuming no changes in debt from the December 31, 20092010 levels, our additional annual expense would be approximately $1.6$1.2 million on a pre-tax basis.
The Company has assets, liabilities and cash flows in foreign currencies creating exposure to foreign currency exchange fluctuations in the normal course of business. Chart’s primary exchange rate exposure is with the euro, the Japanese yen, the British pound, the Czech koruna and the Chinese yuan. Monthly measurement, evaluation and forward exchange rate contracts are employed as methods to reduce this risk. The Company enters into foreign exchange forward contracts to hedge anticipated and firmly committed foreign currency transactions. Chart does not use derivative
49
financial instruments for speculative or trading purposes. The terms of the contracts are generally one year or less. At December 31, 2009,2010, the Company had foreign exchange contracts with notional values of 3,30016.9 million euros, 386.9 million Japanese yen, 5.0 million U.S. dollars, 500,000 Australian dollars and 270 Polish zloty.75,000 British pounds. At December 31, 2009,2010, a hypothetical 10% weakening of the U.S. dollar would not materially affect the Company’s financial statements.
Covenant Compliance
We believe that our Senior Credit Facility and the indenture governing our outstanding Subordinated Notes are material agreements, that the covenants are material terms of these agreements and that information about the covenants is material to an investor’s understanding of our financial condition and liquidity. The breach of covenants in the Senior Credit Facility that are tied to ratios based on Adjusted EBITDA, as defined below, could result in a default under the Senior Credit Facility and the lenders could elect to declare all amounts borrowed due and payable. Any such acceleration would also result in a default under our indenture. Additionally, under the Senior Credit Facility and indenture, our ability to engage in activities such as incurring additional indebtedness, making investments and paying dividends is also tied to ratios based on Adjusted EBITDA.
Covenant levels and pro forma ratios for the four quarters ended December 31, 20092010 are as follows:
| Covenant Level | Four Quarters Ended December 31, Ratio | |||||||
Senior Credit Facility(1) | ||||||||
Minimum Adjusted EBITDA* to cash interest ratio | 3.00x | 5.59x | ||||||
Maximum funded indebtedness to Adjusted EBITDA* ratio | 3.25x | 0.90x | ||||||
Indenture(2) | ||||||||
Minimum pro forma Adjusted EBITDA* to pro forma fixed charge coverage ratio required to incur additional debt pursuant to ratio provisions(3) | 2.0x | 5.4x | ||||||
49
| (1) | Failure to satisfy these ratio requirements would constitute a default under the Senior Credit Facility. If lenders under the Senior Credit Facility failed to waive any such default, repayment obligations under the Senior Credit Facility could be accelerated, which would also constitute a default under the indenture. |
| (2) | Our ability to incur additional debt and make certain restricted payments under our indenture, subject to specified exceptions, is tied to an Adjusted EBITDA to fixed charge ratio of at least 2.0 to 1.0. |
| (3) | The ratio is calculated giving pro forma effect to our acquisitions of |
| * | Adjusted EBITDA as used herein is defined as net income before interest expense, provision for income taxes, depreciation and amortization and further adjusted to exclude non-recurring items, non-cash items and other adjustments permitted in calculating covenants contained in the related Senior Credit Facility and indenture governing the Subordinated Notes. |
| Item 8. | Financial Statements and Supplementary Data. |
Our Financial Statements and the accompanying Notes that are filed as part of this Annual Report are listed under Item 15. “Exhibits and Financial Statement Schedules” and are set forth beginning on page F-1 immediately following the signature page of this Form 10-K and are incorporated into this Item 8 by reference.
| Item 9. | Changes in and Disagreements With Accountants on Accounting and Financial Disclosure. |
None.
50
| Item 9A. | Controls and Procedures. |
Evaluation of Disclosure Controls and Procedures.
As of December 31, 2009,2010, an evaluation was performed, under the supervision and with the participation of the Company’s management including the Company’s Chief Executive Officer and Chief Financial Officer, of the effectiveness of the design and operation of the Company’s disclosure controls and procedures pursuant to Rule 13a-15 under the Securities and Exchange Act of 1934, as amended (the “Exchange Act”). Based upon that evaluation, such officers concluded that the Company’s disclosure controls and procedures are effective to ensure that information required to be disclosed by the Company in the reports it files or submits under the Exchange Act (1) is recorded, processed, summarized and reported, within the time periods specified in the Securities and Exchange Commission’s rules and forms and (2) is accumulated and communicated to the Company’s management including the Chief Executive Officer and Chief Financial Officer, as appropriate to allow for timely decisions regarding required disclosure.
The Company is undertaking a phased implementation and upgrade of its existing J D Edwards global Enterprise Resource Planning software system and one site wentfive sites have now gone “live” as of December 31, 2010 with the remaining sites planning to go “live” during 2011. The phased implementation has not at this point altered the fourth quarter of 2009.Company’s internal controls. The Company believes it is maintaining and monitoring appropriate internal controls during the implementation period and that its internal controls will be enhanced as a result of the implementation of the new system.
Management’s Report on Internal Control Over Financial Reporting.
Management’s Report on Internal Control Over Financial Reporting is set forth on page F-2 of this Annual Report on Form 10-K and incorporated herein by reference.
The effectiveness of the Company’s internal control over financial reporting as of December 31, 20092010 has been audited by Ernst & Young LLP, an independent registered public accounting firm, as stated in its report which is set forth in Item 8. “Financial Statements and Supplementary Data,” on page F-4 under the caption “Report of Independent Registered Public Accounting Firm” and incorporated herein by reference.
50
Changes in Internal Control over Financial Reporting
There were no changes in the Company’s internal control over financial reporting that occurred during the Company’s most recent fiscal quarter that have materially affected, or are reasonably likely to materially affect, the Company’s internal control over financial reporting.
| Item 9B. | Other Information. |
On February 22, 2010, the Compensation Committee of the Board of Directors (the “Committee”) of the Company, approved a form of Restricted Stock Agreement (“RSA”) relating to shares of restricted stock to be granted from time to time by the Company to its key employees under the Chart Industries, Inc. 2009 Omnibus Equity Plan (the “Omnibus Equity Plan”). In connection with the approval of the RSA, on February 22, 2010 the Committee approved the following grants of restricted stock to the Company’s named executive officers:Not Applicable.
| ||
| ||
| ||
| ||
| ||
|
51
The shares of restricted stock granted under the RSA are subject to transfer restrictions and other restrictions specified in the RSA and the Omnibus Equity Plan. Generally, the shares of restricted stock granted under the RSA vest ratably over three years based on service and may not be transferred by the holder. The Omnibus Equity Plan is administered by the Committee, which has the power and discretion to interpret, administer, implement and construe the Omnibus Equity Plan and the RSA.
The disclosure contained herein is qualified in its entirety by reference to the full text of the Omnibus Equity Plan and the form of the RSA, which is incorporated herein by reference. A copy of the Omnibus Equity Plan was attached as Appendix A to the Company’s definitive proxy statement (File No. 001-11442), as filed with the Securities and Exchange Commission on April 7, 2009. A copy of the form of the RSA is attached hereto as Exhibit 10.4.2.
On February 23, 2010, the Committee, in connection with its annual evaluation of executive compensation and after considering the recommendations of independent compensation consultants engaged by the Committee, determined to increase our Chief Executive Officer’s annual base salary rate from $550,000 to $600,000, effective as of January 1, 2010. The Committee made this determination in order to ensure the competitiveness of the Chief Executive Officer’s base salary relative to peer group companies.
The Committee also authorized an amendment (“Amendment No. 2”) to the Chief Executive Officer’s employment agreement (the “Employment Agreement”), dated February 26, 2008, as amended on January 1, 2009 (“Amendment No. 1”). Under the Employment Agreement, our Chief Executive Officer is eligible to earn an annual incentive bonus with a target amount, earned at 100% performance levels, based upon a percentage of the Chief Executive Officer’s annual base salary (the “Base Target”), subject to the terms of our 2009 Incentive Compensation Plan. Any annual incentive bonus payment is determined solely based on performance against performance targets set in accordance with our 2009 Incentive Compensation Plan. Amendment No. 2 adjusts the Chief Executive Officer’s Base Target from one hundred ten percent (110%) of annual base salary to one hundred fifty percent (150%) of annual base salary. As such, our Chief Executive Officer could earn a cash incentive bonus of $900,000 for 2010 if target performance levels are achieved for 2010 and the other terms of the 2009 Incentive Compensation Plan are met. Less or more than that amount could be earned based on actual performance. All other material terms of the Employment Agreement that were in effect prior to Amendment No. 2 remain in effect under the amended agreement.
The increases in the Chief Executive Officer’s annual salary and the Base Target correspondingly increase certain other potential payments that could be due under the Employment Agreement upon termination of the Chief Executive Officer’s employment by us without cause or by the Chief Executive Officer upon resignation for good reason, including after a change in control of the Company, as these potential payments are based on multiples of annual salary and the Base Target. The Employment Agreement and Amendment No. 1 are incorporated herein by reference to Exhibit 10.1 to the Company’s Quarterly Report on Form 10-Q for the quarter ended March 31, 2008 and to Exhibit 10.9.1 to the Company’s Annual Report on Form 10-K for the year ended December 31, 2008, respectively.
52
PART III
| Item 10. | Directors, |
Information required by this item as to the Directors of the Company appearing under the caption “Election of Directors” in the Company’s 20102011 Proxy Statement is incorporated herein by reference. Information required by this item as to the Executive Officers of the Company is included as Item 4A of this Annual Report on Form 10-K as permitted by Instruction 3 to Item 401(b) of Regulation S-K. Information required by Item 405 is set forth in the 20102011 Proxy Statement under the heading “Section 16(a) Beneficial Ownership Reporting Compliance” which information is incorporated herein by reference. Information required by Items 406 and 407(c)(3), (d)(4) and (d)(5) of Regulation S-K is set forth in the 20102011 Proxy Statement under the headings “Information Regarding Meetings and Committees of the Board of Directors”, “Code of Ethical Business Conduct and Officer Code of Ethics” and “Stockholder Communications with the Board”, which information is incorporated herein by reference.
The Charters of the Audit Committee, Compensation Committee and Nominations and Corporate Governance Committee and the Corporate Governance Guidelines, Officer Code of Ethics and Code of Ethical Business Conduct are available on the Company’s website at www.chart-ind.com and in print to any stockholder who requests a copy. Requests for copies should be directed to Secretary, Chart Industries, Inc., One Infinity Corporate Centre Drive, Suite 300, Garfield Heights, Ohio 44125. The Company intends to disclose any amendments to the Code of Ethical Business Conduct or Officer Code of Ethics, and any waiver of the Code of Ethical Business Conduct or Officer Code of Ethics granted to any Director or Executive Officer of the Company, on the Company’s website.
| Item 11. | Executive Compensation. |
The information required by Item 402 of Regulation S-K is set forth in the 20102011 Proxy Statement under the heading “Executive and Director Compensation,” which information is incorporated herein by reference. The information required by Items 407(e)(4) and 407(e)(5) of Regulation S-K is set forth in the 20102011 Proxy Statement under the headings “Compensation Committee Interlocks and Insider Participation” and “Compensation Committee Report,” respectively, which information is incorporated herein by reference.
| Item 12. | Security Ownership of Certain Beneficial Owners and Management and Related Stockholder Matters. |
The information required by this item is set forth in the 20102011 Proxy Statement under the headings “Security Ownership of Certain Beneficial Owners” and “Equity Compensation Plan Information,” which information is incorporated herein by reference.
| Item 13. | Certain Relationships and Related Transactions, and Director Independence. |
The information required by this item is set forth in the 20102011 Proxy Statement under the headings “Related Party Transactions” and “Director Independence,” which information is incorporated herein by reference.
| Item 14. | Principal |
The information required by this item is set forth in the 20102011 Proxy Statement under the heading “Principal AccountantAccounting Fees and Services,” which information is incorporated herein by reference.
53
PART IV
| Item 15. | Exhibits and Financial Statement Schedules. |
(a) The following documents are filed as part of this 20092010 Annual Report on Form 10-K:
1. Financial Statements. The following consolidated financial statements of the Company and its subsidiaries and the reports of the Company’s independent registered public accounting firm are incorporated by reference in Item 8:
Management’s Report on Internal Control over Financial Reporting
Reports of Independent Registered Public Accounting Firm
Consolidated Balance Sheets at December 31, 20092010 and 20082009
Consolidated Statements of Operations for the years ended December 31, 2010, 2009 2008 and 20072008
Consolidated Statements of Shareholders’ Equity for the years ended December 31, 2010, 2009 2008 and 20072008
Consolidated Statements of Cash Flows for the years ended December 31, 2010, 2009 2008 and 20072008
Notes to Consolidated Financial Statements
2. Financial Statement Schedules. The following additional information should be read in conjunction with the consolidated financial statements are set forth under Item 8 of this Annual Report on Form 10-K. Financialstatements:
Schedule II Valuation and Qualifying Accounts for the years ended December 31, 2010, 2009 and 2008
All other financial statement schedules have been omitted since they are either not required, not applicable, or the information is otherwise included.
3. Exhibits. See the Index to Exhibits at page E-1 of this Annual Report on Form 10-K.
54
SIGNATURES
Pursuant to the requirements of Section 13 or 15(d) of the Securities Exchange Act of 1934, the Registrant has duly caused this report to be signed on its behalf by the undersigned, thereunto duly authorized.
| CHART INDUSTRIES, INC. | ||
| By: | /S/ SAMUEL F. THOMAS | |
Samuel F. Thomas | ||
Chairman, Chief Executive Officer and President | ||
Date: February 25, 201028, 2011
Pursuant to the requirements of the Securities Exchange Act of 1934, this report has been signed below by the following persons on behalf of the Registrant and in the capacities and on the dates indicated.
Signature and Title | |||
/S/ SAMUEL F. THOMAS Samuel F. Thomas | Chairman, Chief Executive Officer, | ||
President and a Director | |||
/S/ MICHAEL F. BIEHL Michael F. Biehl | Executive Vice President, | ||
/S/ KENNETH J. WEBSTER Kenneth J. Webster | Vice President, Chief Accounting Officer and Controller | ||
/S/ W. DOUGLAS BROWN W. Douglas Brown | Director | ||
/S/ RICHARD E. GOODRICH Richard E. Goodrich | Director | ||
/S/ STEVEN W. KRABLIN Steven W. Krablin | Director | ||
/S/ MICHAEL W. PRESS Michael W. Press | Director | ||
/S/ JAMES M. TIDWELL James M. Tidwell | Director | ||
/S/ THOMAS L. WILLIAMS Thomas L. Williams | Director | ||
Date: February 25, 201028, 2011
55
F-1
MANAGEMENT’S REPORT ON INTERNAL CONTROL OVER
FINANCIAL REPORTING
Management of Chart Industries, Inc. and its subsidiaries (the “Company”) are responsible for establishing and maintaining adequate internal control over financial reporting. The Company’s internal control over financial reporting is a process designed under the supervision of the Company’s principal executive and financial officers to provide reasonable assurance regarding the reliability of financial reporting and the preparation of the Company’s financial statements for external reporting purposes in accordance with U.S. generally accepted accounting principles.
The Company’s internal control over financial reporting includes policies and procedures that:
Pertain to the maintenance of records that, in reasonable detail, accurately and fairly reflect transactions and dispositions of assets of the Company;
Provide reasonable assurance that transactions are recorded as necessary to permit preparation of financial statements in accordance with U.S. generally accepted accounting principles, and that receipts and expenditures of the Company are being made only in accordance with authorizations of management and the directors of the Company; and
Provide reasonable assurance regarding prevention or timely detection of unauthorized acquisition, use or disposition of the Company’s assets that could have a material effect on the Company’s financial statements.
Because of its inherent limitations, internal control over financial reporting may not prevent or detect misstatements. Also, projections of any evaluation of effectiveness to future periods are subject to the risk that controls may become inadequate because of changes in conditions, or that the degree of compliance with the policies and procedures may deteriorate.
Management has assessed the effectiveness of its internal control over financial reporting as of December 31, 20092010 based on the framework established in Internal Control — Integrated Framework issued by the Committee of Sponsoring Organizations of the Treadway Commission (COSO). Based on this assessment, management has determined that the Company’s internal control over financial reporting is effective as of December 31, 2009.2010.
The effectiveness of the Company’s internal control over financial reporting as of December 31, 20092010 has been audited by Ernst & Young LLP, an independent registered public accounting firm, as stated in their report appearing below, which expresses an unqualified opinion on the effectiveness of the Company’s internal control over financial reporting as of December 31, 2009.2010.
| /S/ SAMUEL F. THOMAS | /S/ MICHAEL F. BIEHL | |||
| Samuel F. Thomas | Michael F. Biehl | |||
| Chairman, Chief Executive Officer and President | Executive Vice President, |
F-2
REPORT OF INDEPENDENT REGISTERED PUBLIC ACCOUNTING FIRM
To the Board of Directors and Shareholders of
Chart Industries, Inc.
We have audited the accompanying consolidated balance sheets of Chart Industries, Inc. and subsidiaries as of December 31, 20092010 and 2008,2009, and the related consolidated statements of operations, shareholders’ equity, and cash flows for each of the three years in the period ended December 31, 2009.2010. Our audits also included the financial statement schedule listed in the index at Item 15(a) 2. These financial statements and schedule are the responsibility of the Company’s management. Our responsibility is to express an opinion on these financial statements and schedule based on our audits.
We conducted our audits in accordance with the standards of the Public Company Accounting Oversight Board (United States). Those standards require that we plan and perform the audit to obtain reasonable assurance about whether the financial statements are free of material misstatement. An audit includes examining, on a test basis, evidence supporting the amounts and disclosures in the financial statements. An audit also includes assessing the accounting principles used and significant estimates made by management, as well as evaluating the overall financial statement presentation. We believe that our audits provide a reasonable basis for our opinion.
In our opinion, the financial statements referred to above present fairly, in all material respects, the consolidated financial position of Chart Industries, Inc. and subsidiaries at December 31, 20092010 and 2008,2009, and the consolidated results of their operations and their cash flows for each of the three years in the period ended December 31, 2009,2010, in conformity with U.S. generally accepted accounting principles.
As discussed Also, in Note Aour opinion, the related financial statement schedule, when considered in relation to the consolidatedbasic financial statements taken as a whole, presents fairly in 2009all material respects the Company changed its method of accounting for business combinations and noncontrolling interests.information set forth therein.
We also have audited, in accordance with the standards of the Public Company Accounting Oversight Board (United States), Chart Industries, Inc. and subsidiaries’ internal control over financial reporting as of December 31, 2009,2010, based on criteria established in Internal Control-Integrated Framework issued by the Committee of Sponsoring Organizations of the Treadway Commission and our report dated February 25, 201028, 2011 expressed an unqualified opinion thereon.
/S/ ERNST & YOUNG LLP
Cleveland, Ohio
February 25, 201028, 2011
F-3
REPORT OF INDEPENDENT REGISTERED PUBLIC ACCOUNTING FIRM
To the Board of Directors and Shareholders of
Chart Industries, Inc.
We have audited Chart Industries, Inc. and subsidiaries’ internal control over financial reporting as of December 31, 20092010 based on criteria established in Internal Control — Integrated Framework issued by the Committee of Sponsoring Organizations of the Treadway Commission (the COSO criteria). Chart Industries, Inc. and subsidiaries’ management is responsible for maintaining effective internal control over financial reporting, and for its assessment of the effectiveness of internal control over financial reporting included in the accompanying Management’s Report ofon Internal Control over Financial Reporting. Our responsibility is to express an opinion on the company’s internal control over financial reporting based on our audit.
We conducted our audit in accordance with the standards of the Public Company Accounting Oversight Board (United States). Those standards require that we plan and perform the audit to obtain reasonable assurance about whether effective internal control over financial reporting was maintained in all material respects. Our audit included obtaining an understanding of internal control over financial reporting, assessing the risk that a material weakness exists, testing and evaluating the design and operating effectiveness of internal control based on the assessed risk, and performing such other procedures as we considered necessary in the circumstances. We believe that our audit provides a reasonable basis for our opinion.
A company’s internal control over financial reporting is a process designed to provide reasonable assurance regarding the reliability of financial reporting and the preparation of financial statements for external purposes in accordance with generally accepted accounting principles. A company’s internal control over financial reporting includes those policies and procedures that (1) pertain to the maintenance of records that, in reasonable detail, accurately and fairly reflect the transactions and dispositions of the assets of the company; (2) provide reasonable assurance that transactions are recorded as necessary to permit preparation of financial statements in accordance with generally accepted accounting principles, and that receipts and expenditures of the company are being made only in accordance with authorizations of management and directors of the company; and (3) provide reasonable assurance regarding prevention or timely detection of unauthorized acquisition, use, or disposition of the company’s assets that could have a material effect on the financial statements.
Because of its inherent limitations, internal control over financial reporting may not prevent or detect misstatements. Also, projections of any evaluation of effectiveness to future periods are subject to the risk that controls may become inadequate because of changes in conditions, or that the degree of compliance with the policies or procedures may deteriorate.
In our opinion, Chart Industries, Inc. and subsidiaries maintained, in all material respects, effective internal control over financial reporting as of December 31, 2009,2010, based on the COSO criteria.
We also have audited, in accordance with the standards of the Public Company Accounting Oversight Board (United States), the consolidated balance sheets of Chart Industries, Inc. and subsidiaries as of December 31, 20092010 and 2008,2009, and the related consolidated statements of operations, shareholders’ equity, and cash flows for each of the three years in the period ended December 31, 2009 of Chart Industries, Inc. and subsidiaries,2010 and our report dated February 25, 201028, 2011 expressed an unqualified opinion thereon.
/S/ ERNST & YOUNG LLP
Cleveland, Ohio
February 25, 201028, 2011
F-4
CHART INDUSTRIES, INC. AND SUBSIDIARIES
CONSOLIDATED BALANCE SHEETS
| December 31, | December 31, | |||||||||||||
| 2009 | 2008 | 2010 | 2009 | |||||||||||
| (Dollars in thousands, except per share amounts) | (Dollars in thousands, except per share amounts) | |||||||||||||
| ASSETS | ||||||||||||||
Current Assets | ||||||||||||||
Cash and cash equivalents | $ | 211,168 | $ | 122,165 | $ | 165,112 | $ | 211,168 | ||||||
Short term investments | — | 32,264 | ||||||||||||
Accounts receivable, net | 77,509 | 91,698 | 88,131 | 77,509 | ||||||||||
Inventories, net | 85,570 | 95,390 | 104,435 | 85,570 | ||||||||||
Unbilled contract revenue | 18,252 | 38,505 | 22,070 | 18,252 | ||||||||||
Prepaid expenses | 5,484 | 7,292 | 5,121 | 5,484 | ||||||||||
Other current assets | 16,421 | 21,636 | 21,227 | 16,421 | ||||||||||
Total Current Assets | 414,404 | 408,950 | 406,096 | 414,404 | ||||||||||
Property, plant and equipment, net | 111,153 | 98,447 | 116,158 | 111,153 | ||||||||||
Goodwill | 264,532 | 261,509 | 275,252 | 264,532 | ||||||||||
Identifiable intangible assets, net | 123,773 | 129,542 | 144,286 | 123,773 | ||||||||||
Other assets, net | 12,641 | 10,979 | 13,047 | 12,641 | ||||||||||
TOTAL ASSETS | $ | 926,503 | $ | 909,427 | $ | 954,839 | $ | 926,503 | ||||||
| LIABILITIES AND SHAREHOLDERS’ EQUITY | ||||||||||||||
Current Liabilities | ||||||||||||||
Accounts payable | $ | 38,089 | $ | 45,392 | $ | 54,749 | $ | 38,089 | ||||||
Customer advances and billings in excess of contract revenue | 51,782 | 96,433 | 51,661 | 51,782 | ||||||||||
Accrued salaries, wages and benefits | 22,309 | 27,084 | 20,359 | 22,309 | ||||||||||
Warranty reserve | 8,764 | 8,636 | 12,101 | 8,764 | ||||||||||
Current portion of long-term debt | 6,500 | — | ||||||||||||
Other current liabilities | 22,993 | 16,616 | 25,813 | 22,993 | ||||||||||
Total Current Liabilities | 143,937 | 194,161 | 171,183 | 143,937 | ||||||||||
Long-term debt | 243,175 | 243,175 | 218,425 | 243,175 | ||||||||||
Long-term deferred tax liability, net | 42,757 | 41,344 | 39,140 | 42,757 | ||||||||||
Accrued pension liabilities | 10,646 | 15,205 | 11,483 | 10,646 | ||||||||||
Other long-term liabilities | 8,742 | 10,090 | 13,234 | 8,742 | ||||||||||
Shareholders’ Equity | ||||||||||||||
Common stock, par value $.01 per share — 150,000,000 shares authorized, as of December 31, 2009 and 2008, respectively, 28,481,586 and 28,397,821 shares issued and outstanding at December 31, 2009 and 2008, respectively | 285 | 284 | ||||||||||||
Common stock, par value $.01 per share — 150,000,000 shares authorized, as of December 31, 2010 and 2009, respectively, 28,831,724 and 28,481,586 shares issued and outstanding at December 31, 2010 and 2009, respectively | 288 | 285 | ||||||||||||
Additional paid-in capital | 251,692 | 247,638 | 258,425 | 251,692 | ||||||||||
Retained earnings | 210,480 | 149,469 | 230,640 | 210,480 | ||||||||||
Accumulated other comprehensive income | 13,104 | 6,569 | 9,811 | 13,104 | ||||||||||
Total Chart Industries, Inc. shareholders’ equity | 475,561 | 403,960 | 499,164 | 475,561 | ||||||||||
Noncontrolling interest | 1,685 | 1,492 | 2,210 | 1,685 | ||||||||||
Total equity | 477,246 | 405,452 | 501,374 | 477,246 | ||||||||||
TOTAL LIABILITIES AND SHAREHOLDERS’ EQUITY | $ | 926,503 | $ | 909,427 | $ | 954,839 | $ | 926,503 | ||||||
The accompanying notes are an integral part of these consolidated financial statements.
F-5
CHART INDUSTRIES, INC. AND SUBSIDIARIES
CONSOLIDATED STATEMENTS OF OPERATIONS
| Year Ended December 31, | Year Ended December 31, | |||||||||||||||||||||||
| 2009 | 2008 | 2007 | 2010 | 2009 | 2008 | |||||||||||||||||||
(Dollars and shares in thousands, share amounts) | (Dollars and shares in thousands, share amounts) | |||||||||||||||||||||||
Sales | $ | 591,516 | $ | 744,363 | $ | 666,395 | $ | 555,455 | $ | 597,458 | $ | 753,086 | ||||||||||||
Cost of sales | 389,635 | 504,975 | 476,854 | 390,156 | 395,577 | 513,698 | ||||||||||||||||||
Gross profit | 201,881 | 239,388 | 189,541 | 165,299 | 201,881 | 239,388 | ||||||||||||||||||
Selling, general and administrative expenses | 95,601 | 100,847 | 92,650 | 104,973 | 95,601 | 100,847 | ||||||||||||||||||
Amortization expense | 10,716 | 10,963 | 10,951 | 11,049 | 10,716 | 10,963 | ||||||||||||||||||
Asset impairment | 1,230 | — | 304 | 1,773 | 1,230 | — | ||||||||||||||||||
Reversal of contingent liabilities related to insolvent subsidiary | — | (6,514 | ) | — | — | — | (6,514 | ) | ||||||||||||||||
Loss on sale or disposal of assets | — | 739 | 455 | — | — | 739 | ||||||||||||||||||
| 107,547 | 106,035 | 104,360 | 117,795 | 107,547 | 106,035 | |||||||||||||||||||
Operating income | 94,334 | 133,353 | 85,181 | 47,504 | 94,334 | 133,353 | ||||||||||||||||||
Other expense (income): | ||||||||||||||||||||||||
Interest expense, net | 15,817 | 17,953 | 22,174 | 16,196 | 15,817 | 17,953 | ||||||||||||||||||
Amortization of deferred financing costs | 1,616 | 1,857 | 1,646 | 3,063 | 1,616 | 1,857 | ||||||||||||||||||
Foreign currency (gain) loss | (687 | ) | 3,948 | 42 | ||||||||||||||||||||
Foreign currency loss (gain) | 871 | (687 | ) | 3,948 | ||||||||||||||||||||
Gain on acquisition of business | (6,954 | ) | — | — | (1,124 | ) | (6,954 | ) | — | |||||||||||||||
| 9,792 | 23,758 | 23,862 | 19,006 | 9,792 | 23,758 | |||||||||||||||||||
Income before income taxes | 84,542 | 109,595 | 61,319 | 28,498 | 84,542 | 109,595 | ||||||||||||||||||
Income tax expense (benefit): | ||||||||||||||||||||||||
Current | 25,137 | 35,975 | 24,349 | 17,338 | 25,137 | 35,975 | ||||||||||||||||||
Deferred | (1,751 | ) | (5,486 | ) | (7,030 | ) | (9,345 | ) | (1,751 | ) | (5,486 | ) | ||||||||||||
| 23,386 | 30,489 | 17,319 | 7,993 | 23,386 | 30,489 | |||||||||||||||||||
Net income | 61,156 | 79,106 | 44,000 | 20,505 | 61,156 | 79,106 | ||||||||||||||||||
Noncontrolling interest, net of taxes | 145 | 182 | (156 | ) | 345 | 145 | 182 | |||||||||||||||||
Net income attributable to Chart Industries, Inc. | $ | 61,011 | $ | 78,924 | $ | 44,156 | $ | 20,160 | $ | 61,011 | $ | 78,924 | ||||||||||||
Net income attributable to Chart Industries, Inc. per common share — basic | $ | 2.14 | $ | 2.78 | $ | 1.64 | $ | 0.71 | $ | 2.14 | $ | 2.78 | ||||||||||||
Net income attributable to Chart Industries, Inc. per common share — diluted | $ | 2.11 | $ | 2.72 | $ | 1.61 | $ | 0.69 | $ | 2.11 | $ | 2.72 | ||||||||||||
Weighted average number of common shares outstanding: | ||||||||||||||||||||||||
Basic | 28,457 | 28,354 | 26,872 | 28,534 | 28,457 | 28,354 | ||||||||||||||||||
Diluted | 28,981 | 29,008 | 27,493 | 29,255 | 28,981 | 29,008 | ||||||||||||||||||
The accompanying notes are an integral part of these consolidated financial statements.
F-6
CHART INDUSTRIES, INC. AND SUBSIDIARIES
CONSOLIDATED STATEMENTS OF SHAREHOLDERS’ EQUITY
| Common Stock | Common Stock | Accumulated Other Comprehensive (Loss) Income | Noncontrolling Interests | Total Equity | |||||||||||||||||||||||||||||||||||||||||||||||
| Shares Outstanding | Amount | Additional Paid-in Capital | Retained Earnings | Accumulated Other Comprehensive (Loss) Income | Noncontrolling Interests | Total Equity | Shares Outstanding | Amount | Additional Paid-in Capital | Retained Earnings | |||||||||||||||||||||||||||||||||||||||||
| (Dollars and shares in thousands) | |||||||||||||||||||||||||||||||||||||||||||||||||||
Balance at December 31, 2006 | 25,588 | $ | 256 | $ | 185,567 | $ | 26,389 | $ | 7,522 | $ | 2,111 | $ | 221,845 | ||||||||||||||||||||||||||||||||||||||
Net income | — | — | — | 44,156 | (156 | ) | 44,000 | ||||||||||||||||||||||||||||||||||||||||||||
Other comprehensive income (loss) | |||||||||||||||||||||||||||||||||||||||||||||||||||
Foreign currency translation adjustments | — | — | — | — | 9,294 | (30 | ) | 9,264 | |||||||||||||||||||||||||||||||||||||||||||
Amortization of unrecognized gains | — | — | — | — | (9 | ) | — | (9 | ) | ||||||||||||||||||||||||||||||||||||||||||
Increase in actuarial losses, net of tax benefit of ($833) | — | — | — | — | (1,375 | ) | — | (1,375 | ) | ||||||||||||||||||||||||||||||||||||||||||
Comprehensive income | — | — | — | — | — | — | 51,880 | ||||||||||||||||||||||||||||||||||||||||||||
Purchase of remaining noncontrolling interests | — | — | — | — | — | (2,081 | ) | (2,081 | ) | ||||||||||||||||||||||||||||||||||||||||||
Contribution from noncontrolling interest | — | — | — | — | — | 1,370 | 1,370 | ||||||||||||||||||||||||||||||||||||||||||||
Compensation expense recognized for employee stock options | — | — | 9,029 | — | — | — | 9,029 | ||||||||||||||||||||||||||||||||||||||||||||
Underwriters' over-allotment option exercise, net proceeds | 1,892 | 19 | 38,023 | — | — | — | 38,042 | ||||||||||||||||||||||||||||||||||||||||||||
Exercise of options | 732 | 7 | 4,790 | — | — | — | 4,797 | ||||||||||||||||||||||||||||||||||||||||||||
Tax benefit of non-qualifying stock options | — | — | 4,323 | — | — | — | 4,323 | ||||||||||||||||||||||||||||||||||||||||||||
| (Dollars and shares in thousands) | |||||||||||||||||||||||||||||||||||||||||||||||||||
Balance at December 31, 2007 | 28,212 | $ | 282 | $ | 241,732 | $ | 70,545 | $ | 15,432 | $ | 1,214 | $ | 329,205 | 28,212 | $ | 282 | $ | 241,732 | $ | 70,545 | $ | 15,432 | $ | 1,214 | $ | 329,205 | |||||||||||||||||||||||||
Net income | — | — | 78,924 | 182 | 79,106 | — | — | — | 78,924 | 182 | 79,106 | ||||||||||||||||||||||||||||||||||||||||
Other comprehensive income (loss) | |||||||||||||||||||||||||||||||||||||||||||||||||||
Foreign currency translation adjustments | — | — | — | — | (1,383 | ) | 96 | (1,287 | ) | — | — | — | — | (1,383 | ) | 96 | (1,287 | ) | |||||||||||||||||||||||||||||||||
Increase in pension liability, net of tax benefit of ($4,278) | — | — | — | — | (7,480 | ) | — | (7,480 | ) | ||||||||||||||||||||||||||||||||||||||||||
Increase in pension liability, net of tax benefit of $4,278 | — | — | — | — | (7,480 | ) | — | (7,480 | ) | ||||||||||||||||||||||||||||||||||||||||||
Comprehensive income | — | — | — | — | — | — | 70,339 | — | — | — | — | — | — | 70,339 | |||||||||||||||||||||||||||||||||||||
Compensation expense recognized for employee stock options | — | — | 3,134 | — | — | — | 3,134 | — | — | 3,134 | — | — | — | 3,134 | |||||||||||||||||||||||||||||||||||||
Exercise of options | 186 | 2 | 1,327 | — | — | — | 1,329 | 186 | 2 | 1,327 | — | — | — | 1,329 | |||||||||||||||||||||||||||||||||||||
Tax benefit of non-qualifying stock options | — | — | 1,435 | — | — | — | 1,435 | — | — | 1,435 | — | — | — | 1,435 | |||||||||||||||||||||||||||||||||||||
Other | — | — | 10 | — | — | — | 10 | — | — | 10 | — | — | — | 10 | |||||||||||||||||||||||||||||||||||||
Balance at December 31, 2008 | 28,398 | $ | 284 | $ | 247,638 | $ | 149,469 | $ | 6,569 | $ | 1,492 | 405,452 | 28,398 | $ | 284 | $ | 247,638 | $ | 149,469 | $ | 6,569 | $ | 1,492 | 405,452 | |||||||||||||||||||||||||||
Net income | — | — | — | 61,011 | — | 145 | 61,156 | — | — | 61,011 | 145 | 61,156 | |||||||||||||||||||||||||||||||||||||||
Other comprehensive income (loss) | |||||||||||||||||||||||||||||||||||||||||||||||||||
Foreign currency translation adjustments | — | — | — | — | 3,427 | 48 | 3,475 | — | — | — | — | 3,427 | 48 | 3,475 | |||||||||||||||||||||||||||||||||||||
Amortization of unrecognized losses | — | — | — | — | 679 | — | 679 | — | — | — | — | 679 | — | 679 | |||||||||||||||||||||||||||||||||||||
Decrease in pension liability, net of tax expense of ($1,777) | — | — | — | — | 2,429 | — | 2,429 | — | — | — | — | 2,429 | — | 2,429 | |||||||||||||||||||||||||||||||||||||
Comprehensive income | — | — | — | — | — | — | 67,739 | — | — | — | — | — | — | 67,739 | |||||||||||||||||||||||||||||||||||||
Compensation expense recognized for employee stock options | — | — | 3,279 | — | — | — | 3,279 | — | — | 3,279 | — | — | — | 3,279 | |||||||||||||||||||||||||||||||||||||
Exercise of options | 84 | 1 | 745 | — | — | — | 746 | 84 | 1 | 745 | — | — | — | 746 | |||||||||||||||||||||||||||||||||||||
Tax benefit of non-qualifying stock options | — | — | 30 | — | — | — | 30 | — | — | 30 | — | — | — | 30 | |||||||||||||||||||||||||||||||||||||
Balance at December 31, 2009 | 28,482 | $ | 285 | $ | 251,692 | $ | 210,480 | $ | 13,104 | $ | 1,685 | $ | 477,246 | 28,482 | $ | 285 | $ | 251,692 | $ | 210,480 | $ | 13,104 | $ | 1,685 | $ | 477,246 | |||||||||||||||||||||||||
Net income | — | — | — | 20,160 | — | 345 | 20,505 | ||||||||||||||||||||||||||||||||||||||||||||
Other comprehensive income (loss) | |||||||||||||||||||||||||||||||||||||||||||||||||||
Foreign currency translation adjustments | — | — | — | — | (2,753 | ) | 180 | (2,573 | ) | ||||||||||||||||||||||||||||||||||||||||||
Amortization of unrecognized losses | — | — | — | — | 270 | — | 270 | ||||||||||||||||||||||||||||||||||||||||||||
Decrease in pension liability, net of tax expense of ($470) | — | — | — | — | (810 | ) | — | (810 | ) | ||||||||||||||||||||||||||||||||||||||||||
Comprehensive income | — | — | — | — | — | — | 17,392 | ||||||||||||||||||||||||||||||||||||||||||||
Compensation expense recognized for employee stock options | — | — | 4,933 | — | — | — | 4,933 | ||||||||||||||||||||||||||||||||||||||||||||
Exercise of options | 350 | 1 | 1,062 | — | — | — | 1,063 | ||||||||||||||||||||||||||||||||||||||||||||
Tax benefit of non-qualifying stock options | — | — | 796 | — | — | — | 796 | ||||||||||||||||||||||||||||||||||||||||||||
Other | — | 2 | (58 | ) | — | — | — | (56 | ) | ||||||||||||||||||||||||||||||||||||||||||
Balance at December 31, 2010 | 28,832 | $ | 288 | $ | 258,425 | $ | 230,640 | $ | 9,811 | $ | 2,210 | $ | 501,374 | ||||||||||||||||||||||||||||||||||||||
The accompanying notes are an integral part of these consolidated financial statements.
F-7
CHART INDUSTRIES, INC. AND SUBSIDIARIES
CONSOLIDATED STATEMENTS OF CASH FLOWS
| Year Ended December 31, | Year Ended December 31, | |||||||||||||||||||||||
| 2009 | 2008 | 2007 | 2010 | 2009 | 2008 | |||||||||||||||||||
| (Dollars in thousands) | (Dollars in thousands) | |||||||||||||||||||||||
OPERATING ACTIVITIES | ||||||||||||||||||||||||
Net income | $ | 61,156 | $ | 79,106 | $ | 44,000 | $ | 20,505 | $ | 61,156 | $ | 79,106 | ||||||||||||
Adjustments to reconcile net income to net cash provided by operating activities: | ||||||||||||||||||||||||
Amortization of deferred financing costs | 1,616 | 1,857 | 1,646 | 3,063 | 1,616 | 1,857 | ||||||||||||||||||
Employee stock and stock option related compensation expense | 3,279 | 3,134 | 9,029 | 4,933 | 3,279 | 3,134 | ||||||||||||||||||
Asset impairment | 1,230 | 739 | 455 | 1,773 | 1,230 | 739 | ||||||||||||||||||
Depreciation and amortization | 21,412 | 21,313 | 18,706 | 23,577 | 21,412 | 21,313 | ||||||||||||||||||
Reversal of contingent liability on insolvent subsidiary | — | (6,514 | ) | — | — | — | (6,514 | ) | ||||||||||||||||
Gain on acquisition of business | (6,954 | ) | — | — | (1,124 | ) | (6,954 | ) | — | |||||||||||||||
Foreign currency transaction (gain) loss | (687 | ) | 3,948 | 42 | ||||||||||||||||||||
Foreign currency transaction loss (gain) | 871 | (687 | ) | 3,948 | ||||||||||||||||||||
Deferred income tax expense (benefit) | (1,751 | ) | (5,486 | ) | (7,030 | ) | (9,345 | ) | (1,751 | ) | (5,486 | ) | ||||||||||||
Other | 1,999 | (35 | ) | — | 3,236 | 1,999 | (35 | ) | ||||||||||||||||
Changes in assets and liabilities: | ||||||||||||||||||||||||
Accounts receivable | 15,217 | 2,505 | (19,022 | ) | (2,614 | ) | 15,217 | 2,505 | ||||||||||||||||
Inventory | 25,221 | (8,296 | ) | (11,122 | ) | (13,717 | ) | 25,221 | (8,296 | ) | ||||||||||||||
Unbilled contract revenues and other current assets | 27,112 | (14,045 | ) | 12,212 | (2,554 | ) | 27,112 | (14,045 | ) | |||||||||||||||
Accounts payable and other current liabilities | (16,567 | ) | (12,987 | ) | 19,245 | 10,505 | (16,567 | ) | (12,987 | ) | ||||||||||||||
Deferred income taxes | 641 | (4,768 | ) | 473 | (337 | ) | 641 | (4,768 | ) | |||||||||||||||
Customer advances and billings in excess of contract revenue | (45,998 | ) | 37,341 | 13,873 | (198 | ) | (45,998 | ) | 37,341 | |||||||||||||||
Net Cash Provided By Operating Activities | 86,926 | 97,812 | 82,507 | 38,574 | 86,926 | 97,812 | ||||||||||||||||||
INVESTING ACTIVITIES | ||||||||||||||||||||||||
Capital expenditures | (13,190 | ) | (13,968 | ) | (19,028 | ) | (16,939 | ) | (13,190 | ) | (13,968 | ) | ||||||||||||
Purchase of short term investments | — | (32,264 | ) | — | — | — | (32,264 | ) | ||||||||||||||||
Proceeds from sale of assets | 107 | — | 2,099 | 989 | 107 | — | ||||||||||||||||||
Acquisition of businesses, net of cash acquired | (18,086 | ) | (18,828 | ) | — | (47,865 | ) | (18,086 | ) | (18,828 | ) | |||||||||||||
Proceeds from maturities of short term investments | 32,264 | — | — | — | 32,264 | — | ||||||||||||||||||
Other investing activities | (1,897 | ) | (616 | ) | (1,612 | ) | (400 | ) | (1,897 | ) | (616 | ) | ||||||||||||
Net Cash (Used In) Investing Activities | (802 | ) | (65,676 | ) | (18,541 | ) | (64,215 | ) | (802 | ) | (65,676 | ) | ||||||||||||
FINANCING ACTIVITIES | ||||||||||||||||||||||||
Borrowings on revolving credit facilities | — | — | 9,000 | |||||||||||||||||||||
Payments on revolving credit facilities and short term debt | — | — | (9,750 | ) | ||||||||||||||||||||
Principal payments on long-term debt | — | (6,825 | ) | (40,000 | ) | (18,250 | ) | — | (6,825 | ) | ||||||||||||||
Payment of financing costs | — | — | (296 | ) | (2,857 | ) | — | — | ||||||||||||||||
Underwriters’ over-allotment proceeds, net | — | — | 38,042 | |||||||||||||||||||||
Warrant and stock option exercise proceeds | 746 | 1,329 | 4,797 | |||||||||||||||||||||
Stock option exercise proceeds | 1,063 | 746 | 1,329 | |||||||||||||||||||||
Tax benefit from exercise of stock options | 30 | 1,435 | 4,323 | 796 | 30 | 1,435 | ||||||||||||||||||
Other financing activities | — | — | 1,328 | (54 | ) | — | — | |||||||||||||||||
Net Cash Provided By (Used In) Financing Activities | 776 | (4,061 | ) | 7,444 | ||||||||||||||||||||
Net Cash (Used In) Provided By Financing Activities | (19,302 | ) | 776 | (4,061 | ) | |||||||||||||||||||
Net increase in cash and cash equivalents | 86,900 | 28,075 | 71,410 | |||||||||||||||||||||
Net (decrease) increase in cash and cash equivalents | (44,943 | ) | 86,900 | 28,075 | ||||||||||||||||||||
Effect of exchange rate changes on cash | 2,103 | 1,221 | 2,605 | (1,113 | ) | 2,103 | 1,221 | |||||||||||||||||
Cash and cash equivalents at beginning of period | 122,165 | 92,869 | 18,854 | 211,168 | 122,165 | 92,869 | ||||||||||||||||||
CASH AND CASH EQUIVALENTS AT END OF PERIOD | $ | 211,168 | $ | 122,165 | $ | 92,869 | $ | 165,112 | $ | 211,168 | $ | 122,165 | ||||||||||||
The accompanying notes are an integral part of these consolidated financial statements.
F-8
CHART INDUSTRIES, INC. AND SUBSIDIARIES
NOTES TO CONSOLIDATED FINANCIAL STATEMENTS
(Dollars and shares in thousands, except per share amounts)
NOTE A — Nature of Operations and Summary of Significant Accounting Policies
Nature of Operations: Chart Industries, Inc. (the “Company”), is a leading global supplier of standard and custom-engineered products and systems serving a wide variety of low-temperature and cryogenic applications. The Company has developed an expertise in cryogenic systems and equipment, which operate at low temperatures sometimes approaching absolute zero. The majority of the Company’s products, including vacuum insulated containment vessels, heat exchangers, cold boxes and other cryogenic components, are used throughout the liquid-gas supply chain for the purification, liquefaction, distribution, storage and useend-use of industrial gases and hydrocarbons. The Company has domestic operations located throughout the United States, including the principal executive offices located in Garfield Heights, Ohio, and an international presence in Asia, Australia and Europe.
Principles of Consolidation: The consolidated financial statements include the accounts of the Company and its subsidiaries. Intercompany accounts and transactions are eliminated in consolidation. Investments in affiliates where the Company’s ownership is between 20 percent and 50 percent, or where the Company does not have control but has the ability to exercise significant influence over operations or financial policy, are accounted for under the equity method.
Basis of Presentation: The consolidated financial statements and accompanying notes as of and for the years ended December 31, 2010, 2009 2008 and 20072008 are prepared in conformity with U.S. generally accepted accounting principles and require management to make certain estimates and assumptions. These may affect the reported amounts of assets and liabilities and the disclosure of contingent assets and liabilities at the date of the financial statements. They may also affect the reported amounts of revenues and expenses during the reporting period. Actual results could differ from those estimates upon subsequent resolution of identified matters.
Reclassifications:Certain items previously reportedIn 2010, the Company determined shipping and handling revenues should be recorded in specific financial statement captionssales and related shipping and handling costs should be recorded in cost of sales. Previously, both shipping and handling revenues and costs were netted within sales. Prior periods have been reclassified to conform to the 2009current period presentation.
Cost of Sales:Any expenses associated with manufacturing are included in cost of sales. These costs include all materials, direct and indirect labor, inbound freight, purchasing and receiving, inspection, internal transfers and distribution and warehousing of inventory. In addition, shop supplies, facility maintenance costs, manufacturing engineering, project management and depreciation expense for assets used in the manufacturing process are included in cost of sales.
Selling, general and administrative costs (“SG&A”):SG&A includes selling, marketing, customer service, product management, design engineering, and other administrative costs not directly supporting the manufacturing process as well as depreciation expense associated with non-manufacturing assets. In addition, SG&A includes corporate operating expenses for executive management, accounting, tax, treasury, human resources, information technology, legal, internal audit, risk management and stock-based compensation expense.
Cash and Cash Equivalents: The Company considers all investments with an initial maturity of three months or less when purchased to be cash equivalents. The December 31, 20092010 and 20082009 balances include money market investments.
Short Term Investments: The Company’s short term investments consist ofFrom time to time, the Company invests in short-term, highly liquid, variable rate instruments, which have stated maturities of greater than three months but less than six months. These short term investments are recorded at cost which approximates fair value. The Company has determined that its investment securities are available and intended for use in current operations and, accordingly, has classified investment securities as current assets. The short term investments include domestic time deposits of $30,169 and foreign time deposits totaling 1,500 euros at December 31, 2008. There are no short-term investments as of December 31, 2010 and 2009.
F-9
CHART INDUSTRIES, INC. AND SUBSIDIARIES
NOTES TO CONSOLIDATED FINANCIAL STATEMENTS—(Continued)
(Dollars and shares in thousands, except per share amounts)
Concentrations of Credit Risks: The Company sells its products to gas producers, distributors and end-users across the industrial gas, hydrocarbon and chemical processing industries in countries all over the world. Approximately 59%57%, 65%59% and 58%65% of sales were to foreign countries in 2010, 2009 2008 and 2007,2008, respectively. No single customer exceeded ten percent of consolidated sales in 2010 and 2009. In 2008 and 2007, sales to Air Liquide represented approximately 10% of consolidated sales across all segments each year.segments. Sales to the Company’s top ten customers accounted for 47%38%, 48%47% and 45%48% of consolidated sales in 2010, 2009 2008 and 2007,2008, respectively. The
F-9
CHART INDUSTRIES, INC. AND SUBSIDIARIES
NOTES TO CONSOLIDATED FINANCIAL STATEMENTS—(Continued)
(Dollars and shares in thousands, except per share amounts)
Company’s sales to particular customers fluctuate from period to period, but the large gas producer and distributor customers of the Company tend to be a consistently large source of revenue for the Company. To minimize credit risk from trade receivables, the Company reviews the financial condition of potential customers in relation to established credit requirements before sales credit is extended and monitors the financial condition of customers to help ensure timely collections and to minimize losses. Additionally, for certain domestic and foreign customers, particularly in the Energy and Chemicals (“E&C”) segment, the Company requires advance payments, letters of credit and other such guarantees of payment. Certain customers also require the Company to issue letters of credit or performance bonds, particularly in instances where advance payments are involved, as a condition of placing the order.
The Company is also subject to concentrations of credit risk with respect to its cash and cash equivalents and forward foreign currency exchange contracts. To minimize credit risk from these financial instruments, the Company enters into these arrangements with major banks and other quality financial institutions and invests only in high-quality instruments. The Company does not expect any counterparties to fail to meet their obligations in this area.
Allowance for Doubtful Accounts: The Company evaluates the collectibility of accounts receivable based on a combination of factors. In circumstances where the Company is aware of a specific customer’s inability to meet its financial obligations (e.g., bankruptcy filings, or substantial downgrading of credit scores), a specific reserve is recorded to reduce the receivable to the amount the Company believes will be collected. The Company also records allowances for doubtful accounts based on the length of time the receivables are past due and historical experience. The allowance for doubtful accounts balance at December 31, 2010 and 2009 was $3,008 and 2008 was $1,727, and $2,312, respectively.
Inventories: Inventories are stated at the lower of cost or market with cost being determined by the first-in, first-out (“FIFO”) method at December 31, 20092010 and 2008.2009. The components of inventory are as follows:
| December 31, | December 31, | |||||||||||||
| 2009 | 2008 | 2010 | 2009 | |||||||||||
Raw materials and supplies | $ | 22,795 | $ | 32,378 | $ | 35,565 | $ | 22,795 | ||||||
Work in process | 19,967 | 27,564 | 23,643 | 19,967 | ||||||||||
Finished goods | 42,808 | 35,448 | 45,227 | 42,808 | ||||||||||
| $ | 85,570 | $ | 95,390 | $ | 104,435 | $ | 85,570 | |||||||
Inventory Valuation Reserves: The Company determines inventory valuation reserves based on a combination of factors. In circumstances where the Company is aware of a specific problem in the valuation of a certain item, a specific reserve is recorded to reduce the item to its net realizable value. The Company also recognizes reserves based on the actual usage in recent history and projected usage in the near-term. If circumstances change (e.g., lower-than-expected or higher-than-expected usage), estimates of the net realizable value could be changed by a material amount.
F-10
CHART INDUSTRIES, INC. AND SUBSIDIARIES
NOTES TO CONSOLIDATED FINANCIAL STATEMENTS—(Continued)
(Dollars and shares in thousands, except per share amounts)
Property, Plant and Equipment: All capital expenditures for property, plant and equipment are stated on the basis of cost. Expenditures for maintenance and repairs are charged to expense as incurred, whereas major improvements are capitalized. The cost of applicable assets is depreciated over their estimated useful lives. Depreciation is computed using the straight-line method for financial reporting purposes and accelerated methods for income tax purposes. Depreciation expense was $12,528, $10,696 $10,350 and $7,755$10,350 for the years ended
F-10
CHART INDUSTRIES, INC. AND SUBSIDIARIES
NOTES TO CONSOLIDATED FINANCIAL STATEMENTS—(Continued)
(Dollars and shares in thousands, except per share amounts)
December 31, 2010, 2009 2008 and 2007,2008, respectively. The following table summarizes the components of property, plant and equipment:
| December 31, | December 31, | |||||||||||||||||||||
Classification | Estimated Useful | 2009 | 2008 | Estimated Useful | 2010 | 2009 | ||||||||||||||||
Land and buildings | 20-35 years | $ | 66,976 | $ | 58,633 | 20-35 years | $ | 72,783 | $ | 66,976 | ||||||||||||
Machinery and equipment | 3-12 years | 66,921 | 52,763 | 3-12 years | 69,572 | 66,921 | ||||||||||||||||
Computer equipment, furniture and fixtures | 3-7 years | 8,791 | 6,213 | 3-7 years | 10,912 | 8,791 | ||||||||||||||||
Construction in process | 3,876 | 4,911 | 8,800 | 3,876 | ||||||||||||||||||
| 146,564 | 122,520 | 162,067 | 146,564 | |||||||||||||||||||
Less accumulated depreciation | (35,411 | ) | (24,073 | ) | (45,909 | ) | (35,411 | ) | ||||||||||||||
Total property, plant and equipment, net | $ | 111,153 | $ | 98,447 | $ | 116,158 | $ | 111,153 | ||||||||||||||
The Company monitors its property, plant and equipment, and finite-lived intangible assets for impairment indicators on an ongoing basis. If impairment indicators exist, the Company performs the required analysis and records impairment charges. In conducting its analysis, the Company compares the undiscounted cash flows expected to be generated from the long-lived assets to the related net book values. If the undiscounted cash flows exceed the net book value, the long-lived assets are considered not to be impaired. If the net book value exceeds the undiscounted cash flows, an impairment loss is measured and recognized. An impairment loss is measured as the difference between the net book value and the fair value of the long-lived assets. Fair value is estimated based upon either discounted cash flow analyses or estimated salvage values. Cash flows are estimated using internal forecasts as well as assumptions related to discount rates. Changes in economic or operating conditions impacting these estimates and assumptions could result in the impairment of long-lived assets.
Goodwill and Other Intangible Assets: The Company does not amortize goodwill or other indefinite-lived intangible assets, but reviews them at least annually, and on an interim basis if necessary, for impairment using a measurement date of October 1st. The Company amortizes intangible assets that have finite lives over their useful lives.
The Company determines the fair value of any indefinite-lived intangible assets using a discounted cash flow method, compares the fair value to its carrying value and records an impairment loss if the carrying value exceeds its fair value. Goodwill is tested utilizing a two-step approach. After recording any impairment losses for indefinite-lived intangible assets, the Company determines the fair value of each reporting unit and compares the fair value to its carrying value, including goodwill, of such reporting unit (step one). To test for impairment, the Company is required to estimate the fair value of each reporting unit. The reporting units are also the reportable segments: Energy & Chemicals, Distribution & Storage, and BioMedical. Consistent with prior years, the Company uses the income and market approaches to develop fair value estimates, which are weighted equally to arrive at a fair value estimate for each reporting unit. With respect to the income approach, a model has been developed to estimate the fair value of each reporting unit. This fair value model incorporates estimates of future cash flows, estimates of allocations of certain assets and cash flows among reporting units, estimates of future growth rates and management’s judgment regarding the applicable discount rates to use to discount those estimated cash flows. With respect to the market approach, a guideline company method is used selecting
F-11
CHART INDUSTRIES, INC. AND SUBSIDIARIES
NOTES TO CONSOLIDATED FINANCIAL STATEMENTS—(Continued)
(Dollars and shares in thousands, except per share amounts)
companies with similar assets or businesses to estimate fair value of each reporting unit. Changes to these judgments and estimates could result in a significantly different estimate of the fair value of the reporting units, which could result in a different assessment of the recoverability of goodwill and other indefinite-lived intangible assets. If the fair value exceeds the carrying value, no impairment loss would be recognized. If the carrying value of the reporting unit exceeds its fair value, the goodwill of the reporting unit may be impaired. The amount of the impairment, if any, would then be measured in step two, which compares the implied fair value of the reporting unit’s goodwill with the carrying
F-11
CHART INDUSTRIES, INC. AND SUBSIDIARIES
NOTES TO CONSOLIDATED FINANCIAL STATEMENTS—(Continued)
(Dollars and shares in thousands, except per share amounts)
amount of that goodwill. As of October 1, 2010, the estimated fair values substantially exceeded the carrying value for all reporting units. The following table displays the gross carrying amount and accumulated amortization for finite-lived intangible assets and indefinite-lived intangible assets:
| Weighted Average Estimated Useful Life | December 31, 2009 | December 31, 2008 | Weighted Average Estimated Useful Life | December 31, 2010 | December 31, 2009 | |||||||||||||||||||||||||||||||
| Gross Carrying Amount | Accumulated Amortization | Gross Carrying Amount | Accumulated Amortization | Gross Carrying Amount | Accumulated Amortization | Gross Carrying Amount | Accumulated Amortization | |||||||||||||||||||||||||||||
Finite-lived assets | ||||||||||||||||||||||||||||||||||||
Unpatented technology | 9 years | $ | 10,988 | $ | (5,407 | ) | $ | 10,808 | $ | (3,897 | ) | 9 years | $ | 15,073 | $ | (7,275 | ) | $ | 10,988 | $ | (5,407 | ) | ||||||||||||||
Patents | 10 years | 9,016 | (4,040 | ) | 8,297 | (3,229 | ) | 10 years | 8,497 | (4,304 | ) | 9,016 | (4,040 | ) | ||||||||||||||||||||||
Product names | 14 years | 4,001 | (907 | ) | 2,580 | (677 | ) | 14 years | 5,676 | (1,285 | ) | 4,001 | (907 | ) | ||||||||||||||||||||||
Non-compete agreements | 3 years | 3,474 | (2,871 | ) | 3,474 | (2,445 | ) | 3 years | 2,130 | (1,952 | ) | 3,474 | (2,871 | ) | ||||||||||||||||||||||
Customer relations | 13 years | 106,194 | (31,239 | ) | 103,509 | (23,450 | ) | 13 years | 125,848 | (39,103 | ) | 106,194 | (31,239 | ) | ||||||||||||||||||||||
Other | — | — | — | 50 | (30 | ) | ||||||||||||||||||||||||||||||
| $ | 133,673 | $ | (44,464 | ) | $ | 128,718 | $ | (33,728 | ) | $ | 157,224 | $ | (53,919 | ) | $ | 133,673 | $ | (44,464 | ) | |||||||||||||||||
Indefinite-lived intangible assets: | ||||||||||||||||||||||||||||||||||||
Goodwill | $ | 264,532 | $ | 261,509 | $ | 275,252 | $ | 264,532 | ||||||||||||||||||||||||||||
Trademarks and trade names | 34,564 | 34,552 | 37,911 | 34,564 | ||||||||||||||||||||||||||||||||
In-process research and development | 3,070 | — | ||||||||||||||||||||||||||||||||||
| $ | 299,096 | $ | 296,061 | $ | 316,233 | $ | 299,096 | |||||||||||||||||||||||||||||
Amortization expense for intangible assets subject to amortization was $11,049, $10,716 $10,963 and $10,951$10,963 for the years ended December 31, 2010, 2009 2008 and 2007,2008, respectively, and is estimated to range from approximately $10,800$13,100 to $9,000$8,800 annually for fiscal years 20102011 through 2014,2016, respectively.
Goodwill increased $3,023$10,720 during the year ended December 31, 2009.2010. Acquisitions accounted for $2,700$11,228 of the increase and the remaining $323$508 decrease is due to the impact of foreign currency translation adjustments.
Financial Instruments: The fair values of cash equivalents, short term investments, accounts receivable and short term bank debt approximate their carrying amount because of the short maturity of these instruments.
Derivative Instruments: The Company utilizes certain derivative financial instruments to enhance its ability to manage foreign currency risk that exists as part of ongoing business operations. Derivative instruments are entered into for periods consistent with related underlying exposures and do not constitute positions independent of those exposures. The Company does not enter into contracts for speculative purposes, nor is it a party to any leveraged derivative instrument.
The Company is exposed to foreign currency exchange risk as a result of transactions in currencies other than the functional currency of certain subsidiaries. The Company utilizes foreign currency forward purchase and sale contracts to manage the volatility associated with foreign currency purchases and certain intercompany
F-12
CHART INDUSTRIES, INC. AND SUBSIDIARIES
NOTES TO CONSOLIDATED FINANCIAL STATEMENTS—(Continued)
(Dollars and shares in thousands, except per share amounts)
transactions in the normal course of business. Contracts typically have maturities of less than one year. Principal currencies include the euro, British pound and Czech koruna. The Company’s foreign currency forward contracts do not qualify as hedges as defined by accounting guidance. Changes in their fair value are recorded in the consolidated statement of operations. The changes in fair value generated a net loss of $630 for 2010, a net gain of $1,492 for 2009, and a net loss of $1,536 infor 2008.
As of December 31, 2010, the Company held forward currency contracts to sell (i) 16,900 euros against the Czech koruna, (ii) 386,853 Japanese yen against the U.S. dollar, (iii) 5,000 U.S. dollars against the euro, (iv) 500 Australian dollars against the U.S dollar, and (v) 75 British pounds against the euro. At December 31, 2010, the fair value of the Company’s derivative liabilities representing foreign currency forward contracts was $807. These were recorded on the balance sheet as other current liabilities. As of December 31, 2009, the Company held forward currency contracts to sell 3,300 euros against the U.S. dollar and to sell 270 Polish zloty against the Czech koruna. As of December 31, 2008, the Company held
F-12
CHART INDUSTRIES, INC. AND SUBSIDIARIES
NOTES TO CONSOLIDATED FINANCIAL STATEMENTS—(Continued)
(Dollars and shares in thousands, except per share amounts)
forward currency contracts to buy $482 and to sell $1,191 against the euro. The Company also held forward currency contracts to sell 21,150 euro and 5,989 Polish zloty against the Czech koruna. The 2009 contracts are at various exchange rates and expire at various dates through July 2010. At December 31, 2009, the fair value of the Company’s derivative assets representing foreign currency forward contracts was $127. These were recorded on the balance sheet as other current assets. The Company’s foreign currency forward contracts are not exchange traded instruments and, accordingly, are classified as being valued utilizing level 2 inputs which are based on observable inputs such as quoted prices for similar assets and liabilities in active markets.
Product Warranties: The Company provides product warranties with varying terms and durations for the majority of its products. The Company records warranty expense in cost of sales. The changes in the Company’s consolidated warranty reserve are as follows:
| Year Ended December 31, | Year Ended December 31, | |||||||||||||||||||||||
| 2009 | 2008 | 2007 | 2010 | 2009 | 2008 | |||||||||||||||||||
Balance at beginning of period | $ | 8,636 | $ | 5,731 | $ | 4,765 | $ | 8,764 | $ | 8,636 | $ | 5,731 | ||||||||||||
Warranty expense | 3,316 | 5,598 | 4,189 | 5,893 | 3,316 | 5,598 | ||||||||||||||||||
Warranty usage. | (4,335 | ) | (2,693 | ) | (3,223 | ) | (3,827 | ) | (4,335 | ) | (2,693 | ) | ||||||||||||
Acquired warranty reserves | 1,147 | — | — | 1,271 | 1,147 | — | ||||||||||||||||||
Balance at end of period | $ | 8,764 | $ | 8,636 | $ | 5,731 | $ | 12,101 | $ | 8,764 | $ | 8,636 | ||||||||||||
Shareholders’ Equity: The Company reports comprehensive income in its consolidated statement of shareholders’ equity. The components of accumulated other comprehensive income (loss) are as follows:
| December 31, | December 31, | |||||||||||||||
| 2009 | 2008 | 2010 | 2009 | |||||||||||||
Foreign currency translation adjustments | $ | 17,691 | $ | 14,264 | $ | 14,938 | $ | 17,691 | ||||||||
Pension liability adjustments, net of taxes of ($1,777) and ($4,278) at December 31, 2009 and 2008, respectively | (4,587 | ) | (7,695 | ) | ||||||||||||
Pension liability adjustments, net of taxes of ($470) and ($1,777) at December 31, 2010 and 2009, respectively | (5,127 | ) | (4,587 | ) | ||||||||||||
| $ | 13,104 | $ | 6,569 | $ | 9,811 | $ | 13,104 | |||||||||
Fair Value of Financial Instruments:Effective January 1, 2008, theThe Company measures financial assets and liabilities at fair value in three levels of inputs. The three-tier fair value hierarchy, which prioritizes the inputs used in the valuation methodologies, is:
Level 1— Valuations based on quoted prices for identical assets and liabilities in active markets.
F-13
CHART INDUSTRIES, INC. AND SUBSIDIARIES
NOTES TO CONSOLIDATED FINANCIAL STATEMENTS—(Continued)
(Dollars and shares in thousands, except per share amounts)
Level 2— Valuations based on observable inputs other than quoted prices included in Level 1, such as quoted prices for similar assets and liabilities in active markets, quoted prices for identical or similar assets and liabilities in markets that are not active, or other inputs that are observable or can be corroborated by observable market data.
Level 3— Valuations based on unobservable inputs reflecting our own assumptions, consistent with reasonably available assumptions made by other market participants. These valuations require significant judgment.
Revenue Recognition: For the majority of the Company’s products, revenue is recognized when products are shipped, title has transferred and collection is reasonably assured. For these products, there is also persuasive evidence of an arrangement and the selling price to the buyer is fixed or determinable. For brazed aluminum heat
F-13
CHART INDUSTRIES, INC. AND SUBSIDIARIES
NOTES TO CONSOLIDATED FINANCIAL STATEMENTS—(Continued)
(Dollars and shares in thousands, except per share amounts)
exchangers, cold boxes, liquefied natural gas fueling stations and engineered tanks, the Company uses the percentage of completion method of accounting. Earned revenue is based on the percentage that incurred costs to date bear to total estimated costs at completion after giving effect to the most current estimates. Earned revenue on contracts in process at December 31, 2010, 2009 and 2008, totaled $240,239, $295,530 and 2007, totaled $295,530, $395,756, and $249,654, respectively. Timing of amounts billed on contracts varies from contract to contract and could cause significant variation in working capital needs. Amounts billed on percentage of completion contracts in process at December 31, 2010, 2009 and 2008 totaled $239,600, $298,131 and 2007 totaled $298,131, $417,843, and $274,848, respectively. The cumulative impact of revisions in total cost estimates during the progress of work is reflected in the proper period asin which these changes become known. Earned revenue reflects the original contract price adjusted for agreed upon claims and change orders, if any. Losses expected to be incurred on contracts in process, after consideration of estimated minimum recoveries from claims and change orders, are charged to operations as soon as such losses are known. Pre-contract costs relate primarily to salaries and benefits incurred to support the selling effort and, accordingly, are expensed as incurred. Change orders resulting in additional revenue and profit are recognized upon approval by the customer based on the percentage that incurred costs to date bear to total estimated costs at completion. Change orders resulting in additional revenue and profit are recognized upon approval by the customer based on the percentage that incurred costs to date bear to total estimated costs at completion. Certain contracts include incentive-fee arrangements. The incentive fees in such contracts can be based on a variety of factors but the most common are the achievement of target completion dates, target costs, and/or other performance criteria. Failure to meet these targets can result in unrealized incentive fees. Incentive fee revenue is not recognized until it is earned. Timing of amounts billed on contracts varies from contract to contract and could cause a significant variation in working capital requirements.
Shipping and Handling Costs: Amounts billed to customers for shipping and handlingare classified as sales, and the related costs are classified as cost of sales. Net shipping costsShipping revenue of ($435)6,537), ($1,612)5,507) and ($1,290)7,111) for the years ended December 31, 2010, 2009 2008 and 2007,2008, respectively, are included in sales. Shipping costs of $8,488, $5,942, and $8,723 for the years ended December 31, 2010, 2009 and 2008, respectively, are included in the cost of sales.
Advertising Costs: The Company incurred advertising costs of $3,268, $3,355 $3,643 and $2,322$3,643 for the years ended December 31, 2010, 2009 2008 and 2007,2008, respectively. Such costs are expensed as incurred.
Research and Development Costs: The Company incurred research and development costs of $3,858, $3,256 $5,927 and $5,730$5,927 for the years ended December 31, 2010, 2009 2008 and 2007,2008, respectively. Such costs are expensed as incurred.
Foreign Currency Translation: The functional currency for the majority of the Company’s foreign operations is the applicable local currency. The translation from the applicable foreign currencies to U.S. dollars is performed for balance sheet accounts using exchange rates in effect at the balance sheet date and for revenue
F-14
CHART INDUSTRIES, INC. AND SUBSIDIARIES
NOTES TO CONSOLIDATED FINANCIAL STATEMENTS—(Continued)
(Dollars and shares in thousands, except per share amounts)
and expense accounts using a weighted average exchange rate during the period. The resulting translation adjustments are recorded as a component of shareholders’ equity. Gains or losses resulting from foreign currency transactions are charged to operations as incurred.
Income Taxes: The Company and its U.S. subsidiaries file a consolidated federal income tax return. Deferred income taxes are provided for temporary differences between financial reporting and the consolidated tax return in accordance with the liability method. A valuation allowance is provided against net deferred tax assets when conditions indicate that it is more likely than not that the benefit related to such assets will not be realized.
The Company utilizes a two-step approach for the recognition and measurement of uncertain tax positions. The first step is to evaluate the tax position and determine whether it is more likely than not that the position will be sustained upon examination by tax authorities. The second step is to measure the tax benefit as the largest amount that is more likely than not of being realized upon settlement.
Interest and penalties related to income taxes are accounted for as income tax expense.
F-14
CHART INDUSTRIES, INC. AND SUBSIDIARIES
NOTES TO CONSOLIDATED FINANCIAL STATEMENTS—(Continued)
(Dollars and shares in thousands, except per share amounts)
Stock-Based Compensation: Compensation expense forThe Company records stock-based compensation according to current accounting guidance which requires all share-based payment awards madepayments to employees and directors, isincluding grants of employee stock options, to be measured at fair value on the date of grant.
Compensation for share-based awards is recognized on an accrual basis over the vesting period. The total cost of a share-based payment award is reduced by estimated forfeitures expected to occur over the vesting period which generally is equivalent to the required service period of the award. See Note H for further discussions regarding stock options and other share-based awards.
Earnings per share: The following table presents calculations of income (loss) per share of common stock:
| Year Ended December 31, | Year Ended December 31, | ||||||||||||||||||||
| 2009 | 2008 | 2007 | 2010 | 2009 | 2008 | ||||||||||||||||
Net income attributable to Chart Industries, Inc. | $ | 61,011 | $ | 78,924 | $ | 44,156 | $ | 20,160 | $ | 61,011 | $ | 78,924 | |||||||||
Net income attributable to Chart Industries, Inc. per common share — basic | $ | 2.14 | $ | 2.78 | $ | 1.64 | $ | 0.71 | $ | 2.14 | $ | 2.78 | |||||||||
Net income attributable to Chart Industries, Inc. per common share — diluted | $ | 2.11 | $ | 2.72 | $ | 1.61 | $ | 0.69 | $ | 2.11 | $ | 2.72 | |||||||||
Weighted average number of common shares outstanding — basic | 28,457 | 28,354 | 26,872 | 28,534 | 28,457 | 28,354 | |||||||||||||||
Incremental shares issuable upon assumed conversion and exercise of stock options | 524 | 654 | 621 | 721 | 524 | 654 | |||||||||||||||
Total shares — diluted | 28,981 | 29,008 | 27,493 | 29,255 | 28,981 | 29,008 | |||||||||||||||
Certain options to purchase common stock of the Company were not included in net income attributable to Chart Industries, Inc. per common share-diluted as they were anti-dilutive and consisted of 362, 170 and 213 shares for the years ended December 31, 2010, 2009 and 2008, respectively.
New Accounting Pronouncements. The Financial Accounting Standards Board (“FASB”) has made the Accounting Standards Codification (ASC) effective for financial statements issued for interim and annual periods ending after September 15, 2009. The ASC combines all previously issued authoritative GAAP into one codified set of guidance organized by subject area. In these financial statements, references to previously issued accounting standards have been replaced with the relevant ASC references. Subsequent revisions to GAAP by the FASB will be incorporated into the ASC through issuance of Accounting Standards Updates (ASU).
In September 2006,June 2009, the FASB issued an accounting standardguidance as codified in ASC 820, “Fair Value Measurements810-10, “Consolidation of Variable Interest Entities” (previously SFAS No. 167, “Amendments to FASB Interpretation No. 46(R)”). This guidance is intended to improve financial reporting by providing additional guidance to companies involved with variable interest entities (“VIE’s”) and Disclosures” which is effective for fiscal years beginning after November 15, 2007. This standard defines fair value, establishes a framework for measuring fair value and expandsby requiring additional disclosures about fair value measurements. The standard was effective for the Company on January 1, 2008. The adoption of ASC 820 for financial assets and liabilities did not have any impact on the Company’s financial position or results of operations.
In February 2007, the FASB issued an accounting standard codifieda company’s involvement in ASC 825, “The Fair Value Option for Financial Assets and Financial Liabilities ”. This standard permits entities to voluntarily choose to measure many financial instruments and certain other items at fair value that are not currently required to be measured at fair value, with unrealized gains and losses related to these financial instruments reported in earnings at each subsequent reporting date. The standard is effective for fiscal years beginning after November 15, 2007. The adoption of ASC 825 at January 1, 2008 did not have any impact on the Company’s financial position or results of operations.
In December 2007, the FASB issued a new business combinations standard codified within ASC 805, which requires the acquiring entity in a business combination to recognize the full fair value of the assets acquired and liabilities assumed in the transaction at the acquisition date, the immediate recognition of acquisition-related transaction costs and the recognition of contingent consideration arrangements at theirvariable
F-15
CHART INDUSTRIES, INC. AND SUBSIDIARIES
NOTES TO CONSOLIDATED FINANCIAL STATEMENTS—(Continued)
(Dollars and shares in thousands, except per share amounts)
interest entities. This guidance is generally effective for annual periods beginning after November 15, 2009 and for interim periods within that first annual reporting period. The adoption of this guidance did not have a material impact on the financial statements of the Company.
In October 2009, the FASB issued ASU 2009-13, “Revenue Recognition (Topic 605) — Multiple-Deliverable Revenue Arrangements”. This ASU eliminates the requirement that all undelivered elements must have objective and reliable evidence of fair value before a company can recognize the portion of the consideration that is attributable to items that already have been delivered. This may allow some companies to recognize revenue on transactions that involve multiple deliverables earlier than under the current requirements. Additionally, under the new guidance, the relative selling price method is required to be used in allocating consideration between deliverables and the residual value method will no longer be permitted. This ASU is effective prospectively for revenue arrangements entered into or materially modified beginning in fiscal 2011 although early adoption is permitted. A company may elect, but will not be required, to adopt the amendments in this ASU retrospectively for all prior periods. The Company has evaluated the ASU and does not believe it will have a material impact on the consolidated financial statements.
In December 2010, the FASB issued ASU 2010-28, “Intangibles — Goodwill and Other (Topic 350).” This ASU modifies the first step of the goodwill impairment test to include reporting units with zero or negative carrying amounts. For these reporting units, the second step of the goodwill impairment test shall be performed to measure the amount of impairment loss, if any, when it is more likely than not that a goodwill impairment exists. This ASU is effective for fiscal years and interim periods beginning after December 15, 2010. The Company has evaluated the ASU and does not believe it will have a material impact on the consolidated financial statements.
In December 2010, the FASB issued ASU 2010-29, “Business Combinations (Topic 805).” This ASU specifies that if a company presents comparative financial statements, the company should disclose revenue and earnings of the combined entity as though the business combination that occurred during the year had occurred as of the beginning of the comparable prior annual reporting period only. The ASU also expands the supplemental pro forma disclosures under Topic 805 to include a description of the nature and amount of material, nonrecurring pro forma adjustments directly attributable to the business combination included in the pro forma revenue and earnings. This ASU is effective prospectively for business combinations for which the acquisition date fair value. ASC 805 was effective for acquisitions that occurredis on or after the beginning of the fiscal yearfirst annual reporting period beginning on or after December 15, 2008. This standard impacted the Company’s acquisitions that were completed in 2009.
In December 2007, the FASB issued a new accounting standard which requires entities to report noncontrolling (formerly known as minority) interests as a component of shareholders’ equity on the balance sheet. The new standard was effective for2010. Effective January 1, 2011, the Company beginning January 1, 2009will adopt this ASU and resultedinclude all required disclosures in a $1,492 reclassification of noncontrolling interests from other long-term liabilitiesthe notes to shareholders’ equity on the December 31, 2008its consolidated balance sheet.financial statements.
In March 2008, the FASB issued an accounting standard related to disclosures about derivative instruments
F-16
CHART INDUSTRIES, INC. AND SUBSIDIARIES
NOTES TO CONSOLIDATED FINANCIAL STATEMENTS—(Continued)
(Dollars and hedging activities which requires enhanced disclosures about an entity’s derivative and hedging activities. This standard was effective for financial statements issued after November 15, 2008. The adoption of the standard did not have an impact on the Company’s financial reporting requirements.shares in thousands, except per share amounts)
NOTE B — Balance Sheet Components
The following table summarizes the components of other current assets, other assets, net, other current liabilities and other long-term liabilities on the Company’s consolidated balance sheet as of December 31, 20092010 and 2008:2009:
| December 31, | December 31, | |||||||||||||
| 2009 | 2008 | 2010 | 2009 | |||||||||||
Other current assets: | ||||||||||||||
Deposits | $ | 278 | $ | 388 | $ | 407 | $ | 278 | ||||||
Assets held for sale | 3,250 | 4,910 | 2,824 | 3,250 | ||||||||||
Deferred income taxes | 7,977 | 8,898 | 12,686 | 7,977 | ||||||||||
Other receivables | 4,916 | 7,440 | 5,310 | 4,916 | ||||||||||
| $ | 16,421 | $ | 21,636 | $ | 21,227 | $ | 16,421 | |||||||
Other assets, net: | ||||||||||||||
Deferred financing costs | $ | 6,245 | $ | 7,860 | $ | 6,039 | $ | 6,245 | ||||||
Cash value life insurance | 1,371 | 1,139 | 1,513 | 1,371 | ||||||||||
Prepaid leases | 1,194 | 1,222 | 1,214 | 1,194 | ||||||||||
Other | 3,831 | 758 | 4,281 | 3,831 | ||||||||||
| $ | 12,641 | $ | 10,979 | $ | 13,047 | $ | 12,641 | |||||||
Other current liabilities: | ||||||||||||||
Accrued interest | $ | 3,112 | $ | 3,113 | $ | 3,206 | $ | 3,112 | ||||||
Accrued other taxes | 1,470 | 1,664 | 2,497 | 1,470 | ||||||||||
Accrued income taxes | 520 | 276 | 1,066 | 520 | ||||||||||
Accrued rebates | 2,615 | 5,082 | 4,090 | 2,615 | ||||||||||
Accrued employee separation and plant closure costs | 2,881 | 1,107 | 2,578 | 2,881 | ||||||||||
Accrued other | 12,395 | 5,374 | 12,376 | 12,395 | ||||||||||
| $ | 22,993 | $ | 16,616 | $ | 25,813 | $ | 22,993 | |||||||
Other long-term liabilities: | ||||||||||||||
Accrued environmental | $ | 6,462 | $ | 6,697 | $ | 6,355 | $ | 6,462 | ||||||
Accrued contingent consideration | 5,845 | — | ||||||||||||
Accrued contingencies and other | 2,280 | 3,393 | 1,034 | 2,280 | ||||||||||
| $ | 8,742 | $ | 10,090 | $ | 13,234 | $ | 8,742 | |||||||
NOTE C — Debt and Credit Arrangements
The following table shows the components of the Company’s borrowings at December 31, 2010 and 2009, respectively.
| December 31, | ||||||||
| 2010 | 2009 | |||||||
Senior term loan, due May 2015, average interest rate of 2.89% at December 31, 2010 | $ | 61,750 | $ | — | ||||
Senior term loan, average interest rate of 2.42% at December 31, 2009 | — | 80,000 | ||||||
Subordinated notes, due 2015, interest accrued at 9.125% | 163,175 | 163,175 | ||||||
Total debt | 224,925 | 243,175 | ||||||
Less: current maturities | (6,500 | ) | — | |||||
Long-term debt. | $ | 218,425 | $ | 243,175 | ||||
F-16
CHART INDUSTRIES, INC. AND SUBSIDIARIES
NOTES TO CONSOLIDATED FINANCIAL STATEMENTS—(Continued)
(Dollars and shares in thousands, except per share amounts)
NOTE C — Debt and Credit Arrangements
The following table showsOn May 18, 2010, the components of the Company’s borrowings at December 31, 2009 and 2008, respectively.
| December 31, | ||||||
| 2009 | 2008 | |||||
Senior term loan, due October 2012, average interest rate of 2.42% and 5.45% at December 31, 2009 and 2008, respectively | $ | 80,000 | $ | 80,000 | ||
Subordinated notes, due 2015, interest accrued at 9.125% | 163,175 | 163,175 | ||||
Total debt | 243,175 | 243,175 | ||||
Less: current maturities | — | — | ||||
Long-term debt. | $ | 243,175 | $ | 243,175 | ||
The Company has acompleted refinancing its prior senior secured credit facility (the “Seniorwith a five-year $200,000 senior credit facility (“Senior Credit Facility”). As a result of the refinancing, the Company wrote off $1,706 of deferred financing fees related to the prior senior credit facility. The new Senior Credit Facility consists of a $65,000 term loan (the “Term Loan”), of which $61,750 remains outstanding and a $135,000 revolving credit facility (the “Revolver”) with a scheduled maturity date of May 18, 2015. As part of the refinancing, the Company used cash to pay off $15,000 of its prior $80,000 term loan. The Revolver includes a $25,000 sub-limit for the issuance of swingline loans and a $50,000 sub-limit to be used for letters of credit. There is a foreign currency limit of $40,000 under the Revolver which can be used for foreign currency denominated letters of credit and borrowings in a foreign currency, in each case in currencies agreed upon with the lenders. In addition, the facility permits borrowings up to $40,000 under the Revolver made by the Company’s wholly-owned subsidiary, Chart Industries Luxembourg S.à r.l. The Company also has $163,175 of 9 1/8% senior subordinated notes (the “Subordinated Notes”) outstanding.
The Senior Credit Facility consistsmatures on May 18, 2015 (the “Maturity Date”). On September 30, 2010, the Company began repaying the principal balance of a $180,000 term loan facility (the “Term Loan”) and a $115,000 revolving credit facility (the “Revolver”), of which $55,000 may be used for letters of credit extending beyond one year from their date of issuance. At December 31, 2009, there was $80,000 and $163,175 outstanding under the Term Loan with its first quarterly installment of $1,625 and Subordinated Notes, respectively, and letters of credit and bank guarantees totaling $26,781 supported bywill continue to make quarterly installments through the Revolver.Maturity Date. The Term Loan matures on October 17, 2012 andCompany may select a Eurocurrency Borrowing or an ABR Borrowing rate. If the Revolver matures on October 17, 2010. We are currently reviewing options associated with our revolver includingCompany elects the need to either refinanceEurocurrency Borrowing, the revolver orbase rate for the entire Senior Credit Facility, or find alternative arrangements for letters of credit and other commercial needs. Market conditions and business needs will dictateelected period equals the appropriate course of action. As a result of five voluntary principal prepaymentsapplicable Adjusted LIBOR rate plus the applicable margin (as defined in 2005, 2006 and June 2007, the Term Loan does not require any scheduled principal payments prior to the maturity date. The interest rate under the Senior Credit Facility is, atFacility). If the Company’s option,Company elects an ABR Borrowing, the Alternative Basebase rate for any day equals an applicable interest margin (as defined in the Senior Credit Facility) plus the greatest of the Prime Rate (“ABR”)in effect on such day, the Federal Funds Effective Rate in effect on such day plus 1.0% or0.5%, and the Adjusted LIBOR Rate for a one month interest period on such day plus 2.0% on the Term Loan and ABR plus 1.5% or LIBOR plus 2.5% on the Revolver.1.0%. The applicable interest margin on the RevolverSenior Credit Facility could decreasechange based upon the leverage ratio calculated at each fiscal quarter end. In addition, the Company is required to pay an annual administrative fee of $100, a commitment fee of 0.375% onbetween 0.3% and 0.5% of the unused Revolver balance and a letter of credit participation fee of 2.0% per annum onequal to the daily aggregate letter of credit exposure and aat the rate per annum equal to the Applicable Margin for Eurocurrency Revolving Facility Borrowings (ranging from 2% to 3.5%, depending on the leverage ratio calculated at each fiscal quarter end). A fronting fee must be paid on each letter of credit issuance feethat is issued equal to 0.125% per annum of 0.25%.the stated dollar amount of the letter of credit. The obligations under the Senior Credit Facility are guaranteed by the Company and substantially all of its U.S. subsidiaries and secured by substantially all of the assets of the Company’s U.S. Subsidiariessubsidiaries and 65% of the capital stock of the Company’s Material (as defined by the Senior Credit Facility) non-U.S. Subsidiaries.subsidiaries that are owned by U.S. subsidiaries.
The Subordinated Notes are due in 2015 with interest payable semi-annually on April 15th and October 15th. Any of the Subordinated Notes may be redeemed solely at the Company’s option, beginning on October 15, 2010.except as restricted by the Senior Credit Facility. The initial redemption price on October 15, 2010 is 104.563 percent104.563% of the principal amount, plus accrued interest. Also, any of the notes may be redeemed solely at the Company’s option at any time prior to October 15, 2010, plus accrued interest and a “make-whole” premium. The Subordinated Notes are general unsecured obligations of the Company and are subordinated in right of payment to all existing and future senior debt of the Company, including the Senior Credit Facility, pari passu in right of payment with all future senior subordinated indebtedness of the Company, and senior in right of payment with any future indebtedness of the Company that expressly providedprovides for its subordination to the Subordinated Notes. The Subordinated Notes andare unconditionally guaranteed jointly and severally by substantially all of the Company’s U.S. Subsidiaries. During September 2008, the Company purchased $6,825 in principal of its Subordinated Notes on the open market. In conjunction with the purchase of the Subordinated Notes, the Company wrote off $218 of unamortized deferred financing costs which were being amortized over the term of the Subordinated Notes. The repurchased Subordinated Notes have been retired.
F-17
CHART INDUSTRIES, INC. AND SUBSIDIARIES
NOTES TO CONSOLIDATED FINANCIAL STATEMENTS—(Continued)
(Dollars and shares in thousands, except per share amounts)
subsidiaries.
The Senior Credit Facility agreement and provisions of the indenture governing the Subordinated Notes contain a number of customary covenants, including but not limited to restrictions on the Company’s ability to incur additional indebtedness, create liens or other encumbrances, sell assets, enter into sale and lease-back transactions, make certain payments, investments, loans, advances or guarantees, make acquisitions and engage in mergers or consolidations, pay dividends andor distributions, and make capital expenditures. The Senior Credit Facility and indenture governing the Subordinated Notes also include financial covenants relating to net leverage interest coverage
F-18
CHART INDUSTRIES, INC. AND SUBSIDIARIES
NOTES TO CONSOLIDATED FINANCIAL STATEMENTS—(Continued)
(Dollars and fixed chargeshares in thousands, except per share amounts)
and interest coverage ratios. The Company is in compliance with all covenants atcovenants. As of December 31, 2009.
On October 5, 2008, Lehman Commercial Paper Inc. (“LCPI”), a subsidiary of Lehman Brothers Holdings Inc. and a lender2010, there was $61,750 outstanding under the revolver, filed for bankruptcy protection under Chapter 11 of United States Bankruptcy Code. LCPI provided $5,000 in commitments or approximately 4.3% of total commitments on the Revolver portion of the Senior Credit Facility. The Company has been informed that LCPI does not intend to honor their $5,000 in commitments; therefore, the total borrowing capacityTerm Loan and $163,175 outstanding under the Revolver portionSubordinated Notes and $21,969 in letters of credit issued but no borrowings outstanding under the Senior Credit Facility is effectively limited to $110,000.Revolver.
Chart Ferox, a.s. (“Ferox”), a wholly-owned subsidiary of the Company, maintains secured revolving credit facilities with borrowing capacity, including overdraft protection, of up to 200,000150,000 Czech korunaskoruna (“CSK”). Ferox maintains two separate facilities. Under the first facility, the revolving credit portion allows Ferox to make borrowings in CSK, euros and U.S. dollars. Borrowings in CSK are at PRIBOR, borrowings in eurosEuros are at EURIBOR and borrowings in U.S,U.S. dollars are at LIBOR, each with a fixed margin of 1.0 percent.1.0%. The first facility allows for overdraft protection in CSK, euros and U.S. dollars. The second facility does not allow for revolving credit borrowings. Both facilities allow for overdraft protection in CSK, euros and U.S. dollars. Borrowings in CSK are at PRIBOR, borrowings in euros are at an overnight European indexed average and borrowings in U.S. dollars are at LIBOR, with a fixed margin of 0.6 – 1.0 percent.1.0%. Ferox is not required to pay a commitment fee to the lenderslender under either creditits facility in respect to the unutilized commitments thereunder. Ferox must pay letter of credit and guarantee fees equal to 0.70 percent0.70% on the face amount of each guarantee. Ferox’s land, buildings and accounts receivable secure the revolving credit facilities. AtAs of December 31, 2009,2010, there were no borrowings outstanding under and $3,770the Ferox credit facilities. However, there were $4,058 of bank guarantees supported by the Ferox revolving credit facilities.
Flow Instruments & Engineering GmbH which was acquired by(“Flow”), a wholly-owned subsidiary of Ferox, in April 2008, maintains two revolving lines of credit with 320 euros in total borrowing capacity. As of December 31, 2009,2010, there were no borrowings outstanding under either line of credit.
The scheduled annual maturities of long-term debt at December 31, 2009,2010, are as follows:
Year | Amount | Amount | |||||
2010 | $ | — | |||||
2011 | — | $ | 6,500 | ||||
2012 | 80,000 | 6,500 | |||||
2013 | — | 6,500 | |||||
2014 | — | 6,500 | |||||
2015 | 198,925 | ||||||
Thereafter | $ | 163,175 | — | ||||
| $ | 243,175 | $ | 224,925 | ||||
The Company paid interest of $16,774, $16,820 $20,936 and $24,039$20,936 for the years ended December 31, 2010, 2009 2008 and 2007,2008, respectively.
The fair value of the term loan portion of the Senior Credit Facility is estimated based on the present value of the underlying cash flows discounted at the Company’s estimated borrowing rate. Under such method the fair
F-18
CHART INDUSTRIES, INC. AND SUBSIDIARIES
NOTES TO CONSOLIDATED FINANCIAL STATEMENTS—(Continued)
(Dollars and shares in thousands, except per share amounts)
value of the Company’s Term Loan approximated its carrying value at December 31, 2009 and 2008.2010. The fair value of the Subordinated Notes is estimated based on a third party’s estimated bid price. The fair value equaled the carrying value of $163,175 at December 31, 20092010 and was $142,000 at December 31, 2008.2009.
NOTE D — Restructuring Activities
In April 2010, Caire Inc., a wholly-owned subsidiary of the Company, announced its plan to close its liquid oxygen therapy manufacturing facility in Plainfield, Indiana and relocate the manufacturing and customer service operations to a facility close to existing BioMedical operations in Canton, Georgia. The Plainfield facility was acquired as part of the 2009 acquisition of the liquid oxygen therapy business of Covidien plc. The total
F-19
CHART INDUSTRIES, INC. AND SUBSIDIARIES
NOTES TO CONSOLIDATED FINANCIAL STATEMENTS—(Continued)
(Dollars and shares in thousands, except per share amounts)
anticipated cost of the restructuring is approximately $7,000 which includes asset impairment charges. The Company has initiatedexpects the closure to be completed in the second quarter of 2011. The cost containment programswill include cash expenditures for employee retention and separation benefits as well as lease exit costs. For the year ended December 31, 2010, the Company recorded $3,730 related to appropriately align its cost structure with expected market conditions. The programs consist primarilythe closure of planned workforce reductionsthe Plainfield, Indiana BioMedical facility and the shutdownwrite-down to net realizable value of itscertain assets at the facility. The Company also recorded an additional $834 in asset impairment expense as a result of the write-down to fair value of the assets held for sale in Denver, Colorado BioMedical facility.and in Plaistow, New Hampshire. The Company also recorded $192 in restructuring costs related to the integration of SeQual Technologies, Inc. which was acquired on December 28, 2010. These charges were recorded in cost of sales ($2,579), selling, general and administrative expenses, ($531) and asset impairment charges ($1,646).
During 2009, the Company recorded $8,020, related to termination benefits primarily in the Distribution & Storage and BioMedical segments and the write-down to net realizable value of certain assets at the Denver, Colorado facility and land held for sale in Plaistow, New Hampshire. These charges were recorded in cost of sales ($3,605), selling, general and administrative expenses ($3,185) and asset impairment charges ($1,230). As a result, excluding recent acquisitions, the number of employees has been reduced by approximately 27.5% at December 31, 2009 compared with December 31, 2008 levels. The Denver facility land and building of approximately $2,500 and $3,925 were classified as assets held for sale as of December 31, 2009 and 2008, respectively.
The following table summarizestables summarize the Company’s restructuring activities for 2009.the years ended December 31, 2010 and 2009:
| Year Ended December 31, 2009 | Year Ended December 31, 2010 | |||||||||||||||||||||||||||||||||||||||
| BioMedical | Distribution & Storage | Energy & Chemical | Corporate | Total | Energy & Chemicals | Distribution & Storage | BioMedical | Corporate | Total | |||||||||||||||||||||||||||||||
Balance as of January 1, 2009 | $ | — | $ | — | $ | — | $ | — | $ | — | ||||||||||||||||||||||||||||||
Balance as of January 1, 2010 | $ | 682 | $ | 1,608 | $ | 503 | $ | 88 | $ | 2,881 | ||||||||||||||||||||||||||||||
Restructuring charges | 3,336 | 3,397 | 1,004 | 283 | 8,020 | — | (45 | ) | 4,723 | 78 | 4,756 | |||||||||||||||||||||||||||||
Asset impairment | (996 | ) | (234 | ) | — | — | (1,230 | ) | — | — | (1,546 | ) | (100 | ) | (1,646 | ) | ||||||||||||||||||||||||
Cash payments | (1,837 | ) | (1,555 | ) | (322 | ) | (195 | ) | (3,909 | ) | (579 | ) | (1,176 | ) | (1,592 | ) | (66 | ) | (3,413 | ) | ||||||||||||||||||||
Balance as of December 31, 2009 | $ | 503 | $ | 1,608 | $ | 682 | $ | 88 | $ | 2,881 | ||||||||||||||||||||||||||||||
Balance as of December 31, 2010 | $ | 103 | $ | 387 | $ | 2,088 | $ | — | $ | 2,578 | ||||||||||||||||||||||||||||||
| Year Ended December 31, 2009 | ||||||||||||||||||||
| Energy & Chemicals | Distribution & Storage | BioMedical | Corporate | Total | ||||||||||||||||
Balance as of January 1, 2009 | $ | — | $ | — | $ | — | $ | — | $ | — | ||||||||||
Restructuring charges | 1,004 | 3,397 | 3,336 | 283 | 8,020 | |||||||||||||||
Asset impairment | — | (234 | ) | (996 | ) | — | (1,230 | ) | ||||||||||||
Cash payments | (322 | ) | (1,555 | ) | (1,837 | ) | (195 | ) | (3,909 | ) | ||||||||||
Balance as of December 31, 2009 | $ | 682 | $ | 1,608 | $ | 503 | $ | 88 | $ | 2,881 | ||||||||||
NOTE E — Acquisitions
On December 28, 2010, Caire Inc. (“Caire”), a wholly-owned subsidiary of the Company, completed the acquisition of SeQual Technologies Inc. (“SeQual”) for a total potential purchase price of $60,000 in cash, of which $38,700 was paid at closing. The cash purchase price is subject to post closing working capital and other adjustments. The majority of the remaining potential total purchase price represents contingent consideration to be paid over two years beginning in 2012 based on the achievement of certain gross profit targets. The estimated value of the contingent consideration at the acquisition date was $5,100, valued according to a discount cash flow approach, which includes assumptions for the probabilities of achieving the gross profit targets and the discount rate applied to the projected payments. The valuation of contingent consideration is classified as utilizing Level 3 inputs consistent with reasonably available assumptions which would be made by other market participants.
F-20
CHART INDUSTRIES, INC. AND SUBSIDIARIES
NOTES TO CONSOLIDATED FINANCIAL STATEMENTS—(Continued)
(Dollars and shares in thousands, except per share amounts)
The purchase price allocation related to the SeQual acquisition is substantially complete with the exception of intangible assets and contingent consideration, which continue to be based on provisional fair values and are subject to revision as the Company finalizes appraisals and other analyses. Final determination of the fair values may result in further adjustments to the values presented below:
Assets acquired: | ||||
Cash | $ | 218 | ||
Accounts receivable, net | 6,169 | |||
Inventory, net | 4,959 | |||
Property and equipment | 711 | |||
Other assets | 504 | |||
Intangible assets | 31,760 | |||
Goodwill | 7,001 | |||
Liabilities assumed | (7,522 | ) | ||
Total purchase price | $ | 43,800 | ||
SeQual is located in San Diego, California and develops, manufactures and markets products for numerous applications utilizing pressure swing adsorption technology for air separation with its primary focus on medical oxygen concentrators. SeQual’s results will be included in the Company’s BioMedical segment.
On August 2, 2010, Chart Inc. acquired substantially all of the assets of Cryotech International, Inc. (“Cryotech”) for a potential total purchase price of $6,653 in cash, of which $4,053 was paid at closing. The remaining portion of the potential total purchase price represents contingent consideration to be paid over two years based on the achievement of certain revenue targets. The estimated value of the contingent consideration at the acquisition date was $1,800. The value of the contingent consideration was estimated using a probability model. The fair value of the assets acquired and goodwill at the date of acquisition were $1,626 and $4,227, respectively. Cryotech is located in San Jose, California and designs, manufactures, sells, and services cryogenic injectors, vacuum insulated piping systems, and manifolds, and also repairs liquid cylinders. Cryotech’s results are included in the Company’s Distribution & Storage segment and added $5,297 to net sales during the year ended December 31, 2010.
On April 2, 2010, Chart Japan Co., Ltd. completed the acquisition of Covidien Japan Inc.’s liquid oxygen therapy business for $1,008 in cash. The fair value of the assets acquired at closing was $2,132 which exceeded the cash paid and, accordingly, resulted in a gain on acquisition of business of $1,124 during the second quarter of 2010. Available public information indicated that Covidien sought to streamline its business portfolio in an expeditious manner and reallocate resources to other businesses, therefore, the liquid oxygen therapy business was considered a non-core asset. Net sales of $2,787 were added to the Company’s BioMedical segment during the year ended December 31, 2010 as a result of the acquisition.
On November 27, 2009, Caire Inc., and other wholly-owned subsidiaries of the Company completed the acquisition of theCovidien’s liquid oxygen therapy business, a non-core asset of Covidien plc. The acquisition includedincluding the design, manufacturing, and worldwide sales and service functions, for $9,082 in cash in the initial closing. In addition, the Company is required to purchase Covidien’s remaining liquid oxygen therapy assets located in Japan for approximately $1,100 once Japanese regulatory approval is obtained. This is expected to close during 2010. The fair value of the net assets acquired in the initial closing of $16,036 exceeded the cash paid and, accordingly, resulted in a gain on acquisition of business of $6,954.$6,954 in 2009. Net sales of $2,900$50,439 were added to the Company’s BioMedical segment in 2009 sinceduring the dateyear ended December 31, 2010 as a result of acquisition.the acquisition of the liquid oxygen therapy business.
During the second quarter of 2009, the Company completed the acquisition of the equity interests of Chengdu Golden Phoenix Liquid Nitrogen Container Company, Ltd. (“Golden Phoenix”) and substantially all of the assets of Tri-Thermal, Inc. for an aggregate of $12,175, net of cash acquired, of which $4,100 will be$2,344 was paid during the first quarter of 2010 and the remaining $1,760 was paid during the second quarter of 2010. The fair values of the net assets acquired and goodwill at the date of acquisition were $10,000 and $2,700, respectively.
F-21
CHART INDUSTRIES, INC. AND SUBSIDIARIES
NOTES TO CONSOLIDATED FINANCIAL STATEMENTS—(Continued)
(Dollars and shares in thousands, except per share amounts)
Golden Phoenix manufactures liquid nitrogen aluminum storage containers used primarily in the animal breeding industry and is located in China. Golden Phoenix is included in the Company’s BioMedical segment. Tri-Thermal is located in Tulsa, Oklahoma and sells replacement parts for air-cooled heat exchangers. Tri-Thermal’s results are included in the Company’s Energy & Chemicals segment.
Pro-forma information related to these acquisitions has not been presented because the impact on the Company’s consolidated results of operations is considered immaterial.
NOTE F — Income Taxes
Income before income taxes and minority interest consists of the following:
| For the Year Ended December 31, | ||||||||||||
| 2010 | 2009 | 2008 | ||||||||||
United States | $ | 18,415 | $ | 70,695 | $ | 88,867 | ||||||
Foreign | 10,083 | 13,847 | 20,728 | |||||||||
| $ | 28,498 | $ | 84,542 | $ | 109,595 | |||||||
F-19Significant components of the provision for income taxes are as follows:
| Year Ended December 31, | ||||||||||||
| 2010 | 2009 | 2008 | ||||||||||
Current: | ||||||||||||
Federal | $ | 12,673 | $ | 21,779 | $ | 32,410 | ||||||
State | 900 | 462 | 1,030 | |||||||||
Foreign | 3,765 | 2,896 | 2,535 | |||||||||
| 17,338 | 25,137 | 35,975 | ||||||||||
Deferred: | ||||||||||||
Federal | (8,603 | ) | (1,718 | ) | (4,421 | ) | ||||||
State | 77 | (142 | ) | (1,687 | ) | |||||||
Foreign | (819 | ) | 109 | 622 | ||||||||
| (9,345 | ) | (1,751 | ) | (5,486 | ) | |||||||
| $ | 7,993 | $ | 23,386 | $ | 30,489 | |||||||
The reconciliation of income taxes computed at the U.S. federal statutory tax rate to income tax expense is as follows:
| Year Ended December 31, | ||||||||||||
| 2010 | 2009 | 2008 | ||||||||||
Income tax expense at U.S. statutory rate | $ | 9,974 | $ | 29,589 | $ | 38,359 | ||||||
State income taxes (benefit), net of federal tax benefit | 976 | 319 | (427 | ) | ||||||||
Foreign income, net of credit on foreign taxes | 176 | (31 | ) | (584 | ) | |||||||
Effective tax rate differential of earnings outside of U.S. | (1,221 | ) | (1,455 | ) | (4,759 | ) | ||||||
Foreign investment tax credit | (305 | ) | (385 | ) | (1,618 | ) | ||||||
Non-taxable gain on acquisition of business | (394 | ) | (2,434 | ) | — | |||||||
(Taxable) non-deductible items | (144 | ) | (735 | ) | 1,445 | |||||||
(Income) provision for tax contingencies | 2 | (69 | ) | (147 | ) | |||||||
Domestic production activities deduction | (1,071 | ) | (1,413 | ) | (1,780 | ) | ||||||
| $ | 7,993 | $ | 23,386 | $ | 30,489 | |||||||
F-22
CHART INDUSTRIES, INC. AND SUBSIDIARIES
NOTES TO CONSOLIDATED FINANCIAL STATEMENTS—(Continued)
(Dollars and shares in thousands, except per share amounts)
BioMedical segment and added $2,200 in sales since the date of acquisition. Tri-Thermal is located in Tulsa, Oklahoma and sells replacement parts for air cooled heat exchangers. Tri-Thermal’s results are included in the Company’s Energy & Chemicals segment and added $1,200 in sales since the date of acquisition.
Pro-forma information related to these acquisitions has not been presented because the impact on the Company’s consolidated results of operations is considered immaterial.
On April 1, 2008, Ferox acquired Flow Instruments & Engineering GmbH (“Flow”), which is based in Germany, for 11,900 euros, net of cash acquired. The fair value of the net assets acquired and goodwill at the date of acquisition was $5,400 and $14,800, respectively. Flow manufactures cryogenic flow meter systems for industrial gases and liquefied petroleum gas, distribution equipment for transport of CO2 and other gases, and provides calibration services. Flow is included in the Company’s Distribution & Storage segment.
In February 2008, the Company entered into a joint venture in Saudi Arabia with two other entities to form a company to manufacture air cooled heat exchangers. The contribution to the joint venture was $616 for a 34% share of the joint venture. The joint venture is accounted for under the equity method. The Company contributed an additional $947 in October 2009 as its pro rata share of a contribution from all the partners.
NOTE F — Income Taxes
Income before income taxes and minority interest consists of the following:
| For the Year Ended December 31, | |||||||||
| 2009 | 2008 | 2007 | |||||||
United States | $ | 70,695 | $ | 88,867 | $ | 38,508 | |||
Foreign | 13,847 | 20,728 | 22,811 | ||||||
| $ | 84,542 | $ | 109,595 | $ | 61,319 | ||||
F-20
CHART INDUSTRIES, INC. AND SUBSIDIARIES
NOTES TO CONSOLIDATED FINANCIAL STATEMENTS—(Continued)
(Dollars and shares in thousands, except per share amounts)
Significant components of the provision for income taxes are as follows:
| Year Ended December 31, | ||||||||||||
| 2009 | 2008 | 2007 | ||||||||||
Current: | ||||||||||||
Federal | $ | 21,779 | $ | 32,410 | $ | 19,764 | ||||||
State | 462 | 1,030 | 1,623 | |||||||||
Foreign | 2,896 | 2,535 | 2,962 | |||||||||
| 25,137 | 35,975 | 24,349 | ||||||||||
Deferred: | ||||||||||||
Federal | (1,718 | ) | (4,421 | ) | (5,795 | ) | ||||||
State | (142 | ) | (1,687 | ) | (1,584 | ) | ||||||
Foreign | 109 | 622 | 349 | |||||||||
| (1,751 | ) | (5,486 | ) | (7,030 | ) | |||||||
| $ | 23,386 | $ | 30,489 | $ | 17,319 | |||||||
The reconciliation of income taxes computed at the U.S. federal statutory tax rate to income tax expense is as follows:
| Year Ended December 31, | ||||||||||||
| 2009 | 2008 | 2007 | ||||||||||
Income tax expense at U.S. statutory rate | $ | 29,589 | $ | 38,359 | $ | 21,462 | ||||||
State income taxes (benefit), net of federal tax benefit | 319 | (427 | ) | 36 | ||||||||
Credit on foreign taxes paid | (31 | ) | (584 | ) | (926 | ) | ||||||
Effective tax rate differential of earnings outside of U.S. | (1,455 | ) | (4,759 | ) | (2,893 | ) | ||||||
Foreign investment tax credit | (385 | ) | (1,618 | ) | (1,780 | ) | ||||||
Gain on acquisition of business | (2,434 | ) | — | — | ||||||||
(Taxable) non-deductible items | (735 | ) | 1,445 | 1,893 | ||||||||
(Income) provision for tax contingencies | (69 | ) | (147 | ) | 332 | |||||||
Domestic production activities deduction | (1,413 | ) | (1,780 | ) | (805 | ) | ||||||
| $ | 23,386 | $ | 30,489 | $ | 17,319 | |||||||
Deferred income taxes reflect the net tax effect of temporary differences between the carrying amounts of assets and liabilities for financial reporting purposes and the amounts used for income tax purposes. Significant components of the Company’s deferred tax assets and liabilities are as follows:
| December 31, 2009 | December 31, 2008 | |||||
Deferred tax assets: | ||||||
Accruals and reserves | $ | 9,730 | $ | 11,011 | ||
Pensions | 3,846 | 5,425 | ||||
Inventory | 1,581 | 1,296 | ||||
Tax credit carryforward | 709 | 1,673 | ||||
Foreign net operating loss | 412 | 57 | ||||
Stock options | 4,310 | 3,455 | ||||
F-21
| December 31, 2010 | December 31, 2009 | |||||||
Deferred tax assets: | ||||||||
Accruals and reserves | $ | 13,699 | $ | 9,730 | ||||
Pensions | 4,245 | 3,846 | ||||||
Inventory | 1,363 | 1,581 | ||||||
Stock options | 5,412 | 4,310 | ||||||
Tax credit carryforwards | 594 | 709 | ||||||
Foreign net operating loss carryforwards | 861 | 412 | ||||||
Federal net operating loss carryforward | 10,189 | — | ||||||
State net operating loss carryforward | 947 | — | ||||||
Other — net | 1,279 | 376 | ||||||
Total deferred tax assets before valuation allowance | $ | 38,589 | $ | 20,964 | ||||
Valuation allowance | (758 | ) | (246 | ) | ||||
Total deferred tax assets, net of valuation allowance | $ | 37,831 | $ | 20,718 | ||||
Deferred tax liabilities: | ||||||||
Property, plant and equipment | $ | 11,973 | $ | 11,644 | ||||
Intangibles | 52,312 | 43,854 | ||||||
Total deferred tax liabilities | $ | 64,285 | $ | 55,498 | ||||
Net deferred tax liabilities | $ | 26,454 | $ | 34,780 | ||||
CHART INDUSTRIES, INC. AND SUBSIDIARIES
NOTES TO CONSOLIDATED FINANCIAL STATEMENTS—(Continued)
(Dollars and shares in thousands, except per share amounts)
| December 31, 2009 | December 31, 2008 | |||||||
Other — net | 376 | 1,026 | ||||||
Total deferred tax assets before valuation allowance | $ | 20,964 | $ | 23,943 | ||||
Valuation allowance | (246 | ) | (57 | ) | ||||
Total deferred tax assets, net of valuation allowance | $ | 20,718 | $ | 23,886 | ||||
Deferred tax liabilities: | ||||||||
Property, plant and equipment | $ | 11,644 | $ | 9,418 | ||||
Intangibles | 43,854 | 46,915 | ||||||
Total deferred tax liabilities | $ | 55,498 | $ | 56,333 | ||||
Net deferred tax liabilities | $ | (34,780 | ) | $ | (32,447 | ) | ||
Tax Credit Carryforwards: As of December 31, 2009,2010, the Company hashad a gross deferred tax asset for tax credit carryforwards of $709, $575$594. These credit carryforwards are subject to expiration from 2015 to 2019, if not utilized.
Federal and State net operating loss carryforwards: As a result of the SeQual acquisition, the Company acquired in excess of $37,000 of federal net operating losses and $31,800 of state net operating losses. Internal Revenue Code Section 382 will limit the use of net operating losses to $29,100 and $16,500, respectively, during the period ending 2030. The Company is presently studying the benefit of making an election under Internal Revenue Code Section 338(g) which would result in a step up in tax basis of the acquired assets in exchange for the extinguishment of the loss carryovers. The Company will make its final determination in a subsequent quarter of 2011. The resulting impact of the acquired attributes and tax basis will be recorded as an adjustment to the SeQual purchase accounting.
Foreign net operating loss carryforwards: As of December 31, 2010, cumulative foreign operating losses of $2,906 generated by the Company were available to reduce future taxable income. Approximately $2,722 of these operating losses expire inbetween 2014 through 2020 and the remainder2017. The remaining $184 can be carried forward indefinitely. In addition,The gross deferred tax asset for the Company has foreign net operating losses of $412 of which $339 expires in 2014, and the remaining $73 can be carried forward indefinitely. At December 31, 2009, the Company has established$861 is partially offset by a valuation allowance of $246 related to the foreign net operating losses.$758.
The Company has not provided for income taxes on approximately $81,231$97,262 of foreign subsidiaries’ undistributed earnings as of December 31, 2009,2010, since the earnings retained have been reinvested indefinitely by the subsidiaries. It is not practicable to estimate the additional income taxes and applicable foreign withholding taxes that would be payable on the remittance of such undistributed earnings.
The Company had net income tax payments of $24,659, $36,167 and $17,893 for the years ended December 31, 2009, 2008 and 2007, respectively.
On January 1, 2007, the Company adopted the new standards that specify the accounting for uncertainty in income taxes. The Company recognizes the financial statement benefit of a tax position only after determining that the relevant tax authority would more likely than not sustain the position following an audit. For tax positions meeting the more likely than not threshold, the amount recognized in the financial statements is the largest benefit that has a greater than 50 percent likelihood of being realized upon ultimate settlement with the relevant tax authority. At the adoption date, the Company applied the new accounting standards to all tax positions for which the statute of limitations remained open. As a result of the implementation, the Company did not recognize material adjustments in the liability for unrecognized tax benefits.
The reconciliation of beginning to ending unrecognized tax benefits is as follows:
| Year Ended December 31, | ||||||||
| 2009 | 2008 | |||||||
Unrecognized tax benefits at beginning of the year | $ | 1,903 | $ | 3,729 | ||||
Additions based on tax positions related to the current year | — | — | ||||||
Additions for tax positions of prior years | 22 | 22 | ||||||
Reductions for tax positions of prior years | (22 | ) | (1,268 | ) | ||||
Settlements | — | (490 | ) | |||||
Lapse of statutes of limitation | (433 | ) | (90 | ) | ||||
Unrecognized tax benefits at end of the year | $ | 1,470 | $ | 1,903 | ||||
F-22
CHART INDUSTRIES, INC. AND SUBSIDIARIES
NOTES TO CONSOLIDATED FINANCIAL STATEMENTS—(Continued)
(Dollars and shares in thousands, except per share amounts)
The Company had net income tax payments of $15,266, $24,659 and $36,167 for the years ended December 31, 2010, 2009 and 2008, respectively.
The reconciliation of beginning to ending unrecognized tax benefits is as follows:
| Year Ended December 31, | ||||||||
| 2010 | 2009 | |||||||
Unrecognized tax benefits at beginning of the year | $ | 1,470 | $ | 1,903 | ||||
Additions for tax positions of prior years | 2,170 | 22 | ||||||
Reductions for tax positions of prior years | (22 | ) | (22 | ) | ||||
Lapse of statutes of limitation | (1,150 | ) | (433 | ) | ||||
Unrecognized tax benefits at end of the year | $ | 2,468 | $ | 1,470 | ||||
The amount of unrecognized tax benefits as of December 31, 20092010 was $1,470.$2,468. This amount, if ultimately recognized, will reduce the Company’s annual effective tax rate.
The Company recognizes interest and penalties related to uncertain tax positions in income tax expense. The Company had accrued approximately $192$53 for the payment of interest and penalties at December 31, 2009.2010. The Company accrued approximately $51$50 and $80$51 for the years ended December 31, 20092010 and 2008,2009, respectively, in additional interest associated with uncertain tax positions.
The Company is subject to income taxes in the U.S. federal jurisdiction, and various states and foreign jurisdictions. Tax regulations within each jurisdiction are subject to the interpretation of the related tax laws and regulations and require significant judgment to apply. With few exceptions, the Company is no longer subject to U.S. federal, state and local or non-U.S. income tax examinations by tax authorities for years prior to 2005.
The Internal Revenue Service (“IRS”) completedcommenced an examination of the Company’s U.S. income tax return for 2008 during 2010. In addition, the IRS is examining the 2005 and 2006 amended returns for 2004 and 2005that were filed. The Company expects the examinations to be completed during 2008. As a result2011. Due to the potential resolution of the completionfederal examination and the expiration of the audit, the Company’s unrecognized tax benefits decreased by $1,379 in 2008 which included an income tax benefitvarious statutes of $230. The Company also completed state audits during 2008 which decreased the Company’s unrecognized tax benefit by $326. There are currently no on-going tax examinations nor were any completed during 2009. Itlimitation, it is reasonably possible the Company’s unrecognized tax benefits at December 31, 20092010 may decrease within the next twelve months by approximately $1,150.$1,318.
NOTE G — Employee Benefit Plans
The Company has one defined benefit pension plan which is frozen, that covers certain U.SU.S. hourly and salary employees. The defined benefit plan provides benefits based primarily on the participants’ years of service and compensation.
The following table sets forth the components of net periodic pension expense (benefit) for the years ended December 31, 2010, 2009 2008 and 2007.2008.
| Year Ended December 31, | Year Ended December 31, | |||||||||||||||||||||||
| 2009 | 2008 | 2007 | 2010 | 2009 | 2008 | |||||||||||||||||||
Interest cost | $ | 2,397 | $ | 2,332 | $ | 2,121 | $ | 2,447 | $ | 2,397 | $ | 2,332 | ||||||||||||
Expected return on plan assets | (1,827 | ) | (2,878 | ) | (2,779 | ) | (2,353 | ) | (1,827 | ) | (2,878 | ) | ||||||||||||
Amortization of net loss (gain) | 678 | — | (9 | ) | 269 | 678 | — | |||||||||||||||||
Total pension expense (benefit) | $ | 1,248 | $ | (546 | ) | $ | (667 | ) | $ | 363 | $ | 1,248 | $ | (546 | ) | |||||||||
F-23
CHART INDUSTRIES, INC. AND SUBSIDIARIES
NOTES TO CONSOLIDATED FINANCIAL STATEMENTS—(Continued)
(Dollars and shares in thousands, except per share amounts)
The following table sets forth changes in the projected benefit obligation and plan assets, the funded status of the plans and the amounts recognized in the consolidated balance sheet:
| December 31, 2009 | December 31, 2008 | December 31, 2010 | December 31, 2009 | |||||||||||||
Change in projected benefit obligation: | ||||||||||||||||
January 1 projected benefit obligation | $ | 40,740 | $ | 39,742 | $ | 41,627 | $ | 40,740 | ||||||||
Interest cost | 2,397 | 2,332 | 2,447 | 2,397 | ||||||||||||
Benefits paid | (1,387 | ) | (1,215 | ) | (1,568 | ) | (1,387 | ) | ||||||||
Actuarial (gains) | (123 | ) | (119 | ) | ||||||||||||
Actuarial losses (gains) | 2,187 | (123 | ) | |||||||||||||
December 31 projected benefit obligation | $ | 41,627 | $ | 40,740 | $ | 44,693 | $ | 41,627 | ||||||||
Change in plan assets: | ||||||||||||||||
Fair value at January 1 | $ | 25,535 | $ | 35,577 | $ | 30,981 | $ | 25,535 | ||||||||
Actual return | 5,911 | (8,998 | ) | 3,261 | 5,911 | |||||||||||
Employer contributions | 922 | 171 | 536 | 922 | ||||||||||||
Benefits paid | (1,387 | ) | (1,215 | ) | (1,568 | ) | (1,387 | ) | ||||||||
Fair value at December 31 | $ | 30,981 | $ | 25,535 | $ | 33,210 | $ | 30,981 | ||||||||
The funded status of the pension plans was as follows: | ||||||||||||||||
Funded status (plan assets less than projected benefit obligations) | $ | (10,646 | ) | $ | (15,205 | ) | $ | (11,483 | ) | $ | (10,646 | ) | ||||
Unrecognized actuarial loss | 7,198 | 12,074 | 8,208 | 7,198 | ||||||||||||
Net amount recognized | $ | (3,448 | ) | $ | (3,131 | ) | $ | (3,275 | ) | $ | (3,448 | ) | ||||
At December 31, 20092010 and 2008,2009, the Company recorded unrecognized actuarial gainslosses (gains) of $4,206$1,280 and losses of $11,758$(4,206) in accumulated other comprehensive income, respectively.
The actuarial assumptions used in determining the funded status information and subsequent net periodic pension cost are as follows:
| Year Ended December 31, | Year Ended December 31, | ||||||||||||||||||||
| 2009 | 2008 | 2007 | 2010 | 2009 | 2008 | ||||||||||||||||
United States Plans | |||||||||||||||||||||
Discount rate | 6.00 | % | 6.00 | % | 6.00 | % | 5.50 | % | 6.00 | % | 6.00 | % | |||||||||
Expected long-term weighted average rate of return on plan assets | 7.75 | % | 7.25 | % | 8.25 | % | 7.75 | % | 7.75 | % | 7.25 | % | |||||||||
The discount rate reflects the current rate at which the pension liabilities could be effectively settled at year end. In estimating this rate, the Company looks to rates of return on high quality, fixed-income investments that receive one of the two highest ratings given by a recognized rating agency and the expected timing of benefit payments under the plan.
The expected long-term weighted average rate of return on plan assets was established using the Company’s target asset allocation for equity and debt securities and the historical average rates of return for equity and debt securities. The Company employs a total return investment approach whereby a mix of equities and fixed income investments are used to maximize the long-term return of plan assets for a prudent level of risk. Risk tolerance is established through careful consideration of short and long-term plan liabilities, plan funded status and corporate financial condition. The investment portfolio contains a diversified blend of equity and fixed-income investments. Furthermore, equity investments are diversified across U.S. and non-U.S. stocks, as well as growth, value, and small and large capitalizations. Investment risk is measured and monitored on an ongoing basis
F-24
CHART INDUSTRIES, INC. AND SUBSIDIARIES
NOTES TO CONSOLIDATED FINANCIAL STATEMENTS—(Continued)
(Dollars and shares in thousands, except per share amounts)
value, and small and large capitalizations. Investment risk is measured and monitored on an ongoing basis through quarterly investment portfolio reviews, annual liability measurements and periodic asset/liability studies. The Company’s plan assets are valued using Level 1 inputs which are the quoted prices for the investments in active markets.
The Company’s pension plan weighted-average actual (which is periodically rebalanced) and target asset allocations by asset category at December 31 are as follows:
| Actual | Actual | ||||||||||||||||||||
| Target | 2009 | 2008 | Target | 2010 | 2009 | ||||||||||||||||
Stocks | 55 | % | 47 | % | 44 | % | 55 | % | 57 | % | 47 | % | |||||||||
Fixed income funds | 43 | % | 51 | % | 53 | % | 43 | % | 41 | % | 51 | % | |||||||||
Cash and cash equivalents | 2 | % | 2 | % | 3 | % | 2 | % | 2 | % | 2 | % | |||||||||
Total | 100 | % | 100 | % | 100 | % | 100 | % | 100 | % | 100 | % | |||||||||
The Company’s funding policy is to contribute at least the minimum funding amounts required by law. Based upon current actuarial estimates, the Company expects to contribute $536$2,176 to its defined benefit pension plan in 20102011 and expects the following benefit payments to be paid by the plan:
2010 | $ | 1,691 | |||||
2011 | 1,823 | $ | 1,790 | ||||
2012 | 1,970 | 1,925 | |||||
2013 | 2,121 | 2,091 | |||||
2014 | 2,231 | 2,189 | |||||
2015 | 2,350 | ||||||
In aggregate during five years thereafter | 13,466 | 13,829 | |||||
| $ | 23,302 | $ | 24,174 | ||||
The Company presently makes contributions to one bargaining unit supported multi-employer pension plan resulting in expense of $391, $525 $620 and $476$620 for the years ended December 31, 2010, 2009 2008 and 2007,2008, respectively.
The Company has a defined contribution savings plan that covers most of its U.S. employees. Company contributions to the plan are based on employee contributions, and a Company match and discretionary contributions. Expenses under the plan totaled $4,949, $5,015 $5,059 and $4,399$5,059 for the years ended December 31, 2010, 2009 2008 and 2007,2008, respectively.
NOTE H — Stock Option Plans
Under the Amended and Restated 2005 Stock Incentive Plan (“Stock Incentive Plan”) which became effective in October 2005, the Company maycould grant stock options, stock appreciation rights (“SARs”), restricted stock units (“RSUs”), stock awards and performance based stock awards to employees and directors. A maximumThe Stock Incentive Plan reserved 3,421 for issuance. As of 3,421 shares of the Company’s commonDecember 31, 2010, 1,336 options and 248 performance based stock may be issued for grantsawards were outstanding under the Stock Incentive Plan. As of December 31, 2009, the Stock Incentive Plan isThe Company no longer being utilized for grant issuance and a new plan,grants stock options or awards under this plan.
Under the 2009 Omnibus Equity Plan (“Omnibus Equity Plan”), which was approved by the shareholders at thein May 2009, Annual Meeting. Under the Omnibus Equity Plan, the Company may grant stock options, SARs, RSUs, restricted stock, performance shares and common shares.shares to employees and directors. The maximum number of shares available for grant is 1,250, which may be treasury shares or unissued shares. As of December 31, 2010, 244 options and 186 restricted stock awards were outstanding under the Omnibus Equity Plan.
F-25
CHART INDUSTRIES, INC. AND SUBSIDIARIES
NOTES TO CONSOLIDATED FINANCIAL STATEMENTS—(Continued)
(Dollars and shares in thousands, except per share amounts)
The Company recognized stock-based compensation of $4,933, $3,279 $3,134 and $9,029$3,134 for the years ended December 31, 2010, 2009 2008 and 2007,2008, respectively. The Company also recognized related tax benefits of $796, $30 $1,435 and $4,323$1,435 for the years ended December 31, 2010, 2009 and 2008, and 2007, respectively. On June 12, 2007, the Company completed its secondary stock offering in which First Reserve Fund X, L.P. achieved a return on its investment that caused 82% of the performance-based options that were granted in 2005 and 2006 to vest as specified in the Stock Incentive Plan. As a result of the vesting, the Company recorded $6,211 in stock-based compensation expense in the second quarter of 2007. As of December 31, 2009,2010, total share-based compensation of $2,106$3,571 is expected to be recognized over the remaining weighted average period of approximately 1.71.6 years.
Stock Options
Under the terms of the Omnibus Equity Plan and the Stock Incentive Plan, stock options generally have either a 4 or 5 year graded vesting period, an exercise price equal to the fair market value of a share of common stock on the date of grant, and a contractual term of 10 years.
The following table summarizes the Company’s stock option activity for the years ended December 31, 20092010 and 2008:2009:
| December 31, 2009 | December 31, 2008 | December 31, 2010 | December 31, 2009 | |||||||||||||||||||||||||
| Number of Shares | Weighted Average Exercise Price | Number of Shares | Weighted Average Exercise Price | Number of Shares | Weighted Average Exercise Price | Number of Shares | Weighted Average Exercise Price | |||||||||||||||||||||
Outstanding at beginning of period | 1,431 | $ | 10.82 | 1,498 | $ | 8.93 | 1,491 | $ | 10.39 | 1,431 | $ | 10.82 | ||||||||||||||||
Granted | 201 | 11.00 | 116 | 30.95 | 250 | 17.27 | 201 | 11.00 | ||||||||||||||||||||
Exercised | (64 | ) | 11.63 | (178 | ) | 7.45 | (143 | ) | 7.42 | (64 | ) | 11.63 | ||||||||||||||||
Expired or forfeited | (77 | ) | 18.99 | (5 | ) | 29.75 | (17 | ) | 17.35 | (77 | ) | 18.99 | ||||||||||||||||
Outstanding at end of period | 1,491 | $ | 10.39 | 1,431 | $ | 10.82 | 1,581 | $ | 11.68 | 1,491 | $ | 10.39 | ||||||||||||||||
Exercisable at end of year* | 1,040 | $ | 8.67 | 985 | $ | 7.82 | 1,118 | $ | 9.46 | 1,040 | $ | 8.67 | ||||||||||||||||
Participants at end of year | 59 | 58 | 65 | 59 | ||||||||||||||||||||||||
Available for future grants at end of year | 1,250 | 797 | 795 | 1,250 | ||||||||||||||||||||||||
* Remaining contractual term of 6.1 years
| * | Remaining contractual term of 5.3 years |
The total fair value of options vested was $1,755, $1,421 $1,257 and $7,027$1,257 for the years ended December 31, 2010, 2009 2008 and 2007,2008, respectively. The total intrinsic value of options exercised during the years ended December 31, 2010, 2009 and 2008 was $3,327, $594 and 2007 was $594, $5,406, and $15,281, respectively.
The Company uses a Black-Scholes option pricing model to estimate the fair value of stock options. The expected volatility and expected term of the options are based on historical information. The risk free rate is based on the U.S. Treasury yield in effect at the time of the grant.
Weighted average grant date fair values of stock options and the assumptions used in estimating the fair values are as follows:
F-26
| 2010 | 2009 | 2008 | ||||||||||
Weighted average grant date fair value | $ | 12.03 | $ | 11.02 | $ | 30.95 | ||||||
Expected term (years) | 6.25 | 6.25 | 6.25 | |||||||||
Risk-free interest rate | 2.46 | % | 2.07 | % | 3.54 | % | ||||||
Expected volatility | 77.84 | % | 74.87 | % | 47.88 | % | ||||||
F-27
CHART INDUSTRIES, INC. AND SUBSIDIARIES
NOTES TO CONSOLIDATED FINANCIAL STATEMENTS—(Continued)
(Dollars and shares in thousands, except per share amounts)
Weighted average grant date fair values of stock options and the assumptions used in estimating the fair values are as follows:
| 2009 | 2008 | 2007 | ||||||||||
Weighted average grant date fair value | $ | 11.02 | $ | 30.95 | $ | 14.60 | ||||||
Expected term (years) | 6.25 | 6.25 | 7.19 | |||||||||
Risk-free interest rate | 2.07 | % | 3.54 | % | 4.99 | % | ||||||
Expected volatility | 74.87 | % | 47.88 | % | 49.00 | % | ||||||
Performance Stock Awards
The Company granted 164 107 and 72107 performance share units under the Stock Incentive Plan during 2009 2008 and 2007,2008, respectively. The performance share units granted in 2009 and 2008 are earned over a 3 year period beginning on January 1, 2009 and 2008, respectively and the performance share units granted in 2007 were earned over a 2.5 year period beginning July 1, 2007.respectively. Total units earned may vary between 0% and 150% of the units granted based on the attainment of pre-determined performance and market condition targets as determined by the Board of Directors. The 2007 performance share units met the minimum threshold for the performance targets; therefore, 14 units were earned. The Company valuesvalued these performance stock awards based on market conditions using a Monte Carlo Simulation model that iswas performed by an outside valuation firm. The fair value of the performance based units iswas calculated using a Black-Scholes model and the probability of any units being earned is evaluated each reporting period. The weighted average per share fair values were $5.26 $29.22 and $25.51$29.22 for the 2009 2008 and 20072008 grants, respectively.
Other
In 2010, 2009 and 2008, the Company granted the non-employee directors stock awards covering 18, 24 and 7 shares, respectively, of common stock that had fair market values of $330, $300 and $250. The stock awards were fully vested on the date of grant. In 2007, the Company granted restricted stock units covering 10 shares of common stock to non-employee directors. Each of the six grants had a fair market value of $40 on the date of grant. Restricted stock units for 7 shares were forfeited during 2007 upon the resignation of three directors. The Company recorded $330, $300, $321, and $234$321 of compensation expense for the years ended December 31, 2010, 2009 and 2008, and 2007, respectively.
In 2010, the Company also granted 192 restricted stock awards which vest ratably over a three year period. The weighted average fair value of the grants was $17.85. The Company recorded $1,162 of compensation expense in 2010.
NOTE I — Lease Commitments
The Company incurred $8,481, $7,221, $7,165, and $6,477$7,165 of rental expense under operating leases for the years ended December 31, 2010, 2009 2008 and 2007,2008, respectively. Certain leases contain rent escalation clauses and lease concessions that require additional rental payments in the later years of the term. Rent expense for these types of leases is recognized on a straight-line basis over the minimum lease term. In addition, the Company has the right, but no obligation, to renew certain leases for various renewal terms. At December 31, 2009,2010, future minimum lease payments for non-cancelable operating leases for the next five years total $25,775$23,917 and are payable as follows: 2010 — $6,591; 2011 — $5,343;$6,671; 2012 — $4,027;$4,666; 2013 — $3,701; and$4,078; 2014 — $3,216$2,965; and 2015 — $1,844 and thereafter — $2,897.
F-27
CHART INDUSTRIES, INC. AND SUBSIDIARIES
NOTES TO CONSOLIDATED FINANCIAL STATEMENTS—(Continued)
(Dollars and shares in thousands, except per share amounts)
$3,693.
NOTE J — Contingencies
Environmental
The Company is subject to federal, state and local environmental laws and regulations concerning, among other matters, waste water effluents, air emissions and handling and disposal of hazardous materials such as cleaning fluids. The Company is involved with environmental compliance, investigation, monitoring and remediation activities at certain of its owned and formerly owned manufacturing facilities and at one owned facility that is leased to a third party, and, except for these continuing remediation efforts, believes it is currently in substantial compliance with all known environmental regulations. At December 31, 20092010 and 2008,2009, the Company had undiscounted accrued environmental reserves of $6,462$6,355 and $6,697,$6,462, respectively, recorded in other long-term liabilities. The Company accrues for certain environmental remediation-related activities for which commitments or remediation plans have been developed and for which costs can be reasonably estimated. These estimates are determined based upon currently available facts and circumstances regarding each facility. Actual costs incurred may vary from these estimates due to the inherent uncertainties involved. Future expenditures relating to these environmental remediation efforts are expected to be made over the next 1817 years as ongoing costs of remediation programs.
F-28
CHART INDUSTRIES, INC. AND SUBSIDIARIES
NOTES TO CONSOLIDATED FINANCIAL STATEMENTS—(Continued)
(Dollars and shares in thousands, except per share amounts)
Although the Company believes it has adequately provided for the cost of all known environmental conditions, the applicable regulatory agencies could insist upon different and more costly remediation than those the Company believes are adequate or required by existing law or third parties may seek to impose environmental liabilities on the Company. The Company believes that any additional liability in excess of amounts accrued which may result from the resolution of such matters will not have a material adverse effect on the Company’s financial position, liquidity, cash flows or results of operations.
CHEL
In March 2003, the Company completed the closure of its Wolverhampton, United Kingdom manufacturing facility, operated by the Company’s former Chart Heat Exchanger Limited (“CHEL”) subsidiary. In March 2003, CHEL filed for a voluntary administration under the United Kingdom (“U.K.”) Insolvency Act of 1986. CHEL’s application for voluntary administration was approved on April 1, 2003, an administrator was appointed and CHEL was no longer consolidated. Additionally, the Company received information that indicated that CHEL’s net pension plan obligations had increased significantly primarily due to a decline in plan asset values and interest rates as well as increased plan liabilities, resulting in a significant plan deficit as of March 2003. Based on the Company’s financial condition in March 2003, it determined not to advance funds to CHEL to fund CHEL’s obligations. Since CHEL was unable to fund its net pension deficit, the trustees of the CHEL pension plan requested a decision to wind-up the plan from a U.K. pension regulatory board. That board approved the wind-up as of March 28, 2003.
For the year ended December 31, 2008, the Company recognized a $6.5 million benefit as a result of reversing contingent liabilities that were previously established for potential secondary pension and severance obligations related to CHEL. Based on events that occurred during 2008, including actions taken by a U.K. governmental agency to support a large portion of the pension obligations after the insolvent former subsidiary had made distributions to satisfy significant portions of its obligations, the contingent liabilities were no longer considered to be probable and were reversed.
Legal Proceedings
The Company is occasionally subject to various legal actions related to performance under contracts, product liability, taxes, employment matters, environmental matters, intellectual property and other matters
F-28
CHART INDUSTRIES, INC. AND SUBSIDIARIES
NOTES TO CONSOLIDATED FINANCIAL STATEMENTS—(Continued)
(Dollars and shares in thousands, except per share amounts)
incidental to the normal course of its business. Based on the Company’s historical experience in litigating these actions, as well as the Company’s current assessment of the underlying merits of the actions and applicable insurance, if any, management believes that the final resolution of these matters will not have a material adverse affect on the Company’s financial position, liquidity, cash flows or results of operations. Future developments may, however, result in resolution of these legal claims in a way that could have a material adverse effect.
NOTE K — Reporting Segments
The Company’s structure of itsthe Company’s internal organization is divided into the following three reportable segments: Energy and Chemicals (“E&C”), Distribution and Storage (“D&S”) and BioMedical. The Company’s reportable segments are business units that offer different products. The reportable segments are each managed separately because they manufacture, offer and distribute distinct products with different production processes and sales and marketing approaches. The EnergyE&C segment sells brazed aluminum and Chemicals segment sellsair-cooled heat exchangers, cold boxes and liquefied natural gas vacuum insulatedvacuum-insulated pipe to natural gas, petrochemical processing and industrial gas companies who use them for the liquefaction and separation of natural and industrial gases. The Distribution and StorageD&S segment sells cryogenic bulk storage systems, cryogenic packaged gas systems, cryogenic systems and components, beverage liquid COCO2 systems,
F-29
CHART INDUSTRIES, INC. AND SUBSIDIARIES
(2)NOTES TO CONSOLIDATED FINANCIAL STATEMENTS—(Continued)
(Dollars and shares in thousands, except per share amounts)
cryogenic flow meter systems and cryogenic services to various companies for the storage and transportation of both industrial and natural gases. The BioMedical segment sells medical respiratory products, and biological storage systems.systems and other oxygen products. Due to the nature of the products that each operating segment sells, there are no inter-segmentintersegment sales. Corporate includes operating expenses for executive management, accounting, tax, treasury, human resources, information technology, legal, internal audit, risk management and stock-based compensation expenseexpenses that are not allocated to the reportablereporting segments.
The Company evaluates performance and allocates resources based on operating income or loss from continuing operations before net interest expense, financing costs amortization expense, derivative contracts valuation expense, foreign currency gain or loss, income taxes and noncontrolling interest. The accounting policies of the reportable segments are the same as those described in the summary of significant accounting policies.
| Year Ended December 31, 2009 | Year Ended December 31, 2010 | |||||||||||||||||||||||||||||||||||
| Reportable Segments | Reportable Segments | |||||||||||||||||||||||||||||||||||
| Energy and Chemicals | Distribution and Storage | BioMedical | Corporate | Total | Energy and Chemicals | Distribution and Storage | BioMedical | Corporate | Total | |||||||||||||||||||||||||||
Sales from external customers | $ | 254,920 | $ | 247,044 | $ | 89,552 | $ | — | $ | 591,516 | $ | 137,801 | $ | 269,293 | $ | 148,361 | $ | — | $ | 555,455 | ||||||||||||||||
Depreciation and amortization expense | 7,335 | 10,104 | 3,591 | 382 | 21,412 | 7,338 | 10,474 | 5,197 | 568 | 23,577 | ||||||||||||||||||||||||||
Operating income (loss) | 61,852 | 39,888 | 15,912 | (23,318 | ) | 94,334 | 6,121 | 41,934 | 30,698 | (31,249 | ) | 47,504 | ||||||||||||||||||||||||
Total assets(B)(C) | 205,482 | 486,620 | 135,977 | 98,424 | 926,503 | 188,407 | 513,215 | 227,138 | 26,079 | 954,839 | ||||||||||||||||||||||||||
Capital expenditures | 2,707 | 7,168 | 2,022 | 1,293 | 13,190 | 973 | 8,563 | 4,594 | 2,809 | 16,939 | ||||||||||||||||||||||||||
| Year Ended December 31, 2008 | Year Ended December 31, 2009 | |||||||||||||||||||||||||||||||||||
| Reportable Segments | Reportable Segments | |||||||||||||||||||||||||||||||||||
| Energy and Chemicals | Distribution and Storage | BioMedical | Corporate | Total | Energy and Chemicals | Distribution and Storage | BioMedical | Corporate | Total | |||||||||||||||||||||||||||
Sales from external customers | $ | 312,502 | $ | 335,916 | $ | 95,945 | $ | — | $ | 744,363 | $ | 255,074 | $ | 252,197 | $ | 90,187 | $ | — | $ | 597,458 | ||||||||||||||||
Depreciation and amortization expense | 7,475 | 10,613 | 2,793 | 432 | 21,313 | 7,335 | 10,104 | 3,591 | 382 | 21,412 | ||||||||||||||||||||||||||
Operating income (loss) | 70,752 | 63,770 | 20,742 | (21,911 | ) | 133,353 | 61,852 | 39,888 | 15,912 | (23,318 | ) | 94,334 | ||||||||||||||||||||||||
Total assets(B)(D) | 242,054 | 475,448 | 99,446 | 92,479 | 909,427 | 205,482 | 486,620 | 135,977 | 98,424 | 926,503 | ||||||||||||||||||||||||||
Capital expenditures | 3,123 | 8,535 | 2,257 | 53 | 13,968 | 2,707 | 7,168 | 2,022 | 1,293 | 13,190 | ||||||||||||||||||||||||||
F-29
CHART INDUSTRIES, INC. AND SUBSIDIARIES
NOTES TO CONSOLIDATED FINANCIAL STATEMENTS—(Continued)
(Dollars and shares in thousands, except per share amounts)
| Year Ended December 31, 2007 | Year Ended December 31, 2008 | |||||||||||||||||||||||||||||||||||
| Reportable Segments | Reportable Segments | |||||||||||||||||||||||||||||||||||
| Energy and Chemicals | Distribution and Storage | BioMedical | Corporate | Total | Energy and Chemicals | Distribution and Storage | BioMedical | Corporate | Total | |||||||||||||||||||||||||||
Sales from external customers | $ | 253,672 | $ | 322,565 | $ | 90,158 | $ | — | $ | 666,395 | $ | 312,683 | $ | 343,703 | $ | 96,700 | $ | — | $ | 753,086 | ||||||||||||||||
Employee separation and plant closure costs (benefit) | — | 304 | — | — | 304 | |||||||||||||||||||||||||||||||
Depreciation and amortization expense | 6,710 | 9,170 | 2,590 | 236 | 18,706 | 7,475 | 10,613 | 2,793 | 432 | 21,313 | ||||||||||||||||||||||||||
Operating income (loss) | 33,821 | 66,167 | 17,788 | (32,595 | ) | 85,181 | ||||||||||||||||||||||||||||||
Operating income (loss)(A) | 70,752 | 63,770 | 20,742 | (21,911 | ) | 133,353 | ||||||||||||||||||||||||||||||
Total assets(B)(E) | 236,991 | 423,247 | 104,623 | 60,893 | 825,754 | 242,054 | 475,448 | 99,446 | 92,479 | 909,427 | ||||||||||||||||||||||||||
Capital expenditures | 6,955 | 9,714 | 1,932 | 427 | 19,028 | 3,123 | 8,535 | 2,257 | 53 | 13,968 | ||||||||||||||||||||||||||
| (A) | Corporate operating income for the year ended December 31, 2008 includes a reversal of contingent liabilities related to an insolvent former subsidiary of $6,514. |
| (B) | Corporate assets at December 31, 2010, 2009 |
F-30
CHART INDUSTRIES, INC. AND SUBSIDIARIES
NOTES TO CONSOLIDATED FINANCIAL STATEMENTS—(Continued)
(Dollars and shares in thousands, except per share amounts)
| (C) | Total assets at December 31, 2010 include goodwill of $83,215, $148,010 and $44,027 for the Energy and Chemicals, Distribution and Storage and BioMedical segments, respectively. |
| (D) | Total assets at December 31, 2009 include goodwill of $83,215, $144,290 and $37,027 for the Energy and Chemicals, Distribution and Storage and BioMedical segments, respectively. |
| Total assets at December 31, 2008 include goodwill of $81,979, $144,060 and $35,470 |
A reconciliation of the total of the reportable segments’ operating income to consolidated income before income taxes and minority interest is presented below:
| Year Ended December 31, | Year Ended December 31, | |||||||||||||||||||||
| 2009 | 2008 | 2007 | 2010 | 2009 | 2008 | |||||||||||||||||
Operating income | $ | 94,334 | $ | 133,353 | $ | 85,181 | $ | 47,504 | $ | 94,334 | $ | 133,353 | ||||||||||
Other expense (income): | ||||||||||||||||||||||
Interest expense, net | 15,817 | 17,953 | 22,174 | 16,196 | 15,817 | 17,953 | ||||||||||||||||
Amortization of deferred financing costs | 1,616 | 1,857 | 1,646 | 3,063 | 1,616 | 1,857 | ||||||||||||||||
Gain on acquisition of business | (6,954 | ) | — | — | (1,124 | ) | (6,954 | ) | — | |||||||||||||
Foreign currency loss (gain) | (687 | ) | 3,948 | 42 | 871 | (687 | ) | 3,948 | ||||||||||||||
Income before income taxes and minority interest | $ | 84,542 | $ | 109,595 | $ | 61,319 | $ | 28,498 | $ | 84,542 | $ | 109,595 | ||||||||||
| Year Ended December 31, | ||||||||||||
| 2010 | 2009 | 2008 | ||||||||||
Product Sales Information: | ||||||||||||
Energy and Chemicals Segment | ||||||||||||
Heat exchangers | $ | 113,313 | $ | 172,374 | $ | 197,857 | ||||||
Cold boxes and LNG VIP | 24,488 | 82,700 | 114,826 | |||||||||
| $ | 137,801 | $ | 255,074 | 312,683 | ||||||||
Distribution and Storage Segment | ||||||||||||
Cryogenic bulk storage systems | $ | 117,907 | $ | 135,523 | $ | 167,170 | ||||||
Cryogenic packaged gas systems and beverage liquid CO2 systems | 103,129 | 80,278 | 125,448 | |||||||||
Cryogenic systems and components | 20,221 | 10,987 | 19,382 | |||||||||
Cryogenic services | 28,036 | 25,409 | 31,703 | |||||||||
| $ | 269,293 | $ | 252,197 | 343,703 | ||||||||
BioMedical Segment | ||||||||||||
Medical respiratory products | $ | 95,666 | $ | 41,793 | $ | 37,341 | ||||||
Biological storage systems | 52,695 | 43,966 | 47,315 | |||||||||
MRI components and other | — | 4,428 | 12,044 | |||||||||
| 148,361 | 90,187 | 96,700 | ||||||||||
Total Sales | $ | 555,455 | $ | 597,458 | $ | 753,086 | ||||||
F-30
CHART INDUSTRIES, INC. AND SUBSIDIARIES
NOTES TO CONSOLIDATED FINANCIAL STATEMENTS—(Continued)
(Dollars and shares in thousands, except per share amounts)
| Year Ended December 31, | |||||||||
| 2009 | 2008 | 2007 | |||||||
Product Sales Information: | |||||||||
Energy and Chemicals Segment | |||||||||
Heat exchangers | $ | 172,374 | $ | 197,857 | $ | 155,822 | |||
Cold boxes and LNG VIP | 82,546 | 114,645 | 97,850 | ||||||
| $ | 254,920 | 312,502 | 253,672 | ||||||
Distribution and Storage Segment | |||||||||
Cryogenic bulk storage systems | $ | 133,045 | $ | 164,165 | $ | 166,702 | |||
Cryogenic packaged gas systems and beverage liquid CO(2) systems | 79,134 | 123,698 | 118,216 | ||||||
Cryogenic systems and components | 10,789 | 19,060 | 12,654 | ||||||
Cryogenic services | 24,076 | 28,993 | 24,993 | ||||||
| $ | 247,044 | 335,916 | 322,565 | ||||||
BioMedical Segment | |||||||||
Medical products and biological storage systems | $ | 85,124 | $ | 83,901 | $ | 77,866 | |||
MRI components and other | 4,428 | 12,044 | 12,292 | ||||||
| 89,552 | 95,945 | 90,158 | |||||||
Total Sales | $ | 591,516 | $ | 744,363 | $ | 666,395 | |||
| Year Ended December 31, 2009 | Year Ended December 31, 2008 | Year Ended December 31, 2007 | Year Ended December 31, 2010 | Year Ended December 31, 2009 | Year Ended December 31, 2008 | ||||||||||||||||||||||||||||||
Geographic Information: | Sales | Long-Lived Assets | Sales | Long-Lived Assets | Sales | Sales | Long-Lived Assets | Sales | Long-Lived Assets | Sales | |||||||||||||||||||||||||
United States | $ | 438,379 | $ | 356,612 | $ | 539,321 | $ | 352,990 | $ | 484,427 | $ | 391,691 | $ | 391,428 | $ | 441,583 | $ | 356,612 | $ | 544,822 | |||||||||||||||
Czech Republic | 77,900 | 87,348 | 113,836 | 87,079 | 96,925 | 72,486 | 86,680 | 79,865 | 87,348 | 116,289 | |||||||||||||||||||||||||
China | 45,203 | 69,243 | 28,641 | 67,791 | 38,995 | ||||||||||||||||||||||||||||||
Other Non-U.S. Countries | 75,237 | 68,139 | 91,206 | 60,070 | 85,043 | 46,075 | 1,392 | 47,369 | 348 | 52,980 | |||||||||||||||||||||||||
Total | $ | 591,516 | $ | 512,099 | $ | 744,363 | $ | 500,139 | $ | 666,395 | $ | 555,455 | $ | 548,743 | $ | 597,458 | $ | 512,099 | $ | 753,086 | |||||||||||||||
Note L — Quarterly Data (Unaudited)
Selected quarterly data for the years ended December 31, 20092010 and 20082009 are as follows:
| Year Ended December 31, 2009 | Year Ended December 31, 2010 | |||||||||||||||||||||||||||||||||||
| First Quarter | Second Quarter | Third Quarter | Fourth Quarter | Total | First Quarter | Second Quarter | Third Quarter | Fourth Quarter | Total | |||||||||||||||||||||||||||
Sales | $ | 180,192 | $ | 155,301 | $ | 127,172 | $ | 128,851 | $ | 591,516 | $ | 118,268 | $ | 139,144 | $ | 139,205 | $ | 158,838 | $ | 555,455 | ||||||||||||||||
Gross profit | 62,666 | 55,923 | 39,374 | 43,918 | 201,881 | 34,276 | 37,575 | 42,801 | 50,647 | 165,299 | ||||||||||||||||||||||||||
Operating income | 34,081 | 29,329 | 15,964 | 14,960 | 94,334 | 7,603 | 8,563 | 13,239 | 18,099 | 47,504 | ||||||||||||||||||||||||||
Net income | 19,592 | 17,765 | 8,227 | 15,572 | 61,156 | 1,419 | 2,458 | 6,665 | 9,963 | 20,505 | ||||||||||||||||||||||||||
Net income attributable to Chart Industries, Inc. | 19,462 | 17,776 | 8,248 | 15,525 | (1) | 61,011 | 1,384 | 2,399 | (1) | 6,575 | 9,802 | 20,160 | ||||||||||||||||||||||||
Net income attributable to Chart Industries, Inc. | $ | 0.68 | $ | 0.62 | $ | 0.29 | $ | 0.54 | ||||||||||||||||||||||||||||
Net income attributable to Chart Industries, Inc. | $ | 0.68 | $ | 0.61 | $ | 0.28 | $ | 0.53 | ||||||||||||||||||||||||||||
Net income attributable to Chart Industries, Inc. per share—basic | $ | 0.05 | $ | 0.08 | $ | 0.23 | $ | 0.34 | ||||||||||||||||||||||||||||
Net income attributable to Chart Industries, Inc. per share—diluted | $ | 0.05 | $ | 0.08 | $ | 0.23 | $ | 0.33 | ||||||||||||||||||||||||||||
| Year Ended December 31, 2009 | ||||||||||||||||||||
| First Quarter | Second Quarter | Third Quarter | Fourth Quarter | Total | ||||||||||||||||
Sales | $ | 181,682 | $ | 156,586 | $ | 128,883 | $ | 130,307 | $ | 597,458 | ||||||||||
Gross profit | 62,666 | 55,923 | 39,374 | 43,918 | 201,881 | |||||||||||||||
Operating income | 34,081 | 29,329 | 15,964 | 14,960 | 94,334 | |||||||||||||||
Net income | 19,592 | 17,765 | 8,227 | 15,572 | 61,156 | |||||||||||||||
Net income attributable to Chart Industries, Inc. | 19,462 | 17,776 | 8,248 | 15,525 | (2) | 61,011 | ||||||||||||||
Net income attributable to Chart Industries, Inc. per share—basic | $ | 0.68 | $ | 0.62 | $ | 0.29 | $ | 0.54 | ||||||||||||
Net income attributable to Chart Industries, Inc. per share—diluted | $ | 0.68 | $ | 0.61 | $ | 0.28 | $ | 0.53 | ||||||||||||
| (1) | Includes $1,124 gain from the acquisition of business. |
| (2) | Includes $6,954 gain from the acquisition of business. |
F-31
CHART INDUSTRIES, INC. AND SUBSIDIARIES
NOTES TO CONSOLIDATED FINANCIAL STATEMENTS—(Continued)
(Dollars and shares in thousands, except per share amounts)
| Year Ended December 31, 2008 | ||||||||||||||||
| First Quarter | Second Quarter | Third Quarter | Fourth Quarter | Total | ||||||||||||
Sales | $ | 170,329 | $ | 197,752 | $ | 188,808 | $ | 187,474 | $ | 744,363 | ||||||
Gross profit | 51,941 | 64,000 | 66,164 | 57,283 | 239,388 | |||||||||||
Operating income | 26,208 | 34,833 | 36,654 | 35,658 | (2) | 133,353 | ||||||||||
Net income | 14,627 | 22,159 | 20,546 | 21,774 | 79,106 | |||||||||||
Net income attributable to Chart Industries, Inc. | 14,656 | 22,192 | 20,402 | 21,674 | 78,924 | |||||||||||
Net income attributable to Chart Industries, Inc. | $ | 0.52 | $ | 0.78 | $ | 0.72 | $ | 0.76 | ||||||||
Net income attributable to Chart Industries, Inc. | $ | 0.51 | $ | 0.76 | $ | 0.70 | $ | 0.75 | ||||||||
NOTE M — Supplemental Guarantor Financial Information
The Company’s Subordinated Notes issued in October 2005 are guaranteed on a full, unconditional and joint and several basis by the following wholly owned subsidiaries:subsidiaries, all of which are 100% owned: Chart Inc., CaireCAIRE Inc., Chart Energy and Chemicals, Inc., Chart Cooler Service Company, Inc., Chart International Holdings, Inc., Chart Asia, Inc. and Chart International, Inc. Chart SeQual Technologies Inc.(“Chart SeQual”), which was acquired by the Company in December 2010, is not a guarantor but is expected to become a guarantor under the Senior Credit Facility and the Indenture governing the Subordinated Notes upon execution of the required documentation during the first half of 2011. Chart SeQual represents 7% of the total assets of the guarantors as of December 31, 2010 in the following balance sheet and has an immaterial impact on the operations of the guarantors for the year ended December 31, 2010. The following subsidiaries are not guarantors of the notes:
Non-Guarantor Subsidiaries | Jurisdiction | |
Abahsain Specialized Industrial Co. Ltd. (34% owned) | Saudi Arabia | |
Changzhou CEM Cryo Equipment Co., Ltd. | China | |
Chart Asia Investment Company Ltd. | Hong Kong | |
Chart Australia Pty. Ltd. | Australia | |
Chart BioMedical Distribution LLC | Delaware | |
Chart BioMedical GmbH | Germany | |
Chart Biomedical Limited | United Kingdom | |
Chart Cryogenic Distribution Equipment (Changzhou) Co., Ltd. (50% owned) | China | |
Chart Cryogenic Engineering Systems (Changzhou) Co., Ltd. | China | |
Chart Cryogenic Equipment (Changzhou) Co., Ltd. | China | |
Chart Ferox a.s. | Czech Republic | |
Chart Ferox GmbH | Germany | |
Chart France S.A.S. | France | |
Chart Industries Luxembourg S.àr.l. | Luxembourg | |
Chart Italy S.r.l. | Italy | |
Chart Japan Co., Ltd. | Japan | |
Chengdu Golden Phoenix Liquid Nitrogen Container Company, Ltd. | China | |
Flow Instruments & Engineering GmbH | Germany | |
GTC of Clarksville, LLC | Delaware | |
Lox Taiwan (11.25% owned) | Taiwan | |
|
The following supplemental condensed consolidating and combining financial information of the Issuer (Chart Industries, Inc.), Subsidiary Guarantors and Subsidiary Non-Guarantors presents statements of operations for the years ended December 31, 2010, 2009 2008 and 2007,2008, balance sheets as of December 31, 20092010 and December 31, 2008,2009, and statements of cash flows for the years ended December 31, 2010, 2009 2008 and 2007.2008.
F-32
CHART INDUSTRIES, INC. AND SUBSIDIARIES
NOTES TO CONSOLIDATED FINANCIAL STATEMENTS—(Continued)
(Dollars and shares in thousands, except per share amounts)
CONDENSED CONSOLIDATING BALANCE SHEET
As of December 31, 20092010
| Issuer | Subsidiary Guarantors | Subsidiary Non-Guarantors | Consolidating Adjustments | Total | Issuer | Subsidiary Guarantors | Subsidiary Non-Guarantors | Consolidating Adjustments | Total | ||||||||||||||||||||||||||||
ASSETS | |||||||||||||||||||||||||||||||||||||
Cash and cash equivalents | $ | 149,596 | $ | 2,103 | $ | 59,469 | $ | — | $ | 211,168 | $ | 69,617 | $ | 2,828 | $ | 92,667 | $ | — | $ | 165,112 | |||||||||||||||||
Accounts receivable, net | — | 52,715 | 24,794 | — | 77,509 | — | 53,735 | 34,396 | — | 88,131 | |||||||||||||||||||||||||||
Inventory, net | — | 40,130 | 45,946 | (506 | ) | 85,570 | — | 56,648 | 48,455 | (668 | ) | 104,435 | |||||||||||||||||||||||||
Other current assets | 6,856 | 26,829 | 6,472 | — | 40,157 | 11,206 | 31,072 | 8,015 | (1,875 | ) | 48,418 | ||||||||||||||||||||||||||
Total current assets | 156,452 | 121,777 | 136,681 | (506 | ) | 414,404 | 80,823 | 144,283 | 183,533 | (2,543 | ) | 406,096 | |||||||||||||||||||||||||
Property, plant and equipment, net | — | 68,523 | 42,630 | — | 111,153 | — | 69,134 | 47,024 | — | 116,158 | |||||||||||||||||||||||||||
Goodwill | — | 190,902 | 73,630 | — | 264,532 | — | 202,131 | 73,121 | — | 275,252 | |||||||||||||||||||||||||||
Intangible assets, net | — | 115,222 | 8,551 | — | 123,773 | — | 136,925 | 7,361 | — | 144,286 | |||||||||||||||||||||||||||
Investments in affiliates | 279,313 | 113,908 | — | (392,146 | ) | 1,075 | 313,498 | 130,997 | — | (443,663 | ) | 832 | |||||||||||||||||||||||||
Intercompany receivables | 298,931 | — | — | (298,931 | ) | — | 358,225 | — | — | (358,225 | ) | — | |||||||||||||||||||||||||
Other assets | 6,245 | 12,321 | 4,400 | (11,400 | ) | 11,566 | 6,040 | 19,826 | 7,482 | (21,133 | ) | 12,215 | |||||||||||||||||||||||||
Total assets | $ | 740,941 | $ | 622,653 | $ | 265,892 | $ | (702,983 | ) | $ | 926,503 | $ | 758,586 | $ | 703,296 | $ | 318,521 | $ | (825,564 | ) | $ | 954,839 | |||||||||||||||
LIABILITIES AND STOCKHOLDERS’ EQUITY | |||||||||||||||||||||||||||||||||||||
Accounts payable and accruals | $ | (21,034 | ) | $ | 127,711 | $ | 37,527 | $ | (267 | ) | $ | 143,937 | $ | 2,583 | $ | 129,305 | $ | 41,999 | $ | (2,704 | ) | $ | 171,183 | ||||||||||||||
Total current liabilities | (21,034 | ) | 127,711 | 37,527 | (267 | ) | 143,937 | 2,583 | 129,305 | 41,999 | (2,704 | ) | 171,183 | ||||||||||||||||||||||||
Long-term debt | 243,175 | — | 11,400 | (11,400 | ) | 243,175 | 218,425 | — | 20,729 | (20,729 | ) | 218,425 | |||||||||||||||||||||||||
Intercompany payables | — | 203,233 | 94,862 | (298,095 | ) | — | — | 240,622 | 117,015 | (357,637 | ) | — | |||||||||||||||||||||||||
Other long-term liabilities | 41,554 | 12,396 | 8,195 | — | 62,145 | 36,204 | 19,872 | 7,781 | — | 63,857 | |||||||||||||||||||||||||||
Total liabilities | 263,695 | 343,340 | 151,984 | (309,762 | ) | 449,257 | 257,212 | 389,799 | 187,524 | (381,070 | ) | 453,465 | |||||||||||||||||||||||||
Common stock | 285 | — | — | — | 285 | 288 | — | — | — | 288 | |||||||||||||||||||||||||||
Other stockholders’ equity | 476,961 | 279,313 | 113,908 | (393,221 | ) | 476,961 | 501,086 | 313,498 | 130,997 | (444,495 | ) | 501,086 | |||||||||||||||||||||||||
Total stockholders’ equity | 477,246 | 279,313 | 113,908 | (393,221 | ) | 477,246 | 501,374 | 313,498 | 130,997 | (444,495 | ) | 501,374 | |||||||||||||||||||||||||
Total liabilities and stockholders’ equity | $ | 740,941 | $ | 622,653 | $ | 265,892 | $ | (702,983 | ) | $ | 926,503 | $ | 758,586 | $ | 703,297 | $ | 318,521 | $ | (825,565 | ) | $ | 954,839 | |||||||||||||||
F-33
CHART INDUSTRIES, INC. AND SUBSIDIARIES
NOTES TO CONSOLIDATED FINANCIAL STATEMENTS—(Continued)
(Dollars and shares in thousands, except per share amounts)
CONDENSED CONSOLIDATING BALANCE SHEET
As of December 31, 20082009
| Issuer | Subsidiary Guarantors | Subsidiary Non-Guarantors | Consolidating Adjustments | Total | Issuer | Subsidiary Guarantors | Subsidiary Non-Guarantors | Consolidating Adjustments | Total | ||||||||||||||||||||||||||||
ASSETS | |||||||||||||||||||||||||||||||||||||
Cash and cash equivalents | $ | 84,428 | $ | 2,540 | $ | 35,197 | $ | — | $ | 122,165 | $ | 149,596 | $ | 2,103 | $ | 59,469 | $ | — | $ | 211,168 | |||||||||||||||||
Short term investments | 32,264 | — | — | — | 32,264 | ||||||||||||||||||||||||||||||||
Accounts receivable, net | — | 70,872 | 20,826 | — | 91,698 | — | 52,715 | 24,794 | — | 77,509 | |||||||||||||||||||||||||||
Inventory, net | — | 52,350 | 43,855 | (815 | ) | 95,390 | — | 40,130 | 45,946 | (506 | ) | 85,570 | |||||||||||||||||||||||||
Other current assets | 8,857 | 42,201 | 16,375 | — | 67,433 | 6,856 | 26,829 | 6,472 | — | 40,157 | |||||||||||||||||||||||||||
Total current assets | 125,549 | 167,963 | 116,253 | (815 | ) | 408,950 | 156,452 | 121,777 | 136,681 | (506 | ) | 414,404 | |||||||||||||||||||||||||
Property, plant and equipment, net | — | 59,898 | 38,549 | — | 98,447 | — | 68,523 | 42,630 | — | 111,153 | |||||||||||||||||||||||||||
Goodwill | — | 189,791 | 71,718 | — | 261,509 | — | 190,902 | 73,630 | — | 264,532 | |||||||||||||||||||||||||||
Intangible assets, net | — | 124,064 | 5,478 | — | 129,542 | — | 115,222 | 8,551 | — | 123,773 | |||||||||||||||||||||||||||
Investments in affiliates | 201,709 | 86,447 | — | (287,616 | ) | 540 | 279,313 | 113,908 | — | (392,146 | ) | 1,075 | |||||||||||||||||||||||||
Intercompany receivables | 327,049 | — | — | (327,049 | ) | — | 298,931 | — | — | (298,931 | ) | — | |||||||||||||||||||||||||
Other assets | 7,860 | 966 | 1,613 | — | 10,439 | 6,245 | 12,321 | 4,400 | (11,400 | ) | 11,566 | ||||||||||||||||||||||||||
Total assets | $ | 662,167 | $ | 629,129 | $ | 233,611 | $ | (615,480 | ) | $ | 909,427 | $ | 740,941 | $ | 622,653 | $ | 265,892 | $ | (702,983 | ) | $ | 926,503 | |||||||||||||||
LIABILITIES AND STOCKHOLDERS’ EQUITY | |||||||||||||||||||||||||||||||||||||
Accounts payable and accruals | $ | (27,850 | ) | $ | 182,552 | $ | 39,469 | $ | (10 | ) | $ | 194,161 | $ | (21,034 | ) | $ | 127,711 | $ | 37,527 | $ | (267 | ) | $ | 143,937 | |||||||||||||
Total current liabilities | (27,850 | ) | 182,552 | 39,469 | (10 | ) | 194,161 | (21,034 | ) | 127,711 | 37,527 | (267 | ) | 143,937 | |||||||||||||||||||||||
Long-term debt | 243,175 | — | — | — | 243,175 | 243,175 | — | 11,400 | (11,400 | ) | 243,175 | ||||||||||||||||||||||||||
Intercompany payables | — | 227,874 | 99,440 | (327,314 | ) | — | — | 203,233 | 94,862 | (298,095 | ) | — | |||||||||||||||||||||||||
Other long-term liabilities | 41,390 | 16,994 | 8,255 | — | 66,639 | 41,554 | 12,396 | 8,195 | — | 62,145 | |||||||||||||||||||||||||||
Total liabilities | 256,715 | 427,420 | 147,164 | (327,324 | ) | 503,975 | 263,695 | 343,340 | 151,984 | (309,762 | ) | 449,257 | |||||||||||||||||||||||||
Common stock | 284 | — | — | — | 284 | 285 | — | — | — | 285 | |||||||||||||||||||||||||||
Other stockholders’ equity | 405,168 | 201,709 | 86,447 | (288,156 | ) | 405,168 | 476,961 | 279,313 | 113,908 | (393,221 | ) | 476,961 | |||||||||||||||||||||||||
Total stockholders’ equity | 405,452 | 201,709 | 86,447 | (288,156 | ) | 405,452 | 477,246 | 279,313 | 113,908 | (393,221 | ) | 477,246 | |||||||||||||||||||||||||
Total liabilities and stockholders’ equity | $ | 662,167 | $ | 629,129 | $ | 233,611 | $ | (615,480 | ) | $ | 909,427 | $ | 740,941 | $ | 622,653 | $ | 265,892 | $ | (702,983 | ) | $ | 926,503 | |||||||||||||||
F-34
CHART INDUSTRIES, INC. AND SUBSIDIARIES
NOTES TO CONSOLIDATED FINANCIAL STATEMENTS—(Continued)
(Dollars and shares in thousands, except per share amounts)
CONDENSED CONSOLIDATING STATEMENT OF OPERATIONS
For the Year Ended December 31, 2010
| Issuer | Subsidiary Guarantors | Subsidiary Non-Guarantors | Consolidating Adjustments | Total | ||||||||||||||||
Net sales | $ | — | $ | 360,944 | $ | 203,071 | $ | (8,560 | ) | $ | 555,455 | |||||||||
Cost of sales | — | 233,556 | 164,993 | (8,393 | ) | 390,156 | ||||||||||||||
Gross profit | — | 127,388 | 38,078 | (167 | ) | 165,299 | ||||||||||||||
Selling, general and administrative expenses | 422 | 97,093 | 20,280 | — | 117,795 | |||||||||||||||
Operating income | (422 | ) | 30,295 | 17,798 | (167 | ) | 47,504 | |||||||||||||
Interest expense, net | 16,486 | (94 | ) | (196 | ) | — | 16,196 | |||||||||||||
Other (income) expense, net | 3,063 | 163 | (66 | ) | (5 | ) | 3,155 | |||||||||||||
Income (loss) before income taxes and equity in net (income) of subsidiaries | (19,971 | ) | 30,226 | 18,060 | (162 | ) | 28,153 | |||||||||||||
Income tax (benefit) provision | (5,592 | ) | 10,291 | 3,465 | (171 | ) | 7,993 | |||||||||||||
Equity in net (income) of subsidiaries | (34,539 | ) | (14,604 | ) | — | 49,143 | — | |||||||||||||
Net income | $ | 20,160 | $ | 34,539 | $ | 14,595 | $ | (49,134 | ) | $ | 20,160 | |||||||||
CONDENSED CONSOLIDATING STATEMENT OF OPERATIONS
For the Year Ended December 31, 2009
| Issuer | Subsidiary Guarantors | Subsidiary Non-Guarantors | Consolidating Adjustments | Total | ||||||||||||||||
Net sales | $ | — | $ | 439,740 | $ | 155,471 | $ | (3,695 | ) | $ | 591,516 | |||||||||
Cost of sales | — | 270,110 | 123,529 | (4,004 | ) | 389,635 | ||||||||||||||
Gross profit | — | 169,630 | 31,942 | 309 | 201,881 | |||||||||||||||
Selling, general and administrative expenses | 1,476 | 91,399 | 14,672 | — | 107,547 | |||||||||||||||
Operating income | (1,476 | ) | 78,231 | 17,270 | 309 | 94,334 | ||||||||||||||
Interest expense | 17,745 | (32 | ) | (280 | ) | — | 17,433 | |||||||||||||
Other (income) expense, net | — | (3,778 | ) | (3,718 | ) | — | (7,496 | ) | ||||||||||||
Income (loss) before income taxes and equity in net (income) of subsidiaries | (19,221 | ) | 82,041 | 21,268 | 309 | 84,397 | ||||||||||||||
Income tax (benefit) provision | (5,324 | ) | 25,957 | 2,641 | 112 | 23,386 | ||||||||||||||
Equity in net (income) of subsidiaries | (74,908 | ) | (18,824 | ) | — | 93,732 | — | |||||||||||||
Net income | $ | 61,011 | $ | 74,908 | $ | 18,627 | $ | (93,535 | ) | $ | 61,011 | |||||||||
CONDENSED CONSOLIDATING STATEMENT OF OPERATIONS
For the Year Ended December 31, 2008
| Issuer | Subsidiary Guarantors | Subsidiary Non-Guarantors | Consolidating Adjustments | Total | Issuer | Subsidiary Guarantors | Subsidiary Non-Guarantors | Consolidating Adjustments | Total | ||||||||||||||||||||||||||||||
Net sales | $ | — | $ | 548,734 | 200,965 | $ | (5,336 | ) | $ | 744,363 | $ | — | $ | 442,790 | $ | 158,363 | $ | (3,695 | ) | $ | 597,458 | ||||||||||||||||||
Cost of sales | — | 353,924 | 155,578 | (4,527 | ) | 504,975 | — | 273,160 | 126,421 | (4,004 | ) | 395,577 | |||||||||||||||||||||||||||
Gross profit | — | 194,810 | 45,387 | (809 | ) | 239,388 | — | 169,630 | 31,942 | 309 | 201,881 | ||||||||||||||||||||||||||||
Selling, general and administrative expenses | 1,557 | 89,577 | 14,901 | — | 106,035 | 1,476 | 91,399 | 14,672 | — | 107,547 | |||||||||||||||||||||||||||||
Operating (loss) income | (1,557 | ) | 105,233 | 30,486 | (809 | ) | 133,353 | (1,476 | ) | 78,231 | 17,270 | 309 | 94,334 | ||||||||||||||||||||||||||
Interest expense, net | 18,574 | 4 | (625 | ) | — | 17,953 | 17,745 | (32 | ) | (280 | ) | — | 17,433 | ||||||||||||||||||||||||||
Other expense (income), net | 1,857 | 1,867 | 2,081 | — | 5,805 | — | (3,778 | ) | (3,718 | ) | — | (7,496 | ) | ||||||||||||||||||||||||||
Minority interest, net of tax | — | — | 182 | — | 182 | ||||||||||||||||||||||||||||||||||
Income (loss) before income taxes and equity in net (income) loss of subsidiaries | (21,988 | ) | 103,362 | 28,848 | (809 | ) | 109,413 | (19,221 | ) | 82,041 | 21,268 | 309 | 84,397 | ||||||||||||||||||||||||||
Income tax (benefit) provision | (6,112 | ) | 32,916 | 3,685 | — | 30,489 | (5,324 | ) | 25,957 | 2,641 | 112 | 23,386 | |||||||||||||||||||||||||||
Equity in net (income) loss of subsidiaries | (94,800 | ) | (24,354 | ) | — | 119,154 | — | (74,908 | ) | (18,824 | ) | — | 93,732 | — | |||||||||||||||||||||||||
Net income (loss) | $ | 78,924 | $ | 94,800 | $ | 25,163 | $ | (119,963 | ) | $ | 78,924 | $ | 61,011 | $ | 74,908 | $ | 18,627 | $ | (93,535 | ) | $ | 61,011 | |||||||||||||||||
F-35
CHART INDUSTRIES, INC. AND SUBSIDIARIES
NOTES TO CONSOLIDATED FINANCIAL STATEMENTS—(Continued)
(Dollars and shares in thousands, except per share amounts)
CONDENSED CONSOLIDATING STATEMENT OF OPERATIONS
For the Year Ended December 31, 20072008
| Issuer | Subsidiary Guarantors | Subsidiary Non-Guarantors | Consolidating Adjustments | Total | Issuer | Subsidiary Guarantors | Subsidiary Non-Guarantors | Consolidating Adjustments | Total | |||||||||||||||||||||||||||||||
Net sales | $ | — | $ | 493,878 | $ | 176,311 | $ | (3,794 | ) | $ | 666,395 | $ | — | $ | 554,046 | 204,376 | $ | (5,336 | ) | $ | 753,086 | |||||||||||||||||||
Cost of sales | — | 344,552 | 135,724 | (3,422 | ) | 476,854 | — | 359,236 | 158,989 | (4,527 | ) | 513,698 | ||||||||||||||||||||||||||||
Gross profit | — | 149,326 | 40,587 | (372 | ) | 189,541 | — | 194,810 | 45,387 | (809 | ) | 239,388 | ||||||||||||||||||||||||||||
Selling, general and administrative expenses | 1,359 | 90,039 | 12,962 | — | 104,360 | 1,557 | 89,577 | 14,901 | — | 106,035 | ||||||||||||||||||||||||||||||
Operating (loss) income | (1,359 | ) | 59,287 | 27,625 | (372 | ) | 85,181 | (1,557 | ) | 105,233 | 30,486 | (809 | ) | 133,353 | ||||||||||||||||||||||||||
Interest expense, net | 22,583 | (23 | ) | (386 | ) | — | 22,174 | 18,574 | 4 | (625 | ) | — | 17,953 | |||||||||||||||||||||||||||
Other expense (income), net | 1,646 | 135 | (93 | ) | — | 1,688 | 1,857 | 1,867 | 2,081 | — | 5,805 | |||||||||||||||||||||||||||||
Minority interest, net of tax | — | — | (156 | ) | — | (156 | ) | — | — | 182 | — | 182 | ||||||||||||||||||||||||||||
Income (loss) before income taxes and equity in net (income) loss of subsidiaries | (25,588 | ) | 59,175 | 28,260 | (372 | ) | 61,475 | (21,988 | ) | 103,362 | 28,848 | (809 | ) | 109,413 | ||||||||||||||||||||||||||
Income tax (benefit) provision | (7,411 | ) | 21,805 | 2,925 | — | 17,319 | (6,112 | ) | 32,916 | 3,685 | — | 30,489 | ||||||||||||||||||||||||||||
Equity in net (income) loss of subsidiaries | (62,333 | ) | (24,963 | ) | — | 87,296 | — | (94,800 | ) | (24,354 | ) | — | 119,154 | — | ||||||||||||||||||||||||||
Net income (loss) | $ | 44,156 | $ | 62,333 | $ | 25,335 | $ | (87,668 | ) | $ | 44,156 | $ | 78,924 | $ | 94,800 | $ | 25,163 | $ | (119,963 | ) | $ | 78,924 | ||||||||||||||||||
F-36
CHART INDUSTRIES, INC. AND SUBSIDIARIES
NOTES TO CONSOLIDATED FINANCIAL STATEMENTS—(Continued)
(Dollars and shares in thousands, except per share amounts)
CONDENSED CONSOLIDATING STATEMENT OF CASH FLOWS
For the Year Ended December 31, 20092010
| Issuer | Subsidiary Guarantors | Subsidiary Non-Guarantors | Consolidating Adjustments | Total | Issuer | Subsidiary Guarantors | Subsidiary Non-Guarantors | Consolidating Adjustments | Total | |||||||||||||||||||||||||||||||
Cash flows from operating activities: | ||||||||||||||||||||||||||||||||||||||||
Net cash (used in) provided by operating activities | $ | (2,623 | ) | $ | 53,685 | $ | 31,726 | $ | 4,138 | $ | 86,926 | |||||||||||||||||||||||||||||
Net cash provided by operating activities | $ | 12,872 | $ | 12,602 | $ | 11,454 | $ | 1,646 | $ | 38,574 | ||||||||||||||||||||||||||||||
Cash flows from investing activities: | ||||||||||||||||||||||||||||||||||||||||
Capital expenditures | — | (10,619 | ) | (2,571 | ) | — | (13,190 | ) | — | (12,189 | ) | (4,750 | ) | — | (16,939 | ) | ||||||||||||||||||||||||
Acquisition of businesses, net of cash acquired | — | (5,937 | ) | (12,149 | ) | — | (18,086 | ) | — | (46,857 | ) | (1,008 | ) | — | (47,865 | ) | ||||||||||||||||||||||||
Maturities of short-term investments | 32,264 | — | — | — | 32,264 | |||||||||||||||||||||||||||||||||||
Proceeds from sale of assets | — | — | 989 | — | 989 | |||||||||||||||||||||||||||||||||||
Other investing activities | — | (1,790 | ) | — | — | (1,790 | ) | — | (400 | ) | — | — | (400 | ) | ||||||||||||||||||||||||||
Net cash (used in) investing activities | 32,264 | (18,346 | ) | (14,720 | ) | — | (802 | ) | — | (59,446 | ) | (4,769 | ) | — | (64,215 | ) | ||||||||||||||||||||||||
Cash flows from financing activities: | ||||||||||||||||||||||||||||||||||||||||
Net change in debt | — | 11,400 | (11,400 | ) | — | (18,250 | ) | (6,910 | ) | 6,910 | — | (18,250 | ) | |||||||||||||||||||||||||||
Payment of deferred financing costs | (2,857 | ) | — | — | — | (2,857 | ) | |||||||||||||||||||||||||||||||||
Other financing activities | 776 | — | — | — | 776 | 1,805 | — | — | — | 1,805 | ||||||||||||||||||||||||||||||
Intercompany account changes | 34,752 | (35,776 | ) | (6,238 | ) | 7,262 | — | (73,550 | ) | 54,479 | 20,717 | (1,646 | ) | — | ||||||||||||||||||||||||||
Net cash provided by (used in) financing activities | 35,528 | (35,776 | ) | 5,162 | (4,138 | ) | 776 | |||||||||||||||||||||||||||||||||
Net cash (used in) provided by financing activities | (92,852 | ) | 47,569 | 27,627 | (1,646 | ) | (19,302 | ) | ||||||||||||||||||||||||||||||||
Net (decrease) increase in cash and cash equivalents | 65,169 | (437 | ) | 22,168 | — | 86,900 | (79,980 | ) | 725 | 34,312 | — | (44,943 | ) | |||||||||||||||||||||||||||
Effect of exchange rate changes | — | — | 2,103 | — | 2,103 | — | — | (1,113 | ) | — | (1,113 | ) | ||||||||||||||||||||||||||||
Cash and cash equivalents, beginning of period | 84,428 | 2,540 | 35,197 | — | 122,165 | 149,597 | 2,103 | 59,468 | — | 211,168 | ||||||||||||||||||||||||||||||
Cash and cash equivalents, end of period | $ | 149,597 | $ | 2,103 | $ | 59,468 | $ | — | $ | 211,168 | $ | 69,617 | $ | 2,828 | $ | 92,667 | $ | — | $ | 165,112 | ||||||||||||||||||||
F-37
CHART INDUSTRIES, INC. AND SUBSIDIARIES
NOTES TO CONSOLIDATED FINANCIAL STATEMENTS—(Continued)
(Dollars and shares in thousands, except per share amounts)
CONDENSED CONSOLIDATING STATEMENT OF CASH FLOWS
For the Year Ended December 31, 20082009
| Issuer | Subsidiary Guarantors | Subsidiary Non-Guarantors | Consolidating Adjustments | Total | Issuer | Subsidiary Guarantors | Subsidiary Non-Guarantors | Consolidating Adjustments | Total | |||||||||||||||||||||||||||||||
Cash flows from operating activities: | ||||||||||||||||||||||||||||||||||||||||
Net cash (used in) provided by operating activities | $ | (36,897 | ) | $ | 110,963 | $ | 50,681 | $ | (26,935 | ) | $ | 97,812 | $ | (2,623 | ) | $ | 53,685 | $ | 31,726 | $ | 4,138 | $ | 86,926 | |||||||||||||||||
Cash flows from investing activities: | ||||||||||||||||||||||||||||||||||||||||
Capital expenditures | — | (8,002 | ) | (5,966 | ) | — | (13,968 | ) | — | (10,619 | ) | (2,571 | ) | — | (13,190 | ) | ||||||||||||||||||||||||
Acquisitions, net of cash acquired | — | — | (18,828 | ) | — | (18,828 | ) | — | (5,937 | ) | (12,149 | ) | — | (18,086 | ) | |||||||||||||||||||||||||
Short term investments | (32,264 | ) | — | — | — | (32,264 | ) | |||||||||||||||||||||||||||||||||
Maturities of short-term investments | 32,264 | — | — | — | 32,264 | |||||||||||||||||||||||||||||||||||
Other investing activities | — | (616 | ) | — | — | (616 | ) | — | (1,790 | ) | — | — | (1,790 | ) | ||||||||||||||||||||||||||
Net cash used in investing activities | (32,264 | ) | (8,618 | ) | (24,794 | ) | — | (65,676 | ) | |||||||||||||||||||||||||||||||
Net cash (used in) investing activities | 32,264 | (18,346 | ) | (14,720 | ) | — | (802 | ) | ||||||||||||||||||||||||||||||||
Cash flows from financing activities: | ||||||||||||||||||||||||||||||||||||||||
Net change in debt | (6,825 | ) | — | — | — | (6,825 | ) | — | — | 11,400 | (11,400 | ) | — | |||||||||||||||||||||||||||
Stock option exercise proceeds | 1,329 | — | — | — | 1,329 | |||||||||||||||||||||||||||||||||||
Tax benefit from exercise of stock options | 1,435 | — | — | — | 1,435 | |||||||||||||||||||||||||||||||||||
Other financing activities | 776 | — | — | — | 776 | |||||||||||||||||||||||||||||||||||
Intercompany account changes | 108,467 | (104,400 | ) | (31,002 | ) | 26,935 | — | 34,752 | (35,776 | ) | (6,238 | ) | 7,262 | — | ||||||||||||||||||||||||||
Net cash provided by (used in) financing activities | 104,406 | (104,400 | ) | (31,002 | ) | 26,935 | (4,061 | ) | 35,528 | (35,776 | ) | 5,162 | (4,138 | ) | 776 | |||||||||||||||||||||||||
Net increase (decrease) in cash and cash equivalents | 35,245 | (2,055 | ) | (5,115 | ) | — | 28,075 | |||||||||||||||||||||||||||||||||
Net (decrease) increase in cash and cash equivalents | 65,169 | (437 | ) | 22,168 | — | 86,900 | ||||||||||||||||||||||||||||||||||
Effect of exchange rate changes | — | — | 1,221 | — | 1,221 | — | — | 2,103 | — | 2,103 | ||||||||||||||||||||||||||||||
Cash and cash equivalents, beginning | — | |||||||||||||||||||||||||||||||||||||||
of period | 49,184 | 4,595 | 39,090 | — | 92,869 | |||||||||||||||||||||||||||||||||||
Cash and cash equivalents, beginning of period | 84,428 | 2,540 | 35,197 | — | 122,165 | |||||||||||||||||||||||||||||||||||
Cash and cash equivalents, end of period | $ | 84,429 | $ | 2,540 | $ | 35,196 | $ | — | $ | 122,165 | $ | 149,597 | $ | 2,103 | $ | 59,468 | $ | — | $ | 211,168 | ||||||||||||||||||||
F-38
CHART INDUSTRIES, INC. AND SUBSIDIARIES
NOTES TO CONSOLIDATED FINANCIAL STATEMENTS—(Continued)
(Dollars and shares in thousands, except per share amounts)
CONDENSED CONSOLIDATING STATEMENT OF CASH FLOWS
For the Year Ended December 31, 20072008
| Issuer | Subsidiary Guarantors | Subsidiary Non-Guarantors | Consolidating Adjustments | Total | Issuer | Subsidiary Guarantors | Subsidiary Non-Guarantors | Consolidating Adjustments | Total | |||||||||||||||||||||||||||||||
Cash flows from operating activities: | ||||||||||||||||||||||||||||||||||||||||
Net cash (used in) provided by operating activities | $ | (22,041 | ) | $ | 83,210 | $ | 15,894 | $ | 5,444 | $ | 82,507 | $ | (36,897 | ) | $ | 110,963 | $ | 50,681 | $ | (26,935 | ) | $ | 97,812 | |||||||||||||||||
Cash flows from investing activities: | ||||||||||||||||||||||||||||||||||||||||
Capital expenditures | — | (10,876 | ) | (8,152 | ) | — | (19,028 | ) | — | (8,002 | ) | (5,966 | ) | — | (13,968 | ) | ||||||||||||||||||||||||
Acquisitions, net of cash acquired | — | — | (18,828 | ) | — | (18,828 | ) | |||||||||||||||||||||||||||||||||
Short term investments | (32,264 | ) | — | — | — | (32,264 | ) | |||||||||||||||||||||||||||||||||
Other investing activities | 2,099 | (1,612 | ) | — | 487 | — | (616 | ) | — | — | (616 | ) | ||||||||||||||||||||||||||||
Net cash used in investing activities | — | (8,777 | ) | (9,764 | ) | — | (18,541 | ) | (32,264 | ) | (8,618 | ) | (24,794 | ) | — | (65,676 | ) | |||||||||||||||||||||||
Cash flows from financing activities: | ||||||||||||||||||||||||||||||||||||||||
Net change in debt | (40,000 | ) | (750 | ) | — | — | (40,750 | ) | (6,825 | ) | — | — | — | (6,825 | ) | |||||||||||||||||||||||||
Underwriters’ over-allotment proceeds, net | 38,042 | — | — | — | 38,042 | |||||||||||||||||||||||||||||||||||
Stock option exercise proceeds | 4,797 | — | — | — | 4,797 | 1,329 | — | — | — | 1,329 | ||||||||||||||||||||||||||||||
Tax benefit from exercise of stock options | 4,323 | — | — | — | 4,323 | 1,435 | — | — | — | 1,435 | ||||||||||||||||||||||||||||||
Other financing activities | (296 | ) | — | 1,328 | — | 1,032 | ||||||||||||||||||||||||||||||||||
Intercompany account changes | 58,275 | (69,202 | ) | 16,371 | (5,444 | ) | — | 108,467 | (104,400 | ) | (31,002 | ) | 26,935 | — | ||||||||||||||||||||||||||
Net cash provided by (used in) financing activities | 65,141 | (69,952 | ) | 17,699 | (5,444 | ) | 7,444 | 104,406 | (104,400 | ) | (31,002 | ) | 26,935 | (4,061 | ) | |||||||||||||||||||||||||
Net increase in cash and cash equivalents | 43,100 | 4,481 | 23,829 | — | 71,410 | |||||||||||||||||||||||||||||||||||
Net increase (decrease) in cash and cash equivalents | 35,245 | (2,055 | ) | (5,115 | ) | — | 28,075 | |||||||||||||||||||||||||||||||||
Effect of exchange rate changes on cash | — | — | 2,605 | — | 2,605 | — | — | 1,221 | — | 1,221 | ||||||||||||||||||||||||||||||
Cash and cash equivalents, beginning | — | |||||||||||||||||||||||||||||||||||||||
of period | 6,084 | 114 | 12,656 | — | 18,854 | |||||||||||||||||||||||||||||||||||
Cash and cash equivalents, beginning of period | 49,184 | 4,595 | 39,090 | — | 92,869 | |||||||||||||||||||||||||||||||||||
Cash and cash equivalents, end of period | $ | 49,184 | $ | 4,595 | $ | 39,090 | $ | — | $ | 92,869 | $ | 84,429 | $ | 2,540 | $ | 35,196 | $ | — | $ | 122,165 | ||||||||||||||||||||
F-39F-40
CHART INDUSTRIES, INC. AND SUBSIDIARIES
SCHEDULE II – VALUATION AND QUALIFYING ACCOUNTS
(Dollars in thousands)
| Additions | ||||||||||||||||||||||||
| Balance at beginning of period | Charged to costs and expenses | Charged to other accounts | Deductions | Translations | Balance at end of period | |||||||||||||||||||
Year Ended December 31, 2010: | ||||||||||||||||||||||||
Allowance for doubtful accounts | $ | 1,727 | $ | 3,326 | $ | 489 | (1) | $ | (2,552 | )(2) | $ | 18 | $ | 3,008 | ||||||||||
Allowance for obsolete and excess inventory | $ | 4,184 | $ | 1,800 | $ | 201 | (1) | $ | (2,965 | )(3) | $ | (39 | ) | $ | 3,181 | |||||||||
Year Ended December 31, 2009: | ||||||||||||||||||||||||
Allowance for doubtful accounts | $ | 2,312 | $ | 2,386 | $ | — | $ | (3,007 | )(2) | $ | 36 | $ | 1,727 | |||||||||||
Allowance for obsolete and excess inventory | $ | 1,912 | $ | 4,450 | $ | 910 | (1) | $ | (3,148 | )(3) | $ | 60 | $ | 4,184 | ||||||||||
Year Ended December 31, 2008: | ||||||||||||||||||||||||
Allowance for doubtful accounts | $ | 2,081 | $ | 3,210 | $ | 13 | (1) | $ | (2,997 | )(2) | $ | 5 | $ | 2,312 | ||||||||||
Allowance for obsolete and excess inventory | $ | 2,513 | $ | 1,509 | $ | — | $ | (2,064 | )(3) | $ | (46 | ) | $ | 1,912 | ||||||||||
| (1) | Reserves at date of acquisition of subsidiary or subsidiaries. |
| (2) | Uncollectible accounts written off. |
| (3) | Inventory items written off against the allowance. |
F-41
EXHIBIT INDEX
Exhibit No. | Description | |
| 2.1 | Agreement and Plan of Merger, dated as of August 2, 2005 by and among Chart Industries, Inc., certain of its stockholders, First Reserve Fund X, L.P. and CI Acquisition, Inc. (incorporated by reference to Exhibit 2.1 to the Registrant’s Registration Statement on Form S-1 (File No. 333-133254)). | |
| 3.1 | Amended and Restated Certificate of Incorporation (incorporated by reference to Exhibit 3.1 to Amendment No. 5 to the Registrant’s Registration Statement on Form S-1 (File No. 333-133254)). | |
| 3.2 | Amended and Restated By-Laws, as amended (incorporated by reference to Exhibit 3.1 to the Registrant’s current report on Form 8-K, filed with the SEC on December 19, 2008 (File No. 001-11442)). | |
| 4.1 | Form of Certificate (incorporated by reference to Exhibit 4.1 to Amendment No. 4 to the Registrant’s Registration Statement on Form S-1 (File No. 333-133254)). | |
| 4.2 | Indenture, dated as of October 17, 2005, between Chart Industries, Inc. and The Bank of New York as trustee (incorporated by reference to Exhibit 4.2 to the Registrant’s Registration Statement on Form S-1 (File No. 333-133254)). | |
| 10.1 | ||
| Form of Amended and Restated Management Stockholders Agreement (incorporated by reference to Exhibit 10.10 to Amendment No. 3 to the Registrant’s Registration Statement on Form S-1 (File No. 333-133254)). | ||
| Amended and Restated Chart Industries, Inc. 2005 Stock Incentive Plan (incorporated by reference to Exhibit 10.3 to the Registrant’s Annual Report on Form 10-K for the year ended December 31, 2008 (File No. 001-11442)).* | ||
| Form of Nonqualified Stock Option Agreement (2005 and 2006 grants) under the Amended and Restated Chart Industries, Inc. 2005 Stock Incentive Plan (incorporated by reference to Exhibit 10.17 to the Registrant’s Registration Statement on Form S-1 (File No. 333-133254)).* | ||
| Form of Restricted Stock Unit Agreement (for non-employee directors) under the Amended and Restated Chart Industries, Inc. 2005 Stock Incentive Plan (incorporated by reference to Exhibit 10.22 to Amendment No. 4 to the Registrant’s Registration Statement on Form S-1 (File No. 333-133254)).* | ||
| Form of 2008 Performance Unit Agreement under the Amended and Restated Chart Industries, Inc. 2005 Stock Incentive Plan (incorporated by reference to Exhibit 10.4.4 to the Registrant’s Annual Report on Form 10-K for the year ended December 31, 2007 (File No. 001-11442)).* | ||
| Form of 2009 Performance Unit Agreement under the Amended and Restated Chart Industries, Inc. 2005 Stock Incentive Plan (incorporated by reference to Exhibit 10.3.5 to the Registrant’s Annual Report on Form 10-K for the year ended December 31, 2008 (File No. 001-11442)).* | ||
| Form of Nonqualified Stock Option Agreement (2007 and 2008 grants) under the Amended and Restated Chart Industries, Inc. 2005 Stock Incentive Plan (incorporated by reference to Exhibit 10.2 to the Registrant’s current report on Form 8-K, filed with the SEC on August 7, 2007 (File No. 001-11442)).* | ||
E-1
|
| ||
| Form of Nonqualified Stock Option Agreement (2009 grants) under the Amended and Restated Chart Industries, Inc. 2005 Stock Incentive Plan (incorporated by reference to Exhibit 10.3.7 to the Registrant’s Annual Report on Form 10-K for the year ended December 31, 2008 (File No. 001-11442)).* | |||
E-1
Exhibit No. | Description | |
| 10.2.7 | Forms of Stock Award Agreement and Deferral Election Form (for non-employee directors) (2008 grants) under the Amended and Restated Chart Industries, Inc. 2005 Stock Incentive Plan (incorporated by reference to Exhibit 10.4.6 to the Registrant’s Annual Report on Form 10-K for the year ended December 31, 2007 (File No. 001-11442)).* | |
| Forms of Stock Award Agreement and Deferral Election Form (for non-employee directors) | ||
| Chart Industries, Inc. 2009 Omnibus Equity Plan (incorporated by reference to Appendix A to the | ||
| Form of Nonqualified Stock Option Agreement (2010 grants) under the Chart Industries, Inc. 2009 Omnibus Equity | ||
| Form of Restricted Stock Agreement (2010 grants) under the Chart Industries, Inc. 2009 Omnibus Equity | ||
| Forms of Stock Award Agreement and Deferral Election Form (for eligible directors) under the Chart Industries, Inc. 2009 Omnibus | ||
| 10.3.4 | Form of Nonqualified Stock Option Agreement (2011 grants) under the Chart Industries, Inc. 2009 Omnibus Equity Plan.* (x) | |
| Form of Restricted Stock Agreement (2011 grants) under the Chart Industries, Inc. 2009 Omnibus Equity Plan.* (x) | ||
| 10.3.6 | Form of Performance Unit Agreement (2011 grants) under the Chart Industries, Inc. 2009 Omnibus Equity Plan.* (x) | |
| 10.4 | Amended and Restated Chart Industries, Inc. Voluntary Deferred Income Plan (incorporated by reference to Exhibit | |
| Incentive Compensation Plan (incorporated by reference to Exhibit 10.19 to Amendment No. 3 to the Registrant’s Registration Statement on Form S-1 (File No. 333-133254)).* | ||
| Amendment No. 1 to Chart Executive Incentive Compensation Plan (incorporated by reference to Exhibit 10.6.1 to the Registrant’s Annual Report on Form 10-K for the year ended December 31, 2008 (File No. 001-11442)).* | ||
| Chart Industries, Inc. 2009 Incentive Compensation Plan (incorporated by reference to Appendix B to the | ||
| Credit Agreement, dated | ||
E-2
Exhibit No. | Description | |
| Guarantee and Collateral Agreement, dated May 18, 2010, among Chart Industries, Inc., certain subsidiaries of Chart Industries, Inc., and JPMorgan Chase Bank, N.A., as administrative agent (incorporated by reference to Exhibit 10.2 to the Registrant’s Current Report on Form 8-K, filed with the SEC on May 19, 2010 (File No. 001-11442)). | ||
| 10.9 | Employment Agreement, dated February 26, 2008, by and between Registrant and Samuel F. Thomas (incorporated by reference to Exhibit 10.1 to the Registrant’s Quarterly Report on Form 10-Q for the quarter ended March 31, 2008 (File No. 001-11442)).* | |
| Amendment No. 1, effective January 1, 2009, to the Employment Agreement dated February 26, 2008 by and between Registrant and Samuel F. Thomas (incorporated by reference to Exhibit 10.9.1 to the Registrant’s Annual Report on Form 10-K for the year ended December 31, 2008 (File No. 001-11442)).* | ||
| Amendment No. 2, effective January 1, 2010, to the Employment Agreement dated February 26, 2008 by and between Registrant and Samuel F. Thomas (incorporated by reference to Exhibit 10.1 to the Registrant’s Quarterly Report on Form 10-Q for the quarter ended March 31, 2010 (File No. 001-11442)).* | ||
| 10.10 | Employment Agreement, dated February 26, 2008, by and between Registrant and Michael F. Biehl (incorporated by reference to Exhibit 10.2 to the Registrant’s Quarterly Report on Form 10-Q for the quarter ended March 31, 2008 (File No. 001-11442)).* | |
| Amendment No. 1, effective January 1, 2009, to the Employment Agreement dated February 26, 2008 by and between Registrant and Michael F. Biehl (incorporated by reference to Exhibit 10.10.1 to the Registrant’s Annual Report on Form 10-K for the year ended December 31, 2008 (File No. 001-11442)).* | ||
| Employment Agreement, dated February 26, 2008, by and between Registrant and Matthew J. Klaben (incorporated by reference to Exhibit 10.3 to the Registrant’s Quarterly Report on Form 10-Q for the quarter ended March 31, 2008 (File No. 001-11442)).* | ||
| Amendment No. 1, effective January 1, 2009, to the Employment Agreement dated February 26, 2008 by and between Registrant and Matthew J. Klaben (incorporated by reference to Exhibit 10.11.1 to the Registrant’s Annual Report on Form 10-K for the year ended December 31, 2008 (File No. 001-11442)).* | ||
| Employment Agreement, dated February 26, 2008, by and between Registrant and James H. Hoppel, Jr. (incorporated by reference to Exhibit 10.4 to the Registrant’s Quarterly Report on Form 10-Q for the quarter ended March 31, 2008 (File No. 001-11442)).* | ||
| Amendment No. 1, effective January 1, 2009, to the Employment Agreement dated February 26, 2008 by and between Registrant and James H. Hoppel, Jr. (incorporated by reference to Exhibit 10.12.1 to the Registrant’s Annual Report on Form 10-K for the year ended December 31, 2008 (File No. 001-11442)).* | ||
| Transition Agreement, dated August 24, 2010, by and between Registrant and James H. Hoppel, Jr. (incorporated by reference to Exhibit 10.1 to the Registrant’s Current Report on Form 8-K, filed with the SEC on August 27, 2010 (File No. 001-11442)).* | ||
| 10.13 | Employment Agreement, dated February 26, 2008, by and between Registrant and Kenneth J. Webster (incorporated by reference to Exhibit 10.5 to the Registrant’s Quarterly Report on Form 10-Q for the quarter ended March 31, 2008 (File No. 001-11442)).* | |
| Amendment No. 1, effective January 1, 2009, to the Employment Agreement dated February 26, 2008 by and between Registrant and Kenneth J. Webster (incorporated by reference to Exhibit 10.13.1 to the Registrant’s Annual Report on Form 10-K for the year ended December 31, 2008 (File No. 001-11442)).* | ||
E-3
Exhibit No. | Description | |
| 10.13.2 | Amendment No. 2, effective January 1, 2010, to the Employment Agreement dated February 26, 2008 by and between Registrant and Kenneth J. Webster (incorporated by reference to Exhibit 10.4 to the Registrant’s Quarterly Report on Form 10-Q for the quarter ended June 30, 2010 (File No. 001-11442)).* | |
| Form of Indemnification Agreement (incorporated by reference to Exhibit 10.20 to the Registrant’s Registration Statement on Form S-1 (File No. 333-133254)). | ||
| IAM Agreement | ||
E-3
|
| ||
| 21.1 | List of Subsidiaries. (x) | ||
| 23.1 | Consent of Independent Registered Public Accounting Firm. (x) | ||
| 31.1 | Rule 13a-14(a) Certification of the Company’s Chief Financial Officer. (x) | ||
| 31.2 | Rule 13a-14(a) Certification of the Company’s Chief Executive Officer. (x) | ||
| 32.1 | Section 1350 Certification of the Company’s Chief Financial Officer. (xx) | ||
| 32.2 | Section 1350 Certification of the Company’s Chief Executive Officer. (xx) | ||
| 101 | The following financial statements from the Company’s Form 10-K for the period ended December 31, 2010, formatted in XBRL: (i) Condensed Consolidated Statements of Income, (ii) Condensed Consolidated Balance Sheets, (iii) Condensed Consolidated Statements of Cash Flow, (iv) the Notes to Condensed Consolidated Financial Statements, tagged as blocks of text. In accordance with Rule 406T of Regulation S-T, the XBRL related information in Exhibit 101 to this Form 10-K shall not be deemed to be “filed” for purposes of Section 18 of the Securities Exchange Act of 1934, or otherwise subject to the liability of that section, and shall not be part of any registration statement or other document filed under the Securities Act of 1933 or Securities Exchange Act of 1934, except as shall be expressly set forth by specific reference in such filing. | ||
| (x) | Filed herewith. |
| (xx) | Furnished herewith. |
| * | Management contract or compensatory plan or arrangement. |
E-4