UNITED STATES


SECURITIES AND EXCHANGE COMMISSION

Washington, D.C. 20549

FORM 10-K

(Mark One)

[ü]ANNUAL REPORT PURSUANT TO SECTION 13 OR 15(d) OF THE SECURITIES EXCHANGE ACT OF 1934
For the fiscal year ended December 31, 2010

For the fiscal year ended December 31, 2009

or

[  ]TRANSITION REPORT PURSUANT TO SECTION 13 OR 15(d) OF THE SECURITIES EXCHANGE ACT OF 1934

For the transition period from      to

Commission file number:

1-6523

Exact name of registrant as specified in its charter:

Bank of America Corporation

State or other jurisdiction of incorporation or organization:

Delaware


IRS Employer Identification No.:
56-0906609

56-0906609


Address of principal executive offices:


Bank of America Corporate Center


100 N.North Tryon Street


Charlotte, North Carolina 28255


Registrant’s telephone number, including area code:


(704) 386-5681


SECURITIES REGISTERED PURSUANT TO SECTION 12(b) OF THE ACT:

Title of each class


Name of each exchange on which registered

Common Stock,

par value $0.01 per share
 New York Stock Exchange
 London Stock Exchange
 Tokyo Stock Exchange

Depositary Shares, each Representing a 1/1,000th interest in a share of


6.204% Non-Cumulative Preferred Stock, Series D

 New York Stock Exchange

Depositary Shares, each Representing a 1/1,000th interest in a share of

Floating Rate Non-Cumulative Preferred Stock, Series E

 New York Stock Exchange

Depositary Shares, each Representing a 1/1,000th Interest in a Share of 8.20% Non-Cumulative Preferred Stock, Series H

 New York Stock Exchange

Depositary Shares, each Representing a 1/1,000th interest in a share of 6.625% Non-Cumulative Preferred Stock, Series I

 New York Stock Exchange

Depositary Shares, each Representing a 1/1,000th interest in a share of 7.25% Non-Cumulative Preferred Stock, Series J

 New York Stock Exchange

7.25% Non-Cumulative Perpetual Convertible Preferred Stock, Series L

 New York Stock Exchange

Depositary Shares, each representing a 1/1,200th interest in a share of Bank of America Corporation Floating Rate Non-Cumulative Preferred Stock, Series 1

 New York Stock Exchange

Depositary Shares, each representing a 1/1,200th interest in a share of Bank of America Corporation Floating Rate Non-Cumulative Preferred Stock, Series 2

 New York Stock Exchange

Depositary Shares, each representing a 1/1,200th interest in a share of Bank of America Corporation 6.375% Non-Cumulative Preferred Stock, Series 3

 New York Stock Exchange

Depositary Shares, each representing a 1/1,200th interest in a share of Bank of America Corporation Floating Rate Non-Cumulative Preferred Stock, Series 4

 New York Stock Exchange

Depositary Shares, each representing a 1/1,200th interest in a share of Bank of America Corporation Floating Rate Non-Cumulative Preferred Stock, Series 5

 New York Stock Exchange

Depositary Shares, each representing a 1/40th interest in a share of Bank of America Corporation 6.70% Non-cumulative Perpetual Preferred Stock, Series 6

 New York Stock Exchange

Depositary Shares, each representing a 1/40th interest in a share of Bank of America Corporation 6.25% Non-cumulative Perpetual Preferred Stock, Series 7

 New York Stock Exchange

Depositary Shares, each representing a 1/1,200th interest in a share of Bank of America Corporation 8.625% Non-Cumulative Preferred Stock, Series 8

 New York Stock Exchange

6.75% Trust Preferred Securities of Countrywide Capital IV (and the guarantees related thereto)

 New York Stock Exchange

7.00% Capital Securities of Countrywide Capital V (and the guarantees related thereto)

 New York Stock Exchange

Capital Securities of BAC Capital Trust I (and the guarantee related thereto)

 New York Stock Exchange

Capital Securities of BAC Capital Trust II (and the guarantee related thereto)

 New York Stock Exchange

Capital Securities of BAC Capital Trust III (and the guarantee related thereto)

 New York Stock Exchange

57//8% Capital Securities of BAC Capital Trust IV (and the guarantee related thereto)

 New York Stock Exchange

6% Capital Securities of BAC Capital Trust V (and the guarantee related thereto)

 New York Stock Exchange

6% Capital Securities of BAC Capital Trust VIII (and the guarantee related thereto)

 New York Stock Exchange

6 ¼%1/4% Capital Securities of BAC Capital Trust X (and the guarantee related thereto)

 New York Stock Exchange

67//8% Capital Securities of BAC Capital Trust XII (and the guarantee related thereto)

 New York Stock Exchange


Title of each class

Name of each exchange on which registered
Floating Rate Preferred Hybrid Income Term Securities of BAC Capital Trust XIII (and the guarantee related thereto)

 New York Stock Exchange

5.63% Fixed to Floating Rate Preferred Hybrid Income Term Securities of BAC Capital Trust XIV (and the guarantee related thereto)

 New York Stock Exchange


Title of each class

MBNA Capital A 8.278% Capital Securities, Series A (and the guarantee related thereto)
 

Name of each exchange on which registered

New York Stock Exchange

Minimum Return Index EAGLESSM, due June 1, 2010, Linked toMBNA Capital B Floating Rate Capital Securities, Series B (and the Nasdaq-100 Index®

guarantee related thereto)
 NYSE AmexNew York Stock Exchange

Minimum Return Index EAGLES®, due June 28, 2010, Linked toMBNA Capital D 8.125% Trust Preferred Securities, Series D (and the S&P 500® Index

guarantee related thereto)
 NYSE AmexNew York Stock Exchange

Minimum Return – Return Linked Notes, due June 24, 2010, Linked toMBNA Capital E 6.10% Trust Originated Preferred Securities, Series E (and the Nikkei 225 Index

guarantee related thereto)
 NYSE AmexNew York Stock Exchange

Minimum Return Basket EAGLESSM, due August 2, 2010, Linked to a BasketPreferred Securities of Energy Stocks

Fleet Capital Trust VIII (and the guarantee related thereto)
 NYSE AmexNew York Stock Exchange

Minimum Return Index EAGLES®, due October 29, 2010, Linked toPreferred Securities of Fleet Capital Trust IX (and the Nasdaq-100 Index®

guarantee related thereto)
 NYSE AmexNew York Stock Exchange

1.50% Index CYCLESTM, due November 26, 2010, Linked to the S&P 500® Index

NYSE Amex

1.00% Index CYCLESTM, due December 28, 2010, Linked to the S&P MidCap 400 Index

NYSE Amex

Return Linked Notes due June 28, 2010, Linked to the Nikkei 225 Index

NYSE Amex

1.00% Index CYCLESTM, due January 28, 2011, Linked to a Basket of Health Care Stocks

NYSE Amex

Minimum Return Index EAGLES®, due January 28, 2011, Linked to the Russell 2000® Index

NYSE Amex

1.00% Basket CYCLESTM, due May 27, 2010, Linked to a “70/30” Basket of Four Indices and an Exchange Traded Fund

NYSE Amex

Minimum Return Index EAGLES®, due June 25, 2010, Linked to the Dow Jones Industrial AverageSM

NYSE Amex

1.50% Basket CYCLESTMtm, due July 29, 2011, Linked to an “80/20” Basket of Four Indices and an Exchange Traded Fund

 NYSE Amex

1.25% Index CYCLESTM, due August 25, 2010, Linked to the Dow Jones Industrial AverageSM

 NYSE Amex

1.25% Basket CYCLESTMtm, due September 27, 2011, Linked to a Basket of Four Indices

 NYSE Amex

Minimum Return Basket EAGLESSM, due September 29, 2010, Linked to a Basket of Energy Stocks

 NYSE Amex

Minimum Return Index EAGLES®, due October 29, 2010, Linked to the S&P 500® Index

NYSE Amex

Minimum Return Index EAGLES®, due November 23, 2010, Linked to the Nasdaq-100 Index®

NYSE Amex

Minimum Return Index EAGLES®, due November 24, 2010, Linked to the CBOE China Index

NYSE Amex

1.25% Basket CYCLESTM, due December 27, 2010, Linked to a “70/30” Basket of Four Indices and an Exchange Traded Fund

NYSE Amex

1.50% Index CYCLESTMtm, due December 28, 2011, Linked to a Basket of Health Care Stocks

 NYSE Amex

61//2% Subordinated InterNotesSMsm, due 2032

 New York Stock Exchange

51//2% Subordinated InterNotesSMsm, due 2033

 New York Stock Exchange

57//8% Subordinated InterNotesSMsm, due 2033

 New York Stock Exchange

6% Subordinated InterNotesSMsm, due 2034

 New York Stock Exchange

Minimum Return Index EAGLES®, due March 25, 2011, Linked to the Dow Jones Industrial AverageSMsm

 NYSE Amex

1.625% Index CYCLESTM, due March 23, 2010, Linked to the Nikkei 225 Index

 NYSE Amex

1.75% Index CYCLESTMtm, due April 28, 2011, Linked to the S&P 500® Index

 NYSE Amex

Return Linked Notes, due August 26, 2010, Linked to a Basket of Three Indices

 NYSE Amex

Return Linked Notes, due June 27, 2011, Linked to an “80/20” Basket of Four Indices and an Exchange Traded Fund

 NYSE Amex

Minimum Return Index EAGLES®, due July 29, 2010, Linked to the S&P 500® Index

 NYSE Amex

Return Linked Notes, due January 28, 2011, Linked to a Basket of Two Indices

NYSE Amex

Minimum Return Index EAGLES®, due August 26, 2010, Linked to the Dow Jones Industrial AverageSM

NYSE Amex

Return Linked Notes, due August 25, 2011, Linked to the Dow Jones EURO STOXX 50® Index

 NYSE Amex

Minimum Return Index EAGLES®, due October 3, 2011, Linked to the S&P 500® Index

 NYSE Amex

Minimum Return Index EAGLES®, due October 28, 2011, Linked to the AMEX Biotechnology Index

 NYSE Amex

Return Linked Notes, due October 27, 2011, Linked to a Basket of Three Indices

 NYSE Amex

Return Linked Notes, due November 22, 2010, Linked to a Basket of Two Indices

 NYSE Amex

Minimum Return Index EAGLES®, due November 23, 2011, Linked to a Basket of Five Indices

 NYSE Amex

Minimum Return Index EAGLES®, due December 27, 2011, Linked to the Dow Jones Industrial AverageSMsm

 NYSE Amex

0.25% Senior Notes Optionally Exchangeable Into a Basket of Three Common Stocks, due February 2012

 NYSE Amex

Return Linked Notes, due December 29, 2011 Linked to a Basket of Three Indices

 NYSE Amex

Bear Market Strategic Accelerated Redemption Securities®, Linked to the iShares® Dow Jones U.S. Real Estate Index Fund, due August 3, 2010

 NYSE Arca, Inc.

Accelerated Return NotesSM, Linked to the S&P 500® Index, due April 5, 2010

NYSE Arca, Inc.

Strategic Accelerated Redemption Securities®, Linked to the S&P 500® Index, due February 1, 2011

NYSE Arca, Inc.

Strategic Accelerated Redemption Securities® Linked to the S&P 500® Index, due January 11, 2012

NYSE Arca, Inc.

Market-Linked Step Up Notes Linked to the S&P 500® Index, due December 23, 2011

 NYSE Arca, Inc.

Strategic Accelerated Redemption Securities® Linked to the S&P 500® Index, due December 5, 2011

 NYSE Arca, Inc.

Market-Linked Step Up Notes Linked to the S&P 500® Index, due November 26, 2012

 NYSE Arca, Inc.

Market Index Target-Term Securities® Linked to the Dow Jones Industrial AverageSMsm, due December 2, 2014

 NYSE Arca, Inc.

Market-Linked Step Up Notes Linked to the S&P 500® Index, due November 28, 2011

 NYSE Arca, Inc.

Market-Linked Step Up Notes Linked to the S&P 500® Index, due October 28, 2011

 NYSE Arca, Inc.

Market-Linked Step Up Notes Linked to the Russell 2000® Index, due October 28, 2011

 NYSE Arca, Inc.

Notes Linked to the S&P 500® Index, due October 4, 2011

 NYSE Arca, Inc.

Market Index Target-Term Securities®, Linked to the S&P 500® Index, due September 27, 2013

 NYSE Arca, Inc.

Accelerated Return Notes® Linked to the S&P 500® Index, due October 29, 2010

 NYSE Arca, Inc.

Leveraged Index Return Notes®, Linked to the S&P 500® Index, due July 27, 2012

 NYSE Arca, Inc.

Strategic Accelerated Redemption Securities®, Linked to the S&P 500® Index, due August 2, 2011

 NYSE Arca, Inc.

Market Index Target-Term Securities®, Linked to the S&P 500® Index, due July 26, 2013

 NYSE Arca, Inc.

Leveraged indexIndex Return Notes®, Linked to the S&P 500® Index, due June 29, 2012

 NYSE Arca, Inc.

Strategic Accelerated Redemption Securities®, Linked to the iShares® FTSE/Xinhua 25 Index Fund, due June 1, 2011

 NYSE Arca, Inc.

Accelerated Return Notes®, Linked to the S&P 500® Index, due July 30, 2010

NYSE Arca, Inc.

Leveraged Index Return Notes®, Linked to the S&P 500® Index, due June 1, 2012

 NYSE Arca, Inc.

Strategic Accelerated Redemption Securities®, Linked to the S&P 500® Index, due June 1, 2011

 NYSE Arca, Inc.

Market Index Target-Term Securities®, Linked to the Dow Jones Industrial AverageSMsm, due May 31, 2013

 NYSE Arca, Inc.

Capped Leveraged Index Return Notes®, Linked to the S&P 500® Index, due November 29, 2010

 NYSE Arca, Inc.

Strategic Accelerated Redemption Securities®, Linked to the SPDR® Gold Trust, due May 3, 2011

NYSE Arca, Inc.

Market Index Target-Term Securities®, Linked to the S&P 500® Index, due April 25, 2014

 NYSE Arca, Inc.

Strategic Accelerated Redemption Securities®, Linked to the S&P 500® Index, due April 5, 2011

 NYSE Arca, Inc.

Bear Market Strategic Accelerated Redemption Securities®, Linked to the iShares® Dow Jones U.S. Real Estate Index Fund, due September 30, 2010

NYSE Arca, inc.

Market Index Target-Term Securities®, Linked to the S&P 500® Index, due March 28, 2014

 NYSE Arca, Inc.

Capped Leveraged Index Return Notes®, Linked to the S&P 500® Index, due August 27, 2010

 NYSE Arca, Inc.

Bear Market Strategic Accelerated Redemption Securities®, Linked to the S&P Small Cap Regional Banks Index, due August 31, 2010

NYSE Arca, Inc.

Strategic Accelerated Redemption Securities®, Linked to the S&P 500® Index, due March 1, 2011

NYSE Arca, Inc.

Market Index Target-Term Securities®, Linked to the S&P 500® Index, due February 28, 2014

 NYSE Arca, Inc.

Accelerated Return

Market-Linked Step Up NotesSM, Linked to the S&P 500® Index, due April 5, 2010

January 27, 2012
 NYSE Arca, Inc.

Strategic

Accelerated Redemption SecuritiesReturn Notes®, Linked to the S&P 500® Index, due February 1,March 25, 2011
Market Index Target-Term Securities® Linked to the Dow Jones Industrial Averagesm

, due January 30, 2015
 NYSE Arca, Inc.

Bear Market

Strategic Accelerated Redemption Securities®, Linked to the iSharesS&P 500® Dow Jones U.S. Real Estate Index, Fund, due August 3, 2010

January 30, 2012
 NYSE Arca, Inc.
Market Index Target-Term Securities® Linked to the S&P 500® Index, due February 27, 2015
NYSE Arca, Inc.
Capped Leveraged Return Notes® Linked to the S&P 500® Index, due February 24, 2012
NYSE Arca, Inc.
Market-Linked Step Up Notes Linked to the S&P 500® Index, due February 25, 2013
NYSE Arca, Inc.
Market Index Target-Term Securities® Linked to the Dow Jones Industrial Averagesm, due March 27, 2015
NYSE Arca, Inc.
Capped Leveraged Index Return Notes® Linked to the S&P 500® Index, due March 30, 2012
NYSE Arca, Inc.
Strategic Accelerated Redemption Securities® Linked to the S&P 500® Index, due March 30, 2012
NYSE Arca, Inc.
Market Index Target-Term Securities® Linked to the Dow Jones Industrial Averagesm, due April 24, 2015
NYSE Arca, Inc.
Capped Leveraged Index Return Notes® Linked to the S&P 500® Index, due April 27, 2012
NYSE Arca, Inc.
Strategic Accelerated Redemption Securities® Linked to the S&P 500® Index, due April 27, 2012
NYSE Arca, Inc.
Accelerated Return Notes® Linked to the S&P 500® Index due July 29, 2011
NYSE Arca, Inc.
Capped Leveraged Index Return Notes® Linked to the S&P 500® Index, due May 25, 2012
NYSE Arca, Inc.
Market Index Target-Term Securities® Linked to the Dow Jones Industrial Averagesm, due May 29, 2015
NYSE Arca, Inc.
Market Index Target-Term Securities® Linked to the Dow Jones Industrial Averagesm, due June 26, 2015
NYSE Arca, Inc.
Capped Leveraged Index Return Notes® Linked to the S&P 500® Index, due June 29, 2012
NYSE Arca, Inc.
Accelerated Return Notes® Linked to the S&P 500® Index due September 30, 2011
NYSE Arca, Inc.
Capped Leveraged Index Return Notes® Linked to the S&P 500® Index, due July 27, 2012
NYSE Arca, Inc.
Market Index Target-Term Securities® Linked to the S&P 500® Index, due July 31, 2015.
NYSE Arca, Inc.
Capped Leveraged Index Return Notes® Linked to the S&P 500® Index, due August 31, 2012
NYSE Arca, Inc.


Securities registered pursuant to Section 12(g) of the Act: None

Indicate by check mark if the registrant is a well-known seasoned issuer, as defined in Rule 405 of the Securities Act.  Yes ü  No

Indicate by check mark if the registrant is not required to file reports pursuant to Section 13 or Section 15(d) of the Act.  Yes  No ü

Indicate by check mark whether the registrant: (1) has filed all reports required to be filed by Section 13 or 15(d) of the Securities Exchange Act of 1934 during the preceding 12 months (or for such shorter period that the registrant was required to file such reports), and (2) has been subject to such filing requirements for the past 90 days.  Yes ü  No

Indicate by check mark whether the registrant has submitted electronically and posted on its corporate Web site, if any, every Interactive Data File required to be submitted and posted pursuant to Rule 405 ofRegulation S-T during the preceding 12 months (or for such shorter period that the registrant was required to submit and post such files).  Yes ü  No

Indicate by check mark if disclosure of delinquent filers pursuant to Item 405 ofRegulation S-K is not contained herein, and will not be contained, to the best of registrant’s knowledge, in definitive proxy or information statements incorporated by reference in Part III of thisForm 10-K or any amendment to thisForm 10-K.

Indicate by check mark whether the registrant is a large accelerated filer, an accelerated filer, a non-accelerated filer, or a smaller reporting company. See the definitions of “large accelerated filer,” “accelerated filer” and “smaller reporting company” in Rule12b-2 of the Exchange Act.

(Check one):
Large accelerated filer ü
 Accelerated filer Non-accelerated filer    (doSmaller reporting company
(do not check if a smaller reporting company) Smaller reporting company

Indicate by check mark whether the registrant is a shell company (as defined inRule 12b-2 of the Act).  Yes  No ü

The aggregate market value of the registrant’s common stock (“Common Stock”) held on June 30, 2010 by non-affiliates iswas approximately $114,282,338,121$144,131,140,753 (based on the June 30, 20092010 closing price of Common Stock of $13.20$14.37 per share as reported on the New York Stock Exchange). As of February 24, 2010,15, 2011, there were 10,032,005,45310,121,154,770 shares of Common Stock outstanding.
Documents Incorporated by reference: Portions of the definitive proxy statement relating to the registrant’s annual meeting of stockholders to be held on May 11, 2011 are incorporated by reference in thisForm 10-K in response to items 10, 11, 12, 13 and 14 of Part III.

DOCUMENTS INCORPORATED BY REFERENCE

Document of the Registrant

Form 10-K Reference Locations

Portions of the 2010 Proxy StatementPART III


Table of Contents
Bank of America Corporation and Subsidiaries

Table of Contents

Bank of America Corporation and Subsidiaries

Part I       
Part IPage
    Page
 
 Business 1
 Item 1A. 
Risk Factors 58
 Item 1B. 
Unresolved Staff Comments 1119
 Item 2. Properties 11
 Item 3.Properties 19
Legal Proceedings 1120
 Item 4. Submission of Matters To A Vote of Security Holders 11
 

Removed and Reserved

20
 1120
Part II   
   
 Item 5. 
Market for Registrant’s Common Equity, Related Stockholder Matters and Issuer Purchases of Equity Securities 1321
 Item 6. 
Selected Financial Data 1321
 Item 7. 
Management’s Discussion and Analysis of Financial Condition and Results of Operations 1422
 
Item 7A. Quantitative and Qualitative Disclosures About Market Risk 112135
 
Item 8. Financial Statements and Supplementary Data 112135
 Item 9. 
Changes in and Disagreements with Accountants on Accounting and Financial Disclosure 203241
Item 9A.Controls And Procedures203
Item 9B.Other Information203
Part III      
 Item 10.Controls And Procedures 241
Other Information243
Directors, Executive Officers and Corporate Governance 204244
 Item 11. 
Executive Compensation 204244
 Item 12. 
Security Ownership of Certain Beneficial Owners and Management and Related Stockholder Matters 204244
 Item 13. 
Certain Relationships and Related Transactions, and Director Independence 205245
 Item 14. 
Principal Accounting Fees and Services 205245
Part IV   
 Item 15. 
Exhibits, Financial Statement Schedules 206246
EX-3.B
EX-4.EE
EX-4.FF
EX-4.GG
EX-4.HH
EX-10.C
EX-10.I
EX-10.DDD
EX-10.EEE
EX-10.III
EX-10.JJJ
EX-10.KKK
EX-10.LLL
EX-12
EX-21
EX-23
EX-24.A
EX-24.B
EX-31.A
EX-31.B
EX-32.A
EX-32.B
EX-101 INSTANCE DOCUMENT
EX-101 SCHEMA DOCUMENT
EX-101 CALCULATION LINKBASE DOCUMENT
EX-101 LABELS LINKBASE DOCUMENT
EX-101 PRESENTATION LINKBASE DOCUMENT
EX-101 DEFINITION LINKBASE DOCUMENT


Part I
Bank of America Corporation and Subsidiaries

Part IItem 1. 

Bank of America Corporation and SubsidiariesBusiness

Item 1.  BusinessGeneral

General

Bank of America Corporation (together, with its consolidated subsidiaries, Bank of America, the Corporation, our company, we or us) is a Delaware corporation, a bank holding company and a financial holding company under the Gramm-Leach-Bliley Act. When used in this report, “the Corporation” may refer to the Corporation individually, the Corporation and its subsidiaries, or certain of the Corporation’s subsidiaries or affiliates. Our principal executive offices are located in the Bank of America Corporate Center, 100 North Tryon Street, Charlotte, North Carolina 28255.

Bank of America is one of the world’s largest financial institutions, serving individual consumers, small- and middle-market businesses, large corporations and governments with a full range of banking, investing, asset management and other financial and risk management products and services. Through our banking subsidiaries (the Banks) and various nonbanking subsidiaries throughout the United States and in selectedcertain international markets, we provide a diversified range of banking and nonbanking financial services and products through six business segments:Deposits, Global Card Services, Home Loans & Insurance, Global Commercial Banking, Global Banking & Markets (GBAM),andGlobal Wealth & Investment Management(GWIM), with the remaining operations recorded inAll Other.

Effective January 1, 2010, we realigned theGlobal Corporate and Investment Banking portion of the formerGlobal Bankingbusiness segment with the formerGlobal Markets business segment to form GBAMand to reflectGlobal Commercial Bankingas a standalone segment.

We are a global franchise, serving customers and clients around the world with operations in all 50 U.S. states, the District of Columbia and more than 40 foreignnon-U.S. countries. As of December 31, 2009, the Bank of America2010, our U.S. retail banking footprint includes approximately 80 percent of the U.S. population, and in the United States, we serve approximately 5957 million consumer and small business relationships with approximately 6,0005,900 retail banking centers, more thanoffices, approximately 18,000 ATMs, nationwide call centers, and the leading online and mobile banking platforms. We have banking centers in 1213 of the 15 fastest growing states and have leadership positions in eightmarket share for deposits in seven of those states. We offer industry-leading support to approximately four million small business owners. We have the No. 1 market share in U.S. retail deposits market share and are the No. 1 issuer of debit cards in the United States. We have the No. 2 market share in credit card products in the United States and we are the No. 1 credit card lender in Europe. We have approximately 8,9005,300 mortgage loan officers

and are the No. 1 mortgage servicer and No. 2 mortgage originator in the United States.

In addition, as of December 31, 2009,2010, our commercial and corporate clients include 98 percent of the U.S. Fortune 1,000 and 8285 percent of the Global Fortune 500 and we serve more than 11,000 issuer clients and 3,500 institutional investors. We are the No. 1 treasury services provider in the United States and a leading provider globally. With our acquisition of Merrill Lynch & Co., Inc. (Merrill Lynch) in 2009, we significantly enhanced our wealth management business andWe are a global leaderleading provider globally in corporate and investment banking and trading across a broad range of asset classes serving corporations, governments, institutions and individuals around the world. We have one of the largest wealth management businesses in the world with approximately 15,000nearly 17,000 financial and wealth advisors and 3,000 other client-facing professionals and more than $2.1$2.2 trillion in net client assets,balances, and we are a leading wealth manager forhigh-net-worth and ultra high net-worthultra-high-net-worth clients. In addition, we have an economic ownership of approximately 34 percent in BlackRock, Inc., a publicly traded investment management company.

Additional information relating to our businesses and our subsidiaries is included in the information set forth in pages 2738 through 4251 of Item 7,

Management’s Discussion and Analysis of Financial Condition and Results of Operations (MD&A) andNote 2326 – Business SegmentInformationto the Notes to the Consolidated Financial Statements in Item 8, Financial Statements and Supplementary Data (Consolidated Financial Statements).

Bank of America’s website is www.bankofamerica.com. Our Annual Reports onForm 10-K, Quarterly Reports onForm 10-Q, Current Reports onForm 8-K and amendments to those reports filed or furnished pursuant to Section 13(a) or 15(d) of the Securities Exchange Act of 1934 are available on our website athttp://investor.bankofamerica.com under the heading SEC Filings as soon as reasonably practicable after we electronically file such material with, or furnish it to, the Securities and Exchange Commission (SEC). In addition, we make available onhttp://investor.bankofamerica.com under the heading Corporate Governance: (i) our Code of Ethics (including our insider trading policy); (ii) our Corporate Governance Guidelines; and (iii) the charter of each committee of our Board of Directors (the Board) (by(accessible by clicking on the committee names under the Committee Composition link), and we also intend to disclose any amendments to our Code of Ethics, or waivers of our Code of Ethics on behalf of our Chief Executive Officer, Chief Financial Officer or Chief Accounting Officer, on our website. All of these corporate governance materials are also available free of charge in print to stockholders who request them in writing to: Bank of America Corporation, Attention: Shareholder Relations, Department, 101 SouthHearst Tower, 214 North Tryon Street, NC1-002-29-01,NC1-027-20-05, Charlotte, North Carolina 28255.28202.


Bank of America 2010     1

Competition


Competition
We operate in a highly competitive environment. Our competitors include banks, thrifts, credit unions, investment banking firms, investment advisory firms, brokerage firms, investment companies, insurance companies, mortgage banking companies, credit card issuers, mutual fund companies ande-commerce and other internet-based companies in addition to those competitors discussed more specifically below. We compete with some of these competitors globally and with others on a regional or product basis. Competition is based on a number of factors including, among others, customer service, quality and range of products and services offered, price, reputation, interest rates on loans and deposits, lending limits and customer convenience. Our ability to continue to compete effectively also depends in large part on our ability to attract new employees and retain and motivate our existing employees, while managing compensation and other costs.

More specifically, our consumer banking Depositsbusiness segment competes with banks, thrifts, credit unions, finance companies and other nonbank organizations offering financial services. Our commercial and large corporate lending businesses competeGlobal Commercial Bankingbusiness segment competes with local, regional and international banks and nonbank financial organizations. In the investment banking, wealth management, investment advisory OurGBAMand brokerage businesses, our nonbanking subsidiariesGWIMbusiness segments compete with U.S. and international commercial banking and investment banking firms, investment advisory firms, brokerage firms, investment companies, mutual funds, hedge funds, private equity funds, trust banks, multi-family offices, advice boutiques and other organizations offering similar services and other investment alternatives available to investors. Our mortgage banking Home Loans & Insurancebusiness segment competes with


Bank of America 20091


banks, thrifts, mortgage brokers, Fannie Mae (FNMA) and Freddie Mac (FHLMC) (collectively, the government sponsored enterprises (GSEs)), and other nonbank organizations offering mortgage banking, mortgage and mortgageinsurance related services. Our cardGlobal Card Services business segment competes in the United States and internationally with banks, consumer finance companies and retail stores with private label credit and debit cards.

We also compete actively for funds. A primary source of funds for the Banks is deposits, and competition for deposits includes other deposit-taking organizations, such as banks, thrifts and credit unions, as well as money market mutual funds. Investment banks and other entities that became bank holding companies and financial holding companies as a result of the recent financial crisis are also competitors for deposits. In addition, we compete for funding in the domestic and international short-term and long-term debt securities capital markets.

Over time, certain sectors of the financial services industry have become more concentrated, as institutions involved in a broad range of financial services have been acquired by or merged into other firms or have declared bankruptcy. This trend continued in 2008 and 2009 asAs a result, this consolidation within the financial crisis caused additional mergers and asset acquisitions amongservices industry participants. This trend toward consolidation has significantly increased the capital base and geographic reach of some of our competitors. This trend hascompetitors and also hastened the globalization of the securities markets. These developments could result in our remaining competitors gaining greater capital and other resources or having stronger local presences and longer operating histories outside the United States.

Our ability to expand certain of our banking operations in additional U.S. states remains subject to various federal and state laws. See “GovernmentGovernment Supervision and Regulation – General”General below for a more detailed discussion of interstate banking and branching legislation and certain state legislation.

Employees

As of December 31, 2009,2010, there were approximately 284,000288,000 full-time equivalent employees with Bank of America. Of these employees, 75,800approximately 80,700 were employed withinDeposits, 24,900approximately 15,000 were employed withinGlobal Card Services, 52,800approximately 58,200 were employed withinHome Loans & Insurance, 22,900approximately 7,100 were employed withinGlobal Commercial Banking, 17,600approximately 34,300 were employed withinGlobalGBAMMarketsand 40,400approximately 40,300 were employed withinGWIM. The remainder were employed elsewhere within our company including various staff and support functions.

None of our domestic employees is subject to a collective bargaining agreement. Management considers our employee relations to be good.

Acquisition and Disposition Activity

As part of our operations, we regularly evaluate the potential acquisition of, and hold discussions with, various financial institutions and other businesses of a type eligible for financial holding company ownership or control. In addition, we regularly analyze the values of, and submit bids for, the acquisition of customer-based funds and other liabilities and assets of such financial institutions and other businesses. We also regularly consider the potential disposition of certain of our assets, branches, subsidiaries or lines of businesses. As a general rule, we publicly announce any material acquisitions or dispositions when a material definitive agreement has been reached.

On January 1, 2009, we completed the acquisition of Merrill Lynch. Additional information on our acquisitions and mergers is included inNote 2 – Merger and Restructuring Activityto the Consolidated Financial Statements which is incorporated herein by reference.

Government Supervision and Regulation

The following discussion describes, among other things, elements of an extensive regulatory framework applicable to bank holding companies, financial holding companies and banks, andincluding specific information about Bank of America. U.S. federal regulation of banks, bank holding companies and financial holding companies is intended primarily for the protection of depositors and the Deposit Insurance Fund (DIF) rather than for the protection of stockholders and creditors. For additional information about recent regulatory programs, initiatives and legislation that impact us, see “Regulatory Initiatives”Regulatory Matters in the MD&A.&A beginning on page 56.


2     Bank of America 2010


General

As a registered bankfinancial holding company and financialbank holding company, Bank of America Corporation is subject to the supervision of, and regular inspection by, the Board of Governors of the Federal Reserve System (Federal Reserve Board). The Banks are organized as national banking associations, which are subject to regulation, supervision and examination by the Office of the Comptroller of the Currency (Comptroller or OCC), the Federal Deposit Insurance Corporation (FDIC), the Federal Reserve Board and other federal and state regulatory agencies. In addition to banking laws, regulations and regulatory agencies, we are subject to various other laws and regulations and supervision and examination by other regulatory agencies, all of which directly or indirectly affect our operations and management and our ability to make distributions to stockholders. For example, our U.S. broker dealer subsidiaries are subject to regulation by and supervision of the SEC, the New York Stock Exchange and the Financial Industry Regulatory Authority (FINRA); our commodities businesses in the United States are subject to regulation by and supervision of the Commodities Futures Trading Commission (CFTC); and our insurance activities are subject to licensing and regulation by state insurance regulatory agencies.

Our non-U.S. businesses are also subject to extensive regulation by various non-U.S. regulators, including governments, securities exchanges, central banks and other regulatory bodies, in the jurisdictions in which the businesses operate. Our financial services operations in the United Kingdom are subject to regulation by and supervision of the Financial Services Authority (FSA).

A U.S. financial holding company, and the companies under its control, are permitted to engage in activities considered “financial in nature” as defined by the Gramm-Leach-Bliley Act and related Federal Reserve Board interpretations (including, without limitation, insurance and securities activities), and therefore may engage in a broader range of activities than permitted for bank holding companies and their subsidiaries.subsidiaries, which are only permitted to engage in activities that are closely related to the business of banking. Unless otherwise limited by the Federal Reserve Board, a financial holding company may engage directly or indirectly in activities considered financial in nature, either de novo or by acquisition, provided the financial holding company gives the Federal Reserve Boardafter-the-fact notice of the new activities. In addition, if the Federal Reserve Board finds that any of the Banks is not well capitalized or well managed, we would be required to enter into an agreement with the Federal Reserve Board to comply with all applicable capital and management requirements and which may contain additional limitations or conditions relating to our activities. The Gramm-Leach-Bliley Act also permits national banks, such as the Banks, to engage in activities considered financial in nature through a financial subsidiary, subject to certain conditions and limitations and with the approval of the OCC.

If the Federal Reserve Board finds that any of the Banks is not well-capitalized or well-managed, we would be required to enter into an agreement with the Federal Reserve Board to comply with all applicable capital and management requirements, which may contain additional limitations or conditions relating to our activities.

2Bank of America 2009


U.S. bank holding companies (including bank holding companies that also are financial holding companies) are also are required to obtain the prior approval of the Federal Reserve Board before acquiring more than five percent of any class of voting stock of any non-affiliated bank. Pursuant to the Riegle-Neal Interstate Banking and Branching Efficiency Act of 1994 (Interstate Banking and Branching Act), a bank holding company may acquire banks located in states other than its home state without regard to the permissibility of such acquisitions under state law, but subject to any state requirement that the

bank has been organized and operating for a minimum period of time, not to exceed five years, and the federal requirement that the bank holding company, after and as a result of the proposed acquisition, controls no more than 10 percent of the total amount of deposits of insured depository institutions in the United States and no more than 30 percent or such lesser or greater amount set by state law of such deposits in that state. At December 31, 2009, we controlled approximately 12 percent of the total amount of deposits of insured institutions in the United States. Subject to certain restrictions, the Interstate Banking and Branching Act also authorizes banks to merge across state lines to create interstate banks. The Interstate BankingAt December 31, 2010, we controlled approximately 12 percent of the total amount of deposits of insured depository institutions in the United States.
In addition to banking laws, regulations and Branching Actregulatory agencies, we are subject to various other laws and regulations, as well as supervision and examination by other regulatory agencies, all of which directly or indirectly affect our operations and management and our ability to make distributions to stockholders. For example, our U.S. broker dealer subsidiaries are subject to regulation by and supervision of the Securities and Exchange Commission (SEC), the New York Stock Exchange and the Financial Industry Regulatory Authority (FINRA); our commodities businesses in the United States are subject to regulation by and supervision of the Commodities Futures Trading Commission (CFTC); and our insurance activities are subject to licensing and regulation by state insurance regulatory agencies.
Ournon-U.S. businesses are also permits a banksubject to open new branchesextensive regulation by variousnon-U.S. regulators, including governments, securities exchanges, central banks and other regulatory bodies, in a statethe jurisdictions in which those businesses operate. Our financial services operations in the United Kingdom (U.K.) are subject to regulation by and supervision of the Financial Services Authority (FSA). In July of 2010, the U.K. proposed abolishing the FSA and replacing it does not already have banking operations if such state enacts a law permitting de novo branching.with the Financial Policy Committee within the Bank of England (FPC) and two new Regulators, the Prudential Regulatory Authority (PRA) and the Consumer Protection and Markets Authority (CPMA). Our U.K. regulated entities will be subject to the supervision of the FPC within the Bank of England for prudential matters and the CPMA for conduct of business matters. The new financial regulatory structure is intended to be in place by the end of 2012. We continue to monitor the development and potential impact of this regulatory restructuring.


Bank of America 2010     3


Changes in Legislation and Regulations

Proposals to change the laws and regulations governing the banking and financial services industries are frequently introduced in Congress, in the state legislatures and before the various bank regulatory or financial regulatory agencies as well as by lawmakers and regulators in jurisdictions outside the United States where we operate. For example, in 2009, the U.S. Department of the Treasury (U.S. Treasury), the FDIC and the Federal Reserve Board developed programs and facilities designed to support the banking and financial services industries during the financial crisis. Congress and the U.S.federal government have continued to evaluate and develop legislation, programs and initiatives designed to, among other things, stabilize the financial and housing markets, stimulate the economy, including the U.S.federal government’s foreclosure prevention program, and prevent future financial crises by further regulating the financial services industry. As a result of the recent financial crisis and the ongoing challenging economic environment, we expectanticipate additional changes to be proposedlegislative and regulatory proposals and initiatives as well as continued legislative and regulatory scrutiny of the financial services industry. TheHowever, at this time we cannot determine the final form of any proposed programs or initiatives or related legislation, the likelihood and timing of any other future proposals or legislation, and the impact they might have on us cannotus.
On July 21, 2010, the Dodd-Frank Wall Street Reform and Consumer Protection Act (Financial Reform Act) was signed into law. The Financial Reform Act provides for sweeping financial regulatory reform and will alter the way in which we conduct certain businesses.
The Financial Reform Act contains a broad range of significant provisions that could affect our businesses, including, without limitation, the following:
• mandating that the Federal Reserve Board limit debit card interchange fees;
• banning banking organizations from engaging in proprietary trading and restricting their sponsorship of, or investing in, hedge funds and private equity funds, subject to limited exceptions;
• increasing regulation of the derivative markets through measures that broaden the derivative instruments subject to regulation and requiring clearing and exchange trading as well as imposing additional capital and margin requirements for derivative market participants;
• changing the assessment base used in calculating FDIC deposit insurance fees from assessable deposits to total assets less tangible capital;
• providing for heightened capital, liquidity, and prudential regulation and supervision over systemically important financial institutions;
• providing for new resolution authority to establish a process to unwind large systemically important financial institutions and requiring the development and implementation of recovery and resolution plans;
• creating a new regulatory body to set requirements around the terms and conditions of consumer financial products and expanding the role of state regulators in enforcing consumer protection requirements over banks.
• disqualifying trust preferred securities and certain other hybrid capital securities from Tier 1 capital;
• including a variety of corporate governance and executive compensation provisions and requirements; and
• requiring securitizers to retain a portion of the risk that would otherwise be transferred into certain securitization transactions.
The Financial Reform Act has had, and will continue to have, a significant and negative impact on our earnings through fee reductions, higher costs and new restrictions, by reducing available capital. The Financial Reform Act also has had and may continue to have a material adverse impact on the value of certain assets and liabilities held on our balance sheet. As previously announced on July 16, 2010, as a result of the Financial Reform Act and its related rules and subject to final rulemaking over the next year, we believe that our debit card revenue will be determined at this time.adversely impacted beginning in the third quarter of 2011. In 2010, our estimate of revenue loss due to the Financial

Reform Act was approximately $2.0 billion annually. As a result, we recorded a non-tax deductible goodwill impairment charge forGlobal Card Servicesof $10.4 billion in 2010. The goodwill impairment analysis includes limited mitigation actions withinGlobal Card Servicesto recapture the lost revenue. We have identified other potential mitigation actions, but they are in the early stages of development and some of them may impact other segments. For additional information, regarding proposed regulatoryrefer to Complex Accounting Estimates – Goodwill and legislative initiatives, see “Executive Summary Intangible Assets– Regulatory Overview”Global Card Services Impairment, in the MD&A.&A beginning on page 110 andNote 10 – Goodwill and Intangible Assetsto the Consolidated Financial Statements.
We anticipate that the final regulations associated with the Financial Reform Act will include limitations on certain activities, including limitations on the use of a bank’s own capital for proprietary trading and sponsorship or investment in hedge funds and private equity funds (Volcker Rule). Regulations implementing the Volcker Rule are required to be in place by October 21, 2011, and the Volcker Rule becomes effective 12 months after such rules are final or on July 21, 2012, whichever is earlier. The Volcker Rule then gives banking entities two years from the effective date (with opportunities for additional extensions) to bring activities and investments into conformance. In anticipation of the adoption of the final regulations, we have begun winding down our proprietary trading line of business. The ultimate impact of the Volcker Rule or the winding down of this business, and the time it will take to comply or complete, continues to remain uncertain. The final regulations issued may impose additional operational and compliance costs on us.
Additionally, the Financial Reform Act includes measures to broaden the scope of derivative instruments subject to regulation by requiring clearing and exchange trading of certain derivatives, imposing new capital and margin requirements for certain market participants and imposing position limits on certainover-the-counter derivatives. The Financial Reform Act grants the U.S. Commodity Futures Trading Commission (CFTC) and the SEC substantial new authority and requires numerous rulemakings by these agencies. Generally, the CFTC and SEC have until July 16, 2011 to promulgate the rulemakings necessary to implement these regulations. The ultimate impact of these derivatives regulations, and the time it will take to comply, continues to remain uncertain. The final regulations will impose additional operational and compliance costs on us and may require us to restructure certain businesses and negatively impact our revenues and results of operations.
Although the ratings agencies have indicated that our credit ratings currently reflect their expectation that, if necessary, we would receive significant support from the U.S. government, all three major ratings agencies have indicated they will reevaluate, and could reduce the uplift they include in our ratings for government support for reasons arising from financial services regulatory reform proposals or legislation. In the event of certain credit ratings downgrades, our access to credit markets, liquidity and our related funding costs would be materially adversely affected. For additional information about our credit ratings, see Capital Management and Liquidity Risk in the MD&A beginning on pages 63 and 67, respectively.
Most provisions of the Financial Reform Act require various federal banking and securities regulators to issue regulations to clarify and implement its provisions or to conduct studies on significant issues. These proposed regulations and studies are generally subject to a public notice and comment period. The timing of issuance of final regulations, their effective dates and their potential impacts to our businesses will be determined over the coming months and years. As a result, the ultimate impact of the Financial Reform Act’s final rules on our businesses and results of operations will depend on regulatory interpretation and rulemaking, as well as the success of any of our actions to mitigate the negative earnings impact of certain provisions.


4     Bank of America 2010


Capital and Operational Requirements

The Federal Reserve Board, the OCC and the FDIC have issued substantially similar risk-based and leverage capital guidelines applicable to U.S. banking organizations. In addition, these regulatory agencies may from time to time require that a banking organization maintain capital above the minimum prescribed levels, whether because of its financial condition or actual or anticipated growth. The Federal Reserve BoardBoard’s risk-based guidelines define a three-tier capital framework. Tier 1 capital includes common shareholders’ equity, common equivalent securities (CES), trust preferred securities and noncontrolling interests in limited amounts and qualifying preferred stock, and any Common Equivalent Securities (CES), less goodwill and other adjustments. The Financial Reform Act includes a provision under which our previously issued and outstanding trust preferred securities in the aggregate amount of $19.9 billion (approximately 137 basis points (bps) of Tier 1 capital) at December 31, 2010, will no longer qualify as Tier 1 capital effective January 1, 2013. Tier 2 capital consists of preferred stock not qualifying as Tier 1 capital, mandatorily convertible debt, limited amounts of subordinated debt, other qualifying term debt, the allowance for credit losses up to 1.25 percent of risk-weighted assets and other adjustments. Tier 3 capital includes subordinated debt that (i) is

unsecured, (ii) is fully paid, (iii) has an original maturity of at least two years, (iv) is not redeemable before maturity without prior approval by the Federal Reserve Board and (v) includes a lock-in clause precluding payment of either interest or principal if the payment would cause the issuing bank’s risk-based capital ratio to fall or remain below the required minimum. The sum of Tier 1 and Tier 2 capital less investments in unconsolidated subsidiaries represents our qualifying total capital. Risk-based capital ratios are calculated by dividing Tier 1 and total capital by risk-weighted assets. Assetsassets, which is calculated by assigning assets and off-balance sheet exposures are assigned to one of four categories of risk-weights, based primarily on relative credit risk. The minimum Tier 1 capital ratio is four percent and the minimum total capital ratio is eight percent. A “well-capitalized” institution must generally maintain capital ratios 200 bps higher than the minimum guidelines.

Our Tier 1 and total risk-based capital ratios under these guidelines at December 31, 20092010 were 10.4011.24 percent and 14.6615.77 percent. At December 31, 2009,2010, we had no subordinated debt that qualified as Tier 3 capital. While not an explicit requirement of law or regulation, bank regulatory agencies have stated that they expect shares of common capitalstock to be the primary component of a financial holding company’s Tier 1 capital and that financial holding companies should maintain a Tier 1 common capital ratio of at least 4%.four percent. The Tier 1 common capital ratio is determined by dividing Tier 1 common capital by risk weightedrisk-weighted assets. We calculate Tier 1 common capital as Tier 1 capital, which includes CES, less preferred stock, trust preferred securities, hybrid securities and noncontrolling interest. As of December 31, 2009,2010, our Tier 1 common capital ratio was 7.818.60 percent.

The leverage ratio is determined by dividing Tier 1 capital by adjusted quarterly average total assets, after certain adjustments. Well-capitalized“Well-capitalized” bank holding companies must have a minimum Tier 1 leverage ratio of threefour percent and not be subject to a Federal Reserve Board directive to maintain higher capital levels. “Well-Capitalized” national banks must maintain a Tier 1 leverage ratio of at least five percent and not be subject to a Federal Reserve Board directive to maintain higher capital levels. Our leverage ratio at December 31, 20092010 was 6.917.21 percent, which exceeded our leverage ratio requirement.

For additional information about our calculation of regulatory capital and capital composition, see Capital Management – Regulatory Capital in the MD&A beginning on page 63, andNote 18 – Regulatory Requirements and Restrictionsto the Consolidated Financial Statements.

The Federal Deposit Insurance Corporation Improvement Act of 1991 (FDICIA), among other things, identifies five capital categories for insured

depository institutions (well capitalized,(well-capitalized, adequately capitalized, undercapitalized, significantly undercapitalized and critically undercapitalized) and requires the respective federal regulatory agencies to implement systems for “prompt corrective action” for insured depository institutions that do not meet minimum capital requirements within such categories. FDICIA imposes progressively more restrictive constraints on operations, management and capital distributions, depending on the category in which an institution is classified. Failure to meet the capital guidelines could also subject a banking institution to capital-raising requirements. An “undercapitalized” bank must develop a capital restoration plan and its parent holding company must guarantee that bank’s compliance with the plan. The liability of the parent holding company under any such guarantee is limited to the lesser of five percent of the bank’s assets at the time it became “undercapitalized” or the amount needed to comply with the plan. Furthermore, in the event of the bankruptcy of the parent holding company, such guarantee would take priority over the parent’s general unsecured creditors. In addition, FDICIA requires the various regulatory agencies to prescribe certain non-capital standards for safety and soundness relating generally to operations and management, asset quality and executive compensation, and permits regulatory action against a financial institution that does not meet such standards.

The various regulatory agencies have adopted substantially similar regulations that define the five capital categories identified by FDICIA, using the total risk-based capital, Tier 1 risk-based capital and leverage capital ratios as the relevant capital measures. Such regulations establish various degrees of corrective action to be taken when an institution is considered undercapitalized. Under the regulations, a “well capitalized”“well-capitalized” institution must have a Tier 1 risk-based capital ratio of at least six percent, a total risk-based capital ratio of at least ten percent and a leverage


Bank of America 20093


ratio of at least five percent and not be subject to a capital directive order. Under these guidelines, each of the Banks was considered well capitalized as of December 31, 2009.

Regulators2010.

Pursuant to FDICIA, regulators also must take into consideration: (a) concentrations of credit risk; (b) interest rate risk; and (c) risks from non-traditional banking activities, such as derivatives, securities and insurance activities, as well as an institution’s ability to manage those risks, when determining the adequacy of an institution’s capital. This evaluation is made as a part of the institution’s regular safety and soundness examination. In addition, Bank of America Corporation, and any Bank with significant trading activity, must incorporate a measure for market risk in their regulatory capital calculations.

In addition, in June 2004, the Basel Committee on Banking Supervision (the Basel Committee) published the Basel II Accord with the intent of more closely aligning regulatory capital requirements with underlying risks, similar to economic capital. While economic capital is measured to cover unexpected losses, the Corporation also manages regulatory capital to adhere to regulatory standards of capital adequacy. The Basel Committee, which is designedconsists of central banks and bank supervisors from 13 countries including the United States, does not possess any formal supervisory or legal authority over institutions in its member countries. Instead, the Basel Committee formulates supervisory guidelines that it recommends to addressits member countries with the expectation that these guidelines will be implemented in a manner best suited to each country’s own national system.
The Basel II Final Rule (Basel II) was published in December 2007 and established requirements for U.S. implementation of the Basel II Rules and provided detailed requirements for a new regulatory capital framework. This regulatory capital framework includes requirements related to credit risk, market risk and operational risk in(Pillar 1), supervisory requirements (Pillar 2) and disclosure requirements (Pillar 3). The Corporation began Basel II parallel implementation on April 1, 2010.


Bank of America 2010     5


Designated U.S. financial institutions are required to complete a minimum parallel qualification period under Basel II of four consecutive successful quarters before receiving regulatory approval to report regulatory capital using the international banking markets. In December 2007,Basel II methodology and exiting the parallel period. During the parallel period, the resulting capital calculations under both the current risk-based capital rules (Basel I) and Basel II will be reported to the financial institutions’ regulatory supervisors. Once the parallel period is successfully completed and we have received approval to exit parallel, we will transition to Basel II as the methodology for calculating regulatory capital. Basel II provides for a three-year transitional floor subsequent to exiting parallel, after which Basel I may be discontinued. The Collins Amendment within the Financial Reform Act and the U.S. banking regulatorsregulators’ subsequent Notice of Proposed Rulemaking published by the Federal Reserve Board on December 14, 2010 propose however that the current three-year transitional floors under Basel II be replaced with a permanent risk based capital floor as defined under Basel I.
On December 16, 2010, U.S. regulators issued a Notice of Proposed Rulemaking on the Risk-Based Capital Guidelines for Market Risk (Market Risk Rules), reflecting partial adoption of the Basel Committee’s July 2009 consultative document on the topic. We anticipate U.S. regulators will adopt the Market Risk Rules in mid-2011. This change is expected to significantly increase the capital requirements for our trading assets and liabilities, including derivatives exposures which meet the definition established by the regulatory agencies. We continue to evaluate the capital impact of the proposed rules and currently anticipate being fully compliant with any final rules which require us and certainby the projected implementation date of our U.S. Banks to implement Basel II. Inyear-end 2011.
On December 2009,16, 2010, the Basel Committee on Banking Supervision released consultative documents on bothissued “Basel III: A global regulatory framework for more resilient banks and banking systems” (Basel III), proposing a January 2013 implementation date for Basel III. If implemented by U.S. regulators as proposed, Basel III could significantly increase our capital requirements. Basel III and the Financial Reform Act propose the disqualification of trust preferred securities from Tier 1 capital, with the Financial Reform Act proposing that the disqualification be phased in from 2013 to 2015. Basel III also proposes the deduction of certain assets from capital (deferred tax assets, mortgage servicing rights (MSRs), investments in financial firms and pension assets, among others, within prescribed limitations), the inclusion of other comprehensive income in capital, increased capital for counterparty credit risk, and new minimum capital and liquidity. Additionally,buffer requirements. The phase-in period for the capital deductions is proposed to occur in 20 percent increments from 2014 through 2018 with full implementation by December 31, 2018. The increase in capital requirements for counterparty credit risk is proposed to be effective January 2013. The phase-in period for the new minimum capital requirements and related buffers is proposed to occur between 2013 and 2019. U.S. banking regulators continue to refine market risk requirements, which also have a regulatory capital impact. Revised requirements have not been issued but are expected to begin the final rulemaking processes for Basel III in 2010.early 2011 and have indicated a goal to adopt final rules by year-end 2011 or early 2012. For additional information regarding these regulatory initiatives and proposals, see “Executive Summaryon our MSRs, refer toNote 25 – Regulatory Overview” in the MD&A andNote 16 – Regulatory RequirementsMortgage Servicing Rightsand Restrictionsto the Consolidated Financial Statements. For additional information on deferred tax assets, refer toNote 21 – Income Taxesto the Consolidated Financial Statements.
If Basel III is implemented in the U.S. consistent with Basel Committee rules, beginning in January 2013, we would be required to maintain minimum capital ratio requirements of 6.0 percent for Tier 1 capital and 8.0 percent for Total capital. The proposed minimum requirement for common equity Tier 1 capital is 3.5 percent in 2013 and would increase to 4.5 percent in 2015. Basel III also includes three capital buffers which would be phased in over time and impact all three capital ratios. These buffers include a capital conservation buffer that would start at 0.63 percent in 2016 and increase to 2.5 percent in 2019. Thus, the minimum capital ratio requirements including the capital conservation buffer in 2019 would be 7.0 percent for common equity Tier 1 capital, 8.5 percent for Tier 1 capital and 10.5 percent

for Total capital. If ratios fall below the minimum requirement plus the capital conservation buffer, such as 10.5 percent for Total capital, an institution would be required to restrict dividends, share repurchases and discretionary bonuses. Additionally, Basel III also includes a countercyclical buffer of up to 2.5 percent that regulators could require in periods of excess credit growth. The countercyclical buffer is to be comprised of loss-absorbing capital, such as common equity, and is meant to retain additional capital during periods of strong credit expansion, providing incremental protection in the event of a material market downturn. The ratios presented above do not include the third buffer requirement for systemically important financial institutions, which the Basel Committee continues to assess and has not yet quantified. The countercyclical and systemic buffers are scheduled to be phased in from 2013 through 2019. U.S. regulators are expected to begin the rulemaking processes for Basel III in early 2011 and have indicated a goal to adopt final rules by end of 2011 or early 2012.
These regulatory changes also require approval by the regulatory agencies of analytical models used as part of our capital measurement and assessment, especially in the case of more complex models. If these more complex models are not approved, it could require financial institutions to hold additional capital, which in some cases could be significant.
We expect to maintain a Tier 1 common capital ratio in excess of 8 percent as the regulatory rule changes are implemented without needing to raise new equity capital. We have made the implementation and mitigation of these regulatory changes a strategic priority. We also note there remains significant uncertainty on the final impacts as the U.S. has issued only final rules for Basel II and a Notice of Proposed Rulemaking for the Market Risk Rules at this time. Impacts may change as the U.S. finalizes rules for Basel III and the regulatory agencies interpret the final rules during the implementation process.
In addition to the capital proposals, in December 2010 the Basel Committee proposed two measures of liquidity risk. The Liquidity Coverage Ratio identifies the amount of unencumbered, high quality liquid assets a financial institution holds that can be used to offset the net cash outflows the institution would encounter under an acute30-day

stress scenario. The Net Stable Funding Ratio measures the amount of longer-term, stable sources of funding employed by a financial institution relative to the liquidity profiles of the assets funded and the potential for contingent calls on funding liquidity arising from off-balance sheet commitments and obligations, over a one-year period. These two minimum liquidity standards are also considered part of Basel III. The Basel Committee expects the Liquidity Coverage Ratio to be implemented in January 2015 and the Net Stable Funding Ratio to be implemented in January 2018, following observation periods beginning in 2012. We continue to monitor the development and potential impact of these capital proposals.

Distributions

Our funds for cash distributions to our stockholders are derived from a variety of sources, including cash and temporary investments. The primary source of such funds, and funds used to pay principal and interest on our indebtedness, is dividends received from the Banks. Each of the Banks is subject to various regulatory policies and requirements relating to the payment of dividends, including requirements to maintain capital above regulatory minimums. The appropriate federal regulatory authority is authorized to determine, under certain circumstances relating to the financial condition of a bank or bank holding company, that the payment of dividends would be an unsafe or unsound practice and to prohibit payment thereof. For additional information regarding the restrictions on our ability to receive dividends or other distributions from the Banks, see Item 1A. Risk Factors.


6     Bank of America 2010


In addition, the ability of Bank of America Corporation and the Banks to pay dividends may be affected by the various minimum capital requirements and the capital and non-capital standards established under FDICIA, as described above. The right of Bank of America Corporation, our stockholders and our creditors to participate in any distribution of the assets or earnings of our subsidiaries is further subject to the prior claims of creditors of the respective subsidiaries.

For additional information regarding the requirements relating to the payment of dividends, including the minimum capital requirements, seeNote 15 – Shareholders’ Equity and Earnings Per Common ShareandNote 1618 – Regulatory Requirements and Restrictionsto the Consolidated Financial Statements.

Source of Strength

According to the Financial Reform Act and Federal Reserve Board policy, bank holding companies are expected to act as a source of financial strength to each subsidiary bank and to commit resources to support each such subsidiary. This support may be required at times when a bank holding company may not be able to provide such support. Similarly, under the cross-guarantee provisions of the Federal Deposit Insurance Act,FDICIA, in the event of a loss suffered or anticipated by the FDIC–FDIC – either as a result of default of a banking subsidiary or related to FDIC assistance provided to such a subsidiary in danger of default–default – the other Banksaffiliate banks of such a subsidiary may be assessed for the FDIC’s loss, subject to certain exceptions.

Deposit Insurance

Deposits placed at the U.S. Banks are insured by the FDIC, subject to limits and conditions of applicable law and the FDIC’s regulations. In 2009,Pursuant to the Financial Reform Act, FDIC insurance coverage limits were temporarilypermanently increased from $100,000 to $250,000 per customer untilcustomer. The Financial Reform Act also provides for unlimited FDIC insurance coverage for non-interest bearing demand deposit accounts for a two-year period beginning on December 31, 2010 and ending on January 1, 2013. The FDIC administers the DIF, and all insured depository institutions are required to pay assessments to the FDIC that fund the DIF. AssessmentsThe Financial Reform Act changed the methodology for calculating deposit insurance assessments from the amount of an insured depository institution’s domestic deposits to its total assets minus tangible capital. On February 7, 2011 the FDIC issued a new regulation implementing revisions to the assessment system mandated by the Financial Reform Act. The new regulation will be effective April 1, 2011 and will be reflected in the June 30, 2011 FDIC fund balance and the invoices for assessments due September 30, 2011. As a result of the new regulations, we expect to incur higher annual deposit insurance assessments. We have identified potential mitigation actions, but they are in the early stages of development and we are not able to directly control the basis or the amount of premiums that we are required if theto pay for FDIC insurance or for other fees or assessment obligations imposed on financial institutions. Any future increases in required deposit insurance premiums or other bank industry fees could have a significant adverse impact on our financial condition and results of operations.
The FDIC is required to maintain at least a designated minimum ratio of the DIF to insured deposits in the United States falls below 1.15%.States. The Financial Reform Act requires the FDIC to assess insured depository institutions to achieve a DIF ratio of at least 1.35 percent by September 30, 2020. The FDIC has recently adopted new regulations that establish a long-term target DIF ratio of greater than two percent. As a result of the ongoing instability in the economy and the failure of other U.S. depository institutions, the DIF ratio is currently is below the required leveltargets and the FDIC has adopted a restoration plan that will result in

substantially higher deposit insurance assessments for all depository institutions over the coming years. On December 30, 2009, the FDIC required all depository institutions to prepay deposit insurance assessments for the next three years in order to provide liquidity to the DIF. Deposit insurance assessment rates are subject to change by the FDIC and will be impacted by the overall economy and the stability of the banking industry as a whole.

Transactions with Affiliates

The U.SU.S. Banks are subject to restrictions under federal law that limit certain types of transactions between the Banks and their non-bank affiliates. In general, the U.SU.S. Banks are subject to quantitative and qualitative limits on extensions of credit, purchases of assets and certain other transactions involving Bank of America and its non-bank affiliates. Transactions between the U.S. Banks and their nonbanknon-bank affiliates are required to be on armsarm’s length terms.

Privacy and Information Security

We are subject to many U.S., state and international laws and regulations governing requirements for maintaining policies and procedures to protect the non-public confidential information of our customers. The Gramm-Leach-Bliley Act requires the Banks to periodically disclose Bank of America’s privacy policies and practices relating to sharing such information and enables retail customers to opt out of our ability to market to affiliates and non-affiliates under certain circumstances.

Additional Information

See also the following additional information which is incorporated herein by reference: Net Interest Income (under the captions “FinancialFinancial Highlights – Net Interest Income”Income and “SupplementalSupplemental Financial Data”Data in the MD&A and Tables I, II and XIII of the Statistical Tables); Securities (under the caption “BalanceBalance Sheet Analysis – Assets – Debt Securities”Securities and “MarketMarket Risk Management – Interest Rate Risk Management for Nontrading Activities – Securities”Securities in the MD&A andNote 1 – Summary of Significant Accounting PrinciplesandNote 5 – Securitiesto the Consolidated Financial Statements); Outstanding Loans and Leases (under the caption “BalanceBalance Sheet AnalysisOverview – Assets – Loans and Leases”Leases and “CreditCredit Risk Management”Management in the MD&A, Table IV of the Statistical Tables, andNote 1 – Summary of Significant Accounting PrinciplesandNote 6 – Outstanding Loans and Leasesto the Consolidated Financial Statements); Deposits (under the caption “BalanceBalance Sheet AnalysisOverview – Deposits”Liabilities – Deposits and “LiquidityLiquidity Risk and Capital Management – Funding and Liquidity Risk Management”Management in the MD&A andNote 11 – Depositsto the Consolidated Financial Statements); Short-term Borrowings (under the caption “BalanceBalance Sheet AnalysisOverview – Liabilities – Commercial Paper and Other Short-term Borrowings”Borrowings and “LiquidityLiquidity Risk and Capital Management – Funding and Liquidity Risk Management”Management in the MD&A, Table IX of the Statistical Tables andNote 12 – Federal Funds Sold, Securities Borrowed or Purchased Under Agreements to Resell and Short-term BorrowingsandNote 13 – Long-term Debtto the Consolidated Financial Statements); Trading Account Assets and Liabilities (under the caption “BalanceBalance Sheet


4Bank of America 2009


Analysis Overview – Federal Funds SoldAssets – Trading Accounts Assets and Securities Borrowed or Purchased Under Agreements to Resell”, “Balance Sheet Analysis – Federal Funds Purchased and Securities Loaned or Sold Under Agreements to Repurchase” and “MarketMarket Risk Management – Trading Risk Management”Management in the MD&A andNote 3 – Trading Account Assets andLiabilitiesto the Consolidated Financial Statements); Market Risk Management (under the caption “MarketMarket Risk Management”Management in the MD&A); Liquidity Risk Management (under the caption “LiquidityLiquidity Risk and Capital Management” in the MD&A); Compliance Risk Management (under the Caption “Compliancecaption Compliance Risk Management”Management in the MD&A) and Operational Risk Management (under the caption “OperationalOperational Risk Management”Management in the MD&A); and Performance by Geographic Area (underNote 2528 – Performance by Geographical Areato the Consolidated Financial Statements).


Bank of America 2010     7

Item 1A.  Risk Factors


Item 1A. Risk Factors
In the course of conducting our business operations, we are exposed to a variety of risks, thatsome of which are inherent toin the financial services industry.industry and others of which are more specific to our own businesses. The following discussesdiscussion addresses some of the key inherent riskrisks that could affect our businesses, operations, and financial condition. Other factors that could affect our businessfinancial condition and operations as well as other risk factors which are particularly relevant to usdiscussed in Forward-looking Statements in the current period of significant economic and market disruption. OtherMD&A. However, other factors besides those discussed below or elsewhere in this report could also adversely affect our business andbusinesses, operations, and thesefinancial condition. Therefore, the risk factors below should not be considered a complete list of potential risks that we may affect us.

face.

Our businesses and earningsresults of operations have been, and may continue to be, negativelymaterially and adversely affected by adverse businessthe U.S. and international financial markets and economic conditions.conditions generally.
Our businesses and earningsresults of operations are materially affected by the financial markets and general business and economic conditions in the United States and abroad. Given the concentration of our business activities in the United States, we are particularly exposed to downturns in the U.S. economy. For example,abroad, including factors such as a result of the challenging economic environment there continues to be a greater likelihood that an elevated number of our customers or counterparties will become delinquent on their loans or other obligations to us, which, in turn, may continue to result in a high level of charge-offs and provision for credit losses, all of which would adversely affect our earnings and capital levels.

General business and economic conditions that could affect us include the level and volatility of short-term and long-term interest rates, inflation, home prices, unemployment and under-employment levels, bankruptcies, household income, consumer spending, fluctuations in both debt and equity capital markets, liquidity of the global financial markets, the availability and cost of capital and credit, investor sentiment and confidence in the financial markets, and the strength of the U.S. economy and the othernon-U.S. economies in which we operate. The deterioration of any of these conditions can adversely affect our consumer and commercial businesses and securities portfolios, our level of charge-offs and provision for credit losses, our capital levels and liquidity and our results of operations.

U.S. financial markets have improved from the severe financial crisis that dominated the domestic economy in the second half of 2008 and early 2009, but mortgage markets remain fragile. The financial crisis that gripped the European Union beginning in spring 2010 directly affected U.S. financial market behavior and the financial services industry. Any intensification of Europe’s financial crisis or the inability to address the sources of future financial turmoil in Europe may adversely affect the U.S. and international financial markets and the financial services industry. Such adverse effect may involve declines in liquidity, loss of investor confidence in the financial services industry, disruptions in credit markets, declines in the values of many asset classes, reductions in home prices and increased unemployment.
Although the U.S. economy has continued to recover throughout 2010 and growth of real Gross Domestic Product strengthened in the second half of 2010, the elevated levels of unemployment and household debt, along with continued stress in the consumer and commercial real estate markets, pose challenges for domestic economic performance and the banking environment. Consumer spending, exports and business investment in equipment and software rose during 2010, and showed accelerated momentum in the second half of 2010, but labor markets and housing markets remain weak and pose risks. The sustained high unemployment rate and the lengthy duration of unemployment have directly impaired consumer finances and pose risks to the financial services sector. The housing market remains weak and the elevated levels of distressed and delinquent mortgages add a significant degree of risk to the mortgage market, in addition to risks inherent to the business of banking. The risks related to the distressed mortgage market may be accentuated by attempts to forestall foreclosure proceedings, as well as our earnings.

In 2009, weak economic conditions instate and federal investigations into foreclosure practices throughout the United States and abroad continued tofinancial services industry. These factors may adversely affect many of our businessescredit quality, bank lending and the general financial services sector.

These conditions, as well as any further challenges stemming from the continuing global economic recovery and recent financial reform initiatives, such as the Financial Reform Act, could have a material adverse effect on our earnings. Dramaticbusinesses and results of operations in the future.

For additional information about economic conditions and challenges discussed above, see Executive Summary – 2010 Economic and Business Environment in the MD&A beginning on page 25.
Liquidity Risk
Liquidity Risk is the Potential Inability to Meet Our Contractual and Contingent Financial Obligations, on- or Off-Balance Sheet, as they Become Due.
Adverse changes to our credit ratings from the major credit ratings agencies could have a material adverse effect on our liquidity, cash flows, competitive position, financial condition and results of operations by significantly limiting our access to the funding or capital markets, increasing our borrowing costs, or triggering additional collateral or funding requirements under certain bilateral provisions of our trading and collateralized financing contracts.
Our borrowing costs and ability to raise funds are directly impacted by our credit ratings. In addition, credit ratings may be important to customers or counterparties when we compete in certain markets and when we seek to engage in certain transactions including OTC derivatives. Credit ratings and outlooks are opinions on our creditworthiness and that of our obligations or securities, including long-term debt, short-term borrowings, preferred stock and other securities, including asset securitizations. Our credit ratings are subject to ongoing review by the ratings agencies and thus may change from time to time based on a number of factors, including our own financial strength and operations as well as factors not under our control, such as rating-agency-specific criteria or frameworks for our industry or certain security types, which are subject to revision from time to time, and conditions affecting the financial services industry generally.
There can be no assurance that we will maintain our current ratings. A reduction in certain of our credit ratings or the ratings of certain asset-backed securitizations would likely have a material adverse effect on our liquidity, access to credit markets, the related cost of funds, our businesses and on certain trading revenues, particularly in those businesses where counterparty creditworthiness is critical. In connection with certainover-the-counter (OTC) derivatives contracts and other trading agreements, counterparties may require us to provide additional collateral or to terminate these contracts and agreements and collateral financing arrangements in the event of a credit ratings downgrade. Termination of these contracts and agreements could cause us to sustain losses and impair our liquidity by requiring us to make significant cash payments or securities movements. If Bank of America Corporation’s or Bank of America, N.A.’s commercial paper or short-term credit ratings (which currently have the following ratings:P-1 by Moody’s,A-1 by S&P and F1+ by Fitch) were downgraded by one or more levels, the potential loss of short-term funding sources such as commercial paper or repurchase agreement financing and the effect on our incremental cost of funds would be material.
The ratings agencies have indicated that, as a systemically important financial institution, our credit ratings currently reflect their expectation that, if necessary, we would receive significant support from the U.S. government. All three major ratings agencies, however, have indicated they will reevaluate and could reduce the uplift they include in our ratings for government support for reasons arising from financial services regulatory reform proposals or legislation. In February 2010, S&P affirmed our current credit ratings but revised the outlook to negative from stable based on its belief that it is less certain whether the U.S. government would be willing to provide extraordinary support. On July 27, 2010, Moody’s affirmed our current ratings but revised the outlook to negative from stable due to its expectation for lower levels of government support over time as a result of the passage of the Financial Reform Act. Also, on October 22, 2010, Fitch placed our credit ratings on Rating Watch Negative from stable outlook due to proposed rulemaking that could negatively impact its assessment of future systemic government


8     Bank of America 2010


support. Any expectation that government support may be diminished or withheld in the future would likely have a negative impact on the company’s credit ratings. The timing of the agencies’ assessment of potential government support, as well as its impact on our ratings, is currently uncertain.
For additional information about the company’s credit ratings, see Liquidity Risk – Credit Ratings in the MD&A beginning on page 70.
Our liquidity, cash flows, financial condition and results of operations, and competitive position may be significantly adversely affected if we are unable to access capital markets, continue to raise deposits, sell assets on favorable terms, or if there is an increase in our borrowing costs.
Liquidity is essential to our businesses. We fund our assets primarily with globally sourced deposits in our bank entities, as well as secured and unsecured liabilities transacted in the capital markets. We rely on certain unsecured and secured funding sources, such as the commercial paper and repo markets, which are typically short-term and credit-sensitive in nature. We also engage in asset securitization transactions to fund consumer lending activities. Our liquidity could be significantly adversely affected by an inability to access the capital markets; illiquidity or volatility in the capital markets; unforeseen outflows of cash, including customer deposits, funding for commitments and contingencies; inability to sell assets on favorable terms; or negative perceptions about our short- or long-term business prospects, including changes in our credit ratings. Several of these factors may arise due to circumstances beyond our control, such as a general market disruption, negative views about the financial services industry generally, changes in the regulatory environment, actions by credit ratings agencies or an operational problem that affects third parties or us. For example, during the recent financial crisis our ability to raise funding was at times adversely affected in the U.S. and international markets.
Our cost of obtaining funding is directly related to prevailing market interest rates and to our credit spreads. Credit spreads are the amount in excess of the interest rate of U.S. Treasury securities, or other benchmark securities, of the same maturity that we need to pay to our funding providers. Increases in interest rates and our credit spreads can significantly increase the cost of our funding. Changes in our credit spreads are market-driven, and may be influenced by market perceptions of our creditworthiness. Changes to interest rates and our credit spreads occur continuously and may be unpredictable and highly volatile.
For additional information about our liquidity position and other liquidity matters, including credit ratings and outlooks and the policies and procedures we use to manage our liquidity risks, see Capital Management and Liquidity Risk in the MD&A beginning on pages 63 and 67, respectively.
Bank of America Corporation is a holding company and as such we are dependent upon our subsidiaries for liquidity, including our ability to pay dividends to stockholders.
Bank of America Corporation is a separate and distinct legal entity from our banking and nonbanking subsidiaries. We evaluate and manage liquidity on a legal entity basis. Legal entity liquidity is an important consideration as there are legal and other limitations on our ability to utilize liquidity from one legal entity to satisfy the liquidity requirements of another, including Bank of America Corporation. For instance, Bank of America Corporation depends on dividends, distributions and other payments from our banking and nonbanking subsidiaries to fund dividend payments on our common stock and preferred stock and to fund all payments on our other obligations, including debt obligations. Many of our subsidiaries, including our bank and broker-dealer subsidiaries, are subject to laws that restrict dividend payments or authorize regulatory bodies to block or reduce the flow of funds from those subsidiaries to Bank of America Corporation. In addition, our bank and broker-dealer subsidiaries are subject to restrictions on their ability to lend or transact with affiliates and to minimum regulatory capital requirements, as well as restrictions on their ability to use funds deposited with them in bank or brokerage accounts to fund their businesses. Additional restrictions on

related-party transactions, increased capital requirements and additional limitations on the use of funds on deposit in bank or brokerage accounts, as well as lower earnings, can reduce the amount of funds available to meet the obligations of Bank of America Corporation and even require Bank of America Corporation to provide additional funding to such subsidiaries. Regulatory action of that kind could impede access to funds we need to make payments on our obligations or dividend payments. In addition, our right to participate in a distribution of assets upon a subsidiary’s liquidation or reorganization is subject to the prior claims of the subsidiary’s creditors. For a further discussion regarding our ability to pay dividends, seeNote 15 – Shareholders’ EquityandNote 18 – Regulatory Requirements and Restrictionsto the Consolidated Financial Statements.
Mortgage and Housing Market-Related Risk
We have been, and expect to continue to be, required to repurchase loansand/or reimburse the GSEs and monoline bond insurance companies (monolines) for losses due to claims related to representations and warranties made in connection with mortgage-backed securities and other loans, and have received similar claims, and may receive additional claims, from whole loan purchasers and private-label securitization investors. The resolution of these claims could have a material adverse effect on our cash flows, financial condition, and results of operations.
We have securitized and continue to securitize first-lien mortgage loans generally in the form of mortgage-backed securities (MBS) guaranteed by the GSEs or, in the case of Federal Housing Administration insured and U.S. Department of Veterans Affairs guaranteed mortgage loans, by the Government National Mortgage Association. We and our legacy companies and certain subsidiaries have also sold pools of first-lien mortgages and home equity loans as private-label securitizations or in the form of whole loans. In certain cases, all or a portion of the private-label MBS were insured by monolines or other non-GSE counterparties. In connection with these securitizations and other transactions, we or our subsidiaries or legacy companies made various representations and warranties. Breaches of these representations and warranties may result in a requirement that we repurchase mortgage loans, or indemnify or provide other remedies to counterparties.
On December 31, 2010, we reached agreements with Freddie Mac (FHLMC) and Fannie Mae (FNMA), collectively the GSEs, where the Corporation paid $2.8 billion to resolve repurchase claims involving first-lien residential mortgage loans sold directly to the GSEs by entities related to legacy Countrywide (Countrywide). The agreement with FHLMC extinguishes all outstanding and potential mortgage repurchase and make-whole claims arising out of any alleged breaches of selling representations and warranties related to loans sold directly by legacy Countrywide to FHLMC through 2008, subject to certain exceptions we do not believe will be material. The agreement with FNMA substantially resolves the existing pipeline of repurchase and make-whole claims outstanding as of September 20, 2010 arising out of alleged breaches of selling representations and warranties related to loans sold directly by legacy Countrywide to FNMA. These agreements with the GSEs do not cover outstanding and potential mortgage repurchase and make-whole claims arising out of any alleged breaches of selling representations and warranties to legacy Bank of America first-lien residential mortgage loans sold directly to the GSEs, loans sold to the GSEs other than described above, loan servicing obligations, other contractual obligations or loans contained in private-label securitizations. In addition, we have other unresolved representation and warranty claims from the GSEs and certain monolines, and other non-GSE counterparties, and certain monolines have instituted litigation against us with respect to representations and warranties claims.
We have experienced increasing repurchase and similar requests from non-GSE counterparties, including monolines, private-label MBS securitization investors and whole loan purchasers. We expect additional activity in this


Bank of America 2010     9


area going forward and the volume of repurchase requests from monolines, whole loan purchasers and investors in private-label MBS could increase in the future. It is reasonably possible that future losses may occur and our estimate is that the upper range of loss related to non-GSE sales could be $7.0 billion to $10.0 billion over existing accruals. This estimate does not represent a probable loss, is based on currently available information, significant judgment, and a number of assumptions that are subject to change. A significant portion of this estimate relates to loans originated through legacy Countrywide, and the repurchase liability is generally limited to the original seller of the loan. Future provisions and possible loss or range of loss may be impacted if actual results are different from our assumptions regarding economic conditions, home prices and other matters and may vary by counterparty. We expect that the resolution of the repurchase claims process with the non-GSE counterparties will likely be a protracted process, and we will vigorously contest any request for repurchase if we conclude that a valid basis for the repurchase claim does not exist.
The resolution of claims related to alleged breaches of these representations and warranties and repurchase claims could have a material adverse effect on our financial condition, cash flows and results of operations, and could exceed existing estimates and accruals. In addition, any accruals or estimates we have made are based on assumptions which are subject to change.
For additional information about our representations and warranties exposure and past activities, see Recent Events – Representations and Warrants Liability, in the MD&A on page 33, Recent Events – Private-label Residential Mortgage-backed Securities Matters, in the MD&A on page 35, Off-Balance Sheet Arrangements and Contractual Obligations – Representations and Warranties, in the MD&A beginning on page 52, andNote 9 – Representations and Warranties Obligations and Corporate Guaranteesto the Consolidated Financial Statements and Representations.
Continued, or increasing, declines in the domestic and international housing markets, including home prices, may adversely affect the company’s consumer and commercial portfolios and have a significant adverse effect on our financial condition and results of operations.
Economic deterioration throughout 2009 and weakness in the economic recovery in 2010 was accompanied by continued stress in the U.S. and international housing markets, including declines in home prices. These declines in the housing market, with falling home prices and increasing foreclosures, and rising unemployment and underemployment, have further negatively impacted the demand for many of our products and the credit performance of our consumer and commercial portfolios. In addition,Additionally, our mortgage loan production volume is generally influenced by the rate of growth in residential mortgage debt outstanding and the size of the residential mortgage market, which has declined due to reduced activity in the housing market. Continued high unemployment rates in the U.S. have added another element to the financial challenges facing U.S. consumers and further compounded these stresses in the U.S. housing market as employment conditions may be compelling some consumers to delay new home purchases or miss payments on existing mortgages.
Conditions in the housing market have also resulted in significant write-downs of asset values in several asset classes, notably mortgage-backed securities commercial real estate and leveraged loans and exposure to monoline insurers.monolines. These conditions may negatively affect the value of real estate which could negatively affect our exposure to representations and warranties. While there are earlywere continued indications throughout the past year that the U.S. economy is stabilizing, the performance of our overall consumer and commercial portfolios may not significantly improve in the near future. A protracted continuation or worsening of these difficult business or economichousing market conditions would likely exacerbate the adverse effects outlined above and have a significant adverse effect on us.

our financial condition and results of operations.

We temporarily suspended our foreclosure sales nationally in the fourth quarter of 2010 to conduct an assessment of our foreclosure processes. Subsequently, numerous state and federal investigations of foreclosure

processes across our industry have soldbeen initiated. Those investigations and any irregularities that might be found in our foreclosure processes, along with any remedial steps taken in response to governmental investigations or to our own internal assessment, could have a material adverse effect on our financial condition and results of operations.
On October 1, 2010, we voluntarily stopped taking residential mortgage foreclosure proceedings to judgment in states where foreclosure requires a court order following a legal proceeding (judicial states). On October 8, 2010, we stopped foreclosure sales in all states in order to complete an assessment of the related business processes. These actions generally did not affect the initiation and processing of foreclosures prior to judgment or sale of vacant real estate owned properties. We took these precautionary steps in order to ensure our processes for handling foreclosures include the appropriate controls and quality assurance. Our review has involved an assessment of the foreclosure process, including a review of completed foreclosure affidavits in pending proceedings.
As a result of that review, we identified and implemented process and control enhancements, and we intend to monitor ongoing quality results of each process. After these enhancements were put in place, we resumed foreclosure sales in most states where foreclosures are handled without judicial supervision (non-judicial states) during the fourth quarter of 2010, and expect sales to resume in the remaining non-judicial states in the first quarter of 2011. We also commenced a rolling process of preparing, as necessary, affidavits of indebtedness in pending foreclosure proceedings in order to resume the process of taking these foreclosure proceedings to judgment in judicial states, beginning with properties believed to be vacant, and with properties for which the mortgage was originated on a non-owner-occupied basis. The process of preparing affidavits in pending proceedings is expected to continue in the first quarter of 2011, and could result in prolonged adversary proceedings that delay certain foreclosure sales.
Law enforcement authorities in all 50 states and the U.S. Department of Justice and other federal agencies, including certain bank supervisory authorities, continue to sellinvestigate alleged irregularities in the foreclosure practices of residential mortgage servicers. Authorities have publicly stated that the scope of the investigations extends beyond foreclosure documentation practices to include mortgage loan modification and loss mitigation practices. The Corporation is cooperating with these investigations and is dedicating significant resources to address these issues. The current environment of heightened regulatory scrutiny has the potential to subject the Corporation to inquiries or investigations that could significantly adversely affect its reputation. Such investigations by state and federal authorities, as well as any other loans, including mortgage loansgovernmental or regulatory scrutiny of our foreclosure processes, could result in material fines, penalties, equitable remedies (including requiring default servicing or other process changes), or other enforcement actions, and result in significant legal costs in responding to third-party buyersgovernmental investigations and toadditional litigation.
While we cannot predict the Federal National Mortgage

Association and Federal Home Loan Mortgage Corporation, under agreementsultimate impact of the temporary delay in foreclosure sales, or any issues that contain representations and warranties related to, among other things, the process for selecting the loans for inclusion in a sale and compliance with applicable criteria established by the buyer. We also have indirect exposure with respect to our mortgage and other loan salesmay arise as a result of alleged irregularities with respect to previously completed foreclosure activities, we may be subject to additional borrower and non-borrower litigation and governmental and regulatory scrutiny related to our past and current foreclosure activities. This scrutiny may extend beyond our pending foreclosure matters to issues arising out of alleged irregularities with respect to previously completed foreclosure activities. Our costs increased in the fourth quarter of 2010 and we expect that additional costs incurred in connection with our foreclosure process assessment will continue into 2011 due to the additional resources necessary to perform the foreclosure process assessment, to revise affidavit filings and to implement other operational changes. This will likely result in higher noninterest expense, including higher servicing costs and legal expenses, inHome Loans & Insurance. It is also possible that the temporary suspension of foreclosure sales may result in additional costs and


10     Bank of America 2010


expenses, including costs associated with the maintenance of properties or possible home price declines, while foreclosures are delayed. In addition, required process changes could increase our default servicing costs over the longer term. Finally, the time to complete foreclosure sales may increase temporarily, which may result in an increase in non-performing loans and servicing advances and may impact the collectability of such advances and the value of our MSRs, MBS and real estate owned properties. An increase in the time to complete foreclosure sales also may inflate the amount of highly delinquent loans in the Corporation’s mortgage statistics, result in increasing levels of consumer nonperforming loans, and could have a dampening effect on net interest margin as non-performing assets rise. Accordingly, delays in foreclosure sales, including any delays beyond those currently anticipated, and our continued process enhancements and any issues that may arise out of alleged irregularities in our foreclosure process could increase the costs associated with our mortgage operations.
Loan sales have not been materially impacted by the temporary delay in foreclosure sales or the review of our foreclosure process. However, delays in foreclosure sales could negatively affect the valuation of our real estate owned properties and MBS that are serviced by us. With respect to GSE MBS, while there would be no credit protectionimpairment to security holders due to the guarantee provided by monolinethe agencies, the valuation of certain MBS could be negatively affected under certain scenarios due to changes in the timing of cash flows. The impact on GSE MBS depends on, among other factors, how long the underlying loans are affected by foreclosure delays and would vary among securities. With respect to non-GSE MBS, under certain scenarios the timing and amount of cash flows could be negatively affected. The ultimate impact on non-GSE MBS depends on the same factors that impact GSE MBS, as well as the level of credit enhancement, including subordination. In addition, as a result of our foreclosure process assessment and related control enhancements that we have implemented, there may continue to be delays in foreclosure sales, including a continued backlog of foreclosure proceedings, and evictions from real estate owned properties.
Failure to satisfy our obligations as servicer in the residential mortgage securitization process, including obligations related to residential mortgage foreclosure actions, along with other losses we could incur in our capacity as servicer, could have a material adverse effect on our financial guarantors. Wecondition and results of operations.
Bank of America and its legacy companies have experiencedsecuritized, and continue to experience increasingsecuritize, a significant portion of the residential mortgage loans that they have originated or acquired. The Corporation services a large portion of the loans it or its subsidiaries have securitized and also services loans on behalf of third-party securitization vehicles. In addition to identifying specific servicing criteria, pooling and servicing arrangements entered into in connection with a securitization or whole loan sale typically impose standards of care on the servicer, with respect to its activities, that may include the obligation to adhere to the accepted servicing practices of prudent mortgage lendersand/or to exercise the degree of care and skill that the servicer employs when servicing loans for its own account. Many non-GSE residential mortgage-backed securitizations and whole loan servicing agreements also require the servicer to indemnify the trustee or other investor for or against failures by the servicer to perform its servicing obligations or acts or omissions that involve willful malfeasance, bad faith, or gross negligence in the performance of, or reckless disregard of, the servicer’s duties.
Servicing agreements with the GSEs generally provide the GSEs with broader rights relative to the servicer than are found in servicing agreements with private investors. For example, each GSE typically has the right to demand

that the servicer repurchase demands fromloans that breach the seller’s representations and disputeswarranties made in connection with these buyersthe initial sale of the loans, even if the servicer was not the seller. The GSEs also reserve the contractual right to demand indemnification or loan repurchase for certain servicing breaches. In addition, our agreements with the GSEs and monoline financial guarantors. Intheir first mortgage seller/servicer guides provide for timelines to resolve delinquent loans through workout efforts or liquidation, if necessary.
With regard to alleged irregularities in foreclosure process-related activities referred to above, a servicer may incur costs or losses if the event we areservicer elects or is required to repurchase these mortgagere-execute or re-file documents or take other action in its capacity as a servicer in connection with pending or completed foreclosures. The servicer also may incur costs or losses if the validity of a foreclosure action is challenged by a borrower. If a court were to overturn a foreclosure because of errors or deficiencies in the foreclosure process, the servicer may have liability to a title insurer of the property sold in foreclosure. These costs and other loansliabilities may not be reimbursable to the servicer. A servicer may also incur costs or provide indemnificationlosses associated with private-label securitizations or other recourse, thisloan investors relating to delays or alleged deficiencies in processing documents necessary to comply with state law governing foreclosures.
The servicer may be subject to deductions by insurers for mortgage insurance or guarantee benefits relating to delays or alleged deficiencies. Additionally, if the servicer commits a material breach of its servicing obligations that is not cured within specified timeframes, including those related to default servicing and foreclosure, it could significantlybe terminated as servicer under servicing agreements under certain circumstances. Any of these actions may harm the servicer’s reputation, increase its servicing costs or otherwise adversely affect its financial condition and results of operations.
Mortgage notes, assignments or other documents are often required to be maintained and are often necessary to enforce mortgages loans. There has been significant public commentary regarding the common industry practice of recording mortgages in the name of Mortgage Electronic Registration Systems, Inc. (MERS), as nominee on behalf of the note holder, and whether securitization trusts own the loans purported to be conveyed to them and have valid liens securing those loans. We currently use the MERS system for a substantial portion of the residential mortgage loans that we originate, including loans that have been sold to investors or securitization trusts. Additionally, certain legal challenges have been made to the process for transferring mortgage loans to securitization trusts, asserting that having a mortgagee of record that is different than the holder of the mortgage note could “break the chain of title” and cloud the ownership of the loan. In order to foreclose on a mortgage loan, in certain cases it may be necessary or prudent for an assignment of the mortgage to be made to the holder of the note, which in the case of a mortgage held in the name of MERS as nominee would need to be completed by MERS. As such, our lossespractice is to obtain assignments of mortgages from MERS prior to instituting foreclosure. If certain required documents are missing or defective, or if the use of MERS is found not to be effective, we could be obligated to cure certain defects or in some circumstances be subject to additional costs and thereby affectexpenses, which could have a material adverse effect on our future earnings.

Additional factorscash flows, financial condition and results of operations.

We may also face negative reputational costs from these servicing risks, which could reduce our earnings include, among other things, lower residual net interest income as a result of a decisionfuture business opportunities in this area or cause that business to deleveragebe on less favorable terms to us.
For additional information concerning our asset and liability management portfolio, higher than expected losses on our purchased impaired portfolio and compliance with governmental foreclosure prevention and loan modification initiatives.

We are a diversified financial services company providing consumer and commercial banking, credit card, mortgage, investment banking and capital markets trading services and investment services. Although we believe this diversity generally assists us in lessening the effect of a downturn in any of our businesses, it also means that our earnings could be adversely affected by the downturn to the extent not fully offset by any of our other businesses.

For a further discussion of the economic downturn and the resulting adverse impact on our credit performance,servicing risks, see “Executive Summary,” “Financial Highlights” and “Credit Risk Management”Recent Events – Certain Servicing-related Issues, in the MD&A.&A beginning on page 34.


Bank of America 2010     11


Credit Risk
OurCredit Risk is the Risk of Loss Arising from a Borrower, Obligor or Counterparty Default when a Borrower, Obligor or Counterparty does not Meet its Obligations.
Increased credit risk, due to economic or market disruptions, insufficient credit loss reserves or concentration of credit risk, may necessitate increased credit risk could result in higherprovisions for credit losses and reduced earningscould have an adverse effect on our financial condition and results of operations..
When we loan money, commit to loan money or enter into a letter of credit or other contract with a counterparty, we incur credit risk, or the risk of losses if our borrowers do not repay their loans or our counterparties fail to perform according to the terms of their agreements. A number of our products expose us to credit risk, including loans, leases and lending commitments, derivatives, trading account assets and assetsheld-for-sale. As one of the nation’s largest lenders, the credit quality of our consumer and commercial portfolios has a significant impact on our earnings. Current negative
Although credit quality generally continued to show improvement throughout 2010, net charge-offs, nonperforming loans, leases and foreclosed properties remained elevated. Global and national economic conditions continue to weigh on our credit portfolios. Economic or market disruptions are likely to continue to increase our credit exposure to third parties whocustomers, obligors or other counterparties due to the increased risk that they may be more likely to default on their obligations to us. This increased credit riskThese potential increases in delinquencies and default rates could adversely affect our consumer credit card, home equity, consumer real estate and purchased impairedcredit-impaired portfolios, among others, including causing increases in delinquencies and default rates, which we expect will continue to impact ourthrough increased charge-offs and provisionprovisions for credit losses. In addition, this increased credit risk could also adversely affect our commercial loan portfolios where we have experienced increasedcontinued losses, particularly in our commercial real estate and commercial domestic portfolios, reflecting broad based deteriorationsbroad-based stress across industries, property types and borrowers.

We estimate and establish reservesan allowance for credit risks and credit losses inherent in our lending activities (including unfunded lending commitments), excluding those measured at fair value, underthrough a charge to earnings. The amount of allowance is determined based on our evaluation of the fair value option. Thispotential credit losses included within our loan portfolio. The process for determining the amount of the allowance, which is critical to our financialoperating results and financial condition, requires difficult, subjective and complex judgments, including forecasts of economic conditions and how our borrowers will react to those conditions. Our ability to assess future economic conditions or the creditworthiness of our customers, obligors or other counterparties is imperfect. The ability of our borrowers to repay their loans will likely be impacted by changes in economic conditions, which in turn could impact the accuracy of our forecasts. As with any such assessments, there is also the chance that we will fail to identify the proper factors or that we will fail to accurately estimate the impacts of factors that we identify. In addition, we may underestimate the credit losses in our loan portfolios and suffer unexpected losses if the models and approaches we use to establish reserves and make judgments in extending credit to our bor - -


Bank of America 20095


rowersborrowers and other counterparties become less predictive of future behaviors, valuations, assumptions or estimates. Although we believe that our allowance for credit losses was in compliance with applicable standards at December 31, 2010, there is no guarantee that it will be sufficient to address future credit losses, particularly if economic conditions worsen. In such an event we may need to increase the

size of our allowance in 2011, which would adversely affect our financial condition and results of operations.
In the ordinary course of our business, we also may be subject to a concentration of credit risk to a particular industry, country, counterparty, borrower or issuer. A deterioration in the financial condition or prospects of a particular industry or a failure or downgrade of, or default by, any particular entity or group of entities could negativelyhave a material adverse impact on our businesses, perhaps materially, and the systemsprocesses by which we set limits and monitor the level of our credit exposure to individual entities, industries and countries may not function as we have anticipated. While our activities expose us to many different industries and counterparties, we routinely execute a high volume of transactions with counterparties in the financial services industry, including brokers and dealers, commercial banks, investment funds and insurers. This has resulted in significant credit concentration with respect to this industry.

In the ordinary course of business, we also enter into transactions with sovereign nations, U.S. states and U.S. municipalities. Unfavorable economic or political conditions, disruptions to capital markets, currency fluctuations, social instability and changes in government policies could impact the operating budgets or credit ratings of sovereign nations, U.S. states and U.S. municipalities and expose us to credit risk.
We also have a concentration of credit risk with respect to our consumer real estate, consumer credit card and commercial real estate portfolios, which represent a large percentage of our overall credit portfolio. The current financial crisis and economic slowdowndownturn has adversely affected these portfolios and further exposed us to this concentration of risk. Continued economic weakness or deterioration in real estate values or household incomes could result in materially higher credit losses.

For a further discussion ofadditional information about our credit risk and our credit risk management policies and procedures, see “CreditCredit Risk Management”Management in the MD&A beginning on page 71 andNote 1 – Summary of Significant Accounting Principlesto the Consolidated Financial Statements.

Adverse changes in legislative and regulatory initiatives may significantly impact our earnings, operations, capital position and ability to pursue business opportunities. We are heavily regulated by regulatory agencies at the federal, state and international levels. As a result of the recent financial crisis and economic downturn, we have faced and expect to continue to face increased regulation and regulatory and political scrutiny, which creates significant uncertainty for us and the financial services industry in general.

In 2009, several major regulatory and legislative initiatives were adopted that will have significant future impacts on our businesses and financial results. For instance, in November 2009, the Federal Reserve Board issued amendments to Regulation E, which implements the Electronic Fund Transfer Act. The new rules have a compliance date of July 1, 2010. These amendments change, among other things, the way we and other banks may charge overdraft fees by limiting our ability to charge an overdraft fee for automated teller machine and one-time debit card transactions that overdraw a consumer’s account, unless the consumer affirmatively consents to payment of overdrafts for those transactions. In connection with the amendments, we announced a program that allowed customers to opt out of overdraft services prior to the effective date of the amendments. In addition, in May 2009, the Credit Card Accountability Responsibility and Disclosure (CARD) Act of 2009 was enacted that provides for comprehensive reform related to credit card industry practices, including (1) significantly restricting banks’ ability to change interest rates and assess fees to reflect individual consumer risk, (2) changing the way payments are applied and (3) requiring changes to consumer credit card disclosures. As a result, as we announced in October 2009, we did not increase interest rates on consumer credit accounts in response to provisions in the CARD Act prior to its effective date, unless a customer’s account fell past due or was based on a variable interest rate. The most significant provisions of the CARD Act took effect in February 2010. Complying with the Regulation E amendments and the CARD Act requires us to invest significant management attention and resources to make the necessary disclosure and systems changes and will likely adversely affect our earnings.

Federal banking regulatory agencies may from time to time require that we change our required capital levels, including maintaining capital above

minimum levels. In January 2010, U.S. banking regulators issued a final rule regarding risk-based capital that eliminates the exclusion of certain asset- backed commercial paper (ABCP) program assets from risk-weighted assets. As a result of the new rules, as with all other consolidated variable interest entities, a banking organization is required to include the assets of a consolidated ABCP program in risk-weighted assets. The new rules would also eliminate the associated provision in the general risk-based capital rules that excludes from Tier 1 capital the noncontrolling interest in a consolidated ABCP program not included in a banking organization’s risk-weighted assets. Beginning with reporting for the quarter ended March 31, 2010, we will be required to risk-weight the underlying assets of ABCP conduits as well as the contractual exposures (e.g. liquidity facilities).

In conjunction with the federal banking regulatory agencies’ Supervisory Capital Assessment Program (SCAP) conducted in May 2009, we were required to increase Tier 1 common capital by approximately $33.9 billion. Additionally, in order to repay the $45 billion investment in our preferred stock previously made under the Trouble Asset Relief Program (TARP) by the U.S. Treasury, in December 2009, we raised approximately $19.3 billion in gross proceeds in an offering of CES and agreed to increase equity by $3 billion through asset sales by June 30, 2010 and raise up to approximately $1.7 billion through the issuance of restricted stock in lieu of a portion of incentive cash compensation to certain Bank of America associates as part of normal year-end incentive payments. For a further discussion of the CES, see “Executive Summary—TARP Repayment” in the MD&A.

In July 2009, the Basel Committee on Banking Supervision released a consultative document that would significantly increase the capital requirements for trading book activities if adopted as proposed. The proposal recommended implementation by December 31, 2010, but regulatory agencies are currently evaluating the proposed rulemaking and related impacts before establishing final rules. As a result, we cannot determine the implementation date or the final capital impact.

In December 2009, the Basel Committee on Banking Supervision released consultative documents on both capital and liquidity. If adopted as proposed, this could increase significantly the aggregate equity that bank holding companies are required to hold, by disqualifying certain instruments that previously have qualified as Tier 1 capital. The proposal currently includes a leverage ratio and increased liquidity and disclosure requirements. The leverage ratio could prove more restrictive than a risk-based measure while the liquidity requirement could result in banks holding greater levels of lower yielding instruments as a percentage of their assets. The proposal could also increase the capital charges imposed on certain assets, potentially making certain businesses more expensive to conduct. U.S. regulatory agencies have not opined on these proposals for U.S. implementation. We continue to assess the potential impact of this proposal. If we are required to increase our regulatory capital as a result of these or other regulatory or legislative initiatives, we may be required among other things to issue additional shares of common stock, which could dilute our existing stockholders.

As a result of the financial crisis, the financial services industry is facing the possibility of legislative and regulatory changes that would impose significant, adverse changes on its ability to serve both retail and wholesale customers. A proposal is currently being considered to levy a tax or fee on financial institutions with assets in excess of $50 billion to repay the costs of TARP, although the proposed tax would continue even after those costs are repaid. If enacted as proposed, the tax could significantly affect our earnings, either by increasing the costs of our liabilities or causing us to reduce our assets. It remains uncertain whether the tax will be enacted, to whom it would apply, or the amount of the tax we would be required to pay. It is also unclear the extent to which the costs of such a tax could be recouped through higher pricing.

In addition, various proposals for broad-based reform of the financial regulatory system are pending. A majority of these proposals would not


6Bank of America 2009


disrupt our core businesses, but a proposal could ultimately be adopted that adversely affects certain of our businesses. The proposals would require divestment of certain proprietary trading activities, or limit private equity investments. Other proposals, which include limiting the scope of an institution’s derivatives activities, or forcing certain derivatives activities to be traded on exchanges, would diminish the demand for, and profitability of, certain businesses. Several other proposals would require issuers to retain unhedged interests in any asset that is securitized, potentially severely restricting the secondary market as a source of funding for consumer or commercial lending. There are also numerous proposals pending on how to resolve a failed systemically important institution. Following the passage of a bill in the U.S. House of Representatives and the possibility of similar provisions in a U.S. Senate bill, one ratings agency has placed us and other banks on negative outlook, and therefore adoption of such provisions may adversely affect our access to credit markets.

In addition, other countries, including the United Kingdom and France, have proposed and in some cases adopted certain reforms targeted at financial institutions, including, but not limited to, increased capital and liquidity requirements for local entities, including regulated U.K. subsidiaries of foreign bank holding companies and other financial institutions as well as branches of foreign banks located in the United Kingdom, the creation and production of recovery and resolutions plans (commonly referred to as living wills) by such entities, and a significant payroll tax on bank bonuses paid to employees over a certain threshold.

There can be no assurance as to whether or when any of the parts of these or other proposals will be enacted, and if enacted, what the final initiatives will consist of and what the ultimate impact on us will be.

We also may be required to pay significantly higher FDIC premiums because market developments have significantly depleted the DIF and reduced the ratio of reserves to insured deposits, which could increase our noninterest expense and reduce our earnings.

For more information on these and other legislative and regulatory initiatives, see “Regulatory Initiatives” in the MD&A.

In addition, Congress is currently considering reinstating income tax provisions whereby a majority of the income of certain foreign subsidiaries would not be subject to current U.S. income tax as a result of long-standing deferral provisions applicable to active finance income. These provisions, which in the past have expired and been extended, expired again for taxable years beginning on or after January 1, 2010. Absent an extension of these provisions, active financing income earned by our foreign subsidiaries during 2010 will generally be subject to a tax provision that considers the incremental U.S. income tax. The impact of the expiration of the provisions should they not be extended could be significant. The exact impact would depend upon the amount, composition and geographic mix of our future earnings. For more information on these provisions, see “Financial Highlights—Income Tax Expense” in the MD&A.

Compliance with current or future legislative and regulatory initiatives could require us to change certain of our business practices, impose significant additional costs on us, limit the products that we offer, result in a significant loss of revenue, limit our ability to pursue business opportunities in an efficient manner, require us to increase our regulatory capital, cause business disruptions, impact the value of assets that we hold or otherwise adversely affect our business, results of operations or financial condition. We have recently witnessed the introduction of an ever-increasing number of regulatory proposals that could substantially impact us and others in the financial services industry. The extent of changes imposed by, and frequency of adoption of, any regulatory initiatives could make it more difficult for us to comply in a timely manner, which could further limit our operations, increase compliance costs or divert management attention or other resources. The long-term impact of legislative and

regulatory initiatives on our business practices and revenues will depend upon the successful implementation of our strategies, consumer behavior, and competitors’ responses to such initiatives, all of which are difficult to predict.

We could suffer losses as a result of the actions of or deterioration in the commercial soundnesssoundness of our counterparties and other financial services institutions.servicesinstitutions and counterparties, including as a result of derivatives transactions.

Our ability to engage in routine trading and funding transactions could be adversely affected by the actions and commercial soundness of other market participants. We have exposure to many different industries and counterparties, and we routinely execute transactions with counterparties in the financial services industry, including brokers and dealers, commercial banks, investment banks, mutual and hedge funds and other institutional clients. Financial services institutions and other counterparties are inter-related because of trading, funding, clearing or other relationships. As a result, defaults by, or even rumors or questions about, one or more financial services institutions, or the financial services industry generally, have led to market-wide liquidity problems and could lead to significant future liquidity problems, including losses or defaults by us or by other institutions. Many of these transactions expose us to credit risk in the event of default of a counterparty or client. In addition, our credit risk may be impacted when the collateral held by us cannot be realized upon or is liquidated at prices not sufficient to recover the full amount of the loan or derivatives exposure due us. There is no assurance that anyAny such losses would notcould materially and adversely affect our financial condition and results of operations.


12  ��  Bank of America 2010


Our derivatives businesses may expose us to unexpected risks and potential losses.
We are party to a large number of derivatives transactions, including credit derivatives. ManyOur derivatives businesses may expose us to unexpected market, credit and operational risks that could cause us to suffer unexpected losses and have an adverse effect on our financial condition and results of theseoperations. Severe declines in asset values, unanticipated credit events or unforeseen circumstances that may cause previously uncorrelated factors to become correlated (and vice versa) may create losses resulting from risks not appropriately taken into account in the development, structuring or pricing of a derivative instrument.
Many derivative instruments are individually negotiated and non-standardized, which can make exiting, transferring or settling some positions difficult. Many credit derivatives require that we deliver to the counterparty the underlying security, loan or other obligation in order to receive payment. In a number of cases, we do not hold, and may not be able to obtain, the underlying security, loan or other obligation. This could cause us to forfeit the payments due to us under these contracts or result in settlement delays with the attendant credit and operational risk, as well as increased costs to us.

Derivatives contracts and other transactions entered into with third parties are not always confirmed by the counterparties or settled on a timely basis. While a transaction remains unconfirmed or during any delay in settlement, we are subject to heightened credit and operational risk and in the event of default may find it more difficult to enforce the contract. In addition, as new and more complex derivatives products have been created, covering a wider array of underlying credit and other instruments, disputes about the terms of the underlying contracts may arise, which could impair our ability to effectively manage our risk exposures from these products and subject us to increased costs.
For a further discussion of our derivatives exposure, seeNote 4 -- Derivativesto the Consolidated Financial Statements.
Market Risk

Market Risk is the Risk that Values of Assets and Liabilities or Revenues will be Adversely Affected by Changes in accounting standards or inaccurate estimates or assumptionsMarket Conditions Such as Market Volatility. Market Risk is Inherent in the application of accounting policies could adversely affectFinancial Instruments Associated with our financial resultsOperations and Activities, Including Loans, Deposits, Securities, Short-Term Borrowings, Long-Term Debt, Trading Account Assets and Liabilities, and Derivatives.
.Our accounting policies and methods are fundamental to how we record and report our financial conditionbusinesses and results of operations. Some of these policies require use of estimates and assumptions that may affect the reported value of our assets or liabilities and financial results and are critical because they require management to make difficult, subjective and complex judgments about matters that are inherently uncertain.

Recently, the Financial Accounting Standards Board (FASB) and other regulatorsoperations have adopted new guidance or rules relating to financial accounting or regulatory capital standards such as, among other things, the rules related to fair value accounting and new FASB guidance on consolidation of variable interest entities. In addition, accounting standard setters and those who interpret the accounting standards (such as the FASB, the SEC, banking regulators and our independent registered public accounting firm) may amend or even reverse their previous interpretations


Bank of America 20097


or positions on how these standards should be applied. These changes can be hard to predict and can materially impact how we record and report our financial condition and results of operations. In some cases, we could be required to apply a new or revised standard retroactively, resulting in the Corporation restating prior period financial statements. For a further discussion of some of our critical accounting policies and standards and recent accounting changes, see “Regulatory Initiatives” and “Complex Accounting Estimates” in the MD&A andNote 1 – Summary of Significant Accounting Principles to the Consolidated Financial Statements.

Our ability to attract and retain customers and employees could be adversely affected to the extent our reputation is harmed. Our ability to attract and retain customers and employees could be adversely affected to the extent our reputation is damaged. Our actual or perceived failure to address various issues could give rise to reputational risk that could cause harm to us and our business prospects, including failure to properly address operational risks. These issues also include, but are not limited to, legal and regulatory requirements; privacy; properly maintaining customer and associate personal information; record keeping; money-laundering; sales and trading practices; ethical issues; appropriately addressing potential conflicts of interest; and the proper identification of the legal, reputational, credit, liquidity and market risks inherent in our products.

We are also facing enhanced public and regulatory scrutiny resulting from the financial crisis, including the U.S. Treasury’s previous investment in our preferred stock, our acquisition of Merrill Lynch, modification of mortgages, volume of lending, compensation practices and the suitability of certain trading and investment businesses. Failure to appropriately address any of these issues could also give rise to additional regulatory restrictions, reputational harm and legal risks, which could among other consequences increase the size and number of litigation claims and damages asserted or subject us to enforcement actions, fines and penalties and cause us to incur related costs and expenses.

We face substantial potential legal liability and significant regulatory action, which could have materially adverse financial consequences or cause significant reputational harm to us.We face significant legal risks in our businesses, and the volume of claims and amount of damages and penalties claimed in litigation and regulatory proceedings against us and other financial institutions remain high and are increasing. Increased litigation costs, substantial legal liability or significant regulatory action against us could have material adverse financial effects or cause significant reputational harm to us, which in turn could seriously impact our business prospects. In addition, we face increased litigation risk and regulatory scrutiny as a result of the Merrill Lynch and Countrywide acquisitions. As a result of current economic conditions and the increased level of defaults over the prior couple of years, we have continued to experience increased litigation and other disputes with counterparties regarding relative rights and responsibilities. These litigation and regulatory matters and any related settlements could adversely impact our earnings and lead to volatility of our stock price. For a further discussion of litigation risks, seeNote 14 – Commitments and Contingencies to the Consolidated Financial Statements.

Our liquidity could be impaired by our inability to access the capital markets on favorable terms. Liquidity is essential to our businesses. Under normal business conditions, primary sources of funding for Bank of America Corporation include dividends received from banking and nonbanking subsidiaries and proceeds from the issuance of securities in the capital markets. The primary sources of funding for our banking subsidiaries include customer deposits and wholesale market-based funding. Our liquidity could be impaired by an inability to access the capital markets or by unforeseen outflows of cash, including deposits. This situation may arise due to circumstances that we may be unable to control, such as a general market disruption, negative views about the financial services industry generally, or an operational problem that affects third parties or us. Our

ability to raise certain types of funds as a result of the recent financial crisis has been, and couldmay continue to be, adversely affected by conditions in the United States and international markets and economies. In 2009, global capital and credit markets continued to experience volatility and disruptions. As a result, we utilized several temporary U.S. government liquidity programs to enhance our liquidity position. Our ability to engage in securitization funding transactions on favorable terms could be adversely affected by continued or subsequent disruptions in the capital markets or other events, including actions by ratings agencies or deteriorating investor expectations.

Our credit ratings and the credit ratings of our securitization trusts are important to our liquidity. The ratings agencies regularly evaluate us and our securities, and their ratings of our long-term and short-term debt and other securities, including asset securitizations, are based on a number of factors, including our financial strength as well as factors not entirely within our control, including conditions affecting the financial services industry generally. During 2009, the ratings agencies took numerous actions to adjust our credit ratings and outlooks, many of which were negative. The ratings agencies have indicated that our credit ratings currently reflect their expectation that, if necessary, we would receive significant support from the U.S. government. In February 2010, Standard & Poor’s affirmed our current credit ratings but revised the outlook to negative from stable, based on their belief that it is less certain whether the U.S. government would be willing to provide extraordinary support. In light of the difficulties in the financial services industry and the financial markets, there can be no assurance that we will maintain our current ratings. Failure to maintain those ratings could adversely affect our liquidity and competitive position by materially increasing our borrowing costs and significantly limiting our access to the funding or capital markets, including securitizations. A reduction in our credit ratings also could have a significant impact on certain trading revenues, particularly in those businesses where counterparty credit worthiness is critical. In connection with certain trading agreements, we may be required to provide additional collateral in the event of a credit ratings downgrade.

For a further discussion of our liquidity position and other liquidity matters, including ratings and outlooks and the policies and procedures we use to manage our liquidity risks, see “Liquidity Risk and Capital Management” in the MD&A.

Changes in financial or capital market conditions could cause our earnings and the value of our assets to decline.Market risk generally represents the risk that values of assets and liabilities or revenues will be adversely affected by changes in the levels of market volatility and by other financial or capital market conditions. As a result, we are directly

Our businesses and indirectlyresults of operations may be adversely affected by changes in market conditions. For example, we rely on bank deposits for a low cost and stable source of funding for the loans that we make. However, changes in interest rates on bank deposits could adversely affect our net interest margin – the difference between the yield we earn on our assets and the interest rate we pay for deposits and other sources of funding – which could in turn affect our net interest income and earnings.

Market risk is inherent in the financial instruments associated with our operations and activities, including loans, deposits, securities, short-term borrowings, long-term debt, trading account assets and liabilities and derivatives. Just a few of the market conditions that may change from time to time, thereby exposing us to market risk includefactors such as changes in interest and currency exchange rates, equity and futures prices, the implied volatility of interest rates, credit spreads and price deterioration or changes in value due to changes in market perception or actual credit quality of either the issuer or its country of origin. Accordingly, depending on the instruments or activities impacted,other economic and business factors. These market risks can have wide ranging, complex adverse effects on our results of operations and our overall financial condition. We also may incur significant unrealized gains or losses as a result of changes in our credit spreads or those of third parties, which mayadversely affect, for example, (i) the fair value of our derivativeson- and off-balance sheet securities, trading assets, other financial instruments, and MSRs, (ii) the cost of debt securities thatcapital and our access to credit markets, (iii) the value of assets under management, which could reduce our fee income relating to those assets, (iv) customer allocation of capital among investment alternatives, (v) the volume of client activity in our trading operations, and (vi) the general profitability and risk level of the transactions in which we hold or issue.

engage. Any of these developments could have a significant adverse impact on our financial condition and results of operations.

8Bank of America 2009


Our

We use various models and strategies we use to assess and control our market risk exposures but those are subject to inherent limitations. For example, our models, which rely on historical trends and assumptions, may not be sufficiently predictive of future results due to limited historical patterns, extreme or unanticipated market movements and illiquidity, especially during severe market downturns or stress events. The models that we use to assess and control our market risk exposures also reflect assumptions about the degree of correlation or lack thereof among prices of various asset classes or other market indicators. In times of market stress or other unforeseen circumstances, such as the market conditions experienced in 2008 and 2009, previously uncorrelated indicators may become correlated, or previously correlated indicators may move in different directions. These types of market movements have at times limited the effectiveness of our hedging strategies and have caused us to incur significant losses, and they may do so in the future. These changes in correlation can be exacerbated where other market participants are using risk or trading models with assumptions or algorithms that are similar to ours. In these and other cases, it may be difficult to reduce our risk positions due to the activity of other market participants or widespread market dislocations, including circumstances where asset values are declining significantly or no market exists for certain assets. To the extent that we make investments directly in securities that do not have an established liquid trading market or are otherwise subject to restrictions on sale or hedging, we may not be able to reduce our positions and therefore reduce our risk associated with such positions.

For a further discussion ofadditional information about market risk and our market risk management policies and procedures, see “MarketMarket Risk Management”Management in the MD&A.

&A beginning on page 100.

Adverse changesDeclines in the value of certain of our assets and liabilities could adversely impacthave an adverse effect on our earningsresults of operations..
We have a large portfolio of financial instruments that we measure at fair value including, among others, certain corporate loans and loan commitments, loansheld-for-sale, structured reverse repurchase agreements and long-term deposits. We also have trading account assets and liabilities, derivatives assets and liabilities,available-for-sale debt and marketable equity securities, consumer-related mortgage servicing rights (MSRs)MSRs and certain other assets that are valued at fair value. We determine the fair values of these instruments based on the fair value hierarchy under applicable accounting guidance. The fair values of these financial instruments include adjustments for market liquidity, credit quality and other dealtransaction specific factors, where appropriate.

Gains or losses on these instruments can have a direct and significant impact on our earnings,results of operations, unless we have effectively “hedged” our exposures. For example, changes in interest rates, among other things, can impact the value of our MSRs and can result in substantially higher or lower mortgage banking income and earnings, depending upon our ability to fully hedge the performance of our MSRs. Fair values may be impacted by declining values of the underlying assets or the prices at which observable market transactions occur and the continued availability of these transactions. The financial strength of counterparties, such as monoline financial guarantors,monolines, with whom we have economically hedged some of our exposure to these assets, also will affect the fair value of these assets. Sudden declines and significant volatility in the prices of assets may substantially curtail or eliminate the trading activity for these assets, which may make it very difficult to sell, hedge or value such assets. The inability to sell or effectively hedge assets reduces our ability to limit losses in such positions and the difficulty in valuing assets may increase our risk-weighted assets, which requires us to maintain additional capital and increases our funding costs.


Bank of America 2010     13

As previously disclosed on a current report on Form 8-K, in connection with the $2.8 billion in cash-settled restricted stock units awarded to some associates as part of their year-end compensation, we may recognize additional expense as a result of changes in the price of our common stock during the vesting period to the extent we do not effectively hedge this exposure. The awards of cash-settled restricted stock units are stock-based compensation paid out over time based on the price of


our common stock. Although we currently plan to make those payments in cash, we have reserved the right to make some or all of the payments in shares of our common stock.

Asset values also directly impact revenues in our asset management business.businesses. We receive asset-based management fees based on the value of our clients’ portfolios or investments in funds managed by us and, in some cases, we also receive incentive fees based on increases in the value of such investments. Declines in asset values can reduce the value of our clients’ portfolios or fund assets, which in turn can result in lower fees earned for managing such assets.

For additional information about fair value measurements, seeNote 22 – Fair Value Measurements to the Consolidated Financial Statements. For additional information about our asset management businesses, see Business Segment Operations –Global Wealth & Investment Management in the MD&A beginning on page 48.
Our abilitycommodities activities, particularly our physical commodities business, subject us to successfully identify and manage our complianceperformance, environmental and other risks that may result in significant cost and liabilities.
As part of our commodities business, we enter into exchange-traded contracts, financially settled OTC derivatives, contracts for physical delivery and contracts providing for the transportation, transmissionand/or storage rights on or in vessels, barges, pipelines, transmission lines or storage facilities. Commodity, related storage, transportation or other contracts expose us to the risk that the price of the underlying commodity or the cost of storing or transporting commodities may rise or fall. In addition, contracts relating to physical ownershipand/or delivery can expose us to numerous other risks, including performance and environmental risks. For example, our counterparties may not be able to pass changes in the price of commodities to their customers and therefore may not be able to meet their performance obligations. Our actions to mitigate the aforementioned risks may not prove adequate to address every contingency. In addition, insurance covering some of these risks may not be available, and the proceeds, if any, from insurance recovery may not be adequate to cover liabilities with respect to particular incidents. As a result, our financial condition and results of operations may be adversely affected by such events.
Regulatory and Legal Risk
Bank regulatory agencies may require us to hold higher levels of regulatory capital, increase our regulatory capital ratios, or increase liquidity which could result in the need to issue additional securities that qualify as regulatory capital or to liquidate company assets.
We are subject to the risk-based capital guidelines issued by the Federal Reserve Board. These guidelines establish regulatory capital requirements for banking institutions to meet minimal requirements as well as to qualify as a “well-capitalized” institution. (A “well-capitalized” institution must generally maintain capital ratios 200 bps higher than the minimum guidelines.) The risk-based capital rules have been further supplemented by required leverage ratios, defined as so-called Tier 1 (the highest grade) capital divided by quarterly average total assets, after certain adjustments. If any of our insured depository institutions fails to maintain its status as “well- capitalized” under the capital rules of their primary federal regulator, the Federal Reserve Board will require us to enter into an agreement to bring the insured depository institution or institutions back into a “well-capitalized” status. For the duration of such an agreement, the Federal Reserve Board may impose restrictions on the activities in which we may engage. If we were to fail to enter into such an agreement, or fail to comply with the terms of such agreement, the Federal Reserve Board may impose more severe restrictions on the activities in which we may engage, including requiring us to cease and desist in activities permitted under the Gramm-Leach-Bliley Act.
It is an important factorpossible that in the future increases in regulatory capital requirements, changes in how regulatory capital is calculated or increases to liquidity requirements, may cause the loss of our “well-capitalized” status unless we increase our capital levels by issuing additional common stock, thus diluting

our existing shareholders, or by selling assets. For example, the Financial Reform Act includes a provision under which our previously issued and outstanding trust preferred securities will no longer qualify as Tier 1 capital effective January 1, 2013. The exclusion of trust preferred securities from Tier 1 capital will be phased in incrementally over a three-year phase-in period. The treatment of trust preferred securities during the phase-in period remains unclear and is subject to future rulemaking.
On December 16, 2010, the Basel Committee issued Basel III, proposing a January 2013 implementation date for Basel III. If implemented by U.S. regulators as proposed, Basel III could significantly increase our capital requirements. Basel III and the Financial Reform Act propose the disqualification of trust preferred securities from Tier 1 capital, with the Financial Reform Act proposing that the disqualification be phased in from 2013 to 2015. Basel III also proposes the deduction of certain assets from capital (deferred tax assets, mortgage servicing rights (MSRs), investments in financial firms and pension assets, among others, within prescribed limitations), the inclusion of other comprehensive income in capital, increased capital for counterparty credit risk, and new minimum capital and buffer requirements. U.S. regulators are expected to begin the final rulemaking processes for Basel III in early 2011 and have indicated a goal to adopt final rules by year-end 2011 or early 2012. In addition to the capital proposals, in December 2010 the Basel Committee proposed two measures of liquidity risk. The Liquidity Coverage Ratio identifies the amount of unencumbered, high quality liquid assets a financial institution holds that can significantly impact our results.We seekbe used to monitor and control our various risk exposures throughoffset the net cash outflows the institution would encounter under an acute30-day stress scenario. The Net Stable Funding Ratio measures the amount of longer-term, stable sources of funding employed by a varietyfinancial institution relative to the liquidity profiles of separate but complementary financial, credit, operational, compliance and legal reporting systems. While we employ a broad and diversified set of risk monitoring and risk mitigation techniques, those techniquesthe assets funded and the judgmentspotential for contingent calls on funding liquidity arising from off-balance sheet commitments and obligations, over a one-year period. The Basel Committee expects the Liquidity Coverage Ratio to be implemented in January 2015 and the Net Stable Funding Ratio to be implemented in January 2018, following observation periods beginning in 2012.
Any requirement that accompanywe increase our regulatory capital, regulatory capital ratios or liquidity could have a material adverse effect on our financial condition and results of operations, as we may need to liquidate certain assets, perhaps on terms unfavorable to us and contrary to our business plans. Such a requirement could also compel us to issue additional securities, which could dilute our current common stockholders.For additional information about the proposals described above and their application cannot anticipate every economic,potential effect on our required levels of regulatory capital, see Item 1. Business – Capital and Operational Requirements on page 5 and Capital Management – Regulatory Capital in the MD&A beginning on page 63.
Government measures to regulate the financial industry, including the Financial Reform Act, either individually, in combination or regulatory outcome orin the specifics or timingaggregate, could require us to change certain of such outcomes. Accordingly,our business practices, impose significant additional costs on us, limit the products that we offer, limit our ability to successfully identify and manage risks facing us ispursue business opportunities in an important factor that can significantly impact our results. Recent economic conditions, increased legislative and regulatory scrutiny and increased complexity of our operations, among other things, have increased and made it more difficult forefficient manner, require us to manageincrease our operational, complianceregulatory capital, impact the value of assets that we hold, significantly reduce our revenues or otherwise materially and other risks. Foradversely affect our businesses, financial condition or results of operations.
As a further discussion of our risk management policiesfinancial institution, we are heavily regulated at the state, federal and procedures, see “Managing Risk” in the MD&A.

We may be unable to compete successfully asinternational levels. As a result of the evolvingfinancial crisis and related global economic downturn that began in 2007, we have faced and expect to continue to face increased public and legislative scrutiny as well as stricter and more comprehensive regulation of our financial services industrypractices. These regulatory and market conditions. We operatelegislative measures, either individually, in a highly competitive environment. Over time, there has been substantial consolidation among companiescombination or in the aggregate, could require us to change certain of our business practices, impose significant additional costs on us, limit the products that we offer, limit our ability to pursue business opportunities in an efficient manner, require us to increase our regulatory capital, impact the value of assets that we hold,


14     Bank of America 2010


significantly reduce our revenues or otherwise materially and adversely affect our businesses, financial services industry,condition, or results of operations.
Throughout 2009 and this trend accelerated2010, several major regulatory and legislative initiatives were adopted that will have significant future impacts on our businesses and financial results. For example, in 2008November 2009, the Federal Reserve Board issued amendments to Regulation E, which implements the Electronic Fund Transfer Act. The rules became effective on July 1, 2010 for new customers and August 16, 2010 for existing customers. These amendments limit the way we and other banks charge an overdraft fee for non-recurring debit card transactions that overdraw a consumer’s account unless the consumer affirmatively consents to the bank’s payment of overdrafts for those transactions. In addition, in May 2009, as the credit crisis led to numerous mergersCredit Card Accountability Responsibility and asset acquisitions among industry participants and in certain cases reorganization, restructuring, or even bankruptcy. This trend has also hastened the globalizationDisclosure (“CARD”) Act of 2009 was signed into law. The majority of the securitiesCARD Act provisions became effective in February 2010. The CARD Act legislation contains comprehensive credit card reform related to credit card industry practices, including significantly restricting banks’ ability to change interest rates and financial services markets. Weassess fees to reflect individual consumer risk, changing the way payments are applied and requiring changes to consumer credit card disclosures. Complying with the Regulation E amendments and the CARD Act has required us to invest significant management attention and resources to make the necessary disclosure and systems changes and has adversely affected, and will likely continue to experience intensified competition as further consolidationadversely affect, our earnings.
In July 2010, the Financial Reform Act was signed into law. The Financial Reform Act, among other reforms, (i) mandates that the Federal Reserve Board limit debit card interchange fees; (ii) bans banking organizations from engaging in proprietary trading and restricts their sponsorship of, or investing in, hedge funds and private equity funds, subject to limited exceptions; (iii) increases regulation of theover-the-counter derivative markets through measures that broaden the derivative instruments subject to regulation, requiring clearing and exchange trading and imposing additional capital and margin requirements for derivative market participants; (iv) changes the assessment base used in calculating FDIC deposit insurance fees from assessable deposits to total assets less tangible capital; (v) provides for heightened capital, liquidity, and prudential regulation and supervision over systemically important financial services industry in connection with current marketinstitutions; (vi) provides for resolution authority to establish a process to unwind large systemically important financial companies; (vii) creates a new regulatory body to set requirements around the terms and conditions may produce larger and better-capitalized companies that are capable of offering a wider array ofconsumer financial products and services at more competitive prices. Toexpands the extentrole of state regulators in enforcing consumer protection requirements over banks; (viii) disqualifies trust preferred securities and other hybrid capital securities from Tier 1 capital; (ix) includes a variety of corporate governance and executive compensation provisions and requirements; and (x) requires securitizers to retain a portion of the risk that would otherwise be transferred into certain securitization transactions.
Many of these provisions have begun to be or will be phased in over the next several months or years and will be subject both to further rulemaking and the discretion of applicable regulatory bodies. The ultimate impact of the final rules on our businesses and results of operations will depend on regulatory interpretation and rulemaking, as well as the success of any of our actions to mitigate the negative earnings impact of certain provisions. For instance, in December 2010, the Federal Reserve Board requested comment on a proposed rule that would establish debit card interchange fee standards and prohibit network exclusivity arrangements and routing restrictions. The proposed rule would establish standards for determining whether a debit card interchange fee received by a card issuer is reasonable and proportional to the cost incurred by the issuer for the transaction. Depending upon which cap is ultimately adopted, the final rule could have a significant adverse effect on our financial condition and results of operations and could result in additional goodwill impairment charges within ourGlobal Card Servicesbusiness segment.
We also anticipate that the final regulations associated with the Financial Reform Act will include limitations on certain activities, including limitations on

the use of a bank’s own capital for proprietary trading and sponsorship or investment in hedge funds and private equity funds (Volcker Rule). Regulations implementing the Volcker Rule are required to be in place by October 21, 2011, and the Volcker Rule becomes effective 12 months after such rules are final or on July 21, 2012, whichever is earlier. The Volcker Rule then gives banking entities two years from the effective date (with opportunities for additional extensions) to bring activities and investments into conformance. In anticipation of the adoption of the final regulations, we expand intohave begun winding down our proprietary trading line of business. The ultimate impact of the Volcker Rule or the winding down of this business, and the time it will take to comply or complete, continues to remain uncertain. The final regulations issued may impose additional operational and compliance costs on us.
Additionally, the Financial Reform Act includes measures to broaden the scope of derivative instruments subject to regulation by requiring clearing and exchange trading of certain derivatives, imposing new business areascapital and margin requirements for certain market participants and imposing position limits on certainover-the-counter derivatives. The Financial Reform Act grants the U.S. Commodity Futures Trading Commission (CFTC) and the SEC substantial new geographic regions,authority and requires numerous rulemakings by these agencies. Generally, the CFTC and SEC have until July 16, 2011 to promulgate the rulemakings necessary to implement these regulations. The ultimate impact of these derivatives regulations, and the time it will take to comply, continues to remain uncertain. The final regulations will impose additional operational and compliance costs on us and may require us to restructure certain businesses and negatively impact our revenues and results of operations.
The Financial Reform Act provided for a new resolution authority to establish a process to unwind large systemically important financial institutions. As part of that process we may face competitors with more experiencewill be required to develop and more established relationships with clients, regulatorsimplement a recovery and industry participantsresolution plan which will be subject to review by the FDIC and the Federal Reserve Board to determine whether our plan is credible and viable. As a result of FDIC and Federal Reserve Board review, we could be required to take certain actions over the next several years which could impose operational costs and could potentially result in the relevant market, whichdivestiture or restructuring of certain businesses and subsidiaries.
Although we cannot predict the full effect of the Financial Reform Act on our operations, it, as well as the future rules implementing its reforms, could result in a significant loss of revenue, impose additional costs on us, require us to increase our regulatory capital or otherwise materially adversely affect our businesses, financial condition and results of operations.
In addition, Congress and the Administration have signaled growing interest in reforming the U.S. corporate income tax. While the timing of consideration of such legislative reform is unclear, possible approaches include lowering the 35% corporate tax rate, modifying the taxation of income earned outside of the U.S. and limiting or eliminating various other deductions, tax creditsand/or other tax preferences. It is not possible at this time to quantify either the one-time impact from remeasuring deferred tax assets and liabilities that might result upon enactment of tax reform or the ongoing impact reform might have on income tax expense, but it is possible either of these impacts could adversely affect our ability to compete. In addition, technological advancesfinancial condition and results of operations.
Other countries have also proposed and, in some cases, adopted certain regulatory changes targeted at financial institutions or that otherwise affect us. For example, the European Union has adopted increased capital requirements and the growth of e-commerce have made it possibleU.K. has (i) increased liquidity requirements for non-depository institutions to offer products and services that traditionally were banking products, and forlocal financial institutions, including regulated U.K. subsidiaries of non-U.K. bank holding companies and other financial institutions as well as branches of non-U.K. banks located in the U.K; (ii) adopted a Bank Tax Levy which will apply to compete with technology companiesthe aggregate balance sheet of branches and subsidiaries of non-U.K. banks and banking groups operating in providing electronicthe U.K.; (iii) proposed the creation and internet-based financial solutions. Increased competition may affect our resultsproduction of recovery and resolution plans (commonly referred to as living wills) by creating pressureU.K. regulated entities; and (iv) announced the expectation of corporate


Bank of America 2010     15


income tax rate reductions of one percent to lower pricesbe enacted during each of 2011, 2012 and 2013 that would favorably impact income tax expense on our productsfuture earnings but which would result in adjustments to the carrying value of deferred tax assets and servicesrelated one-time charges to income tax expenses of nearly $400 million for each one percent reduction (however, it is possible that the full three percent rate reductions could be enacted in 2011, which would result in a 2011 charge of approximately $1.1 billion). We are also monitoring other international legislative proposals that could materially impact us, such as changes to income tax laws. Currently, in the U.K., net operating loss carry forwards (NOLs) have an indefinite life. Were the U.K. taxing authorities to introduce limitations on the future utilization of NOLs and reducing market share.

Ourthe Corporation was unable to document its continued ability to compete effectivelyfully utilize its NOLs, it would be required to establish a valuation allowance by a charge to income tax expense. Depending upon the nature of the limitations, such a change could be material in our businesses,the period of enactment. In addition, in 2010 the FSA issued a policy statement regarding payment protection insurance (PPI) that requires companies to review their sales practices and to proactively remediate certain problems, if discovered. As a result of this review, we may be required to record additional liabilities.

For additional information about the regulatory initiatives discussed above, see Regulatory Matters in the MD&A beginning on page 56. For additional information about PPI, seeNote 14 – Commitments and Contingencies – Payment Protection Insurance Claims Matterto the Consolidated Financial Statements.
During the last ten years, the Corporation and its subsidiaries and legacy companies have sold over $2.0 trillion of loans to the GSEs. Each GSE is currently in a conservatorship, with its primary regulator, the Federal Housing Finance Agency, acting as conservator. We cannot predict if, when or how the conservatorships will end, or any associated changes to the GSEs’ business structure that could result. We also cannot predict whether the conservatorships will end in receivership. There are several proposed approaches to reform the GSEs which, if enacted, could change the structure of the GSEs and the relationship among the GSEs, the government, and the private markets. We expect dialogue concerning GSE reform to continue and additional proposals to be advanced. We cannot predict the prospects for the enactment, timing or content of legislative or rulemaking proposals regarding the future status of the GSEs. Accordingly, there continues to be uncertainty regarding the future of the GSEs, including managementwhether they will continue to exist in their current form. GSE reform, if enacted, could result in a significant change to the business operations of our existing businesses and expansion into new businesses and geographic areas, depends in part on our ability to retain and motivate our existing employees and attract new employees. We face significant competition for qualified employees both within and outsideHome Loans & Insurance.
Finally, since the financial services industry,crisis began several years ago, an increasing number of bank failures has imposed significant costs on the FDIC in resolving those failures, and the regulator’s deposit insurance fund has been depleted. In order to maintain a strong funding position and restore reserve ratios of the deposit insurance fund, the FDIC has increased, and may increase in the future, assessment rates of insured institutions, including foreign-based institutions and institutions notBank of America.
Deposits placed at the U.S. Banks are insured by the FDIC, subject to compensation or hiring restrictions imposed under any U. S. government initiatives or not subjectlimits and conditions of applicable law and the FDIC’s regulations. Pursuant to the same regulatory scrutiny. This is particularlyFinancial Reform Act, FDIC insurance coverage limits were permanently increased to $250,000 per customer. The Financial Reform Act also provides for unlimited FDIC insurance coverage for non-interest bearing demand deposit accounts for a two-year period beginning on December 31, 2010 and ending on January 1, 2013. The FDIC administers the caseDIF, and all insured depository institutions are required to pay assessments to the FDIC that fund the DIF. The Financial Reform Act changed the methodology for calculating deposit insurance assessments from the amount of an insured depository institution’s domestic deposits to its total assets minus tangible capital. On February 7, 2011 the FDIC issued a new regulation implementing revisions to the assessment system mandated by the Financial Reform Act. The new regulation will be effective April 1, 2011 and will be reflected in emerging markets, wherethe June 30, 2011 FDIC fund balance and the invoices for assessments due

September 30, 2011. As a result of the new regulations, we expect to incur higher annual deposit insurance assessments. We have identified potential mitigation actions, but they are in the early stages of development and we are often competingnot able to directly control the basis or the amount of premiums that we are required to pay for qualified employees with entities that may have a significantly greater presenceFDIC insurance or more extensive experiencefor other fees or assessment obligations imposed on financial institutions. Any future increases in the region. A substantial portion of our annual bonus compensation paid to our senior employees has in recent years been paid in the form of long-term awards. The value of long-term equity awards to senior employees generally


Bank of America 20099


has been impacted by the significant decline in the market price of our common stock. We also reduced the number of employees across nearly all of our businesses in 2008 and 2009. In addition, the consolidation in the financial servicesrequired deposit insurance premiums or other bank industry has intensified the inherent challenges of cultural integration between differing types of financial services institutions. The combination of these eventsfees could have a significant adverse impact on our abilityfinancial condition and results of operations.

We face substantial potential legal liability and significant regulatory action, which could have material adverse effects on our cash flows, financial condition and results of operations, or cause significant reputational harm to retainus.
We face significant legal risks in our businesses, and hire the most qualified employees.

Our inabilityvolume of claims and amount of damages and penalties claimed in litigation and regulatory proceedings against us and other financial institutions remain high and are increasing. Increased litigation costs, substantial legal liability or significant regulatory action against us could have material adverse effects on our financial condition and results of operations or cause significant reputational harm to successfully integrate, or realize the expected benefits from, our recent acquisitionsus, which in turn could adversely affectimpact our results. There are significant risks and uncertainties associated with mergers. We have made several significant acquisitions in the last several years, including our acquisition of Merrill Lynch, and there is a risk that integration difficulties or a significant decline in asset valuations or cash flows may cause us not to realize expected benefits from the transactions and may affect our results, including adversely impacting the carrying value of the acquisition premium or goodwill.business prospects. In particular, the success of the Merrill Lynch acquisition will depend, in part, on our ability to realize the anticipated benefits and cost savings from combining the businesses of Bank of America and Merrill Lynch. To realize these anticipated benefits and cost savings,addition, we must continue to successfully integrate our businesses, systemsface increased litigation risk and operations. If we are not able to achieve these objectives, the anticipated benefits and cost savings of the acquisition may not be realized fully or may take longer to realize than expected. For example, we may fail to realize the growth opportunities and cost savings anticipated to be derived from the acquisition. Our ability to achieve these objectives has also been made more difficultregulatory scrutiny as a result of the substantial challenges that we are facing in our businesses because of the current economic environment.

In addition, it is possible that the integration process could result in disruption of ourCountrywide and Merrill Lynch’sLynch acquisitions. As a result of ongoing businesses or inconsistencies in standards, controls, procedureschallenging economic conditions and policies that adversely affect our abilitythe increased level of defaults over recent years, we have continued to maintain sufficiently strong relationshipsexperience increased litigation and other disputes with clients, customers, depositorscounterparties regarding relative rights and employees or to achieve the anticipated benefits of the acquisition. Integration efforts may also divert management attentionresponsibilities. These litigation and resources. These integrationregulatory matters and any related settlements could have ana material adverse effect on us for an undetermined period. We will be subject to similar risksour cash flows, financial condition and difficulties in connection with any future acquisitions or decisions to downsize, sell or close units or otherwise change the business mixresults of the Corporation.

We may be adversely impacted by business, economic and political conditions in the non-U.S. jurisdictions in which we operate. We do business throughout the world, including in developing regions of the world commonly known as emerging markets. Our acquisition of Merrill Lynch has significantly increased our exposure to a number of risks in non-U.S. jurisdictions, including economic, market, reputational, operational, litigation and regulatory risks. Our businesses and revenues derived from non-U.S. jurisdictions are subject to risk of loss from currency fluctuations, social or judicial instability, changes in governmental policies or policies of central banks, expropriation, nationalization and/or confiscation of assets, unfavorable political and diplomatic developments and changes in legislation. Also, as in the United States, many non-U.S. jurisdictions in which we do business have beenoperations. They could also negatively impacted by recessionary conditions. While a number of these jurisdictions are showing signs of recovery, others continue to experience increasing levels of stress. In addition, the risk of default on sovereign debt in some non-U.S. jurisdictions is increasing and could expose us to losses.

In many countries, the laws and regulations applicable to the securities and financial services industries are uncertain and evolving, and it may be difficult for us to determine the exact requirements of local laws in every market or manage our relationships with multiple regulators in various jurisdictions. Our inability to remain in compliance with local laws in a particular market and manage our relationships with regulators could have a significant and negative effect not only on our business in that market but also onimpact our reputation generally.

In addition,and lead to volatility of our revenues from emerging markets are particularly exposed to severe political, economic and financial disruptions, including significant currency devaluations, currency exchange controls and low or negative economic growth rates.

We also invest or trade in the securities of corporations and governments located in non-U.S. jurisdictions, including emerging markets. Revenues from the trading of non-U.S. securities may be subject to negative fluctuations as a result of the above factors. Furthermore, the impact of these fluctuations could be magnified, because generally non-U.S. trading markets, particularly in emerging market countries, are smaller, less liquid and more volatile than U.S. trading markets.

We are subject to geopolitical risks, including acts or threats of terrorism, and actions taken by the U.S. or other governments in response and/or military conflicts, that could adversely affect business and economic conditions abroad as well as in the United States.

stock price. For a further discussion of our foreign creditlitigation risks, seeNote 14 – Commitments and trading portfolio, see “Credit Risk Management—Foreign Portfolio” inContingenciesto the MD&A.

Consolidated Financial Statements.

Changes in governmentalgovernmental fiscal and monetary policy could adversely affect our businessesfinancial condition and results of operations..
Our businesses and earnings are affected by domestic and international fiscal and monetary policy. For example, the Federal Reserve Board regulates the supply of money and credit in the United States and its policies determine in large part our cost of funds for lending, investing and capital raising activities and the return we earn on those loans and investments, both of which affect our net interest margin. The actions of the Federal Reserve Board also can materially affect the value of financial instruments we hold, such as debt securities and MSRs, and its policies also can affect our borrowers, potentially increasing the risk that they may fail to repay their loans. Our businesses and earnings are also affected by the fiscal or other policies that are adopted by various U.S. regulatory authorities,non-U.S. governments and international agencies. Changes in domestic and international fiscal and monetary policies are beyond our control and difficult to predict.predict but could have an adverse impact on our capital requirements and the costs of running our businesses, in turn adversely impacting our financial condition and results of operations.
Risk of the Competitive Environment in which We Operate

We face significant and increasing competition in the financial services industry.
We operate in a highly competitive environment.  Over time, there has been substantial consolidation among companies in the financial services industry, and this trend accelerated in recent years as the credit crisis led to numerous mergers and asset acquisitions among industry participants and in certain cases reorganization, restructuring, or even bankruptcy. This trend has also hastened the globalization of the securities and financial services markets. We will continue to experience intensified competition as further


16     Bank of America 2010


consolidation in the financial services industry in connection with current market conditions may suffer losses asproduce larger, better-capitalized and more geographically diverse companies that are capable of offering a resultwider array of operational risk or technical system failures.The potentialfinancial products and services at more competitive prices. To the extent we expand into new business areas and new geographic regions, we may face competitors with more experience and more established relationships with clients, regulators and industry participants in the relevant market, which could adversely affect our ability to compete. In addition, technological advances and the growth ofe-commerce have made it possible for operational risk exposure exists throughoutnon-depository institutions to offer products and services that traditionally were banking products, and for financial institutions to compete with technology companies in providing electronic and internet-based financial solutions. Increased competition may negatively affect our organization. Integralresults of operations by creating pressure to lower prices on our products and services and reducing market share.
Damage to our reputation could significantly harm our businesses, including our competitive position and business prospects.
Our ability to attract and retain investors, customers, clients and employees could be adversely affected to the extent our reputation is damaged. Significant harm to our reputation can arise from many sources, including employee misconduct, litigation or regulatory outcomes, failing to deliver minimum standards of service and quality, compliance failures, unethical behavior, unintended disclosure of confidential information, and the activities of our clients, customers and counterparties. Actions by the financial services industry generally or by certain members or individuals in the industry also can significantly adversely affect our reputation.
Our actual or perceived failure to address various issues also could give rise to reputational risk that could cause significant harm to us and our business prospects, including failure to properly address operational risks. These issues include legal and regulatory requirements, privacy, properly maintaining customer and associate personal information, record keeping, protecting against money-laundering, sales and trading practices, ethical issues, and the proper identification of the legal, reputational, credit, liquidity and market risks inherent in our products.
We could suffer significant reputational harm if we fail to properly identify and manage potential conflicts of interest. Management of potential conflicts of interests has become increasingly complex as we expand our business activities through more numerous transactions, obligations and interests with and among our clients. The failure to adequately address, or the perceived failure to adequately address, conflicts of interest could affect the willingness of clients to deal with us, or give rise to litigation or enforcement actions, which could adversely affect our businesses.
We continue to face increased public and regulatory scrutiny resulting from the financial crisis, including our foreclosure practices, modifications of mortgages, volume of lending, compensation practices, our acquisitions of Countrywide and Merrill Lynch, and the suitability of certain trading and investment businesses. Failure to appropriately address any of these issues could also give rise to additional regulatory restrictions, legal risks and reputational harm, which could, among other consequences, increase the size and number of litigation claims and damages asserted or subject us to enforcement actions, fines and penalties and cause us to incur related costs and expenses.
Our ability to attract and retain qualified employees is critical to the success of our businesses and failure to do so could adversely affect our business prospects, including our competitive position and results of operations.
Our performance is heavily dependent on the continued efficacytalents and efforts of highly skilled individuals. Competition for qualified personnel within the financial services industry and from businesses outside the financial services industry has been, and is expected to continue to be, intense even during difficult economic times. Our competitors includenon-U.S.-based institutions and institutions otherwise not subject to compensation and hiring regulations imposed on U.S. institutions and financial institutions in particular. The difficulty we face in competing for key personnel is exacerbated in emerging markets, where we

are often competing for qualified employees with entities that may have a significantly greater presence or more extensive experience in the region.
In order to attract and retain qualified personnel, we must provide market-level compensation. As a large financial and banking institution, we may be subject to limitations on compensation practices (which may or may not affect our competitors) by the Federal Reserve Board, the FDIC or other regulators around the world. Any future limitations on executive compensation imposed by legislators and regulators could adversely affect our ability to attract and maintain qualified employees. Furthermore, a substantial portion of our internal processes, systems, relationships with third parties andannual bonus compensation paid to our senior employees has in recent years taken the vast arrayform of associates and key executives in our day-to-day and ongoing operations, including losses resulting from unauthorized tradeslong-term equity awards. The value of long-term equity awards to senior employees generally has been negatively affected by any associates. Operational risk also encompasses the failure to implement strategic objectives in a successful, timely and cost-effective manner. Failure to properly manage operational risk subjects us to risks of loss that may vary in size, scale and scope, including loss of customers. This also includes but is not limited to operational or technical failures, unlawful tampering with our technical systems, ineffectiveness or exposure due to interruption in third party support, as well as the loss of key individuals or failure on the part of key individuals to perform properly. For further discussion of operational risks and our operational risk management, see “Operational Risk Management”significant decline in the MD&A.

market price of our common stock. If we are unable to continue to attract and retain qualified individuals, our business prospects, including our competitive position and results of operations, could be adversely affected.

Our inability to adapt our productsproducts and services to evolving industry standards and consumer preferences could harm our businessesbusinesses..
Our business model is based on a diversified mix of businesses that provide a broad range of financial products and services, delivered through multiple distribution channels. Our success depends, in part, on our ability to adapt our products and services to evolving industry standards. There is increasing pressure by competitors to provide products and services at lower prices. This can reduce our net interest margin and revenues from our fee-based products and services. In addition, the widespread adoption of new technologies, including internet services, could require us to incur substantial expenditures to modify or adapt our existing products and services. We might not be successful in developing or introducing new products and services, responding or adapting to changes in


10Bank of America 2009


consumer spending and saving habits, achieving market acceptance of our products and services, or sufficiently developing and maintaining loyal customers.

Risks Related to Risk Management
Our risk management framework may not be effective in mitigating risk and reducing the potential for significant losses.
Our risk management framework is designed to minimize risk and loss to us. We seek to identify, measure, monitor, report and control our exposure to the types of risk to which we are subject, including strategic, credit, market, liquidity, compliance, fiduciary, operational and reputational risks, among others. While we employ a broad and diversified set of risk monitoring and mitigation techniques, those techniques are inherently limited because they cannot anticipate the existence or future development of currently unanticipated or unknown risks. For example, recent economic conditions, heightened legislative and regulatory scrutiny of the financial services industry and increases in the overall complexity of our operations, among other developments, have resulted in the creation of a variety of previously unanticipated or unknown risks, highlighting the intrinsic limitations of our risk monitoring and mitigation techniques. As such, we may incur future losses due to the development of such previously unanticipated or unknown risks.
For additional information about our risk management policies and procedures, see Managing Risk in the MD&A beginning on page 59.
A failure in or breach of our operational or security systems or infrastructure, or those of third parties, could disrupt our businesses, result in the disclosure of confidential information or damage our reputation. Any such failure also could have a significant adverse effect on our reputation, cash flows, financial condition, and results of operations.
Our businesses are highly dependent on our ability to process and monitor, on a continuous basis, a large number of transactions, many of which are highly complex, across numerous and diverse markets in many currencies. The potential for operational risk exposure exists throughout our organization, including losses resulting from unauthorized trades by any employees.


Bank of America Corporation2010     17


Integral to our performance is the continued efficacy of our internal processes, systems, relationships with third parties and the vast array of employees and key executives in ourday-to-day and ongoing operations. Our financial, accounting, data processing or other operating systems and facilities may fail to operate properly or become disabled as a holding companyresult of events that are wholly or partially beyond our control and as such is dependent upon its subsidiaries for liquidity, including itsadversely affect our ability to pay dividends. Bankprocess these transactions or provide these services. We must continuously update these systems to support our operations and growth. This updating entails significant costs and creates risks associated with implementing new systems and integrating them with existing ones.
In addition, we also face the risk of America Corporation isoperational failure, termination or capacity constraints of any of the clearing agents, exchanges, clearing houses or other financial intermediaries we use to facilitate our securities transactions. In recent years, there has been significant consolidation among clearing agents, exchanges and clearing houses, which has increased our exposure to operational failure, termination or capacity constraints of the particular financial intermediaries that we use and could affect our ability to find adequate and cost-effective alternatives in the event of any such failure, termination or constraint. Industry consolidation, whether among market participants or financial intermediaries, increases the risk of operational failure as disparate complex systems need to be integrated, often on an accelerated basis.
Furthermore, the interconnectivity of multiple financial institutions with central agents, exchanges and clearing houses, and the increased centrality of these entities under proposed and potential regulation, increases the risk that an operational failure at one institution or entity may cause an industry-wide operational failure that could adversely impact our own business operations. Any such failure, termination or constraint could adversely affect our ability to effect transactions, service our clients, manage our exposure to risk or expand our businesses and could have a separatesignificant adverse impact on our liquidity, financial condition, and distinct legal entity from our bankingresults of operations.
Our operations rely on the secure processing, storage and nonbanking subsidiaries. We therefore depend on dividends, distributionstransmission of confidential and other paymentsinformation in our computer systems and networks. Although we take protective measures and endeavor to modify them as circumstances warrant, the security of our computer systems, software and networks may be vulnerable to breaches, unauthorized access, misuse, computer viruses or other malicious code and other events that could have a security impact. Additionally, breaches of security may occur through intentional or unintentional acts by those having authorized or unauthorized access to our or our clients’ or counterparties’ confidential or other information. If one or more of such events occur, this potentially could jeopardize our or our clients’ or counterparties’ confidential and other information processed and stored in, and transmitted through, our computer systems and networks, or otherwise cause interruptions or malfunctions in our, our clients’, our counterparties’ or third parties’ operations, which could result in significant losses or reputational damage to us. We may be required to expend significant additional resources to modify our protective measures or to investigate and remediate vulnerabilities or other exposures arising from operational and security risks, and we may be subject to litigation and financial losses that are either not insured against or not fully covered through any insurance maintained by us.
We routinely transmit and receive personal, confidential and proprietary information bye-mail and other electronic means. We have discussed and worked with clients, vendors, service providers, counterparties and other third parties to develop secure transmission capabilities, but we do not have, and may be unable to put in place, secure capabilities with all of our bankingclients, vendors, service providers, counterparties and nonbanking subsidiariesother third parties, and we may not be able to fund dividend paymentsensure that these third parties have appropriate controls in place to protect the confidentiality of the information. Any interception, misuse or mishandling of personal, confidential or proprietary information being sent to or received from a client, vendor, service provider, counterparty or other third party could result in legal liability, regulatory action and

reputational harm for us and could have a significant adverse effect on our common stockcompetitive position, financial condition and preferred stockresults of operations.
With regard to the physical infrastructure that supports our operations, we have taken measures to implement backup systems and other safeguards, but our ability to fund all paymentsconduct business may be adversely affected by any disruption to that infrastructure. Such disruptions could involve electrical, communications, internet, transportation or other services used by us or third parties with whom we conduct business. These disruptions may occur as a result of events that affect only our facilities or those of our clients or other business partners but they could also be the result of events with a broader impact globally, regionally or in the cities where those facilities are located. The costs associated with such disruptions, including any loss of business, could have a significant adverse effect on our other obligations,results of operations or financial condition.
Any of these operational and security risks could lead to significant and negative consequences, including debt obligations. Manyreputational harm as well as loss of our subsidiaries are subject to laws that authorize regulatory agencies to block or reduce the flow of funds from those subsidiaries to Bank of America Corporation. Regulatory action of that kindcustomers and business opportunities, which in turn could impede access to funds we need to make pay - -

mentshave a significant adverse effect on our obligations or dividend payments. In addition, our right to participate in a distributionbusinesses, financial condition and results of assets upon a subsidiary’s liquidation or reorganization is subject to the prior claims of the subsidiary’s creditors.operations. For a further discussion regardingof operational risks and our operational risk management, see Operational Risk Management in the MD&A beginning on page 106.

Risk Related to Past Acquisitions
Any failure to successfully integrate or otherwise realize the expected benefits from our recent acquisitions could adversely affect our results of operations.
There are significant risks and uncertainties associated with mergers and acquisitions. We have made several significant acquisitions in the last several years, including Merrill Lynch and Countrywide, and the success of these acquisitions faces numerous challenges. In particular, the success of our acquisition of Merrill Lynch in 2009 will continue to depend, in part, on our ability to pay dividends,realize the anticipated benefits and cost savings from combining the businesses of Bank of America and Merrill Lynch. If we are not able to successfully integrate these businesses, the anticipated benefits and cost savings of the acquisition may not be realized fully or may take longer to realize than expected. For example, we may fail to realize the growth opportunities and cost savings anticipated to be derived from the acquisition. With regard to any of our acquisitions, a significant decline in asset valuations or cash flows may also cause us not to realize expected benefits. These failures could in turn negatively affect our financial condition, including adversely impacting the carrying value of the acquisition premium or goodwill. Our ability to achieve these objectives has also been made more difficult as a result of the substantial challenges that we are facing in our businesses because of the current economic environment.
In addition, it is possible that the integration process could result in disruption of our and Merrill Lynch’s ongoing businesses or inconsistencies in standards, controls, procedures and policies that adversely affect our ability to maintain sufficiently strong relationships with clients, customers, depositors and employees or to achieve the anticipated benefits of the acquisition. Integration efforts may also divert management attention and resources. These integration matters could have an adverse effect on us for an undetermined period. We will be subject to similar risks and difficulties in connection with any future acquisitions or decisions to downsize, sell or close units or otherwise change the business mix of the Corporation.
Risk of Being an International Business
We are subject to numerous political, economic, market, reputational, operational, legal, regulatory and other risks in thenon-U.S. jurisdictions in which we operate which could adversely impact our businesses.
We do business throughout the world, including in developing regions of the world commonly known as emerging markets. Our businesses and revenues derived fromnon-U.S. jurisdictions are subject to risk of loss from currency fluctuations, social or judicial instability, changes in governmental


18     Bank of America 2010


policies or policies of central banks, expropriation, nationalizationand/or confiscation of assets, price controls, capital controls, exchange controls, other restrictive actions, unfavorable political and diplomatic developments and changes in legislation. These risks are especially acute in emerging markets. As in the United States, manynon-U.S. jurisdictions in which we do business have been negatively impacted by recessionary conditions. While a number of these jurisdictions are showing signs of recovery, others continue to experience increasing levels of stress. In addition, the risk of default on sovereign debt in somenon-U.S. jurisdictions is increasing and could expose us to substantial losses. Any such unfavorable conditions or developments could have an adverse impact on our businesses and results of operations.
Ournon-U.S. businesses are also subject to extensive regulation by variousnon-U.S. regulators, including governments, securities exchanges, central banks and other regulatory bodies, in the jurisdictions in which those businesses operate. In many countries, the laws and regulations applicable to the financial services and securities industries are uncertain and evolving, and it may be difficult for us to determine the exact requirements of local laws in every market or manage our relationships with multiple regulators in various jurisdictions. Our inability to remain in compliance with local laws in a particular market and manage our relationships with regulators could have a significant and adverse effect not only on our businesses in that market but also on our reputation generally.
We also invest or trade in the securities of corporations and governments located innon-U.S. jurisdictions, including emerging markets. Revenues from the trading ofnon-U.S. securities may be subject to negative fluctuations as a result of the above factors. Furthermore, the impact of these fluctuations could be magnified, becausenon-U.S. trading markets, particularly in emerging market countries, are generally smaller, less liquid and more volatile than U.S. trading markets.
We are subject to geopolitical risks, including acts or threats of terrorism, and actions taken by the U.S. or other governments in responseand/or military conflicts, that could adversely affect business and economic conditions abroad as well as in the United States.

For a further discussion of ournon-U.S. credit and trading portfolio, see “Government Supervision and Regulation – Distributions”Credit Risk Management —Non-U.S. Portfolio in the MD&A beginning on page 494.
Risk from Accounting Changes
Changes in accounting standards or inaccurate estimates or assumptions in the application of thisaccounting policies could adversely affect our financial condition and results of operations.
Our accounting policies and methods are fundamental to how we record and report our financial condition and Note 15 –Shareholders’ Equityresults of operations. Some of these policies require use of estimates and Earnings Per Common Shareassumptions that may affect the reported value of our assets or liabilities and results of operations and are critical because they require management to make difficult, subjective and complex judgments about matters that are inherently uncertain. If those assumptions, estimate or judgments were incorrectly made, we could be required to correct and restate prior period financial statements.
Accounting standard-setters and those who interpret the accounting standards (such as the Financial Accounting Standards Board (FASB), the SEC, banking regulators and our independent registered public accounting firm) may also amend or even reverse their previous interpretations or positions on how various standards should be applied. These changes can be hard to predict and can materially impact how we record and report our financial condition and results of operations. In some cases, we could be required to apply a new or revised standard retroactively, resulting in the Corporation needing to revise and republish prior period financial statements. For a further discussion of some of our critical accounting policies and standards and recent accounting changes, see Complex Accounting Estimates in the MD&A beginning on page 107 andNote 161Regulatory Requirements andSummary of Significant Accounting PrinciplesRestrictionsto the Consolidated Financial Statements.

Item 1B.  Unresolved Staff Comments

Item 1B. Unresolved Staff Comments
There are no unresolved written comments that were received from the SEC’s staffSEC Staff 180 days or more before the end of our 20092010 fiscal year relating to our periodic or current reports filed under the Securities Exchange Act of 1934.


Item 2.  Properties


Item 2. Properties
As of December 31, 2009,2010, our principal offices and other materially important properties consisted of the following:

Property 
Primary Business
Bank Occupied Space and Amount
Facility NameLocationProperty Type Primary Segment 

Owned/

Leased

Property Status
 

Occupied; Sub-LeasedLeased to

3rd parties

Parties

Bank of America

Corporate
Center

Charlotte,
NC

 60 story building Principal executive offices-AllExecutive
Offices – All Business Segments*
Segments
 Owned Occupy 48% (573,734Directly occupy 50% (624,153 sq. ft.); sub-lease 50% (603,833
of building while subleasing an
additional 48% (576,233 sq. ft.) of the space.
1 Bank of
America Center
Charlotte,
NC
30 story buildingDeposits, Home
Loans & Insurance,
GBAM
andGWIM
OwnedDirectly occupy 21% (159,000 sq. ft.)
of building while subleasing an additional 10%
(75,000 sq. ft.) of the space.
4 World
Financial Center
New York,
NY
34 story building
(North Tower)
GBAM49% Owned (1)Directly occupy 100% (1,803,157 sq. ft.)
of building

One Bryant
Park

New York,
NY
51 Story buildingGBAM49.9% Owned (1)Directly occupy 74% (1,834,969 sq. ft.)
of building
100 Federal Street

St.
Boston

Boston, MA

 37 story building Global Wealth & Investment ManagementGWIM Owned Occupy 51% (636,202Directly occupy 65% (818,019 sq. ft.); sub-lease 38% (470,029
of building while subleasing an
additional 35% (434,160 sq. ft.) of buildingthe space.

Bank of America Tower

One Bryant Hopewell Office
Park

New York, NY

Campus
 52 story buildingGlobal Markets; Global Wealth & Investment Management

49%

Owned

Occupy 99% of building (1,628,416 sq. ft.)

2 World Financial Center

New York, NY

44 story building (South Tower)Global Markets; Global Wealth & Investment ManagementLeasedOccupy 24% (609,155 sq. ft.); sub-lease 72% (1,815,833 sq. ft.) of building

4 World Financial Center

New York, NY

34 story building (North Tower)Global Markets; Global Wealth & Investment Management

49%

Owned

Occupy 78% (1,215,754 sq. ft.) of building

222 Broadway

New York, NY

31 story buildingGlobal Markets; Global Wealth & Investment ManagementOwnedOccupy 93% (652,633 sq. ft.); sub-lease 7% (50,902 sq. ft.) of building

Hopewell, Campus

Hopewell,
NJ

 8 building campus All Business SegmentsGWIM Owned Occupy 99% (1,561,611Directly occupy 100% (1,606,025 sq. ft.); sub-lease 1%
of buildingscampus.

Jacksonville Complex

Jacksonville, FL

Concord
Campus
 9 building campusAll Business SegmentsLeasedOccupy 80% (950,842 sq. ft.) of buildings

Jacksonville Campus

Jacksonville, FL

Concord, CA
 4 building campus All Business
Segments
 Owned Occupy 95% (549,436Directly occupy 100% (1,075,241 sq. ft.)
of buildingscampus.

Concord Villa Park
Campus

Concord, CA

 4Richmond,
VA
3 building campus All Business
Segments
OwnedOccupy 82% (887,469 sq. ft.) of buildings

Merrill Lynch Financial Center

London, England

4 building campusGlobal Markets; Global Wealth & Investment Management Leased OccupyDirectly occupy 84% (485,495(770,322 sq. ft.)
of buildingscampus.

Other London Locations

London, England

 3 buildings Global Markets; Global Wealth & Investment Management Leased Occupy 70% (125,962 sq. ft.); sub-lease 5% of buildings

Bank of America

Merrill Lynch Japan

Tokyo, Japan

 20 story buildingGlobal Markets; Global Wealth & Investment ManagementLeasedOccupy 60% (158,861 sq. ft.); sub-lease 24% (62,613 sq. ft.) of building
*

All Business Segments consists ofDeposits, Global Card Services, Home Loans & Insurance, Global Commercial Banking, Global Markets GBAMand Global Wealth& Investment ManagementGWIM.

(1)Represents percentage ownership interest in entity that owns the property.

We own or lease approximately 118.7120 million square feet in 27,77926,910 locations in 50 statesglobally, including approximately 112 million square feet in the United States (all 50 U.S. states, the District of Columbia, the U.S. Virgin Islands and Puerto Rico. We also own or leaseRico) and approximately 6.9eight million square feet in 90 cities in 44 foreignnon-U.S. countries.
We believe that theour owned and leased properties we own or lease are adequate for our business needs and are well maintained. We continue to evaluate our current and

projected space requirements and may determine from time to time that certain of our premises and facilities are no longer necessary for our operations. There is no assurance that we will be able to dispose of any such excess premises, and we may incur costs in connection with such disposition, including costs that could be material to our results of operations in any given period.


Bank of America 2010     19

Item 3.  Legal Proceedings


Item 3. Legal Proceedings
See “LitigationLitigation and Regulatory Matters”Matters inNote 14 – Commitments and Contingenciesto the Consolidated Financial Statements beginning on page 160 for Bank of America’s litigation disclosure which is incorporated herein by reference.

Item 4.  Submission of Matters To A Vote of Security Holders

There were no matters submitted to a vote of stockholders during the quarter ended December 31, 2009.

Item 4. Removed and Reserved
The name, age and position of each of our current executive officers are listed below along with such officer’s business experience. Unless otherwise indicated, executive officers are appointed by the Board to hold office until their successors are elected and qualified or until their earlier resignation or removal.

Neil A. Cotty (55) Interim Chief Financial Officer since February 1, 2010 andChief Accounting Officer since July 2009; Chief Financial Officer, Global Banking and Global Wealth and Investment Management from October 2008 to July 2009; Chief Accounting Officer from April 2004 to September 2008; Senior Finance Executive for Consumer Products supporting Commercial Banking (now Global Commercial Banking) from October 2003 to April 2004; Senior Finance Executive for Consumer Products from January 2003 to October 2003.

David C. Darnell (56)(58) President, Global Commercial Bankingsince July 2005. Mr. Darnell joined the Corporation in 1979 and served in a number of senior leadership roles before becoming the President Middle Market Banking Group from June 2001 to July 2005; President, Bank of America Central Region from August 2000


Bank of America 200911


to June 2001; President, Bank of America Midwest and Texas from September 1996 to August 2000; Executive Vice President andGlobal Commercial Division Executive in Florida from January 1989 to September 1996.

Banking.

Barbara J. Desoer (57)(58) President, Bank of America Home Loans and InsurancesinceJulysince July 2008; Chief Technology and Operations Officer from August 2004 to July 2008; President, Consumer Products from July 2001 to August 2004; Director2008. Ms. Desoer joined a predecessor of Marketing from September 1999 to July 2001; President, Bankthe Corporation in 1977 and served in a number of America Northern California from January 1998 to September 1999.

senior leadership roles before becoming Chief Technology and Operations Officer.

Sallie L. Krawcheck (45)(46) President, Global Wealth and Investment Managementsince August 2009; Chairman of Global Wealth Management of Citigroup, Inc. from January 2007 until December 2008; Chief Executive Officer of Global Wealth Management of Citigroup, Inc. from January 2007 to September 2008; Chief Financial Officer and Head of Strategy of Citigroup, Inc. from November 2004 to January 2007; Chairman and2007.
Terrence P. Laughlin (56) Legacy Asset Servicing Executivesince February 2011; Credit Loss Mitigation Strategies & Secondary Markets Executive from August 2010 to February 2011; Chief Executive Officer - SmithBarneyand President of Citigroup, Inc.OneWest Bank, FSB from October 2002March 2009 to November 2004;July 2010; Chairman and Chief Executive Officer of Sanford C. BernsteinMerrill Lynch Bank & Trust Co. prior, FSB from February 2005 to 2002.

May 2008.

Thomas K. Montag (52)(54) President, Global Banking and Marketssince August 2009; President, Global Markets from January 2009 to August 2009; Executive Vice President and Head of Global Sales and Trading of Merrill Lynch & Co., Inc. from August 2008 to December 2008; Co-head, Global

Securities of The Goldman Sachs Group, Inc. from 2006 to 2008; Co-president, Japanese Operations of The Goldman Sachs Group, Inc. from 2002 to 2007; Member, Management Committee of The Goldman Sachs Group, Inc. from 2002 to 2008; Member, Fixed Income, Currency and Commodities & Equities Executive Committee of The Goldman Sachs Group, Inc. from 2000 to 2008.

Brian T. Moynihan (50)(51) President and Chief Executive OfficersinceJanuarysince January 2010; President, Consumer and Small Business Banking from August 2009 to December 2009; President, Global Banking and Wealth

Management (now Global Wealth and Investment Management) from January 2009 to August 2009; General Counsel from December 2008 to January 2009; President, Global Corporate and Investment Banking (now Global Banking and Markets) from October 2007 to December 2008; President, Global Wealth and Investment Management from April 2004 to October 2007;2007.

Charles H. Noski (58) Executive Vice President and Chief Financial Officersince May 2010. Mr. Noski has served as a director of FleetBoston FinancialMicrosoft Corporation since November 2003; director of Air Products and Chemicals, Inc. from 1999October 2000 to January 2004 and from May 2005 to May 2010; director of Morgan Stanley from September 2005 to April 2004, with responsibility for Brokerage and Wealth Management2010; director of Automatic Data Processing, Inc. from 2000 and Regional Commercial Financial Services and Investment Management fromApril 2008 to May 2003.

2010.

Edward P. O’Keefe (54)(55) General Counselsince January 2009; Deputy General Counsel and Head of Litigation from December 2008 to January 2009; Global Compliance and Operational Risk Executive and Senior Privacy Executive from September 2008 to December 2008; Deputy General Counsel for Staff Support from August 2004January 2005 to September 2008.

Joe L. Price (49) President;(50) President, Consumer and Small Business and Card Bankingsince February 1, 2010; Chief Financial Officer from January 2007 to January 2010; Global Corporate and Investment Banking Risk Management Executive from June 2003 to December 2006; Senior Vice President, Corporate Strategy and President, Consumer Special Assets from July 2002 to May 2003; President, Consumer Finance from November 1999 to July 2002; Corporate Risk Evaluation Executive and General Auditor from August 1997 to October 1999; Controller from June 1995 to July 1997; Accounting Policy and Finance Executive from April 1993 to May 1995.

2006.

Bruce R. Thompson (45)(46) Chief Risk Officersince January 2010; Head of Global Capital Markets from July 2008 to January 2010; Co-head of Capital Markets (now Global Capital Markets) from October 2007 to July 2008;Co-head of Global Credit Products from June 2007 to October 2007; Co-head of Global Leveraged Finance from March 2007 to June 2007; Head of U.S. Leveraged Finance Capital Markets from May 2006 to March 2007; Managing Director of Banc of America Securities LLC, a subsidiary of the Corporation, from 1996 to May 2006.


12Bank of America 2009

20     Bank of America 2010


Part II
Bank of America Corporation and Subsidiaries

Part II
Bank of America Corporation and Subsidiaries

Item 5. Market for Registrant’s Common Equity, Related Stockholder Matters and Issuer Purchases of Equity Securities

The principal market on which our common stock is traded is the New York Stock Exchange. Our common stock is also listed on the London Stock Exchange, and certain shares are listed on the Tokyo Stock Exchange. The following table sets forth the high and low closing sales prices of the common stock on the New York Stock Exchange for the periods indicated:

   Quarter    High    Low

2008


first

    $45.03    $35.31
 

second

     40.86     23.87
 

third

     37.48     18.52
 

fourth

     38.13     11.25

2009


first

     14.33     3.14
 

second

     14.17     7.05
 

third

     17.98     11.84
 

fourth

     18.59     14.58

           
  Quarter High  Low 
2009 first $14.33  $3.14 
  second  14.17   7.05 
  third  17.98   11.84 
  fourth  18.59   14.58 
2010 first  18.04   14.45 
  second  19.48   14.37 
  third  15.67   12.32 
  fourth  13.56   10.95 
           
As of February 24, 2010,15, 2011, there were 257,307247,064 registered shareholders of common stock. During 20082009 and 2009,2010, we paid dividends on the common stock on a quarterly basis.

The following table sets forth dividends paid per share of our common stock for the periods indicated:

   Quarter    Dividend

2008


first

    $0.64
 

second

     0.64
 

third

     0.64
 

fourth

     0.32

2009


first

     0.01
 

second

     0.01
 

third

     0.01
 

fourth

     0.01

       
  Quarter Dividend 
2009 first $0.01 
  second  0.01 
  third  0.01 
  fourth  0.01 
2010 first  0.01 
  second  0.01 
  third  0.01 
  fourth  0.01 
       
For additional information regarding our ability to pay dividends, see the discussion under the heading “Government Supervision and Regulation – Distributions” on page 4 of this report andNote 15 – Shareholders’ Equity and Earnings Per Common Share to the Consolidated Financial Statements beginning on page 171, andNote 1618 – Regulatory Requirements and Restrictionsto the Consolidated Financial Statements, beginning on page 175, which are incorporated herein by reference.

For information on our equity compensation plans, see Item 12 beginning on page 204244 of this report andNote 1820 – Stock-Based Compensation Plansto the Consolidated Financial Statements beginning on page 182, both of which are incorporated herein by reference.


The table below presents share repurchase activity for the three months ended December 31, 2009. For additional information regarding share repurchases on these restrictions, seeNote 15 – Shareholders’ Equity and Earnings Per Common Share to the Consolidated Financial Statements on page 171 which is incorporated herein by reference.

(Dollars in millions, except per share information; shares in thousands)  Common Shares
Repurchased(1)
  Weighted Average
Per Share Price
  Shares
Purchased as
Part of Publicly
Announced
Programs
  Remaining Buyback
Authority(2)
        Amounts  Shares

October 1 – 31, 2009

  98  15.96  -  3,750  75,000

November 1 – 30, 2009

  24  14.28  -  3,750  75,000

December 1 – 31, 2009

  314  14.50  -  3,750  75,000

Three months ended December 31, 2009

  435  14.82         
2010.
                     
        Shares
       
        Purchased as
  Remaining Buyback
 
        Part of Publicly
  Authority 
  Common Shares
  Weighted-Average
  Announced
   
(Dollars in millions, except per share information; shares in thousands) Repurchased (1)  Per Share Price  Programs  Amounts  Shares 
October 1 – 31, 2010  252  $13.32          
November 1 – 30, 2010  5  $12.96          
December 1 – 31, 2010  101  $12.28          
                     
Three months ended December 31, 2010
  358  $13.02             
                     
(1)

Consists of shares of our common stock purchased by participants under certain retirement plans and shares acquired by usthe Corporation in connection with satisfaction of tax withholding obligations on vested restricted stock or restricted stock units and certain forfeitures andfrom terminations of employment related to awards under equity incentive plans.

(2)

On July 23, 2008, the Board authorized a stock repurchase program of up to 75 million shares of our common stock at an aggregate cost not to exceed $3.75 billion and is limited to a period of 12 to 18 months. The stock repurchase program expired on January 23, 2010.

We did not have any unregistered sales of our equity securities in 2009, except as previously disclosed on Form 8-K.

2010.

Item 6.  Selected Financial Data

Item 6. Selected Financial Data
See Table 6 in the MD&A on page 2432 and Table XII of the Statistical Tables on page 105125 which are incorporated herein by reference.


Bank of America 200913

Bank of America 2010     21


Item 7. Bank of America Corporation and Subsidiaries


Management’s Discussion and Analysis of Financial Condition and Results of Operations


Table of Contents

  Page

 1624

 2028

 2229

33
 2536

 2738

 2839

 2940

 3141

 3344

 3545

 3848

 4150

 4251

 4356

 4459

 4762

 4763

67
 5471

 5472

 6483

 7494

 7696

 7697

 79100

 80100

 83103

 86106

 86106

 86106

ASF Framework

87

 88107

 92113

 92113

 93114

 95115

 108132

Throughout the MD&A, we use certain acronyms and


abbreviations which are defined in the Glossary beginning on page 108.Glossary.

14Bank of America 2009
22     Bank of America 2010


Management’s Discussion and Analysis of Financial Condition and Results of Operations

This report onForm 10-K, the documents that it incorporates by reference and the documents into which it may be incorporated by reference may contain, and from time to time ourBank of America Corporation (collectively with its subsidiaries, the Corporation) and its management may make, certain statements that constitute forward-looking statements. Wordsstatements within the meaning of the Private Securities Litigation Reform Act of 1995. These statements can be identified by the fact that they do not relate strictly to historical or current facts. Forward-looking statements often use words such as “expects,” “anticipates,” “believes,” “estimates”“estimates,” “targets,” “intends,” “plans,” “goal” and other similar expressions or future or conditional verbs such as “will,” “may,” “might,” “should,” “would” and “could” are intended to identify such“could.” The forward-looking statements. These statements are not historical facts, but insteadmade represent the current expectations, plans or forecasts of Bank of Americathe Corporation and its subsidiaries (the Corporation) regarding the Corporation’s integration of the Merrill Lynch and Countrywide acquisitions and related cost savings, future results and revenues, and future business and economic conditions more generally, including statements concerning: the adequacy of the liability for the remaining representations and warranties exposure to the government-sponsored enterprises (GSEs) and the future impact to earnings; the potential assertion and impact of additional claims not addressed by the GSE agreements; the expected repurchase claims on the2004-2008 loan vintages; representations and warranties liabilities (also commonly referred to as reserves), and range of possible loss estimates, expenses and repurchase claims and resolution of those claims; the proposal to modestly increase dividends in the second half of 2011; the charge to income tax expense resulting from a reduction in the United Kingdom (U.K.) corporate income tax rate; future payment protection insurance claims in the U.K.; future risk-weighted assets and any mitigation efforts to reduce risk-weighted assets; net interest income; credit trends and conditions, including credit losses, credit reserves, and charge-offs, delinquency trends and nonperforming asset levels, level of preferred dividends,levels; consumer and commercial service charges, including the closing of the sales of Columbia Management (Columbia) and First Republic Bank, effective tax rate, noninterest expense, impact of changes in fair valuethe Corporation’s overdraft policy as well as from the Electronic Fund Transfer Act and the Corporation’s ability to mitigate a decline in revenues; liquidity; capital levels determined by or established in accordance with accounting principles generally accepted in the United States of Merrill Lynch structured notes,America (GAAP) and with the requirements of various regulatory agencies, including our ability to comply with any Basel capital requirements endorsed by U.S. regulators without raising additional capital; the revenue impact of new accounting guidance regarding consolidation on capitalthe Credit Card Accountability Responsibility and reserves,Disclosure Act of 2009 (the CARD Act); the revenue impact resulting from, and any mitigation actions taken in response to, the Dodd-Frank Wall Street Reform and Consumer Protection Act (the Financial Reform Act) including the impact of the Volcker Rule and derivatives regulations; mortgage production levels; long-term debt levels; run-off of loan portfolios; the effectimpact of various legal proceedings discussed in “Litigation and Regulatory Matters” in Note 14 – Commitments and Contingencies to the Consolidated Financial StatementsStatements; the number of delayed foreclosure sales and the resulting financial impact and other similar matters; and other matters relating to the Corporation and the securities that we may offer from time to time. The foregoing is not an exclusive list of all forward-looking statements the Corporation makes. These statements are not guarantees of future results or performance and involve certain risks, uncertainties and assumptions that are difficult to predict and often are beyond the Corporation’s control. Actual outcomes and results may differ materially from those expressed in, or implied by, the Corporation’s forward-looking statements.

You should not place undue reliance on any forward-looking statement and should consider the following uncertainties and risks, as well as the risks and uncertainties more fully discussed elsewhere in this report, including under Item 1A. “Risk Factors,” and in any of the Corporation’s other subsequent Securities and Exchange Commission (SEC) filings: the Corporation’s resolution of certain

representations and warranties obligations with the GSEs and our ability to resolve any remaining claims; the Corporation’s ability to resolve any representations and warranties obligations with monolines and private investors; failure to satisfy our obligations as servicer in the residential mortgage securitization process; the adequacy of the liabilityand/or range of possible loss estimates for the representations and warranties exposures to the GSEs, monolines and private-label and other investors; the potential assertion and impact of additional claims not addressed by the GSE agreements; the foreclosure review and assessment process, the effectiveness of the Corporation’s response and any governmental or private third-party claims asserted in connection with these foreclosure matters; the adequacy of the reserve for future payment protection insurance claims in the U.K.; negative economic conditions that adversely affectgenerally including continued weakness in the general economy,U.S. housing prices, job market, consumer confidencehigh unemployment in the U.S., as well as economic challenges in manynon-U.S. countries in which we operate and spending habits which may affect, among other things, the credit quality of our loan portfolios (the degree of the impact of which is dependent upon the duration and severity of these conditions);sovereign debt challenges; the Corporation’s mortgage modification policies and related results; the level and volatility of the capital markets, interest

rates, currency values and other market indices which may affect, among other things, our liquidity and the value of our assets and liabilities and, in turn, our trading and investment portfolios;indices; changes in consumer, investor and counterparty confidence in, and the related impact on, financial markets and institutions;institutions, including the Corporation as well as its business partners; the Corporation’s credit ratings and the credit ratings of our securitizations which are important to the Corporation’s liquidity, borrowing costs and trading revenues;its securitizations; estimates of the fair value of certain of the Corporation’s assets and liabilities which could change in value significantly from period to period;liabilities; legislative and regulatory actions in the United StatesU.S. (including the impact of the Financial Reform Act, the Electronic Fund Transfer Act, the Credit Card Accountability Responsibility and Disclosure (CARD)CARD Act of 2009 and related regulations)regulations and internationally which may increaseinterpretations) and internationally; the Corporation’s costsidentification and adversely affecteffectiveness of any initiatives to mitigate the Corporation’s businesses and economic conditions as a whole;negative impact of the Financial Reform Act; the impact of litigation and regulatory investigations, including costs, expenses, settlements and judgments;judgments as well as any collateral effects on our ability to do business and access the capital markets; various monetary, tax and fiscal policies and regulations of the U.S. andnon-U.S. governments; changes in accounting standards, rules and interpretations (including new consolidation guidance), inaccurate estimates or assumptions in the application of accounting policies, including in determining reserves, applicable guidance on consolidation)regarding goodwill accounting and the impact on the Corporation’s financial statements; increased globalization of the financial services industry and competition with other U.S. and international financial institutions; adequacy of the Corporation’s risk management framework; the Corporation’s ability to attract new employees and retain and motivate existing employees; technology changes instituted by the Corporation, its counterparties or competitors; mergers and acquisitions and their integration into the Corporation, including ourthe Corporation’s ability to realize the benefits and cost savings from and limit any unexpected liabilities acquired as a result of the Merrill Lynch acquisition;and Countrywide acquisitions; the Corporation’s reputation;reputation, including the effects of continuing intense public and regulatory scrutiny of the Corporation and the financial services industry; the effects of any unauthorized disclosures of our or our customers’ private or confidential information and any negative publicity directed toward the Corporation; and decisions to downsize, sell or close units or otherwise change the business mix of the Corporation.

Forward-looking statements speak only as of the date they are made, and the Corporation undertakes no obligation to update any forward-looking statement to reflect the impact of circumstances or events that arise after the date the forward-looking statement was made.

Notes to the Consolidated Financial Statements referred to in the Management’s Discussion and Analysis of Financial Condition and Results of Operations (MD&A) are incorporated by reference into the MD&A. Certain prior period amounts have been reclassified to conform to current period presentation.


Bank of America 200915

Bank of America 2010     23


Executive Summary

Business Overview

The Corporation is a Delaware corporation, a bank holding company and a financial holding company. When used in this report, “the Corporation” may refer to the Corporation individually, the Corporation and its subsidiaries, or certain of the Corporation’s subsidiaries or affiliates. Our principal executive offices are located in the Bank of America Corporate Center in Charlotte, North Carolina. Through our banking and various nonbanking subsidiaries throughout the United States and in certain international markets, we provide a diversified range of banking and nonbanking financial services and products through six business segments: Deposits, Global Card Services, Home Loans & Insurance, Global Commercial Banking, Global Banking & Markets (GBAM) andGlobal Wealth & Investment Management (GWIM),with the remaining operations recorded inAll Other. Effective January 1, 2010, we realigned the Global Corporate and Investment Banking portion of the formerGlobal Bankingbusiness segment with the formerGlobal Marketsbusiness segment to form GBAMand to reflectGlobal Commercial Bankingas a standalone segment. At December 31, 2009,2010, the Corporation had $2.2$2.3 trillion in assets and approximately 284,000288,000 full-time equivalent employees.

On January 1, 2009, we acquired Merrill Lynch & Co., Inc. (Merrill Lynch) and, as a result, we now have one of the largest wealth management businesses in the world with approximately 15,000 financialnearly 17,000 wealth advisors, an additional 3,000 client-facing professionals and more than $2.1$2.2 trillion in

net client assets. Additionally, we are a global leader in corporate and investment banking and trading across a broad range of asset classes serving corporations, governments, institutions and individuals around the world. On July 1, 2008, we acquired Countrywide Financial Corporation (Countrywide) significantly expanding our mortgage origination and servicing capabilities, making us a leading mortgage originator and servicer.

As of December 31, 2009,2010, we currently operate in all 50 states, the District of Columbia and more than 40 foreignnon-U.S. countries. In addition, our Our retail banking footprint covers approximately 80 percent of the U.S. population and in the U.S., we serve approximately 5957 million consumer and small business relationships with approximately 6,0005,900 banking centers, more than 18,000 ATMs, nationwide call centers, and leading online and mobile banking platforms. We have banking centers in 1213 of the 15 fastest growing states and have leadership positions in eightmarket share for deposits in seven of those states. We offer industry-leading support to approximately four million small business owners.

For information on recent and proposed legislative and regulatory initiatives that may affect our business, see Regulatory Matters beginning on page 56.
The following table below provides selected consolidated financial data for 20092010 and 2008.

2009.


Table 1Selected Financial Data

(Dollars in millions, except per share information) 2009   2008 

Income statement


Revenue, net of interest expense (FTE basis)

 $120,944    $73,976  

Net income

  6,276     4,008  

Diluted earnings (loss) per common share

  (0.29   0.54  

Average diluted common shares issued and outstanding (in millions)

  7,729     4,596  

Dividends paid per common share

 $0.04    $2.24  

Performance ratios


Return on average assets

  0.26   0.22

Return on average tangible shareholders’ equity(1)

  4.18     5.19  

Efficiency ratio (FTE basis)(1)

  55.16     56.14  

Balance sheet at year end


Total loans and leases

 $900,128    $931,446  

Total assets

  2,223,299     1,817,943  

Total deposits

  991,611     882,997  

Total common shareholders’ equity

  194,236     139,351  

Total shareholders’ equity

  231,444     177,052  

Common shares issued and outstanding (in millions)

  8,650     5,017  

Asset quality


Allowance for loan and lease losses

 $37,200    $23,071  

Nonperforming loans, leases and foreclosed properties

  35,747     18,212  

Allowance for loan and lease losses as a percentage of total nonperforming loans and leases

  111   141

Net charge-offs

 $33,688    $16,231  

Net charge-offs as a percentage of average loans and leases outstanding

  3.58   1.79

Capital ratios


Tier 1 common

  7.81   4.80

Tier 1

  10.40     9.15  

Total

  14.66     13.00  

Tier 1 leverage

  6.91     6.44  
         
(Dollars in millions, except per share information) 2010  2009 
Income statement
        
Revenue, net of interest expense (FTE basis) (1)
 $111,390  $120,944 
Net income (loss)  (2,238)  6,276 
Net income, excluding goodwill impairment charges (2)
  10,162   6,276 
Diluted earnings (loss) per common share  (0.37)  (0.29)
Diluted earnings (loss) per common share, excluding goodwill impairment charges (2)
  0.86   (0.29)
Dividends paid per common share $0.04  $0.04 
         
Performance ratios
        
Return on average assets  n/m   0.26%
Return on average assets, excluding goodwill impairment charges (2)
  0.42%  0.26 
Return on average tangible shareholders’ equity (1)
  n/m   4.18 
Return on average tangible shareholders’ equity, excluding goodwill impairment charges(1, 2)
  7.11   4.18 
Efficiency ratio (FTE basis) (1)
  74.61   55.16 
Efficiency ratio (FTE basis), excluding goodwill impairment charges(1, 2)
  63.48   55.16 
         
Asset quality
        
Allowance for loan and lease losses at December 31 $41,885  $37,200 
Allowance for loan and lease losses as a percentage of total loans and leases outstanding at December 31 (3)
  4.47%  4.16%
Nonperforming loans, leases and foreclosed properties at December 31 (3)
 $32,664  $35,747 
Net charge-offs  34,334   33,688 
Net charge-offs as a percentage of average loans and leases outstanding(3, 4)
  3.60%  3.58%
Ratio of the allowance for loan and lease losses at December 31 to net charge-offs(3, 5)
  1.22   1.10 
         
Balance sheet at year end
        
Total loans and leases $940,440  $900,128 
Total assets  2,264,909   2,230,232 
Total deposits  1,010,430   991,611 
Total common shareholders’ equity  211,686   194,236 
Total shareholders’ equity  228,248   231,444 
         
Capital ratios at year end
        
Tier 1 common equity  8.60%  7.81%
Tier 1 capital  11.24   10.40 
Total capital  15.77   14.66 
Tier 1 leverage  7.21   6.88 
         
(1)

Return

Fully taxable-equivalent (FTE) basis, return on average tangible shareholders’ equity (ROTE) and the efficiency ratio are non-GAAP measures. Other companies may define or calculate these measures differently. For additional information on these measures and ratios, see Supplemental Financial Data beginning on page 36, and for a corresponding reconciliation to GAAP financial measures, see Table XIII.
(2)Net income (loss), diluted earnings (loss) per common share, return on average assets, ROTE and the efficiency ratio have been calculated excluding the impact of goodwill impairment charges of $12.4 billion in 2010 and accordingly, these are non-GAAP measures. For additional information on these measures and ratios, see Supplemental Financial Data beginning on page 25.36, and for a corresponding reconciliation to GAAP financial measures, see Table XIII.
(3)

Balances and ratios do not include loans accounted for under the fair value option. For additional exclusions on nonperforming loans, leases and foreclosed properties, see Nonperforming Consumer Loans and Foreclosed Properties Activity beginning on page 81 and corresponding Table 33, and Nonperforming Commercial Loans, Leases and Foreclosed Properties Activity and corresponding Table 41 on page 89.
(4)Net charge-offs as a percentage of average loans and leases outstanding excluding purchased credit-impaired (PCI) loans were 3.73 percent and 3.71 percent for 2010 and 2009.
(5)Ratio of the allowance for loan and lease losses to net charge-offs excluding (PCI) loans was 1.04 percent and 1.00 percent for 2010 and 2009.
n/m = not meaningful
24     Bank of America 2010


20092010 Economic and Business Environment

2009 was a transition year

The banking environment and markets in which we conduct our businesses will continue to be strongly influenced by developments in the U.S. and global economies, as well as the continued implementation and rulemaking from recent financial reforms. The global economy continued to recover in 2010, but growth was very uneven across countries and regions. Emerging nations, led by China, India and Brazil, expanded rapidly, while the U.S., U.K., Europe and Japan continued to grow modestly.
United States
In the U.S., the economy began to stabilize althoughrecover early in 2010, fueled by moderate growth in consumption and inventory rebuilding, but slowed in late spring, coincident with the intensification of Europe’s financial crisis. A slowdown in consumption and domestic demand growth contributed to weak employment gains and an unemployment continuedrate that drifted close to rise. Gross Domestic Product, which fell sharply in10 percent.Year-over-year inflation measures receded below one percent and stock market indices declined. Concerns about high unemployment and fears that the first quarter and continuedU.S. might incur deflation led the Federal Reserve to decline in theadopt a second quarter,round of quantitative easing that involved purchases of $600 billion of U.S. Treasury securities scheduled to occur through June 2011. The announcement of this policy led to lower interest rates. Bond yields rebounded in the second half of 2010 as the U.S. economy reaccelerated, driven by stronger consumer spending, rapid growth of exports and business investment in equipment and software. The strong holiday retail season provided healthy economic momentum toward year butend. Despite only moderate economic growth in 2010, corporate profits rose sharply, benefiting from strong productivity gains and constraints on hiring and operating costs. Cautious business financial practices resulted in a record-breaking $1.5 trillion in free cash flows at non-financial businesses.
The housing market remained well below its earlier expansion peak level. Consumer spending, which had declined sharplyweak throughout 2010. Home sales were soft, despite lower home prices and low interest rates. There were delays in the foreclosure process on the large number of distressed mortgages and the supply of unsold homes remained high. Based on available Home Price Index (HPI) information, the mild improvement in home prices that occurred in the second half of 2008, rose modestly in each quarter of 2009 and receivedcontinued into early 2010. However, housing prices renewed a boost from the U.S. government’s Cash-for-Clunkers auto subsidiesdownward trend in the third quarter. Consumer spending remained tentative assecond half of 2010, due in part to the expiration of tax incentives for home buyers.
Credit quality of bank loans to businesses and households saved moreimproved significantly in 2010 and paid down debt. After reaching lowsthe continued economic recovery improved the environment for bank lending. Bank commercial and industrial loans to businesses increased in January, housing activity increased comparedthe last few months of 2010, following their steep recession-related declines, reflecting increasing loan demand relating to 2008 as home salesstronger production, inventory building and new housing starts rose throughcapital spending. Rising disposable personal income, household deleveraging and improving household finances contributed to improving consumer credit quality.
Europe
In Europe, a financial crisis emerged in mid-2010, triggered by high budget deficits and rising direct and contingent sovereign debt in Greece, Ireland, Italy, Portugal and Spain that created concerns about the year lifting residential construction. Nevertheless, large inventoriesability of unsold homesthese European Union (EU) “peripheral nations” to continue to service their debt obligations. These conditions impacted financial markets and the

increaseresulted in foreclosures continued to weigh heavilyhigh and volatile bond yields on the housing sector.

Businesses cut production, inventories, employmentsovereign debt of many EU nations. The financial crisis and capital spending aggressivelyefforts by the European Commission, European Central Bank (ECB) and International Monetary Fund (IMF) to negotiate a financial support package to financially challenged EU nations unsettled global financial markets and contributed to Euro exchange rate and interest rate volatility. Economic performance of certain EU “core nations,” led by Germany, remained healthy throughout 2010, while the economies of Greece, Ireland, Italy, Portugal and Spain experienced recessionary conditions and slowing

growth in response to the financial crisis and the implementation of fiscal austerity programs. Additionally, Spain and Ireland’s economies declined as a result of material deterioration in late 2008 continuing into 2009. Productiontheir housing sectors. Uncertainty over the outcome of the EU governments’ financial support programs and capital spending fellworries about sovereign finances continued through year end. For information on our exposure in Europe, seeNon-U.S. Portfolio beginning on page 94 andNote 28 – Performance by Geographical Areato the Consolidated Financial Statements.
Asia
Asia, excluding Japan, continued to outperform all other regions in 2010 with strong growth across most countries. China and India continued to lead the region in terms of growth and China became the second largest economy in the first halfworld after the U.S., eclipsing Japan. Growth across the region became broader based with consumer demand, investment activity and exports all performing well. Asia remained well positioned to withstand global shocks because of record international reserves, current account surpluses and reduced external leverage. Many Asian nations, including China, Taiwan, South Korea, Thailand and Malaysia, are net external creditors, with China and Japan among the largest holders of U.S. Treasury bonds. Bank balance sheets have improved across most of the region and asset quality issues have remained manageable. Among the key challenges faced by the region were large capital inflows that placed appreciation pressures on most currencies against the U.S. Dollar (USD), complicating monetary policy and adding to excess liquidity pressures. Most countries in the region, including China, India, South Korea, Thailand and Indonesia, began to withdraw fiscal stimulus and tighten monetary policy with hikes in interest rates as growth gathered momentum and as food and broader price inflation pressures began to increase. Japan performed well early in the year, but the economy weakened at the end of the year inventories declined for the first three quartersdue to weakening consumer demand, and employment declined through the entire year although at a progressively lower rate. U.S. exports increased in the second halfappreciation of the year reflectingyen that hurt export competitiveness. For information on our exposure in Asia, seeNon-U.S. Portfolio beginning on page 94 andNote 28 – Performance by Geographical Areato the rebound of certain international economies followingConsolidated Financial Statements.
Emerging Nations
In the global recession. Despite the modestemerging nations, inflation pressures began to mount and their central banks raised interest rates or took steps to tighten monetary policy and slow bank lending. Strong growth in product demandemerging nations and output intheir favorable economic outlooks attracted capital from the second half ofindustrialized nations. The excess global liquidity generated by the year, job layoffs mounted, and the unemployment rate increased to over 10 percent in the fourth quarter, the highest since the early 1980s. Producing more with fewer workers drove improvement in labor productivity, boosting profits in the second half of the year.


16Bank of America 2009


The Board of Governorsaccommodative monetary policies of the Federal Reserve, System (Federal Reserve) lowered the federal funds rate to close to zero percent early in the first quarter and in mid-March announced a programBank of quantitative easing, in which it purchased U.S. Treasuries, mortgage-backed securities (MBS) and long-term debt of government-sponsored enterprises (GSEs). This program contributed to lower mortgage rates generating an increase in consumer mortgage refinancing which helped homeowners, and along with lower home prices, stimulated activity in the housing market.

In early 2009, the short-term funding markets began to return to normal and the U.S. government began to unwind its alternative liquidity facilities, and loan and asset guarantee programs. By mid-year, order had been restored to most financial market sectors. The stock market fell sharply through mid-March, but rebounded abruptly, triggered in part by the U.S. government’s bank stress tests and banks’ successful capital raising. The stock market rally through year end retraced some of the losses in household net worth and increased consumer confidence.

Our consumer businesses were affected by the economic factors mentioned above, as ourDepositsbusiness was negatively impacted by spread compression.Global Card Services was affected as reduced consumer spending led to lower revenue and a higher level of bankruptcies led to increased provision for credit losses.Home Loans & Insurance benefited from the low interest rate environment and lower home prices, driving higher mortgage production income; however, higher unemployment and falling home values drove increases in the provision for credit losses. In addition, the factors mentioned above negatively impacted growth in the consumer loan portfolio including credit card and real estate.

Global Banking felt the impact of the above economic factors as businesses paid down debt reducing loan balances. In addition, the commercial portfolio withinGlobal Banking declined due to further reductions in spending by businesses as they sought to increase liquidity, and the resurgence of capital markets which allowed corporate clients to issue bonds and equity to replace loans as a source of funding. The commercial real estate and commercial – domestic portfolios experienced higher net charge-offs reflecting deterioration across a broad range of industries, property types and borrowers. In addition to increased net charge-offs, nonperforming loans, leases and foreclosed properties and commercial criticized utilized exposures were higher which contributed to increased reserves across most portfolios during the year.

Capital markets conditions showed some signs of improvement during 2009 andGlobal Markets took advantage of the favorable trading environment. Market dislocations that occurred throughout 2008 continued to impact our results in 2009, although to a lesser extent, as we experienced reduced write-downs on legacy assets compared to the prior year. During 2009, our credit spreads improved driving negative credit valuation adjustments on the Corporation’s derivative liabilities recorded inGlobal Marketsand on Merrill Lynch structured notes recorded inAll Other.

GWIM also benefited from the improvement in capital markets driving growth in client assets resulting in increased fees and brokerage commissions. In addition, we continued to provide support to certain cash funds during 2009 although to a lesser extent than in the prior year. As of December 31, 2009, all capital commitments to these cash funds had been terminated and the funds no longer hold investments in structured investment vehicles (SIVs).

On a going forward basis, the continued weakness in the global economy and recent and proposed regulatory changes will continue to affect many of the markets in which we do business and may adversely impact our results for 2010. The impact of these conditions is dependent upon the timing, degree and sustainability of the economic recovery.

Regulatory Overview

In November 2009, the Federal Reserve issued amendments to Regulation E, which implement the Electronic Fund Transfer Act (Regulation E). The new rules have a compliance date of July 1, 2010. These amendments change, among other things, the way weJapan and other central banks may charge overdraft fees; by limiting our ability to charge an overdraft fee for ATM and one-time debit card transactions that overdraw a consumer’s account, unless the consumer affirmatively consents to the bank’s payment of overdrafts for those transactions. Changes to our overdraft practices will negatively impact future service charge revenue primarily inDeposits.

On May 22, 2009, the Credit Card Accountability Responsibility and Disclosure Act of 2009 (CARD Act) was signedalso flowed into law. The majority of the CARD Act provisions became effective in February 2010. The CARD Act legislation contains comprehensive credit card reform related to credit card industry practices including significantly restricting banks’ ability to change interest rates and assess fees to reflect individual consumer risk, changing the way payments are applied and requiring changes to consumer credit card disclosures. Under the CARD Act, banks must give customers 45 days notice prior to a change in termsemerging nations. These capital inflows put upward pressure on their account and the grace period for credit card payments changes from 14 days to 21 days. The CARD Act also requires banks to review any accounts that were repriced since January 1, 2009 for a possible rate reduction. As announced in October 2009, we did not increase interest rates on consumer card accounts in response to provisions in the CARD Act prior to its effective date unless the customer’s account fell past due or was based on a variable interest rate. WithinGlobal Card Services, the provisions in the CARD Act are expected to negatively impact net interest income, due to the restrictions on our ability to reprice credit cards based on risk, and card income due to restrictions imposed on certain fees.

In July 2009, the Basel Committee on Banking Supervision released a consultative document entitled “Revisions to the Basel II Market Risk Framework” that would significantly increase the capital requirements for trading book activities if adopted as proposed. The proposal recommended implementation by December 31, 2010, but regulatory agencies are currently evaluating the proposed rulemaking and related impacts before establishing final rules.many emerging nation currencies. As a result, we cannot determinesome emerging nations, such as Brazil, experienced strong currency appreciation. However, in other nations, that peg their currencies to the implementation date orU.S. dollar, currency appreciation was muted causing inflationary pressures and rapid real estate price appreciation. Global economic momentum, along with the final capital impact.

In December 2009, the Basel Committee on Banking Supervision issued a consultative document entitled “Strengthening the Resilience of the Banking Sector.” If adopted as proposed, this could increase significantly the aggregate equity that bank holding companies are requiredgenerally weak U.S. dollar and easing monetary policies in several industrialized nations, contributed to hold by disqualifying certain instruments that previously have qualified as Tier 1 capital. In addition, it would increase the level of risk-weighted assets. The proposal could also increase the capital charges imposed on certain assets potentially making certain businessesrising prices for industrial commodities in these emerging nations. Through year end, inflation pressures in key emerging nations continued to mount. For more expensive to conduct. Regulatory agencies have not opined on the proposal for implementation. We continue to assess the potential impact of the proposal.

As a result of the financial crisis, the financial services industry is facing the possibility of legislative and regulatory changes that would impose significant, adverse changes on its ability to serve both retail and wholesale customers. A proposal is currently being considered to levy a tax or fee on financial institutions with assets in excess of $50 billion to repay the costs of TARP, although the proposed tax would continue even after those costs are repaid. If enacted as proposed, the tax could significantly affect our earnings, either by increasing the costs of our liabilities or causing us to reduce our assets. It remains uncertain whether the tax will be enacted, to whom it would apply, or the amount of the tax we would be required to pay. It is also unclear the extent to which the costs of such a tax could be recouped through higher pricing.


Bank of America 200917


In addition, various proposals for broad-based reform of the financial regulatory system are pending. A majority of these proposals would not disrupt our core businesses, but a proposal could ultimately be adopted that adversely affects certain of our businesses. The proposals would require divestment of certain proprietary trading activities, or limit private equity investments. Other proposals, which include limiting the scope of an institution’s derivatives activities, or forcing certain derivatives activities to be traded on exchanges, would diminish the demand for, and profitability of, certain businesses. Several other proposals would require issuers to retain unhedged interests in any asset that is securitized, potentially severely restricting the secondary market as a source of funding for consumer or commercial lending. There are also numerous proposals pending on how to resolve a failed systemically important institution. In light of the current regulatory environment, one ratings agency has placed Bank of America and certain other banks on negative outlook, and therefore adoption of such provisions may adversely affect our access to credit markets. It remains unclear whether any of these proposals will ultimately be enacted, and what form they may take.

For additional information on these items, refer to Item 1A., Risk Factors.

our emerging nations exposure, see Table 48 on page 95.

Performance Overview

Net income was $6.3 billion in 2009, compared with $4.0 billion in 2008. Including preferred stock dividends and the impact from the repayment of the U.S. government’s $45.0 billion preferred stock investment in the Corporation under the Troubled Asset Relief Program (TARP), income applicable to common shareholders was

In 2010, we reported a net loss of $2.2 billion compared to net income of $6.3 billion in 2009. After preferred stock dividends and accretion of $1.4 billion in 2010 compared with $8.5 billion in 2009, net loss applicable to common shareholders was $3.6 billion, or $(0.29)$0.37 per diluted share. Thosecommon share, compared to $2.2 billion, or $0.29 per diluted common share in 2009. Our 2010 results compared with 2008reflected, among other things, $12.4 billion in goodwill impairment charges, including non-cash, non-tax deductible goodwill impairment charges of


Bank of America 2010     25


$10.4 billion inGlobal Card Services and $2.0 billion inHome Loans & Insurance. For more information about the goodwill impairment charges in 2010, see Complex Accounting Estimates beginning on page 107 andNote 10 – Goodwill and Intangible Assetsto the Consolidated Financial Statements.
Excluding the $12.4 billion of goodwill impairment charges, net income was $10.2 billion for 2010. After preferred stock dividends and accretion, net income applicable to common shareholders, of $2.6excluding the goodwill impairment charges was $8.8 billion, or $0.54$0.86 per diluted share.

common share, for 2010. Revenue, net of interest expense on a fully taxable-equivalent (FTE)FTE basis rosedecreased $9.6 billion or eight percent to $120.9 billion representing a 63 percent increase from $74.0$111.4 billion in 2008 reflecting in part the addition of Merrill Lynch and the full-year impact of Countrywide.

2010.

Net interest income on a FTE basis increased $4.3 billion to $48.4$52.7 billion for 2010 compared with $46.6 billion in 2008.to 2009. The increase was due to the resultimpact of a favorable rate environment, improved hedge resultsdeposit pricing and the acquisitionsadoption of Countrywide and Merrill Lynch,new consolidation guidance. The increase was partially offset in part by lower assetcommercial and liability management (ALM) portfolio levels, lower consumer loan balanceslevels and an increase in nonperforming loans. The net interest yield narrowed 33 basis points (bps) to 2.65 percent.

lower rates on the core assets and trading assets and liabilities.

Noninterest income rosedecreased $13.8 billion to $58.7 billion in 2010 compared to $72.5 billion compared with $27.4in 2009. Contributing to the decline was lower mortgage banking income, down $6.1 billion, largely due to $6.8 billion in 2008. Higher trading account profits,representations and warranties provision, and decreases in equity investment income investment and brokerage services fees and investment banking income reflected the addition of Merrill Lynch while higher mortgage banking and insurance income reflected the full-year impact of Countrywide. Gains$4.8 billion, gains on sales of debt securities of $2.2 billion, trading account profits of $2.2 billion, service charges of $1.6 billion and insurance income of $694 million, compared to 2009. These declines were partially offset by an increase in other income of $2.4 billion and a decrease in impairment losses of $1.9 billion.
Representations and warranties expense increased $4.9 billion to $6.8 billion in 2010 compared to $1.9 billion in 2009. The increase was primarily driven by salesa $4.1 billion provision for representations and warranties in the fourth quarter of agency MBS and collateralized mortgage obligations (CMOs). Equity investment income benefited from pre-tax gains of $7.32010. The fourth quarter provision includes $3.0 billion related to the saleimpact of portions of our investmentthe agreements reached with the GSEs on December 31, 2010, pursuant to which we paid $2.8 billion to resolve repurchase claims involving certain residential mortgage loans sold directly to the GSEs by entities related to legacy Countrywide Financial Corporation (Countrywide) as well as adjustments made to the representations and warranties liability for other loans sold

directly to the GSEs and not covered by these agreements. For more information about the GSE agreements, see Recent Events beginning on page 33 andNote 9 – Representations and Warranties Obligations and Corporate Guaranteesto the Consolidated Financial Statements.
The provision for credit losses decreased $20.1 billion to $28.4 billion in China Construction Bank (CCB) and a pre-tax gain of $1.1 billion on our investment in BlackRock, Inc. (BlackRock). In addition, trading account profits benefited from decreased write-downs on legacy assets of $6.5 billion2010 compared to the prior year. The other income (loss) category included a $3.8 billion gain from the contribution of our merchant processing business to a joint venture. This was partially offset by a decline in card income of $5.0 billion mainly due to higher credit losses on securitized credit card loans and lower fee income. In addition, noninterest income was negatively impacted by $4.9 billion in net losses mostly related to credit valuation adjustments on the Merrill Lynch structured notes.

2009. The provision for credit losses was $48.6$5.9 billion an increaselower than net charge-offs in 2010, resulting in a reduction in reserves, compared with the 2009 provision for credit losses that was $14.9 billion higher than net charge-offs, reflecting reserve additions throughout the year. The reserve reduction in 2010 was due to improving portfolio trends across most of $21.7 billion compared to 2008, reflecting deterioration in the economy and housing markets which drove higher credit costs in both the

consumer and commercial portfolios. Higher reserve additions resulted from further deterioration inbusinesses, particularly the purchased impairedU.S. credit card, consumer portfolios obtained through acquisitions, broad-based deterioration in thelending and small business products, as well as core commercial portfolio and the impact of deterioration in the housing markets on the residential mortgage portfolio.

loan portfolios.

Noninterest expense increased $16.4 billion to $66.7 billion compared with $41.5$83.1 billion in 2008. Personnel2010 compared to 2009. The increase was driven by the $12.4 billion of goodwill impairment charges recognized in 2010. Excluding the goodwill impairment charges, noninterest expense increased $4.0 billion in 2010 compared to 2009, driven by a $3.6 billion increase in personnel costs reflecting the build-out of several businesses and other general operating expenses rose due to the addition of Merrill Lynch and the full-year impact of Countrywide. Pre-taxa $1.6 billion increase in litigation expense, partially offset by lower merger and restructuring charges.
FTE basis, net income excluding the goodwill impairment charges, rose to $2.7 billion from $935 million a year earlier due to the acquisition of Merrill Lynch.

For the year, we recognized a tax benefit of $1.9 billion compared with taxnoninterest expense of $420 million in 2008. The decrease in tax expense was due to certain tax benefits, as well as a shift in the geographic mix of the Corporation’s earnings driven by the addition of Merrill Lynch.

TARP Repayment

In efforts to help stabilize financial institutions, in October 2008, the U.S. Department of the Treasury (U.S. Treasury) created the TARP to invest in certain eligible financial institutions in the form of non-voting, senior preferred stock. We participated in the TARP by issuing to the U.S. Treasury non-voting perpetual preferred stock (TARP Preferred Stock)excluding goodwill impairment charges and warrants for a total of $45.0 billion. On December 2, 2009, the Corporation received approval from the U.S. Treasury and the Federal Reserve to repay the $45.0 billion investment. In accordance with the approval, on December 9, 2009, we repurchased all shares of the TARP Preferred Stock by using $25.7 billion from excess liquidity and $19.3 billion in proceeds from the sale of 1.3 billion units of Common Equivalent Securities (CES) valued at $15.00 per unit. In addition, the Corporation agreed to increase equity by $3.0 billion through asset sales in 2010 and approximately $1.7 billion through the issuance in 2010 of restricted stock in lieu of a portion of incentive cash compensation to certain of the Corporation’s associates as part of their 2009 year-end performance award. As a result of repurchasing the TARP Preferred Stock, the Corporation accelerated the remaining accretion of the issuance discount on the TARP Preferred Stock of $4.0 billion and recorded a corresponding charge to retained earnings andnet income (loss) applicable to common shareholders inexcluding the calculation of diluted earnings per common share. While participating ingoodwill impairment charges are non-GAAP measures. For corresponding reconciliations to GAAP financial measures, see Table XIII.

Segment Results
Effective January 1, 2010, management realigned the TARP, we recorded $7.4 billion in dividends formerGlobal Bankingand accretion, including $2.7 billion in cash dividends Global Marketsbusiness segments intoGlobal Commercial Bankingand $4.7 billion of accretion onGBAM. Prior year amounts have been reclassified to conform to the TARP Preferred Stock (the remaining accretion of $4.0 billion was included as part of the $45.0 billion cash payment). Repayment will save us approximately $3.6 billion in annual dividends, including $2.9 billion in cash and $720 million of discount accretion. At the time we repurchased the TARP Preferred Stock, we did not repurchase the related warrants. The U.S. Treasury recently announced its intention to auction, during March 2010, these warrants.

We issued the CES, which qualify as Tier 1 common capital, because wecurrent period presentation. These changes did not have a sufficient number of authorized common shares available for issuance atan impact on the time we repaid the TARP Preferred Stock. Each CES consisted of one depositary share representing a 1/1000th interest in a share of our Common Equivalent Junior Preferred Stock, Series S (Common Equivalent Stock) and a contingent warrant to purchase 0.0467 of a share of our common stock for a purchase price of $0.01 per share. The Corporation held a special meeting of shareholders on February 23, 2010 at which we obtained stockholder approval of an amendment to our amended and restated certificate of incorporation to increase the number of authorized shares of our common stock, and following the effective datepreviously reported consolidated results of the amendment, on February 24, 2010,Corporation. For additional information related to the Common Equivalent Stock converted in full into our common stock andbusiness segments, seeNote 26 – Business Segment Informationto the contingent warrants expired without having become exercisable and the CES ceased to exist.

Consolidated Financial Statements.


Table 2 Business Segment Results
                 
  Total Revenue (1)  Net Income (Loss) 
(Dollars in millions) 2010  2009  2010  2009 
Deposits $13,181  $13,890  $1,352  $2,576 
Global Card Services (2)
  25,621   29,046   (6,603)  (5,261)
Home Loans & Insurance  10,647   16,903   (8,921)  (3,851)
Global Commercial Banking  10,903   11,141   3,181   (290)
Global Banking & Markets  28,498   32,623   6,319   10,058 
Global Wealth & Investment Management  16,671   16,137   1,347   1,716 
All Other (2)
  5,869   1,204   1,087   1,328 
                 
Total FTE basis  111,390   120,944   (2,238)  6,276 
FTE adjustment  (1,170)  (1,301)      
                 
Total Consolidated
 $110,220  $119,643  $(2,238) $6,276 
                 
18Bank of America 2009


Recent Accounting Developments

On January 1, 2010, the Corporation adopted new Financial Accounting Standards Board (FASB) guidance that results in the consolidation of entities that were off-balance sheet as of December 31, 2009. The adoption of this new accounting guidance resulted in a net incremental increase in assets on January 1, 2010, on a preliminary basis, of $100 billion, including $70 billion resulting from consolidation of credit card trusts and $30 billion from consolidation of other special purpose entities including multi-

seller conduits. These preliminary amounts are net of retained interests in securitizations held on our balance sheet and an $11 billion increase in the allowance for loan losses, the majority of which relates to credit card receivables. This increase in the allowance for loan losses was recorded on January 1, 2010 as a charge net-of-tax to retained earnings for the cumulative effect of the adoption of this new accounting guidance. Initial recording of these assets and related allowance and liabilities on the Corporation’s balance sheet had no impact on results of operations.


Segment Results

Table 2  Business Segment Results

  Total Revenue(1)     Net Income (Loss) 
(Dollars in millions) 2009     2008      2009     2008 

Deposits

 $14,008      $17,840     $2,506      $5,512  

Global Card Services(2)

  29,342       31,220      (5,555     1,234  

Home Loans & Insurance

  16,902       9,310      (3,838     (2,482

Global Banking

  23,035       16,796      2,969       4,472  

Global Markets

  20,626       (3,831    7,177       (4,916

Global Wealth & Investment Management

  18,123       7,809      2,539       1,428  

All Other(2)

  (1,092     (5,168     478       (1,240

Total FTE basis

  120,944       73,976      6,276       4,008  

FTE adjustment

  (1,301     (1,194              

Total Consolidated

 $119,643      $72,782      $6,276      $4,008  
(1)

Total revenue is net of interest expense and is on a FTE basis which is a non-GAAP measure. For more information on this measure, see Supplemental Financial Data beginning on page 36, and for the business segments andAll Other.

a corresponding reconciliation to a GAAP financial measure, see Table XIII.
(2)

In 2010,Global Card Services isandAll Otherare presented in accordance with new consolidation guidance. Accordingly, current yearGlobal Card Servicesresults are comparable to prior year results which are presented on a managed basis with a corresponding offset recorded inbasis. For more information on the reconciliation ofGlobal Card ServicesandAll Other., seeNote 26 – Business Segment Information to the Consolidated Financial Statements.

Depositsnet income narroweddecreased from the prior year due to declinesa decline in net revenue and increasedhigher noninterest expense. Net revenue declined mainly due to a lower net interest income allocation from ALM activities and spread compression as interest rates declined. This decrease was partially offset by growth in average deposits on strong organic growth and the migration of certain client deposits fromGWIM partially offset by an expected decline in higher-yielding Countrywide deposits. Noninterest expense increased as a result of higher Federal Deposit Insurance Corporation (FDIC) insurancea customer shift to more liquid products and special assessment costs.

Global Card Services reported a net loss as credit costs continued to rise reflecting weak economies in the U.S., Europe and Canada. Managed net revenue declined mainly due to lower fee income driven by changes in consumer retail purchase and payment behavior in the current economic environment and the absence of one-time gains that positively impacted 2008 results. The decline was partially offset by higher net interest income as lower funding costs outpaced the decline in average managed loans. Provision for credit losses increased as economic conditions led to higher losses.

Home Loans & Insurancenet loss widened as higher credit costs continued to negatively impact results. Net revenue and noninterest expense increased primarily driven by the full-year impact of Countrywide and higher loan production from increased refinance activity. Provision for credit losses increased driven by continued economic and housing market weakness combined with further deterioration in the purchased impaired portfolio.

Global Banking net income declined as increases in revenue driven by strong deposit growth, the impact of the Merrill Lynch acquisition and favorable market conditions for debt and equity issuances were more than offset by increased credit costs. Provision for credit losses increased driven by higher net charge-offs and reserve additions in the

commercial real estate and commercial – domestic portfolios. These increases reflect deterioration across a broad range of property types, industries and borrowers. Noninterest expense increased as a result of the Merrill Lynch acquisition, and higher FDIC insurance and special assessment costs.

Global Markets net income increased driven by the addition of Merrill Lynch and a more favorable trading environment. Net revenue increased due to improved market conditions and new issuance capabilities due to the addition of Merrill Lynch driving increased fixed income, currency and commodity, and equity revenues. In addition, improved market conditions led to significantly lower write-downs on legacy assets compared with the prior year.

GWIMnet income increased driven by the addition of Merrill Lynchpricing discipline, partially offset by a lower net interest income allocation from ALM activities,related to asset and liability management (ALM) activities. The noninterest income decline was driven by the migrationimpact of client balancesRegulation E, which was effective in the third quarter of 2010 and our overdraft policy changes implemented in late 2009. Noninterest expense increased as a higher proportion of banking center sales and service

costs was aligned toDepositsfrom the other segments, and increased litigation expenses. The increase was partially offset by the absence of a special Federal Deposit Insurance Corporation (FDIC) assessment in 2009.
Global Card Servicesnet loss increased compared to the prior year due primarily to a $10.4 billion goodwill impairment charge. Revenue decreased compared to the prior year driven by lower average loans, reduced interest and fee income primarily resulting from the implementation of the CARD Act and the impact of recording a reserve related to future payment protection


26     Bank of America 2010


insurance claims in the U.K. that have not yet been asserted. Provision for credit losses improved due to lower delinquencies and bankruptcies as a result of the improved economic environment, which resulted in reserve reductions in 2010 compared to reserve increases in the prior year. Noninterest expense increased primarily due to the goodwill impairment charge.
Home Loans & Insurancenet loss increased in 2010 compared to the prior year primarily due to an increase in representations and warranties provision and a $2.0 billion goodwill impairment charge, partially offset by a decline in provision for credit losses driven by improving portfolio trends. Mortgage banking income declined driven by increased representations and warranties provision and lower average equity market levelsproduction volume reflecting a drop in the overall size of the mortgage market. Noninterest expense increased primarily due to the goodwill impairment charge, higher litigation expense and higheran increase in default-related servicing expense, partially offset by lower production expense and insurance losses.
Global Commercial Bankingnet income increased due to lower credit costs. Revenue was negatively impacted by additional costs related to our agreement to purchase certain retail automotive loans. Net interest income increased due to a growth in average deposits, partially offset by a lower net interest income allocation related to ALM activities. Credit pricing discipline offset the impact of the decline in average loan balances. The provision for credit losses decreased driven by improvements from stabilizing values in the commercial real estate portfolio.
GBAMnet income decreased driven by the absence of the gain in the prior year related to the contribution of our merchant processing business to a joint venture. Additionally, the decrease was driven by lower sales and trading revenue due to more than doubledfavorable market conditions in the prior year, partially

offset by credit valuation gains on derivative liabilities and gains on legacy assets compared to losses in the prior year. Provision for credit losses declined driven by lower net charge-offs and reserve levels, as well as a reduction in reservable criticized balances. Noninterest expense increased driven by higher compensation costs as a result of higher investmentthe recognition of expense on a proportionately larger amount of prior year incentive deferrals and brokerage services income dueinvestments in infrastructure and personnel associated with further development of the business. Income tax expense was adversely affected by a charge related to the additionU.K. tax rate reduction impacting the carrying value of Merrill Lynch, the gain on our investment in BlackRockdeferred tax assets.
GWIMnet income decreased driven by higher noninterest expense and the tax-related effect of the sale of the Columbia Management long-term asset management business partially offset by higher noninterest income and lower level of support we provided for certain cash funds.credit costs. Revenue increased driven by higher asset management fees and transactional revenue. Provision for credit losses increaseddecreased driven by stabilization of the portfolios and the recognition of a single large commercial charge-off in 2009. Noninterest expense increased due primarily to higher net charge-offsrevenue-related expenses, support costs and personnel costs associated with further investment in the consumer real estate and commercial portfolios.

business.

All Othernet income increaseddecreased compared to the prior year driven primarily by higherdecreases in net interest income and noninterest income, partially offset by a lower provision for credit losses. Revenue decreased due primarily to lower equity investment income and increasedgains as the prior year included a gain resulting from the sale of a portion of our investment in China Construction Bank (CCB) combined with reduced gains on the sale of debt securities partially offset by negative credit valuation adjustments on certain Merrill Lynch structured notes as credit spreads improved. Results were also impacted by lower other-than-temporary impairment charges primarily related to non-agency CMOs. Excluding the securitization impact to showGlobal Card Services on a managed basis,securities. The decrease in the provision for credit losses increasedwas due to higher credit costs related to our ALMimproving portfolio trends in the residential mortgage portfolio.


Bank of America 200819

Bank of America 2010     27


Financial Highlights

Net Interest Income

Net interest income on a FTE basis increased $1.9$4.3 billion to $48.4$52.7 billion for 20092010 compared to 2008.2009. The increase was driven by the improved interest rate environment, improved hedge results, the acquisitions of Countrywide and Merrill Lynch,due to the impact of new draws on previously securitized accountsdeposit pricing and the contribution from market-basedadoption of new consolidation guidance which contributed $10.5 billion to net interest income related to ourGlobal Markets business which benefited from the Merrill Lynch acquisition. These items werein 2010. The increase was partially offset by the impact of deleveraging the ALM portfolio earlier in 2009, lower commercial and consumer loan levels, the sale of First Republic in 2010 and lower rates on the adverse impact of nonperforming loans.core assets and trading assets and liabilities, including derivatives exposure. The net interest yield on a FTE basis decreased 33 bpsincreased 13 basis points (bps) to 2.652.78 percent for 20092010 compared to 20082009 due to the factors related to the core businesses as described above. For more information on net interest income on a FTE basis, see Tables I and II beginning on page 95.

Noninterest Income

these same factors.

Table 3  Noninterest Income
Table 3

(Dollars in millions) 2009     2008 

Card income

 $8,353      $13,314  

Service charges

  11,038       10,316  

Investment and brokerage services

  11,919       4,972  

Investment banking income

  5,551       2,263  

Equity investment income

  10,014       539  

Trading account profits (losses)

  12,235       (5,911

Mortgage banking income

  8,791       4,087  

Insurance income

  2,760       1,833  

Gains on sales of debt securities

  4,723       1,124  

Other income (loss)

  (14     (1,654

Net impairment losses recognized in earnings on available-for-sale debt securities

  (2,836     (3,461

Total noninterest income

 $72,534      $27,422  

 Noninterest Income

         
(Dollars in millions) 2010  2009 
Card income $8,108  $8,353 
Service charges  9,390   11,038 
Investment and brokerage services  11,622   11,919 
Investment banking income  5,520   5,551 
Equity investment income  5,260   10,014 
Trading account profits  10,054   12,235 
Mortgage banking income  2,734   8,791 
Insurance income  2,066   2,760 
Gains on sales of debt securities  2,526   4,723 
Other income (loss)  2,384   (14)
Net impairment losses recognized in earnings onavailable-for-sale debt securities
  (967)  (2,836)
         
Total noninterest income
 $58,697  $72,534 
         
Noninterest income increased $45.1decreased $13.8 billion to $72.5$58.7 billion in 2009for 2010 compared to 2008.

2009. The following items highlight the significant changes.
 

Card income on a held basis decreased $5.0 billion primarily due to higher credit losses on securitized credit card loans and lower fee income which was driven by changes in consumer retail purchase and payment behavior in the current economic environment.

Service charges grew $722$245 million due to the acquisitionimplementation of Merrill Lynch.

Investment and brokerage services increased $6.9 billion primarily due to the acquisition of Merrill LynchCARD Act partially offset by the impact of lower valuationsthe new consolidation guidance and higher interchange income.

• Service charges decreased $1.6 billion largely due to the impact of Regulation E, which became effective in the equity markets driven by the market downturn in the fourththird quarter of 2008, which improved modestly2010 and the impact of our overdraft policy changes implemented in 2009, and net outflows in the cash funds.

late 2009.

Investment banking income increased $3.3 billion due to higher debt, equity and advisory fees reflecting the increased size of the investment banking platform from the acquisition of Merrill Lynch.

Equity investment income increased $9.5decreased by $4.8 billion, driven byas net gains on the sales of certain strategic investments during 2010, including Itaú Unibanco, MasterCard, Santander and a portion of our investment in BlackRock, Inc. (BlackRock) were less than gains in 2009 that included a $7.3 billion in gains on salesgain related to the sale of portionsa portion of our investment in CCB investment and athe $1.1 billion gain related to our BlackRock investment. The results were partially offset by the absence of the Visa-related gain recorded during the prior year.

Trading account profits (losses) increased $18.1decreased $2.2 billion primarily driven bydue to more favorable core trading resultsmarket conditions in the prior year and reduced write-downs on legacy

assets partially offset by negativeinvestor concerns regarding sovereign debt fears and regulatory uncertainty. Net credit valuation adjustmentsgains on derivative liabilities of $801$262 million for 2010 compared to losses of $662 million for 2009.

• Mortgage banking income decreased $6.1 billion due to an increase of $4.9 billion in representations and warranties provision and lower volume and margins.
• Insurance income decreased $694 million due to improvementa liability recorded for future claims related to payment protection insurance (PPI) sold in the Corporation’s credit spreads.

U.K.

Mortgage banking income increased $4.7 billion driven by higher production and servicing income of $3.2 billion and $1.5 billion. These increases were primarily due to increased volume as a result of the full-year impact of Countrywide and higher refinance activity partially offset by lower MSR results, net of hedges.

Insurance income increased $927 million due to the full-year impact of Countrywide’s property and casualty businesses.

Gains on sales of debt securities increased $3.6decreased $2.2 billion due to the favorable interest rate environment and improved credit spreads. Gains were primarily driven by a lower volume of sales of agency MBSdebt securities. The decrease also included the impact of losses in 2010 related to portfolio restructuring activities.

• Other income (loss) improved by $2.4 billion. The prior year included a net negative fair value adjustment of $4.9 billion on structured liabilities compared to a net positive adjustment of $18 million in 2010, and CMOs.

the prior year


The net loss in other decreased $1.6 billion primarily due to thealso included a $3.8 billion gain fromon the contribution of our merchant processing business to a joint venture, reduced support providedventure. Legacy asset write-downs included in other income (loss) were $1.7 billion in 2009 compared to cash funds and lower write-downs on legacy assets offset by negative credit valuation adjustments recorded on Merrill Lynch structured notesnet gains of $4.9 billion.

$256 million in 2010.

Net impairmentImpairment losses recognized in earnings onavailable-for-sale (AFS) debt securities decreased $625 million driven by$1.9 billion reflecting lower impairment write-downs on non-agency residential mortgage-backed securities (RMBS) and collateralized debt obligation (CDO) related impairment losses partially offset by higher impairment losses on non-agency CMOs.

obligations (CDOs).

Provision for Credit Losses

The provision for credit losses increased $21.7decreased $20.1 billion to $48.6$28.4 billion for 2009in 2010 compared to 2008.

2009. The consumer portion of the provision for credit losses increased $15.1was $5.9 billion to $36.9 billion for 2009 compared to 2008. The increase was driven by higherlower than net charge-offs for 2010, resulting in our consumer real estate, consumer credit card and consumer lending portfolios reflecting deteriorationa reduction in the economy and housing markets. In addition to higher net charge-offs, the provision increase was also driven by higher reserve additions for deterioration in the purchased impaired and residential mortgage portfolios, new draws on previously securitized accounts as well as an approximate $800 million addition to increase the reserve coverage to approximately 12 months of charge-offs in consumer credit card. These increases were partially offset by lower reserve additions in our unsecured domestic consumer lending portfolios resulting from improved delinquencies and in the home equity portfolioreserves primarily due to improving portfolio trends throughout the slowdown inyear across the pace of deterioration. In the Countrywideconsumer and Merrill Lynch consumer purchased impaired portfolios, the additions to reserves to reflect further reductions in expected principal cash flows were $3.5 billion in 2009 compared to $750 million in 2008. The increase was primarily related to the home equity purchased impaired portfolio.

The commercial portion of thebusinesses.

The provision for credit losses related to our consumer portfolio decreased $11.4 billion to $25.4 billion for 2010 compared to 2009. The provision for credit losses related to our commercial portfolio including the provision for unfunded lending commitments increased $6.7decreased $8.7 billion to $11.7$3.0 billion for 20092010 compared to 2008. The increase was driven by higher net charge-offs and higher additions to the reserves in the commercial real estate and commercial – domestic portfolios reflecting deterioration across a broad range of property types, industries and borrowers. These increases were partially offset by lower reserve additions in the small business portfolio due to improved delinquencies.

2009.

Net charge-offs totaled $33.7$34.3 billion, or 3.583.60 percent of average loans and leases for 20092010 compared with $16.2$33.7 billion, or 1.793.58 percent for 2008. The increased level of net charge-offs is a result of2009. For more information on the same factors noted above.

provision for credit losses, see Provision for Credit Losses on page 96.

20Bank of America 2009


Noninterest Expense

Table 4  Noninterest Expense
Table 4

(Dollars in millions) 2009    2008

Personnel

 $31,528    $18,371

Occupancy

  4,906     3,626

Equipment

  2,455     1,655

Marketing

  1,933     2,368

Professional fees

  2,281     1,592

Amortization of intangibles

  1,978     1,834

Data processing

  2,500     2,546

Telecommunications

  1,420     1,106

Other general operating

  14,991     7,496

Merger and restructuring charges

  2,721     935

Total noninterest expense

 $66,713    $41,529

Noninterest Expense

         
(Dollars in millions) 2010  2009 
Personnel $35,149  $31,528 
Occupancy  4,716   4,906 
Equipment  2,452   2,455 
Marketing  1,963   1,933 
Professional fees  2,695   2,281 
Amortization of intangibles  1,731   1,978 
Data processing  2,544   2,500 
Telecommunications  1,416   1,420 
Other general operating  16,222   14,991 
Goodwill impairment  12,400    
Merger and restructuring charges  1,820   2,721 
         
Total noninterest expense
 $83,108  $66,713 
         
Excluding the goodwill impairment charges of $12.4 billion, noninterest expense increased $25.2 billion to $66.7$4.0 billion for 20092010 compared to 2008. Personnel2009. The increase was driven by a $3.6 billion increase in personnel costs and other general operating expenses rose due toreflecting the additionbuild out of Merrill Lynchseveral businesses, the recognition of expense on proportionally larger prior year incentive deferrals and the full-year impact of Countrywide. Personnel expense rose due to increased revenue and the impacts of Merrill Lynch and CountrywideU.K. payroll tax on certain year-end incentive payments, as well as a $1.6 billion increase in litigation costs. These increases were partially offset by a change$901 million decline in compensation that delivers a greater portion of incentive pay over time. Additionally, noninterest expense increased due to higher litigation costspre-tax merger and restructuring charges compared to the prior year. The prior year included a $425 million pre-tax charge to pay the U.S. government to terminate its asset guarantee term sheet and higherspecial FDIC insurance costs including aassessment of $724 million special assessment in 2009.

million.

Income Tax Expense

Income tax expense was $915 million for 2010 compared to a benefit wasof $1.9 billion for 2009 compared to expense of $420 million for 2008 and resulted in an2009. The effective tax rate for 2010 was not meaningful due to the impact of (44.0)non-deductible goodwill impairment charges of $12.4 billion.
The effective tax rate for 2010 excluding goodwill impairment charges from pre-tax income was 8.3 percent compared to 9.5(44.0) percent for 2009, primarily driven by an increase in pre-tax income excluding the prior year. The change innon-deductible goodwill impairment charges. Also impacting the 2010 effective tax rate was a


28     Bank of America 2010


$392 million charge from a U.K. law change referred to below and a $1.7 billion tax benefit from the prior year was due to increased permanent tax preference items as well as a shift in the geographic mix of our earnings driven by the addition of Merrill Lynch. Significant permanent tax preference items for 2009 included the reversal of partrelease of a portion of the deferred tax asset valuation allowance provided forrelated to acquired capital loss carryforward tax benefits annually recurring tax-exempt income and tax credits, a loss on certain foreign subsidiary stock and the effect of audit settlements.

We acquired with Merrill Lynch a deferred tax asset relatedcompared to a federal capital loss carryforward against which a valuation allowance was recorded at the date of acquisition. In 2009, we recognized substantial capital gains, against which a portion of the capital loss carryforward was utilized.

The income of certain foreign subsidiaries has not been subject to U.S. income tax as a result of long-standing deferral provisions applicable to active finance income. These provisions expired for taxable years beginning on or after January 1, 2010. On December 9, 2009, the U.S. House of Representatives passed a bill that would have extended these provisions as well as certain other expiring tax provisions through December 31, 2010. Absent an extension of these provisions, this active financing income earned by foreign subsidiaries after January 1, 2010 will generally be subject to a tax provision that considers the incremental U.S. income tax. The impact of the expiration of these provisions would depend upon the amount, composition and geographic mix of our future earnings and could increase our annual income tax expense by up to $1.0 billion.$650 million in 2009. For more information, on income tax expense, seeNote 19 –21 — Income Taxesto the Consolidated Financial Statements.

During 2010, the U.K. government enacted a tax law change reducing the corporate income tax rate by one percent effective for the 2011 U.K. tax financial year beginning on April 1, 2011. This reduction favorably affects

income tax expense on future U.K. earnings, but also required us to re-measure our U.K. net deferred tax assets using the lower tax rate. The U.K. corporate tax rate reduction resulted in an income tax charge of $392 million in 2010. If future rate reductions were to be enacted as suggested in U.K. Treasury announcements and assuming no change in the deferred tax asset balance, a similar charge to income tax expense for each one percent reduction in the rate would result during each period of enactment. For more information, see Regulatory Matters beginning on page 56.

Bank of America 200921


Balance Sheet AnalysisOverview

Table 5Selected Balance Sheet Data

  December 31    Average Balance
(Dollars in millions) 2009  2008     2009  2008

Assets


Federal funds sold and securities borrowed or purchased under agreements to resell

 $189,933  $82,478   $235,764  $128,053

Trading account assets

  182,206   134,315    217,048   186,579

Debt securities

  311,441   277,589    271,048   250,551

Loans and leases

  900,128   931,446    948,805   910,878

All other assets (1)

  639,591   392,115     764,852   367,918

Total assets

 $2,223,299  $1,817,943    $2,437,517  $1,843,979

Liabilities


Deposits

 $991,611  $882,997   $980,966  $831,144

Federal funds purchased and securities loaned or sold under agreements to repurchase

  255,185   206,598    369,863   272,981

Trading account liabilities

  65,432   51,723    72,207   72,915

Commercial paper and other short-term borrowings

  69,524   158,056    118,781   182,729

Long-term debt

  438,521   268,292    446,634   231,235

All other liabilities

  171,582   73,225     204,421   88,144

Total liabilities

  1,991,855   1,640,891    2,192,872   1,679,148

Shareholders’ equity

  231,444   177,052     244,645   164,831

Total liabilities and shareholders’ equity

 $2,223,299  $1,817,943    $2,437,517  $1,843,979
(1)
                 
  December 31  Average Balance 
(Dollars in millions) 2010  2009  2010  2009 
Assets
                
Federal funds sold and securities borrowed or purchased under agreements to resell $209,616  $189,933  $256,943  $235,764 
Trading account assets  194,671   182,206   213,745   217,048 
Debt securities  338,054   311,441   323,946   271,048 
Loans and leases  940,440   900,128   958,331   948,805 
Allowance for loan and lease losses  (41,885)  (37,200)  (45,619)  (33,315)
All other assets  624,013   683,724   732,256   803,718 
                 
Total assets
 $2,264,909  $2,230,232  $2,439,602  $2,443,068 
                 
Liabilities
                
Deposits $1,010,430  $991,611  $988,586  $980,966 
Federal funds purchased and securities loaned or sold under agreements to repurchase  245,359   255,185   353,653   369,863 
Trading account liabilities  71,985   65,432   91,669   72,207 
Commercial paper and other short-term borrowings  59,962   69,524   76,676   118,781 
Long-term debt  448,431   438,521   490,497   446,634 
All other liabilities  200,494   178,515   205,290   209,972 
                 
Total liabilities
  2,036,661   1,998,788   2,206,371   2,198,423 
Shareholders’ equity
  228,248   231,444   233,231   244,645 
                 
Total liabilities and shareholders’ equity
 $2,264,909  $2,230,232  $2,439,602  $2,443,068 
                 

All other assets are presented net of allowance for loan and lease losses for the year-end and average balances.

At December 31, 2009,2010, total assets were $2.2$2.3 trillion, an increase of $405.4$34.7 billion, or 22two percent, from December 31, 2008.2009. Average total assets in 2009 increased $593.52010 decreased $3.5 billion or 32 percent, from 2008. The increases in year-end and average total assets were primarily attributable to the acquisition of Merrill Lynch, which impacted virtually all categories, but particularly federal funds sold and securities borrowed or purchased under agreements to resell, trading account assets, and debt securities. Cash and cash equivalents, which are included in all other assets in the table above, increased due to our strengthened liquidity and capital position. Partially offsetting these increases was a decrease in year-end loans and leases primarily attributable to customer payments, reduced demand and charge-offs.

2009. At December 31, 2009,2010, total liabilities were $2.0 trillion, an increase of $351.0$37.9 billion, or 21two percent, from December 31, 2008.2009. Average total liabilities for 20092010 increased $513.7$7.9 billion or 31 percent, from 2008.2009.

Period-end balance sheet amounts may vary from average balance sheet amounts due to liquidity and balance sheet management functions, primarily involving our portfolios of highly liquid assets, that are designed to ensure the adequacy of capital while enhancing our ability to manage liquidity requirements for the Corporation and for our customers, and to position the balance sheet in accordance with the Corporation’s risk appetite. The increasesexecution of these functions requires the use of balance sheet and capital-related limits including spot, average and risk-weighted asset limits, particularly in year-end andour trading businesses. One of our key metrics, Tier 1 leverage ratio, is calculated based on adjusted quarterly average total assets.

Impact of Adopting New Consolidation Guidance
On January 1, 2010, the Corporation adopted new consolidation guidance resulting in the consolidation of certain former qualifying special purpose entities and VIEs that were not recorded on the Corporation’s Consolidated Balance Sheet prior to that date. The adoption of this new consolidation guidance resulted in a net incremental increase in assets of $100.4 billion, including $69.7 billion resulting from consolidation of credit card trusts and $30.7 billion from consolidation of other special purpose entities including multi-seller conduits, and a net increase of $106.7 billion in total liabilities, were attributableincluding $84.4 billion of long-term debt. These amounts are net of retained interests in securitizations held on the Consolidated Balance Sheet at December 31, 2009 and a $10.8 billion increase in the allowance for loan and lease losses, the majority of which relates to credit card receivables. The Corporation recorded a $6.2 billion charge,net-of-tax, to retained earnings on January 1, 2010 for the cumulative effect of the adoption of this new consolidation guidance due primarily to the acquisitionincrease in the allowance for loan and lease losses, and a $116 million charge to accumulated other comprehensive income (OCI). The initial recording of Merrill Lynch which impacted virtually all categories, but particularly federal funds purchasedthese assets, related allowance for loan and securities loaned or sold under agreements to repurchase, long-term debtlease losses and other liabilities. In addition toliabilities on the Corporation’s Consolidated Balance Sheet had no impact at the date of adoption on consolidated results of operations. For additional detail on the impact of Merrill Lynch, deposits increased as we benefited from higher savingsadopting this new consolidation guidance, refer toNote 8 – Securitizations and movement into more liquid products due Other Variable Interest Entitiesto the low rate environment. Partially offsetting these increases was a decrease in commercial paper and other short-term borrowings due in part to lower Federal Home Loan Consolidated Financial Statements.


Bank (FHLB) borrowings.of America 2010     29


Assets
Federal Funds Sold and Securities Borrowed or Purchased Under Agreements to Resell

Federal funds transactions involve lending reserve balances on a short-term basis. Securities borrowed and securities purchased under agreements to resell are utilized to accommodate customer transactions, earn interest rate spreads and obtain securities for settlement. Year-end and average federal funds sold and securities borrowed or purchased under agreements to resell increased $107.5$19.7 billion and $107.7average amounts increased $21.2 billion in 2010 compared to 2009, attributable primarily to the acquisition of Merrill Lynch.

a favorable rate environment and increased customer activity.

Trading Account Assets

Trading account assets consist primarily of fixed incomefixed-income securities (including government and corporate debt), and equity and convertible instruments. Year-end and average trading account assets increased $47.9 billion and $30.5$12.5 billion in 2010 compared to 2009 attributable primarily due to the acquisitionadoption of Merrill Lynch.

new consolidation guidance as well as the consolidation of a VIE late in 2010. Average trading account assets decreased slightly in 2010 as compared to 2009.

Debt Securities

Debt securities include U.S. Treasury and agency securities, MBS,mortgage-backed securities (MBS), principally agency MBS, foreign bonds, corporate bonds and municipal debt. We use the debt securities portfolio primarily to manage interest rate and liquidity risk and to take advantage of market conditions that create more economically attractive returns on these investments. The year-endYear-end and average balances of debt securities increased $33.9$26.6 billion and $20.5$52.9 billion from 2008in 2010 compared to 2009 due to net purchases of securities and the impact of the acquisition of Merrill Lynch.agency MBS purchases. For additional information on our AFS debt securities, see Market Risk Management – Securities beginning on page 84103 andNote 5 – Securitiesto the Consolidated Financial Statements.

Loans and Leases

Year-end loans and leases decreased $31.3 billion to $900.1 billion in 2009 compared to 2008 primarily due to lower commercial loans as the result of customer payments and reduced demand, lower customer merger and acquisition activity, and net charge-offs, partially offset by the addition of Merrill Lynch. Averageaverage loans and leases increased $37.9$40.3 billion to $948.8$940.4 billion and $9.5 billion to $958.3 billion in 20092010 compared to 20082009. The increase was primarily due to the addition of Merrill Lynch, and the full-year impact of Countrywide. The average consumer loan portfolio increased $24.4 billion due to the addition of Merrill Lynch domestic and foreign securities-based lending margin loans, Merrill Lynch consumer real estate balances, and the full-year impact of Countrywide,adopting new consolidation guidance partially offset by lower balance sheet retention, salescontinued deleveraging by consumers, tighter underwriting and conversionsthe elevated levels of residential mortgages into retained MBS and net charge-offs. The averageliquidity of commercial loan and lease portfolio increased $13.5 billion primarily due to the acquisition of Merrill Lynch.clients. For a more detailed discussion of the loan portfolio, see Credit Risk Management beginning on page 54,71 andNote 6 – Outstanding Loans and Leasesto the Consolidated Financial Statements.
Allowance for Loan and Lease Losses


22Bank of America 2009


Year-end and average allowance for loan lease losses increased $4.7 billion and $12.3 billion in 2010 compared to 2009 primarily due to the $10.8 billion of reserves recorded on January 1, 2010 in connection with the adoption of new consolidation guidance and reserve additions in the PCI portfolio throughout 2010. These were partially offset by reserve reductions during 2010 due to the impacts of the improving economy. For a more detailed discussion of the Allowance for Loan and Lease Losses, see Allowance for Loan and Lease Losses beginning on page 97.

All Other Assets

Year-end and average all other assets increased $247.5decreased $59.7 billion and $396.9$71.5 billion at December 31,in 2010 compared to 2009 driven primarily by the acquisitionsale of Merrill Lynch, which impacted various line items, including derivative assets. In addition, the increase was driven by higher cashstrategic investments and cash equivalents due to our strengthened liquidity and capital position.goodwill impairment charges.

Liabilities
Deposits

Year-end and average deposits increased $108.6$18.8 billion to $991.6 billion$1.0 trillion and $149.8$7.6 billion to $981.0$988.6 billion in 20092010 compared to 2008. The increases were in domestic interest-bearing deposits and noninterest-bearing deposits. Partially offsetting these increases was a decrease in foreign interest-bearing deposits. We categorize our deposits as core and market-based deposits. Core deposits exclude negotiable CDs, public funds, other domestic time deposits and foreign interest-bearing deposits. Average core deposits increased $164.4 billion, or 24 percent, to $861.3 billion in 2009 compared to 2008.2009. The increase was attributable to growth in our averagenoninterest-bearing deposits, NOW and money market accounts primarily driven by affluent, and IRAscommercial and noninterest-bearing deposits due to higher savings, the consumer flight-to-safety and movement into more liquid products due to the low rate environment. Average market-based deposit funding decreased $14.6 billion to $119.7 billion in 2009 compared to 2008 due primarily tocorporate clients, partially offset by a decrease in time deposits in banks located in foreign countries.

as a result of customer shift to more liquid products.

Federal Funds Purchased and Securities Loaned or Sold Under Agreements to Repurchase

Federal funds transactions involve borrowing reserve balances on a short-term basis. Securities loaned and securities sold under agreements to repurchase are collateralized financingborrowing transactions utilized to accommodate customer transactions, earn interest rate spreads and finance inventory positions.assets on the balance sheet. Year-end and average federal funds purchased and securities loaned or sold under agreements to repurchase increased $48.6decreased $9.8 billion and $96.9$16.2 billion in 2010 compared to 2009 primarily due to the Merrill Lynch acquisition.

lower funding requirements.

Trading Account Liabilities

Trading account liabilities consist primarily of short positions in fixed incomefixed-income securities (including government and corporate debt), equity and

convertible instruments. Year-end and average trading account liabilities increased $13.7$6.5 billion and $19.5 billion in 2010 compared to 2009 attributable primarilydue to increasestrading activity in equity securities and foreign sovereign debt.

fixed-income securities.

Commercial Paper and Other Short-term Borrowings

Commercial paper and other short-term borrowings provide a funding source to supplement deposits in our ALM strategy. Year-end and average commercial paper and other short-term borrowings decreased $88.5$9.6 billion to $69.5$60.0 billion and $63.9decreased $42.1 billion to $118.8$76.7 billion in 20092010 compared to 2008 due, in part, to lower FHLB balances2009 as a result of our strongstrengthened liquidity position.

Long-term Debt

Year-end and average long-term debt increased $170.2by $9.9 billion to $438.5$448.4 billion and $215.4$43.9 billion to $446.6$490.5 billion in 20092010 compared to 2008.2009. The increases were attributable to the $84.4 billion impact of new consolidation guidance as discussed on page 29 offset by maturities outpacing new issuances and the addition ofCorporation’s strategy to reduce our long-term debt associated with the Merrill Lynch acquisition.debt. For additional information on long-term debt, seeNote 13 – Long-term Debtto the Consolidated Financial Statements.

All Other Liabilities

Year-end and average all other liabilities increased $98.4$22.0 billion and $116.3 billion at December 31,in 2010 compared to 2009 driven primarily by the acquisitionadoption of Merrill Lynch, which impacted various line items, including derivative liabilities.

new consolidation guidance.

Shareholders’ Equity

Year-end and average shareholders’ equity increased $54.4decreased $3.2 billion and $79.8$11.4 billion duein 2010 compared to 2009. The decrease was driven primarily by the goodwill impairment charges of $12.4 billion and the impact of adopting new consolidation guidance as we recorded a common stock offering of $13.5$6.2 billion $29.1 billion of common and preferred stock issued in connection with the Merrill Lynch acquisition, the issuance of CES of $19.2 billion, an increase in accumulated other comprehensive income (OCI) and net income. These increases werecharge to retained earnings for newly consolidated loans partially offset by repayment of TARP Preferred Stock of $45.0 billion, $30.0 billion of which was issued in early 2009, and higher preferred stock dividend payments. The increasechanges in accumulated OCI wasOCI.


30     Bank of America 2010


Cash Flows Overview
The Corporation’s operating assets and liabilities support our global markets and lending activities. We believe that cash flows from operations, available cash balances and our ability to generate cash through short- and long-term debt are sufficient to fund our operating liquidity needs. Our investing activities primarily include the AFS securities portfolio and other short-term investments. In addition, our financing activities reflect cash flows related to raising customer deposits and issuing long-term debt as well as preferred and common stock.
Cash and cash equivalents decreased $12.9 billion during 2010 due to unrealized gains onrepayment and maturities of certain long-term debt and net purchases of AFS securities partially offset by deposit growth. Cash and cash equivalents increased $88.5 billion during 2009 which reflected our strengthened liquidity. The following discussion outlines the significant activities that impacted our cash flows during 2010 and 2009.
During 2010, net cash provided by operating activities was $82.6 billion compared to $129.7 billion in 2009. The more significant adjustments to net

income (loss) to arrive at cash provided by operating activities included the decreases in the provision for credit losses, decreases in trading and derivative assets, and in 2010, the goodwill impairment charges.
During 2010, net cash of $30.3 billion was used in investing activities primarily for net purchases of AFS debt and marketable equity securities. Average shareholders’ equityDuring 2009, net cash provided by investing activities was also impacted by the issuance of preferred stock and common stock warrants of $30.0$157.9 billion, in early 2009. This preferred stockpart, from net sales, pay downs and maturities of AFS securities associated with our management of interest rate risk, and net cash received from the acquisition of Merrill Lynch.
During 2010, the net cash used in financing activities of $65.4 billion primarily reflected the net decreases in long-term debt as maturities outpaced new issuances. During 2009, net cash used in financing activities was $199.6 billion reflecting the declines in commercial paper and other short-term borrowings due, in part to lower Federal Home Loan Bank (FHLB) balances as a result of the TARP repaymentour strong liquidity position and a decrease in December 2009.

long-term debt as maturities outpaced new issuances.

Bank of America 200923

Bank of America 2010     31


Table 6Five Year Summary of Selected Financial Data

(Dollars in millions, except per share information) 2009   2008   2007   2006   2005 

Income statement


Net interest income

 $47,109    $45,360    $34,441    $34,594    $30,737  

Noninterest income

  72,534     27,422     32,392     38,182     26,438  

Total revenue, net of interest expense

  119,643     72,782     66,833     72,776     57,175  

Provision for credit losses

  48,570     26,825     8,385     5,010     4,014  

Noninterest expense, before merger and restructuring charges

  63,992     40,594     37,114     34,988     28,269  

Merger and restructuring charges

  2,721     935     410     805     412  

Income before income taxes

  4,360     4,428     20,924     31,973     24,480  

Income tax expense (benefit)

  (1,916   420     5,942     10,840     8,015  

Net income

  6,276     4,008     14,982     21,133     16,465  

Net income (loss) applicable to common shareholders

  (2,204   2,556     14,800     21,111     16,447  

Average common shares issued and outstanding (in thousands)

  7,728,570     4,592,085     4,423,579     4,526,637     4,008,688  

Average diluted common shares issued and outstanding (in thousands)

  7,728,570     4,596,428     4,463,213     4,580,558     4,060,358  

Performance ratios


Return on average assets

  0.26   0.22   0.94   1.44   1.30

Return on average common shareholders’ equity

  n/m     1.80     11.08     16.27     16.51  

Return on average tangible common shareholders’ equity(1)

  n/m     4.72     26.19     38.23     31.80  

Return on average tangible shareholders’ equity(1)

  4.18     5.19     25.13     37.80     31.67  

Total ending equity to total ending assets

  10.41     9.74     8.56     9.27     7.86  

Total average equity to total average assets

  10.04     8.94     8.53     8.90     7.86  

Dividend payout

  n/m     n/m     72.26     45.66     46.61  

Per common share data


Earnings (loss)

 $(0.29  $0.54    $3.32    $4.63    $4.08  

Diluted earnings (loss)

  (0.29   0.54     3.29     4.58     4.02  

Dividends paid

  0.04     2.24     2.40     2.12     1.90  

Book value

  21.48     27.77     32.09     29.70     25.32  

Tangible book value(1)

  11.94     10.11     12.71     13.26     13.51  

Market price per share of common stock


Closing

 $15.06    $14.08    $41.26    $53.39    $46.15  

High closing

  18.59     45.03     54.05     54.90     47.08  

Low closing

  3.14     11.25     41.10     43.09     41.57  

Market capitalization

 $130,273    $70,645    $183,107    $238,021    $184,586  

Average balance sheet


Total loans and leases

 $948,805    $910,878    $776,154    $652,417    $537,218  

Total assets

  2,437,517     1,843,979     1,602,073     1,466,681     1,269,892  

Total deposits

  980,966     831,144     717,182     672,995     632,432  

Long-term debt

  446,634     231,235     169,855     130,124     97,709  

Common shareholders’ equity

  182,288     141,638     133,555     129,773     99,590  

Total shareholders’ equity

  244,645     164,831     136,662     130,463     99,861  

Asset quality (2)


Allowance for credit losses(3)

 $38,687    $23,492    $12,106    $9,413    $8,440  

Nonperforming loans, leases and foreclosed properties(4)

  35,747     18,212     5,948     1,856     1,603  

Allowance for loan and lease losses as a percentage of total loans and leases outstanding(4)

  4.16   2.49   1.33   1.28   1.40

Allowance for loan and lease losses as a percentage of total nonperforming loans and leases(4)

  111     141     207     505     532  

Net charge-offs

 $33,688    $16,231    $6,480    $4,539    $4,562  

Net charge-offs as a percentage of average loans and
leases outstanding(4)

  3.58   1.79   0.84   0.70   0.85

Nonperforming loans and leases as a percentage of total loans and leases outstanding(4)

  3.75     1.77     0.64     0.25     0.26  

Nonperforming loans, leases and foreclosed properties as a percentage of total loans, leases and foreclosed properties(4)

  3.98     1.96     0.68     0.26     0.28  

Ratio of the allowance for loan and lease losses at December 31 to net charge-offs

  1.10     1.42     1.79     1.99     1.76  

Capital ratios (year end)


Risk-based capital:


Tier 1 common

  7.81   4.80   4.93   6.82   6.80

Tier 1

  10.40     9.15     6.87     8.64     8.25  

Total

  14.66     13.00     11.02     11.88     11.08  

Tier 1 leverage

  6.91     6.44     5.04     6.36     5.91  

Tangible equity(1)

  6.42     5.11     3.73     4.47     4.36  

Tangible common equity(1)

  5.57     2.93     3.46     4.27     4.34  
                      
(Dollars in millions, except per share information)  2010  2009  2008  2007  2006 
Income statement
                     
Net interest income  $51,523  $47,109  $45,360  $34,441  $34,594 
Noninterest income   58,697   72,534   27,422   32,392   38,182 
Total revenue, net of interest expense   110,220   119,643   72,782   66,833   72,776 
Provision for credit losses   28,435   48,570   26,825   8,385   5,010 
Goodwill impairment   12,400             
Merger and restructuring charges   1,820   2,721   935   410   805 
All other noninterest expense (1)
   68,888   63,992   40,594   37,114   34,988 
Income (loss) before income taxes   (1,323)  4,360   4,428   20,924   31,973 
Income tax expense (benefit)   915   (1,916)  420   5,942   10,840 
Net income (loss)   (2,238)  6,276   4,008   14,982   21,133 
Net income (loss) applicable to common shareholders   (3,595)  (2,204)  2,556   14,800   21,111 
Average common shares issued and outstanding (in thousands)   9,790,472   7,728,570   4,592,085   4,423,579   4,526,637 
Average diluted common shares issued and outstanding (in thousands)   9,790,472   7,728,570   4,596,428   4,463,213   4,580,558 
                      
Performance ratios
                     
Return on average assets   n/m   0.26%  0.22%  0.94%  1.44%
Return on average common shareholders’ equity   n/m   n/m   1.80   11.08   16.27 
Return on average tangible common shareholders’ equity (2)
   n/m   n/m   4.72   26.19   38.23 
Return on average tangible shareholders’ equity (2)
   n/m   4.18   5.19   25.13   37.80 
Total ending equity to total ending assets   10.08%  10.38   9.74   8.56   9.27 
Total average equity to total average assets   9.56   10.01   8.94   8.53   8.90 
Dividend payout   n/m   n/m   n/m   72.26   45.66 
                      
Per common share data
                     
Earnings (loss)  $(0.37) $(0.29) $0.54  $3.32  $4.63 
Diluted earnings (loss)   (0.37)  (0.29)  0.54   3.29   4.58 
Dividends paid   0.04   0.04   2.24   2.40   2.12 
Book value   20.99   21.48   27.77   32.09   29.70 
Tangible book value (2)
   12.98   11.94   10.11   12.71   13.26 
                      
Market price per share of common stock
                     
Closing  $13.34  $15.06  $14.08  $41.26  $53.39 
High closing   19.48   18.59   45.03   54.05   54.90 
Low closing   10.95   3.14   11.25   41.10   43.09 
                      
Market capitalization
  $134,536  $130,273  $70,645  $183,107  $238,021 
                      
Average balance sheet
                     
Total loans and leases  $958,331  $948,805  $910,871  $776,154  $652,417 
Total assets   2,439,602   2,443,068   1,843,985   1,602,073   1,466,681 
Total deposits   988,586   980,966   831,157   717,182   672,995 
Long-term debt   490,497   446,634   231,235   169,855   130,124 
Common shareholders’ equity   212,681   182,288   141,638   133,555   129,773 
Total shareholders’ equity   233,231   244,645   164,831   136,662   130,463 
                      
Asset quality (3)
                     
Allowance for credit losses (4)
  $43,073  $38,687  $23,492  $12,106  $9,413 
Nonperforming loans, leases and foreclosed properties (5)
   32,664   35,747   18,212   5,948   1,856 
Allowance for loan and lease losses as a percentage of total loans and leases outstanding (5)
   4.47%  4.16%  2.49%  1.33%  1.28%
Allowance for loan and lease losses as a percentage of total nonperforming loans and
leases (5, 6)
   136   111   141   207   505 
Allowance for loan and lease losses as a percentage of total nonperforming loans and leases excluding the purchased credit-impaired loan portfolio (5, 6)
   116   99   136   n/a   n/a 
Net charge-offs  $34,334  $33,688  $16,231  $6,480  $4,539 
Net charge-offs as a percentage of average loans and leases outstanding (5)
   3.60%  3.58%  1.79%  0.84%  0.70%
Nonperforming loans and leases as a percentage of total loans and leases outstanding (5)
   3.27   3.75   1.77   0.64   0.25 
Nonperforming loans, leases and foreclosed properties as a percentage of total loans, leases and foreclosed properties (5)
   3.48   3.98   1.96   0.68   0.26 
Ratio of the allowance for loan and lease losses at December 31 to net charge-offs   1.22   1.10   1.42   1.79   1.99 
                      
Capital ratios (year end)
                     
Risk-based capital:                     
Tier 1 common   8.60%  7.81%  4.80%  4.93%  6.82%
Tier 1   11.24   10.40   9.15   6.87   8.64 
Total   15.77   14.66   13.00   11.02   11.88 
Tier 1 leverage   7.21   6.88   6.44   5.04   6.36 
Tangible equity (2)
   6.75   6.40   5.11   3.73   4.47 
Tangible common equity (2)
   5.99   5.56   2.93   3.46   4.27 
                      
(1)

Excludes merger and restructuring charges and goodwill impairment charges.
(2)Tangible equity ratios and tangible book value per share of common stock are non-GAAP measures. Other companies may define or calculate these measures differently. For additional information on these ratios, and a corresponding reconciliation to GAAP financial measures, see Supplemental Financial Data beginning on page 25.

36 and for corresponding reconciliations to GAAP financial measures, see Table XIII.
(2)(3)

For more information on the impact of the purchased impairedPCI loan portfolio on asset quality, see Consumer Portfolio Credit Risk Management beginning on page 5472 and Commercial Portfolio Credit Risk Management beginning on page 64.

83.
(3)(4)

Includes the allowance for loan and lease losses and the reserve for unfunded lending commitments.

(4)(5)

Balances and ratios do not include loans accounted for under the fair value option.

For additional exclusions on nonperforming loans, leases and foreclosed properties, see Nonperforming Consumer Loans and Foreclosed Properties Activity beginning on page 81 and corresponding Table 33 and Nonperforming Commercial Loans, Leases and Foreclosed Properties Activity and corresponding Table 41 on page 89.
n/m

= not meaningful

(6)
24Bank of AmericaAllowance for loan and lease losses includes $22.9 billion, $17.7 billion, $11.7 billion, $6.5 billion and $5.4 billion allocated to products that are excluded from nonperforming loans, leases and foreclosed properties at December 31, 2010, 2009, 2008, 2007 and 2006, respectively.
n/m = not meaningful
n/a = not applicable
32     Bank of America 2010


Recent Events
Representations and Warranties Liability
On December 31, 2010, we reached agreements with Freddie Mac (FHLMC) and Fannie Mae (FNMA), collectively the GSEs, where the Corporation paid $2.8 billion to resolve repurchase claims involving first-lien residential mortgage loans sold directly to the GSEs by entities related to legacy Countrywide (Countrywide). The agreement with FHLMC extinguishes all outstanding and potential mortgage repurchase and make-whole claims arising out of any alleged breaches of selling representations and warranties related to loans sold directly by legacy Countrywide to FHLMC through 2008, subject to certain exceptions we do not believe will be material. The agreement with FNMA substantially resolves the existing pipeline of repurchase and make-whole claims outstanding as of September 20, 2010 arising out of alleged breaches of selling representations and warranties related to loans sold directly by legacy Countrywide to FNMA. These agreements with the GSEs do not cover outstanding and potential mortgage repurchase and make-whole claims arising out of any alleged breaches of selling representations and warranties to legacy Bank of America first-lien residential mortgage loans sold directly to the GSEs or other loans sold directly to the GSEs other than described above, loan servicing obligations, other contractual obligations or loans contained in private-label securitizations.
As a result of these agreements and associated adjustments made to the representations and warranties liability for other loans sold directly to the GSEs and not covered by the agreements, the Corporation recorded a provision of $3.0 billion during the fourth quarter of 2010. We believe that our remaining exposure to representations and warranties for first-lien residential mortgage loans sold directly to the GSEs has been accounted for as a result of these agreements and the associated adjustments to our recorded liability for representations and warranties for first-lien residential mortgage for loans sold directly to the GSEs and not covered by the agreements as discussed above. We believe our predictive repurchase models, utilizing our historical repurchase experience with the GSEs while considering current developments, including the recent agreements, projections of future defaults as well as certain assumptions regarding economic conditions, home prices and other matters, allows us to reasonably estimate the liability for obligations under representations and warranties on loans sold to the GSEs. However, future provisions for representations and warranties liability to the GSEs may be affected if actual experience is different from our historical experience with the GSEs or our projections of future defaults, and assumptions regarding economic conditions, home prices and other matters, that are incorporated in the provision calculation.
Although our experience with non-GSE claims remains limited, we expect additional activity in this area going forward and that the volume of repurchase claims from monolines, whole-loan investors and investors in private-label securitizations could increase in the future. It is reasonably possible that future losses may occur, and our estimate is that the upper range of possible loss related to non-GSE sales could be $7 billion to $10 billion over existing accruals. This estimate does not represent a probable loss, is based on currently available information, significant judgment, and a number of assumptions that are subject to change. A significant portion of this estimate relates to loans originated through legacy Countrywide, and the repurchase liability is generally limited to the original seller of the loan. Future provisions and possible loss or range of loss may be impacted if actual results are different from our assumptions regarding economic conditions, home prices and other matters and may vary by counterparty. The resolution of the repurchase claims process with the non-GSE counterparties will likely be a protracted process, and we will vigorously contest any request for repurchase if we conclude that a valid basis for the repurchase claim does not exist. For additional information about representations and warranties, seeNote 9 – Representations and Warranties Obligations and Corporate Guaranteesto the Consolidated Financial Statements and Representations and Warranties beginning on page 52.

Goodwill
In 2010, we recorded a $10.4 billion goodwill impairment charge inGlobal Card Servicesand a $2.0 billion goodwill impairment charge inHome Loans & Insurance. These goodwill impairment charges are non-cash, non-tax deductible and have no impact on our reported Tier 1 and tangible equity ratios. Our consumer and small business card products, including the debit card business, are part of an integrated platform withinGlobal Card Services. Based on the provisions of the Financial Reform Act which limit the interchange fees that may be charged with respect to electronic debit interchange, we estimate a revenue loss, beginning in the third quarter of 2011, of approximately $2.0 billion annually based on current volumes and assuming limited mitigation within this segment. Accordingly, we performed a goodwill impairment analysis during the three months ended September 30, 2010. This analysis indicated that the implied fair value of the goodwill inGlobal Card Serviceswas less than the carrying value, and accordingly, we recorded a $10.4 billion charge to reduce the carrying value to fair value.
During the three months ended December 31, 2010, we performed a goodwill impairment analysis forHome Loans & Insuranceas it was likely that there had been a decline in its fair value as a result of increased uncertainties, including existing and potential litigation exposure and other related risks, higher servicing costs including loss mitigation efforts, foreclosure related issues and the redeployment of centralized sales resources to address servicing needs. This analysis indicated that the implied fair value of the goodwill inHome Loans & Insurancewas less than the carrying value, and accordingly, we recorded a $2 billion charge to reduce the carrying value of goodwill inHome Loans & Insurance.
For additional information on the goodwill impairment charges, see Complex Accounting Estimates — Goodwill and Intangible Assets beginning on page 110 andNote 10 — Goodwill and Intangible Assetsto the Consolidated Financial Statements.
Review of Foreclosure Processes
On October 1, 2010, we voluntarily stopped taking residential mortgage foreclosure proceedings to judgment in states where foreclosure requires a court order following a legal proceeding (judicial states). On October 8, 2010, we stopped foreclosure sales in all states in order to complete an assessment of the related business processes. These actions generally did not affect the initiation and processing of foreclosures prior to judgment, or sale of vacant real estate owned properties. We took these precautionary steps in order to ensure our processes for handling foreclosures include the appropriate controls and quality assurance. Our review has involved an assessment of the foreclosure process, including a review of completed foreclosure affidavits in pending proceedings.
As a result of that review, we identified and implemented process and control enhancements, and we intend to monitor ongoing quality results of each process. The process and control enhancements implemented as a result of our review are intended to strengthen the controls related to preparation, execution and notarization of affidavits in judicial states and strengthen our oversight of lawyers in the attorney network who conduct foreclosure proceedings on our behalf, both in judicial states and in states where foreclosures are handled without judicial supervision (non-judicial states). This oversight includes a periodic review of a sample of foreclosure files maintained by these attorneys, andon-site reviews of law firms in the attorney network. In addition, our process and control enhancements for both judicial and non-judicial states include strengthening the controls related to the preparation and execution of other foreclosure loan documentation, including notices of default and pre-foreclosure loss mitigation affidavits, as well as enhanced associate training. After these enhancements were put in place, we resumed foreclosure sales in most non-judicial states during the fourth quarter of 2010, and expect sales to resume in the remaining non-judicial states in the


Bank of America 2010     33


first quarter of 2011. We also commenced a rolling process of preparing, as necessary, affidavits of indebtedness in pending foreclosure proceedings in order to resume the process of taking these foreclosure proceedings to judgment in judicial states, beginning with properties believed to be vacant, and with properties for which the mortgage was originated on a non-owner-occupied basis. The process of preparing affidavits in pending proceedings is expected to continue in the first quarter of 2011, and could result in prolonged adversary proceedings that delay certain foreclosure sales.
Law enforcement authorities in all 50 states and the U.S. Department of Justice (DOJ) and other federal agencies, including certain bank supervisory authorities, continue to investigate alleged irregularities in the foreclosure practices of residential mortgage servicers. Authorities have publicly stated that the scope of the investigations extends beyond foreclosure documentation practices to include mortgage loan modification and loss mitigation practices. The Corporation is cooperating with these investigations and is dedicating significant resources to address these issues. The current environment of heightened regulatory scrutiny has the potential to subject the Corporation to inquiries or investigations that could significantly adversely affect its reputation. Such investigations by state and federal authorities, as well as any other governmental or regulatory scrutiny of our foreclosure processes, could result in material fines, penalties, equitable remedies (including requiring default servicing or other process changes), or other enforcement actions, and result in significant legal costs in responding to governmental investigations and additional litigation.
While we cannot predict the ultimate impact of the temporary delay in foreclosure sales, or any issues that may arise as a result of alleged irregularities with respect to previously completed foreclosure activities, we may be subject to additional borrower and non-borrower litigation and governmental and regulatory scrutiny related to our past and current foreclosure activities. This scrutiny may extend beyond our pending foreclosure matters to issues arising out of alleged irregularities with respect to previously completed foreclosure activities. Our costs increased in the fourth quarter of 2010 and we expect that additional costs incurred in connection with our foreclosure process assessment will continue into 2011 due to the additional resources necessary to perform the foreclosure process assessment, to revise affidavit filings and to implement other operational changes. This will likely result in higher noninterest expense, including higher servicing costs and legal expenses, inHome Loans & Insurance. It is also possible that the temporary suspension in foreclosure sales may result in additional costs and expenses, including costs associated with the maintenance of properties or possible home price declines while foreclosures are delayed. In addition, required process changes could increase our default servicing costs over the longer term. Finally, the time to complete foreclosure sales may increase temporarily, which may result in an increase in nonperforming loans and servicing advances and may impact the collectability of such advances and the value of our mortgage servicing rights (MSR) asset, MBS and real estate owned properties. An increase in the time to complete foreclosure sales also may inflate the amount of highly delinquent loans in the Corporation’s mortgage statistics, result in increasing levels of consumer nonperforming loans, and could have a dampening effect on net interest margin as nonperforming assets increase. Accordingly, delays in foreclosure sales, including any delays beyond those currently anticipated, our continued process enhancements and any issues that may arise out of alleged irregularities in our foreclosure process could increase the costs associated with our mortgage operations.
Loan sales have not been materially impacted by the temporary delay in foreclosure sales or the review of our foreclosure process. However, delays in foreclosure sales could negatively impact the valuation of our real estate owned properties and MBS that are serviced by us. With respect to agency MBS, while there would be no credit impairment to security holders due to the guarantee provided by the agencies, the valuation of certain MBS could be negatively affected under certain scenarios due to changes in the timing of cash flows. The impact on agency MBS depends on, among other factors, how

long the underlying loans are affected by foreclosure delays and would vary among securities. With respect to non-agency MBS, under certain scenarios the timing and amount of cash flows could be negatively affected. The ultimate impact on the non-agency MBS depends on the same factors that impact agency MBS, as well as the level of credit enhancement, including subordination. In addition, as a result of our foreclosure process assessment and related control enhancements that we have implemented, there may continue to be delays in foreclosure sales, including a continued backlog of foreclosure proceedings, and evictions from real estate owned properties.
Certain Servicing-related Issues
The Corporation and its legacy companies have securitized, and continue to securitize, a significant portion of the residential mortgage loans that we have originated or acquired. The Corporation services a large portion of the loans it or its subsidiaries have securitized and also services loans on behalf of third-party securitization vehicles. In addition to identifying specific servicing criteria, pooling and servicing arrangements entered into in connection with a securitization or whole loan sale typically impose standards of care on the servicer, with respect to its activities, that may include the obligation to adhere to the accepted servicing practices of prudent mortgage lendersand/or to exercise the degree of care and skill that the servicer employs when servicing loans for its own account. Many non-agency residential mortgage-backed securitizations and whole loan servicing agreements also require the servicer to indemnify the trustee or other investor for or against failures by the servicer to perform its servicing obligations or acts or omissions that involve willful malfeasance, bad faith or gross negligence in the performance of, or reckless disregard of, the servicer’s duties.
Servicing agreements with the GSEs generally provide the GSEs with broader rights relative to the servicer than are found in servicing agreements with private investors. For example, each GSE typically has the right to demand that the servicer repurchase loans that breach the seller’s representations and warranties made in connection with the initial sale of the loans even if the servicer was not the seller. The GSEs also reserve the contractual right to demand indemnification or loan repurchase for certain servicing breaches although we believe that repurchase or indemnification demands solely for servicing breaches are rare. In addition, our agreements with the GSEs and their first mortgage seller/servicer guides provide for timelines to resolve delinquent loans through workout efforts or liquidation, if necessary. In the fourth quarter of 2010, we recorded an expense of $230 million for compensatory fees that we expect to be assessed by the GSEs as a result of foreclosure delays.
With regard to alleged irregularities in foreclosure process-related activities, a servicer may incur costs or losses if the servicer elects or is required to re-execute or re-file documents or take other action in its capacity as a servicer in connection with pending or completed foreclosures. The servicer also may incur costs or losses if the validity of a foreclosure action is challenged by a borrower. If a court were to overturn a foreclosure because of errors or deficiencies in the foreclosure process, the servicer may have liability to a title insurer of the property sold in foreclosure. These costs and liabilities may not be reimbursable to the servicer. A servicer may also incur costs or losses associated with private-label securitizations or other loan investors relating to delays or alleged deficiencies in processing documents necessary to comply with state law governing foreclosures.
The servicer may be subject to deductions by insurers for mortgage insurance or guarantee benefits relating to delays or alleged deficiencies. Additionally, if the servicer commits a material breach of its servicing obligations that is not cured within specified timeframes, including those related to default servicing and foreclosure, it could be terminated as servicer under servicing agreements under certain circumstances. Any of these actions may harm the servicer’s reputation, increase its servicing costs or otherwise adversely affect its financial condition and results of operations.


34     Bank of America 2010


Mortgage notes, assignments or other documents are often required to be maintained and are often necessary to enforce mortgage loans. We have processes in place to satisfy document delivery and maintenance requirements in accordance with securitization transaction standards. Additionally, there has been significant public commentary regarding the common industry practice of recording mortgages in the name of Mortgage Electronic Registration Systems, Inc. (MERS), as nominee on behalf of the note holder, and whether securitization trusts own the loans purported to be conveyed to them and have valid liens securing those loans. We believe that the process for mortgage loan transfers into securitization trusts is based on a well-established body of law that establishes ownership of mortgage loans by the securitization trusts and we believe that we have substantially executed this process. We currently use the MERS system for a substantial portion of the residential mortgage loans that we originate, including loans that have been sold to investors or securitization trusts. Although the GSEs do not require the use of MERS, the GSEs permit standard forms of mortgages and deeds of trust that use MERS and we believe that loans that employ these forms are considered to be properly documented for the GSEs’ purposes. We believe that the use of MERS is a widespread practice in the industry. Certain legal challenges have been made to the process for transferring mortgage loans to securitization trusts asserting that having a mortgagee of record that is different than the holder of the mortgage note could “break the chain of title” and cloud the ownership of the loan. Under the Uniform Commercial Code, a securitization trust or other investor should have good title to a mortgage loan if, among other means, either the note is endorsed in blank or to the named transferee and delivered to the holder or its designee, which may be a document custodian. In order to foreclose on a mortgage loan, in certain cases it may be necessary or prudent for an assignment of the mortgage to be made to the holder of the note, which in the case of a mortgage held in the name of MERS as nominee would need to be completed by MERS. As such, our practice is to obtain assignments of mortgages from MERS prior to instituting foreclosure. If certain required documents are missing or defective, or if the use of MERS is found not to be effective, we could be obligated to cure

certain defects or in some circumstances otherwise be subject to additional costs and expenses, which could have a material adverse effect on our results of operations, cash flows and financial condition.
Private-label Residential Mortgage-backed Securities Matters
On October 18, 2010, Countrywide Home Loans Servicing, LP (which changed its name to BAC Home Loans Servicing, LP), a wholly-owned subsidiary of the Corporation, received a letter, in its capacity as servicer under certain pooling and servicing agreements for 115 private-label residential MBS securitizations (subsequently increased to 225 securitizations) from investors purportedly owning interests in RMBS issued in the securitizations. The letter asserted breaches of certain loan servicing obligations, including an alleged failure to provide notice to the trustee and other parties to the pooling and servicing agreements of breaches of representations and warranties with respect to mortgage loans included in the securitization transactions. On November 4, 2010, the servicer responded in writing to the letter, stating among other things that the letter had identified no facts indicating that the servicer had breached any of its obligations, and asking that the signatories of the letter provide evidence that they met the minimum voting interest requirements for investor action contained in the relevant contracts. BAC Home Loans Servicing, LP and Gibbs & Bruns LLP on behalf of certain investors including those who signed the letter, as well as The Bank of New York Mellon, as trustee, have agreed to a short extension of any time periods commenced by the letter to permit the parties to explore dialogue around the issues raised. There are a number of questions about the validity of the assertions set forth in the letter, including whether these purported investors have standing to bring these claims. The servicer intends to challenge the assertions in the letter and to fully enforce its rights under the relevant contracts.
For additional information about representations and warranties, seeNote 9 – Representations and Warranties Obligations and Corporate Guaranteesto the Consolidated Financial Statements, Representations and Warranties beginning on page 52 and Item 1A. Risk Factors of thisForm 10-K.


Bank of America 2010     35


Supplemental Financial Data

Table 7 provides a reconciliation of the supplemental financial data mentioned below with financial measures defined by generally accepted accounting principles in the United States of America (GAAP). Other companies may define or calculate supplemental financial data differently.

We view net interest income and related ratios and analyses (i.e., efficiency ratio and net interest yield) on a FTE basis. Although this is athese are non-GAAP measure,measures, we believe managing the business with net interest income on a FTE basis provides a more accurate picture of the interest margin for comparative purposes. To derive the FTE basis, net interest income is adjusted to reflect tax-exempt income on an equivalent before-tax basis with a corresponding increase in income tax expense. For purposes of this calculation, we use the federal statutory tax rate of 35 percent. This measure ensures comparability of net interest income arising from taxable and tax-exempt sources.

As mentioned above, certain performance measures including the efficiency ratio and net interest yield utilize net interest income (and thus total revenue) on a FTE basis. The efficiency ratio measures the costs expended to generate a dollar of revenue, and net interest yield evaluates how many bpsbasis points we are earning over the cost of funds. During our annual planning process, we set efficiency targets for the Corporation and each line of business. We believe the use of thisthese non-GAAP measuremeasures provides additional clarity in assessing our results. Targets vary by year and by business and are based on a variety of factors including maturity of the business, competitive environment, market factors and other items (e.g.,including our risk appetite).

appetite.

We also evaluate our business based uponon the following ratios that utilize tangible equity.equity, a non-GAAP measure. Return on average tangible common shareholders’ equity measures our earnings contribution as a percentage of common shareholders’ equity plus CESany Common Equivalent Securities (CES) less goodwill and intangible assets, (excluding MSRs), net of related deferred tax liabilities. Return on average tangible shareholders’ equity (ROTE)ROTE measures our earnings contribution as a percentage of

average shareholders’ equity reduced byless goodwill and intangible assets (excluding MSRs), net of related deferred tax liabilities. The tangible common equity ratio represents common shareholders’ equity plus any CES less goodwill and intangible assets (excluding MSRs), net of related deferred tax liabilities divided by total assets less goodwill and intangible assets (excluding MSRs), net of related deferred tax liabilities. The tangible equity ratio represents total shareholders’ equity less goodwill and intangible assets (excluding MSRs), net of related deferred tax liabilities divided by total assets less goodwill and intangible assets (excluding MSRs), net of related deferred tax liabilities. Tangible book value per common share represents ending common shareholders’ equity plus CES less goodwill and intangible assets (excluding MSRs), net of related deferred tax liabilities divided by ending common shares outstanding plus the number of common shares issued upon conversion of CES.common equivalent shares. These measures are used to evaluate our use of equity (i.e., capital). In addition, profitability, relationship and investment models all use ROTE as key measures to support our overall growth goals.

The aforementioned supplemental data and performance measures are presented in Tables 6 and 7 and Statistical Tables XII and XIV. In addition, in Table 7 and Statistical Table XIV, we have excluded the impact of goodwill impairment charges of $12.4 billion recorded in 2010 when presenting earnings and diluted earnings per common share, the efficiency ratio, return on average assets, return on average common shareholders’ equity, return on average tangible common shareholders’ equity and ROTE. Accordingly, these are non-GAAP measures. Statistical Tables XIII and XV provide reconciliations of these non-GAAP measures with financial measures defined by GAAP. We believe the use of these non-GAAP measures provides additional clarity in assessing the results of the Corporation. Other companies may define or calculate these measures and ratios are presented in differently.


Table 6.

7
 Five Year Supplemental Financial Data

                      
(Dollars in millions, except per share information)  2010  2009  2008  2007  2006 
Fully taxable-equivalent basis data
                     
Net interest income  $52,693  $48,410  $46,554  $36,190  $35,818 
Total revenue, net of interest expense   111,390   120,944   73,976   68,582   74,000 
Net interest yield (1)
   2.78%  2.65%  2.98%  2.60%  2.82%
Efficiency ratio   74.61   55.16   56.14   54.71   48.37 
                      
Performance ratios, excluding goodwill impairment charges (2)
                     
Per common share information                     
Earnings  $0.87                 
Diluted earnings   0.86                 
Efficiency ratio   63.48%                
Return on average assets   0.42                 
Return on average common shareholders’ equity   4.14                 
Return on average tangible common shareholders’ equity   7.03                 
Return on average tangible shareholders’ equity   7.11                 
                      
Bank of America 200925


Table 7  Supplemental Financial Data and Reconciliations to GAAP Financial Measures(1)

(Dollars in millions, shares in thousands) 2009   2008   2007   2006   2005 

FTE basis data


Net interest income

 $48,410    $46,554    $36,190    $35,818    $31,569  

Total revenue, net of interest expense

  120,944     73,976     68,582     74,000     58,007  

Net interest yield

  2.65   2.98   2.60   2.82   2.84

Efficiency ratio

  55.16     56.14     54.71     48.37     49.44  

Reconciliation of average common shareholders’ equity to average tangible common shareholders’ equity


Common shareholders’ equity

 $182,288    $141,638    $133,555    $129,773    $99,590  

Common Equivalent Securities

  1,213                      

Goodwill

  (86,034   (79,827   (69,333   (66,040   (45,331

Intangible assets (excluding MSRs)

  (12,220   (9,502   (9,566   (10,324   (3,548

Related deferred tax liabilities

  3,831     1,782     1,845     1,809     1,014  

Tangible common shareholders’ equity

 $89,078    $54,091    $56,501    $55,218    $51,725  

Reconciliation of average shareholders’ equity to average tangible shareholders’ equity


Shareholders’ equity

 $244,645    $164,831    $136,662    $130,463    $99,861  

Goodwill

  (86,034   (79,827   (69,333   (66,040   (45,331

Intangible assets (excluding MSRs)

  (12,220   (9,502   (9,566   (10,324   (3,548

Related deferred tax liabilities

  3,831     1,782     1,845     1,809     1,014  

Tangible shareholders’ equity

 $150,222    $77,284    $59,608    $55,908    $51,996  

Reconciliation of year end common shareholders’ equity to year end tangible common shareholders’ equity


Common shareholders’ equity

 $194,236    $139,351    $142,394    $132,421    $101,262  

Common Equivalent Securities

  19,244                      

Goodwill

  (86,314   (81,934   (77,530   (65,662   (45,354

Intangible assets (excluding MSRs)

  (12,026   (8,535   (10,296   (9,422   (3,194

Related deferred tax liabilities

  3,498     1,854     1,855     1,799     1,336  

Tangible common shareholders’ equity

 $118,638    $50,736    $56,423    $59,136    $54,050  

Reconciliation of year end shareholders’ equity to year end tangible shareholders’ equity


Shareholders’ equity

 $231,444    $177,052    $146,803    $135,272    $101,533  

Goodwill

  (86,314   (81,934   (77,530   (65,662   (45,354

Intangible assets (excluding MSRs)

  (12,026   (8,535   (10,296   (9,422   (3,194

Related deferred tax liabilities

  3,498     1,854     1,855     1,799     1,336  

Tangible shareholders’ equity

 $136,602    $88,437    $60,832    $61,987    $54,321  

Reconciliation of year end assets to year end tangible assets


Assets

 $2,223,299    $1,817,943    $1,715,746    $1,459,737    $1,291,803  

Goodwill

  (86,314   (81,934   (77,530   (65,662   (45,354

Intangible assets (excluding MSRs)

  (12,026   (8,535   (10,296   (9,422   (3,194

Related deferred tax liabilities

  3,498     1,854     1,855     1,799     1,336  

Tangible assets

 $2,128,457    $1,729,328    $1,629,775    $1,386,452    $1,244,591  

Reconciliation of year end common shares outstanding to year end tangible common shares outstanding


Common shares outstanding

  8,650,244     5,017,436     4,437,885     4,458,151     3,999,688  

Assumed conversion of common equivalent shares

  1,286,000                      

Tangible common shares outstanding

  9,936,244     5,017,436     4,437,885     4,458,151     3,999,688  

Calculation includes fees earned on overnight deposits placed with the Federal Reserve of $368 million and $379 million for 2010 and 2009. The Corporation did not have fees earned on overnight deposits during 2008, 2007 and 2006.
26(2)BankPerformance ratios are calculated excluding the impact of America 2009goodwill impairment charges of $12.4 billion recorded during 2010.
36     Bank of America 2010


Core Net Interest Income – Managed Basis

We manage core net interest income – managed basis, which adjustsis reported net interest income on a FTE basis adjusted for the impact of market-based activities and certain securitizations, net of retained securities.activities. As discussed in theGlobal MarketsGBAMbusiness segment section beginning on page 35,45, we evaluate our market-based results and strategies on a total market-based revenue approach by combining net interest income and noninterest income forGlobal Markets.GBAM.We also adjustIn addition, 2009 is presented on a managed basis which is adjusted for loans that we originated and subsequently sold into credit card securitizations. Noninterest income, rather than net interest income and provision for credit

losses, iswas recorded for securitized assets that have been securitized as we are compensated for servicing the securitized assets and recordwe recorded servicing income and gains or losses on securitizations, where appropriate. We believe the use of this non-GAAP presentation provides additional clarity2010 is presented in managing our results.accordance with new consolidation guidance. An analysis of core net interest income, – managed basis, core average earning assets – managed basis and core net interest yield on earning assets, – managed basis,all of which adjust for the impact of these two non-core items from reported net interest income on a FTE basis, is shown below.

We believe the use of this non-GAAP presentation provides additional clarity in assessing our results.

Core net interest income on a managed basis increased $2.3 billion to $52.8 billion for 2009 compared to 2008. The increase was driven by the favorable interest rate environment and the acquisitions of Merrill Lynch and Countrywide. These items were partially offset by the impact of deleveraging the ALM portfolio earlier in 2009, lower consumer loan levels and the adverse impact of our nonperforming loans. For more information on our nonperforming loans, see Credit Risk Management on page 54.

On a managed basis, core average earning assets increased $130.1 billion to $1.4 trillion for 2009 compared to 2008 primarily due to the acquisitions of Merrill Lynch and Countrywide partially offset by lower loan levels and earlier deleveraging of the AFS debt securities portfolio.

Core net interest yield on a managed basis decreased 19 bps to 3.69 percent for 2009 compared to 2008, primarily due to the addition of lower yielding assets from the Merrill Lynch and Countrywide acquisitions, reduced consumer loan levels and the impact of deleveraging the ALM portfolio earlier in 2009 partially offset by the favorable interest rate environment.


Table 8Core Net Interest Income – Managed Basis

(Dollars in millions) 2009   2008 

Net interest income(1)


As reported

 $48,410    $46,554  

Impact of market-based net interest income (2)

  (6,119   (4,939

Core net interest income

  42,291     41,615  

Impact of securitizations(3)

  10,524     8,910  

Core net interest income – managed basis

 $52,815    $50,525  

Average earning assets


As reported

 $1,830,193    $1,562,729  

Impact of market-based earning assets(2)

  (481,542   (360,667

Core average earning assets

  1,348,651     1,202,062  

Impact of securitizations(4)

  83,640     100,145  

Core average earning assets – managed basis

 $1,432,291    $1,302,207  

Net interest yield contribution(1)


As reported

  2.65   2.98

Impact of market-based activities(2)

  0.49     0.48  

Core net interest yield on earning assets

  3.14     3.46  

Impact of securitizations

  0.55     0.42  

Core net interest yield on earning assets – managed basis

  3.69   3.88
         
(Dollars in millions) 2010  2009 
Net interest income (1)
        
As reported (2)
 $52,693  $48,410 
Impact of market-based net interest income (3)
  (4,430)  (6,117)
         
Core net interest income  48,263   42,293 
Impact of securitizations (4)
  n/a   10,524 
         
Core net interest income
  48,263   52,817 
         
Average earning assets
        
As reported  1,897,573   1,830,193 
Impact of market-based earning assets (3)
  (504,360)  (481,376)
         
Core average earning assets  1,393,213   1,348,817 
Impact of securitizations (5)
  n/a   83,640 
         
Core average earning assets
  1,393,213   1,432,457 
         
Net interest yield contribution (1)
        
As reported (2)
  2.78%  2.65%
Impact of market-based activities (3)
  0.68   0.49 
         
Core net interest yield on earning assets  3.46   3.14 
Impact of securitizations  n/a   0.55 
         
Core net interest yield on earning assets
  3.46%  3.69%
         
(1)

FTE basis

(2)

Balance and calculation include fees earned on overnight deposits placed with the Federal Reserve of $368 million and $379 million for 2010 and 2009.
(3)Represents the impact of market-based amounts included inGlobal MarketsGBAM.

(3)(4)

Represents the impact of securitizations utilizing actual bond costs. Thiscosts which is different from the business segment view which utilizes funds transfer pricing methodologies.

(4)(5)

Represents average securitized loans less accrued interest receivable and certain securitized bonds retained.

n/a = not applicable

Core net interest income decreased $4.6 billion to $48.3 billion for 2010 compared to 2009. The decrease was driven by lower loan levels compared to managed loan levels in 2009, and lower yields for the discretionary and credit card portfolios. These impacts were partially offset by lower rates on deposits.
Core average earning assets decreased $39.2 billion to $1.4 trillion for 2010 compared to 2009. The decrease was primarily due to lower

commercial loan levels and lower consumer loan levels compared to managed consumer loan levels in 2009. The impact was partially offset by increased securities levels in 2010.
Core net interest yield decreased 23 bps to 3.46 percent for 2010 compared to 2009 due to the factors noted above.


Bank of America 2010     37


Business Segment Operations

Segment Description and Basis of Presentation

We report the results of our operations through six business segments:Deposits, Global Card Services, Home Loans & Insurance, Global Commercial Banking, Global MarketsGBAMandGWIM, with the remaining operations recorded inAll Other. The Corporation may periodically reclassify Effective January 1, 2010, we realigned the Global Corporate and Investment Banking portion of the formerGlobal Bankingsegment with the formerGlobal Marketsbusiness segment results based on modifications to its management reporting methodologies form GBAMand changes in organizational alignment.to reflectGlobal Commercial Bankingas a standalone segment. Prior period amounts have been reclassified to conform to current period presentation.

We prepare and evaluate segment results using certain non-GAAP methodologies and performance measures, many of which are discussed in Supplemental Financial Data beginning on page 25.36. In addition, return on average tangible shareholders’ equity for the segments is calculated as net income, excluding goodwill impairment charges, divided by average allocated equity less goodwill and a percentage of intangible assets (excluding MSRs). We begin by evaluating the operating results of the segments which by definition exclude merger and restructuring charges.
The management accounting and reporting process derives segment and business results by utilizing allocation methodologies for revenue and expense. The net income derived for the businesses is dependent upon revenue and cost allocations using an activity-based costing model, funds transfer pricing, and other methodologies and assumptions management believes are appropriate to reflect the results of the business.
Total revenue, net of interest expense, includes net interest income on a FTE basis and noninterest income. The adjustment of net interest income to a FTE basis results in a corresponding increase in income tax expense. The segment results also reflect certain revenue and expense methodologies whichthat are utilized to determine

net income. For presentation purposes, in segments where the total of liabilities and equity exceeds assets, which are generally deposit-taking segments, we allocate assets to match liabilities. The net interest income of the business segmentsbusinesses includes the results of a funds transfer pricing

process that matches assets and liabilities with similar interest rate sensitivity and maturity characteristics.

Net interest income of the business segments also includes an allocation of net interest income generated by our ALM activities.

Our ALM activities include an overall interest rate risk management strategy that incorporates the use of interest rate contracts to manage fluctuations in earnings that are caused by interest rate volatility. Our goal is to manage interest rate sensitivity so that movements in interest rates do not significantly adversely affect net interest income. Our ALM activities are allocated to the business segments and fluctuate based on performance. ALM activities include external product pricing decisions including deposit pricing strategies, the effects of our internal funds transfer pricing process and the net effects of other ALM activities.
Certain expenses not directly attributable to a specific business segment are allocated to the segments. The most significant of these expenses include data and item processing costs and certain centralized or shared functions. Data processing costs are allocated to the segments based on equipment usage. Item processing costs are allocated to the segments based on the volume of items processed for each segment. The costs of certain centralized or shared functions are allocated based on methodologies that reflect utilization.
Equity is allocated to business segments and related businesses using a risk-adjusted methodology incorporating each segment’s stand-alone credit, market, interest rate, strategic and operational risk components. The nature of these risks is discussed further beginning on page 44. The Corporation benefits59. We benefit from the diversification of risk across these components which is reflected as a reduction to allocated equity for each segment. AverageThe total amount of average equity is allocated to the business segmentsreflects both risk-based capital and is affected by the portion of goodwill that isand intangibles specifically assigned to them.

the business segments.

For more information on our basis of presentation, selected financial information for the business segments and reconciliations to consolidated total revenue, net income (loss) and year-end total assets, seeNote 2326 – Business Segment Informationto the Consolidated Financial Statements.


38     Bank of America 2010


Deposits
             
(Dollars in millions) 2010  2009  % Change 
Net interest income (1)
 $8,128  $7,089   15%
Noninterest income:            
Service charges  5,058   6,796   (26)
All other income (loss)  (5)  5   n/m 
             
Total noninterest income  5,053   6,801   (26)
             
Total revenue, net of interest expense  13,181   13,890   (5)
             
Provision for credit losses  201   343   (41)
Noninterest expense  10,831   9,501   14 
             
Income before income taxes  2,149   4,046   (47)
Income tax expense (1)
  797   1,470   (46)
             
Net income
 $1,352  $2,576   (48)
             
             
Net interest yield (1)
  1.99%  1.75%    
Return on average equity  5.58   10.92     
Return on average tangible shareholders’ equity  21.70   46.00     
Efficiency ratio (1)
  82.17   68.40     
             
Balance Sheet
            
             
Average
            
Total earning assets $409,359  $405,104   1%
Total assets  435,994   431,564   1 
Total deposits  411,001   406,823   1 
Allocated equity  24,204   23,594   3 
             
Year end
            
Total earning assets $403,926  $417,713   (3)%
Total assets  432,334   444,612   (3)
Total deposits  406,856   419,583   (3)
Allocated equity  24,273   24,186    
             
Bank of America 200927


Deposits

(Dollars in millions) 2009   2008 

Net interest income(1)

 $7,160    $10,970  

Noninterest income:


Service charges

  6,802     6,801  

All other income

  46     69  

Total noninterest income

  6,848     6,870  

Total revenue, net of interest expense

  14,008     17,840  

Provision for credit losses

  380     399  

Noninterest expense

  9,693     8,783  

Income before income taxes

  3,935     8,658  

Income tax expense(1)

  1,429     3,146  

Net income

 $2,506    $5,512  

Net interest yield(1)

  1.77   3.13

Return on average equity

  10.55     22.55  

Efficiency ratio(1)

  69.19     49.23  

Balance Sheet


Average


Total earning assets(2)

 $405,563    $349,930  

Total assets(2)

  432,268     379,067  

Total deposits

  406,833     357,608  

Allocated equity

  23,756     24,445  

Year end


Total earning assets(2)

 $418,156    $363,334  

Total assets(2)

  445,363     390,487  

Total deposits

  419,583     375,763  
(1)

FTE basis

(2)

Total earning assets and total assets include asset allocations to match liabilities (i.e., deposits).

n/m = not meaningful

Depositsincludes the results of consumer deposit activities which consist of a comprehensive range of products provided to consumers and small businesses. In addition,Depositsincludes our student lending results and an allocation of ALM activities. In the U.S., we serve approximately 5957 million consumer and small business relationships through a franchise that stretches coast to coast through 32 states and the District of Columbia utilizing our network of 6,011approximately 5,900 banking centers, 18,262 domestic-branded18,000 ATMs, telephone,nationwide call centers and leading online and mobile banking channels.

platforms.

At December 31, 2010, our active online banking customer base was 29.3 million subscribers compared to 29.6 million at December 31, 2009, and our active bill pay users paid $304.3 billion of bills online during 2010 compared to $302.4 billion in 2009.
Our deposit products include traditional savings accounts, money market savings accounts, CDs and IRAs, and noninterest- andnoninterest-and interest-bearing checking accounts. Deposit products provide a relatively stable source of funding and liquidity. We earn net interest spread revenuesrevenue from investing this liquidity in earning assets through client-facing lending and ALM activities. The revenue is allocated to the deposit products using our funds transfer pricing process which takes into account the interest rates and maturity characteristics of the deposits.Depositsalso generategenerates fees such as account service fees, non-sufficient funds fees, overdraft charges and ATM fees.

During the third quarter of 2009, we announced changes in our overdraft fee policies intended to help customers limit overdraft fees. These changes negatively impacted net revenue beginning in the fourth quarter of 2009. In addition, in November 2009, the Federal Reserve issued Regulation E which will negatively impact future service charge revenue inDeposits. For more information on Regulation E, see Regulatory Overview beginning on page 17.

During 2009, our active online banking customer base grew to 29.6 million subscribers, a net increase of 1.3 million subscribers from December 31, 2008 reflecting our continued focus on increasing the use of alternative banking channels. In addition, our active bill pay users paid $302.4 billion of bills online during 2009 compared to $301.1 billion during 2008.

Depositsincludes the net impact of migrating customers and their related deposit balances betweenGWIMandDeposits. DuringFor more information on the migration of customer balances, seeGWIM beginning on page 48.

Regulation E became effective July 1, 2010 for new customers and August 16, 2010 for existing customers. These rules partially impacted the third quarter of 2010 and fully impacted the fourth quarter of 2010. In late 2009, total deposits of $43.4 billionwe implemented changes in our overdraft policies which negatively

impacted revenue. These changes were migratedintended toDepositsfromGWIM.Conversely, $20.5 billion of deposits were migrated fromDeposits toGWIMduring 2008. The directional shift was mainly due to client segmentation threshold changes resulting from the Merrill Lynch acquisition, partially offset by the acceleration in 2008 of movement of clients intoGWIMas part of our growth initiatives for our help customers limit overdraft fees. For more affluent customers. As of the date of migration, the associated net interest income, service charges and noninterest expense are recorded in the segment to which deposits were transferred.

information on Regulation E, see Regulatory Matters beginning on page 56.

Net income fell $3.0$1.2 billion, or 5548 percent, to $2.5$1.4 billion as netdue to lower revenue declined and higher noninterest expense rose.expense. Net interest income decreased $3.8increased $1.0 billion, or 3515 percent, to $7.2$8.1 billion as a result of a customer shift to more liquid products and continued pricing discipline, partially offset by a lower net interest income allocation fromrelated to ALM activities and spread compression as interest rates declined.activities. Average deposits grew $49.2increased $4.2 billion or 14 percent,from a year ago due to strongthe transfer of certain deposits from other client managed businesses and organic growth, and the net migration of certain households’ deposits fromGWIM. Organic growth was driven by the continuing need of customers to manage their liquidity as illustrated by growth in higher spread deposits from new money as well as movement from certificates of deposits to checking accounts and other products. This increase was partially offset by the expected run-off of higher-cost legacy Countrywide deposits.
Noninterest income fell $1.7 billion, or 26 percent, to $5.1 billion, primarily driven by the decline in higher-yielding Countrywide deposits.

Noninterest income was flat at $6.8 billion as service charges remained unchanged fordue to the year. The positive impactsimplementation of revenue initiatives were offset by changes in consumer spending behavior attributable to current economic conditions, as well asRegulation E and the negative impact of our overdraft policy changes. The impact of Regulation E, which was in effect beginning in the implementationthird quarter and fully in effect in the fourth quarter of 20092010, and overdraft policy changes, which were in effect for the full year of 2010, was a reduction in service charges during 2010 of approximately $1.7 billion. In 2011, the new initiatives aimed at assisting customers who are economically stressed by reducing their banking fees.

incremental reduction to service charges related to Regulation E and overdraft policy changes is expected to be approximately $1.1 billion, or a full-year impact of approximately $2.8 billion, net of identified mitigation actions.

Noninterest expense increased $910$1.3 billion, or 14 percent, to $10.8 billion as a result of a higher proportion of costs associated with banking center sales and service efforts being aligned toDepositsfrom the other consumer segments and increased litigation expenses in 2010. Noninterest expense includes FDIC charges of $896 million or 10 percent, duecompared to higher$1.2 billion during 2009 which included a special FDIC insurance and special assessment costs, partially offset by lower operating costs related to lower transaction volume due to the economy and productivity initiatives.

assessment.


Bank of America 2010     39


Global Card Services
             
(Dollars in millions) 2010  2009 (1)  % Change 
Net interest income (2)
 $17,821  $19,972   (11)%
Noninterest income:            
Card income  7,658   8,553   (10)
All other income  142   521   (73)
             
Total noninterest income  7,800   9,074   (14)
             
Total revenue, net of interest expense  25,621   29,046   (12)
             
Provision for credit losses  12,648   29,553   (57)
Goodwill impairment  10,400      n/m 
All other noninterest expense  6,953   7,726   (10)
             
Loss before income taxes  (4,380)  (8,233)  47 
Income tax expense (benefit) (2)
  2,223   (2,972)  175 
             
Net loss
 $(6,603) $(5,261)  (26)
             
             
Net interest yield (2)
  10.10%  9.43%    
Return on average tangible shareholders’ equity  22.50   n/m     
Efficiency ratio (2)
  67.73   26.60     
Efficiency ratio, excluding goodwill impairment charge (2)
  27.14   26.60     
             
Balance Sheet
            
             
Average
            
Total loans and leases $176,232  $211,981   (17)%
Total earning assets  176,525   211,737   (17)
Total assets  181,766   228,438   (20)
Allocated equity  36,567   41,031   (11)
             
Year end
            
Total loans and leases $167,367  $196,289   (15)%
Total earning assets  168,224   196,046   (14)
Total assets  169,762   212,668   (20)
Allocated equity  27,490   42,842   (36)
             
28Bank of America 2009


Global Card Services

(Dollars in millions) 2009   2008 

Net interest income(1)

 $20,264    $19,589  

Noninterest income:


Card income

  8,555     10,033  

All other income

  523     1,598  

Total noninterest income

  9,078     11,631  

Total revenue, net of interest expense

  29,342     31,220  

Provision for credit losses(2)

  30,081     20,164  

Noninterest expense

  7,961     9,160  

Income (loss) before income taxes

  (8,700   1,896  

Income tax expense (benefit)(1)

  (3,145   662  

Net income (loss)

 $(5,555  $1,234  

Net interest yield(1)

  9.36   8.26

Return on average equity

  n/m     3.15  

Efficiency ratio(1)

  27.13     29.34  

Balance Sheet


Average


Total loans and leases

 $216,654    $236,714  

Total earning assets

  216,410     237,025  

Total assets

  232,643     258,710  

Allocated equity

  41,409     39,186  

Year end


Total loans and leases

 $201,230    $233,040  

Total earning assets

  200,988     233,094  

Total assets

  217,139     252,683  
(1)

FTE

Prior year amounts are presented on a managed basis

for comparative purposes. For information on managed basis, refer toNote 26 – Business Segment Informationto the Consolidated Financial Statements beginning on page 233.
(2)

Represents provision for credit losses on held loans combined with realized credit losses associated with the securitized loan portfolio.

FTE basis
n/m

= not meaningful

n/m = not meaningful

Global Card Servicesprovides a broad offering of products including U.S. consumer and business card, consumer lending, international card and debit card to consumers and small businesses. We provide credit card products to customers in the U.S., Canada, Ireland, Spain and the United Kingdom.U.K. We offer a variety of co-branded and affinity credit and debit card products and are one of the leading issuers of credit cards through endorsed marketing in the U.S. and Europe.
On MayFebruary 22, 2009,2010, the majority of the provisions of the CARD Act which calls for a number of changes to credit card industry practices was signed into law. The provisions in the CARD Act are expected tobecame effective and negatively impactimpacted net interest income during 2010 due to the restrictions on our ability to reprice credit cards based on risk and on card income due to restrictions imposed on certain fees. The 2010 full-year impact on revenue was approximately $1.5 billion. For more information on the CARD Act, see Regulatory OverviewMatters beginning on page 17.

56.

The Corporation reports itsGlobal Card Servicesresults in accordance with new consolidation guidance. Under this new consolidation guidance, we consolidated all credit card trusts on January 1, 2010. Accordingly, current year results are comparable to prior year results that are presented on a managed basis. For more information on managed basis, which is consistent withrefer toNote 26 – Business Segment Informationto the way that management evaluatesConsolidated Financial Statements and for more information on the resultsnew consolidation guidance, refer to Balance Sheet Overview – Impact of Adopting New Consolidation Guidance beginning on page 29 andNote 8 – Securitizations and Other Variable Interest Entitiesto the Consolidated Financial Statements.
As a result of the business. Managed basis assumesFinancial Reform Act, which was signed into law on July 21, 2010, we believe that securitized loans were not sold and presents earnings on these loansour debit card revenue in a manner similar to the way loans that have not been sold (i.e., held loans) are

presented. Loan securitization is an alternative funding process that is used by the Corporation to diversify funding sources. Loan securitization removes loans from the Consolidated Balance Sheet through the sale of loans to an off-balance sheet qualifying special purpose entity (QSPE).

Securitized loans continue toGlobal Card Serviceswill be serviced by the business and are subject to the same underwriting standards and ongoing monitoring as held loans. In addition, excess servicing income is exposed to similar credit risk and repricing of interest rates as held loans. Starting lateadversely impacted beginning in the third quarter of 2008 and continuing into the first quarter2011. Based on 2010 volumes, our estimate of 2009, liquidity for asset-backed securitizations became disrupted and spreads rose to historic highs which negatively impacted our credit card securitization programs. Beginning in the second quarter of 2009, conditions started to improve with spreads narrowing and liquidity returningrevenue loss due to the marketplace, however, we did not returndebit card interchange fee standards to be adopted under the credit card securitization market during 2009.Financial Reform Act was approximately $2.0 billion annually. This estimate resulted in a $10.4 billion goodwill impairment charge forGlobal Card Services. Depending on the final rulemaking under the Durbin Amendment, additional goodwill impairment may occur inGlobal Card Services. For moreadditional information, see the Liquidity Riskrefer to Regulatory

Matters – Debit Interchange Fees on page 57 and Capital Management discussionComplex Accounting Estimates beginning on page 47.

107.

Global Card Servicesrecorded a net loss of $5.6$6.6 billion primarily due to the $10.4 billion goodwill impairment charge in 2009 compared to2010. Excluding this charge,Global Card Serviceswould have reported net income of $1.2$3.8 billion compared to a net loss of $5.3 billion in 2008the prior year, primarily due to highera decrease in provision for credit losses as credit costs continuedlosses. Revenue decreased $3.4 billion, or 12 percent, to rise driven by weak economies in the U.S., Europe and Canada. Managed net revenue declined $1.9$25.6 billion, to $29.3 billion in 2009 driven by lower noninterest income partially offset by growth in netaverage loans, reduced interest income.

Net interest income grew to $20.3 billion in 2009 from $19.6 billion in 2008 driven by increased loan spreads due to the beneficial impact of lower short-term interest rates on our funding costs partially offset by a decrease in average managed loans of $20.1 billion, or eight percent.

Noninterest income decreased $2.6 billion, or 22 percent, to $9.1 billion driven by decreases in card income of $1.5 billion, or 15 percent, and all other income of $1.1 billion, or 67 percent. The decrease in card income resulted from lower cash advances primarily related to balance transfers, and lower credit card interchange and fee income primarily resulting from the implementation of the CARD Act and the impact of recording an incremental reserve of $592 million for future payment protection insurance claims in the U.K. that have not yet been asserted. For more information on payment protection insurance, refer toNote 14 – Commitments and Contingenciesto the Consolidated Financial Statements.

Net interest income decreased $2.2 billion, or 11 percent, to $17.8 billion as average loans decreased $35.7 billion partially offset by lower funding costs. The decline in average loans was due to changes in consumer retail purchasethe elevated level of net charge-offs and risk mitigation strategies that were implemented throughout the recent economic cycle.
Noninterest income decreased $1.3 billion, or 14 percent, to $7.8 billion driven by lower card income primarily due to the implementation of the CARD Act and the impact of recording a reserve related to future payment behavior in the current economic environment. Thisprotection insurance claims. The decrease was partially offset by higher interchange income during 2010 and the absence of a negative valuation adjustmentgain on the interest-only strip recorded in 2008. In addition, all other income in 2008 included the gain associated with the Visa initial public offering (IPO).

sale of our MasterCard equity holdings.

Provision for credit losses increased by $9.9 billion to $30.1 billion as economic conditions led to higher losses in the consumer card and consumer lending portfolios including a higher level of bankruptcies. Also contributing to the increase were higher reserve additions related to new draws on previously securitized accounts as well as an approximate $800 million addition to increase the reserve coverage to approximately 12 months of charge-offs in consumer credit card. These reserve additions were partially offset by the beneficial impact of reserve reductions from improving delinquency trends in the second half of 2009.

Noninterest expense decreased $1.2 billion, or 13 percent, to $8.0improved $16.9 billion due to lower operatingdelinquencies and marketing costs.bankruptcies as a result of the improved economic environment. This resulted in reserve reductions of $7.0 billion in 2010 compared to reserve increases of $3.4 billion in 2009. The prior year included a reserve addition due to maturing securitizations which had an unfavorable impact on the 2009 provision expense. In addition, net charge-offs declined $6.5 billion in 2010 compared to 2009.

Excluding the goodwill impairment charge of $10.4 billion, noninterest expense in 2008 included benefitsdecreased $773 million primarily driven by a higher proportion of costs associated with the Visa IPO.

banking center sales and service efforts being aligned toDepositsfromGlobal Card Services.


40     Bank of America 2010


Home Loans & Insurance
             
(Dollars in millions) 2010  2009  % Change 
Net interest income (1)
 $4,690  $4,975   (6)%
Noninterest income:            
Mortgage banking income  3,079   9,321   (67)
Insurance income  2,257   2,346   (4)
All other income  621   261   138 
             
Total noninterest income  5,957   11,928   (50)
             
Total revenue, net of interest expense  10,647   16,903   (37)
             
Provision for credit losses  8,490   11,244   (24)
Goodwill impairment  2,000      n/m 
All other noninterest expense  13,163   11,705   12 
             
Loss before income taxes  (13,006)  (6,046)  (115)
Income tax benefit (1)
  (4,085)  (2,195)  (86)
             
Net loss
 $(8,921) $(3,851)  (132)
             
             
Net interest yield (1)
  2.52%  2.58%    
Efficiency ratio (1)
  142.42   69.25     
Efficiency ratio, excluding goodwill impairment charge (1)
  123.63   69.25     
             
Balance Sheet
            
             
Average
            
Total loans and leases $129,236  $130,519   (1)%
Total earning assets  186,455   193,152   (3)
Total assets  226,352   230,123   (2)
Allocated equity  26,170   20,530   27 
             
Year end
            
Total loans and leases $122,935  $131,302   (6)%
Total earning assets  173,033   188,349   (8)
Total assets  213,455   232,588   (8)
Allocated equity  23,542   27,148   (13)
             
Bank of America 200929


The table below and the following discussion present selected key indicators for theGlobal Card Services and credit card portfolios. Credit card includes U.S., Europe and Canada consumer credit card and does not include business card, debit card and consumer lending.

Key Statistics


(Dollars in millions) 2009   2008 

Global Card Services


Average – total loans:


Managed

 $216,654    $236,714  

Held

  118,201     132,313  

Year end – total loans:


Managed

  201,230     233,040  

Held

  111,515     132,080  

Managed net losses(1):


Amount

  26,655     15,723  

Percent(2)

  12.30   6.64

Credit Card


Average – total loans:


Managed

 $170,486    $184,246  

Held

  72,033     79,845  

Year end – total loans:


Managed

  160,824     182,234  

Held

  71,109     81,274  

Managed net losses(1):


Amount

  19,185     11,382  

Percent(2)

  11.25   6.18
(1)

Represents net charge-offs on held loans combined with realized credit losses associated with the securitized loan portfolio.

FTE basis
(2)

Ratios are calculated as managed net losses divided by average outstanding managed loans during the year.

n/m = not meaningful

Global Card Servicesmanaged net losses increased $10.9 billion to $26.7 billion, or 12.30 percent of average outstandings, compared to $15.7 billion, or 6.64 percent in 2008. This increase was driven by portfolio deterioration due to economic conditions including a higher level of bankruptcies. Additionally, consumer lending net charge-offs increased $2.1 billion to $4.3 billion, or 17.75 percent of average outstandings compared to $2.2 billion, or 7.98 percent in 2008. Lower loan balances driven by reduced marketing and tightened credit criteria also adversely impacted net charge-off ratios.

Managed consumer credit card net losses increased $7.8 billion to $19.2 billion, or 11.25 percent of average credit card outstandings, compared to $11.4 billion, or 6.18 percent in 2008. The increase was driven by portfolio deterioration due to economic conditions including elevated unemployment, underemployment and a higher level of bankruptcies.

For more information on credit quality, see Consumer Portfolio Credit Risk Management beginning on page 54.


30Bank of America 2009


Home Loans & Insurance

(Dollars in millions) 2009   2008 

Net interest income(1)

 $4,974    $3,311  

Noninterest income:


Mortgage banking income

  9,321     4,422  

Insurance income

  2,346     1,416  

All other income

  261     161  

Total noninterest income

  11,928     5,999  

Total revenue, net of interest expense

  16,902     9,310  

Provision for credit losses

  11,244     6,287  

Noninterest expense

  11,683     6,962  

Loss before income taxes

  (6,025   (3,939

Income tax benefit(1)

  (2,187   (1,457

Net loss

 $(3,838  $(2,482

Net interest yield(1)

  2.57   2.55

Efficiency ratio(1)

  69.12     74.78  

Balance Sheet


Average


Total loans and leases

 $130,519    $105,724  

Total earning assets

  193,262     129,674  

Total assets

  230,234     147,461  

Allocated equity

  20,533     9,517  

Year end


Total loans and leases

 $131,302    $122,947  

Total earning assets

  188,466     175,609  

Total assets

  232,706     205,046  
(1)

FTE basis

Home Loans & Insurancegenerates revenue by providing an extensive line of consumer real estate products and services to customers nationwide.Home Loans & Insuranceproducts are available to our customers through a retail network of 6,0115,900 banking centers, mortgage loan officers in approximately 880750 locations and a sales force offering our customers direct telephone and online access to our products. These products are also offered through our correspondent and wholesale loan acquisition channels. On February 4, 2011, we announced that we are exiting the reverse mortgage origination business. In October 2010, we exited the first mortgage wholesale acquisition channel. These strategic changes were made to allow greater focus on our retail and correspondent channels.
Home Loans & Insuranceproducts include fixed and adjustable rateadjustable-rate first-lien mortgage loans for home purchase and refinancing needs, reverse mortgages, home equity lines of credit and home equity loans. First mortgage products are either sold into the secondary mortgage market to investors, while retaining MSRs and the Bank of America customer relationships, or are held on our balance sheet inAll Otherfor ALM purposes.Home Loans & Insuranceis not impacted by the Corporation’s first mortgage production retention decisions asHome Loans & Insuranceis compensated for the decision on a management accounting basis with a corresponding offset recorded inAll Other. Funded home equity lines of credit and home equity loans are held on theHome Loans & Insurancebalance sheet. In addition,Home Loans & Insuranceoffers property, casualty, life, disability and credit insurance.

While

On February 3, 2011, we announced that we had entered into an agreement to sell the resultslender-placed and voluntary property and casualty insurance assets and liabilities of Countrywide’s deposit operations are included inDeposits, the majorityBalboa Insurance Company (Balboa) and affiliated

entities for an upfront cash payment of its ongoing operations are recorded inapproximately $700 million, subject to certain closing and other adjustments, as well as additional future payments. Balboa is a wholly-owned subsidiary and part ofHome Loans & Insurance. Countrywide’s acquired first mortgage and discontinued real estate portfolios are recorded inAll Otherand are managed as part of our overall ALM activities.

Home Loans & Insuranceincludes the impact of migratingtransferring customers and their related loan balances betweenGWIMandHome Loans & Insurance. As of the date of migration, the associated net interest income

and noninterest expense are recorded in the segment to which the customers were migrated. Total loans of $11.5 billion were migrated fromGWIMin 2009 compared to $1.6 billion in 2008. The increase was mainly due tobased on client segmentation threshold changes resulting fromthresholds. For more information on the Merrill Lynch acquisition.

migration of customer balances, seeGWIMbeginning on page 48.

Home Loans & Insurancerecorded a net loss of $3.8$8.9 billion in 2009 compared to a net loss of $2.5$3.9 billion in 2008, as growth2009 primarily due to an increase of $4.9 billion in noninterest incomerepresentations and net interest income was more thanwarranties provision and the $2.0 billion goodwill impairment charge recorded in 2010, partially offset by highera decline in provision for credit losses of $2.8 billion. For additional information on representations and higher noninterest expense.

Net interest income grew $1.7warranties, seeNote 9 – Representations and Warranties Obligations and Corporate Guaranteesto the Consolidated Financial Statements and Representations and Warranties on page 52.

Provision for credit losses decreased $2.8 billion or 50 percent,to $8.5 billion driven primarily by an increase in average loans held-for-sale (LHFS) andimproving portfolio trends which led to lower reserve additions, including those associated with the Countrywide PCI home equity loans. The $19.1portfolio.
Noninterest expense increased $3.5 billion increase in average LHFS was the result of higher mortgage loan volume driven by the lower interest rate environment. The growth in average home equity loans of $23.7 billion, or 23 percent, wasprimarily due primarily to the migrationgoodwill impairment charge, higher litigation expense and default-related and other loss mitigation expenses, partially offset by lower production expense and insurance losses.
See Complex Accounting Estimates – Goodwill and Intangible Assets beginning on page 110 andNote 10 – Goodwill and Intangible Assetsto the Consolidated Financial Statements for a discussion of certain loans fromthe goodwill impairment charge forGWIMHome Loans & Insurance. to


Bank of America 2010     41


Mortgage Banking Income
Home Loans & Insuranceas well as the full-year impact of Countrywide balances.

Noninterest income increased $5.9 billion to $11.9 billion driven by higher mortgage banking income which benefited from the full-year impact of Countrywide and lower current interest rates which drove higher production income.

Provision for credit losses increased $5.0 billion to $11.2 billion driven by continued economic and housing market weakness particularly in geographic areas experiencing higher unemployment and falling home prices. Additionally, reserve increases in the Countrywide home equity purchased impaired loan portfolio were $2.8 billion higher in 2009 compared to 2008 reflecting further reduction in expected principal cash flows.

Noninterest expense increased $4.7 billion to $11.7 billion largely due to the full-year impact of Countrywide as well as increased compensation costs and other expenses related to higher production volume and delinquencies. Partly contributing to the increase in expenses was the more than doubling of personnel and other costs in the area of our business that is responsible for assisting distressed borrowers with loan modifications or other workout solutions.

Mortgage Banking Income

We categorizeHome Loans & Insurance mortgage banking incomecategorized into production and servicing income. Production income is comprised of revenue from the fair value gains and losses recognized on our IRLCsinterest rate lock commitments (IRLCs) and LHFS andloansheld-for-sale (LHFS), the related secondary market execution, and costs related to representations and warranties in the sales transactions andalong with other obligations incurred in the sales of mortgage loans. In addition, production income includes revenue, which is eliminated inAll Other,for transfers of mortgage loans fromHome Loans & Insuranceto the ALM portfolio related to the Corporation’s mortgage production retention decisions which is eliminateddecisions.

Servicing income includes income earned inAll Other.

connection with servicing activities and MSR valuation adjustments, net of economic hedge activities. The costs associated with our servicing activities are included in noninterest expense.

Servicing activities primarily include collecting cash for principal, interest and escrow payments from borrowers, disbursing customer draws for lines of credit and accounting for and remitting principal and interest payments to investors and escrow payments to third parties. Our home retention efforts are also part of our servicing activities, along with responding to customer inquiries and supervising foreclosures and property dispositions. In an effort to avoid foreclosure, Bank of America evaluates various workout options prior to foreclosure sale which has resulted in elongated default timelines. Our servicing agreements with certain loan investors require us to comply with usual and customary standards in the liquidation of delinquent mortgage loans. Our agreements with the GSEs provide timelines to complete the liquidation of delinquent loans. In instances where we fail to meet these timelines, our agreements provide the GSEs with the option to assess compensatory fees. In 2010, the Corporation recorded an expense of approximately $230 million for estimated compensatory fees that it expects to be assessed by the GSEs as a result of foreclosure delays. Additionally, we may face demands and claims from private-label securitization investors concerning alleged breaches of customary servicing standards. For additional information on our servicing activities, see Recent Events – Certain Servicing-related Issues beginning on page 34.
On October 18, 2010, Countrywide Home Loans Servicing, income includes ancillary income earnedLP (which changed its name to BAC Home Loans Servicing, LP), a wholly-owned subsidiary of the Corporation, received a letter, in connection with these activities suchits capacity as late fees,servicer under certain pooling and MSR valuation adjustments, netservicing agreements for 115 private-label residential MBS securitizations (subsequently increased to 225 securitizations). The letter asserted breaches of economic hedge activities.certain servicing obligations. For additional information, see Recent Events – Private-label Residential Mortgage-backed Securities Matters on page 35.


Bank of America 200931


The following table below summarizes the components of mortgage banking income.

Mortgage Banking Income

(Dollars in millions) 2009     2008 

Production income

 $5,539      $2,105  

Servicing income:


Servicing fees and ancillary income

  6,200       3,531  

Impact of customer payments

  (3,709     (3,314

Fair value changes of MSRs, net of economic hedge results

  712       1,906  

Other servicing-related revenue

  579       194  

Total net servicing income

  3,782       2,317  

Total Home Loans & Insurance mortgage banking income

  9,321       4,422  

Other business segments’ mortgage banking
income (loss)(1)

  (530     (335

Total consolidated mortgage banking income

 $8,791      $4,087  
         
(Dollars in millions) 2010  2009 
Production income:        
Core production revenue $6,098  $7,352 
Representations and warranties provision  (6,786)  (1,851)
         
Total production income (loss)  (688)  5,501 
         
Servicing income:        
Servicing fees  6,475   6,219 
Impact of customer payments (1)
  (3,760)  (4,491)
Fair value changes of MSRs, net of economic hedge results (2)
  376   1,539 
Other servicing-related revenue  676   553 
         
Total net servicing income  3,767   3,820 
         
Total Home Loans & Insurance mortgage banking income
  3,079   9,321 
Other business segments’ mortgage banking loss (3)
  (345)  (530)
         
Total consolidated mortgage banking income
 $2,734  $8,791 
         
(1)

Represents the change in the market value of the MSR asset due to the impact of customer payments received during the year.
(2)Includes sale of MSRs.
(3)Includes the effect of transfers of mortgage loans fromHome Loans & Insuranceto the ALM portfolio inAll Other.

Production income increased $3.4

The production loss of $688 million represented a decrease of $6.2 billion in 2009 compared to 2008. This increase was driven by higher mortgage volumes due in large part to Countrywide and also to higher refinance activity resulting from the lower interest rate environment, partially offset by an increase inas representations and warranties expenseprovision increased $4.9 billion to $1.9$6.8 billion in 2009 from $246 million in 2008. The increase inwhich includes provision of $3.0 billion related to the GSE agreements as well as adjustments to the representations and warranties expenseliability for other loans sold directly to the GSEs and not covered by those agreements. Also contributing to the representations and warranties provision for the year was driven by increased estimatesour continued evaluation of defaults reflecting deterioration innon-GSE exposure to repurchases and similar claims, which led to the economydetermination that we have developed sufficient repurchase experience with certain non-GSE counterparties to record a liability related to existing and housing markets combined with a higher rate of repurchase or similar requests.future projected claims from such counterparties. For furtheradditional information regardingon representations and warranties, seeNote 89 – SecuritizationsRepresentations and Warranties Obligations and Corporate Guaranteesto the Consolidated Financial Statements, Recent Events – Representations and the Consumer Portfolio Credit Risk Management – Residential Mortgage discussionWarranties Liability on page 33 and Representations and Warranties beginning on page 56.

52. In addition, core production revenue, which excludes representations and warranties provision, declined $1.3 billion due to a decline in volume driven by a drop in the overall size of the mortgage market and a decline in market share.

Net servicing income increased $1.5 billion in 2009 compared to 2008 largely due to the full-yearremained relatively flat as lower MSR results, net of hedges, were offset by a lower impact of Countrywide which drove an increase of $2.7 billion in servicing feescustomer payments and ancillary income partially offset by lower MSR performance, net of hedge activities. The fair value changes of MSRs, net of economic hedge results were $712 million and $1.9 billion in 2009 and 2008. The positive 2009 MSRs results were primarily driven by changes in the forward interest rate curve. The positive 2008 MSR results were driven primarily by the expectation that weakness in the housing market would lessen the impact of decreasing market interest rates on expected future prepayments.higher fee income. For further discussionadditional information on MSRs and the related hedge instruments, see Mortgage Banking Risk Management on page 86.

106.


The following table presents select key indicators forHome Loans & Insurance.42     Bank of America 2010


Home Loans & Insurance Key Statistics

(Dollars in millions, except as noted) 2009  2008 

Loan production


Home Loans & Insurance:


First mortgage

 $357,371   $128,945  

Home equity

  10,488    31,998  

Total Corporation(1):


First mortgage

  378,105    140,510  

Home equity

  13,214    40,489  

Year end


Mortgage servicing portfolio (in billions)(2)

 $2,151   $2,057  

Mortgage loans serviced for
investors (in billions)

  1,716    1,654  

Mortgage servicing rights:


Balance

  19,465    12,733  

Capitalized mortgage servicing rights (% of loans serviced for investors)

  113 bps   77 bps 
         
(Dollars in millions, except as noted) 2010  2009 
Loan production
        
Home Loans & Insurance:        
First mortgage $287,236  $354,506 
Home equity  7,626   10,488 
Total Corporation(1):
        
First mortgage  298,038   378,105 
Home equity  8,437   13,214 
         
Year end
        
Mortgage servicing portfolio (in billions) (2)
 $2,057  $2,151 
Mortgage loans serviced for investors (in billions)  1,628   1,716 
Mortgage servicing rights:        
Balance  14,900   19,465 
Capitalized mortgage servicing rights (% of loans serviced for investors)  92bps  113bps
         
(1)

In addition to loan production inHome Loans & Insurance, the remaining first mortgage and home equity loan production is primarily inGWIMGWIM..

(2)(2)

Servicing of residential mortgage loans, home equity lines of credit, home equity loans and discontinued real estate mortgage loans.

First mortgage production inHome Loans & Insurancewas $357.4$287.2 billion in 20092010 compared to $128.9$354.5 billion in 2008.2009. The increasedecrease of $228.4$67.3 billion was primarily due to a drop in large part to the full-year impactoverall size of Countrywide as well as an increase in the mortgage market driven by weaker market demand for both refinance and purchase transactions combined with a declinedecrease in interest rates.market share. Home equity production was $7.6 billion in 2010 compared to $10.5 billion in 2009 compared to $32.0 billion in 2008.2009. The decrease of $21.5$2.9 billion was primarily due to our more stringent underwriting guidelines for home equity lines of credit and loans as well as lower consumer demand.

At December 31, 2009,2010, the consumer MSR balance was $19.5$14.9 billion, which represented 92 bps of the related unpaid principal balance compared to $19.5 billion, or 113 bps of the related unpaid principal balance as compared to $12.7 billion, or 77 bps of the related principal balance at December 31, 2008.2009. The increasedecrease in the consumer MSR balance was driven by increases in the forward interest rate curve andimpact of declining mortgage rates partially offset by the additionaladdition of new MSRs recorded in connection with sales of loans. ThisIn addition, elevated servicing costs, due to higher personnel expenses associated with default-related servicing activities, reduced expected cash flows. These factors together resulted in the 3621 bps increasedecrease in the capitalized MSRs as a percentage of loans serviced for investors.

serviced.


Bank of America 2010     43


Global Commercial Banking
             
(Dollars in millions) 2010  2009  % Change 
Net interest income (1)
 $8,086  $8,054   %
Noninterest income:            
Service charges  2,105   2,078   1 
All other income  712   1,009   (29)
             
Total noninterest income  2,817   3,087   (9)
             
Total revenue, net of interest expense  10,903   11,141   (2)
             
Provision for credit losses  1,971   7,768   (75)
Noninterest expense  3,874   3,833   1 
             
Income (loss) before income taxes  5,058   (460)  n/m 
Income tax expense (benefit) (1)
  1,877   (170)  n/m 
             
Net income (loss)
 $3,181  $(290)  n/m 
             
             
Net interest yield (1)
  2.94%  3.19%    
Return on average tangible shareholders’ equity  15.20   n/m     
Return on average equity  7.64   n/m     
Efficiency ratio (1)
  35.52   34.40     
             
Balance Sheet
            
             
Average
            
Total loans and leases $203,339  $229,102   (11)%
Total earning assets  275,356   252,309   9 
Total assets  306,302   283,936   8 
Total deposits  148,565   129,832   14 
Allocated equity  41,624   41,931   (1)
             
Year end
            
Total loans and leases $193,573  $215,237   (10)%
Total earning assets  277,551   264,855   5 
Total assets  310,131   295,947   5 
Total deposits  161,260   147,023   10 
Allocated equity  40,607   42,975   (6)
             
32Bank of America 2009


Global Banking

(Dollars in millions) 2009   2008 

Net interest income(1)

 $11,250    $10,755  

Noninterest income:


Service charges

  3,954     3,233  

Investment banking income

  3,108     1,371  

All other income

  4,723     1,437  

Total noninterest income

  11,785     6,041  

Total revenue, net of interest expense

  23,035     16,796  

Provision for credit losses

  8,835     3,130  

Noninterest expense

  9,539     6,684  

Income before income taxes

  4,661     6,982  

Income tax expense(1)

  1,692     2,510  

Net income

 $2,969    $4,472  

Net interest yield(1)

  3.34   3.30

Return on average equity

  4.93     8.84  

Efficiency ratio(1)

  41.41     39.80  

Balance Sheet


Average


Total loans and leases

 $315,002    $318,325  

Total earning assets(2)

  337,315     325,764  

Total assets(2)

  394,140     382,790  

Total deposits

  211,261     177,528  

Allocated equity

  60,273     50,583  

Year end


Total loans and leases

 $291,117    $328,574  

Total earning assets(2)

  343,057     338,915  

Total assets(2)

  398,061     394,541  

Total deposits

  227,437     215,519  
(1)

FTE basis

(2)

Total earning assets and total assets include asset allocations to match liabilities (i.e., deposits).

n/m = not meaningful

Global Commercial Bankingprovides a wide range of lending-related products and services, integrated working capital management and treasury solutions and investment banking services to clients worldwide through our network of offices and client relationship teams along with various product partners. Our clients include multinationals, middle-market and business banking and middle-market companies, correspondent banks, commercial real estate firms and governments.governments, and are generally defined as companies with annual sales up to $2 billion. Our lending products and services include commercial loans and commitment facilities, real estate lending, leasing, trade finance, short-term credit facilities, asset-based lending and indirect consumer loans. Our capital management and treasury solutions include treasury management, foreign exchange and short-term investing options. Our investment banking
Global Commercial Bankingrecorded 2010 net income of $3.2 billion compared to a 2009 net loss of $290 million, with the improvement driven by lower credit costs.
Net interest income remained relatively flat as growth in average deposits from our existing clients of $18.7 billion, or 14 percent, was offset by a lower net interest income allocation related to ALM activities. In addition, net interest income benefited from credit pricing discipline, which negated the impact of the $25.8 billion, or 11 percent, decline in average loan balances.
Noninterest income decreased $270 million, or nine percent, largely due to additional costs related to our agreement to purchase certain retail automotive loans. For further information, seeNote 14 – Commitments and Contingenciesto the Consolidated Financial Statements.
The provision for credit losses decreased $5.8 billion to $2.0 billion for 2010 compared to 2009. The decrease was driven by improvements primarily in the commercial real estate portfolios reflecting stabilizing values and in the

U.S. commercial portfolio resulting from improved borrower credit profiles. Additionally, all other portfolios experienced lower net charge-offs attributable to more stable economic conditions.
Global Commercial Banking Revenue
Global Commercial Bankingrevenues can also be categorized as treasury services providerevenue primarily from capital and treasury management, and business lending revenue derived from credit related products and services. Treasury services revenue for 2010 was $4.3 billion, an increase of $62 million compared to 2009. Revenue growth was driven by net interest income from increased deposits, partially offset by lower treasury service charges. As clients manage through current economic conditions, we have seen usage of certain treasury services decline and increased conversion of paper to electronic services. These actions combined with our clients leveraging compensating balances to offset fees have decreased treasury service charges. Business lending revenue for 2010 was $6.6 billion, a decrease of $299 million compared to 2009, largely due to additional costs related to our agreement to purchase certain retail automotive loans. Despite client deleveraging in the first half of 2010 and continued low loan demand, commercial and industrial loan balances began to stabilize and show moderate growth during the latter part of 2010. Commercial real estate loan balances declined due to continued client deleveraging and our management of nonperforming loans. Credit pricing discipline negated the impact of the decline in average loan balances on net interest income.


44     Bank of America 2010


Global Banking & Markets
             
(Dollars in millions) 2010  2009  % Change 
Net interest income (1)
 $7,989  $9,553   (16)%
Noninterest income:            
Service charges  2,126   2,044   4 
Investment and brokerage services  2,441   2,662   (8)
Investment banking income  5,408   5,927   (9)
Trading account profits  9,689   11,803   (18)
All other income  845   634   33 
             
Total noninterest income  20,509   23,070   (11)
             
Total revenue, net of interest expense  28,498   32,623   (13)
             
Provision for credit losses  (155)  1,998   (108)
Noninterest expense  18,038   15,921   13 
             
Income before income taxes  10,615   14,704   (28)
Income tax expense (1)
  4,296   4,646   (8)
             
Net income
 $6,319  $10,058   (37)
             
             
Return on average equity  12.01%  20.32%    
Return on average tangible shareholders’ equity  15.05   25.82     
Efficiency ratio (1)
  63.30   48.80     
             
Balance Sheet
            
             
Average
            
Total trading-related assets $499,433  $508,163   (2)%
Total loans and leases  98,604   110,811   (11)
Total market-based earning assets  504,360   481,376   5 
Total earning assets  598,613   588,252   2 
Total assets  758,958   778,870   (3)
Total deposits  109,792   104,868   5 
Allocated equity  52,604   49,502   6 
             
Year end
            
Total trading-related assets $413,563  $410,755   1%
Total loans and leases  100,010   95,930   4 
Total market-based earning assets  416,174   404,315   3 
Total earning assets  509,269   498,765   2 
Total assets  655,535   649,876   1 
Total deposits  111,447   102,093   9 
Allocated equity  49,054   53,260   (8)
             
(1)FTE basis

GBAMprovides financial products, advisory services, financing, securities clearing, settlement and custody services globally to our institutional investor clients in support of their investing and trading activities. We also work with our commercial and corporate issuer clients withto provide debt and equity underwriting and distribution capabilities, as well as merger-related and other advisory services.services, and risk management products using interest rate, equity, credit, currency and commodity derivatives, foreign exchange, fixed-income and mortgage-related products. As a result of our market-making activities in these products, we may be required to manage positions in government securities, equity and equity-linked securities, high-grade and high-yield corporate debt securities, commercial paper, MBS and asset-backed securities (ABS). Underwriting debt and equity issuances, securities research and certain market-based activities are executed through our global broker/dealer affiliates which are our primary dealers in several countries.Global BankingGBAMis a leader in the global distribution of fixed-income, currency and energy commodity products and derivatives.GBAMalso has one of the largest equity trading operations in the world and is a leader in the origination and distribution of equity and equity-related products. Our corporate banking services provide a wide range of lending-related products and services, integrated working capital management and treasury solutions to clients through our network of offices and client relationship teams along with various product partners. Our corporate clients are generally defined as companies with annual sales greater than $2 billion.

GBAMalso includes the results of our merchant servicesprocessing joint venture, as discussed below, and the economic hedgingBanc of our credit risk to certain exposures utilizing various risk mitigation tools. Our clients are supported in offices throughout the world that are divided into four distinct geographic regions: U.S. and Canada; Asia Pacific; Europe, Middle East and Africa; and Latin America. For more information on our foreign operations, see Foreign Portfolio beginning on page 74.

During the second quarter ofAmerica Merchant Services, LLC.

In 2009, we entered into a joint venture agreement with First Data Corporation (First Data) to form Banc of America Merchant Services, LLC. The joint venture provides payment solutions, including credit, debit and prepaid cards, and check ande-commerce payments to merchants ranging from small businesses to corporate and commercial clients worldwide. We contributed approximately 240,000 merchant relationships, a sales force of approximately 350 associates, and the use of theIn addition to Bank of America brand name.and First Data, contributed

approximately 140,000 merchant relationships, 200 sales associates and state of the art technology. The joint venture and clients benefit from both companies’ comprehensive suite of leading payment solutions capabilities. At December 31, 2009, we owned 46.5 percent ofremaining stake was initially held by a third party. During 2010, the joint venture and we account for our investment under the equity method of accounting. The third party investor has the right to put theirsold its interest to the joint venture, which would have the effect ofthus increasing the Corporation’s ownership interest in the joint venture to 49 percent. In connection with the formation ofFor additional information on the joint venture we recordedagreement, seeNote 5 – Securitiesto the Consolidated Financial Statements.

Net income decreased $3.7 billion to $6.3 billion due to a pre-tax$4.1 billion decline in revenues and an increase in noninterest expenses of $2.1 billion. This was partially offset by lower provision expense reflecting improvement in borrower credit profiles. Additionally, income tax expense was negatively affected from a change in the U.K. corporate income tax rate that impacted the carrying value of the deferred tax asset by approximately $390 million.
Net interest income decreased $1.6 billion to $8.0 billion due to tighter spreads on trading related assets and lower average loan and lease balances, partially offset by higher earned spreads on deposits. The $12.2 billion, or 11 percent, decline in average loans and leases was driven by reduced client demand. Net interest income is comprised of both markets-based revenue


Bank of America 2010     45


from our trading activities and banking-based revenue which is related to our credit and treasury service products.
Noninterest income decreased $2.6 billion due in part to the prior year gain of $3.8 billion which represents the excess of fair value over the carrying value of our contributed merchant processing business.

Global Banking net income decreased $1.5 billion, or 34 percent, to $3.0 billion in 2009 compared to 2008 as an increase in revenue was more than offset by higher provision for credit losses and noninterest expense.

Net interest income increased $495 million, or five percent, as average deposits grew $33.7 billion, or 19 percent, driven by deposit growth as our clients remain very liquid. In addition, average deposit growth benefited from a flight-to-safety in late 2008. Net interest income also benefited from improved loan spreads on new, renewed and amended facilities. These increases were partially offset by a $3.3 billion, or one percent, decline in average loan balances due to decreased client demand as clients are deleveraging and capital markets began to open up so that corporate clients could access other funding sources. In addition, net interest income was negatively impacted by a lower net interest income allocation from ALM activities and increased nonperforming loans.

Noninterest income increased $5.7 billion, or 95 percent, to $11.8 billion, mainly driven by the $3.8 billion pre-tax gain related to the contribution of the merchant processing business into a joint venture, higher investment banking income and service charges. Investment banking income increased $1.7 billion due to the acquisition of Merrill Lynch and strong growth in debt and equity capital markets fees. Service charges increased $721 million, or 22 percent, driven by the Merrill Lynch acquisition and the impact of fees charged for services provided to the merchant processing joint venture. All other income increased $3.3 billion compared toWhile overall sales and trading revenue were flatyear-over-year, the prior year from the gain related to the contribution of the merchant processing business. All other income also includes our proportionate share of the joint venture net income, where prior to formation of the joint venture these activities were reflected in card income. In addition, noninterest income benefited in 2008 fromGlobal Banking’s share of the Visa IPO gain.

The provision for credit losses increased $5.7 billion to $8.8 billionmarket in 2009 compared to 2008 primarily drivenwas more favorable but results were muted by higher net charge-offs and reserve additions in the commercial real estate and commercial – domestic portfolios resulting from deterioration across a broad range of property types, industries and borrowers.

losses on legacy positions. Noninterest expense increased $2.9$2.1 billion or 43 percent, to $9.5 billion, primarily attributable to the Merrill Lynch acquisitiondriven mainly by higher compensation costs from investments in infrastructure, professional fees and higher FDIC insurance and special assessment costs. These items were partially offset by a reduction in certain merchant-related expenses that are now incurred by the joint venture and a change in compensation that delivers a greater portionlitigations expense.

Components of incentive pay over time. In addition, noninterest expense in 2008 also included benefits associated with the Visa IPO.

Global Banking & Markets

Sales and Trading Revenue

Global Bankingevaluates its

Sales and trading revenue is segregated into fixed-income including investment and non-investment grade corporate debt obligations, commercial mortgage-backed securities (CMBS), RMBS and CDOs; currencies including interest rate and foreign exchange contracts; commodities including primarily futures, forwards, swaps and options; and equity income from two primary client views, global commercial bankingequity-linked derivatives and global corporate and investment banking. Global commercial banking primarily includes revenue related to our commercial and business banking clients who are generally defined as companies with sales between $2 million and $2 billion including middle-market and multinational clients as well as commercial real estate clients. Global

cash equity activity.

         
(Dollars in millions) 2010  2009 
Sales and trading revenue(1, 2)
        
Fixed income, currencies and commodities (FICC) $13,158  $12,723 
Equity income  4,145   4,902 
         
Total sales and trading revenue
 $17,303  $17,625 
         
Bank(1)Includes $274 million and $353 million of America 2009net interest income on a FTE basis for 2010 and 2009.
(2)33Includes $2.4 billion and $2.6 billion of investment and brokerage services revenue for 2010 and 2009.


corporate

Sales and investment banking primarily includestrading revenue relateddecreased $322 million, or two percent, to our large corporate clients including multinationals which are generally defined as companies with sales$17.3 billion in excess2010 compared to 2009 due to increased investor risk aversion and more favorable market conditions in the prior year. We recorded net credit spread gains on derivative liabilities during 2010 of $2 billion. Additionally, global corporate and investment banking revenue also includes debt and equity underwriting and merger-related advisory services (net$242 million compared to losses of revenue sharing primarily withGlobal Markets). The following table presents further detail regardingGlobal Banking revenue.

(Dollars in millions) 2009    2008

Global Banking revenue


Global commercial banking

 $15,209    $11,362

Global corporate and investment banking

  7,826     5,434

Total Global Banking revenue

 $23,035    $16,796

Global Banking$801 million in 2009.

FICC revenue increased $6.2 billion to $23.0 billion in 2009 compared to 2008.Global Bankingrevenue consists of credit-related revenue derived from lending-related products and services, treasury services-related revenue primarily from capital and treasury management, and investment banking income.

Global commercial banking revenue increased $3.8 billion, or 34 percent, primarily driven by the gain from the contribution of the merchant processing business to the joint venture.

Credit-related revenue within global commercial banking increased $960$435 million to $6.7$13.2 billion due to improved loan spreads on new, renewed and amended facilities and the Merrill Lynch acquisition. Average loans and leases decreased $3.7 billion to $219.0 billion as increased balances due to the Merrill Lynch acquisition were more than offset by reduced client demand.

Treasury services-related revenue within global commercial banking increased $2.9 billion to $8.5 billion driven by the $3.8 billion gain related to the contribution of the merchant services business to the joint venture,significantly lower market disruption charges, partially offset by lower net interestrevenue in our rates and currencies, commodities and credit products due to diminished client activity and European debt deterioration. Gains on legacy assets, primarily in trading account profits (losses) and other income and(loss), were $321 million for 2010 compared to write-downs of $3.8 billion in 2009. Legacy losses in the absence of the 2008 gain associated with the Visa IPO. Average treasury services deposit balances increased $22.7 billion to $130.9 billionprior year were primarily driven by clients managing their balances.

Global corporate and investment banking revenue increased $2.4 billion in 2009 compared to 2008 driven primarily by the Merrill Lynch acquisition which resulted in increased debt and equity capital markets fees, and higher net interest income due mainly to growth in average deposits.

our CMBS, CDO and leveraged finance exposure.

Credit-related revenue within global corporate and investment banking increased $387 million to $2.9Equity income was $4.1 billion in 20092010 compared to 2008 driven by improved loan spreads and the Merrill Lynch acquisition, partially offset by the adverse impact of increased nonperforming loans and the higher cost of credit hedging. Average loans and leases remained essentially flat as reduced demand offset the impact of the Merrill Lynch acquisition.

Treasury services-related revenue within global corporate and investment banking decreased $438 million to $2.5$4.9 billion in 2009 driven by lower net interest income, service feesa decline in client flows and card income. Average deposit balances increased $11.1 billion to $80.4 billion during 2009 primarily due to clients managing their balances.market conditions in the derivatives business.

Investment Banking Income

Product specialists withinGlobal MarketsGBAM work closely withGlobal Banking on underwritingunderwrite and distribution ofdistribute debt and equity securitiesissuances and certain other products.loan products, and provide advisory services. To reflect the efforts ofGlobal Markets andGlobal Banking in servicing our clients with the best product capabilities, we allocate revenue to the two segments based on relative contribution. Therefore, to provide a complete discussion of our consolidated investment banking income, we have included the following table thatbelow presents total investment banking income for the Corporation.

(Dollars in millions) 2009     2008 

Investment banking income


Advisory(1)

 $1,167      $546  

Debt issuance

  3,124       1,539  

Equity issuance

  1,964       624  
  6,255       2,709  

Offset for intercompany fees(2)

  (704     (446

Total investment banking income

 $5,551      $2,263  
Corporation of which, 93 percent in 2010 and 94 percent in 2009 is recorded inGBAM with the remainder reported inGWIMandGlobal Commercial Banking.
         
(Dollars in millions) 2010  2009 
Investment banking income
        
Advisory (1)
 $1,019  $1,167 
Debt issuance  3,267   3,124 
Equity issuance  1,499   1,964 
         
   5,785   6,255 
Offset for intercompany fees (2)
  (265)  (704)
         
Total investment banking income
 $5,520  $5,551 
         
(1)

Advisory includes fees on debt and equity advisory services and mergermergers and acquisitions.

(2)

The

Represents the offset to fees paid on the Corporation’s transactions.

Investment banking income increased $3.3 billion to $5.6 billion

Equity issuance fees decreased $465 million in 2009 compared to 2008. The increase was largely due to the Merrill Lynch acquisition2010 primarily reflecting lower levels of industry-wide activity and favorable market conditions for debt and equity issuances.a decline in market-based revenue pools. Debt issuance fees increased $1.6 billion due primarily to$143 million consistent with a five percent increase in global fee pools in 2010. Strong performance within debt issuance was mainly driven by higher revenues within leveraged finance and investment grade bond issuances. Equity issuance fees increased $1.3 billion as we benefited from the increased size of the investment banking platform.finance. Advisory fees increased $621decreased $148 million attributable to the larger advisory platform partially offset by decreased merger and acquisitions activity.

during 2010.

34Bank of America 2009


Global MarketsCorporate Banking

(Dollars in millions) 2009   2008 

Net interest income(1)

 $6,120    $5,151  

Noninterest income:


Investment and brokerage services

  2,552     752  

Investment banking income

  2,850     1,337  

Trading account profits (losses)

  11,675     (5,809

All other income (loss)

  (2,571   (5,262

Total noninterest income (loss)

  14,506     (8,982

Total revenue, net of interest expense

  20,626     (3,831

Provision for credit losses

  400     (50

Noninterest expense

  10,042     3,906  

Income (loss) before income taxes

  10,184     (7,687

Income tax expense (benefit)(1)

  3,007     (2,771

Net income (loss)

 $7,177    $(4,916

Return on average equity

  23.33   n/m  

Efficiency ratio(1)

  48.68     n/m  

Balance Sheet


Average


Total trading-related assets(2)

 $507,648    $338,074  

Total market-based earning assets

  481,542     360,667  

Total earning assets

  490,406     366,195  

Total assets

  656,621     427,734  

Allocated equity

  30,765     12,839  

Year end


Total trading-related assets(2)

 $411,212    $244,174  

Total market-based earning assets

  404,467     237,452  

Total earning assets

  409,717     243,275  

Total assets

  538,456     306,693  
(1)

FTE basis

(2)

Includes assets which are not considered earning assets (i.e., derivative assets).

n/m

= not meaningful

Global Markets provides financial products, advisory services, financing, securities clearing, settlement and custody services globally to our institutional investor clients in support of their investing and trading activities. We also

Client relationship teams along with product partners work with our commercial and corporate clientscustomers to provide debt and equity underwriting and distribution capabilities and risk management products using interest rate, equity, credit, currency and commodity derivatives, foreign exchange, fixed income and mortgage-related products. The business may take positions in thesethem with a wide range of lending-related products and participateservices, integrated working capital management and treasury solutions through the Corporation’s global network of offices. Global Corporate Banking lending revenues of $3.4 billion for 2010 increased $567 million compared to 2009. The increase in market-making activities dealing2010 is primarily due to higher fees and the negative impact of hedge results in government securities, equity and equity-linked securities, high-grade and high-yield corporate debt securities, commercial paper, MBS and asset-backed securities (ABS). Underwriting debt and equity, securities research and certain market-based activities are executed through our global broker/dealer affiliates which are our primary dealers in several countries.Global Markets is2009. Treasury services revenue of $2.8 billion for 2010 decreased $3.9 billion primarily due to a leader$3.8 billion pre-tax gain in the global distribution of fixed income, currency and energy commodity products and derivatives.Global Markets also has oneprior year related to the contribution of the largest equity trading operations in the world and is a leader in the origination and distribution of equity and equity-related products.

Net income increased $12.1 billion to $7.2 billion in 2009 comparedmerchant processing business to a loss of $4.9 billionjoint venture. Equity investment income from the joint venture was $133 million for 2010. During 2010, we sold our trust administration business and in 2008 as increased noninterest income driven by trading account profits was partially offset by higher noninterest expense.

Net interest income, almost all of which is market-based, increased $969 million to $6.1 billion due to growth in average market-based earning assets which increased $120.9 billion or 34 percent, driven primarily byconnection with the Merrill Lynch acquisition.

Noninterest income increased $23.5 billion duesale provided certain commitments to the Merrill Lynch acquisition, favorable core trading resultsacquirer. SeeNote 14 —Commitments and decreased write-downs on legacy assets partially offset by negative credit valuation adjustments on derivative liabilities due to improvement in our credit spreads in 2009. Noninterest expense increased $6.1 billion, largely attributable Contingenciesto the Merrill Lynch acquisition. This increase was partially offset by a change in compensation that delivers a greater portionConsolidated Financial Statements for additional information.


46     Bank of incentive pay over time.

America 2010

Sales and Trading Revenue

Global Marketsrevenue is primarily derived from sales and trading and investment banking activities which are shared betweenGlobal Markets andGlobal Banking.Global Banking originates certain deal-related transactions with our corporate and commercial clients that are executed and distributed byGlobal Markets. In order to reflect the relative contribution of each business segment, a revenue-sharing agreement has been implemented which attributes revenue accordingly (see page 34 for a discussion of investment banking fees on a consolidated basis). In addition, certain gains and losses related to write-downs on legacy assets and select trading results are also allocated or shared betweenGlobal Markets andGlobal Banking. Therefore, in order to provide a complete discussion of our sales and trading revenue, the following table and related discussion present total sales and trading revenue for the consolidated Corporation. Sales and trading revenue is segregated into fixed income (investment and noninvestment grade corporate debt obligations, commercial mortgage-backed securities (CMBS), residential mortgage-backed securities (RMBS) and CDOs), currencies (interest rate and foreign exchange contracts), commodities (primarily futures, forwards, swaps and options) and equity income from equity-linked derivatives and cash equity activity.

(Dollars in millions) 2009    2008 

Sales and trading revenue(1, 2)


Fixed income, currencies and commodities (FICC)

 $12,727    $(7,625

Equity income

  4,901     743  

Total sales and trading revenue

 $17,628    $(6,882
(1)

Includes $356 million and $257 million of net interest income on a FTE basis for 2009 and 2008.

(2)

Includes $1.1 billion and $1.2 billion of write-downs on legacy assets that were allocated toGlobal Banking for 2009 and 2008.

Sales and trading revenue increased $24.5 billion to $17.6 billion in 2009 compared to a loss of $6.9 billion in 2008 due to the addition of Merrill Lynch and the improving economy. Write-downs on legacy assets in 2009 were $3.8 billion with $2.7 billion included inGlobal Markets as compared to $10.5 billion in 2008 with $9.3 billion recorded inGlobal Markets. Further, we recorded negative net credit valuation adjustments on derivative liabilities of $801 million resulting from improvements in our credit spreads in 2009 compared to a gain of $354 million in 2008.

FICC revenue increased $20.4 billion to $12.7 billion in 2009 compared to 2008 primarily driven by credit and structured products which continued to benefit from improved market liquidity and tighter credit spreads as well as new issuance capabilities.

During 2009, we incurred $2.2 billion of losses resulting from our CDO exposure which includes our super senior, warehouse, sales and trading positions, hedging activities and counterparty credit risk valuations. This compares to $4.8 billion in CDO-related losses for 2008. Included in the above losses were $910 million and $1.1 billion of losses in 2009 and 2008 related to counterparty risk on our CDO-related exposure. Also included in the above losses were other-than-temporary impairment charges of $1.2 billion in 2009 compared to $3.3 billion in 2008 related to CDOs and retained positions classified as AFS debt securities. See the following detailed CDO exposure discussion.

During 2009 we recorded $1.6 billion of losses, net of hedges, on CMBS funded debt and forward finance commitments compared to losses of $944 million in 2008. These losses were concentrated in the more difficult to hedge floating-rate debt. In addition, we recorded $670 million in losses associated with equity investments we made in acquisition-related financing transactions compared to $545 million in losses in the prior year. At December 31, 2009 and 2008, we held $5.3 billion and $6.9 billion of funded and unfunded CMBS exposure of which $4.4 billion and $6.0 billion were primarily floating-rate


Bank of America 200935


acquisition-related financings to major, well-known operating companies. CMBS exposure decreased as $4.1 billion of funded CMBS debt acquired in the Merrill Lynch acquisition was partially offset by a transfer of $3.8 billion of CMBS funded debt to commercial loans held for investment as we plan to hold these positions and, to a lesser extent, by loan sales and paydowns.

We incurred losses in 2009 on our leveraged loan exposures of $286 million compared to $1.1 billion in 2008. At December 31, 2009, the carrying value of our leveraged funded positions held for distribution was $2.4 billion, which included $1.2 billion from the Merrill Lynch acquisition, compared to $2.8 billion at December 31, 2008, which did not include Merrill Lynch. At December 31, 2009, 99 percent of the carrying value of the leveraged funded positions was senior secured.

We recorded a loss of $100 million on auction rate securities (ARS) in 2009 compared to losses of $898 million in 2008 which reflects stabilizing valuations on ARS during the year. We have agreed to purchase ARS at par from certain customers in connection with an agreement with federal and state securities regulators. During 2009, we purchased a net $3.8 billion of ARS from our customers and at December 31, 2009, our outstanding buyback commitment was $291 million.

Equity products sales and trading revenue increased $4.2 billion to $4.9 billion in 2009 compared to 2008 driven by the addition of Merrill Lynch’s trading and financing platforms.

Collateralized Debt Obligation Exposure

CDO vehicles hold diversified pools of fixed incomefixed-income securities and issue multiple tranches of debt securities including commercial paper, mezzanine and equity securities. Our CDOCDO-related exposure can be divided into funded and unfunded super senior liquidity commitment exposure, other super senior exposure (i.e., cash positions and derivative contracts), warehouse, and sales and trading positions. For more information on our CDO liquidity commitments,positions, seeNote 98 – Securitizations and Other Variable Interest Entitiesto the Consolidated Financial Statements. Super senior exposure represents the most senior class of commercial paper or notes that are issued by the CDO vehicles. These financial instruments benefit from the subordination of all other securities issued by the CDO vehicles.

In 2010, we incurred $573 million of losses resulting from our CDO-related exposure compared to $2.2 billion in CDO-related losses in 2009. This included $357 million in 2010 related to counterparty risk on our CDO-related exposure compared to $910 million in 2009. Also included in these losses wereother-than-temporary

impairment (OTTI) write-downs of $251 million in 2010 compared to losses of $1.2 billion in 2009 related to CDOs and retained positions classified as AFS debt securities.

As presented in the following table below, at December 31, 2009,2010, our hedged and unhedged super senior CDO exposure before consideration of insurance, net of write-downs, was $2.0 billion compared to $3.6 billion.

billion at December 31, 2009.


Super Senior Collateralized Debt Obligation Exposure

December 31, 2009

(Dollars in millions) Subprime (1)    Retained
Positions
    

Total

Subprime

    Non-Subprime (2)    Total

Unhedged

 $938    $528    $1,466    $839    $2,305

Hedged (3)

  661          661     652     1,313

Total

 $1,599    $528    $2,127    $1,491    $3,618
                      
   December 31, 2010 
      Retained
  Total
       
(Dollars in millions)  Subprime (1)  Positions  Subprime  Non-Subprime (2)  Total 
Unhedged  $721  $156  $877  $338  $1,215 
Hedged (3)
   583      583   189   772 
                      
Total
  $1,304  $156  $1,460  $527  $1,987 
                      
(1)

Classified as subprime when subprime consumer real estate loans make up at least 35 percent of the original net exposure value of the underlying collateral.

(2)

Includes highly ratedhighly-rated collateralized loan obligations and CMBS super senior exposure.

(3)

Hedged amounts are presented at carrying value before consideration of the insurance.

We value our CDO structures using market-standard models to model the averagespecific collateral composition and cash flow structure of all prices obtained from either external pricing services or offsetting tradeseach deal. Key inputs to the models are prepayment rates, default rates and severities for approximately 89 percenteach collateral type, and 77 percent of the CDO exposure and related retained positions. The majority of the remaining positions where no pricing quotes were available were valued using matrix pricing and projected cash flows.other relevant contractual features. Unrealized losses recorded in accumulated OCI on super senior cash positions and retained positions from liquidated CDOs in aggregate increased $88decreased $382 million during 20092010 to $104$466 million at December 31, 2009.

2010.

At December 31, 2009,2010, total subprime super senior unhedged exposure of $1.466 billion was carried at 15 percent and the $839 million of non-subprime unhedged exposure was carried at 51 percent of their original net exposure amounts. Net hedged subprime super senior exposure of $661$2.0 billion was marked at 18 percent, including $156 million was carriedof retained positions from

liquidated CDOs marked at 1342 percent, $527 million of non-subprime exposure marked at 39 percent and the $652 millionremaining $1.3 billion of hedged non-subprime super seniorsubprime exposure was carriedmarked at 6414 percent of itsthe original net exposure.

The following table presents the carrying values of our subprime net exposures including subprime collateral content and percentages of certain vintages.


Unhedged Subprime Super Senior Collateralized Debt Obligation Carrying Values

December 31, 2009


Subprime

Net Exposure

    Carrying Value
as a Percent of
Original Net
Exposure
   Subprime
Content of
Collateral (1)
   

   Vintage of Subprime Collateral   

 
(Dollars in millions)         Percent in
2006/2007
Vintages
   Percent in
2005/Prior
Vintages
 

Mezzanine super senior liquidity commitments

 $88    7  100  85  15

Other super senior exposure


High grade

  577    20    43    23    77  

Mezzanine

  272    16    34    79    21  

CDO-squared

  1    1    100    100      

Total other super senior

  850            

Total super senior

  938    15        

Retained positions from liquidated CDOs

  528    15    28    22    78  

Total

 $1,466    15              
(1)

Based on current net exposure value.

36Bank of America 2009


At December 31, 2009, we held purchased insurance on our subprime and non-subprime super senior CDO exposure with a notional value of $5.2 billion and $1.0 billion from monolines and other financial guarantors. Monolines provided $3.8 billion of the purchased insurance in the form of CDS, total return swaps or financial guarantees. In addition, we held collateral in the form of cash and marketable securities of

amounts.

$1.1 billion related to our non-monoline purchased insurance. In the case of default, we look to the underlying securities and then to recovery on purchased insurance. The table below providespresents our original total notional,mark-to-market receivable counterpartyand credit valuation adjustment for credit default swaps and other positions with monolines. The receivable for super senior CDOs reflects hedge gains (write-downs)recorded from inception of the contracts in connection with write-downs on insurance purchased from monolines.

the super senior CDOs in the table above.


Credit Default Swaps with Monoline Financial Guarantors

                           
   December 31, 2010   December 31, 2009 
      Other
         Other
    
   Super Senior
  Guaranteed
      Super Senior
  Guaranteed
    
(Dollars in millions)  CDOs  Positions  Total   CDOs  Positions  Total 
Notional  $3,241  $35,183  $38,424   $3,757  $38,834  $42,591 
                           
                           
Mark-to-market or guarantor receivable
  $2,834  $6,367  $9,201   $2,833  $8,256  $11,089 
Credit valuation adjustment   (2,168)  (3,107)  (5,275)   (1,873)  (4,132)  (6,005)
                           
Total
  $666  $3,260  $3,926   $960  $4,124  $5,084 
                           
Credit valuation adjustment %   77%  49%  57%   66%  50%  54%
(Write-downs) gains  $(386) $362  $(24)  $(961) $98  $(863)
                           

December 31, 2009

(Dollars in millions) 

Super

Senior CDOs

   Other
Guaranteed
Positions
   Total 

Notional

 $3,757    $38,834    $42,591  

Mark-to-market or guarantor receivable

 $2,833    $8,256    $11,089  

Credit valuation adjustment

  (1,873   (4,132   (6,005

Total

 $960    $4,124    $5,084  

Credit valuation adjustment %

  66   50   54

(Write-downs) gains during 2009

 $(961  $98    $(863

Monoline wrap protection on our super senior CDOs had a notional value

Total monoline exposure, net of $3.8 billion at December 31, 2009, with a receivable of $2.8 billion and a counterparty credit valuation adjustment of $1.9adjustments, decreased $1.2 billion or 66 percent. During 2009, we recorded $961 million of counterparty credit risk-related write-downs on these positions. At December 31, 2008, the monoline wrap on our super senior CDOs had a notional value of $2.8 billion, with a receivable of $1.5 billion and a counterparty credit valuation adjustment of $1.1 billion, or 72 percent.

In addition to the monoline financial guarantor exposure related to super senior CDOs, we had $38.8 billion of notional exposure to monolines that predominantly hedge corporate collateralized loan obligation and CDO exposure as well as CMBS, RMBS and other ABS cash and synthetic exposures that were acquired from Merrill Lynch. At December 31, 2008, the monoline wrap on our other guaranteed positionsduring 2010. This decrease was $5.9 billion of notional exposure. Mark-to-market monoline derivative credit exposure was $8.3 billion at December 31, 2009 compared to $694 million at December 31, 2008. This increase was driven

by the addition of Merrill Lynch exposures as well as credit deterioration related to underlying counterparties, partially offset by positive valuation adjustments on legacy assets and terminated monoline contracts.

At December 31, 2009, the counterparty credit valuation adjustment related to non-super senior

Other CDO monoline derivative exposure was $4.1 billion which reduced our net mark-to-market exposure to $4.1 billion. We do not hold collateral against these derivative exposures. Also, during 2009 we recognized gains of $113 million for counterparty credit risk related to these positions.

Exposure

With the Merrill Lynch acquisition, we acquired a loan with a carrying value of $4.4$4.2 billion as of December 31, 20092010 that is collateralized by U.S. super senior ABS CDOs. Merrill Lynch originally provided financing to the borrower

for an amount equal to approximately 75 percent of the fair value of the collateral. The loan, which is recorded inAll Other, has full recourse to the borrower and all scheduled payments on the loan have been received. Events of default under the loan are customary events of default, including failure to pay interest when due and failure to pay principal at maturity. Collateral for the loan is excluded from our CDO exposure discussions and the applicable tables.


Bank of America 2010     47


Global Wealth & Investment Management
             
(Dollars in millions) 2010  2009  % Change 
Net interest income (1)
 $5,831  $5,988   (3)%
Noninterest income:            
Investment and brokerage services  8,832   8,425   5 
All other income  2,008   1,724   16 
             
Total noninterest income  10,840   10,149   7 
             
Total revenue, net of interest expense  16,671   16,137   3 
             
Provision for credit losses  646   1,061   (39)
Noninterest expense  13,598   12,397   10 
             
Income before income taxes  2,427   2,679   (9)
Income tax expense (1)
  1,080   963   12 
             
Net income
 $1,347  $1,716   (22)
             
             
Net interest yield (1)
  2.37%  2.64%    
Return on average tangible shareholders’ equity  18.40   27.63     
Return on average equity  7.44   10.35     
Efficiency ratio (1)
  81.57   76.82     
             
Balance Sheet
            
             
Average
            
Total loans and leases $99,491  $103,384   (4)%
Total earning assets  245,812   226,856   8 
Total assets  266,638   249,887   7 
Total deposits  236,350   225,979   5 
Allocated equity  18,098   16,582   9 
             
Year end
            
Total loans and leases $101,020  $99,571   1%
Total earning assets  275,598   227,796   21 
Total assets  297,301   250,963   18 
Total deposits  266,444   224,839   19 
Allocated equity  18,349   17,730   3 
             
Bank of America 200937


Global Wealth & Investment Management

  2009 
(Dollars in millions) Total     Merrill Lynch
Global Wealth
Management (1)
   U.S.
Trust
   Columbia
Management
     Other 

Net interest income(2)

 $5,564      $4,567    $1,361    $32      $(396

Noninterest income:


Investment and brokerage services

  9,273       6,130     1,254     1,090       799  

All other income (loss)

  3,286       1,684     48     (201     1,755  

Total noninterest income

  12,559       7,814     1,302     889       2,554  

Total revenue, net of interest expense

  18,123       12,381     2,663     921       2,158  
 

Provision for credit losses

  1,061       619     442              

Noninterest expense

  13,077       9,411     1,945     932       789  

Income (loss) before income taxes

  3,985       2,351     276     (11     1,369  

Income tax expense (benefit)(2)

  1,446       870     102     (4     478  

Net income (loss)

 $2,539      $1,481    $174    $(7    $891  
 

Net interest yield(2)

  2.53     2.49   2.58   n/m       n/m  

Return on average equity(3)

  13.44       18.50     3.39     n/m       n/m  

Efficiency ratio(2)

  72.16       76.01     73.03     n/m       n/m  

Year end – total assets (4)

 $254,192      $195,175    $55,371    $2,717       n/m  

  2008 
(Dollars in millions) Total     Merrill Lynch
Global Wealth
Management (1)
   U.S.
Trust
   Columbia
Management
   Other 

Net interest income(2)

 $4,797      $3,211    $1,570    $6    $10  

Noninterest income:


Investment and brokerage services

  4,059       1,001     1,400     1,496     162  

All other income (loss)

  (1,047     58     18     (1,120   (3

Total noninterest income

  3,012       1,059     1,418     376     159  

Total revenue, net of interest expense

  7,809       4,270     2,988     382     169  
 

Provision for credit losses

  664       561     103            

Noninterest expense

  4,910       1,788     1,831     1,126     165  

Income (loss) before income taxes

  2,235       1,921     1,054     (744   4  

Income tax expense (benefit)(2)

  807       711     390     (275   (19

Net income (loss)

 $1,428      $1,210    $664    $(469  $23  
 

Net interest yield(2)

  2.97     2.60   3.05   n/m     n/m  

Return on average equity(3)

  12.20       36.66     14.20     n/m     n/m  

Efficiency ratio(2)

  62.87       41.88     61.26     n/m     n/m  

Year end – total assets (4)

 $189,073      $137,282    $57,167    $2,923     n/m  
(1)

Effective January 1, 2009, as a result of the Merrill Lynch acquisition, we combined Merrill Lynch’s wealth management business and our formerPremier Banking & Investments business to formMerrill Lynch Global Wealth Management (MLGWM).

FTE basis
(2)

FTE basis

(3)

Average allocated equity forGWIM was $18.9 billion and $11.7 billion at December 31, 2009 and 2008.

(4)

Total assets include asset allocations to match liabilities (i.e., deposits).

n/m

= not meaningful

  December 31      Average Balance
(Dollars in millions) 2009    2008       2009    2008

Balance Sheet


Total loans and leases

 $99,596    $89,401     $103,398    $87,593

Total earning assets(1)

  219,866     179,319      219,612     161,685

Total assets(1)

  254,192     189,073      251,969     170,973

Total deposits

  224,840     176,186       225,980     160,702
(1)

Total earning assets and total assets include asset allocations to match liabilities (i.e., deposits).

38Bank of America 2009


GWIMprovides a wide offeringconsists of customized banking, investment and brokerage services tailored to meet the changing wealth management needs of our individual and institutional customer base. Our clients have access to a range of services offered through three primary businesses:MLGWM;Merrill Lynch Global Wealth Management (MLGWM), U.S. Trust, Bank of America Private Wealth Management (U.S. Trust);and ColumbiaRetirement Services. The results of the Retirement & Philanthropic Services
MLGWM’sadvisory business the Corporation’s approximate 34 percent economic ownership interest in BlackRock and other miscellaneous items are included inOther within GWIM.

As part of the Merrill Lynch acquisition, we added its financial advisors and an economic ownership interest of approximately 50 percent in BlackRock, a publicly traded investment management company. During 2009, BlackRock completed its purchase of Barclays Global Investors, an asset management business, from Barclays PLC which had the effect of diluting our ownership interest in BlackRock and, for accounting purposes, was treated as a sale of a portion of our ownership interest. As a result, upon the closing of this transaction, the Corporation’s economic ownership interest in BlackRock was reduced to approximately 34 percent and we recorded a pre-tax gain of $1.1 billion.

Net income increased $1.1 billion, or 78 percent, to $2.5 billion as higher total revenue was partially offset by increases in noninterest expense and provision for credit losses.

Net interest income increased $767 million, or 16 percent, to $5.6 billion primarily due to the acquisition of Merrill Lynch partially offset by a lower net interest income allocation from ALM activities and the impact of the migration of client balances during 2009 toDeposits andHome Loans &Insurance.GWIM’saverage loan and deposit growth benefited from the acquisition of Merrill Lynch and the shift of client assets from off-balance sheet (e.g., money market funds) to on-balance sheet products (e.g., deposits) partially offset by the net migration of customer relationships. A more detailed discussion regarding migrated customer relationships and related balances is provided in the followingMLGWMdiscussion.

Noninterest income increased $9.5 billion to $12.6 billion primarily due to higher investment and brokerage services income driven by the Merrill Lynch acquisition, the $1.1 billion gain on our investment in BlackRock and the lower level of support provided to certain cash funds partially offset by the impact of lower average equity market levels and net outflows primarily in the cash complex.

Provision for credit losses increased $397 million, or 60 percent, to $1.1 billion, reflecting the weak economy during 2009 which drove higher net charge-offs in the consumer real estate and commercial portfolios including a single large commercial charge-off.

Noninterest expense increased $8.2 billion to $13.1 billion driven by the addition of Merrill Lynch and higher FDIC insurance and special assessment costs partially offset by lower revenue-related expenses.

Client Assets

The following table presents client assets which consist of AUM, client brokerage assets, assets in custody and client deposits.

Client Assets

  December 31 
(Dollars in millions) 2009     2008 

Assets under management

 $749,852      $523,159  

Client brokerage assets(1)

  1,270,461       172,106  

Assets in custody

  274,472       133,726  

Client deposits

  224,840       176,186  

Less: Client brokerage assets and assets in custody included in assets under management

  (346,682     (87,519

Total net client assets

 $2,172,943      $917,658  
(1)

Client brokerage assets include non-discretionary brokerage and fee-based assets.

The increase in net client assets was driven by the acquisition of Merrill Lynch and higher equity market values at December 31, 2009 compared to 2008 partially offset by outflows that primarily occurred in cash and money market assets due to increasing interest rate pressure.

Merrill Lynch Global Wealth Management

Effective January 1, 2009, as a result of the Merrill Lynch acquisition, we combined the Merrill Lynch wealth management business and our formerPremier Banking & Investments business to formMLGWM.MLGWMprovides a high-touch client experience through a network of approximately 15,000 client-facing15,500 financial advisors focused on clients with more than $250,000 in total investable assets.MLGWMalso includes Merrill Edge, a new integrated investing and banking service which is targeted at clients with less than $250,000 in total assets. Merrill Edge provides team-based investment advice and guidance, brokerage services, a self-directed online investing platform and key banking capabilities including access to the Corporation’s branch network and ATMs. In addition,MLGWMincludes the Private Banking & Investments Group.

U.S. Trust, together withMLGWM’sPrivate Banking & Investments Group, provides comprehensive wealth management solutions targeted at wealthy and ultra-wealthy clients with investable assets of more than $5 million, as well as customized solutions to meet clients’ wealth structuring, investment management, trust and banking needs, including specialty asset management services.
Retirement Servicespartners with financial advisors to provide institutional and personal retirement solutions including investment management,

administration, recordkeeping and custodial services for 401(k), pension, profit-sharing, equity award and non-qualified deferred compensation plans. Retirement Servicesalso provides comprehensive investment advisory services to individuals, small to large corporations and pension plans. Included inRetirement Services’ results is the consolidation of a collective investment fund that did not have a significant impact on our affluent customers with a personal wealth profile of at least $250,000 of investable assets. The addition of Merrill Lynch created oneconsolidated results. For additional information, seeNote 8 – Securitizations and Other Variable Interest Entitiesto the Consolidated Financial Statements.
GWIMresults also include the BofA Global Capital Management (BACM) business, which is comprised primarily of the largest financial advisor networkscash and liquidity asset management business that Bank of America retained following the sale of the Columbia Management long-term asset management business on May 1, 2010. The historical results of Columbia Management’s long-term asset management business were transferred toAll Otheralong with the Corporation’s economic ownership interest in the world. Merrill Lynch added $10.3BlackRock.
Revenue fromMLGWMwas $13.1 billion, up four percent in revenue and $1.62010 compared to 2009. Revenue fromU.S. Trustwas $2.7 billion, up five percent in net income during2010 compared to 2009. Total client balances inRevenue fromMLGWMRetirement Services, which include deposits, AUM, client brokerage assets and other assets in custody, were $1.4 trillion at December 31,was $950 million, up four percent compared to 2009.


48     Bank of America 2010


MLGWMGWIMincludesresults include the impact of migrating customersclients and their related deposit and loan balances to or fromDeposits and,Home Loans & Insurance. Asand the ALM portfolio as presented in the table below. The directional shift of total deposits migrated was mainly due to client segmentation threshold changes. Subsequent to the date of migration, the associated net interest income, noninterest income and noninterest expense are recorded in the segmentbusiness to which the customersclients migrated. During 2009, total deposits
Migration Summary
         
(Dollars in millions) 2010  2009 
Average
        
Total deposits –GWIMfrom (to)Deposits
 $3,086  $(30,638)
Total loans –GWIMtoHome Loans & Insuranceand the ALM portfolio
  (1,405)  (12,033)
Year end
        
Total deposits –GWIMfrom (to)Deposits
 $7,232  $(42,521)
Total loans –GWIMtoHome Loans & Insuranceand the ALM portfolio
  (1,625)  (17,241)
         
Net income decreased $369 million, or 22 percent, to $1.3 billion driven in part by higher noninterest expense, the tax-related effect of $43.4the sale of the Columbia Management long-term asset management business and lower net interest income, partially offset by higher noninterest income and lower credit costs. Net interest income decreased $157 million, or three percent, to $5.8 billion were migratedas the positive impact of higher deposit levels was more than offset by lower revenue from corporate ALM activity. Noninterest income increased $691 million, or seven percent, toDepositsfromMLGWM. Conversely, during 2008, total deposits of $20.5 $10.8 billion were migrated fromDepositstoMLGWM. During 2009 and 2008, total loans of $16.6 billion and $1.7 billion were migrated from MLGWM,of which $11.5 billion and $1.6 billion were migrated toHome Loans & Insurance.These changes in 2009 were mainlyprimarily due to higher asset management fees driven by stronger markets, continued long-term assets under management flows and higher transactional activity. Provision for credit losses decreased $415 million, or 39 percent, to $646 million driven by stabilization of the portfolios and the recognition of a single large

commercial charge-off in 2009. Noninterest expense increased $1.2 billion, or 10 percent, to $13.6 billion driven by increases in revenue-related expenses, higher support costs and personnel costs associated with further investment in the business.
Client Balances
The table below presents client segmentation threshold changes resulting from the Merrill Lynch acquisition.balances which consist of assets under management, client brokerage assets, assets in custody, client deposits, and loans and leases.
Client Balances by Type


   December 31 
(Dollars in millions)  2010  2009 
Assets under management  $643,955  $749,851 
Client brokerage assets (1)
   1,480,231   1,402,977 
Assets in custody   126,203   144,012 
Client deposits   266,444   224,839 
Loans and leases   101,020   99,571 
Less: Client brokerage assets, assets in custody and deposits included in assets under management   (379,310)  (348,738)
          
Total client balances (2)
  $2,238,543  $2,272,512 
          
Bank(1)Client brokerage assets include non-discretionary brokerage and fee-based assets.
(2)2009 balance includes the Columbia Management long-term asset management business representing $114.6 billion, net of America 200939eliminations, which was sold on May 1, 2010.


Net income increased $271 million, or 22 percent,

The decrease in client balances was due to $1.5 billion as increasesthe sale of the Columbia Management long-term asset management business, outflows in noninterest incomeMLGWM’s non-fee based brokerage assets and net interest income wereoutflows in BACM’s money market assets due to the continued low rate environment, partially offset by higher noninterest expense. Net interest income increased $1.4 billion, or 42 percent, to $4.6 billion driven by higher average depositmarket levels and loan balances due to the acquisition of Merrill Lynch partially offset by a lower net interest income allocation from ALM activities, the impact of migration toDepositsinflows in client deposits, long-term assets under management (AUM) andHome Loans & Insurance, and spread compression on deposits. Noninterest income rose $6.8 billion to $7.8 billion due to an increase in investment and fee-based brokerage services income of $5.1 billion driven by the acquisition of Merrill Lynch. Provision for credit losses increased $58 million, or 10 percent, to $619 million primarily driven by increased credit costs related to the consumer real estate portfolio reflecting the weak housing market. Noninterest expense increased $7.6 billion to $9.4 billion driven by the acquisition of Merrill Lynch. In addition, noninterest expense was adversely impacted by higher FDIC insurance and special assessment costs.

assets.


U.S. Trust, Bank of America Private Wealth Management2010     49

U.S. Trust provides comprehensive wealth management solutions to wealthy and ultra-wealthy clients with investable assets of more than $3 million. In addition,U.S. Trust provides resources and customized solutions to meet clients’ wealth structuring, investment management, trust and banking needs as well as specialty asset management services (oil and gas, real estate, farm and ranch, timberland, private businesses and tax advisory). Clients also benefit from access to resources available through the Corporation including capital markets products, large and complex financing solutions, and our extensive banking platform.


Net income decreased $490 million, or 74 percent, to $174 million driven by higher provision for credit losses and lower net interest income. Net interest income decreased $209 million, or 13 percent, to $1.4 billion due to a lower net interest income allocation from ALM activities partially offset by the shift of client assets from off-balance sheet (e.g., money market funds) to on-balance sheet products (e.g., deposits). Noninterest income decreased $116 million, or eight percent, to $1.3 billion driven by lower investment and brokerage services income due to lower valuations in the equity markets and a decline in transactional revenues offset by the addition of the Merrill Lynch trust business and lower losses related to ARS. Provision for credit losses increased $339 million to $442 million driven by higher net charge-offs, including a single large commercial charge-off, and higher reserve additions in the commercial and consumer real estate portfolios. Noninterest expense increased $114 million, or six percent, to $1.9 billion due to higher FDIC insurance and special assessment costs and the addition of the Merrill Lynch trust business which were partially offset by cost containment strategies and lower revenue-related expenses.

Columbia Management

Columbia is an asset management business serving the needs of both institutional clients and individual customers.Columbia provides asset management products and services including mutual funds and separate accounts.Columbia mutual fund offerings provide a broad array of investment strategies and products including equity, fixed income (taxable and nontaxable) and money market (taxable and nontaxable) funds.Columbia distributes its products and services to institutional clients and individuals directly throughMLGWM, U.S. Trust, Global Banking and nonproprietary channels including other brokerage firms.

During 2009, the Corporation reached an agreement to sell the long-term asset management business ofColumbia to Ameriprise Financial, Inc., for consideration of approximately $900 million to $1.2 billion subject to certain adjustments including, among other factors, AUM net flows. This includes the management ofColumbia’s equity and fixed

income mutual funds and separate accounts. The transaction is expected to close in the second quarter of 2010, and is subject to regulatory approvals and customary closing conditions, including fund board, fund shareholder and other required client approvals.

Columbia recorded a net loss of $7 million compared to a net loss of $469 million in 2008. Net revenue increased $539 million due to a reduction in losses of $917 million related to support provided to certain cash funds offset by lower investment and brokerage services income of $406 million. The decrease in investment and brokerage services income was driven by the impact of lower average equity market levels and net outflows primarily in the cash complex. Noninterest expense decreased $194 million driven by lower revenue-related expenses, such as lower sub-advisory, distribution and dealer support expenses, and reduced personnel-related expenses.

Cash Funds Support

Beginning in the second half of 2007, we provided support to certain cash funds managed withinColumbia.The funds for which we provided support typically invested in high quality, short-term securities with a portfolio weighted-average maturity of 90 days or less, including securities issued by SIVs and senior debt holdings of financial services companies. Due to market disruptions, certain investments in SIVs and senior debt securities were downgraded by the ratings agencies and experienced a decline in fair value. We entered into capital commitments under which the Corporation provided cash to these funds in the event the net asset value per unit of a fund declined below certain thresholds. All capital commitments to these cash funds have been terminated. In 2009 and 2008, we recorded losses of $195 million and $1.1 billion related to these capital commitments.

Additionally, during 2009 and 2008, we purchased $1.8 billion and $1.7 billion of certain investments from the funds. As a result of these purchases, certain cash funds, including the Money Market Funds, managed withinColumbiano longer have exposure to SIVs or other troubled assets. At December 31, 2009 and 2008, we held AFS debt securities with a fair value of $902 million and $698 million of which $423 million and $279 million were classified as nonperforming AFS debt securities and had $171 million and $272 million of related unrealized losses recorded in accumulated OCI. The decline in value of these securities was driven by the lack of market liquidity and the overall deterioration of the financial markets. These unrealized losses are recorded in accumulated OCI as we expect to recover the full principal amount of such investments and it is more-likely-than-not that we will not be required to sell the investments prior to recovery.

Other

Other includes the results of the Retirement & Philanthropic Services business, the Corporation’s approximately 34 percent economic ownership interest in BlackRock and other miscellaneous items. Our investment in BlackRock is accounted for under the equity method of accounting with our proportionate share of income or loss recorded in equity investment income.

Net income increased $868 million to $891 million compared to 2008. The increase was driven by higher noninterest income offset by higher noninterest expense and lower net interest income. Net interest income decreased $406 million due to the funding cost on a management accounting basis for carrying the BlackRock investment. Noninterest income increased $2.4 billion to $2.6 billion due to the addition of the Retirement & Philanthropic Services business from Merrill Lynch and earnings from BlackRock which contributed $1.3 billion during 2009, including the $1.1 billion gain previously mentioned. Noninterest expense increased $624 million to $789 million primarily driven by the addition of the Retirement & Philanthropic Services business from Merrill Lynch.


(Dollars in millions) 2010  2009 (2)  % Change 
Net interest income (1)
 $148  $2,029   (93)%
Noninterest income:            
Card income  2   1,138   (100)
Equity investment income  4,532   10,589   (57)
Gains on sales of debt securities  2,314   4,437   (48)
All other loss  (1,127)  (5,590)  80 
             
Total noninterest income  5,721   10,574   (46)
             
Total revenue, net of interest expense  5,869   12,603   (53)
             
Provision for credit losses  4,634   8,002   (42)
Merger and restructuring charges  1,820   2,721   (33)
All other noninterest expense  2,431   2,909   (16)
             
Loss before income taxes  (3,016)  (1,029)  (193)
Income tax benefit(1)
  (4,103)  (2,357)  (74)
             
Net income
 $1,087  $1,328   (18)
             
             
Balance Sheet
            
             
Average
            
Total loans and leases $250,956  $260,755   (4)%
Total assets (3)
  263,592   338,703   (22)
Total deposits  55,769   88,736   (37)
Allocated equity  33,964   51,475   (34)
             
Year end
            
Total loans and leases $255,155  $250,868   2%
Total assets (3)
  186,391   233,293   (20)
Total deposits  38,162   65,434   (42)
Allocated equity  44,933   23,303   92 
             
40Bank of America 2009


All Other

  2009       2008 
(Dollars in millions) Reported
Basis(1)
     Securitization
Offset(2)
    As
Adjusted
        Reported
Basis(1)
   Securitization
Offset(2)
   As
Adjusted
 

Net interest income(3)

 $(6,922    $9,250    $2,328       $(8,019  $8,701    $682  

Noninterest income:


Card income (loss)

  (895     2,034     1,139        2,164     (2,250   (86

Equity investment income

  9,020            9,020        265          265  

Gains on sales of debt securities

  4,440            4,440        1,133          1,133  

All other income (loss)

  (6,735     115     (6,620       (711   219     (492

Total noninterest income

  5,830       2,149     7,979         2,851     (2,031   820  

Total revenue, net of interest expense

  (1,092     11,399     10,307        (5,168   6,670     1,502  

Provision for credit losses

  (3,431     11,399     7,968        (3,769   6,670     2,901  

Merger and restructuring charges(4)

  2,721            2,721        935          935  

All other noninterest expense

  1,997            1,997         189          189  

Income (loss) before income taxes

  (2,379          (2,379      (2,523        (2,523

Income tax benefit(3)

  (2,857          (2,857       (1,283        (1,283

Net income (loss)

 $478      $    $478        $(1,240  $    $(1,240
(1)

Provision for credit losses represents the provision for credit losses inAll Other combined with theGlobal Card Services securitization offset.

FTE basis
(2)

The

2009 is presented on an as adjusted basis for comparative purposes, which excludes the securitization offset on net interest income is on a funds transfer pricing methodology consistent with the way funding costs are allocated to the businesses.

(3)

FTE basis

(4)

offset. For more information on merger and restructuring charges,All Other, including the securitization offset, seeNote 226 – Merger and Restructuring ActivityBusiness Segment Informationto the Consolidated Financial Statements.

(Dollars in millions) 2009    2008

Balance Sheet


Average


Total loans and leases(1)

 $155,561    $135,789

Total assets(1,2)

  239,642     77,244

Total deposits

  103,122     105,725

Allocated equity(3)

  49,015     16,563

Year end


Total loans and leases(1)

 $152,944    $136,163

Total assets(1,2)

  137,382     79,420

Total deposits

  78,618     86,888
(1)(3)

Loan amounts are net of the securitization offset of $98.5 billion and $104.4 billion for 2009 and 2008 and $89.7 billion and $101.0 billion at December 31, 2009 and 2008.

(2)

Includes elimination of segments’ excess asset allocations to match liabilities (i.e., deposits) of $511.0$621.3 billion and $413.1$537.1 billion for 2010 and 2009, and 2008 and $561.6$645.8 billion and $439.2$586.0 billion at December 31, 20092010 and 2008.

2009.
(3)

Increase in allocated equity was due to capital raises during 2009.

The 2009 presentation above ofAll Otherexcludes the securitization offset to make it comparable with the 2010 presentation. In 2009,Global Card Services is reportedwas presented on a managed basis whichwith the difference between managed and held reported as the securitization offset. With the adoption of new consolidation guidance on January 1, 2010, we consolidated all credit card securitizations that were previously unconsolidated, such thatAll Otherno longer includes athe securitization impact adjustment which hasoffset. For additional information on the effect of assuming that loans that have been securitized were not sold and presents these loanssecuritization offset included in a manner similar All Other, seeNote 26 – Business Segment Informationto the way loans that have not been sold are presented.Consolidated Financial Statements.
All Other’sOther, as presented above, consists of two broad groupings,Equity InvestmentsandOther.  results include a corresponding securitization offset which removesEquity Investmentsincludes Corporate Investments, Global Principal Investments and Strategic Investments.Othercan be segregated into the following categories: liquidating businesses, merger and restructuring charges, ALM functions (i.e., residential mortgage portfolio and investment securities) and related activities (i.e., economic hedges, fair value option on structured liabilities), and the impact of these securitized loanscertain allocation methodologies. For additional information on the other activities included in order All Other, seeNote 26 – Business Segment Informationto the Consolidated Financial Statements.

The tables below present the consolidated results oncomponents ofAll Other’sequity investments at December 31, 2010 and 2009, and also a GAAP basis (i.e., held basis). See theGlobal Card Services section beginning on page 29 for information on theGlobal Card Services managed results. The followingreconciliation ofAll OtherOther’s discussion focuses on the results on an as adjusted basis excluding the securitization offset. In additionequity investment income to the securitization offset discussed above,total consolidated equity investment income for 2010 and 2009.
All Other includes ourEquity Investments businesses and
         
  December 31 
(Dollars in millions) 2010  2009 
Corporate Investments $  $2,731 
Global Principal Investments  11,656   14,071 
Strategic and other investments  22,545   27,838 
         
Total equity investments included inAll Other
 $34,201  $44,640 
         
OtherEquity Investment Income.
         
(Dollars in millions) 2010  2009 
Corporate Investments $(293) $(88)
Global Principal Investments  2,304   1,222 
Strategic and other investments  2,521   9,455 
         
Total equity investment income included inAll Other
  4,532   10,589 
Total equity investment income included in the business segments  728   (575)
         
Total consolidated equity investment income
 $5,260  $10,014 


50     Bank of America 2010

Equity


In 2010, the $2.7 billion Corporate Investments includes equity securities portfolio, which consisted of highly liquid publicly-traded equity securities, was sold as a result of a change in our investment portfolio objectives shifting more to interest earnings and reducing our exposure to equity market risk, which contributed to the $293 million loss in 2010.
Global Principal Investments Corporate Investments and Strategic Investments. On January 1, 2009, Global

Principal Investments added Merrill Lynch’s principal investments. The combined business(GPI) is comprised of a diversified portfolio of investments in private equity, real estate and other alternative investments. These investments are made either directly in a company or held through a fund with related income recorded in equity investment income. Global Principal Investments hasGPI had unfunded equity commitments amounting toof $1.4 billion and $2.5 billion at December 31, 2010 and 2009, related to certain of these investments. For more information onDuring 2010, we sold our exposure of $2.9 billion in certain private equity funds, comprised of $1.5 billion in funded exposure and $1.4 billion in unfunded commitments in these commitments, seeNote 14 – Commitmentsfunds as we continue to reduce our equity exposure.

Affiliates of the Corporation may, from time to time, act as general partner, fund managerand/or investment advisor to certain Corporation-sponsored real estate private equity funds. In this capacity, these affiliates manageand/or provide investment advisory services to such real estate private equity funds primarily for the benefit of third-party institutional and Contingenciesprivate clients. These activities, which are recorded in GPI, inherently involve risk to us and to the Consolidated Financial Statements.

Corporate Investments primarily includes investmentsfund investors, and in publicly traded debtcertain situations may result in losses. In 2010, we recorded a loss of $163 million related to a consolidated real estate private equity fund for which we were the general partner and equity securitiesinvestment advisor. In late 2010, the general partner and funds which are accounted for as AFS marketable equity securities. investment advisor responsibilities were transferred to an independent third-party asset manager.

Strategic Investments includes investments of $9.2 billion in CCB, $5.4 billion in Itaú Unibanco Holding S.A. (Itaú Unibanco), $2.5 billion in Grupo Financiero Santander, S.A. (Santander) and other investments. Our shares of Itaú Unibanco are accounted for as AFS marketable equity securities. Our investment in Santander is accounted for under the equity method of accounting.

In 2009, we sold 19.1 billion common shares representingprimarily our entire initial investment in CCB for $10.1of $19.7 billion resultingas well as our $2.6 billion remaining investment in a pre-tax gain of $7.3 billion. During 2008, under the terms of the CCB purchase option,BlackRock. At December 31, 2010, we increased our ownership by purchasingowned approximately 10 percent, or 25.6 billion common shares for $9.2 billion. We continueof CCB. During 2010, we sold certain rights related to hold the shares purchased in 2008.

These shares are accounted for at cost, are recorded in other assets and are non-transferable until August 2011. We remain a significant shareholderour investment in CCB with an approximate 11 percent ownership interestresulting in a gain of $432 million. Also during 2010, we sold our Itaú Unibanco and intend to continue the important long-term strategic alliance with CCB originally entered into in 2005. As part of this alliance, we expect to continue to provide advice and assistance to CCB.


Bank of America 200941


The following table presents the components ofAll Other’s equity investment income and reconciliation to the total consolidated equity investment income for 2009 and 2008 and alsoAll Other’sSantander equity investments at December 31,resulting in a net gain of approximately $800 million and a portion of our interest in BlackRock resulting in a gain of $91 million.

All Otherreported net income of $1.1 billion in 2010 compared to $1.3 billion in 2009 and 2008.

Equity Investment Income

(Dollars in millions) 2009     2008 

Global Principal Investments

 $1,222      $(84

Corporate Investments

  (88     (520

Strategic and other investments

  7,886       869  

Total equity investment income included inAll Other

  9,020       265  

Total equity investment income included in the business segments

  994       274  

Total consolidated equity investment income

 $10,014      $539  
Equity Investments     
  December 31 
  2009     2008 

Global Principal Investments

 $14,071      $3,812  

Corporate Investments

  2,731       2,583  

Strategic and other investments

  17,860       25,027  

Total equity investments included in All Other

 $34,662      $31,422  

Other includes the residential mortgage portfolio associated with ALM activities, the residual impact of the cost allocation processes, merger and restructuring charges, intersegment eliminations and the results of certain businesses that are expected to be or have been sold or are in the process of being liquidated.Other also includes certain amounts associated with ALM activities, including the residual impact of funds transfer pricing allocation methodologies, amounts associated with the changedecline due to decreases in the value of derivatives used as economic hedges of interest rate and foreign exchange rate fluctuations, impact of foreign exchange rate fluctuations related to revaluation of foreign currency-denominated debt, fair value adjustments on certain structured notes, certain gains (losses) on sales of whole mortgage loans and gains (losses) on sales of debt securities. In addition,Other includes adjustments to net interest income and noninterest income tax expensecompared to remove the FTE effectprior year. The decrease in net interest income was driven by a $1.4 billion lower funding differential on certain securitizations and the impact of items (primarily low-income housing tax credits)capital raises occurring throughout 2009 that are reportedwere not allocated to the businesses. Noninterest income decreased $4.9 billion, as the prior year included a $7.3 billion gain resulting from sales of shares of CCB and an increase of $1.4 billion on a FTE basis in the business segments.Other also includes a trust services business which is a client-focused business providing trustee services and fund administration to various financial services companies.

First Republic results are also included inOther. First Republic, acquired as part of the Merrill Lynch acquisition, provides personalized, relationship-based banking services including private banking, private business banking, real estate lending, trust, brokerage and investment management. First Republic is a stand-alone bank that operates primarilynet gains on the west coast and in the northeast and caters to high-end customers. On October 21, 2009, we reached an agreement to sell First Republic to a numbersale of investors, leddebt securities. This was offset by First Republic’s existing management, Colony Capital, LLC and General Atlantic, LLC. The transaction is expected to close in the second quarternet negative fair value adjustments of 2010 subject to regulatory approval.

All Other recorded net income of $478 million$4.9 billion on structured liabilities in 2009 compared to a net losspositive adjustment of $1.2 billion$18 million in 2008 as2010 and higher total revenue driven by increases in noninterest income, net interest incomevaluation adjustments and an income tax benefit were partially offset by increased provision for credit losses, merger and restructuring charges and all other noninterest expense.

Net interest income increased $1.6 billion to $2.3 billion primarily due to unallocated net interest income related to increased liquidity driven in

part by capital raises during 2009 and the addition of First Republic in 2009.

Noninterest income increased $7.2 billion to $8.0 billion driven by higher equity investment income of $8.8 billion, increased gains on sales of debt securitiesselect investments in GPI. Also in 2010, we sold our investments in Itaú Unibanco and Santander resulting in a net gain of $3.3 billion

approximately $800 million, as well as the gains on CCB and increased card income of $1.2 billion. These items were partially offset by a decrease in all other income of $6.1 billion. The increase in equity investment income was driven by a $7.3 billion gainBlackRock. For more information on the salesales of a portion of our CCB investment and positive valuation adjustments on public and privatethese investments, within Global Principal Investments. The decrease in all other income was driven by the $4.9 billion negative credit valuation adjustments on certain Merrill Lynch structured notes due to an improvement in credit spreads during 2009. In addition, we recorded other-than-temporary impairments of $1.6 billion related to non-agency CMOs included in the ALM debt securities portfolio during the year.

Provision for credit losses increased $5.1 billion to $8.0 billion. This increase was primarily due to higher credit costs related to our ALM residential mortgage portfolio reflecting deterioration in the housing markets and the impacts of a weak economy.

Merger and restructuring charges increased $1.8 billion to $2.7 billion due to the Merrill Lynch and Countrywide acquisitions. The Merrill Lynch acquisition was accounted for in accordance with new accounting guidance for business combinations effective on January 1, 2009 requiring that acquisition-related transaction and restructuring costs be charged to expense. Previously these costs were recorded as an adjustment to goodwill. This change in accounting drove a portion of the increase. We recorded $1.8 billion of merger and restructuring charges during 2009 related to the Merrill Lynch acquisition, the majority of which related to severance and employee-related charges. The remaining merger and restructuring charges related to Countrywide and ABN AMRO North America Holding Company, parent of LaSalle Bank Corporation (LaSalle). For additional information on merger and restructuring charges and systems integrations, seeNote 25 – Merger and Restructuring ActivitySecuritiesto the Consolidated Financial Statements. All other noninterest expense increased $1.8

Provision for credit losses decreased $3.4 billion to $2.0$4.6 billion due to higher personnel costs and a $425 million charge to payimproving portfolio trends in the U.S. government to terminate its asset guarantee term sheet.

Incomeresidential mortgage portfolio partially offset by further deterioration in the Countrywide purchased credit-impaired discontinued real estate portfolio.

The income tax benefit in 2010 was $4.1 billion compared to $2.4 billion in 2009, increased $1.6 billion primarilydriven by an increase in the pre-tax loss as a result ofwell as the release of a higher portion of a deferred tax asset valuation allowance that was provided for an acquired capital loss carryforward.

allowance.

During 2010, we completed the sale of First Republic at book value and as a result, we removed $17.4 billion of loans and $17.8 billion of deposits from the Corporation’s Consolidated Balance Sheet.
Obligations
Off-Balance Sheet Arrangements and CommitmentsContractual Obligations

We have contractual obligations to make future payments on debt and lease agreements. Additionally, in the normal course of business, we enter into contractual arrangements whereby we commit to future purchases of products or services from unaffiliated parties. Obligations that are legally binding agreements whereby we agree to purchase products or services with a specific minimum quantity defined at a fixed, minimum or variable price over a specified period of time are defined as purchase obligations. Included in purchase obligations are commitments to purchase loans of $9.5$2.6 billion and vendor contracts of $9.1$7.1 billion. The most significant vendor contracts include communication services, processing services and software contracts. Other long-term liabilities include our contractual funding obligations related to the Qualified Pension Plans,Non-U.S. Pension Plans, Nonqualified Pension Plans, and Postretirement Health and Life Plans (the Plans). Obligations to the Plans are based on the current and projected obligations of the Plans, performance of the Plans’ assets and any participant contributions, if applicable. During 20092010 and 2008,2009, we contributed $414$378 million and $1.6 billion$414 million to the Plans, and we expect to make at least $346$306 million of contributions during 2010.

2011.

42Bank of America 2009


Table 9 presents total long-term debt and other obligations at December 31, 2009.

Table 9  Long-term Debt and Other Obligations

  December 31, 2009
(Dollars in millions) Due in 1
Year or Less
    Due after 1
Year through
3 Years
    Due after 3
Years through
5 Years
    Due after
5 Years
    Total

Long-term debt and capital leases

 $99,144    $124,054    $72,103    $143,220    $438,521

Operating lease obligations

  3,143     5,072     3,355     8,143     19,713

Purchase obligations

  11,957     3,667     1,627     2,119     19,370

Other long-term liabilities

  610     1,097     848     1,464     4,019

Total long-term debt and other obligations

 $114,854    $133,890    $77,933    $154,946    $481,623

Debt, lease, equity and other obligations are more fully discussed inNote 13 – Long-term DebtandNote 14 – Commitments and Contingenciesto the Consolidated Financial Statements. The Plans are more fully discussed inNote 1719 – Employee Benefit Plansto the Consolidated Financial Statements.

We enter into commitments to extend credit such as loan commitments, standby letters of credit (SBLCs) and commercial letters of credit to meet the financing needs of our customers. For a summary of the total unfunded, or off-balance sheet, credit extension commitment amounts by expiration date, see the table inNote 14 – Commitments and Contingenciesto the Consolidated Financial Statements.
Table 9 presents total long-term debt and other obligations at December 31, 2010.


Table 9 Long-term Debt and Other Obligations
                     
  December 31, 2010 
     Due after
  Due after
       
  Due in
  1 Year through
  3 Years through
  Due after
    
(Dollars in millions) 1 Year or Less  3 Years  5 Years  5 Years  Total 
Long-term debt and capital leases $89,251  $138,603  $69,539  $151,038  $448,431 
Operating lease obligations  3,016   4,716   2,894   6,624   17,250 
Purchase obligations  5,257   2,490   1,603   1,077   10,427 
Time deposits  181,280   17,548   4,752   4,178   207,758 
Other long-term liabilities  696   1,047   770   1,150   3,663 
                     
Total long-term debt and other obligations
 $279,500  $164,404  $79,558  $164,067  $687,529 
                     
Bank of America 2010     51


Representations and Warranties
We securitize first-lien residential mortgage loans generally in the form of MBS guaranteed by GSEs or the Government National Mortgage Association (GNMA) in the case of the Federal Housing Administration (FHA) insured and U.S. Department of Veterans Affairs (VA) guaranteed mortgage loans. In addition, in prior years, legacy companies and certain subsidiaries have sold pools of first-lien residential mortgage loans and home equity loans as private-label securitizations or in the form of whole loans. In connection with these transactions, we or our subsidiaries or legacy companies make or have made various representations and warranties. Breaches of these representations and warranties may result in the requirement to repurchase mortgage loans or to otherwise make whole or provide other remedy to awhole-loan buyer or securitization trust (collectively, repurchase claims). Our operations are currently structured to attempt to limit the risk of repurchase and accompanying credit exposure by seeking to ensure consistent production of mortgages in accordance with our underwriting procedures and by servicing those mortgages consistent with our contractual obligations.
The fair value of probable losses to be absorbed under the representations and warranties obligations and the guarantees is recorded as an accrued liability when the loans are sold. The liability for probable losses is updated by accruing a representations and warranties provision in mortgage banking income. This is done throughout the life of the loan as necessary when additional relevant information becomes available. The methodology used to estimate the liability for representations and warranties is a function of the representations and warranties given and considers a variety of factors, which include, depending on the counterparty, actual defaults, estimated future defaults, historical loss experience, estimated home prices, estimated probability that a repurchase request will be received, number of payments made by the borrower prior to default and estimated probability that a loan will be required to be repurchased. Historical experience also considers recent events such as the agreements with the GSEs on December 31, 2010 as discussed in the following section. Changes to any one of these factors could significantly impact the estimate of our liability. Given that these factors vary by counterparty, we analyze our representations and warranties obligations based on the specific counterparty with whom the sale was made. Although the timing and volume has varied, we have experienced in recent periods increasing repurchase and similar requests from buyers and insurers, including monolines. Generally the volume of unresolved repurchase claims from the FHA and VA for loans in GNMA-guaranteed securities is not significant because the requests are limited in number and are typically resolved quickly. We expect that efforts to attempt to assert repurchase requests by monolines,whole-loan investors and private-label securitization investors may increase in the future. See Recent Events – Private-label Residential Mortgage-backed Securities Matters, on page 35 for additional information. We perform aloan-by-loan review of all properly presented repurchase claims and have and will continue to contest such demands that we do not believe are valid. In addition, we may reach a bulk settlement with a counterparty (in lieu of theloan-by-loan review process), on terms determined to be advantageous to the Corporation. Overall, disputes with respect to repurchase claims have increased with monoline insurers,whole-loan buyers andprivate-label securitization investors. For additional information, seeNote 9 – Representations and Warranties Obligations and Corporate Guaranteesto the Consolidated Financial Statements.

At December 31, 2010, our total unresolved repurchase claims totaled approximately $10.7 billion compared to $7.6 billion at the end of 2009. The liability for representations and warranties and corporate guarantees, is included in accrued expenses and other liabilities and the related provision is included in mortgage banking income. At December 31, 2010 and 2009, the liability was $5.4 billion and $3.5 billion. For 2010 and 2009, the provision for representations and warranties and corporate guarantees was $6.8 billion and $1.9 billion. The representations and warranties provision of $6.8 billion, includes a provision of $3.0 billion in the fourth quarter of 2010 related to the GSE agreements as well as adjustments to the representations and warranties liability for other loans sold directly to the GSEs and not covered by those agreements. Also contributing to the increase in representations and warranties provision for the year was our continued evaluation of exposure to non-GSE repurchases and similar claims, which led to the determination that we have developed sufficient repurchase experience with certain non-GSE counterparties to record a liability related to existing and future projected claims from such counterparties. Representations and warranties provision may vary significantly each period as the methodology used to estimate the expense continues to be refined based on the level and type of repurchase claims presented, defects identified, the latest experience gained on repurchase claims and other relevant facts and circumstances, which could have a material adverse impact on our earnings for any particular period.
Government-sponsored Enterprises
During the last ten years, Bank of America and our subsidiaries have sold over $2.0 trillion of loans to the GSEs and we have an established history of working with them on repurchase claims. Our experience with them continues to evolve and any disputes are generally related to areas such as the reasonableness of stated income, occupancy and undisclosed liabilities, and are typically focused on the 2004 through 2008 vintages. On December 31, 2010, we reached agreements with the GSEs and paid $2.8 billion to the GSEs pursuant to such agreements, resolving repurchase claims involving certain residential mortgage loans sold directly to them by entities related to legacy Countrywide. As a result of these agreements, as well as adjustments to the representations and warranties liability for other loans sold directly to the GSEs and not covered by those agreements, we adjusted our liability for representations and warranties. For additional information regarding these agreements, seeNote 9 – Representations and Warranties Obligations and Corporate Guaranteesto the Consolidated Financial Statements.
Our current repurchase claims experience with the GSEs is predominantly concentrated in the 2004 through 2008 origination vintages where we believe that our exposure to representations and warranties liability is most significant. Our repurchase claims experience related to loans originated prior to 2004 has not been significant and we believe that the changes made to our operations and underwriting policies have reduced our exposure after 2008. The cumulative repurchase claims for 2007 exceed all other vintages. The volume of loans originated in 2007 was significantly higher than any other vintage which, together with the high delinquency level in this vintage, helps to explain the high level of repurchase claims compared to the other vintages.


52     Bank of America 2010


Cumulative GSE Repurchase Claims by Vintage
(1)Exposure at default (EAD) represents the unpaid principal balance at the time of default or the unpaid principal balance as of December 31, 2010.

Bank of America and legacy Countrywide sold approximately $1.1 trillion of loans originated from 2004 through 2008 to the GSEs. As of December 31, 2010, slightly less than 10 percent of the loans in these vintages have defaulted or are 180 days or more past due (severely delinquent). At least 25 payments have been made on approximately 55 percent of severely delinquent or defaulted loans. Through December 31, 2010, we have received approximately $21.6 billion in repurchase claims associated with these vintages, representing approximately two percent of the loans sold to the GSEs in these vintages. Including the agreement reached with FNMA on December 31, 2010, we have resolved $18.2 billion of these claims with a net loss experience of approximately 27 percent. The claims resolved and the loss rate do not include $839 million in claims extinguished as a result of the

agreement with FHLMC due to the global nature of the agreement and, specifically, the absence of a formal apportionment of the agreement amount between current and future claims. Our collateral loss severity rate on approved repurchases has averaged approximately 45 to 55 percent. Although the level of repurchase claims from the GSEs has been elevated for the last few quarters, the agreements with the GSEs have resulted in a decrease in the total number of outstanding repurchase claims at December 31, 2010 compared to December 31, 2009. Based on the information derived from the historical GSE experience, including the GSE agreements discussed on the previous page, we believe we are 70 percent to 75 percent through the receipt of the GSE repurchase claims that we ultimately expect to receive.


Bank of America 2010     53


The table below highlights our experience with the GSEs related to loans originated from 2004 through 2008.
Table 10 Overview of GSE Balances – 2004–2008 Originations
                 
  Legacy Orginator 
           Percent of
 
(Dollars in billions) Countrywide  Other  Total  Total 
Original funded balance $846  $272  $1,118     
Principal payments  (406)  (133)  (539)    
Defaults  (31)  (3)  (34)    
                 
Total outstanding balance at December 31, 2010
 $409  $136  $545     
                 
Outstanding principal balance 180 days or more past due (severely delinquent) $59  $14  $73     
Defaults plus severely delinquent (principal at risk)  90   17   107     
                 
Payments made by borrower:
                
Less than 13         $16   15%
13-24          32   30 
25-36          33   31 
Greater than 36          26   24 
                 
Total payments made by borrower
         $107   100%
                 
Outstanding GSE pipeline of representations and warranties claims (all vintages)
                
As of December 31, 2009         $3.3     
As of December 31, 2010          2.8     
Cumulative representations and warranties losses2004-2008 vintages
         $6.3     
                 

Our liability for obligations under representations and warranties given to the GSEs considers the recent agreements and their impact on the repurchase rates on future repurchase claims we might receive on loans that have defaulted or that we estimate will default. We believe that our remaining exposure to representations and warranties for loans sold directly to the GSEs has been accounted for as a result of these agreements and the associated adjustments to our recorded liability for representations and warranties for other loans sold directly to the GSEs and not covered by the agreements. We believe our predictive repurchase models, utilizing our historical repurchase experience with the GSEs while considering current developments, including the recent agreements, projections of future defaults as well as certain assumptions regarding economic conditions, home prices and other matters, allows us to reasonably estimate the liability for obligations under representations and warranties on loans sold to the GSEs. However, future provisions and possible loss or range of loss associated with representations and warranties made to the GSEs may be impacted if actual results are different from our assumptions regarding economic conditions, home prices and other matters.
Transactions with Investors Other than Government-sponsored Entities
In prior years, legacy companies and certain subsidiaries have sold pools of first-lien mortgage loans and home equity loans as private-label securitizations or in the form of whole loans. The loans sold include prime loans, including loans with a loan balance in excess of the conforming loan limit, Alt-A, pay-option, home equity and subprime loans. Many of the loans sold in the form of whole loans were subsequently pooled with other mortgages into private-label securitizations issued or sponsored by the third-party buyer of the whole loans. In some of the private-label securitizations, monolines have insured all or some of the issued bonds or certificates. In connection with these securitizations and whole loan sales, we or our subsidiaries or our legacy companies made various representations and warranties. Breaches of these representations and warranties may result in the requirement to repurchase mortgage loans from or to otherwise make whole or provide other remedy to a whole-loan buyer or securitization trust.
As detailed in Table 11, legacy companies and certain subsidiaries sold loans originated from 2004 through 2008 with a principal balance of $963 billion to investors other than GSEs, of which approximately $478 billion in

principal has been paid and $216 billion have defaulted, or are severely delinquent (i.e., 180 days or more past due) and are considered principal at-risk at December 31, 2010. As of December 31, 2010, we had received $13.7 billion of repurchase claims on these2004-2008 loan vintages, of which $6.0 billion have been resolved and $7.7 billion remain outstanding. Of the $7.7 billion of repurchase claims that remain outstanding, we have reviewed $4.1 billion that we have declined to repurchase. We have recognized losses of $1.7 billion on the resolved repurchase claims, $631 million of which relates to monolines and $1.1 billion of which relates to whole loan and private-label investors, as described in more detail below.
As it relates to private investors, including those who have invested in private-label securitizations, a contractual liability to repurchase mortgage loans generally arises only if counterparties prove there is a breach of the representations and warranties that materially and adversely affects the interest of the investor or all investors in a securitization trust, or that there is a breach of other standards established by the terms of the related sale agreement. We believe that the longer a loan performs, the less likely an underwriting representations and warranties breach would have had a material impact on the loan’s performance or that a breach even exists. Because the majority of the borrowers in this population would have made a significant amount of payments if they are not yet 180 days or more delinquent, we believe that the principal balance at the greatest risk for repurchase requests in this population of private-label investors is a combination of loans that have already defaulted and those that are currently 180 days or more past due. Additionally, the obligation to repurchase mortgage loans also requires that counterparties have the contractual right to demand repurchase of the loans. Based on a recent court ruling that dismissed a case against legacy Countrywide, we believe private-label securitization investors must generally aggregate 25 percent of the voting interests in each of the tranches of a particular securitization to instruct the securitization trustee to investigate potential repurchase claims. While a securitization trustee may elect to investigate or demand repurchase of loans on its own, individual investors typically have limited rights under the contracts to present repurchase claims directly. Also, the motivation of some private-label securitization investors to assert repurchase claims may be diminished by the fact that their investment is not materially impacted by the losses due to the credit enhancement coverage provided by cash flows from the tranches rated below AAA, for example.
Any amounts paid related to repurchase claims from a monoline are paid to the securitization trust and are applied in accordance with the terms of the


54     Bank of America 2010


governing securitization documents, which may include use by the securitization trust to repay any outstanding monoline advances or reduce future advances from the monolines. To the extent that a monoline has not advanced funds or does not anticipate that it will be required to advance funds to the securitization trust, the likelihood of receiving a repurchase request from a monoline may be reduced as the monoline would receive limited or no benefit from the payment of repurchase claims. Moreover, some monolines are not

currently performing their obligations under the financial guaranty policies they issued which may, in certain circumstances, impact their ability to present repurchase claims.
Table 11 details the population of loans sold as whole-loans or in non-agency securitizations by entity and product together with the principal at-risk stratified by the number of payments the borrower made prior to default or becoming severely delinquent.


Table 11 Overview of Non-Agency Securitization and Whole Loan Balances –2004-2008 Originations
                                      
   Principal Balance           Principal at Risk 
      Outstanding
  Outstanding
           Borrower
  Borrower
  Borrower
 
   Original
  Principal
  Principal Balance
  Defaulted
        Made
  Made
  Made
 
(Dollars in billions)
  Principal
  Balance
  180 Days or More
  Principal
  Principal at
  Borrower Made
  13 to 24
  25 to 36
  > 36
 
By Entity  Balance  12/31/2010  Past Due  Balance  Risk  < 13 Payments  Payments  Payments  Payments 
Bank of America  $100  $34  $4  $3  $7  $1  $2  $2  $2 
Countrywide   716   293   86   80   166   24   46   49   47 
Merrill Lynch   65   22   7   10   17   3   4   3   7 
First Franklin   82   23   7   19   26   4   6   4   12 
                                      
Total(1, 2, 3)
  $963  $372  $104  $112  $216  $32  $58  $58  $68 
                                      
                                      
By Product
                                     
                                      
Prime  $302  $124  $16  $11  $27  $2  $6  $8  $11 
Alt-A   172   82   22   21   43   7   12   12   12 
Pay option   150   65   30   20   50   5   15   16   14 
Subprime   245   82   36   43   79   16   19   17   27 
Home Equity   88   18      16   16   2   5   5   4 
Other   6   1      1   1      1       
                                      
Total
  $963  $372  $104  $112  $216  $32  $58  $58  $68 
                                      
(1)Includes $186 billion of original principal balance related to transactions with monoline participation.
(2)Excludes transactions sponsored by Bank of America and Merrill Lynch where no representations or warranties were assumed.
(3)Includes exposures on third-party sponsored transactions related to legacy entity originations.

As of December 31, 2010, approximately 22 percent of the loans sold to non-GSEs that were originated from 2004 to 2008 have defaulted or are severely delinquent. As shown in Table 11, at least 25 payments have been made on approximately 58 percent of the loans included in principal at-risk. We believe many of the defaults observed in these securitizations have been, and continue to be, driven by external factors like the substantial depreciation in home prices, persistently high unemployment and other negative economic trends, diminishing the likelihood that any loan defect (assuming one exists at all) was the cause of the loan’s default.
We believe the agreements for private-label securitizations generally contain less rigorous representations and warranties and generally impose higher burdens on investors seeking loan repurchases than the comparable agreements with the GSEs. For example, borrower fraud representations and warranties were generally not given in private-label securitizations. The following represent some of the typical private-label securitization transaction terms (which differ substantially from those provided in GSE transactions):
• Representation of material compliance with underwriting guidelines (which often explicitly permit exceptions).
• Few transactions contain a representation that there has been no fraud or material misrepresentation by a borrower or third party.
• Many representations include materiality qualifiers.
• Breach of representation must materially and adversely affect certificate holders’ interest in the loan.
• No representation that the mortgage is of investment quality.
• Offering documents included extensive disclosures, including detailed risk factors, description of underwriting practices and guidelines, and loan attributes.
• Only parties to a pooling and servicing agreement (e.g., the trustee) can bring repurchase claims. Certificate holders cannot bring claims directly and do not have access to loan files. At least 25 percent of each tranche of certificate holders is generally required in order to direct a trustee to review

loan files for potential claims. In addition, certificate holders must bear costs of a trustee’s loan file review.
• Repurchase liability is generally limited to the seller.
These factors lead us to believe that only a portion of the principal at-risk with respect to loans included in private-label securitizations will be the subject of a repurchase request and only a portion of those requests would ultimately result in a repurchase. Although our experience with non-GSE claims remains limited, we expect additional activity in this area going forward and that the volume of repurchase claims from monolines, whole-loan investors and investors in private-label securitizations could increase in the future. It is reasonably possible that future losses may occur, and our estimate is that the upper range of possible loss related to non-GSE sales could be $7 billion to $10 billion over existing accruals. This estimate does not represent a probable loss, is based on currently available information, significant judgment, and a number of assumptions that are subject to change. A significant portion of this estimate relates to loans originated through legacy Countrywide, and the repurchase liability is generally limited to the original seller of the loan. Future provisions and possible loss or range of loss may be impacted if actual results are different from our assumptions regarding economic conditions, home prices and other matters and may vary by counterparty. The resolution of the repurchase claims process with the non-GSE counterparties will likely be a protracted process, and we will vigorously contest any request for repurchase if we conclude that a valid basis for the repurchase claim does not exist.
The following discussion provides more detailed information related to non-GSE counterparties.
Monoline Insurers
Legacy companies have sold $185.6 billion of loans originated from 2004 through 2008 into monoline-insured securitizations, which are included in Table 11, including $106.2 billion of first-lien mortgages and $79.4 billion of


Bank of America 2010     55


second-lien mortgages. Of these balances, $45.8 billion of the first-lien mortgages and $48.5 billion of the second-lien mortgages have paid off and $32.9 billion of the first-lien mortgages and $14.5 billion of the second-lien mortgages have defaulted or are severely delinquent and are considered principal at-risk at December 31, 2010. At least 25 payments have been made on approximately 52 percent of the loans included in principal at-risk. Of the first-lien mortgages sold, $41.0 billion, or 39 percent, were sold as whole loans to other institutions which subsequently included these loans with those of other originators in private-label securitization transactions in which the monolines typically insured one or more securities. Through December 31, 2010, we have received $5.6 billion of representations and warranties claims related to the monoline-insured transactions. Of these repurchase claims, $799 million have been resolved, with losses of $631 million. The majority of these resolved claims related to second-lien mortgages and $678 million of these claims were resolved through repurchase or indemnification while $121 million were rescinded by the investor or paid in full. At December 31, 2010, the unpaid principal balance of loans related to unresolved monoline repurchase requests was $4.8 billion, including $3.0 billion that have been reviewed where it is believed a valid defect has not been identified which would constitute an actionable breach of representations and warranties and $1.8 billion that are in the process of review. We have had limited experience with most of the monoline insurers in the repurchase process, which has constrained our ability to resolve the open claims with such counterparties. Also, certain monoline insurers have instituted litigation against legacy Countrywide and Bank of America, which limits our relationship with such monoline insurers and ability to enter into constructive dialogue to resolve the open claims. It is not possible at this time to reasonably estimate future repurchase obligations with respect to those monolines with whom we have limited repurchase experience and, therefore, no liability has been recorded in connection with these monolines, other than a liability for repurchase requests that are in the process of review and repurchase requests where we have determined that there are valid loan defects. However, certain other monoline insurers have engaged with us in a consistent repurchase process and we have used that experience to record a liability related to existing and projected future claims from such counterparties.
Whole Loan Sales and Private-label Securitizations
Legacy entities, and to a lesser extent Bank of America, sold loans in whole loan sales or via private-label securitizations with a total principal balance of $777.1 billion originated from 2004 through 2008, which are included in Table 11, of which $384.0 billion have been paid off and $169.0 billion have defaulted or are severely delinquent and are considered principal at-risk at December 31, 2010. At least 25 payments have been made on approximately 60 percent of the loans included in principal at-risk. We have received approximately $8.1 billion of representations and warranties claims from whole loan investors and private-label securitization investors related to these vintages, including $5.6 billion from whole loan investors, $800 million from one private-label securitization counterparty which were submitted prior to 2008 and $1.7 billion in recent demands from private-label securitization investors. Private-label securitization investors generally do not have the contractual right to demand repurchase of loans directly. The inclusion of the $1.7 billion in recent demands from private-label securitization investors does not mean that we believe these claims have satisfied the contractual thresholds required for these investors to direct the securitization trustee to take action or are otherwise procedurally or substantively valid. Additionally, certain private-label securitizations are insured by the monolines, which are not reflected in these figures regarding whole loan sales and private-label securitizations.
We have resolved $5.2 billion of the claims received from whole loan investors and private-label securitization investors with losses of $1.1 billion. Approximately $2.1 billion of these claims were resolved through repurchase

or indemnification and $3.1 billion were rescinded by the investor. Claims outstanding related to these vintages totaled $2.9 billion at December 31, 2010, $1.1 billion of which we have reviewed and declined to repurchase based on an assessment of whether a material breach exists, $91 million of which are in the process of review and $1.7 billion of which are demands from private-label securitization investors received in the fourth quarter of 2010. The majority of the claims that we have received so far are from whole loan investors and until we have meaningful repurchase experiences with counterparties other than whole loan investors, it is not possible to determine whether a loss related to our private-label securitizations has occurred or is probable. However, certain whole loan investors have engaged with us in a consistent repurchase process and we have used that experience to record a liability related to existing and future claims from such counterparties.
On October 18, 2010, Countrywide Home Loans Servicing, LP (which changed its name to BAC Home Loans Servicing, LP), a wholly-owned subsidiary of the Corporation, received a letter, in its capacity as servicer on 115 private-label securitizations which was subsequently extended to 225 securitizations. The letter asserted breaches of certain servicing obligations, including an alleged failure to provide notice of breaches of representations and warranties with respect to mortgage loans included in the transactions. See Recent Events – Private-label Residential Mortgage-backed Securities Matters on page 35 for additional information.
See Complex Accounting Estimates – Representations and Warranties on page 112 for information related to our estimated liability for representations and warranties and corporate guarantees related to mortgage-related securitizations. For additional information regarding representations and warranties and disputes involving monolines, whole loan sales and private-label securitizations, seeNote 9 – Representations and Warranties Obligations and Corporate GuaranteesandNote 14 – Commitments and Contingenciesto the Consolidated Financial Statements.
Regulatory InitiativesMatters
Refer to Item 1A. Risk Factors for additional information on recent or proposed legislative and regulatory initiatives as well as other risks to which we are exposed, including among others, enhanced regulatory scrutiny or potential legal liability as a result of the recent financial crisis.
Financial Reform Act
On July 21, 2010, the Financial Reform Act was signed into law. The Financial Reform Act enacts sweeping financial regulatory reform and will alter the way in which we conduct certain businesses, increase our costs and reduce our revenues.
Background
The Financial Reform Act mandates that the Federal Reserve limit debit card interchange fees. Provisions in the legislation also ban banking organizations from engaging in proprietary trading and restrict their sponsorship of, or investing in, hedge funds and private equity funds, subject to limited exceptions. The Financial Reform Act increases regulation of the derivative markets through measures that broaden the derivative instruments subject to regulation and requires clearing and exchange trading as well as imposing additional capital and margin requirements for derivative market participants. The Financial Reform Act also changes the methodology for calculating deposit insurance assessments from the amount of an insured depository institution’s domestic deposits to its total assets minus tangible capital; provides for resolution authority to establish a process to unwind large systemically important financial companies; creates a new regulatory body to set requirements regarding the terms and conditions of consumer financial products and expands the role of state regulators in enforcing consumer protection requirements over banks; includes new minimum leverage and risk-based


56     Bank of America 2010


capital requirements for large financial institutions; disqualifies trust preferred securities and other hybrid capital securities from Tier 1 capital; and requires securitizers to retain a portion of the risk that would otherwise be transferred into certain securitization transactions. Many of these provisions have begun to be phased-in or will be phased-in over the next several months or years and will be subject both to further rulemaking and the discretion of applicable regulatory bodies.
The Financial Reform Act will continue to have a significant and negative impact on our earnings through fee reductions, higher costs and new restrictions, as well as reduce available capital. The Financial Reform Act may also continue to have a material adverse impact on the value of certain assets and liabilities held on our balance sheet. The ultimate impact of the Financial Reform Act on our businesses and results of operations will depend on regulatory interpretation and rulemaking, as well as the success of any of our actions to mitigate the negative earnings impact of certain provisions. For information on the impact of the Financial Reform Act on our credit ratings, see Liquidity Risk beginning on page 67.
The Financial Reform Act and other proposed regulatory initiatives may also have an adverse impact on capital. During 2010, the Basel Committee on Banking Supervision finalized rules on certain capital and liquidity measurements. For additional information on these rules, see Regulatory Capital – Regulatory Capital Changes beginning on page 64.
Debit Interchange Fees
The limits that the Financial Reform Act places on debit interchange fees will significantly reduce our debit card interchange revenues. Interchange fees, or “swipe” fees, are charges that merchants pay to us and other credit card companies and card-issuing banks for processing electronic payment transactions. The legislation, which provides the Federal Reserve with authority over interchange fees received or charged by a card issuer, requires that fees must be “reasonable and proportional” to the costs of processing such transactions. The Federal Reserve considered the functional similarity between debit card transactions and traditional checking transactions and the incremental costs incurred by a card issuer in processing a particular debit card transaction. In addition, the legislation prohibits card issuers and networks from entering into exclusive arrangements requiring that debit card transactions be processed on a single network or only two affiliated networks, and allows merchants to determine transaction routing.
On November 12, 2009,December 16, 2010, the Federal Reserve issued a proposed rule that would establish debit card interchange fee standards and prohibit network exclusivity arrangements and routing restrictions. The Federal Reserve requested comments on two alternative interchange fee standards that would apply to all covered issuers: one based on each issuer’s costs, with a safe harbor initially set at $0.07 per transaction and a cap initially set at $0.12 per transaction; and the other a stand-alone cap initially set at $0.12 per transaction. The Federal Reserve also requested comment on possible frameworks for an adjustment to the interchange fees to reflect certain issuer costs associated with fraud prevention. If the Federal Reserve adopts either of these proposed standards in the final rule, the maximum allowable interchange fee received by covered issuers for debit card transactions would be more than 70 percent lower than the 2009 average once the new rule takes effect on July 21, 2011. The proposed rule would also prohibit issuers and networks from restricting the number of networks over which debit card transactions may be processed. The Federal Reserve requested comment on two alternative approaches: one alternative would require at least two unaffiliated networks per debit card, and the other would require at least two unaffiliated networks per debit card for each type of cardholder authorization method (such as signature or PIN). Under both alternatives, the issuers and networks would be prohibited from inhibiting a merchant’s ability to direct the routing of debit card transactions over any network that the issuer enabled to process them.

As previously announced on July 16, 2010, as a result of the Financial Reform Act and its related rules and subject to final rulemaking over the next year, we believe that our debit card revenue will be adversely impacted beginning in the third quarter of 2011. Our consumer and small business card products, including the debit card business, are part of an integrated platform within theGlobal Card Servicesbusiness segment. In 2010, our estimate of revenue loss due to the debit card interchange fee standards to be adopted under the Financial Reform Act was approximately $2.0 billion annually based on 2010 volumes. As a result, we recorded a non-tax deductible goodwill impairment charge forGlobal Card Servicesof $10.4 billion in 2010. We have identified other potential mitigation actions withinGlobal Card Services, but they are in the early stages of development and some of them may impact other segments. The impairment charge, which is a non-cash item, had no impact on our reported Tier 1 and tangible equity ratios. If the Federal Reserve sets the final interchange fee standards at the lowest proposed fee alternative, as described above (i.e., $0.07 per transaction) the lower interchange revenue may result in additional impairment of goodwill inGlobal Card Services. In view of the uncertainty with model inputs including the final ruling, changes in the economic outlook and the corresponding impact to revenues and asset quality, and the impacts of mitigation actions, it is not possible to estimate the amount or range of amounts of additional goodwill impairment, if any, associated with changes to Regulation Einterchange fee standards. For more information on goodwill and the impairment charge, refer toNote 10 – Goodwill and Intangible Assetsto the Consolidated Financial Statements and Complex Accounting Estimates beginning on page 107.
Limitations on Certain Activities
We anticipate that the final regulations associated with the Financial Reform Act will include limitations on certain activities, including limitations on the use of a bank’s own capital for proprietary trading and sponsorship or investment in hedge funds and private equity funds (Volcker Rule). Regulations implementing the Volcker Rule are required to be in place by October 21, 2011, and the Volcker Rule becomes effective twelve months after such rules are final or on July 21, 2012, whichever is earlier. The Volcker Rule then gives banking entities two years from the effective date (with opportunities for additional extensions) to bring activities and investments into conformance. In anticipation of the adoption of the final regulations, we have begun winding down our proprietary trading line of business. The ultimate impact of the Volcker Rule or the winding down of this business, and the time it will take to comply or complete, continues to remain uncertain. The final regulations issued may impose additional operational and compliance costs on us.
Derivatives
The Financial Reform Act includes measures to broaden the scope of derivative instruments subject to regulation by requiring clearing and exchange trading of certain derivatives, imposing new capital and margin requirements for certain market participants and imposing position limits on certainover-the-counter (OTC) derivatives. The Financial Reform Act grants the U.S. Commodity Futures Trading Commission (CFTC) and the SEC substantial new authority and requires numerous rulemakings by these agencies. Generally, the CFTC and SEC have until July 16, 2011 to promulgate the rulemakings necessary to implement these regulations. The ultimate impact of these derivatives regulations, and the time it will take to comply, continues to remain uncertain. The final regulations will impose additional operational and compliance costs on us and may require us to restructure certain businesses and negatively impact our revenues and results of operations.
FDIC Deposit Insurance Assessments
Since the financial crisis began several years ago, an increasing number of bank failures has imposed significant costs on the FDIC in resolving those failures, and the regulator’s deposit insurance fund has been depleted. In order to


Bank of America 2010     57


maintain a strong funding position and restore reserve ratios of the deposit insurance fund, the FDIC has increased, and may increase in the future, assessment rates of insured institutions, including Bank of America.
Deposits placed at the U.S. Banks are insured by the FDIC, subject to limits and conditions of applicable law and the FDIC’s regulations. Pursuant to the Financial Reform Act, FDIC insurance coverage limits were permanently increased to $250,000 per customer. The Financial Reform Act also provides for unlimited FDIC insurance coverage for non-interest bearing demand deposit accounts for a two-year period beginning on December 31, 2010 and ending on January 1, 2013. The FDIC administers the Deposit Insurance Fund, and all insured depository institutions are required to pay assessments to the FDIC that fund the Deposit Insurance Fund. The Financial Reform Act changed the methodology for calculating deposit insurance assessments from the amount of an insured depository institution’s domestic deposits to its total assets minus tangible capital. On February 7, 2011 the FDIC issued a new regulation implementing revisions to the assessment system mandated by the Financial Reform Act. The new regulation will be effective April 1, 2011 and will be reflected in the June 30, 2011 FDIC fund balance and the invoices for assessments due September 30, 2011. As a result of the new regulations, we expect to incur higher annual deposit insurance assessments. We have identified potential mitigation actions, but they are in the early stages of development and we are not able to directly control the basis or the amount of premiums that we are required to pay for FDIC insurance or for other fees or assessment obligations imposed on financial institutions. Any future increases in required deposit insurance premiums or other bank industry fees could have a significant adverse impact on our financial condition and results of operations.
CARD Act
On May 22, 2009, the CARD Act was signed into law. For more informationThe majority of the CARD Act provisions became effective in February 2010. The CARD Act legislation contains comprehensive credit card reform related to credit card industry practices including significantly restricting banks’ ability to change interest rates and assess fees to reflect individual consumer risk, changing the way payments are applied and requiring changes to consumer credit card disclosures. The provisions of the CARD Act negatively impacted net interest income and card income during 2010, and are expected to negatively impact future net interest income due to the restrictions on our ability to reprice credit cards based on risk, and card income due to restrictions imposed on certain fees. The 2010 full-year decrease in revenue was approximately $1.5 billion.
Regulation E
On November 12, 2009, the Federal Reserve issued amendments to Regulation E which implements the Electronic Fund Transfer Act. The rules became effective on July 1, 2010 for new customers and August 16, 2010 for existing customers. These amendments limit the way we and other banks charge an overdraft fee for non-recurring debit card transactions that overdraw a consumer’s account unless the consumer affirmatively consents to the bank’s payment of overdrafts for those transactions. Under previously announced plans, we do not offer customers the opportunity to opt-in to overdraft services related to non-recurring debit card transactions. However, customers are able to opt-in on awithdrawal-by-withdrawal basis to access cash through the Bank of America ATM network where the bank is able to alert customers that the transaction may overdraw their account and result in a fee if they choose to proceed. The impact of these new regulations, see Regulatory Overview on page 17.

In December 2009,Regulation E, which was in effect beginning in the Basel Committee on Banking Supervision released consultative documents on both capitalthird quarter and liquidity. In addition, we will begin Basel II parallel implementation duringfully in effect in the secondfourth quarter of 2010, and our overdraft policy changes, which were in effect for the full year of 2010, was a reduction in service charges during 2010 of approximately $1.7 billion. In 2011, the incremental reduction to service charges related to Regulation E and overdraft policy changes is expected

to be approximately $1.1 billion, or a full-year impact of approximately $2.8 billion, net of identified mitigation action.
U.K. Corporate Income Tax Rate
On July 27, 2010, the U.K. government enacted a law change reducing the corporate income tax rate by one percent effective for the 2011 U.K. tax financial year beginning on April 1, 2011. While this rate reduction favorably affects income tax expense on future U.K. earnings, it also required us to remeasure our U.K. net deferred tax assets using the lower tax rate, which resulted in a charge to income tax expense of $392 million in 2010. For more information, see BaselA future rate reduction of one percent per year is generally expected to be enacted in each of 2011, 2012 and 2013, which would result in a similar charge to income tax expense of nearly $400 million during each of the three years. The U.K. Treasury has asked for taxpayer views on whether the U.K. government should alternatively enact the full remaining three-percent reduction entirely during 2011, which would accelerate the possible charges into 2011 for a total of approximately $1.1 billion.
Final Regulatory Capital RequirementsGuidance on page 52.

Consolidation

On January 21, 2010, the Federal Reserve, Office of the Comptroller of the Currency, FDIC and Office of Thrift Supervision (collectively, joint agencies) issued a final rule regarding risk-based capital andrequirements related to the impact of the adoption of new consolidation rules issued byguidance. The impact on the FASB. The final rule eliminates the exclusion of certain asset-backed commercial paper (ABCP) program assets from risk-weighted assets and provides a reservation of authority to permit the joint agencies to require banks to treat structures that are not consolidated under the accounting standards as if they were consolidated for risk-based capital purposes commensurate with the risk relationship of the bankCorporation on January 1, 2010 due to the structure. In addition,new consolidation guidance and the final rule allows forwas an optional delay and phase-in for a maximum of one year for the effect onincrease in risk-weighted assets of $21.3 billion and a reduction in capital of $9.7 billion. The overall impact of the new consolidation guidance and the regulatory limit on the inclusion of the allowance for loan and lease lossesfinal rule was a decrease in Tier 21 capital related to the assets that must be consolidated as a resultand Tier 1 common ratios of the accounting change. The transitional relief does not apply to the leverage ratio or to assets in VIEs to which a bank provides implicit support. We have elected to forgo the phase-in period,76 bps and accordingly, we consolidated the amounts for regulatory capital purposes as of January 1, 2010.73 bps. For more information, on the impact of this guidance, see Balance Sheet Overview – Impact of Adopting New AccountingConsolidation Guidance on Consolidationpage 29, Capital Management beginning on page 52.

On December 14, 2009, we announced our intention63 and Liquidity Risk beginning on page 67.

Payment Protection Insurance
In the U.K., the Corporation sells PPI through itsGlobal Card Servicesbusiness to increase lendingcredit card customers and has previously sold this insurance to small- and medium-sized businesses to approximately $21 billion in 2010 compared to approximately $16 billion in 2009. This announcement is consistent with the U.S. Treasury’s initiative, announced as part of the Financial Stability Plan on February 2, 2009, to help increase small

business owners’ access to credit. As part of the initiative, the U.S. Treasury began making direct purchases of up to $15 billion of certain securities backed by Small Business Administration (SBA) loans to improve liquidity in the credit markets and purchasing new securities to ensure that financial institutions feel confident in extending new loans to small businesses. The program also temporarily raises guarantees to up to 90 percent in the SBA’sconsumer loan program and temporarily eliminates certain SBA loan fees. We continue to lend to creditworthy small business customers through small business credit cards, loans and lines of credit products.

customers. In response to an elevated level of customer complaints of misleading sales tactics across the economic downturn,industry, heightened media coverage and pressure from consumer advocacy groups, the FDIC implementedU.K. Financial Services Authority (FSA) has investigated and raised concerns about the Temporary Liquidity Guarantee Program (TLGP)way some companies have handled complaints relating to strengthen confidencethe sale of these insurance policies. In August 2010, the FSA issued a policy statement on the assessment and encourage liquidityremediation of PPI claims which is applicable to the Corporation’s U.K. consumer businesses and is intended to address concerns among consumers and regulators regarding the handling of PPI complaints across the industry. The policy statement sets standards for the sale of PPI that apply to current and prior sales, and in the banking system by allowing the FDIC to guarantee senior unsecured debt (e.g., promissory notes, unsubordinated unsecured notes and commercial paper) up to prescribed limits, issued by participating entities beginning on October 14, 2008, and continuing through October 31, 2009. We participated in this program; however, as announced in September 2009, due to improved market liquidity and our ability to issue debt without the FDIC guarantee, we,event a company does not or did not comply with the FDIC’s agreement, exitedstandards, it is alleged that the program and have stopped issuing FDIC-guaranteed debt. At December 31, 2009, we still had FDIC-guaranteed debt outstanding issued underinsurance was incorrectly sold, giving the TLGP of $44.3 billion. The TLGP also offeredcustomer rights to remedies. Given the Transaction Account Guarantee Program (TAGP) that guaranteed noninterest-bearing deposit accounts held at participating FDIC-insured institutions on balancesnew regulatory guidance, in excess of $250,000. We elected to opt out of the six-month extension of the TAGP which extends the program to June 30, 2010. We exited the TAGP effective December 31, 2009.

On September 21, 2009,2010, the Corporation reachedhad a liability of $630 million based on its current claims history and an agreementestimate of future claims that have yet to terminate its term sheet with the U.S. government under which the U.S. government agreed in principle to provide protectionbe asserted against the possibility of unusually large lossesCorporation. For additional information on a pool of the Corporation’s financial instruments that were acquired from Merrill Lynch. In connection with the termination of the term sheet, the Corporation paid a total of $425 million PPI, seeNote 14 – Commitments and Contingenciesto the U.S.Consolidated Financial Statements – Payment Protection Insurance Claims Matter on page 196.

U.K. Bank Levy
On June 22, 2010, the U.K. government announced that it intended to introduce an annual bank levy. Beginning in 2011, the bank levy will be payable on the consolidated liabilities, subject to certain exclusions and offsets, of U.K. group companies and U.K. branches of foreign banking groups as of each year-end balance sheet date. As currently proposed, the bank levy rate for 2011 and


58     Bank of America 2010


future years will be 0.075 percent per annum for certain short-term liabilities with a rate of 0.0375 percent per annum for longer maturity liabilities and certain deposits. The legislation is expected to be allocated among the U.S. Treasury, the Federal Reserve and the FDIC.

In addition to exiting the TARP as discussed on page 18, terminating the U.S. Government’s asset guarantee term sheet and exiting the TLGP, including the TAGP, we have exited or ceased participationenacted in market disruption liquidity programs created by the U.S. government in response to the economic downturn of 2008. We have exited or repaid borrowings under the Term Auction Facility, U.S. Treasury Temporary Liquidity Guarantee Program for Money Market Funds, ABCP Money Market Fund Liquidity Facility, Commercial Paper Federal Funding Facility, Money Market Investor Funding Facility, Term Securities Lending Facility and Primary Dealer Credit Facility.

On November 17, 2009, the FDIC issued a final rule that required insured institutions to prepay on December 30, 2009 their estimated


Bank of America 200943


quarterly risk-based assessments for the fourth quarter of 2009 and for all of 2010, 2011 and 2012. For the fourth quarter of 2009 and for all of 2010, the prepaid assessment rate was based on each institution’s total base assessment rate for the third quarter of 2009, modified to assume2011. We currently estimate that the assessment ratecost of the U.K. bank levy will be approximately $125 million annually beginning in effect2011.

Regulatory Guidance on September 30, 2009 had beenCollateral Dependent Loans
On February 23, 2010, regulators issued clarifying guidance, effective in effect for the entire thirdfirst quarter of 2009. The prepaid assessment rates for 2011 and 2012 are equal2010, on modified consumer real estate loans that specifies criteria required to demonstrate a borrower’s capacity to repay the modified third quarter 2009 total base assessment rate plus three bps adjusted quarterly for an estimated five percent annual growth rate in the assessment base through the end of 2012. As the prepayment related to future periods, it was recorded in prepaid assets for financial reporting purposes and will be recognized as expense over the coverage period.

On May 22, 2009, the FDIC adopted a rule designed to replenish the deposit insurance fund. This rule established a special assessment of five bps on each FDIC-insured depository institution’s assets minus its Tier 1 capital with a maximum assessment not to exceed 10 bps of an institution’s domestic deposits. This special assessment was calculated based on asset levels at June 30, 2009, and was collected on September 30, 2009. The Corporation recorded a net charge of $724 million in 2009 inloan. In connection with this assessment. Additionally, beginning April 1, 2009, the FDIC increased fees on deposits based on a revised risk-weighted methodology which increased the base assessment rates.

Pursuant to the Emergency Economic Stabilization Act of 2008 (EESA), the U.S. Treasury announced the creation of the Financial Stability Plan. This plan outlined a series of key initiatives including a new Capital Assistance Program (CAP) to help ensure that banking institutions have sufficient capital. We, as well as several other large financial institutions, are subject to the Supervisory Capital Assessment Program (SCAP) conducted by federal regulators. The objective of the SCAP is to assess losses that could occur under certain economic scenarios, including economic conditions more severe than anticipated. As a result of the SCAP, in May 2009, federal regulatorsguidance, we reviewed our modified consumer real estate loans and determined that a portion of these loans did not meet the Corporation required an additional $33.9criteria and, therefore, were deemed collateral dependent. The guidance requires that a modified loan deemed to be collateral dependent be written down to its estimated collateral value even if that loan is performing. The application of this guidance resulted in $1.0 billion of Tier 1 common capital to sustain more severe economic circumstances assuming a more prolongednet charge-offs in 2010, of which $822 million were home equity, $207 million were residential mortgage and deeper recession over a two-year period than the majority of both private and government economists projected. We achieved the increased capital requirement during the first half of 2009 through strategic transactions that increased common capital, including the expected reductions in preferred dividends and related reduction in deferred tax asset disallowances, by approximately $39.7 billion and significantly exceeded the SCAP buffer. This Tier 1 common capital increase resulted from the exchange of approximately $14.8 billion aggregate liquidation preference of non-government preferred shares into approximately 1.0 billion common shares, an at-the-market offering of 1.25 billion common shares for $13.5 billion, a $4.4 billion benefit (including associated tax effects) related to the sale of shares of CCB, a $3.2 billion benefit (net of tax and including an approximate $800$9 million reduction in goodwill and intangibles) related to the gain from the contribution of our merchant processing business to a joint venture, $1.6 billion due to reduced actual and forecasted preferred dividends throughout 2009 and 2010 related to the exchange of preferred for common shares and a $2.2 billion reduction in the deferred tax asset disallowance for Tier 1 common capital from the preceding items.

were discontinued real estate.

Making Home Affordable Program
On March 4, 2009, the U.S. Treasury provided details related to the $75 billion Making Home Affordable program (MHA). The MHA which is focused on reducing the number of foreclosures and making it easier for customers to refinance loans. The MHA consists of the Home Affordable Modification Program (HAMP) which provides guidelines on first lienfirst-lien loan modifications, and the Home Affordable Refinance Program (HARP) which provides guidelines for loan refinancing. The HAMP is designed to help at-risk homeowners avoid foreclosure by reducing payments. This program

provides incentives to lenders to modify all eligible loans that fall under the guidelines of this program. The HARP is available to approximately four to five million homeowners who have a proven payment history on an existing mortgage owned by the Federal National Mortgage Association (FNMA) or the Federal Home Loan Mortgage Corporation (FHLMC). The HARP is designed to help eligible homeowners refinance their mortgage loans to take advantage of current lower mortgage rates or to refinance adjustable-rate mortgages (ARM) into more stable fixed-rate mortgages.

As part of the MHA program, on April 28, 2009, the U.S. government announced intentions to create the second liensecond-lien modification program (2MP) that will beis designed to reduce the monthly payments on qualifying home equity loans and lines of credit under certain conditions, including completion of a HAMP modification on the first mortgage on the property. This program will provideprovides incentives to lenders to modify all eligible loans that fall under the guidelines of this program. Additional clarification on government guidelines for the program was announced early in 2010. On January 26,April 8, 2010, we formally announced that we will participate inbegan early implementation of the 2MP once program details are finalized.with the mailing of trial modification offers to eligible home equity customers. We will modify eligible second liens under this initiative regardless of whether the MHA modified first lien“first lien” is serviced by Bank of Americathe Corporation or another participating servicer.

Another addition to

On April 5, 2010, we implemented the HAMP is the recently announced Home Affordable Foreclosure Alternatives (HAFA) program, which is another addition to assistthe HAMP that assists borrowers with non-retention options, such as short sale ordeed-in-lieu options, instead of foreclosure. The HAFA program provides incentives to lenders to assist all eligible borrowers that fall under the guidelines of this program. Our first goal is to work with the borrower to determine if a loan modification or other homeownership retention solution is available before pursuing non-retention options such as short sales. Short sales are an important option for homeowners who are facing financial difficulty and do not have a viable option to remain in the home. HAFA’s short sale guidelines are designed to streamline and standardize the process and will be compatible with Bank of America’s new cooperative short sale program.

As

During 2010, 285,000 loan modifications were completed with a total unpaid principal balance of January 2010, approximately 220,000 Bank$65.7 billion, including 109,000 loans with a total unpaid principal amount of America customers$25.5 billion that were already in aconverted from trial-period modificationto permanent modifications under the MHA, program.which include HAMP first-lien modifications and 2MP second-lien modifications. In addition, on March 26, 2010, the U.S. government announced new changes to the MHA program guidelines that include principal forgiveness options to the HAMP for asub-segment of qualified HAMP borrowers. The details around eligibility, forgiveness arrangements and the incentive structures are still being finalized. However, we

implemented a forgiveness program on a subset of HAMP eligible products under the National Home Retention Program (NHRP) in 2010.
In addition to the programs described above, we have implemented several programs designed to help our customers. For information on these programs, refer to Credit Risk Management beginning on page 71. We will continue to help our customers address financial challenges through these government programs and our own home retention programs.

Stress Tests
The Corporation has established management routines to periodically conduct stress tests to evaluate potential impacts to the Corporation under hypothetical economic scenarios. These stress tests will facilitate our contingency planning and management of capital and liquidity. These processes were also used to conduct the recent secondary stress testing imposed by the Federal Reserve and were incorporated into the Capital Plan that was submitted as part of this request, which included a proposed modest increase in our common dividend in the second half of 2011. The results of these stress tests may influence bank regulatory supervisory requirements concerning the Corporation and may impact the amount or timing of dividends or distributions to the Corporation’s stockholders. For additional information, see Capital Management beginning on page 63 and Liquidity Risk beginning on page 67.
Other Matters
The Corporation has established guidelines and policies for managing capital across its subsidiaries. The guidance for the Corporation’s subsidiaries with regulatory capital requirements, including branch operations of banking subsidiaries, requires each entity to maintain satisfactory capital levels. This includes setting internal capital targets for the U.S. bank subsidiaries to exceed “well capitalized” levels.
The U.K. has adopted increased capital and liquidity requirements for local financial institutions, including regulated U.K. subsidiaries of non-U.K. bank holding companies and other financial institutions as well as branches of non-U.K. banks located in the U.K. In addition, the U.K. has proposed the creation and production of recovery and resolution plans (commonly referred to as living wills) by such entities. We are currently monitoring the impact of these initiatives.
Managing Risk

Overview
Risk is inherent in every activity that we undertake. Our business exposes us to strategic, credit, market, liquidity, compliance, operational and reputational risk. We must manage these risks to maximize our long-term results by ensuring the integrity of our assets and the quality of our earnings.
Strategic risk is the risk that results from adverse business decisions, ineffective or inappropriate business plans, or failure to respond to changes in the competitive environment, business cycles, customer preferences, product obsolescence, regulatory environment, business strategy execution,and/or other inherent risks of the business including reputational risk. Credit risk is the risk of loss arising from a borrower’s or counterparty’s inability to meet its obligations. Market risk is the risk that values of assets and liabilities or revenues will be adversely affected by changes in market conditions such as interest rate movements. Liquidity risk is the inability to meet contractual and contingent financial obligations, on- or off-balance sheet, as they come due. Compliance risk is the risk that arises from the failure to adhere to laws, rules, regulations, or internal policies and procedures. Operational risk is the risk of loss resulting from inadequate or failed internal processes, people and systems, or external events. Reputational risk is the potential that negative publicity regarding an organization’s conduct or business practices will adversely affect its profitability, operations or customer base, or require costly


Bank of America 2010     59


litigation or other measures. Reputational risk is evaluated within all of the risk categories and throughout the risk management process, and as such is not discussed separately herein. The Corporation’sfollowing sections, Strategic Risk Management beginning on page 62, Capital Management beginning on page 63, Liquidity Risk beginning on page 67, Credit Risk Management beginning on page 71, Market Risk Management beginning on page 100, Compliance Risk Management on page 106 and Operational Risk Management beginning on page 106, address in more detail the specific procedures, measures and analyses of the major categories of risk that we manage.
In choosing when and how to take risks, we evaluate our capacity for risk and seek to protect our brand and reputation, our financial flexibility, the value of our assets and the strategic potential of our Corporation. We intend to maintain a strong and flexible financial position that will allow us to successfully weather challenging economic times and take advantage of opportunities to grow. We also intend to focus on maintaining our relevance and value to customers, associates and shareholders. To achieve these objectives, we have built a comprehensive risk management culture and have implemented governance and control measures to maintain that culture.
Our risk management infrastructure is continually evolving to meet the heightened challenges posed by the increased complexity of the financial services industry and markets, by our increased size and global footprint, and by the rapid and significant financial crisis of the past two years.crisis. We have redefined oura defined risk framework and clearly articulated a risk appetite which is approved annually by the Corporation’s Board of Directors (the Board), and begun the roll out and implementation of our risk plan. While many of these processes, and roles and responsibilities continue to evolve and mature, we will ensure that we continue to enhance our risk management process with a focus on clarity of roles and accountabilities, escalation of issues, aggregation of risk and data across the enterprise, and effective governance characterized by clarity and transparency.

Given our wide range of business activities as well as the competitive dynamics, the regulatory environment and the geographic span of such activities, risk taking is an inherent activity for the Corporation. Consequently, we.

We take a comprehensive approach to risk management. Risk management planning is fully integrated with strategic, financial and customer/client planning so that goals and responsibilities are aligned across the organization. Risk is managed in a systematic manner by focusing on the Corporation as a whole andas well as managing risk across the enterprise and within individual business units, products, services and transactions.transactions, and across all geographic locations. We maintain a governance structure that delineates the


44Bank of America 2009


responsibilities for risk management activities, as well as governance and the oversight of those activities, by executive management and the Board.

Executive management assesses, and the Board oversees, the risk-adjusted returns of each business segment through review and approval of strategic and financial operating plans. By allocating economic capital to and establishing a risk appetite for a business segment, we seek to effectively manage the ability to take on risk. Economic capital is assigned to each business segment using a risk-adjusted methodology incorporating each segment’s stand-alone credit, market, interest rate and operational risk components, and is used to measure risk-adjusted returns. Executive management assesses, and the Board oversees, the risk-adjusted returns of each business through review and approval of strategic and financial operating plans. By allocating economic capital to and establishing a risk appetite for a line of business, we effectively manage the ability to take on risk. Businesses operate within their credit, market, compliance and operational risk standards and limits in order to adhere to the risk appetite. These limits are based on analyses of risk and reward in each line of business, and executive management is responsible for tracking and reporting performance measurements as well as any exceptions to guidelines or limits. The Board monitors financial performance, execution of the strategic and financial operating plans, compliance with the risk appetite and the adequacy of internal controls through its committees.

Our business exposes us to strategic, credit, market, liquidity, compliance, operational and reputational risk. Strategic risk is the risk that adverse business decisions, ineffective or inappropriate business plans, or failure to respond to changes in the competitive environment, business cycles, customer preferences, product obsolescence, execution and/or other intrinsic risks of business will impact our ability to meet our objectives. Credit risk is the risk of loss arising from a borrower’s or counterparty’s inability to meet its obligations. Market risk is the risk that values of assets and liabilities or revenues will be adversely affected by changes in market conditions such as interest rate movements. Liquidity risk is the inability to accommodate liability maturities and deposit withdrawals, fund asset growth and meet contractual obligations through unconstrained access to funding at reasonable market rates. Compliance risk is the risk posed by the failure to manage regulatory, legal and ethical issues that could result in monetary damages, losses or harm to our reputation or image. Operational risk is the risk of loss resulting from inadequate or failed internal processes, people and systems or external events. Reputational risk, the risk that negative publicity will adversely affect the Corporation, is managed as a natural part of managing the other six types of risk. The following sections, Strategic Risk Management on page 47, Liquidity Risk and Capital Management beginning on page 47, Credit Risk Management beginning on page 54, Market Risk Management beginning on page 79, Compliance Risk Management on page 86, and Operational Risk Management beginning on page 86, address in more detail the specific procedures, measures and analyses of the major categories of risk that the Corporation manages.

On October 28, 2009,December 14, 2010, the Board approvedcompleted its annual review and approval of the Risk Framework and the Risk Appetite Statement for the Corporation. The Risk Framework defines the accountability of the Corporation and its associates and the Risk Appetite Statement defines the parameters under which we will take risk. Both documents are intended to enable us to maximize our long-term results and ensure the integrity of our assets and the quality of our earnings. The Risk Framework is designed to be used by our associates to understand risk management activities, including their individual roles and accountabilities. The Risk FrameworkIt also defines how risk management is integrated into our core business processes, and it defines the risk management governance structure, including management’s involvement. The risk management responsibilities of the lines of business, Governancegovernance and Controlcontrol functions, and Corporate Audit are also clearly defined. The Risk Frameworkdefined, and reflects how the

Board-approved risk appetite influences business and risk strategy. The risk management process (i.e.,contains four elements: identify and measure risk, mitigate and control risk, monitor and test risk, and report and review risk) was enhanced for executionrisk, and is applied across all business activities. The Risk Framework supportsactivities to enable an integrated and comprehensive review of risk consistent with the accountability of the Corporation and its associates to ensure the integrity of assets and the quality of earnings. TheBoard’s Risk Appetite Statement defines the parameters under which we will take

Statement.

risk to maximize our long-term results by ensuring the integrity of our assets and the quality of our earnings. Our intent is for our risk appetite to reflect a “through the cycle” view which will be reviewed and assessed annually.

Risk Management Processes and Methods

To ensure thatsupport our corporate goals and objectives, risk appetite, and business and risk strategies, are achieved, we utilizemaintain a governance structure that delineates the responsibilities for risk management process that is applied in executing all business activities.activities, as well as governance and oversight of those activities, by management and the Board. All functions and roles fallassociates have accountability for risk management. Each associate’s risk management responsibilities falls into one of three categories where risk must be managed. These aremajor categories: lines of business, Governancegovernance and Controlcontrol (Global Risk Management or other support groups)and enterprise control functions) and Corporate Audit.

The lines

Line of business managers and associates are responsibleaccountable for identifying, managing and managingescalating attention, as appropriate, to all existing, reputational and emerging risks in their business units, since this is where most of our risk-taking occurs.including existing and emerging risks. Line of business managers must ensure that their business activities are conducted within the risk appetite defined by management makes and executesapproved by the Board. The limits and controls for each business planmust be consistent with the Risk Appetite Statement. Line of business associates in client and customer facing businesses are responsible forday-to-day business activities, including developing and delivering profitable products and services, fulfilling customer requests and maintaining desirable customer relationships. These associates are accountable for conducting their daily work in accordance with policies and procedures. It is the responsibility of each associate to protect the Corporation and defend the interests of the shareholders.
Governance and control functions are comprised of Global Risk Management and the enterprise control functions. Global Risk Management is led by the Chief Risk Officer (CRO). The CRO leads senior management in managing risk, is independent from the Corporation’s lines of business and enterprise control functions, and maintains sufficient autonomy to develop and implement meaningful risk management measures. This position serves to protect the Corporation and its shareholders. The CRO reports to the Chief Executive Officer (CEO) and is closestthe management team lead or a participant in Board-level risk governance committees. The CRO has the mandate to ensure that appropriate risk management practices are in place, effective and consistent with our overall business strategy and risk appetite. Global Risk Management is comprised of two types of risk teams, Enterprise Risk Teams and independent line of business risk teams, which report to the changing nature of risksCRO and therefore, we believe is best able to implement procedures and controls that align to policies and limits. Risk self-assessments conducted by the business are used to identify risks and calibrate the severity of potential risk issues. These assessments are reviewed byindependent from the lines of business and executive management, including seniorenterprise control functions.
Enterprise Risk executives. To the extent appropriate, the assessmentsTeams are reviewed by the Board or its committees to ensure appropriateresponsible for setting and establishing enterprise policies, programs and standards, assessing program adherence, providing enterprise-level risk management and oversight, and to identify enterprise-widereporting and monitoring for systemic and emerging risk issues. Our management processes, structuresIn addition, the Enterprise Risk Teams are responsible for monitoring and ensuring that risk limits are reasonable and consistent with the risk appetite. These risk teams also carry out risk-based oversight of the enterprise control functions.
Independent line of business risk teams are responsible for establishing policies, aid us in complying with lawslimits, standards, controls, metrics and regulations and provide clear linesthresholds within the defined corporate standards for decision-making and accountability. Wherever practical, we attempt to house decision-making authority as close to the transaction as possible while retaining supervisory control functions from both inside and outside of the lines of business.

business to which they are aligned. The Governanceindependent line of business risk teams are responsible for ensuring that risk limits and Controlstandards are reasonable and consistent with the risk appetite.

Enterprise control functions include our Risk Management, Finance, Treasury, Technology and Operations, Human Resources, and Legal functions. These groups are independent of the lines of business and have risk governance and control responsibilities for enterprise programs. In this role, they are organized with both line of business-aligned and enterprise-wide functions. The Governance and Control functions are accountableresponsible for setting policies, standards and limits according to the Risk Appetite Statement,limits; providing risk reportingreporting; monitoring for systemic risk issues including existing, emerging and monitoring,reputational; and ensuring compliance. For example, inimplementing procedures and controls at the enterprise and line of business levels for their respective control functions. Enterprise control functions consist of the Chief Financial Officer group, Global Risk Management, a senior risk executive is assigned to each


60     Bank of America 2010


Technology and Operations, Global Human Resources, Global Marketing and Corporate Affairs, and Legal.
The Corporate Audit function and the Corporate General Auditor maintain independence from the lines of business and is responsible forgovernance and control functions by reporting directly to the oversightAudit Committee of all the risks associated with that line of business and ensuring compliance with policies, standards and limits. Enterprise-level risk executives have responsibility to develop and implement the framework for policies and practices to assess and manage enterprise-wide credit, market, compliance and operational risks.

Board. Corporate Audit provides an independent assessment of our management and internal control systemsvalidation through testing of key processes and controls across the organization.Corporation. Corporate Audit provides an independent assessment of the Corporation’s management and internal control systems. Corporate Audit activities are designed to provide reasonable assurance that resources are adequately protected; significant financial, managerial and operating information is materially complete, accurate and reliable; and employees’ actions are in compliance with the Corporation’s policies, standards, procedures, and applicable laws and regulations.

We use

To ensure that the Corporation’s goals and objectives, risk appetite, and business and risk strategies are achieved, we utilize a risk management process that is applied across the execution of all business activities, thatactivities. This risk management process, which is designed to identify and measure, mitigate and control, monitor and test, and report and review risks. This processan integral part of our Risk Framework, enables usthe Corporation to review risksrisk in an integrated and comprehensive manner across all risk categories and make strategic and business decisions based on that comprehensive view. Corporate goals and objectives and our risk appetite are established by executive management, approved by the Board, and are inputskey drivers to setting business and risk strategy which guidestrategy.
One of the executionkey tools of the risk management process is the use of Risk and Control Self Assessments (RCSAs). RCSAs are the primary method for facilitating the management of Business Environment and Internal Control Factor (BEICF) data. Theend-to-end RCSA process incorporates risk identification and assessment of the control environment; monitoring, reporting and escalating risk; quality assurance and data validation; and integration with the risk appetite. The RCSA process also incorporates documentation by either the line of business activities. Governance, continuous feedback, and independent testing and validation provide structured controls, reporting and auditor enterprise control function of the execution


Bank of America 200945


of risk processes and business activities. Examples of tools, methods and processes used include: self-assessments conducted by the lines of business in concert with independent risk assessments by Governance and Control (part of “identify and measure”); a system ofenvironment, risks, controls, and supervision which provides assurancemonitoring and reporting. This results in a comprehensive risk management view that associates act in accordance with laws, regulations, policiesenables understanding of and procedures (partaction on operational risks and controls for all of “mitigateour processes, products, activities and control”); independent testing of control and mitigation plans by Credit Review and Corporate Audit (part of “monitor and test”); and a summary risk report which includes key risk metrics that measure the performance of the Corporation against risk limits and the Risk Appetite Statement (part of “report and review”).

systems.

The formal processes used to manage risk represent only one portiona part of our overall risk management process. Corporate culture and the actions of our associates

are also critical to effective risk management. Through our Code of Ethics, we set a high standard for our associates. The Code of Ethics provides a framework for all of our associates to conduct themselves with the highest integrity in the delivery of our products or services to our customers. We instill a risk-consciousstrong and comprehensive risk management culture through communications, training, policies, procedures, and organizational roles and responsibilities. Additionally, we continue to strengthen the linkagelink between the associate performance management process and individual compensation to encourage associates to work toward enterprise-wide risk goals.

Board Oversight of Risk

We maintain a governance structure that delineates the responsibilities for risk management activities, as well as governance and oversight of those activities, by management and the Board. The majority of our directors, including the Chairman of the Board, are considered independent and meet the requirements of our Director Independence Categorical Standards and the criteria for independence in the listing standards of the New York Stock Exchange. Also, all members of the Audit and Enterprise Risk Committees are independent and all members of the Credit Committee are non-management directors.
The Board overseesis responsible for the oversight of the management of the Corporation’s businesses and affairs. InCorporation. As part of its oversight, the Board oversees the management of the Corporation,various types of risk faced by the Board’s goal is to set the tone for the highest ethical standards and performance of our management, associates and the Corporation as a whole. The Board strongly believes that good corporate governance practices are important for successful business performance.Corporation. Our corporate risk management governance practices arestructure is designed to align the interests of the Board and management with those of our stockholders and to promote honesty andfoster integrity throughout the Corporation. Over the past year, we have enhanced our corporate governance practices in many important ways, and we continue to monitor best practices to promote a high level of performance from the Board, management and our associates.
The Board, has adopted Corporate Governance Guidelines that embody long-standing practicesunder the leadership of its independent Chairman, oversees the management of the Corporation as well as current corporatethrough the governance best practices.structure, which includes Board committees and management committees. The Board maintains standing committees to oversee risk. The committees with the majority of risk oversight responsibilities include the Credit, Enterprise Risk and Audit Committees.


Bank of America 2010     61

In 2009,


The figure below illustrates the inter-relationship between the Board, established a special Board committeelevel committees and management level committees with five non-management members (the “Special Governance Committee”)the majority of risk oversight responsibilities for the Corporation.
(1) Compliance Risk activities, including Ethics Oversight, are required to review and recommend changes in all aspects of the Board’s activities. In recognition of the increased complexity of our company following the major acquisitions of Merrill Lynch and Countrywide, and the challenges of the current business environment, the Board has strengthened its membership by appointing new directors who are independent of management and demonstrate significant banking, financial and investment banking expertise. In addition, the Board has assessed and further developed its structures and processes through which it fulfills its oversight rolebe reviewed by the following: modifying committee membership and leadership to best leverage the abilities and backgrounds of the Board members; recasting the Asset Quality Committee as a more targeted and focused CreditAudit Committee and establishingOperational Risk activities are required to be reviewed by the Enterprise Risk Committee.
(2) The Disclosure Committee such that these two committees, together withassists the Audit Committee, workCEO and CFO in complement to ensure that key aspects of risk, capitalfulfilling their responsibility for the accuracy and liquidity management are specifically overseen by committees with clear and affirmative oversight responsibilities set forth in their committee charters; working with management and outside regulatory experts to redesign

management reports to the Board and committees; periodically reviewing the composition of the Board in lighttimeliness of the Corporation’s businessdisclosures and structure to identify and nominate director candidates who possess relevant experience, qualifications, attributes and skillsreports the results of the process to the Board; and enhancing the director orientation process to include, among other changes, increased interaction with executive management and increased focus on key risks.

At the Corporation, the Audit Credit and Enterprise Risk Committees are charged with a majority of the risk oversight responsibilities on behalf of the Board. In 2009, as noted above, the Board recast the Asset Quality Committee as a more targeted and focused Credit Committee and established a new Enterprise Risk Committee.

The Credit Committee oversees, among other things, theis responsible for oversight of senior management’s identification and management of ourthe Corporation’s credit exposures on an enterprise-wide basis, our responseas well as the Corporation’s responses to trends affecting those exposures,exposures. The Credit Committee is also responsible for oversight of senior management’s actions relating to the adequacy of the allowance for credit losses and our credit relatedthe Corporation’s credit-related policies.
The Enterprise Risk Committee among other things, oversees ouris responsible for exercising oversight of senior management’s responsibility to identify the material risks facing the Corporation and oversight of senior management’s planning for and management of and policies and procedures with respect tothe Corporation’s material risks, on an enterprise-wide basis, including market risk, interest rate risk, liquidity risk, operational risk and reputational risk. ItThe Enterprise Risk Committee also oversees our capitalsenior management’s establishment of policies and guidelines articulating the Corporation’s risk tolerances for material categories of risk, the performance and functioning of the Corporation’s overall risk management function, and senior management’s establishment of appropriate systems that support control of market risk, interest rate risk and liquidity planning. risk.
The Audit Committee retains oversight responsibilityis responsible for operational risk,assisting the Board in overseeing the integrity of our consolidated financial statements, compliance, legal riskthe Corporation’s Consolidated Financial Statements and overallthe effectiveness of the Corporation’s system of internal controls and policies and practices relating toprocedures for managing and assessing risk, management. In addition toincluding compliance with legal and regulatory requirements. The Audit Committee also provides approval and direct oversight of the three riskindependent registered public accounting firm, including such firm’s assessment of management’s assertion of the effectiveness of the Corporation’s disclosure controls and procedures and

the Corporation’s internal control over financial reporting; and oversight committees, the Compensationof such accountant’s appointment, compensation, qualifications and Benefitsindependence. The Audit Committee also oversees the Corporation’s compensation practices in order that they do not encourage unnecessary and excessive risk taking by our associates.

corporate audit function.

The Audit, Credit, and Enterprise Risk and Audit Committees work in tandem to provide enterprise-wide oversight of the Corporation’s management and handling of risk. Each of these three committees reports regularly to the Board on risk-related matters within its responsibilities and together this providesthey provide the Board with integrated, thorough insight about our management of strategic, credit, market, liquidity, compliance, legal, operational and reputational risks.

Starting in 2009, the Board formalized its process of approving the Corporation’s articulation of its risk appetite, which is used internally to help the directors and management understand more clearly the Corporation’s tolerance for risk in each of the major risk categories, the way those risks are measured and the key controls available that influence the Corporation’s level of risk-taking. The Board intends to undertake this process annually going forward. The Board also approves, at a high level, following proposal by management, the Corporation’s framework for managing risk.

At meetings of theeach Board committee and the Audit, Credit and Enterprise Risk Committees,our Board, directors receive updates from management regarding all aspects of enterprise risk management, including our performance against theour identified risk appetite. The Chief

Executive management develops for Board approval the Corporation’s Risk Officer, who is responsible for instituting risk management practices that are consistentFramework, Risk Appetite Statement, and strategic and financial operating plans. Management and the Board, through the Credit, Enterprise Risk and Audit Committees, monitor financial performance, execution of the strategic and financial operating plans, compliance with our overall business strategy andthe risk appetite, and the General Counsel, who manages legal risk, both report directly to the Chief Executive Officer and lead management’s risk and legal risk discussions at Board and committee meetings. In addition, the Corporate General Auditor, who is responsible for assessing the company’s control environment over significant financial, managerial, and operating information, is independentadequacy of management and reports directly to the Audit Committee. The Corporate General Auditor also administratively reports to our Chief Executive Officer. Outside of formal meetings, Board members have regular access to senior executives, including the Chief Risk Officer and the General Counsel.

internal controls.

46Bank of America 2009


Strategic Risk Management

Strategic risk is embedded in every line of business and is partone of the other major risk categories (credit,along with credit, market, liquidity, compliance, operational and operational).reputational risks. It is the risk that results from adverse business decisions,


62     Bank of America 2010


ineffective or inappropriate business plans, or failure to respond to changes in the competitive environment, business cycles, customer preferences, product obsolescence, regulatory environment, business strategy executionand/or other inherent risks of the business including reputational risk. In the financial services industry, strategic risk is high due to changing customer, competitive and regulatory environments. The Corporation’sOur appetite for strategic risk is continually assessed within the context of the strategic plan, with strategic risks selectively and carefully taken to maintain relevanceconsidered in the context of the evolving marketplace. Strategic risk is managed in the context of our overall financial condition and assessed, managed and acted on by the Chief Executive Officer and executive management team. Significant strategic actions, such as material acquisitions or capital actions, are reviewed and approved by the Board.

Using a plan developed by management, executive

Executive management and the Board approve a strategic plan every two to three years. Annually, executive management develops a financial operating plan and the Board reviews and approves the plan. ExecutiveWith oversight by the Board, executive management with Board oversight, ensures that the plans are consistent with the Corporation’s strategic plan, core operating tenets and risk appetite. The following are assessed in their reviews: forecasted earnings and returns on capital;capital, the current risk profile, current capital and liquidity requirements, staffing levels and changes required to support the plan; current capital and liquidity requirements and changes required to support the plan;plan, stress testing results;results, and other qualitative factors such as market growth rates and peer analysis. ExecutiveWith oversight by the Board, executive management with Board oversight, performs similar analyses throughout the year, and will definedefines changes to the financial forecast or the risk, capital or liquidity positions as deemed appropriate to balance and optimize between achieving the targeted risk appetite and shareholder returns and maintaining the targeted financial strength.

We use proprietary models to measure the capital requirements for credit, country, market, operational and strategic risks. The economic capital assigned to each line of business is based on its unique risk exposures. With oversight by the Board, executive management assesses the risk-adjusted returns of each business in approving strategic and financial operating plans. The businesses use economic capital to define business strategies, price products and transactions, and evaluate client profitability.
Capital Management
Bank of America manages its capital position to maintain a strong and flexible financial position in order to perform through economic cycles, take advantage of organic growth opportunities, maintain ready access to financial markets, remain a source of financial strength for its subsidiaries, and return capital to its shareholders as appropriate.
To determine the appropriate level of capital, we assess the results of our Internal Capital Adequacy Assessment Process (ICAAP), the current economic and market environment, and feedback from investors, ratings agencies and regulators. Based upon this analysis we set capital guidelines for Tier 1 common capital and Tier 1 capital to ensure we can maintain an adequate capital position in a severe adverse economic scenario. We also target to maintain capital in excess of the capital required per our economic capital measurement process (see Economic Capital on page 66). Management and the Board annually approve a comprehensive Capital Plan which documents the ICAAP and related results, analysis and support for the capital guidelines, and planned capital actions and capital adequacy assessment.
The ICAAP incorporates capital forecasts, stress test results, economic capital, qualitative risk assessments and assessment of regulatory changes. We generate monthly regulatory capital and economic capital forecasts that are aligned to the most recent earnings, balance sheet and risk forecasts. We utilize quarterly stress tests to assess the potential impacts to earnings, capital and liquidity for a variety of economic stress scenarios. We perform qualitative risk assessments to identify and assess material risks not fully captured in the forecasts, stress tests or economic capital. Given the significant proposed regulatory capital changes, we also regularly assess the potential capital

impacts and monitor associated mitigation actions. Management continuously assesses ICAAP results and provides documented quarterly assessments of the adequacy of the capital guidelines and capital position to the Board.
Capital management is integrated into the risk and governance processes, as capital is a key consideration in development of the strategic plan, risk appetite and risk limits. Economic capital is allocated to each business unit and used to perform risk-adjusted return analysis at the business unit, client relationship and transaction level.
Regulatory Capital
As a financial services holding company, we are subject to the risk-based capital guidelines (Basel I) issued by the Federal Reserve. At December 31, 2010, we operated banking activities primarily under two charters: Bank of America, N.A. and FIA Card Services, N.A. which are subject to the risk-based capital guidelines issued by the Office of the Comptroller of the Currency (OCC). Under these guidelines, the Corporation and its affiliated banking entities measure capital adequacy based on Tier 1 common capital, Tier 1 capital and Total capital (Tier 1 plus Tier 2 capital). Capital ratios are calculated by dividing each capital amount by risk-weighted assets. Additionally, Tier 1 capital is divided by adjusted quarterly average total assets to derive the Tier 1 leverage ratio.
Tier 1 capital is calculated as the sum of “core capital elements.” The predominate components of core capital elements are qualifying common stockholders’ equity, any CES and qualifying noncumulative perpetual preferred stock. Also included in Tier 1 capital are qualifying trust preferred capital debt securities (Trust Securities), hybrid securities and qualifying non-controlling interest in subsidiaries which are subject to the rules governing “restricted core capital elements.” Goodwill, other disallowed intangible assets, disallowed deferred tax assets and the cumulative changes in fair value of all financial liabilities accounted for under a fair value option that are included in retained earnings and are attributable to changes in the company’s own creditworthiness are deducted from the sum of the core capital elements. Total capital is Tier 1 plus supplementary Tier 2 capital elements such as qualifying subordinated debt, a limited portion of the allowance for loan and lease losses, and a portion of net unrealized gains on AFS marketable equity securities. Tier 1 common capital is not an official regulatory ratio, but was introduced by the Federal Reserve during the Supervisory Capital Assessment Program in 2009. Tier 1 common capital is Tier 1 capital less preferred stock, Trust Securities, hybrid securities and qualifying non-controlling interest in subsidiaries.
Risk-weighted assets are calculated for credit risk for all on- and off-balance sheet credit exposures and for market risk on trading assets and liabilities, including derivative exposures. Credit risk risk-weighted assets are calculated by assigning a prescribed risk-weight to all on-balance sheet assets and to the credit equivalent amount of certain off-balance sheet exposures. The risk-weight is defined in the regulatory rules based upon the obligor or guarantor type and collateral if applicable. Off-balance sheet exposures include financial guarantees, unfunded lending commitments, letters of credit and derivatives. Market risk risk-weighted assets are calculated using risk models for the trading account positions, including all foreign exchange and commodity positions regardless of the applicable accounting guidance. Under Basel I there are no risk-weighted assets calculated for operational risk. Any assets that are a direct deduction from the computation of capital are excluded from risk-weighted assets and adjusted average total assets consistent with regulatory guidance.
For additional information on these and other regulatory requirements, seeNote 18 – Regulatory Requirements and Restrictionsto the Consolidated Financial Statements.
Capital Composition and Ratios
On January 21, 2010, the joint agencies issued a final rule regarding the impact of the new consolidation guidance on risk-based capital. The incremental impact on January 1, 2010 was an increase in assets of $100.4 billion and risk-weighted assets of $21.3 billion and a reduction in Tier 1 common


Bank of America 2010     63


capital and Tier 1 capital of $9.7 billion. The overall effect of the new consolidation guidance and the final rule was a decrease in Tier 1 capital and Tier 1 common capital ratios of 76 bps and 73 bps on January 1, 2010.
We continued to strengthen capital in 2010 as evidenced by the $4.7 billion growth in Tier 1 common capital or $14.4 billion before the impact of the new consolidation guidance. The increase was driven by the $10.2 billion in earnings generated in 2010, excluding the goodwill impairment charges of $12.4 billion. Tier 1 capital and Total capital grew by $3.2 billion and $3.5 billion in 2010 or by $13.0 billion and $12.9 billion when adjusted for the impact of the new consolidation guidance.
Risk-weighted assets declined by $87 billion in 2010 including the impact of the new consolidation guidance. The risk-weighted asset reduction is consistent with our continued efforts to reduce non-core assets and legacy loan portfolios.
As a result of the increased capital position and reduced risk-weighted assets, the Tier 1 common capital ratio increased 79 bps to 8.60 percent, the Tier 1 capital ratio increased 84 bps to 11.24 percent and Total capital increased 111 bps to 15.77 percent in 2010. When adjusted for the impacts of the new consolidation guidance, the growth in the ratios was more significant.

The Tier 1 leverage ratio increased 33 bps to 7.21 percent, reflecting both the strengthening of the capital position previously mentioned and a $62 billion reduction in adjusted quarterly average total assets including the impact of the new consolidation guidance.
The $12.4 billion goodwill impairment charges recognized during 2010 did not impact the regulatory capital ratios.
The table below presents the Corporation’s capital ratios and related information at December 31, 2010 and 2009.
Table 12 Regulatory Capital
         
  December 31 
(Dollars in billions) 2010  2009 
Tier 1 common equity ratio  8.60%  7.81%
Tier 1 capital ratio  11.24   10.40 
Total capital ratio  15.77   14.66 
Tier 1 leverage ratio  7.21   6.88 
Risk-weighted assets $1,456  $1,543 
Adjusted quarterly average total assets (1)
  2,270   2,332 
         
(1)Reflects adjusted average total assets for the three months ended December 31, 2010 and 2009.


The table below presents the capital composition at December 31, 2010 and 2009.
Table 13 Capital Composition
           
   December 31 
(Dollars in millions)  2010   2009 
Total common shareholders’ equity  $211,686   $194,236 
Goodwill   (73,861)   (86,314)
Nonqualifying intangible assets (includes core deposit intangibles, affinity relationships, customer relationships and other intangibles)   (6,846)   (8,299)
Net unrealized gains or losses on AFS debt and marketable equity securities and net losses on derivatives recorded in accumulated OCI,net-of-tax
   (4,137)   1,034 
Unamortized net periodic benefit costs recorded in accumulated OCI,net-of-tax
   3,947    4,092 
Exclusion of fair value adjustment related to structured notes (1)
   2,984    2,981 
Common Equivalent Securities       19,290 
Disallowed deferred tax asset   (8,663)   (7,080)
Other   29    454 
           
Total Tier 1 common capital
   125,139    120,394 
           
Preferred stock   16,562    17,964 
Trust preferred securities   21,451    21,448 
Noncontrolling interest   474    582 
           
Total Tier 1 capital
   163,626    160,388 
           
Long-term debt qualifying as Tier 2 capital   41,270    43,284 
Allowance for loan and lease losses   41,885    37,200 
Reserve for unfunded lending commitments   1,188    1,487 
Allowance for loan and lease losses exceeding 1.25 percent of risk-weighted assets   (24,690)   (18,721)
45 percent of the pre-tax net unrealized gains on AFS marketable equity securities   4,777    1,525 
Other   1,538    907 
           
Total capital
  $229,594   $226,070 
           
(1)Represents loss on structured notes,net-of-tax, that is excluded from Tier 1 common capital, Tier 1 capital and Total capital for regulatory purposes.

Regulatory Capital Changes
In June 2004, the Basel II Accord was published by the Basel Committee on Banking Supervision (the Basel Committee) with the intent of more closely aligning regulatory capital requirements with underlying risks, similar to economic capital. While economic capital is measured to cover unexpected losses, we also manage regulatory capital to adhere to regulatory standards of capital adequacy.
The Basel II Final Rule (Basel II) which was published in December 2007 established requirements for U.S. implementation of the Basel Committee’s Basel II Accord and provides detailed requirements for a new regulatory capital framework. This regulatory capital framework includes requirements related to credit and operational risk (Pillar 1), supervisory requirements

(Pillar 2) and disclosure requirements (Pillar 3). We began the Basel II parallel qualification period on April 1, 2010.
Designated U.S. financial institutions are required to complete a minimum parallel qualification period under Basel II of four consecutive successful quarters before receiving regulatory approval to report regulatory capital using the Basel II methodology and exiting the parallel period. During the parallel period, the resulting capital calculations under both the current risk-based capital rules (Basel I) and Basel II will be reported to the financial institutions’ regulatory supervisors. Once the parallel period is successfully completed and we have received approval to exit parallel, we will transition to Basel II as the methodology for calculating regulatory capital. Basel II provides for a three-year transitional floor subsequent to exiting parallel, after which Basel I may be discontinued. The Collins Amendment within the Financial


64     Bank of America 2010


Reform Act and the U.S. banking regulators’ subsequent Notice of Proposed Rulemaking published by the Federal Reserve on December 14, 2010 propose however that the current three-year transitional floors under Basel II be replaced with a permanent risk based capital floor as defined under Basel I.
On December 16, 2010, U.S. regulators issued a Notice of Proposed Rulemaking on the Risk-Based Capital Guidelines for Market Risk (Market Risk Rules), reflecting partial adoption of the Basel Committee’s July 2009 consultative document on the topic. We anticipate U.S. regulators will adopt the Market Risk Rules in mid-2011. This change is expected to significantly increase the capital requirements for our trading assets and liabilities, including derivatives exposures which meet the definition established by the regulatory agencies. We continue to evaluate the capital impact of the proposed rules and currently anticipate being fully compliant with any final rules by the projected implementation date of year-end 2011.
On December 16, 2010, the Basel Committee issued “Basel III: A global regulatory framework for more resilient banks and banking systems” (Basel III), proposing a January 2013 implementation date for Basel III. If implemented by U.S. regulators as proposed, Basel III could significantly increase our capital requirements. Basel III and the Financial Reform Act propose the disqualification of trust preferred securities from Tier 1 capital, with the Financial Reform Act proposing the disqualification be phased in from 2013 to 2015. Basel III also proposes the deduction of certain assets from capital (deferred tax assets, MSRs, investments in financial firms and pension assets, among others, within prescribed limitations), the inclusion of other comprehensive income in capital, increased capital for counterparty credit risk, and new minimum capital and buffer requirements. The phase-in period for the capital deductions is proposed to occur in 20 percent increments from 2014 through 2018 with full implementation by December 31, 2018. The increase in capital requirements for counterparty credit risk is proposed to be effective January 2013. The phase-in period for the new minimum capital requirements and related buffers is proposed to occur between 2013 and 2019. U.S. regulators are expected to begin the final rulemaking processes for Basel III in early 2011 and have indicated a goal to adopt final rules by year-end 2011 or early 2012. For additional information on our MSRs, refer toNote 25 – Mortgage Servicing Rightsto the Consolidated Financial Statements. For additional information on deferred tax assets, refer toNote 21 – Income Taxesto the Consolidated Financial Statements.
If Basel III is implemented in the U.S. consistent with Basel Committee rules, beginning in January 2013, we would be required to maintain minimum capital ratio requirements of 6.0 percent for Tier 1 capital and 8.0 percent for Total capital. Basel III also includes a proposed minimum requirement for common equity Tier 1 capital of 3.5 percent beginning in 2013 which would

increase to 4.5 percent in 2015. Basel III also includes three capital buffers which would be phased in over time and impact all three capital ratios. These buffers include a capital conservation buffer that would start at 0.63 percent in 2016 and increase to 2.5 percent in 2019. Thus, the minimum capital ratio requirements including the capital conservation buffer in 2019 would be 7.0 percent for common equity Tier 1 capital, 8.5 percent for Tier 1 capital and 10.5 percent for Total capital. If ratios fall below the minimum requirement plus the capital conservation buffer, such as 10.5 percent for Total capital, an institution would be required to restrict dividends, share repurchases and discretionary bonuses. Additionally, Basel III also includes a countercyclical buffer of up to 2.5 percent that regulators could require in periods of excess credit growth. The countercyclical buffer is to be comprised of loss-absorbing capital, such as common equity, and is meant to retain additional capital during periods of excess credit growth providing incremental protection in the event of a material market downturn. The ratios presented above do not include the third buffer requirement for systemically important financial institutions, which the Basel Committee continues to assess and has not yet quantified. The countercyclical and systemic buffers are scheduled to be phased in from 2013 through 2019. U.S. regulators are expected to begin the rulemaking processes for Basel III in early 2011 and have indicated a goal to adopt final rules by the end of 2011 or early 2012.
These regulatory changes also require approval by the agencies of analytical models used as part of our capital measurement and assessment, especially in the case of more complex models. If these more complex models are not approved, it could require financial institutions to hold additional capital, which in some cases could be significant.
We expect to maintain a Tier 1 common capital ratio in excess of eight percent as the regulatory rule changes are implemented without needing to raise new equity capital. We have made the implementation and mitigation of these regulatory changes a strategic priority. We also note there remains significant uncertainty on the final impacts as the U.S. has issued final rules only for Basel II and a Notice of Proposal Rulemaking for the Market Risk Rules at this time. Impacts may change as the U.S. finalizes rules and the regulatory agencies interpret the final rules for Basel III during the implementation process.
Bank of America, N.A. and FIA Card Services, N.A. Regulatory Capital
The table below presents regulatory capital information for Bank of America N.A. and FIA Card Services, N.A. at December 31, 2010 and 2009. The goodwill impairment charges recognized in 2010 did not impact the regulatory capital ratios.


Table 14 Bank of America, N.A. and FIA Card Services, N.A. Regulatory Capital
                  
   December 31 
   2010  2009 
(Dollars in millions)  Ratio  Amount  Ratio  Amount 
Tier 1
                 
Bank of America, N.A.   10.78% $114,345   10.30% $111,916 
FIA Card Services, N.A.   15.30   25,589   15.21   28,831 
Total
                 
Bank of America, N.A.   14.26   151,255   13.76   149,528 
FIA Card Services, N.A.   16.94   28,343   17.01   32,244 
Tier 1 leverage
                 
Bank of America, N.A.   7.83   114,345   7.38   111,916 
FIA Card Services, N.A.   13.21   25,589   23.09   28,831 
                  

The Bank of America, N.A. Tier 1 and Total capital ratio increased 48 bps to 10.78 percent and 50 bps to 14.26 percent at December 31, 2010 compared to December 31, 2009. The increase in the ratios was driven by $11.1 billion

in earnings generated in 2010 combined with a $26.4 billion decline in risk-weighted assets. The Tier 1 leverage ratio increased 45 bps to 7.83 percent benefiting from the improvement in Tier 1 capital combined with a $56.0 billion


Bank of America 2010     65


decrease in adjusted quarterly average total assets. The reduction in risk-weighted assets and adjusted quarterly average total assets is consistent with our continued efforts to reduce non-core assets and legacy loan portfolios.
The FIA Card Services, N.A. Tier 1 capital ratio increased 9 bps to 15.30 percent and Total capital ratio decreased 7 bps to 16.94 percent compared to December 31, 2009. The increase in Tier 1 capital ratio was due to a decrease in risk-weighted assets of $22.3 billion. The decrease in the Total capital ratio was due to a reduction in Tier 2 capital resulting from a $390 million decrease in qualifying term subordinated debt combined with a net increase in the allowance for credit losses limitation of $269 million. The Tier 1 leverage ratio decreased to 13.21 percent at December 31, 2010 from 23.09 percent at December 31, 2009 due to a $68.9 billion increase in adjusted quarterly average total assets. The increase in adjusted quarterly average total assets was the result of the adoption of new consolidation guidance.
Broker/Dealer Regulatory Capital
Bank of America’s principal U.S. broker/dealer subsidiaries are Merrill Lynch, Pierce, Fenner & Smith (MLPF&S) and Merrill Lynch Professional Clearing Corp (MLPCC). MLPCC is a subsidiary of MLPF&S and provides clearing and settlement services. Both entities are subject to the net capital requirements of SECRule 15c3-1. Both entities are also registered as futures commission merchants and subject to the Commodity Futures Trading Commission (CFTC) Regulation 1.17.
MLPF&S has elected to compute the minimum capital requirement in accordance with the “Alternative Net Capital Requirement” as permitted by SECRule 15c3-1. At December 31, 2010, MLPF&S’s regulatory net capital as defined byRule 15c3-1 was $9.8 billion and exceeded the minimum requirement of $736 million by $9.1 billion. MLPCC’s net capital of $2.3 billion exceeded the minimum requirement by $2.1 billion.
In accordance with the Alternative Net Capital Requirements, MLPF&S is required to maintain tentative net capital in excess of $1 billion and notify the SEC in the event its tentative net capital is less than $5 billion. At December 31, 2010, MLPF&S had tentative net capital in excess of the minimum and notification requirements.
Economic Capital
Our economic capital measurement process provides a risk-based measurement of the capital required for unexpected credit, market and operational losses over a one-year time horizon at a 99.97 percent confidence level, consistent with a “AA” credit rating. Economic capital is allocated to each business unit based upon its risk positions and contribution to enterprise risk, and is used for capital adequacy, performance measurement and risk management purposes. The strategic planning process utilizes economic capital with the goal of allocating risk appropriately and measuring returns consistently across all businesses and activities.
Credit Risk Capital
Economic capital for credit risk captures two types of risks: default risk, which represents the loss of principal due to outright default or the borrower’s inability to repay an obligation in full, and migration risk, which represents potential loss in market value due to credit deterioration over the one-year capital time horizon. Credit risk is assessed and modeled for all on- and off-balance sheet credit exposures withinsub-categories for commercial, retail, counterparty and investment securities. The economic capital methodology captures dimensions such as concentration and country risk and originated securitizations. The economic capital methodology is based on the probability

of default, loss given default, exposure at default and maturity for each credit exposure, and the portfolio correlations across exposures. See page 71 for more information on Credit Risk Management.
Market Risk Capital
Market risk reflects the potential loss in the value of financial instruments or portfolios due to movements in foreign exchange and interest rates, credit spreads, and security and commodity prices. Bank of America’s primary market risk exposures are in its trading portfolio, equity investments, MSRs and the interest rate exposure of its core balance sheet. Economic capital is determined by utilizing the same models the Corporation used to manage these risks including, for example, Value-at-Risk, simulation, stress testing and scenario analysis. See page 100 for additional information on Market Risk Management.
Operational Risk Capital
We calculate operational risk capital at the business unit level using actuarial-based models and historical loss data. We supplement the calculations with scenario analysis and risk control assessments. See Operational Risk Management beginning on page 106 for more information.
Capital Actions
The Corporation held a special meeting of stockholders on February 23, 2010 at which we obtained stockholder approval of an amendment to our amended and restated certificate of incorporation to increase the number of authorized shares of our common stock from 10.0 billion to 11.3 billion. On February 24, 2010, approximately 1.3 billion shares of common stock were issued through the conversion of CES into common stock. For more information regarding this conversion, see Preferred Stock Issuances and Exchanges on page 67.
In January 2009, we issued approximately 1.4 billion shares of common stock in connection with the acquisition of Merrill Lynch. For additional information regarding the Merrill Lynch acquisition, seeNote 2 – Merger and Restructuring Activityto the Consolidated Financial Statements. In addition, in 2009, we issued warrants to purchase approximately 199.1 million shares of common stock in connection with preferred stock issuances to the U.S. government. For more information, see Preferred Stock Issuances and Exchanges on page 67. In 2009, we issued 1.3 billion shares of common stock at an average price of $10.77 per share through anat-the-market issuance program resulting in gross proceeds of approximately $13.5 billion. In addition, during 2010 and 2009, we issued approximately 98.6 million and 7.4 million shares under employee stock plans.
Troubled Asset Relief Program – Related Asset Sales
We received notification from the Federal Reserve confirming that we fulfilled our commitment to increase equity by $3.0 billion through asset sales to be completed by December 31, 2010. The commitment was made in connection with the approval we received in December 2009 to repurchase the preferred stock that we issued as a result of our participation in the Troubled Asset Relief Program (TARP).
There were no common shares repurchased in 2010 except for shares acquired under equity incentive plans, as discussed in Item 5. Market for Registrant’s Common Equity, Related Stockholder Matters and Issuer Purchases of Equity Securities of thisForm 10-K. Currently, there is no existing Board authorized share repurchase program. For more information regarding our common share issuances, seeNote 15 – Shareholders’ Equityto the Consolidated Financial Statements.
We currently intend to modestly increase the common stock dividends in the second half of 2011 subject to approval by the Federal Reserve.


66     Bank of America 2010


Common Stock Dividends
The table below is a summary of our declared quarterly cash dividends on common stock during 2010 and through February 25, 2011.
Table 15 Common Stock Cash Dividend Summary
                
           Dividend
 
Declaration Date  Record Date   Payment Date   Per Share 
January 26, 2011   March 4, 2011    March 25, 2011   $0.01 
October 25, 2010   December 3, 2010    December 24, 2010    0.01 
July 28, 2010   September 3, 2010    September 24, 2010    0.01 
April 28, 2010   June 4, 2010    June 25, 2010    0.01 
January 27, 2010   March 5, 2010    March 26, 2010    0.01 
                
Preferred Stock Issuances and Exchanges
In 2009, we completed an offer to exchange outstanding depositary shares of portions of certain series of preferred stock up to approximately 200 million shares of common stock at an average price of $12.70 per share. In addition, we also entered into agreements with certain holders of other non-government perpetual preferred shares to exchange their holdings of approximately $10.9 billion aggregate liquidation preference of perpetual preferred stock into approximately 800 million shares of common stock. In total, the exchange offer and these privately negotiated exchanges covered the exchange of $14.8 billion aggregate liquidation preference of perpetual preferred stock into 1.0 billion shares of common stock. In 2009, we recorded an increase to retained earnings and net income applicable to common shareholders of $576 million related to these exchanges. This represents the net of a $2.6 billion benefit due to the excess of the carrying value of our non-convertible preferred stock over the fair value of the common stock exchanged. This was partially offset by a $2.0 billion inducement to convertible preferred shareholders representing the excess of the fair value of the common stock exchanged, which was accounted for as an induced conversion of convertible preferred stock, over the fair value of the common stock that would have been issued under the original conversion terms.
On December 2, 2009, we received approval from the U.S. Treasury and Federal Reserve to repay the U.S. government’s $45.0 billion preferred stock investment provided under TARP. In accordance with the approval, on December 9, 2009, we repurchased all outstanding shares of Cumulative Perpetual Preferred Stock Series N, Series Q and Series R issued to the U.S. Treasury as part of the TARP. While participating in the TARP we recorded $7.4 billion in dividends and accretion on the TARP Preferred Stock and repayment saved us approximately $3.6 billion in annual dividends and accretion. We did not repurchase the related common stock warrants issued to the U.S. Treasury in connection with its TARP investment. The U.S. Treasury auctioned these warrants in March 2010. For more detail on the TARP Preferred Stock, refer toNote 15 – Shareholders’ Equityto the Consolidated Financial Statements.
We repurchased the TARP Preferred Stock through the use of $25.7 billion in excess liquidity and $19.3 billion in proceeds from the sale of 1.3 billion units of CES valued at $15.00 per unit. The CES consisted of depositary shares representing interests in shares of Common Equivalent Junior Preferred Stock Series S (Common Equivalent Stock) and warrants (Contingent Warrants) to purchase an aggregate 60 million shares of the Corporation’s common stock. Each depositary share represented a 1/1,000th interest in a share of Common Equivalent Stock and each Contingent Warrant granted the holder the right to purchase 0.0467 of a share of a common stock for $0.01 per share. Each depositary share entitled the holder, through the depository, to a proportional fractional interest in all rights and preferences of the Common Equivalent Stock, including conversion, dividend, liquidation and voting rights.
The Corporation held a special meeting of stockholders on February 23, 2010 at which we obtained stockholder approval of an amendment to our amended and restated certificate of incorporation to increase the number of

authorized shares of our common stock. Following effectiveness of the amendment, on February 24, 2010, the Common Equivalent Stock converted in full into our common stock and the Contingent Warrants automatically expired without becoming exercisable, and the CES ceased to exist.
On October 15, 2010, all of the outstanding shares of the mandatory convertible Preferred Stock, Series 2 and Series 3, of Merrill Lynch automatically converted into an aggregate of 50 million shares of the Corporation’s Common Stock in accordance with the terms of these preferred securities.
For more information on cash dividends declared on preferred stock, see Table III.
Enterprise-wide Stress Testing
As a part of our core risk management practices, we conduct enterprise-wide stress tests on a periodic basis to better understand earnings, capital and liquidity sensitivities to certain economic and business scenarios, including economic and market conditions that are more severe than anticipated. These enterprise-wide stress tests provide an understanding of the potential impacts from our risk profile to earnings, capital and liquidity, and serve as a key component of our capital management practices. Scenarios are selected by a group comprised of senior line of business, risk and finance executives. Impacts to each line of business from each scenario are then determined and analyzed, primarily leveraging the models and processes utilized in everyday management routines. Impacts are assessed along with potential mitigating actions that may be taken. Analysis from such stress scenarios is compiled for and reviewed through our Risk Oversight Committee (ROC), Asset Liability Market Risk Committee (ALMRC) and the Board’s Enterprise Risk Committee, and serves to inform and be incorporated, along with other core business processes, into decision-making by management and the Board. We have made substantial investments to establish stress testing capabilities as a core business process.
Liquidity Risk and Capital Management

Funding and Liquidity Risk Management

We define liquidity risk as the potential inability to meet our contractual and contingent financial obligations, on- or off-balance sheet, as they come due. Our primary liquidity objective is to ensure adequate funding for our businesses throughout market cycles, including during periods of financial stress. To achieve that objective, we analyze and monitor our liquidity risk, maintain excess liquidity and access diverse funding sources including our stable deposit base. We define excess liquidity as readily available assets, limited to cash and high-quality, liquid, unencumbered securities that we can use to meet our funding requirements as those obligations arise.

Global funding and liquidity risk management activities are centralized within Corporate Treasury. We believe that a centralized approach to funding and liquidity risk management enhances our ability to monitor liquidity requirements, maximizes access to funding sources, minimizes borrowing costs and facilitates timely responses to liquidity events.

The BoardEnterprise Risk Committee approves the Corporation’s liquidity policy and contingency funding plan, including establishing liquidity risk tolerance levels. The Asset and Liability Market Risk Committee (ALMRC),ALMRC, in conjunction with the Board and its committees, monitors our liquidity position and reviews the impact of strategic decisions on our liquidity. ALMRC is responsible for managing liquidity risks and ensuring exposures remain within the established tolerance levels. ALMRC delegates additional oversight responsibilities to the Risk Oversight Committee (ROC),ROC, which reports to ALMRC. The ROC reviews and monitors our liquidity position, cash flow forecasts, stress testing scenarios and results, and implements our liquidity limits and guidelines. For more information, refer to Board Oversight of Risk beginning on page 46.

61.

Under this governance framework, we have developed the followingcertain funding and liquidity risk management practices:practices which include: maintaining excess


Bank of America 2010     67

Maintain excess liquidity at the parent company and selected subsidiaries, including our bank and broker/dealer subsidiaries

Determine what amounts of excess liquidity are appropriate for these entities based on analysis of debt maturities and other potential cash outflows, including those that we may experience during stressed market conditions

Diversify funding sources, considering our asset profile and legal entity structure

Perform contingency planning


liquidity at the parent company and selected subsidiaries, including our bank and broker/dealer subsidiaries; determining what amounts of excess liquidity are appropriate for these entities based on analysis of debt maturities and other potential cash outflows, including those that we may experience during stressed market conditions; diversifying funding sources, considering our asset profile and legal entity structure; and performing contingency planning.
Global Excess Liquidity Sources and Other Unencumbered Assets

We maintain excess liquidity available to the parent company and selected subsidiaries in the form of cash and high-quality, liquid, unencumbered securities that togethersecurities. These assets serve as our primary means of liquidity risk mitigation. Wemitigation and we call these assets our “Global Excess Liquidity Sources,Sources.and weOur cash is primarily on deposit with central banks, such as the Federal Reserve. We limit the composition of high-quality, liquid, unencumbered securities to U.S. government securities, U.S. agency securities, U.S. agency MBS and a select group ofnon-U.S. government securities. We believe we can quickly obtain cash for these securities, even in stressed market conditions, through repurchase agreements or outright sales. We hold these assetsour Global Excess Liquidity Sources in entities that allow us to meet the liquidity requirements of our global businesses and we consider the impact of potential regulatory, tax, legal and other restrictions that could limit the transferability of funds among entities.

Our Global Excess Liquidity Sources totaledglobal excess liquidity sources increased $122 billion to $336 billion at December 31, 2010 compared to $214 billion at December 31, 2009 and were maintained as presented in the table below.

This increase was due primarily to liquidity generated by our bank subsidiaries through deposit growth, loan repayments combined with lower loan demand and other factors.

Table 10  16Global Excess Liquidity Sources

December 31, 2009

(Dollars in billions)  

Parent company

 $99

Bank subsidiaries

  89

Broker/dealers

  26

Total global excess liquidity sources

 $214

           
   December 31 
(Dollars in billions)  2010   2009 
Parent company  $121   $99 
Bank subsidiaries   180    89 
Broker/dealers   35    26 
           
Total global excess liquidity sources
  $336   $214 
 
As noted above, the excess liquidity available to the parent company is held in cash and high-quality, liquid, unencumbered securities and totaled $121 billion and $99 billion at December 31, 2010 and 2009. Typically, parent company cash is deposited overnight with Bank of America, N.A.

Our bank subsidiaries’ excess liquidity sources at December 31, 2010 and 2009 consisted ofwere $180 billion and $89 billion in cash on deposit at the Federal Reserve and high-quality, liquid, unencumbered securities.billion. These amounts are distinct from the cash deposited by the parent company, as previously described.described above. In addition to their excess liquidity sources, our bank sub - -


Bank of America 200947


sidiariessubsidiaries hold significant amounts of other unencumbered securities that we believe they could also usebe used to generate liquidity, such as investment gradeinvestment-grade ABS, MBS and municipal bonds. Another way our bank subsidiaries can generate incremental liquidity is by pledging a range of other unencumbered loans and securities to certain FHLBsFederal Home Loan Banks and the Federal Reserve Discount Window. The cash we could have obtained at December 31, 2009 by borrowing against this pool of specifically identified eligible assets was approximately $170 billion and $187 billion.billion at December 31, 2010 and 2009. We have established operational procedures to enable us to borrow against these assets, including regularly monitoring our total pool of eligible loanloans and securities collateral. Due to regulatory restrictions, liquidity generated by the bank subsidiaries maycan only be used to fund obligations within the bank subsidiaries and may notcannot be transferred to the parent company or other nonbank subsidiaries.

Our broker/dealer subsidiaries’ excess liquidity sources at December 31, 2010 and 2009 consisted of $35 billion and $26 billion in cash and high-quality, liquid, unencumbered securities. Our broker/dealers also held

significant amounts of other unencumbered securities we believe they could utilizealso be used to generate additional liquidity, including investment gradeinvestment-grade corporate bonds, ABSsecurities and equities. Liquidity held in a broker/dealer subsidiary mayis only be available to meet the liquidity requirementsobligations of that entity and may notcannot be transferred to the parent company or to any other subsidiaries.

subsidiary, often due to regulatory restrictions and minimum requirements.

Time to Required Funding and Stress Modeling

We use a variety of metrics to determine the appropriate amounts of excess liquidity to maintain at the parent company and our bank and broker/dealer subsidiaries. The primaryOne metric we use to evaluate the appropriate level of excess liquidity at the parent company is “Time to Required Funding.” This debt coverage measure indicates the number of months that the parent company can continue to meet its unsecured contractual obligations as they come due using only its Global Excess Liquidity Sources without issuing any new debt or accessing any additional liquidity sources. We define unsecured contractual obligations for purposes of this metric as maturities of senior or subordinated debt maturities issued or guaranteed by Bank of America Corporation or Merrill Lynch & Co., Inc., including certain unsecured debt instruments, primarily structured notes, which we may be required to settle for cash prior to maturity. The ALMRC has established a minimum target for “TimeTime to Required Funding”Funding of 21 months. “TimeTime to Required Funding”Funding was 24 months at December 31, 2010 compared to 25 months at December 31, 2009.

We also utilize liquidity stress models to assist us in determining the appropriate amounts of excess liquidity to maintain at the parent company and our bank and broker/dealer subsidiaries. We use theseThese risk sensitive models to analyzehave become increasingly important in analyzing our potential contractual and contingent cash outflows andbeyond those outflows considered in the Time to Required Funding analysis.
We evaluate the liquidity requirements under a range of scenarios with varying levels of severity and time horizons. These scenarios incorporate market-wide and Corporation-specific events, including potential credit ratingratings downgrades for the parent company and our subsidiaries. We consider and utilize scenarios based on historical experience, regulatory guidance, and both expected and unexpected future events.

The types of contractual and contingent cash outflows we consider in our scenarios may include, but are not limited to: upcoming contractual maturities of unsecured debt and reductions in new debt issuance; diminished access to secured financing markets; potential deposit withdrawals and reduced rollover of maturing term deposits by customers; increased draws on loan commitments and liquidity facilities; additional collateral that counterparties could call if our credit ratings were downgraded; collateral, margin and subsidiary capital requirements arising from losses; and potential liquidity required to maintain businesses and finance customer activities.
We consider all sources of funds that we could access during each stress scenario and focus particularly on matching available sources with corresponding liquidity requirements by legal entity. We also use the stress modeling results to manage our asset-liability profile and establish limits and guidelines on certain funding sources and businesses.
Basel III Liquidity Standards
In December 2010, the Basel Committee on Bank Supervision issued “International framework for liquidity risk measurement, standards and monitoring,” which includes two measures of liquidity risk. These two minimum liquidity measures were initially introduced in guidance in December 2009 and are considered part of Basel III.
The first liquidity measure is the Liquidity Coverage Ratio (LCR) which identifies the amount of unencumbered, high quality liquid assets a financial institution holds that can be used to offset the net cash outflows the institution would encounter under an acute30-day stress scenario. The second


68     Bank of America 2010


liquidity measure is the Net Stable Funding Ratio (NSFR) which measures the amount of longer-term, stable sources of funding employed by a financial institution relative to the liquidity profiles of the assets funded and the potential for contingent calls on funding liquidity arising from off-balance sheet commitments and obligations over a one-year period. The Basel Committee expects the LCR to be implemented in January 2015 and the NSFR in January 2018, following observation periods beginning in 2012. We continue to monitor the development and the potential impact of these evolving proposals and expect to be able to meet the final requirements.
Diversified Funding Sources

We fund our assets primarily with a mix of deposits and secured and unsecured liabilities through a globally coordinated funding strategy. We

diversify our funding globally across products, programs, markets, currencies and investor bases.

We fund a substantial portion of our lending activities through our deposit base which was $1.0 trillion and $992 billion at December 31, 2010 and 2009. Deposits are primarily generated by ourDeposits, Global Commercial Banking, GWIMandGWIMGBAMsegments. These deposits are diversified by clients, product typestype and geography. DomesticCertain of our U.S. deposits may beare insured by the FDIC. We consider a substantial portion of our deposits to be a stable, low-cost and consistent source of funding. We believe this deposit funding is generally less sensitive to interest rate changes, market volatility or changes in our credit ratings than wholesale funding sources.

Certain consumer lending activities, primarily in our banking subsidiaries, may be funded through securitizations. Included in these consumer lending activities are the extension of mortgage, credit card, auto loans, home equity loans and lines of credit. If securitization markets are not available to us on favorable terms, we typically finance these loans with deposits or with wholesale borrowings. For additional information on securitizations, seeNote 8 – Securitizations and Other Variable Interest Entitiesto the Consolidated Financial Statements.

Our trading activities are primarily funded on a secured basis through repurchase and securities lending agreements. Due toand repurchase agreements; these amounts will vary based on customer activity and market conditions. We believe funding these activities in the underlying collateral, we believe thissecured financing markets is more cost-efficient and less sensitive to changes in our credit ratings than unsecured financing. Repurchase agreements are generally short-term and often occur overnight. Disruptions in secured financing markets for financial institutions have occurred in prior market cycles which resulted in adverse changes in terms or significant reductions in the availability of such financing. We manage the liquidity risks arising from secured funding by sourcing funding globally from a diverse group of counterparties, providing a range of securities collateral and pursuing longer durations, when we finance lower-quality assets.

appropriate.

Unsecured debt, both short- and long-term, is also an important source of funding. We may issue unsecured debt through syndicated U.S. registered offerings, U.S. registered and unregistered medium-term note programs,non-U.S. medium-term note programs,non-U.S. private placements, U.S. andnon-U.S. commercial paper and through other methods. We distribute a significant portion of our debt offerings through our retail and institutional sales forces to a large, diversified global investor base. Maintaining relationships with our investors is an important aspect of our funding strategy. We may, from time to time, purchase outstanding Bank of America Corporation debt securities in various transactions, depending upon prevailing market conditions, liquidity and other factors. In addition, we may also make markets in our debt instruments to provide liquidity for investors.
In addition, our parent company, bank and broker-dealer subsidiaries regularly access short-term secured and unsecured markets through federal funds purchased, commercial paper and other short-term borrowings to

support customer activities, short-term financing requirements and cash management.
At December 31, 2010, commercial paper and other short-term borrowings included $6.7 billion of VIEs that were consolidated in accordance with new consolidation guidance effective January 1, 2010. For average and year-end balance discussions, see Balance Sheet Overview beginning on page 29. For more information, seeNote 12 Federal Funds Sold, Securities Borrowed or Purchased Under Agreements to Resell and Short-term Borrowingsto the Consolidated Financial Statements.
We issue the majority of our long-term unsecured debt at the parent company and Bank of America, N.A. During 2009, we issued $30.2 billion and $10.5 billion of long-term senior unsecured debt at2010, the parent company and Bank of America, N.A. The primary benefitsissued $28.8 billion and $3.5 billion of this centralized financing strategy include greater control, reduced funding costs, wider name recognition by investors and greater flexibility to meet the variable funding requirements of subsidiaries. Where regulations, time zone differences, or other business considerations make parent company funding impractical, certain other subsidiaries maylong-term senior unsecured debt.
We issue their own debt.

We issuelong-term unsecured debt in a variety of maturities and currencies to achieve cost-efficient funding and to maintain an appropriate maturity profile. While the cost and availability of unsecured funding may be negatively impacted by general market conditions or by matters specific to the financial services industry or Bank of America,the Corporation, we seek to mitigate refinancing risk by actively managing the amount of our borrowings that we anticipate will mature within any month or quarter.

The primary benefits of our centralized funding strategy include greater control, reduced funding costs, wider name recognition by investors and greater flexibility to meet the variable funding requirements of subsidiaries. Where regulations, time zone differences or other business considerations make parent company funding impractical, certain other subsidiaries may issue their own debt.
At December 31, 2010 and 2009, our long-term debt was issued in the currencies presented in the following table.

table below.

48Bank of America 2009


Table 11  17Long-term Debt By Major Currency

           
   December 31 
(Dollars in millions)  2010   2009 
U.S. Dollar  $302,487   $281,692 
Euros   87,482    99,917 
Japanese Yen   19,901    19,903 
British Pound   16,505    16,460 
Australian Dollar   6,924    7,973 
Canadian Dollar   6,628    4,894 
Swiss Franc   3,069    2,666 
Other   5,435    5,016 
 
Total long-term debt
  $448,431   $438,521 
 
At December 31, 2009

(Dollars in millions)  

U.S. Dollar

 $281,692

Euros

  99,917

Japanese Yen

  19,903

British Pound

  16,460

Australian Dollar

  7,973

Canadian Dollar

  4,894

Swiss Franc

  2,666

Other

  5,016

Total long-term debt

 $438,521

2010, the above table includes $71.0 billion of primarily U.S. Dollar long-term debt of VIEs that were consolidated in accordance with new consolidation guidance effective January 1, 2010.

We use derivative transactions to manage the duration, interest rate and currency risks of our borrowings, considering the characteristics of the assets they are funding. For further details on our ALM activities, refer to Interest Rate Risk Management for Nontrading Activities beginning on page 83.

103.

We also diversify our funding sources by issuing various types of debt instruments including structured notes. Structured notes, which are debt obligations that pay investors with returns linked to other debt or equity securities, indices, currencies or commodities. We typically hedge the returns we are obligated to pay on these notes with derivative positionsand/or in the underlying instruments so that from a funding perspective, the cost is similar to our other unsecured long-term debt. We could be required to immediately settle certain structured note obligations for cash or other securities under certain circumstances, which we consider for liquidity planning purposes. We believe, however, that a portion of such borrowings will remain outstanding beyond the


Bank of America 2010     69


earliest put or redemption date. At December 31, 2009, weWe had outstanding structured notes of $57 billion.

$61.1 billion and $57.0 billion at December 31, 2010 and 2009.

Substantially all of our senior and subordinated debt obligations contain no provisions that could trigger a requirement for an early repayment, require additional collateral support, result in changes to terms, accelerate maturity or create additional financial obligations upon an adverse change in our credit ratings, financial ratios, earnings, cash flows or stock price.

The U.S. government and joint agencies have introduced various programs to stabilize and provide liquidity to the U.S. financial markets since 2007.

We have participated in certain of these initiatives and we repaid our borrowings under U.S. government secured financing programs during 2009. We also participated in the FDIC’s TLGPTemporary Liquidity Guarantee Program (TLGP) which allowed us to issue senior unsecured debt that itthe FDIC guaranteed in return for a fee based on the amount and maturity of the debt. We issued $21.8 billion and $19.9 billion of FDIC-guaranteed long-term debt in 2009 and 2008. We have also issued short-term notes under the program. At December 31, 2009,2010, we had $41.7$27.5 billion outstanding under the program. We no longer issue debt under this program and all of our debt issued under TLGP will mature by June 30, 2012. Under this program, our debt received the highest long-term ratings from the major credit ratings agencies which resulted in a lower total cost of issuance than if we had issued non-FDIC guaranteed long-term debt. The associated FDIC fee for the 2009 issuances was $554 million and is being amortized into expense over the stated term of

the debt.

For additional information on debt funding, seeNote 13 – Long-term Debtto the Consolidated Financial Statements.

Contingency Planning

The Corporation maintains

We maintain contingency funding plans that outline our potential responses to liquidity stress events at various levels of severity. These policies and plans are based on stress scenarios and include potential funding strategies, and communication and notification procedures that we would implement in the event we experienced stressed liquidity conditions. We periodically review and test the contingency funding plans to validate efficacy and assess readiness.

Our U.S. bank subsidiaries can access contingency funding through the Federal Reserve Discount Window. Certainnon-U.S. subsidiaries have access to central bank facilities in the jurisdictions in which they operate. While we do not rely on these sources in our liquidity modeling, we maintain the policies, procedures and governance processes that would enable us to access these sources if necessary.

Credit Ratings

Our borrowing costs and ability to raise funds are directly impacted by our credit ratings. In addition, credit ratings may be important to customers or counterparties when we compete in certain markets and when we seek to engage in certain transactions including over-the-counterOTC derivatives. ItThus, it is our objective to maintain high qualityhigh-quality credit ratings.

Credit ratings and outlooks are opinions on our creditworthiness and that of our obligations or securities, including long-term debt, short-term borrowings, preferred stock and other securities, including asset securitizations. Our credit ratings are subject to ongoing review by the ratings agencies and thus may change from time to time based on a number of factors, including our own financial strength, performance, prospects and operations as well as factors not under our control, such as ratings agency-specific criteria or frameworks for our industry dynamicsor certain security types, which are subject to revision from time to time, and other factors. conditions affecting the financial services industry generally. In light of the recent difficulties in the financial services industry and financial markets, there can be no assurance that we will maintain our current ratings.
During 2009 and 2010, the ratings agencies took numerous actions, many of which were negative, to adjust our credit ratings and the outlooks manyfor those ratings. Currently, Bank of which were negative.America Corporation’s long-term senior debt

and outlook expressed by the ratings agencies are as follows: A2 (negative) by Moody’s Investors Services, Inc. (Moody’s), A (negative) by Standard and Poor’s Ratings Services, a division of The McGraw-Hill Companies, Inc. (S&P), and A+ (Rating Watch Negative) by Fitch, Inc. (Fitch). Bank of America, N.A.’s long-term debt and outlook currently are as follows: A+ (negative), Aa3 (negative) and A+ (Rating Watch Negative) by those same three credit ratings agencies, respectively. The ratings agencies have indicated that, as a systemically important financial institution, our credit ratings currently reflect their expectation that, if necessary, we would receive significant support from the U.S. government. All three ratings agencies, however, have indicated they will reevaluate, and could reduce the uplift they include in our ratings for government support for reasons arising from financial services regulatory reform proposals or legislation. In February 2010, Standard & Poor’sS&P affirmed our current credit ratings but revised the outlook to negative from stable based on theirits belief that it is less certain whether the U.S. government would be willing to provide extraordinary support. On July 27, 2010, Moody’s affirmed our current ratings but revised the outlook to negative from stable due to its expectation for lower levels of government support over time as a result of the passage of the Financial Reform Act. Also, on October 22, 2010, Fitch placed our credit ratings on Rating Watch Negative from stable outlook due to proposed rulemaking that could negatively impact its assessment of future systemic government support. Other factors that influence our credit ratings include changes to the ratings agencies’ methodologies, the ratings agencies’ assessment of the general operating environment, our relative positions in the markets in which we compete, reputation, liquidity position, diversity of funding sources, the level and volatility of earnings, corporate governance and risk management policies, capital position, and capital management practices.

practices and current or future regulatory and legislative initiatives.

A reduction in certain of our credit ratings or the ratings of certain asset-backed securitizations would likely have a material adverse effect on our liquidity, access to credit markets, the related cost of funds, our businesses and on certain trading revenues, particularly in those businesses where counterparty creditworthiness is critical. Under the terms of certain OTC derivatives contracts and other trading agreements, in the event of a credit ratings downgrade, the counterparties to those agreements may require us to provide additional collateral or to terminate these contracts or agreements. Such collateral calls or terminations could cause us to sustain losses, impair our liquidity, or both, by requiring us to provide the counterparties with additional collateral in the form of cash or highly liquid securities. If Bank of America Corporation’s or Bank of America, N.A.’s commercial paper or short-term credit ratings (which currently have the following ratings:P-1 by Moody’s,A-1 by S&P and F1+ by Fitch) were downgraded by one or more levels, the potential loss of short-term funding sources such as commercial paper or repo financing and effect on our incremental cost of funds would be material. For information regarding the additional collateral and termination payments that would be required in connection with certain OTC derivative contracts and other trading agreements as a result of such a credit ratings downgrade, seeNote 4 – Derivativesto the Consolidated Financial Statements and Item 1A. Risk Factors.
The credit ratings of Merrill Lynch & Co., Inc. from the three major credit ratings agencies are the same as those of Bank of America Corporation. The major credit ratings agencies have indicated that the primary drivers of Merrill Lynch’s credit ratings are Bank of America’sAmerica Corporation’s credit ratings.

A reduction in our credit ratings or the ratings of certain asset-backed securitizations could potentially have an adverse effect on our access to credit markets, the related cost of funds and our businesses. If


70     Bank of America Corporation or Bank2010


Credit Risk Management
Credit quality continued to show improvement during 2010; although, net charge-offs, and nonperforming loans, leases and foreclosed properties remained elevated. Signs of America, N.A. commercial paper or short-termeconomic stability and our proactive credit ratings were downgraded by one level, our incremental cost of fundsrisk management initiatives positively impacted the credit portfolio as charge-offs and potential lost funding could be material.

The credit ratings of Bank of America Corporation and Bank of America, N.A. as of February 26, 2010 are reflecteddelinquencies continued to improve across almost all portfolios along with risk rating improvements in the table below.


Table 12  Credit Ratings

OutlookBank of America CorporationBank of America, N.A.

Long-term

Senior Debt

Subordinated

Debt

Trust

Preferred

Preferred

Stock

Short-term

Debt

Long-term
Senior Debt

Long-term

Deposits

Short-term

Debt

Moody’s Investors Service

StableA2A3Baa3Ba3P-1Aa3Aa3P-1

Standard & Poor’s

NegativeAA-BBBBA-1A+A+A-1

Fitch Ratings

StableA+ABBBB-F1+A+AA-F1+

Bank of America 200949


Regulatory Capital

Atcommercial portfolio. Global and national economic uncertainty, regulatory initiatives and reform, however, continued to weigh on the credit portfolios through December 31, 2009,2010. For more information, see 2010 Economic and Business Environment on page 25. Credit metrics were also impacted by loans added to the Corporation operated its banking activities primarily under two charters: Bank of America, N.A. and FIA Card Services, N.A. With the acquisition of Merrill Lynchbalance sheet on January 1, 2009, we acquired Merrill Lynch Bank USA and Merrill Lynch Bank & Trust Co., FSB. Effective July 1, 2009, Merrill Lynch Bank USA merged into Bank of America, N.A, with Bank of America, N.A. as the surviving entity. Effective November 2, 2009, Merrill Lynch Bank & Trust Co., FSB merged into Bank of America, N.A., with Bank of America, N.A. as the surviving entity. Further, with the acquisition of Countrywide on July 1, 2008, we acquired Countrywide Bank, FSB, and effective April 27, 2009, Countrywide Bank, FSB converted to a national bank with the name Countrywide Bank, N.A. and immediately thereafter merged with and into Bank of America, N.A., with Bank of America, N.A. as the surviving entity.

Certain corporate sponsored trust companies which issue trust preferred securities (Trust Securities) are not consolidated under applicable

accounting guidance. In accordance with Federal Reserve guidance, Trust Securities qualify as Tier 1 capital with revised quantitative limits that will be effective on March 31, 2011. Such limits restrict certain types of capital to 15 percent of total core capital elements for internationally active bank holding companies. In addition, the Federal Reserve revised the qualitative standards for capital instruments included in regulatory capital. Internationally active bank holding companies are those with consolidated assets greater than $250 billion or on-balance sheet exposure greater than $10 billion. At December 31, 2009, our restricted core capital elements comprised 11.8 percent of total core capital elements.

Table 13 provides a reconciliation of the Corporation’s total shareholders’ equity at December 31, 2009 and 2008 to Tier 1 common capital, Tier 1 capital and total capital as defined by the regulations issued by the joint agencies. SeeNote 16 – Regulatory Requirements and Restrictions to the Consolidated Financial Statements for more information on our regulatory capital.


Table 13  Reconciliation of Tier 1 Common Capital, Tier 1 Capital and Total Capital

  December 31 
(Dollars in millions) 2009     2008 

Total common shareholders’ equity

 $194,236      $139,351  

Goodwill

  (86,314     (81,934

Nonqualifying intangible assets(1)

  (8,299     (4,195

Net unrealized losses on AFS debt and marketable equity securities and net losses on derivatives
recorded in accumulated OCI, net-of-tax

  1,034       5,479  

Unamortized net periodic benefit costs recorded in accumulated OCI, net-of-tax

  4,092       4,642  

Exclusion of fair value adjustment related to the Merrill Lynch structured notes(2)

  3,010         

Common Equivalent Securities

  19,290         

Disallowed deferred tax asset

  (7,080       

Other

  425       (4

Total Tier 1 common capital

  120,394       63,339  

Preferred stock

  17,964       37,701  

Trust preferred securities

  21,448       18,105  

Noncontrolling interest

  582       1,669  

Total Tier 1 capital

  160,388       120,814  

Long-term debt qualifying as Tier 2 capital

  43,284       31,312  

Allowance for loan and lease losses

  37,200       23,071  

Reserve for unfunded lending commitments

  1,487       421  

Other(3)

  (16,282     (3,957

Total capital

 $226,077      $171,661  
(1)

Nonqualifying intangible assets include core deposit intangibles, affinity relationships, customer relationships and other intangibles.

(2)

Represents loss on Merrill Lynch structured notes, net-of-tax, that is excluded from Tier 1 common capital, Tier 1 capital and total capital for regulatory purposes.

(3)

Balance includes a reduction of $18.7 billion and $6.7 billion related to allowance for loan and lease losses exceeding 1.25 percent of risk-weighted assets in 2009 and 2008. Balance also includes 45 percent of the pre-tax unrealized fair value adjustments on AFS marketable equity securities.

At December 31, 2009, the Corporation’s Tier 1 common capital, Tier 1 capital, total capital and Tier 1 leverage ratios were 7.81 percent, 10.40 percent, 14.66 percent and 6.91 percent, respectively.

The Corporation calculates Tier 1 common capital as Tier 1 capital including CES less preferred stock, qualifying trust preferred securities, hybrid securities and qualifying noncontrolling interest. CES is included in Tier 1 common capital based upon applicable regulatory guidance and our expectation that the underlying Common Equivalent Stock would convert into common stock following shareholder approval of additional authorized shares. Shareholders approved the increase in the number of authorized shares of common stock at the special meeting of shareholders held on February 23, 2010 and the Common Equivalent Stock converted to common stock on February 24, 2010. Tier 1 common capital increased to $120.4 billion at December 31, 2009 compared to $63.3 billion at December 31, 2008. The Tier 1 common capital ratio increased 301 bps to 7.81 percent. This increase was driven primarily by the second quarter at-the-market common stock issuance and the preferred to common stock exchanges which together represented a benefit of 185 bps and the issuance of CES which together provided a benefit of 138 bps to the Tier 1 common capital ratio. In addition, Tier 1 common capital benefited from the common stock that was issued in connection with the

adoption of new consolidation guidance.

Merrill Lynch acquisition partially offset byCredit risk is the risk of loss arising from the inability of a borrower or counterparty to meet its obligations. Credit risk can also arise from operational failures that result in an increase in risk-weightederroneous advance, commitment or investment of funds. We define the credit exposure to a borrower or counterparty as the loss potential arising from all product classifications including loans and leases, deposit overdrafts, derivatives, assets due toheld-for-sale and unfunded lending commitments which include loan commitments, letters of credit and financial guarantees. Derivative positions are recorded at fair value and assetsheld-for-sale are recorded at fair value or the acquisition.

Enterprise-wide Stress Testing

As alower of cost or fair value. Certain loans and unfunded commitments are accounted for under the fair value option. Credit risk for these categories of assets is not accounted for as part of our core risk management practices, the Corporation conducts enterprise-wide stress tests on a periodic basis to better understand earnings, capital and liquidity sensitivities to certain economic scenarios, including economic conditions that are more severe than anticipated. These enterprise-wide stress tests provide an understandingallowance for credit losses but as part of the potential impacts tofair value adjustments recorded in earnings. For derivative positions, our credit risk profile, capital and liquidity. Scenario(s) are selected by a group comprised of senior line of business, risk and finance executives. Impacts to each line of business from each scenario are then analyzed and determined, primarily leveragingis measured as the models and processes utilized in everyday management routines. Impacts are assessed along with potential mitigating actions that may be taken in each scenario. Analysis from such stress scenarios is compiled for and reviewed through our ROC, ALMRC, and the Enterprise Risk Committee of the Board and serves to inform and be incorporated, along with other core business processes, into decision making by management and the Board. The Corporation continues to invest in and improve stress testing capabilities as a core business process.


50Bank of America 2009


Off-Balance Sheet Liquidity Arrangements with Special Purpose Entities

In the ordinary course of business, we support our customers’ financing needs by facilitating their access to the commercial paper market. In addition, we utilize certain financing arrangements to meet our balance sheet management, funding and liquidity needs. These activities utilize special purpose entities (SPEs), typicallynet replacement cost in the form of corporations, limited liability companies, or trusts, which raise funds by issuing short-term commercial paper or other debt or equity instruments to third party investors. These SPEs typically hold various types of financial assets whose cash flows areevent the primary source of repayment for the liabilities of the SPEs. Investors have recourse to the assetscounterparties with contracts in the SPE and often benefit from other credit enhancements, such as overcollateralization in the form of excess assets in the SPE, liquidity facilities and other arrangements. As a result, the SPEs can typically obtain a favorable credit rating from the ratings agencies, resulting in lower financing costs for us and our customers.

We have liquidity agreements, SBLCs and other arrangements with SPEs, as described below, under which we are obligatedin a gain position fail to provide funding inperform under the eventterms of a market disruption or other specified event or otherwise providethose contracts. We use the currentmark-to-market value to represent credit supportexposure without giving consideration to the entities. We also fund selected assets via derivative contracts with third party SPEs under which we may be

required to purchase the assets at par value or the third party SPE’s cost to acquire the assets. We manage ourfuturemark-to-market changes. The credit risk amounts take into consideration the effects of legally enforceable master netting agreements and any market riskcash collateral. Our consumer and commercial credit extension and review procedures take into account funded and unfunded credit exposures. For additional information on these liquidity arrangements by subjecting them to our normal underwriting and risk management processes. Our credit ratings and changes thereto may affect the borrowing cost and liquidity of these SPEs. In addition, significant changes in counterparty asset valuationderivative and credit standing may also affect the ability of the SPEs to issue commercial paper. The contractual or notional amount of theseextension commitments, as presented in Table 14 represents our maximum possible funding obligation and is not, in management’s view, representative of expected losses or funding requirements.

The table below presents our liquidity exposure to unconsolidated SPEs, which include VIEs and QSPEs. VIEs are SPEs that lack sufficient equity at risk or whose equity investors do not have a controlling financial interest. QSPEs are SPEs whose activities are strictly limited to holding and servicing financial assets. As a result of our adoption of new accounting guidance on consolidation on January 1, 2010 as discussed in the following section, we consolidated all multi-seller conduits, asset acquisition conduits and credit card securitization trusts. In addition, we consolidated certain home equity securitization trusts, municipal bond trusts and credit-linked note and other vehicles.


Table 14  Off-Balance Sheet Special Purpose Entities Liquidity Exposure

  December 31, 2009
(Dollars in millions) VIEs    QSPEs    Total

Commercial paper conduits:


Multi-seller conduits

 $25,135    $    $25,135

Asset acquisition conduits

  1,232          1,232

Home equity securitizations

       14,125     14,125

Municipal bond trusts

  3,292     6,492     9,784

Collateralized debt obligation vehicles

  3,283          3,283

Credit-linked note and other vehicles

  1,995          1,995

Customer-sponsored conduits

  368          368

Credit card securitizations

       2,288     2,288

Total liquidity exposure

 $35,305    $22,905    $58,210
  December 31, 2008
  VIEs    QSPEs    Total

Commercial paper conduits:


Multi-seller conduits

 $41,635    $    $41,635

Asset acquisition conduits

  2,622          2,622

Other corporate conduits

       1,578     1,578

Home equity securitizations

       13,064     13,064

Municipal bond trusts

  3,872     2,921     6,793

Collateralized debt obligation vehicles

  542          542

Customer-sponsored conduits

  980          980

Credit card securitizations

       946     946

Total liquidity exposure

 $49,651    $18,509    $68,160

At December 31, 2009, our total liquidity exposure to SPEs was $58.2 billion, a decrease of $10.0 billion from December 31, 2008. The decrease was attributable to decreases in commercial paper conduits due to maturities and liquidations partially offset by the acquisition of Merrill Lynch. Legacy Merrill Lynch related exposures as of December 31, 2009 were $4.9 billion in municipal bond trusts, $3.3 billion in CDO vehicles and $2.0 billion in credit-linked note and other vehicles.

For more information on commercial paper conduits, municipal bond trusts, CDO vehicles, credit-linked note and other vehicles, see Note 9 – Variable Interest Entitiesto the Consolidated Financial Statements. For more information on home equity and credit card securitizations, seeNote 84 – SecuritizationsDerivatives to the Consolidated Financial Statements.

Customer-sponsored conduits are established by our customers to provide them with direct access to the commercial paper market. We are typically one of several liquidity providers for a customer’s conduit. We do not provide SBLCs or other forms of credit enhancement to these conduits. Assets of these conduits consist primarily of auto loans and student loans. The liquidity commitments benefit from structural protections which vary depending upon the program, but given these protections, we view the exposures as investment grade quality. These commitments are included inNote 14 – Commitments and Contingenciesto the Consolidated Financial Statements. As we typically provide less than 20 percent

We manage credit risk based on the risk profile of the total liquidity commitments to these conduits and do not provide other formsborrower or counterparty, repayment sources, the nature of support, we have concluded that we do not hold a


Bank of America 200951


significant variable interest in the conduits and they are not included in our discussion of VIEs inNote 9 – Variable Interest Entities to the Consolidated Financial Statements.

Impact of Adopting New Accounting Guidance on Consolidation

On June 12, 2009, the FASB issued new guidance on sale accounting criteria for transfers of financial assets, including transfers to QSPEs and consolidation of VIEs. As described more fully inNote 8 – Securitizationsto the Consolidated Financial Statements, the Corporation routinely transfers mortgage loans, credit card receivablesunderlying collateral, and other financial instruments to SPEs that meet the definition of a QSPE which are not currently subject to consolidation by the transferor. Among other things, this new guidance eliminates the concept of a QSPEsupport given current events, conditions and expectations. We classify our portfolios as a result, existing QSPEs generally will be subject to consolidation under the new guidance.

This new guidance also significantly changes the criteria by which an enterprise determines whether it must consolidate a VIE,either consumer or commercial and monitor credit risk in each as described more fully inNote 9 – Variable Interest Entitiesto the Consolidated Financial Statements. A VIE is an entity, typically an SPE, which has insufficient equity at risk or which is not controlled through voting rights held by

discussed below.

equity investors. Currently, a VIE is consolidated by the enterprise that will absorb a majority of the expected losses or expected residual returns created by the assets of the VIE. This new guidance requires that a VIE be consolidated by the enterprise that has both the power to direct the activities that most significantly impact the VIE’s economic performanceWe proactively refine our underwriting and the obligation to absorb losses or the right to receive benefits that could potentially be significant to the VIE. This new guidance also requires that an enterprise continually reassesses, based on current facts and circumstances, whether it should consolidate the VIEs with which it is involved.

The table below shows the impact on a preliminary basis of this new accounting guidance in terms of incremental GAAP assets and risk-weighted assets for those VIEs and QSPEs that we consolidated on January 1, 2010. The assets and liabilities of the newly consolidated credit card securitization trusts, multi-seller commercial paper conduits, home equity lines of credit and certain other VIEs are recorded at their respective carrying values. The Corporation has elected to account for the assets and liabilities of the newly consolidated asset acquisition commercial paper conduits, municipal bond trusts and certain other VIEs under the fair value option.


Table 15  Preliminary Incremental GAAP and Risk-Weighted Assets Impact

(Dollars in billions) Preliminary
Incremental
GAAP
Assets
    Estimated
Incremental
Risk-Weighted
Assets

Type of VIE/QSPE


Credit card securitization trusts(1)

 $70    $8

Asset-backed commercial paper conduits(2)

  15     11

Municipal bond trusts

  5     1

Home equity lines of credit

  5     5

Other

  5     

Total

 $100    $25
(1)

The Corporation undertook certain actions during 2009 related to its off-balance sheet credit card securitization trusts. As a result of these actions, we included approximately $63.6 billion of incremental risk-weighted assets in its risk-based capital ratios as of December 31, 2009.

(2)

Regulatory capital requirements changed effective January 1, 2010 for all ABCP conduits. The increase in risk-weighted assets in this table reflects the impact of these changes on all ABCP conduits, including those that were consolidated prior to January 1, 2010.

In addition to recording the incremental assets and liabilities on the Corporation’s Consolidated Balance Sheet, we recorded an after-tax charge of approximately $6 billion to retained earnings on January 1, 2010 as the cumulative effect of adoption of these new accounting standards. The charge relates primarily to the addition of $11 billion of allowance for loan losses for the newly consolidated assets, principally credit card related.

On January 21, 2010, the joint agencies issued a final rule regarding risk-based capital and the impact of adoption of the new consolidation guidance issued by the FASB. The final rule allows for a phase-in period for a maximum of one year for the effect on risk-weighted assets and the regulatory limit on the inclusion of the allowance for loan and lease losses in Tier 2 capital related to the assets that are consolidated. Our current estimate of the incremental impact is a decrease in our Tier 1 and Tier 1 common capital ratios of 65 to 75 bps. However, the final capital impact will be affected by certain factors, including, the final determination of the cumulative effect of adoption of this new accounting guidance on retained earnings, and limitations of deferred tax assets for risk-based capital purposes. The Corporation has elected to forgo the phase-in period and consolidate the amounts for regulatory capital purposes as of January 1, 2010. For more information, refer to the Regulatory Initiatives section on page 43.

Basel Regulatory Capital Requirements

In June 2004, the Basel II Accord was published with the intent of more closely aligning regulatory capital requirements with underlying risks, similar to economic capital. While economic capital is measured to cover unexpected losses, the Corporation also manages regulatory capital to adhere to regulatory standards of capital adequacy.

The Basel II Final Rule (Basel II Rules), which was published on December 7, 2007, establishes requirements for the U.S. implementation and provided detailed capital requirements for credit and operational risk under Pillar 1, supervisory requirements under Pillar 2 and disclosure requirements under Pillar 3. The Corporation will begin Basel II parallel implementation during the second quarter of 2010.

Financial institutions are required to successfully complete a minimum parallel qualification period before receiving regulatory approval to report regulatory capital using the Basel II methodology. During the parallel period, the resulting capital calculations under both the current (Basel I) rules and the Basel II Rules will be reported to the financial institutions regulatory supervisors for at least four consecutive quarterly periods. Once the parallel period is successfully completed, the financial institution will utilize Basel II as their methodology for calculating regulatory capital. A three-year transitional floor period will follow after which use of Basel I will be discontinued.

In July 2009, the Basel Committee on Banking Supervision released a consultative document entitled “Revisions to the Basel II Market Risk


52Bank of America 2009


Framework” that would significantly increase the capital requirements for trading book activities if adopted as proposed. The proposal recommended implementation by December 31, 2010, but regulatory agencies are currently evaluating the proposed rulemaking and related impacts before establishing final rules. As a result, we cannot determine the implementation date or the final capital impact.

In December 2009, the Basel Committee on Banking Supervision issued a consultative document entitled “Strengthening the Resilience of the Banking Sector.” If adopted as proposed, this could increase significantly the aggregate equity that bank holding companies are required to hold by disqualifying certain instruments that previously have qualified as Tier 1 capital. In addition, it would increase the level of risk-weighted assets. The proposal could also increase the capital charges imposed on certain assets potentially making certain businesses more expensive to conduct. Regulatory agencies have not opined on the proposal for implementation. We continue to assess the potential impact of the proposal.

Common Share Issuances and Repurchases

In January 2009, the Corporation issued 1.4 billion shares of common stock in connection with its acquisition of Merrill Lynch. For additional information regarding the Merrill Lynch acquisition, seeNote 2 – Merger

and Restructuring Activity to the Consolidated Financial Statements. In addition, during the first quarter of 2009, we issued warrants to purchase approximately 199.1 million shares of common stock in connection with preferred stock issuances to the U.S. government. For more information, see the following preferred stock discussion. During the second quarter of 2009, we issued 1.25 billion shares of common stock at an average price of $10.77 per share through an at-the-market issuance program resulting in gross proceeds of approximately $13.5 billion. In addition, we issued approximately 7.4 million shares under employee stock plans.

In connection with the TARP repayment approval, the Corporation agreed to increase equity by $3.0 billion through asset sales to be approved by the Federal Reserve and contracted for by June 30, 2010. To the extent those asset sales are not completed by the end of 2010, the Corporation must raise a commensurate amount of common equity. We also agreed to raise up to approximately $1.7 billion through the issuance in 2010 of restricted stock in lieu of a portion of incentive cash compensation to certain of the Corporation’s associates as part of their 2009 year-end incentive payments.

For more information regarding our common share issuances, seeNote 15 – Shareholders’ Equity and Earnings Per Common Share to the Consolidated Financial Statements.


Common Stock Dividends

The following table provides a summary of our declared quarterly cash dividends on common stock during 2009 and through February 26, 2010.

Table 16  Common Stock Dividend Summary

Declaration Date Record Date    Payment Date    Dividend Per Share
January 27, 2010 March 5, 2010    March 26, 2010    $0.01
October 28, 2009 December 4, 2009    December 24, 2009     0.01
July 21, 2009 September 4, 2009    September 25, 2009     0.01
April 29, 2009 June 5, 2009    June 26, 2009     0.01
January 16, 2009 March 6, 2009    March 27, 2009     0.01

Preferred Stock Issuances and Exchanges

During the second quarter of 2009, we completed an offer to exchange up to approximately 200 million shares of common stock at an average price of $12.70 for outstanding depositary shares of portions of certain series of preferred stock. In addition, we also entered into agreements with certain holders of other non-government perpetual preferred shares to exchange their holdings of approximately $10.9 billion aggregate liquidation preference of perpetual preferred stock into approximately 800 million shares of common stock. In total, the exchange offer and these privately negotiated exchanges covered the exchange of approximately $14.8 billion aggregate liquidation preference of perpetual preferred stock into approximately 1.0 billion shares of common stock. During the second quarter of 2009, we recorded an increase to retained earnings and net income applicable to common shareholders of approximately $580 million related to these exchanges. This represents the net of a $2.6 billion benefit due to the excess of the carrying value of our non-convertible preferred stock over the fair value of the common stock exchanged. This was partially offset by a $2.0 billion inducement to convertible preferred shareholders. The inducement represented the excess of the fair value of the common stock exchanged, which was accounted for as an induced conversion of convertible preferred stock, over the fair value of the common stock that would have been issued under the original conversion terms.

On December 2, 2009, we received approval from the U.S. Treasury and Federal Reserve to repay the U.S. government’s $45.0 billion preferred stock investment provided under TARP. In accordance with the approval, on December 9, 2009, we repurchased all outstanding shares of Cumulative Perpetual Preferred Stock Series N, Series Q and Series R

issued to the U.S. Treasury as part of the TARP. While participating in the TARP we recorded $7.4 billion in dividends and accretion on the TARP Preferred Stock and repayment will save us approximately $3.6 billion in annual dividends and accretion. We did not repurchase the related common stock warrants issued to the U.S. Treasury in connection with its TARP investment. The U.S. Treasury recently announced its intention to auction these warrants during March 2010. For more detail on the TARP Preferred Stock, refer toNote 15 – Shareholders’ Equity and Earnings Per Common Share to the Consolidated Financial Statements.

The Corporation repurchased the TARP Preferred Stock through the use of $25.7 billion in excess liquidity and $19.3 billion in proceeds from the sale of 1.3 billion units of CES valued at $15.00 per unit. The CES consisted of depositary shares representing interests in shares of Common Equivalent Junior Preferred Stock Series S (Common Equivalent Stock) and warrants (Contingent Warrants) to purchase an aggregate 60 million shares of the Corporation’s common stock. Each depositary share represented a 1/1000th interest in a share of Common Equivalent Stock and each Contingent Warrant granted the holder the right to purchase 0.0467 of a share of a common stock for $.01 per share. Each depositary share entitled the holder, through the depository, to a proportional fractional interest in all rights and preferences of the Common Equivalent Stock, including conversion, dividend, liquidation and voting rights.

The Corporation held a special meeting of stockholders on February 23, 2010 at which we obtained stockholder approval of an amendment to our amended and restated certificate of incorporation to increase the number of authorized shares of our common stock, and following effectiveness of the amendment, on February 24, 2010, the Common Equivalent Stock converted in full into our common stock and


Bank of America 200953


the Contingent Warrants automatically expired without becoming exercisable, and the CES ceased to exist.

Credit Risk Management

The economic recession accelerated in late 2008 and continued to deepen into the first half of 2009 but has shown some signs of stabilization and possible improvement over the second half of the year. Consumers continued to be under financial stress as unemployment and underemployment remained at elevated levels and individuals spent longer periods without work. These factors combined with further reductions in spending by consumers and businesses, continued home price declines and turmoil in sectors of the financial markets continued to negatively impact both the consumer and commercial loan portfolios. During 2009, these conditions drove increases in net charge-offs and nonperforming loans and foreclosed propertiesmanagement practices, as well as higher commercial criticized utilized exposure and reserve increases across most portfolios. The depth, breadth and duration of the economic downturn, as well as the resulting impact on the credit quality of the loan portfolios remain unclear into 2010.

We continue to refine our credit standards, to meet the changing economic environment. InTo actively mitigate losses and enhance customer support in our consumer businesses, we have implemented a number of initiatives to mitigate losses. These include increased use of judgmental lending and adjustment of underwriting, and account and line management standards and strategies, including reducing unfunded lines where appropriate. Additionally, we have increasedexpanded collections, loan modification and customer assistance infrastructuresinfrastructures. We also have implemented a number of actions to enhance customer support. In 2009,mitigate losses in the commercial businesses including increasing the frequency and intensity of portfolio monitoring, hedging activity and our practice of transferring management of deteriorating commercial exposures to independent special asset officers as credits approach criticized levels.

Since January 2008, and through 2010, Bank of America and Countrywide have completed nearly 775,000 loan modifications with customers. During 2010, we provided home ownership retention opportunities to approximately 460,000 customers. This included completion of 260,000completed nearly 285,000 customer loan modifications with a total unpaid balancesprincipal balance of approximately $55$65.7 billion, and approximately 200,000which included 109,000 customers who were in trial-periodconverted from trial period to permanent modifications under the government’s Making Home AffordableMHA program. As of January 2010, approximately 220,000 customers were in trial period modifications and more than 12,700 were in permanent modifications. Of the 260,000loan modifications done during 2009,

completed in 2010, in terms of both the volume of modifications and the unpaid principal balance associated with the underlying loans, most arewere in the portfolio serviced for investors and iswere not on our balance sheet. During 2008, Bank of America and Countrywide completed 230,000 loan modifications. The most common types of modifications during the year include rate reductions, capitalization of past due amounts or a combination of rate reduction and capitalization of past due amounts which are 17represent 68 percent 21 percent and 40 percent, respectively,of the volume of modifications completed in 2009.2010, while principal forbearance represented 15 percent and capitalization of past due amounts represented nine percent. We also provide rate reductions, rate and payment extensions, principal forbearance or forgiveness and other actions. These modification types are generally considered troubled debt restructurings (TDRs). For more information on TDRs except for certain short-term modifications whereand portfolio impacts, see Nonperforming Consumer Loans and Foreclosed Properties Activity beginning on page 81 andNote 6 – Outstanding Loans and Leasesto the Consolidated Financial Statements.
On October 1, 2010, we expectvoluntarily stopped taking residential mortgage foreclosure proceedings to collect the full contractual principal and interest.

A number of initiatives have also been implementedjudgment in our small business commercial – domestic portfolio including changesjudicial states. On October 8, 2010, we stopped foreclosure sales in all states in order to underwriting thresholds augmented by a judgmental decision-making process by experienced underwriters including increasing minimum FICO scores and lowering initial line assignments. We have also increased the intensity of our existing customer line management strategies.

To mitigate losses in the commercial businesses, we have increased the frequency and intensity of portfolio monitoring, hedging activity and our efforts in managingcomplete an exposure when we begin to see signs of deterioration. Our lines of business and risk management personnel use a variety of tools to continually monitor the ability of a borrower or counterparty to perform under its obligations. It is our practice to transfer the management of deteriorating commercial exposures to independent Special Asset officers as a credit approaches criticized levels. Our experi - -

ence has shown that this discipline generates an objective assessment of the borrower’srelated business processes. As a result of that assessment, we identified and began implementing process and control enhancements and we intend to monitor ongoing quality results of each process. After these enhancements were put in place, we resumed foreclosure sales in most non-judicial states during the fourth quarter of 2010, and expect sales to resume in the remaining non-judicial states in the first quarter of 2011. The process of preparing affidavits in pending proceedings in judicial states is expected to continue into the first quarter of 2011 and could result in prolonged adversary proceedings that delay certain foreclosure sales. We took these precautionary steps in order to ensure our processes for handling foreclosures include the appropriate controls and quality assurance. These initiatives further support our credit risk management and mitigation efforts. For more information, see Recent Events beginning on page 33.

Certain European countries, including Greece, Ireland, Italy, Portugal and Spain, continue to experience varying degrees of financial healthstress. Risks and ongoing concerns about the value of our exposure, and maximizes our recovery upon resolution. As part of our underwriting process we have increased scrutiny around stress analysis and required pricing and structure to reflect current market dynamics. Given the volatilitydebt crisis in Europe could result in a disruption of the financial markets we increasedwhich could have a detrimental impact on the frequencyglobal economic recovery, including the impact of various tests designed to understand whatnon-sovereign debt in these countries. For more information on our direct sovereign and non-sovereign exposures in these countries, seeNon-U.S. Portfolio beginning on page 94.
The Financial Accounting Standards Board (FASB) issued new disclosure guidance, effective on a prospective basis for the volatility could mean to our underlying credit risk. Given the potential for single name risk associated with any disruption in the financial markets, we use a real-time counterparty event management process to monitor key counterparties.

Additionally, we account for certain large corporateCorporation’s 2010 year-end reporting, that addresses disclosure of loans and loan commitments (including issued but unfunded letters of creditother financing receivables and the related allowance. The new disclosure guidance defines a portfolio segment as the level at which are considered utilized for credit risk management purposes) that exceed our single name credit risk concentration guidelines under the fair value option. These loansan entity develops and loan commitments are then actively managed and hedged, principally by purchasing credit default protection. By including the credit risk of the borrower in the fair value adjustments, any credit spread deterioration or improvement is recorded in other income immediately as part of the fair value adjustment. Asdocuments a result,systematic methodology to determine the allowance for loan and leasecredit losses, and a class of financing receivables as the reserve for unfunded lending commitments are not used to capture credit losses inherent in any nonperforming or impaired loans and unfunded commitments carried at fair value. See the Commercial Loans Carried at Fair Value section on page 69 for more informationlevel of disaggregation of portfolio segments based on the performance of theseinitial measurement attribute, risk characteristics and methods for assessing risk. The Corporation’s portfolio segments are home loans, credit card and loan commitments and seeNote 20 – Fair Value Measurements to the Consolidated Financial Statements for additional information on our fair value option elections.

The acquisition of Merrill Lynch contributed to both ourother consumer, and commercialcommercial. The classes within the home loans and commitments. Acquired consumer loans consisted ofportfolio segment are residential mortgages,mortgage, home equity loans and lines ofdiscontinued real estate. The classes within the credit card and other consumer portfolio segment are U.S. credit card,non-U.S. credit card, direct/indirect loans (principally securities-based lending margin loans). Commercial exposures were comprisedconsumer and other consumer. The classes within the commercial portfolio segment are U.S. commercial, commercial real estate, commercial lease financing,non-U.S. commercial and U.S. small business commercial. Under this new disclosure guidance, the allowance is presented by portfolio segment.


Bank of both investment and non-investment grade loans and included exposures to CMBS, monolines and leveraged finance. Consistent with other acquisitions, we incorporated the acquired assets into our overall credit risk management processes.America 2010     71


Consumer Portfolio Credit Risk Management

Credit risk management for the consumer portfolio begins with initial underwriting and continues throughout a borrower’s credit cycle. Statistical techniques in conjunction with experiential judgment are used in all aspects of portfolio management including underwriting, product pricing, risk appetite, setting credit limits and establishing operating processes and metrics to quantify and balance risks and returns. Statistical models are built using detailed behavioral information from external sources such as credit bureausand/or internal historical experience. These models are a component of our consumer credit risk management process and are used, in part, to help determine both new and existing credit decisions, portfolio management strategies including authorizations and line management, collection practices and strategies, determination of the allowance for loan and lease losses, and economic capital allocations for credit risk.

For information on our accounting policies regarding delinquencies, nonperforming status, charge-offs and charge-offsTDRs for the consumer portfolio, seeNote 1 – Summary of Significant Accounting Principlesto the Consolidated Financial Statements.

Consumer Credit Portfolio

Weakness

Although unemployment rates remained at elevated levels, improvement in the U.S. economy and housingstabilization in the labor markets elevated unemployment and underemployment and tighter credit conditionsduring 2010 resulted in deterioration across most of ourlower losses and lower delinquencies in almost all consumer portfolios during 2009.2010 when compared to 2009 on a managed basis. However,


54Bank of America 2009


economic deterioration throughout 2009 and weakness in the economic recovery in 2010 drove continued stress in the housing markets and tighter availability of credit in the market place resulting in elevated net charge-offs in most portfolios. In addition, during the last half2010, our consumer real estate portfolios were impacted by net charge-offs on certain modified loans deemed to be collateral dependent pursuant to clarification of the year, the unsecured consumer portfolios withinGlobal Card Services experienced lower levels of delinquency and by the fourth quarter consumer credit began to stabilize and in some cases improve. As part of our ongoing risk mitigation and consumer client support initiatives, we have been working with borrowers to modify their loans to terms that better align with their current ability to pay. Under certain circumstances, we identify these as TDRs which are modifications where an economic concession is granted to a borrower experiencing financial difficulty.regulatory guidance. For more

information on TDRs and portfolio impacts,regulatory guidance on collateral dependent modified loans, see Nonperforming Consumer Loans and Foreclosed Properties ActivityRegulatory Matters beginning on page 6256.
Under the new consolidation guidance, we consolidated all previously off-balance sheet securitized credit card receivables along with certain home equity andNote 6 – Outstanding Loans and Leases auto loan securitization trusts. The 2010 consumer credit card credit quality statistics include the impact of consolidation of VIEs. The following tables include the December 31, 2009 balances as well as the January 1, 2010 balances to show the impact of the adoption of the new consolidation guidance. Accordingly, the December 31, 2010 credit quality statistics under the new consolidation guidance should be compared to the Consolidated Financial Statements.

Table 17amounts presented in the January 1, 2010 column.

The table below presents our outstanding consumer loans and leases and our managed credit card portfolio, and related credit quality information. Nonperforming loans do not include consumer credit card, consumer loans secured by personal property or unsecured consumer loans that are past due as these loans are generally charged off no later than the end of the month in which the account becomes 180 days past due. Real estate-secured past due loans, repurchased pursuant to our servicing agreement with Government National Mortgage Association (GNMA) are not reported as nonperforming as repayments are insured by the Federal Housing Administration (FHA). Additionally, nonperforming loans and accruing balances past due 90 days or more do not include the Countrywide purchased impaired loans even though the customer may be contractually past due.PCI loan portfolio. Loans that were acquired from Countrywide that wereand considered impairedcredit-impaired were written down to fair value upon acquisition. In addition to being included in the “Outstandings” columncolumns in the following table below, these

loans are also shown separately, net of purchase accounting adjustments, for increased transparency in the “Countrywide Purchased ImpairedCredit-impaired Loan Portfolio” column. For additional information, seeNote 6 – Outstanding Loans and Leases to the Consolidated Financial Statements. Under certain circumstances, loans that were originally classified as discontinued real estate loans upon acquisition have been subsequently modified and are now included in the residential mortgage portfolio shown below. The impact of the Countrywide portfolio on certain credit statistics is reported where appropriate. Refer to the Countrywide Purchased Impaired Loan Portfolio discussion beginning on page 59 for more information.

Loans that were acquired from Merrill Lynch were recorded at fair value including those that were considered impairedcredit-impaired upon acquisition. The Merrill Lynch consumer purchased impairedPCI loan portfolio did not materially alter the reported credit quality statistics of the consumer portfolios and is, therefore, excluded from the “Countrywide Purchased ImpairedCredit-impaired Loan Portfolio” column and discussion that follows. In addition, the nonperforming loansfollowing discussion. For additional information, seeNote 6 – Outstanding Loans and delinquency statistics presented below includeLeasesto the Merrill Lynch purchased impairedConsolidated Financial Statements. The impact of the Countrywide PCI loan portfolio based on the customer’s performance under the contractualcertain credit statistics is reported where appropriate. See Countrywide Purchased Credit-impaired Loan Portfolio beginning on page 78 for more information. Under certain circumstances, loans that were originally classified as discontinued real estate loans upon acquisition have been subsequently modified from pay option or subprime loans into loans with more conventional terms of the loan. At December 31, 2009, consumer loans included $47.2 billion from Merrill Lynch of which $2.0 billion of residential mortgage and $146 million of home equity loans wereare now included in the Merrill Lynch purchased impaired loan portfolio. There were no reported net charge-offs on these loans during 2009 as the initial fair value at acquisition date already considered the estimated credit losses.

residential mortgage portfolio shown below.


Table 17  18Consumer Loans and Leases

  December 31
  Outstandings    Nonperforming (1)    

Accruing Past Due 90

Days or More(2)

    Countrywide Purchased
Impaired Loan Portfolio
(Dollars in millions) 2009  2008     2009  2008     2009  2008     2009  2008

Held basis


Residential mortgage(3)

 $242,129  $248,063   $16,596  $7,057   $11,680  $372   $11,077  $10,013

Home equity

  149,126   152,483    3,804   2,637           13,214   14,099

Discontinued real estate (4)

  14,854   19,981    249   77           13,250   18,097

Credit card – domestic

  49,453   64,128    n/a   n/a    2,158   2,197    n/a   n/a

Credit card – foreign

  21,656   17,146    n/a   n/a    500   368    n/a   n/a

Direct/Indirect consumer(5)

  97,236   83,436    86   26    1,488   1,370    n/a   n/a

Other consumer(6)

  3,110   3,442     104   91     3   4     n/a   n/a

Total held

 $577,564  $588,679    $20,839  $9,888    $15,829  $4,311    $37,541  $42,209

Supplemental managed basis data


Credit card – domestic

 $129,642  $154,151    n/a   n/a   $5,408  $5,033    n/a   n/a

Credit card – foreign

  31,182   28,083     n/a   n/a     799   717     n/a   n/a

Total credit card – managed

 $160,824  $182,234     n/a   n/a    $6,207  $5,750     n/a   n/a
                     
           Countrywide Purchased
 
           Credit-impaired Loan
 
           Portfolio 
  Outstandings   
    December 31 
  December 31
  January 1
  December 31
   
(Dollars in millions) 2010 (1)  2010 (1)  2009  2010 (1)  2009 
Residential mortgage (2)
 $257,973  $242,129  $242,129  $10,592  $11,077 
Home equity  137,981   154,202   149,126   12,590   13,214 
Discontinued real estate (3)
  13,108   14,854   14,854   11,652   13,250 
U.S. credit card  113,785   129,642   49,453   n/a   n/a 
Non-U.S. credit card
  27,465   31,182   21,656   n/a   n/a 
Direct/Indirect consumer (4)
  90,308   99,812   97,236   n/a   n/a 
Other consumer (5)
  2,830   3,110   3,110   n/a   n/a 
 
Total
 $643,450  $674,931  $577,564  $34,834  $37,541 
 
(1)

Nonperforming held consumer loans and leases as a percentage

Balances reflect the impact of outstanding consumer loans and leases were 3.61 percent (3.86 percent excludingnew consolidation guidance. Adoption of the new consolidation guidance did not impact the Countrywide purchased impairedPCI loan portfolio) and 1.68 percent (1.81 percent excluding the Countrywide purchased impaired loan portfolio) at December 31, 2009 and 2008.

portfolio.
(2)

Accruing held consumer loans

Outstandings includenon-U.S. residential mortgages of $90 million and leases past due 90 days or more as a percentage of outstanding consumer loans and leases were 2.74 percent (2.93 percent excluding Countrywide purchased impaired loan portfolio) and 0.73 percent (0.79 percent excluding the Countrywide purchased impaired loan portfolio)$552 million at December 31, 2010 and 2009.
(3)Outstandings include $11.8 billion and $13.4 billion of pay option loans and $1.3 billion and $1.5 billion of subprime loans at December 31, 2010 and 2009. We no longer originate these products.
(4)Outstandings include dealer financial services loans of $42.9 billion and $41.6 billion, consumer lending loans of $12.9 billion and $19.7 billion, U.S. securities-based lending margin loans of $16.6 billion and $12.9 billion, student loans of $6.8 billion and $10.8 billion,non-U.S. consumer loans of $8.0 billion and $8.0 billion and other consumer loans of $3.1 billion and $4.2 billion at December 31, 2010 and 2009, respectively.
(5)Outstandings include consumer finance loans of $1.9 billion and 2008. Residential mortgages$2.3 billion, othernon-U.S. consumer loans of $803 million and $709 million and consumer overdrafts of $88 million and $144 million at December 31, 2010 and 2009.
n/a = not applicable
72     Bank of America 2010


The table below presents our accruing consumer loans past due 90 days or more and our consumer nonperforming loans. Nonperforming loans do not include past due consumer credit card loans, consumer non-real estate-secured loans or unsecured consumer loans as these loans are generally charged off no later than the end of the month in which the loan becomes 180 days past due. Real estate-secured past due consumer loans insured by the FHA are reported as accruing as opposed to nonperforming since the

principal repayment is insured by the FHA. FHA insured loans accruing past due 90 days or more are primarily related to our purchases of delinquent loans pursuant to our servicing agreements with GNMA. Additionally, nonperforming loans and accruing balances past due 90 days or more do not include the Countrywide PCI loans even though the customer may be contractually past due.


Table 19 Consumer Credit Quality
                          
   Accruing Past Due 90 Days or More  Nonperforming 
   December 31
  January 1
  December 31
  December 31
  January 1
  December 31
 
(Dollars in millions)  2010 (1)  2010 (1)  2009  2010 (1)  2010 (1)  2009 
Residential mortgage(2, 3)
  $16,768  $11,680  $11,680  $17,691  $16,596  $16,596 
Home equity (2)
            2,694   4,252   3,804 
Discontinued real estate (2)
            331   249   249 
U.S. credit card   3,320   5,408   2,158   n/a   n/a   n/a 
Non-U.S. credit card
   599   814   515   n/a   n/a   n/a 
Direct/Indirect consumer   1,058   1,492   1,488   90   86   86 
Other consumer   2   3   3   48   104   104 
                          
Total
  $21,747  $19,397  $15,844  $20,854  $21,287  $20,839 
                          
(1)Balances reflect the impact of new consolidation guidance.
(2)Our policy is to classify consumer real estate-secured loans as nonperforming at 90 days past due, except Countrywide PCI loans and FHA loans as referenced in footnote (3).
(3)At December 31, 2010 and 2009, balances accruing past due 90 days or more represent repurchases ofloans insured or guaranteed loans. See Residential Mortgage discussion for more detail.

(3)

Outstandingsby the FHA. These balances include foreign residential mortgages of $552 million at December 31, 2009 mainly from the Merrill Lynch acquisition. We did not have any foreign residential mortgage loans at December 31, 2008.

(4)

Outstandings include $13.4$8.3 billion and $18.2$2.2 billion of pay option loans that are no longer accruing interest or interest has been curtailed by the FHA although principal is still insured and $1.5$8.5 billion and $1.8$9.5 billion of subprime loans at December 31, 2009 and 2008. We no longer originate these products.

(5)

Outstandings include dealer financial services loans of $41.6 billion and $40.1 billion, consumer lending loans of $19.7 billion and $28.2 billion, securities-based lending margin loans of $12.9 billion and $0, and foreignthat were still accruing interest. Our policy is to classify delinquent consumer loans of $8.0 billionsecured by real estate and $1.8 billion at December 31, 2009 and 2008, respectively.

insured by the FHA as accruing past due 90 days or more.
(6)
n/a = not applicable

Outstandings include consumer finance loans of $2.3 billion and $2.6 billion, and other foreign consumer loans of $709 million and $618 million at December 31, 2009 and 2008.

n/a

= not applicable

Bank of America 200955


Accruing consumer loans and leases past due 90 days or more as a percentage of outstanding consumer loans and leases were 3.38 percent (0.90 percent excluding the Countrywide PCI and FHA insured loan portfolios) and 2.74 percent (0.79 percent excluding the Countrywide PCI and FHA insured loan portfolios) at December 31, 2010 and 2009. Nonperforming consumer loans as a percentage of outstanding consumer loans were

Table 18

3.24 percent (3.76 percent excluding the Countrywide PCI and FHA insured loan portfolios) and 3.61 percent (3.95 percent excluding the Countrywide PCI and FHA insured loan portfolios) at December 31, 2010 and 2009.
The table below presents net charge-offs and related ratios for our consumer loans and leases for 2010 and net losses and related ratios2009 (managed basis for our managed credit card portfolio for 2009 and 2008. The reported net charge-off ratios for residential mortgage, home equity and discontinued real estate

2009).

benefit from the addition of the Countrywide purchased impaired loan portfolio as the initial fair value adjustments recorded on those loans upon acquisition already included the estimated credit losses.


Table 18  20Consumer Net Charge-offs/Charge-offs, Net Losses and Related Ratios

  Net Charge-offs/Losses    Net Charge-off/Loss Ratios (1, 2) 
(Dollars in millions) 2009    2008         2009   2008 

Held basis


Residential mortgage

 $4,350    $925   1.74  0.36

Home equity

  7,050     3,496   4.56    2.59  

Discontinued real estate

  101     16   0.58    0.15  

Credit card – domestic

  6,547     4,161   12.50    6.57  

Credit card – foreign

  1,239     551   6.30    3.34  

Direct/Indirect consumer

  5,463     3,114   5.46    3.77  

Other consumer

  428     399   12.94    10.46  

Total held

 $25,178    $12,662   4.22    2.21  

Supplemental managed basis data


Credit card – domestic

 $16,962    $10,054   12.07    6.60  

Credit card – foreign

  2,223     1,328   7.43    4.17  

Total credit card – managed

 $19,185    $11,382    11.25    6.18  
                 
  Net Charge-offs  Net Charge-offs(1, 2) 
(Dollars in millions) 2010  2009  2010  2009 
Held basis                
Residential mortgage $3,670  $4,350   1.49%  1.74%
Home equity  6,781   7,050   4.65   4.56 
Discontinued real estate  68   101   0.49   0.58 
U.S. credit card  13,027   6,547   11.04   12.50 
Non-U.S. credit card
  2,207   1,239   7.88   6.30 
Direct/Indirect consumer  3,336   5,463   3.45   5.46 
Other consumer  261   428   8.89   12.94 
                 
Total held
 $29,350  $25,178   4.51   4.22 
                 
  Net Losses  Net Losses(1) 
Supplemental managed basis data
                
U.S. credit card  n/a  $16,962   n/a   12.07 
Non-U.S. credit card
  n/a   2,223   n/a   7.43 
                 
Total credit card – managed
  n/a  $19,185   n/a   11.25 
                 
(1)

Net charge-off/charge-off and net loss ratios are calculated as held net charge-offs or managed net losses divided by average outstanding held or managed loans and leases.

(2)

Net charge-off ratios excluding the Countrywide purchased impairedPCI and FHA insured loan portfolio were 1.821.79 percent and 0.361.83 percent for residential mortgage, 5.005.10 percent and 2.735.00 percent for home equity, 5.574.20 percent and 1.335.57 percent for discontinued real estate and 4.525.02 percent and 2.294.53 percent for the total held portfolio for 20092010 and 2008.2009. These are the only product classifications materially impacted by the Countrywide purchased impairedPCI loan portfolio for 20092010 and 2008.2009. For all loan and lease categories, the dollar amounts of the net charge-offs were unchanged.

n/a = not applicable

We believe that the presentation of information adjusted to exclude the impactsimpact of the Countrywide purchased impairedPCI and FHA insured loan portfolioportfolios is more representative of the ongoing operations and credit quality of the business. As a result, in the following discussions of the residential mortgage, home

equity and discontinued real estate portfolios, we supplement certain reported statistics withprovide information that is adjusted to exclude the impactsimpact of the Countrywide purchased impairedPCI and FHA insured loan portfolio.portfolios. In addition, beginning on page 59,78, we separately disclose information on the Countrywide purchased impairedPCI loan portfolio.


Bank of America 2010     73


Residential Mortgage

The residential mortgage portfolio, which excludes the discontinued real estate portfolio acquired with Countrywide, makes up the largest percentage of our consumer loan portfolio at 4240 percent of consumer loans and leases (43 percent excluding the Countrywide purchased impaired loan portfolio) at December 31, 2009.2010. Approximately 1514 percent of the residential mortgage portfolio is inGWIMand represents residential mortgages that are originated for the home purchase and refinancing needs of our affluent customers.clients. The remaining portion of the portfolio is mostly inAll Otherand is comprised of both purchased loans as well as residential loans originated for our customers which areand used in our overall ALM activities.

activities as well as purchased loans.

Outstanding loans and leases decreased $5.9balances in the residential mortgage portfolio increased $15.8 billion at December 31, 20092010 compared to December 31, 2008 due2009 as new FHA insured origination volume was partially offset by paydowns, the sale

of First Republic, transfers to lower balance sheet retentionforeclosed properties and charge-offs. In addition, FHA repurchases of new originations, paydowns and charge-offs as well as sales and conversions ofdelinquent loans into retained MBS. These decreases were offset, in part, by the acquisition of Merrill Lynch and GNMA repurchases. Merrill Lynch added $21.7 billion of residential mortgage outstandings as of December 31, 2009. At December 31, 2009 and 2008, loans past due 90 days or more and still accruing interest of $11.7 billion and $372 million were related to repurchases pursuant to our servicing agreements with GNMA where repayments arealso increased the residential mortgage portfolio during 2010. At December 31, 2010 and 2009, the residential mortgage portfolio included $53.9 billion and $12.9 billion of outstanding loans that were insured by the FHA. The increase was driven byOn this portion of the repurchase of delinquent loans from securitizations during the year asresidential mortgage portfolio, we repurchase these loans for economic reasons, with no significant detrimental impact to our risk exposure. Excluding these repurchases, the accruing loans past due 90 days or moreare protected against principal loss as a percentageresult of consumer loansFHA insurance. The table below presents certain residential mortgage key credit statistics on both a reported basis and leases would have

been 0.72 percent (0.77 percent excluding the Countrywide purchased impairedPCI and FHA insured loan portfolio) and 0.67 percent (0.72 percent excludingportfolios. We believe the Countrywide purchased impaired loan portfolio) at December 31, 2009 and 2008.

Nonperforming residential mortgage loans increased $9.5 billion comparedpresentation of information adjusted to December 31, 2008 due toexclude the impacts of the weak housing marketsCountrywide PCI and economic conditions andFHA insured loan portfolios is more representative of the credit risk in part due to TDRs.this portfolio. For more information on TDRs, refer to the Nonperforming Consumer Loans and Foreclosed Properties ActivityCountrywide PCI loan portfolio, see the discussion beginning on page 6278.


Table 21 Residential Mortgage – Key Credit Statistics
                 
  December 31 
     Excluding Countrywide Purchased Credit-impaired
 
     and
 
  Reported Basis  FHA Insured Loans 
(Dollars in millions) 2010  2009  2010  2009 
Outstandings $257,973  $242,129  $193,435  $218,147 
Accruing past due 90 days or more  16,768   11,680   n/a   n/a 
Nonperforming loans  17,691   16,596   17,691   16,596 
Percent of portfolio with refreshed LTVs greater than 90 but less than 100  15%  12%  10%  11%
Percent of portfolio with refreshed LTVs greater than 100  32   27   23   23 
Percent of portfolio with refreshed FICOs below 620  20   17   14   12 
Percent of portfolio in the 2006 and 2007 vintages  32   42   38   42 
Net charge-off ratio  1.49   1.74   1.79   1.83 
                 
n/a = not applicable

The following discussion presents the residential mortgage portfolio excluding the Countrywide PCI and FHA insured loan portfolios.
We have mitigated a portion of our credit risk on the residential mortgage portfolio through the use of synthetic securitization vehicles and long-term standby agreements with FNMA and FHLMC as described inNote 6 – Outstanding Loans and Leasesto the Consolidated Financial Statements. At December 31, 2010 and 2009, $9.6the synthetic securitization vehicles referenced $53.9 billion or approximately 58 percent,and $70.7 billion of the nonperforming residential mortgage loans were greater than 180 days past due and provided loss protection up to $1.1 billion and $1.4 billion. At December 31, 2010 and 2009, the Corporation had been written down to their fair values. Net charge-offs increased $3.4a receivable of $722 million and $1.0 billion to $4.4 billion in 2009, or 1.74 percent (1.82 percent excludingfrom these vehicles for reimbursement of losses. The Corporation records an allowance for credit losses on loans referenced by the Countrywide purchased impaired portfolio), of total average residential mortgage loans compared to 0.36 percent (0.36 percent excluding the Countrywide purchased impaired portfolio) for 2008. These increases reflect the impacts of the weak housing markets and the weak economy. See the Countrywide Purchased Impaired Loan Portfolio discussion beginning on page 59 for more information.

We mitigate a portion of our credit risk through synthetic securitizations which are cash collateralized and provide mezzanine risk protection of $2.5 billion which will reimburse us in the event that losses exceed 10 bps of the original pool balance. For further information regarding these synthetic securitizations, seeNote 6 – Outstanding Loans and Leases to the Consolidated Financial Statements.securitization vehicles. The reported net charge-offs for the residential mortgagesmortgage portfolio do not include the benefitsbenefit of amounts reimbursable under cash collateralized synthetic securitizations.from these vehicles. Adjusting for the benefit of thisthe credit protection from the synthetic securitizations, the residential mortgage net charge-off ratio in 2009for 2010 would have been reduced by 25seven bps and fourcompared to 27 bps in 2008.for 2009. Synthetic securitizations and the protection provided by GSEsFNMA and FHLMC together providedmitigated risk mitigation for approximately 32 percent and 48on 35 percent of our residential mortgage portfolio at both December 31, 20092010 and 2008. Our2009. These credit protection agreements reduce our regulatory risk-weighted assets are reduced as a resultdue to the transfer of these risk protection transactions because we transferred a portion of our credit risk to unaffiliated parties. At December 31, 2010 and 2009, and 2008, these


56Bank of America 2009


transactions had the cumulative effect of reducing our risk-weighted assets by $8.6 billion and $16.8 billion, and $34.0 billion, and strengthenedincreased our Tier 1 capital ratio by 11seven bps and 2411 bps and our Tier 1 common capital ratio by eightfive bps and 12eight bps. At December 31, 2010 and 2009, $14.3 billion and $6.6 billion in loans were protected by long-term standby agreements. The Corporation does not record an allowance for credit losses on loans protected by these long-term standby agreements.

Below is a discussion

Nonperforming residential mortgage loans increased $1.1 billion compared to December 31, 2009 as new inflows, which continued to slow in 2010 due to favorable delinquency trends, continued to outpace nonperforming loans returning to performing status, charge-offs, and paydowns and payoffs. At December 31, 2010, $12.7 billion, or 72 percent, of certainthe nonperforming residential mortgage loans were 180 days or more past due and had been written down to the fair value of the underlying collateral. Net charge-offs decreased $680 million to $3.7 billion in 2010, or 1.79 percent of total average residential mortgage loans compared to 1.83 percent for 2009 driven primarily by favorable delinquency trends which were due in part to improvement in the U.S. economy. Net charge-off ratios were further impacted by lower loan balances primarily due to paydowns, the sale of First Republic and charge-offs.
Certain risk characteristics of the residential mortgage portfolio excluding the Countrywide purchased impaired loan portfolio, which contributedcontinued to contribute to higher losses. These characteristics include loans with a high refreshed LTVs,loan-to-value (LTV), loans which were originated at the peak of home prices in 2006 and 2007, loans to borrowers located in the states of California and Florida where we have concentrations and where significant declines in home prices have been experienced, as well as interest-only loans. Although the following disclosures below address each of these risk characteristics separately, there is significant overlap in loans with these characteristics, which contributed to a disproportionate share of the losses in the portfolio. Excluding the Countrywide purchased impaired portfolio,The residential mortgage loans with all of these higher risk characteristics comprised five percent and seven percent of the total residential mortgage portfolio at December 31, 2010 and 2009, but have accounted for 3126 percent of the residential mortgage net charge-offs in 2010 compared to 31 percent in 2009.


74     Bank of America 2010


Residential mortgage loans with a greater than 90 percent but less than 100 percent refreshed LTV represented 10 percent and 11 percent of the residential mortgage portfolio at December 31, 2010 and loans2009. Loans with a refreshed LTV greater than 100 percent represented 2623 percent of the residential mortgage loan portfolio at both December 31, 2010 and 2009. Of the loans with a refreshed LTV greater than 100 percent, 9088 percent were performing at both December 31, 2010 and 2009. Loans with a refreshed LTV greater than 100 per - -

centpercent reflect loans where the outstanding book balancecarrying value of the loan is greater than the most recent valuation of the property securing the loan. The majority of these loans have a refreshed LTV greater than 100 percent due primarily to home price deterioration from the weakened economy. Loans to borrowers with refreshed FICO scores below 620 represented 1614 percent and 12 percent of the residential mortgage portfolio.portfolio at December 31, 2010 and 2009.

The 2006 and 2007 vintage loans, which represented 38 percent and 42 percent of our residential mortgage portfolio at December 31, 2010 and 2009, continued to season and have higher refreshed LTVs and accounted for 67 percent and 69 percent of nonperforming residential mortgage loans at December 31, 20092010 and approximately 752009. These vintages of loans accounted for 77 percent of residential mortgage net charge-offs during 2010 and 75 percent during 2009.

The table below presents outstandings, nonperforming loans and net charge-offs by certain state concentrations for the residential mortgage portfolio. California and Florida combined represented 4342 percent of the total residential mortgage portfoliooutstandings and 4748 percent of nonperforming residential mortgage loans at December 31, 2009, but2010. These states accounted for 5854 percent of the residential mortgage net charge-offs for 2010 compared to 58 percent for 2009. The Los Angeles-Long Beach-Santa Ana Metropolitan Statistical Area (MSA) within California represented 12 percent and 13 percent of the total residential mortgage portfoliooutstandings at both December 31, 2010 and 2009, and 2008. Additionally, 37 percent and 24but comprised only seven percent of loans in Californianet charge-offs for both 2010 and Florida are in reference pools of synthetic securitizations, as described above, which provide mezzanine risk protection.

2009.


Table 19  22Residential Mortgage State Concentrations

  December 31   Year Ended
December 31
  Outstandings   Nonperforming   Net Charge-offs
(Dollars in millions)         2009  2008    2009  2008        2009  2008

California

 $82,329  $84,847  $5,967  $2,028  $1,726  $411

Florida

  16,518   15,787   1,912   1,012   796   154

New York

  16,278   15,539   632   255   66   5

Texas

  10,737   10,804   534   315   59   20

Virginia

  7,812   9,696   450   229   89   32

Other U.S./Foreign

  97,378   101,377    7,101   3,218    1,614   303

Total residential mortgage loans (excluding the Countrywide purchased
impaired residential mortgage loan portfolio)

 $231,052  $238,050   $16,596  $7,057   $4,350  $925

Total Countrywide purchased impaired residential mortgage loan portfolio (1)

  11,077   10,013        

Total residential mortgage loan portfolio

 $242,129  $248,063                  
                         
  December 31  Year Ended December 31 
  Outstandings  Nonperforming  Net Charge-offs 
(Dollars in millions) 2010  2009  2010  2009  2010  2009 
California $68,341  $81,508  $6,389  $5,967  $1,392  $1,726 
Florida  13,616   15,088   2,054   1,912   604   796 
New York  12,545   15,752   772   632   44   66 
Texas  9,077   9,865   492   534   52   59 
Virginia  6,960   7,496   450   450   72   89 
OtherU.S./Non-U.S. 
  82,896   88,438   7,534   7,101   1,506   1,614 
                         
Total residential mortgage loans (1)
 $193,435  $218,147  $17,691  $16,596  $3,670  $4,350 
                         
Total FHA insured loans
  53,946   12,905                 
Total Countrywide purchased credit-impaired residential mortgage portfolio
  10,592   11,077                 
                         
Total residential mortgage loan portfolio
 $257,973  $242,129                 
                         
(1)

Represents acquired loans from

Amount excludes the Countrywide that were considered impairedPCI residential mortgage and written down to fair value upon acquisition date. See page 59 for the discussion of the characteristics of the purchased impaired loans.

FHA insured loan portfolios.

Of the residential mortgage portfolio, $84.2loans, $62.5 billion, or 3532 percent, at December 31, 20092010 are interest-only loans of which 8987 percent were performing. Nonperforming balances on interest-only residential mortgage loans were $9.1$8.0 billion, or 5545 percent of total nonperforming residential mortgages. Additionally, net charge-offs on the interest-only portion of the portfolio represented 5853 percent of the total residential mortgage net charge-offs for 2009.

during 2010.

The Community Reinvestment Act (CRA) encourages banks to meet the credit needs of their communities for housing and other purposes, particularly in neighborhoods with low or moderate incomes. At December 31, 2009,2010, our CRA portfolio comprised sixwas eight percent of the total residential mortgage loan balances but comprised 17 percent of nonperforming residential mortgage loans. This portfolio also comprised 20represented 23 percent of residential mortgage net charge-offs during 2009. While approximately 32 percent of our residential mortgage portfolio carries risk mitigation protection, only a small portion of our CRA portfolio is covered by this protection.

2010.

We have sold and continue to sell mortgage and other loans, including mortgage loans, to third-party buyers and to FNMA and FHLMC under agreements that containFor information on representations and warranties related to among other things, the process for selecting the loans for inclusion in a saleour residential mortgage portfolio, see Representations and compliance with applicable criteria established by the buyer. Such agreements contain provisions under which we may be required to either repurchase the loans or indemnify or provide other recourse to the buyer or insurer if there is a breach of the representationsWarranties beginning on page 52 and warranties that materially and adversely affects the interests of the buyer or pursuant to such other standard established by the terms of such agreements. We have experienced and continue to experience increasing repurchase and similar demands from, and disputes with buyers and insurers. We expect to contest such demands that we do not believe are valid. In the event that we are required to repurchase loans that have been the subject of repurchase demands or otherwise provide indemnification or other recourse, this could significantly increase our losses and thereby affect our future earnings. For further information regarding representations and warranties, seeNote 89 – SecuritizationsRepresentations and Warranties Obligations and Corporate Guaranteesto the Consolidated Financial Statements, and Item 1A., Risk Factors.

Statements.

Bank of America 200957


Home Equity

The home equity portfolio makes up 21 percent of the consumer portfolio and is comprised of home equity lines of credit, home equity loans and reverse mortgages. At December 31, 2009,2010, approximately 8788 percent of the home equity portfolio was included inHome Loans & Insurance, while the remainder of the portfolio was primarily inGWIM.Outstanding balances in the home equity portfolio decreased $3.4$11.1 billion at December 31, 20092010 compared to December 31, 20082009 due to charge-offs, paydowns and managementthe sale of credit lines in the legacy portfolioFirst Republic, partially offset by the acquisitionadoption of Merrill Lynch.new consolidation guidance, which resulted in the consolidation of $5.1 billion of home equity loans on January 1, 2010. Of the loans in the home equity portfolio at December 31, 2010 and 2009, $24.8 billion and 2008, approximately $26.0 billion, or 18 percent and $23.2 billion, or 15 percent,for both periods, were in first lienfirst-lien positions (19(20 percent and 1719 percent excluding the Countrywide purchased impairedPCI home equity loan portfolio). For more information on the Countrywide purchased impairedPCI home equity loan portfolio, see the Countrywide Purchased Impaired Loan Portfolio discussion beginning on page 59.

78.

Home equity unused lines of credit totaled $80.1 billion at December 31, 2010 compared to $92.7 billion at December 31, 2009 compared to $107.4 billion at December 31, 2008.2009. This decrease was drivendue primarily by higher customerto account net utilization and lower attrition as well as line management initiatives on deteriorating accounts with declining equity positions partiallyand the sale of First Republic, which more than offset by the Merrill Lynch acquisition.new production. The home equity line of credit utilization rate was 5659 percent at December 31, 20092010 compared to 5257 percent at December 31, 2008.2009.


Bank of America 2010     75


The table below presents certain home equity key credit statistics on both a reported basis as well as excluding the Countrywide PCI loan portfolio. We believe the presentation of information adjusted to exclude the impacts of the Countrywide PCI loan portfolio is more representative of the credit risk in this portfolio.
Table 23 Home Equity – Key Credit Statistics
                 
  December 31 
     Excluding Countrywide Purchased Credit-
 
  Reported Basis  impaired Loans 
(Dollars in millions) 2010  2009  2010  2009 
Outstandings $137,981  $149,126  $125,391  $135,912 
Nonperforming loans  2,694   3,804   2,694   3,804 
Percent of portfolio with refreshed CLTVs greater than 90 but less than 100  11%  12%  11%  12%
Percent of portfolio with refreshed CLTVs greater than 100  34   35   30   31 
Percent of portfolio with refreshed FICOs below 620  14   13   12   13 
Percent of portfolio in the 2006 and 2007 vintages  50   52   47   49 
Net charge-off ratio  4.65   4.56   5.10   5.00 
                 

The following discussion presents the home equity portfolio excluding the Countrywide PCI loan portfolio.
Nonperforming home equity loans increased $1.2decreased $1.1 billion to $2.7 billion compared to December 31, 2008 due2009 driven primarily by charge-offs, including those recorded in connection with regulatory guidance clarifying the timing of charge-offs on collateral dependent modified loans, and nonperforming loans returning to performing status which together outpaced delinquency inflows and the weak housing market and economic conditions and in part to TDRs. For more information on TDRs, refer toimpact of the Nonperforming Consumer Loans and Foreclosed Properties Activity discussion on page 62 andNote 6 – Outstanding Loans and Leases to the Consolidated Financial Statements.adoption of new consolidation guidance. At December 31, 2009, $7212010, $916 million, or approximately 2034 percent, of the nonperforming home equity loans were greater than 180 days or more past due and had been written down to their fair values. Net charge-offs increased $3.6decreased $269 million to $6.8 billion, to $7.1 billion for 2009, or 4.565.10 percent, (5.00 percent excluding the Countrywide purchased impaired loan portfolio) of total average home equity loans for 2010 compared to 2.59$7.1 billion, or 5.00 percent, (2.73 percent excluding the Countrywide purchased impaired loan portfolio) in 2008. These increases werefor 2009. The decrease was primarily driven by continued weaknessfavorable portfolio trends due in part to improvement in the housing marketsU.S. economy. This was partially offset by $822 million of net charge-offs related to the implementation of regulatory guidance on collateral dependent modified loans and $463 million of net charge-offs related to home equity loans that were consolidated on January 1, 2010 under new consolidation guidance. Net charge-off ratios were further impacted by lower loan balances primarily as a result of charge-offs, paydowns and the economy.

sale of First Republic.

There are certain risk characteristics of the home equity portfolio excluding the Countrywide purchased impaired loan portfolio, which have contributed to higher losses. These characteristics includelosses including loans with a high refreshed CLTVs,combinedloan-to-value (CLTV), loans originated at the peak of home prices in 2006 and 2007 and loans in geographic areas that have experienced the most significant declines in home prices. Home price declines coupled with the fact that most home equity loans are secured by second lien

second-lien positions have significantly reduced and, in some cases, eliminated all collateral value after consideration of the first lienfirst-lien position. Although the following disclosures below address each of these risk characteristics separately, there is significant overlap in loans with these characteristics, which has contributed to a

disproportionate share of losses in the portfolio. Excluding the Countrywide purchased impaired portfolio, homeHome equity loans with all of these higher risk characteristics comprised 10 percent and 11 percent of the total home equity portfolio at December 31, 2010 and 2009, but have accounted for 3829 percent of the home equity net charge-offs forin 2010 compared to 38 percent in 2009.

Home equity loans with greater than 90 percent but less than 100 percent refreshed CLTVs comprised 11 percent and 12 percent of the home equity portfolio while loansat December 31, 2010 and 2009. Loans with refreshed CLTVs greater than 100 percent comprised 30 percent and 31 percent of the home equity portfolio at December 31, 2009. Net charge-offs on loans with a refreshed CLTV greater than 100 percent represented 82 percent of net charge-offs for2010 and 2009. Of those loans with a refreshed CLTV greater than 100 percent, 97 percent were performing at December 31, 2010 while 95 percent were performing at December 31, 2009. Home equity loans and lines of credit with a refreshed CLTV greater than 100 percent reflect loans where the balancecarrying value and available line of credit of the combined loans are equal to or greater than the most recent valuation of the property securing the loan. Depending on the LTV of the first lien, there may be collateral in excess of the first lien that is available to reduce the severity of loss on the second lien. The majority of these high refreshed CLTV ratios are due to the weakened economy and home price declines. In addition, loans to borrowers with a refreshed FICO score below 620 represented 12 percent and 13 percent of the home equity loans at December 31, 2010 and 2009. Of the total home equity portfolio, 6875 percent and 72 percent at December 31, 2010 and 2009 were interest-only loans.

The 2006 and 2007 vintage loans, which represent 47 percent and 49 percent of our home equity portfolio continued to seasonat December 31, 2010 and 2009, have higher refreshed CLTVs and accounted for 6257 percent of nonperforming home equity loans at December 31, 2009 and approximately 722010 compared to 62 percent at December 31, 2009. These vintages of loans accounted for 66 percent of net charge-offs forin 2010 compared to 72 percent in 2009. Additionally, legacy


76     Bank of America discontinued the program of purchasing non-franchise originated home equity loans in the second quarter of 2007. These purchased loans represented only two percent of the home equity portfolio but accounted for 10 percent of home equity net charge-offs for 2009.2010


The table below presents outstandings, nonperforming loans and net charge-offs by certain state concentrations for the home equity loan portfolio. California and Florida combined represented 4140 percent of the total home equity portfolio and 5044 percent of nonperforming home equity loans at December 31, 2009, but2010. These states accounted for 55 percent of the home equity net charge-offs for 2010 compared to 60 percent of the home equity net charge-offs for 2009. In the New York area, the New York-Northern New Jersey-Long Island MSA made up 11 percent of outstanding home equity loans at both December 31, 2009 but2010 and 2009. This MSA comprised only six percent

of net charge-offs for both 2010 and 2009. The Los Angeles-Long Beach-Santa Ana MSA within California made up 11 percent of outstanding home equity loans at both December 31, 2010 and 2009 and 13comprised 11 percent of net charge-offs for 2010 compared to 13 percent for 2009.

For information on representations and warranties related to our home equity portfolio, see Representations and Warranties beginning on page 52 andNote 9 – Representations and Warranties Obligations and Corporate Guaranteesto the Consolidated Financial Statements.


Table 20  24Home Equity State Concentrations

  December 31   

Year Ended

December 31

  Outstandings   Nonperforming   Net Charge-offs
(Dollars in millions)             2009  2008        2009  2008    2009  2008

California

 $38,573  $38,015  $1,178  $857  $2,669  $1,464

Florida

  16,735   17,893   731   597   1,583   788

New York

  8,752   8,602   274   176   262   96

New Jersey

  8,732   8,929   192   126   225   96

Massachusetts

  6,155   6,008   90   48   93   56

Other U.S./Foreign

  56,965   58,937    1,339   833    2,218   996

Total home equity loans (excluding the Countrywide purchased
impaired home equity portfolio)

 $135,912  $138,384   $3,804  $2,637   $7,050  $3,496

Total Countrywide purchased impaired home equity portfolio(1)

  13,214   14,099        

Total home equity portfolio

 $149,126  $152,483                  
(1)

Represents acquired loans from Countrywide that were considered impaired and written down to fair value at the acquisition date. See page 59 for the discussion of the characteristics of the purchased impaired loans.

                         
              Year Ended
 
  December 31  December 31 
  Outstandings  Nonperforming  Net Charge-offs 
(Dollars in millions) 2010  2009  2010  2009  2010  2009 
California $35,426  $38,573  $708  $1,178  $2,341  $2,669 
Florida  15,028   16,735   482   731   1,420   1,583 
New Jersey  8,153   8,732   169   192   219   225 
New York  8,061   8,752   246   274   273   262 
Massachusetts  5,657   6,155   71   90   102   93 
OtherU.S./Non-U.S. 
  53,066   56,965   1,018   1,339   2,426   2,218 
                         
Total home equity loans (1)
 $125,391  $135,912  $2,694  $3,804  $6,781  $7,050 
                         
Total Countrywide purchased credit-impaired home
                        
equity loan portfolio
  12,590   13,214                 
                         
Total home equity loan portfolio
 $137,981  $149,126                 
                         
58(1)Bank of America 2009Amount excludes the Countrywide PCI home equity loan portfolio.


Discontinued Real Estate

The discontinued real estate portfolio, totaling $14.9$13.1 billion at December 31, 2009,2010, consisted of pay option and subprime loans obtainedacquired in the Countrywide acquisition. Upon acquisition, the majority of the discontinued real estate portfolio was considered impairedcredit-impaired and written down to fair value. At December 31, 2009,2010, the Countrywide purchased impairedPCI loan portfolio comprised $13.3$11.7 billion, or 89 percent, of the $14.9 billiontotal discontinued real estate portfolio. This portfolio is included inAll Otherand is managed as part of our overall ALM activities. See the Countrywide Purchased ImpairedCredit-impaired Loan Portfolio discussion belowbeginning on page 78 for more information on the discontinued real estate portfolio.

At December 31, 2009,2010, the purchased non-impaired discontinued real estate portfolio that was $1.6not credit-impaired was $1.4 billion. Loans with greater than 90 percent refreshed LTVs and CLTVs comprised 2529 percent of thisthe portfolio and those with refreshed FICO scores below 620 represented 3946 percent of the portfolio. California represented 37 percent of the portfolio and 3034 percent of the nonperforming loans while Florida represented nine10 percent of the portfolio and 1615 percent of the nonperforming loans at December 31, 2009.2010. The Los Angeles-Long Beach-Santa Ana MSA within California made up 1516 percent of outstanding discontinued real estate loans at December 31, 2009.

Countrywide Purchased Impaired Loan Portfolio

Loans acquired with evidence of credit quality deterioration since origination and for2010.

Pay option adjustable-rate mortgages (ARMs), which it is probable at purchase that we will be unable to collect all contractually required payments are accounted for under the accounting guidance for purchased impaired loans, which addresses accounting for differences between contractual and expected cash flows to be collected from the Corporation’s initial investment in loans if those differences are attributable, at least in part, to credit quality. Evidence of credit quality deterioration as of the acquisition date may include statistics such as past due status, refreshed FICO scores and refreshed LTVs. Purchased impaired loans are recorded at fair value and the applicable accounting guidance prohibits carrying over or creation of valuation allowancesincluded in the initial accounting. The Merrill Lynch purchased impaired consumer loan portfolio did not materially alter the reported credit quality statistics of the consumer portfolios. As such, the Merrill Lynch consumer purchased impaired loans are excluded from the following discussion and credit statistics.

Certain acquired loans of Countrywide that were considered impaired were written down to fair value at the acquisition date. As of December 31, 2009, the carrying value was $37.5 billion and the unpaid principal balance of these loans was $47.7 billion. Based on the unpaid

principal balance, $30.6 billion have experienced no charge-offs and of these loans 82 percent, or $25.1 billion are current based on their contractual terms. Of the $5.5 billion that are not current, approximately 51 percent, or $2.8 billion are in early stage delinquency. During 2009, had the acquired portfolios not been accounted for as impaired, we would have recorded additional net charge-offs of $7.4 billion. During 2009, the Countrywide purchased impaired loan portfolio experienced further credit deterioration due to weakness in the housing markets and the impacts of a weak economy. As such, in 2009, we recorded $3.3 billion of provision for credit losses which was comprised of $3.0 billion for home equity loans and $316 million for discontinued real estate loans compared to $750 million in 2008. In addition, we wrote down Countrywide purchased impaired loans by $179 million during 2009 as losses on certain pools of impaired loans exceeded the original purchase accounting adjustment. The remaining purchase accounting credit adjustment of $487 million and the allowance of $3.9 billion results in a total credit adjustment of $4.4 billion remaining on all pools of Countrywide purchased impaired loans at December 31, 2009. For further information on the purchased impaired loan portfolio, seeNote 6 – Outstanding Loans and Leasesto the Consolidated Financial Statements.

The following discussion provides additional information on the Countrywide purchased impaired residential mortgage, home equity and discontinued real estate loan portfolios. Since these loans were written down to fair value upon acquisition, we are reporting this information separately. In certain cases, we supplement the reported statistics on these portfolios with information that is presented as if the acquired loans had not been accounted for as impaired upon acquisition.

Residential Mortgage

The Countrywide purchased impaired residential mortgage portfolio outstandings were $11.1 billion at December 31, 2009 and comprised 30 percent of the total Countrywide purchased impaired loan portfolio. Those loans with a refreshed FICO score below 620 represented 33 percent of the Countrywide purchased impaired residential mortgage portfolio at December 31, 2009. Refreshed LTVs greater than 90 percent after consideration of purchase accounting adjustments and refreshed LTVs greater than 90 percent based on the unpaid principal balance represented 65 percent and 80 percent of the purchased impaired residential mortgage portfolio. The table below presents outstandings net of purchase accounting adjustments and net charge-offs had the portfolio not been accounted for as impaired upon acquisition by certain state concentrations.


Table 21  Countrywide Purchased Impaired Loan Portfolio Residential Mortgage State Concentrations

  Outstandings(1)    Purchased Impaired Portfolio Net Charge-offs (1, 2)
  December 31    Year Ended December 31
(Dollars in millions) 2009    2008                 2009                2008

California

 $6,142    $5,633   $496    $177

Florida

  843     776    143     103

Virginia

  617     556    30     14

Maryland

  278     253    13     6

Texas

  166     148    5     5

Other U.S./Foreign

  3,031     2,647     237     133

Total Countrywide purchased impaired residential mortgage loan portfolio

 $11,077    $10,013    $924    $438
(1)

Those loans that were originally classified as discontinued real estate loans upon acquisition and have been subsequently modified are now included in the residential mortgage outstandings shown above. Charge-offs on these loans prior to modification are excluded from the amounts shown above and shown as discontinued real estate charge-offs consistent with the product classification of the loan at the time of charge-off.

(2)

Represents additional net charge-offs had the portfolio not been accounted for as impaired upon acquisition.

Bank of America 200959


Home Equity

The Countrywide purchased impaired home equity outstandings were $13.2 billion at December 31, 2009 and comprised 35 percent of the total Countrywide purchased impaired loan portfolio. Those loans with a refreshed FICO score below 620 represented 21 percent of the Countrywide purchased impaired home equity portfolio at December 31, 2009. Refreshed CLTVs greater than 90 percent represented 90 percent of the

purchased impaired home equity portfolio after consideration of purchase accounting adjustments and 89 percent of the purchased impaired home equity portfolio based on the unpaid principal balance at December 31, 2009. The table below presents outstandings net of purchase accounting adjustments and net charge-offs had the portfolio not been accounted for as impaired upon acquisition, by certain state concentrations.


Table 22  Countrywide Purchased Impaired Portfolio – Home Equity State Concentrations

  Outstandings    Purchased Impaired Portfolio Net Charge-offs (1)
  December 31    Year Ended December 31
(Dollars in millions) 2009    2008                         2009                          2008

California

 $4,311    $5,110   $1,769  $744

Florida

  765     910    320   186

Virginia

  550     529    77   42

Arizona

  542     626    203   79

Colorado

  416     402    48   22

Other U.S./Foreign

  6,630     6,522     1,057   421

Total Countrywide purchased impaired home equity portfolio

 $13,214    $14,099    $3,474  $1,494
(1)

Represents additional net charge-offs had the portfolio not been accounted for as impaired upon acquisition.

Discontinued Real Estate

The Countrywide purchased impaired discontinued real estate outstandings were $13.3 billion at December 31, 2009 and comprised 35 percent of the total Countrywide purchased impaired loan portfolio. Those loans with a refreshed FICO score below 620 represented 51 percent of the Countrywide purchased impaired discontinued real estate portfolio at December 31, 2009. Refreshed LTVs and CLTVs greater than 90 percent represented 52 percent of the purchased impaired discontinued real

estate portfolio after consideration of purchase accounting adjustments. Refreshed LTVs and CLTVs greater than 90 percent based on the unpaid principal balance represented 80 percent of the purchased impaired discontinued real estate portfolio at December 31, 2009. The table below presents outstandings net of purchase accounting adjustments and net charge-offs had the portfolio not been accounted for as impaired upon acquisition, by certain state concentrations.


Table 23  Countrywide Purchased Impaired Loan Portfolio – Discontinued Real Estate State Concentrations

  Outstandings(1)    Purchased Impaired Portfolio Net Charge-offs (1, 2)
  December 31    Year Ended December 31
(Dollars in millions) 2009    2008                       2009                        2008

California

 $7,148    $9,987   $1,845  $1,010

Florida

  1,315     1,831    393   275

Arizona

  430     666    151   61

Washington

  421     492    30   8

Virginia

  399     580    76   48

Other U.S./Foreign

  3,537     4,541     517   297

Total Countrywide purchased impaired discontinued real estate loan portfolio

 $13,250    $18,097    $3,012  $1,699
(1)

Those loans that were originally classified as discontinued real estate loans upon acquisition and have been subsequently modified are now excluded from amounts shown above. Charge-offs on these loans prior to modification are included in the amounts shown above consistent with the product classification of the loan at the time of charge-off.

(2)

Represents additional net charge-offs had the portfolio not been accounted for as impaired upon acquisition.

Pay option ARMs have interest rates that adjust monthly and minimum required payments that adjust annually, (subjectsubject to resetting of the loan if minimum payments are made and deferred interest limits are reached).reached. Annual payment adjustments are subject to a 7.5 percent maximum change. To ensure that contractual loan payments are adequate to repay a loan, the fully amortizing loan payment amount is re-established after the initial five or10-year period and again every five years thereafter. These payment adjustments are not subject to the 7.5 percent limit and may be substantial due to changes in interest rates and the addition of unpaid interest to the loan

balance. Payment advantage ARMs have interest rates that are fixed for an initial period of five years. Payments are subject to reset if the minimum payments are made and deferred interest limits are reached. If interest deferrals cause thea loan’s principal balance

to reach a certain level within the first 10 years of the loans,life of the loan, the payment is reset to the interest-only payment; then at the10-year point, the fully amortizing payment is required.

The difference between the frequency of changes in the loans’ interest rates and payments along with a limitation on changes in the minimum monthly payments toof 7.5 percent per year can result in payments that are not sufficient to pay all of the monthly interest charges (i.e., negative amortization). Unpaid interest charges are added to the loan balance until the loan balance increases to a specified limit, which iscan be no more than 115 percent of the original loan amount, at which time a new monthly payment amount adequate to repay the loan over its remaining contractual life is established.


60Bank of America 2009


At December 31, 2009,2010, the unpaid principal balance of pay option loans was $17.0$14.6 billion, with a carrying amount of $13.4$11.8 billion, including $12.5$11.0 billion of loans that were impairedcredit-impaired upon acquisition. The total unpaid principal balance of pay option loans with accumulated negative amortization was $15.2$12.5 billion and accumulatedincluding $858 million of negative amortization from the original loan balance was $1.0 billion.amortization. The percentage of borrowers electing to make only the minimum payment on option ARMs was 6569 percent at December 31, 2009.2010. We continue to evaluate our exposure to payment resets on the acquired negatively amortizingnegative-amortizing loans including the Countrywide PCI pay option loan portfolio and have taken into consideration several assumptions regarding this evaluation (e.g., prepayment rates). We also continue to evaluate the potential for resets on the Countrywide purchased impaired pay option portfolio. Based on our expectations, 21 percent, eight11 percent and twothree percent of the pay option loan portfolio isare expected to reset in 2010, 2011 and 2012, respectively.2012. Approximately threefour percent are expected to reset thereafter and approximately 6682 percent are expected to default or repay prior to being reset.


Bank of America 2010     77

We manage these purchased impaired portfolios, including consideration


Countrywide Purchased Credit-impaired Loan Portfolio
Loans acquired with evidence of credit quality deterioration since origination and for which it is probable at purchase that we will be unable to collect all contractually required payments are accounted for under the accounting guidance for PCI loans, which addresses accounting for differences between contractual and expected cash flows to be collected from the purchaser’s initial investment in loans if those differences are attributable, at least in part, to credit quality. Evidence of credit quality deterioration as of the acquisition date may include statistics such as past due status, refreshed FICO scores and refreshed LTVs. PCI loans are recorded at fair value upon acquisition and

the applicable accounting guidance prohibits carrying over or recording valuation allowances in the initial accounting. The Merrill Lynch PCI consumer loan portfolio did not materially alter the reported credit quality statistics of the consumer portfolios. As such, the Merrill Lynch consumer PCI loans are excluded from the following discussion and credit statistics.
Acquired loans from Countrywide that were considered credit-impaired were written down to fair value at the acquisition date. The following table presents the unpaid principal balance, carrying value, allowance for loan and lease losses and the net carrying value as a percentage of the unpaid principal balance for the Countrywide PCI loan portfolio at December 31, 2010.


Table 25 Countrywide Purchased Credit-impaired Loan Portfolio
                     
  December 31, 2010 
  Unpaid
        Carrying
  % of
 
  Principal
  Carrying
  Related
  Value Net of
  Unpaid Principal
 
(Dollars in millions) Balance  Value  Allowance  Allowance  Balance 
Residential mortgage $11,481  $10,592  $229  $10,363   90.26%
Home equity  15,072   12,590   4,514   8,076   53.58 
Discontinued real estate  14,893   11,652   1,591   10,061   67.56 
                     
Total Countrywide purchased credit-impaired loan portfolio
 $41,446  $34,834  $6,334  $28,500   68.76%
                     

Of the unpaid principal balance at December 31, 2010, $15.5 billion was 180 days or more past due, including $10.9 billion of first-lien and $4.6 billion of home retention programs to modify troubled mortgages, consistent with our other consumerequity. Of the $25.9 billion that is less than 180 days past due, $21.5 billion, or 83 percent of the total unpaid principal balance, was current based on the contractual terms while $2.2 billion, or eight percent, was in early stage delinquency. During 2010, we recorded $2.3 billion of provision for credit losses on PCI loans which was comprised mainly of $1.4 billion for home equity and $689 million for discontinued real estate practices.loans compared to a total provision for PCI loans of $3.3 billion in 2009. Provision expense in 2010 was driven primarily by a slower pace of expected recovery in home prices, the result of a deteriorating view on defaults on more seasoned loans in the portfolio and a reassessment of modification and short sale benefits as we gain more experience with troubled borrowers. The Countrywide PCI allowance for loan losses increased $2.5 billion from December 31, 2009 to $6.3 billion at December 31, 2010 as a result of the increase in the provision for credit losses and the reclassification of a portion of nonaccretable difference to the allowance. For further information on the PCI loan portfolio, seeNote 6 – Outstanding Loans and Leasesto the Consolidated Financial Statements.
Additional information on the Countrywide PCI residential mortgage, home equity and discontinued real estate loan portfolios follows.

Purchased Credit-impaired Residential Mortgage Loan Portfolio
The Countrywide PCI residential mortgage loan portfolio outstandings were $10.6 billion at December 31, 2010 and comprised 30 percent of the total Countrywide PCI loan portfolio. Those loans to borrowers with a refreshed FICO score below 620 represented 38 percent of the Countrywide PCI residential mortgage loan portfolio at December 31, 2010. Refreshed LTVs greater than 90 percent represented 68 percent of the PCI residential mortgage loan portfolio after consideration of purchase accounting adjustments and 82 percent based on the unpaid principal balance at December 31, 2010. Those loans that were originally classified as discontinued real estate loans upon acquisition and have been subsequently modified are now included in the residential mortgage outstandings. The table below presents outstandings net of purchase accounting adjustments, by certain state concentrations.
Table 26 Outstanding Countrywide PurchasedCredit-impaired Loan Portfolio – Residential Mortgage State Concentrations
         
  December 31 
(Dollars in millions) 2010  2009 
California $5,882  $6,142 
Florida  779   843 
Virginia  579   617 
Maryland  271   278 
Texas  164   166 
OtherU.S./Non-U.S. 
  2,917   3,031 
         
Total Countrywide purchased credit-impaired residential mortgage loan portfolio
 $10,592  $11,077 


78     Bank of America 2010


Purchased Credit-impaired Home Equity Loan Portfolio
The Countrywide PCI home equity loan portfolio outstandings were $12.6 billion at December 31, 2010 and comprised 36 percent of the total Countrywide PCI loan portfolio. Those loans with a refreshed FICO score below 620 represented 26 percent of the Countrywide PCI home equity loan portfolio at December 31, 2010. Refreshed CLTVs greater than 90 percent represented 85 percent of the PCI home equity loan portfolio after consideration of purchase accounting adjustments and 85 percent based on the unpaid principal balance at December 31, 2010. The table below presents outstandings net of purchase accounting adjustments, by certain state concentrations.
Table 27 Outstanding Countrywide PurchasedCredit-impaired Loan Portfolio – Home Equity State Concentrations
         
  December 31 
(Dollars in millions) 2010  2009 
California $4,178  $4,311 
Florida  750   765 
Virginia  532   550 
Arizona  520   542 
Colorado  375   416 
OtherU.S./Non-U.S. 
  6,235   6,630 
         
Total Countrywide purchased credit-impaired home equity loan portfolio
 $12,590  $13,214 
         
Purchased Credit-impaired Discontinued Real Estate Loan Portfolio
The Countrywide PCI discontinued real estate loan portfolio outstandings were $11.7 billion at December 31, 2010 and comprised 34 percent of the total Countrywide PCI loan portfolio. Those loans to borrowers with a refreshed FICO score below 620 represented 62 percent of the Countrywide PCI discontinued real estate loan portfolio at December 31, 2010. Refreshed LTVs and CLTVs greater than 90 percent represented 55 percent of the PCI discontinued real estate loan portfolio after consideration of purchase accounting adjustments and 83 percent based on the unpaid principal balance at December 31, 2010. Those loans that were originally classified as discontinued real estate loans upon acquisition and have been subsequently modified are now excluded from this portfolio and included in the Countrywide PCI residential mortgage loan portfolio, but remain in the PCI loan pool. The table below presents outstandings net of purchase accounting adjustments, by certain state concentrations.
Table 28 Outstanding Countrywide Purchased Credit-impaired Loan Portfolio – Discontinued Real Estate State Concentrations
         
  December 31 
(Dollars in millions) 2010  2009 
California $6,322  $7,148 
Florida  1,121   1,315 
Washington  368   421 
Virginia  344   399 
Arizona  339   430 
OtherU.S./Non-U.S. 
  3,158   3,537 
         
Total Countrywide purchased credit-impaired discontinued real estate loan portfolio
 $11,652  $13,250 
         

U.S. Credit Card
Prior to the adoption of new consolidation guidance, the U.S. credit card portfolio was reported on both a held and managed basis. Managed basis assumed that securitized loans were not sold into credit card securitizations and presented credit quality information as if the loans had not been sold. Under the new consolidation guidance effective January 1, 2010, we consolidated the credit card securitization trusts and the new held basis is comparable to the previously reported managed basis. For more information on the adoption of the new consolidation guidance, seeNote 8 – Securitizations and Other Variable Interest Entitiesto the Consolidated Financial Statements.
The table below presents certain U.S. credit card key credit statistics on a held basis for 2010 and managed basis for December 31, 2009.
Table 29 U.S. Credit Card – DomesticKey Credit Statistics

             
  December 31
  January 1
  December 31
 
(Dollars in millions) 2010(1)  2010(1)  2009 
Outstandings $113,785  $129,642  $49,453 
Accruing past due 30 days or more  5,913   9,866   3,907 
Accruing past due 90 days or more  3,320   5,408   2,158 
             
         
  2010  2009 
Net charge-offs
        
Amount $13,027  $6,547 
Ratios  11.04%  12.50%
Supplemental managed basis data
        
Amount  n/a  $16,962 
Ratios  n/a   12.07%
         
(1)Balances reflect the impact of new consolidation guidance.
n/a = not applicable
The consumer domesticU.S. credit card portfolio is managed inGlobal Card Services. Outstandings in the held domesticU.S. credit card loan portfolio decreased $14.7increased $64.3 billion at December 31, 2009 compared to December 31, 20082009 due to the adoption of the new consolidation guidance. Compared to 2009, net charge-offs increased $6.5 billion to $13.0 billion also due to the adoption of the new consolidation guidance. U.S. credit card loans 30 days or more past due and still accruing interest increased $2.0 billion while loans 90 days or more past due and still accruing interest increased $1.2 billion compared to December 31, 2009 due to the adoption of new consolidation guidance.
Compared to December 31, 2009 on a managed basis, outstandings decreased $15.9 billion primarily as a result of charge-offs and lower origination volume. Net losses decreased $3.9 billion due to lower originationslevels of delinquencies and transactional volume,bankruptcies as a result of improvement in the conversionU.S. economy compared to 2009 on a managed basis. The net charge-off ratio was 11.04 percent of certaintotal average U.S. credit card loans into held-to-maturity debt securities and charge-offs partially offset by lower payment rates and new

draws on previously securitized accounts. For more information on this conversion, seeNote 8 – Securitizationsin 2010 compared to the Consolidated Financial Statements. Net charge-offs increased $2.4 billion12.07 percent in 2009 to $6.5 billion reflecting the weak economy including elevated unemployment underemployment and higher bankruptcies. However, held domesticon a managed basis. U.S. credit card loans 30 days or more past due and still accruing interest decreased $668 million from December 31, 2008 driven by improvement in the last three quarters of 2009. Due to the decline in outstandings, the percentage of balances 30 days or more past due$4.0 billion and still accruing interest increased to 7.90 percent from 7.13 percent at December 31, 2008.

Managed domestic credit card outstandings decreased $24.5 billion to $129.6 billion at December 31, 2009 compared to December 31, 2008 due to lower originations and transactional volume and credit losses partially offset by lower payment rates. The $6.9 billion increase in managed net losses to $17.0 billion was driven by the same factors as described in the held discussion above. Managed loans that were 3090 days or more past due and still accruing interest decreased $856 million to $9.9$2.1 billion compared to $10.7December 31, 2009 on a managed basis. These declines were due to improvement in the U.S. economy including stabilization in the levels of unemployment.


Bank of America 2010     79


The table below presents certain state concentrations for the U.S. credit card portfolio on a held basis for 2010 and managed basis for December 31, 2009.
Table 30 U.S. Credit Card State Concentrations
                         
  December 31  Year Ended December 31 
  Outstandings  Accruing Past Due 90 Days or More  Net Charge-offs 
(Dollars in millions) 2010  2009  2010  2009  2010  2009 
California $17,028  $20,048  $612  $1,097  $2,752  $3,558 
Florida  9,121   10,858   376   676   1,611   2,178 
Texas  7,581   8,653   207   345   784   960 
New York  6,862   7,839   192   295   694   855 
New Jersey  4,579   5,168   132   189   452   559 
Other U.S.   68,614   77,076   1,801   2,806   6,734   8,852 
                         
Total U.S. credit card portfolio
 $113,785  $129,642  $3,320  $5,408  $13,027  $16,962 
                         

Unused lines of credit for U.S. credit card totaled $399.7 billion at December 31, 2008. Similar2010 compared to the held discussion above, the percentage of balances 30 days or more past due and still accruing interest increased to 7.61 percent from 6.96 percent at December 31, 2008 due to the decline in outstandings.

Managed consumer credit card unused lines of credit for domestic credit card totaled $438.5 billion at December 31, 2009 compared to $713.0 billion at December 31, 2008.on a managed basis. The $274.5$38.8 billion decrease was driven primarily by a combination of account management initiatives on higher risk customers in higher risk statesor inactive accounts and inactive accounts.

tighter underwriting standards for new originations.

Non-U.S. Credit Card
Prior to the adoption of new consolidation guidance, thenon-U.S. credit card portfolio was reported on both a held and managed basis. Under the new consolidation guidance effective January 1, 2010, we consolidated the credit card securitization trusts and the new held basis is comparable to the previously reported managed basis. For more information on the adoption of the new consolidation guidance, seeNote 8 – Securitizations and Other Variable Interest Entitiesto the Consolidated Financial Statements.
The table below presents asset quality indicators by certain state concentrationsnon-U.S. credit card key credit statistics on a held basis for the2010 and managed credit card – domestic portfolio.

basis for December 31, 2009.

Table 24  31 Non-U.S.Credit Card – Domestic State Concentrations – Managed BasisKey Credit Statistics

  December 31      Year Ended December 31
  Outstandings      

Accruing Past Due 90

Days or More

      Net Losses
(Dollars in millions) 2009    2008       2009    2008       2009    2008

California

 $20,048    $24,191     $1,097    $997     $3,558    $1,916

Florida

  10,858     13,210      676     642      2,178     1,223

Texas

  8,653     10,262      345     293      960     634

New York

  7,839     9,368      295     263      855     531

New Jersey

  5,168     6,113      189     172      559     316

Other U.S.

  77,076     91,007       2,806     2,666       8,852     5,434

Total credit card – domestic loan portfolio

 $129,642    $154,151      $5,408    $5,033      $16,962    $10,054

Credit Card – Foreign

             
  December 31
  January 1
  December 31
 
(Dollars in millions) 2010(1)  2010(1)  2009 
Outstandings $27,465  $31,182  $21,656 
Accruing past due 30 days or more  1,354   1,744   1,104 
Accruing past due 90 days or more  599   814   515 


     2010  2009 
Net charge-offs
            
Amount     $2,207  $1,239 
Ratio      7.88%  6.30%
Supplemental managed basis data
            
Amount      n/a  $2,223 
Ratio      n/a   7.43%
             
(1)Balances reflect the impact of new consolidation guidance.
n/a = not applicable
The consumer foreignnon-U.S. credit card portfolio is managed inGlobal Card Services. Outstandings in the held foreignnon-U.S. credit card loan portfolio increased $4.5$5.8 billion compared to December 31, 2009 due to the adoption of the new consolidation guidance. Additionally, net charge-off levels and ratios for 2010, when compared to 2009, were impacted by the adoption of the new consolidation guidance. Net charge-offs increased $1.0 billion to $21.7$2.2 billion in 2010.
Outstandings declined $3.7 billion compared to December 31, 2009 on a managed basis primarily due to charge-offs, lower origination volume and the strengthening of the U.S. dollar against certain foreign currencies. Net losses

were substantially flat for 2010, decreasing $16 million from managed losses in 2009. The net loss ratio increased to 7.88 percent of total averagenon-U.S. credit card compared to 7.43 percent in 2009, due to the decrease in outstandings.
Unused lines of credit fornon-U.S. credit card totaled $60.3 billion at December 31, 2010 compared to $69.6 billion at December 31, 2009 compared to December 31, 2008 primarily due toon a managed basis. The $9.3 billion decrease was driven by the combination of account management initiatives on inactive accounts, tighter underwriting standards for new originations and the strengthening of the U.S. dollar against certain foreign currencies, particularly the British pound againstPound and the U.S. dollar. Net charge-offs for the held foreign portfolio increased $688 million to $1.2 billion in 2009, or 6.30 percent of total average held credit card – foreign loans compared to 3.34 percent in 2008. The increase was driven primarily by weak economic conditions and higher unemployment also being experienced in Europe and Canada, including a higher level of bankruptcies/insolvencies.

Managed foreign credit card outstandings increased $3.1 billion to $31.2 billion at December 31, 2009 compared to December 31, 2008 primarily due to the strengthening of certain foreign currencies, partic - -

Euro.

ularly the British pound against the U.S. dollar. Managed consumer foreign loans that were accruing past due 90 days or more increased to $799 million, or 2.56 percent, compared to $717 million, or 2.55 percent, at December 31, 2008. The dollar increase was primarily due to the strengthening of foreign currencies, especially the British pound against the U.S. dollar, further exacerbated by continuing weakness in the European and Canadian economies. Net losses for the managed foreign portfolio increased $895 million to $2.2 billion for 2009, or 7.43 percent of total average managed credit card – foreign loans compared to 4.17 percent in 2008. The increase in managed net losses was driven by the same factors as described in the held discussion above.

Managed consumer credit card unused lines of credit for foreign credit card totaled $69.0 billion at December 31, 2009 compared to $80.6 billion at December 31, 2008. The $11.6 billion decrease was driven primarily by account management initiatives mainly on inactive accounts.


Bank of America 200961


Direct/Indirect Consumer

At December 31, 2009,2010, approximately 4548 percent of the direct/indirect portfolio was included inGlobal Commercial Banking (dealer(dealer financial services – automotive, marine and recreational vehicle loans), 2229 percent was included inGWIM(principally other non-real estate-secured, unsecured personal loans and securities-based lending margin loans), 15 percent was included inGlobal Card Services (consumer(consumer personal loans and other non-real estate secured), 24 percent inGWIM(principally other non-real estate secured and unsecured personal loans and securities-based lending marginestate-secured loans) and the remainder was inDepositsAll Other (student(student loans).

Outstanding loans and leases increased $13.8decreased $6.9 billion to $97.2$90.3 billion at December 31, 20092010 compared to December 31, 2008 primarily due to the acquisition of Merrill Lynch which included both domestic and foreign securities-based lending margin loans, partially offset by2009 as lower outstandings in theGlobal Card Services consumer lending portfolio. Net charge-offs increased $2.3 billion to $5.5 billion for 2009, or 5.46 per - -

cent of total average direct/indirect loans compared to 3.77 percent for 2008. The dollar increase was concentrated in theGlobal Card Servicesunsecured consumer lending portfolio drivenand the sale of a portion of the student loan portfolio were partially offset by the effectsadoption of a weak economy including higher bankruptcies. Net charge-off ratiosnew consolidation guidance, growth in securities-based lending and the consumer lending portfolio have also been impacted by a significant slowdown in new loan production due, in part, to a tighteningpurchase of underwriting criteria. Net charge-off ratios in the consumer lending portfolio were 17.75 percent during 2009, compared to 7.98 percent during 2008. The weak economy resulted in higher charge-offs inauto receivables within the dealer financial services portfolio. LoansDirect/indirect loans that were past due 30 days or more and still accruing interest declined $1.1 billion compared to December 31, 20082009, to $2.6 billion due to a combination of reduced outstandings and improvement in the unsecured consumer lending portfolio. Net charge-offs decreased $2.1 billion to $3.3 billion in 2010, or 3.45 percent of total average direct/indirect loans compared to 5.46 percent in 2009. This decrease was primarily driven by reduced outstandings from changes in underwriting criteria and lower levels of delinquencies and bankruptcies in the unsecured consumer lending portfolio.portfolio as a result of improvement in the U.S. economy including stabilization in the levels of unemployment. An additional driver was lower net charge-offs in the dealer financial services portfolio due to the impact of higher credit quality originations and higher resale values. Net charge-offs for the unsecured consumer lending portfolio decreased $1.6 billion to $2.7 billion and the net charge-off ratio decreased to 16.74 percent in 2010 compared to 17.75 percent in 2009. Net charge-offs for the dealer financial services portfolio decreased $404 million to $487 million and the loss rate decreased to 1.08 percent in 2010 compared to 2.16 percent in 2009.


80     Bank of America 2010


The table below presents asset quality indicators by certain state concentrations for the direct/indirect consumer loan portfolio.


Table 25  32Direct/Indirect State Concentrations

  December 31      Year Ended December 31
  Outstandings      

Accruing Past Due

90 Days or More

      Net Charge-offs
(Dollars in millions) 2009    2008       2009    2008       2009    2008

California

 $11,664    $10,555     $228    $247     $1,055    $601

Texas

  8,743     7,738      105     88      382     222

Florida

  7,559     7,376      130     145      597     334

New York

  5,111     4,938      73     69      272     162

Georgia

  3,165     3,212      52     48      205     115

Other U.S./Foreign

  60,994     49,617       900     773       2,952     1,680

Total direct/indirect loans

 $97,236    $83,436      $1,488    $1,370      $5,463    $3,114
                         
  December 31  Year Ended December 31 
  Outstandings  Accruing Past Due 90 Days or More  Net Charge-offs 
(Dollars in millions) 2010  2009  2010  2009  2010  2009 
California $10,558  $11,664  $132  $228  $591  $1,055 
Texas  7,885   8,743   78   105   262   382 
Florida  6,725   7,559   80   130   343   597 
New York  4,770   5,111   56   73   183   272 
Georgia  2,814   3,165   44   52   126   205 
OtherU.S./Non-U.S. 
  57,556   60,994   668   900   1,831   2,952 
                         
Total direct/indirect loans
 $90,308  $97,236  $1,058  $1,488  $3,336  $5,463 
                         

Other Consumer

At December 31, 2009,2010, approximately 7369 percent of the $2.8 billion other consumer portfolio was associated with portfolios from certain consumer finance businesses that we have previously exited and areis included inAll Other. The remainder consisted of the foreignnon-U.S. consumer loan portfolio, of which the vast majority we previously exited and is mostly includedlargely inGlobal Card Servicesand deposit overdrafts which are recorded inDepositsDeposits..

Nonperforming Consumer Loans and Foreclosed Properties Activity

Table 2633 presents nonperforming consumer loans and foreclosed properties activity during 20092010 and 2008.2009. Nonperforming loans held for saleLHFS are excluded from nonperforming loans as they are recorded at either fair value or the lower of cost or fair value. Nonperforming loans do not include past due consumer credit card loans and in general, past due consumer loans not secured by personal property or unsecured consumer loans that are past duereal estate as these loans are generally charged off no later than the end of the month in which the accountloan becomes 180 days past due. Real estate-secured past due consumer loans repurchased pursuant to our servicing agreements with GNMAinsured by the FHA are not reported as nonperforming as repayments areprincipal repayment is insured by the FHA. Additionally, nonperforming loans do not include the Countrywide purchased impairedPCI loan portfolio. For further information regarding nonperforming loans, seeNote 1 – Summary of Significant Accounting Principlesto the Consolidated Financial Statements. Total net additions to nonperformingNonperforming loans in 2009 were $11.0remained relatively flat at $20.9 billion at December 31, 2010 compared to $6.4$20.8 billion in 2008. The net additions to nonperforming loans in 2009 were driven primarily by the residential mortgage and home equity portfolios reflecting weak housing markets and economy, seasoning of vintages originated in periods of higher growth and performing loans that were accelerated into nonperforming loan status upon modification into a TDR. Nonperforming consumer real estate related TDRs as a percentage of total nonperforming consumer loans and foreclosed properties were 21 percent at

December 31, 2009 comparedas delinquency inflows to five percent at December 31, 2008nonaccrual loans slowed driven by favorable portfolio trends due primarilyin part to increased modification volume during the year.

improving U.S. economy. These inflows were offset by charge-offs, nonperforming loans returning to performing status, and paydowns and payoffs.

The outstanding balance of a real estate securedestate-secured loan that is in excess of the estimated property value, lessafter reducing the property value for costs to sell, is charged off no later than the end of the month in which the account becomes 180 days past due unless repayment of the loan is insured by the FHA. Property values are refreshed at least quarterly with additional charge-offs taken as needed. At December 31, 2009, $10.72010, $15.1 billion, or approximately 6069 percent, of the nonperforming residential mortgageconsumer real estate loans and foreclosed properties comprised of $9.6 billion of nonperforming loans and $1.1 billion of foreclosed properties, were greater than 180 days past due and had been written down to their fair valuesvalues. This was comprised of $13.9 billion of nonperforming loans 180 days or more past due and $790$1.2 billion of foreclosed properties.
Foreclosed properties decreased $179 million or approximately 20 percent,in 2010. PCI loans are excluded from nonperforming loans as these loans were written down to fair value at the acquisition date. However, once the underlying real estate is acquired by the Corporation upon foreclosure of the delinquent PCI loan, it is included in foreclosed properties. Net changes to foreclosed properties related to PCI loans were an increase of $100 million in 2010. Not included in foreclosed properties at December 31, 2010 was $1.4 billion of real estate that was acquired by the Corporation upon foreclosure of delinquent FHA insured loans. We hold this real estate on our balance sheet until we convey

these properties to the FHA. We exclude these amounts from our nonperforming home equity loans and foreclosed properties comprised of $721 million of nonperforming loans and $69 million of foreclosed properties, were greater than 180 days past due and had been written down to their fair values.

In 2009, approximately 16 percent and six percent ofactivity as we will be reimbursed once the net increase in nonperforming loans were from Countrywide purchased non-impaired loans and Merrill Lynch loans that deteriorated subsequent to acquisition. While we witnessed increased levels of nonperforming loans transferred to foreclosed properties dueproperty is conveyed to the lifting of variousFHA for principal and up to certain limits, costs incurred during the foreclosure moratoriumsprocess and interest incurred during 2009, the net reductions to foreclosed properties of $78 million were driven by sales of foreclosed properties and write-downs.

holding period.

Restructured Loans

As discussed above, nonperforming

Nonperforming loans also include certain loans that have been modified in TDRs where economic concessions have been granted to borrowers who have experienced or are expected to experienceexperiencing financial difficulties. These concessions typically result from the Corporation’s loss mitigation activities and could include reductions in the interest rate, payment extensions, forgiveness of principal, forbearance or other actions. Certain TDRs are classified as nonperforming at the time of


62Bank of America 2009


restructure restructuring and may only be returned to performing status after considering the borrower’s sustained repayment performance under revised payment terms for a reasonable period, generally six months. Nonperforming TDRs, excluding those modified loans modified in the purchased impairedCountrywide PCI loan portfolio, are included in Table 26.

The pace of modifications slowed during the second half of 2009 due to the MHA and other programs where the loan goes through a trial period prior to formal modification. For more information on our modification programs, see Regulatory Initiatives beginning on page 43.

At33.

Residential mortgage TDRs totaled $11.8 billion at December 31, 2009, residential mortgage TDRs were $5.3 billion,2010, an increase of $4.7$4.6 billion compared to December 31, 2008. Nonperforming TDRs increased $2.72009. Of these loans, $3.3 billion during 2009 to $2.9 billion. Nonperforming residential mortgage TDRs comprised approximately 17 percentwere nonperforming representing an increase of $130 million in 2010, and three percent of total residential mortgage nonperforming loans and foreclosed properties at December 31, 2009 and 2008. Residential mortgage TDRs that$8.5 billion were performing representing an increase of $4.5 billion in accordance with their modified terms2010 driven by TDRs returning to performing status and new additions. These performing TDRs are excluded from nonperforming loans in Table 26 were33. Residential mortgage TDRs deemed collateral dependent totaled $3.2 billion at December 31, 2010 and included $921 million of loans classified as nonperforming and $2.3 billion an increaseclassified as performing. At December 31, 2010, performing residential mortgage TDRs included $2.5 billion that were FHA insured.
Home equity TDRs totaled $1.7 billion at December 31, 2010, a decrease of $2.0 billion$673 million compared to December 31, 2008.

At December 31, 2009, home equity2009. Of these loans, $541 million were nonperforming representing a decrease of $1.2 billion in 2010 driven primarily by nonperforming TDRs were $2.3 billion, an increasereturning to performing status and charge-offs taken to comply with regulatory guidance clarifying the timing of $2.0 billion compared to December 31, 2008. Nonperforming TDRs increased $1.4 billion during 2009 to $1.7 billion. Nonperforming home equity TDRs comprised 44 percent and 11 percent of total home

equity nonperforming loans and foreclosed properties at December 31, 2009 and 2008.charge-offs on collateral dependent modified loans. Home equity TDRs that were performing in accordance with their modified terms andwere $1.2 billion representing an increase of $514 million in 2010. These performing TDRs are excluded from nonperforming loans in Table 26 were $639 million compared to $133. Home equity TDRs deemed collateral dependent totaled $796 million at December 31, 2008.

2010 and included $245 million of loans classified as nonperforming and $551 million classified as performing.

Discontinued real estate TDRs totaled $78$395 million at December 31, 2009. This was2010, an increase of $7$13 million from December 31, 2008.in 2010. Of these loans, $43$206 million were nonperforming while the remaining $35$189 million were classified as


Bank of America 2010     81


performing at December 31, 2009.

2010. Discontinued real estate TDRs deemed collateral dependent totaled $213 million at December 31, 2010 and included $97 million of loans classified as nonperforming and $116 million classified as performing.

We also work with customers that are experiencing financial difficulty by renegotiating consumer credit card, and consumer lending and small business loans (the renegotiated TDR portfolio), while ensuring that we remain withincomplying with Federal Financial Institutions Examination Council (FFIEC) guidelines. TheseSubstantially all renegotiated loansportfolio modifications are considered to be TDRs. The renegotiated TDR portfolio may include modifications, both short- and long-term, of interest rates or payment amounts or a combination of interest rates and payment amounts. We make modifications primarily through internal renegotiation programs utilizing direct customer contact, but may also utilize external renegotiation programs. The renegotiated TDR portfolio is excluded from Table 2633 as we do not generally classify consumer non-real estate unsecured loans as nonperforming. At December 31, 2010, our renegotiated TDR portfolio was $12.1 billion of which $9.2 billion was current or less than 30 days past due under the modified terms, compared to an $8.1 billion portfolio, on a held basis at December 31, 2009, of which $5.9 billion was current or less than 30 days past due under the modified terms. At December 31, 2009, our renegotiated

TDR portfolio, on a managed basis, was $15.8 billion of which $11.5 billion was current or less than 30 days past due under the modified terms. For furthermore information regarding these restructured andon the renegotiated loans,TDR portfolio, seeNote 6 – Outstanding Loans and Leasesto the Consolidated Financial Statements.

Certain

As a result of new accounting guidance on PCI loans, beginning January 1, 2010, modifications of loans in the purchased impairedPCI loan portfolio do not result in removal of the loan from the purchased impairedPCI loan pool. TDRs in the consumer real estate portfolio poolthat were removed from the PCI loan portfolio prior to the adoption of new accounting guidance were $2.1 billion and subsequent classification as a TDR.$2.3 billion at December 31, 2010 and 2009, of which $426 million and $395 million were nonperforming. These modifiednonperforming loans are excluded from Table 26. For more informationthe table below.
Nonperforming consumer real estate TDRs, included in the table below, as a percentage of total nonperforming consumer loans and foreclosed properties, declined to 16 percent at December 31, 2010 from 21 percent at December 31, 2009. This was due to nonperforming TDRs returning to performing status and charge-offs, including those charged off to comply with regulatory guidance clarifying the timing of charge-offs on TDRs, renegotiated andcollateral dependent modified loans, refer toNote 6 – Outstanding Loans and Leases to the Consolidated Financial Statements.

both of which outpaced new additions of nonperforming TDRs.


Table 26  33Nonperforming Consumer Loans and Foreclosed Properties Activity(1)

(Dollars in millions) 2009   2008 

Nonperforming loans


Balance, January 1

 $9,888    $3,442  

Additions to nonperforming loans:


New nonaccrual loans and leases(2)

  28,011     13,421  

Reductions in nonperforming loans:


Paydowns and payoffs

  (1,459   (527

Returns to performing status(3)

  (4,540   (1,844

Charge-offs(4)

  (9,442   (3,729

Transfers to foreclosed properties

  (1,618   (875

Transfers to loans held-for-sale

  (1     

Total net additions to nonperforming loans

  10,951     6,446  

Total nonperforming loans, December 31(5)

  20,839     9,888  

Foreclosed properties


Balance, January 1

  1,506     276  

Additions to foreclosed properties:


New foreclosed properties(6, 7)

  1,976     2,530  

Reductions in foreclosed properties:


Sales

  (1,687   (1,077

Write-downs

  (367   (223

Total net additions (reductions) to foreclosed properties

  (78   1,230  

Total foreclosed properties, December 31

  1,428     1,506  

Nonperforming consumer loans and foreclosed properties, December 31

 $22,267    $11,394  

Nonperforming consumer loans as a percentage of outstanding consumer loans and leases

  3.61   1.68

Nonperforming consumer loans and foreclosed properties as a percentage of outstanding consumer loans and foreclosed properties

  3.85     1.93  
         
(Dollars in millions) 2010  2009 
Nonperforming loans
        
Balance, January 1
 $20,839  $9,888 
         
Additions to nonperforming loans:        
Consolidation of VIEs  448   n/a 
New nonaccrual loans (2)
  21,136   29,271 
Reductions in nonperforming loans:        
Paydowns and payoffs  (2,809)  (1,459)
Returns to performing status (3)
  (7,647)  (4,540)
Charge-offs (4)
  (9,772)  (10,702)
Transfers to foreclosed properties  (1,341)  (1,619)
         
Total net additions to nonperforming loans  15   10,951 
         
Total nonperforming loans, December 31 (5)
  20,854   20,839 
         
Foreclosed properties
        
Balance, January 1
  1,428   1,506 
         
Additions to foreclosed properties:        
New foreclosed properties(6, 7)
  2,337   1,976 
Reductions in foreclosed properties:        
Sales  (2,327)  (1,687)
Write-downs  (189)  (367)
         
Total net reductions to foreclosed properties  (179)  (78)
         
Total foreclosed properties, December 31
  1,249   1,428 
         
Nonperforming consumer loans and foreclosed properties, December 31
 $22,103  $22,267 
         
Nonperforming consumer loans as a percentage of outstanding consumer loans  3.24%  3.61%
Nonperforming consumer loans and foreclosed properties as a percentage of outstanding consumer loans and        
foreclosed properties  3.43   3.85 
         
(1)

Balances do not include nonperforming LHFS of $2.9$1.0 billion and $3.2$1.6 billion in 2009at December 31, 2010 and 2008.

2009. For more information on our definition of nonperforming loans, see the discussion beginning on page 81.
(2)

2009 includes $465 million of nonperforming loans acquired from Merrill Lynch.

(3)

Consumer loans may be restoredreturned to performing status when all principal and interest is current and full repayment of the remaining contractual principal and interest is expected, or when the loan otherwise becomes well-secured and is in the process of collection. Certain TDRs are classified as nonperforming at the time of restructure and may only be returned to performing status after considering the borrower’s sustained repayment performance for a reasonable period, generally six months.

(4)

Our policy is not to classify consumer credit card and consumer loans not secured by real estate as nonperforming; therefore, the charge-offs on these loans have no impact on nonperforming activity.

activity and accordingly are excluded from this table.
(5)

Approximately half

At December 31, 2010, 67 percent of the 2009 and 2008 nonperforming loans are greater than 180 days or more past due and have been charged offwritten down through charge-offs to approximately 68 percent and 7169 percent of original cost.

the unpaid principal balance.
(6)

Our policy is to record any losses in the value of foreclosed properties as a reduction in the allowance for creditloan and lease losses during the first 90 days after transfer of a loan into foreclosed properties. Thereafter, all gains and losses in value are recorded asin noninterest expense. New foreclosed properties in the table above are net of $818$575 million and $436$818 million of charge-offs induring 2010 and 2009, and 2008 taken during the first 90 days after transfer.

(7)

2009 includes $21 million of foreclosed properties acquired from Merrill Lynch. 2008 includes $952 million of foreclosed properties acquired from Countrywide.

Bank of America 200963
n/a = not applicable
82     Bank of America 2010


Commercial Portfolio Credit Risk Management

Credit risk management for the commercial portfolio begins with an assessment of the credit risk profile of the borrower or counterparty based on an analysis of its financial position. As part of the overall credit risk assessment, our commercial credit exposures are assigned a risk rating and are subject to approval based on defined credit approval standards. Subsequent to loan origination, risk ratings are monitored on an ongoing basis, and if necessary, adjusted to reflect changes in the financial condition, cash flow, risk profile, or outlook of a borrower or counterparty. In making credit decisions, we consider risk rating, collateral, country, industry and single name concentration limits while also balancing the total borrower or counterparty relationship. Our lines of business and risk management personnel use a variety of tools to continuously monitor the ability of a borrower or counterparty to perform under its obligations. We use risk rating aggregations to measure and evaluate concentrations within portfolios. In addition, risk ratings are a factor in determining the level of assigned economic capital and the allowance for credit losses.

For information on our accounting policies regarding delinquencies, nonperforming status and net charge-offs for the commercial portfolio, seerefer toNote 1 – Summary of Significant Accounting Principlesto the Consolidated Financial Statements.

Management of Commercial Credit Risk Concentrations

Commercial credit risk is evaluated and managed with athe goal that concentrations of credit exposure do not result in undesirable levels of risk. We review, measure and manage concentrations of credit exposure by industry, product, geography, customer relationship and customer relationship. Distribution of loans and leases by loan size is an additional measure of portfolio risk diversification.size. We also review, measure and manage commercial real estate loans by geographic location and property type. In addition, within our international portfolio, we evaluate borrowingsexposures by region and by country. Tables 31, 34, 38, 3942, 48 and 4049 summarize our concentrations. Additionally, weWe also utilize syndication of exposure to third parties, loan sales, hedging and other risk mitigation techniques to manage the size and risk profile of the loancommercial credit portfolio.

As part of our ongoing risk mitigation initiatives, we attempt to work with clients to modify their loans to terms that better align with their current ability to pay. In situations where an economic concession has been granted to a borrower experiencing financial difficulty, we identify these loans as TDRs.

We account for certain large corporate loans and loan commitments, (includingincluding issued but unfunded letters of credit which are considered utilized for credit risk management purposes)purposes, that exceed our single name credit risk concentration guidelines under the fair value option. Lending commitments,

both funded and unfunded, are actively managed and

monitored, and as appropriate, credit risk for these lending relationships may be mitigated through the use of credit derivatives, with the Corporation’s credit view and market perspectives determining the size and timing of the hedging activity. In addition, we purchase credit protection is purchased to cover the funded portion as well as the unfunded portion of certain other credit exposures. To lessen the cost of obtaining our desired credit protection levels, credit exposure may be added within an industry, borrower or counterparty group by selling protection. These credit derivatives do not meet the requirements for treatment as accounting hedges. They are carried at fair value with changes in fair value recorded in other income.

income (loss).

Commercial Credit Portfolio

During 2009, continued housing value declines and economic stress impacted our commercial portfolios which experienced higher levels of losses. Broad-based economic pressures, including further reductions in spending by consumers and businesses, have also impacted commercial credit quality indicators. Loan

U.S.-based loan balances continued to decline in 2009on weak loan demand as businesses aggressively managed their working capital and production capacity by maintaining lowlean inventories, deferringstaff levels, physical locations and capital spending and rationalizing staff and physical locations.expenditures. Additionally, many borrowers increasingly accessedcontinued to access the capital markets for financing while reducing their use of bank credit facilities. Risk mitigation strategies and net charge-offs further contributed to the decline in loan balances.

Increases Fourth-quarter balances showed stabilization relative to prior quarters.Non-U.S. commercial loans showed strong growth from client demand, driven by regional economic conditions and the positive impact of our initiatives in Asia and other emerging markets.

Reservable criticized balances, net charge-offs and nonperforming loans, were largely driven by continued deteriorationleases and foreclosed property balances in the commercial real estate and commercial – domestic portfolios. Nonperforming loans and utilized reservable criticized exposures increased from 2008 levels; however, during the second half of 2009 the pace of increase slowed for nonperforming loans while reservable criticized exposurecredit portfolio declined in 2010. These reductions were driven primarily by the fourth quarter.

The loansU.S. commercial and leases net charge-off ratios increased across all commercial portfolios. The increase in commercial real estate net charge-offs during 2009 compared to 2008portfolios. U.S. commercial was driven by both the non-homebuilder and homebuilder portfolios, although homebuilder portfolio net charge-offs declined in the second half of 2009 compared to the first half of 2009. The increases in commercial – domestic and commercial – foreign net charge-offs were diversebroad-based improvements in terms of borrowers and industries.

The acquisition of Merrill Lynch increased our concentrations to certainclients, industries and countries. For more detail onlines of business. Commercial real estate also continued to show signs of stabilization during 2010; however, levels of stressed commercial real estate loans remained elevated. Most other credit indicators across the Merrill Lynch impact, see the Industry Concentrations discussion beginning on page 70 and the Foreign Portfolio discussion beginning on page 74. There wereremaining commercial portfolio have also increased concentrations within both investment and non-investment grade exposures including monolines, and certain leveraged finance and CMBS positions.

improved.

64Bank of America 2009


Table 2734 presents our commercial loans and leases, and related credit quality information at December 31, 20092010 and 2008. 2009.

Loans that were acquired from Merrill Lynch that were considered impairedpurchased credit-impaired were written down to fair value upon acquisition. In additionacquisition and amounted to being included in the “Outstandings” column below, these$204 million and $692 million at December 31, 2010 and 2009. These loans are also shown separately, net of purchase accounting adjustments, for increased transparency, inexcluded from the “Merrill Lynch Purchased Impaired Loan Portfolio” column. Nonperformingnonperforming loans and accruing balances 90 days or more past due do not include Merrill Lynch purchased impaired loans even though the customer may be contractually past due. The portion of the Merrill Lynch port - -

folio that was not impaired at acquisition was recorded at fair value in accordance with fair value accounting. This adjustment to fair value incorporates the interest rate, creditworthiness of the borrower and market liquidity compared to the contractual terms of the non-impaired loans at the date of acquisition. For more information, seeNote 2 – Merger and Restructuring Activity andNote 6 – Outstanding Loans and Leases to the Consolidated Financial Statements. The acquisition of Countrywide and related purchased impaired loan portfolio did not impact the commercial portfolios.


Table 27  34Commercial Loans and Leases

  December 31
  Outstandings      Nonperforming (1)    Accruing Past Due
90 Days or More(2)
      Merrill Lynch
Purchased
Impaired Loan
Portfolio
(Dollars in millions) 2009    2008       2009    2008     2009    2008       2009

Commercial loans and leases


Commercial – domestic(3)

 $181,377    $200,088     $4,925    $2,040   $213    $381     $100

Commercial real estate(4)

  69,447     64,701      7,286     3,906    80     52      305

Commercial lease financing

  22,199     22,400      115     56    32     23      

Commercial – foreign

  27,079     31,020       177     290     67     7       361
  300,102     318,209      12,503     6,292    392     463      766

Small business commercial – domestic(5)

  17,526     19,145       200     205     624     640       

Total commercial loans excluding loans measured at fair value

  317,628     337,354      12,703     6,497    1,016     1,103      766

Total measured at fair value(6)

  4,936     5,413       15          87            

Total commercial loans and leases

 $322,564    $342,767      $12,718    $6,497    $1,103    $1,103      $766
                             
        Accruing Past Due
 
  Outstandings  Nonperforming  90 Days or More 
  December 31
  January 1
  December 31
  December 31
  December 31
  December 31
  December 31
 
(Dollars in millions) 2010(1)  2010(1)  2009  2010  2009  2010  2009 
U.S. commercial (2)
 $175,586  $186,675  $181,377  $3,453  $4,925  $236  $213 
Commercial real estate (3)
  49,393   69,377   69,447   5,829   7,286   47   80 
Commercial lease financing  21,942   22,199   22,199   117   115   18   32 
Non-U.S. commercial
  32,029   27,079   27,079   233   177   6   67 
                             
   278,950   305,330   300,102   9,632   12,503   307   392 
U.S. small business commercial (4)
  14,719   17,526   17,526   204   200   325   624 
                             
Total commercial loans excluding loans measured at fair value  293,669   322,856   317,628   9,836   12,703   632   1,016 
Total measured at fair value (5)
  3,321   4,936   4,936   30   138      87 
                             
Total commercial loans and leases
 $296,990  $327,792  $322,564  $9,866  $12,841  $632  $1,103 
                             
(1)

Nonperforming commercial loans and leases as a percentage

Balance reflects impact of outstanding commercial loans and leases excluding loans measured at fair value were 4.00 percent (4.01 percent excluding the purchased impaired loan portfolio) and 1.93 percent at December 31, 2009 and 2008.

new consolidation guidance.
(2)(2)

Accruing

Excludes U.S. small business commercial loans and leases past due 90 days or more as a percentage of outstanding commercial loans and leases excluding loans measured at fair value were 0.32 percent and 0.33 percent at December 31, 2009 and 2008. The December 31, 2009 ratio remained unchanged excluding the purchased impaired loan portfolio.

loans.
(3)

Excludes small business commercial – domestic loans.

(4)

Includes domesticU.S. commercial real estate loans of $46.9 billion and $66.5 billion and $63.7 billion, and foreignnon-U.S. commercial real estate loans of $3.0$2.5 billion and $979 million$3.0 billion at December 31, 20092010 and 2008.2009.

(4)Includes card-related products.
(5)

Small business commercial – domestic including card related products.

(6)

Certain commercialCommercial loans are accounted for under the fair value option and include U.S. commercial – domestic loans of $3.0$1.6 billion and $3.5$3.0 billion,non-U.S. commercial – foreign loans of $1.9$1.7 billion and $1.7$1.9 billion and commercial real estate loans of $90$79 million and $203$90 million at December 31, 20092010 and 2008.2009. SeeNote 2023 – Fair Value MeasurementsOptionto the Consolidated Financial Statements for additional discussion ofinformation on the fair value for certain financial instruments.option.

Bank of America 2010     83


Nonperforming commercial loans and leases as a percentage of outstanding commercial loans and leases were 3.32 percent (3.35 percent excluding loans accounted for under the fair value option) and 3.98 percent (4.00 percent excluding loans accounted for under the fair value option) at December 31, 2010 and 2009. Accruing commercial loans and leases past due 90 days or more as a percentage of outstanding commercial loans and leases were 0.21 percent (0.22 percent excluding loans accounted for under

the fair value option) and 0.34 percent (0.32 percent excluding loans accounted for under the fair value option) at December 31, 2010 and 2009.
Table 2835 presents net charge-offs and related ratios for our commercial loans and leases for 20092010 and 2008. The reported net charge-off ratios for commercial – domestic, commercial2009. Commercial real estate net charge-offs for 2010 declined in the homebuilder portfolio and commercial – foreign were impacted by the additionin certain segments of the Merrill Lynch purchased

non-homebuilder portfolio.

impaired loan portfolio as the initial fair value adjustments recorded on those loans upon acquisition would have already included the estimated credit losses.


Table 28  35Commercial Net Charge-offs and Related Ratios

  Net Charge-offs           Net Charge-off Ratios (1, 2, 3)  
(Dollars in millions) 2009    2008       2009   2008 

Commercial loans and leases


Commercial – domestic(4)

 $2,190    $519     1.09  0.26

Commercial real estate

  2,702     887     3.69    1.41  

Commercial lease financing

  195     60     0.89    0.27  

Commercial – foreign

  537     173     1.76    0.55  
  5,624     1,639     1.72    0.52  

Small business commercial – domestic

  2,886     1,930     15.68    9.80  

Total commercial

 $8,510    $3,569      2.47    1.07  
                 
  Net Charge-offs  Net Charge-off Ratios(1) 
(Dollars in millions) 2010  2009  2010  2009 
U.S. commercial (2)
 $881  $2,190   0.50%  1.09%
Commercial real estate  2,017   2,702   3.37   3.69 
Commercial lease financing  57   195   0.27   0.89 
Non-U.S. commercial
  111   537   0.39   1.76 
                 
   3,066   5,624   1.07   1.72 
U.S. small business commercial  1,918   2,886   12.00   15.68 
                 
Total commercial
 $4,984  $8,510   1.64   2.47 
                 
(1)

Net charge-off ratios are calculated as net charge-offs divided by average outstanding loans and leases excluding loans accounted for under the fair value option.

(2)

Net charge-off ratios excluding the Merrill Lynch purchased impaired loan portfolio were 1.06 percent for commercial – domestic, 3.60 percent for commercial real estate, 1.49 percent for commercial – foreign, and 2.41 percent for the total commercial portfolio in 2009. These are the only product classifications impacted by the Merrill Lynch purchased impaired loan portfolio in 2009.

(3)

Although the Merrill Lynch purchased impaired portfolio was recorded at fair value at acquisition on January 1, 2009, actual credit losses have exceeded the initial purchase accounting estimates. Included above are net charge-offs related to the Merrill Lynch purchased impaired portfolio in 2009 of $55 million for commercial – domestic, $88 million for commercial real estate and $90 million for commercial – foreign.

(4)

Excludes U.S. small business commercial – domestic.

loans.

Bank of America 200965


Table 2936 presents commercial credit exposure by type for utilized, unfunded and total binding committed credit exposure. Commercial utilized credit exposure includes funded loans, standby letters of credit,SBLCs, financial guarantees, bankers’ acceptances and commercial letters of credit for which the bankCorporation is legally bound to advance funds under prescribed conditions, during a specified period. Although funds have not yet been advanced, these exposure types are considered utilized for credit risk management purposes. Total commercial committed credit exposure decreased by $10.1$68.1 billion, or oneeight percent, at December 31, 20092010 compared to December 31, 2008. The decrease was largely2009 driven primarily by reductions in loansboth funded and leases partially offset by an increase in derivatives due to the acquisition of Merrill Lynch.

unfunded loan and lease exposure.

Total commercial utilized credit exposure decreased to $494.4$45.1 billion, or nine percent, at December 31, 20092010 compared to $498.7 billion at December 31, 2009. Utilized

2008. Funded

loans and leases declined dueas businesses continued to limited demand for acquisition financing and capital expenditures in the large corporate and middle-market portfolios and as clients utilized the improved capital markets more extensively for their funding needs. With the economic outlook remaining uncertain, businesses are aggressively managingmanage working capital and production capacity, maintainingmaintain low inventories and deferringdefer capital spending.expenditures as the economic outlook remained uncertain. Clients also continued to access the capital markets for their funding needs to reduce reliance on bank credit facilities. The increasedecline in derivative assets was driven by the acquisition of Merrill Lynch substantially offset during 2009 by maturing transactions, mark-to-market adjustments from changing interest and foreign exchange rates, as well as narrower credit spreads.

Theutilized loans and leases fundedwas also due to the sale of First Republic effective July 1, 2010 and the transfer of certain exposures into LHFS partially offset by the increase in conduit balances related to the adoption of new consolidation guidance. The utilization rate for loans and leases, letters of credit and financial guarantees, and bankers’ acceptances was 57 percent at both December 31, 2009 compared to 58 percent at December 31, 2008.

2010 and 2009.


Table 29  36Commercial Credit Exposure by Type

  December 31
  Commercial Utilized(1, 2)      Commercial Unfunded (1, 3, 4)      

Total Commercial    

Committed (1)    

(Dollars in millions) 2009    2008       2009    2008       2009    2008

Loans and leases

 $322,564    $342,767     $293,519    $300,856     $616,083    $643,623

Derivative assets(5)

  80,689     62,252                 80,689     62,252

Standby letters of credit and financial guarantees

  70,238     72,840      6,008     4,740      76,246     77,580

Assets held-for-sale(6)

  13,473     14,206      781     183      14,254     14,389

Bankers’ acceptances

  3,658     3,382      16     13      3,674     3,395

Commercial letters of credit

  2,958     2,974      569     791      3,527     3,765

Foreclosed properties and other

  797     328                   797     328

Total commercial credit exposure

 $494,377    $498,749      $300,893    $306,583      $795,270    $805,332
                         
  December 31 
  Commercial Utilized (1)  Commercial Unfunded(2, 3)  Total Commercial Committed 
(Dollars in millions) 2010  2009  2010  2009  2010  2009 
Loans and leases $296,990  $322,564  $272,172  $298,048  $569,162  $620,612 
Derivative assets (4)
  73,000   87,622         73,000   87,622 
Standby letters of credit and financial guarantees  62,027   67,975   1,511   1,767   63,538   69,742 
Debt securities and other investments (5)
  10,216   11,754   4,546   1,508   14,762   13,262 
Loansheld-for-sale
  10,380   8,169   242   781   10,622   8,950 
Commercial letters of credit  3,372   2,958   1,179   569   4,551   3,527 
Bankers’ acceptances  3,706   3,658   23   16   3,729   3,674 
Foreclosed properties and other  731   797         731   797 
                         
Total commercial credit exposure
 $460,422  $505,497  $279,673  $302,689  $740,095  $808,186 
                         
(1)

At December 31, 2009, total commercial utilized, total commercial unfunded and total commercial committed exposure include $88.5 billion, $25.7 billion and $114.2 billion, respectively, related to Merrill Lynch.

(2)

Total commercial utilized exposure at December 31, 20092010 and 20082009 includes loans and issued letters of credit accounted for under the fair value option and is comprised ofincluding loans outstanding of $4.9$3.3 billion and $5.4$4.9 billion and letters of credit with a notional amountvalue of $1.7$1.4 billion and $1.4$1.7 billion.

(3)(2)

Total commercial unfunded exposure at December 31, 20092010 and 20082009 includes loan commitments accounted for under the fair value option with a notional amountvalue of $25.3$25.9 billion and $15.5$25.3 billion.

(4)(3)

Excludes unused business card lines which are not legally binding.

(5)(4)

Derivative assets are carried at fair value, reflect the effects of legally enforceable master netting agreements and have been reduced by cash collateral of $58.4$58.3 billion and $34.8$51.5 billion at December 31, 20092010 and 2008.2009. Not reflected in utilized and committed exposure is additional derivative collateral held of $16.2$17.7 billion and $13.4$16.2 billion which consists primarily of other marketable securities.
(5)Total commercial committed exposure consists of $14.2 billion and $9.8 billion of debt securities and $590 million and $3.5 billion of other investments at December 31, 20092010 and 2008.

2009.
(6)
84     Bank of America 2010


Total commercial committed assets held-for-sale exposure consists of $9.0 billion and $12.1 billion of commercial LHFS exposure (e.g., commercial mortgage and leveraged finance) and $5.3 billion and $2.3 billion of assets held-for-sale exposure at December 31, 2009 and 2008.

Table 3037 presents commercial utilized reservable criticized exposure by product type. Criticized exposure corresponds to the Special Mention, Substandard and Doubtful asset categories as defined by regulatory authorities. In addition to reservable loans and leases, excluding those accounted for under the fair value option, exposure includes SBLCs, financial guarantees, bankers’ acceptances and commercial letters of credit for which we are legally bound to advance funds under prescribed conditions, during a specified time period. Although funds have not been advanced, these exposure types are considered utilized for credit risk management purposes. Total commercial

utilized reservable criticized

exposure rose by $21.7decreased $16.1 billion primarilyat December 31, 2010 compared to December 31, 2009, due to increasesdecreases across all portfolios, primarily U.S. commercial and commercial real estate driven largely by continued paydowns, payoffs and, to a diminishing extent, charge-offs. Despite the improvements, utilized reservable criticized levels remain elevated in commercial real estate and commercial – domestic. Commercial real estate increased $10.0 billion primarily due to the non-homebuilder portfolio which has been impacted by the weak economy partially offset by a decrease in the homebuilder portfolio. The $9.3 billion increase in commercial – domestic reflects deterioration across various lines of business and industries, primarily inGlobal Banking.estate. At December 31, 2009,2010, approximately 8588 percent of the loans within commercial utilized reservable criticized reservable utilized exposure arewere secured.


Table 30  37Commercial Utilized Reservable Criticized Exposure

  December 31 
  2009     2008 
(Dollars in millions) Amount    Percent (1)      Amount    Percent (1) 

Commercial – domestic(2)

 $28,259    11.66   $18,963    7.20

Commercial real estate

  23,804    32.13      13,830    19.73  

Commercial lease financing

  2,229    10.04      1,352    6.03  

Commercial – foreign

  2,605    7.12      1,459    3.65  
  56,897    15.17      35,604    8.99  

Small business commercial – domestic

  1,789    10.18      1,333    6.94  

Total commercial utilized reservable criticized exposure

 $58,686    14.94      $36,937    8.90  
                 
  December 31 
  2010  2009 
(Dollars in millions) Amount  Percent(1)  Amount  Percent(1) 
U.S. commercial (2)
 $17,195   7.44% $28,259   11.77%
Commercial real estate  20,518   38.88   23,804   32.13 
Commercial lease financing  1,188   5.41   2,229   10.04 
Non-U.S. commercial
  2,043   5.01   2,605   7.12 
                 
   40,944   11.81   56,897   15.26 
U.S. small business commercial  1,677   11.37   1,789   10.18 
                 
Total commercial utilized reservable criticized exposure
 $42,621   11.80  $58,686   15.03 
                 
(1)

Percentages are calculated as commercial utilized reservable criticized exposure divided by total commercial utilized reservable exposure for each exposure category.

(2)

Excludes U.S. small business commercial – domestic exposure.

66Bank of America 2009


U.S. Commercial – Domestic (excluding Small Business)

At December 31, 2009, approximately 812010, 57 percent and 25 percent of the U.S. commercial – domestic loan portfolio, excluding small business, waswere included inGlobal Commercial Banking (business banking, middle-market and large multinational corporate loans and leases) andGlobal MarketsGBAM (acquisition, bridge financing and institutional investor services). The remaining 1918 percent was mostly included inGWIM (business-purpose(business-purpose loans for wealthy individuals)clients). Outstanding U.S. commercial – domestic loans, excluding loans accounted for under the fair value option, decreased driven$5.8 billion primarily bydue to reduced customer demand withinGlobal Banking,and continued client utilization of the capital markets, partially offset by the acquisitionadoption of Merrill Lynch. Nonperforming commercial – domesticnew consolidation guidance which increased loans increased $2.9by $5.3 billion comparedon January 1, 2010. Compared to December 31, 2008. Net charge-offs increased $1.7 billion in 2009, compared to 2008. The increases inreservable criticized balances and nonperforming loans and net charge-offsleases declined $11.1 billion and $1.5 billion. The declines were broad-based in terms of borrowers and industries. The acquisition of Merrill Lynch accounts for a portion of the increaseindustries and were driven by improved client credit profiles and liquidity. Net charge-offs decreased $1.3 billion in nonperforming loans and reservable criticized exposure.

2010 compared to 2009.

Commercial Real Estate

The commercial real estate portfolio is predominantly managed inGlobal Commercial Banking and consists of loans made primarily to public and private developers, homebuilders and commercial real estate firms. Outstanding loans and leases, excluding loans accounted for under the fair value option, increased $4.7decreased $20.1 billion at December 31, 20092010 compared

to December 31, 2008, primarily2009 due to the acquisition of Merrill Lynch partially offset by

portfolio attrition, the sale of First Republic, transfer of certain assets to LHFS and losses.net charge-offs. The portfolio remains diversified across property types and geographic regions. California and Florida representrepresents the two largest state concentrationsconcentration at 2118 percent and seven percent forof commercial real estate loans and leases at December 31, 2009.2010. For more information on geographic orand property concentrations, refer to Table 31.

For38.

Credit quality for commercial real estate is showing signs of stabilization; however, we expect that elevated unemployment and ongoing pressure on vacancy and rental rates will continue to affect primarily the year,non-homebuilder portfolio. Compared to December 31, 2009, nonperforming commercial real estate loans increased $3.4 billion and utilized reservable criticized exposure increased $10.0 billion from December 31, 2008 across most property types and was attributable toforeclosed properties decreased in the continuing impact of the housing slowdown, elevated unemployment and deteriorating vacancy and rental rates across most non-homebuilder property types and geographies during 2009. The increase in nonperforming loans was driven by thehomebuilder, retail office, multi-use, and land and land development portfolios. Theproperty types, partially offset by an increase in utilized reservableoffice and multi-use property types. Reservable criticized exposure was drivenbalances declined by the office, retail and multi-family rental property types, offset by a $1.9$3.3 billion decreaseprimarily due to stabilization in the homebuilder portfolio and retail and unsecured segments in the non-homebuilder portfolio, partially offset by continued deterioration in the multi-family rental and office property types within the non-homebuilder portfolio. For 2009, netNet charge-offs were up $1.8 billiondecreased $685 million in 2010 compared to 2008 driven by increases2009 due to declines in net charge-offs in both the non-homebuilder and the homebuilder portfolios.portfolio resulting from a slower rate of declining appraisal values.


Bank of America 2010     85


The following table below presents outstanding commercial real estate loans by geographic region and property type. Commercial real estate primarily includes commercial loans and leases secured by non owner-occupied real estate which are dependent on the sale or lease of the real estate as the primary source of repayment.

The decline in California is due primarily to the sale of First Republic.

Table 31  38Outstanding Commercial Real Estate Loans

  December 31
(Dollars in millions) 2009    2008

By Geographic Region(1)


California

 $14,273    $11,270

Northeast

  11,661     9,747

Southwest

  8,183     6,698

Southeast

  6,830     7,365

Midwest

  6,505     7,447

Florida

  4,568     5,146

Illinois

  4,375     5,451

Midsouth

  3,332     3,475

Northwest

  3,097     3,022

Geographically diversified(2)

  3,238     2,563

Non-U.S.

  2,994     979

Other(3)

  481     1,741

Total outstanding commercial real estate loans(4)

 $69,537    $64,904

By Property Type


Office

 $12,511    $10,388

Multi-family rental

  11,169     8,177

Shopping centers/retail

  9,519     9,293

Homebuilder(5)

  7,250     10,987

Hotels/motels

  6,946     2,513

Multi-use

  5,924     3,444

Industrial/warehouse

  5,852     6,070

Land and land development

  3,215     3,856

Other(6)

  7,151     10,176

Total outstanding commercial real estate loans(4)

 $69,537    $64,904
         
  December 31 
(Dollars in millions) 2010  2009 
By Geographic Region (1)
        
California $9,012  $14,554 
Northeast  7,639   12,089 
Southwest  6,169   8,641 
Southeast  5,806   7,019 
Midwest  5,301   6,662 
Florida  3,649   4,589 
Illinois  2,811   4,527 
Midsouth  2,627   3,459 
Northwest  2,243   3,097 
Non-U.S.   2,515   2,994 
Other (2)
  1,701   1,906 
         
Total outstanding commercial real estate loans (3)
 $49,473  $69,537 
         
By Property Type
        
Office $9,688  $12,511 
Multi-family rental  7,721   11,169 
Shopping centers/retail  7,484   9,519 
Industrial/warehouse  5,039   5,852 
Homebuilder (4)
  4,299   7,250 
Multi-use  4,266   5,924 
Hotels/motels  2,650   6,946 
Land and land development  2,376   3,215 
Other (5)
  5,950   7,151 
         
Total outstanding commercial real estate loans (3)
 $49,473  $69,537 
         
(1)

Distribution is based on geographic location of collateral.

(2)

The geographically diversified category is comprised primarily of

Includes unsecured outstandings to real estate investment trusts and national home builders whose portfolios of properties span multiple geographic regions.

(3)

Primarily includesregions and properties in the states of Colorado, Utah, Hawaii, Wyoming and Montana.

(4)(3)

Includes commercial real estate loans accounted for under the fair value option of $90$79 million and $203$90 million at December 31, 20092010 and 2008.

2009.
(5)(4)

Homebuilder includes condominiums and residential land.

(6)(5)

Represents loans to borrowers whose primary business is commercial real estate, but the exposure is not secured by the listed property types or is unsecured.

During 2009, deterioration within the commercial real estate portfolio shifted from2010, we continued to see stabilization in the homebuilder portfolio toportfolio. Certain portions of the non-homebuilder portfolio. Non-homebuilder credit quality indicators and appraised values weakened in 2009 due to deteriorating property fundamentals and increased loss severities, whereas homebuilder credit quality indicators, while remaining elevated, began to stabilize. The non-homebuilder portfolio remainsremain most

at risk at-risk as occupancy andrates, rental rates continued to deteriorate due to the current economic environment and restrained business hiring and capital investment.commercial property prices remain under pressure. We have adopted a number of proactive risk mitigation initiatives to reduce utilized and potential exposure in the commercial real estate portfolios.


Bank of America 200967
86     Bank of America 2010


The following table presentstables below present commercial real estate credit quality data by non-homebuilder and homebuilder property types. CommercialThe homebuilder portfolio includes condominiums and other residential real estate primarily includes commercial loans secured by non owner-occu - -

estate.

pied real estate which is dependent on the sale or lease of the real estate as the primary source of repayment.


Table 32  39Commercial Real Estate Credit Quality Data

  December 31      Year Ended December 31 
  Nonperforming Loans and
Foreclosed Properties (1)
      Utilized Reservable
Criticized Exposure(2)
      

Net Charge-offs

      Net Charge-off Ratios (3) 
(Dollars in millions)         2009            2008       2009    2008       2009    2008       2009   2008 

Commercial real estate – non-homebuilder


Office

 $729    $95     $3,822    $801     $249    $     2.01  

Multi-family rental

  546     232      2,496     822      217     13     1.96    0.18  

Shopping centers/retail

  1,157     204      3,469     1,442      239     10     2.30    0.11  

Hotels/motels

  160     9      1,140     67      5     4     0.08    0.09  

Industrial/warehouse

  442     91      1,757     464      82          1.34      

Multi-use

  416     17      1,578     409      146     24     2.58    0.38  

Land and land development

  968     455      1,657     1,281      286          8.00      

Other(4)

  417     88       2,210     973       140     22      1.72    0.42  

Total non-homebuilder

  4,835     1,191      18,129     6,259      1,364     73     2.13    0.15  

Commercial real estate – homebuilder(5)

  3,228     3,036       5,675     7,571       1,338     814      14.41    6.25  

Total commercial real estate

 $8,063    $4,227      $23,804    $13,830      $2,702    $887      3.69    1.41  
                 
     December 31 
  Nonperforming
    
  Loans and
       
  Foreclosed
  Utilized Reservable
 
  Properties (1)  Criticized Exposure(2) 
(Dollars in millions) 2010  2009  2010  2009 
Commercial real estate – non-homebuilder
                
Office $1,061  $729  $3,956  $3,822 
Multi-family rental  500   546   2,940   2,496 
Shopping centers/retail  1,000   1,157   2,837   3,469 
Industrial/warehouse  420   442   1,878   1,757 
Multi-use  483   416   1,316   1,578 
Hotels/motels  139   160   1,191   1,140 
Land and land development  820   968   1,420   1,657 
Other (3)
  168   417   1,604   2,210 
                 
Total non-homebuilder
  4,591   4,835   17,142   18,129 
Commercial real estate – homebuilder
  1,963   3,228   3,376   5,675 
                 
Total commercial real estate
 $6,554  $8,063  $20,518  $23,804 
                 
(1)

Includes commercial foreclosed properties of $777$725 million and $321$777 million at December 31, 20092010 and 2008.

2009.
(2)

Utilized reservable criticized exposure corresponds to the Special Mention, Substandard and Doubtful asset categories defined by regulatory authorities. This is defined asincludes loans, excluding those accounted for under the fair value option, SBLCs and bankers’ acceptances.

(3)

Net charge-off ratios are calculated as net charge-offs divided by average outstanding loans excluding loans accounted for under the fair value option during the year for each loan and lease category.

(4)

Represents loans to borrowers whose primary business is commercial real estate, but the exposure is not secured by the listed property types or is unsecured.

Table 40 Commercial Real Estate Net Charge-offs and Related Ratios
                 
  Net Charge-offs  Net Charge-off Ratios(1) 
(Dollars in millions) 2010  2009  2010  2009 
Commercial real estate – non-homebuilder
                
Office $273  $249   2.49%  2.01%
Multi-family rental  116   217   1.21   1.96 
Shopping centers/retail  318   239   3.56   2.30 
Industrial/warehouse  59   82   1.07   1.34 
Multi-use  143   146   2.92   2.58 
Hotels/motels  45   5   1.02   0.08 
Land and land development  377   286   13.04   8.00 
Other (2)
  220   140   3.14   1.72 
                 
Total non-homebuilder
  1,551   1,364   2.86   2.13 
Commercial real estate – homebuilder
  466   1,338   8.26   14.41 
                 
Total commercial real estate
 $2,017  $2,702   3.37   3.69 
                 
(5)(1)

Net charge-off ratios are calculated as net charge-offs divided by average outstanding loans excluding loans accounted for under the fair value option.
(2)Homebuilder includes condominiums and residential land.

Represents loans to borrowers whose primary business is commercial real estate, but the exposure is not secured by the listed property types or is unsecured.

At December 31, 2009,2010, we had total committed non-homebuilder exposure of $84.4$64.2 billion compared to $84.1$84.4 billion at December 31, 2008. The increase was2009, with the decrease due to the Merrill Lynch acquisition, largely offset bysale of First Republic, repayments and net charge-offs. Non-homebuilder nonperforming loans and foreclosed properties were $4.8$4.6 billion, or 7.7310.08 percent of total non-homebuilder loans and foreclosed properties at December 31, 20092010 compared to $1.2$4.8 billion, or 2.217.73 percent, at December 31, 2008, with the increase driven by deterioration in the shopping center/retail, office, and land and land development portfolios.

2009. Non-homebuilder utilized reservable criticized exposure increased $11.9decreased to $17.1 billion, or 35.55 percent, at December 31, 2010 compared to $18.1 billion, or 27.27 percent, of total non-homebuilder utilized reservable exposure at December 31, 2009 compared to $6.3 billion, or 10.66 percent, at December 31, 2008.2009. The increasedecrease in criticized exposure was driven primarily by office, shopping center/in the retail and multi-family rental property types which have beenunsecured segments, with the most adversely affected by high unemployment and the slowdown in consumer spending.

ratio increasing due to declining loan balances. For the non-homebuilder portfolio, net charge-offs increased $1.3 billion$187 million for 20092010 compared to 2008 with the increase2009. The changes were concentrated in non-homebuilder land and land development office, shopping center/retail and multi-family rental property types.

Within our total non-homebuilder exposure, at December 31, 2009, we had total committed non-homebuilder construction and land development exposure of $24.5 billion compared to $27.8 billion at December 31, 2008. Non-homebuilder construction and land development exposure is mostly secured and diversified across property types and geographies. Assets in the non-homebuilder construction and land development portfolio face significant challenges in the current rental market. Weak rental demand and cash flows and declining property valuations have resulted in increased levels of reservable criticized exposure and nonperforming loans and foreclosed properties. Nonperforming loans and foreclosed properties and utilized reservable criticized exposure for

retail.

the non-homebuilder construction and land development portfolio increased $2.0 billion and $6.1 billion from December 31, 2008 to $2.6 billion and $8.9 billion at December 31, 2009.

At December 31, 2009,2010, we had committed homebuilder exposure of $10.4$6.0 billion compared to $16.2$10.4 billion at December 31, 20082009 of which $7.3$4.3 billion and $11.0$7.3 billion were funded secured loans. The decline in homebuilder committed exposure was driven bydue to repayments, net charge-offs, reduced

reductions in new home construction and continued risk mitigation initiatives. HomebuilderAt December 31, 2010, homebuilder nonperforming loans and foreclosed properties stabilizeddeclined $1.3 billion due to therepayments, net charge-offs, fewer risk rating downgrades and a slowdown in the rate of home price declines.declines compared to December 31, 2009. Homebuilder utilized reservable criticized exposure decreased by $1.9$2.3 billion driven by higherto $3.4 billion due to repayments and net charge-offs. The nonperforming loans, leases and foreclosed properties and the utilized reservable criticized ratios for the homebuilder portfolio were 42.80 percent and 74.27 percent at December 31, 2010 compared to 42.16 percent and 74.44 percent at December 31, 2009 compared to 27.07 percent and 66.33 percent at December 31, 2008. Lower loan balances and exposures in 2009 drove a portion of the increase in the ratios.2009. Net charge-offs for the homebuilder portfolio increased $524decreased $872 million in 2010 compared to 2009.
At December 31, 2010 and 2009, the commercial real estate loan portfolio included $19.1 billion and $27.4 billion of funded construction and land development loans that were originated to fund the constructionand/or rehabilitation of commercial properties. This portfolio is mostly secured and diversified across property types and geographies but faces significant challenges in the current housing and rental markets. Weak rental


Bank of America 2010     87


demand and cash flows, along with declining property valuations have resulted in elevated levels of reservable criticized exposure, nonperforming loans and foreclosed properties, and net charge-offs. Reservable criticized construction and land development loans totaled $10.5 billion and $13.9 billion at December 31, 2010 and 2009. Nonperforming construction and land development loans and foreclosed properties totaled $4.0 billion and $5.2 billion at December 31, 2010 and 2009. During a property’s construction phase, interest income is typically paid from 2008.

interest reserves that are established at the inception of the loan. As construction is completed and the property is put into service, these interest reserves are depleted and interest begins to be paid from operating cash flows. Loans continue to be classified as construction loans until they are refinanced. We do not recognize interest income on nonperforming loans regardless of the existence of an interest reserve.

Non-U.S.Commercial – Foreign
Thenon-U.S. commercial

The commercial – foreign loan portfolio is managed primarily inGlobal BankingGBAM. Outstanding loans, excluding loans accounted for under the fair value option, showed growth from client demand driven by regional economic conditions and the positive impact of our initiatives in Asia and other emerging markets. Net charge-offs decreased $426 million in 2010 compared to 2009 due to repayments as borrowers accessed the capital markets to refinance bank debt and aggressively managed working capital and investment spending, partially offset by the acquisition of Merrill Lynch. Reduced merger and acquisition activity was also a factor contributing to modest new loan origination. Net charge-offs increased primarily due to deteriorationstabilization in the portfolio, particularly in financial services, consumer dependent and housing-related sectors.portfolio. For additional information on thenon-U.S. commercial – foreign portfolio, refer to the ForeignNon-U.S. Portfolio discussion beginning on page 74.

94.

68Bank of America 2009


U.S. Small Business Commercial – Domestic

The U.S. small business commercial – domestic loan portfolio is comprised of business card and small business loans primarily managed inGlobal Card ServicesandGlobal Commercial Banking. In 2009,U.S. small business commercial – domestic net charge-offs increased $956decreased $968 million from 2008. The portfolio deteriorationin 2010 compared to 2009. Although losses remain

elevated, the reduction in net charge-offs was primarily driven by lower levels of delinquencies and bankruptcies resulting from U.S. economic improvement as well as the impactsreduction of a weakened economy. Approximately 77 percenthigher risk vintages and the impact of higher quality originations. Of the U.S. small business commercial – domestic net charge-offs for 20092010, 79 percent were credit card relatedcard-related products compared to 7581 percent in 2008.

during 2009.

Commercial Loans Carried at Fair Value

The portfolio of commercial loans accounted for under the fair value option is managed primarily inGlobal MarketsGBAM. The $477 million decrease inOutstanding commercial loans accounted for under the fair value loan portfolio inoption decreased $1.6 billion to an aggregate fair value of $3.3 billion at December 31, 2010 compared to December 31, 2009 was drivendue primarily byto reduced corporate borrowings under bank credit facilities. We recorded net gainslosses of $515$89 million resulting from new originations, loans being paid off at par value and changes in the fair value of the loan portfolio during 20092010 compared to net lossesgains of $780$515 million for 2008.during 2009. These gains and lossesamounts were primarily attributable to changes in instrument-specific credit risk and were predominantlylargely offset by net gains or net losses from hedging activities.

In addition, unfunded lending commitments and letters of credit had an aggregate fair value of $950$866 million and $1.1 billion$950 million at December 31, 20092010 and 20082009 and were recorded in accrued expenses and other liabilities. The associated aggregate notional amount of unfunded lending commitments and letters of credit accounted for under the fair value

option was $27.0were $27.3 billion and $16.9$27.0 billion at December 31, 20092010 and 2008 with the increase driven by the acquisition of Merrill Lynch.2009. Net gains resulting from new originations, terminations and changes in the fair value of commitments and letters of credit of $1.4 billion$172 million were recorded during 20092010 compared to net lossesgains of $473 million$1.4 billion for 2008.2009. These gains and losses were primarily attributable to changes in instrument-specific credit risk.


88     Bank of America 2010


Nonperforming Commercial Loans, Leases and Foreclosed Properties Activity

The following table below presents the additions and reductions to nonperforming commercial loans, leases and foreclosed properties activity during 2010 and 2009. The $2.9 billion decrease at December 31, 2010 compared to December 31, 2009 was driven by paydowns, payoffs and charge-offs in the commercial portfolio during 2009 and 2008. The $16.2 billion in new nonaccrual loans and leases for 2009 was primarily attributable to increases within non-homebuilder commercial real estate property types such as shopping centers/retail, office, land and land development, and multi-use and withinU.S. commercial – domestic excluding small business, where the increases were broad-based across industries and lines of business.portfolios. Approximately 9095 percent of commercial

nonperforming loans, leases and foreclosed properties are secured and approximately 3540 percent are contractually current. In addition, commercial nonperforming loans are carried at approximately 7568 percent of their unpaid principal balance before consideration of the allowance for loan and lease losses as the carrying value of these loans has been reduced to the estimated net realizable value.


Table 33  41Nonperforming Commercial Loans, Leases and Foreclosed Properties Activity(1, 2)

(Dollars in millions) 2009   2008 

Nonperforming loans and leases

Balance, January 1

 $6,497    $2,155  

Additions to nonperforming loans and leases:


Merrill Lynch balance, January 1, 2009

  402       

New nonaccrual loans and leases

  16,190     8,110  

Advances

  339     154  

Reductions in nonperforming loans and leases:


Paydowns and payoffs

  (3,075   (1,467

Sales

  (630   (45

Returns to performing status(3)

  (461   (125

Charge-offs(4)

  (5,626   (1,900

Transfers to foreclosed properties

  (857   (372

Transfers to loans held-for-sale

  (76   (13

Total net additions to nonperforming loans and leases

  6,206     4,342  

Total nonperforming loans and leases, December 31

  12,703     6,497  

Foreclosed properties

Balance, January 1

  321     75  

Additions to foreclosed properties:


New foreclosed properties

  857     372  

Reductions in foreclosed properties:


Sales

  (310   (110

Write-downs

  (91   (16

Total net additions to foreclosed properties

  456     246  

Total foreclosed properties, December 31

  777     321  

Nonperforming commercial loans, leases and foreclosed properties, December 31

 $13,480    $6,818  

Nonperforming commercial loans and leases as a percentage of outstanding commercial loans and leases(5)

  4.00   1.93

Nonperforming commercial loans, leases and foreclosed properties as a percentage of outstanding commercial loans,
leases and foreclosed properties(5)

  4.24     2.02  
         
(Dollars in millions) 2010  2009 
Nonperforming loans and leases, January 1
 $12,703  $6,497 
         
Additions to nonperforming loans and leases:        
Merrill Lynch balance, January 1, 2009     402 
New nonaccrual loans and leases  7,809   16,190 
Advances  330   339 
Reductions in nonperforming loans and leases:        
Paydowns and payoffs  (3,938)  (3,075)
Sales  (841)  (630)
Returns to performing status (3)
  (1,607)  (461)
Charge-offs (4)
  (3,221)  (5,626)
Transfers to foreclosed properties  (1,045)  (857)
Transfers to loansheld-for-sale
  (354)  (76)
         
Total net additions (reductions) to nonperforming loans and leases  (2,867)  6,206 
         
Total nonperforming loans and leases, December 31
  9,836   12,703 
         
Foreclosed properties, January 1
  777   321 
         
Additions to foreclosed properties:        
New foreclosed properties  818   857 
Reductions in foreclosed properties:        
Sales  (780)  (310)
Write-downs  (90)  (91)
         
Total net additions (reductions) to foreclosed properties  (52)  456 
         
Total foreclosed properties, December 31
  725   777 
         
Nonperforming commercial loans, leases and foreclosed properties, December 31
 $10,561  $13,480 
         
Nonperforming commercial loans and leases as a percentage of outstanding commercial loans and leases (5)
  3.35%  4.00%
Nonperforming commercial loans, leases and foreclosed properties as a percentage of outstanding commercial loans,
leases and foreclosed properties (5)
  3.59   4.23 
         
(1)

Balances do not include nonperforming LHFS of $4.5$1.5 billion and $852 million$4.5 billion at December 31, 20092010 and 2008.

2009.
(2)

Includes U.S. small business commercial – domestic activity.

(3)

Commercial loans and leases may be restored to performing status when all principal and interest is current and full repayment of the remaining contractual principal and interest is expected or when the loan otherwise becomes well-secured and is in the process of collection. TDRs are generally classified as performing after a sustained period of demonstrated payment performance.

(4)

Business card loans are not classified as nonperforming; therefore, the charge-offs on these loans have no impact on nonperforming activity.

activity and accordingly are excluded from this table.
(5)

Outstanding commercial loans and leases exclude loans accounted for under the fair value option.

Bank of America 200969


At December 31, 2009,2010, the total commercial TDR balance was $577 million.$1.2 billion. Nonperforming TDRs were $952 million and are included in Table 41. Nonperforming TDRs increased $442$466 million while performing TDRs increased $78$147 million during 2009.2010.
U.S. commercial TDRs were $356 million, an increase of $60 million for the year ended December 31, 2010. Nonperforming U.S. commercial TDRs decreased $52 million during 2010, while performing TDRs excluded from nonperforming loans in Table 41 increased $112 million.
At December 31, 2010, the commercial real estate TDR balance was $815 million, an increase of $547 million during 2010. Nonperforming TDRs increased $524 million during the year, while performing TDRs increased $23 million.
At December 31, 2010 thenon-U.S. commercial TDR balance was $19 million, an increase of $486$6 million. Nonperforming TDRs decreased $6 million are included in Table 33.

during the year, while performing TDRs increased $12 million.

Industry Concentrations

Table 3442 presents commercial committed and commercial utilized credit exposure by industry and the total net credit default protection purchased to cover the funded and the unfunded portionportions of certain credit exposure.exposures. Our commercial

credit exposure is diversified across a broad range of industries.

The decline in commercial committed exposure of $68.1 billion from December 31, 2009 to December 31, 2010 was broad-based across most industries.

Industry limits are used internally to manage industry concentrations and are based on committed exposureexposures and capital usage that are allocated on anindustry-by-industry basis. A risk management framework is in place to set and approve industry limits, as well as to provide ongoing monitoring. TheManagement’s Credit Risk Committee (CRC) oversees industry limitslimit governance.

Total commercial committed exposure decreased $10.1 billion in 2009 across most industries. Those industries that experienced increases in total commercial committed exposure in 2009 were driven by the Merrill Lynch acquisition.

Diversified financials, our largest industry concentration, experienced an increasea decrease in committed exposure of $7.6$25.8 billion, or seven24 percent, at December 31, 20092010 compared to 2008. The total committed credit exposure increaseDecember 31, 2009. This decrease was driven by the Merrill Lynch portfolio which contributed $34.7 billion, largely the result of $28.8 billion in capital markets industry exposure, primarily comprised of derivatives. This was offset, in part, by a reduction in legacy Bank of America positions of $27.1 billion,exposure to conduits tied to the majority of which came from a $21.2 billion reduction in capital markets industry exposure including the cancellation of $8.8 billion in facilities to legacy Merrill Lynch.

consumer finance industry.

Real estate, our second largest industry concentration, experienced a decrease in committed exposure of $12.4$21.1 billion, or 1223 percent, at December 31, 20092010 compared to 2008. An $18.6 billion decrease in legacy Bank of America committed exposure, drivenDecember 31, 2009 due primarily by decreases in homebuilder, unsecured commercial real estate and commercial construction and land development exposure, was partially offset by the acquisition of Merrill Lynch.to portfolio attrition. Real estate construction and land development exposure comprised 31represented 27 percent of the total real estate industry committed exposure at December 31, 2009.2010. For more information on the commercial real estate and related portfolios, refer to the commercial real estate discussionCommercial Real Estate beginning on page 67.85.


Bank of America 2010     89


The insurance$11.8 billion, or 34 percent, decline in individuals and utilitiestrusts committed exposure increased primarilywas largely due to the acquisitionunwinding of Merrill Lynch. Refer totwo derivative transactions. Committed exposure in theGlobal Markets discussion beginning on page 35 and to the monoline and related exposure discussion below for more information.

Retailing committed exposure declined 16 banking industry increased $6.3 billion, or 27 percent, at December 31, 20092010 compared to 2008, drivenDecember 31, 2009 primarily due to increases in both traded products and loan exposure as a result of momentum from growth initiatives. The decline of $4.5 billion, or 10 percent, in consumer services was concentrated in gaming and restaurants. Committed exposure for the commercial services and supplies industry declined $4.1 billion, or 12 percent, primarily due to reduced loan demand and the sale of First Republic.

The recent economic downturn has had a residual effect on debt issued by state and local municipalities and certain exposures to these municipalities. While historically default rates were low, stress on the retirementmunicipalities’ financials due to the economic downturn has increased the potential for defaults in the near term. As part of several large retailour overall and ongoing risk management processes, we continually monitor these exposures and paydowns as retailers and wholesalers worked to reduce inventory levels.

through a rigorous review process. Additionally, internal communications surrounding certain at-risk counterpartiesand/or sectors are regularly circulated ensuring exposure levels are compliant with established concentration guidelines.

Monoline and Related Exposure

Monoline exposure is reported in the insurance industry and managed under insurance portfolio industry limits. Direct loan exposure to monolines consisted of revolvers in the amount of $41$51 million and $126$41 million at December 31, 20092010 and 2008.

2009.

We have indirect exposure to monolines primarily in the form of guarantees supporting our loans, investment portfolios, securitizations and credit-enhanced securities as part of our public finance business and other selected products. Such indirect exposure exists when we purchase credit protection

from monolines to hedge all or a portion of the credit risk on certain credit exposures including loans and CDOs. We underwrite our public finance exposure by evaluating the underlying securities.

We also have indirect exposure to monoline financial guarantors,monolines, primarily in the form of guarantees supporting our mortgage and other loan sales. Indirect exposure may exist when we purchase credit protection was purchased from monoline financial guarantorsmonolines to hedge all or a portion of the credit risk on certain mortgage and other loan exposures. A loss may occur when we are required to repurchase a loan and the market value of the loan has declined or when we are required to indemnify or provide recourse for a guarantor’s loss. We have experienced and continue to experience increasing repurchase demands from and disputes with monoline financial guarantors. We expect to contest such demands that we do not believe are valid. In the event that we are required to repurchase loans that have been the subject of repurchase demands or otherwise provide indemnification or other recourse, this could significantly increase our losses and thereby affect our future earnings. For furtheradditional information regarding our exposure to representations and warranties, seeNote 89 – SecuritizationsRepresentations and Warranties Obligations and Corporate Guaranteesto the Consolidated Financial Statements and Item 1A., Risk Factors.

Representations and Warranties beginning on page 52. For additional information regarding monolines, seeNote 14 – Commitments and Contingencies to the Consolidated Financial Statements.

Monoline derivative credit exposure at December 31, 20092010 had a notional value of $42.6$38.4 billion compared to $9.6$42.6 billion at December 31, 2008. 2009.Mark-to-market monoline derivative credit exposure was $9.2 billion at December 31, 2010 compared to $11.1 billion at December 31, 2009 compared to $2.2 billion at December 31, 2008,with the decrease driven by the addition of Merrill Lynch exposures as well as credit deterioration related to underlying counterpartiespositive valuation adjustments on legacy assets and spread widening in both wrapped CDO and structured finance related exposures.terminated monoline contracts. At December 31, 2009,2010, the counterparty credit valuation adjustment related to monoline derivative exposure was $5.3 billion compared to $6.0 billion whichat December 31, 2009. This reduced our netmark-to-market exposure to $3.9 billion at December 31, 2010 compared to $5.1 billion.billion at December 31, 2009. At December 31, 2010, approximately 62 percent of this exposure was related to one monoline compared to approximately 54 percent at December 31, 2009. We do not hold collateral against these derivative exposures. For more information on our monoline exposure, see theGlobal MarketsGBAM discussion beginning on page 35.45.


90     Bank of America 2010


We also have indirect exposure to monolines as we invest in securities where the issuers have purchased wraps (i.e., insurance). For example, municipalities and corporations purchase protectioninsurance in order to enhance their pricing power which has the effect of reducingreduce their cost of borrowing. If the ratings agencies downgrade the monolines, the credit rating of the bond may fall and may have an adverse impact on the market value of the security. In the case of default, we first look to the underlying

securities and then to recovery on the purchased insurance. Investments in securities issued by municipalities and corporations with purchased wraps at December 31, 20092010 and 20082009 had a notional value of $5.0$2.4 billion and $6.0$5.0 billion.Mark-to-market investment exposure was $2.2 billion at December 31, 2010 compared to $4.9 billion at December 31, 2009 compared to $5.7 billion at December 31, 2008.

2009.


Table 42 Commercial Credit Exposure by Industry (1)
                 
  December 31 
  Commercial Utilized  Total Commercial Committed 
(Dollars in millions) 2010  2009  2010  2009 
Diversified financials $55,196  $69,259  $83,248  $109,079 
Real estate (2)
  58,531   75,049   72,004   93,147 
Government and public education  44,131   44,151   59,594   61,998 
Healthcare equipment and services  30,420   29,584   47,569   46,870 
Capital goods  21,940   23,911   46,087   48,184 
Retailing  24,660   23,671   43,950   42,414 
Consumer services  24,759   28,704   39,694   44,214 
Materials  15,873   16,373   33,046   33,233 
Commercial services and supplies  20,056   23,892   30,517   34,646 
Banks  26,831   20,299   29,667   23,384 
Food, beverage and tobacco  14,777   14,812   28,126   28,079 
Energy  9,765   9,605   26,328   23,619 
Insurance, including monolines  17,263   20,613   24,417   28,033 
Utilities  6,990   9,217   24,207   25,316 
Individuals and trusts  18,278   25,941   22,899   34,698 
Media  11,611   14,020   20,619   22,886 
Transportation  12,070   13,724   18,436   20,101 
Pharmaceuticals and biotechnology  3,859   2,875   11,009   10,626 
Technology hardware and equipment  4,373   3,416   10,932   10,516 
Religious and social organizations  8,409   8,920   10,823   11,374 
Software and services  3,837   3,216   9,531   9,359 
Telecommunication services  3,823   3,558   9,321   9,478 
Consumer durables and apparel  4,297   4,409   8,836   9,998 
Food and staples retailing  3,222   3,680   6,161   6,562 
Automobiles and components  2,090   2,379   5,941   6,359 
Other  13,361   10,219   17,133   14,013 
                 
Total commercial credit exposure by industry
 $460,422  $505,497  $740,095  $808,186 
Net credit default protection purchased on total commitments (3)
         $(20,118) $(19,025)
                 
70Bank of America 2009


Table 34  Commercial Credit Exposure by Industry(1, 2, 3)

  December 31 
  Commercial Utilized      Total Commercial Committed 
(Dollars in millions) 2009    2008       2009     2008 

Diversified financials

 $68,876    $50,327     $110,948      $103,306  

Real estate (4)

  75,049     79,766      91,479       103,889  

Government and public education

  44,151     39,386      61,446       58,608  

Capital goods

  23,834     27,588      47,413       52,522  

Healthcare equipment and services

  29,584     31,280      46,370       46,785  

Consumer services

  28,517     28,715      44,164       43,948  

Retailing

  23,671     30,736      42,260       50,102  

Commercial services and supplies

  23,892     24,095      34,646       34,867  

Individuals and trusts

  25,191     22,752      33,678       33,045  

Materials

  16,373     22,825      32,898       38,105  

Insurance

  20,613     11,223      28,033       17,855  

Food, beverage and tobacco

  14,812     17,257      27,985       28,521  

Utilities

  9,217     8,230      25,229       19,272  

Energy

  9,605     11,885      23,619       22,732  

Banks

  20,299     22,134      23,384       26,493  

Media

  11,236     8,939      22,832       19,301  

Transportation

  13,724     13,050      19,597       18,561  

Religious and social organizations

  8,920     9,539      11,371       12,576  

Pharmaceuticals and biotechnology

  2,875     3,721      10,343       10,111  

Consumer durables and apparel

  4,374     6,219      9,829       10,862  

Technology hardware and equipment

  3,135     3,971      9,671       10,371  

Telecommunication services

  3,558     3,681      9,478       8,036  

Software and services

  3,216     4,093      9,306       9,590  

Food and staples retailing

  3,680     4,282      6,562       7,012  

Automobiles and components

  2,379     3,093      5,339       6,081  

Other

  3,596     9,962       7,390       12,781  

Total commercial credit exposure by industry

 $494,377    $498,749     $795,270      $805,332  

Net credit default protection purchased on total commitments(5)

               $(19,025    $(9,654
(1)

Total

Includes U.S. small business commercial utilized and total commercial committed exposure includes loans and letters of credit accounted for under the fair value option and are comprised of loans outstanding of $4.9 billion and $5.4 billion, and issued letters of credit with a notional amount of $1.7 billion and $1.4 billion at December 31, 2009 and 2008. In addition, total commercial committed exposure includes unfunded loan commitments with a notional amount of $25.3 billion and $15.5 billion at December 31, 2009 and 2008.

exposure.
(2)

Includes small business commercial – domestic exposure.

(3)

At December 31, 2009, total commercial utilized and total commercial committed exposure included $88.5 billion and $114.2 billion of exposure due to the acquisition of Merrill Lynch which included $31.7 billion and $34.7 billion in diversified financials and $12.3 billion and $13.0 billion in insurance with the remaining exposure spread across various industries.

(4)

Industries are viewed from a variety of perspectives to best isolate the perceived risks. For purposes of this table, the real estate industry is defined based uponon the borrowers’ or counterparties’ primary business activity using operating cash flowflows and primary source of repayment as key factors.

(5)(3)

Represents net notional credit protection purchased. Refer to theSee Risk Mitigation discussion beginning on page 71below for additional information.

Risk Mitigation

Credit

We purchase credit protection is purchased to cover the funded portion as well as the unfunded portion of certain credit exposure.exposures. To lessenlower the cost of obtaining our desired credit protection levels, credit exposure may be added within an industry, borrower or counterparty group by selling protection.

At December 31, 20092010 and 2008, we had2009, net notional credit default protection purchased in our credit derivatives portfolio to hedge our funded and unfunded exposures for which we elected the fair value option, as well as certain other credit exposures, of $19.0was $20.1 billion and $9.7$19.0 billion. The increase from December 31, 2008 is primarily driven by the acquisition of Merrill Lynch. The mark-to-market impacts, effects, including the cost of net credit default protection hedging our

credit exposure, resulted in net

losses of $546 million during 2010 compared to net losses of $2.9 billion in 2009 compared to net gains of $993 million in 2008.2009. The averageValue-at-Risk (VAR) (VaR) for these credit derivative hedges was $53 million for 2010 compared to $76 million in 2009 compared to $24 million in 2008.for 2009. The average VARVaR for the related credit exposure was $130$65 million in 20092010 compared to $57$130 million in 2008. The year-over-year increase in VAR was driven by the combination of the Merrill Lynch and Bank of America businesses in 2009. There is a diversification effect between the net credit default protection hedging our credit exposure and the related credit exposure such that the combined average VARVaR was $41 million for 2010, compared to $89 million infor 2009. Refer to the Trading Risk Management discussion beginning on page 80100 for a description of our VARVaR calculation for the market-based trading portfolio.


Bank of America 200971

Bank of America 2010     91


Tables 3543 and 3644 present the maturity profiles and the credit exposure debt ratings of the net credit default protection portfolio at December 31, 20092010 and 2008.2009. The distribution of debt ratingratings for net

notional credit default protection purchased is shown as a negative amount and the net notional credit protection sold is shown as a positive amount.


Table 35  43Net Credit Default Protection by Maturity Profile

  December 31 
  2009   2008 

Less than or equal to one year

 16  1

Greater than one year and less than or equal to five years

 81    92  

Greater than five years

 3    7  

Total net credit default protection

 100  100

         
  December 31 
  2010  2009 
Less than or equal to one year  14%  16%
Greater than one year and less than or equal to five years  80   81 
Greater than five years  6   3 
         
Total net credit default protection
  100%  100%
         
Table 36  44Net Credit Default Protection by Credit Exposure Debt Rating(1)

(Dollars in millions) December 31 
  2009     2008 
Ratings(2) Net Notional   Percent of Total      Net Notional   Percent of Total 

AAA

 $15    (0.1)%    $30    (0.3)% 

AA

  (344  1.8      (103  1.1  

A

  (6,092  32.0      (2,800  29.0  

BBB

  (9,573  50.4      (4,856  50.2  

BB

  (2,725  14.3      (1,948  20.2  

B

  (835  4.4      (579  6.0  

CCC and below

  (1,691  8.9      (278  2.9  

NR(3)

  2,220    (11.7     880    (9.1

Total net credit default protection

 $(19,025  100.0    $(9,654  100.0
                 
  December 31 
  2010  2009 
  Net
  Percent of
  Net
  Percent of
 
(Dollars in millions) Notional  Total  Notional  Total 
Ratings (2)
                
AAA $   0.0% $15   (0.1)%
AA  (188)  0.9   (344)  1.8 
A  (6,485)  32.2   (6,092)  32.0 
BBB  (7,731)  38.4   (9,573)  50.4 
BB  (2,106)  10.5   (2,725)  14.3 
B  (1,260)  6.3   (835)  4.4 
CCC and below  (762)  3.8   (1,691)  8.9 
NR (3)
  (1,586)  7.9   2,220   (11.7)
                 
Total net credit default protection
 $(20,118)  100.0% $(19,025)  100.0%
                 
(1)

Ratings are refreshed on a quarterly basis.

(2)

The Corporation considers ratings of BBB- or higher to meet the definition of investment grade.

(3)

In addition to names which have not been rated, “NR” includes $2.3$(1.5) billion and $948 million$2.3 billion in net credit default swaps index positions at December 31, 20092010 and 2008.2009. While index positions are principally investment grade, credit default swaps indices include names in and across each of the ratings categories.

In addition to our net notional credit default protection purchased to cover the funded and unfunded portion of certain credit exposures, credit derivatives are used for market-making activities for clients and establishing positions intended to profit from directional or relative value changes. We execute the majority of our credit derivative positionstrades in the over-the-counterOTC market with large, multinational financial institutions, including broker/dealers and, to a lesser degree, with a variety of other investors. Because these transactions are executed in the over-the-counterOTC market, we are subject to settlement risk. We are also

subject to credit risk in the event that these counterparties fail to perform under the terms of these contracts. In most cases, credit derivative transactions are executed on a daily margin basis. Therefore, events such as a credit downgrade, (dependingdepending on the ultimate rating level)level, or a breach of credit covenants would typically require an increase in the amount of collateral required of the counterparty, (where applicable), where applicable,and/or allow us to take additional protective measures such as early termination of all trades.


72Bank of America 2009

92     Bank of America 2010


The notional amounts presented in Table 3745 represent the total contract/notional amount of credit derivatives outstanding and include both purchased and written credit derivatives. The credit risk amounts are measured as the net replacement cost, in the event the counterparties with contracts in a gain position to us fail to perform under the terms of those contracts. The addition of Merrill Lynch drove the increase in counterparty credit risk for purchased credit derivatives and the increase in the contract/notional amount. For information on the performance risk of our written credit derivatives, seeNote 4 – Derivatives to the Consolidated Financial Statements.

The credit risk amounts discussed aboveon page 92 and noted in the table below take into consideration the effects of legally enforceable master netting agreements while amounts disclosed inNote 4 – Derivativesto the Consolidated Financial Statements are shown on a gross basis. Credit risk reflects the potential benefit from offsetting exposure to non-credit derivative products with the same counterparties that may be netted upon the occurrence of certain events, thereby reducing the Corporation’s overall exposure.


Table 37  45Credit Derivatives

  December 31
  2009    2008
(Dollars in millions) Contract/Notional  Credit Risk     Contract/Notional  Credit Risk

Credit derivatives


Purchased credit derivatives:


Credit default swaps

 $2,800,539  $25,964   $1,025,850  $11,772

Total return swaps/other

  21,685   1,740     6,601   1,678

Total purchased credit derivatives

  2,822,224   27,704     1,032,451   13,450

Written credit derivatives:


Credit default swaps

  2,788,760       1,000,034   

Total return swaps/other

  33,109        6,203   

Total written credit derivatives

  2,821,869        1,006,237   

Total credit derivatives

 $5,644,093  $27,704    $2,038,688  $13,450
                 
  December 31 
  2010  2009 
  Contract/
     Contract/
    
(Dollars in millions) Notional  Credit Risk  Notional  Credit Risk 
Purchased credit derivatives:
                
Credit default swaps $2,184,703  $18,150  $2,800,539  $25,964 
Total return swaps/other  26,038   1,013   21,685   1,740 
                 
Total purchased credit derivatives
  2,210,741   19,163   2,822,224   27,704 
                 
Written credit derivatives:
                
Credit default swaps  2,133,488   n/a   2,788,760   n/a 
Total return swaps/other  22,474   n/a   33,109   n/a 
                 
Total written credit derivatives
  2,155,962   n/a   2,821,869   n/a 
                 
Total credit derivatives
 $4,366,703  $19,163  $5,644,093  $27,704 
                 
n/a = not applicable

Counterparty Credit Risk Valuation Adjustments

We record a counterparty credit risk valuation adjustment on certain derivativesderivative assets, including our credit default protection purchased, in order to properly reflect the credit quality of the counterparty. These adjustments are necessary as the market quotes on derivatives do not fully reflect the credit risk of the counterparties to the derivative assets. We consider collateral and legally enforceable master netting agreements that mitigate our credit exposure to each counterparty in determining the counterparty credit risk valuation adjustment. All or a portion of these counterparty credit risk valuation adjustments are reversed or otherwise

adjusted in future periods due to changes in the value of the derivative contract, collateral and creditworthiness of the counterparty.

During 2010 and 2009, credit valuation gains (losses) of $731 million and $3.1 billion ($(8) million and $1.7 billion, net of hedges) were recognized in trading account profits (losses) related tofor counterparty credit risk onrelated to derivative assets. For additional information on gains or losses related to the counterparty credit risk on derivative assets, refer toNote 4 – Derivativesto the Consolidated Financial Statements.Statements. For information on our monoline counterparty credit risk, see the discussiondiscussions beginning on pages 3747 and 70,90, and for information on our CDO-related counterparty credit risk, see theGlobal MarketsGBAM discussion beginning on page 35.

45.

Bank of America 200973

Bank of America 2010     93


Foreign
Non-U.S. Portfolio

Our foreignnon-U.S. credit and trading portfolio isportfolios are subject to country risk. We define country risk as the risk of loss from unfavorable economic and political conditions, currency fluctuations, social instability and changes in government policies. A risk management framework is in place to measure, monitor and manage foreignnon-U.S. risk and exposures. Management oversight of country risk, including cross-border risk, is provided by the Regional Risk Committee, a subcommittee of the CRC.

The following table sets forth total foreignnon-U.S. exposure broken out by region at December 31, 20092010 and 2008. Foreign2009.Non-U.S. exposure includes credit

credit

exposure net of local liabilities, securities and other investments issued by or domiciled in countries other than the U.S. Total foreignnon-U.S. exposure can be adjusted for externally guaranteed outstandingsloans outstanding and certain collateral types. Exposures which are assignedsubject to external guarantees are reported under the country of the guarantor. Exposures with tangible collateral are reflected in the country where the collateral is held. For securities received, other than cross-border resale agreements, outstandings are assigned to the domicile of the issuer of the securities. Resale agreements are generally presented based on the domicile of the counterparty consistent with FFIEC reporting requirements.


Table 38  Regional Foreign Exposure46 RegionalNon-U.S. Exposure(1, 2, 3)

  December 31
(Dollars in millions) 2009    2008

Europe

 $170,796    $66,472

Asia Pacific

  47,645     39,774

Latin America

  19,516     11,378

Middle East and Africa

  3,906     2,456

Other

  15,799     10,988

Total

 $257,662    $131,068
         
  December 31 
(Dollars in millions) 2010  2009 
Europe $148,078  $170,796 
Asia Pacific  73,255   47,645 
Latin America  14,848   19,516 
Middle East and Africa  3,688   3,906 
Other  22,188   15,799 
         
Total
 $262,057  $257,662 
         
(1)

Local funding or liabilities are subtracted from local exposures consistent with FFIEC reporting requirements.

(2)

Exposures

Derivative assets included in the exposure amounts have been reduced by $34.3the amount of cash collateral applied of $44.2 billion and $19.6$34.3 billion at December 31, 20092010 and 2008 for the cash applied as collateral to derivative assets.

2009.
(3)

Generally, resale agreements are presented based on the domicile of the counterparty, consistent with FFIEC reporting requirements. Cross-border resale agreements where the underlying securities are U.S. Treasury securities, in which case the domicile is the U.S., are excluded from this presentation.

Our total foreignnon-U.S. exposure was $257.7$262.1 billion at December 31, 2009,2010, an increase of $126.6$4.4 billion from December 31, 2008.2009. Our foreignnon-U.S. exposure remained concentrated in Europe which accounted for $170.8$148.1 billion, or 6657 percent, of total foreignnon-U.S. exposure. The European exposure was mostly in Western Europe and was distributed across a variety of industries. The decrease of $22.7 billion in Europe was primarily driven by our efforts to reduce exposure in the peripheral Eurozone countries and sale or maturity of securities in the U.K. Select European countries are further detailed in Table 49. Asia Pacific was our second largest foreignnon-U.S. exposure at $47.6$73.3 billion, or 1828 percent. The $25.6 billion increase in Asia Pacific was predominantly driven by a required change in accounting for our CCB investment, increased securities exposure in Japan, and increased securities and loan exposure in other Asia Pacific emerging markets. For more information on the required change in accounting for our CCB investment, refer toNote 5 – Securitiesto the Consolidated Financial Statements. Latin America accounted for $19.5$14.8 billion, or eightsix percent, of total foreignnon-U.S. exposure. The increases of $104.3$4.7 billion $7.9 billion and $8.1 billiondecrease in our foreign exposure in Europe, Asia Pacific and Latin America respectively, from was primarily driven by the sale of our equity investments in Itaú Unibanco and Santander. Othernon-U.S. exposure was $22.2 billion at

December 31, 2008 were primarily due to2010, an increase of $6.4 billion from the acquisition of Merrill Lynch.prior year resulting from an increase in Canadian cross-border loans. For more information on our Asia Pacific and Latin America exposure, see the discussion of the foreignnon-U.S. exposure to selected countries defined as emerging markets below.

on page 95.

As shown in Table 39, at December 31, 2009 and 2008,47, the United Kingdom, France and China had total cross-border exposure of $60.7 billion and $13.3 billion, representing 2.73 percent and 0.73greater than one percent of our total assets. The

United Kingdom wasassets and were the only countrycountries where the total cross-border exposure exceeded one percent of our total assets at December 31, 2009. The increase of $47.4 billion was primarily due to the acquisition of Merrill Lynch.2010. At December 31, 2009, Germany2010, Canada and France, withJapan had total cross-border exposure of $18.9$17.9 billion and $17.4$17.0 billion representing 0.850.79 percent and 0.780.75 percent of total assetsassets. Canada and Japan were the only other countries that had total cross-border exposure whichthat exceeded 0.75 percent of our total assets.

assets at December 31, 2010.

Exposure includes cross-border claims by our foreignnon-U.S. offices including loans, acceptances, time deposits placed, trading account assets, securities, derivative assets, other interest-earning investments and other monetary assets. Amounts also include unused commitments, SBLCs, commercial letters of credit and formal guarantees. Sector definitions are consistent with FFIEC reporting requirements for preparing the Country Exposure Report.


Table 39  47Total Cross-border Exposure Exceeding One Percent of Total Assets(1)

(Dollars in millions) December 31    Public Sector    Banks    Private Sector    Cross-border
Exposure
    Exposure as a
Percentage of Total
Assets
 

United Kingdom

 2009    $157    $8,478    $52,080    $60,715    2.73
  2008     543     567     12,167     13,277    0.73  
                         
                 Exposure as a
 
              Cross-border
  Percentage of
 
(Dollars in millions) December 31  Public Sector  Banks  Private Sector  Exposure  Total Assets 
United Kingdom  2010  $101  $5,544  $32,354  $37,999   1.68%
   2009   157   8,478   52,080   60,715   2.73 
France (2)
  2010   978   8,110   15,685   24,773   1.09 
China (2)
  2010   777   21,617   1,534   23,928   1.06 
                         
(1)

At December 31, 2009 and 2008,2010, total cross-border exposure for the United Kingdom, France and China included derivatives exposure of $5.0$2.3 billion, $1.7 billion and $3.2 billion,$870 million, respectively, which has been reduced by the amount of cash collateral applied of $7.1$13.0 billion, $6.9 billion and $4.5 billion.$130 million, respectively. Derivative assets were collateralized by other marketable securities of $18$96 million, $26 million and $124$71 million, respectively, at December 31, 2009 and 2008.

2010.

(2)
74BankAt December 31, 2009, total cross-border exposure for France and China was $17.4 billion and $12.1 billion, representing 0.78 percent and 0.54 percent of America 2009total assets.
94     Bank of America 2010


As presented in Table 40, foreign48,non-U.S. exposure to borrowers or counterparties in emerging markets increased $4.7$14.5 billion to $65.1 billion at December 31, 2010 compared to $50.6 billion at December 31, 2009, compared to $45.8 billion at December 31, 2008.2009. The increase was due to an increase in the acquisition of Merrill LynchAsia Pacific region which was partially offset by

a

the sale of CCB common shares

decrease in 2009. ForeignLatin America.Non-U.S. exposure to borrowers or counterparties in emerging markets represented 2025 percent and 3520 percent of total foreignnon-U.S. exposure at December 31, 20092010 and 2008.

2009.


Table 40  48Selected Emerging Markets(1)

(Dollars in millions) Loans and
Leases, and
Loan
Commitments
  Other
Financing (2)
  Derivative
Assets(3)
  Securities/
Other
Investments (4)
  

Total Cross-

border
Exposure (5)

  Local
Country
Exposure
Net of Local
Liabilities (6)
  Total
Emerging
Market
Exposure at
December 31,
2009
  Increase
(Decrease)
From
December 31,
2008
 

Region/Country


Asia Pacific


China

 $572  $517  $704  $10,270  $12,063  $  $12,063  $(8,642

India

  1,702   1,091   639   1,704   5,136   1,024   6,160   1,726  

South Korea

  428   803   1,275   2,505   5,011      5,011   335  

Hong Kong

  391   337   98   276   1,102      1,102   421  

Singapore

  293   54   228   293   868      868   (701

Taiwan

  279   32   86   127   524   205   729   (113

Other Asia Pacific(7)

  248   63   147   505   963   68   1,031   426  

Total Asia Pacific

  3,913   2,897   3,177   15,680   25,667   1,297   26,964   (6,548

Latin America


Brazil

  522   475   156   6,396   7,549   1,905   9,454   5,585  

Mexico

  1,667   291   524   2,860   5,342   129   5,471   1,314  

Chile

  604   248   281   26   1,159   2   1,161   582  

Other Latin America(7)

  150   319   354   446   1,269   211   1,480   833  

Total Latin America

  2,943   1,333   1,315   9,728   15,319   2,247   17,566   8,314  

Middle East and Africa


South Africa

  133   2   93   920   1,148      1,148   821  

Bahrain

  119   8   36   970   1,133      1,133   (56

United Arab Emirates

  469   12   167   72   720      720   310  

Other Middle East and Africa(7)

  315   92   142   218   767   1   768   239  

Total Middle East and Africa

  1,036   114   438   2,180   3,768   1   3,769   1,314  

Central and Eastern Europe


Russian Federation

  116   66   273   214   669      669   577  

Other Central and Eastern Europe(7)

  141   356   289   788   1,574   32   1,606   1,069  

Total Central and Eastern Europe

  257   422   562   1,002   2,243   32   2,275   1,646  

Total emerging market exposure

 $8,149  $4,766  $5,492  $28,590  $46,997  $3,577  $50,574  $4,726  
                                 
                    Total
    
                    Emerging
  Increase
 
  Loans and
              Local Country
  Market
  (Decrease)
 
  Leases, and
        Securities/
  Total Cross-
  Exposure Net
  Exposure at
  From
 
  Loan
  Other
  Derivative
  Other
  border
  of Local
  December 31,
  December 31,
 
(Dollars in millions) Commitments  Financing (2)  Assets (3)  Investments (4)  Exposure(5)  Liabilities (6)  2010  2009 
Region/Country
                                
Asia Pacific
                                
China $1,064  $1,237  $870  $20,757  $23,928  $  $23,928  $11,865 
India  3,292   1,590   607   2,013   7,502   766   8,268   2,108 
South Korea  621   1,156   585   2,009   4,371   908   5,279   268 
Singapore  560   75   442   1,469   2,546      2,546   1,678 
Hong Kong  349   516   242   935   2,042      2,042   940 
Taiwan  283   64   84   692   1,123   732   1,855   1,126 
Thailand  20   17   39   569   645   24   669   482 
Other Asia Pacific (7)
  298   32   145   239   714      714   (130)
                                 
Total Asia Pacific
  6,487   4,687   3,014   28,683   42,871   2,430   45,301   18,337 
                                 
Latin America
                                
Brazil  1,033   293   560   2,355   4,241   1,565   5,806   (3,648)
Mexico  1,917   305   303   1,860   4,385      4,385   (1,086)
Chile  954   132   401   38   1,525   1   1,526   365 
Colombia  132   460   10   75   677      677   481 
Peru  231   150   16   121   518      518   248 
Other Latin America (7)
  74   167   10   456   707   153   860   (154)
                                 
Total Latin America
  4,341   1,507   1,300   4,905   12,053   1,719   13,772   (3,794)
                                 
Middle East and Africa
                                
United Arab Emirates  967   6   154   49   1,176      1,176   456 
Bahrain  78      3   1,079   1,160      1,160   27 
South Africa  406   7   56   102   571      571   (577)
Other Middle East and Africa (7)
  441   55   132   153   781      781   13 
                                 
Total Middle East and Africa
  1,892   68   345   1,383   3,688      3,688   (81)
                                 
Central and Eastern Europe
                                
Russian Federation  264   133   35   104   536      536   (133)
Turkey  269   165   14   52   500      500   112 
Other Central and Eastern Europe (7)
  148   210   277   618   1,253      1,253   35 
                                 
Total Central and Eastern Europe
  681   508   326   774   2,289      2,289   14 
                                 
Total emerging market exposure
 $13,401  $6,770  $4,985  $35,745  $60,901  $4,149  $65,050  $14,476 
                                 
(1)

There is no generally accepted definition of emerging markets. The definition that we use includes all countries in Asia Pacific excluding Japan, Australia and New Zealand; all countries in Latin America excluding Cayman Islands and Bermuda; all countries in Middle East and Africa; and all countries in Central and Eastern Europe. ThereAt December 31, 2010, there was no$460 million in emerging market exposure included in the portfolio accounted for under the fair value option, none at December 31, 2009 and 2008.

2009.
(2)

Includes acceptances, due froms, SBLCs, commercial letters of credit and formal guarantees.

(3)

Derivative assets are carried at fair value and have been reduced by the amount of cash collateral applied of $557 million$1.2 billion and $152$557 million at December 31, 20092010 and 2008.2009. At December 31, 20092010 and 2008,2009, there were $616$408 million and $531$616 million of other marketable securities collateralizing derivative assets.

(4)

Generally, cross-border resale agreements are presented based on the domicile of the counterparty, consistent with FFIEC reporting requirements. Cross-border resale agreements where the underlying securities are U.S. Treasury securities, in which case the domicile is the U.S., are excluded from this presentation.

(5)

Cross-border exposure includes amounts payable to the Corporation by borrowers or counterparties with a country of residence other than the one in which the credit is booked, regardless of the currency in which the claim is denominated, consistent with FFIEC reporting requirements.

(6)

Local country exposure includes amounts payable to the Corporation by borrowers with a country of residence in which the credit is booked regardless of the currency in which the claim is denominated. Local funding or liabilities are subtracted from local exposures consistent with FFIEC reporting requirements. Total amount of available local liabilities funding local country exposure at December 31, 20092010 was $17.6$15.7 billion compared to $12.6$17.6 billion at December 31, 2008.2009. Local liabilities at December 31, 20092010 in Asia Pacific, Latin America, and Middle East and Africa were $16.3$15.1 billion, $857$451 million and $449$193 million, respectively, of which $8.7$7.9 billion werewas in Singapore, $2.1$1.8 billion were in Hong Kong, $1.5 billion were in both China and Hong Kong, $1.2 billion in India, $1.3 billion were$802 million in South Korea and $734$573 million were in Mexico.Taiwan. There were no other countries with available local liabilities funding local country exposure greater than $500 million.

(7)

No country included in Other Asia Pacific, Other Latin America, Other Middle East and Africa, and Other Central and Eastern Europe had total foreignnon-U.S. exposure of more than $500 million.

Bank of America 200975


At December 31, 2010 and 2009, and 2008, 5370 percent and 7353 percent of the emerging markets exposure was in Asia Pacific. Emerging markets exposure in Asia Pacific decreasedincreased by $6.5$18.3 billion primarily driven by the sale of CCB common shares in 2009. Our exposure in China was primarily related to our equity investment in CCB, which accounted for $9.2$10.6 billion, or 58 percent, of the increase in Asia, and $19.7 billion at December 31, 2009increases in loans in India and 2008.securities in Singapore. The increase in our equity investment in CCB was driven by a required change in accounting. For more information on our CCB investment, refer toNote 5 – Securitiesto theAll Other discussion beginning on page 41. Consolidated Financial Statements.

At December 31, 2010 and 2009, 21 percent and 35 percent of the emerging markets exposure was in Latin America compared to 20 percent at December 31, 2008.America. Latin America emerging markets exposure increaseddecreased $3.8 billion driven by $8.3 billion due to the acquisition of Merrill Lynch. Our exposure in Brazil was primarily related to the carrying valuesale of our investmentequity investments in Itaú Unibanco and Santander, which accounted for $5.4 billion and $2.5 billion of exposure in Brazil at December 31, 2009, and 2008. Our equity investment in Itaú Unibanco represents five percent and eight percent of its outstanding voting and non-voting shares at December 31, 2009 and 2008. Our exposure in Mexico was primarily relatedpartially offset by increased loans across the region. For more information on these sales, refer to our 24.9 percent investment in Santander, which is classified as securities and other investments in Table 40, and accounted for $2.5 billion and $2.1 billion of exposure in Mexico at December 31, 2009 and 2008.

Note 5 – Securitiesto the Consolidated Financial Statements.

At December 31, 2010 and 2009, and 2008, sevensix percent and sixseven percent of the emerging markets exposure was in Middle East and Africa, with a decrease of


Bank of America 2010     95


$81 million primarily driven by a decrease in securities in South Africa, offset by increases in loans in the increase of $1.3 billion due to the acquisition of Merrill Lynch.

United Arab Emirates and South Africa, and securities in Bahrain. At December 31, 2010 and 2009, and 2008, fivethree percent and onefive percent of the emerging markets exposure was in Central and Eastern Europe.

Certain European countries, including Greece, Ireland, Italy, Portugal and Spain, are currently experiencing varying degrees of financial stress. These countries have had certain credit ratings lowered by ratings services during 2010. Risks from the debt crisis in Europe could result in a disruption of the

financial markets which increasedcould have a detrimental impact on the global economic recovery and sovereign and non-sovereign debt in these countries. The table below shows our direct sovereign and non-sovereign exposures, excluding consumer credit card exposure, in these countries at December 31, 2010. The total exposure to these countries was $15.8 billion at December 31, 2010 compared to $25.5 billion at December 31, 2009. The $9.7 billion decrease since December 31, 2009 was driven primarily by $1.6 billion due to the acquisitionsale or maturity of Merrill Lynch.sovereign and non-sovereign securities in all countries.


Table 49 Selected European Countries
                                 
                 Local
  Total Non-
    
  Loans and
              Country
  U.S.
    
  Leases, and
        Securities/
  Total Cross-
  Exposure Net
  Exposure at
    
  Loan
  Other
  Derivative
  Other
  border
  of Local
  December 31,
  Credit Default
 
(Dollars in millions) Commitments  Financing (1)  Assets (2)  Investments (3)  Exposure (4)  Liabilities (5)  2010  Protection (6) 
Greece
                                
Sovereign $  $  $  $103  $103  $  $103  $(23)
Non-sovereign  260   2   43   69   374      374    
                                 
Total Greece
 $260  $2  $43  $172  $477  $  $477  $(23)
                                 
Ireland
                                
Sovereign $7  $326  $22  $52  $407  $  $407  $ 
Non-sovereign  1,641   524   152   267   2,584      2,584   (15)
                                 
Total Ireland
 $1,648  $850  $174  $319  $2,991  $  $2,991  $(15)
                                 
Italy
                                
Sovereign $  $  $1,247  $21  $1,268  $1  $1,269  $(1,136)
Non-sovereign  967   639   560   1,310   3,476   1,792   5,268   (67)
                                 
Total Italy
 $967  $639  $1,807  $1,331  $4,744  $1,793  $6,537  $(1,203)
                                 
Portugal
                                
Sovereign $  $  $36  $  $36  $  $36  $(19)
Non-sovereign  65   55   26   344   490      490    
                                 
Total Portugal
 $65  $55  $62  $344  $526  $  $526  $(19)
                                 
Spain
                                
Sovereign $25  $  $36  $  $61  $40  $101  $(57)
Non-sovereign  1,028   40   382   1,872   3,322   1,835   5,157   (7)
                                 
Total Spain
 $1,053  $40  $418  $1,872  $3,383  $1,875  $5,258  $(64)
                                 
Total
                                
Sovereign $32  $326  $1,341  $176  $1,875  $41  $1,916  $(1,235)
Non-sovereign  3,961   1,260   1,163   3,862   10,246   3,627   13,873   (89)
                                 
Total selected European exposure
 $3,993  $1,586  $2,504  $4,038  $12,121  $3,668  $15,789  $(1,324)
                                 
(1)Includes acceptances, due froms, SBLCs, commercial letters of credit and formal guarantees.
(2)Derivative assets are carried at fair value and have been reduced by the amount of cash collateral applied of $2.9 billion at December 31, 2010. At December 31, 2010, there was $41 million of other marketable securities collateralizing derivative assets.
(3)Generally, cross-border resale agreements are presented based on the domicile of the counterparty, consistent with FFIEC reporting requirements. Cross-border resale agreements where the underlying securities are U.S. Treasury securities, in which case the domicile is the U.S., are excluded from this presentation.
(4)Cross-border exposure includes amounts payable to the Corporation by borrowers or counterparties with a country of residence other than the one in which the credit is booked, regardless of the currency in which the claim is denominated, consistent with FFIEC reporting requirements.
(5)Local country exposure includes amounts payable to the Corporation by borrowers with a country of residence in which the credit is booked regardless of the currency in which the claim is denominated. Local funding or liabilities are subtracted from local exposures consistent with FFIEC reporting requirements. Of the $838 million applied for exposure reduction, $459 million was in Italy, $208 million in Ireland, $137 million in Spain and $34 million in Greece.
(6)Represents net notional credit default protection purchased to hedge counterparty risk.

Provision for Credit Losses

The provision for credit losses increased $21.7decreased $20.1 billion to $48.6$28.4 billion for 20092010 compared to 2008.

2009. The consumer portion of the provision for credit losses increased $15.1for the consumer portfolio decreased $11.4 billion to $36.9$25.4 billion for 20092010 compared to 2008. The increase was driven by higher net charge-offs2009 reflecting lower delinquencies and decreasing bankruptcies in our consumer real estate,the consumer credit card and consumer lending portfolios, reflecting deterioration in the economy and housing markets. In addition to higher net charge-offs, the provision increase was also driven by higher reserve additions for deterioration in the purchased impaired and residential mortgage portfolios, new draws on previously securitized accounts as well as an approximate $800 million addition to increase the reserve coverage to approximately 12 months of charge-offs in consumer credit card. These increases were partially offset by lower reserve additions in our unsecured domestic consumer lending portfolios resulting from improved delinquencies andan improving economic outlook. Also contributing to the improvement were lower reserve additions in consumer real estate due to improving portfolio trends. The addition to reserves in the home equity portfolio due to the slowdown in the pace of deterioration. In the Countrywide and Merrill Lynch consumer purchased impairedPCI loan portfolios the additions to reserves to reflectreflected further reductions in expected principal cash flows wereof $2.2 billion for 2010 compared to $3.5 billion in 2009 compared to $750 million in 2008. The increase was primarily relateda year earlier. Consumer net charge-offs of $29.4 billion for 2010 were $4.2 billion higher than the prior year due to the impact of the adoption of new

consolidation guidance resulting in the consolidation of certain securitized loan balances in our consumer credit card and home equity purchased impaired portfolio.

portfolios, offset by benefits from economic improvement during the year which impacted all consumer portfolios.

The commercial portion of the provision for credit losses for the commercial portfolio, including the provision for unfunded lending commitments, increased $6.7decreased $8.7 billion to $11.7$3.0 billion for 20092010 compared to 2008. The increase was driven by higher net charge-offs and higher additions2009 due to the reservesimproved borrower credit profiles, stabilization of appraisal values in the commercial real estate portfolio and commercial – domestic portfolios, reflecting deterioration across a broad range of property types, industrieslower delinquencies and borrowers. These increases were partially offset by lower reserve additionsbankruptcies in the small business portfolio dueportfolio. These same factors resulted in a decrease in commercial net charge-offs of $3.5 billion to improved delinquencies.$5.0 billion in 2010 compared to 2009.


96     Bank of America 2010


Allowance for Credit Losses

Allowance for Loan and Lease Losses

The allowance for loan and lease losses is allocated based on two components, described below, based on whether a loan or lease is performing or whether it has been individually identified as being impaired or has been modified as a TDR. We evaluate the adequacy of the allowance for loan and lease losses based on the total of these two components. The allowance for loan and lease losses excludes loansheld-for-sale and loans accounted for under the fair value option, as fair value adjustments related to loans measured at fair value include a credit risk component. The allowance for loan and lease losses is allocated based on two components. We evaluate the adequacy of the allowance for loan and lease losses based on the combined total of these two components.

The first component of the allowance for loan and lease losses covers thosenonperforming commercial loans, excluding loans accounted for under the fair value option, that are either nonperforming or impaired, or consumer real estate loans that have been modified in a TDR.TDR, renegotiated credit card, unsecured consumer and small business loans. These loans are subject to impairment measurement primarily at the loan level based either on the present value of expected future cash flows discounted at the loan’s contractualoriginal effective interest rate, (oror discounted at the portfolio average contractual annual percentage rate, excluding renegotiated and promotionally priced loans for the renegotiated TDR portfolio. Impairment measurement may also be based upon the collateral value or the loan’s observable market price).price. When the determined or measured values are lower than the carrying value of thatthe loan, impairment is recognized. For purposes of computing this specific loss component of the allowance, larger impaired loans are evaluated individually and smaller impaired loans are evaluated as a pool using historical loss experience for the respective product types and risk ratings of the loans.

The second component of the allowance for loan and lease losses covers performing consumer and commercial loans and leases excludingwhich have incurred losses that are not yet individually identifiable. The allowance for consumer and certain homogeneous commercial loan and lease products is based on aggregated portfolio evaluations, generally by product type. Loss forecast models are utilized that consider a variety of factors including, but not limited to, historical loss experience, estimated defaults or foreclosures based on portfolio trends, delinquencies, economic trends and credit scores. Our consumer real estate loss forecast model estimates the portion of our homogeneous loans accountedthat will default based on individual loan attributes, the most significant of which are refreshed LTV or CLTV, borrower credit score as well as vintage and geography, all of which are further broken down into current delinquency status. Incorporating refreshed LTV and CLTV into our probability of default allows us to factor the impact of changes in home prices into our allowance for underloan and lease losses. These loss forecast models are updated on a quarterly basis to incorporate information reflecting the fair value option. current economic environment. Included within this second component of the allowance for loan and lease losses and determined separately from the procedures outlined above are reserves which are maintained to cover uncertainties that affect our estimate of probable losses including domestic and global economic uncertainty and large single name defaults. We evaluate the adequacy of the allowance for loan and lease losses based on the combined total of these two components. As of December 31, 2010, inputs to the loss forecast process resulted in reductions in the allowance for most consumer portfolios.
The allowance for commercial loan and lease losses is established by product type after analyzing historical loss experience by internal risk rating, current economic conditions, industry performance trends, geographic or obligor concentrations within each portfolio segment, and any other pertinent information. The statistical models for commercial loans are generally updated annually and utilize the Corporation’s historical loss experience isdatabase of actual defaults and other data. The loan risk ratings and composition of the commercial portfolios are updated at least quarterly to incorporate the most recent data reflective ofreflecting the current economic environment. AsFor risk-rated commercial loans, we estimate the probability of December 31, 2009, quarterly updatesdefault (PD) and the loss given

default (LGD) based on the Corporation’s historical experience of defaults and credit losses. Factors considered when assessing the internal risk rating include the value of the underlying collateral, if applicable; the industry in which the obligor operates; the obligor’s liquidity and other financial indicators; and other quantitative and qualitative factors relevant to historical loss experience resulted in an increase inthe obligor’s credit risk. When estimating the allowance for loan and lease losses, most significantlymanagement relies not only on models derived from historical experience but also on its judgment in considering the effect on probable losses inherent in the commercial real estate portfolio. The allowance for consumer and certain homogeneous commercial loan and lease products is based on aggregated portfolio segment evaluations, generally by product type. Loss forecast models are utilized that consider a variety of factors including, but not limitedportfolios due to historical loss experience, estimated defaults or foreclosures based on portfolio trends, delinquencies, economic trends and credit scores. These loss forecast models are updated on a quarterly basis to incorporate information reflecting the current economic environment.macroeconomic environment and trends, inherent uncertainty in models, and other qualitative factors. As of December 31, 2009, quarterly2010, updates to the loss forecast modelsloan risk ratings and composition resulted in increases in the allowance for loan and lease losses in the consumer real estate and foreign credit card portfolios and reductions in the allowance for theGlobal Card Services consumer lending and domestic credit cardall commercial portfolios.

We monitor differences between estimated and actual incurred loan and lease losses. This monitoring process includes periodic assessments by senior management of loan and lease portfolios and the models used to estimate incurred losses in those portfolios.

Additions to, or reductions of, the allowance for loan and lease losses generally are made byrecorded through charges or credits to the provision for credit losses. Credit exposures deemed to be uncollectible are charged against the allowance for loan and lease losses. Recoveries of previously charged off amounts are credited to the allowance for loan and lease losses.

The allowance for loan and lease losses for the consumer portfolio as presented in Table 4251 was $27.8$34.7 billion at December 31, 2009,2010, an increase of $11.1$6.9 billion from December 31, 2008.2009. This increase was primarily related to $10.8 billion of reserves recorded on January 1, 2010 in connection with the impactadoption of new consolidation guidance, and higher reserve additions in the weak economy and deteriorationnon-impaired consumer real estate portfolios during the first half of 2010 amid continued stress in


76Bank of America 2009


the housing markets, which drovemarket. These items were partially offset by reserve builds for higher losses across most reductions primarily due to improving credit quality in theGlobal Card Servicesconsumer portfolios. With respect to the Countrywide and Merrill Lynch consumer purchased impairedPCI loan portfolios, updating ofupdates to our expected principal cash flows resulted in an increase in reserves through provision of $3.5$2.2 billion for 2010, primarily in the home equity and discontinued real estate and residential mortgage portfolios.

portfolios compared to $3.5 billion in 2009.

The allowance for commercial loan and lease losses was $9.4$7.2 billion at December 31, 2009,2010, a $3.0$2.2 billion increasedecrease from December 31, 2008.2009. The increasedecrease was primarily due to improvements in allowance levels was driven by reserve increases onthe U.S. small business commercial portfolio withinGlobal Card Servicesdue to improved delinquencies and bankruptcies, as well as in the U.S. commercial portfolios primarily inGlobal Commercial BankingandGBAM,and the commercial real estate and commercial – domestic portfoliosportfolio primarily withinGlobal Commercial Banking.

reflecting improved borrower credit profiles as a result of improving economic conditions.

The allowance for loan and lease losses as a percentage of total loans and leases outstanding was 4.47 percent at December 31, 2010 compared to 4.16 percent at December 31, 2009, compared to 2.49 percent at December 31, 2008.2009. The increase in the ratio was primarily driven bymostly due to consumer reserve increases for higher losses insecuritized loans consolidated under the residential mortgage, consumernew consolidation guidance, which were primarily credit card and home equity portfolios, reflecting deterioration in the housing markets and the impact of the weak economy.loans. The increase was also the result of reserve increases in the commercial real estate and commercial – domestic portfolios reflecting broad-based deterioration across various borrowers, industries, and property types. In addition, the December 31, 2010 and 2009 and 2008 ratios above include the impact of the purchased impairedPCI loan portfolio. Excluding the impacts of the purchased impairedPCI loan portfolio, the allowance for loan and lease losses as a percentage of total loans and leases outstanding was 3.94 percent at December 31, 2010 compared to 3.88 percent at December 31, 2009, compared to 2.53 percent at December 31, 2008.

2009.

Reserve for Unfunded Lending Commitments

In addition to the allowance for loan and lease losses, we also estimate probable losses related to unfunded lending commitments such as letters of credit, financial guarantees and binding loan commitments, excluding commitments accounted for under the fair value option, such as letters of credit and financial guarantees, and binding unfunded loan commitments.option. Unfunded lending commitments are subject to the same assessment as funded loans, except utilization assumptionsincluding estimates of PD and LGD. Due to the nature of unfunded commitments, the


Bank of America 2010     97


estimate of probable losses must also consider utilization. To estimate the portion of these undrawn commitments that is likely to be drawn by a borrower at the time of estimated default, analyses of the Corporation’s historical experience are considered.applied to the unfunded commitments to estimate the funded exposure at default (EAD). The reserveexpected loss for unfunded lending commitments is includedthe product of the PD, the LGD and the EAD, adjusted for any qualitative factors including economic uncertainty and inherent uncertainty in accrued expenses and other liabilities on the Consolidated Balance Sheet with changes to the reserve generally made through the provision for credit losses.models.

The reserve for unfunded lending commitments at December 31, 20092010 was $1.5$1.2 billion, compared to $421$299 million atlower than December 31, 2008. The increase was largely2009 primarily driven by the fair valueaccretion of thepurchase accounting adjustments on acquired Merrill Lynch unfunded lending commitments.

positions and customer utilizations of previously unfunded positions.

Bank of America 200977


Table 4150 presents a rollforward of the allowance for credit losses for 20092010 and 2008.

2009.


Table 41  50Allowance for Credit Losses

(Dollars in millions) 2009   2008 

Allowance for loan and lease losses, January 1

 $23,071    $11,588  

Loans and leases charged off


Residential mortgage

  (4,436   (964

Home equity

  (7,205   (3,597

Discontinued real estate

  (104   (19

Credit card – domestic

  (6,753   (4,469

Credit card – foreign

  (1,332   (639

Direct/Indirect consumer

  (6,406   (3,777

Other consumer

  (491   (461

Total consumer charge-offs

  (26,727   (13,926

Commercial – domestic(1)

  (5,237   (2,567

Commercial real estate

  (2,744   (895

Commercial lease financing

  (217   (79

Commercial – foreign

  (558   (199

Total commercial charge-offs

  (8,756   (3,740

Total loans and leases charged off

  (35,483   (17,666

Recoveries of loans and leases previously charged off


Residential mortgage

  86     39  

Home equity

  155     101  

Discontinued real estate

  3     3  

Credit card – domestic

  206     308  

Credit card – foreign

  93     88  

Direct/Indirect consumer

  943     663  

Other consumer

  63     62  

Total consumer recoveries

  1,549     1,264  

Commercial – domestic(2)

  161     118  

Commercial real estate

  42     8  

Commercial lease financing

  22     19  

Commercial – foreign

  21     26  

Total commercial recoveries

  246     171  

Total recoveries of loans and leases previously charged off

  1,795     1,435  

Net charge-offs

  (33,688   (16,231

Provision for loan and lease losses

  48,366     26,922  

Write-downs on consumer purchased impaired loans(3)

  (179   n/a  

Other(4)

  (370   792  

Allowance for loan and lease losses, December 31

  37,200     23,071  

Reserve for unfunded lending commitments, January 1

  421     518  

Provision for unfunded lending commitments

  204     (97

Other(5)

  862       

Reserve for unfunded lending commitments, December 31

  1,487     421  

Allowance for credit losses, December 31

 $38,687    $23,492  

Loans and leases outstanding at December 31(6)

 $895,192    $926,033  

Allowance for loan and lease losses as a percentage of total loans and leases outstanding at December 31(3, 6)

  4.16   2.49

Consumer allowance for loan and lease losses as a percentage of total consumer loans and leases outstanding at December 31(3)

  4.81     2.83  

Commercial allowance for loan and lease losses as a percentage of total commercial loans and leases outstanding at December 31(3)

  2.96     1.90  

Average loans and leases outstanding(3, 6)

 $941,862    $905,944  

Net charge-offs as a percentage of average loans and leases outstanding(3, 6)

  3.58   1.79

Allowance for loan and lease losses as a percentage of total nonperforming loans and leases at December 31(3, 6)

  111     141  

Ratio of the allowance for loan and lease losses at December 31 to net charge-offs(3)

  1.10     1.42  
         
(Dollars in millions) 2010  2009 
Allowance for loan and lease losses, beginning of period, before effect of the January 1 adoption of new consolidation guidance
 $37,200  $23,071 
Allowance related to adoption of new consolidation guidance  10,788   n/a 
         
Allowance for loan and lease losses, January 1
  47,988   23,071 
         
Loans and leases charged off
        
Residential mortgage  (3,779)  (4,436)
Home equity  (7,059)  (7,205)
Discontinued real estate  (77)  (104)
U.S. credit card  (13,818)  (6,753)
Non-U.S. credit card
  (2,424)  (1,332)
Direct/Indirect consumer  (4,303)  (6,406)
Other consumer  (320)  (491)
         
Total consumer charge-offs  (31,780)  (26,727)
         
U.S. commercial (1)
  (3,190)  (5,237)
Commercial real estate  (2,185)  (2,744)
Commercial lease financing  (96)  (217)
Non-U.S. commercial
  (139)  (558)
         
Total commercial charge-offs  (5,610)  (8,756)
         
Total loans and leases charged off  (37,390)  (35,483)
         
Recoveries of loans and leases previously charged off
        
Residential mortgage  109   86 
Home equity  278   155 
Discontinued real estate  9   3 
U.S. credit card  791   206 
Non-U.S. credit card
  217   93 
Direct/Indirect consumer  967   943 
Other consumer  59   63 
         
Total consumer recoveries  2,430   1,549 
         
U.S. commercial (2)
  391   161 
Commercial real estate  168   42 
Commercial lease financing  39   22 
Non-U.S. commercial
  28   21 
         
Total commercial recoveries  626   246 
         
Total recoveries of loans and leases previously charged off  3,056   1,795 
         
Net charge-offs  (34,334)  (33,688)
         
Provision for loan and lease losses  28,195   48,366 
Other (3)
  36   (549)
         
Allowance for loan and lease losses, December 31  41,885   37,200 
         
Reserve for unfunded lending commitments, January 1
  1,487   421 
Provision for unfunded lending commitments  240   204 
Other (4)
  (539)  862 
         
Reserve for unfunded lending commitments, December 31  1,188   1,487 
         
Allowance for credit losses, December 31
 $43,073  $38,687 
         
(1)

Includes U.S. small business commercial – domestic charge-offs of $2.0 billion and $3.0 billion in 2010 and $2.0 billion in 2009 and 2008.

2009.
(2)

Includes U.S. small business commercial – domestic recoveries of $107 million and $65 million in 2010 and $39 million in 2009 and 2008.

2009.
(3)

Allowance for loan and lease losses includes $3.9 billion and $750 million of valuation allowance for consumer purchased impaired loans at December 31, 2009 and 2008. Excluding the valuation allowance for purchased impaired loans, allowance for loan and lease losses as a percentage of total nonperforming loans and leases would have been 99 percent and 136 percent at December 31, 2009 and 2008. For more information on the impact of purchased impaired loans on asset quality, see Consumer Portfolio Credit Risk Management beginning on page 54 and Commercial Portfolio Credit Risk Management beginning on page 64.

(4)

The 2009 amount includes a $750 million reduction in the allowance for loan and lease losses related to credit card loans of $8.5 billion which were exchanged for a $7.8 billion inheld-to-maturity debt securitysecurities that waswere issued by the Corporation’s U.S. Credit Card Securitization Trust and retained by the Corporation. This reduction was partially offset by a $340 million increase associated with the reclassification to other assets of the December 31, 2008 amount expected to be reimbursed under residential mortgage cash collateralized synthetic securitizations.

(4)The 20082010 amount includes the $1.2 billion addition of the Countrywide allowance for loan losses as of July 1, 2008.

(5)

The 2009 amount represents the fair valueremaining balance of the acquired Merrill Lynch unfunded lending commitmentsreserve excluding those commitments accounted for under the fair value option, net of accretion, and the impact of funding previously unfunded portions.

positions. All other amounts represent primarily accretion of the Merrill Lynch purchase accounting adjustment and the impact of funding previously unfunded positions.
n/a = not applicable
98     Bank of America 2010


Table 50 Allowance for Credit Losses (continued)
         
(Dollars in millions) 2010  2009 
Loans and leases outstanding at December 31 (5)
 $937,119  $895,192 
Allowance for loan and lease losses as a percentage of total loans and leases and outstanding at December 31 (5)
  4.47%  4.16%
Consumer allowance for loan and lease losses as a percentage of total consumer loans and leases outstanding at December 31  5.40   4.81 
Commercial allowance for loan and lease losses as a percentage of total commercial loans and leases outstanding at December 31 (5)
  2.44   2.96 
Average loans and leases outstanding (5)
 $954,278  $941,862 
Net charge-offs as a percentage of average loans and leases outstanding (5)
  3.60%  3.58%
Allowance for loan and lease losses as a percentage of total nonperforming loans and leases at December 31(5, 6, 7)
  136   111 
Ratio of the allowance for loan and lease losses at December 31 to net charge-offs  1.22   1.10 
         
Excluding purchased credit-impaired loans: (8)
        
Allowance for loan and lease losses as a percentage of total loans and leases outstanding at December 31 (5)
  3.94%  3.88%
Consumer allowance for loan and lease losses as a percentage of total consumer loans and leases outstanding at December 31  4.66   4.43 
Commercial allowance for loan and lease losses as a percentage of total commercial loans and leases outstanding at December 31 (5)
  2.44   2.96 
Net charge-offs as a percentage of average loans and leases outstanding (5)
  3.73   3.71 
Allowance for loan and lease losses as a percentage of total nonperforming loans and leases at December 31(5, 6, 7)
  116   99 
Ratio of the allowance for loan and lease losses at December 31 to net charge-offs  1.04   1.00 
         
(6)(5)

Outstanding loan and lease balances and ratios do not include loans accounted for under the fair value option. Loans measured ataccounted for under the fair value option were $4.9$3.3 billion and $5.4$4.9 billion at December 31, 20092010 and 2008.2009. Average loans measured ataccounted for under the fair value option were $4.1 billion and $6.9 billion in 2010 and $4.9 billion for 2009 and 2008.

2009.
n/a

= not applicable

(6)Allowance for loan and lease losses includes $22.9 billion and $17.7 billion allocated to products that were excluded from nonperforming loans, leases and foreclosed properties at December 31, 2010 and 2009.
78(7)BankFor more information on our definition of America 2009nonperforming loans, see the discussion beginning on page 81.
(8)Metrics exclude the impact of Countrywide consumer PCI loans and Merrill Lynch commercial PCI loans.


For reporting purposes, we allocate the allowance for credit losses across products. However, the allowance is available to absorb any credit losses without restriction. Table 4251 presents our allocation by product type.

Table 42  51Allocation of the Allowance for Credit Losses by Product Type

  December 31 
  2009    2008 
(Dollars in millions) Amount    Percent
of Total
   Percent of
Loans and
Leases
Outstanding (1)
     Amount  Percent
of Total
   Percent of
Loans and
Leases
Outstanding (1)
 

Allowance for loan and lease losses


Residential mortgage

 $4,607    12.38  1.90  $1,382  5.99  0.56

Home equity

  10,160    27.31    6.81     5,385  23.34    3.53  

Discontinued real estate

  989    2.66    6.66     658  2.85    3.29  

Credit card – domestic

  6,017    16.18    12.17     3,947  17.11    6.16  

Credit card – foreign

  1,581    4.25    7.30     742  3.22    4.33  

Direct/Indirect consumer

  4,227    11.36    4.35     4,341  18.81    5.20  

Other consumer

  204    0.55    6.53     203  0.88    5.87  

Total consumer

  27,785    74.69    4.81     16,658  72.20   ��2.83  

Commercial – domestic(2)

  5,152    13.85    2.59     4,339  18.81    1.98  

Commercial real estate

  3,567    9.59    5.14     1,465  6.35    2.26  

Commercial lease financing

  291    0.78    1.31     223  0.97    1.00  

Commercial – foreign

  405    1.09    1.50     386  1.67    1.25  

Total commercial(3)

  9,415    25.31    2.96     6,413  27.80    1.90  

Allowance for loan and lease losses

  37,200    100.00  4.16   23,071  100.00  2.49

Reserve for unfunded lending commitments(4)

  1,487         421    

Allowance for credit losses (5)

 $38,687             $23,492        
                             
  December 31, 2010  January 1, 2010 (1)  December 31, 2009 
        Percent of
           Percent of
 
        Loans and
           Loans and
 
     Percent
  Leases
        Percent of
  Leases
 
(Dollars in millions) Amount  of Total  Outstanding (2)  Amount  Amount  Total  Outstanding (2) 
Allowance for loan and lease losses (3)
                            
Residential mortgage $4,648   11.10%  1.80% $4,607  $4,607   12.38%  1.90%
Home equity  12,934   30.88   9.37   10,733   10,160   27.31   6.81 
Discontinued real estate  1,670   3.99   12.74   989   989   2.66   6.66 
U.S. credit card  10,876   25.97   9.56   15,102   6,017   16.18   12.17 
Non-U.S. credit card
  2,045   4.88   7.45   2,686   1,581   4.25   7.30 
Direct/Indirect consumer  2,381   5.68   2.64   4,251   4,227   11.36   4.35 
Other consumer  161   0.38   5.67   204   204   0.55   6.53 
                             
Total consumer  34,715   82.88   5.40   38,572   27,785   74.69   4.81 
                             
U.S. commercial (4)
  3,576   8.54   1.88   5,153   5,152   13.85   2.59 
Commercial real estate  3,137   7.49   6.35   3,567   3,567   9.59   5.14 
Commercial lease financing  126   0.30   0.57   291   291   0.78   1.31 
Non-U.S. commercial
  331   0.79   1.03   405   405   1.09   1.50 
                             
Total commercial(5)
  7,170   17.12   2.44   9,416   9,415   25.31   2.96 
                             
Allowance for loan and lease losses
  41,885   100.00%  4.47   47,988   37,200   100.00%  4.16 
                             
Reserve for unfunded lending commitments
  1,188           1,487   1,487         
                             
Allowance for credit losses (6)
 $43,073          $49,475  $38,687         
                             
(1)

Balances reflect impact of new consolidation guidance.
(2)Ratios are calculated as allowance for loan and lease losses as a percentage of loans and leases outstanding excluding loans accounted for under the fair value option for each loan and lease category. Loans accounted for under the fair value option include U.S. commercial – domestic loans of $3.0$1.6 billion and $3.5$3.0 billion,non-U.S. commercial – foreign loans of $1.9$1.7 billion and $1.7$1.9 billion and commercial real estate loans of $90$79 million and $203$90 million at December 31, 20092010 and 2008.2009.

(2)

Includes allowance for small business commercial – domestic loans of $2.4 billion at both December 31, 2009 and 2008.

(3)

December 31, 2010 is presented in accordance with new consolidation guidance. December 31, 2009 has not been restated.
(4)Includes allowance for U.S. small business commercial loans of $1.5 billion and $2.4 billion at December 31, 2010 and 2009.
(5)Includes allowance for loan and lease losses for impaired commercial loans of $1.2$1.1 billion and $691 million$1.2 billion at December 31, 20092010 and 2008.

(4)

The majority of2009. Included in the increase from$1.1 billion at December 31, 2008 relates to the fair value of the acquired Merrill Lynch unfunded lending commitments, excluding commitments accounted for under the fair value option.

(5)

Includes $3.9 billion and $7502010 is $445 million related to U.S. small business commercial renegotiated TDR loans.

(6)Includes $6.4 billion and $3.9 billion of allowance for credit losses related to purchased impairedcredit-impaired loans at December 31, 20092010 and 2008.

2009.
Bank of America 2010     99


Market Risk Management

Market risk is the risk that values of assets and liabilities or revenues will be adversely affected by changes in market conditions such as market movements. This risk is inherent in the financial instruments associated with our operationsand/or activities including loans, deposits, securities, short-term borrowings, long-term debt, trading account assets and liabilities, and derivatives. Market-sensitive assets and liabilities are generated through loans and deposits associated with our traditional banking business, customer and other trading operations, the ALM process, credit risk mitigation activities and mortgage banking activities. In the event of market volatility, factors such as underlying market movements and liquidity have an impact on the results of the Corporation.

Our traditional banking loan and deposit products are nontrading positions and are generally reported at amortized cost for assets or the amount owed for liabilities (historical cost). However, these positions are still subject to changes in economic value based on varying market conditions, primarily changes in the levels of interest rates. The risk of adverse changes in the economic value of our nontrading positions is managed through our ALM activities. We have elected to account for certain assets and liabilities under the fair value option. For further information on the fair value of certain financial assets and liabilities, seeNote 2022 – Fair Value Measurementsto the Consolidated Financial Statements.

Our trading positions are reported at fair value with changes currently reflected in income. Trading positions are subject to various risk factors, which include exposures to interest rates and foreign exchange rates, as

well as mortgage, equity, commodity, issuer and market liquidity risk factors. We seek to mitigate these risk exposures by using techniques that encompass a variety of financial instruments in both the cash and derivatives markets. The following discusses the key risk components along with respective risk mitigation techniques.

Interest Rate Risk

Interest rate risk represents exposures to instruments whose values vary with the level or volatility of interest rates. These instruments include, but are not limited to, loans, debt securities, certain trading-related assets and liabilities, deposits, borrowings and derivative instruments. Hedging instruments used to mitigate these risks include related derivatives such as options, futures, forwards and swaps.

Foreign Exchange Risk

Foreign exchange risk represents exposures to changes in the values of current holdings and future cash flows denominated in other currencies. The types of instruments exposed to this risk include investments in foreignnon-U.S. subsidiaries, foreign currency-denominated loans and securities, future cash flows in foreign currencies arising from foreign exchange transactions, foreign currency-denominated debt and various foreign exchange derivative instruments whose values fluctuate with changes in the level or volatility of currency exchange rates or foreignnon-U.S. interest rates. Hedging instruments used to mitigate this risk include foreign exchange options, currency swaps, futures, forwards, foreign currency- denominatedcurrency-denominated debt and deposits.


Bank of America 200979


Mortgage Risk

Mortgage risk represents exposures to changes in the value of mortgage-related instruments. The values of these instruments are sensitive to prepayment rates, mortgage rates, agency debt ratings, default, market liquidity, other interest rates, government participation and interest rate volatility. Our exposure to these instruments takes several forms. First, we trade and engage in market-making activities in a variety of mortgage securities including whole loans, pass-through certificates, commercial mortgages, and CMOscollateralized mortgage obligations (CMOs) including CDOs using mortgages as

underlying collateral. Second, we originate a variety of MBS which involves the accumulation of mortgage-related loans in anticipation of eventual securitization. Third, we may hold positions in mortgage securities and residential mortgage loans as part of the ALM portfolio. Fourth, we create MSRs as part of our mortgage origination activities. SeeNote 1 – Summary of Significant Accounting PrinciplesandNote 2225 – Mortgage Servicing Rightsto the Consolidated Financial Statements for additional information on MSRs. Hedging instruments used to mitigate this risk include foreign exchange options, currency swaps, futures, forwards swaps, swaptions and securities.

foreign currency-denominated debt.

Equity Market Risk

Equity market risk represents exposures to securities that represent an ownership interest in a corporation in the form of domestic and foreign common stock or other equity-linked instruments. Instruments that would lead to this exposure include, but are not limited to, the following: common stock, exchange tradedexchange-traded funds, American Depositary Receipts, convertible bonds, listed equity options (puts and calls),over-the-counter equity options, equity total return swaps, equity index futures and other equity derivative products. Hedging instruments used to mitigate this risk include options, futures, swaps, convertible bonds and cash positions.

Commodity Risk

Commodity risk represents exposures to instruments traded in the petroleum, natural gas, power and metals markets. These instruments consist primarily of futures, forwards, swaps and options. Hedging instruments used to mitigate this risk include options, futures and swaps in the same or similar commodity product, as well as cash positions.

Issuer Credit Risk

Issuer credit risk represents exposures to changes in the creditworthiness of individual issuers or groups of issuers. Our portfolio is exposed to issuer credit risk where the value of an asset may be adversely impacted by changes in the levels of credit spreads, by credit migration or by defaults. Hedging instruments used to mitigate this risk include bonds, CDScredit default swaps and other credit fixed incomefixed-income instruments.

Market Liquidity Risk

Market liquidity risk represents the risk that the level of expected market activity changes dramatically and, in certain cases, may even cease to exist. This exposes us to the risk that we will not be able to transact business and execute trades in an orderly manner andwhich may impact our results. This impact could further be exacerbated if expected hedging or pricing correlations are impactedcompromised by the disproportionate demand or lack of demand for certain instruments. We utilize various risk mitigating techniques as discussed in more detail in Trading Risk Management.

below.

Trading Risk Management

Trading-related revenues represent the amount earned from trading positions, including market-based net interest income, which are taken in a diverse range of financial instruments and markets. Trading account assets and liabilities and derivative positions are reported at fair value. For more information on fair value, seeNote 2022 – Fair Value Measurementsto the Consolidated Financial Statements. Trading-related revenues can be volatile and are largely driven by general market conditions and customer demand. Trading-related revenues are dependent on the volume and type of transactions, the level of risk assumed, and the volatility of price and rate movements at any given time within the ever-changing market environment.

The Global Markets Risk Committee (GRC), chaired by the Global Markets Risk Executive, has been designated by ALMRC as the primary governance


100     Bank of America 2010


authority for Global Markets Risk Management including trading risk management. The GRC’s focus is to take a forward-looking view of the primary credit and market risks impactingGlobal MarketsGBAMand prioritize those that need a proactive risk mitigation strategy. Market risks that impact lines of business outside ofGlobal MarketsGBAMare monitored and governed by their respective governance authorities.

At the

The GRC meetings, the committee considersmonitors significant daily revenues and losses by business along with an explanationand the primary drivers of the primary driver of the revenuerevenues or loss.losses. Thresholds are establishedin place for each of our businesses in order to determine if the revenue or loss is considered to be significant for that business. If any of the thresholds are exceeded, an explanation of the variance is madeprovided to the GRC. The thresholds are developed in coordination with the respective risk managers to highlight those revenues or losses whichthat exceed what is considered to be normal daily income statement volatility.


80Bank of America 2009


The following histogram below is a graphic depiction of trading volatility and illustrates the daily level of trading-related revenue for the twelve months ended December 31, 20092010, as compared with the twelve months ended December 31, 2008.2009. During the twelve months ended December 31, 2010, positive trading-related revenue was recorded for 90 percent of the trading days of which 75 percent were daily trading gains of over $25 million, four percent of the trading days had losses greater than $25 million and the largest loss was $102 million. This can be compared to the twelve months ended December 31, 2009, where positive trading-related revenue was recorded for 88 percent of the trading days of which 72 percent were daily trading gains of over $25 million, six percent of the trading days had losses greater than $25 million

and the largest loss was $100 million. This can be compared to the twelve months ended December 31, 2008, where positive trading-related revenue was recorded for 66 percent


Histogram of the trading days of which 39 percent were daily trading gains of over $25 million, 17 percent of the trading days had losses greater than $25 million and the largest loss was $173 million. The increase in daily trading gains of over $25 million in 2009 compared to 2008 was driven by more favorable market conditions.

Daily Trading-related Revenue

To evaluate risk in our trading activities, we focus on the actual and potential volatility of individual positions as well as portfolios. VARVaR is a key statistic used to measure market risk. In order to manageday-to-day risks, VARVaR is subject to trading limits both for our overall trading portfolio and within individual businesses. All limit excesses are communicated to management for review.

A VARVaR model simulates the value of a portfolio under a range of hypothetical scenarios in order to generate a distribution of potential gains and losses. VARVaR represents the worst loss the portfolio is expected to experience based on historical trends with a given level of confidence and depends on the volatility of the positions in the portfolio and on how strongly their risks are correlated. Within any VARVaR model, there are significant and numerous assumptions that will differ from company to company. In addition, the accuracy of a VARVaR model depends on the availability and quality of historical data for each of the positions in the portfolio. A VARVaR model may require additional modeling assumptions for new products whichthat do not have extensive historical price data or for illiquid positions for which accurate daily prices are not consistently available.

A VARVaR model is an effective tool in estimating ranges of potential gains and losses on our trading portfolios. There are however many limitations inherent in a VARVaR model as it utilizes historical results over a

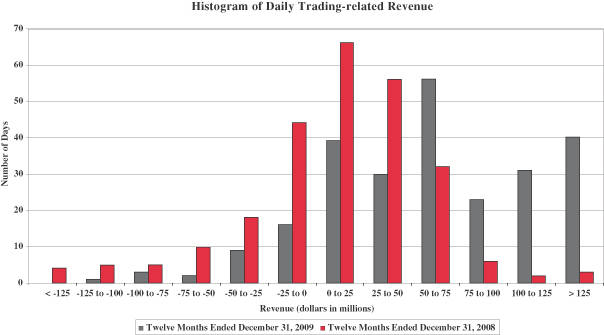
defined time period to estimate future performance. Historical results may not always be indicative

of future results and changes in market conditions or in the composition of the underlying portfolio could have a material impact on the accuracy of the VARVaR model. To ensure thatIn order for the VARVaR model reflectsto reflect current market conditions, we update the historical data underlying our VARVaR model on a bi-weekly basis and regularly review the assumptions underlying the model.

We continually review, evaluate and enhance our VARVaR model to ensureso that it reflects the material risks in our trading portfolio. Nevertheless, due to the limitations mentioned above, we have historically used the VARVaR model as only one of the components in managing our trading risk and also use other techniques such as stress testing and desk level limits. Periods of extreme market stress influence the reliability of these techniques to variousvarying degrees.

The accuracy of the VARVaR methodology is reviewed by backtesting (i.e., comparing actual results against expectations derived from historical data) the VARVaR results against the daily profit and loss. Graphic representation of the backtesting results with additional explanation of backtesting excesses are reported to the GRC. Backtesting excesses occur when trading losses exceed VAR.VaR. Senior management reviews and evaluates the results of these tests.

In periods of market stress, the GRC members communicate daily to discuss losses and VaR limit excesses. As a result of this process, the lines of business may selectively reduce risk. Where economically feasible, positions are sold or macroeconomic hedges are executed to reduce the exposure.

Bank of America 200981

Bank of America 2010     101


The following graph below shows daily trading-related revenue and VARVaR for the twelve months ended December 31, 2009.2010. Actual losses did not exceed daily trading VARVaR in the twelve months ended December 31, 2010 and 2009. ActualOur VaR model uses a historical simulation approach based on three years of historical data

and an expected shortfall methodology equivalent to a 99 percent confidence level. Statistically, this means that losses exceeded dailywill exceed VaR, on average, one out of 100 trading VARdays, or two to three times in the twelve months ended December 31, 2008.

each year.


Trading Risk and Return
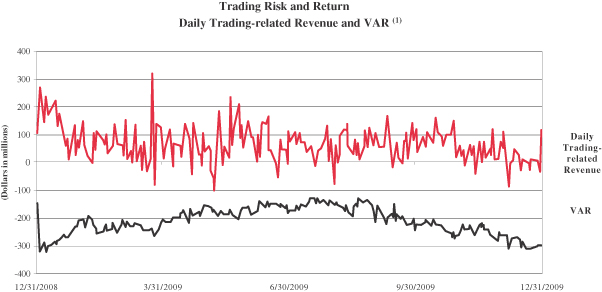
Daily Trading-related Revenue and VaR

(1)

Our VAR model uses a historical simulation approach based on three years of historical data and an expected shortfall methodology equivalent to a 99 percent confidence level. Statistically, this means that losses will exceed VAR, on average, one out of 100 trading days, or two to three times each year.

Table 4352 presents average, high and low daily trading VARVaR for 20092010 and 2008.

2009.

Table 43  52Trading Activities Market Risk VARVaR

  2009     2008
  VAR   VAR
(Dollars in millions) Average     High(1)    Low(1)   Average   High(1)    Low(1)

Foreign exchange

 $20.3      $55.4    $6.1   $7.7    $11.7    $5.0

Interest rate

  73.7       136.7     43.6    28.9     68.3     12.4

Credit

  183.3       338.7     123.9    84.6     185.2     44.1

Real estate/mortgage

  51.1       81.3     32.4    22.7     43.1     12.8

Equities

  44.6       87.6     23.6    28.0     63.9     15.5

Commodities

  20.2       29.1     16.0    8.2     17.7     2.4

Portfolio diversification

  (187.0              (69.4        

Total market-based trading portfolio(2)

 $206.2      $325.2    $117.9    $110.7    $255.7    $64.1
                          
  2010  2009 
(Dollars in millions) Average   High (1)  Low (1)  Average  High (1)  Low (1) 
Foreign exchange $23.8   $73.1  $4.9  $20.3  $55.4  $6.1 
Interest rate  64.1    128.3   33.2   73.7   136.7   43.6 
Credit  171.5    287.2   122.9   183.3   338.7   123.9 
Real estate/mortgage  83.1    138.5   42.9   51.1   81.3   32.4 
Equities  39.4    90.9   20.8   44.6   87.6   23.6 
Commodities  19.9    31.7   12.8   20.2   29.1   16.0 
Portfolio diversification  (200.5)         (187.0)      
                          
Total market-based trading portfolio
 $201.3   $375.2  $123.0  $206.2  $325.2  $117.9 
                          
(1)

The high and low for the total portfolio may not equal the sum of the individual components as the highs or lows of the individual portfolios may have occurred on different trading days.

(2)

The table above does not include credit protection purchased to manage our counterparty credit risk.

The increasedecrease in average VARVaR during 2009 as compared to 20082010 resulted from the acquisition of Merrill Lynch.reduced exposures in several businesses. In periods of market stress, the GRC members communicate dailyaddition, portfolio diversification increased relative to discuss losses and VAR limit excesses. As a result of this process, the lines of business may selectively reduce risk. Where economically feasible, positions are sold or macroeconomic hedges are executed to reduce the exposure.

average VaR, as exposure changes resulted in reduced correlations across businesses.

Counterparty credit risk is an adjustment to themark-to-market value of our derivative exposures reflecting the impact of the credit quality of counterparties on our derivative assets. Since counterparty credit exposure is not included in the VARVaR component of the regulatory capital allocation, we do not include it in our trading VAR,VaR, and it is therefore not included in the daily trading-related revenue illustrated in our histogram or used for backtesting.

Trading Portfolio Stress Testing

Because the very nature of a VARVaR model suggests results can exceed our estimates, we also “stress test” our portfolio. Stress testing estimates the value change in our trading portfolio that may result from abnormal market movements. Various scenarios, categorized as either historical or hypothetical, are regularly run and reported for the overall trading portfolio and individual businesses. Historical scenarios simulate the impact of price changes whichthat occurred during a set of extended historical market events. Generally, a 10-business-day window or longer, representing the most severe

point during thea crisis, is selected for each historical scenario. Hypothetical scenarios provide simulations of anticipated shocks from predefined market stress events. These stress events include shocks to underlying market risk variables which may be well beyond the shocks found in the historical data used to calculate the VAR.VaR. As with the histor - -


82Bank of America 2009


icalhistorical scenarios, the hypothetical scenarios are designed to represent a short-term market disruption. Scenarios are reviewed and updated as necessary in light of changing positions and new economic or political information. In addition to the value afforded by the results themselves, this information provides senior management with a clear picture of the trend of risk being taken given the relatively static nature of the shocks applied. Stress testing for the trading portfolio is also integrated with the enterprise-wide stress testing.testing and incorporated into the limits framework. A process has been established to ensurepromote consistency between the scenarios used for the trading portfolio and those used for enterprise-wide stress testing. The scenarios used for enterprise-wide stress testing purposes differ from the typical trading portfolio scenarios in that they have a longer time horizon and the results are forecasted over multiple periods for use in consolidated capital and liquidity planning. For additional information on enterprise-wide stress testing, see page 50.68.


102     Bank of America 2010


Interest Rate Risk Management for Nontrading Activities

Interest rate risk represents the most significant market risk exposure to our nontrading exposures. Our overall goal is to manage interest rate risk so that movements in interest rates do not adversely affect core net interest income – managed basis.income. Interest rate risk is measured as the potential volatility in our core net interest income – managed basis caused by changes in market interest rates. Client-facing activities, primarily lending and deposit-taking, create interest rate sensitive positions on our balance sheet. Interest rate risk from these activities, as well as the impact of changing market conditions, is managed through our ALM activities.

Simulations are used to estimate the impact on core net interest income – managed basis usingof numerous interest rate scenarios, balance sheet trends and strategies. These simulations evaluate how these scenarios impact core net interest income – managed basis onchanges in short-term financial instruments, debt securities, loans, deposits, borrowings and derivative instruments.instruments impact core net interest income. In addition, these simulations incorporate assumptions about balance sheet dynamics such as loan and deposit growth and pricing, changes in funding mix, and asset and liability repricing and

maturity characteristics. These simulations do not include the impact of hedge ineffectiveness.

Management analyzes core net interest income – managed basis forecasts utilizing different rate scenarios with the baseline utilizing themarket-based forward interest rates. Management frequently updates the core net interest income – managed basis forecast for changing assumptions and differing outlooks based on economic trends and market conditions. Thus, we continually monitor our balance sheet position in an effort to maintain an acceptable level of exposure to interest rate changes.

We prepare forward-looking forecasts of core net interest income – managed basis. Theseincome. The baseline forecasts takeforecast takes into consideration expected future business growth, ALM positioning and the direction of interest rate movements as implied by the market-based forward interest rates.curve. We then measure and evaluate the impact that alternative interest rate scenarios have on thesethe static baseline forecastsforecast in order to assess interest rate sensitivity under varied conditions. The spot and12-month forward monthly rates used in our respective baseline forecastsforecast at December 31, 20092010 and 20082009 are presented in the following table.

table below.


Table 44  53Forward Rates

  December 31 
  2009     2008 
  Federal
Funds
   Three-
Month
LIBOR
   10-Year
Swap
     Federal
Funds
   Three-
Month
LIBOR
   10-Year
Swap
 

Spot rates

 0.25  0.25  3.97   0.25  1.43  2.56

12-month forward rates

 1.14    1.53    4.47      0.75    1.41    2.80  
                         
  December 31 
  2010  2009 
  Federal
  Three-Month
  10-Year
  Federal
  Three-Month
  10-Year
 
  Funds  LIBOR  Swap  Funds  LIBOR  Swap 
Spot rates  0.25%  0.30%  3.39%  0.25%  0.25%  3.97%
12-month forward rates
  0.25   0.72   3.86   1.14   1.53   4.47 
                         

During 2009, the spread between the spot three-month London InterBank Offered Rate (LIBOR) and the Federal Funds target rate converged. We are typically asset sensitive to Federal Funds and Prime rates, and liability sensitive to LIBOR. Net interest income benefits as the spread between Federal Funds and LIBOR narrows.

Table 45 below reflects54 shows the pre-tax dollar impact to forecasted core net interest income – managed basis over the next twelve months from

December 31, 20092010 and 2008,2009, resulting from a 100 bpbps gradual parallel increase, a 100 bpbps gradual parallel decrease, a 100 bpbps gradual curve flattening (increase in short-term rates or

decrease in long-term rates) and a 100 bpbps gradual curve steepening (decrease in short-term rates or increase in long-term rates) from the forward market curve. For further discussion of core net interest income, – managed basis see page 27.

37.


Table 45  54Estimated Core Net Interest Income – Managed Basis at Risk(1)

(Dollars in millions)           December 31 
Curve Change Short Rate (bps)    Long Rate (bps)    2009     2008 

+100 bps Parallel shift

 +100    +100    $598      $144  

-100 bps Parallel shift

 -100    -100     (1,084     (186

Flatteners


Short end

 +100         127       (545

Long end

     -100     (616     (638

Steepeners


Short end

 -100         (444     453  

Long end

     +100     476       698  

                 
(Dollars in millions)       December 31 
Curve Change Short Rate (bps)  Long Rate (bps)  2010  2009 
+100 bps Parallel shift  +100   +100  $601  $598 
-100 bps Parallel shift  –100   –100   (834)  (1,084)
Flatteners                
Short end  +100      136   127 
Long end     –100   (637)  (616)
Steepeners                
Short end  –100      (170)  (444)
Long end     +100   493   476 
                 
Bank of America 2009(1)83Prior periods are reported on a managed basis.


The sensitivity analysis above assumes that we take no action in response to these rate shifts over the indicated periods. The estimatedAt December 31, 2010, the exposure isas reported on a managed basis and reflects impacts that may be realized in net interest income. At December 31, 2009, the estimated exposure as reported reflects impacts that would have been realized primarily in net interest income and card income on the Consolidated Statement of Income. This sensitivity analysis excludes any impact that could occur in the valuation of retained interests in the Corporation’s securitizations due to changes in interest rate levels. For additional information on securitizations, seeNote 8 – Securitizations to the Consolidated Financial Statements.

income.

Our core net interest income – managed basis was asset sensitive to a parallel move in interest rates at both December 31, 20092010 and 2008. Beyond what is already implied2009. The change in the forward market curve, the interest rate risk position has become more exposedrelative to declining rates since December 31, 2008 driven by the acquisition of Merrill Lynch and the actions taken2009 is primarily due to strengthen our capital and liquidity position.lower short-term interest rates. As part of our ALM activities, we use securities, residential mortgages, and interest rate and foreign exchange derivatives in managing interest rate sensitivity.

Securities

The securities portfolio is an integral part of our ALM position and is primarily comprised of debt securities and includesincluding MBS and to a lesser extent U.S. Treasury, corporate, municipal and other investment grade debt securities. At December 31, 2010 and 2009, AFS debt securities were $337.6 billion and $301.6 billion compared to $276.9 billion at December 31, 2008.billion. During 20092010 and 2008,2009, we purchased AFS debt securities of $199.2 billion and $185.1 billion, and $184.2 billion, sold $159.4$97.5 billion and $119.8$159.4 billion, and had maturities and received paydowns of $59.9$70.9 billion and $26.1$59.9 billion. We realized $2.5 billion and $4.7 billion and $1.1 billion in net gains on sales of debt securities during 20092010 and 2008.2009. In addition, we securitized $14.0$2.4 billion and $26.1$14.0 billion of residential mortgage loans into MBS during 2010 and 2009, which we retained during 2009retained.


Bank of America 2010     103


During 2010, we entered into a series of transactions in our AFS debt securities portfolio that involved securitizations as well as sales of non-agency RMBS. These transactions were initiated following a review of corporate risk objectives in light of proposed Basel regulatory capital changes and 2008.

liquidity targets. For more information on the proposed regulatory capital changes, see Capital Management – Regulatory Capital Changes beginning on page 64. During 2010, the carrying value of the non-agency RMBS portfolio was reduced $14.5 billion primarily as a result of the aforementioned sales and securitizations as well as paydowns. We recognized net losses of $922 million on the series of transactions in the AFS debt securities portfolio, and improved the overall credit quality of the remaining portfolio such that the percentage of the non-agency RMBS portfolio that is below investment-grade was reduced significantly.

Accumulated OCI includes after-tax net unrealized gains of $7.4 billion and $1.5 billion in after-tax gains at December 31, 2010 and 2009, including $628comprised primarily of after-tax net unrealized gains of $714 million ofand after-tax net unrealized losses of $628 million related to AFS debt securities and $2.1 billion ofafter-tax net unrealized gains of $6.7 billion and $2.1 billion related to AFS equity securities. The 2010 unrealized gain on marketable equity securities was related to our investment in CCB. SeeNote 5 – Securitiesto the Consolidated Financial Statements for further discussion on marketable equity securities. Total market value of the AFS debt securities was $337.6 billion and $301.6 billion at December 31, 2010 and 2009 with a weighted-average duration of 4.9 and 4.5 years, and primarily relates to our MBS and U.S. Treasury portfolio.

The amount of pre-tax accumulated OCI loss related to AFS debt securities decreasedincreased by $8.3$2.2 billion during 20092010 to $1.0 billion. For those securities that are in an unrealized loss position, we have the intent and ability$1.1 billion, primarily due to hold these securities to recovery and it is more likely than not that we will not be required to sell the securities prior to recovery.

sales of non-agency CMO positions.

We recognized $2.8 billion$967 million of other-than-temporary impairmentOTTI losses through earnings on AFS debt securities during 2009in 2010 compared to $3.5$2.8 billion during 2008.in 2009. We also recognized $326$3 million of other-than-temporary impairmentOTTI losses on AFS marketable equity securities during 20092010 compared to $661$326 million during 2008.

in 2009.

The recognition of impairment oflosses on AFS debt and marketable equity securities is based on a variety of factors, including the length of time and extent to which the market value has been less than cost;cost, the financial condition of the issuer of the security including credit ratings and its ability to recover market value;the specific events affecting the operations of the issuer, underlying assets that collateralize the debt security, other industry and macroeconomic conditions, and our intent and ability to hold the security to recovery. We do not intend to sell securities with unrealized losses and it is not more-likely-than-not that we will be required to sell those securities before recovery of amortized cost. Based on our evaluation of the abovethese and other relevant factors, and after consideration of the losses described in the paragraph above, we do not believe that the AFS debt and marketable equity securities that are in an unrealized loss position at December 31, 20092010 areother-than-temporarily impaired.

We adopted new accounting guidance related to the recognition and presentation of other-than-temporary impairment of debt securities as of January 1, 2009. As prescribed by the new guidance, at December 31, 2009, we recognized the credit component of other-than-temporary

impairment of debt securities in earnings and the non-credit component in OCI for those securities which we do not intend to sell and it is more likely than not that we will not be required to sell the security prior to recovery. For more information on the adoption of the new guidance, seeNote 1 – Summary of Significant Accounting Principles to the Consolidated Financial Statements.

Residential Mortgage Portfolio

At December 31, 2010 and 2009, residential mortgages were $242.1 billion compared to $248.1 billion at December 31, 2008. We retained $26.6$258.0 billion and $27.3$242.1 billion. During 2010 and 2009, we retained $63.8 billion and $26.6 billion in first mortgages originated byHome Loans & Insurance. Outstanding residential mortgage loans increased $15.8 billion in 2010 compared to 2009 as new FHA insured origination volume was partially offset by paydowns, the sale of $10.8 billion of residential mortgages related to First Republic Bank, transfers to foreclosed properties and charge-offs. In addition, FHA repurchases of delinquent loans pursuant to our servicing agreements with GNMA also increased the residential mortgage portfolio during 2010.

During 2010 and 2009, and 2008. Wewe securitized $14.0$2.4 billion and $26.1$14.0 billion of residential mortgage loans into MBS which we retainedretained. We recognized gains of $68 million on securitizations completed during 20092010. For more information on these securitizations, seeNote 8 – Securitizations and 2008.Other Variable Interest Entitiesto the Consolidated Financial Statements. During 2010 and 2009, we had no purchases of residential mortgages related to ALM activities comparedactivities. We sold $443 million of residential mortgages during 2010, of which $432 million were originated residential mortgages and $11 million were previously purchased from third parties. Net gains on these transactions were $21 million. This compares to purchasessales of $405 million during 2008. We sold $5.9 billion of residential mortgages during 2009 of which $5.1 billion were originated residential mortgages and $771 million were previously purchased from third parties. These sales resulted in gains of $47 million. This compares to sales of $30.7 billion during 2008 which were comprised of $22.9 billion in originated residential mortgages and $7.8 billion in mortgages previously purchased from third parties. These sales resulted in gains of $496 million. We received paydowns of $38.2 billion and $42.3 billion in 2010 and $26.3 billion in 2009 and 2008.

In addition to the residential mortgage portfolio, we incorporated the discontinued real estate portfolio that was acquired in connection with the Countrywide acquisition into our ALM activities. This portfolio’s balance was $14.9 billion and $20.0 billion at December 31, 2009 and 2008.

2009.

Interest Rate and Foreign Exchange Derivative Contracts

Interest rate and foreign exchange derivative contracts are utilized in our ALM activities and serve as an efficient tool to manage our interest rate and foreign exchange risk. We use derivatives to hedge the variability in cash flows or changes in fair value on our balance sheet due to interest rate and foreign exchange components. For additional information on our hedging activities, seeNote 4 – Derivativesto the Consolidated Financial Statements.

Our interest rate contracts are generally non-leveraged generic interest rate and foreign exchange basis swaps, options, futures and forwards. In addition, we use foreign exchange contracts, including cross-currency interest rate swaps, and foreign currency forward contracts and options to mitigate the foreign exchange risk associated with foreign currency-denominated assets and liabilities. Table 46 reflects55 shows the notional amounts, fair value, weighted-average receive fixedreceive-fixed and pay fixedpay-fixed rates, expected maturity and estimated duration of our open ALM derivatives at December 31, 20092010 and 2008.2009. These amounts do not include derivative hedges on our net investments in consolidated foreign operations and MSRs.

Changes to the composition of our derivatives portfolio during 20092010 reflect actions taken for interest rate and foreign exchange rate risk management. The decisions to reposition our derivatives portfolio are based upon the current assessment of economic and financial conditions including the interest rate environment,and foreign currency environments, balance sheet composition and trends, and the relative mix of our cash and derivative positions. The notional amount of our option positions increased to $6.6 billion at December 31, 2010 from $6.5 billion at December 31, 2009 from $5.0 billion at December 31, 2008. Changes in the levels of the option positions were driven by swaptions acquired as a result of the Merrill Lynch acquisition.2009. Our interest rate swap positions, (includingincluding foreign exchange contracts)contracts, were a net receive fixedreceive-fixed position of $6.4 billion and $52.2 billion at December 31, 2009 compared to a net receive fixed position of $50.3 billion at December 31, 2008. Changes2010 and 2009. The decrease in the net notional levels of our interest rate swap position werewas driven by the net addition of


84Bank of America 2009


$104.4 $51.6 billion in pay fixedpay-fixed swaps $83.4and $11.5 billion in foreign currency-denominated receive-fixed swaps, offset by a reduction of $5.6 billion in U.S. dollar-denominated receive fixed swaps and the net addition of $22.9 billion in foreign currency-denominated receive fixedreceive-fixed swaps. The notional amount of our foreign exchange basis swaps was $122.8$235.2 billion and $54.6$122.8 billion at December 31, 20092010 and 2008.2009. The $42.9$112.4 billion increase in same-currency basis swap positionsnotional change was primarily due to the acquisition of Merrill Lynch.new trade activity during 2010 to mitigate cross-currency basis risk on our economic hedge portfolio. The increase in pay-fixed swaps resulted from hedging newly purchased U.S. Treasury Bonds with swaps and entering into additional pay-fixed swaps to hedge variable rate short-term liabilities. Our futures and forwards net notional position, which reflects the net of long and short positions, was a short position of $280 million at December 31, 2010 compared to a long position of $10.6 billion compared to a short position of $8.8 billion at December 31, 2008.2009.


104     Bank of America 2010


The following table below includes derivatives utilized in our ALM activities including those designated as accounting and economic hedging instruments. The fair value of net ALM contracts increased $5.8 billion$329 million to a gain of $12.6 billion at December 31, 2010 compared to $12.3 billion at December 31, 2009 from a gain of $6.4 billion at December 31, 2008.2009. The increase was primarily attributable to changes in the value of U.S. dollar-denominated receive fixeddollar-

denominated receive-fixed interest rate swaps of $1.9$3.3 billion, foreign exchange contracts of $2.1 billion and foreign exchange basis swaps of $1.4 billion, pay fixed interest rate swaps of $1.2 billion, foreign exchange contracts of $1.1 billion, option products of $174 million and same-currency basis swaps of $107$197 million. The increase was partially offset by a loss from the changes in the value of futurespay-fixed interest rate swaps of $5.0 billion and forward rate contractsoption products of $66$294 million.


Table 46  55Asset and Liability Management Interest Rate and Foreign Exchange Contracts

December 31, 2009

  Fair
Value
  Expected Maturity   
(Dollars in millions, average estimated duration in years)  Total  2010  2011  2012  2013  2014  Thereafter  Average Estimated
Duration

Receive fixed interest rate swaps(1, 2)

 $4,047          4.34

Notional amount

  $110,597   $15,212   $8   $35,454   $7,333   $8,247   $44,343   

Weighted-average fixed-rate

   3.65  1.61    2.42  4.06  3.48  5.29 

Pay fixed interest rate swaps(1)

  1,175          4.18

Notional amount

  $104,445   $2,500   $50,810   $14,688   $806   $3,729   $31,912   

Weighted-average fixed-rate

   2.83  1.82  2.37  2.24  3.77  2.61  3.92 

Same-currency basis swaps(3)

  107          

Notional amount

  $42,881   $4,549   $8,593   $11,934   $5,591   $5,546   $6,668   

Foreign exchange basis swaps(2, 4, 5)

  4,633          

Notional amount

   122,807    7,958    10,968    19,862    18,322    31,853    33,844   

Option products(6)

  174          

Notional amount

   6,540    656    2,031    1,742    244    603    1,264   

Foreign exchange contracts(2, 5, 7)

  2,144          

Notional amount(8)

   103,726    63,158    3,491    3,977    6,795    10,585    15,720   

Futures and forward rate contracts

  (8        

Notional amount(8)

      10,559    10,559                       

Net ALM contracts

 $12,272                                

December 31, 2008

   
     Expected Maturity   
(Dollars in millions, average estimated duration in years) Fair
Value
  Total  2009  2010  2011  2012  2013  Thereafter  Average Estimated
Duration

Receive fixed interest rate swaps(1, 2)

 $2,103          4.93

Notional amount

  $27,166   $17   $4,002   $   $9,258   $773   $13,116   

Weighted-average fixed-rate

   4.08  7.35  1.89    3.31  4.53  5.27 

Foreign exchange basis swaps(2, 4, 5)

  3,196          

Notional amount

  $54,569   $4,578   $6,192   $3,986   $8,916   $4,819   $26,078   

Option products(6)


Notional amount

   5,025    5,000    22                3   

Foreign exchange contracts(2, 5, 7)

  1,070          

Notional amount(8)

   23,063    2,313    4,021    1,116    1,535    486    13,592   

Futures and forward rate contracts

  58          

Notional amount(8)

      (8,793  (8,793                     

Net ALM contracts

 $6,427                                

                                     
     December 31, 2010    
     Expected Maturity  Average
 
  Fair
    Estimated
 
(Dollars in millions, average estimated duration in years) Value  Total  2011  2012  2013  2014  2015  Thereafter  Duration 
Receive fixed interest rate swaps(1, 2)
 $7,364                               4.45 
Notional amount     $104,949  $8  $36,201  $7,909  $7,270  $8,094  $45,467     
Weighted-average fixed-rate      3.94%  1.00%  2.49%  3.90%  3.66%  3.71%  5.19%    
Pay fixed interest rate swaps (1, 2)
  (3,827)                              6.03 
Notional amount     $156,067  $50,810  $16,205  $1,207  $4,712  $10,933  $72,200     
Weighted-average fixed-rate      3.02%  2.37%  2.15%  2.88%  2.40%  2.75%  3.76%    
Same-currency basis swaps (3)
  103                                 
Notional amount     $152,849  $13,449  $49,509  $31,503  $21,085  $11,431  $25,872     
Foreign exchange basis swaps(2, 4, 5)
  4,830                                 
Notional amount      235,164   21,936   39,365   46,380   41,003   23,430   63,050     
Option products (6)
  (120)                                
Notional amount (8)
      6,572   (1,180)  2,092   2,390   603   311   2,356     
Foreign exchange contracts(2, 5, 7)
  4,272                                 
Notional amount (8)
      109,544   59,508   5,427   10,048   13,035   2,372   19,154     
Futures and forward rate contracts  (21)                                
Notional amount (8)
      (280)  (280)                   
                                     
Net ALM contracts
 $12,601                                 


     December 31, 2009    
     Expected Maturity  Average
 
  Fair
    Estimated
 
(Dollars in millions, average estimated duration in years) Value  Total  2010  2011  2012  2013  2014  Thereafter  Duration 
Receive fixed interest rate swaps(1, 2)
 $4,047                               4.34 
Notional amount     $110,597  $15,212  $8  $35,454  $7,333  $8,247  $44,343     
Weighted-average fixed-rate      3.65%  1.61%  1.00%  2.42%  4.06%  3.48%  5.29%    
Pay fixed interest rate swaps(1, 2)
  1,175                               4.18 
Notional amount     $104,445  $2,500  $50,810  $14,688  $806  $3,729  $31,912     
Weighted-average fixed-rate      2.83%  1.82%  2.37%  2.24%  3.77%  2.61%  3.92%    
Same-currency basis swaps(3)
  107                                 
Notional amount     $42,881  $4,549  $8,593  $11,934  $5,591  $5,546  $6,668     
Foreign exchange basis swaps(2, 4, 5)
  4,633                                 
Notional amount      122,807   7,958   10,968   19,862   18,322   31,853   33,844     
Option products(6)
  174                                 
Notional amount(8)
      6,540   656   2,031   1,742   244   603   1,264     
Foreign exchange contracts(2, 5, 7)
  2,144                                 
Notional amount(8)
      103,726   63,158   3,491   3,977   6,795   10,585   15,720     
Futures and forward rate contracts  (8)                                
Notional amount(8)
      10,559   10,559                    
                                     
Net ALM contracts
 $12,272                                 
                                     
(1)

At December 31, 2010 and 2009, the receive fixedreceive-fixed interest rate swap notional amounts that represented forward starting swaps and will not be effective until their respective contractual start dates waswere $1.7 billion and $2.5 billion, and the forward starting pay fixedpay-fixed swap positions waswere $34.5 billion and $76.8 billion. At December 31, 2008, there were no forward starting pay or receive fixed swap positions.

(2)

Does not include basis adjustments on either fixed-rate debt issued by the Corporation andor AFS debt securities which are hedged underin fair value hedges pursuant tohedge relationships using derivatives designated as hedging instruments that substantially offset the fair values of these derivatives.

(3)

At December 31, 2010 and 2009, same-currency basis swaps consist of $152.8 billion and $42.9 billion in both foreign currency and U.S. dollar-denominated basis swaps in which both sides of the swap are in the same currency. There were no same-currency basis swaps at December 31, 2008.

(4)

Foreign exchange basis swaps consistconsisted of cross-currency variable interest rate swaps used separately or in conjunction with receive fixedreceive-fixed interest rate swaps.

(5)

Does not include foreign currency translation adjustments on certain foreignnon-U.S. debt issued by the Corporation which substantially offset the fair values of these derivatives.

(6)

Option products of $6.6 billion at December 31, 2010 are comprised of $160 million in purchased caps/floors, $8.2 billion in swaptions and $(1.8) billion in foreign exchange options. Option products of $6.5 billion at December 31, 2009 wereare comprised of $177 million in purchased capscaps/floors and $6.3 billion in swaptions. Option products of $5.0 billion at December 31, 2008 are comprised completely of purchased caps.

(7)

Foreign exchange contracts include foreign currency-denominated and cross-currency receive fixedreceive-fixed interest rate swaps as well as foreign currency forward rate contracts. Total notional amount was comprised of $57.6 billion in foreign currency-denominated and cross-currency receive-fixed swaps and $52.0 billion in foreign currency forward rate contracts at December 31, 2010, and $46.0 billion in foreign currency-denominated and cross-currency receive fixedreceive-fixed swaps and $57.7 billion in foreign currency forward rate contracts at December 31, 2009, and $23.1 billion in foreign currency-denominated and cross-currency receive fixed swaps and $78 million in foreign currency forward rate contracts at December 31, 2008.

2009.
(8)

Reflects the net of long and short positions.

Bank of America 200985


We use interest rate derivative instruments to hedge the variability in the cash flows of our assets and liabilities, including certain compensation costs and other forecasted transactions (cash flow hedges). From time(collectively referred to time, we also utilize equity-indexed derivatives accounted for as derivatives designated as cash flow hedges to minimize exposure to price fluctuations on the forecasted purchase or sale of certain equity investments.hedges). The net losses on both open and terminated derivative instruments recorded in accumulated OCI,net-of-tax, were $2.5$3.2 billion and $3.5$2.5 billion at December 31, 20092010 and 2008.2009. These net losses are expected to be reclassified into earnings in the same period whenas the hedged cash flows affect earnings and will decrease income or increase expense on the respective

hedged cash flows. Assuming no change in open cash flow derivative hedge positions and no changes to prices or interest rates beyond what is implied in forward yield curves at December 31, 2009,2010 the pre-tax net losses are expected to be reclassified into earnings as follows: $937 million,$1.8 billion, or 2335 percent within the next year, 6680 percent within five years, and 8892 percent within 10 years, with the remaining 12eight percent thereafter. For more information on derivatives designated as cash flow hedges, seeNote 4 – Derivativesto the Consolidated Financial Statements.


Bank of America 2010     105

In addition to the derivatives disclosed in Table 46 we


We hedge our net investment in consolidated foreignnon-U.S. operations determined to have functional currencies other than the U.S. dollar using forward foreign exchange contracts that typically settle in 90less than 180 days, cross currencycross-currency basis swaps, foreign exchange options and by issuing foreign currency-denominated debt. We recorded after-tax losses fromon derivatives and foreign currency-denominated debt in accumulated OCI associated with net investment hedges which waswere offset by after-tax unrealized gains in accumulated OCI associated for changes in the value ofon our net investments in consolidated foreignnon-U.S. entities at December 31, 2009.

2010.

Mortgage Banking Risk Management

We originate, fund and service mortgage loans, which subject us to credit, liquidity and interest rate risks, among others. We determine whether loans will be held for investment or held for saleheld-for-sale at the time of commitment and manage credit and liquidity risks by selling or securitizing a portion of the loans we originate.

Interest rate risk and market risk can be substantial in the mortgage business. Fluctuations in interest rates drive consumer demand for new mortgages and the level of refinancing activity, which in turn, affects total origination and service fee income. Typically, a decline in mortgage interest rates will lead to an increase in mortgage originations and fees and a decrease in the value of the MSRs driven by higher prepayment expectations. Hedging the various sources of interest rate risk in mortgage banking is a complex process that requires complex modeling and ongoing monitoring. IRLCs and the related residential first mortgage LHFS are subject to interest rate risk between the date of the IRLC and the date the loans are sold to the secondary market. To hedge interest rate risk, we utilize forward loan sale commitments and other derivative instruments including purchased options. These instruments are used as economic hedges of IRLCs and residential first mortgage LHFS. At December 31, 20092010 and 2008,2009, the notional amount of derivatives economically hedging the IRLCs and residential first mortgage LHFS was $161.4$129.0 billion and $97.2$161.4 billion.

MSRs are nonfinancial assets created when the underlying mortgage loan is sold to investors and we retain the right to service the loan. We use certain derivatives such as interest rate options, interest rate swaps, forward settlement contracts, euro dollarEurodollar futures, as well as mortgage-backed and U.S. Treasury securities as economic hedges of MSRs. The notional amounts of the derivative contracts and other securities designated as economic hedges of MSRs at December 31, 20092010 were $1.3$1.6 trillion and $67.6 billion, for a total notional amount of $1.4 trillion.$60.3 billion. At

December 31, 2008,2009, the notional amounts of the derivative contracts and other securities designated as economic hedges of MSRs were $1.0$1.3 trillion and $87.5 billion, for a total notional amount of $1.1 trillion.$67.6 billion. In 2009,2010, we recorded lossesgains in mortgage banking income of $3.8$5.0 billion related to the change in fair value of these economic hedges as compared to gainslosses of $8.6$3.8 billion for 2008.2009. For additional information on MSRs, seeNote 2225 – Mortgage Servicing Rightsto the Consolidated Financial Statements and for more information on mortgage banking income, see theHome Loans & Insurance discussion beginning on page 31.

41.

Compliance Risk Management

Compliance risk is the risk posed by the failure to manage regulatory, legal and ethical issues that could result in monetary damages, losses or harm to our reputation or image. The Seven Elements of a Compliance Program® provides the framework for the compliance programs that are consistently applied across the enterpriseCorporation to manage compliance risk. This framework includes a common approach to commitment and accountability, policies and procedures, controls and supervision, monitoring and testing, regulatory change management, education and awareness, and reporting.

We approach compliance risk management on an enterprise and line of business level. The Operational and Compliance Risk Committee, which is asub-committee of the Operational Risk Committee, provides oversight of significant compliance risk issues. Within Global Risk Management, Global

Compliance Risk Management develops and guidesimplements the strategies, policies and practices for assessing and managing compliance risks across the organization. Through education and communication efforts, a culture of compliance is emphasized across the organization. We also mitigate compliance risk through a broad-based approach to process management and improvement.

The lines of business are responsible for all the risks within the business line, including compliance risks. Compliance Riskrisk executives working in conjunction with senior line ofmonitor and test business executives, have developed key tools to addressprocesses for compliance and measure complianceescalate risks and to ensure compliance with laws and regulations in each line of business.

issues needing resolution.

Operational Risk Management

Operational

The Corporation defines operational risk isas the risk of loss resulting from inadequate or failed internal processes, people and systems or from external events. Operational risk may occur anywhere in the Corporation, not solely in operations functions, and its effects may extend beyond financial losses. Operational risk includes legal risk. Successful operational risk management is particularly important to diversified financial services companies because of the nature, volume and complexity of the financial services business. Global banking guidelines and country-specific requirements for managing operational risk were established in a set of rules known as Basel II. Basel II requires banks have internal operational risk management processes to assess and measure operational risk exposure and to set aside appropriate capital to address those exposures.
Under the Basel II Rules, an operational loss event is an event that results in a loss and is associated with any of the following seven operational loss event categories: internal fraud; external fraud; employment practices and workplace safety; clients, products and business practices; damage to physical assets; business disruption and system failures; and execution, delivery and process management. Losses in these categories are captured and mapped to four overall risk categories: people, process, systems and external events. Specific examples of loss events include robberies, internalcredit card fraud, processing errors and physical losses from natural disasters.

We approach operational risk management from two perspectives: (1) at the enterprise level and (2) at the line of business. business and enterprise control function levels. The enterprise level refers to risk across all of the Corporation. The line of business level includes risk in all of the revenue producing businesses. Enterprise control functions refer to the business units that support the Corporation’s business operations.
The Operational Risk Committee whichoversees and approves the Corporation’s policies and processes to assure sound operational and compliance risk management and serves as an escalation point for critical operational risk and compliance matters within the Corporation. The Operational Risk Committee reports to the AuditEnterprise Risk Committee of the Board is responsible forregarding operational risk policies, measurement and management, and control processes.activities. Within the Global Risk Management Globalorganization, the Corporate Operational Risk Managementteam develops and guides the strategies, policies, practices, controls and monitoring tools for assessing and managing operational risks across the organization.organization as well reporting results to governance committees and the Board.
The lines of business and enterprise control functions are responsible for all the risks within the business line, including operational risks. In addition to enterprise risk management tools like loss reporting, scenario analysis and risk and control self-assessments, operational risk executives, working in conjunction with senior line of business executives, have developed key tools to help identify, measure, mitigate and monitor risk in each line of business and enterprise control function. Examples of these include personnel management practices, data reconciliation processes, fraud management units, transaction processing monitoring and analysis, business recovery planning and new product introduction processes. The lines of business and enterprise control functions are also responsible for consistently implementing and monitoring adherence to corporate practices. Line of business and enterprise control function management uses the enterprise risk and control self-assessment process to identify and evaluate the status of risk and control


106     Bank of America 2010


issues, including mitigation plans, as appropriate. The goal of this process is to assess changing market and business conditions, to evaluate key risks impacting each line of business and enterprise control function and assess the controls in place to mitigate the risks. The risk and control self assessment process is documented at periodic intervals. Key operational risk indicators for these risks have been developed and are used to help identify trends and issues on an enterprise, line of business and enterprise control function level.
The enterprise control functions participate in two ways to the operational risk management process. First, these organizations manage risk in their functional department. Second, they provide specialized risk management services within their area of expertise to the enterprise and the lines of business and other enterprise control functions they support. For selected risks, we use specialized support groups, such asexample, the Enterprise Information Management and Supply Chain Management to


86Bank of America 2009


organizations in the Technology and Operations enterprise control function, develop risk management practices, such as an information security program and a supplier program to ensure that suppliers adopt appropriate policies and procedures when performing work on our behalf. These specialized groups also assist the lines of business in the development and implementation of risk management practices specific to the needs of the individual businesses.programs. These groups also work with line of business executives and risk executives to develop and guide appropriate strategies, policies, practices, controls and monitoring tools for each line of business.

business and enterprise control function relative to these programs.

Additionally, where appropriate, we purchase insurance policies are purchased to mitigate the impact of operational losses when and if they occur. These insurance policies are explicitly incorporated in the structural features of our operational risk evaluation. As insurance recoveries, especially given recent market events, are subject to legal and financial uncertainty, the inclusion of these insurance policies are subject to reductions in thetheir expected mitigating benefits expected within our operational risk evaluation.

The lines of business are responsible for all the risks within the business line, including operational risks. Operational risk executives, working in conjunction with senior line of business executives, have developed key tools to help identify, measure, mitigate and monitor risk in each line of business. Examples of these include personnel management practices, data reconciliation processes, fraud management units, transaction processing monitoring and analysis, business recovery planning and new product introduction processes. In addition, the lines of business are responsible for monitoring adherence to corporate practices. Line of business management uses a self-assessment process, which helps to identify and evaluate the status of risk and control issues, including mitigation plans, as appropriate. The goal of the self-assessment process is to periodically assess changing market and business conditions, to evaluate key risks impacting each line of business and assess the controls in place to mitigate the risks. In addition to information gathered from the self-assessment process, key operational risk indicators have been developed and are used to help identify trends and issues on both an enterprise and a line of business level.

benefits.

ASF Framework

In December 2007, the American Securitization Forum (ASF) issued the Streamlined Foreclosure and Loss Avoidance Framework for Securitized Adjustable Rate Mortgage Loans (the ASF Framework). The ASF Framework was developed to address a large number of subprime loans that are at risk of default when the loans reset from their initial fixed interest rates to variable rates. The objective of the framework is to provide uniform guidelines for evaluating a large number of loans for refinancing in an efficient manner while complying with the relevant tax regulations and off-balance sheet accounting standards for loan securitizations. The ASF Framework targets loans that were originated between January 1, 2005 and July 31, 2007, have an initial fixed interest rate period of 36 months or less and which are scheduled for their first interest rate reset between January 1, 2008 and July 31, 2010.

The ASF Framework categorizes the targeted loans into three segments. Segment 1 includes loans where the borrower is likely to be able to refinance into any available mortgage product. Segment 2 includes loans where the borrower is current but is unlikely to be able to refinance into any readily available mortgage product. Segment 3 includes loans where the borrower is not current. If certain criteria are met, ASF Framework loans in Segment 2 are eligible for fast-track modification under which the interest rate will be kept at the existing initial rate, generally for five years following the interest rate reset date. Upon evaluation, if targeted loans do not meet specific criteria to be eligible for one of the three segments, they are categorized as other loans, as shown in the table below. These criteria include the occupancy status of the borrower, structure and other terms of the loan. In January 2008, the SEC’s Office of the Chief Accountant issued a letter addressing the accounting issues relating to the ASF Framework. The letter concluded that the SEC would not object to continuing off-balance sheet accounting treatment for Segment 2 loans modified pursuant to the ASF Framework.

For those current loans that are accounted for off-balance sheet that are modified, but not as part of the ASF Framework, the servicer must perform on an individual basis, an analysis of the borrower and the loan to demonstrate it is probable that the borrower will not meet the repayment obligation in the near term. Such analysis provides sufficient evidence to demonstrate that the loan is in imminent or reasonably foreseeable default. The SEC’s Office of the Chief Accountant issued a letter in July 2007 stating that it would not object to continuing off-balance sheet accounting treatment for these loans.

Prior to the acquisition of Countrywide on July 1, 2008, Countrywide began making fast-track loan modifications under Segment 2 of the ASF Framework in June 2008 and the off-balance sheet accounting treatment of QSPEs that hold those loans was not affected. In addition, other workout activities relating to subprime ARMs including modifications (e.g., interest rate reductions and capitalization of interest) and repayment plans were also made. These initiatives have continued subsequent to the acquisition in an effort to work with all of our customers that are eligible and affected by loans that meet the requisite criteria. These foreclosure prevention efforts will reduce foreclosures and the related losses providing a solution for customers and protecting investors.

As of December 31, 2009, the principal balance of beneficial interests issued by the QSPEs that hold subprime ARMs totaled $70.5 billion and the fair value of beneficial interests related to those QSPEs held by the Corporation totaled $9 million. The following table presents a summary of loans in QSPEs that hold subprime ARMs as of December 31, 2009 as well as workout and other activity for the subprime loans by ASF categorization for 2009. Prior to the acquisition of Countrywide on July 1, 2008, we did not originate or service significant subprime residential mortgage loans, nor did we hold a significant amount of beneficial interests in QSPEs of subprime residential mortgage loans.


Table 47  QSPE Loans Subject to ASF Framework Evaluation(1)

  December 31, 2009    Activity During the Year Ended December 31, 2009
(Dollars in millions) Balance    Percent of
Total
     Payoffs    

Fast-track

Modifications

    Other
Workout
Activities
    Foreclosures

Segment 1

 $4,875    6.9  $443    $    $675    $78

Segment 2

  8,114    11.5     142     27     1,368     155

Segment 3

  17,817    25.3      489     6     3,413     3,150

Total subprime ARMs

  30,806    43.7     1,074     33     5,456     3,383

Other loans

  37,891    53.7     1,228     174     4,355     2,126

Foreclosed properties

  1,838    2.6      n/a     n/a     n/a     n/a

Total

 $70,535    100.0   $2,302    $207    $9,811    $5,509
(1)

Represents loans that were acquired with the acquisitions of Countrywide on July 1, 2008 and Merrill Lynch on January 1, 2009 that meet the requirements of the ASF Framework.

n/a = not applicable

Bank of America 200987


Complex Accounting Estimates

Our significant accounting principles, as described inNote 1 – Summary of Significant Accounting Principlesto the Consolidated Financial Statements are essential in understanding the MD&A. Many of our significant accounting principles require complex judgments to estimate the values of assets and liabilities. We have procedures and processes in place to facilitate making these judgments.

The more judgmental estimates are summarized below.in the following discussion. We have identified and described the development of the variables most important in the estimation processes that, with the exception of accrued taxes, involve mathematical models to derive the estimates. In many cases, there are numerous alternative judgments that could be used in the process of determining the inputs to the models. Where alternatives exist, we have used the factors that we believe represent the most reasonable value in developing the inputs. Actual performance that differs from our estimates of the key variables could impact net income. Separate from the possible future impact to net income from input and model variables, the value of our lending portfolio and market sensitive assets and liabilities may change subsequent to the balance sheet date, often significantly, due to the nature and magnitude of future credit and market conditions. Such credit and market conditions may change quickly and in unforeseen ways and the resulting volatility could have a significant, negative effect on future operating results. These fluctuations would not be indicative of deficiencies in our models or inputs.

Allowance for Credit Losses

The allowance for credit losses, which includes the allowance for loan and lease losses and the reserve for unfunded lending commitments, represents management’s estimate of probable losses inherent in the Corporation’s lending activitiesloan portfolio excluding those loans accounted for under the fair value option. Changes to the allowance for credit losses are reported in the Consolidated Statement of Income in the provision for credit losses. Our process for determining the allowance for credit losses is discussed in the Credit Risk Management section beginning on page 54 andNote 1 – Summary of Significant Accounting Principlesto the Consolidated Financial Statements.

We evaluate our allowance at the portfolio segment level and our portfolio segments are home loans, credit card and other consumer, and commercial. Due to the variability in the drivers of the assumptions used in this process, estimates of the portfolio’s inherent risks and overall collectability change with changes in the economy, individual industries, countries, and borrowers’ or counterparties’ ability and willingness to repay their obligations. The degree to which any particular assumption affects the allowance for credit losses depends on the severity of the change and its relationship to the other assumptions.

Key judgments used in determining the allowance for credit losses include: (i)include risk ratings for pools of commercial loans and leases, (ii) market and collateral values and discount rates for individually evaluated loans, (iii) product type classifications for consumer and commercial loans and leases, (iv) loss rates used for consumer and commercial loans and leases, (v) adjustments made to address current events and conditions, (vi) considerations regarding domestic and global economic uncertainty, and (vii) overall credit conditions.

Our estimate for the allowance for loan and lease losses is sensitive to the risk ratings assigned to commercialloss rates and expected cash flows from our home loans, and leases. Assuming a downgrade ofcredit card and other consumer portfolio segments. For each one level in the internal risk rating for commercial loans and leases, except loans and leases already risk-rated Doubtful as defined by regulatory authorities, the allowance for loan and lease losses wouldpercent increase by approximately $4.9 billion at December 31, 2009. The allowance for loan and lease losses as a percentage of total loans and leases at December 31, 2009 was 4.16 percent and this hypothetical increase in the allowance would raise the ratio to approximately 4.70 percent. Our allowance for loan and lease losses is also sensitive to the loss rates used for the consumer and commercial portfolios. A 10 percent increase

in the loss rates used on loans collectively evaluated for impairment in our home loans portfolio segment excluding PCI loans, coupled with a one percent decrease in the consumer and commercial loan and lease portfolios covered by the allowance would increasediscounted cash flows on those loans individually evaluated for impairment within this portfolio segment, the allowance for loan and lease losses at December 31, 20092010 would have increased by approximately $2.9 billion of which $2.6 billion would relate to consumer and $266 million to commercial.

Purchased impaired$141 million. PCI loans within our home loans portfolio segment are initially recorded at fair value. Applicable accounting guidance prohibits carry-over or creation of valuation allowances in the initial accounting. However, subsequent decreases in the expected principal cash flows from the date of acquisition result in a charge to the provision for credit losses and a corresponding increase to the allowance for loan and lease losses. Our purchased impairedWe subject our PCI portfolio is also subjected to stress scenarios to evaluate the potential impact given certain events. A one percent decrease in the expected principal cash flows could result in approximately a $200$297 million impairment of the portfolio, of which approximately $100$138 million would relatebe related to our discontinued real estate portfolio.

For each one percent increase in the loss rates on loans collectively evaluated for impairment within our credit card and other consumer portfolio segment coupled with a one percent decrease in the expected cash flows on those loans individually evaluated for impairment within this portfolio segment, the allowance for loan and lease losses at December 31, 2010 would have increased by $152 million.

Our allowance for loan and lease losses is sensitive to the risk ratings assigned to loans and leases within our Commercial portfolio segment. Assuming a downgrade of one level in the internal risk ratings for commercial loans and leases, except loans and leases already risk-rated Doubtful as defined by regulatory authorities, the allowance for loan and lease losses would have increased by $6.7 billion at December 31, 2010. The allowance for loan and lease losses as a percentage of total loans and leases at December 31, 2010 was 4.47 percent and this hypothetical increase in the allowance would raise the ratio to 5.19 percent.
These sensitivity analyses do not represent management’s expectations of the deterioration in risk ratings or the increases in loss rates but are provided as hypothetical scenarios to assess the sensitivity of the allowance for loan and lease losses to changes in key inputs. We believe the risk ratings and loss severities currently in use are appropriate and that the probability of a downgrade of one level of the internal risk ratings for commercial loans and leasesalternative scenarios outlined above occurring within a short period of time is remote.

The process of determining the level of the allowance for credit losses requires a high degree of judgment. It is possible that others, given the same information, may at any point in time reach different reasonable conclusions.


Bank of America 2010     107


Mortgage Servicing Rights

MSRs are nonfinancial assets that are created when a mortgage loan is sold and we retain the right to service the loan. We account for consumer MSRs at fair value with changes in fair value recorded in the Consolidated Statement of Income in mortgage banking income. Commercial-related and residential reverse mortgage MSRs are accounted for using the amortization method (i.e., lower of cost or market) with impairment recognized as a reduction of mortgage banking income. At December 31, 2009,2010, our total MSR balance was $19.8$15.2 billion.

We determine the fair value of our consumer MSRs using a valuation model that calculates the present value of estimated future net servicing income. The model incorporates key economic assumptions including estimates of prepayment rates and resultant weighted averageweighted-average lives of the MSRs, and the option-adjusted spread (OAS) levels. These variables can, and generally do change from quarter to quarter as market conditions and projected interest rates change. These assumptions are subjective in nature and changes in these assumptions could materially affect our net income.operating results. For example, decreasing the prepayment rate assumption used in the valuation of our consumer MSRs by 10 percent while keeping all other assumptions unchanged could have resulted in an estimated increase of $895$907 million in mortgage banking income at December 31, 2009.

2010. This impact provided above does not reflect any hedge strategies that may be undertaken to mitigate such risk.

We manage potential changes in the fair value of MSRs through a comprehensive risk management program. The intent is to mitigate the effects of changes in the fair value of MSRs through the use of risk management instruments. To reduce the sensitivity of earnings to interest rate and market value fluctuations, securities as well as certain derivatives such as options and interest rate swaps may be used as economic hedges of the MSRs, but are not designated as accounting hedges. These instruments are carried at fair value with changes in fair value recognized in mortgage banking income. The impact provided above does not reflect any hedge strategies that may be undertaken to mitigate such risk.

For more information, see Mortgage Banking Risk Management on page 106.

88Bank of America 2009


For additional information on MSRs, including the sensitivity of weighted averageweighted-average lives and the fair value of MSRs to changes in modeled assumptions, seeNote 2225 – Mortgage Servicing Rights to the Consolidated Financial Statements.

Also, for information on the impact of the time to complete foreclosure sales on the value of MSRs, see Recent Events — Certain Servicing-related Issues beginning on page 34.

Fair Value of Financial Instruments

We determine the fair values of financial instruments based on the fair value hierarchy under applicable accounting guidance which requires an entity to maximize the use of observable inputs and minimize the use of unobservable inputs when measuring fair value. Applicable accounting guidance establishes three levels of inputs used to measure fair value. We carry trading account assets and liabilities, derivative assets and liabilities, AFS debt and marketable equity securities, certain MSRs and certain other assets at fair value. Also, we account for certain corporate loans and loan commitments, LHFS, commercial paper and other short-term borrowings, securities financing agreements, asset-backed secured financings, long-term deposits and long-term debt under the fair value option. For more information, seeNote 2022 – Fair Value MeasurementsandNote 23 – Fair Value Optionto the Consolidated Financial Statements.

The fair values of assets and liabilities include adjustments for market liquidity, credit quality and other deal specific factors, where appropriate. Valuations of products using models or other techniques are sensitive to assumptions used for the significant inputs. Where market data is available, the inputs used for valuation reflect that information as of our valuation date. Inputs to valuation models are considered unobservable if they are supported by little or no market activity. In periods of extreme volatility, lessened liquidity

or in illiquid markets, there may be more variability in market pricing or a lack of market data to use in the valuation process. To ensureIn keeping with the prudent application of estimates and management judgment in determining the fair value of assets and liabilities, we have in place various processes and controls that include: a model validation policy that requires review and approval of quantitative models used for deal pricing;pricing, financial statement fair value determination and risk quantification; a trading product valuation policy that requires verification of all traded product valuations; and a periodic review and substantiation of daily profit and loss reporting for all traded products. Primarily through validation controls, we utilize both broker and pricing service inputs which can and do include both market-observable and internally-modeled valuesand/or value valuation inputs. Our reliance on this information is tempered by the knowledge of how the brokerand/or pricing service develops its data with a higher degree of reliance applied to those that are more directly observable and lesser reliance applied to those developed through their own internal modeling. Similarly, broker quotes that are executable are given a higher level of reliance than indicative broker quotes, which are not executable. These processes and controls are performed independently of the business.

Trading account assets and liabilities are carried at fair value based primarily on actively traded markets where prices are from either direct market quotes or observed transactions. Liquidity is a significant factor in the determination of the fair value of trading account assets and liabilities. Market price quotes may not be readily available for some positions, or positions within a market sector where trading activity has slowed significantly or ceased. Situations of illiquidity generally are triggered by market perception of credit uncertainty regarding a single company or a specific market sector. In these instances, fair value is determined based on limited available market information and other factors, principally from reviewing the issuer’s financial statements and changes in credit ratings made by one or more of the ratings agencies.

Trading account profits (losses), which represent the net amount earned from our trading positions, can be volatile and are largely driven by general market conditions and customer demand. Trading account

profits (losses) are dependent on the volume and type of transactions, the level of risk assumed, and the volatility of price and rate movements at any given time within the ever-changing market environment. To evaluate risk in our trading activities, we focus on the actual and potential volatility of individual positions as well as portfolios. At a portfolio and corporate level, we use trading limits, stress testing and tools such as VARVaR modeling, which estimates a potential daily loss that we do not expect to exceed with a specified confidence level, to measure and manage market risk. For more information on VAR,VaR, see Trading Risk Management beginning on page 80.

100.

The fair values of derivative assets and liabilities traded in the over-the-counterOTC market are determined using quantitative models that require the use of multiple market inputs including interest rates, prices and indices to generate continuous yield or pricing curves and volatility factors, which are used to value the positions. The majority of market inputs are actively quoted and can be validated through external sources including brokers, market transactions and third-party pricing services. Estimation risk is greater for derivative asset and liability positions that are either option-based or have longer maturity dates where observable market inputs are less readily available or are unobservable, in which case quantitative-based extrapolations of rate, price or index scenarios are used in determining fair values. The Corporation incorporates within its fair value measurements of over-the-counterOTC derivatives the net credit differential between the counterparty credit risk and our own credit risk. The value of the credit differential is determined by reference to existing direct market reference costs of credit, or where direct references are not available, a proxy is applied consistent with direct references for other counterparties that are similar in credit risk. An estimate of severity of loss is also used in the


108     Bank of America 2010


determination of fair value, primarily based on historical experience adjusted for any more recent name specific expectations.

Level 3 Assets and Liabilities

Financial assets and liabilities whose values are based on prices or valuation techniques that require inputs that are both unobservable and are significant to the overall fair value measurement are classified as Level 3 under the fair value hierarchy established in applicable accounting guidance. The Level 3 financial assets and liabilities include private equity investments, consumer MSRs, ABS, highly structured, complex or long-dated derivative contracts, structured notes and certain CDOs, for which there is not an active market for

identical assets from which to determine fair value or where sufficient, current market information about similar assets to use as observable, corroborated data for all significant inputs into a valuation model areis not available. In these cases, the fair values of these Level 3 financial assets and liabilities are determined using pricing models, discounted cash flow methodologies, a net asset value approach for certain structured securities, or similar techniques for which the determination of fair value requires significant management judgment or estimation. In 2009,2010, there were no changes to the quantitative models, or uses of such models, that resulted in a material adjustment to the Consolidated Statement of Income.


Table 56Level 3 assets, before the impact of counterparty netting related to our derivative positions, were $103.6 billionAsset and $59.4 billion at December 31, 2009 and 2008 and represented approximately 14 percent and 10 percent of assets measured at fair value (or five percent and three percent of total assets). Level 3 liabilities, before the impact of counterparty netting related to our derivative positions, were $21.8 billion and $8.0 billion as of December 31, 2009 and 2008 and represented approximately 10 percent and nine percent of the liabilities measured at fair value (or approximately one percent of total liabilities). At December 31, 2009, $21.1 billion, or 12 percent, of trading account assets were

Liability Summary

                         
  December 31, 2010  December 31, 2009 
     As a %
        As a %
    
     of Total
  As a %
     of Total
  As a %
 
  Level 3
  Level 3
  of Total
  Level 3
  Level 3
  of Total
 
(Dollars in millions) Fair Value  Assets  Assets  Fair Value  Assets  Assets 
Trading account assets $15,525   19.56%  0.69% $21,077   20.34%  0.95%
Derivative assets  18,773   23.65   0.83   23,048   22.24   1.03 
Available-for-sale securities
  15,873   19.99   0.70   20,346   19.63   0.91 
All other Level 3 assets at fair value  29,217   36.80   1.29   39,164   37.79   1.76 
                         
Total Level 3 assets at fair value (1)
 $79,388   100.00%  3.51% $103,635   100.00%  4.65%


     As a %
        As a %
    
     of Total
  As a %
     of Total
  As a %
 
  Level 3
  Level 3
  of Total
  Level 3
  Level 3
  of Total
 
  Fair Value  Liabilities  Liabilities  Fair Value  Liabilities  Liabilities 
Trading account liabilities $7   0.05%    $396   1.81%  0.02%
Derivative liabilities  11,028   70.90   0.54%  15,185   69.53   0.76 
Long-term debt  2,986   19.20   0.15   4,660   21.34   0.23 
All other Level 3 liabilities at fair value  1,534   9.85   0.07   1,598   7.32   0.08 
                         
Total Level 3 liabilities at fair value(1)
 $15,555   100.00%  0.76% $21,839   100.00%  1.09%
                         
Bank(1)Level 3 total assets and liabilities are shown before the impact of America 200989counterparty netting related to our derivative positions.


classified as Level 3 assets, and $396 million or less than one percent of trading account liabilities were classified as Level 3 liabilities. At December 31, 2009, $23.0 billion, or 29 percent, of derivative assets were classified as Level 3 assets, and $15.2 billion and 35 percent of derivative liabilities were classified as Level 3 liabilities. SeeNote 20 – Fair Value Measurementsto the Consolidated Financial Statements for a tabular presentation of the fair values of Level 1, 2 and 3 assets and liabilities at December 31, 2009 and 2008 and detail of Level 3 activity for the years ended December 31, 2009, 2008 and 2007.

In 2009,

During 2010, we recognized net gains of $10.6$7.1 billion on Level 3 assets and liabilities which were primarily gains on net derivatives and consumer MSRsdriven by income earned on IRLCs, which are considered derivative instruments related to the origination of mortgage loans that areheld-for-sale. These gains were partially offset by changes in the value of MSRs as a result of a decline in interest rates and OTTI losses on long-term debt.non-agency RMBS. We also recorded pre-tax net unrealized gainslosses of $3.3 billion (pre-tax)$193 million in accumulated OCI on Level 3 assets and liabilities during the year, which were driven2010, primarily by improved market-observability as liquidity returned to the market related to non-agency MBS. The gains in net derivatives were driven by high origination volumes of held-for-sale mortgage loans and by positive valuation adjustments on our IRLCs. The increase in the consumer MSR balance benefited from changes in the forward interest rate curve. Losses of $2.3 billion on long-term debt were driven by the impact of market movements and from improved credit spreads on certain Merrill Lynch structured notes.

RMBS.

Level 3 financial instruments, such as our consumer MSRs, may be economically hedged with derivatives not classified as Level 3,3; therefore, gains or losses associated with Level 3 financial instruments may be offset by gains or losses associated with financial instruments classified in other levels of the fair value hierarchy. The gains and losses recorded in earnings did not have a significant impact on our liquidity or capital resources.

A

We conduct a review of our fair value hierarchy classifications is conducted on a quarterly basis. Transfers into or out of Level 3 are made if the significant inputs used in the financial models measuring the fair values of the assets and liabilities became unobservable or observable, respectively, in the current marketplace. These transfers are effective as of the beginning of the quarter. In 2009, several
During 2010, the more significant transfers into Level 3 included $3.2 billion of trading account assets, $3.5 billion of AFS debt securities, $1.1 billion of net derivative contracts and $1.9 billion of long-term debt. Transfers into Level 3 for trading account assets were madedriven by reduced price transparency as a result of lower levels of trading activity for certain municipal auction rate securities and corporate debt securities as well as a change in valuation

methodology for certain ABS to a discounted cash flow model. Transfers into or outLevel 3 for AFS debt securities were due to an increase in the number of non-agency RMBS and other taxable securities priced using a discounted cash flow model. Transfers into Level 3. Long-term debt3 for net derivative contracts were primarily related to a lack of $4.3 billion was transferredprice observability for certain credit default and total return swaps. Transfers in and transfers out of Level 3 for long-term debt are primarily due to changes in the decreased significanceimpact of unobservable inputs on the value of certain equity-linked structured notes. Net derivative assets
During 2010, the more significant transfers out of $5.7 billion were transferred into Level 3 due towere $3.4 billion of trading account assets and $1.8 billion of long-term debt. Transfers out of Level 3 for trading account assets were driven by increased price verification of certain mortgage-backed securities, corporate debt andnon-U.S. government and agency securities. Transfers out of Level 3 for long-term debt are the impactresult of significant unobservable inputsa decrease in the overall valuationsignificance of unobservable pricing inputs for certain derivative products in the marketplace.

equity-linked structured notes.

Global Principal Investments

Global Principal Investments is included withinEquity Investments inAll Otheron page 41.51. Global Principal Investments is comprised of a diversified portfolio of private equity, real estate and other alternative investments in privately-heldboth privately held and publicly-traded companies at all stages of their life cycle.publicly traded companies. These investments are made either directly in a company or held through a fund. Some of these companies may need access to additional cash to support their long-term business models. Market conditions and company performance may impact whether funding is available from private investors or the capital markets.

At December 31, 2009,2010, this portfolio totaled $14.1$11.7 billion including $12.4$9.7 billion of non-public investments. Investments with active market quotes

Certain equity investments in the portfolio are subject to investment-company accounting under applicable accounting guidance, and accordingly,


Bank of America 2010     109


are carried at estimated fair value; however, the majority of our investments do not have publicly available price quotes and, therefore, the fair value is unobservable. Valuation of these investments requires significant management judgment. We initiallywith changes in fair value these investments atreported in equity investment income. Initially the transaction price of the investment is generally considered to be the best indicator of fair value. Thereafter, valuation of direct investments is based on an assessment of each individual investment using methodologies that include publicly traded comparables derived by multiplying a key performance metric (e.g., earnings before interest, taxes, depreciation and adjust valuations when evidence is availableamortization) of the portfolio company by the relevant valuation multiple observed for comparable companies, acquisition comparables, entry-level multiples and discounted cash flows, and are subject to support such adjustments. Such evidence includes transactionsappropriate discounts for lack of liquidity or marketability. Certain factors that may influence changes in similar instruments, market comparables, completed or pending third-party transactions in the underlying investment or comparable entities,fair value include but are not limited to, recapitalizations, subsequent rounds of financing recapitalizations and other transactions acrossofferings in the equity or debt capital structure, and changes in financial ratios or cash flows. Invest - -

ments are carried at estimatedmarkets. For fund investments, we generally record the fair value with changes recorded in equity investment incomeof our proportionate interest in the Consolidated Statement of Income.

fund’s capital as reported by the fund’s respective managers.

Accrued Income Taxes

Accrued income taxes, reported as a component of accrued expenses and other liabilities on our Consolidated Balance Sheet, represents the net amount of current income taxes we expect to pay to or receive from various taxing jurisdictions attributable to our operations to date. We currently file income tax returns in more than 100 jurisdictions and consider many factors, including statutory, judicial and regulatory guidance,in estimating the appropriate accrued income taxes for each jurisdiction.

In applying the applicable accounting guidance, we monitor relevant tax authorities and change our estimate of accrued income taxes due to changes in income tax laws and their interpretation by the courts and regulatory authorities. These revisions of our estimate of accrued income taxes, which also may result from our income tax planning and from the resolution of income tax controversies, may be material to our operating results for any given period.

Goodwill and Intangible Assets

Background
The nature of and accounting for goodwill and intangible assets are discussed in detail inNote 1 – Summary of Significant Accounting PrinciplesandNote 10 – Goodwill and Intangible Assetsto the Consolidated Financial Statements. Goodwill is reviewed for potential impairment at the reporting unit level on an annual basis, which for the Corporation is performed as of June 30 orand in interim periods if events or circumstances indicate a potential impairment. See discussion about the annual impairment test as of June 30, 2010 on page 111. A reporting unit is a business segment or one level below. As reporting units are determined after an acquisition or evolve with changes in business strategy, goodwill is assigned to reporting units and it no longer retains its association with a particular acquisition. All of the revenue streams and related activities of a reporting unit, whether acquired or organic, are available to support the value of the goodwill.

The Corporation’s common stock price, consistent with common stock prices in the financial services industry, has been moreremains volatile over the past 18 months primarily due to the deteriorationcontinued uncertainty in the financial markets in 2008 as well as recent financial reforms including the overall economy moved into a recession, followed in 2009 by stabilization and improvement in some sectors of the economy. During this period, ourFinancial Reform Act. Our market capitalization has remained below our recorded book value.value during 2010. The fair value of all reporting units in aggregate as of the June 30, 20092010 annual impairment test was estimated to be $262.8$264.4 billion and the common stock market capitalization of the Corporation as of that date was $114.2$144.2 billion ($149.6134.5 billion at December 31, 2009, including CES)2010). The implied control premium, orwhich is the amount a buyer iswould be willing to pay over the current market price of a publicly traded stock to obtain control, was 5263 percent after taking into consideration the outstanding preferred stock of $58.7$18.0 billion as of June 30, 2009.2010. As none of our reporting units are publicly traded, individual reporting unit fair value determinations are not directly correlated to the Corporation’s stock price. Although we believe it is reasonable to conclude that market capitalization

could be an indicator of fair value over time, we do not believe that recent fluctuations in our market capitalization as a result of the market dislocationcurrent economic conditions are reflective of actual cash flows and the fair value of our individual reporting units.

Estimating the fair value of reporting units and the assets, liabilities and intangible assets of a reporting unit is a subjective process that involves the use of estimates and judgments, particularly related to cash flows, the appropriate discount rates and an applicable control premium. The fair values of the reporting units were determined using a combination of valuation techniques consistent with the market approach and the income approach and included the use of independent valuation specialists. Measurement of the fair values of the assets, liabilities and intangibles of a reporting unit was consistent with the requirements of the


90Bank of America 2009


fair value measurements accounting guidance and includes the use of estimates and judgments. The fair values of the intangible assets were determined using the income approach.

The market approach we used results in an estimate ofestimates the fair value of the individual reporting units by incorporating any combination of the tangible capital, book capital and earnings multiples from comparable publicly traded companies in industries similar industries to that of the reporting unit. The relative weight assigned to these multiples varies among the reporting units based upon qualitative and quantitative characteristics, primarily the size and relative profitability of the respective reporting unit as compared to the comparable publicly traded companies. Since the fair values determined under the market approach are representative of a noncontrolling interest, a control premium was added to arrive at the reporting units’ estimated fair values of the reporting units on a controlling basis.

For purposes of the income approach, we calculated discounted cash flows were calculated by taking the net present value of estimated cash flows using a combination of historical results, estimated future cash flows and an appropriate terminal value. Our discounted cash flow analysis employs a capital asset pricing model in estimating the discount rate (i.e., cost of equity financing) for each reporting unit. The inputs to this model include the risk-free rate of return;return, beta, which is a measure of the level of non-diversifiable risk associated with comparable companies for each specific reporting unit;unit, market equity risk premium and in certain cases an unsystematic (company-specific) risk factor. The unsystematic risk factor is the input that specifically addresses uncertainty related to our projections of earnings and growth, including the uncertainty related to loss expectations. We utilized discount rates that we believe adequately reflect the risk and uncertainty in the financial markets generally and specifically in our internally developed forecasts. Expected rates of equity returns were estimated based on historical market returns and risk/return rates for similar industries to that of the reporting unit. We use our internal forecasts to estimate future cash flows and actual results may differ from forecasted results.
Global Card Services Impairment
On July 21, 2010, the Financial Reform Act was signed into law. Under the Financial Reform Act and its amendment to the Electronic Fund Transfer Act, the Federal Reserve must adopt rules within nine months of enactment of the Financial Reform Act regarding the interchange fees that may be charged with respect to electronic debit transactions. Those rules will take effect one year after enactment of the Financial Reform Act. The Financial Reform Act and the applicable rules are expected to materially reduce the future revenues generated by the debit card business of the Corporation.
Our consumer and small business card products, including the debit card business, are part of an integrated platform withinGlobal Card Services. During the three months ended September 30, 2010, our estimate of revenue loss due to the debit card interchange fee standards to be adopted under the Financial Reform Act was approximately $2.0 billion annually based on current volumes. Accordingly, we performed an impairment test forGlobal Card Servicesduring the three months ended September 30, 2010. In step one of the impairment test, the fair value ofGlobal Card Serviceswas estimated under the income approach where the significant assumptions included the


110     Bank of America 2010


discount rate, terminal value, expected loss rates and expected new account growth. We also updated our estimated cash flow valuation to reflect the current strategic plan and other portfolio assumptions. Based on the results of step one of the impairment test, we determined that the carrying amount ofGlobal Card Services, including goodwill, exceeded the fair value. The carrying amount, fair value and goodwill of the reporting unit were $39.2 billion, $25.9 billion and $22.3 billion, respectively. Accordingly, we performed step two of the goodwill impairment test for this reporting unit. In step two, we compared the implied fair value of the reporting unit’s goodwill with the carrying amount of that goodwill. Under step two of the impairment test, significant assumptions in measuring the fair value of the assets and liabilities including discount rates, loss rates and interest rates were updated to reflect the current economic conditions. Based on the results of this third-quarter goodwill impairment test forGlobal Card Services, the carrying value of the goodwill assigned to the reporting unit exceeded the implied fair value by $10.4 billion. Accordingly, we recorded a non-cash, non-tax deductible goodwill impairment charge of $10.4 billion to reduce the carrying value of goodwill inGlobal Card Servicesfrom $22.3 billion to $11.9 billion. The goodwill impairment test included limited mitigation actions to recapture lost revenue. Although we have identified other potential mitigation actions withinGlobal Card Services, the impact of these actions going forward did not reduce the goodwill impairment charge because these actions are in the early stages of development and, additionally, certain of them may impact segments other thanGlobal Card Services(e.g., Deposits). The impairment charge had no impact on the Corporation’s reported Tier 1 and tangible equity ratios.
Due to the continued stress onGlobal Card Servicesas a result of the Financial Reform Act, we concluded that an additional impairment analysis should be performed for this reporting unit during the three months ended December 31, 2010. In step one of the goodwill impairment test, the fair value ofGlobal Card Serviceswas estimated under the income approach. The significant assumptions under the income approach included the discount rate, terminal value, expected loss rates and expected new account growth. The carrying amount, fair value and goodwill for theGlobal Card Servicesreporting unit were $27.5 billion, $27.6 billion and $11.9 billion, respectively. The estimated fair value as a percent of the carrying amount at December 31, 2010 was 100 percent. Although fair value exceeded the carrying amount in step one of theGlobal Card Servicesgoodwill impairment test, to further substantiate the value of goodwill, we also performed the step two test for this reporting unit. Under step two of the goodwill impairment test for this reporting unit, significant assumptions in measuring the fair value of the assets and liabilities of the reporting unit including discount rates, loss rates and interest rates were updated to reflect the current economic conditions. The results of step two of the goodwill impairment test indicated that remaining balance of goodwill of $11.9 billion was not impaired as of December 31, 2010.
On December 16, 2010, the Federal Reserve released proposed regulations to implement the Durbin Amendment of the Financial Reform Act, which are scheduled to be effective July 21, 2011. The proposed rule includes two alternative interchange fee standards that would apply to all covered issuers: one based on each issuer’s costs, with a safe harbor initially set at $0.07 per transaction and a cap initially set at $0.12 per transaction; and the other a stand-alone cap initially set at $0.12 per transaction. See Regulatory Matters beginning on page 56 for additional information. Although the range of revenue loss estimate based on the proposed rule was slightly higher than our original estimate of $2.0 billion, given the uncertainty around the potential outcome, we did not change the revenue loss estimate used in the goodwill impairment test during the three months ended December 31, 2010. If the final Federal Reserve rule sets interchange fee standards that are significantly lower than the interchange fee assumptions we used in this goodwill impairment test, we will be required to perform an additional goodwill impairment

test which may result in additional impairment of goodwill inGlobal Card Services.In view of the uncertainty with model inputs including the final ruling, changes in the economic outlook and the corresponding impact to revenues and asset quality, and the impacts of mitigation actions, it is not possible to estimate the amount or range of amounts of additional goodwill impairment, if any.
Home Loans & Insurance Impairment
During the three months ended December 31, 2010, we performed an impairment test for theHome Loans & Insurancereporting unit as it was likely that there was a decline in its fair value as a result of increased uncertainties, including existing and potential litigation exposure and other related risks, higher current servicing costs including loss mitigation efforts, foreclosure related issues and the redeployment of centralized sales resources to address servicing needs. In step one of the goodwill impairment test, the fair value ofHome Loans & Insurancewas estimated based on a combination of the market approach and the income approach. Under the market approach valuation, significant assumptions included market multiples and a control premium. The significant assumptions for the valuation ofHome Loans & Insuranceunder the income approach included cash flow estimates, the discount rate and the terminal value. These assumptions were updated to reflect the current strategic plan forecast and to address the increased uncertainties referenced above. Based on the results of step one of the impairment test,we determined that the carrying amount ofHome Loans & Insurance, including goodwill, exceeded the fair value. The carrying amount, fair value and goodwill for theHome Loans & Insurancereporting unit were $24.7 billion, $15.1 billion and $4.8 billion, respectively. Accordingly, we performed step two of the goodwill impairment test for this reporting unit. In step two, we compared the implied fair value of the reporting unit’s goodwill with the carrying amount of that goodwill. Under step two of the goodwill impairment test, significant assumptions in measuring the fair value of the assets and liabilities of the reporting unit including discount rates, loss rates and interest rates were updated to reflect the current economic conditions. Based on the results of step two of the impairment test, the carrying value of the goodwill assigned toHome Loans & Insuranceexceeded the implied fair value by $2.0 billion. Accordingly, we recorded a non-cash, non-tax deductible goodwill impairment charge of $2.0 billion as of December 31, 2010 to reduce the carrying value of goodwill in theHome Loans & Insurancereporting unit. The impairment charge had no impact on the Corporation’s Tier 1 and tangible equity ratios.
As we obtain additional information relative to our litigation exposure, representations and warranties repurchase obligations, servicing costs and foreclosure related issues, it is possible that such information, if significantly different than the assumptions used in this goodwill impairment test, may result in additional impairment in theHome Loans & Insurancereporting unit.
Annual Impairment Test for 2010
We perform our annual goodwill impairment test for all reporting units as of June 30 each year. In performing the first step of the June 30, 2010 annual impairment analysis,test, we compared the fair value of each reporting unit to its current carrying amount, including goodwill. To determine fair value, we usedutilized a combination of a market approach and an income approach. Under the market approach, we compared earnings and equity multiples of the individual reporting units to multiples of publicpublicly traded companies comparable to the individual reporting units. The control premiums used in the June 30, 20092010 annual impairment test ranged from 25 percent to 35 percent. Under the income approach, we updated our assumptions to reflect the current market environment. The discount rates used in the June 30, 20092010 annual impairment test ranged from 11 percent to 2015 percent depending on the relative risk of a reporting unit. GrowthBecause growth rates developed by management for each reporting unit and/or


Bank of America 2010     111


individual revenue and expense items ranged from two percent to 10 percent. For certain revenue and expense items that have been significantly affected by the current economic environment and financial reform, management developed separate long-term forecasts.

The fair value ofGlobal Card Serviceswas estimated under the income approach which did not include the impact of any potential future changes that would result from the Financial Reform Act because it was not signed into law until the third quarter 2010.

Based on the results of step one of the annual impairment test, we determined that the carrying amount of theHome Loans & InsuranceandGlobal Card Servicesreporting units, including goodwill, exceeded their fair value. The carrying amount, of the reporting unit, fair value of the reporting unit and goodwill for theHome Loans & Insurancereporting unit were $16.5$27.1 billion, $14.3$22.5 billion and $4.8 billion, respectively, and forGlobal Card Serviceswere $41.4$40.1 billion, $41.3$40.1 billion and $22.3 billion, respectively. Because the carrying amount exceeded the fair value, we performed step two of the goodwill impairment test for these reporting units as of June 30, 2009.2010. For all other reporting units, step two was not required as

their fair value exceeded their carrying amount in step one indicating there was no impairment.

In step two for both reporting units, we compared the implied fair value of each reporting unit’s goodwill with the carrying amount of that goodwill. We determined the implied fair value of goodwill for a reporting unit by assigning the fair value of the reporting unit to all of the assets and liabilities of that unit, including any unrecognized intangible assets, as if the reporting unit had been acquired in a business combination. The excess of the fair value of the reporting unit over the amounts assigned to its assets and liabilities is the implied fair value of goodwill. Significant assumptions in measuring the fair value of the assets and liabilities of both reporting units including discount rates, loss rates and interest rates were updated to reflect the current economic conditions. Based on the results of step two of the impairment test as of June 30, 2009,2010, we determined that goodwill was not impaired in theeitherHome Loans & Insurance orGlobal Card Services reporting units..
Representations and Warranties

In estimating

The methodology used to estimate the fair valueliability for representations and warranties is a function of the reporting units in steprepresentations and warranties given and considers a variety of factors, which include depending upon the counterparty, actual defaults, estimated future defaults, historical loss experience, estimated home prices, estimated probability that we will receive a repurchase request, number of payments made by the borrower prior to default and estimated probability that we will be required to repurchase a loan. Changes to any one of these factors could significantly impact the goodwill impairment analysis,estimate of our liability. Representations and warranties provision may vary significantly each period as the methodology used to estimate the expense continues to be refined based on the level and type of repurchase requests presented, defects identified, the latest experience gained on repurchase requests and other relevant facts and circumstances. For those claims where we note thathave established a representations and warranties liability as discussed inNote 9 — Representations and Warranties Obligations and Corporate Guaranteesto the fair values can be sensitive to changesConsolidated Financial Statements, an assumed simultaneous increase or decrease of 10 percent in estimated future defaults, loss severity and the net repurchase rate would result in an increase of approximately $850 million or decrease of approximately $950 million in the projected cash flowsrepresentations and assumptions. In some instances, minor changes in the assumptions could impact whether the fair value of a reporting unit is greater than its carrying amount. Furthermore, a prolonged decrease or increase in a particular assumption could eventually lead to the fair value of a reporting unit being less than its carrying amount. Also, to the extent step two of the goodwill analysis is required, changes in the estimated fair values of the individual assets and liabilities may impact other estimates of fair value for assets or liabilities and result in a different amount of implied goodwill, and ultimately the amount of goodwill impairment, if any.

Given the results of our annual impairment test and due to continued stress onHome Loans & Insuranceand Global Card Services as a result of current market conditions, we concluded that we should perform an additional impairment analysis for these two reporting unitswarranties liability as of December 31, 2009. In step one2010. These sensitivities are hypothetical and are intended to provide an indication of the goodwill impairment analysis,impact of a significant change in these key assumptions on the fair value ofrepresentations and warranties liability. In reality, changes in one assumption may result in changes in other assumptions, which may or may not counteract the sensitivity.

For additional information on representations and warranties, see Representations and Warranties on page 52,Home Loans & InsuranceNote 9 – Representations and Warranties Obligations and Corporate Guarantees was estimated with equal weighting assigned andNote 14 – Commitments and Contingenciesto the market approachConsolidated Financial Statements.

Litigation Reserve
In accordance with applicable accounting guidance, the Corporation establishes an accrued liability for litigation and regulatory matters when those matters present loss contingencies that are both probable and estimable. In such cases, there may be an exposure to loss in excess of any amounts accrued. When a loss contingency is not both probable and estimable, the income approach.Corporation does not establish an accrued liability. As a litigation or regulatory matter develops, the Corporation, in conjunction with any outside counsel handling the matter, evaluates on an ongoing basis whether such matter presents a loss contingency that is both probable and estimable. If, at the time of evaluation, the loss contingency related to a litigation or regulatory matter is not both probable and estimable, the matter will continue to be monitored for further developments that would make such loss contingency both probable and estimable. Once the loss contingency related to a litigation or regulatory matter is deemed to be both probable and estimable, the Corporation will establish an accrued liability with respect to such loss contingency and record a corresponding amount of litigation-related expense. The fair value ofGlobal Card Services was estimated underCorporation will continue to monitor the income approach. Undermatter for further developments that could affect the market approach valuation forHome Loans & Insurance, significant assumptions were consistent with the assumptions used in our annual impairment tests as of June 30, 2009 and included market multiples and a control premium. In theGlobal Card Services valuation under the income approach, the significant assumptions included the discount rate, terminal value, expected loss rates and expected new account growth. Consistent with the June 30, 2009 annual impairment test, the carrying amount exceeded the fair value forHome Loans & Insurancerequiring that we perform step two. AlthoughGlobal Card Services passed step one of the goodwill impairment analysis, to further substantiate the value of the goodwill balance, we also performed the step two analysis for this reporting unit. The carrying amount of the reporting unit, fair valueaccrued liability that has been previously established.
For a limited number of the reporting unitmatters disclosed inNote 14 – Commitments and goodwillContingenciesto the Consolidated Financial Statements forHome Loans & Insurance were $27.3 billion, $20.3 billion which a loss is probable or reasonably possible in future periods, whether in excess of a related accrued liability or where there is no accrued liability, we are able to estimate a range of possible loss. In determining whether it is possible to provide an estimate of loss or range of possible loss, the Corporation reviews and $4.8 billion, respectively,evaluates its material litigation and forGlobal Card Services were $43.4 billion, $47.3 billion and $22.3 billion, respectively. The estimated fair value as a percent ofregulatory matters on an ongoing basis, in conjunction with any outside counsel handling the carrying amount at December 31, 2009 was 74 percent forHome Loans & Insuranceand 109 percent forGlobal Card Services. The increase in the fair value ofGlobal CardServices during the fourth quarter of 2009 was primarily attributable to improvement in market conditions and the economic outlook for the reporting unit. Under step two of the goodwill impairment analysis for both reporting units, significant assumptions in measuring the fair value of the assets and liabilities of the reporting units including discount rates, loss rates, interest rates and new account growth were updatedmatter, in light of potentially relevant factual and legal developments. These may include information learned through the improvementdiscovery process, rulings on dispositive motions, settlement discussions, and other rulings by courts, arbitrators or others. In cases in economic conditions. Based onwhich the resultsCorporation possesses sufficient information to develop an estimate of step twoloss or range of our impairment tests, there was no goodwill impairment aspossible loss, that estimate is aggregated and disclosed inNote 14 – Commitments and Contingenciesto the Consolidated Financial Statements. For other disclosed matters for which a loss is probable or reasonably possible, such an estimate is not possible. Those matters for which an estimate is not possible are not included within this estimated range. Therefore, the estimated range of December 31, 2009.

If economic conditions deteriorate or other events adversely impactpossible loss represents what we believe to be an estimate of possible loss only for certain matters meeting these criteria. It does not represent the business modelsCorporation’s maximum loss exposure. Information is provided inNote 14 – Commitments and Contingenciesto the related assumptions including discount


Bank of America 200991


rates, loss rates, interest ratesConsolidated Financial Statements regarding the nature of all of these contingencies and, new account growth used to value these reporting units, there could be a change inwhere specified, the valuation of our goodwill and intangible assets and may possibly result in the recognition of impairment losses. With any assumption change, when a prolonged change in performance causes the fair valueamount of the reporting unit to fall below the carrying amount of goodwill, goodwill impairment will occur.

claim associated with these loss contingencies.

Consolidation and Accounting for Variable Interest Entities

Under applicable accounting guidance, a VIE is consolidated by the entity that will absorb a majority of the variability created by the assets of the VIE. The calculation of variability is based on an analysis of projected probability-weighted cash flows based on the design of the particular VIE. Scenarios in which expected cash flows are less than or greater than the expected outcomes create expected losses or expected residual returns.

The entity that will absorbhas a majority of expected variability (the sum of the absolute values of the expected losses and expected residual returns) consolidates thecontrolling financial interest in a VIE and is referred to as the primary beneficiary.beneficiary and consolidates the VIE. In accordance with the new consolidation guidance effective January 1, 2010, the Corporation is deemed to have a controlling financial interest and is the primary beneficiary of a VIE if it has both the power to direct the activities of the VIE that most significantly impact the VIE’s economic performance and an obligation to absorb losses or the right to receive benefits that could potentially be significant to the VIE.


112     Bank of America 2010

A variety


Determining whether an entity has a controlling financial interest in a VIE requires significant judgment. An entity must assess the purpose and design of qualitativethe VIE, including explicit and quantitative assumptions are used to estimate projected cash flowsimplicit contractual arrangements, and the relative probabilityentity’s involvement in both the design of each potential outcome,the VIE and toits ongoing activities. The entity must then determine which parties willactivities have the most significant impact on the economic performance of the VIE and whether the entity has the power to direct such activities. For VIEs that hold financial assets, the party that services the assets or makes investment management decisions may have the power to direct the most significant activities of a VIE. Alternatively, a third party that has the unilateral right to replace the servicer or investment manager or to liquidate the VIE may be deemed to be the party with power. If there are no significant ongoing activities, the party that was responsible for the design of the VIE may be deemed to have power. If the entity determines that it has the power to direct the most significant activities of the VIE, then the entity must determine if it has either an obligation to absorb expected losses and expected residual returns. Critical assumptions, whichor the right to receive benefits that could potentially be significant to the VIE. Such economic interests may include projected credit lossesinvestments in debt or equity instruments issued by the VIE, liquidity commitments, and interest rates, are independently verified against market observable data where possible. Where market observable data is not available, the results of the analysis become more subjective.

As certain events occur,explicit and implicit guarantees.

On a quarterly basis, we reconsider which parties will absorb variability andreassess whether we have a controlling financial interest and are the primary beneficiary of a VIE. The quarterly reassessment process considers whether we have acquired or divested the power to direct the activities of the VIE through changes in governing documents or other circumstances. The reassessment also considers whether we have acquired or disposed of a financial interest that could be significant to the VIE, or whether an interest in the VIE has become significant or areis no longer the primary beneficiary.significant. The consolidation status of a VIEthe VIEs with which we are involved may change as a result of such reconsideration events, which occur when VIEs acquire additionalreassessments. Changes in consolidation status are applied prospectively, with assets issue new variableand liabilities of a newly consolidated VIE initially recorded at fair value. A gain or loss may be recognized upon deconsolidation of a VIE depending on the carrying amounts of deconsolidated assets and liabilities compared to the fair value of retained interests or enter into new or modifiedand ongoing contractual arrangements. A reconsideration event may also occur when we acquire new or additional interests in a VIE.

See the Impact of Adopting New Accounting Guidance on Consolidation section on page 52 for a discussion of new accounting that significantly changes the criteria for consolidation effective January 1, 2010.

2008
2009 Compared to 20072008

The following discussion and analysis provides a comparison of our results of operations for 20082009 and 2007.2008. This discussion should be read in conjunction with the Consolidated Financial Statements and related Notes. Tables 6 and 7 contain financial data to supplement this discussion.

Overview

Net Income

Net income totaled $6.3 billion in 2009 compared to $4.0 billion in 2008 compared to $15.0 billion in 2007.2008. Including preferred stock dividends, incomenet loss applicable to common shareholders was $2.2 billion, or $(0.29) per diluted share. Those results compared with 2008 net income available to common shareholders of $2.6 billion, or $0.54 per diluted share. Those results compared with 2007 net income available to common shareholders of $14.8 billion, or $3.29 per diluted share. The return on average common shareholders’ equity was 1.80 percent in 2008 compared to 11.08 percent in 2007.

Net Interest Income

Net interest income on a FTE basis increased $10.4$1.9 billion to $46.6$48.4 billion for 20082009 compared to 2007.2008. The increase was driven by strong loan growth, as well asthe improved rate environment, the acquisitions of Countrywide and LaSalle,Merrill Lynch, the impact of new draws on previously securitized accounts and the contribution from market-based net interest income related to ourGlobal

Markets business, which benefited from the steepeningMerrill Lynch acquisition. These items were partially offset by the impact of deleveraging the yield curveALM portfolio earlier in 2009, lower consumer loan levels and product mix.the adverse impact of nonperforming loans. The net interest yield on a FTE basis increased 38decreased 33 bps to 2.982.65 percent for 20082009 compared to 2007,2008 due to the improvement in market-based yield,factors related to the beneficial impact of the current interest rate environment and loan growth. Partially offsetting these increases were the additions of lower yielding assets from the Countrywide and LaSalle acquisitions.core businesses as described above.

Noninterest Income

Noninterest income increased $45.1 billion to $72.5 billion in 2009 compared to 2008. Card income on a held basis decreased $5.0 billion to $27.4 billion in 2008 compared to 2007.

Card income decreased $763 million primarily due to the negative impact of higher credit costslosses on securitized credit card loans and lower fee income driven by changes in consumer retail purchase and payment behavior in the related unfavorable change in value of the interest-only strip as well as decreases in interchange income and late fees. Partially offsetting these decreases was higher debit card income.

Service charges grew $1.4 billion resulting from growth in new deposit accounts and the beneficial impact of the LaSalle acquisition.

stressed economic environment. Investment and brokerage services decreased $175 millionincreased $6.9 billion primarily due to the absenceacquisition of fees related to the sale of a business that we sold in late 2007 andMerrill Lynch partially offset by the impact of significantly lower valuations in the equity markets driven by the market downturn in late 2008, which improved modestly in 2009, and net outflows in the cash funds. Investment banking income increased $3.3 billion due to higher debt, equity and advisory fees reflecting the increased size of the investment banking platform from the acquisition of Merrill Lynch. Equity investment income increased $9.5 billion driven by $7.3 billion in gains on sales of portions of our CCB investment and a $1.1 billion gain related to our BlackRock investment. Trading account profits (losses) increased $18.1 billion primarily driven by favorable core trading results and reduced write-downs on legacy assets partially offset by the full year impactnegative credit valuation adjustments on derivative liabilities of the U.S. Trust and LaSalle acquisitions.

Investment banking income decreased $82$662 million due to reduced advisory fees related to the slowing economy.

Equity investment income decreased $3.5 billion due to a reduction in gains from our Global Principal Investments portfolio attributable to the lack of liquidityimprovement in the marketplace when compared to 2007 and other-than-temporary impairments taken on certain AFS marketable equity securities.

Trading account losses increased $1.0 billion in 2008 driven by losses related to CDO exposure and the continuing impact of the market disruptions on various parts ofGlobal Markets.

Corporation’s credit spreads. Mortgage banking income increased $4.7 billion driven by higher production and servicing income of $3.2 billion in large partand $1.5 billion. These increases were primarily due to increased volume as a result of the full-year impact of Countrywide acquisition which contributed significantly to increases in servicing incomeand higher refinance activity partially offset by lower MSR results, net of $1.7 billion and production income of $1.5 billion.

Insurance premiums increased $1.1 billion primarily due to the Countrywide acquisition.

hedges. Gains on sales of debt securities increased $944 million$3.6 billion due to the favorable interest rate environment and improved credit spreads. Gains were primarily driven by the sales of agency MBS and CMOs.

Other income decreased $2.9 billion due toGlobal Marketsrelated write-downs and $1.1 billion associated with the support provided to certain cash funds managed withinGWIM. In addition, 2008 was impacted by the absence of the $1.5 billion gain from the sale of a business in 2007. These items were partially offset by the gain of $776 million related to the Visa IPO.

Net impairment losses recognized The net loss in earnings on AFS debt securities increased $3.1other decreased $1.6 billion primarily due to CDO related write-downs.

the $3.8 billion gain from the contribution of our merchant processing business to a joint venture, reduced support provided to cash funds and lower write-downs on legacy assets offset by negative credit valuation adjustments recorded on Merrill Lynch structured notes of $4.9 billion.

Provision for Credit Losses

The provision for credit losses increased $18.4$21.7 billion to $26.8$48.6 billion for 20082009 compared to 2007 due to an increase of $9.8 billion in net charge-offs and higher additions to the reserve. The majority of the reserve additions were in consumer and small business portfolios,2008 reflecting increased weakness in the housing markets and the slowing economy. Reserves were also increased on commercial portfolios forfurther deterioration in the homebuildereconomy and non–homebuilder commercial portfolios withinGlobal Banking.

housing markets across a broad range of property types, industries and borrowers. Net charge-offs totaled $33.7 billion, or 3.58 percent of average loans and leases for 2009 compared with $16.2 billion, or 1.79 percent for 2008. The increased level of net charge-offs is a result of the same factors noted above.

92Bank of America 2009


Noninterest Expense

Noninterest expense increased $4.0$25.2 billion to $41.5$66.7 billion for 20082009 compared to 2007,2008. Personnel costs and other general operating expenses rose due to the addition of Merrill Lynch and the full-year impact of Countrywide. Additionally, noninterest expense increased due to higher litigation costs compared to the prior year, a $425 million pre-tax charge to pay the U.S. government to terminate its asset guarantee term sheet and higher FDIC insurance costs including a $724 million special assessment in 2009.
Income Tax Expense
Income tax benefit was $1.9 billion for 2009 compared to expense of $420 million for 2008 and resulted in an effective tax rate of (44.0) percent compared to 9.5 percent in the prior year. The change in the effective tax rate from the prior year was due to increased permanent tax preference items as well as a shift in the geographic mix of our earnings driven by the addition of Merrill Lynch.


Bank of America 2010     113


Business Segment Operations
Deposits
Net income decreased $3.0 billion to $2.6 billion driven by lower net revenue partially offset by an increase in noninterest expense. Net interest income decreased $3.8 billion driven by lower net interest income allocation from ALM activities and spread compression as interest rates declined. Noninterest income was essentially flat at $6.8 billion. Noninterest expense increased $908 million to $9.5 billion primarily due to the acquisitions of Countrywide and LaSalle, which increased various expense categories,higher FDIC insurance including a special FDIC assessment, partially offset by lower operating costs related to lower transaction volume due to the economy and productivity initiatives.
Global Card Services
Net income decreased $6.8 billion to a reductionnet loss of $5.3 billion due to higher provision for credit losses. Net interest income grew $667 million to $20.0 billion driven by increased loan spreads. Noninterest income decreased $2.6 billion to $9.1 billion driven by decreases in performance-based incentive compensationcard income and all other income. The decrease in card income resulted from lower cash advances, credit card interchange and fee income. All other income in 2008 included the gain associated with the Visa initial public offering (IPO). Provision for credit losses increased $10.0 billion to $29.6 billion primarily driven by higher losses in the consumer card and consumer lending portfolios from impact of the economic conditions. Noninterest expense decreased $1.2 billion to $7.7 billion primarily due to lower operating and marketing costs, and the impact of certain benefits associated with the Visa IPO transactions.

Income Tax Expense

Income tax expense was $420 million for 2008 compared to $5.9 billion for 2007 resulting in effective tax rates of 9.5 percent and 28.4 percent. The effective tax rate decrease was due to permanent tax preference amounts (e.g., tax exempt income and tax credits) offsetting a higher percentage of our pre-tax income.

Business Segment Operations

Deposits

Net income increased $438 million, or nine percent, to $5.5 billion compared to 2007 driven by higher net interest income and noninterest income partially offset by an increase in noninterest expense. Net interest income increased $755 million, or seven percent, driven by a higher contribution from our ALM activities and growth in average deposits partially offset by the impact of competitive deposit pricing. Average deposits grew $33.3 billion, or 10 percent, due to organic growth, including customers’ flight-to-safety, as well as the acquisitions of Countrywide and LaSalle. Organic growth was partially offset by the migration of customer relationships and related deposit balances toGWIM. Noninterest income increased $683 million, or 11 percent, to $6.9 billion driven by an increase of $798 million, or 13 percent, in service charges primarily as a result of increased volume, new demand deposit account growth and the addition of LaSalle. Noninterest expense increased $433 million, or five percent, to $8.8 billion compared to 2007, primarily due to the LaSalle and Countrywide acquisitions, combined with an increase in accounts and transaction volumes.

Global Card Services

Net income decreased $3.0 billion, or 71 percent, to $1.2 billion compared to 2007 as growth in net interest income and noninterest income was more than offset by an $8.5 billion increase in provision for credit losses. Net interest income grew $3.0 billion, or 18 percent, to $19.6 billion driven by higher managed average loans of $22.3 billion, or 10 percent, combined with the beneficial impact of the decrease in short-term interest rates on our funding costs. Noninterest income increased $485 million, or four percent, to $11.6 billion as other income benefited from the $388 million gain related toGlobal Card Services’ allocation of the Visa IPO gain as well as a $283 million gain on the sale of a card portfolio. These increases were partially offset by the decrease in card income of $137 million, or one percent, due to the unfavorable change in the value of the interest-only strip and decreases in interchange income driven by reduced retail volume and late fees. These decreases were partially offset by higher debit card income due to new account and card growth, increased usage and the addition of LaSalle. Provision for credit losses increased $8.5 billion, or 73 percent, to $20.2 billion compared to 2007 primarily driven by portfolio deterioration and higher bankruptcies from impacts of the slowing economy, a lower level of foreign securitizations and growth-related seasoning of the portfolio. Noninterest expense decreased $217 million, or two percent, to $9.2 billion compared to 2007, as the impact of certain benefits associated with the Visa IPO transactions and lower marketing expense were partially offset by higher personnel and technology-related expenses from increased customer assistance and collections infrastructure.

Home Loans & Insurance

Home Loans & Insurancenet income decreased $2.6loss increased $1.3 billion to a net loss of $2.5$3.9 billion compared to 2007 as growth in noninterest income and net interest income was more than offset by higher provision for credit losses and an increase in noninterest expense. Net interest income grew $1.4$1.7 billion or 74 percent, driven primarily by an increase in average LHFS and home equity loans and LHFS.loans. The growth in average LHFS was a result of higher mortgage loan volume driven by the lower interest rate environment. The growth in average home equity loans of $32.9 billion, or 45 percent, and a $5.5 billion increase in LHFS werewas attributable to the Countrywide and LaSalle acquisitions migration of certain loans fromGWIMtoHome Loans & Insuranceas well as increases in our home equity portfolio as a result of slower prepayment speeds and organic growth.the Countrywide acquisition. Noninterest income increased $4.2$5.9 billion to $6.0$11.9 billion compared to 2007 driven by increases inhigher mortgage banking income which benefited from the Countrywide acquisition and insurance income. Mortgage bankinghigher production income, grew $3.1 billion due primarily to the acquisition of Countrywide combined with increases in the value of MSR economic hedge instruments partially offset by a decrease in the value of MSRs. Insurance income increased $1.1 billion due to the acquisition of Countrywide.higher representations and warranties provision. Provision for credit losses increased $5.3$5.0 billion to $6.3$11.2 billion compared to 2007. This increase was driven primarily by higher losses inherent in the home equity portfolio reflecting deteriorationand reserve increases in the housing markets particularly in geographic areas that have experienced higher levels of declines inCountrywide home prices. This drove more severe charge-offs as borrowers defaulted.equity PCI portfolio. Noninterest expense increased $4.4$4.7 billion to $7.0$11.7 billion primarily driven by the Countrywide acquisition.acquisition as well as increased costs related to higher production volume.
Global Commercial Banking
Net income decreased $2.9 billion to a net loss of $290 million in 2009 as an increase in revenue was more than offset by increased credit costs. Net interest income was essentially flat at $8.1 billion. Noninterest income increased $552 million to $3.1 billion largely driven by our agreement to

purchase certain retail automotive loans. The provision for credit losses increased $4.5 billion to $7.8 billion, driven by reserve additions primarily in the commercial real estate portfolio and higher net charge-offs across all portfolios. Noninterest expense increased $501 million primarily attributable to higher FDIC insurance, including a special FDIC assessment.
Global Banking & Markets

Global Banking & Marketsrecognized net income of $10.1 billion in 2009 compared to a net loss of $3.2 billion in 2008 as increased noninterest income driven by trading account profits was partially offset by higher noninterest expense. Sales and trading revenue was $17.6 billion in 2009 compared to a loss of $6.9 billion in 2008 primarily due to the addition of Merrill Lynch. Noninterest income also included a $3.8 billion pre-tax gain related to the contribution of the merchant processing business into a joint venture. Noninterest expense increased $8.6 billion, largely attributable to the Merrill Lynch acquisition.
Global Wealth & Investment Management
Net income increased $341$702 million or eight percent, to $4.5$1.7 billion in 2008 compared to 20072009 as increasedhigher total revenue and lower noninterest expense werewas partially offset by an increaseincreases in noninterest expense and provision for credit losses. Net interest income increased $2.1$1.2 billion or 24 percent, driven by growth in average loans and leasesto $6.0 billion primarily due to the acquisition of $64.1 billion, or 25 percent, and average deposits of $29.6 billion, or 20 percent. The increases in average loans and leases and average deposits were driven by the LaSalle acquisition and organic growth.Merrill Lynch. Noninterest income decreased $42 million, or one percent, asGlobal Banking’s shareincreased $8.6 billion to $10.1 billion primarily due to higher investment and brokerage services income and the lower level of write-downs on legacy assets wassupport provided to certain cash funds, partially offset by an increasethe impact of lower average equity market levels and net outflows primarily in service charges and the $388 million gain related toGlobal Banking’s allocation of the Visa IPO gain. The increase in service charges was driven by organic growth, changes in our pricing structure and the LaSalle acquisition. The provisioncash complex. Provision for credit losses increased $2.5$397 million to $1.1 billion, to $3.1 billion in 2008 compared to 2007. The increase was primarily driven by reserve additions and higher charge-offs primarily due toreflecting the continued weakness in the housing markets on the homebuilder portfolio. Also contributing to this increase were higher commercial – domestic and foreign net charge-offsweak economy during 2009 which increased from very low 2007 levels anddrove higher net charge-offs and reserve increases in the retail dealer-related loan portfolios due to deteriorationconsumer real estate and seasoning of the portfolio.commercial portfolios. Noninterest expense decreased $874 million, or 12 percent, primarily dueincreased $8.3 billion to lower incentive compensation and the impact of certain benefits associated with the Visa IPO transactions, partially offset$12.4 billion driven by the addition of LaSalle.

Global Markets

Global Markets recognizedMerrill Lynch and higher FDIC insurance, including a net loss of $4.9special FDIC assessment, partially offset by lower revenue-related expenses.

All Other
Net income inAll Otherwas $1.3 billion in 20082009 compared to a net loss of $3.8$1.1 billion in 20072008 as increasedhigher total revenue driven by increases in noninterest income, net interest income and reduced noninterest expensean income tax benefit were more thanpartially offset by increased sales and trading losses. Sales and trading revenue was a net loss of $6.9 billion in 2008 as compared to a net loss of $2.6 billion in 2007. These decreases were driven by losses related to CDO exposure, our hedging activities including counterparty credit risk valuations and the continuing impact of the market disruptions on various parts of our business including the severe volatility, illiquidity and credit dislocations that


Bank of America 200993


were experienced in the debt and equity markets in the fourth quarter of 2008. Partially offsetting these declines were favorable results in our rates and currencies products which benefited from volatility in interest rates and foreign exchange markets which also drove favorable client flows. Noninterest expense declined $834 million primarily due to lower performance-based incentive compensation.

Global Wealth & Investment Management

Net income decreased $527 million, or 27 percent, to $1.4 billion in 2008 as increases in net interest income and investment and brokerage services income were more than offset by losses associated with the support provided to certain cash funds, increases in provision for credit losses, merger and restructuring charges and all other noninterest expense as well as losses related to the buyback of ARS.expense. Net interest income increased $877 million, or 22 percent, to $4.8$1.5 billion due to higher margin on ALM activities, the acquisitions of U.S. Trust Corporation and LaSalle, and growth in average deposit and loan balances partially offset by spread compression driven by deposit mix and competitive deposit pricing.GWIM average deposit growth benefited from the migration of customer relationships and related balances fromDeposits, organic growth and the U.S. Trust Corporation and LaSalle acquisitions. Noninterest income decreased $625 million, or 17 percent, to $3.0 billion driven by $1.1 billion in losses during 2008 related to the support provided to certain cash funds and losses of $181 million related to the buyback of ARS. These losses were partially offset by an increase of $278 million in investment and brokerage services resulting from the U.S. Trust Corporation acquisition partially offset by the impact of significantly lower valuations in the equity markets. Provision for credit losses increased $649 million to $664 million as a result of higher credit

costs due to the deterioration in the housing markets and the impacts of a slower economy. Noninterest expense increased $419 million, or nine percent, to $4.9 billion due to the addition of U.S. Trust Corporation and LaSalle, and higher initiative spending partially offset by lower discretionary incentive compensation.

All Other

Net income decreased $4.5 billion to a net loss of $1.2 billion due to a decrease in total revenue combined with increases in provision for credit losses and merger and restructuring charges. Net interest income increased $113 million primarily due to increasedunallocated net interest income related to our functional activities partially offsetincreased liquidity driven in part by the reclassification to card income related to our funds transfer pricing forGlobal Card Services’ securitizations.capital raises during 2009. Noninterest income declined $3.3increased $8.2 billion to $820 million$10.6 billion driven by decreases inhigher equity investment income including a $7.3 billion gain on the sale of $3.5 billiona portion of our CCB investment and all other income (loss) of $1.2 billion partially offset by increases in gains on sales of debt securities of $953 million and card income of $653 million. Excluding the securitizationsecurities. These were partially offset to presentGlobal Card Servicesby a $4.9 billion negative valuation adjustment on a managed basis provisioncertain structured liabilities. Provision for credit losses increased $3.2was $8.0 billion in 2009 compared to $2.9$2.8 billion in 2008 primarily due to higher credit costs related to our ALM residential mortgage portfolio reflecting deterioration in the housing markets and the impacts of a slowing economy. Additionally, deterioration in our Countrywide discontinued real estate portfolio subsequent to the July 1, 2008 acquisition as well as the absence of 2007 reserve reductions also contributed to the increase in provision.portfolio. Merger and restructuring charges increased $525 million$1.8 billion to $935 million$2.7 billion due to the integration costs associated with the Merrill Lynch and Countrywide and LaSalle acquisitions.


94Bank of America 2009

114     Bank of America 2010


Statistical Tables

Table IYear-to-date Average Balances and Interest Rates – FTE Basis

  2009    2008    2007 
(Dollars in millions) Average
Balance
 Interest
Income/
Expense
 Yield/
Rate
     Average
Balance
 Interest
Income/
Expense
 Yield/
Rate
     Average
Balance
 Interest
Income/
Expense
 Yield/
Rate
 

Earning assets


Time deposits placed and other short-term investments

 $27,465 $713 2.60  $10,696 $440 4.11  $13,152 $627 4.77

Federal funds sold and securities borrowed or purchased under agreements to resell

  235,764  2,894 1.23     128,053  3,313 2.59     155,828  7,722 4.96  

Trading account assets

  217,048  8,236 3.79     186,579  9,259 4.96     187,287  9,747 5.20  

Debt securities(1)

  271,048  13,224 4.88     250,551  13,383 5.34     186,466  10,020 5.37  

Loans and leases(2):


Residential mortgage(3)

  249,335  13,535 5.43     260,244  14,657 5.63     264,650  15,112 5.71  

Home equity

  154,761  6,736 4.35     135,060  7,606 5.63     98,765  7,385 7.48  

Discontinued real estate

  17,340  1,082 6.24     10,898  858 7.87     n/a  n/a n/a  

Credit card – domestic

  52,378  5,666 10.82     63,318  6,843 10.81     57,883  7,225 12.48  

Credit card – foreign

  19,655  2,122 10.80     16,527  2,042 12.36     12,359  1,502 12.15  

Direct/Indirect consumer(4)

  99,993  6,016 6.02     82,516  6,934 8.40     70,009  6,002 8.57  

Other consumer(5)

  3,303  237 7.17     3,816  321 8.41     4,510  389 8.64  

Total consumer

  596,765  35,394 5.93     572,379  39,261 6.86     508,176  37,615 7.40  

Commercial – domestic

  223,813  8,883 3.97     220,561  11,702 5.31     180,102  12,884 7.15  

Commercial real estate(6)

  73,349  2,372 3.23     63,208  3,057 4.84     42,950  3,145 7.32  

Commercial lease financing

  21,979  990 4.51     22,290  799 3.58     20,435  1,212 5.93  

Commercial – foreign

  32,899  1,406 4.27     32,440  1,503 4.63     24,491  1,452 5.93  

Total commercial

  352,040  13,651 3.88     338,499  17,061 5.04     267,978  18,693 6.98  

Total loans and leases

  948,805  49,045 5.17     910,878  56,322 6.18     776,154  56,308 7.25  
Other earning assets  130,063  5,105 3.92     75,972  4,161 5.48     71,305  4,629 6.49  

Total earning assets(7)

  1,830,193  79,217 4.33     1,562,729  86,878 5.56     1,390,192  89,053 6.41  

Cash and cash equivalents

  196,237     45,354     33,091  

Other assets, less allowance for loan and lease losses

  411,087         235,896         178,790      

Total assets

 $2,437,517         $1,843,979         $1,602,073      

Interest-bearing liabilities


Domestic interest-bearing deposits:


Savings

 $33,671 $215 0.64  $32,204 $230 0.71  $32,316 $188 0.58

NOW and money market deposit accounts

  358,847  1,557 0.43     267,818  3,781 1.41     220,207  4,361 1.98  

Consumer CDs and IRAs

  218,041  5,054 2.32     203,887  7,404 3.63     167,801  7,817 4.66  

Negotiable CDs, public funds and other time deposits

  37,661  473 1.26     32,264  1,076 3.33     20,557  974 4.74  

Total domestic interest-bearing deposits

  648,220  7,299 1.13     536,173  12,491 2.33     440,881  13,340 3.03  

Foreign interest-bearing deposits:


Banks located in foreign countries

  19,397  144 0.74     37,657  1,063 2.82     42,788  2,174 5.08  

Governments and official institutions

  7,580  18 0.23     13,004  311 2.39     16,523  812 4.91  

Time, savings and other

  55,026  346 0.63     51,363  1,385 2.70     43,443  1,767 4.07  

Total foreign interest-bearing deposits

  82,003  508 0.62     102,024  2,759 2.70     102,754  4,753 4.63  

Total interest-bearing deposits

  730,223  7,807 1.07     638,197  15,250 2.39     543,635  18,093 3.33  

Federal funds purchased, securities loaned or sold under agreements to repurchase and other short-term borrowings

  488,644  5,512 1.13     455,710  12,362 2.71     424,814  21,967 5.17  

Trading account liabilities

  72,207  2,075 2.87     72,915  2,774 3.80     82,721  3,444 4.16  
Long-term debt  446,634  15,413 3.45     231,235  9,938 4.30     169,855  9,359 5.51  

Total interest-bearing liabilities(7)

  1,737,708  30,807 1.77     1,398,057  40,324 2.88     1,221,025  52,863 4.33  

Noninterest-bearing sources:


Noninterest-bearing deposits

  250,743     192,947     173,547  

Other liabilities

  204,421     88,144     70,839  

Shareholders’ equity

  244,645         164,831         136,662      

Total liabilities and shareholders’ equity

 $2,437,517        $1,843,979        $1,602,073      

Net interest spread

   2.56    2.68    2.08

Impact of noninterest-bearing sources

       0.09          0.30          0.52  

Net interest income/yield on earning assets

    $48,410 2.65      $46,554 2.98      $36,190 2.60
                                     
  2010  2009  2008 
     Interest
        Interest
        Interest
    
  Average
  Income/
  Yield/
  Average
  Income/
  Yield/
  Average
  Income/
  Yield/
 
(Dollars in millions) Balance  Expense  Rate  Balance  Expense  Rate  Balance  Expense  Rate 
Earning assets
                                    
Time deposits placed and other short-term investments (1)
 $27,419  $292   1.06% $27,465  $334   1.22% $10,696  $367   3.43%
Federal funds sold and securities borrowed or purchased under agreements to resell  256,943   1,832   0.71   235,764   2,894   1.23   128,053   3,313   2.59 
Trading account assets  213,745   7,050   3.30   217,048   8,236   3.79   186,579   9,259   4.96 
Debt securities (2)
  323,946   11,850   3.66   271,048   13,224   4.88   250,551   13,383   5.34 
Loans and leases(3):
                                    
Residential mortgage (4)
  245,727   11,736   4.78   249,335   13,535   5.43   260,244   14,657   5.63 
Home equity  145,860   5,990   4.11   154,761   6,736   4.35   135,060   7,606   5.63 
Discontinued real estate  13,830   527   3.81   17,340   1,082   6.24   10,898   858   7.87 
U.S. credit card  117,962   12,644   10.72   52,378   5,666   10.82   63,318   6,843   10.81 
Non-U.S. credit card
  28,011   3,450   12.32   19,655   2,122   10.80   16,527   2,042   12.36 
Direct/Indirect consumer (5)
  96,649   4,753   4.92   99,993   6,016   6.02   82,516   6,934   8.40 
Other consumer (6)
  2,927   186   6.34   3,303   237   7.17   3,816   321   8.41 
                                     
Total consumer  650,966   39,286   6.04   596,765   35,394   5.93   572,379   39,261   6.86 
                                     
U.S. commercial  195,895   7,909   4.04   223,813   8,883   3.97   220,554   11,702   5.31 
Commercial real estate (7)
  59,947   2,000   3.34   73,349   2,372   3.23   63,208   3,057   4.84 
Commercial lease financing  21,427   1,070   4.99   21,979   990   4.51   22,290   799   3.58 
Non-U.S. commercial
  30,096   1,091   3.62   32,899   1,406   4.27   32,440   1,503   4.63 
                                     
Total commercial  307,365   12,070   3.93   352,040   13,651   3.88   338,492   17,061   5.04 
                                     
Total loans and leases  958,331   51,356   5.36   948,805   49,045   5.17   910,871   56,322   6.18 
                                     
Other earning assets  117,189   3,919   3.34   130,063   5,105   3.92   75,972   4,161   5.48 
                                     
Total earning assets(8)
  1,897,573   76,299   4.02   1,830,193   78,838   4.31   1,562,722   86,805   5.55 
                                     
Cash and cash equivalents (1)
  174,621   368       196,237   379       45,367   73     
Other assets, less allowance for loan and lease losses  367,408           416,638           235,896         
                                     
Total assets
 $2,439,602          $2,443,068          $1,843,985         
                                     
Interest-bearing liabilities
                                    
U.S. interest-bearing deposits:                                    
Savings $36,649  $157   0.43% $33,671  $215   0.64% $32,204  $230   0.71%
NOW and money market deposit accounts  441,589   1,405   0.32   358,712   1,557   0.43   267,831   3,781   1.41 
Consumer CDs and IRAs  142,648   1,723   1.21   218,041   5,054   2.32   203,887   7,404   3.63 
Negotiable CDs, public funds and other time deposits  17,683   226   1.28   37,796   473   1.25   32,264   1,076   3.33 
                                     
Total U.S. interest-bearing deposits  638,569   3,511   0.55   648,220   7,299   1.13   536,186   12,491   2.33 
                                     
Non-U.S. interest-bearing deposits:
                                    
Banks located innon-U.S. countries
  18,102   144   0.80   18,688   145   0.78   37,354   1,056   2.83 
Governments and official institutions  3,349   10   0.28   6,270   16   0.26   10,975   279   2.54 
Time, savings and other  55,059   332   0.60   57,045   347   0.61   53,695   1,424   2.65 
                                     
Totalnon-U.S. interest-bearing deposits
  76,510   486   0.64   82,003   508   0.62   102,024   2,759   2.70 
                                     
Total interest-bearing deposits  715,079   3,997   0.56   730,223   7,807   1.07   638,210   15,250   2.39 
                                     
Federal funds purchased, securities loaned or sold under agreements to repurchase and other short-term borrowings  430,329   3,699   0.86   488,644   5,512   1.13   455,703   12,362   2.71 
Trading account liabilities  91,669   2,571   2.80   72,207   2,075   2.87   72,915   2,774   3.80 
Long-term debt  490,497   13,707   2.79   446,634   15,413   3.45   231,235   9,938   4.30 
                                     
Total interest-bearing liabilities (8)
  1,727,574   23,974   1.39   1,737,708   30,807   1.77   1,398,063   40,324   2.88 
                                     
Noninterest-bearing sources:                                    
Noninterest-bearing deposits  273,507           250,743           192,947         
Other liabilities  205,290           209,972           88,144         
Shareholders’ equity  233,231           244,645           164,831         
                                     
Total liabilities and shareholders’ equity
 $2,439,602          $2,443,068          $1,843,985         
                                     
Net interest spread          2.63%          2.54%          2.67%
Impact of noninterest-bearing sources          0.13           0.08           0.30 
                                     
Net interest income/yield on earning assets (1)
     $52,325   2.76%     $48,031   2.62%     $46,481   2.97%
                                     
(1)

Fees earned on overnight deposits placed with the Federal Reserve, which were included in time deposits placed and other short-term investments in prior periods, have been reclassified to cash and cash equivalents, consistent with the Corporation’s Consolidated Balance Sheet presentation of these deposits. Net interest income and net interest yield are calculated excluding these fees.
(2)Yields on AFS debt securities are calculated based on fair value rather than the cost basis. The use of fair value does not have a material impact on net interest yield.

(2)(3)

Nonperforming loans are included in the respective average loan balances. Income on these nonperforming loans is recognized on a cash basis.

Purchased credit-impaired loans were written down to fair value upon acquisition and accrete interest income over the remaining life of the loan.
(3)(4)

Includes foreignnon-U.S. residential mortgagesmortgage loans of $410 million and $622 million in 2010 and 2009. We did not have anyThere were no material foreignnon-U.S. residential mortgage loans prior to January 1, 2009.

(4)

Includes foreign consumer loans of $8.0 billion, $2.7 billion and $3.8 billion in 2009, 2008 and 2007, respectively.

(5)

Includesnon-U.S. consumer loans of $7.9 billion, $8.0 billion and $2.7 billion in 2010, 2009 and 2008, respectively.
(6)Includes consumer finance loans of $2.1 billion, $2.4 billion and $2.8 billion and $3.2 billion in 2009, 2008 and 2007, respectively; andbillion; other foreignnon-U.S. consumer loans of $731 million, $657 million and $774 million; and consumer overdrafts of $111 million, $217 million and $1.1 billion$247 million in 2010, 2009 and 2008, and 2007, respectively.

(6)(7)

Includes domesticU.S. commercial real estate loans of $57.3 billion, $70.7 billion and $62.1 billionbillion; and $42.1 billion in 2009, 2008 and 2007, respectively; and foreignnon-U.S. commercial real estate loans of $2.7 billion, $2.7 billion and $1.1 billion in 2010, 2009 and $858 million in 2009, 2008, and 2007.

respectively.
(7)(8)

Interest income includes the impact of interest rate risk management contracts, which decreased interest income on the underlying assets $1.4 billion, $456 million and $260 million in 2010, 2009 and $542 million in 2009, 2008, and 2007, respectively. Interest expense includes the impact of interest rate risk management contracts, which increased (decreased) interest expense on the underlying liabilities $(3.5) billion, $(3.0) billion and $409 million in 2010, 2009 and $813 million in 2009, 2008, and 2007, respectively. For further information on interest rate contracts, see Interest Rate Risk Management for Nontrading Activities beginning on page 83.

103.
n/a

= not applicable

Bank of America 200995
Bank of America 2010     115


Table IIAnalysis of Changes in Net Interest Income – FTE Basis

  From 2008 to 2009     From 2007 to 2008 
  Due to Change in(1)   

Net

Change

     Due to Change in(1)   

Net

Change

 
(Dollars in millions) Volume   Rate       Volume   Rate   

Increase (decrease) in interest income


Time deposits placed and other short-term investments

 $689    $(416  $273     $(117  $(70  $(187

Federal funds sold and securities borrowed or purchased under agreements to resell

  2,793     (3,212   (419    (1,371   (3,038   (4,409

Trading account assets

  1,507     (2,530   (1,023    (45   (443   (488

Debt securities

  1,091     (1,250   (159    3,435     (72   3,363  

Loans and leases:


Residential mortgage

  (619   (503   (1,122    (252   (203   (455

Home equity

  1,107     (1,977   (870    2,717     (2,496   221  

Discontinued real estate

  507     (283   224      n/a     n/a     858  

Credit card – domestic

  (1,181   4     (1,177    677     (1,059   (382

Credit card – foreign

  387     (307   80      506     34     540  

Direct/Indirect consumer

  1,465     (2,383   (918    1,070     (138   932  

Other consumer

  (43   (41   (84     (59   (9   (68

Total consumer

            (3,867               1,646  

Commercial – domestic

  182     (3,001   (2,819    2,886     (4,068   (1,182

Commercial real estate

  493     (1,178   (685    1,482     (1,570   (88

Commercial lease financing

  (12   203     191      110     (523   (413

Commercial – foreign

  20     (117   (97     472     (421   51  

Total commercial

            (3,410               (1,632

Total loans and leases

            (7,277               14  

Other earning assets

  2,966     (2,022   944       302     (770   (468

Total interest income

           $(7,661              $(2,175

Increase (decrease) in interest expense


Domestic interest-bearing deposits:


Savings

 $9    $(24  $(15   $(1  $43    $42  

NOW and money market deposit accounts

  1,279     (3,503   (2,224    942     (1,522   (580

Consumer CDs and IRAs

  511     (2,861   (2,350    1,684     (2,097   (413

Negotiable CDs, public funds and other time deposits

  178     (781   (603     555     (453   102  

Total domestic interest-bearing deposits

            (5,192               (849

Foreign interest-bearing deposits:


Banks located in foreign countries

  (516   (403   (919    (261   (850   (1,111

Governments and official institutions

  (130   (163   (293    (174   (327   (501

Time, savings and other

  101     (1,140   (1,039     323     (705   (382

Total foreign interest-bearing deposits

            (2,251               (1,994

Total interest-bearing deposits

            (7,443               (2,843

Federal funds purchased, securities loaned or sold under
agreements to repurchase and other short-term borrowings

  880     (7,730   (6,850    1,593     (11,198   (9,605

Trading account liabilities

  (30   (669   (699    (411   (259   (670

Long-term debt

  9,267     (3,792   5,475       3,382     (2,803   579  

Total interest expense

            (9,517               (12,539

Net increase in net interest income

           $1,856                $10,364  
                         
  From 2009 to 2010  From 2008 to 2009 
  Due to Change in(1)  Net  Due to Change in (1)  Net 
(Dollars in millions) Volume  Rate  Change  Volume  Rate  Change 
Increase (decrease) in interest income
                        
Time deposits placed and other short-term investments (2)
 $1  $(43) $(42) $575  $(608) $(33)
Federal funds sold and securities borrowed or purchased under agreements to resell  266   (1,328)  (1,062)  2,793   (3,212)  (419)
Trading account assets  (135)  (1,051)  (1,186)  1,507   (2,530)  (1,023)
Debt securities  2,585   (3,959)  (1,374)  1,091   (1,250)  (159)
Loans and leases:                        
Residential mortgage  (192)  (1,607)  (1,799)  (619)  (503)  (1,122)
Home equity  (391)  (355)  (746)  1,107   (1,977)  (870)
Discontinued real estate  (219)  (336)  (555)  507   (283)  224 
U.S. credit card  7,097   (119)  6,978   (1,181)  4   (1,177)
Non-U.S. credit card
  903   425   1,328   387   (307)  80 
Direct/Indirect consumer  (198)  (1,065)  (1,263)  1,465   (2,383)  (918)
Other consumer  (27)  (24)  (51)  (43)  (41)  (84)
                         
Total consumer          3,892           (3,867)
                         
U.S. commercial  (1,106)  132   (974)  182   (3,001)  (2,819)
Commercial real estate  (436)  64   (372)  493   (1,178)  (685)
Commercial lease financing  (24)  104   80   (12)  203   191 
Non-U.S. commercial
  (121)  (194)  (315)  20   (117)  (97)
                         
Total commercial          (1,581)          (3,410)
                         
Total loans and leases          2,311           (7,277)
                         
Other earning assets  (511)  (675)  (1,186)  2,966   (2,022)  944 
                         
Total interest income         $(2,539)         $(7,967)
                         
Increase (decrease) in interest expense
                        
U.S. interest-bearing deposits:                        
Savings $20  $(78) $(58) $9  $(24) $(15)
NOW and money market deposit accounts  342   (494)  (152)  1,277   (3,501)  (2,224)
Consumer CDs and IRAs  (1,745)  (1,586)  (3,331)  511   (2,861)  (2,350)
Negotiable CDs, public funds and other time deposits  (252)  5   (247)  183   (786)  (603)
                         
Total U.S. interest-bearing deposits          (3,788)          (5,192)
                         
Non-U.S. interest-bearing deposits:
                        
Banks located innon-U.S. countries
  (4)  3   (1)  (527)  (384)  (911)
Governments and official institutions  (7)  1   (6)  (120)  (143)  (263)
Time, savings and other  (11)  (4)  (15)  88   (1,165)  (1,077)
                         
Totalnon-U.S. interest-bearing deposits
          (22)          (2,251)
                         
Total interest-bearing deposits          (3,810)          (7,443)
                         
Federal funds purchased, securities loaned or sold under agreements to repurchase and other short-term borrowings  (649)  (1,164)  (1,813)  880   (7,730)  (6,850)
Trading account liabilities  556   (60)  496   (30)  (669)  (699)
Long-term debt  1,509   (3,215)  (1,706)  9,267   (3,792)  5,475 
                         
Total interest expense          (6,833)          (9,517)
                         
Net increase in interest income (2)
         $4,294          $1,550 
                         
(1)

The changes for each category of interest income and expense are divided between the portion of change attributable to the variance in volume and the portion of change attributable to the variance in rate for that category. The unallocated change in rate or volume variance is allocated between the rate and volume variances.

n/a

= not applicable

(2)
96BankFees earned on overnight deposits placed with the Federal Reserve, which were included in the time deposits placed and other short-term investments line in prior periods, have been reclassified to cash and cash equivalents, consistent with the balance sheet presentation of America 2009these deposits. Net interest income is calculated excluding these fees.
116     Bank of America 2010


Table IIIPreferred Stock Cash Dividend Summary (as of February 26, 2010)25, 2011)

Preferred Stock 

Outstanding
Notional
Amount

(in millions)

    Declaration Date   Record Date    Payment Date    Per Annum
Dividend Rate
   Dividend
Per Share

Series B(1)

 $1    January 27, 2010    April 9, 2010    April 23, 2010    7.00  $1.75
     October 28, 2009    January 11, 2010    January 25, 2010    7.00     1.75
     July 21, 2009    October 9, 2009    October 23, 2009    7.00     1.75
     April 29, 2009    July 10, 2009    July 24, 2009    7.00     1.75
        January 16, 2009    April 10, 2009    April 24, 2009    7.00     1.75

Series D(2)

 $661    January 4, 2010    February 26, 2010    March 15, 2010    6.204  $0.38775
     October 2, 2009    November 30, 2009    December 14, 2009    6.204     0.38775
     July 2, 2009    August 31, 2009    September 14, 2009    6.204     0.38775
     April 3, 2009    May 29, 2009    June 15, 2009    6.204     0.38775
        January 5, 2009    February 27, 2009    March 16, 2009    6.204     0.38775

Series E(2)

 $487    January 4, 2010    January 29, 2010    February 16, 2010    Floating    $0.25556
     October 2, 2009    October 30, 2009    November 16, 2009    Floating     0.25556
     July 2, 2009    July 31, 2009    August 17, 2009    Floating     0.25556
     April 3, 2009    April 30, 2009    May 15, 2009    Floating     0.24722
        January 5, 2009    January 30, 2009    February 17, 2009    Floating     0.25556

Series H(2)

 $2,862    January 4, 2010    January 15, 2010    February 1, 2010    8.20  $0.51250
     October 2, 2009    October 15, 2009    November 2, 2009    8.20     0.51250
     July 2, 2009    July 15, 2009    August 3, 2009    8.20     0.51250
     April 3, 2009    April 15, 2009    May 1, 2009    8.20     0.51250
        January 5, 2009    January 15, 2009    February 2, 2009    8.20     0.51250

Series I(2)

 $365    January 4, 2010    March 15, 2010    April 1, 2010    6.625  $0.41406
     October 2, 2009    December 15, 2009    January 4, 2010    6.625     0.41406
     July 2, 2009    September 15, 2009    October 1, 2009    6.625     0.41406
     April 3, 2009    June 15, 2009    July 1, 2009    6.625     0.41406
        January 5, 2009    March 15, 2009    April 1, 2009    6.625     0.41406

Series J(2)

 $978    January 4, 2010    January 15, 2010    February 1, 2010    7.25  $0.45312
     October 2, 2009    October 15, 2009    November 2, 2009    7.25     0.45312
     July 2, 2009    July 15, 2009    August 3, 2009    7.25     0.45312
     April 3, 2009    April 15, 2009    May 1, 2009    7.25     0.45312
        January 5, 2009    January 15, 2009    February 2, 2009    7.25     0.45312

Series K(3, 4)

 $1,668    January 4, 2010    January 15, 2010    February 1, 2010    Fixed-to-Floating    $40.00
     July 2, 2009    July 15, 2009    July 30, 2009    Fixed-to-Floating     40.00
        January 5, 2009    January 15, 2009    January 30, 2009    Fixed-to-Floating     40.00

Series L

 $3,349    December 17, 2009    January 1, 2010    February 1, 2010    7.25  $18.1250
     September 18, 2009    October 1, 2009    October 30, 2009    7.25     18.1250
     June 19, 2009    July 1, 2009    July 30, 2009    7.25     18.1250
        March 17, 2009    April 1, 2009    April 30, 2009    7.25     18.1250

Series M(3, 4)

 $1,434    October 2, 2009    October 31, 2009    November 16, 2009    Fixed-to-Floating    $40.625
        April 3, 2009    April 30, 2009    May 15, 2009    Fixed-to-Floating     40.625

Series N(1, 5)

 $    October 2, 2009    October 31, 2009    November 16, 2009    5.00  $312.50
     July 2, 2009    July 31, 2009    August 17, 2009    5.00     312.50
     April 3, 2009    April 30, 2009    May 15, 2009    5.00     312.50
        January 5, 2009(6)   January 31, 2009    February 17, 2009    5.00     371.53

Series Q(1, 5)

 $    October 2, 2009    October 31, 2009    November 16, 2009    5.00  $312.50
     July 2, 2009    July 31, 2009    August 17, 2009    5.00     312.50
     April 3, 2009    April 30, 2009    May 15, 2009    5.00     312.50
        January 5, 2009(6)   January 31, 2009    February 17, 2009    5.00     125.00

Series R(1, 5)

 $    October 2, 2009    October 31, 2009    November 16, 2009    8.00  $500.00
     July 2, 2009    July 31, 2009    August 17, 2009    8.00     500.00
     April 3, 2009    April 30, 2009    May 15, 2009    8.00     500.00
        January 5, 2009(6)   January 31, 2009    February 17, 2009    8.00     161.11

                         
  Outstanding
                
  Notional
                
  Amount
           Per Annum
  Dividend Per
 
Preferred Stock (in millions)  Declaration Date  Record Date  Payment Date  Dividend Rate  Share 
Series B (1)
 $1   January 26, 2011   April 11, 2011   April 25, 2011   7.00% $1.75 
       October 25, 2010   January 11, 2011   January 25, 2011   7.00   1.75 
       July 28, 2010   October 11, 2010   October 25, 2010   7.00   1.75 
       April 28, 2010   July 9, 2010   July 23, 2010   7.00   1.75 
       January 27, 2010   April 9, 2010   April 23, 2010   7.00   1.75 
                         
Series D (2)
 $661   January 4, 2011   February 28, 2011   March 14, 2011   6.204% $0.38775 
       October 4, 2010   November 30, 2010   December 14, 2010   6.204   0.38775 
       July 2, 2010   August 31, 2010   September 14, 2010   6.204   0.38775 
       April 2, 2010   May 28, 2010   June 14, 2010   6.204   0.38775 
       January 4, 2010   February 26, 2010   March 15, 2010   6.204   0.38775 
                         
Series E (2)
 $487   January 4, 2011   January 31, 2011   February 15, 2011   Floating  $0.25556 
       October 4, 2010   October 29, 2010   November 15, 2010   Floating   0.25556 
       July 2, 2010   July 30, 2010   August 16, 2010   Floating   0.25556 
       April 2, 2010   April 30, 2010   May 17, 2010   Floating   0.24722 
       January 4, 2010   January 29, 2010   February 16, 2010   Floating   0.25556 
                         
Series H (2)
 $2,862   January 4, 2011   January 15, 2011   February 1, 2011   8.20% $0.51250 
       October 4, 2010   October 15, 2010   November 1, 2010   8.20   0.51250 
       July 2, 2010   July 15, 2010   August 2, 2010   8.20   0.51250 
       April 2, 2010   April 15, 2010   May 3, 2010   8.20   0.51250 
       January 4, 2010   January 15, 2010   February 1, 2010   8.20   0.51250 
                         
Series I (2)
 $365   January 4, 2011   March 15, 2011   April 1, 2011   6.625% $0.41406 
       October 4, 2010   December 15, 2010   January 3, 2011   6.625   0.41406 
       July 2, 2010   September 15, 2010   October 1, 2010   6.625   0.41406 
       April 2, 2010   June 15, 2010   July 1, 2010   6.625   0.41406 
       January 4, 2010   March 15, 2010   April 1, 2010   6.625   0.41406 
                         
Series J (2)
 $978   January 4, 2011   January 15, 2011   February 1, 2011   7.25% $0.45312 
       October 4, 2010   October 15, 2010   November 1, 2010   7.25   0.45312 
       July 2, 2010   July 15, 2010   August 2, 2010   7.25   0.45312 
       April 2, 2010   April 15, 2010   May 3, 2010   7.25   0.45312 
       January 4, 2010   January 15, 2010   February 1, 2010   7.25   0.45312 
                         
Series K(3, 4)
 $1,668   January 4, 2011   January 15, 2011   January 31, 2011   Fixed-to-Floating  $40.00 
       July 2, 2010   July 15, 2010   July 30, 2010   Fixed-to-Floating   40.00 
       January 4, 2010   January 15, 2010   February 1, 2010   Fixed-to-Floating   40.00 
                         
Series L $3,349   December 17, 2010   January 3, 2011   January 31, 2011   7.25% $18.125 
       September 17, 2010   October 1, 2010   November 1, 2010   7.25   18.125 
       June 17, 2010   July 1, 2010   July 30, 2010   7.25   18.125 
       March 17, 2010   April 1, 2010   April 30, 2010   7.25   18.125 
                         
Series M(3, 4)
 $1,434   October 4, 2010   October 31, 2010   November 15, 2010   Fixed-to-Floating  $40.625 
       April 2, 2010   April 30, 2010   May 17, 2010   Fixed-to-Floating   40.625 
                         
Bank(1)Dividends are cumulative.
(2)Dividends per depositary share, each representing a 1/1000th interest in a share of America 2009preferred stock.
(3)97Initially pays dividends semi-annually.
(4)Dividends per depositary share, each representing a 1/25th interest in a share of preferred stock.
Bank of America 2010     117


Table IIIPreferred Stock Cash Dividend Summary (as of February 26, 2010) continued25, 2011) (continued)

Preferred Stock


Outstanding
Notional
Amount

(in millions)

    Declaration Date    Record Date    Payment Date    Per Annum
Dividend Rate
   Dividend
Per Share

Series 1(7)

 $146    January 4, 2010    February 15, 2010    February 26, 2010    Floating    $0.19167
     October 2, 2009    November 15, 2009    November 30, 2009    Floating     0.19167
     July 2, 2009    August 15, 2009    August 28, 2009    Floating     0.19167
     April 3, 2009    May 15, 2009    May 28, 2009    Floating     0.18542
        January 5, 2009    February 15, 2009    February 27, 2009    Floating     0.19167

Series 2(7)

 $526    January 4, 2010    February 15, 2010    February 26, 2010    Floating    $0.19167
     October 2, 2009    November 15, 2009    November 30, 2009    Floating     0.19167
     July 2, 2009    August 15, 2009    August 28, 2009    Floating     0.19167
     April 3, 2009    May 15, 2009    May 28, 2009    Floating     0.18542
        January 5, 2009    February 15, 2009    February 27, 2009    Floating     0.19167

Series 3(7)

 $670    January 4, 2010    February 15, 2010    March 1, 2010    6.375  $0.39843
     October 2, 2009    November 15, 2009    November 30, 2009    6.375     0.39843
     July 2, 2009    August 15, 2009    August 28, 2009    6.375     0.39843
     April 3, 2009    May 15, 2009    May 28, 2009    6.375     0.39843
        January 5, 2009    February 15, 2009    March 2, 2009    6.375     0.39843

Series 4(7)

 $389    January 4, 2010    February 15, 2010    February 26, 2010    Floating    $0.25556
     October 2, 2009    November 15, 2009    November 30, 2009    Floating     0.25556
     July 2, 2009    August 15, 2009    August 28, 2009    Floating     0.25556
     April 3, 2009    May 15, 2009    May 28, 2009    Floating     0.24722
        January 5, 2009    February 15, 2009    February 27, 2009    Floating     0.25556

Series 5(7)

 $606    January 4, 2010    February 1, 2010    February 22, 2010    Floating    $0.25556
     October 2, 2009    November 1, 2009    November 23, 2009    Floating     0.25556
     July 2, 2009    August 1, 2009    August 21, 2009    Floating     0.25556
     April 3, 2009    May 1, 2009    May 21, 2009    Floating     0.24722
        January 5, 2009    February 1, 2009    February 23, 2009    Floating     0.25556

Series 6(8)

 $65    January 4, 2010    March 15, 2010    March 30, 2010    6.70  $0.41875
     October 2, 2009    December 15, 2009    December 30, 2009    6.70     0.41875
     July 2, 2009    September 15, 2009    September 30, 2009    6.70     0.41875
     April 3, 2009    June 15, 2009    June 30, 2009    6.70     0.41875
        January 5, 2009    March 15, 2009    March 30, 2009    6.70     0.41875

Series 7(8)

 $17    January 4, 2010    March 15, 2010    March 30, 2010    6.25  $0.39062
     October 2, 2009    December 15, 2009    December 30, 2009    6.25     0.39062
     July 2, 2009    September 15, 2009    September 30, 2009    6.25     0.39062
     April 3, 2009    June 15, 2009    June 30, 2009    6.25     0.39062
        January 5, 2009    March 15, 2009    March 30, 2009    6.25     0.39062

Series 8(7)

 $2,673    January 4, 2010    February 15, 2010    March 1, 2010    8.625  $0.53906
     October 2, 2009    November 15, 2009    November 30, 2009    8.625     0.53906
     July 2, 2009    August 15, 2009    August 28, 2009    8.625     0.53906
     April 3, 2009    May 15, 2009    May 28, 2009    8.625     0.53906
        January 5, 2009    February 15, 2009    March 2, 2009    8.625     0.53906

Series 2 (MC)(9)

 $1,200    January 4, 2010    February 15, 2010    March 1, 2010    9.00  $2,250.00
     October 2, 2009    November 15, 2009    November 30, 2009    9.00     2,250.00
     July 2, 2009    August 15, 2009    August 28, 2009    9.00     2,250.00
     April 3, 2009    May 15, 2009    May 28, 2009    9.00     2,250.00
        January 21, 2009    February 15, 2009    March 2, 2009    9.00     2,250.00

Series 3 (MC)(9)

 $500    January 4, 2010    February 15, 2010    March 1, 2010    9.00  $2,250.00
     October 2, 2009    November 15, 2009    November 30, 2009    9.00     2,250.00
     July 2, 2009    August 15, 2009    August 28, 2009    9.00     2,250.00
     April 3, 2009    May 15, 2009    May 28, 2009    9.00     2,250.00
        January 21, 2009    February 15, 2009    March 2, 2009    9.00     2,250.00
                         
  Outstanding
                
  Notional
                
  Amount
           Per Annum
  Dividend Per
 
Preferred Stock (in millions)  Declaration Date  Record Date  Payment Date  Dividend Rate  Share 
Series 1 (5)
 $146   January 4, 2011   February 15, 2011   February 28, 2011   Floating  $0.19167 
       October 4, 2010   November 15, 2010   November 29, 2010   Floating   0.19167 
       July 2, 2010   August 15, 2010   August 31, 2010   Floating   0.19167 
       April 2, 2010   May 15, 2010   May 28, 2010   Floating   0.18542 
       January 4, 2010   February 15, 2010   February 26, 2010   Floating   0.19167 
                         
Series 2 (5)
 $526   January 4, 2011   February 15, 2011   February 28, 2011   Floating  $0.19167 
       October 4, 2010   November 15, 2010   November 29, 2010   Floating   0.19167 
       July 2, 2010   August 15, 2010   August 31, 2010   Floating   0.19167 
       April 2, 2010   May 15, 2010   May 28, 2010   Floating   0.18542 
       January 4, 2010   February 15, 2010   February 26, 2010   Floating   0.19167 
                         
Series 3 (5)
 $670   January 4, 2011   February 15, 2011   February 28, 2011   6.375% $0.39843 
       October 4, 2010   November 15, 2010   November 29, 2010   6.375   0.39843 
       July 2, 2010   August 15, 2010   August 30, 2010   6.375   0.39843 
       April 2, 2010   May 15, 2010   May 28, 2010   6.375   0.39843 
       January 4, 2010   February 15, 2010   March 1, 2010   6.375   0.39843 
                         
Series 4 (5)
 $389   January 4, 2011   February 15, 2011   February 28, 2011   Floating  $0.25556 
       October 4, 2010   November 15, 2010   November 29, 2010   Floating   0.25556 
       July 2, 2010   August 15, 2010   August 31, 2010   Floating   0.25556 
       April 2, 2010   May 15, 2010   May 28, 2010   Floating   0.24722 
       January 4, 2010   February 15, 2010   February 26, 2010   Floating   0.25556 
                         
Series 5 (5)
 $606   January 4, 2011   February 1, 2011   February 22, 2011   Floating  $0.25556 
       October 4, 2010   November 1, 2010   November 22, 2010   Floating   0.25556 
       July 2, 2010   August 1, 2010   August 23, 2010   Floating   0.25556 
       April 2, 2010   May 1, 2010   May 21, 2010   Floating   0.24722 
       January 4, 2010   February 1, 2010   February 22, 2010   Floating   0.25556 
                         
Series 6 (6)
 $65   January 4, 2011   March 15, 2011   March 30, 2011   6.70% $0.41875 
       October 4, 2010   December 15, 2010   December 30, 2010   6.70   0.41875 
       July 2, 2010   September 15, 2010   September 30, 2010   6.70   0.41875 
       April 2, 2010   June 15, 2010   June 30, 2010   6.70   0.41875 
       January 4, 2010   March 15, 2010   March 30, 2010   6.70   0.41875 
                         
Series 7 (6)
 $17   January 4, 2011   March 15, 2011   March 30, 2011   6.25% $0.39062 
       October 4, 2010   December 15, 2010   December 30, 2010   6.25   0.39062 
       July 2, 2010   September 15, 2010   September 30, 2010   6.25   0.39062 
       April 2, 2010   June 15, 2010   June 30, 2010   6.25   0.39062 
       January 4, 2010   March 15, 2010   March 30, 2010   6.25   0.39062 
                         
Series 8 (5)
 $2,673   January 4, 2011   February 15, 2011   February 28, 2011   8.625% $0.53906 
       October 4, 2010   November 15, 2010   November 29, 2010   8.625   0.53906 
       July 2, 2010   August 15, 2010   August 31, 2010   8.625   0.53906 
       April 2, 2010   May 15, 2010   May 28, 2010   8.625   0.53906 
       January 4, 2010   February 15, 2010   March 1, 2010   8.625   0.53906 
                         
Series 2 (MC) (7)
 $   October 4, 2010   October 5, 2010   October 15, 2010   9.00% $1,150.00 
       July 2, 2010   August 15, 2010   August 30, 2010   9.00   2,250.00 
       April 2, 2010   May 15, 2010   May 28, 2010   9.00   2,250.00 
       January 4, 2010   February 15, 2010   March 1, 2010   9.00   2,250.00 
                         
Series 3 (MC) (8)
 $   October 4, 2010   October 5, 2010   October 15, 2010   9.00% $1,150.00 
       July 2, 2010   August 15, 2010   August 30, 2010   9.00   2,250.00 
       April 2, 2010   May 15, 2010   May 28, 2010   9.00   2,250.00 
       January 4, 2010   February 15, 2010   March 1, 2010   9.00   2,250.00 
                         
(1)(5)

Dividends are cumulative.

(2)

Dividends per depositary share, each representing a 1/1000th1200th interest in a share of preferred stock.

(3)

Initially pays dividends semi-annually.

(4)

Dividends per depositary share, each representing 1/25th interest in a share of preferred stock.

(5)

In connection with the repurchase of the TARP preferred stock on December 9, 2009, the Corporation paid accrued and unpaid dividends to the date of repurchase of $83.33, $83.33 and $133.33 per share for Series N, Q and R, respectively.

(6)

Initial dividends

(7)

Dividends per depositary share, each representing a 1/1200th40th interest in a share of preferred stock.

(8)(7)

Dividends per depositary share, each representing 1/40th interest in a share

All of preferred stock.

(9)

Representsthe outstanding shares of the preferred stock of Merrill Lynch & Co., Inc. which is mandatorily convertible (MC)converted into 31 million shares of common stock on October 15, 2010, but optionally convertible prior to that date.2010.

(8)

All of the outstanding shares of the preferred stock of Merrill Lynch & Co., Inc. converted into 19 million shares of common stock on October 15, 2010.
118     Bank of America 2010


Table IV Outstanding Loans and Leases
                     
  December 31 
(Dollars in millions) 2010 (1)  2009  2008  2007  2006 
Consumer
                    
Residential mortgage (2)
 $257,973  $242,129  $248,063  $274,949  $241,181 
Home equity  137,981   149,126   152,483   114,820   87,893 
Discontinued real estate (3)
  13,108   14,854   19,981   n/a   n/a 
U.S. credit card  113,785   49,453   64,128   65,774   61,195 
Non-U.S. credit card
  27,465   21,656   17,146   14,950   10,999 
Direct/Indirect consumer (4)
  90,308   97,236   83,436   76,538   59,206 
Other consumer (5)
  2,830   3,110   3,442   4,170   5,231 
                     
Total consumer
  643,450   577,564   588,679   551,201   465,705 
                     
Commercial
                    
U.S. commercial (6)
  190,305   198,903   219,233   208,297   161,982 
Commercial real estate (7)
  49,393   69,447   64,701   61,298   36,258 
Commercial lease financing  21,942   22,199   22,400   22,582   21,864 
Non-U.S. commercial
  32,029   27,079   31,020   28,376   20,681 
                     
Total commercial loans  293,669   317,628   337,354   320,553   240,785 
Commercial loans measured at fair value (8)
  3,321   4,936   5,413   4,590   n/a 
                     
Total commercial
  296,990   322,564   342,767   325,143   240,785 
                     
Total loans and leases
 $940,440  $900,128  $931,446  $876,344  $706,490 
                     
98Bank of America 2009


Table IV  Outstanding Loans and Leases

(Dollars in millions) December 31
 2009    2008    2007    2006    2005

Consumer


Residential mortgage(1)

 $242,129    $248,063    $274,949    $241,181    $182,596

Home equity

  149,126     152,483     114,820     87,893     70,229

Discontinued real estate(2)

  14,854     19,981     n/a     n/a     n/a

Credit card – domestic

  49,453     64,128     65,774     61,195     58,548

Credit card – foreign

  21,656     17,146     14,950     10,999     

Direct/Indirect consumer(3)

  97,236     83,436     76,538     59,206     37,265

Other consumer(4)

  3,110     3,442     4,170     5,231     6,819

Total consumer

  577,564     588,679     551,201     465,705     355,457

Commercial


Commercial – domestic(5)

  198,903     219,233     208,297     161,982     140,533

Commercial real estate(6)

  69,447     64,701     61,298     36,258     35,766

Commercial lease financing

  22,199     22,400     22,582     21,864     20,705

Commercial – foreign

  27,079     31,020     28,376     20,681     21,330

Total commercial loans-excluding loans measured at fair value

  317,628     337,354     320,553     240,785     218,334

Commercial loans measured at fair value(7)

  4,936     5,413     4,590     n/a     n/a

Total commercial

  322,564     342,767     325,143     240,785     218,334

Total loans and leases

 $900,128    $931,446    $876,344    $706,490    $573,791
(1)

2010 period is presented in accordance with new consolidation guidance.
(2)Includes foreignnon-U.S. residential mortgages of $90 million and $552 million at December 31, 2009 mainly from the Merrill Lynch acquisition. We did not have any2010 and 2009. There were no material foreignnon-U.S. residential mortgage loans prior to January 1, 2009.

(2)(3)

Includes $11.8 billion, $13.4 billion and $18.2 billion of pay option loans, and $1.3 billion, $1.5 billion and $1.8 billion of subprime loans at December 31, 2010, 2009 and 2008. The Corporation2008, respectively. We no longer originatesoriginate these products.

(3)(4)

Includes dealer financial services loans of $42.9 billion, $41.6 billion, $40.1 billion, $37.2 billion $33.4 billion and $27.7$33.4 billion; consumer lending loans of $12.9 billion, $19.7 billion, $28.2 billion, $24.4 billion and $16.3 billion; U.S. securities-based lending margin loans of $16.6 billion, $12.9 billion, $0, $0 and $0; student loans of $6.8 billion, $10.8 billion, $8.3 billion, $4.7 billion and $0; and foreign$4.3 billion;non-U.S. consumer loans of $8.0 billion, $8.0 billion, $1.8 billion, $3.4 billion and $3.9 billion; and other consumer loans of $3.1 billion, $4.2 billion, $5.0 billion, $6.8 billion and $48 million$1.3 billion at December 31, 2010, 2009, 2008, 2007 and 2006, and 2005, respectively. The 2009 amount includes securities-based lending margin loans of $12.9 billion.

(4)(5)

Includes consumer finance loans of $1.9 billion, $2.3 billion, $2.6 billion, $3.0 billion $2.8 billion and $2.8 billion, and other foreignnon-U.S. consumer loans of $803 million, $709 million, $618 million, $829 million and $2.3 billion, and $3.8 billionconsumer overdrafts of $88 million, $144 million, $211 million, $320 million and $172 million at December 31, 2010, 2009, 2008, 2007 and 2006, and 2005, respectively.

(5)(6)

Includes U.S. small business commercial – domestic loans, including card relatedcard-related products, of $14.7 billion, $17.5 billion, $19.1 billion, $19.3 billion $15.2 billion and $7.2$15.2 billion at December 31, 2010, 2009, 2008, 2007 and 2006, and 2005, respectively.

(6)(7)

Includes domesticU.S. commercial real estate loans of $46.9 billion, $66.5 billion, $63.7 billion, $60.2 billion and $35.7 billion and $35.2 billion, and foreignnon-U.S. commercial real estate loans of $2.5 billion, $3.0 billion, $979 million, $1.1 billion $578 million and $585$578 million at December 31, 2010, 2009, 2008, 2007 and 2006, and 2005, respectively.

(7)(8)

Certain commercial loans are accounted for under the fair value option and include U.S. commercial – domestic loans of $1.6 billion, $3.0 billion, $3.5 billion and $3.5 billion,non-U.S. commercial – foreign loans of $1.7 billion, $1.9 billion, $1.7 billion and $790 million, and commercial real estate loans of $79 million, $90 million, $203 million and $304 million at December 31, 2010, 2009, 2008 and 2007, respectively.

n/a

= not applicable

n/a = not applicable
Table V Nonperforming Loans, Leases and Foreclosed Properties(1)
                     
  December 31 
(Dollars in millions) 2010  2009  2008  2007  2006 
Consumer
                    
Residential mortgage $17,691  $16,596  $7,057  $1,999  $660 
Home equity  2,694   3,804   2,637   1,340   289 
Discontinued real estate  331   249   77   n/a   n/a 
Direct/Indirect consumer  90   86   26   8   4 
Other consumer  48   104   91   95   77 
                     
Total consumer (2)
  20,854   20,839   9,888   3,442   1,030 
                     
Commercial
                    
U.S. commercial (3)
  3,453   4,925   2,040   852   494 
Commercial real estate  5,829   7,286   3,906   1,099   118 
Commercial lease financing  117   115   56   33   42 
Non-U.S. commercial
  233   177   290   19   13 
                     
   9,632   12,503   6,292   2,003   667 
U.S. small business commercial  204   200   205   152   90 
                     
Total commercial (4)
  9,836   12,703   6,497   2,155   757 
                     
Total nonperforming loans and leases
  30,690   33,542   16,385   5,597   1,787 
Foreclosed properties  1,974   2,205   1,827   351   69 
                     
Total nonperforming loans, leases and foreclosed properties(5)
 $32,664  $35,747  $18,212  $5,948  $1,856 
                     
Bank of America 200999


Table V  Nonperforming Loans, Leases and Foreclosed Properties(1)

  December 31
(Dollars in millions) 2009    2008    2007    2006    2005

Consumer


Residential mortgage

 $16,596    $7,057    $1,999    $660    $570

Home equity

  3,804     2,637     1,340     289     151

Discontinued real estate

  249     77     n/a     n/a     n/a

Direct/Indirect consumer

  86     26     8     4     3

Other consumer

  104     91     95     77     61

Total consumer(2)

  20,839     9,888     3,442     1,030     785

Commercial


Commercial – domestic(3)

  4,925     2,040     852     494     550

Commercial real estate

  7,286     3,906     1,099     118     49

Commercial lease financing

  115     56     33     42     62

Commercial – foreign

  177     290     19     13     34
  12,503     6,292     2,003     667     695

Small business commercial – domestic

  200     205     152     90     31

Total commercial(4)

  12,703     6,497     2,155     757     726

Total nonperforming loans and leases

  33,542     16,385     5,597     1,787     1,511

Foreclosed properties

  2,205     1,827     351     69     92

Total nonperforming loans, leases and foreclosed properties(5)

 $35,747    $18,212    $5,948    $1,856    $1,603
(1)

Balances do not include purchased impairedPCI loans even though the customer may be contractually past due. Loans accounted for as purchased impairedPCI loans were written down to fair value upon acquisition and accrete interest income over the remaining life of the loan.

In addition, FHA loans are excluded from nonperforming loans and foreclosed properties since the principal payments are insured by the FHA.
(2)

In 2009, $1.42010, $2.0 billion in interest income was estimated to be contractually due on consumer loans and leases classified as nonperforming at December 31, 20092010 provided that these loans and leases had been paying according to their terms and conditions, including troubled debt restructured loansTDRs of which $3.0$9.9 billion were performing at December 31, 20092010 and not included in the table above. Approximately $194$514 million of the estimated $1.4$2.0 billion in contractual interest was received and included in earnings for 2009.

2010.
(3)

Excludes U.S. small business commercial – domestic loans.

(4)

In 2009, $4502010, $429 million in interest income was estimated to be contractually due on commercial loans and leases classified as nonperforming at December 31, 2009,2010, including troubled debt restructured loansTDRs of which $91$238 million were performing at December 31, 20092010 and not included in the table above. Approximately $128$76 million of the estimated $450$429 million in contractual interest was received and included in earnings for 2009.

2010.
(5)

Balances do not include loans accounted for under the fair value option. At December 31, 2009,2010, there were $15$30 million of nonperforming loans accounted for under the fair value option. At December 31, 2009,2010, there were $87 million$0 of loans or leases past due 90 days or more and still accruing interest accounted for under the fair value option.

n/a

= not applicable

100Bank of America 2009
n/a = not applicable
Bank of America 2010     119


Table VIAccruing Loans and Leases Past Due 90 Days or More(1)

  December 31
(Dollars in millions) 2009  2008  2007  2006  2005

Consumer


Residential mortgage(2)

 $11,680  $372  $237  $118  $

Credit card – domestic

  2,158   2,197   1,855   1,991   1,197

Credit card – foreign

  500   368   272   184   

Direct/Indirect consumer

  1,488   1,370   745   378   75

Other consumer

  3   4   4   7   15

Total consumer

  15,829   4,311   3,113   2,678   1,287

Commercial


Commercial – domestic(3)

  213   381   119   66   79

Commercial real estate

  80   52   36   78   4

Commercial lease financing

  32   23   25   26   15

Commercial – foreign

  67   7   16   9   32
  392   463   196   179   130

Small business commercial – domestic

  624   640   427   199   38

Total commercial

  1,016   1,103   623   378   168

Total accruing loans and leases past due 90 days or more(4)

 $16,845  $5,414  $3,736  $3,056  $1,455
                     
  December 31 
(Dollars in millions) 2010  2009  2008  2007  2006 
Consumer
                    
Residential mortgage(2)
 $16,768  $11,680  $372  $237  $118 
U.S. credit card  3,320   2,158   2,197   1,855   1,991 
Non-U.S. credit card
  599   515   368   272   184 
Direct/Indirect consumer  1,058   1,488   1,370   745   378 
Other consumer  2   3   4   4   7 
                     
Total consumer
  21,747   15,844   4,311   3,113   2,678 
                     
Commercial
                    
U.S. commercial (3)
  236   213   381   119   66 
Commercial real estate  47   80   52   36   78 
Commercial lease financing  18   32   23   25   26 
Non-U.S. commercial
  6   67   7   16   9 
                     
   307   392   463   196   179 
U.S. small business commercial  325   624   640   427   199 
                     
Total commercial
  632   1,016   1,103   623   378 
                     
Total accruing loans and leases past due 90 days or more(4)
 $22,379  $16,860  $5,414  $3,736  $3,056 
                     
(1)

Accruing loans past due 90 days or more do not include purchasedPCI loan portfolios of Countrywide and Merrill Lynch that were considered impaired loans which wereand written down to fair value upon acquisition and accrete interest income over the remaining life of the loan.

(2)

Balances represent repurchases ofloans insured or guaranteed loans.

by the FHA.
(3)

Excludes U.S. small business commercial – domestic loans.

(4)

Balances do not include loans accounted for under the fair value option. At December 31, 2010, there were no loans past due 90 days or more and still accruing interest accounted for under the fair value option. At December 31, 2009, there werewas $87 million of loans past due 90 days or more and still accruing interest accounted for under the fair value option.

120     Bank of America 2010


Table VII Allowance for Credit Losses
                      
(Dollars in millions)  2010  2009  2008  2007  2006 
Allowance for loan and lease losses, beginning of period, before effect of the January 1 adoption of new consolidation guidance
  $37,200  $23,071  $11,588  $9,016  $8,045 
Allowance related to adoption of new consolidation guidance   10,788   n/a   n/a   n/a   n/a 
                      
Allowance for loan and lease losses, January 1
   47,988   23,071   11,588   9,016   8,045 
Loans and leases charged off
                     
Residential mortgage   (3,779)  (4,436)  (964)  (78)  (74)
Home equity   (7,059)  (7,205)  (3,597)  (286)  (67)
Discontinued real estate   (77)  (104)  (19)  n/a   n/a 
U.S. credit card   (13,818)  (6,753)  (4,469)  (3,410)  (3,546)
Non-U.S. credit card
   (2,424)  (1,332)  (639)  (453)  (292)
Direct/Indirect consumer   (4,303)  (6,406)  (3,777)  (1,885)  (857)
Other consumer   (320)  (491)  (461)  (346)  (327)
                      
Total consumer charge-offs   (31,780)  (26,727)  (13,926)  (6,458)  (5,163)
                      
U.S. commercial (1)
   (3,190)  (5,237)  (2,567)  (1,135)  (597)
Commercial real estate   (2,185)  (2,744)  (895)  (54)  (7)
Commercial lease financing   (96)  (217)  (79)  (55)  (28)
Non-U.S. commercial
   (139)  (558)  (199)  (28)  (86)
                      
Total commercial charge-offs   (5,610)  (8,756)  (3,740)  (1,272)  (718)
                      
Total loans and leases charged off   (37,390)  (35,483)  (17,666)  (7,730)  (5,881)
                      
Recoveries of loans and leases previously charged off
                     
Residential mortgage   109   86   39   22   35 
Home equity   278   155   101   12   16 
Discontinued real estate   9   3   3   n/a   n/a 
U.S. credit card   791   206   308   347   452 
Non-U.S. credit card
   217   93   88   74   67 
Direct/Indirect consumer   967   943   663   512   247 
Other consumer   59   63   62   68   110 
                      
Total consumer recoveries   2,430   1,549   1,264   1,035   927 
                      
U.S. commercial (2)
   391   161   118   128   261 
Commercial real estate   168   42   8   7   4 
Commercial lease financing   39   22   19   53   56 
Non-U.S. commercial
   28   21   26   27   94 
                      
Total commercial recoveries   626   246   171   215   415 
                      
Total recoveries of loans and leases previously charged off   3,056   1,795   1,435   1,250   1,342 
                      
Net charge-offs   (34,334)  (33,688)  (16,231)  (6,480)  (4,539)
                      
Provision for loan and lease losses   28,195   48,366   26,922   8,357   5,001 
Other (3)
   36   (549)  792   695   509 
                      
Allowance for loan and lease losses, December 31   41,885   37,200   23,071   11,588   9,016 
                      
Reserve for unfunded lending commitments, January 1
   1,487   421   518   397   395 
Provision for unfunded lending commitments   240   204   (97)  28   9 
Other (4)
   (539)  862      93   (7)
                      
Reserve for unfunded lending commitments, December 31   1,188   1,487   421   518   397 
                      
Allowance for credit losses, December 31
  $43,073  $38,687  $23,492  $12,106  $9,413 
                      
Bank of America 2009101


Table VII  Allowance for Credit Losses

(Dollars in millions) 2009   2008   2007   2006   2005 

Allowance for loan and lease losses, January 1

 $23,071    $11,588    $9,016    $8,045    $8,626  

Loans and leases charged off


Residential mortgage

  (4,436   (964   (78   (74   (58

Home equity

  (7,205   (3,597   (286   (67   (46

Discontinued real estate

  (104   (19   n/a     n/a     n/a  

Credit card – domestic

  (6,753   (4,469   (3,410   (3,546   (4,018

Credit card – foreign

  (1,332   (639   (453   (292     

Direct/Indirect consumer

  (6,406   (3,777   (1,885   (857   (380

Other consumer

  (491   (461   (346   (327   (376

Total consumer charge-offs

  (26,727   (13,926   (6,458   (5,163   (4,878

Commercial – domestic(1)

  (5,237   (2,567   (1,135   (597   (535

Commercial real estate

  (2,744   (895   (54   (7   (5

Commercial lease financing

  (217   (79   (55   (28   (315

Commercial – foreign

  (558   (199   (28   (86   (61

Total commercial charge-offs

  (8,756   (3,740   (1,272   (718   (916

Total loans and leases charged off

  (35,483   (17,666   (7,730   (5,881   (5,794

Recoveries of loans and leases previously charged off


Residential mortgage

  86     39     22     35     31  

Home equity

  155     101     12     16     15  

Discontinued real estate

  3     3     n/a     n/a     n/a  

Credit card – domestic

  206     308     347     452     366  

Credit card – foreign

  93     88     74     67       

Direct/Indirect consumer

  943     663     512     247     132  

Other consumer

  63     62     68     110     101  

Total consumer recoveries

  1,549     1,264     1,035     927     645  

Commercial – domestic(2)

  161     118     128     261     365  

Commercial real estate

  42     8     7     4     5  

Commercial lease financing

  22     19     53     56     84  

Commercial – foreign

  21     26     27     94     133  

Total commercial recoveries

  246     171     215     415     587  

Total recoveries of loans and leases previously charged off

  1,795     1,435     1,250     1,342     1,232  

Net charge-offs

  (33,688   (16,231   (6,480   (4,539   (4,562

Provision for loan and lease losses

  48,366     26,922     8,357     5,001     4,021  

Write-downs on consumer purchased impaired loans(3)

  (179   n/a     n/a     n/a     n/a  

Other(4)

  (370   792     695     509     (40

Allowance for loan and lease losses, December 31

  37,200     23,071     11,588     9,016     8,045  

Reserve for unfunded lending commitments, January 1

  421     518     397     395     402  

Provision for unfunded lending commitments

  204     (97   28     9     (7

Other(5)

  862          93     (7     

Reserve for unfunded lending commitments, December 31

  1,487     421     518     397     395  

Allowance for credit losses, December 31

 $38,687    $23,492    $12,106    $9,413    $8,440  

Loans and leases outstanding at December 31(6)

 $895,192    $926,033    $871,754    $706,490    $573,791  

Allowance for loan and lease losses as a percentage of total loans and leases outstanding at December 31(3, 6)

  4.16   2.49   1.33   1.28   1.40

Consumer allowance for loan and lease losses as a percentage of total consumer loans and leases outstanding at December 31 (3)

  4.81     2.83     1.23     1.19     1.27  

Commercial allowance for loan and lease losses as a percentage of total commercial loans and leases outstanding at December 31(3)

  2.96     1.90     1.51     1.44     1.62  

Average loans and leases outstanding(3, 6)

 $941,862    $905,944    $773,142    $652,417    $537,218  

Net charge-offs as a percentage of average loans and leases outstanding(3, 6)

  3.58   1.79   0.84   0.70   0.85

Allowance for loan and lease losses as a percentage of total nonperforming loans and leases at December 31(3, 6)

  111     141     207     505     532  

Ratio of the allowance for loan and lease losses at December 31 to net charge-offs (3)

  1.10     1.42     1.79     1.99     1.76  
(1)

Includes U.S. small business commercial – domestic charge-offs of $2.0 billion, $3.0 billion, $2.0 billion, $931 million and $424 million in 2010, 2009, 2008, 2007 and 2006, respectively. Small business commercial – domestic charge offs were not material in 2005.

(2)

Includes U.S. small business commercial – domestic recoveries of $107 million, $65 million, $39 million, $51 million and $54 million in 2010, 2009, 2008, 2007 and 2006, respectively. Small business commercial – domestic recoveries were not material in 2005.

(3)

Allowance for loan and leases losses includes $3.9 billion and $750 million of valuation allowance for consumer purchased impaired loans at December 31, 2009 and 2008. Excluding the valuation allowance for purchased impaired loans, allowance for loan and leases losses as a percentage of total nonperforming loans and leases would have been 99 percent and 136 percent at December 31, 2009 and 2008. For more information on the impact of purchased impaired loans on asset quality statistics, see Consumer Portfolio Credit Risk Management beginning on page 54 and Commercial Portfolio Credit Risk Management beginning on page 64.

(4)

The 2009 amount includes a $750 million reduction in the allowance for loan and lease losses related to credit card loans of $8.5 billion which were exchanged for a $7.8 billion inheld-to-maturity debt securitysecurities that waswere issued by the Corporation’s U.S. Credit Card Securitization Trust and retained by the Corporation. This reduction was partially offset by a $340 million increase associated with the reclassification to other assets of the December 31, 2008 amount expected to be reimbursed under residential mortgage cash collateralized synthetic securitizations. The 2008 amount includes the $1.2 billion addition of the Countrywide allowance for loan losses as of July 1, 2008. The 2007 amount includes the $725and 2006 amounts include $750 million and $25$577 million of additions of the LaSalle and U.S. Trust Corporationto allowance for loan losses as of October 1, 2007 and July 1, 2007 and a reduction of $32 million for the adjustment from the adoption of the fair value option accounting guidance. certain acquisitions.

(4)The 20062010 amount includes the $577 billion addition of the MBNA Corporation allowance for loan losses as of January 1, 2006

(5)

The 2009 amount represents the fair valueremaining balance of the acquired Merrill Lynch unfunded lending commitmentsliability excluding those commitments accounted for under the fair value option, net of accretion, and the impact of funding previously unfunded positions. The 2009 amount represents primarily accretion of the Merrill Lynch purchase accounting adjustment and the impact of funding previously unfunded positions. The 2007 amount includes thea $124 million addition of the LaSallefor reserve for unfunded lending commitments as of October 1, 2007 andfor a $28 million reduction for the adjustment from the adoption of the fair value option accounting guidance.

prior acquisition.
n/a = not applicable
Bank of America 2010     121


Table VII Allowance for Credit Losses (continued)
                      
(Dollars in millions)  2010  2009  2008  2007  2006 
Loans and leases outstanding at December 31 (5)
  $937,119  $895,192  $926,033  $871,754  $706,490 
Allowance for loan and lease losses as a percentage of total loans and leases                     
outstanding at December 31 (5)
   4.47%  4.16%  2.49%  1.33%  1.28%
Consumer allowance for loan and lease losses as a percentage of total consumer loans and leases outstanding at December 31   5.40   4.81   2.83   1.23   1.19 
Commercial allowance for loan and lease losses as a percentage of total                     
commercial loans and leases outstanding at December 31 (5)
   2.44   2.96   1.90   1.51   1.44 
Average loans and leases outstanding (5)
  $954,278  $941,862  $905,944  $773,142  $652,417 
Net charge-offs as a percentage of average loans and leases outstanding (5)
   3.60%  3.58%  1.79%  0.84%  0.70%
Allowance for loan and lease losses as a percentage of total nonperforming loans and leases at December 31(5, 6, 7)
   136   111   141   207   505 
Ratio of the allowance for loan and lease losses at December 31 to net charge-offs   1.22   1.10   1.42   1.79   1.99 
                      
Excluding purchased credit-impaired loans: (8)
                     
Allowance for loan and lease losses as a percentage of total loans and leases outstanding at December 31 (5)
   3.94%  3.88%  2.53%  n/a   n/a 
Consumer allowance for loan and lease losses as a percentage of total consumer loans and leases outstanding at December 31   4.66   4.43   2.91   n/a   n/a 
Commercial allowance for loan and lease losses as a percentage of total commercial loans and leases outstanding at December 31 (5)
   2.44   2.96   1.90   n/a   n/a 
Net charge-offs as a percentage of average loans and leases outstanding (5)
   3.73   3.71   1.83   n/a   n/a 
Allowance for loan and lease losses as a percentage of total nonperforming loans and leases at December 31(5, 6, 7)
   116   99   136   n/a   n/a 
Ratio of the allowance for loan and lease losses at December 31 to net charge-offs   1.04   1.00   1.38   n/a   n/a 
                      
(6)(5)

Outstanding loan and lease balances and ratios do not include loans accounted for under the fair value option at andoption. Loans accounted for under the years ended December 31, 2009, 2008 and 2007. Loans measured at fair value option were $3.3 billion, $4.9 billion, $5.4 billion and $4.6 billion at December 31, 2010, 2009, 2008 and 2007, respectively. Average loans accounted for under the fair value option were $4.1 billion, $6.9 billion, $4.9 billion and $3.0 billion for 2010, 2009, 2008 and 2007, respectively.
(6)

Allowance for loan and lease losses includes $22.9 billion, $17.7 billion, $11.7 billion, $6.5 billion and $5.4 billion allocated to products that were excluded from nonperforming loans, leases and foreclosed properties at December 31, 2010, 2009, 2008, 2007 and 2006, respectively.
(7)For more information on our definition of nonperforming loans, see the discussion beginning on page 81.
(8)Metrics exclude the impact of Countrywide consumer PCI loans and Merrill Lynch commercial PCI loans.

n/a = not applicable

102Bank of America 2009
122     Bank of America 2010


Table VIIIAllocation of the Allowance for Credit Losses by Product Type

  December 31 
  2009  2008     2007     2006     2005 
(Dollars in millions) Amount  Percent
of Total
      Amount  Percent
of Total
      Amount  Percent
of Total
      Amount  Percent
of Total
      Amount  Percent
of Total
 

Allowance for loan and lease losses


Residential mortgage

 $4,607  12.38   $1,382  5.99   $207  1.79   $248  2.75   $277  3.44

Home equity

  10,160  27.31      5,385  23.34      963  8.31      133  1.48      136  1.69  

Discontinued real estate

  989  2.66      658  2.85      n/a  n/a      n/a  n/a      n/a  n/a  

Credit card – domestic

  6,017  16.18      3,947  17.11      2,919  25.19      3,176  35.23      3,301  41.03  

Credit card – foreign

  1,581  4.25      742  3.22      441  3.81      336  3.73      -  -  

Direct/Indirect consumer

  4,227  11.36      4,341  18.81      2,077  17.92      1,378  15.28      421  5.23  

Other consumer

  204  0.55       203  0.88       151  1.30       289  3.20       380  4.73  

Total consumer

  27,785  74.69       16,658  72.20       6,758  58.32       5,560  61.67       4,515  56.12  

Commercial – domestic(1)

  5,152  13.85      4,339  18.81      3,194  27.56      2,162  23.98      2,100  26.10  

Commercial real estate

  3,567  9.59      1,465  6.35      1,083  9.35      588  6.52      609  7.57  

Commercial lease financing

  291  0.78      223  0.97      218  1.88      217  2.41      232  2.89  

Commercial – foreign

  405  1.09       386  1.67       335  2.89       489  5.42       589  7.32  

Total commercial(2)

  9,415  25.31       6,413  27.80       4,830  41.68       3,456  38.33       3,530  43.88  

Allowance for loan and lease losses

  37,200  100.00    23,071  100.00    11,588  100.00    9,016  100.00    8,045  100.00

Reserve for unfunded lending commitments(3)

  1,487      421      518      397      395  

Allowance for credit losses (4)

 $38,687        $23,492        $12,106        $9,413        $8,440    
                                         
  December 31 
  2010  2009  2008  2007  2006 
     Percent
     Percent
     Percent
     Percent
     Percent
 
(Dollars in millions) Amount  of Total  Amount  of Total  Amount  of Total  Amount  of Total  Amount  of Total 
Allowance for loan and lease losses (1)
                                        
Residential mortgage $4,648   11.10% $4,607   12.38% $1,382   5.99% $207   1.79% $248   2.75%
Home equity  12,934   30.88   10,160   27.31   5,385   23.34   963   8.31   133   1.48 
Discontinued real estate  1,670   3.99   989   2.66   658   2.85   n/a   n/a   n/a   n/a 
U.S. credit card  10,876   25.97   6,017   16.18   3,947   17.11   2,919   25.19   3,176   35.23 
Non-U.S. credit card
  2,045   4.88   1,581   4.25   742   3.22   441   3.81   336   3.73 
Direct/Indirect consumer  2,381   5.68   4,227   11.36   4,341   18.81   2,077   17.92   1,378   15.28 
Other consumer  161   0.38   204   0.55   203   0.88   151   1.30   289   3.20 
                                         
Total consumer
  34,715   82.88   27,785   74.69   16,658   72.20   6,758   58.32   5,560   61.67 
                                         
U.S. commercial (2)
  3,576   8.54   5,152   13.85   4,339   18.81   3,194   27.56   2,162   23.98 
Commercial real estate  3,137   7.49   3,567   9.59   1,465   6.35   1,083   9.35   588   6.52 
Commercial lease financing  126   0.30   291   0.78   223   0.97   218   1.88   217   2.41 
Non-U.S. commercial
  331   0.79   405   1.09   386   1.67   335   2.89   489   5.42 
                                         
Total commercial (3)
  7,170   17.12   9,415   25.31   6,413   27.80   4,830   41.68   3,456   38.33 
                                         
Allowance for loan and lease losses
  41,885   100.00%  37,200   100.00%  23,071   100.00%  11,588   100.00%  9,016   100.00%
Reserve for unfunded lending commitments (4)
  1,188       1,487       421       518       397     
                                         
Allowance for credit losses (5)
 $43,073      $38,687      $23,492      $12,106      $9,413     
                                         
(1)

December 31, 2010 is presented in accordance with new consolidation guidance. Prior periods have not been restated.
(2)Includes allowance for U.S. small business commercial – domestic loans of $1.5 billion, $2.4 billion, $2.4 billion, $1.4 billion and $578 million at December 31, 2010, 2009, 2008, 2007 and 2006, respectively. The allowance for small business commercial – domestic loans was not material in 2005.

(2)(3)

Includes allowance for loan and lease losses for impaired commercial loans of $1.1 billion, $1.2 billion, $691 million, $123 million $43 million and $55$43 million at December 31, 2010, 2009, 2008, 2007 and 2006, and 2005, respectively.

Included in the $1.1 billion at December 31, 2010 is $445 million related to U.S. small business commercial renegotiated TDR loans.
(3)(4)

Amounts for 2010 and 2009 include the Merrill Lynch acquisition. The majority of the increase from December 31, 2008 relates to the fair value of the acquired Merrill Lynch unfunded lending commitments, excluding commitments accounted for under the fair value option.

(4)(5)

Includes $6.4 billion, $3.9 billion and $750 million related to purchased impairedPCI loans at December 31, 2010, 2009 and 2008.

2008, respectively.

n/a = not applicable

Table IXSelected Loan Maturity Data(1, 2)

  December 31, 2009 
(Dollars in millions) Due in One
Year or Less
   Due After
One Year
Through
Five Years
   Due After
Five Years
   Total 

Commercial – domestic

 $69,112    $90,528    $42,239    $201,879  

Commercial real estate – domestic

  30,926     26,463     9,154     66,543  

Foreign and other(3)

  25,157     8,361     262     33,780  

Total selected loans

 $125,195    $125,352    $51,655    $302,202  

Percent of total

  41.4   41.5   17.1   100.0

Sensitivity of selected loans to changes in interest rates for loans due after one year:


Fixed interest rates

   $12,612    $28,247    

Floating or adjustable interest rates

       112,740     23,408       

Total

      $125,352    $51,655       
                 
  December 31, 2010 
     Due After
       
     One Year
       
  Due in One
  Through
  Due After
    
(Dollars in millions) Year or Less  Five Years  Five Years  Total 
U.S. commercial $62,325  $84,412  $45,141  $191,878 
U.S. commercial real estate  21,097   21,084   4,777   46,958 
Non-U.S. and other (3)
  31,012   5,610   959   37,581 
                 
Total selected loans
 $114,434  $111,106  $50,877  $276,417 
                 
Percent of total  41.4%  40.2%  18.4%  100%
                 
Sensitivity of selected loans to changes in interest rates for loans due after one year:                
Fixed interest rates     $12,164  $25,619     
Floating or adjustable interest rates      98,942   25,258     
                 
Total
     $111,106  $50,877     
                 
(1)

Loan maturities are based on the remaining maturities under contractual terms.

(2)

Includes loans accounted for under the fair value option.

(3)

Loan maturities include other consumer, commercial real estate andnon-U.S. commercial – foreign loans.

Bank of America 2010     123


Table X Non-exchange Traded Commodity Contracts
         
  December 31, 2010 
  Asset
  Liability
 
(Dollars in millions) Positions  Positions 
Net fair value of contracts outstanding, January 1, 2010 $5,036  $3,758 
Effects of legally enforceable master netting agreements  17,785   17,785 
         
Gross fair value of contracts outstanding, January 1, 2010  22,821   21,543 
Contracts realized or otherwise settled  (15,531)  (14,899)
Fair value of new contracts  6,240   6,734 
Other changes in fair value  1,999   2,055 
         
Gross fair value of contracts outstanding, December 31, 2010  15,529   15,433 
Effects of legally enforceable master netting agreements  (10,756)  (10,756)
         
Net fair value of contracts outstanding, December 31, 2010
 $4,773  $4,677 
         
Table XI Non-exchange Traded Commodity Contract Maturities
         
  December 31, 2010 
  Asset
  Liability
 
(Dollars in millions) Positions  Positions 
Less than one year $9,262  $9,453 
Greater than or equal to one year and less than three years  4,631   4,395 
Greater than or equal to three years and less than five years  659   682 
Greater than or equal to five years  977   903 
         
Gross fair value of contracts outstanding  15,529   15,433 
Effects of legally enforceable master netting agreements  (10,756)  (10,756)
         
Net fair value of contracts outstanding
 $4,773  $4,677 
         
124     Bank of America 2010


Table XII Selected Quarterly Financial Data
                                 
  2010 Quarters  2009 Quarters 
(Dollars in millions, except per share information) Fourth  Third  Second  First  Fourth  Third  Second  First 
Income statement
                                
Net interest income $12,439  $12,435  $12,900  $13,749  $11,559  $11,423  $11,630  $12,497 
Noninterest income  9,959   14,265   16,253   18,220   13,517   14,612   21,144   23,261 
Total revenue, net of interest expense  22,398   26,700   29,153   31,969   25,076   26,035   32,774   35,758 
Provision for credit losses  5,129   5,396   8,105   9,805   10,110   11,705   13,375   13,380 
Goodwill impairment  2,000   10,400                   
Merger and restructuring charges  370   421   508   521   533   594   829   765 
All other noninterest expense (1)
  18,494   16,395   16,745   17,254   15,852   15,712   16,191   16,237 
Income (loss) before income taxes  (3,595)  (5,912)  3,795   4,389   (1,419)  (1,976)  2,379   5,376 
Income tax expense (benefit)  (2,351)  1,387   672   1,207   (1,225)  (975)  (845)  1,129 
Net income (loss)  (1,244)  (7,299)  3,123   3,182   (194)  (1,001)  3,224   4,247 
Net income (loss) applicable to common shareholders  (1,565)  (7,647)  2,783   2,834   (5,196)  (2,241)  2,419   2,814 
Average common shares issued and outstanding (in thousands)  10,036,575   9,976,351   9,956,773   9,177,468   8,634,565   8,633,834   7,241,515   6,370,815 
Average diluted common shares issued and outstanding (in thousands)  10,036,575   9,976,351   10,029,776   10,005,254   8,634,565   8,633,834   7,269,518   6,431,027 
                                 
Performance ratios
                                
Return on average assets  n/m   n/m   0.50%  0.51%  n/m   n/m   0.53%  0.68%
Four quarter trailing return on average assets (2)
  n/m   n/m   0.20   0.21   0.26%  0.20%  0.28   0.28 
Return on average common shareholders’ equity  n/m   n/m   5.18   5.73   n/m   n/m   5.59   7.10 
Return on average tangible common shareholders’ equity (3)
  n/m   n/m   9.19   9.79   n/m   n/m   12.68   16.15 
Return on average tangible shareholders’ equity (3)
  n/m   n/m   8.98   9.55   n/m   n/m   8.86   12.42 
Total ending equity to total ending assets  10.08%  9.85%  9.85   9.80   10.38   11.40   11.29   10.32 
Total average equity to total average assets  9.94   9.83   9.36   9.14   10.31   10.67   10.01   9.08 
Dividend payout  n/m   n/m   3.63   3.57   n/m   n/m   3.56   2.28 
                                 
Per common share data
                                
Earnings (loss) $(0.16) $(0.77) $0.28  $0.28  $(0.60) $(0.26) $0.33  $0.44 
Diluted earnings (loss)  (0.16)  (0.77)  0.27   0.28   (0.60)  (0.26)  0.33   0.44 
Dividends paid  0.01   0.01   0.01   0.01   0.01   0.01   0.01   0.01 
Book value  20.99   21.17   21.45   21.12   21.48   22.99   22.71   25.98 
Tangible book value (3)
  12.98   12.91   12.14   11.70   11.94   12.00   11.66   10.88 
                                 
Market price per share of common stock
                                
Closing $13.34  $13.10  $14.37  $17.85  $15.06  $16.92  $13.20  $6.82 
High closing  13.56   15.67   19.48   18.04   18.59   17.98   14.17   14.33 
Low closing  10.95   12.32   14.37   14.45   14.58   11.84   7.05   3.14 
                                 
Market capitalization
 $134,536  $131,442  $144,174  $179,071  $130,273  $146,363  $114,199  $43,654 
                                 
Average balance sheet
                                
Total loans and leases $940,614  $934,860  $967,054  $991,615  $905,913  $930,255  $966,105  $994,121 
Total assets  2,370,258   2,379,397   2,494,432   2,516,590   2,431,024   2,398,201   2,425,377   2,519,134 
Total deposits  1,007,738   973,846   991,615   981,015   995,160   989,295   974,892   964,081 
Long-term debt  465,875   485,588   497,469   513,634   445,440   449,974   444,131   446,975 
Common shareholders’ equity  218,728   215,911   215,468   200,380   197,123   197,230   173,497   160,739 
Total shareholders’ equity  235,525   233,978   233,461   229,891   250,599   255,983   242,867   228,766 
                                 
Asset quality (4)
                                
Allowance for credit losses (5)
 $43,073  $44,875  $46,668  $48,356  $38,687  $37,399  $35,777  $31,150 
Nonperforming loans, leases and foreclosed properties (6)
  32,664   34,556   35,598   35,925   35,747   33,825   30,982   25,632 
Allowance for loan and lease losses as a percentage of total loans and leases outstanding (6)
  4.47%  4.69%  4.75%  4.82%  4.16%  3.95%  3.61%  3.00%
Allowance for loan and lease losses as a percentage of total nonperforming loans and leases (6, 7)
  136   135   137   139   111   112   116   122 
Allowance for loan and lease losses as a percentage of total nonperforming loans and leases excluding the purchased credit-impaired loan portfolio(6, 7)
  116   118   121   124   99   101   108   115 
Net charge-offs $6,783  $7,197  $9,557  $10,797  $8,421  $9,624  $8,701  $6,942 
Annualized net charge-offs as a percentage of average loans and leases outstanding (6)
  2.87%  3.07%  3.98%  4.44%  3.71%  4.13%  3.64%  2.85%
Nonperforming loans and leases as a percentage of total loans and leases outstanding (6)
  3.27   3.47   3.48   3.46   3.75   3.51   3.12   2.47 
Nonperforming loans, leases and foreclosed properties as a percentage of total loans, leases and foreclosed properties (6)
  3.48   3.71   3.73   3.69   3.98   3.72   3.31   2.64 
Ratio of the allowance for loan and lease losses at period end to annualized net charge-offs  1.56   1.53   1.18   1.07   1.11   0.94   0.97   1.03 
                                 
Capital ratios (period end)
                                
Risk-based capital:                                
Tier 1 common  8.60%  8.45%  8.01%  7.60%  7.81%  7.25%  6.90%  4.49%
Tier 1  11.24   11.16   10.67   10.23   10.40   12.46   11.93   10.09 
Total  15.77   15.65   14.77   14.47   14.66   16.69   15.99   14.03 
Tier 1 leverage  7.21   7.21   6.68   6.44   6.88   8.36   8.17   7.07 
Tangible equity (3)
  6.75   6.54   6.14   6.02   6.40   7.51   7.37   6.42 
Tangible common equity (3)
  5.99   5.74   5.35   5.22   5.56   4.80   4.66   3.13 
                                 
Bank of America 2009103


Table X  Non-exchange Traded Commodity Contracts

  December 31, 2009 
(Dollars in millions) Asset
Positions
   Liability
Positions
 

Net fair value of contracts outstanding, January 1, 2009

 $9,433    $6,726  

Effects of legally enforceable master netting agreements

  30,021     30,021  

Gross fair value of contracts outstanding, January 1, 2009

  39,454     36,747  

Contracts realized or otherwise settled

  (19,654   (18,623

Fair value of new contracts

  9,231     9,284  

Other changes in fair value

  (6,210   (5,865

Gross fair value of contracts outstanding, December 31, 2009

  22,821     21,543  

Effects of legally enforceable master netting agreements

  (17,785   (17,785

Net fair value of contracts outstanding, December 31, 2009

 $5,036    $3,758  

Table XI  Non-exchange Traded Commodity Contract Maturities

  December 31, 2009 
(Dollars in millions) Asset
Positions
   Liability
Positions
 

Maturity of less than 1 year

 $16,161    $15,431  

Maturity of 1-3 years

  4,603     4,295  

Maturity of 4-5 years

  774     542  

Maturity in excess of 5 years

  1,283     1,275  

Gross fair value of contracts outstanding

  22,821     21,543  

Effects of legally enforceable master netting agreements

  (17,785   (17,785

Net fair value of contracts outstanding

 $5,036    $3,758  

104Bank of America 2009


Table XII  Selected Quarterly Financial Data

  2009 Quarters    2008 Quarters 
(Dollars in millions, except per share information) Fourth  Third  Second  First    Fourth  Third  Second  First 

Income statement


Net interest income

 $11,559   $11,423   $11,630   $12,497    $13,106   $11,642   $10,621   $9,991  

Noninterest income

  13,517    14,612    21,144    23,261     2,574    7,979    9,789    7,080  

Total revenue, net of interest expense

  25,076    26,035    32,774    35,758     15,680    19,621    20,410    17,071  

Provision for credit losses

  10,110    11,705    13,375    13,380     8,535    6,450    5,830    6,010  

Noninterest expense, before merger and restructuring charges

  15,852    15,712    16,191    16,237     10,641    11,413    9,447    9,093  

Merger and restructuring charges

  533    594    829    765     306    247    212    170  

Income (loss) before income taxes

  (1,419  (1,976  2,379    5,376     (3,802  1,511    4,921    1,798  

Income tax expense (benefit)

  (1,225  (975  (845  1,129     (2,013  334    1,511    588  

Net income (loss)

  (194  (1,001  3,224    4,247     (1,789  1,177    3,410    1,210  

Net income (loss) applicable to
common shareholders

  (5,196  (2,241  2,419    2,814     (2,392  704    3,224    1,020  

Average common shares issued and
outstanding (in thousands)

  8,634,565    8,633,834    7,241,515    6,370,815     4,957,049    4,543,963    4,435,719    4,427,823  

Average diluted common shares issued and outstanding (in thousands)

  8,634,565    8,633,834    7,269,518    6,431,027      4,957,049    4,547,578    4,444,098    4,461,201  

Performance ratios


Return on average assets

  n/m    n/m    0.53  0.68   n/m    0.25  0.78  0.28

Return on average common shareholders’ equity

  n/m    n/m    5.59    7.10     n/m    1.97    9.25    2.90  

Return on average tangible common
shareholders’ equity(1)

  n/m    n/m    12.68    16.15     n/m    5.34    23.78    7.37  

Return on average tangible shareholders’ equity(1)

  n/m    n/m    8.86    12.42     n/m    6.11    18.12    7.06  

Total ending equity to total ending assets

  10.41  11.45  11.32    10.32     9.74  8.79    9.48    9.00  

Total average equity to total average assets

  10.35    10.71    10.03    9.08     9.06    8.73    9.20    8.77  

Dividend payout

  n/m    n/m    3.56    2.28      n/m    n/m    88.67    n/m  

Per common share data


Earnings (loss)

 $(0.60 $(0.26 $0.33   $0.44    $(0.48 $0.15   $0.72   $0.23  

Diluted earnings (loss)

  (0.60  (0.26  0.33    0.44     (0.48  0.15    0.72    0.23  

Dividends paid

  0.01    0.01    0.01    0.01     0.32    0.64    0.64    0.64  

Book value

  21.48    22.99    22.71    25.98     27.77    30.01    31.11    31.22  

Tangible book value(1)

  11.94    12.00    11.66    10.88      10.11    10.50    11.87    11.90  

Market price per share of common stock


Closing

 $15.06   $16.92   $13.20   $6.82    $14.08   $35.00   $23.87   $37.91  

High closing

  18.59    17.98    14.17    14.33     38.13    37.48    40.86    45.03  

Low closing

  14.58    11.84    7.05    3.14      11.25    18.52    23.87    35.31  

Market capitalization

 $130,273   $146,363   $114,199   $43,654     $70,645   $159,672   $106,292   $168,806  

Average balance sheet


Total loans and leases

 $905,913   $930,255   $966,105   $994,121    $941,563   $946,914   $878,639   $875,661  

Total assets

  2,421,531    2,390,675    2,420,317    2,519,134     1,948,854    1,905,691    1,754,613    1,764,927  

Total deposits

  995,160    989,295    974,892    964,081     892,141    857,845    786,002    787,623  

Long-term debt

  445,440    449,974    444,131    446,975     255,709    264,934    205,194    198,463  

Common shareholders’ equity

  197,123    197,230    173,497    160,739     142,535    142,303    140,243    141,456  

Total shareholders’ equity

  250,599    255,983    242,867    228,766      176,566    166,454    161,428    154,728  

Asset quality(2)


Allowance for credit losses(3)

 $38,687   $37,399   $35,777   $31,150    $23,492   $20,773   $17,637   $15,398  

Nonperforming loans, leases and
foreclosed properties(4)

  35,747    33,825    30,982    25,632     18,212    13,576    9,749    7,827  

Allowance for loan and lease losses as a percentage of total loans and leases outstanding(4)

  4.16  3.95  3.61  3.00   2.49  2.17  1.98  1.71

Allowance for loan and lease losses as a percentage of total nonperforming loans and leases(4)

  111    112    116    122     141    173    187    203  

Net charge-offs

 $8,421   $9,624   $8,701   $6,942    $5,541   $4,356   $3,619   $2,715  

Annualized net charge-offs as a percentage of average loans and leases outstanding(4)

  3.71  4.13  3.64  2.85   2.36  1.84  1.67  1.25

Nonperforming loans and leases as a percentage of total loans and leases outstanding(4)

  3.75    3.51    3.12    2.47     1.77    1.25    1.06    0.84  

Nonperforming loans, leases and foreclosed properties as a percentage of total loans, leases and foreclosed properties(4)

  3.98    3.72    3.31    2.64     1.96    1.45    1.13    0.90  

Ratio of the allowance for loan and lease losses at period end to annualized net charge-offs

  1.11    0.94    0.97    1.03      1.05    1.17    1.18    1.36  

Capital ratios (period end)


Risk-based capital:


Tier 1 common

  7.81  7.25  6.90  4.49   4.80  4.23  4.78  4.64

Tier 1

  10.40    12.46    11.93    10.09     9.15    7.55    8.25    7.51  

Total

  14.66    16.69    15.99    14.03     13.00    11.54    12.60    11.71  

Tier 1 leverage

  6.91    8.39    8.21    7.07     6.44    5.51    6.07    5.59  

Tangible equity(1)

  6.42    7.55    7.39    6.42     5.11    4.13    4.72    4.26  

Tangible common equity(1)

  5.57    4.82    4.67    3.13      2.93    2.75    3.24    3.21  
(1)

Excludes merger and restructuring charges and goodwill impairment charges.
(2)Calculated as total net income for four consecutive quarters divided by average assets for the period.
(3)Tangible equity ratios and tangible book value per share of common stock are non-GAAP measures. Other companies may define or calculate these measures differently. For additional information on these ratios, and a corresponding reconciliation to GAAP financial measures, see Supplemental Financial Data beginning on page 25.

36 and for corresponding reconciliations to GAAP financial measures, see Table XV.
(2)(4)

For more information on the impact of purchased impaired loansthe PCI loan portfolio on asset quality, statistics, see Consumer Portfolio Credit Risk Management beginning on page 5472 and Commercial Portfolio Credit Risk Management beginning on page 64.

83.
(3)(5)

Includes the allowance for loan and lease losses and the reserve for unfunded lending commitments.

(4)(6)

Balances and ratios do not include loans accounted for under the fair value option.

For additional exclusions on nonperforming loans, leases and foreclosed properties, see Nonperforming Consumer Loans and Foreclosed Properties Activity beginning on page 81 and corresponding Table 33 and Nonperforming Commercial Loans, Leases and Foreclosed Properties Activity and corresponding Table 41 on page 89.
(7)Allowance for loan and lease losses includes $22.9 billion, $23.7 billion, $24.3 billion, $26.2 billion, $17.7 billion, $17.2 billion, $16.5 billion and $14.9 billion allocated to products that are excluded from nonperforming loans, leases and foreclosed properties at December 31, 2010, September 30, 2010, June 30, 2010, March 31, 2010, December 31, 2009, September 30, 2009, June 30, 2009, and March 31, 2009, respectively.

n/m = not meaningful
Bank of America 2010     125


Table XIII Five Year Reconciliations to GAAP Financial Measures (1)
                     
(Dollars in millions, except per share information) 2010  2009  2008  2007  2006 
Reconciliation of net interest income to net interest income on a fully taxable-equivalent basis
                    
Net interest income $51,523  $47,109  $45,360  $34,441  $34,594 
Fully taxable-equivalent adjustment  1,170   1,301   1,194   1,749   1,224 
                     
Net interest income on a fully taxable-equivalent basis
 $52,693  $48,410  $46,554  $36,190  $35,818 
                     
Reconciliation of total revenue, net of interest expense to total revenue, net of interest expense on a fully taxable-equivalent basis
                    
Total revenue, net of interest expense $110,220  $119,643  $72,782  $66,833  $72,776 
Fully taxable-equivalent adjustment  1,170   1,301   1,194   1,749   1,224 
                     
Total revenue, net of interest expense on a fully taxable-equivalent basis
 $111,390  $120,944  $73,976  $68,582  $74,000 
                     
Reconciliation of total noninterest expense to total noninterest expense, excluding goodwill impairment charges
                    
Total noninterest expense $83,108  $66,713  $41,529  $37,524  $35,793 
Goodwill impairment charges  (12,400)            
                     
Total noninterest expense, excluding goodwill impairment charges
 $70,708  $66,713  $41,529  $37,524  $35,793 
                     
Reconciliation of income tax expense (benefit) to income tax expense (benefit) on a fully taxable-equivalent basis
                    
Income tax expense (benefit) $915  $(1,916) $420  $5,942  $10,840 
Fully taxable-equivalent adjustment  1,170   1,301   1,194   1,749   1,224 
                     
Income tax expense (benefit) on a fully taxable-equivalent basis
 $2,085  $(615) $1,614  $7,691  $12,064 
                     
Reconciliation of net income (loss) to net income, excluding goodwill impairment charges
                    
Net income (loss) $(2,238) $6,276  $4,008  $14,982  $21,133 
Goodwill impairment charges  12,400             
                     
Net income, excluding goodwill impairment charges
 $10,162  $6,276  $4,008  $14,982  $21,133 
                     
Reconciliation of net income (loss) applicable to common shareholders to net income (loss) applicable to common shareholders, excluding goodwill impairment charges
                    
Net income (loss) applicable to common shareholders $(3,595) $(2,204) $2,556  $14,800  $21,111 
Goodwill impairment charges  12,400             
                     
Net income (loss) applicable to common shareholders, excluding goodwill impairment charges
 $8,805  $(2,204) $2,556  $14,800  $21,111 
                     
Reconciliation of average common shareholders’ equity to average tangible common shareholders’ equity
                    
Common shareholders’ equity $212,681  $182,288  $141,638  $133,555  $129,773 
Common Equivalent Securities  2,900   1,213          
Goodwill  (82,596)  (86,034)  (79,827)  (69,333)  (66,040)
Intangible assets (excluding MSRs)  (10,985)  (12,220)  (9,502)  (9,566)  (10,324)
Related deferred tax liabilities  3,306   3,831   1,782   1,845   1,809 
                     
Tangible common shareholders’ equity
 $125,306  $89,078  $54,091  $56,501  $55,218 
                     
Reconciliation of average shareholders’ equity to average tangible shareholders’ equity
                    
Shareholders’ equity $233,231  $244,645  $164,831  $136,662  $130,463 
Goodwill  (82,596)  (86,034)  (79,827)  (69,333)  (66,040)
Intangible assets (excluding MSRs)  (10,985)  (12,220)  (9,502)  (9,566)  (10,324)
Related deferred tax liabilities  3,306   3,831   1,782   1,845   1,809 
                     
Tangible shareholders’ equity
 $142,956  $150,222  $77,284  $59,608  $55,908 
                     
Reconciliation of year end common shareholders’ equity to year end tangible common shareholders’ equity
                    
Common shareholders’ equity $211,686  $194,236  $139,351  $142,394  $132,421 
Common Equivalent Securities     19,244          
Goodwill  (73,861)  (86,314)  (81,934)  (77,530)  (65,662)
Intangible assets (excluding MSRs)  (9,923)  (12,026)  (8,535)  (10,296)  (9,422)
Related deferred tax liabilities  3,036   3,498   1,854   1,855   1,799 
                     
Tangible common shareholders’ equity
 $130,938  $118,638  $50,736  $56,423  $59,136 
                     
Reconciliation of year end shareholders’ equity to year end tangible shareholders’ equity
                    
Shareholders’ equity $228,248  $231,444  $177,052  $146,803  $135,272 
Goodwill  (73,861)  (86,314)  (81,934)  (77,530)  (65,662)
Intangible assets (excluding MSRs)  (9,923)  (12,026)  (8,535)  (10,296)  (9,422)
Related deferred tax liabilities  3,036   3,498   1,854   1,855   1,799 
                     
Tangible shareholders’ equity
 $147,500  $136,602  $88,437  $60,832  $61,987 
                     
Reconciliation of year end assets to year end tangible assets
                    
Assets $2,264,909  $2,230,232  $1,817,943  $1,715,746  $1,459,737 
Goodwill  (73,861)  (86,314)  (81,934)  (77,530)  (65,662)
Intangible assets (excluding MSRs)  (9,923)  (12,026)  (8,535)  (10,296)  (9,422)
Related deferred tax liabilities  3,036   3,498   1,854   1,855   1,799 
                     
Tangible assets
 $2,184,161  $2,135,390  $1,729,328  $1,629,775  $1,386,452 
                     
Reconciliation of year end common shares outstanding to year end tangible common shares outstanding
                    
Common shares outstanding  10,085,155   8,650,244   5,017,436   4,437,885   4,458,151 
Assumed conversion of common equivalent shares (2)
     1,286,000          
                     
Tangible common shares outstanding
  10,085,155   9,936,244   5,017,436   4,437,885   4,458,151 
                     
Bank(1)Presents reconciliations of America 2009non-GAAP measures to GAAP financial measures. We believe the use of these non-GAAP measures provides additional clarity in assessing the results of the Corporation. Other companies may define or calculate non-GAAP measures differently. For more information on non-GAAP measures and ratios we use in assessing the results of the Corporation, see Supplemental Financial Data beginning on page 36.
(2)105On February 24, 2010, the common equivalent shares converted into common shares.
126     Bank of America 2010


Table XIII  XIV Quarterly Supplemental Financial Data (1)
                                 
  2010 Quarters  2009 Quarters 
(Dollars in millions, except per share information) Fourth  Third  Second  First  Fourth  Third  Second  First 
Fully taxable-equivalent basis data
                                
Net interest income $12,709  $12,717  $13,197  $14,070  $11,896  $11,753  $11,942  $12,819 
Total revenue, net of interest expense  22,668   26,982   29,450   32,290   25,413   26,365   33,086   36,080 
Net interest yield (2)
  2.69%  2.72%  2.77%  2.93%  2.62%  2.61%  2.64%  2.70%
Efficiency ratio  92.04   100.87   58.58   55.05   64.47   61.84   51.44   47.12 
                                 
Performance ratios, excluding goodwill impairment charges (3)
                                
Per common share information                                
Earnings $0.04  $0.27                         
Diluted earnings  0.04   0.27                         
Efficiency ratio  83.22%  62.33%                        
Return on average assets  0.13   0.52                         
Four quarter trailing return on average assets (4)
  0.43   0.39                         
Return on average common shareholders’ equity  0.79   5.06                         
Return on average tangible common shareholders’ equity  1.27   8.67                         
Return on average tangible shareholders’ equity  1.96   8.54                         
                                 
(1)Supplemental financial data on a FTE basis and performance measures and ratios excluding the impact of goodwill impairment charges are non-GAAP measures. Other companies may define or calculate these measures differently. For additional information on these performance measures and ratios, see Supplemental Financial Data beginning on page 36 and for corresponding reconciliations to GAAP financial measures, see Table XV.
(2)Calculation includes fees earned on overnight deposits placed with the Federal Reserve of $63 million, $107 million, $106 million and $92 million for the fourth, third, second and first quarters of 2010, and $130 million, $107 million, $92 million and $50 million for the fourth, third, second and first quarters of 2009, respectively.
(3)Performance ratios are calculated excluding the impact of the goodwill impairment charges of $10.4 billion recorded during the third quarter of 2010 and $2.0 billion recorded during the fourth quarter of 2010.
(4)Calculated as total net income for four consecutive quarters divided by average assets for the period.
Bank of America 2010     127


Table XV Quarterly Reconciliations to GAAP Financial Measures (1)
                                 
  2010 Quarters  2009 Quarters 
(Dollars in millions, except per share information) Fourth  Third  Second  First  Fourth  Third  Second  First 
Reconciliation of net interest income to net interest income on a fully taxable-equivalent basis
                                
Net interest income $12,439  $12,435  $12,900  $13,749  $11,559  $11,423  $11,630  $12,497 
Fully taxable-equivalent adjustment  270   282   297   321   337   330   312   322 
                                 
Net interest income on a fully taxable-equivalent basis
 $12,709  $12,717  $13,197  $14,070  $11,896  $11,753  $11,942  $12,819 
                                 
Reconciliation of total revenue, net of interest expense to total revenue, net of interest expense on a fully taxable-equivalent basis
                                
Total revenue, net of interest expense $22,398  $26,700  $29,153  $31,969  $25,076  $26,035  $32,774  $35,758 
Fully taxable-equivalent adjustment  270   282   297   321   337   330   312   322 
                                 
Total revenue, net of interest expense on a fully taxable-equivalent basis
 $22,668  $26,982  $29,450  $32,290  $25,413  $26,365  $33,086  $36,080 
                                 
Reconciliation of total noninterest expense to total noninterest expense, excluding goodwill impairment charges
                                
Total noninterest expense $20,864  $27,216  $17,253  $17,775  $16,385  $16,306  $17,020  $17,002 
Goodwill impairment charges  (2,000)  (10,400)                  
                                 
Total noninterest expense, excluding goodwill impairment charges
 $18,864  $16,816  $17,253  $17,775  $16,385  $16,306  $17,020  $17,002 
                                 
Reconciliation of income tax expense (benefit) to income tax expense (benefit) on a fully taxable-equivalent basis
                                
Income tax expense (benefit) $(2,351) $1,387  $672  $1,207  $(1,225) $(975) $(845) $1,129 
Fully taxable-equivalent adjustment  270   282   297   321   337   330   312   322 
                                 
Income tax expense (benefit) on a fully taxable-equivalent basis
 $(2,081) $1,669  $969  $1,528  $(888) $(645) $(533) $1,451 
                                 
Reconciliation of net income (loss) to net income (loss), excluding goodwill impairment charges
                                
Net income (loss) $(1,244) $(7,299) $3,123  $3,182  $(194) $(1,001) $3,224  $4,247 
Goodwill impairment charges  2,000   10,400                   
                                 
Net income (loss), excluding goodwill impairment charges
 $756  $3,101  $3,123  $3,182  $(194) $(1,001) $3,224  $4,247 
                                 
Reconciliation of net income (loss) applicable to common shareholders to net income (loss) applicable to common shareholders, excluding goodwill impairment charges
                                
Net income (loss) applicable to common shareholders $(1,565) $(7,647) $2,783  $2,834  $(5,196) $(2,241) $2,419  $2,814 
Goodwill impairment charges  2,000   10,400                   
                                 
Net income (loss) applicable to common shareholders, excluding goodwill impairment charges
 $435  $2,753  $2,783  $2,834  $(5,196) $(2,241) $2,419  $2,814 
                                 
Reconciliation of average common shareholders’ equity to average tangible common shareholders’ equity
                                
Common shareholders’ equity $218,728  $215,911  $215,468  $200,380  $197,123  $197,230  $173,497  $160,739 
Common Equivalent Securities           11,760   4,811          
Goodwill  (75,584)  (82,484)  (86,099)  (86,334)  (86,053)  (86,170)  (87,314)  (84,584)
Intangible assets (excluding MSRs)  (10,211)  (10,629)  (11,216)  (11,906)  (12,556)  (13,223)  (13,595)  (9,461)
Related deferred tax liabilities  3,121   3,214   3,395   3,497   3,712   3,725   3,916   3,977 
                                 
Tangible common shareholders’ equity
 $136,054  $126,012  $121,548  $117,397  $107,037  $101,562  $76,504  $70,671 
                                 
(1)Presents reconciliations of non-GAAP measures to GAAP financial measures. We believe the use of these non-GAAP measures provides additional clarity in assessing the results of the Corporation. Other companies may define or calculate non-GAAP measures differently. For more information on non-GAAP measures and ratios we use in assessing the results of the Corporation, see Supplemental Financial Data beginning on page 36.
(2)On February 24, 2010, the common equivalent shares converted into common shares.
128     Bank of America 2010


Table XV Quarterly Reconciliations to GAAP Financial Measures (1) (continued)
                                 
  2010 Quarters  2009 Quarters 
(Dollars in millions, except per share information) Fourth  Third  Second  First  Fourth  Third  Second  First 
Reconciliation of average shareholders’ equity to average tangible shareholders’ equity
                                
Shareholders’ equity  $  235,525   $  233,978   $  233,461   $  229,891  $250,599  $255,983  $242,867  $228,766 
Goodwill  (75,584)  (82,484)  (86,099)  (86,334)  (86,053)  (86,170)  (87,314)  (84,584)
Intangible assets (excluding MSRs)  (10,211)  (10,629)  (11,216)  (11,906)  (12,556)  (13,223)  (13,595)  (9,461)
Related deferred tax liabilities  3,121   3,214   3,395   3,497   3,712   3,725   3,916   3,977 
                                 
Tangible shareholders’ equity
  $  152,851   $  144,079   $  139,541   $  135,148  $155,702  $160,315  $145,874  $138,698 
                                 
Reconciliation of period end common shareholders’ equity to period end tangible common shareholders’ equity
                                
Common shareholders’ equity  $  211,686   $  212,391   $  215,181   $  211,859  $194,236  $198,843  $196,492  $166,272 
Common Equivalent Securities              19,244          
Goodwill  (73,861)  (75,602)  (85,801)  (86,305)  (86,314)  (86,009)  (86,246)  (86,910)
Intangible assets (excluding MSRs)  (9,923)  (10,402)  (10,796)  (11,548)  (12,026)  (12,715)  (13,245)  (13,703)
Related deferred tax liabilities  3,036   3,123   3,215   3,396   3,498   3,714   3,843   3,958 
                                 
Tangible common shareholders’ equity
  $  130,938   $  129,510   $  121,799   $  117,402  $118,638  $103,833  $100,844  $69,617 
                                 
Reconciliation of period end shareholders’ equity to period end tangible shareholders’ equity
                                
Shareholders’ equity  $  228,248   $  230,495   $  233,174   $  229,823  $231,444  $257,683  $255,152  $239,549 
Goodwill  (73,861)  (75,602)  (85,801)  (86,305)  (86,314)  (86,009)  (86,246)  (86,910)
Intangible assets (excluding MSRs)  (9,923)  (10,402)  (10,796)  (11,548)  (12,026)  (12,715)  (13,245)  (13,703)
Related deferred tax liabilities  3,036   3,123   3,215   3,396   3,498   3,714   3,843   3,958 
                                 
Tangible shareholders’ equity
  $  147,500   $  147,614   $  139,792   $  135,366  $136,602  $162,673  $159,504  $142,894 
                                 
Reconciliation of period end assets to period end tangible assets
                                
Assets  $2,264,909   $2,339,660   $2,368,384   $2,344,634  $2,230,232  $2,259,891  $2,260,853  $2,321,961 
Goodwill  (73,861)  (75,602)  (85,801)  (86,305)  (86,314)  (86,009)  (86,246)  (86,910)
Intangible assets (excluding MSRs)  (9,923)  (10,402)  (10,796)  (11,548)  (12,026)  (12,715)  (13,245)  (13,703)
Related deferred tax liabilities  3,036   3,123   3,215   3,396   3,498   3,714   3,843   3,958 
                                 
Tangible assets
  $2,184,161   $2,256,779   $2,275,002   $2,250,177  $2,135,390  $2,164,881  $2,165,205  $2,225,306 
                                 
Reconciliation of ending common shares outstanding to ending tangible common shares outstanding
                                
Common shares outstanding  10,085,155   10,033,705   10,033,017   10,032,001   8,650,244   8,650,314   8,651,459   6,400,950 
Assumed conversion of common equivalent shares (2)
              1,286,000          
                                 
Tangible common shares outstanding
  10,085,155   10,033,705   10,033,017   10,032,001   9,936,244   8,650,314   8,651,459   6,400,950 
                                 
For footnotes see page 128.
Bank of America 2010     129


Table XVIQuarterly Average Balances and Interest Rates – FTE Basis

  Fourth Quarter 2009     Third Quarter 2009 
(Dollars in millions) Average
Balance
    Interest
Income/
Expense
    Yield/
Rate
      Average
Balance
    Interest
Income/
Expense
    Yield/
Rate
 

Earning assets


Time deposits placed and other short-term investments

 $28,566    $220    3.06   $29,485    $133    1.79

Federal funds sold and securities borrowed or purchased under
agreements to resell

  244,914     327    0.53      223,039     722    1.28  

Trading account assets

  218,787     1,800    3.28      212,488     1,909    3.58  

Debt securities(1)

  279,231     2,921    4.18      263,712     3,048    4.62  

Loans and leases(2):


Residential mortgage(3)

  236,883     3,108    5.24      241,924     3,258    5.38  

Home equity

  150,704     1,613    4.26      153,269     1,614    4.19  

Discontinued real estate

  15,152     174    4.58      16,570     219    5.30  

Credit card – domestic

  49,213     1,336    10.77      49,751     1,349    10.76  

Credit card – foreign

  21,680     605    11.08      21,189     562    10.52  

Direct/Indirect consumer(4)

  98,938     1,361    5.46      100,012     1,439    5.71  

Other consumer(5)

  3,177     50    6.33      3,331     60    7.02  

Total consumer

  575,747     8,247    5.70      586,046     8,501    5.77  

Commercial – domestic

  207,050     2,090    4.01      216,332     2,132    3.91  

Commercial real estate(6)

  71,352     595    3.31      74,276     600    3.20  

Commercial lease financing

  21,769     273    5.04      22,068     178    3.22  

Commercial – foreign

  29,995     287    3.78      31,533     297    3.74  

Total commercial

  330,166     3,245    3.90      344,209     3,207    3.70  

Total loans and leases

  905,913     11,492    5.05      930,255     11,708    5.01  

Other earning assets

  130,487     1,222    3.72      131,021     1,333    4.05  

Total earning assets(7)

  1,807,898     17,982    3.96      1,790,000     18,853    4.19  

Cash and cash equivalents

  230,618            196,116        

Other assets, less allowance for loan and lease losses

  383,015              404,559          

Total assets

 $2,421,531                $2,390,675            

Interest-bearing liabilities


Domestic interest-bearing deposits:


Savings

 $33,749    $54    0.63   $34,170    $49    0.57

NOW and money market deposit accounts

  392,212     388    0.39      356,873     353    0.39  

Consumer CDs and IRAs

  192,779     835    1.72      214,284     1,100    2.04  

Negotiable CDs, public funds and other time deposits

  31,758     82    1.04      48,905     118    0.95  

Total domestic interest-bearing deposits

  650,498     1,359    0.83      654,232     1,620    0.98  

Foreign interest-bearing deposits:


Banks located in foreign countries

  16,477     30    0.73      15,941     29    0.73  

Governments and official institutions

  6,650     4    0.23      6,488     4    0.23  

Time, savings and other

  54,469     79    0.57      53,013     57    0.42  

Total foreign interest-bearing deposits

  77,596     113    0.58      75,442     90    0.47  

Total interest-bearing deposits

  728,094     1,472    0.80      729,674     1,710    0.93  

Federal funds purchased, securities loaned or sold under
agreements to repurchase and other short-term borrowings

  450,538     658    0.58      411,063     1,237    1.19  

Trading account liabilities

  83,118     591    2.82      73,290     455    2.46  

Long-term debt

  445,440     3,365    3.01      449,974     3,698    3.27  

Total interest-bearing liabilities(7)

  1,707,190     6,086    1.42      1,664,001     7,100    1.70  

Noninterest-bearing sources:


Noninterest-bearing deposits

  267,066            259,621        

Other liabilities

  196,676            211,070        

Shareholders’ equity

  250,599              255,983          

Total liabilities and shareholders’ equity

 $2,421,531                $2,390,675            

Net interest spread

         2.54           2.49

Impact of noninterest-bearing sources

         0.08             0.12  

Net interest income/yield on earning assets

       $11,896    2.62          $11,753    2.61
                         
  Fourth Quarter 2010  Third Quarter 2010 
     Interest
        Interest
    
  Average
  Income/
  Yield/
  Average
  Income/
  Yield/
 
(Dollars in millions) Balance  Expense  Rate  Balance  Expense  Rate 
Earning assets
                        
Time deposits placed and other short-term investments (1)
 $28,141  $75   1.07% $23,233  $86   1.45%
Federal funds sold and securities borrowed or purchased under agreements to resell  243,589   486   0.79   254,820   441   0.69 
Trading account assets  216,003   1,710   3.15   210,529   1,692   3.20 
Debt securities (2)
  341,867   3,065   3.58   328,097   2,646   3.22 
Loans and leases (3):
                        
Residential mortgage (4)
  254,051   2,857   4.50   237,292   2,797   4.71 
Home equity  139,772   1,410   4.01   143,083   1,457   4.05 
Discontinued real estate  13,297   118   3.57   13,632   122   3.56 
U.S. credit card  112,673   3,040   10.70   115,251   3,113   10.72 
Non-U.S. credit card
  27,457   815   11.77   27,047   875   12.84 
Direct/Indirect consumer (5)
  91,549   1,088   4.72   95,692   1,130   4.68 
Other consumer (6)
  2,796   45   6.32   2,955   47   6.35 
                         
Total consumer  641,595   9,373   5.81   634,952   9,541   5.98 
                         
U.S. commercial  193,608   1,894   3.88   192,306   2,040   4.21 
Commercial real estate (7)
  51,617   432   3.32   55,660   452   3.22 
Commercial lease financing  21,363   250   4.69   21,402   255   4.78 
Non-U.S. commercial
  32,431   289   3.53   30,540   282   3.67 
                         
Total commercial  299,019   2,865   3.81   299,908   3,029   4.01 
                         
Total loans and leases  940,614   12,238   5.18   934,860   12,570   5.35 
                         
Other earning assets  113,325   923   3.23   112,280   949   3.36 
                         
Total earning assets (8)
  1,883,539   18,497   3.90   1,863,819   18,384   3.93 
                         
Cash and cash equivalents (1)
  136,967   63       155,784   107     
Other assets, less allowance for loan and lease losses  349,752           359,794         
                         
Total assets
 $2,370,258          $2,379,397         
                         
Interest-bearing liabilities
                        
U.S. interest-bearing deposits:                        
Savings $37,145  $35   0.36% $37,008  $36   0.39%
NOW and money market deposit accounts  464,531   333   0.28   442,906   359   0.32 
Consumer CDs and IRAs  124,855   338   1.07   132,687   377   1.13 
Negotiable CDs, public funds and other time deposits  16,334   47   1.16   17,326   57   1.30 
                         
Total U.S. interest-bearing deposits  642,865   753   0.46   629,927   829   0.52 
                         
Non-U.S. interest-bearing deposits:
                        
Banks located innon-U.S. countries
  16,827   38   0.91   17,431   38   0.86 
Governments and official institutions  1,560   2   0.42   2,055   2   0.36 
Time, savings and other  58,746   101   0.69   54,373   81   0.59 
                         
Totalnon-U.S. interest-bearing deposits
  77,133   141   0.73   73,859   121   0.65 
                         
Total interest-bearing deposits  719,998   894   0.49   703,786   950   0.54 
                         
Federal funds purchased, securities loaned or sold under agreements to repurchase and other short-term borrowings  369,738   1,142   1.23   391,148   848   0.86 
Trading account liabilities  81,313   561   2.74   95,265   635   2.65 
Long-term debt  465,875   3,254   2.78   485,588   3,341   2.74 
                         
Total interest-bearing liabilities (8)
  1,636,924   5,851   1.42   1,675,787   5,774   1.37 
                         
Noninterest-bearing sources:                        
Noninterest-bearing deposits  287,740           270,060         
Other liabilities  210,069           199,572         
Shareholders’ equity  235,525           233,978         
                         
Total liabilities and shareholders’ equity
 $2,370,258          $2,379,397         
                         
Net interest spread          2.48%          2.56%
Impact of noninterest-bearing sources          0.18           0.13 
                         
Net interest income/yield on earning assets (1)
     $12,646   2.66%     $12,610   2.69%
                         
(1)

Fees earned on overnight deposits placed with the Federal Reserve, which were included in time deposits placed and other short-term investments in prior periods, have been reclassified to cash and cash equivalents, consistent with the Corporation’s Consolidated Balance Sheet presentation of these deposits. Net interest income and net interest yield in the table are calculated excluding these fees.
(2)Yields on AFS debt securities are calculated based on fair value rather than the cost basis. The use of fair value does not have a material impact on net interest yield.

(2)(3)

Nonperforming loans are included in the respective average loan balances. Income on these nonperforming loans is recognized on a cash basis. Purchased impairedcredit-impaired loans were written down to fair value upon acquisition and accrete interest income over the remaining life of the loan.

(3)(4)

Includes foreignnon-U.S. residential mortgage loans of $550$96 million, $662$502 million, $650$506 million and $627$538 million forin the fourth, third, second and first quarters of 2010, and $550 million in the fourth quarter of 2009, respectively.

(4)(5)

Includes foreignnon-U.S. consumer loans of $8.6$7.9 billion, $8.4$7.7 billion, $8.0$7.7 billion and $7.1$8.1 billion in the fourth, third, second and first quarters of 2009, respectively,2010, and $2.0$8.6 billion in the fourth quarter of 2008.2009, respectively.

(5)(6)

Includes consumer finance loans of $2.3$2.0 billion, $2.4$2.0 billion, $2.5$2.1 billion and $2.6$2.2 billion in the fourth, third, second and first quarters of 2009, respectively,2010, and $2.7$2.3 billion in the fourth quarter of 2008; and2009, respectively; other foreignnon-U.S. consumer loans of $689$791 million, $700$788 million, $640$679 million and $596$664 million in the fourth, third, second and first quarters of 2009, respectively,2010, and $654$689 million in the fourth quarter of 2008.2009, respectively; and consumer overdrafts of $34 million, $123 million, $155 million and $132 million in the fourth, third, second and first quarters of 2010, and $192 million in the fourth quarter of 2009, respectively.

(6)(7)

Includes domesticU.S. commercial real estate loans of $68.2$49.0 billion, $70.7$53.1 billion, $72.8$61.6 billion and $70.9$65.6 billion in the fourth, third, second and first quarters of 2009, respectively,2010, and $63.6$68.2 billion in the fourth quarter of 2008;2009, respectively; and foreignnon-U.S. commercial real estate loans of $3.1$2.6 billion, $3.6$2.5 billion, $2.8$2.6 billion and $1.3$3.0 billion in the fourth, third, second and first quarters of 2009, respectively,2010, and $964 million$3.1 billion in the fourth quarter of 2008.2009, respectively.

(7)(8)

Interest income includes the impact of interest rate risk management contracts, which decreased interest income on the underlying assets $248by $29 million, $136$639 million, $11$479 million and $61$272 million in the fourth, third, second and first quarters of 2009, respectively,2010 and $41$248 million in the fourth quarter of 2008.2009, respectively. Interest expense includes the impact of interest rate risk management contracts, which increased (decreased)decreased interest expense on the underlying liabilities $(1.1)by $672 million, $1.0 billion, $(873) million, $(550)$829 million and $(512)$970 million in the fourth, third, second and first quarters of 2009, respectively,2010, and $237 million$1.1 billion in the fourth quarter of 2008.2009, respectively. For further information on interest rate contracts, see Interest Rate Risk Management for Nontrading Activities beginning on page 83.

103.

106Bank of America 2009
130     Bank of America 2010


Table XVIQuarterly Average Balances and Interest Rates – FTE Basis (continued)

  Second Quarter 2009    First Quarter 2009    Fourth Quarter 2008 
(Dollars in millions) Average
Balance
  Interest
Income/
Expense
  Yield/
Rate
     Average
Balance
  Interest
Income/
Expense
  Yield/
Rate
     Average
Balance
  Interest
Income/
Expense
  Yield/
Rate
 

Earning assets


Time deposits placed and other short-term investments

 $25,604  $169  2.64  $26,158  $191  2.96  $10,511  $158  5.97

Federal funds sold and securities borrowed or purchased under agreements to resell

  230,955   690  1.20     244,280   1,155  1.90     104,843   393  1.50  

Trading account assets

  199,820   2,028  4.07     237,350   2,499  4.24     179,687   2,170  4.82  

Debt securities(1)

  255,159   3,353  5.26     286,249   3,902  5.47     280,942   3,913  5.57  

Loans and leases(2):


Residential mortgage (3)

  253,803   3,489  5.50     265,121   3,680  5.57     253,560   3,596  5.67  

Home equity

  156,599   1,722  4.41     158,575   1,787  4.55     151,943   1,954  5.12  

Discontinued real estate

  18,309   303  6.61     19,386   386  7.97     21,324   459  8.60  

Credit card – domestic

  51,721   1,380  10.70     58,960   1,601  11.01     64,906   1,784  10.94  

Credit card – foreign

  18,825   501  10.66     16,858   454  10.94     17,211   521  12.05  

Direct/Indirect consumer(4)

  100,302   1,532  6.12     100,741   1,684  6.78     83,331   1,714  8.18  

Other consumer(5)

  3,298   63  7.77     3,408   64  7.50     3,544   70  7.83  

Total consumer

  602,857   8,990  5.97     623,049   9,656  6.25     595,819   10,098  6.76  

Commercial – domestic

  231,639   2,176  3.77     240,683   2,485  4.18     226,095   2,890  5.09  

Commercial real estate(6)

  75,559   627  3.33     72,206   550  3.09     64,586   706  4.35  

Commercial lease financing

  22,026   260  4.72     22,056   279  5.05     22,069   242  4.40  

Commercial – foreign

  34,024   360  4.24     36,127   462  5.18     32,994   373  4.49  

Total commercial

  363,248   3,423  3.78     371,072   3,776  4.12     345,744   4,211  4.85  

Total loans and leases

  966,105   12,413  5.15     994,121   13,432  5.46     941,563   14,309  6.06  

Other earning assets

  134,338   1,251  3.73     124,325   1,299  4.22     99,127   959  3.85  

Total earning assets(7)

  1,811,981   19,904  4.40     1,912,483   22,478  4.74     1,616,673   21,902  5.40  

Cash and cash equivalents

  204,354       153,007       77,388    

Other assets, less allowance for loan and lease losses

  403,982           453,644           254,793        

Total assets

 $2,420,317           $2,519,134           $1,948,854        

Interest-bearing liabilities


Domestic interest-bearing deposits:


Savings

 $34,367  $54  0.63  $32,378  $58  0.72  $31,561  $58  0.73

NOW and money market deposit accounts

  342,570   376  0.44     343,215   440  0.52     285,410   813  1.13  

Consumer CDs and IRAs

  229,392   1,409  2.46     235,787   1,710  2.93     229,410   1,835  3.18  

Negotiable CDs, public funds and other time deposits

  39,100   124  1.28     31,188   149  1.94     36,510   270  2.94  

Total domestic interest-bearing deposits

  645,429   1,963  1.22     642,568   2,357  1.49     582,891   2,976  2.03  

Foreign interest-bearing deposits:


Banks located in foreign countries

  19,261   37  0.76     26,052   48  0.75     41,398   125  1.20  

Governments and official institutions

  7,379   4  0.22     9,849   6  0.25     13,738   30  0.87  

Time, savings and other

  54,307   78  0.58     58,380   132  0.92     48,836   165  1.34  

Total foreign interest-bearing deposits

  80,947   119  0.59     94,281   186  0.80     103,972   320  1.22  

Total interest-bearing deposits

  726,376   2,082  1.15     736,849   2,543  1.40     686,863   3,296  1.91  

Federal funds purchased, securities loaned or sold under agreements to repurchase and other short-term borrowings

  503,451   1,396  1.11     591,928   2,221  1.52     459,743   1,910  1.65  

Trading account liabilities

  62,778   450  2.87     69,481   579  3.38     65,058   524  3.20  

Long-term debt

  444,131   4,034  3.64     446,975   4,316  3.89     255,709   2,766  4.32  

Total interest-bearing liabilities(7)

  1,736,736   7,962  1.84     1,845,233   9,659  2.11     1,467,373   8,496  2.30  

Noninterest-bearing sources:


Noninterest-bearing deposits

  248,516       227,232       205,278    

Other liabilities

  192,198       217,903       99,637    

Shareholders’ equity

  242,867         228,766         176,566      

Total liabilities and shareholders’ equity

 $2,420,317           $2,519,134           $1,948,854        

Net interest spread

     2.56      2.63      3.10

Impact of noninterest-bearing sources

         0.08            0.07            0.21  

Net interest income/yield on earning assets

     $11,942  2.64       $12,819  2.70       $13,406  3.31

                                     
  Second Quarter 2010  First Quarter 2010  Fourth Quarter 2009 
     Interest
        Interest
        Interest
    
  Average
  Income/
  Yield/
  Average
  Income/
  Yield/
  Average
  Income/
  Yield/
 
(Dollars in millions) Balance  Expense  Rate  Balance  Expense  Rate  Balance  Expense  Rate 
Earning assets
                                    
Time deposits placed and other short-term investments (1)
 $30,741  $70   0.93% $27,600  $61   0.89% $28,566  $90   1.25%
Federal funds sold and securities borrowed or purchased under agreements to resell  263,564   457   0.70   266,070   448   0.68   244,914   327   0.53 
Trading account assets  213,927   1,853   3.47   214,542   1,795   3.37   218,787   1,800   3.28 
Debt securities (2)
  314,299   2,966   3.78   311,136   3,173   4.09   279,231   2,921   4.18 
Loans and leases (3):
                                    
Residential mortgage (4)
  247,715   2,982   4.82   243,833   3,100   5.09   236,883   3,108   5.24 
Home equity  148,219   1,537   4.15   152,536   1,586   4.20   150,704   1,613   4.26 
Discontinued real estate  13,972   134   3.84   14,433   153   4.24   15,152   174   4.58 
U.S. credit card  118,738   3,121   10.54   125,353   3,370   10.90   49,213   1,336   10.77 
Non-U.S. credit card
  27,706   854   12.37   29,872   906   12.30   21,680   605   11.08 
Direct/Indirect consumer (5)
  98,549   1,233   5.02   100,920   1,302   5.23   98,938   1,361   5.46 
Other consumer (6)
  2,958   46   6.32   3,002   48   6.35   3,177   50   6.33 
                                     
Total consumer  657,857   9,907   6.03   669,949   10,465   6.30   575,747   8,247   5.70 
                                     
U.S. commercial  195,144   2,005   4.12   202,662   1,970   3.94   207,050   2,090   4.01 
Commercial real estate (7)
  64,218   541   3.38   68,526   575   3.40   71,352   595   3.31 
Commercial lease financing  21,271   261   4.90   21,675   304   5.60   21,769   273   5.04 
Non-U.S. commercial
  28,564   256   3.59   28,803   264   3.72   29,995   287   3.78 
                                     
Total commercial  309,197   3,063   3.97   321,666   3,113   3.92   330,166   3,245   3.90 
                                     
Total loans and leases  967,054   12,970   5.38   991,615   13,578   5.53   905,913   11,492   5.05 
                                     
Other earning assets  121,205   994   3.29   122,097   1,053   3.50   130,487   1,222   3.72 
                                     
Total earning assets (8)
  1,910,790   19,310   4.05   1,933,060   20,108   4.19   1,807,898   17,852   3.93 
                                     
Cash and cash equivalents (1)
  209,686   106       196,911   92       230,618   130     
Other assets, less allowance for loan and lease losses  373,956           386,619           392,508         
                                     
Total assets
 $2,494,432          $2,516,590          $2,431,024         
                     ��               
Interest-bearing liabilities
                                    
U.S. interest-bearing deposits:                                    
Savings $37,290  $43   0.46% $35,126  $43   0.50% $33,749  $54   0.63%
NOW and money market deposit accounts  442,262   372   0.34   416,110   341   0.33   392,212   388   0.39 
Consumer CDs and IRAs  147,425   441   1.20   166,189   567   1.38   192,779   835   1.72 
Negotiable CDs, public funds and other time deposits  17,355   59   1.36   19,763   63   1.31   31,758   82   1.04 
                                     
Total U.S. interest-bearing deposits  644,332   915   0.57   637,188   1,014   0.65   650,498   1,359   0.83 
                                     
Non-U.S. interest-bearing deposits:
                                    
Banks located innon-U.S. countries
  19,751   36   0.72   18,424   32   0.71   16,132   30   0.75 
Governments and official institutions  4,214   3   0.28   5,626   3   0.22   5,779   4   0.26 
Time, savings and other  52,195   77   0.60   54,885   73   0.53   55,685   79   0.56 
                                     
Totalnon-U.S. interest-bearing deposits
  76,160   116   0.61   78,935   108   0.55   77,596   113   0.58 
                                     
Total interest-bearing deposits  720,492   1,031   0.57   716,123   1,122   0.64   728,094   1,472   0.80 
                                     
Federal funds purchased, securities loaned or sold under agreements to repurchase and other short-term borrowings  454,051   891   0.79   508,332   818   0.65   450,538   658   0.58 
Trading account liabilities  100,021   715   2.87   90,134   660   2.97   83,118   591   2.82 
Long-term debt  497,469   3,582   2.88   513,634   3,530   2.77   445,440   3,365   3.01 
                                     
Total interest-bearing liabilities (8)
  1,772,033   6,219   1.41   1,828,223   6,130   1.35   1,707,190   6,086   1.42 
                                     
Noninterest-bearing sources:                                    
Noninterest-bearing deposits  271,123           264,892           267,066         
Other liabilities  217,815           193,584           206,169         
Shareholders’ equity  233,461           229,891           250,599         
                                     
Total liabilities and shareholders’ equity
 $2,494,432          $2,516,590          $2,431,024         
                                     
Net interest spread          2.64%          2.84%          2.51%
Impact of noninterest-bearing sources          0.10           0.08           0.08 
                                     
Net interest income/yield on earning assets (1)
     $13,091   2.74%     $13,978   2.92%     $11,766   2.59%
                                     
For Footnotes,footnotes, see page 106.

Bank of America 2009107
130.
Bank of America 2010     131


Glossary

Glossary

Alt-A Mortgage– Alternative-A mortgage, a type of U.S. mortgage that, for various reasons, is considered riskier than A-paper, or “prime”,“prime,” and less risky than “subprime,” the riskiest category. Alt-A interest rates, which are determined by credit risk, therefore tend to be between those of prime and subprime home loans. Typically, Alt-A mortgages are characterized by borrowers with less than full documentation, lower credit scores and higher LTVs.

Asset-Backed Commercial Paper Money Market Fund Liquidity Facility (AMLF)– A lending program created by the Federal Reserve on September 19, 2008 that provides nonrecourse loans to U.S. financial institutions for the purchase of U.S. dollar-denominated high-quality asset-backed commercial paper from money market mutual funds under certain conditions. This program is intended to assist money market funds that hold such paper in meeting demands for redemptions by investors and to foster liquidity in the asset-backed commercial paper market and money markets more generally. Financial institutions generally bear no credit risk associated with commercial paper purchased under the AMLF.

Assets in Custody – Consist largely of custodial and non-discretionary trust assets excluding brokerage assets administered for customers.clients. Trust assets encompass a broad range of asset types including real estate, private company ownership interest, personal property and investments.

Assets Under Management (AUM)– The total market value of assets under the investment advisory and discretion ofGWIMwhich generate asset management fees based on a percentage of the assets’ market values. AUM reflectreflects assets that are generally managed for institutional, high net-worth and retail clients and are distributed through various investment products including mutual funds, other commingled vehicles and separate accounts.

At-the-market Offering – A form of equity issuance where an exchange-listed company incrementally sells newly issued shares into the market through a designated broker/dealer at prevailing market prices, rather than via a traditional underwritten offering of a fixed number of shares at a fixed price all at once.

Bridge Financing – A loan or security that is expected to be replaced by permanent financing (debt or equity securities, loan syndication or asset sales) prior to the maturity date of the loan. Bridge loans may include an unfunded commitment, as well as funded amounts, and are generally expected to be retired in one year or less.

CDO-squared – A type of CDO where the underlying collateral includes tranches of other CDOs.

Client Brokerage Assets– Include client assets which are held in brokerage accounts. This includes non-discretionary brokerage and fee-based assets which generate brokerage income and asset management fee revenue.

Client Deposits – IncludesGWIMclient deposit accounts representing both consumer and commercial demand, regular savings, time, money market, sweep and foreignnon-U.S. accounts.

Committed Credit Exposure – Includes any funded portion of a facility plus the unfunded portion of a facility on which the lender is legally bound to advance funds during a specified period under prescribed conditions.

Core Net Interest Income  Managed Basis– Net interest income on a fully taxable-equivalent basis excluding the impact of market-based activities and certain securitizations.

Credit Default Swap (CDS) – A derivative contract that provides protection against the deterioration of credit quality and allows one party to receive payment in the event of default by a third party under a borrowing arrangement.

activities.

Credit Card Accountability Responsibility and Disclosure Act of 2009 (CARD Act)– Legislation signed into law on May 22, 2009 to provide changes to credit card industry practices including significantly restricting credit card issuers’ ability to change interest rates and assess fees to reflect individual consumer risk, change the way payments are applied and requiring changes to consumer credit card disclosures. The majority of the provisions became effective in February 2010.

DerivativeCredit Default Swap (CDS) – A derivative contract or agreement whose value is derived from changesthat provides protection against the deterioration of credit quality and allows one party to receive payment in an underlying index such as interest rates, foreign exchange rates or pricesthe event of securities. Derivatives utilizeddefault by the Corporation include swaps, financial futures and forward settlement contracts, and option contracts.

Emergency Economic Stabilization Act of 2008 (EESA)– Legislation signed into law on October 3, 2008 authorizing the U.S. Secretary of the Treasury to, among other things, establish the Troubled Asset Relief Program.

a third party under a borrowing arrangement.

Excess Servicing Income – For certain assets that have been securitized, interest income, fee revenue and recoveries in excess of interest paid to the investors, gross credit losses and other trust expenses related to the securitized receivables are all classified as excess servicing income, which is a component of card income. Excess servicing income also includes the changes in fair value of the Corporation’s card relatedcard-related retained interests.

Financial Stability Plan– A plan announced on February 10, 2009 by the U.S. Treasury pursuant to the EESA which outlines a series of initiatives including the Capital Assistance Program (CAP); the creation of a new Public-Private Investment Program (PPIP); the expansion of the Term Asset-Backed Securities Loan Facility (TALF); the extension of the FDIC’s Temporary Liquidity Guarantee Program (TLGP) to October 31, 2009; the Small Business and Community Lending Initiative; a broad program to stabilize the housing market by encouraging lower mortgage rates and making it easier for homeowners to refinance and avoid foreclosure; and a new framework of governance and oversight related to the use of funds of the Financial Stability Plan.

Interest-only Strip – A residual interest in a securitization trust representing the right to receive future net cash flows from securitized assets after payments to third partythird-party investors and net credit losses. These arise when assets are transferred to a SPE as part of an asset securitization transaction qualifying for sale treatment under GAAP.

Interest Rate Lock Commitment (IRLC) – Commitment with a loan applicant in which the loan terms, including interest rate and price, are guaranteed for a designated period of time subject to credit approval.
Letter of Credit – A document issued on behalf of a customer to a third party promising to pay the third party upon presentation of specified documents. A

letter of credit effectively substitutes the issuer’s credit for that of the customer.
Loan-to-value

Loan-to-value (LTV)– A commonly used credit quality metric that is reported in terms of ending and average LTV. Ending LTV is calculated as the outstanding carrying value of the loan at the end of the period divided by the estimated value of the property securing the loan. Estimated property values are primarily determined by utilizing the Case-Schiller Home Index, a widely used index based on data from repeat sales of single family homes. Case-Schiller indices are updated quarterly and are reported on a three-month or one-quarter lag. An additional metric related to LTV iscombinedloan-to-value (CLTV) which is similar to the LTV metric, yet combines the outstanding balance on the residential mortgage loan and the outstanding carrying value on the home equity loan or available line of credit, both of which are secured by the same property, divided by the estimated value of the property. A LTV of 100 percent reflects a loan that is currently secured by a property valued at an amount exactly equal to the carrying value or available line of the loan. Under certain circumstances, estimated values can also be determined by utilizing an automated valuation method (AVM) or Mortgage Risk Assessment Corporation (MRAC) index. An AVM is a tool that estimates the value of a prop - -


108Bank of America 2009


ertyproperty by reference to large volumes of market data including sales of comparable properties and price trends specific to the MSA in which the property being valued is located. The MRAC index is similar to the Case-Schiller Home Index in that it is an index that is based on data from repeat sales of single family homes and is reported on a lag.

Letter of Credit – A document issued on behalf of a customer to a third party promising to pay the third party upon presentation of specified documents. A letter of credit effectively substitutes the issuer’s credit for that of the customer.

Making Home Affordable Program (MHA)– A U.S. Treasury program to reduce the number of foreclosures and make it easier for homeowners to refinance loans. The program is comprised of the Home Affordable Modification Program (HAMP) which provides guidelines on loan modifications and is designed to help at-risk homeowners avoid foreclosure by reducing monthly mortgage payments and provides incentives to lenders to modify all eligible loans that fall under the program guidelines and the Home Affordable Refinance Program (HARP) which is available to homeowners who have a proven payment history on an existing mortgage owned by FNMA or FHLMC and is designed to help eligible homeowners refinance their mortgage loans to take advantage of current lower mortgage rates or to refinance ARMs into more stable fixed-rate mortgages. In addition, the Second Lien Program is a part of the MHA. For more information on this program, see the separate definition for the Second Lien Program.

Managed Basis– Managed basis assumes that securitized loans were not sold and presents earnings on these loans in a manner similar to the way loans that have not been sold (i.e., held loans) are presented. Noninterest income, both on a held and managed basis, also includes the impact of adjustments to the interest-only strip that are recorded in card income.

Managed Net Losses – Represent net charge-offs on held loans combined with realized credit losses associated with the securitized loan portfolio.

Mortgage Servicing Right (MSR) – The right to service a mortgage loan when the underlying loan is sold or securitized. Servicing includes collections for principal, interest and escrow payments from borrowers and accounting for and remitting principal and interest payments to investors.

Net Interest Yield – Net interest income divided by average total interest-earning assets.

Nonperforming Loans and Leases – Includes loans and leases that have been placed on nonaccrual status, including nonaccruing loans whose contractual terms have been restructured in a manner that grants a concession to a borrower experiencing financial difficulties (troubled debt restructurings or TDRs). Loans accounted for under the fair value option, purchased impairedcredit-impaired loans and loansheld-for-sale are not reported as nonperforming loans and leases. Past due consumerConsumer credit card loans, business card loans, consumer loans not secured by personal property, unsecured consumer loans,real estate, and consumer loans secured by real estate where repayments are insured by the Federal Housing Administration and business card loans are not placed on nonaccrual status and are, therefore, not reported as nonperforming loans and leases.

Option-adjusted Spread (OAS)– The spread that is added to the discount rate so that the sum of the discounted cash flows equals the market price, thus, it is a measure of the extra yield over the reference discount factor (i.e., the forward swap curve) that a company is expected to earn by holding the asset.

Primary Dealer Credit Facility (PDCF)– A facility announced on March 16, 2008 by the Federal Reserve to provide discount window loans to primary dealers that settle on the same business day and mature on the following business day, in exchange for a specified range of eligible collateral. The rate paid on the loan is the same as the primary credit rate

at the Federal Reserve Bank of New York. In addition, primary dealers are subject to a frequency-based fee after they exceed 45 days of use. The frequency-based fee is calculated on an escalating scale and communicated to the primary dealers in advance. The PDCF was available to primary dealers until February 1, 2010.

Purchased ImpairedCredit-impaired (PCI) Loan– A loan purchased as an individual loan, in a portfolio of loans or in a business combination with evidence of deterioration in credit quality since origination for which it is probable, upon


132     Bank of America 2010


acquisition, that the investor will be unable to collect all contractually required payments. These loans are written down to fair value at the acquisition date.

Qualifying Special Purpose Entity (QSPE)– A SPE whose activities are strictly limited to holding and servicing financial assets and which meets the other criteria under applicable accounting guidance. A QSPE is generally not required to be consolidated by any party.

Return on Average Common Shareholders’ Equity– Measure of the earnings contribution as a percentage of average common shareholders’ equity.

Second Lien Program (2MP) – A MHA program announced on April 28, 2009 by the U.S. Treasury that focuses on creating a comprehensive affordability solution for homeowners. By focusing on shared efforts with lenders to reduce second mortgage payments,pay-for-success incentives for servicers, investors and borrowers, and a payment schedule for extinguishing second mortgages, the 2MP is designed to help up to 1.5 million homeowners. The program is designed to ensure that first and second lien holders are treated fairly and consistently with priority of liens, and offers automatic modification of a second lien when a first lien is modified. Details of the program are still being finalized as of the time of this filing.

Securitize/Securitization – A process by which financial assets are sold to a SPE, which then issues securities collateralized by those underlying assets, and the return on the securities issued is based on the principal and interest cash flow of the underlying assets.

Structured Investment Vehicle (SIV)– An entity that issues short duration debt and uses the proceeds from the issuance to purchase longer-term fixed income securities.

Subprime Loans – Although a standard industry definition for subprime loans (including subprime mortgage loans) does not exist, the Corporation defines subprime loans as specific product offerings for higher risk borrowers, including individuals with one or a combination of high credit risk factors, such as low FICO scores, (generally less than 620 for secured products and 660 for unsecured products), high debt to income ratios and inferior payment history.

Super Senior CDO Exposure– Represents the most senior class of commercial paper or notes that are issued by CDO vehicles. These financial instruments benefit from the subordination of all other securities, including AAA-rated securities, issued by CDO vehicles.

Treasury Temporary Guarantee Program for Money Market Funds (TTGP)– A voluntary and temporary program announced on September 19, 2008 by the U.S. Treasury which provided for a guarantee to investors that they would receive $1.00 for each money market fund share held as of September 19, 2008 in the event that a participating fund no longer had a $1.00 per share net asset value and liquidated. With respect to such shares covered by this program, the guarantee payment would have been equal to any shortfall between the amount received by an investor in a liquidation and $1.00 per share. Eligible money market mutual funds paid a fee to the U.S. Treasury to participate in this program which expired on September 18, 2009.

Temporary Liquidity Guarantee Program (TLGP) – A program announced on October 14, 2008 by the FDIC which is comprised of the Debt Guaran - -


Bank of America 2009109


tee Program (DGP) under which the FDIC guaranteed, for a fee, all newly issued senior unsecured debt (e.g., promissory notes, unsubordinated unsecured notes and commercial paper) up to prescribed limits, issued by participating entities through October 31, 2009, with an emergency guarantee facility available through April 30, 2010; and the Transaction Account Guarantee Program (TAGP) under which the FDIC will guarantee, for a fee, noninterest-bearing deposit accounts held at participating FDIC-insured depository institutions until June 30, 2010.

Term Auction Facility (TAF)– A temporary credit facility announced on December 12, 2007 and implemented by the Federal Reserve that allows a depository institution to place a bid for an advance from its local Federal Reserve Bank at an interest rate that is determined as the result of an auction and is aimed to help ensure that liquidity provisions can be disseminated efficiently even when the unsecured interbank markets are under stress. The TAF typically auctions term funds with 28-day or 84-day maturities and is available to all depository institutions that are judged to be in generally sound financial condition by their local Federal Reserve Bank. Additionally, all TAF credit must be fully collateralized.

Term Securities Lending Facility (TSLF)– A weekly loan facility established and announced by the Federal Reserve on March 11, 2008 to promote liquidity in U.S. Treasury and other collateral markets and foster the functioning of financial markets by offering U.S. Treasury securities held by the System Open Market Account (SOMA) for loan over a one-month term against other program-eligible general collateral. Loans are awarded to primary dealers based on competitive bidding, subject to a minimum fee requirement. The Open Market Trading Desk of the Federal Reserve Bank of New York auctions general U.S. Treasury collateral (treasury bills, notes, bonds and inflation-indexed securities) held by SOMA for loan against all collateral currently eligible for tri-party repurchase agreements arranged by the Open Market Trading Desk and separately against collateral and investment-grade corporate securities, municipal securities, MBS and ABS.

Tier 1 Common Capital – Tier 1 capital including CES, less preferred stock, qualifying trust preferred securities, hybrid securities and qualifying noncontrolling interest in subsidiaries.

Troubled Asset Relief Program (TARP)– A program established under the EESAEmergency Economic Stabilization Act of 2008 by the U.S. Treasury to, among other things, invest in financial institutions through capital infusions and purchase mortgages, MBS and certain other financial instruments from financial institutions, in an aggregate amount up to $700 billion, for the purpose of stabilizing and providing liquidity to the U.S. financial markets.

Troubled Debt Restructuring (TDR)Restructurings (TDRs)– Loans whose contractual terms have been restructured in a manner that grants a concession to a borrower experiencing financial difficulties. Concessions could include a reduction in the interest rate on the loan, payment extensions, forgiveness of principal, forbearance or other actions intended to maximize collection. TDRs are generally reported as nonperforming loans and leases while on nonaccrual status. TDRs that are on accrual status are reported as performing TDRs through the end of the calendar year in which the restructuring occurred or the year in which they are returned to accrual status. In addition, if accruing TDRs bear less than a market rate of interest at the time of modification, they are reported as performing TDRs throughout their remaining lives.
Value-at-Risk

Unrecognized Tax Benefit (UTB) – The difference between the benefit recognized for a tax position, which is measured as the largest dollar amount of the position that is more-likely-than-not to be sustained upon settlement, and the tax benefit claimed on a tax return.

Value-at-risk (VAR) (VaR) – A VARVaR model estimates a range of hypothetical scenarios to calculate a potential loss which is not expected to be exceeded with a specified confidence level. VARVaR is a key statistic used to measure and manage market risk.


Bank of America 2010     133


Variable Interest Entity (VIE)Acronyms – A term for an entity whose equity investors do not have a controlling financial interest. The entity may not have sufficient equity at risk to finance its activities without additional subordinated financial support from third parties. The equity investors may lack the ability to make significant decisions about the entity’s activities, or they may not absorb the losses or receive the residual returns generated by the assets and other contractual arrangements of the VIE. The entity that will absorb a majority of expected variability (the sum of the absolute values of the expected losses and expected residual returns) consolidates the VIE and is referred to as the primary beneficiary.


110 Bank of America 2009


Acronyms

ABCP 

Asset-backed commercial paper

ABS
 

Asset-backed securities

AFS 

Available-for-sale

ALMRC
AFS
 

Available-for-sale

ALM
Asset and liability management
ALMRC
Asset Liability Market Risk Committee

ALM 

Asset and liability management

ARM
 

Adjustable-rate mortgage

ARS 

ARS
Auction rate securities

ASF 

American Securitization Forum

BPS
 

Basis points

CDO 

CDO
Collateralized debt obligation

CES 

CES
Common Equivalent Securities

CMBS 

CMBS
Commercial mortgage-backed securities

CMO 

CMO
Collateralized mortgage obligation

CRA 

CRA
Community Reinvestment Act

CRC 

CRC
Credit Risk Committee

FASB 

FASB
Financial Accounting Standards Board

FDIC 

FDIC
Federal Deposit Insurance Corporation

FFIEC 

FFIEC
Federal Financial Institutions Examination Council

FHA 

FHA
Federal Housing Administration

FHLB 

Federal Home Loan Bank

FHLMC
 

Federal Home Loan Mortgage Corporation

Freddie Mac
FICC 

FICC
Fixed income, currencies and commodities

FNMA 

Federal National Mortgage Association

FTE
FICO
 

Fully taxable-equivalent

Fair Isaac Corporation (credit score)
GAAP 

FNMA
Fannie Mae
FSA
Financial Services Authority
FTE
Fully taxable-equivalent
GAAP
Generally accepted accounting principles in the United States of America

GNMA 

GNMA
Government National Mortgage Association

GRC 

GRC
Global Markets Risk Committee

GSE 

Government-sponsored enterprise

IPO
GSE
 

Government-sponsored enterprise

HAFA
Home Affordable Foreclosure Alternatives
IPO
Initial public offering

LHFS 

Loans held-for-sale

LIBOR
LHFS
 

Loans held-for-sale

LIBOR
London InterBank Offered Rate

MBS 

Mortgage-backed securities

MD&A
MBS
 

Mortgage-backed securities

MD&A
Management’s Discussion and Analysis of Financial Condition and Results of Operations

MSA 

MSA
Metropolitan statistical area

OCI 

OCI
Other comprehensive income

RMBS 

OTC
Over-the-counter
OTTI
Other-than-temporary impairment
PCI
Purchased credit-impaired
PPI
Payment protection insurance
QSPE
Qualifying special purpose entity
RMBS
Residential mortgage-backed securities

ROC 

ROC
Risk Oversight Committee

ROTE 

ROTE
Return on average tangible shareholders’ equity

SBA 

Small Business Administration

SBLCs
 

Standby letters of credit

SEC 

SEC
Securities and Exchange Commission

SPE 

SPE
Special purpose entity

Bank of America 2009 111
VA
Veterans Affairs
VIE
Variable interest entity
134     Bank of America 2010


Item 7A. QUANTITATIVE AND QUALITATIVE DISCLOSURES ABOUT MARKET RISK

See Market Risk Management beginning on page 100 in the MD&A beginning on page 79 which is incorporated herein by reference.

and the sections referenced therein for Quantitative and Qualitative Disclosures about Market Risk.

Item 8. FINANCIAL STATEMENTS AND SUPPLEMENTARY DATA

Report of Management on Internal Control


Over Financial Reporting

The management of Bank of America Corporation is responsible for establishing and maintaining adequate internal control over financial reporting.

The Corporation’s internal control over financial reporting is a process designed to provide reasonable assurance regarding the reliability of financial reporting and the preparation of financial statements for external purposes in accordance with accounting principles generally accepted in the United States of America. The Corporation’s internal control over financial reporting includes those policies and procedures that (i) pertain to the maintenance of records that, in reasonable detail, accurately and fairly reflect the transactions and dispositions of the assets of the Corporation; (ii) provide reasonable assurance that transactions are recorded as necessary to permit preparation of financial statements in accordance with accounting principles generally accepted in the United States of America, and that receipts and expenditures of the Corporation are being made only in accordance with authorizations of management and directors of the Corporation; and (iii) provide reasonable assurance regarding prevention or timely detection of unauthorized acquisition, use, or disposition of the Corporation’s assets that could have a material effect on the financial statements.

Because of its inherent limitations, internal control over financial reporting may not prevent or detect misstatements. Also, projections of any evaluation of effectiveness to future periods are subject to the risk that controls may become inadequate because of changes in conditions, or that the degree of compliance with the policies or procedures may deteriorate.

Management assessed the effectiveness of the Corporation’s internal control over financial reporting as of December 31, 2009,2010 based on the

framework set forth by the Committee of Sponsoring Organizations of the

Treadway Commission inInternal Control – Integrated Framework. Based on that assessment, management concluded that, as of December 31, 2009,2010, the Corporation’s internal control over financial reporting is effective based on the criteria established inInternal Control – Integrated Framework.

The Corporation’s internal control over financial reporting as of December 31, 20092010 has been audited by PricewaterhouseCoopers, LLP, an independent registered public accounting firm, as stated in their accompanying report which expresses an unqualified opinion on the effectiveness of the Corporation’s internal control over financial reporting as of December 31, 2009.

2010.

Brian T. Moynihan


Chief Executive Officer and President

Neil A. Cotty

Interim

Charles H. Noski
Chief Financial Officer

Chief Accounting Officer

and Executive Vice President

112Bank of America 2009

Bank of America 2010     135


Report of Independent Registered Public Accounting Firm

To the Board of Directors and Shareholders of Bank of America Corporation:

In our opinion, the accompanying Consolidated Balance Sheet and the related Consolidated Statement of Income, Consolidated Statement of Changes in Shareholders’ Equity and Consolidated Statement of Cash Flows present fairly, in all material respects, the financial position of Bank of America Corporation and its subsidiaries at December 31, 20092010 and 2008,2009, and the results of their operations and their cash flows for each of the three years in the period ended December 31, 20092010 in conformity with accounting principles generally accepted in the United States of America. Also in our opinion, the Corporation maintained, in all material respects, effective internal control over financial reporting as of December 31, 2009,2010, based on criteria established inInternal Control – Integrated Frameworkissued by the Committee of Sponsoring Organizations of the Treadway Commission (COSO). The Corporation’s management is responsible for these financial statements, for maintaining effective internal control over financial reporting and for its assessment of the effectiveness of internal control over financial reporting, included in the accompanying Report of Management on Internal Control Over Financial Reporting. Our responsibility is to express opinions on these financial statements and on the Corporation’s internal control over financial reporting based on our integrated audits. We conducted our audits in accordance with the standards of the Public Company Accounting Oversight Board (United States). Those standards require that we plan and perform the audits to obtain reasonable assurance about whether the financial statements are free of material misstatement and whether effective internal control over financial reporting was maintained in all material respects. Our audits of the financial statements included examining, on a test basis, evidence supporting the amounts and disclosures in the financial statements, assessing the accounting principles used and significant estimates made by management, and evaluating the overall financial statement presentation. Our audit of internal control over financial report - -

ingreporting included obtaining an understanding of internal control over financial reporting, assessing the risk that a material

weakness exists, and testing and evaluating the design and operating effectiveness of internal control based on the assessed risk. Our audits also included performing such other procedures as we considered necessary in the circumstances. We believe that our audits provide a reasonable basis for our opinions.

A company’s internal control over financial reporting is a process designed to provide reasonable assurance regarding the reliability of financial reporting and the preparation of financial statements for external purposes in accordance with generally accepted accounting principles. A company’s internal control over financial reporting includes those policies and procedures that (i) pertain to the maintenance of records that, in reasonable detail, accurately and fairly reflect the transactions and dispositions of the assets of the company; (ii) provide reasonable assurance that transactions are recorded as necessary to permit preparation of financial statements in accordance with generally accepted accounting principles, and that receipts and expenditures of the company are being made only in accordance with authorizations of management and directors of the company; and (iii) provide reasonable assurance regarding prevention or timely detection of unauthorized acquisition, use, or disposition of the company’s assets that could have a material effect on the financial statements.

Because of its inherent limitations, internal control over financial reporting may not prevent or detect misstatements. Also, projections of any evaluation of effectiveness to future periods are subject to the risk that controls may become inadequate because of changes in conditions, or that the degree of compliance with the policies or procedures may deteriorate.

Charlotte, North Carolina


February 26,25, 2011


136     Bank of America 2010


Bank of America 2009113


Bank of America Corporation and Subsidiaries

Consolidated Statement of Income

  Year Ended December 31 
(Dollars in millions, except per share information) 2009     2008   2007 

Interest income


Interest and fees on loans and leases

 $48,703      $56,017    $55,681  

Interest on debt securities

  12,947       13,146     9,784  

Federal funds sold and securities borrowed or purchased under agreements to resell

  2,894       3,313     7,722  

Trading account assets

  7,944       9,057     9,417  

Other interest income

  5,428       4,151     4,700  

Total interest income

  77,916       85,684     87,304  

Interest expense


Deposits

  7,807       15,250     18,093  

Short-term borrowings

  5,512       12,362     21,967  

Trading account liabilities

  2,075       2,774     3,444  

Long-term debt

  15,413       9,938     9,359  

Total interest expense

  30,807       40,324     52,863  

Net interest income

  47,109       45,360     34,441  

Noninterest income


Card income

  8,353       13,314     14,077  

Service charges

  11,038       10,316     8,908  

Investment and brokerage services

  11,919       4,972     5,147  

Investment banking income

  5,551       2,263     2,345  

Equity investment income

  10,014       539     4,064  

Trading account profits (losses)

  12,235       (5,911   (4,889

Mortgage banking income

  8,791       4,087     902  

Insurance income

  2,760       1,833     761  

Gains on sales of debt securities

  4,723       1,124     180  

Other income (loss)

  (14     (1,654   1,295  

Other-than-temporary impairment losses on available-for-sale debt securities:


Total other-than-temporary impairment losses

  (3,508     (3,461   (398

Less: Portion of other-than-temporary impairment losses recognized in other comprehensive income

  672              

Net impairment losses recognized in earnings on available-for-sale debt securities

  (2,836     (3,461   (398

Total noninterest income

  72,534       27,422     32,392  

Total revenue, net of interest expense

  119,643       72,782     66,833  

Provision for credit losses

  48,570       26,825     8,385  

Noninterest expense


Personnel

  31,528       18,371     18,753  

Occupancy

  4,906       3,626     3,038  

Equipment

  2,455       1,655     1,391  

Marketing

  1,933       2,368     2,356  

Professional fees

  2,281       1,592     1,174  

Amortization of intangibles

  1,978       1,834     1,676  

Data processing

  2,500       2,546     1,962  

Telecommunications

  1,420       1,106     1,013  

Other general operating

  14,991       7,496     5,751  

Merger and restructuring charges

  2,721       935     410  

Total noninterest expense

  66,713       41,529     37,524  

Income before income taxes

  4,360       4,428     20,924  

Income tax expense (benefit)

  (1,916     420     5,942  

Net income

 $6,276      $4,008    $14,982  

Preferred stock dividends and accretion

  8,480       1,452     182  

Net income (loss) applicable to common shareholders

 $(2,204    $2,556    $14,800  

Per common share information


Earnings (loss)

 $(0.29    $0.54    $3.32  

Diluted earnings (loss)

  (0.29     0.54     3.29  

Dividends paid

  0.04       2.24     2.40  

Average common shares issued and outstanding (in thousands)

  7,728,570       4,592,085     4,423,579  

Average diluted common shares issued and outstanding (in thousands)

  7,728,570       4,596,428     4,463,213  

             
  Year Ended December 31 
(Dollars in millions, except per share information) 2010  2009  2008 
Interest income
            
Loans and leases $50,996  $48,703  $56,017 
Debt securities  11,667   12,947   13,146 
Federal funds sold and securities borrowed or purchased under agreements to resell  1,832   2,894   3,313 
Trading account assets  6,841   7,944   9,057 
Other interest income  4,161   5,428   4,151 
             
Total interest income  75,497   77,916   85,684 
             
Interest expense
            
Deposits  3,997   7,807   15,250 
Short-term borrowings  3,699   5,512   12,362 
Trading account liabilities  2,571   2,075   2,774 
Long-term debt  13,707   15,413   9,938 
             
Total interest expense  23,974   30,807   40,324 
             
Net interest income
  51,523   47,109   45,360 
Noninterest income
            
Card income  8,108   8,353   13,314 
Service charges  9,390   11,038   10,316 
Investment and brokerage services  11,622   11,919   4,972 
Investment banking income  5,520   5,551   2,263 
Equity investment income  5,260   10,014   539 
Trading account profits (losses)  10,054   12,235   (5,911)
Mortgage banking income  2,734   8,791   4,087 
Insurance income  2,066   2,760   1,833 
Gains on sales of debt securities  2,526   4,723   1,124 
Other income (loss)  2,384   (14)  (1,654)
Other-than-temporary impairment losses onavailable-for-sale debt securities:
            
Totalother-than-temporary impairment losses
  (2,174)  (3,508)  (3,461)
Less: Portion ofother-than-temporary impairment losses recognized in other comprehensive income
  1,207   672    
             
Net impairment losses recognized in earnings onavailable-for-sale debt securities
  (967)  (2,836)  (3,461)
             
Total noninterest income  58,697   72,534   27,422 
             
Total revenue, net of interest expense
  110,220   119,643   72,782 
             
Provision for credit losses
  28,435   48,570   26,825 
             
Noninterest expense
            
Personnel  35,149   31,528   18,371 
Occupancy  4,716   4,906   3,626 
Equipment  2,452   2,455   1,655 
Marketing  1,963   1,933   2,368 
Professional fees  2,695   2,281   1,592 
Amortization of intangibles  1,731   1,978   1,834 
Data processing  2,544   2,500   2,546 
Telecommunications  1,416   1,420   1,106 
Other general operating  16,222   14,991   7,496 
Goodwill impairment  12,400       
Merger and restructuring charges  1,820   2,721   935 
             
Total noninterest expense  83,108   66,713   41,529 
             
Income (loss) before income taxes
  (1,323)  4,360   4,428 
Income tax expense (benefit)
  915   (1,916)  420 
             
Net income (loss)
 $(2,238) $6,276  $4,008 
             
Preferred stock dividends and accretion
  1,357   8,480   1,452 
             
Net income (loss) applicable to common shareholders
 $(3,595) $(2,204) $2,556 
             
Per common share information
            
Earnings (loss) $(0.37) $(0.29) $0.54 
Diluted earnings (loss)  (0.37)  (0.29)  0.54 
Dividends paid  0.04   0.04   2.24 
             
Average common shares issued and outstanding (in thousands)
  9,790,472   7,728,570   4,592,085 
             
Average diluted common shares issued and outstanding (in thousands)
  9,790,472   7,728,570   4,596,428 
             
See accompanying Notes to Consolidated Financial Statements.

114Bank of America 2009
Bank of America 2010     137


Bank of America Corporation and Subsidiaries

Consolidated Balance Sheet

  December 31 
(Dollars in millions) 2009     2008 

Assets


Cash and cash equivalents

 $121,339      $32,857  

Time deposits placed and other short-term investments

  24,202       9,570  

Federal funds sold and securities borrowed or purchased under agreements to resell (includes$57,775 and $2,330 measured at fair value and$189,844 and $82,099 pledged as collateral)

  189,933       82,478  

Trading account assets (includes$30,921 and $69,348 pledged as collateral)

  182,206       134,315  

Derivative assets

  80,689       62,252  

Debt securities:


Available-for-sale (includes$122,708 and $158,939 pledged as collateral)

  301,601       276,904  

Held-to-maturity, at cost (fair value –$9,684 and $685)

  9,840       685  

Total debt securities

  311,441       277,589  

Loans and leases (includes$4,936 and $5,413 measured at fair value and$118,113 and $166,891 pledged as collateral)

  900,128       931,446  

Allowance for loan and lease losses

  (37,200     (23,071

Loans and leases, net of allowance

  862,928       908,375  

Premises and equipment, net

  15,500       13,161  

Mortgage servicing rights (includes$19,465 and $12,733 measured at fair value)

  19,774       13,056  

Goodwill

  86,314       81,934  

Intangible assets

  12,026       8,535  

Loans held-for-sale (includes$32,795 and $18,964 measured at fair value)

  43,874       31,454  

Customer and other receivables

  81,996       37,608  

Other assets (includes$55,909 and $55,113 measured at fair value)

  191,077       124,759  

Total assets

 $2,223,299      $1,817,943  

Liabilities


Deposits in domestic offices:


Noninterest-bearing

 $269,615      $213,994  

Interest-bearing (includes$1,663 and $1,717 measured at fair value)

  640,789       576,938  

Deposits in foreign offices:


Noninterest-bearing

  5,489       4,004  

Interest-bearing

  75,718       88,061  

Total deposits

  991,611       882,997  

Federal funds purchased and securities loaned or sold under agreements to repurchase (includes
$37,325 measured at fair value at December 31, 2009)

  255,185       206,598  

Trading account liabilities

  65,432       51,723  

Derivative liabilities

  43,728       30,709  

Commercial paper and other short-term borrowings (includes$813 measured at
fair value at December 31, 2009)

  69,524       158,056  

Accrued expenses and other liabilities (includes$19,015 and $7,542 measured at fair value and$1,487 and $421 of reserve for unfunded lending commitments)

  127,854       42,516  

Long-term debt (includes$45,451 measured at fair value at December 31, 2009)

  438,521       268,292  

Total liabilities

  1,991,855       1,640,891  

Commitments and contingencies (Note 9 – Variable Interest Entities andNote 14Commitments and Contingencies)


Shareholders’ equity


Preferred stock, $0.01 par value; authorized –100,000,000 shares; issued and outstanding –5,246,660 and 8,202,042 shares

  37,208       37,701  

Common stock and additional paid-in capital, $0.01 par value; authorized –10,000,000,000 shares; issued and outstanding –8,650,243,926 and 5,017,435,592 shares

  128,734       76,766  

Retained earnings

  71,233       73,823  

Accumulated other comprehensive income (loss)

  (5,619     (10,825

Other

  (112     (413

Total shareholders’ equity

  231,444       177,052  

Total liabilities and shareholders’ equity

 $2,223,299      $1,817,943  

         
  December 31 
(Dollars in millions) 2010  2009 
Assets
        
Cash and cash equivalents $108,427  $121,339 
Time deposits placed and other short-term investments  26,433   24,202 
Federal funds sold and securities borrowed or purchased under agreements to resell (includes$78,599and $57,775 measured at fair value and$209,249and $189,844 pledged as collateral)
  209,616   189,933 
Trading account assets (includes$28,093and $30,921 pledged as collateral)
  194,671   182,206 
Derivative assets  73,000   87,622 
Debt securities:        
Available-for-sale (includes$99,925and $122,708 pledged as collateral)
  337,627   301,601 
Held-to-maturity, at cost (fair value –$427and $9,684)
  427   9,840 
         
Total debt securities  338,054   311,441 
         
Loans and leases (includes$3,321and $4,936 measured at fair value and$91,730 and $118,113 pledged as collateral)
  940,440   900,128 
Allowance for loan and lease losses  (41,885)  (37,200)
         
Loans and leases, net of allowance  898,555   862,928 
         
Premises and equipment, net  14,306   15,500 
Mortgage servicing rights (includes$14,900and $19,465 measured at fair value)
  15,177   19,774 
Goodwill  73,861   86,314 
Intangible assets  9,923   12,026 
Loansheld-for-sale (includes$25,942and $32,795 measured at fair value)
  35,058   43,874 
Customer and other receivables  85,704   81,996 
Other assets (includes$70,531and $55,909 measured at fair value)
  182,124   191,077 
         
Total assets
 $2,264,909  $2,230,232 
         
         
Assets of consolidated VIEs included in total assets above (substantially all pledged as collateral)
        
         
Trading account assets $19,627     
Derivative assets  2,027     
Available-for-sale debt securities
  2,601     
Loans and leases  145,469     
Allowance for loan and lease losses  (8,935)    
         
Loans and leases, net of allowance  136,534     
         
Loansheld-for-sale
  1,953     
All other assets  7,086     
         
Total assets of consolidated VIEs
 $169,828     
         
See accompanying Notes to Consolidated Financial Statements.

Bank of America 2009115
138     Bank of America 2010


Bank of America Corporation and Subsidiaries
Consolidated Balance Sheet (continued)
         
  December 31 
(Dollars in millions) 2010  2009 
Liabilities
        
Deposits in U.S. offices:        
Noninterest-bearing $285,200  $269,615 
Interest-bearing (includes$2,732and $1,663 measured at fair value)
  645,713   640,789 
Deposits innon-U.S. offices:
        
Noninterest-bearing  6,101   5,489 
Interest-bearing  73,416   75,718 
         
Total deposits  1,010,430   991,611 
         
Federal funds purchased and securities loaned or sold under agreements to repurchase (includes$37,424 and $37,325 measured at fair value)
  245,359   255,185 
Trading account liabilities  71,985   65,432 
Derivative liabilities  55,914   50,661 
Commercial paper and other short-term borrowings (includes$7,178 and $1,520 measured at fair value)
  59,962   69,524 
Accrued expenses and other liabilities (includes$33,229 and $18,308 measured at fair value and$1,188 and $1,487 of reserve for unfunded lending commitments)
  144,580   127,854 
Long-term debt (includes$50,984 and $45,451 measured at fair value)
  448,431   438,521 
         
Total liabilities
  2,036,661   1,998,788 
         
Commitments and contingencies (Note 8 – Securitizations and Other Variable Interest Entities, Note 9 – Representations and Warranties Obligations and Corporate GuaranteesandNote 14 – Commitments and Contingencies)
        
Shareholders’ equity
        
Preferred stock, $0.01 par value; authorized –100,000,000 shares; issued and outstanding –3,943,660and 5,246,660 shares
  16,562   37,208 
Common stock and additional paid-in capital, $0.01 par value; authorized –12,800,000,000and 10,000,000,000 shares; issued and outstanding –10,085,154,806and 8,650,243,926 shares
  150,905   128,734 
Retained earnings  60,849   71,233 
Accumulated other comprehensive income (loss)  (66)  (5,619)
Other  (2)  (112)
         
Total shareholders’ equity
  228,248   231,444 
         
Total liabilities and shareholders’ equity
 $2,264,909  $2,230,232 
         
         
Liabilities of consolidated VIEs included in total liabilities above
        
         
Commercial paper and other short-term borrowings (includes$706 of non-recourse liabilities)
 $6,742     
Long-term debt (includes$66,309 of non-recourse debt)
  71,013     
All other liabilities (includes$382 of non-recourse liabilities)
  9,141     
         
Total liabilities of consolidated VIEs
 $86,896     
See accompanying Notes to Consolidated Financial Statements.
Bank of America 2010     139


Bank of America Corporation and Subsidiaries
Consolidated Statement of Changes in Shareholders’ Equity

(Dollars in millions, shares in thousands) Preferred
Stock
  Common Stock and
Additional Paid-in
Capital
  Retained
Earnings
  

Accumulated
Other
Comprehensive
Income

(Loss)

  Other  Total
Shareholders’
Equity
  Comprehensive
Income (Loss)
 
   Shares  Amount      

Balance, December 31, 2006

 $2,851   4,458,151   $61,574   $79,024   $(7,711 $(466 $135,272   

Cumulative adjustment for accounting changes:


Leveraged leases

     (1,381    (1,381 

Fair value option and measurement

     (208    (208 

Income tax uncertainties

     (146    (146 

Net income

     14,982      14,982   $14,982  

Net change in available-for-sale debt and marketable
equity securities

      9,269     9,269    9,269  

Net change in foreign currency translation adjustments

      149     149    149  

Net change in derivatives

      (705   (705  (705

Employee benefit plan adjustments

      127     127    127  

Dividends paid:


Common

     (10,696    (10,696 

Preferred

     (182    (182 

Issuance of preferred stock

  1,558         1,558   

Common stock issued under employee plans and
related tax effects

  53,464    2,544      10    2,554   

Common stock repurchased

     (73,730  (3,790              (3,790    

Balance, December 31, 2007

  4,409   4,437,885    60,328    81,393    1,129    (456  146,803    23,822  

Net income

     4,008      4,008    4,008  

Net change in available-for-sale debt and marketable
equity securities

      (8,557   (8,557  (8,557

Net change in foreign currency translation adjustments

      (1,000   (1,000  (1,000

Net change in derivatives

      944     944    944  

Employee benefit plan adjustments

      (3,341   (3,341  (3,341

Dividends paid:


Common

     (10,256    (10,256 

Preferred

     (1,272    (1,272 

Issuance of preferred stock and stock warrants

  33,242     1,500       34,742   

Stock issued in acquisition

  106,776    4,201       4,201   

Issuance of common stock

  455,000    9,883       9,883   

Common stock issued under employee plans and
related tax effects

  17,775    854      43    897   

Other

  50           (50                

Balance, December 31, 2008

  37,701   5,017,436    76,766    73,823    (10,825  (413  177,052    (7,946

Cumulative adjustment for accounting change:


Other-than-temporary impairment on debt securities

     71    (71      

Net income

     6,276      6,276    6,276  

Net change in available-for-sale debt and marketable
equity securities

      3,593     3,593    3,593  

Net change in foreign currency translation adjustments

      211     211    211  

Net change in derivatives

      923     923    923  

Employee benefit plan adjustments

      550     550    550  

Dividends paid:


Common

     (326    (326 

Preferred

     (4,537    (4,537 

Issuance of preferred stock and stock warrants

  26,800     3,200       30,000   

Repayment of preferred stock

  (41,014    (3,986    (45,000 

Issuance of Common Equivalent Securities

  19,244         19,244   

Stock issued in acquisition

  8,605   1,375,476    20,504       29,109   

Issuance of common stock

  1,250,000    13,468       13,468   

Exchange of preferred stock

  (14,797 999,935    14,221    576         

Common stock issued under employee plans and
related tax effects

  7,397    575      308    883   

Other

  669           (664      (7  (2    

Balance, December 31, 2009

 $37,208   8,650,244   $128,734   $71,233   $(5,619 $(112 $231,444   $11,553  

                                 
     Common Stock and
                
     Additional Paid-in
                
     Capital     Accumulated
          
          Other
     Total
    
  Preferred
        Retained
  Comprehensive
     Shareholders’
  Comprehensive
 
(Dollars in millions, shares in thousands) Stock  Shares  Amount  Earnings  Income (Loss)  Other  Equity  Income (Loss) 
Balance, December 31, 2007
 $4,409   4,437,885  $60,328  $81,393  $1,129  $(456) $146,803     
Net income              4,008           4,008  $4,008 
Net change inavailable-for-sale debt and marketable equity securities
                  (8,557)      (8,557)  (8,557)
Net change in derivatives                  944       944   944 
Employee benefit plan adjustments                  (3,341)      (3,341)  (3,341)
Net change in foreign currency translation adjustments                  (1,000)      (1,000)  (1,000)
Dividends paid:                                
Common              (10,256)          (10,256)    
Preferred              (1,272)          (1,272)    
Issuance of preferred stock and stock warrants  33,242       1,500               34,742     
Stock issued in acquisition      106,776   4,201               4,201     
Issuance of common stock      455,000   9,883               9,883     
Common stock issued under employee plans and related tax effects      17,775   854           43   897     
Other  50           (50)               
                                 
Balance, December 31, 2008
  37,701   5,017,436   76,766   73,823   (10,825)  (413)  177,052   (7,946)
                                 
Cumulative adjustment for accounting change –Other-than-temporary impairments on debt securities
              71   (71)         (71)
Net income              6,276           6,276   6,276 
Net change inavailable-for-sale debt and marketable equity securities
                  3,593       3,593   3,593 
Net change in derivatives                  923       923   923 
Employee benefit plan adjustments                  550       550   550 
Net change in foreign currency translation adjustments                  211       211   211 
Dividends paid:                                
Common              (326)          (326)    
Preferred              (4,537)          (4,537)    
Issuance of preferred stock and stock warrants  26,800       3,200               30,000     
Repayment of preferred stock  (41,014)          (3,986)          (45,000)    
Issuance of Common Equivalent Securities  19,244                       19,244     
Stock issued in acquisition  8,605   1,375,476   20,504               29,109     
Issuance of common stock      1,250,000   13,468               13,468     
Exchange of preferred stock  (14,797)  999,935   14,221   576                
Common stock issued under employee plans and related tax effects      7,397   575           308   883     
Other  669           (664)      (7)  (2)    
                                 
Balance, December 31, 2009
  37,208   8,650,244   128,734   71,233   (5,619)  (112)  231,444   11,482 
                                 
Cumulative adjustments for accounting changes:                                
Consolidation of certain variable interest entities              (6,154)  (116)      (6,270)  (116)
Credit-related notes              (229)  229          229 
Net loss              (2,238)          (2,238)  (2,238)
Net change inavailable-for-sale debt and marketable equity securities
                  5,759       5,759   5,759 
Net change in derivatives                  (701)      (701)  (701)
Employee benefit plan adjustments                  145       145   145 
Net change in foreign currency translation adjustments                  237       237   237 
Dividends paid:                                
Common              (405)          (405)    
Preferred              (1,357)          (1,357)    
Common stock issued under employee plans and related tax effects      98,557   1,385           103   1,488     
Mandatory convertible preferred stock conversion  (1,542)  50,354   1,542                    
Common Equivalent Securities conversion  (19,244)  1,286,000   19,244                    
Other  140           (1)      7   146     
                                 
Balance, December 31, 2010
 $16,562   10,085,155  $150,905  $60,849  $(66) $(2) $228,248  $3,315 
                                 
See accompanying Notes to Consolidated Financial Statements.

116Bank of America 2009
140     Bank of America 2010


Bank of America Corporation and Subsidiaries

Consolidated Statement of Cash Flows

  Year Ended December 31 
(Dollars in millions) 2009     2008   2007 

Operating activities


Net income

 $6,276      $4,008    $14,982  

Reconciliation of net income to net cash provided by operating activities:


Provision for credit losses

  48,570       26,825     8,385  

Gains on sales of debt securities

  (4,723     (1,124   (180

Depreciation and premises improvements amortization

  2,336       1,485     1,168  

Amortization of intangibles

  1,978       1,834     1,676  

Deferred income tax expense (benefit)

  370       (5,801   (753

Net decrease (increase) in trading and derivative instruments

  59,822       (16,973   (8,108

Net decrease (increase) in other assets

  28,553       (6,391   (15,855

Net (decrease) increase in accrued expenses and other liabilities

  (16,601     (8,885   4,190  

Other operating activities, net

  3,150       9,056     5,531  

Net cash provided by operating activities

  129,731       4,034     11,036  

Investing activities


Net decrease in time deposits placed and other short-term investments

  19,081       2,203     2,191  

Net decrease in federal funds sold and securities borrowed or purchased under agreements to resell

  31,369       53,723     6,294  

Proceeds from sales of available-for-sale debt securities

  164,155       120,972     28,107  

Proceeds from paydowns and maturities of available-for-sale debt securities

  59,949       26,068     19,233  

Purchases of available-for-sale debt securities

  (185,145     (184,232   (28,016

Proceeds from maturities of held-to-maturity debt securities

  2,771       741     630  

Purchases of held-to-maturity debt securities

  (3,914     (840   (314

Proceeds from sales of loans and leases

  7,592       52,455     57,875  

Other changes in loans and leases, net

  21,257       (69,574   (177,665

Net purchases of premises and equipment

  (2,240     (2,098   (2,143

Proceeds from sales of foreclosed properties

  1,997       1,187     104  

Cash received (paid) upon acquisition, net

  31,804       6,650     (19,816

Other investing activities, net

  9,249       (10,185   5,040  

Net cash provided by (used in) investing activities

  157,925       (2,930   (108,480

Financing activities


Net increase in deposits

  10,507       14,830     45,368  

Net decrease in federal funds purchased and securities loaned or sold under agreements to repurchase

  (62,993     (34,529   (1,448

Net (decrease) increase in commercial paper and other short-term borrowings

  (126,426     (33,033   32,840  

Proceeds from issuance of long-term debt

  67,744       43,782     67,370  

Retirement of long-term debt

  (101,207     (35,072   (28,942

Proceeds from issuance of preferred stock

  49,244       34,742     1,558  

Repayment of preferred stock

  (45,000            

Proceeds from issuance of common stock

  13,468       10,127     1,118  

Common stock repurchased

              (3,790

Cash dividends paid

  (4,863     (11,528   (10,878

Excess tax benefits of share-based payments

         42     254  

Other financing activities, net

  (42     (56   (38

Net cash provided by (used in) financing activities

  (199,568     (10,695   103,412  

Effect of exchange rate changes on cash and cash equivalents

  394       (83   134  

Net increase (decrease) in cash and cash equivalents


88,482


     (9,674   6,102  

Cash and cash equivalents at January 1

  32,857       42,531     36,429  

Cash and cash equivalents at December 31

 $121,339      $32,857    $42,531  

Supplemental cash flow disclosures


Cash paid for interest

 $37,602      $36,387    $51,829  

Cash paid for income taxes

  2,933       4,700     9,196  

During

2009, the Corporation exchanged $14.8 billion of preferred stock by issuing 1.0 billion shares of common stock valued at $11.5 billion.

During 2009, the Corporation transferred credit card loans of $8.5 billion and the related allowance for loan and lease losses of $750 million in exchange for a $7.8 billion held-to-maturity debt security that was issued by the Corporation’s U.S. Credit Card Securitization Trust.

The fair values of noncash assets acquired and liabilities assumed in the Merrill Lynch acquisition were $618.4 billion and $626.2 billion at January 1, 2009.

Approximately 1.4 billion shares of common stock, valued at approximately $20.5 billion and 376 thousand shares of preferred stock valued at $8.6 billion were issued in connection with the Merrill Lynch acquisition.

The Corporation securitized $14.0 billion and $26.1 billion of residential mortgage loans into mortgage-backed securities and $0 and $4.9 billion of automobile loans into asset-backed securities which were retained by the Corporation during 2009 and 2008.

The fair values of noncash assets acquired and liabilities assumed in the Countrywide acquisition were $157.4 billion and $157.8 billion at July 1, 2008.

Approximately 107 million shares of common stock, valued at approximately $4.2 billion were issued in connection with the Countrywide acquisition.

The fair values of noncash assets acquired and liabilities assumed in the LaSalle Bank Corporation acquisition were $115.8 billion and $97.1 billion at October 1, 2007.

The fair values of noncash assets acquired and liabilities assumed in the U.S. Trust Corporation acquisition were $12.9 billion and $9.8 billion at July 1, 2007.

             
  Year Ended December 31 
(Dollars in millions) 2010  2009  2008 
Operating activities
            
Net income (loss) $(2,238) $6,276  $4,008 
Reconciliation of net income (loss) to net cash provided by operating activities:            
Provision for credit losses  28,435   48,570   26,825 
Goodwill impairment charges  12,400       
Gains on sales of debt securities  (2,526)  (4,723)  (1,124)
Depreciation and premises improvements amortization  2,181   2,336   1,485 
Amortization of intangibles  1,731   1,978   1,834 
Deferred income tax expense (benefit)  608   370   (5,801)
Net (increase) decrease in trading and derivative instruments  20,775   59,822   (16,973)
Net (increase) decrease in other assets  5,213   28,553   (6,391)
Net increase (decrease) in accrued expenses and other liabilities  14,069   (16,601)  (8,885)
Other operating activities, net  1,946   3,150   9,056 
             
Net cash provided by operating activities  82,594   129,731   4,034 
             
Investing activities
            
Net (increase) decrease in time deposits placed and other short-term investments  (2,154)  19,081   2,203 
Net (increase) decrease in federal funds sold and securities borrowed or purchased under agreements to resell  (19,683)  31,369   53,723 
Proceeds from sales ofavailable-for-sale debt securities
  100,047   164,155   120,972 
Proceeds from paydowns and maturities ofavailable-for-sale debt securities
  70,868   59,949   26,068 
Purchases ofavailable-for-sale debt securities
  (199,159)  (185,145)  (184,232)
Proceeds from maturities ofheld-to-maturity debt securities
  11   2,771   741 
Purchases ofheld-to-maturity debt securities
  (100)  (3,914)  (840)
Proceeds from sales of loans and leases  8,046   7,592   52,455 
Other changes in loans and leases, net  (2,550)  21,257   (69,574)
Net purchases of premises and equipment  (987)  (2,240)  (2,098)
Proceeds from sales of foreclosed properties  3,107   1,997   1,187 
Cash received upon acquisition, net     31,804   6,650 
Cash received due to impact of adoption of new consolidation guidance  2,807       
Other investing activities, net  9,400   9,249   (10,185)
             
Net cash provided by (used in) investing activities  (30,347)  157,925   (2,930)
             
Financing activities
            
Net increase in deposits  36,598   10,507   14,830 
Net decrease in federal funds purchased and securities loaned or sold under agreements to repurchase  (9,826)  (62,993)  (34,529)
Net decrease in commercial paper and other short-term borrowings  (31,698)  (126,426)  (33,033)
Proceeds from issuance of long-term debt  52,215   67,744   43,782 
Retirement of long-term debt  (110,919)  (101,207)  (35,072)
Proceeds from issuance of preferred stock     49,244   34,742 
Repayment of preferred stock     (45,000)   
Proceeds from issuance of common stock     13,468   10,127 
Cash dividends paid  (1,762)  (4,863)  (11,528)
Excess tax benefits on share-based payments        42 
Other financing activities, net  5   (42)  (56)
             
Net cash used in financing activities  (65,387)  (199,568)  (10,695)
             
Effect of exchange rate changes on cash and cash equivalents  228   394   (83)
             
Net increase (decrease) in cash and cash equivalents  (12,912)  88,482   (9,674)
Cash and cash equivalents at January 1  121,339   32,857   42,531 
             
Cash and cash equivalents at December 31
 $108,427  $121,339  $32,857 
             
Supplemental cash flow disclosures
            
Interest paid $21,166  $37,602  $36,387 
Income taxes paid  1,465   2,964   4,816 
Income taxes refunded  (7,783)  (31)  (116)
             
During 2010, the Corporation sold First Republic Bank in a non-cash transaction that reduced assets and liabilities by $19.5 billion and $18.1 billion.
The Corporation securitized $2.4 billion, $14.0 billion and $26.1 billion of residential mortgage loans into mortgage-backed securities which were retained by the Corporation during 2010, 2009 and 2008, respectively.
During 2009, the Corporation exchanged $14.8 billion of preferred stock by issuing approximately 1.0 billion shares of common stock valued at $11.5 billion.
During 2009, the Corporation exchanged credit card loans of $8.5 billion and the related allowance for loan and lease losses of $750 million for a $7.8 billionheld-to-maturity debt security that was issued by the Corporation’s U.S. credit card securitization trust and retained by the Corporation.
The acquisition-date fair values of non-cash assets acquired and liabilities assumed in the Merrill Lynch & Co., Inc. (Merrill Lynch) acquisition were $619.1 billion and $626.8 billion.
Approximately 1.4 billion shares of common stock valued at approximately $20.5 billion and 376 thousand shares of preferred stock valued at approximately $8.6 billion were issued in connection with the Merrill Lynch acquisition.
The acquisition-date fair values of non-cash assets acquired and liabilities assumed in the Countrywide Financial Corporation (Countrywide) acquisition were $157.4 billion and $157.8 billion.
Approximately 107 million shares of common stock, valued at approximately $4.2 billion were issued in connection with the Countrywide acquisition.
See accompanying Notes to Consolidated Financial Statements.

Bank of America 2009117
Bank of America 2010     141


Bank of America Corporation and Subsidiaries

Notes to Consolidated Financial Statements

NOTE 1 Summary of Significant Accounting Principles

Bank of America Corporation (the(collectively with its subsidiaries, the Corporation), through its banking and nonbanking subsidiaries,a financial holding company, provides a diverse range of financial services and products throughout the U.S. and in certain international markets. At December 31,The term “the Corporation” as used herein may refer to the Corporation individually, the Corporation and its subsidiaries, or certain of the Corporation’s subsidiaries or affiliates.
The Corporation conducts its activities through banking and nonbanking subsidiaries. On January 1, 2009, the Corporation operatedacquired Merrill Lynch & Co., Inc. (Merrill Lynch) in exchange for common and preferred stock with a value of $29.1 billion. The Corporation operates its banking activities primarily under two charters: Bank of America, National Association (Bank of America, N.A.) and FIA Card Services, N.A. In connection with certain acquisitions including Merrill Lynch, & Co. Inc. (Merrill Lynch) and Countrywide Financial Corporation (Countrywide), the Corporation acquired banking subsidiaries that have been merged into Bank of America, N.A. with no impact on the Consolidated Financial Statements of the Corporation.

On January 1, 2009, the Corporation acquired Merrill Lynch through its merger with a subsidiary of the Corporation in exchange for common and preferred stock with a value of $29.1 billion. On July 1, 2008, the Corporation acquired all of the outstanding shares of Countrywide through its merger with a subsidiary of the Corporation in exchange for common stock with a value of $4.2 billion. On October 1, 2007, the Corporation acquired all the outstanding shares of ABN AMRO North America Holding Company, parent of LaSalle Bank Corporation (LaSalle), for $21.0 billion in cash. On July 1, 2007, the Corporation acquired all the outstanding shares of U.S. Trust Corporation for $3.3 billion in cash.

The results of operations of the acquired companies were included in the Corporation’s results from their dates of acquisition.

Principles of Consolidation and Basis of Presentation

The Consolidated Financial Statements include the accounts of the Corporation and its majority-owned subsidiaries, and those variable interest entities (VIEs) where the Corporation is the primary beneficiary. Intercompany accounts and transactions have been eliminated. Results of operations of acquired companies are included from the dates of acquisition and for VIEs, from the dates that the Corporation became the primary beneficiary. Assets held in an agency or fiduciary capacity are not included in the Consolidated Financial Statements. The Corporation accounts for investments in companies for which it owns a voting interest of 20 percent to 50 percent and for which it has the ability to exercise significant influence over operating and financing decisions using the equity method of accounting.accounting or at fair value under the fair value option. These investments are included in other assets andassets. Equity method investments are subject to impairment testing. Thetesting and the Corporation’s proportionate share of income or loss is included in equity investment income.

The preparation of the Consolidated Financial Statements in conformity with accounting principles generally accepted in the United States of America (GAAP) requires management to make estimates and assumptions that affect reported amounts and disclosures. Realized results could differ from those estimates and assumptions.

The Corporation evaluates subsequent events through the date of filing with the Securities and Exchange Commission (SEC). Certain prior period amounts have been reclassified to conform to current period presentation.

New Accounting Pronouncements

On July 1, 2009, the Corporation adopted new guidance that established

In March 2010, the Financial Accounting Standards Board (FASB) Accounting Standards Codification (Codification) asissued new accounting guidance on embedded credit derivatives. This new accounting guidance clarifies the single source of authoritative GAAP. The Codification establishes a common referencing systemscope exception for accounting standardsembedded credit derivatives and is generally organized by subject matter. Usedefines which embedded credit derivatives are required to be evaluated for bifurcation and separate accounting. In addition, the guidance extends the current disclosure requirements for credit derivatives to all securities with potential embedded derivative features regardless of the Codification has no impactaccounting treatment. This new accounting guidance was effective on July 1, 2010. Upon adoption, companies may elect the Corporation’s financial condition or results of operations.fair value option for any beneficial interests, including those that would otherwise require bifurcation under the new

guidance. In connection with the useadoption of the Codification,guidance on July 1, 2010, the Corporation elected the fair value option for $629 million of AFS debt securities, principally collateralized debt obligations (CDOs), that otherwise may be subject to bifurcation under the new guidance. In connection with this Form 10-K no longer makes referenceelection, the Corporation recorded a $229 million charge to specificretained earnings on July 1, 2010 as an after-tax adjustment to reclassify the net unrealized loss on these AFS debt securities from accumulated other comprehensive income (OCI) to retained earnings and they were reclassified to trading account assets. The Corporation did not bifurcate any securities as a result of adopting the new accounting standardsguidance. The additional disclosures required by number or title.

In June 2009,this new guidance are included inNote 4 – Derivatives.

On January 1, 2010, the Corporation adopted new FASB issued new accounting guidance on transfers of financial assets and consolidation of VIEs. This new accounting guidance which was effective on January 1, 2010, revises existingrevised sale accounting criteria for transfers of financial assets, eliminated the concept of and accounting for qualifying special purpose entities (QSPEs) and significantly changeschanged the criteria by which an enterprise determines whether it must consolidatefor consolidation of a VIE. The adoption of this new accounting guidance on January 1, 2010 resulted in the consolidation of certain qualifying special purpose entities (QSPEs)VIEs that previously were QSPEs and VIEs that were not recorded on the Corporation’s Consolidated Balance Sheet prior to that date.January 1, 2010. The adoption of this new accounting guidance resulted in a net incremental increase in assets onof $100.4 billion and a preliminary basis,net increase in liabilities of approximately $100 billion, including $70 billion resulting from consolidation of credit card trusts and $30 billion from consolidation of other special purpose entities (SPEs) including multi-seller conduits.$106.7 billion. These amounts are net of retained interests in securitizations held on the Consolidated Balance Sheet at December 31, 2009 and an $11net of a $10.8 billion increase in the allowance for loan losses, the majority of which relatesand lease losses. The Corporation recorded a $6.2 billion charge,net-of-tax, to credit card receivables. This increase in the allowance for loan losses was recordedretained earnings on January 1, 2010 as a charge net-of-tax to retained earnings for the cumulative effect of the adoption of this new accounting guidance.guidance, which resulted principally from an increase in the allowance for loan and lease losses related to the newly consolidated loans, and a $116 million charge to accumulated OCI. Initial recording of these assets, and related allowance and liabilities on the Corporation’s Consolidated Balance Sheet had no impact at the date of adoption on the consolidated results of operations.

On January 1, 2009,2010, the Corporation elected to early adoptadopted, on a prospective basis, new FASB accounting guidance for determining whether a market is inactive and a transaction is distressed in orderstating that troubled debt restructuring (TDR) accounting cannot be applied to apply the existing fair value measurements guidance. In addition, this new guidance requires enhanced disclosures regarding financial assets and liabilities that are recorded at fair value.individual loans within purchased credit-impaired (PCI) loan pools. The adoption of this new guidance did not have a material impact on the Corporation’s consolidated financial condition or results of operations. The enhanced disclosures required under this new guidance are included inNote 20 – Fair Value Measurements.

On January 1, 2009, the Corporation elected to early adopt new FASB guidance on recognition and presentation of other-than-temporary impairment of debt securities that requires an entity to recognize the credit component of other-than-temporary impairment of a debt security in earnings and the noncredit component in other comprehensive income (OCI) when the entity does not intend to sell the security and it is more-likely-than-not that the entity will not be required to sell the security prior to recovery. This new guidance also requires expanded disclosures. In connection with the adoption of this new guidance, the Corporation recorded a cumulative-effect adjustment to reclassify $71 million, net-of-tax, from retained earnings to accumulated OCI as of January 1,


118Bank of America 2009


2009. This new guidance does not change the recognition of other-than- temporary impairment for equity securities. The expanded disclosures required by this new guidance are included inNote 5 – Securities.

On January 1, 2009, the Corporation adopted new FASB guidance that modifies the accounting for business combinations and requires, with limited exceptions, the acquirer in a business combination to recognize 100 percent of the assets acquired, liabilities assumed and any noncontrolling interest in the acquired company at the acquisition-date fair value. In addition, the guidance requires that acquisition-related transaction and restructuring costs be charged to expense as incurred, and requires that certain contingent assets acquired and liabilities assumed, as well as contingent consideration, be recognized at fair value. This new guidance also modifies the accounting for certain acquired income tax assets and liabilities.

Further, the new FASB guidance requires that assets acquired and liabilities assumed in a business combination that arise from contingencies be recognized at fair value on the acquisition date if fair value can be determined during the measurement period. If fair value cannot be determined, companies should typically account for the acquired contingencies under existing accounting guidance. This new guidance is effective for acquisitions consummated on or after January 1, 2009. The Corporation applied this new guidance to its January 1, 2009 acquisition of Merrill Lynch.

On January 1, 2009, the Corporation adopted new FASB guidance that defines unvested share-based payment awards that contain nonforfeitable rights to dividends as participating securities that should be included in computing earnings per share (EPS) using the two-class method. Additionally, all prior-period EPS data was adjusted retrospectively. The adoption did not have a material impact on the Corporation’s financial condition or results of operations.

On January 1, 2009, the Corporation adopted new FASB guidance that requires expanded qualitative, quantitative and credit-risk disclosures about derivatives and hedging activities and their effects on the Corporation’s financial position, financial performance and cash flows. The adoption of this new guidance did not impact the Corporation’s financial condition or results of operations. The expanded disclosures are included inNote 4 – Derivatives.

On January 1, 2009, the Corporation adopted new FASB guidance requiring all entities to report noncontrolling interests in subsidiaries as equity in the Consolidated Financial Statements and to account for transactions between an entity and noncontrolling owners as equity transactions if the parent retains its controlling financial interest in the subsidiary. This new guidance also requires expanded disclosure that distinguishes between the interests of the controlling owners and the interests of the noncontrolling owners of a subsidiary. Consolidated subsidiaries in which there are noncontrolling owners are insignificant to the Corporation.

For 2009, the Corporation adopted new accounting guidance that requires disclosures on plan assets for defined pension and other postretirement plans, including how investment decisions are made, the major categories of plan assets, the inputs and valuation techniques used to measure the fair value of plan assets, the effect of Level 3 measurements on changes in plan assets and concentrations of risk within plan assets. The expanded disclosures are included inNote 17 – Employee Benefit Plans.

Cash and Cash Equivalents

Cash and cash equivalents include cash on hand, cash items in the process of collection, and amounts due from correspondent banks and the Federal Reserve Bank.

Securities Financing Agreements

Securities borrowed or purchased under agreements to resell and securities loaned or sold under agreements to repurchase (securities financing agreements) are treated as collateralized financing transactions. These agreements are recorded at the amounts at which the securities were acquired or sold plus accrued interest, except for certain securities financing agreements whichthat the Corporation accounts for under the fair value option. Changes in the fair value of securities financing agreements that are accounted for under the fair value option are recorded in other income.income (loss). For more


142     Bank of America 2010


information on securities financing agreements whichthat the Corporation accounts for under the fair value option, seeNote 2023 – Fair Value MeasurementsOption.
The Corporation’s policy is to obtain possession of collateral with a market value equal to or in excess of the principal amount loaned under resale agreements. To ensure that the market value of the underlying collateral remains sufficient, collateral is generally valued daily and the Corporation may require counterparties to deposit additional collateral or may return collateral pledged when appropriate.

Securities financing agreements give rise to negligible credit risk as a result of these collateral provisions, and accordingly, no allowance for loan losses is considered necessary.

Substantially all securities financing agreementsrepurchase and resale activities are transacted under master repurchase agreements which give the Corporation, in the event of default by the counterparty, the right to liquidate securities held and to offset receivables and payables with the same counterparty. The Corporation offsets securities financing agreementsrepurchase and resale transactions with the same counterparty on the Consolidated Balance Sheet where it has such a master agreement. agreement and the transactions have the same maturity date.
In transactions where the Corporation acts as the lender in a securities lending agreement and receives securities that can be pledged or sold as collateral, it recognizes an asset on the Consolidated Balance Sheet at fair value, representing the securities received, and a liability for the same amount, representing the obligation to return those securities.

At the end of certain quarterly periods during the three years ended December 31, 2009, the Corporation had recorded certain sales of agency mortgage-backed securities (MBS) which, based on an ongoing internal review and interpretation, should have been recorded as secured borrowings. These periods and amounts were as follows: March 31, 2009 – $573 million; September 30, 2008 – $10.7 billion; December 31, 2007 – $2.1 billion; and March 31, 2007 – $4.5 billion. As the transferred securities were recorded at fair value in trading account assets, the change would have had no impact on consolidated results of operations. Had the sales been recorded as secured borrowings, trading account assets and federal funds purchased and securities loaned or sold under agreements to repurchase would have increased by the amount of the transactions, however, the increase in all cases was less than 0.7 percent of total assets or total liabilities. Accordingly, the Corporation believes that these transactions did not have a material impact on the Corporation’s Consolidated Financial Statements.
In repurchase transactions, typically, the termination date for a repurchase agreement is before the maturity date of the underlying security. However, in certain situations, the Corporation may enter into repurchase agreements where the termination date of the repurchase transaction is the same as the maturity date of the underlying security and these transactions are referred to as“repo-to-maturity” (RTM) transactions. The Corporation enters into RTM transactions only for high quality, very liquid securities such as U.S. Department of the Treasury (U.S. Treasury) securities or securities issued by government-sponsored enterprises (GSE). The Corporation accounts for RTM transactions as sales in accordance with applicable accounting guidance, and accordingly, removes the securities from the Consolidated Balance Sheet and recognizes a gain or loss in the Consolidated Statement of Income. At December 31, 2010, the Corporation had no outstanding RTM transactions compared to $6.5 billion at December 31, 2009, that had been accounted for as sales.
Collateral

The Corporation accepts collateral that it is permitted by contract or custom to sell or repledge.repledge and such collateral is recorded on the Consolidated Balance Sheet. At December 31, 2010 and 2009, the fair value of this collateral was $156.9$401.7 billion and $418.2 billion of which $126.4$257.6 billion was sold or repledged. At December 31, 2008, the fair value of this collateral was $144.5and $310.2 billion of which $117.6 billion waswere sold or repledged. The primary sourcesources of this collateral isare repurchase agreements.agreements and securities borrowed. The Corporation also pledges securities

and loans as collateral in transactions that include repurchase agreements, securities loaned, public and trust deposits, U.S. Department of the Treasury (U.S. Treasury) tax and loan notes, and other short-term borrowings. This collateral can be sold or repledged by the counterparties to the transactions.

In addition, the Corporation obtains collateral in connection with its derivative contracts. Required collateral levels vary depending on the credit risk rating and the type of counterparty. Generally, the Corporation accepts collateral in the form of cash, U.S. Treasury securities and other marketable securities. Based on provisions contained in legal netting agreements, the Corporation nets cash collateral against the applicable derivative fair value. The Corporation also pledges collateral on its own derivative positions which can be applied against derivative liabilities.

Trading Instruments

Financial instruments utilized in trading activities are carried at fair value. Fair value is generally based on quoted market prices or quoted market prices for similar assets and liabilities. If these market prices are not available, fair values are estimated based on dealer quotes, pricing models, discounted cash flow methodologies, or similar techniques where the determination of fair value may require significant management judgment or estimation. Realized and unrealized gains and losses are recognized in trading account profits (losses).


Bank of America 2009119


Derivatives and Hedging Activities

Derivatives are heldentered into on behalf of customers, for trading, as economic hedges or as qualifying accounting hedges, with the determination made when the Corporation enters into the derivative contract. The designation may change based upon management’s reassessment or changing circumstances.hedges. Derivatives utilized by the Corporation include swaps, financial futures and forward settlement contracts, and option contracts. A swap agreement is a contract between two parties to exchange cash flows based on specified underlying notional amounts, assetsand/or indices. Financial futures and forward settlement contracts are agreements to buy or sell a quantity of a financial instrument, index, currency or commodity at a predetermined future date, and rate or price. An option contract is an agreement that conveys to the purchaser the right, but not the obligation, to buy or sell a quantity of a financial instrument (including another derivative financial instrument), index, currency or commodity at a predetermined rate or price during a period or at a date in the future. Option agreements can be transacted on organized exchanges or directly between parties.

All derivatives are recorded on the Consolidated Balance Sheet at fair value, taking into consideration the effects of legally enforceable master netting agreements that allow the Corporation to settle positive and negative positions and offset cash collateral held with the same counterparty on a net basis. For exchange-traded contracts, fair value is based on quoted market prices. For non-exchange traded contracts, fair value is based on dealer quotes, pricing models, discounted cash flow methodologies or similar techniques for which the determination of fair value may require significant management judgment or estimation.

Valuations of derivative assets and liabilities reflect the value of the instrument including counterparty credit risk. These values also take into account the Corporation’s own credit standing, thus including in the valuation of the derivative instrument the value of the net credit differential between the counterparties to the derivative contract.

Trading Derivatives and Economic Hedges

Derivatives held for trading purposes are included in derivative assets or derivative liabilities with changes in fair value included in trading account profits (losses).

Derivatives used as economic hedges, because either they did not qualify for or were not designated as an accounting hedge, are also included in derivative assets or derivative liabilities. Changes in the fair value of


Bank of America 2010     143


derivatives that serve as economic hedges of mortgage servicing rights (MSRs), interest rate lock commitments (IRLCs) and first mortgage loansheld-for-sale (LHFS) that are originated by the Corporation are recorded in mortgage banking income. Changes in the fair value of derivatives that serve as asset and liability management (ALM) economic hedges that do not qualify or were not designated as accounting hedges are recorded in other income (loss). Credit derivatives used by the Corporation as economic hedges do not qualify as accounting hedges despite being effective economic hedges, and changes in the fair value of these derivatives are included in other income (loss).

Derivatives Used For Hedge Accounting Purposes (Accounting Hedges)

For accounting hedges, the Corporation formally documents at inception all relationships between hedging instruments and hedged items, as well as the risk management objectives and strategies for undertaking various accounting hedges. Additionally, the Corporation primarily uses dollar offset or regression analysis at the inception of a hedge and for each reporting period thereafter to assess whether the derivative used in itsa hedging transaction is expected to be and has been highly effective in offsetting changes in the fair value or cash flows of a hedged item. The Corporation discontinues hedge accounting when it is determined that a derivative is

not expected to be or has ceased to be highly effective as a hedge, and then reflects changes in fair value of the derivative in earnings after termination of the hedge relationship.

The Corporation uses its accounting hedges as either fair value hedges, cash flow hedges or hedges of net investments in foreign operations. The Corporation manages interest rate and foreign currency exchange rate sensitivity predominantly through the use of derivatives. Fair value hedges are used to protect against changes in the fair value of the Corporation’s assets and liabilities that are dueattributable to interest rate or foreign exchange volatility. Cash flow hedges are used primarily to minimize the variability in cash flows of assets or liabilities, or forecasted transactions caused by interest rate or foreign exchange fluctuations. For terminated cash flow hedges, the maximum length of time over which forecasted transactions are hedged is 26 years, with a substantial portion of the hedged transactions being less than 10 years. For open or future cash flow hedges, the maximum length of time over which forecasted transactions are or will be hedged is less than seven years.

Changes in the fair value of derivatives designated as fair value hedges are recorded in earnings, together and in the same income statement line item with changes in the fair value of the related hedged item. Changes in the fair value of derivatives designated as cash flow hedges are recorded in accumulated OCI and are reclassified into the line item in the income statement in which the hedged item is recorded and in the same period the hedged item affects earnings. Hedge ineffectiveness and gains and losses on the excluded component of a derivative in assessing hedge effectiveness are recorded in earnings in the same income statement line item. The Corporation records changes in the fair value of derivatives used as hedges of the net investment in foreign operations, to the extent effective, as a component of accumulated OCI.

If a derivative instrument in a fair value hedge is terminated or the hedge designation removed, the previous adjustments to the carrying amount of the hedged asset or liability are subsequently accounted for in the same manner as other components of the carrying amount of that asset or liability. For interest-earning assets and interest-bearing liabilities, such adjustments are amortized to earnings over the remaining life of the respective asset or liability. If a derivative instrument in a cash flow hedge is terminated or the hedge designation is removed, related amounts in accumulated OCI are reclassified into earnings in the same period or periods during which the hedged forecasted transaction affects earnings. If it is probable that a

forecasted transaction will not occur, any related amounts in accumulated OCI are reclassified into earnings in that period.

Interest Rate Lock Commitments

The Corporation enters into IRLCs in connection with its mortgage banking activities to fund residential mortgage loans at specified times in the future. IRLCs that relate to the origination of mortgage loans that will be held for sale are considered derivative instruments under applicable accounting guidance. As such, these IRLCs are recorded at fair value with changes in fair value recorded in mortgage banking income.

Effective January 1, 2008, the Corporation adopted new accounting guidance that requires that the expected net future cash flows related to servicing of a loan be included in the measurement of all written loan commitments accounted for at fair value through earnings.

In estimating the fair value of an IRLC, the Corporation assigns a probability to the loan commitment based on an expectation that it will be exercised and the loan will be funded. The fair value of the commitments is derived from the fair value of related mortgage loans which is based on observable market data.data and includes the expected net future cash flows related to servicing of the loans. Changes to the fair value of IRLCs are recognized based on interest rate changes, changes in the probability that the commitment will be exercised and the passage of time. Changes from the expected future


120Bank of America 2009


cash flows related to the customer relationship are excluded from the valuation of IRLCs. Prior to January 1, 2008, the Corporation did not record any unrealized gain or loss at the inception of a loan commitment, which is the time the commitment is issued to the borrower, as applicable accounting guidance at that time did not allow expected net future cash flows related to servicing of a loan to be included in the measurement of written loan commitments that are accounted for at fair value through earnings.

Outstanding IRLCs expose the Corporation to the risk that the price of the loans underlying the commitments might decline from inception of the rate lock to funding of the loan. To protect against this risk, the Corporation utilizes forward loan sales commitments and other derivative instruments, including interest rate swaps and options, to economically hedge the risk of potential changes in the value of the loans that would result from the commitments. The changes in the fair value of these derivatives are recorded in mortgage banking income.

Securities

Debt securities are recorded on the Consolidated Balance Sheet as of the trade date and classified based on management’s intention on the date of purchase and recorded on the Consolidated Balance Sheet as debt securities as of the trade date.purchase. Debt securities which management has the intent and ability to hold to maturity are classified asheld-to-maturity (HTM) and reported at amortized cost. Debt securities that are bought and held principally for the purpose of resale in the near term are classified as trading and are carried at fair value with unrealized gains and losses included in trading account profits (losses). Other debt securities are classified as available-for-sale (AFS)AFS and carried at fair value with net unrealized gains and losses included in accumulated OCI on an after-tax basis.

In addition, credit-related notes, which include investments in securities issued by CDOs, collateralized loan obligations (CLOs) and credit-linked note vehicles, are classified as trading securities.

The Corporation regularly evaluates each AFS and HTM debt security whosewhere the value has declined below amortized cost to assess whether the decline in fair value isother-than-temporary. In determining whether an impairment isother-than-temporary, the Corporation considers the severity and duration of the decline in fair value, the length of time expected for recovery, the financial condition of the issuer, and other qualitative factors, as well as whether the Corporation either plans to sell the security or it is more-likely-than-not that it will be required to sell the security before recovery of its amortized cost. Beginning in 2009, under new accounting guidance for impairments of debt securities that are deemed to beother-than-temporary, the credit component of another-than-temporary impairment (OTTI) loss is recognized in earnings and the non-credit component is recognized in accumulated OCI in situations where the Corporation does not intend to sell the security and it is more- likely-than-notnot more-likely-than-not that the Corporation will not be required to sell the security prior to recovery. Prior to January 1, 2009, unrealized losses, (bothboth the credit and non-credit components)components, on AFS debt securities that were deemed to beother-than-temporary were included in current periodcurrent-period earnings. If there is an other-than-temporary impairment in the fair value ofOTTI on any individual security classified as HTM, the


144     Bank of America 2010


Corporation writes down the security to fair value with a corresponding charge to other income.

income (loss).

Interest on debt securities, including amortization of premiums and accretion of discounts, is included in interest income. Realized gains and losses from the sales of debt securities, which are included in gains (losses) on sales of debt securities, are determined using the specific identification method.

Marketable equity securities are classified based on management’s intention on the date of purchase and recorded on the Consolidated Balance Sheet as of the trade date. Marketable equity securities that are bought and held principally for the purpose of resale in the near term are classified as trading and are carried at fair value with unrealized gains and losses included in trading account profits (losses). Other marketable

equity securities are accounted for as AFS and classified in other assets. All AFS marketable equity securities are carried at fair value with net unrealized gains and losses included in accumulated OCI on an after-tax basis. If there is another-than-temporary decline in the fair value of any individual AFS marketable equity security, the Corporation reclassifies the associated net unrealized loss out of accumulated OCI with a corresponding charge to equity investment income. Dividend income on all AFS marketable equity securities is included in equity investment income. Realized gains and losses on the sale of all AFS marketable equity securities, which are recorded in equity investment income, are determined using the specific identification method.

Equity investments without readily determinable fair values are recorded in other assets. Impairment testing is based on applicable accounting guidance and the cost basis is reduced when an impairment is deemed to beother-than-temporary.

Certain equity investments held by Global Principal Investments, the Corporation’s diversified equity investor in private equity, real estate and other alternative investments, are subject to investment company accounting under applicable accounting guidance, and accordingly, are carried at fair value with changes in fair value reported in equity investment income. These investments are included in other assets. Initially, the transaction price of the investment is generally considered to be the best indicator of fair value. Thereafter, valuation of direct investments is based on an assessment of each individual investment using methodologies that include publicly traded comparables derived by multiplying a key performance metric (e.g., earnings before interest, taxes, depreciation and amortization) of the portfolio company by the relevant valuation multiple observed for comparable companies, acquisition comparables, entry level multiples and discounted cash flows, and are subject to appropriate discounts for lack of liquidity or marketability. Certain factors that may influence changes in fair value include but are not limited to recapitalizations, subsequent rounds of financing and offerings in the equity or debt capital markets. For fund investments, the Corporation generally records the fair value of its proportionate interest in the fund’s capital as reported by the fund’sfunds’ respective managers.

Other investments held by Global Principal Investments are accounted for under either the equity method or at cost, depending on the Corporation’s ownership interest, and are reported in other assets.

Loans and Leases

Loans measured at historical cost are reported at their outstanding principal balances net of any unearned income, charge-offs, unamortized deferred fees and costs on originated loans, and for purchased loans, net of any unamortized premiums or discounts. Loan origination fees and certain direct origination costs are deferred and recognized as adjustments to interest income over the lives of the related loans. Unearned income, discounts and premiums are amortized to interest income using a level yield methodology. The Corporation elects to account for certain loans under the fair value option. Fair valuesoption with changes in fair value reported in mortgage banking income for theseresidential mortgage loans areand other income for commercial loans.

The FASB issued new disclosure guidance, effective on a prospective basis for the Corporation’s 2010 year-end reporting, that addresses disclosure of loans and other financing receivables and the related allowance. The new accounting guidance defines a portfolio segment as the level at which an entity develops and documents a systematic methodology to determine the allowance for credit losses, and a class of financing receivables as the level of disaggregation of portfolio segments based on market prices, where available, or discounted cash flow analyses using market-basedthe initial measurement attribute, risk characteristics and methods for assessing risk. The Corporation’s portfolio segments are home loans, credit spreads of comparable debt instruments orcard and other consumer, and commercial. The classes within the home loans portfolio segment are residential mortgage, home equity and discontinued real estate. The classes within the credit derivatives ofcard and other consumer portfolio segment are U.S. credit card,non-U.S. credit card, direct/indirect consumer and other consumer. The classes within the specific borrower or comparable borrowers. Results of discounted cash flow analyses may be adjusted, as appropriate, to reflect other market conditions orcommercial portfolio segment are U.S. commercial, commercial real estate, commercial lease financing,non-U.S. commercial and U.S. small business commercial. Under this new accounting guidance, the perceived credit risk of the borrower.

allowance is presented by portfolio segment.

Purchased ImpairedCredit-impaired Loans

The Corporation purchases loans with and without evidence of credit quality deterioration since origination. Evidence of credit quality deterioration as of the purchase date may include statistics such as past due status, refreshed borrower credit scores and refreshedloan-to-value (LTV) ratios, some of which are not immediately available as of the purchase date. The


Bank of America 2009121


Corporation continues to evaluate this information and other credit-related information as it becomes available. Interest income on purchased non-impairedPurchased loans is recognized using a level yield methodology based onare considered to be impaired if the Corporation does not expect to receive all contractually required payments receivable. For purchased impaired loans, applicable accounting guidance addresses the accounting for differences between contractual cash flows and expected cash flows from the Corporation’s initial investment in loans if those differences are attributable, at least in part,due to concerns about credit quality. The excess of the cash flows expected to be collected measured as of the acquisition date, over the estimated fair value is referred to as the accretable yield and is recognized in interest income over the remaining life of the loan using a level yield methodology. The difference between contractually required payments as of the acquisition date and the cash flows expected to be collected is referred to as the nonaccretable difference.

The initial fair values for purchased impairedPCI loans are determined by discounting both principal and interest cash flows expected to be collected using an observable discount rate for similar instruments with adjustments that management believes a market participant would consider in determining fair value. The Corporation estimates the cash flows expected to be collected upon acquisition using internal credit risk, interest rate and prepayment risk models that incorporate management’s best estimate of current key assumptions such as default rates, loss severity and payment speeds.

Subsequent decreases to expected principal cash flows result in a charge to provision for credit losses and a corresponding increase to a valuation allowance included in the allowance for loan and lease losses. Subsequent increases in expected principal cash flows result in a recovery of any previously recorded allowance for loan and lease losses, to the extent applicable, and a reclassification from nonaccretable difference to accretable yield for any remaining increase. Changes in expected interest cash flows may result in reclassifications to/from the nonaccretable difference. Loan disposals, which may include sales of loans, receipt of payments in full from the borrower foreclosure or troubled debt restructuring (TDR),foreclosure, result in removal of the loan from the purchased impairedPCI loan pool at its allocated carrying amount.

Beginning on January 1, 2010, loans modified in a TDR remain within the PCI loan pools. Prior to January 1, 2010, TDRs were removed from the PCI loan pools.

Leases

The Corporation provides equipment financing to its customers through a variety of lease arrangements. Direct financing leases are carried at the aggregate of lease payments receivable plus estimated residual value of the


Bank of America 2010     145


leased property less unearned income. Leveraged leases, which are a form of financing leases, are carried net of nonrecourse debt. Unearned income on leveraged and direct financing leases is accreted to interest income over the lease terms using methods that approximate the interest method.

Allowance for Credit Losses

The allowance for credit losses, which includes the allowance for loan and lease losses and the reserve for unfunded lending commitments, represents management’s estimate of probable losses inherent in the Corporation’s lending activities. The allowance for loan and lease losses and the reserve for unfunded lending commitments exclude amounts for loans and unfunded lending commitments accounted for under the fair value option as the fair values of these instruments already reflect a credit component. The allowance for loan and lease losses does not include amounts related to accrued interest receivable other than billed interest and fees on credit card receivables as accrued interest receivable is reversed when a loan is placed on nonaccrual status. The allowance for loan and lease losses represents the estimated probable credit losses in funded consumer and commercial loans and leases while the reserve for unfunded lending commitments, including standby letters of credit (SBLCs) and binding unfunded loan commitments, represents estimated probable credit losses on these unfunded credit instruments based on utilization assumptions. Credit exposures deemed to be uncollectible, excluding derivative assets, trad - -

ingtrading account assets and loans carried at fair value, are charged against these accounts. Cash recovered on previously charged off amounts is recorded as a recovery to these accounts.

Management evaluates the adequacy of the allowance for loan and lease losses based on the combined total of these two components.

The Corporation performs periodic and systematic detailed reviews of its lending portfolios to identify credit risks and to assess the overall collectability of those portfolios. The allowance on certain homogeneous consumer loan portfolios, which generally consist of consumer loans (e.g., consumer real estate within the home loans portfolio segment and credit card loans) and certain commercial loans (e.g., businesswithin the credit card and small business portfolios),other consumer portfolio segment, is based on aggregated portfolio segment evaluations generally by product type. Loss forecast models are utilized for these portfolios which consider a variety of factors including, but not limited to, historical loss experience, estimated defaults or foreclosures based on portfolio trends, delinquencies, bankruptcies, economic conditions and credit scores.
The Corporation’s home loans portfolio segment is comprised primarily of large groups of homogeneous consumer loans secured by residential real estate. The amount of losses incurred in the homogeneous loan pools is estimated based upon how many of the loans will default and the loss in the event of default. Using statistically valid modeling methodologies, the Corporation estimates how many of the homogeneous loans will default based on the individual loans’ attributes aggregated into pools of homogeneous loans with similar attributes. The attributes that are most significant to the probability of default and are used to estimate default include refreshed LTV or in the case of a subordinated lien, refreshed combinedloan-to-value (CLTV), borrower credit score, months since origination (i.e., vintage) and geography, all of which are further broken down by present collection status (whether the loan is current, delinquent, in default or in bankruptcy). This estimate is based on the Corporation’s historical experience with the loan portfolio. The estimate is adjusted to reflect an assessment of environmental factors not yet reflected in the historical data underlying the loss estimates, such as changes in real estate values, local and national economies, underwriting standards and the regulatory environment. The probability of default of a loan is based on an analysis of the movement of loans with the measured attributes from either current or each of the delinquency categories to default over a twelve-month period. Loans 90 or more days past due or those expected to migrate to 90 or more days past due within the twelve-month period are assigned a rate of

default that measures the percentage of such loans that will default over their lives given the assumption that the condition causing the ultimate default presently exists as of the measurement date. On home equity loans where the Corporation holds only a second-lien position and foreclosure is not the best alternative, the loss severity is estimated at 100 percent.
The allowance on certain commercial loans (except business card and certain small business loans) is calculated using loss rates delineated by risk rating and product type. Factors considered when assessing loss rates include: the value of the underlying collateral, if applicable, the industry of the obligor, and the obligor’s liquidity and other financial indicators along with certain qualitative factors. These statistical models are updated on a quarterly basis to incorporate information reflectingregularly for changes in economic and business conditions. Included in the current economic environment. The loss forecasts also incorporate the estimated increased volume and impactanalysis of consumer real estateand commercial loan modification programs,portfolios are reserves which are maintained to cover uncertainties that affect the Corporation’s estimate of probable losses including losses associated with estimated re-default after modification.

domestic and global economic uncertainty and large single name defaults.

The remaining commercial portfolios, including nonperforming commercial loans, as well as consumer real estate loans modified in a TDR, renegotiated credit card, unsecured consumer and small business loans are reviewed in accordance with applicable accounting guidance on an individual loan basis. Loans subject to individual reviews are analyzedimpaired loans and segregated by risk according to the Corporation’s internal risk rating scale. These risk classifications, in conjunction with an analysis of historical loss experience, current economic conditions, industry performance trends, geographic or obligor concentrations within each portfolio segment, and any other pertinent information (including individual valuations on nonperforming loans) result in the estimation of the allowance for credit losses. The historical loss experience is updated quarterly to incorporate the most recent data reflecting the current economic environment.

TDRs. If necessary, a specific allowance is established for individual impaired loans.these loans if they are deemed to be impaired. A loan is considered impaired when, based on current information and events, it is probable that the Corporation will be unable to collect all amounts due, including principal andand/or interest, according to the contractual terms of the agreement, and once a loan has been identified as individually impaired, management measures impairment. Individually impairedImpaired loans and TDRs are primarily measured based on the present value of payments expected to be received, discounted at the loans’ original effective contractual interest rates, or discounted at the portfolio average contractual annual percentage rate, excluding renegotiated and promotionally priced loans for the renegotiated TDR portfolio. Impaired loans and TDRs may also be measured based on observable market prices, or for loans that are solely dependent on the collateral for repayment, the estimated fair value of the collateral less estimated costs to sell. If the recorded investment in impaired loans exceeds this amount, a specific allowance is established as a component of the allowance for loan and lease losses.

Purchased impaired loanslosses unless these are recorded at fair value and applicable accounting guidance prohibits the carrying over or creation of valuation allowances in the initial accounting for impaired loans acquired in a transfer. This applies to the purchase of an individual loan, a pool of loans and portfolios of loans acquired in a purchase business combination. Subsequent to acquisition, decreases in expected principal cash flows of purchased impaired loans are recorded as a valuation allowance included in the allowance for loan and lease losses. Subsequent increases in expected principal cash flows result in a recovery of any previously recorded allowance for loan and lease losses, to the extent applicable. Write-downs on purchased impaired loans in excess of the nonaccretable difference are charged against the allowance for loan and lease losses. For more information on the purchased impaired portfolios associated with acquisitions, see Note 6 – Outstanding Loans and Leases.

The allowance for loan and lease losses includes two components that are allocated to cover the estimated probable losses in each loan and lease category based on the results of the Corporation’s detailed review process described above. The first component covers those commercial loans that are either nonperforming or impaired and


122Bank of America 2009


consumer real estate loans that have been modified as TDRs. These loans are subject to impairment measurement at the loan level basedsolely dependent on the presentcollateral for repayment, in which case the initial amount that exceeds the fair value of expected future cash flows discounted at the loan’s contractual effective interest rate. Wherecollateral is charged off.

Generally, prior to performing a detailed property valuation including a walk-through of a property, the presentCorporation initially estimates the fair value of the collateral securing consumer loans that are solely dependent on the collateral for repayment using an automated valuation method (AVM). An AVM is a tool that estimates the value of a property by reference to market data including sales of comparable properties and price trends specific to the Metropolitan Statistical Area in which the property being valued is located. In the event that an AVM value is not available, the Corporation utilizes publicized indices or if these methods provide less thanreliable valuations, the recorded investmentCorporation uses appraisals or broker price opinions to estimate the fair value of the collateral. While there is inherent imprecision in these valuations, the Corporation believes that they are representative of the portfolio in the loan, impairment is recognized through the provision for credit losses with a corresponding increase in the allowance for loan and lease losses. The second component covers consumer loans and performing commercial loans and leases. Included within this second component of the allowance for loan and lease losses and determined separately from the procedures outlined above are reserves which are maintained to cover uncertainties that affect the Corporation’s estimate of probable losses including domestic and global economic uncertainty and large single name defaults. Management evaluates the adequacy of the allowance for loan and lease losses based on the combined total of these two components.

aggregate.

In addition to the allowance for loan and lease losses, the Corporation also estimates probable losses related to unfunded lending commitments, such as letters of credit and financial guarantees, and binding unfunded loan commitments. The reserve for unfunded lending commitments excludes commitments accounted for under the fair value option. Unfunded lending commitments are subject to individual reviews and are analyzed and segregated by risk according to the Corporation’s internal risk rating scale. These risk classifications, in conjunction with an analysis of historical loss experience, utilization assumptions, current economic conditions, performance


146     Bank of America 2010


trends within specificthe portfolio segments and any other pertinent information, result in the estimation of the reserve for unfunded lending commitments.

The allowance for credit losses related to the loan and lease portfolio is reported separately on the Consolidated Balance Sheet whereas the reserve for unfunded lending commitments is reported on the Consolidated Balance Sheet in accrued expenses and other liabilities. Provision for credit losses related to the loan and lease portfolio and unfunded lending commitments is reported in the Consolidated Statement of Income.

Nonperforming Loans and Leases, Charge-offs and Delinquencies

Nonperforming loans and leases generally include loans and leases that have been placed on nonaccrual status including nonaccruing loans whose contractual terms have been restructured in a manner that grants a concession to a borrower experiencing financial difficulties. Loans accounted for under the fair value option, purchased impairedPCI loans and LHFS are not reported as nonperforming loans and leases.

In accordance with the Corporation’s policies, non-bankrupt credit card loans and unsecured consumer loans are charged off no later than the end of the month in which the account becomes 180 days past due. The outstanding balance of real estate-secured loans that is in excess of the estimated property value, less costestimated costs to sell, is charged off no later than the end of the month in which the account becomes 180 days past due unless repayment of the loan is guaranteedinsured by the Federal Housing Administration (FHA). The estimated property value, less estimated costs to sell, is determined using the same process as described for impaired loans in the Allowance for Credit Losses section beginning on page 146. Personal property-secured loans are charged off no later than the end of the month in which the account becomes 120 days past due. AccountsUnsecured accounts in bankruptcy, including credit cards, are charged off for credit card and certain unsecured accounts 60 days after bankruptcy notification. For secured products, accounts in bankruptcy are written down to the collateral value, less cost to sell, by the end of the month in which the account becomes 60 days past due. Consumer credit card loans, consumer loans secured by personal property and unsecured consumer loans are not placed on nonaccrual status prior to charge-off and therefore are not reported as nonperforming loans. Real estate-secured loans are generally placed on nonaccrual status and classified as non - -

performingnonperforming at 90 days past due. However, consumer loans secured by real estate where repayments are guaranteedinsured by the FHA are not placed on nonaccrual status, and therefore, are not reported as nonperforming loans. Interest accrued but not collectedAccrued interest receivable is reversed when a consumer loan is placed on nonaccrual status. Interest collections on nonaccruing consumer loans for which the ultimate collectability of principal is uncertain are applied as principal reductions; otherwise, such collections are credited to interest income when received. These loans may be restored to accrual status when all principal and interest is current and full repayment of the remaining contractual principal and interest is expected, or when the loan otherwise becomes well-secured and is in the process of collection. Consumer loans whose contractual terms have been modified in a TDR and are current at the time of restructuring remain on accrual status if there is demonstrated performance prior to the restructuring and payment in full under the restructured terms is expected. Otherwise, the loans are placed on nonaccrual status and reported as nonperforming until there is sustained repayment performance for a reasonable period, generally six months. Consumer TDRs that are on accrual status are reported as performing TDRs through the end of the calendar year in which the restructuring occurred or the year in which the loans are returned to accrual status. In addition, if accruing consumer TDRs bear less than a market rate of interest at the time of modification, they are reported as performing TDRs throughout the remaining lives of the loans.

Commercial loans and leases, excluding business card loans, that are past due 90 days or more as to principal or interest, or where reasonable

doubt exists as to timely collection, including loans that are individually identified as being impaired, are generally placed on nonaccrual status and classified as nonperforming unless well-secured and in the process of collection. Commercial loans and leases whose contractual terms have been modified in a TDR are placed on nonaccrual status and reported as nonperforming until the loans have performed for an adequate period of time under the restructured agreement.agreement, generally six months. Accruing commercial TDRs are reported as performing TDRs through the end of the calendar year in which the loans are returned to accrual status. In addition, if accruing commercial TDRs bear less than a market rate of interest at the time of modification, they are reported as performing TDRs throughout the remaining lives of the loans. Interest accrued but not collectedAccrued interest receivable is reversed when a commercial loan is placed on nonaccrual status. Interest collections on nonaccruing commercial loans and leases for which the ultimate collectability of principal is uncertain are applied as principal reductions; otherwise, such collections are credited to income when received. Commercial loans and leases may be restored to accrual status when all principal and interest is current and full repayment of the remaining contractual principal and interest is expected, or when the loan otherwise becomes well-secured and is in the process of collection. Business card loans are charged off no later than the end of the month in which the account becomes 180 days past due or where 60 days have elapsed since receipt of notification of bankruptcy filing, whichever comes first. These loans are not placed on nonaccrual status prior to charge-off and therefore are not reported as nonperforming loans.

Other commercial loans are generally charged off when all or a portion of the principal amount is determined to be uncollectible.

The entire balance of a consumer and commercial loan is contractually delinquent if the minimum payment is not received by the specified due date on the customer’s billing statement. Interest and fees continue to accrue on past due loans until the date the loan goes into nonaccrual status, if applicable.

Purchased impaired

PCI loans are recorded at fair value at the acquisition date. Although the purchased impairedPCI loans may be contractually delinquent, the Corporation does not classify these loans as nonperforming as the loans were written down to fair value at the acquisition date and the accretable yield is recognized in interest income over the remaining life of


Bank of America 2009123


the loan. In addition, reported net charge-offs exclude write-downs on purchased impairedPCI loan pools as the fair value already considers the estimated credit losses.

Loans Held-for-SaleHeld-for-sale

Loans that are intended to be sold in the foreseeable future, including residential mortgages, loan syndications, and to a lesser degree, commercial real estate, consumer finance and other loans, are reported as LHFS and are carried at the lower of aggregate cost or market value (fair value).fair value. The Corporation accounts for certain LHFS, including first mortgage LHFS, under the fair value option. Fair values for LHFS are based on quoted market prices, where available, or are determined by discounting estimated cash flows using interest rates approximating the Corporation’s current origination rates for similar loans and adjusted to reflect the inherent credit risk. Mortgage loan origination costs related to LHFS which the Corporation accounts for under the fair value option are recognized in noninterest expense when incurred. Mortgage loan origination costs for LHFS carried at the lower of cost or marketfair value (fair value) are capitalized as part of the carrying amount of the loans and recognized as a reduction of mortgage banking income upon the sale of such loans. LHFS that are on nonaccrual status and are reported as nonperforming, as defined in the policy above, are reported separately from nonperforming loans and leases.

Premises and Equipment

Premises and equipment are stated at cost less accumulated depreciation and amortization. Depreciation and amortization are recognized using the straight-line method over the estimated useful lives of the assets. Estimated lives range up to 40 years for buildings, up to 12 years for furniture and


Bank of America 2010     147


equipment, and the shorter of lease term or estimated useful life for leasehold improvements.

Mortgage Servicing Rights

The Corporation accounts for consumer-related MSRs at fair value with changes in fair value recorded in mortgage banking income, while commercial-related and residential reverse mortgage MSRs are accounted for using the amortization method (i.e., lower of cost or market) with impairment recognized as a reduction in mortgage banking income. To reduce the volatility of earnings related to interest rate and market value fluctuations, certain securities and derivatives such as options and interest rate swaps may be used as economic hedges of the MSRs, but are not designated as accounting hedges. These economic hedges are carried at fair value with changes in fair value recognized in mortgage banking income.

The Corporation estimates the fair value of the consumer-related MSRs using a valuation model that calculates the present value of estimated future net servicing income. This is accomplished through an option-adjusted spread (OAS) valuation approach that factors in prepayment risk. This approach consists of projecting servicing cash flows under multiple interest rate scenarios and discounting these cash flows using risk-adjusted discount rates. The key economic assumptions used in valuations of MSRs include weighted-average lives of the MSRs and the OAS levels. The OAS represents the spread that is added to the discount rate so that the sum of the discounted cash flows equals the market price, therefore it is a measure of the extra yield over the reference discount factor (i.e., the forward swap curve) that the Corporation expects to earn by holding the asset. These variables can, and generally do, change from quarter to quarter as market conditions and projected interest rates change, and could have an adverse impact on the value of the MSRs and could result in a corresponding reduction in mortgage banking income.

Goodwill and Intangible Assets

Goodwill is calculated as the purchase premium after adjusting for the fair value of net assets acquired. Goodwill is not amortized but is reviewed for potential impairment on an annual basis, or when events or circumstances indicate a potential impairment, at the reporting unit level. A reporting unit, as defined under applicable accounting guidance, is a business segment or one level below a business segment. Under applicable accounting guidance, theThe goodwill impairment analysis is a two-step test. The first step of the goodwill impairment test involves comparing the fair value of each reporting unit with its carrying amount including goodwill. If the fair value of the reporting unit exceeds its carrying amount, goodwill of the reporting unit is considered not impaired; however, if the carrying amount of the reporting unit exceeds its fair value, the second step must be performed to measure potential impairment.

The second step involves calculating an implied fair value of goodwill for each reporting unit for which the first step indicated possible impairment. The implied fair value of goodwill is determined in the same manner as the amount of goodwill recognized in a business combination, which is the excess of the fair value of the reporting unit, as determined in the first step, over the aggregate fair values of the assets, liabilities and identifiable intangibles as if the reporting unit was being acquired in a business combination. Measurement of the fair values of the assets and liabilities of a reporting unit is consistent with the requirements of the fair value measurements accounting guidance, which defines fair value as an exit price, meaning the price that would be received to sell an asset or paid to transfer a liability in an orderly transaction between market participants at the measurement date. The adjustments to measure the assets, liabilities and intangibles at fair value are for the purpose of measuring the implied fair value of goodwill and such adjustments are not reflected in the Consolidated Balance Sheet. If the implied fair value of goodwill exceeds the goodwill assigned to the reporting unit, there is no impairment. If the goodwill assigned to a reporting unit

exceeds the implied fair value of goodwill, an impairment charge is recorded for the excess. An impairment loss recognized cannot exceed the amount of goodwill assigned to a reporting unit. An impairment loss establishes a new basis in the goodwill and subsequent reversals of goodwill impairment losses are not permitted under applicable accounting guidance. In 2009, 2008 and 2007, goodwill was tested for impairment and it was determined that goodwill was not impaired at any of these dates.

For intangible assets subject to amortization, an impairment loss is recognized if the carrying amount of the intangible asset is not recoverable and exceeds fair value. The carrying amount of the intangible asset is considered not recoverable if it exceeds the sum of the undiscounted cash flows expected to result from the use of the asset.

Special Purpose FinancingVariable Interest Entities

A VIE is an entity that lacks equity investors or whose equity investors do not have a controlling financial interest in the entity through their equity investments. The entity that has a controlling financial interest in a VIE is referred to as the primary beneficiary and consolidates the VIE. Prior to January 1, 2010, the primary beneficiary was the entity that would absorb a majority of the economic risks and rewards of the VIE based on an analysis of projected probability-weighted cash flows. In accordance with the ordinary coursenew accounting guidance on consolidation of business,VIEs and transfers of financial assets effective January 1, 2010, the Corporation supports its customers’ financing needs by facilitating customers’ accessis deemed to different funding sources,have a controlling financial interest and is the primary beneficiary of a VIE if it has both the power to direct the activities of the VIE that most significantly impact the VIE’s economic performance and an obligation to absorb losses or the right to receive benefits that could potentially be significant to the VIE. On a quarterly basis, the Corporation reassesses whether it has a controlling financial interest in and is the primary beneficiary of a VIE. The quarterly reassessment process considers whether the Corporation has acquired or divested the power to direct the activities of the VIE through changes in governing documents or other circumstances. The reassessment also considers whether the Corporation has acquired or disposed of a financial interest that could be significant to the VIE, or whether an interest in the VIE has become significant or is no longer significant. The consolidation status of the VIEs with which the Corporation is involved may change as a result of such reassessments. Changes in consolidation status are applied prospectively, with assets and risks. In addition,liabilities of a newly consolidated VIE initially recorded at fair value. A gain or loss may be recognized upon deconsolidation of a VIE depending on the carrying amounts of deconsolidated assets and liabilities compared to the fair value of retained interests and ongoing contractual arrangements.
The Corporation primarily uses VIEs for its securitization activities, in which the Corporation utilizes certain financing arrangementstransfers whole loans or debt securities into a trust or other vehicle such that the assets are legally isolated from the creditors of the Corporation. Assets held in a trust can only be used to meet its balance sheet management, funding, liquidity, and market or credit risk management needs. These financing entities may besettle obligations of the trust. The creditors of these trusts typically have no recourse to the Corporation except in the form of corporations, partnerships, limited liability companies or trusts, and are generally not consolidated onaccordance with the Corporation’s Consolidated Balance Sheet. The majorityobligations under standard representations and warranties. Prior to 2010, securitization trusts typically met the definition of these activities are basic term or revolvinga QSPE and as such were not subject to consolidation.
When the Corporation is the servicer of whole loans held in a securitization vehicles fortrust, including non-agency residential mortgages, home equity loans, credit cards, automobile loans and student loans, the Corporation has the power to direct the most significant activities of the trust. The Corporation does not have the power to direct the most significant activities of a residential mortgage agency trust unless the Corporation holds substantially all of the issued securities and has the unilateral right to liquidate the trust. The power to direct the most significant activities of a commercial mortgage securitization trust is typically held by the special servicer or other types of loansby the party holding specific subordinate securities which are generally funded through term-amortizing debt structures. Other SPEs finance theirembody certain controlling rights. In accordance with the new accounting guidance, the Corporation consolidates a whole loan securitization trust if it has the power to direct the most significant activities by issuing short-term commercial paper. Theand also holds securities issued by these vehicles are designedthe trust or has other contractual


148     Bank of America 2010


arrangements, other than standard representations and warranties, that could potentially be significant to be repaid from the underlying cash flows of the vehicles’ assets or the reissuance of commercial paper.

trust.

124Bank of America 2009


Securitizations

The Corporation securitizes, sells and services interests in residential mortgage loans and credit card loans, and from time to time, automobile, other consumer and commercial loans. The securitization vehicles are typically QSPEs which, in accordance with applicable accounting guidance, are legally isolated, bankruptcy remote and beyond the control of the seller, and are not consolidated in the Corporation’s Consolidated Financial Statements. When the Corporation securitizes assets, it may retain a portion of the securities, subordinated tranches, interest-only strips, subordinated interests in accrued interest and fees on the securitized receivables and, in some cases, overcollateralization and cash reserve accounts, all of which are generally considered retained interests in the securitized assets. The Corporation may also retain senior tranches in these securitizations. Gainstransfer trading account securities and losses upon sale of assets toAFS securities into municipal bond or resecuritization trusts. The Corporation consolidates a securitization vehicle are based on an allocationmunicipal bond or resecuritization trust if it has control over the ongoing activities of the previous carrying amounttrust such as the remarketing of the assetstrust’s liabilities or, if there are no ongoing activities, sole discretion over the design of the trust, including the identification of securities to be transferred in and the structure of securities to be issued, and also retains securities or has liquidity or other commitments that could potentially be significant to the trust. The Corporation does not consolidate a municipal bond or resecuritization trust if one or a limited number of third-party investors share responsibility for the design of the trust or have control over the significant activities of the trust through liquidation or other substantive rights.

Other VIEs used by the Corporation include commercial paper conduits, CDOs, investment vehicles created on behalf of customers and other investment vehicles. The Corporation consolidated all previously unconsolidated commercial paper conduits in accordance with the new accounting guidance on January 1, 2010. In its role as administrator, the Corporation has the power to determine which assets are held in the conduits and the Corporation manages the issuance of commercial paper. Through liquidity facilities, loss protection commitments and other arrangements, the Corporation has an obligation to absorb losses that could potentially be significant to the VIE.
The Corporation does not routinely serve as collateral manager for CDOs and, therefore, does not typically have the power to direct the activities that most significantly impact the economic performance of a CDO. However, following an event of default, if the Corporation is a majority holder of senior securities issued by a CDO and acquires the power to manage the assets of the CDO, the Corporation consolidates the CDO.
The Corporation consolidates a customer or other investment vehicle if it has control over the initial design of the vehicle or manages the assets in the vehicle and also absorbs potentially significant gains or losses through an investment in the vehicle, derivative contracts or other arrangements. The Corporation does not consolidate an investment vehicle if a single investor controlled the initial design of the vehicle or manages the assets in the vehicles or if the Corporation does not have a variable interest that could potentially be significant to the vehicle.
Retained interests in securitized assets are initially recorded at fair value. Prior to 2010, retained interests. Carrying amounts of assets transferred areinterests were initially recorded at an allocated cost basis in proportion to the relative fair values of the assets sold and interests retained.

In addition, the Corporation may invest in debt securities issued by unconsolidated VIEs. Quoted market prices are primarily used to obtain fair values of senior retained interests.these debt securities, which are AFS debt securities or trading account assets. Generally, quoted market prices for retained residual interests are not available;available, therefore, the Corporation estimates fair values based uponon the present value of the associated expected future cash flows. This may require management to estimate credit losses, prepayment speeds, forward interest yield curves, discount rates and other factors that impact the value of retained interests.

Interest-only strips retained Retained residual interests in connection with credit card securitizationsunconsolidated securitization trusts are classified in trading account assets or other assets andwith changes in fair value recorded in income. The Corporation may also enter into derivatives with unconsolidated VIEs, which are carried at fair value with changes in fair value recorded in card income. Other retained interests are recorded in other assets, AFS debt securities or trading account assets and generally are carried at fair value with changes recorded in income or accumulated OCI, or are recorded as HTM debt securities and carried at amortized cost. If the fair value of such retained interests has declined below carrying amount and there has been an adverse change in estimated contractual cash flows of the underlying assets, then such decline is determined to be other-than-temporary and the retained interest is written down to fair value with a corresponding charge to other income.

Other Special Purpose Financing Entities

Other special purpose financing entities (e.g., Corporation-sponsored multi-seller conduits, collateralized debt obligation vehicles and asset acquisition conduits) are generally funded with short-term commercial paper or long-term debt. These financing entities are usually contractually limited to a narrow range of activities that facilitate the transfer of or access to various types of assets or financial instruments and provide the investors in the transaction with protection from creditors of the Corporation in the event of bankruptcy or receivership of the Corporation. In certain situations, the Corporation provides liquidity commitments and/or loss protection agreements.

The Corporation determines whether these entities should be consolidated by evaluating the degree to which it maintains control over the financing entity and will receive the risks and rewards of the assets in the financing entity. In making this determination, the Corporation considers whether the entity is a QSPE, which is generally not required to be consolidated by the seller or investors in the entity. For non-QSPE structures or VIEs, the Corporation assesses whether it is the primary beneficiary of the entity. In accordance with applicable accounting guidance, the entity that will absorb a majority of expected variability (the sum of the absolute values of the expected losses and expected residual returns) consolidates the VIE and is referred to as the primary beneficiary. As certain events occur, the Corporation reevaluates which parties will absorb varia - -

bility and whether the Corporation has become or is no longer the primary beneficiary. Reconsideration events may occur when VIEs acquire additional assets, issue new variable interests or enter into new or modified contractual arrangements. A reconsideration event may also occur when the Corporation acquires new or additional interests in a VIE.

Fair Value

The Corporation measures the fair values of its financial instruments in accordance with accounting guidance that requires an entity to base fair value on exit price and maximize the use of observable inputs and minimize the use of unobservable inputs to determine the exit price. The Corporation categorizes its financial instruments, based on the priority of inputs to the valuation technique, into a three-level hierarchy, as described below. Trading account assets and liabilities, derivative assets and liabilities, AFS debt and marketable equity securities, MSRs and certain other assets are carried at fair value in accordance with applicable accounting guidance. The Corporation has also elected to account for certain assets and liabilities under the fair value option, including certain corporate loans and loan commitments, LHFS, commercial paper and other short-term borrowings, securities financing agreements, asset-backed secured financings, long-term deposits and long-term debt. The following describes the three-level hierarchy.

Level 1  

Unadjusted quoted prices in active markets for identical assets or liabilities. Level 1 assets and liabilities include debt and equity securities and derivative contracts that are traded in an active exchange market, as well as certain U.S. Treasury securities that are highly liquid and are actively traded inover-the-counter markets.

Level 2  

Observable inputs other than Level 1 prices, such as quoted prices for similar assets or liabilities, quoted prices in markets that are not active, or other inputs that are observable or can be corroborated by observable market data for substantially the full term of the assets or liabilities. Level 2 assets and liabilities include debt securities with quoted prices that are traded less frequently than exchange-traded instruments and derivative contracts where value is determined using a pricing model with inputs that are observable in the market or can be derived principally from or corroborated by observable market data. This category generally includes U.S. government and agency mortgage-backed debt securities, corporate debt securities, derivative contracts, residential mortgage loans and certain LHFS.

Level 3  

Unobservable inputs that are supported by little or no market activity and that are significant to the overall fair value of the assets or liabilities. Level 3 assets and liabilities include financial instruments for which the determination of fair value requires significant management judgment or estimation. The fair value for such assets and liabilities is generally determined using pricing models, discounted cash flow methodologies or similar techniques that incorporate the assumptions a market participant would use in pricing the asset or liability. This category generally includes certain private equity investments and other principal investments, retained residual interests in securitizations, residential MSRs, asset-backed securities (ABS), highly structured, complex or long-dated derivative contracts, certain LHFS, IRLCs and certain collateralized debt obligations (CDOs)CDOs where independent pricing information cannot be obtained for a significant portion of the underlying assets.


Bank of America 2009125

Bank of America 2010     149


Income Taxes

There are two components of income tax expense: current and deferred. Current income tax expense approximates taxes to be paid or refunded for the current period. Deferred income tax expense results from changes in deferred tax assets and liabilities between periods. These gross deferred tax assets and liabilities represent decreases or increases in taxes expected to be paid in the future because of future reversals of temporary differences in the bases of assets and liabilities as measured by tax laws and their bases as reported in the financial statements. Deferred tax assets are also recognized for tax attributes such as net operating loss carryforwards and tax credit carryforwards. Valuation allowances are recorded to reduce deferred tax assets to the amounts management concludes are more-likely-than-not to be realized.

Income tax benefits are recognized and measured based upon a two-step model: 1) a tax position must be more-likely-than-not to be sustained based solely on its technical merits in order to be recognized, and 2) the benefit is measured as the largest dollar amount of that position that is more-likely-than-not to be sustained upon settlement. The difference between the benefit recognized and the tax benefit claimed on a tax return is referred to as an unrecognized tax benefit (UTB). The Corporation records income tax-related interest and penalties, if applicable, within income tax expense.

Retirement Benefits

The Corporation has established retirement plans covering substantially all full-time and certain part-time employees. Pension expense under these plans is charged to current operations and consists of several components of net pension cost based on various actuarial assumptions regarding future experience under the plans.

In addition, the Corporation has established unfunded supplemental benefit plans and supplemental executive retirement plans (SERPs) for selected officers of the Corporation and its subsidiaries that provide benefits that cannot be paid from a qualified retirement plan due to Internal Revenue Code restrictions. The SERPs have been frozen and theCorporation’s current executive officers do not accrue anyearn additional benefits.retirement income under SERPs. These plans are nonqualified under the Internal Revenue Code and assets used to fund benefit payments are not segregated from other assets of the Corporation; therefore, in general, a participant’s or beneficiary’s claim to benefits under these plans is as a general creditor. In addition, the Corporation has established several postretirement healthcare and life insurance benefit plans.

Accumulated Other Comprehensive Income

The Corporation records unrealized gains and losses on AFS debt and marketable equity securities, gains and losses on cash flow accounting hedges, unrecognized actuarial gains and losses, transition obligation and prior service costs on pension and postretirement plans, foreign currency translation adjustments and related hedges of net investments in foreign operations in accumulated OCI,net-of-tax. Unrealized gains and losses on AFS debt and marketable equity securities are reclassified to earnings as the gains or losses are realized upon sale of the securities. Unrealized losses on AFS securities deemed to represent other-than- temporary impairmentOTTI are reclassified to earnings at the time of the impairment charge. Beginning in 2009, for AFS debt securities that the Corporation does not intend to sell or it is not more-likely-than-not that it will not be

required to sell, only the credit component of an unrealized loss is reclassified to earnings. Gains or losses on derivatives accounted for as cash flow hedges are reclassified to earnings when the hedged transaction affects earnings. Translation gains or losses on foreign currency translation adjustments are reclassified to earnings upon the substantial sale or liquidation of investments in foreign operations.

Earnings Per Common Share

EPS

Earnings per share (EPS) is computed by dividing net income (loss) allocated to common shareholders by the weighted averageweighted-average common shares outstanding. Net income (loss) allocated to common shareholders represents net income (loss) applicable to common shareholders (netwhich is net income (loss) adjusted for preferred stock dividends including dividends declared, accretion of discounts on preferred stock including accelerated accretion when preferred stock is repaid early, and cumulative dividends related to the current dividend period that have not been declared as of period end)end, less income allocated to participating securities (see discussion below)below for additional information). Diluted earnings (loss) per common share is computed by dividing income (loss) allocated to common shareholders by the weighted averageweighted-average common shares outstanding plus amounts representing the dilutive effect of stock options outstanding, restricted stock, restricted stock units, outstanding warrants and the dilution resulting from the conversion of convertible preferred stock, if applicable.

On January 1, 2009, the Corporation adopted new accounting guidance on earnings per share that defines unvested share-based payment awards that contain nonforfeitable rights to dividends as participating securities that are included in computing EPS using the two-class method. The two-class method is an earnings allocation formula under which EPS is calculated for common stock and participating securities according to dividends declared and participating rights in undistributed earnings. Under this method, all earnings, (distributeddistributed and undistributed)undistributed, are allocated to participating securities and common shares based on their respective rights to receive dividends.

In an exchange of non-convertible preferred stock, income allocated to common shareholders is adjusted for the difference between the carrying value of the preferred stock and the fair value of the common stock exchanged. In an induced conversion of convertible preferred stock, income allocated to common shareholders is reduced by the excess of the fair value of the common stock exchanged over the fair value of the common stock that would have been issued under the original conversion terms.

Foreign Currency Translation

Assets, liabilities and operations of foreign branches and subsidiaries are recorded based on the functional currency of each entity. For certain of the foreign operations, the functional currency is the local currency, in which case the assets, liabilities and operations are translated, for consolidation purposes, from the local currency to the U.S. dollar reporting currency at period-end rates for assets and liabilities and generally at average rates for results of operations. The resulting unrealized gains or losses as well as gains and losses from certain hedges, are reported as a component of accumulated OCI on an after-tax basis. When the foreign entity’s functional currency is determined to be the U.S. dollar, the resulting remeasurement currency gains or losses on foreign currency-denominated assets or liabilities are included in earnings.


126Bank of America 2009


Credit Card and Deposit Arrangements

Endorsing Organization Agreements

The Corporation contracts with other organizations to obtain their endorsement of the Corporation’s loan and deposit products. This endorsement may provide to the Corporation exclusive rights to market to the organization’s members or to customers on behalf of the Corporation. These organizations endorse the Corporation’s loan and deposit products and provide the Corporation with their mailing lists and marketing activities. These agreements generally have terms that range from two to five years. The Corporation typically pays royalties in exchange for theirthe endorsement. Compensation costs related to the credit card agreements are recorded as contra-revenue in card income.


150     Bank of America 2010


Cardholder Reward Agreements

The Corporation offers reward programs that allow its cardholders to earn points that can be redeemed for a broad range of rewards including cash, travel and discounted products. The Corporation establishes a rewards liability based upon the points earned that are expected to be redeemed and the average cost per point redeemed. The points to be redeemed are estimated based on past redemption behavior, card product type, account transaction activity and other historical card performance. The liability is reduced as the points are redeemed. The estimated cost of the rewards programs is recorded as contra-revenue in card income.

Insurance Income &and Insurance Expense

Property and casualty and credit life and disability premiums are generally recognized over the term of the policies on a pro-rata basis for all policies except for certain of the lender-placed auto insurance and the guaranteed auto protection (GAP) policies. For GAP insurance, revenue recognition is correlated to the exposure and accelerated over the life of the contract. For lender-placed auto insurance, premiums are recognized when collections become probable due to high cancellation rates experienced early in the life of the policy. For GAP insurance, revenue recognition is correlated to the exposure and accelerated over the life of the contract. Mortgage reinsurance premiums are recognized as earned. Insurance expense includes insurance claims, commissions and commissions, bothpremium taxes, all of which are recorded in other general operating expense.

NOTE 2 Merger and Restructuring Activity

Merrill Lynch

On January 1, 2009, the Corporation acquired Merrill Lynch through its merger with a subsidiary of the Corporation in exchange for common and preferred stock with a value of $29.1 billion, creating a financial services franchise with significantly enhanced wealth management, investment banking and international capabilities.billion. Under the terms of the merger agreement, Merrill Lynch common shareholders received 0.8595 of a share of Bank of America Corporation common stock in exchange for each share of Merrill Lynch common stock. In addition, Merrill Lynch non-convertible preferred shareholders received Bank of America Corporation preferred stock having substantially identical terms. On October 15, 2010, the outstanding Merrill Lynch convertible preferred stock remains outstanding and is convertibleautomatically converted into Bank of America Corporation common stock at an equivalent exchange ratio. With the acquisition, the Corporation has one of the largest wealth management businesses in the worldaccordance with approximately 15,000 financial advisors and more than $2.1 trillion in client assets. Global investment management capabilities include an economic ownership interest of approximately 34 percent in BlackRock, Inc. (BlackRock), a publicly traded investment management company. In addition, the acquisition adds strengths in debt and equity underwriting, sales and trading, and merger and acquisition advice, creating significant opportunities to deepen relationships with corporate and institutional clients around the globe. Merrill Lynch’s results of operations were included in the Corporation’s results beginning January 1, 2009.

its terms.

The purchase price was allocated to the acquired assets and liabilities based on their estimated fair values at the Merrill Lynch acquisition date as summarized in the following table.table below. Goodwill of $5.1$5.2 billion was calculated as the purchase premium after adjusting for the fair value of net assets acquired and represents the value expected from the synergies created from combining the Merrill Lynch wealth management and corporate and investment banking businesses with the Corporation’s capabilities in consumer and commercial banking as well as the economies of scale expected from combining the operations of the two companies.acquired. No goodwill is expected to be deductible for federal income tax purposes. The goodwill was allocated principally to theGlobal Wealth & Investment Management (GWIM)(GWIM)andGlobal Banking & Markets (GBAM)business segments.


Merrill Lynch Purchase Price Allocation

(Dollars in billions, except per share amounts)   

Purchase price


Merrill Lynch common shares exchanged (in millions)

  1,600  

Exchange ratio

  0.8595  

The Corporation’s common shares issued (in millions)

  1,375  

Purchase price per share of the Corporation’s common stock(1)

 $14.08  

Total value of the Corporation’s common stock and cash exchanged for fractional shares

 $19.4  

Merrill Lynch preferred stock

  8.6  

Fair value of outstanding employee stock awards

  1.1  

Total purchase price

 $29.1  

Allocation of the purchase price


Merrill Lynch stockholders’ equity

  19.9  

Merrill Lynch goodwill and intangible assets

  (2.6

Pre-tax adjustments to reflect acquired assets and liabilities at fair value:


Derivatives and securities

  (1.9

Loans

  (6.1

Intangible assets(2)

  5.4  

Other assets/liabilities

  (0.8

Long-term debt

  16.0  

Pre-tax total adjustments

  12.6  

Deferred income taxes

  (5.9

After-tax total adjustments

  6.7  

Fair value of net assets acquired

  24.0  

Goodwill resulting from the Merrill Lynch acquisition

 $5.1  
     
(Dollars in billions, except per share amounts)   
Purchase price
    
Merrill Lynch common shares exchanged (in millions)  1,600 
Exchange ratio  0.8595 
     
The Corporation’s common shares issued (in millions)  1,375 
Purchase price per share of the Corporation’s common stock (1)
 $14.08 
     
Total value of the Corporation’s common stock and cash exchanged for fractional shares
 $19.4 
Merrill Lynch preferred stock  8.6 
Fair value of outstanding employee stock awards  1.1 
     
Total purchase price
 $29.1 
Allocation of the purchase price
    
Merrill Lynch stockholders’ equity  19.9 
Merrill Lynch goodwill and intangible assets  (2.6)
Pre-tax adjustments to reflect acquired assets and liabilities at fair value:    
Derivatives and securities  (2.1)
Loans  (6.1)
Intangible assets (2)
  5.4 
Other assets/liabilities  (0.7)
Long-term debt  16.0 
     
Pre-tax total adjustments
  12.5 
Deferred income taxes  (5.9)
     
After-tax total adjustments
  6.6 
     
Fair value of net assets acquired
  23.9 
     
Goodwill resulting from the Merrill Lynch acquisition
 $5.2 
     
(1)

The value of the shares of common stock exchanged with Merrill Lynch shareholders was based upon the closing price of the Corporation’s common stock at December 31, 2008, the last trading day prior to the date of acquisition.

(2)

Consists of trade name of $1.5 billion and customer relationship and core deposit intangibles of $3.9 billion. The amortization life is 10 years for the customer relationship and core deposit intangibles which are primarily amortized on a straight-line basis.

Bank of America 2009127
Bank of America 2010     151


Condensed Statement of Net Assets Acquired

The following condensed statement of net assets acquired reflects the values assigned to Merrill Lynch’s net assets as of the acquisition date.

(Dollars in billions) January 1, 2009

Assets


Federal funds sold and securities borrowed or purchased under agreements to resell

 $138.8

Trading account assets

  87.9

Derivative assets

  96.4

Investment securities

  70.5

Loans and leases

  55.9

Intangible assets

  5.4

Other assets

  195.3

Total assets

 $650.2

Liabilities


Deposits

 $98.1

Federal funds purchased and securities loaned or sold under agreements to repurchase

  111.6

Trading account liabilities

  18.1

Derivative liabilities

  72.0

Commercial paper and other short-term borrowings

  37.9

Accrued expenses and other liabilities

  99.6

Long-term debt

  188.9

Total liabilities

  626.2

Fair value of net assets acquired

 $24.0

     
(Dollars in billions) January 1, 2009 
Assets
    
Federal funds sold and securities borrowed or purchased under agreements to resell $138.8 
Trading account assets  87.7 
Derivative assets  96.4 
Investment securities  70.5 
Loans and leases  55.9 
Intangible assets  5.4 
Other assets  195.3 
     
Total assets
 $650.0 
     
Liabilities
    
Deposits $98.1 
Federal funds purchased and securities loaned or sold under agreements to repurchase  111.6 
Trading account liabilities  18.1 
Derivative liabilities  72.0 
Commercial paper and other short-term borrowings  37.9 
Accrued expenses and other liabilities  99.5 
Long-term debt  188.9 
     
Total liabilities
  626.1 
     
Fair value of net assets acquired
 $23.9 
     
Contingencies

The fair value of net assets acquired includes certain contingent liabilities that were recorded as of the acquisition date. Merrill Lynch has been named as a defendant in various pending legal actions and proceedings arising in connection with its activities as a global diversified financial services institution. Some of these legal actions and proceedings include claims for substantial compensatoryand/or punitive damages or claims for indeterminate amounts of damages. Merrill Lynch is also involved in investigationsand/or proceedings by governmental and self-regulatory agencies. Due to the number of variables and assumptions involved in assessing the possible outcome of these legal actions, sufficient information did not exist as of the acquisition date to reasonably estimate the fair value of these contingent liabilities. As such, these contingences have been measured in accordance with applicable accounting guidance on contingencies which states that a loss is recognized when it is probable of occurring and the loss amount can be reasonably estimated. For further information, seeNote 14 – Commitments and Contingencies.

In connection with the Merrill Lynch acquisition, on January 1, 2009, the Corporation recorded certain guarantees, primarily standby liquidity facilities and letters of credit, with a fair value of approximately $1 billion. At the time of acquisition, the maximum amount that could be drawn from these guarantees was approximately $20 billion.

Countrywide

On July 1, 2008, the Corporation acquired Countrywide through its merger with a subsidiary of the Corporation. Under the terms of the merger agreement, Countrywide shareholders received 0.1822 of a share of Bank of America Corporation common stock in exchange for each share of Countrywide common stock. The acquisition of Countrywide significantly expanded the Corporation’s mortgage originating and servicing capabilities, making it a leading mortgage originator and servicer. As provided by the merger agreement, 583 million shares of Countrywide common stock were exchanged for 107 million shares of the Corporation’s common stock. Countrywide’s results of operations were included in the Corporation’s results beginning July 1, 2008.

The Countrywide purchase price was allocated to the assets acquired and liabilities assumed based on their fair values at the Countrywide

acquisition date as summarized in the following table. No goodwill is deductible for federal income tax purposes. All the goodwill was allocated to theHome Loans & Insurance business segment.

Countrywide Purchase Price Allocation

(Dollars in billions)   

Purchase price (1)

 $4.2  

Allocation of the purchase price


Countrywide stockholders’ equity(2)

  8.4  

Pre-tax adjustments to reflect assets acquired and liabilities assumed at fair value:


Loans

  (9.8

Investments in other financial instruments

  (0.3

Mortgage servicing rights

  (1.5

Other assets

  (0.8

Deposits

  (0.2

Notes payable and other liabilities

  (0.9

Pre-tax total adjustments

  (13.5

Deferred income taxes

  4.9  

After-tax total adjustments

  (8.6

Fair value of net assets acquired

  (0.2

Goodwill resulting from the Countrywide acquisition

 $4.4  
(1)

The value of the shares of common stock exchanged with Countrywide shareholders was based upon the average of the closing prices of the Corporation’s common stock for the period commencing two trading days before and ending two trading days after January 11, 2008, the date of the Countrywide merger agreement.

(2)

Represents the remaining Countrywide shareholders’ equity as of the acquisition date after the cancellation of the $2.0 billion of Series B convertible preferred shares owned by the Corporation.

The Corporation acquired certain loans for which there was, at the time of the merger, evidence of deterioration of credit quality since origination and for which it was probable that all contractually required payments would not be collected. For more information, see the Countrywide purchased impaired loan discussion inNote 6 – Outstanding Loans and Leases.

Other Acquisitions

On October 1, 2007, the Corporation acquired all the outstanding shares of LaSalle, for $21.0 billion in cash. LaSalle’s results of operations were included in the Corporation’s results beginning October 1, 2007.

On July 1, 2007, the Corporation acquired all the outstanding shares of U.S. Trust Corporation for $3.3 billion in cash. U.S. Trust Corporation’s results of operations were included in the Corporation’s results beginning July 1, 2007.

Unaudited Pro Forma Condensed Combined Financial Information

If the Merrill Lynch and Countrywide acquisitions had been completed on January 1, 2008, total revenue, net of interest expense would have been $66.8 billion, net loss from continuing operations would have been $26.0 billion, and basic and diluted loss per common share would have been $5.37 for 2008. These results include the impact of amortizing certain purchase accounting adjustments such as intangible assets as well as fair value adjustments to loans, securities and debt. The pro forma financial information does not include the impact of possible business model changes nor does it consider any potential impacts of current market conditions or revenues, expense efficiencies, asset dispositions, share repurchases or other factors. For 2009, Merrill Lynch contributed $23.3 billion in revenue, net of interest expense, and $4.7 billion in net income. These amounts exclude the impact of intercompany transfers of businesses and are before the consideration of certain merger-related costs, revenue opportunities and certain consolidating tax benefits that were recognized in legacy Bank of America legal entities.


128Bank of America 2009


Merger and Restructuring Charges and Reserves

Merger and restructuring charges are recorded in the Consolidated Statement of Income and include incremental costs to integrate the operations of the Corporation and its recent acquisitions. These charges represent costs associated with these one-time activities and do not represent ongoing costs of the fully integrated combined organization. On January 1, 2009, the Corporation adopted new accounting guidance on business combinations, on a prospective basis, that requires that acquisition-related transaction and restructuring costs be charged to expense as incurred. Previously, these expenses were recorded as an adjustment to goodwill.

The following table below presents severance and employee-related charges, systems integrations and related charges, and other merger-related charges.

(Dollars in millions) 2009    2008    2007

Severance and employee-related charges

 $1,351    $138    $106

Systems integrations and related charges

  1,155     640     240

Other

  215     157     64

Total merger and restructuring charges

 $2,721    $935    $410

             
(Dollars in millions) 2010  2009  2008 
Severance and employee-related charges $455  $1,351  $138 
Systems integrations and related charges  1,137   1,155   640 
Other  228   215   157 
             
Total merger and restructuring charges
 $1,820  $2,721  $935 
             
Included for 2010 are merger-related charges of $1.6 billion related to the Merrill Lynch acquisition and $202 million related to the July 1, 2008 acquisition of Countrywide Financial Corporation (Countrywide). Included for 2009 are merger-related charges of $1.8 billion related to the Merrill Lynch acquisition, $843 million related to the Countrywide acquisition and $97 million related to the LaSalle acquisition.earlier acquisitions. Included for 2008 are merger-related charges of $623 million related to the LaSalle acquisition, $205 million related to the Countrywide acquisition and $107$730 million related to the U.S. Trust Corporation acquisition. Included for 2007 areearlier acquisitions.
During 2010, $1.6 billion in merger-related charges of $233for the Merrill Lynch acquisition included $426 million related to the 2006 MBNA Corporation (MBNA) acquisition, $109for severance and other employee-related costs, $975 million related to the U.S. Trust Corporation acquisitionfor systems integration costs and $68$217 million related to the LaSalle acquisition.

Duringin other merger-related costs. In 2009, the $1.8 billion in merger-related charges for the Merrill Lynch acquisition included $1.2 billion for severance and other employee-related costs, $480 million of systemfor systems integration costs and $129 million in other merger-related costs.

Merger-related Exit Cost and Restructuring Reserves

The following table below presents the changes in exit cost and restructuring reserves for 20092010 and 2008.2009. Exit cost reserves were established in purchase accounting resulting in an increase in goodwill. Restructuring reserves are established by a charge to merger and restructuring charges.

charges, and the restructuring charges are included in the total merger and restructuring charges in the table above. Exit costs were not recorded in purchase accounting for the Merrill Lynch acquisition in accordance with amendments to thenew accounting guidance foron business combinations which werewas effective January 1, 2009.

  Exit Cost
Reserves
    Restructuring
Reserves
 
(Dollars in millions) 2009  2008     2009  2008 

Balance, January 1

 $523   $377    $86   $108  

Exit costs and restructuring charges:


Merrill Lynch

  n/a    n/a     949    n/a  

Countrywide

      588     191    71  

LaSalle

  (24  31     (6  25  

U.S. Trust Corporation

      (3   (1  40  

MBNA

      (6       (3

Cash payments

  (387  (464    (816  (155

Balance, December 31

 $112   $523     $403   $86  
n/a

= not applicable

At December 31, 2008, there were $523 million of exit cost reserves related principally to the Countrywide acquisition, including $347 million for severance, relocation and other employee-related costs and $176 million for contract terminations. During 2009, $24 million of exit cost reserve adjustments were recorded for the LaSalle acquisition primarily due to lower than expected contract terminations. Cash payments of $387 million during 2009 consisted of $271 million in severance, relocation and other employee-related costs and $116 million in contract terminations.

                 
  Exit Cost Reserves  Restructuring Reserves 
(Dollars in millions) 2010  2009  2010  2009 
Balance, January 1
 $112  $523  $403  $86 
Exit costs and restructuring charges:                
Merrill Lynch  n/a   n/a   375   949 
Countrywide  (18)     54   191 
Other  (9)  (24)     (6)
Cash payments and other  (70)  (387)  (496)  (817)
                 
Balance, December 31
 $15  $112  $336  $403 
                 
n/a = not applicable
At December 31, 2009, exit cost reserves of $112 million related principally to Countrywide.

At December 31, 2008, there were $86$403 million of restructuring reserves related to the Merrill Lynch and Countrywide LaSalle and U.S. Trust Corporation acquisitions related tofor severance and other employee-related costs. During 2009, $1.1 billion2010, $429 million was added to the restructuring reserves related to severance and other employee-related costs primarily associated with the Merrill Lynch acquisition. Cash payments and other of $816$496 million during 20092010 were all related to severance and other employee-related costs. As ofcosts primarily associated with the Merrill Lynch acquisition. Payments associated with the Countrywide acquisition are expected to continue into 2011, while Merrill Lynch related payments are anticipated to continue into 2012. At December 31, 2009,2010, restructuring reserves of $403$336 million included $328 million forrelated principally to Merrill Lynch and $74 million for Countrywide.Lynch.


152     Bank of America 2010

Payments under exit cost and restructuring reserves associated with the U.S. Trust Corporation acquisition were completed in 2009 while payments associated with the LaSalle, Countrywide and Merrill Lynch acquisitions will continue into 2010.


NOTE 3 Trading Account Assets and Liabilities

The following table below presents the components of trading account assets and liabilities at December 31, 20092010 and 2008.

  December 31
(Dollars in millions) 2009    2008

Trading account assets


U.S. government and agency securities(1)

 $44,585    $60,038

Corporate securities, trading loans and other

  57,009     34,056

Equity securities

  33,562     20,258

Foreign sovereign debt

  28,143     13,614

Mortgage trading loans and asset-backed securities

  18,907     6,349

Total trading account assets

 $182,206    $134,315

Trading account liabilities


U.S. government and agency securities

 $26,519    $27,286

Equity securities

  18,407     12,128

Foreign sovereign debt

  12,897     7,252

Corporate securities and other

  7,609     5,057

Total trading account liabilities

 $65,432    $51,723
(1)

Includes $23.5 billion and $52.6 billion at December 31, 2009 and 2008 of government-sponsored enterprise (GSE) obligations.

2009.
         
  December 31 
(Dollars in millions) 2010  2009 
Trading account assets
        
U.S. government and agency securities(1)
 $60,811  $44,585 
Corporate securities, trading loans and other  49,352   57,009 
Equity securities  32,129   33,562 
Non-U.S. sovereign debt
  33,523   28,143 
Mortgage trading loans and asset-backed securities  18,856   18,907 
         
Total trading account assets
 $194,671  $182,206 
         
Trading account liabilities
        
U.S. government and agency securities $29,340  $26,519 
Equity securities  15,482   18,407 
Non-U.S. sovereign debt
  15,813   12,897 
Corporate securities and other  11,350   7,609 
         
Total trading account liabilities
 $71,985  $65,432 
         
Bank(1)Includes $29.7 billion and $23.5 billion at December 31, 2010 and 2009 of America 2009129GSE obligations.


NOTE 4 Derivatives

Derivative Balances

Derivatives are heldentered into on behalf of customers, for trading, as economic hedges or as qualifying accounting hedges.hedges. The Corporation enters into derivatives to facilitate client transactions, for proprietaryprincipal trading purposes and to manage risk exposures. For additional information on the Corporation’s derivatives and hedging activities, seeNote 1 – Summary of Significant

Accounting Principles. The following table below identifies derivative instruments included

on the Corporation’s Consolidated Balance Sheet in derivative assets and liabilities at December 31, 20092010 and 2008.2009. Balances are providedpresented on a gross basis, prior to the application of the impact of counterparty and collateral netting. Total derivative assets and liabilities are adjusted on an aggregate basis to take into consideration the effects of legally enforceable master netting agreements and have been reduced by the cash collateral applied.


  December 31, 2009 
  Gross Derivative Assets          Gross Derivative Liabilities 
(Dollars in billions) Contract/
Notional (1)
    Trading
Derivatives
and
Economic
Hedges
    Qualifying
Accounting
Hedges (2)
    Total           Trading
Derivatives
and
Economic
Hedges
    Qualifying
Accounting
Hedges (2)
    Total 

Interest rate contracts


Swaps

 $45,261.5    $1,121.3    $5.6    $1,126.9          $1,105.0    $0.8    $1,105.8  

Futures and forwards

  11,842.1     7.1          7.1           6.1          6.1  

Written options

  2,865.5                          84.1          84.1  

Purchased options

  2,626.7     84.1          84.1                       

Foreign exchange contracts


Swaps

  661.9     23.7     4.6     28.3           27.3     0.5     27.8  

Spot, futures and forwards

  1,750.8     24.6     0.3     24.9           25.6     0.1     25.7  

Written options

  383.6                          13.0          13.0  

Purchased options

  355.3     12.7          12.7                       

Equity contracts


Swaps

  58.5     2.0          2.0           2.0          2.0  

Futures and forwards

  79.0     3.0          3.0           2.2          2.2  

Written options

  283.4                          25.1     0.4     25.5  

Purchased options

  273.7     27.3          27.3                       

Commodity contracts


Swaps

  65.3     6.9     0.1     7.0           6.8          6.8  

Futures and forwards

  387.8     10.4          10.4           9.6          9.6  

Written options

  54.9                          7.9          7.9  

Purchased options

  50.9     7.6          7.6                       

Credit derivatives


Purchased credit derivatives:


Credit default swaps

  2,800.5     105.5          105.5           45.2          45.2  

Total return swaps/other

  21.7     1.5          1.5           0.4          0.4  

Written credit derivatives:


Credit default swaps

  2,788.8     44.1          44.1           98.4          98.4  

Total return swaps/other

  33.1     1.8          1.8            1.1          1.1  

Gross derivative assets/liabilities

     $1,483.6    $10.6     1,494.2          $1,459.8    $1.8     1,461.6  

Less: Legally enforceable master netting agreements

              (1,355.1                 (1,355.1

Less: Cash collateral applied

                    (58.4                      (62.8

Total derivative assets/liabilities

                   $80.7                       $43.7  

                             
     December 31, 2010 
     Gross Derivative Assets  Gross Derivative Liabilities 
     Trading
        Trading
       
     Derivatives
        Derivatives
       
     and
  Qualifying
     and
  Qualifying
    
  Contract/
  Economic
  Accounting
     Economic
  Accounting
    
(Dollars in billions) Notional (1)  Hedges  Hedges (2)  Total  Hedges  Hedges (2)  Total 
Interest rate contracts
                            
Swaps $42,719.2  $1,193.9  $14.9  $1,208.8  $1,187.9  $2.2  $1,190.1 
Futures and forwards  9.939.2   6.0      6.0   4.7      4.7 
Written options  2,887.7            82.8      82.8 
Purchased options  3,026.2   88.0      88.0          
Foreign exchange contracts
                            
Swaps  630.1   26.5   3.7   30.2   28.5   2.1   30.6 
Spot, futures and forwards  2,652.9   41.3      41.3   44.2      44.2 
Written options  439.6            13.2      13.2 
Purchased options  417.1   13.0      13.0          
Equity contracts
                            
Swaps  42.4   1.7      1.7   2.0      2.0 
Futures and forwards  78.8   2.9      2.9   2.1      2.1 
Written options  242.7            19.4      19.4 
Purchased options  193.5   21.5      21.5          
Commodity contracts
                            
Swaps  90.2   8.8   0.2   9.0   9.3      9.3 
Futures and forwards  413.7   4.1      4.1   2.8      2.8 
Written options  86.3            6.7      6.7 
Purchased options  84.6   6.6      6.6          
Credit derivatives
                            
Purchased credit derivatives:                            
Credit default swaps  2,184.7   69.8      69.8   34.0      34.0 
Total return swaps/other  26.0   0.9      0.9   0.2      0.2 
Written credit derivatives:                            
Credit default swaps  2,133.5   33.3      33.3   63.2      63.2 
Total return swaps/other  22.5   0.5      0.5   0.5      0.5 
                             
Gross derivative assets/liabilities     $1,518.8  $18.8  $1,537.6  $1,501.5  $4.3  $1,505.8 
Less: Legally enforceable master netting agreements              (1,406.3)          (1,406.3)
Less: Cash collateral applied              (58.3)          (43.6)
                             
Total derivative assets/liabilities
             $73.0          $55.9 
                             
(1)

Represents the total contract/notional amount of the derivatives outstandingderivative assets and includes both written and purchased credit derivatives.

liabilities outstanding.
(2)Excludes $4.1 billion of long-term debt designated as a hedge of foreign currency risk.
Bank of America 2010     153


     December 31, 2009 
     Gross Derivative Assets  Gross Derivative Liabilities 
     Trading
        Trading
       
     Derivatives
        Derivatives
       
     and
  Qualifying
     and
  Qualifying
    
  Contract/
  Economic
  Accounting
     Economic
  Accounting
    
(Dollars in billions) Notional (1)  Hedges  Hedges (2)  Total  Hedges  Hedges (2)  Total 
Interest rate contracts
                            
Swaps $45,261.5  $1,121.3  $5.6  $1,126.9  $1,105.0  $0.8  $1,105.8 
Futures and forwards  11,842.1   7.1      7.1   6.1      6.1 
Written options  2,865.5            84.1      84.1 
Purchased options  2,626.7   84.1      84.1          
Foreign exchange contracts
                            
Swaps  661.9   23.7   4.6   28.3   27.3   0.5   27.8 
Spot, futures and forwards  1,750.8   24.6   0.3   24.9   25.6   0.1   25.7 
Written options  383.6            13.0      13.0 
Purchased options  355.3   12.7      12.7          
Equity contracts
                            
Swaps  58.5   2.0      2.0   2.0      2.0 
Futures and forwards  79.0   3.0      3.0   2.2      2.2 
Written options  283.4            25.1   0.4   25.5 
Purchased options  273.7   27.3      27.3          
Commodity contracts
                            
Swaps  65.3   6.9   0.1   7.0   6.8      6.8 
Futures and forwards  387.8   10.4      10.4   9.6      9.6 
Written options  54.9            7.9      7.9 
Purchased options  50.9   7.6      7.6          
Credit derivatives
                            
Purchased credit derivatives:                            
Credit default swaps  2,800.5   105.5      105.5   45.2      45.2 
Total return swaps/other  21.7   1.5      1.5   0.4      0.4 
Written credit derivatives:                            
Credit default swaps  2,788.8   44.1      44.1   98.4      98.4 
Total return swaps/other  33.1   1.8      1.8   1.1      1.1 
                             
Gross derivative assets/liabilities     $1,483.6  $10.6  $1,494.2  $1,459.8  $1.8  $1,461.6 
Less: Legally enforceable master netting agreements              (1,355.1)          (1,355.1)
Less: Cash collateral applied              (51.5)          (55.8)
                             
Total derivative assets/liabilities
             $87.6          $50.7 
                             
(1)Represents the total contract/notional amount of derivative assets and liabilities outstanding.
(2)Excludes $4.4 billion of long-term debt designated as a hedge of foreign currency risk.

130Bank of America 2009


  December 31, 2008 
        Gross Derivative Assets              Gross Derivative Liabilities       
(Dollars in billions) Contract/
Notional(1)
    Trading
Derivatives
and
Economic
Hedges
    Qualifying
Accounting
Hedges(2)
    Total         Trading
Derivatives
and
Economic
Hedges
    Qualifying
Accounting
Hedges(2)
    Total 

Interest rate contracts


Swaps

 $26,577.4    $1,213.2    $2.2    $1,215.4        $1,186.0    $    $1,186.0  

Futures and forwards

  4,432.1     5.1          5.1         7.9          7.9  

Written options

  1,731.1                        62.7          62.7  

Purchased options

  1,656.6     60.3          60.3                     

Foreign exchange contracts


Swaps

  438.9     17.5     3.6     21.1         20.5     1.3     21.8  

Spot, futures and forwards

  1,376.5     52.3          52.3         51.3          51.3  

Written options

  199.8                        7.5          7.5  

Purchased options

  175.7     8.0          8.0                     

Equity contracts


Swaps

  34.7     1.8          1.8         1.0          1.0  

Futures and forwards

  14.1     0.3          0.3         0.1          0.1  

Written options

  214.1                        31.6     0.1     31.7  

Purchased options

  217.5     32.6          32.6                     

Commodity contracts


Swaps

  2.1     2.4          2.4         2.1          2.1  

Futures and forwards

  9.6     1.2          1.2         1.0          1.0  

Written options

  17.6                        3.8          3.8  

Purchased options

  15.6     3.7          3.7                     

Credit derivatives


Purchased credit derivatives:


Credit default swaps

  1,025.9     125.7          125.7         3.4          3.4  

Total return swaps

  6.6     1.8          1.8         0.2          0.2  

Written credit derivatives:


Credit default swaps

  1,000.0     3.4          3.4         118.8          118.8  

Total return swaps

  6.2     0.4          0.4          0.1          0.1  

Gross derivative assets/liabilities

     $1,529.7    $5.8     1,535.5        $1,498.0    $1.4     1,499.4  

Less: Legally enforceable master netting agreements

              (1,438.4               (1,438.4

Less: Cash collateral applied

                    (34.8                    (30.3

Total derivative assets/liabilities

                   $62.3                     $30.7  
(1)

Represents the total contract/notional amount of the derivatives outstanding and includes both written and purchased credit derivatives.

(2)

Excludes $2.0 billion of long-term debt designated as a hedge of foreign currency risk.

ALM and Risk Management Derivatives

The Corporation’s ALM and risk management activities include the use of derivatives to mitigate risk to the Corporation including both derivatives that are designated as hedging instruments and economic hedges. Interest rate, commodity, credit and foreign exchange contracts are utilized in the Corporation’s ALM and risk management activities.

The Corporation maintains an overall interest rate risk management strategy that incorporates the use of interest rate contracts, which are generally non-leveraged generic interest rate and basis swaps, options, futures, and forwards, to minimize significant fluctuations in earnings that are caused by interest rate volatility. The Corporation’s goal is to manage interest rate sensitivity so that movements in interest rates do not significantly adversely affect earnings. As a result of interest rate fluctuations, hedged fixed-rate assets and liabilities appreciate or depreciate in fair value. Gains or losses on the derivative instruments that are linked to the hedged fixed-rate assets and liabilities are expected to substantially offset this unrealized appreciation or depreciation.

Interest rate contracts, which are generally non-leveraged generic interest rate and basis swaps, options, futures and forwards, are used by the Corporation in the management of its interest rate risk position. Non-leveraged generic interest rate swaps involve the exchange of fixed-rate and variable-rate interest payments based on the contractual underlying notional amount. Basis swaps involve the exchange of interest payments based on the contractual underlying notional amounts, where both the pay rate and the receive rate are floating rates based on differ - -

ent indices. Option products primarily consist of caps, floors and swaptions. Futures contracts used for the Corporation’s ALM activities are primarily index futures providing for cash payments based upon the movements of an underlying rate index.

Interest rate and market risk can be substantial in the mortgage business. Market risk is the risk that values of mortgage assets or revenues will be adversely affected by changes in market conditions such as interest rate movements. To hedge interest rate risk in mortgage banking production income, the Corporation utilizes forward loan sale commitments and other derivative instruments including purchased options. The Corporation also utilizes derivatives such as interest rate options, interest rate swaps, forward

settlement contracts and euro-dollar futures as economic hedges of the fair value of MSRs. For additional information on MSRs, seeNote 2225 – Mortgage Servicing Rights.

The Corporation uses foreign currency contracts to manage the foreign exchange risk associated with certain foreign currency-denominated assets and liabilities, as well as the Corporation’s investments in foreignnon-U.S. subsidiaries. Foreign exchange contracts, which include spot and forward contracts, represent agreements to exchange the currency of one country for the currency of another country at anagreed-upon price on anagreed-upon settlement date. Exposure to loss on these contracts will increase or decrease over their respective lives as currency exchange and interest rates fluctuate.


Bank of America 2009131


The Corporation enters into derivative commodity contracts such as futures, swaps, options and forwards as well as non-derivative commodity contracts to provide price risk management services to customers or to manage price risk associated with its physical and financial commodity positions. The non-derivative commodity contracts and physical inventories of commodities expose the Corporation to earnings volatility. Cash flow and fair value accounting hedges provide a method to mitigate a portion of this earnings volatility.

The Corporation purchases credit derivatives to manage credit risk related to certain funded and unfunded credit exposures. Credit derivatives include credit default swaps, total return swaps and swaptions. These derivatives are


154     Bank of America 2010


accounted for as economic hedges and changes in fair value are recorded in other income.

income (loss).

Derivatives Designated as Accounting Hedges

The Corporation uses various types of interest rate, commodity and foreign exchange derivative contracts to protect against changes in the fair value of its assets and liabilities due to fluctuations in interest rates, exchange rates and commodity prices (fair value hedges). The Corporation also uses these

types of contracts and equity derivatives to protect against changes in the cash flows of its assets and liabilities, and other forecasted transactions (cash flow hedges). The Corporation hedges its net investment in consolidated foreignnon-U.S. operations determined to have functional currencies other than the U.S. dollar using forward exchange contracts, that typically settle in 90 days, cross-currency basis swaps, and by issuing foreign currency-denominated debt.

debt (net investment hedges).


Fair Value Hedges
The following table below summarizes certain information related to the Corporation’s derivatives designated as fair value hedges for 2010, 2009 and 2008.


  Amounts Recognized in Income 
  2009       2008 
(Dollars in millions) Derivative     Hedged
Item
     Hedge
Ineffectiveness
        Derivative    Hedged
Item
   Hedge
Ineffectiveness
 

Derivatives designated as fair value hedges


Interest rate risk on long-term debt(1)

 $(4,858    $4,082      $(776     $4,340    $(4,143  $197  
Interest rate and foreign currency risk on long-term debt(1)  932       (858     74        294     (444   (150

Interest rate risk on available-for-sale securities(2, 3)

  791       (1,141     (350      32     (51   (19

Commodity price risk on commodity inventory(4)

  (51     51                n/a     n/a     n/a  

Total(5)

 $(3,186    $2,134      $(1,052      $4,666    $(4,638  $28  
             
  2010 
     Hedged
  Hedge
 
(Dollars in millions) Derivative  Item  Ineffectiveness 
Derivatives designated as fair value hedges
            
Interest rate risk on long-term debt (1)
 $2,952  $(3,496) $(544)
Interest rate and foreign currency risk on long-term debt (1)
  (463)  130   (333)
Interest rate risk onavailable-for-sale securities(2, 3)
  (2,577)  2,667   90 
Commodity price risk on commodity inventory (4)
  19   (19)   
             
Total
 $(69) $(718) $(787)


  2009 
Derivatives designated as fair value hedges
            
Interest rate risk on long-term debt (1)
 $(4,858) $4,082  $(776)
Interest rate and foreign currency risk on long-term debt (1)
  932   (858)  74 
Interest rate risk onavailable-for-sale securities(2, 3)
  791   (1,141)  (350)
Commodity price risk on commodity inventory (4)
  (51)  51    
             
Total
 $(3,186) $2,134  $(1,052)


  2008 
Derivatives designated as fair value hedges
            
Interest rate risk on long-term debt (1)
 $4,340  $(4,143) $197 
Interest rate and foreign currency risk on long-term debt (1)
  294   (444)  (150)
Interest rate risk onavailable-for-sale securities(2)
  32   (51)  (19)
             
Total
 $4,666  $(4,638) $28 
             
(1)

Amounts are recorded in interest expense on long-term debt.

(2)

Amounts are recorded in interest income on AFS securities.

(3)(3)

Measurement of ineffectiveness in 20092010 includes $7 million compared to $354 million in 2009 of interest costs on short forward contracts. The Corporation considers this as part of the cost of hedging and it is offset by the fixed coupon receipt on the AFS security that is recognized in interest income on securities.

(4)(4)

Amounts are recorded in trading account profits (losses).

profits.
(5)
Bank of America 2010     155


For 2007, hedge ineffectiveness recognized in net interest income was $55 million.

n/a

= not applicable

Cash Flow Hedges
The following table below summarizes certain information related to the Corporation’s derivatives designated as cash flow hedges and net investment hedges for 2010, 2009 and 2008. During the next 12 months, net losses in accumulated OCI of approximately $937 million$1.8 billion ($590 million

1.1 billion after-tax) on derivative instruments that qualify as cash flow hedges are expected to be reclassified into earnings. These net losses reclassified into earnings are expected to primarily reduce net interest income related to the respective hedged items.

Amounts related to interest rate risk on variable rate portfolios reclassified from accumulated OCI increased interest income on assets by $144 million in 2010, reduced interest income on assets by $189 million and $156 million in 2009 and 2008 and increased interest expense on liabilities by $554 million, $1.1 billion and $1.1 billion in 2010, 2009 and 2008, respectively. Amounts reclassified from accumulated OCI exclude amounts related to derivative interest accruals which increased interest expense by $88 million and increased interest income by $160 million for 2010 and

2009, and increased interest expense by $73 million for 2008. Hedge ineffectiveness of $(14) million, $73 million and $(11) million was recorded in interest income, and $(16) million, $(2) million and $4 million was recorded in interest expense in 2010, 2009 and 2008.
Amounts related to commodity price risk reclassified from accumulated OCI are recorded in trading account profits (losses) with the underlying hedged item. Amounts related to price risk on restricted stock awards reclassified from accumulated OCI are recorded in personnel expense. Amounts related to price risk on equity investments included in AFS securities reclassified from accumulated OCI are recorded in equity investment income with the underlying hedged item.
Amounts related to foreign exchange risk recognized in accumulated OCI on derivatives exclude gains of $192 million related to long-term debt designated as a net investment hedge for 2010 compared to losses of $387 million for 2009 and $0 for 2008.

  2009       2008 
(Dollars in millions, amounts pre-tax) Amounts
Recognized
in OCI on
Derivatives
     Amounts
Reclassified
from OCI
into Income
     Hedge
Ineffectiveness
and Amount
Excluded from
Effectiveness
Testing(1)
        Amounts
Recognized
in OCI on
Derivatives
   Amounts
Reclassified
from OCI
into Income
   Hedge
Ineffectiveness
and Amount
Excluded from
Effectiveness
Testing(1)
 

Derivatives designated as cash flow hedges

                  
Interest rate risk on variable rate portfolios (2, 3, 4, 5) $579      $(1,214    $71       $(82  $(1,334  $(7

Commodity price risk on forecasted purchases
and sales(6)

  72       70       (2      n/a     n/a     n/a  

Price risk on equity investments included in available-for-sale securities

  (331                     243            

Total(7)

 $320      $(1,144    $69        $161    $(1,334  $(7

Net investment hedges


Foreign exchange risk(8)

 $(2,997    $      $(142      $2,814    $    $(192

             
  2010 
        Hedge
 
  Gains (losses)
  Gains (losses)
  Ineffectiveness and
 
  Recognized in
  in Income
  Amounts Excluded
 
  Accumulated OCI
  Reclassified from
  from Effectiveness
 
(Dollars in millions, amounts pre-tax) on Derivatives  Accumulated OCI  Testing(1, 2) 
Derivatives designated as cash flow hedges
            
Interest rate risk on variable rate portfolios $(1,876) $(410) $(30)
Commodity price risk on forecasted purchases and sales  32   25   11 
Price risk on restricted stock awards  (97)  (33)   
Price risk on equity investments included inavailable-for-sale securities
  186   (226)   
             
Total
 $(1,755) $(644) $(19)
             
Net investment hedges
            
Foreign exchange risk $(482) $  $(315)


  2009 
Derivatives designated as cash flow hedges
            
Interest rate risk on variable rate portfolios $502  $(1,293) $71 
Commodity price risk on forecasted purchases and sales  72   70   (2)
Price risk on equity investments included inavailable-for-sale securities
  (332)      
             
Total
 $242  $(1,223) $69 
             
Net investment hedges
            
Foreign exchange risk $(2,997) $  $(142)


  2008 
Derivatives designated as cash flow hedges
            
Interest rate risk on variable rate portfolios $(13) $(1,266) $(7)
Price risk on equity investments included inavailable-for-sale securities
  243       
             
Total
 $230  $(1,266) $(7)
             
Net investment hedges
            
Foreign exchange risk $2,814  $  $(192)
             
(1)

Gains (losses).
(2)Amounts related to derivatives designated as cash flow hedges represent hedge ineffectiveness and amounts related to net investment hedges represent amounts excluded from effectiveness testing.

(2)

Amounts reclassified from OCI reduced interest income on assets by $110 million and $224 million during 2009 and 2008, and increased interest expense on liabilities by $1.1 billion during both 2009 and 2008.

(3)

Hedge ineffectiveness of $73 million and $(10) million was recorded in interest income and $(2) million and $3 million was recorded in interest expense during 2009 and 2008.

(4)

Amounts recognized in OCI on derivatives exclude amounts related to terminated hedges of AFS securities of $(9) million and $206 million for 2009 and 2008.

(5)

Amounts reclassified from OCI exclude amounts related to derivative interest accruals which increased interest income by $104 million for 2009 and amounts which increased interest expense $73 million for 2008.

(6)

Gains reclassified from OCI into income were recorded in trading account profits (losses) during 2009, 2008 and 2007 were $44 million, $0 and $18 million, respectively, related to the discontinuance of cash flow hedging because it was probable that the original forecasted transaction would not occur.

(7)

For 2007, hedge ineffectiveness recognized in net interest income was $4 million.

(8)

Amounts recognized in OCI on derivatives exclude losses of $387 million related to long-term debt designated as a net investment hedge for 2009.

n/a

= not applicable

132Bank of America 2009
156     Bank of America 2010


The Corporation entered into equity total return swaps to hedge a portion of cash-settled restricted stock units (RSUs) granted to certain employees in February 2010 as part of their 2009 compensation. These cash-settled RSUs are accrued as liabilities over the vesting period and adjusted to fair value based on changes in the share price of the Corporation’s common stock. From time to time, the Corporation may enter into equity derivatives to minimize the change in the expense to the Corporation driven by fluctuations in the share price of the Corporation’s common stock during the vesting period of any RSUs that may be granted from time to time, if any, subject to similar or other terms and conditions. Certain of these derivatives are designated as cash flow hedges of unrecognized non-vested awards with the changes in fair value of the hedge recorded in accumulated OCI and reclassified into earnings in the

same period as the RSUs affect earnings. The remaining derivatives are accounted for as economic hedges and changes in fair value are recorded in personnel expense. For more information on restricted stock units and related hedges, seeNote 20 – Stock-Based Compensation Plans.
Economic Hedges

Derivatives designated as economic hedges, because either they did not qualify for or were not designated as accounting hedges, are used by the Corporation to reduce certain risk exposure but are not accounted for as accounting hedges.exposures. The following table below presents gains (losses) on these derivatives for 2010, 2009 and 2008. These gains (losses) are largely offset by the income or expense that is recorded on the economically hedged item.

(Dollars in millions) 2009     2008 

Price risk on mortgage banking production income(1, 2)

 $8,898      $892  

Interest rate risk on mortgage banking servicing income(1)

  (3,792     8,610  

Credit risk on loans and leases(3)

  (698     309  

Interest rate and foreign currency risk on long-term debt and other foreign exchange transactions(3)

  1,572       (1,316

Other(3)

  14       34  

Total

 $5,994      $8,529  


(Dollars in millions) 2010  2009  2008 
Price risk on mortgage banking production income(1, 2)
 $9,109  $8,898  $892 
Interest rate risk on mortgage banking servicing income (1)
  3,878   (4,264)  8,052 
Credit risk on loans (3)
  (119)  (698)  309 
Interest rate and foreign currency risk on long-term debt and other foreign exchange transactions (4)
  (2,080)  1,572   (1,316)
Other (5)
  (109)  16   34 
             
Total
 $10,679  $5,524  $7,971 
             
(1)

Gains (losses) on these derivatives are recorded in mortgage banking income.

(2)

Includes gains on IRLCsinterest rate lock commitments related to the origination of mortgage loans that are held for sale,held-for-sale, which are considered derivative instruments, of $8.7 billion, $8.4 billion for 2009 and $1.6 billion for 2008.2010, 2009 and 2008, respectively.

(3)

Gains (losses) on these derivatives are recorded in other income.income (loss).
(4)

The majority of the balance is related to the revaluation of economic hedges on foreign currency-denominated debt which is recorded in other income (loss).
(5)Gains (losses) on these derivatives are recorded in other income (loss), and for 2010, also in personnel expense for hedges of certain RSUs.
Bank of America 2010     157


Sales and Trading Revenue

The Corporation enters into trading derivatives to facilitate client transactions, for proprietaryprincipal trading purposes, and to manage risk exposures arising from trading account assets and liabilities. It is the Corporation’s policy to include these derivative instruments in its trading activities which include derivativederivatives and non-derivative cash instruments. The resulting risk from these derivatives is managed on a portfolio basis as part of the Corporation’sGlobal MarketsGBAMbusiness segment. The related sales and trading

revenue generated withinGlobal MarketsGBAMis

recorded on differentvarious income statement line items including trading account profits (losses) and net interest income as well as other revenue categories. However, the vast majority of income related to derivative instruments is recorded in trading account profits (losses). The following table below identifies the amounts in the respective income statement line items attributable to the Corporation’s sales and trading revenue categorized by primary risk for 2010, 2009 and 2008.


  2009      2008 
(Dollars in millions) Trading
Account
Profits
    Other
Revenues (1)
     Net
Interest
Income
     Total       

Trading
Account

Profits
(Losses)

   Other
Revenues (1)
   Net
Interest
Income
   Total 

Interest rate risk

 $3,145    $33      $1,068      $4,246     $1,083    $47    $276    $1,406  

Foreign exchange risk

  972     6       26       1,004      1,320     6     13     1,339  

Equity risk

  2,041     2,613       246       4,900      (66   686     99     719  

Credit risk

  4,433     (2,576     4,637       6,494      (8,276   (6,881   4,380     (10,777

Other risk

  1,084     13       (469     628       130     58     (14   174  

Total sales and trading revenue

 $11,675    $89      $5,508      $17,272      $(5,809  $(6,084  $4,754    $(7,139

                 
  2010 
  Trading
          
  Account
          
  Profits
  Other
  Net Interest
    
(Dollars in millions) (Losses)  Revenues(1)  Income  Total 
Interest rate risk $2,004  $113  $624  $2,741 
Foreign exchange risk  903   3      906 
Equity risk  1,670   2,506   21   4,197 
Credit risk  4,791   617   3,652   9,060 
Other risk  228   39   (142)  125 
                 
Total sales and trading revenue
 $9,596  $3,278  $4,155  $17,029 


  2009 
Interest rate risk $3,145  $33  $1,068  $4,246 
Foreign exchange risk  972   6   26   1,004 
Equity risk  2,041   2,613   246   4,900 
Credit risk  4,433   (2,576)  4,637   6,494 
Other risk  1,084   13   (469)  628 
                 
Total sales and trading revenue
 $11,675  $89  $5,508  $17,272 


  2008 
Interest rate risk $1,083  $47  $276  $1,406 
Foreign exchange risk  1,320   6   13   1,339 
Equity risk  (66)  686   99   719 
Credit risk  (8,276)  (6,881)  4,380   (10,777)
Other risk  130   58   (14)  174 
                 
Total sales and trading revenue
 $(5,809) $(6,084) $4,754  $(7,139)
                 
(1)

Represents investment and brokerage services and other income recorded inGlobal MarketsGBAM that the Corporation includes in its definition of sales and trading revenue.

Credit Derivatives

The Corporation enters into credit derivatives primarily to facilitate client transactions and to manage credit risk exposures. Credit derivatives derive value based on an underlying third party-referenced obligation or a portfolio of referenced obligations and generally require the Corporation as the seller of credit protection to make payments to a buyer upon the occurrence of a predefined credit event. Such credit events generally

include bankruptcy of the

referenced credit entity and failure to pay under the obligation, as well as acceleration of indebtedness and payment repudiation or moratorium. For credit derivatives based on a portfolio of referenced credits or credit indices, the Corporation may not be required to make payment until a specified amount of loss has occurredand/or may only be required to make payment up to a specified amount.


Bank of America 2009133

158     Bank of America 2010


Credit derivative instruments in which the Corporation is the seller of credit protection and their expiration at December 31, 20092010 and 20082009 are summarized below. These instruments are classified as investment and non-investmentnon-

investment grade based on the credit quality of the underlying

reference obligation. The Corporation considers ratings of BBB- orBBB-or higher as meeting the definition of investment grade.investment-grade. Non-investment grade includes non-rated credit derivative instruments.


  December 31, 2010 
  Carrying Value 
  Less than
  One to
  Three to
  Over Five
    
(Dollars in millions) One Year  Three Years  Five Years  Years  Total 
Credit default swaps:                    
Investment grade $158  $2,607  $7,331  $14,880  $24,976 
Non-investment grade  598   6,630   7,854   23,106   38,188 
                     
Total  756   9,237   15,185   37,986   63,164 
                     
Total return swaps/other:                    
Investment grade        38   60   98 
Non-investment grade  1   2   2   415   420 
                     
Total  1   2   40   475   518 
                     
Total credit derivatives
 $757  $9,239  $15,225  $38,461  $63,682 
                     
Credit-related notes:(1)
                    
Investment grade     136      949   1,085 
Non-investment grade  9   33   174   2,315   2,531 
                     
Total credit-related notes
 $9  $169  $174  $3,264  $3,616 


  Maximum Payout/Notional 
Credit default swaps:                    
Investment grade $133,691  $466,565  $475,715  $275,434  $1,351,405 
Non-investment grade  84,851   314,422   178,880   203,930   782,083 
                     
Total  218,542   780,987   654,595   479,364   2,133,488 
                     
Total return swaps/other:                    
Investment grade     10   15,413   4,012   19,435 
Non-investment grade  113   78   951   1,897   3,039 
                     
Total  113   88   16,364   5,909   22,474 
                     
Total credit derivatives
 $218,655  $781,075  $670,959  $485,273  $2,155,962 
                     
                     
  December 31, 2009 
  Carrying Value 
  Less than
  One to
  Three to
  Over Five
    
(Dollars in millions) One Year  Three Years  Five Years  Years  Total 
Credit default swaps:                    
Investment grade $454  $5,795  $5,831  $24,586  $36,666 
Non-investment grade  1,342   14,012   16,081   30,274   61,709 
                     
Total  1,796   19,807   21,912   54,860   98,375 
                     
Total return swaps/other:                    
Investment grade  1   20   5   540   566 
Non-investment grade     194   3   291   488 
                     
Total  1   214   8   831   1,054 
                     
Total credit derivatives
 $1,797  $20,021  $21,920  $55,691  $99,429 


  Maximum Payout/Notional 
Credit default swaps:                    
Investment grade $147,501  $411,258  $596,103  $335,526  $1,490,388 
Non-investment grade  123,907   417,834   399,896   356,735   1,298,372 
                     
Total  271,408   829,092   995,999   692,261   2,788,760 
                     
Total return swaps/other:                    
Investment grade  31   60   1,081   8,087   9,259 
Non-investment grade  2,035   1,280   2,183   18,352   23,850 
                     
Total  2,066   1,340   3,264   26,439   33,109 
                     
Total credit derivatives
 $273,474  $830,432  $999,263  $718,700  $2,821,869 
                     
(1)Maximum payout/notional for credit-related notes is the same as these amounts.
Bank of America 2010     159


  December 31, 2009
  Carrying Value
(Dollars in millions) Less than
One Year
    

One to

Three
Years

    Three to
Five Years
    

Over

Five Years

    Total

Credit default swaps:


Investment grade

 $454    $5,795    $5,831    $24,586    $36,666

Non-investment grade

  1,342     14,012     16,081     30,274     61,709

Total

  1,796     19,807     21,912     54,860     98,375

Total return swaps/other:


Investment grade

  1     20     5     540     566

Non-investment grade

       194     3     291     488

Total

  1     214     8     831     1,054

Total credit derivatives

 $1,797    $20,021    $21,920    $55,691    $99,429
  Maximum Payout/Notional

Credit default swaps:


Investment grade

 $147,501    $411,258    $596,103    $335,526    $1,490,388

Non-investment grade

  123,907     417,834     399,896     356,735     1,298,372

Total

  271,408     829,092     995,999     692,261     2,788,760

Total return swaps/other:


Investment grade

  31     60     1,081     8,087     9,259

Non-investment grade

  2,035     1,280     2,183     18,352     23,850

Total

  2,066     1,340     3,264     26,439     33,109

Total credit derivatives

 $273,474    $830,432    $999,263    $718,700    $2,821,869
  December 31, 2008
  Carrying Value
(Dollars in millions) Less than
One Year
    One to
Three
Years
    Three to
Five Years
    Over Five
Years
    Total

Credit default swaps:


Investment grade

 $1,039    $13,062    $32,594    $29,153    $75,848

Non-investment grade

  1,483     9,222     19,243     13,012     42,960

Total

  2,522     22,284     51,837     42,165     118,808

Total return swaps/other:


Non-investment grade

  36     8          13     57

Total credit derivatives

 $2,558    $22,292    $51,837    $42,178    $118,865
  Maximum Payout/Notional

Credit default swaps:


Investment grade

 $49,535    $169,508    $395,768    $187,075    $801,886

Non-investment grade

  17,217     48,829     89,650     42,452     198,148

Total

  66,752     218,337     485,418     229,527     1,000,034

Total return swaps/other:


Non-investment grade

  1,178     628     37     4,360     6,203

Total credit derivatives

 $67,930    $218,965    $485,455    $233,887    $1,006,237

The notional amount represents the maximum amount payable by the Corporation for most credit derivatives. However, the Corporation does not solely monitor its exposure to credit derivatives based on notional amount because this measure does not take into consideration the probability of occurrence. As such, the notional amount is not a reliable indicator of the Corporation’s exposure to these contracts. Instead, a risk framework is used to define risk tolerances and establish limits to help ensure that certain credit risk-related losses occur within acceptable, predefined limits.

The Corporation economically hedges its market risk exposure to credit derivatives by entering into a variety of offsetting derivative contracts and security positions. For example, in certain instances, the Corporation may purchase credit protection with identical underlying referenced names to offset its exposure. The carrying valueamount and notional amount of written credit derivatives for which the Corporation held purchased credit derivatives with identical underlying referenced names and terms at December 31, 20092010 was $43.7 billion and $1.4 trillion compared to $79.4 billion and $2.3 trillion compared to $92.4 billion and $819.4 billion at December 31, 2008.

2009.

134Bank of America 2009


Credit-related notes in the table on page 159 include investments in securities issued by CDOs, CLOs and credit-linked note vehicles. These instruments are classified as trading securities. The carrying value of these instruments equals the Corporation’s maximum exposure to loss. The Corporation is not obligated to make any payments to the entities under the terms of the securities owned. The Corporation discloses internal categorizations (i.e., investment-grade, non-investment grade) consistent with how risk is managed for these instruments.

Credit Risk Management of Derivatives andCredit-related Contingent Features

The Corporation executes the majority of its derivative contracts in theover-the-counter market with large, international financial institutions, including broker/dealers and, to a lesser degree, with a variety of non-financial companies. Substantially all of the derivative transactions are executed on a daily margin basis. Therefore, events such as a credit ratings downgrade (depending on the ultimate rating level) or a breach of credit covenants would typically require an increase in the amount of collateral required of the counterparty, where applicable,and/or allow the Corporation to take additional protective measures such as early termination of all trades. Further, as discussed above,previously described on page 153, the Corporation enters into legally enforceable master netting agreements which reduce risk by permitting the closeout and netting of transactions with the same counterparty upon the occurrence of certain events.

Substantially all of the Corporation’s derivative contracts contain credit risk-related contingent features, primarily in the form of International Swaps and Derivatives Association, Inc. (ISDA) master agreements that enhance the creditworthiness of these instruments as compared to other obligations of the

respective counterparty with whom the Corporation has transacted (e.g., other debt or equity). These contingent features may be for the benefit of the Corporation as well as its counterparties with respect to changes in the Corporation’s creditworthiness. At December 31, 2010 and 2009, the Corporation receivedheld cash and securities collateral of $74.6$76.0 billion and $67.7 billion, and posted cash and securities collateral of $69.1$61.2 billion and $62.2 billion in the normal course of business under derivative agreements.

In connection with certainover-the-counter derivatives derivative contracts and other trading agreements, the Corporation could be required to provide additional collateral or to terminate transactions with certain counterparties in the event of a downgrade of the senior debt ratings of Bank of America Corporation and its subsidiaries. The amount of additional collateral required depends on the contract and is usually a fixed incremental

amountand/or the market value of the exposure. At December 31, 2010 and 2009, the amount of additional collateral and termination payments that would behave been required for such derivatives and trading agreements was approximately $1.2 billion and $2.1 billion if the long-term credit rating of Bank of Americathe Corporation and its subsidiaries was incrementally downgraded by one level by all ratings agencies. AAt December 31, 2010 and 2009, a second incremental one level downgrade by the ratings agencies would requirehave required approximately $1.1 billion and $1.2 billion in additional collateral.

collateral and termination payments.

The Corporation records counterparty credit risk valuation adjustments on derivative assets in order to properly reflect the credit quality of the counterparty. These adjustments are necessary as the market quotes on derivatives do not fully reflect the credit risk of the counterparties to the derivative assets. The Corporation considers collateral and legally enforceable master netting agreements that mitigate its credit exposure to each counterparty in determining the counterparty credit risk valuation adjustment. All or a portion of these counterparty credit risk valuation adjustments can be reversed or otherwise adjusted in future periods due to changes in the value of the derivative contract, collateral and creditworthiness of the counterparty. During 2010 and 2009, credit valuation gains (losses) of $1.8$731 million and $3.1 billion ($(8) million and $1.7 billion, net of hedges) for counterparty credit risk related to derivative assets and during 2008, losses of $3.2 billion were recognized in trading account profits (losses). At December 31, 20092010 and 2008,2009, the cumulative counterparty credit risk valuation adjustment that was included inreduced the derivative assetassets balance was $7.6by $6.8 billion and $4.0$7.9 billion.

In addition, the fair value of the Corporation’s or its subsidiaries’ derivative liabilities is adjusted to reflect the impact of the Corporation’s credit quality. During 2010 and 2009, credit valuation lossesgains (losses) of $801$331 million and during 2008, gains$(662) million ($262 million and $(662) million, net of $364 millionhedges) were recognized in trading account profits (losses) for changes in the Corporation’s or its subsidiaries’ credit risk. At December 31, 20092010 and 2008,2009, the Corporation’s cumulative credit risk valuation adjustment that was included inreduced the derivative liabilities balance was $608 millionby $1.1 billion and $573$732 million.


Bank of America 2009135

160     Bank of America 2010


NOTE 5 Securities

The table below presents the amortized cost, gross unrealized gains and losses in accumulated OCI, and fair value of AFS debt and marketable equity securities at December 31, 20092010 and 2008 were:

(Dollars in millions) Amortized
Cost
    Gross
Unrealized
Gains
    Gross
Unrealized
Losses
   Fair Value

Available-for-sale debt securities, December 31, 2009


U.S. Treasury and agency securities

 $22,648    $414    $(37  $23,025

Mortgage-backed securities:


Agency

  164,677     2,415     (846   166,246

Agency-collateralized mortgage obligations

  25,330     464     (13   25,781

Non-agency residential(1)

  37,940     1,191     (4,028   35,103

Non-agency commercial

  6,354     671     (116   6,909

Foreign securities

  4,732     61     (896   3,897

Corporate bonds

  6,136     182     (126   6,192

Other taxable securities (2)

  19,475     245     (478   19,242

Total taxable securities

  287,292     5,643     (6,540   286,395

Tax-exempt securities

  15,334     115     (243   15,206

Total available-for-sale debt securities

 $302,626    $5,758    $(6,783  $301,601

Available-for-sale marketable equity securities(3)

 $6,020    $3,895    $(507  $9,408

Available-for-sale debt securities, December 31, 2008


U.S. Treasury and agency securities

 $4,540    $121    $(14  $4,647

Mortgage-backed securities:


Agency

  191,913     3,064     (146   194,831

Non-agency residential

  40,139     860     (8,825   32,174

Non-agency commercial

  3,085          (512   2,573

Foreign securities

  5,675     6     (678   5,003

Corporate bonds

  5,560     31     (1,022   4,569

Other taxable securities (2)

  24,832     11     (1,300   23,543

Total taxable securities

  275,744     4,093     (12,497   267,340

Tax-exempt securities

  10,501     44     (981   9,564

Total available-for-sale debt securities

 $286,245    $4,137    $(13,478  $276,904

Available-for-sale marketable equity securities(3)

 $18,892    $7,717    $(1,537  $25,072
2009.
                 
     Gross
  Gross
    
  Amortized
  Unrealized
  Unrealized
    
(Dollars in millions) Cost  Gains  Losses  Fair Value 
Available-for-sale debt securities, December 31, 2010
                
U.S. Treasury and agency securities $49,413  $604  $(912) $49,105 
Mortgage-backed securities:                
Agency  190,409   3,048   (2,240)  191,217 
Agency collateralized mortgage obligations  36,639   401   (23)  37,017 
Non-agency residential (1)
  23,458   588   (929)  23,117 
Non-agency commercial  6,167   686   (1)  6,852 
Non-U.S. securities
  4,054   92   (7)  4,139 
Corporate bonds  5,157   144   (10)  5,291 
Other taxable securities, substantially all ABS  15,514   39   (161)  15,392 
                 
Total taxable securities  330,811   5,602   (4,283)  332,130 
Tax-exempt securities  5,687   32   (222)  5,497 
                 
Totalavailable-for-sale debt securities
 $336,498  $5,634  $(4,505) $337,627 
                 
Held-to-maturity debt securities
  427         427 
                 
Total debt securities
 $336,925  $5,634  $(4,505) $338,054 
                 
Available-for-sale marketable equity securities (2)
 $8,650  $10,628  $(13) $19,265 
                 
Available-for-sale debt securities, December 31, 2009
                
U.S. Treasury and agency securities $22,648  $414  $(37) $23,025 
Mortgage-backed securities:                
Agency  164,677   2,415   (846)  166,246 
Agency collateralized mortgage obligations  25,330   464   (13)  25,781 
Non-agency residential (1)
  37,940   1,191   (4,028)  35,103 
Non-agency commercial  6,354   671   (116)  6,909 
Non-U.S. securities
  4,732   61   (896)  3,897 
Corporate bonds  6,136   182   (126)  6,192 
Other taxable securities, substantially all ABS  25,469   260   (478)  25,251 
                 
Total taxable securities  293,286   5,658   (6,540)  292,404 
Tax-exempt securities  9,340   100   (243)  9,197 
                 
Totalavailable-for-sale debt securities
 $302,626  $5,758  $(6,783) $301,601 
                 
Held-to-maturity debt securities
  9,800      (100)  9,700 
                 
Total debt securities
 $312,426  $5,758  $(6,883) $311,301 
                 
Available-for-sale marketable equity securities (2)
 $6,020  $3,895  $(507) $9,408 
                 
(1)

Includes

At December 31, 2010, includes approximately 90 percent prime bonds, eight percent Alt-A bonds and two percent subprime bonds. At December 31, 2009, includes approximately 85 percent of prime bonds, 10 percent of Alt-A bonds and five percent of subprime bonds.

(2)

Includes substantially all ABS.

(3)

RecordedClassified in other assets on the Corporation’s Consolidated Balance Sheet.

At December 31, 2010, the accumulated net unrealized gains on AFS debt securities included in accumulated OCI were $714 million, net of the related income tax expense of $415 million. At December 31, 2010 and 2009, the Corporation had nonperforming AFS debt securities of $44 million and $467 million.
At December 31, 2010, both the amortized cost and fair value of HTM debt securities were $427 million. At December 31, 2009, the amortized cost and fair value of HTM debt securities waswere $9.8 billion and $9.7 billion, which includesincluded ABS that were issued by the Corporation’s credit card securitization trust and retained by the Corporation with an amortized cost of $6.6 billion

and a fair value of $6.4 billion. At December 31, 2008, bothAs a result of the adoption of new consolidation guidance, the Corporation consolidated the credit card securitization trusts on January 1, 2010 and the ABS were eliminated in consolidation and the related consumer credit card loans were included in loans and leases on the Corporation’s Consolidated Balance Sheet. Additionally, during the three months ended June 30, 2010, $2.9 billion of debt securities held in consolidated commercial paper conduits was reclassified from HTM to AFS as a result of new regulatory capital requirements related to asset-backed commercial paper conduits.


Bank of America 2010     161


The Corporation recorded OTTI losses on AFS debt securities as presented in the table below in 2010 and 2009. Upon initial impairment of a security, total OTTI losses represent the excess of the amortized cost andover the fair value. For subsequent impairments of the same security, total OTTI losses represent additional declines in fair value subsequent to the previously recorded OTTI loss(es), if applicable. Unrealized OTTI losses recognized in accumulated OCI represent the non-credit component of HTM OTTI losses on AFS

debt securities were $685 million. The accumulated net unrealized gains (losses)securities. Net impairment losses recognized in earnings represent the credit component of OTTI losses on AFS debt securities. In 2010, for certain securities, the Corporation recognized credit losses in excess of unrealized losses in accumulated OCI. In these instances, a portion of the credit losses recognized in earnings has been offset by an unrealized gain. Balances in the table exclude $51 million and marketable equity securities included$582 million of gross gains recorded in accumulated OCI were $(628) millionrelated to these securities for 2010 and $2.1 billion, net of the related income tax expense (benefit) of $(397) million2009.


  2010 
  Non-agency
  Non-agency
        Other
    
  Residential
  Commercial
  Non-U.S.
  Corporate
  Taxable
    
(Dollars in millions) MBS  MBS  Securities  Bonds  Securities  Total 
Total OTTI losses (unrealized and realized) $(1,305) $(19) $(276) $(6) $(568) $(2,174)
Unrealized OTTI losses recognized in accumulated OCI  817   15   16   2   357   1,207 
                         
Net impairment losses recognized in earnings
 $(488) $(4) $(260) $(4) $(211) $(967)


  2009 
Total OTTI losses (unrealized and realized) $(2,240) $(6) $(360) $(87) $(815) $(3,508)
Unrealized OTTI losses recognized in accumulated OCI  672               672 
                         
Net impairment losses recognized in earnings
 $(1,568) $(6) $(360) $(87) $(815) $(2,836)
                         

The table below presents activity for 2010 and $1.3 billion. At December 31, 2009 and 2008, the Corporation had nonperforming AFS debt securities of $467 million and $291 million.

During 2009, the Corporation transferred $5.6 billion of auction rate securities (ARS) from trading account assets to AFS debt securities due to the Corporation’s decision to hold these securities. During 2008, the Corporation reclassified $12.6 billion of AFS debt securities to trading account assets in connection with the Countrywide acquisition as the Corporation realigned its AFS portfolio. Further, the Corporation transferred $1.7 billion of leveraged lending bonds from trading account assets to AFS debt securities due to the Corporation’s decision to hold these bonds.

During 2009, the Corporation recorded other-than-temporary impairment losses on AFS and HTM debt securities as follows:


  2009 
(Dollars in millions) Non-agency
Residential
MBS
   Non-agency
Commercial
MBS
   Foreign
Securities
   Corporate
Bonds
   Other Taxable
Securities (1)
   Total 

Total other-than-temporary impairment losses (unrealized
and realized)

 $(2,240  $(6  $(360  $(87  $(815  $(3,508

Unrealized other-than-temporary impairment losses
recognized in OCI(2)

  672                         672  

Net impairment losses recognized in earnings(3)

 $(1,568  $(6  $(360  $(87  $(815  $(2,836
(1)

Includes $31 million of other-than-temporary impairment losses on HTM debt securities.

(2)

Represents the noncredit component of other-than-temporary impairment losses on AFS debt securities. For 2009, for certain securities, the Corporation recognized credit losses in excess of unrealized losses in OCI. In these instances, a portion of the credit losses recognized in earnings has been offset by an unrealized gain. Balances above exclude $582 million of gross gains recorded in OCI related to these securities for 2009.

(3)

Represents the credit component of other-than-temporary impairment losses on AFS and HTM debt securities.

136Bank of America 2009


Activity related to the credit component recognized in earnings on debt securities held by the Corporation for which a portion of the other-than-temporary impairmentOTTI loss remains in accumulated OCI. At December 31, 2010, those debt securities with OTTI for which a portion of the OTTI loss remains in accumulated OCI for 2009 is as follows:

(Dollars in millions) 2009

Balance, January 1, 2009

 $

Credit component of other-than-temporary impairment not reclassified to OCI in connection with the cumulative-effect transition adjustment (1)

  22

Additions for the credit component on debt securities on which other-than temporary impairment was not previously recognized(2)

  420

Balance, December 31, 2009

 $442
primarily consisted of non-agency residential mortgage-backed securities (RMBS) and CDOs.
         
(Dollars in millions) 2010  2009 
Balance, January 1
 $442  $ 
Credit component ofother-than-temporary impairment not reclassified to accumulated OCI in connection with the cumulative effect transition adjustment (1)
     22 
Additions for the credit component on debt securities on whichother-than-temporary impairment losses were not previously recognized (2)
  207   420 
Additions for the credit component on debt securities on whichother-than-temporary impairment losses were previously recognized (2)
  406    
         
Balance, December 31
 $1,055  $442 
         
(1)

As of

On January 1, 2009, the Corporation had securities with $134 million of other-than-temporary impairmentOTTI previously recognized in earnings of which $22 million represented the credit component and $112 million represented the noncreditnon-credit component which was reclassified to accumulated OCI through a cumulative-effectcumulative effect transition adjustment.

(2)

During

In 2010 and 2009, the Corporation recognized $354 million and $2.4 billion of other-than-temporary impairmentOTTI losses on debt securities inon which no portion of other-than-temporary impairmentOTTI loss remained in accumulated OCI. Other-than-temporary impairmentOTTI losses related to these securities are excluded from these amounts.

As of December 31, 2009, those debt securities with other-than-temporary impairment for which a portion of the other-than-temporary impairment loss remains in OCI consisted entirely of non-agency residential Mortgage-backed Securities (MBS).

The Corporation estimates the portion of loss attributable to credit using a discounted cash flow model. The Corporationmodel and estimates the expected cash flows of the underlying collateral using internal credit, risk, interest rate and prepayment risk models that incorporate management’s best estimate of current key assumptions such as default rates, loss severity and prepayment rates. Assumptions

used can vary widely from loan to loan and are influenced by such factors as loan interest rate, geographical location of the borrower, borrower characteristics and collateral type. The Corporation then uses a third partythird-party vendor to determine how the underlying collateral cash flows will be distributed to each security issued from the structure. Expected principal and interest cash flows on thean impaired debt security are discounted using the book yield of each individual impaired debt security.

Based on the expected cash flows derived from the applicable model, the Corporation expects to recover the unrealized losses in accumulated OCI on non-agency residential MBS. RMBS. Annual constant prepayment speed and loss severity rates are projected considering collateral characteristics such as LTV, creditworthiness of borrowers (FICO) and geographic concentrations. The weighted-average severity by collateral type was 41 percent for prime bonds, 48 percent for Alt-A bonds and 53 percent for subprime bonds. Additionally, default rates are projected by considering collateral characteristics including, but not limited to LTV, FICO and geographic concentration. Weighted-average life default rates by collateral type were 38 percent for prime bonds, 58 percent for Alt-A bonds and 62 percent for subprime bonds.
Significant assumptions used in the valuation of non-agency residential MBS were as followsRMBS at December 31, 2009.

        Range(1) 
  Weighted-
average
      10th
Percentile (2)
   90th
Percentile (2)
 

Prepayment speed(3)

 14.0   3.0  32.7

Loss severity(4)

 51.0     21.8    61.3  

Life default rate(5)

 48.4      1.1    98.7  
2010 are presented in the table below.
             
     Range(1) 
  Weighted-average  10th Percentile(2)  90th Percentile(2) 
Prepayment speed  12.6%  3.0%  27.1%
Loss severity  46.2   17.7   57.9 
Life default rate  49.1   2.2   99.1 
             
(1)

Represents the range of inputs/assumptions based upon the underlying collateral.

(2)

The value of a variable below which the indicated percentile of observations will fall.

(3)

Annual constant prepayment speed.

(4)

Loss severity rates are projected considering collateral characteristics such as LTV, creditworthiness of borrowers (FICO score) and geographic concentration. Weighted-average severity by collateral type was 47 percent for prime bonds, 52 percent for Alt-A bonds and 55 percent for subprime bonds.

(5)

Default rates are projected by considering collateral characteristics including, but not limited to LTV, FICO and geographic concentration. Weighted-average life default rate by collateral type was 36 percent for prime bonds, 56 percent for Alt-A bonds and 65 percent for subprime bonds.


Bank of America 2009137

162     Bank of America 2010


The following table below presents the current fair value and the associated gross unrealized losses on investments in securities with gross unrealized losses at December 31, 2010 and 2009, and 2008. The table also discloses

whether these securities have had gross unrealized losses for less than twelve months or for twelve months or longer.


  Less than Twelve Months   Twelve Months or Longer   Total 
(Dollars in millions) Fair
Value
    Gross
Unrealized
Losses
   Fair
Value
    Gross
Unrealized
Losses
   Fair Value    Gross
Unrealized
Losses
 

Temporarily-impaired available-for-sale debt securities at December 31, 2009


U.S. Treasury and agency securities

 $4,655    $(37  $    $    $4,655    $(37

Mortgage-backed securities:


Agency

  53,979     (817   740     (29   54,719     (846

Agency-collateralized mortgage obligations

  965     (10   747     (3   1,712     (13

Non-agency residential

  6,907     (557   13,613     (3,370   20,520     (3,927

Non-agency commercial

  1,263     (35   1,711     (81   2,974     (116

Foreign securities

  169     (27   3,355     (869   3,524     (896

Corporate bonds

  1,157     (71   294     (55   1,451     (126

Other taxable securities

  3,779     (70   932     (408   4,711     (478

Total taxable securities

  72,874     (1,624   21,392     (4,815   94,266     (6,439

Tax-exempt securities

  4,716     (93   1,989     (150   6,705     (243

Total temporarily-impaired available-for-sale
debt securities

  77,590     (1,717   23,381     (4,965   100,971     (6,682

Temporarily-impaired available-for-sale marketable
equity securities

  338     (113   1,554     (394   1,892     (507

Total temporarily-impaired available-for-sale securities

  77,928     (1,830   24,935     (5,359   102,863     (7,189

Other-than-temporarily impaired available-for-sale
debt securities (1)


Mortgage-backed securities:


Non-agency residential

  51     (17   1,076     (84   1,127     (101

Total temporarily-impaired and other-than-temporarily impaired available-for-sale securities

 $77,979    $(1,847  $26,011    $(5,443  $103,990    $(7,290

Temporarily-impaired available-for-sale debt securities at December 31, 2008


U.S. Treasury and agency securities

 $306    $(14  $    $    $306    $(14

Mortgage-backed securities:


Agency

  2,282     (12   7,508     (134   9,790     (146

Non-agency residential

  19,853     (6,750   1,783     (2,075   21,636     (8,825

Non-agency commercial

  215     (26   2,358     (486   2,573     (512

Foreign securities

  3,491     (562   1,126     (116   4,617     (678

Corporate bonds

  2,573     (934   666     (88   3,239     (1,022

Other taxable securities

  12,870     (1,077   501     (223   13,371     (1,300

Total taxable securities

  41,590     (9,375   13,942     (3,122   55,532     (12,497

Tax-exempt securities

  6,386     (682   1,540     (299   7,926     (981

Total temporarily-impaired available-for-sale
debt securities

  47,976     (10,057   15,482     (3,421   63,458     (13,478

Temporarily-impaired available-for-sale marketable
equity securities

  3,431     (499   1,555     (1,038   4,986     (1,537

Total temporarily-impaired available-for-sale securities

 $51,407    $(10,556  $17,037    $(4,459  $68,444    $(15,015
                         
  Less than Twelve Months  Twelve Months or Longer  Total 
     Gross
     Gross
     Gross
 
     Unrealized
     Unrealized
     Unrealized
 
(Dollars in millions) Fair Value  Losses  Fair Value  Losses  Fair Value  Losses 
Temporarily-impairedavailable-for-sale debt securities at December 31, 2010
                        
U.S. Treasury and agency securities $27,384  $(763) $2,382  $(149) $29,766  $(912)
Mortgage-backed securities:                        
Agency  85,517   (2,240)        85,517   (2,240)
Agency collateralized mortgage obligations  3,220   (23)        3,220   (23)
Non-agency residential  6,385   (205)  2,245   (274)  8,630   (479)
Non-agency commercial  47   (1)        47   (1)
Non-U.S. securities
        70   (7)  70   (7)
Corporate bonds  465   (9)  22   (1)  487   (10)
Other taxable securities  3,414   (38)  46   (7)  3,460   (45)
                         
Total taxable securities  126,432   (3,279)  4,765   (438)  131,197   (3,717)
Tax-exempt securities  2,325   (95)  568   (119)  2,893   (214)
                         
Total temporarily-impairedavailable-for-sale debt securities
  128,757   (3,374)  5,333   (557)  134,090   (3,931)
Temporarily-impairedavailable-for-sale marketable equity securities
  7   (2)  19   (11)  26   (13)
                         
Total temporarily-impairedavailable-for-sale securities
  128,764   (3,376)  5,352   (568)  134,116   (3,944)
                         
Other-than-temporarily impairedavailable-for-sale debt securities (1)
                        
Mortgage-backed securities:                        
Non-agency residential  128   (11)  530   (439)  658   (450)
Other taxable securities        223   (116)  223   (116)
Tax-exempt securities  68   (8)        68   (8)
                         
Total temporarily-impaired andother-than-temporarily impairedavailable-for-sale securities(2)
 $128,960  $(3,395) $6,105  $(1,123) $135,065  $(4,518)
                         
Temporarily-impairedavailable-for-sale debt securities at December 31, 2009
                        
U.S. Treasury and agency securities $4,655  $(37) $  $  $4,655  $(37)
Mortgage-backed securities:                        
Agency  53,979   (817)  740   (29)  54,719   (846)
Agency collateralized mortgage obligations  965   (10)  747   (3)  1,712   (13)
Non-agency residential  6,907   (557)  13,613   (3,370)  20,520   (3,927)
Non-agency commercial  1,263   (35)  1,711   (81)  2,974   (116)
Non-U.S. securities
  169   (27)  3,355   (869)  3,524   (896)
Corporate bonds  1,157   (71)  294   (55)  1,451   (126)
Other taxable securities  3,779   (70)  932   (408)  4,711   (478)
                         
Total taxable securities  72,874   (1,624)  21,392   (4,815)  94,266   (6,439)
Tax-exempt securities  4,716   (93)  1,989   (150)  6,705   (243)
                         
Total temporarily-impairedavailable-for-sale debt securities
  77,590   (1,717)  23,381   (4,965)  100,971   (6,682)
Temporarily-impairedavailable-for-sale marketable equity securities
  338   (113)  1,554   (394)  1,892   (507)
                         
Total temporarily-impairedavailable-for-sale securities
  77,928   (1,830)  24,935   (5,359)  102,863   (7,189)
                         
Other-than-temporarily impairedavailable-for-sale debt securities (1)
                        
Mortgage-backed securities:                        
Non-agency residential  51   (17)  1,076   (84)  1,127   (101)
                         
Total temporarily-impaired andother-than-temporarily impairedavailable-for-sale securities(2)
 $77,979  $(1,847) $26,011  $(5,443) $103,990  $(7,290)
                         
(1)

Includesother-than-temporarily impaired available-for-saleAFS debt securities inon which a portion of the other-than-temporary impairmentOTTI loss remains in OCI.

(2)At December 31, 2010, the amortized cost of approximately 8,500 AFS securities exceeded their fair value by $4.5 billion. At December 31, 2009, the amortized cost of approximately 12,000 AFS securities exceeded their fair value by $7.3 billion.

The impairment of AFS debt and marketable equity securities is based on a variety of factors, includingCorporation considers the length of time and extent to which the marketfair value of AFS debt securities has been less than cost to conclude that such securities were notother-than-temporarily impaired. The Corporation also considers other factors such as the financial condition of the issuer of the security including credit ratings and specific events affecting the Corporation’s intent and ability to hold the security to recovery.

At December 31, 2009, the amortized cost of approximately 12,000 AFS securities exceeded their fair value by $7.3 billion. Included in the $7.3 billion of gross unrealized losses on AFS securities at December 31, 2009, was $1.9 billion of gross unrealized losses that have existed for less than twelve months and $5.4 billion of gross unrealized losses that have existed for a period of twelve months or longer. Of the gross unreal - -

ized losses existing for twelve months or longer, $3.6 billion, or 66 percent,operations of the gross unrealized losses are related to approximately 500 MBS primarily due to continued deterioration in collateralized mortgage obligation values driven by illiquidity inissuer, underlying assets that collateralize the markets. In addition, ofdebt security, and other

industry and macroeconomic conditions. As the gross unrealized losses existing for twelve months or longer, $394 million, or seven percent, is related to approximately 800 AFS marketable equity securities primarily due to the overall decline in the market during 2008. The Corporation has no intent to sell these securities with unrealized losses and it is not more-likely-than-not that the Corporation will be required to sell these securities before recovery of amortized cost.

cost, the Corporation has concluded that the securities are not impaired on another-than-temporary basis.

138Bank of America 2009

Bank of America 2010     163


The amortized cost and fair value of the Corporation’s investment in AFS debt securities from the Federal National Mortgage AssociationFannie Mae (FNMA), the Government National Mortgage Association (GNMA), Freddie Mac (FHLMC) and U.S. Treasury securities where the

Federal Home Loan Mortgage Corporation (FHLMC) that investment exceeded 10 percent of consolidated shareholders’ equity at December 31, 2010 and 2009 and 2008 were:

are presented in the table below.

                 
  December 31 
  2010  2009 
  Amortized
     Amortized
    
(Dollars in millions) Cost  Fair Value  Cost  Fair Value 
Fannie Mae $123,662  $123,107  $100,321  $101,096 
Government National Mortgage Association  72,863   74,305   60,610   61,121 
Freddie Mac  30,523   30,822   29,076   29,810 
U.S. Treasury securities(1)
  46,576   46,081   19,315   19,516 
                 
(1)Investments in U.S. Treasury securities did not exceed 10 percent of consolidated shareholders’ equity at December 31, 2009.

  December 31
  2009         2008
(Dollars in millions) Amortized
Cost
    Fair Value          Amortized
Cost
    Fair Value

Federal National Mortgage Association

 $100,321    $101,096        $102,908    $104,126

Government National Mortgage Association

  60,610     61,121         43,713     44,627

Federal Home Loan Mortgage Corporation

  29,076     29,810          46,114     46,859

Securities are pledged or assigned to secure borrowed funds, government and trust deposits and for other purposes. The carrying value of pledged securities was $122.7 billion and $158.9 billion at December 31, 2009 and 2008.

The expected maturity distribution of the Corporation’s MBS and the contractual maturity distribution of the Corporation’s other AFS debt secu - -

rities,securities, and the yields ofon the Corporation’s AFS debt securities portfolio at

December 31, 20092010 are summarized in the following table.table below. Actual maturities may differ from the contractual or expected maturities since borrowers may have the right to prepay obligations with or without prepayment penalties.


  December 31, 2009 
  Due in One
Year or Less
     Due after One Year
through Five Years
     Due after Five Years
through Ten Years
     Due after Ten Years     Total 
(Dollars in millions) Amount Yield (1)      Amount Yield (1)      Amount Yield (1)      Amount Yield (1)      Amount  Yield (1) 

Fair value of available-for-sale debt securities


U.S. Treasury and agency securities

 $231 1.94   $1,888 3.31   $2,774 4.78   $18,132 4.73   $23,025  4.59

Mortgage-backed securities:


Agency

  28 5.48      78,579 4.81      33,351 4.66      54,288 4.52      166,246  4.69  

Agency-collateralized mortgage obligations

  495 3.83      12,360 2.39      12,778 2.53      148 0.98      25,781  2.48  

Non-agency residential

  757 8.58      18,068 9.34      4,790 7.61      11,488 4.09      35,103  7.38  

Non-agency commercial

  132 4.22      3,729 5.91      2,779 10.89      269 6.17      6,909  7.63  

Foreign securities

  105 3.03      1,828 6.33      96 5.60      1,868 3.21      3,897  4.53  

Corporate bonds

  592 1.22      3,311 3.68      1,662 7.47      627 2.59      6,192  4.31  

Other taxable securities

  12,297 1.17      5,921 3.92      203 7.19      821 4.00      19,242  2.24  

Total taxable securities

  14,637 1.82      125,684 5.24      58,433 4.81      87,641 4.45      286,395  4.73  

Tax-exempt securities(2)

  6,413 0.28      1,772 6.38      3,450 6.39      3,571 5.29      15,206  3.56  

Total available-for-sale debt securities

 $21,050 1.35     $127,456 5.25     $61,883 4.89     $91,212 4.48     $301,601  4.67  

Amortized cost of available-for-sale debt securities

 $21,271       $127,395       $61,103       $92,857       $302,626    

                                         
  December 31, 2010 
  Due in One
  Due after One Year
  Due after Five Years
             
  Year or Less  through Five Years  through Ten Years  Due after Ten Years  Total 
(Dollars in millions) Amount  Yield (1)  Amount  Yield (1)  Amount  Yield (1)  Amount  Yield (1)  Amount  Yield (1) 
Amortized cost of AFS debt securities
                                        
U.S. Treasury and agency securities $643   5.00% $1,731   2.30% $12,318   3.50% $34,721   4.20% $49,413   4.00%
Mortgage-backed securities:                                        
Agency  34   4.80   88,913   4.30   70,789   3.80   30,673   3.90   190,409   4.10 
Agency-collateralized mortgage obligations  29   0.80   13,279   2.80   13,738   0.20   9,593   2.30   36,639   3.20 
Non-agency residential  178   12.50   4,241   7.40   1,746   5.60   17,293   4.20   23,458   4.90 
Non-agency commercial  439   5.20   4,960   6.30   441   9.80   327   6.70   6,167   6.50 
Non-U.S. securities
  1,852   0.80   2,076   5.40   126   3.50          4,054   5.30 
Corporate bonds  133   1.20   3,847   2.30   1,114   3.70   63   2.20   5,157   2.60 
Other taxable securities  6,129   0.90   3,875   1.20   118   11.20   5,392   3.80   15,514   2.09 
                                         
Total taxable securities  9,437   1.62   122,922   4.16   100,390   3.35   98,062   3.91   330,811   3.98 
Tax-exempt securities  193   4.10   912   4.30   1,408   3.80   3,174   4.60   5,687   4.35 
                                         
Total amortized cost of AFS debt securities
 $9,630   1.72  $123,834   4.16  $101,798   3.36  $101,236   3.93  $336,498   3.99 
                                         
Fair value of AFS debt securities
                                        
U.S. Treasury and agency securities $646      $1,769      $12,605      $34,085      $49,105     
Mortgage-backed securities:                                        
Agency  36       90,967       70,031       30,183       191,217     
Agency-collateralized mortgage obligations  22       13,402       13,920       9,673       37,017     
Non-agency residential  158       4,149       1,739       17,071       23,117     
Non-agency commercial  448       5,498       543       363       6,852     
Non-U.S. securities
  1,868       2,140       131              4,139     
Corporate bonds  136       3,929       1,162       64       5,291     
Other taxable securities  6,132       3,863       118       5,279       15,392     
                                         
Total taxable securities  9,446       125,717       100,249       96,718       332,130     
Tax-exempt securities  193       923       1,408       2,973       5,497     
                                         
Total fair value of AFS debt securities
 $9,639      $126,640      $101,657      $99,691      $337,627     
                                         
(1)

Yields are calculated based on the amortized cost of the securities.

(2)

Yields of tax-exempt securities are calculated on a fully taxable-equivalent (FTE) basis.

The components of realized gains and losses on sales of debt securities for 2010, 2009 and 2008 and 2007 were:are presented in the table below.
             
(Dollars in millions) 2010  2009  2008 
Gross gains $3,995  $5,047  $1,367 
Gross losses  (1,469)  (324)  (243)
             
Net gains on sales of debt securities
 $2,526  $4,723  $1,124 
             
Income tax expense attributable to realized net gains on sales of debt securities
 $935  $1,748  $416 
             

(Dollars in millions) 2009     2008   2007 

Gross gains

 $5,047      $1,367    $197  

Gross losses

  (324     (243   (17

Net gains on sales of debt securities

 $4,723      $1,124    $180  

The income tax expense attributable to realized net gains on

During 2010, the Corporation entered into a series of transactions in its AFS debt securities portfolio that involved securitizations as well as sales of non-agency RMBS. These transactions were initiated following a review of corporate risk objectives in light of proposed Basel regulatory capital changes and liquidity targets. During 2010, the carrying value of the non-agency RMBS portfolio was reduced $14.5 billion primarily as a result of the aforementioned sales and securitizations as well as paydowns. The Corporation recognized net losses of $922 million on the series of transactions in the AFS debt securities portfolio, and improved the overall credit quality of the remaining portfolio such that the percentage of the non-agency RMBS portfolio that is below investment-grade was $1.7 billion, $416 million and $67 million in 2009, 2008 and 2007, respectively.reduced significantly.


164     Bank of America 2010


Certain Corporate and Strategic Investments

At December 31, 20092010 and 2008,2009, the Corporation owned 25.6 billion shares representing approximately 10 and 11 percent or 25.6 billion common shares and 19 percent, or 44.7 billion common shares of China Construction Bank (CCB). During 2010, the Corporation sold its rights to participate in CCB’s secondary offering resulting in a pre-tax gain of $432 million recorded in equity investment income. During 2009, the Corporation sold its initial investment of 19.1 billion common shares in CCB for a pre-tax gain of $7.3 billion. During 2010, the Corporation recorded in accumulated OCI a $6.7 billion after-tax unrealized gain on 23.6 billion shares of the Corporation’s investment in CCB, which previously had been carried at cost. These shares were accounted for at

fair valuereclassified to AFS during 2010 because the sales restrictions on these shares expire within one year (August 2011), and therefore, in accordance with applicable accounting guidance, the Corporation recorded as AFS marketable equity securities in other assets with an offset, net-of-tax,the unrealized gain in accumulated OCI. TheOCI, net of a 10 percent restriction discount. Sales restrictions on the remaining investment of 25.6two billion commonCCB shares is accounted for at cost, is recorded in other assets and is non-transferablecontinue until August 2011.2013, and these shares continue to be carried at cost. At December 31, 2009 and 2008,2010, the cost basis of theall remaining CCB investmentshares was $9.2 billion and $12.0 billion, the carrying value was $9.2 billion and $19.7 billion and the fair value was $22.0$20.8 billion. At December 31, 2009, both the cost basis and the carrying value were $9.2 billion and $24.5the fair value was $22.0 billion. Dividend income on this investment is recorded in equity investment income.income and during 2010, the Corporation recorded dividend income of $535 million from CCB. The investment is recorded in other assets. The Corporation remains a significant shareholder in CCB and intends to continue the important long-term strategic alliance with CCB originally entered into in 2005. As part of this alliance, the Corporation expects to continue to provide advice and assistance to CCB.

At December 31, 2009 and 2008,

During 2010, the Corporation owned approximatelysold various strategic investments which included the Corporation’s investment of 188.4 million and 171.3 million preferred shares and 56.5 million and 51.3 million common shares ofin Itaú Unibanco Holding S.A. (Itaú Unibanco). During 2009, the Corporation received at a dividendprice of 17.1 million preferred shares and 5.2 million common shares.$3.9 billion. The Itaú Unibanco investment iswas accounted for at fair value and recorded as AFS marketable equity securities in other assets with an offset, unrealized gains recorded,net-of-tax, in accumulated OCI. Dividend income on this investment is recorded in


Bank of America 2009139


equity investment income. At December 31, 2009 and 2008, theThe cost basis of this investment was $2.6 billion and, after transaction costs, the fair valuepre-tax gain was $5.4$1.2 billion and $2.5 billion.

At December 31, 2009 and 2008,which was recorded in equity investment income. In addition, the Corporation had asold its 24.9 percent or $2.5 billion and $2.1 billion, investmentownership interest in Grupo Financiero Santander, S.A.B. de C.V. to an affiliate of its parent company, Banco Santander, S.A., the subsidiary of Grupo Santander, S.A. Thismajority interest holder. The investment is recorded in other assets and iswas accounted for under the equity method of accounting with income beingand recorded in other assets. This sale resulted in a pre-tax loss of $428 million which was recorded in equity investment income. The Corporation also sold all of its Class B units in

MasterCard Worldwide, Inc. (MasterCard), which were acquired primarily upon MasterCard’s initial public offering and recorded in other assets. This sale resulted in a pre-tax gain of $440 million which was recorded in equity investment income. Also during the year, the Corporation sold its exposure of $2.9 billion in certain private equity funds recorded in other assets, comprised of $1.5 billion in capital and $1.4 billion in unfunded commitments resulting in a loss of $163 million which was recorded in equity investment income.
As part of the acquisition of Merrill Lynch, the Corporation acquired an economic ownership in BlackRock Inc. (BlackRock), a publicly traded investment company. AtDuring 2010, the Corporation sold 51.2 million shares consisting of 48.9 million preferred and 2.3 million common shares for net proceeds of $8.3 billion resulting in a pre-tax gain of $91 million, lowering its ownership to 13.6 million preferred shares, or 7 percent. The carrying value of this investment at December 31, 2010 and 2009 was $2.2 billion and $10.0 billion and the carryingfair value was $10.0$2.6 billion representing approximately a 34 percent economic ownershipand $15.0 billion. Following the sale, the Corporation’s remaining interest in BlackRock. Thisis held at cost due to restrictions that affect the marketability of the preferred shares. The investment is recorded in other assets and is accounted for using the equity method of accounting with income being recorded in equity investment income.assets. During 2009, BlackRock completed its purchase of Barclays Global Investors, an asset management business, from Barclays PLC which had the effect of diluting the Corporation’s ownership interest in BlackRock from approximately 50 percent to approximately 34 percent and, for accounting purposes, was treated as a sale of a portion of the Corporation’s ownership interest. As a result, upon the closing of this transaction, the Corporation recorded an adjustment to its investment in

BlackRock resulting in a pre-tax gain of $1.1 billion. The summarized earnings information for BlackRock,billion which represents 100 percent of BlackRock, includes revenues of $4.7 billion, operating income and income before income taxes of $1.3 billion, and net income of $875 millionwas recorded in 2009.

On June 26, 2009, the Corporation entered intoequity investment income.

In 2010, a third-party investor in a joint venture agreementin which the Corporation held a 46.5 percent ownership interest sold its interest to the joint venture, resulting in an increase in the Corporation’s ownership interest to 49 percent. The joint venture was formed in 2009 with First Data Corporation (First Data) creating Banc of America Merchant Services, LLC. Under the terms of the agreement, the Corporation contributed its merchant processing business to the joint venture and First Data contributed certain merchant processing contracts and personnel resources. TheIn 2009, the Corporation recorded in other income a pre-tax gain of $3.8 billion related to this transaction. The Corporation owns approximately 46.5 percent of this joint venture, 48.5 percent is owned by First Data, with the remaining stake held by a third party investor. The third party investor has the right to put their interest to the joint venture which would have the effect of increasing the Corporation’s ownership interest to 49 percent. The investment in the joint venture, which was initially recorded at a fair value of $4.7 billion, is being accounted for under the equity method of accounting with income being recorded in equity investment income. The carrying value at both December 31, 2010 and 2009 was $4.7 billion.


Bank of America 2010     165


NOTE 6 Outstanding Loans and Leases

Outstanding

The table below presents total outstanding loans and leases at December 31, 2010 and 2009 and 2008 were:

  December 31
(Dollars in millions) 2009    2008

Consumer


Residential mortgage(1)

 $242,129    $248,063

Home equity

  149,126     152,483

Discontinued real estate(2)

  14,854     19,981

Credit card – domestic

  49,453     64,128

Credit card – foreign

  21,656     17,146

Direct/Indirect consumer(3)

  97,236     83,436

Other consumer(4)

  3,110     3,442

Total consumer

  577,564     588,679

Commercial


Commercial – domestic(5)

  198,903     219,233

Commercial real estate(6)

  69,447     64,701

Commercial lease financing

  22,199     22,400

Commercial – foreign

  27,079     31,020

Total commercial loans

  317,628     337,354

Commercial loans measured at fair value(7)

  4,936     5,413

Total commercial

  322,564     342,767

Total loans and leases

 $900,128    $931,446
an age analysis at December 31, 2010.
                                 
  December 31, 2010  December 31, 2009 
     90 Days or
  Total Past
  Total Current
  Purchased
  Loans
       
  30-89 Days
  More
  Due 30 Days
  or Less Than 30
  Credit -
  Measured at
  Total
  Total
 
(Dollars in millions) Past Due(1)  Past Due(2)  or More  Days Past Due(3)  Impaired(4)  Fair Value  Outstandings(5)  Outstandings 
Home loans
                                
Residential mortgage (6)
 $8,274  $33,240  $41,514  $205,867  $10,592      $257,973  $242,129 
Home equity  2,086   2,291   4,377   121,014   12,590       137,981   149,126 
Discontinued real estate (7)
  107   419   526   930   11,652       13,108   14,854 
Credit card and other consumer
                                
U.S. credit card  2,593   3,320   5,913   107,872          113,785   49,453 
Non-U.S. credit card
  755   599   1,354   26,111          27,465   21,656 
Direct/Indirect consumer (8)
  1,608   1,104   2,712   87,596          90,308   97,236 
Other consumer (9)
  90   50   140   2,690          2,830   3,110 
                                 
Total consumer
  15,513   41,023   56,536   552,080   34,834       643,450   577,564 
                                 
Commercial
                                
U.S. commercial  946   1,453   2,399   173,185   2       175,586   181,377 
Commercial real estate (10)
  721   3,554   4,275   44,957   161       49,393   69,447 
Commercial lease financing  118   31   149   21,793          21,942   22,199 
Non-U.S. commercial
  27   6   33   31,955   41       32,029   27,079 
U.S. small business commercial  360   438   798   13,921          14,719   17,526 
                                 
Total commercial loans  2,172   5,482   7,654   285,811   204       293,669   317,628 
Commercial loans measured at fair value (11)
                $3,321   3,321   4,936 
                                 
Total commercial
  2,172   5,482   7,654   285,811   204   3,321   296,990   322,564 
                                 
Total loans and leases
 $17,685  $46,505  $64,190  $837,891  $35,038  $3,321  $940,440  $900,128 
                                 
Percentage of outstandings
  1.88%  4.95%  6.83%  89.10%  3.72%  0.35%        
                                 
(1)

Home loans includes $2.3 billion of FHA insured loans, $818 million of nonperforming loans and $156 million of TDRs that were removed from the Countrywide PCI loan portfolio prior to the adoption of new accounting guidance effective January 1, 2010.
(2)Includes foreignHome loans includes $16.8 billion of FHA insured loans and $372 million of TDRs that were removed from the Countrywide PCI loan portfolio prior to the adoption of new accounting guidance effective January 1, 2010.
(3)Home loans includes $1.1 billion of nonperforming loans as all principal and interest are not current or are TDRs that have not demonstrated sustained repayment performance.
(4)PCI loan amounts are shown gross of the valuation allowance and exclude $1.6 billion of PCI home loans from the Merrill Lynch acquisition which are included in their appropriate aging categories.
(5)Periods subsequent to January 1, 2010 are presented in accordance with new consolidation guidance.
(6)Total outstandings includenon-U.S. residential mortgages of $90 million and $552 million at December 31, 2009 mainly from the Merrill Lynch acquisition. The Corporation did not have any material foreign residential mortgage loans prior to January 1,2010 and 2009.

(2)(7)

Includes $13.4

Total outstandings include $11.8 billion and $18.2$13.4 billion of pay option loans and $1.5$1.3 billion and $1.8$1.5 billion of subprime loans at December 31, 20092010 and 2008.2009. The Corporation no longer originates these products.

(3)(8)

Includes

Total outstandings include dealer financial services loans of $41.6$42.9 billion and $40.1$41.6 billion, consumer lending of $12.9 billion and $19.7 billion, and $28.2 billion,U.S. securities-based lending margin loans of $16.6 billion and $12.9 billion, student loans of $6.8 billion and $0, and foreign$10.8 billion,non-U.S. consumer loans of $7.8$8.0 billion and $1.8$8.0 billion, and other consumer loans of $3.1 billion and $4.2 billion at December 31, 20092010 and 2008.

2009.
(4)(9)

IncludesTotal outstandings include consumer finance loans of $1.9 billion and $2.3 billion, and $2.6 billion, and other foreignnon-U.S. consumer loans of $803 million and $709 million, and $618consumer overdrafts of $88 million and $144 million at December 31, 20092010 and 2008.2009.

(5)(10)

Includes small business commercial – domestic loans, primarily credit card related, of $17.5 billion and $19.1 billion at December 31, 2009 and 2008.

(6)

Includes domesticTotal outstandings include U.S. commercial real estate loans of $46.9 billion and $66.5 billion, and $63.7 billion and foreignnon-U.S. commercial real estate loans of $3.0$2.5 billion and $979 million$3.0 billion at December 31, 20092010 and 2008.

2009.
(7)(11)

Certain commercial loans are accounted for under the fair value option and include U.S. commercial – domestic loans of $3.0$1.6 billion and $3.5$3.0 billion,non-U.S. commercial – foreign loans of $1.9$1.7 billion and $1.7$1.9 billion, and commercial real estate loans of $90$79 million and $203$90 million at December 31, 20092010 and 2008.2009. SeeNote 2022 – Fair Value MeasurementsandNote 23 – Fair Value Optionfor additional discussion of fair value for certain financial instruments.information.

The Corporation mitigates a portion of its credit risk on the residential mortgage portfolio through the use of synthetic securitizationssecuritization vehicles. These vehicles issue long-term notes to investors, the proceeds of which are held as cash collateralized and providecollateral. The Corporation pays a premium to the vehicles to purchase mezzanine riskloss protection on a portfolio of $2.5 billion which willresidential mortgages owned by the Corporation. Cash held in the vehicles is used to reimburse the Corporation in the event that losses on the mortgage portfolio exceed 10 bpsbasis points (bps) of the original pool balance. Asbalance, up to the remaining amount of purchased loss protection of $1.1 billion and $1.4 billion at December 31, 20092010 and 2008, $70.7 billion2009. The vehicles are variable interest entities from which the Corporation purchases credit protection and $109.3 billion of mortgage loans were protectedin which the Corporation does not have a variable interest; accordingly, these vehicles are not consolidated by these agreements. The decrease in these credit protected pools wasthe Corporation. Amounts due to approximately $12.1 billion in loan sales, a terminated transaction of $6.6 billion and principal payments

duringfrom the year. During 2009, $669 million was recognizedvehicles are recorded in other income for amounts that will be reimbursed under these structures. As(loss) when the Corporation recognizes a reimbursable loss, as described above. Amounts are collected when reimbursable losses are realized through

the sale of the underlying collateral. At December 31, 2010 and 2009, the Corporation had a receivable of $722 million and $1.0 billion from these structuresvehicles for reimbursement of losses. At December 31, 2010 and 2009, $53.9 billion and $70.7 billion of residential mortgage loans were referenced under these agreements. The Corporation records an allowance for credit losses on these loans without regard to the existence of the purchased loss protection as the protection does not represent a guarantee of individual loans.
In addition, the Corporation has entered into credit protectionlong-term standby agreements with GSEsFNMA and FHLMC on loans totaling $14.3 billion and $6.6 billion and $9.6 billion as ofat December 31, 20092010 and 2008,2009, providing full protection on conforming residential mortgage loans that become severely delinquent.

The Corporation does not record an allowance for credit losses on these loans as the loans are individually insured.

140Bank of America 2009

166     Bank of America 2010


Nonperforming Loans and Leases

The following table presentsbelow includes the Corporation’s nonperforming loans and leases, including nonperforming TDRs, and loans accruing past due 90 days or more at December 31, 20092010 and 2008. This table excludes2009. Nonperforming loans and leases exclude performing TDRs and loans accounted for under the fair value option. Nonperforming LHFS are excluded from nonperforming loans and leases as they are recorded at either fair value or the lower of cost or fair value. In addition, purchased impairedPCI, consumer credit card, business card loans and past duein general, consumer

credit card, consumer non-real estate-secured

loans and leases, and business cardnot secured by real estate, including renegotiated loans, are not considered nonperforming loans and leases and are therefore excluded from nonperforming loans and leases.leases in the table. SeeNote 1 – Summary of Significant Accounting Principlesfor further information on the criteria to determine if a loan is classified as nonperforming. Real estate-secured past due consumer loans repurchased pursuant toinsured by the Corporation’s servicing agreements with GNMAFHA are not reported as nonperforming as repayments are guaranteedperforming since the principal repayment is insured by the FHA.


Nonperforming Loans and Leases

  December 31
(Dollars in millions) 2009    2008

Consumer


Residential mortgage

 $16,596    $7,057

Home equity

  3,804     2,637

Discontinued real estate

  249     77

Direct/Indirect consumer

  86     26

Other consumer

  104     91

Total consumer

  20,839     9,888

Commercial


Commercial – domestic(1)

  5,125     2,245

Commercial real estate

  7,286     3,906

Commercial lease financing

  115     56

Commercial – foreign

  177     290

Total commercial

  12,703     6,497

Total nonperforming loans and leases

 $33,542    $16,385

                 
        Accruing Past Due
 
  Nonperforming Loans and Leases  90 Days or More 
  December 31  December 31 
(Dollars in millions) 2010  2009  2010  2009 
Home loans
                
Residential mortgage (1)
 $17,691  $16,596  $16,768  $11,680 
Home equity  2,694   3,804       
Discontinued real estate  331   249       
Credit card and other consumer
                
U.S. credit card  n/a   n/a   3,320   2,158 
Non-U.S. credit card
  n/a   n/a   599   515 
Direct/Indirect consumer  90   86   1,058   1,488 
Other consumer  48   104   2   3 
                 
Total consumer
  20,854   20,839   21,747   15,844 
                 
Commercial
                
U.S. commercial  3,453   4,925   236   213 
Commercial real estate  5,829   7,286   47   80 
Commercial lease financing  117   115   18   32 
Non-U.S. commercial
  233   177   6   67 
U.S. small business commercial  204   200   325   624 
                 
Total commercial
  9,836   12,703   632   1,016 
                 
Total consumer and commercial
 $30,690  $33,542  $22,379  $16,860 
                 
(1)

Includes small business commercial – domestic

Residential mortgage loans of $200 million and $205 million ataccruing past due 90 days or more represent loans insured by the FHA. At December 31, 2010 and 2009, residential mortgage includes $8.3 billion and 2008.

$2.2 billion of loans that are no longer accruing interest as interest has been curtailed by the FHA although principal is still insured.
n/a = not applicable

Included in certain loan categories in nonperforming loans and leases in the nonperforming table above are TDRs that were classified as nonperforming. At December 31, 20092010 and 2008,2009, the Corporation had $2.9$3.0 billion and $209 million$2.9 billion of residential mortgages, $535 million and $1.7 billion and $302 million of home equity, $486$75 million and $44 million of commercial – domestic loans, and $43 million and $5 million of discontinued real estate, $175 million and $227 million of U.S. commercial, $770 million and $246 million of commercial real estate and $7 million and $13 million ofnon-U.S. commercial loans that were TDRs and classified as nonperforming.
As a result of new accounting guidance on PCI loans, beginning January 1, 2010, modification of a PCI loan no longer results in removal of the loan from the PCI loan pool. TDRs in the consumer real estate portfolio that were removed from the PCI loan portfolio prior to the adoption of the new accounting guidance were $2.1 billion and $2.3 billion at December 31, 2010 and 2009, of which $426 million and $395 million were nonperforming. These nonperforming loans are excluded from the table above.
Credit Quality Indicators
The Corporation monitors credit quality within its three portfolio segments based on primary credit quality indicators. Within the home loans portfolio segment, the primary credit quality indicators used are refreshed LTV and refreshed FICO score. Refreshed LTV measures the carrying value of the loan

as a percentage of the value of property securing the loan, refreshed quarterly. Home equity loans are measured using combined LTV which measures the carrying value of the combined loans that have liens against the property and the available line of credit as a percentage of the appraised value of the property securing the loan, refreshed quarterly. Refreshed FICO score measures the creditworthiness of the borrower based on the financial obligations of the borrower and the borrower’s credit history. At a minimum, FICO scores are refreshed quarterly, and in many cases, more frequently. Refreshed FICO score is also a primary credit quality indicator for the credit card and other consumer portfolio segment and the business card portfolio within U.S. small business commercial. The Corporation’s commercial loans are evaluated using pass rated or reservable criticized as the primary credit quality indicator. The term reservable criticized refers to those commercial loans that are internally classified or listed by the Corporation as special mention, substandard or doubtful. These assets pose an elevated risk and may have a high probability of default or total loss. Pass rated refers to all loans not considered criticized. In addition to these amounts,primary credit quality indicators, the Corporation had performing TDRs that were on accrual statususes other credit quality indicators for certain types of $2.3 billionloans. See Note 1 – Summary of Significant Accounting Principlesfor additional information.


Bank of America 2010     167


The tables below present certain credit quality indicators related to the Corporation’s home loans, credit card and $320 million of residential mortgages, $639 million and $1 million of home equity, $91 million and $13 million of commercial – domesticother consumer loans, and $35 millioncommercial loan portfolio segments at December 31, 2010.
Home Loans
                         
  December 31, 2010 
                 Countrywide
 
     Countrywide
     Countrywide
     Discontinued
 
  Residential
  Residential
  Home
  Home Equity
  Discontinued
  Real Estate
 
(Dollars in millions) Mortgage(1)  Mortgage PCI(2)  Equity(1, 3)  PCI(2, 3)  Real Estate(1)  PCI(2) 
Refreshed LTV                        
Less than 90 percent $130,260  $3,390  $73,680  $1,883  $1,033  $5,248 
Greater than 90 percent but less than 100 percent  19,907   1,654   14,038   1,186   155   1,578 
Greater than 100 percent  43,268   5,548   37,673   9,521   268   4,826 
FHA Loans (4)
  53,946                
                         
Total home loans
 $247,381  $10,592  $125,391  $12,590  $1,456  $11,652 
                         
Refreshed FICO score                        
Less than 620 $27,483  $4,016  $15,494  $3,206  $663  $7,168 
Greater than or equal to 620  165,952   6,576   109,897   9,384   793   4,484 
FHA Loans (4)
  53,946                
                         
Total home loans
 $247,381  $10,592  $125,391  $12,590  $1,456  $11,652 
                         
(1)Excludes Countrywide PCI loans.
(2)Excludes PCI home loans related to the Merrill Lynch acquisition.
(3)Refreshed LTV is reported using a combined LTV, which measures the carrying value of the combined loans with liens against the property and the available line of credit as a percentage of the appraised value securing the loan.
(4)Credit quality indicators are not reported for FHA insured loans as principal repayment is insured by the FHA.
Credit Card and $66 million of discontinued real estate.Other Consumer
  ��              
  December 31, 2010 
  U.S. Credit
  Non-U.S.
  Direct/Indirect
  Other
 
(Dollars in millions) Card  Credit Card  Consumer  Consumer(1) 
Refreshed FICO score                
Less than 620 $14,159  $631  $6,748  $979 
Greater than or equal to 620  99,626   7,528   48,209   961 
Other internal credit metrics(2, 3, 4)
     19,306   35,351   890 
                 
Total credit card and other consumer
 $113,785  $27,465  $90,308  $2,830 
                 
(1)96 percent of the other consumer portfolio was associated with portfolios from certain consumer finance businesses that have been previously exited by the Corporation.
(2)Other internal credit metrics may include delinquency status, geography or other factors.
(3)Direct/indirect consumer includes $24.0 billion of securities-based lending which is overcollateralized and therefore offers minimal credit risk and $7.4 billion of loans the Corporation no longer originates.
(4)Non-U.S. credit card represents the select European countries’ credit card portfolio and a portion of the Canadian credit card portfolio which is evaluated using internal credit metrics, including delinquency status. At December 31, 2010, 95 percent of this portfolio was current or less than 30 days past due, three percent was30-89 days past due and two percent was 90 days or more past due.
Commercial(1)
                     
  December 31, 2010 
        Commercial
     U.S. Small
 
  U.S.
  Commercial
  Lease
  Non-U.S.
  Business
 
(Dollars in millions) Commercial  Real Estate  Financing  Commercial  Commercial 
Risk Ratings                    
Pass rated $160,154  $29,757  $20,754  $30,180  $3,139 
Reservable criticized  15,432   19,636   1,188   1,849   988 
Refreshed FICO score                    
Less than 620  n/a   n/a   n/a   n/a   888 
Greater than or equal to 620  n/a   n/a   n/a   n/a   5,083 
Other internal credit metrics(2, 3)
  n/a   n/a   n/a   n/a   4,621 
                     
Total commercial credit
 $175,586  $49,393  $21,942  $32,029  $14,719 
                     
(1)Includes $204 million of PCI loans related to the commercial portfolio segment and excludes $3.3 billion of loans accounted for under the fair value option.
(2)Other internal credit metrics may include delinquency status, application scores, geography or other factors.
(3)U.S. small business commercial includes business card and small business loans which are evaluated using internal credit metrics, including delinquency status. At December 31, 2010, 95 percent was current or less than 30 days past due.
n/a = not applicable

Impaired Loans and Troubled Debt Restructurings

A loan is considered impaired when, based on current information and events, it is probable that the Corporation will be unable to collect all amounts due from the borrower in accordance with the contractual terms of the loan. Impaired loans include nonperforming commercial loans, all TDRs, including

both commercial performingand consumer TDRs, and both performingthe renegotiated credit card, consumer lending and nonperforming consumer real estate TDRs. As defined in applicable accounting guidance, impairedsmall business loan portfolios (the renegotiated portfolio). Impaired loans exclude nonperforming consumer loans not modified in a TDR,unless they are classified as TDRs, all commercial leases and all commercial loans and leases accounted for under the fair value option. Purchased impairedPCI loans are reported separately on page 171.


168 ��   Bank of America 2010


The following tables present impaired loans related to the Corporation’s home loans and discussed separately below.commercial loan portfolio segments at December 31, 2010. Certain impaired home loans and commercial loans do not have a related allowance as the valuation of these impaired loans, determined under current accounting guidance, exceeded the carrying value.
Impaired Loans – Home Loans
                     
  December 31, 2010  2010 
  Unpaid
        Average
  Interest
 
  Principal
  Carrying
  Related
  Carrying
  Income
 
(Dollars in millions) Balance  Value  Allowance  Value  Recognized(1) 
With no recorded allowance
                    
Residential mortgage $5,493  $4,382   n/a  $4,429  $184 
Home equity  1,411   437   n/a   493   21 
Discontinued real estate  361   218   n/a   219   8 
With an allowance recorded
                    
Residential mortgage $8,593  $7,406  $1,154  $5,226  $196 
Home equity  1,521   1,284   676   1,509   23 
Discontinued real estate  247   177   41   170   7 
                     
Total
                    
Residential mortgage
 $14,086  $11,788  $1,154  $9,655  $380 
Home equity
  2,932   1,721   676   2,002   44 
Discontinued real estate
  608   395   41   389   15 
                     
(1)Interest income recognized includes interest accrued and collected on the outstanding balances of accruing impaired loans as well as interest cash collections on nonaccruing impaired loans for which the ultimate collectability of principal is not uncertain. SeeNote 1 – Summary of Significant Accounting Principlesfor additional information.
n/a = not applicable
Impaired Loans – Commercial
                     
  December 31, 2010  2010 
  Unpaid
        Average
  Interest
 
  Principal
  Carrying
  Related
  Carrying
  Income
 
(Dollars in millions) Balance  Value  Allowance  Value  Recognized(1) 
With no recorded allowance
                    
U.S. commercial $968  $441   n/a  $547  $3 
Commercial real estate  2,655   1,771   n/a   1,736   8 
Non-U.S. commercial
  46   28   n/a   9    
U.S. small business commercial (2)
        n/a       
With an allowance recorded
                    
U.S. commercial $3,891  $3,193  $336  $3,389  $36 
Commercial real estate  5,682   4,103   208   4,813   29 
Non-U.S. commercial
  572   217   91   190    
U.S. small business commercial (2)
  935   892   445   1,028   34 
                     
Total
                    
U.S. commercial
 $4,859  $3,634  $336  $3,936  $39 
Commercial real estate
  8,337   5,874   208   6,549   37 
Non-U.S. commercial
  618   245   91   199    
U.S. small business commercial (2)
  935   892   445   1,028   34 
                     
(1)Interest income recognized includes interest accrued and collected on the outstanding balances of accruing impaired loans as well as interest cash collections on nonaccruing impaired loans for which the ultimate collectability of principal is not uncertain. SeeNote 1 – Summary of Significant Accounting Principlesfor additional information.
(2)Includes U.S. small business commercial renegotiated TDR loans and related allowance.
n/a = not applicable

At December 31, 20092010 and 2008, the Corporation had $12.7 billion and $6.5 billion of commercial impaired loans and $7.7 billion and $903 million of consumer impaired loans. The average recorded investment in the commercial and consumer impaired loans for 2009, 2008 and 2007 was approximately $15.1 billion, $5.0 billion and $1.2 billion, respectively. At December 31, 2009 and 2008, the recorded investment in impaired loans requiring an allowance for loan and lease losses was $18.6 billion and $6.9 billion, and the related allowance for loan and lease losses was $3.0 billion and $720 million. For 2009, 2008 and 2007, interest income recognized on impaired loans totaled $266 million, $105 million and $130 million, respectively.

At December 31, 2009 and 2008, remaining commitments to lend additional funds to debtors whose terms have been modified in a commercial or consumer TDR were immaterial.

The Corporation seeks to assist customers that are experiencing financial difficulty throughby renegotiating credit card and consumer lending loans within the renegotiated portfolio while ensuring compliance with Federal Financial Institutions Examination Council (FFIEC) guidelines. Substantially all modifications in the renegotiated portfolio are considered to be both TDRs and impaired loans. The renegotiated portfolio may include modifications, both short- and long-term, of interest rates or payment amounts or a combination thereof. The Corporation makes loan

modifications, primarily utilizing internal renegotiation programs via direct customer contact, that manage customers’ debt exposures held only by the Corporation. Additionally, the Corporation makes loan modifications with consumers who have elected to work with external renegotiation agencies and these modifications provide solutions to customers’ entire unsecured debt structures. Under both internal and external programs, customers receive reduced annual percentage rates with fixed payments that amortize loan balances over a60-month period. Under both programs, for credit card loans, a customer’s charging privileges are revoked.


Bank of America 2010     169


The following tables provide detailed information on the Corporation’s primary modification programs for the renegotiated portfolio. At December 31, 20092010, all renegotiated credit card and 2008,other consumer loans were considered impaired and have a related allowance as shown in the table below. The allowance for credit

card loans is based on the present value of projected cash flows discounted using the interest rate in effect prior to restructuring and prior to any risk-based or penalty-based increase in rate.


Impaired Loans – Credit Card and Other Consumer
                      
   December 31, 2010  2010 
   Unpaid
        Average
  Interest
 
   Principal
  Carrying
  Related
  Carrying
  Income
 
(Dollars in millions)  Balance  Value(1)  Allowance  Value  Recognized(2) 
With an allowance recorded
                     
U.S. credit card  $8,680  $8,766  $3,458  $10,549  $621 
Non-U.S. credit card
   778   797   506   973   21 
Direct/Indirect consumer   1,846   1,858   822   2,126   111 
                      
(1)Includes accrued interest and fees.
(2)Interest income recognized includes interest accrued and collected on the outstanding balances of accruing impaired loans as well as interest cash collections on nonaccruing impaired loans for which the ultimate collectability of principal is not uncertain. SeeNote 1 – Summary of Significant Accounting Principlesfor additional information.
Renegotiated TDR Portfolio
                                         
  Internal Programs                         
                      Percent of Balances Current or
 
  December 31  External Programs  Other  Total  Less Than 30 Days Past Due 
    December 31  December 31  December 31  December 31 
(Dollars in millions) 2010  2009  2010  2009  2010  2009  2010  2009  2010  2009 
Credit card and other consumer
                                        
U.S. credit card $6,592  $3,159  $1,927  $758  $247  $283  $8,766  $4,200   77.66%  75.43%
Non-U.S. credit card
  282   252   176   168   339   435   797   855   58.86   53.02 
Direct/Indirect consumer  1,222   1,414   531   539   105   89   1,858   2,042   78.81   75.44 
Other consumer     54      69      17      140   n/a   68.94 
                                         
Total consumer
  8,096   4,879   2,634   1,534   691   824   11,421   7,237   76.51   72.66 
                                         
Commercial
                                        
U.S. small business commercial  624   776   58   57   6   11   688   844   65.37   64.90 
                                         
Total commercial
  624   776   58   57   6   11   688   844   65.37   64.90 
                                         
Total renegotiated TDR loans
 $8,720  $5,655  $2,692  $1,591  $697  $835  $12,109  $8,081   75.90%  72.96%
                                         
n/a = not applicable

At December 31, 2010 and 2009, the Corporation had a renegotiated consumer credit card – domestic held loansTDR portfolio of $4.2$12.1 billion and $2.3$8.1 billion of which $3.1$9.2 billion and $1.7 billion were current or less than 30 days past due under the modified terms. In addition, at December 31, 2009 and 2008, the Corporation had renegotiated consumer credit card – foreign held loans of $898 million and $517 million of which $471 million and $287 million werewas current or less than 30 days past due under the modified terms and consumer lending loans of $2.0 billion and $1.3 billion of which $1.5 billion and $854 million were current or less than 30 days past due under the modified terms. Theseat December 31, 2010. The renegotiated loans areTDR portfolio is excluded from nonperforming loans.loans as the Corporation generally does not classify consumer loans not secured by real

estate as nonperforming as these loans are generally charged off no later than the end of the month in which the loan becomes 180 days past due. Current period amounts include the impact of new consolidation guidance which resulted in the consolidation of credit card and certain other securitization trusts.


170     Bank of America 2010


Purchased ImpairedCredit-impaired Loans

Purchased impaired

PCI loans are acquired loans with evidence of credit quality deterioration since origination for which it is probable at purchase date that the Corporation will be unable to collect all contractually required payments. In connection with the Countrywide acquisition in 2008, the Corporation acquired purchased impairedPCI loans, substantially all of which arewere residential mortgage, home equity and discontinued real estate loans. In connection with anthe Merrill Lynch acquisition in 2009, the Corporation acquired PCI loans, substantially all of which were residential mortgage and commercial loans.
The table below presents the remaining unpaid principal balance of $47.7 billion and $55.4 billion and a carrying amount, of $37.5 billion and $42.2 billionexcluding the valuation reserve, for PCI loans at December 31, 20092010 and 2008. At December 31, 2009, the unpaid principal balance of Merrill Lynch purchased impaired consumer and commercial loans was $2.4 billion and $2.0 billion and the carrying amount of these loans was $2.1 billion and $692 million. 2009. SeeNote 7 – Allowance for Credit Lossesfor additional information.
         
  December 31 
(Dollars in millions) 2010  2009 
Consumer
        
Countrywide
        
Unpaid principal balance $41,446  $47,701 
Carrying value excluding valuation reserve  34,834   37,541 
Merrill Lynch
        
Unpaid principal balance  1,698   2,388 
Carrying value excluding valuation reserve  1,559   2,112 
         
Commercial
        
Merrill Lynch
        
Unpaid principal balance $870  $1,971 
Carrying value excluding valuation reserve  204   692 
         
As a result of the acquisition dateadoption of new accounting guidance on PCI loans, beginning January 1, 2009, these loans had an unpaid principal balance of $2.7 billion and $2.9 billion and a fair value of $2.3 billion and $1.9 billion.


Bank of America 2009141


The following table provides details on purchased impaired loans obtained in the Merrill Lynch acquisition. This information is provided only for acquisitions that occurred in the current year.

Acquired Loan Information for Merrill Lynch as of January 1, 2009

(Dollars in millions)   

Contractually required payments including interest

 $6,205  

Less: Nonaccretable difference

  (1,357

Cash flows expected to be collected(1)

  4,848  

Less: Accretable yield

  (627

Fair value of loans acquired

 $4,221  
(1)

Represents undiscounted expected principal and interest cash flows upon acquisition.

Consumer purchased impaired loans are accounted for on a pool basis. Pooled2010, pooled loans that are modified subsequent to acquisition are not removed from the PCI loan pools and are not considered TDRs. Prior to January 1, 2010, pooled loans that were modified subsequent to acquisition were reviewed to compare modified contractual cash flows to

the purchased impaired loanPCI carrying value. If the present value of the modified cash flows is lowerwas less than the carrying value, the loan iswas removed from the purchased impairedPCI loan pool at its carrying value, as well as any related allowance for loan and lease losses, and was classified as a TDR. The carrying value of purchased impairedPCI loan TDRs that were removed from the PCI pool prior to January 1, 2010 totaled $2.3 billion at$2.1 billion. At December 31, 20092010, $1.6 billion of which $1.9 billionthose classified as TDRs were on accrual status. The carrying value of these modified loans, net of allowance, was approximately 6965 percent of the unpaid principal balance.

The table below shows activity for the accretable yield on PCI loans. The $14 million and $1.4 billion reclassifications to nonaccretable difference during 2010 and 2009 reflect a reduction in estimated interest cash flows during the year.
     
(Dollars in millions)   
Accretable yield, January 1, 2009
 $12,860 
Merrill Lynch balance  627 
Accretion  (2,859)
Disposals/transfers  (1,482)
Reclassifications to nonaccretable difference  (1,431)
     
Accretable yield, December 31, 2009
  7,715 
     
Accretion  (1,766)
Disposals/transfers  (213)
Reclassifications to nonaccretable difference  (14)
     
Accretable yield, December 31, 2010
 $5,722 
     
LoansHeld-for-Sale
The Corporation had LHFS of $35.1 billion and $43.9 billion at December 31, 2010 and 2009. Proceeds from sales, securitizations and paydowns of LHFS were $281.7 billion, $365.1 billion and $142.1 billion for 2010, 2009 and 2008. Proceeds used for originations and purchases of LHFS were $263.0 billion, $369.4 billion and $127.5 billion for 2010, 2009 and 2008.


Bank of America 2010     171


NOTE 7 Allowance for Credit Losses
The table below summarizes the changes in the allowance for credit losses for 2010, 2009 and 2008.
                         
     Credit Card
             
  Home
  and Other
     Total Allowance 
(Dollars in millions) Loans  Consumer  Commercial  2010  2009  2008 
Allowance for loan and lease losses, January 1, before effect of the January 1 adoption of new consolidation guidance
 $15,756  $12,029  $9,415  $37,200  $23,071  $11,588 
Allowance related to adoption of new consolidation guidance  573   10,214   1   10,788   n/a   n/a 
                         
Allowance for loan and lease losses, January 1
  16,329   22,243   9,416   47,988   23,071   11,588 
Loans and leases charged off  (10,915)  (20,865)  (5,610)  (37,390)  (35,483)  (17,666)
Recoveries of loans and leases previously charged off  396   2,034   626   3,056   1,795   1,435 
                         
Net charge-offs  (10,519)  (18,831)  (4,984)  (34,334)  (33,688)  (16,231)
                         
Provision for loan and lease losses  13,335   12,115   2,745   28,195   48,366   26,922 
Other  107   (64)  (7)  36   (549)  792 
                         
Allowance for loan and lease losses, December 31
  19,252   15,463   7,170   41,885   37,200   23,071 
                         
Reserve for unfunded lending commitments, January 1
        1,487   1,487   421   518 
Provision for unfunded lending commitments        240   240   204   (97)
Other        (539)  (539)  862    
                         
Reserve for unfunded lending commitments, December 31
        1,188   1,188   1,487   421 
                         
Allowance for credit losses, December 31
 $19,252  $15,463  $8,358  $43,073  $38,687  $23,492 
                         
n/a = not applicable

In 2010, the Corporation recorded a $750 million$2.2 billion in provision for credit losses establishingwith a corresponding increase in the valuation allowance withinreserve included as part of the allowance for loan and lease losses specifically for purchased impaired loans at December 31, 2008. The Corporation recorded $3.7the PCI loan portfolio. This compared to $3.5 billion in provision, including a $3.5 billion addition to the allowance for loan2009 and lease losses, related to the purchased impaired loan portfolio during 2009 due to a decrease$750 million in expected principal cash flows.2008. The amount of the allowance for loan and lease losses associated with the purchased impairedPCI loan portfolio was

$3.9 $6.4 billion, $3.9 billion and $750 million at December 31, 2009, primarily related to Countrywide.

The following table shows activity for the accretable yield on purchased impaired loans acquired from Countrywide and Merrill Lynch for2010, 2009 and 2008. The decrease in expected cash flows during 2009 of $1.4 billion is primarily attributable to lower expected interest cash flows due to increased credit losses, faster prepayment assumptions and lower rates.

Accretable Yield Activity

(Dollars in millions)   

Accretable yield, July 1, 2008(1)

 $19,549  

Accretion

  (1,667

Disposals/transfers

  (589

Reclassifications to nonaccretable difference

  (4,433

Accretable yield, January 1, 2009

  12,860  

Merrill Lynch balance

  627  

Accretion

  (2,859

Disposals/transfers(2)

  (1,482

Reclassifications to nonaccretable difference

  (1,431

Accretable yield, December 31, 2009

 $7,715  
(1)

Represents the accretable yield of loans acquired from Countrywide at July 1, 2008.

(2)

Includes $1.2 billion in accretable yield related to loans restructured in TDRs in which the present value of modified cash flows was lower than expectations upon acquisition. These TDRs were removed from the purchased impaired loan pool.

Loans Held-for-Sale

The Corporation had LHFS of $43.9 billion and $31.5 billion at December 31, 2009 and 2008. Proceeds from sales, securitizations and paydowns of LHFS were $365.1 billion, $142.1 billion and $107.1 billion for 2009, 2008, and 2007. Proceeds used for originations and purchases of LHFS were $369.4 billion, $127.5 billion and $123.0 billion for 2009, 2008 and 2007.


NOTE 7 – Allowance for Credit Losses

The following table summarizes the changes in the allowance for credit losses for 2009, 2008 and 2007.

(Dollars in millions) 2009     2008   2007 

Allowance for loan and lease losses, January 1

 $23,071      $11,588    $9,016  

Loans and leases charged off

  (35,483     (17,666   (7,730

Recoveries of loans and leases previously charged off

  1,795       1,435     1,250  

Net charge-offs

  (33,688     (16,231   (6,480

Provision for loan and lease losses

  48,366       26,922     8,357  

Write-downs on consumer purchased impaired loans(1)

  (179     n/a     n/a  

Other

  (370     792     695  

Allowance for loan and lease losses, December 31

  37,200       23,071     11,588  

Reserve for unfunded lending commitments, January 1

  421       518     397  

Provision for unfunded lending commitments

  204       (97   28  

Other

  862       —       93  

Reserve for unfunded lending commitments, December 31

  1,487       421     518  

Allowance for credit losses, December 31

 $38,687      $23,492    $12,106  
(1)

Represents the write-downs on certain pools of purchased impaired loans that exceed the original purchase accounting adjustments.

n/a = not applicable

The Corporation recorded $3.7 billion in provision, including a $3.5 billion addition to the allowance for loan and leases losses, during 2009 specifically for the purchased impaired loan portfolio. The amount of the allowance for loan and lease losses associated with the purchased impaired loan portfolio was $3.9 billion at December 31, 2009.

respectively.

In the above table, the 2009The “other” amount under allowance for loan and lease losses for 2009 includes a $750 million reduction in the allowance for loan and lease losses related to $8.5 billion of credit card loans that were exchanged for a $7.8 billion HTM debt security that was issued by the Corporation’s U.S. Credit Card Securitization Trust and retained by the


142Bank of America 2009


Corporation. This reduction was partially offset by a $340 million increase associated with the reclassification to other assets of the December 31, 2008 amount expected to be reimbursable under residential mortgage cash collateralized synthetic securitizations. The 2008 “other”

“other” amount under allowance for loan and lease losses includes the $1.2 billion addition of the Countrywide allowance for loan losses as of July 1, 2008.
The 2007 “other” amount under allowance for loan and lease losses includes the $725 million and $25 million additions of the LaSalle and U.S. Trust Corporation allowance for loan losses as of October 1, 2007 and July 1, 2007.

In the previous table, the 2009 “other” amount under the reserve for unfunded lending commitments representsfor 2009 includes the fair valueremaining balance of the acquired Merrill Lynch reserve excluding those commitments accounted for under the fair value option, net of accretion, and the impact of funding previously unfunded portions. The 2007 “other”positions. This amount under the reserve for unfunded lending commitments includes the $124 million additionin 2010 represents primarily accretion of the LaSalle reserve asMerrill Lynch purchase accounting adjustment and the impact of October 1, 2007.

NOTE 8 – Securitizations

funding previously unfunded positions.

The Corporation routinely securitizestable below represents the allowance and the carrying value of outstanding loans and debt securities. These securitizations are a source of funding for the Corporation in addition to transferring the economic risk of the loans or debt securities to third parties. In a securitization, various classes of debt securities may be issued and are generally collateralizedleases by a single class of transferred assets which most often consist of residential mortgages, but may also include commercial mortgages, credit card receivables, home equity loans, automobile loans or MBS. The securitized loans may be serviced by the

Corporation or by third parties. With each securitization, the Corporation may retain a portion of the securities, subordinated tranches, interest-only strips, subordinated interests in accrued interest and fees on the securitized receivables or, in some cases, overcollateralization and cash reserve accounts, all of which are referred to as retained interests. These retained interests are recorded in other assets, AFS debt securities, or trading account assets and are generally carriedportfolio segment at fair value or amounts that approximate fair value with changes recorded in income or accumulated OCI, or are recorded as HTM debt securities and carried at amortized cost. Changes in the fair value of credit card related interest- only strips are recorded in card income. In addition, the Corporation may enter into derivatives with the securitization trust to mitigate the trust’s interest rate or foreign currency risk. These derivatives are entered into at market terms and are generally senior in payment. The Corporation also may serve as the underwriter and distributor of the securitization, serve as the administrator of the trust, and from time to time, make markets in securities issued by the securitization trusts.

First Lien Mortgage-related Securitizations

As part of its mortgage banking activities, the Corporation securitizes a portion of the residential mortgage loans it originates or purchases from third parties in conjunction with or shortly after loan closing or purchase. In addition, the Corporation may, from time to time, securitize commercial mortgages and first lien residential mortgages that it originates or purchases from other entities.

The following table summarizes selected information related to mortgage securitizations at and for the years ended December 31, 2009 and 2008.

2010.

  Residential Mortgage        
  Agency    Non-Agency                
      Prime  Subprime  Alt-A    Commercial Mortgage    
(Dollars in millions) 2009  2008     2009  2008  2009  2008  2009  2008     2009  2008

For the Year Ended December 31


Cash proceeds from new securitizations(1)

 $346,448  $123,653   $  $1,038  $  $1,377  $  $   $313  $3,557

Gains on securitizations(2,3)

  73   25       2      24             29

Cash flows received on residual interests

         25   6   71   33   5   4    23   

At December 31


Principal balance outstanding(4)

  1,255,650   1,123,916    81,012   111,683   83,065   57,933   147,072   136,027    65,397   55,403

Residual interests held

          9      2   13           48   7

Senior securities held(5, 6):


Trading account assets

 $2,295  $1,308   $201  $367  $12  $  $431  $278   $469  $168

Available-for-sale debt securities

  13,786   12,507     3,845   4,559   188   121   561   569     1,215   16

Total senior securities held

 $16,081  $13,815    $4,046  $4,926  $200  $121  $992  $847    $1,684  $184

Subordinated securities held(5, 7):


Trading account assets

 $  $   $  $23  $  $3  $  $1   $122  $136

Available-for-sale debt securities

          13   20   22   1   4   17     23   

Total subordinated securities held

 $  $    $13  $43  $22  $4  $4  $18    $145  $136

                 
     Credit Card
       
     and Other
       
(Dollars in millions) Home Loans  Consumer  Commercial  Total 
Impaired loans and troubled debt restructurings(1)
                
Allowance for loan and lease losses (2)
 $1,871  $4,786  $1,080  $7,737 
Carrying value  13,904   11,421   10,645   35,970 
Allowance as a percentage of outstandings  13.46%  41.91%  10.15%  21.51%
                 
Collectively evaluated for impairment
                
Allowance for loan and lease losses $10,964  $10,677  $6,078  $27,719 
Carrying value (3)
  358,765   222,967   282,820   864,552 
Allowance as a percentage of outstandings (3)
  3.06%  4.79%  2.15%  3.21%
                 
Purchased credit-impaired loans
                
Allowance for loan and lease losses $6,417   n/a  $12  $6,429 
Carrying value  36,393   n/a   204   36,597 
Allowance as a percentage of outstandings  17.63%  n/a   5.76%  17.57%
                 
Total
                
Allowance for loan and lease losses
 $19,252  $15,463  $7,170  $41,885 
Carrying value (3)
  409,062   234,388   293,669   937,119 
Allowance as a percentage of outstandings (3)
  4.71%  6.60%  2.44%  4.47%
                 
(1)

The Corporation sells residential mortgage

Impaired loans to GSEs in the normal course of businessinclude nonperforming commercial loans and receives MBS in exchange which may then be sold into the market to third party investors for cash proceeds.

(2)

Net of hedges

(3)

Substantially all of the residential mortgages securitizedTDRs, including both commercial and consumer TDRs. Impaired loans exclude nonperforming consumer loans unless they are initially classified as LHFSTDRs, and all commercial loans and leases which are accounted for under the fair value option. As such, gains are recognized on these LHFS prior to securitization. During 2009 and 2008, the Corporation recognized $5.5 billion and $1.6 billion of gains on these LHFS.

(4)

Generally, the Corporation as transferor will service the sold loans and thus recognize a MSR upon securitization.

(5)

As a holder of these securities, the Corporation receives scheduled interest and principal payments. During 2009 and 2008, there were no significant other-than-temporary impairment losses recorded on those securities classified as AFS debt securities.

(6)

At December 31, 2009 and 2008, substantially all of the residential mortgage held senior securities were valued using quoted market prices. At December 31, 2009, substantially all of the commercial mortgage held senior securities were valued using quoted market prices while at December 31, 2008 substantially all were valued using model valuations.

(7)

At December 31, 2009, substantially all of the residential mortgage held subordinated securities and all of the commercial mortgage held subordinated securities were valued using quoted market prices while at December 31, 2008 substantially all were valued using model valuations.

In addition to the amounts included in the table above, during 2009, the Corporation purchased $49.2 billion of MBS from third parties and resecuritized them compared to $12.2 billion during 2008. Net gains,

which include net interest income earned during the holding period, totaled $213 million and $80 million in 2009 and 2008. At December 31, 2009 and 2008, the Corporation retained $543 million


Bank of America 2009143


and $1.0 billion of the senior securities issued in these transactions which were valued using quoted market prices and recorded in trading account assets.

The Corporation has consumer MSRs from the sale or securitization of mortgage loans. Servicing fee and ancillary fee income on consumer mortgage loans serviced, including securitizations where the Corporation has continuing involvement, were $6.2 billion and $3.5 billion in 2009 and 2008. Servicing advances on consumer mortgage loans, including securitizations where the Corporation has continuing involvement, were $19.3 billion and $8.8 billion at December 31, 2009 and 2008. In addition, the Corporation has retained commercial MSRs from the sale or securitization of commercial mortgage loans. Servicing fee and ancillary fee income on commercial mortgage loans serviced, including securitizations where the Corporation has continuing involvement, were $49 million and $40 million in 2009 and 2008. Servicing advances on commercial mortgage loans, including securitizations where the Corporation has continuing involvement, were $109 million and $14 million at December 31, 2009 and 2008. For more information on MSRs, seeNote 22 – Mortgage Servicing Rights.

The Corporation sells mortgage loans and, in the past sold home equity loans, with various representations and warranties related to, among other things, the ownership of the loan, validity of the lien securing the loan, absence of delinquent taxes or liens against the property securing the loan, the process used in selecting the loans for inclusion in a transaction, the loan’s compliance with any applicable loan criteria established by the buyer, and the loan’s compliance with applicable local, state and federal laws. Under the Corporation’s representations and warranties, the Corporation may be required to repurchase the mortgage loans with the identified defects, indemnify or provide other recourse to the investor or insurer. In such cases, the Corporation bears any subsequent credit loss on the mortgage loans. The Corporation’s representations and warranties are generally not subject to stated limits and extend over the life of the loan. However, the Corporation’s contractual liability arises only if there is a breach of the representations and warranties that materially and adversely affects the interest of the investor or pursuant to such other standard established by the terms of the related selling agreement. The Corporation attempts to limit its risk of incurring these losses by structuring its operations to ensure consistent production of quality mortgages and servicing those mortgages at levels that meet secondary mortgage market standards. In addition, certain of the Corporation’s securitizations include corporate guarantees that are contracts written to protect purchasers of the loans from credit losses up to a specified amount. The estimated losses to be absorbed under the guarantees are recorded when the Corporation sells the loans with guarantees. The methodology used to estimate the liability for representations and warranties considers a variety of factors and is a function of the representations and warranties given, estimated defaults, historical loss experience and probability that the Corporation will be required to repurchase the loan. The Corporation records its liability for representations and warranties, and corporate guarantees in accrued expenses and other liabilities and records the related expense in mortgage banking income. During 2009 and 2008, the Corporation recorded representations and warranties expense of $1.9 billion and $246 million. During 2009 and 2008, the Corporation repurchased $1.5 billion and $448 million of loans from first lien securitization trusts under the Corporation’s representations and warranties and corporate guarantees and paid $730 million and $77 million to indemnify the investors or insurers. In addition,

during 2009, the Corporation repurchased $13.1 billion of loans from first lien securitization trusts as a result of modifications, loan delinquencies or optional clean-up calls.

Credit Card Securitizations

The Corporation securitizes originated and purchased credit card loans. The Corporation’s continuing involvement includes servicing the receivables, retaining an undivided interest (the “seller’s interest”) in the receivables, and holding certain retained interests in credit card securitization trusts including senior and subordinated securities, interest-only strips, discount receivables, subordinated interests in accrued interest and fees on the securitized receivables and cash reserve accounts. The securitization trusts’ legal documents require the Corporation to maintain a minimum seller’s interest of four to five percent, and at December 31, 2009, the Corporation is in compliance with this requirement. The seller’s interest in the trusts represents the Corporation’s undivided interest in the receivables transferred to the trust and is pari passu to the investors’ interest. The seller’s interest is not represented by security certificates, is carried at historical cost, and is classified in loans on the Corporation’s Consolidated Balance Sheet. At December 31, 2009 and 2008, the Corporation had $10.8 billion and $14.8 billion of seller’s interest.

As specifically permitted by the terms of the transaction documents, and in an effort to address the recent decline in the excess spread due to the performance of the underlying credit card receivables in the U.S. Credit Card Securitization Trust, an additional subordinated security with a stated interest rate of zero percent was issued by the trust to the Corporation during 2009 (the Class D security). As the issuance was not treated as a sale, the Class D security was recorded at $7.8 billion representing the carry-over basis of the seller’s interest which is comprised of the $8.5 billion book value of the loans exchanged less the associated $750 million allowance for loan and lease losses, and was classified as HTM. Future principal and interest cash flows on the loans exchanged for the Class D security will be returned to the Corporation through its ownership of the Class D security and the U.S. Credit Card Securitization Trust’s residual interest. Income on this residual interest is presently recognized in card income as cash is received. The Class D security is subject to review for impairment at least on a quarterly basis. As the Corporation expects to receive all of the contractually due cash flows on the Class D security, there was no other-than-temporary impairment at December 31, 2009. In addition, as permitted by the transaction documents, the Corporation specified that from March 1, 2009 through September 30, 2009 a percentage of new receivables transferred to the trust will be deemed “discount receivables” and collections thereon will be added to finance charges which have increased the yield in the trust. Through the designation of these newly transferred receivables as discount receivables, the Corporation has subordinated a portion of its seller’s interest to the investors’ interest. The discount receivables were initially accounted for at the carry-over basis of the seller’s interest and are subject to impairment review at least on a quarterly basis. No impairment on the discount receivables has been recognized as of December 31, 2009. During 2009, the Corporation extended this agreement through March 31, 2010. The carrying amount and fair value of the discount receivables were both $3.6 billion, and the carrying amount and fair value of the retained Class D security was $6.6 billion and $6.4 billion at December 31, 2009. These actions did not have a significant impact on the Corporation’s results of operations.


144Bank of America 2009


The following table summarizes selected information related to credit card securitizations at and for the year ended December 31, 2009 and 2008.

  Credit Card
(Dollars in millions) 2009    2008

For the Year Ended December 31


Cash proceeds from new securitizations

 $650    $20,148

Gains on securitizations

       81

Collections reinvested in revolving period securitizations

  133,771     162,332

Cash flows received on residual interests

  5,512     5,771

At December 31


Principal balance outstanding(1)

  103,309     114,141

Senior securities held(2)

  7,162     4,965

Subordinated securities held(3)

  7,993     1,837

Other subordinated or residual interests held(4)

  5,195     2,233
(1)

Principal balance outstanding represents the principal balance of credit card receivables that have been legally isolated from the Corporation including those loans represented by the seller’s interest that are still held on the Corporation’s Consolidated Balance Sheet.

(2)

At December 31, 2009

Commercial impaired allowance for loan and 2008, held senior securities issued by credit card securitization trusts were valued using quoted market prices and substantially all were classified as AFS debt securities and there were no other-than-temporary impairmentlease losses recorded on those securities.

includes $445 million related to U.S. small business commercial renegotiated TDR loans.
(3)

At

Outstanding loan and lease balances and ratios do not include loans accounted for under the fair value option. Loans accounted for under the fair value option were $3.3 billion at December 31, 2009, the $6.6 billion Class D security was carried at amortized cost and classified as HTM debt securities and $1.4 billion of other held subordinated securities were valued using quoted market prices and were classified as AFS debt securities. At December 31, 2008, all of the held subordinated securities were valued using quoted market prices and classified as AFS debt securities.

2010.
(4)

Other subordinated and residual interests include discount receivables, subordinated interests in accrued interest and fees on the securitized receivables, and cash reserve accounts and interest-only strips which are carried at fair value or amounts that approximate fair value. The residual interests were valued using model valuations. Residual interests associated with the Class D and discount receivables transactions have not been recognized.

Economic assumptions are used in measuring the fair valuen/a = not applicable

172     Bank of certain residual interests that continue to be held by the Corporation. The expected loss rate assumption used to measure the discount receivables at December 31, 2009 was 13 percent. A 10 percent and 20 percent adverse change to the expected loss rate would have caused a decrease of $280 million and $1.2 billion to the fair value of the discount receivables at December 31, 2009. The discount rate assumption used to measure the Class D security at December 31, 2009 was six percent. A 100 bps and 200 bps increase in the discount rate would have caused a decrease of $116 million and $228 million to the fair value of the Class D security. Conversely, a 100 bps and 200 bps decrease in the discount rate would have caused an increase of $120 million and $245 million to the fair value of the Class D security. These sensitivities are hypothetical and should be used with caution. As the amounts indicate, changes in fair value based on variations in assumptions generally cannot be extrapolated because the relationship of the change in assumption to the change in fair value may not be linear.

At December 31, 2009 and 2008, there were no recognized servicing assets or liabilities associated with any of the credit card securitization transactions. The Corporation recorded $2.0 billion and $2.1 billion in servicing fees related to credit card securitizations during 2009 and 2008.

During 2008, the Corporation became one of the liquidity support providers for the Corporation’s commercial paper program that obtains financing by issuing tranches of commercial paper backed by credit card receivables to third-party investors from a trust sponsored by the Corporation. During 2009, the Corporation became the sole liquidity support provider for the program and increased its liquidity commitment from $946 million to $2.3 billion. The maximum amount of commercial paper that can be issued under this program given the current level of liquidity support is $8.8 billion, all of which was outstanding at December 31, 2009 and 2008. If certain conditions set forth in the legal documents governing the trust are not met, such as not being able to reissue the commercial paper due to market illiquidity, the commercial paper maturity dates will be extended to 390 days from the original issuance date. This

America 2010

extension would cause the outstanding commercial paper to convert to an interest-bearing note and subsequent credit card receivable collections would be applied to the outstanding note balance. If these notes are still outstanding at the end of the extended maturity period, the liquidity commitment obligates the Corporation and other liquidity support providers, if any, to purchase maturity notes from the trust in order to retire the interest-bearing notes held by investors. As a maturity note holder, the Corporation would be entitled to the remaining cash flows from the collateralizing credit card receivables. At December 31, 2009 and 2008, none of the commercial paper had been extended and there were no maturity notes outstanding. Due to illiquidity in the marketplace, the Corporation held $7.1 billion and $5.0 billion of the outstanding commercial paper as of December 31, 2009 and 2008, which is classified in AFS debt securities on the Corporation’s Consolidated Balance Sheet.

Other Securitizations

The Corporation also maintains interests in other securitization trusts to which the Corporation transferred assets including municipal bonds, automobile loans and home equity loans. These retained interests include senior and subordinated securities and residual interests. During 2009, the Corporation had cash proceeds from new securitizations of municipal bonds of $664 million as well as cash flows received on residual interests of $316 million. At December 31, 2009, the principal balance outstanding for municipal bonds securitization trusts was $6.9 billion, senior securities held were $122 million and residual interests held were $203 million. The residual interests were valued using model valuations and substantially all are classified as derivative assets. At December 31, 2009, all of the held senior securities issued by municipal bond securitization trusts were valued using quoted market prices and classified as trading account assets.

During 2009, the Corporation securitized $9.0 billion of automobile loans in a transaction that was structured as a secured borrowing under applicable accounting guidance and the loans are therefore recorded on the Corporation’s Consolidated Balance Sheet and excluded from the following table.


Bank of America 2009145


There were no new securitizations of home equity loans during 2009 and 2008. The following table summarizes selected information related to home equity and automobile loan securitizations at and for the year ended December 31, 2009 and 2008.

  Home Equity    Automobile 
(Dollars in millions) 2009    2008    2009    2008 

For the Year Ended December 31


Cash proceeds from new securitizations

 $    $    $    $741  

Losses on securitizations(1)

                 (31

Collections reinvested in revolving period securitizations

  177     235            

Repurchases of loans from trust(2)

  268     128     298     184  

Cash flows received on residual interests

  35     27     52       

At December 31


Principal balance outstanding

  46,282     34,169     2,656     5,385  

Senior securities held(3, 4)

  15          2,119     4,102  

Subordinated securities held(5)

  48     3     195     383  

Residual interests held(6)

  100     93     83     84  
(1)

Net of hedges

(2)

Repurchases of loans from the trust for home equity loans are typically a result of the Corporation’s representations and warranties, modifications or the exercise of an optional clean-up call. In addition, during 2009 and 2008, the Corporation paid $141 million and $34 million to indemnify the investor or insurer under the representations and warranties, and corporate guarantees. For further information regarding representations and warranties, and corporate guarantees, see the First Lien Mortgage-related Securitizations discussion. Repurchases of automobile loans during 2009 and 2008 were due to the exercise of an optional clean-up call.

(3)

As a holder of these securities, the Corporation receives scheduled interest and principal payments. During 2009, there were no other-than-temporary impairment losses recorded on those securities classified as AFS debt securities.

(4)

At December 31, 2009, all of the held senior securities issued by the home equity securitization trusts were valued using quoted market prices and classified as trading account assets. At December 31, 2009 and 2008, substantially all of the held senior securities issued by the automobile securitization trusts were valued using quoted market prices and classified as AFS debt securities.

(5)

At December 31, 2009 and 2008, substantially all of the held subordinated securities issued by the home equity securitization trusts were valued using model valuations and classified as AFS debt securities. At December 31, 2009 and 2008, substantially all of the held subordinated securities issued by the automobile securitization trusts were valued using quoted market prices and classified as AFS debt securities.

(6)

Residual interests include the residual asset, overcollateralization and cash reserve accounts, which are carried at fair value or amounts that approximate fair value. The residual interests were derived using model valuations and substantially all are classified in other assets.

Under the terms of the Corporation’s home equity securitizations, advances are made to borrowers when they draw on their lines of credit and the Corporation is reimbursed for those advances from the cash flows in the securitization. During the revolving period of the securitization, this reimbursement normally occurs within a short period after the advance. However, when the securitization transaction has begun a rapid amortization period, reimbursement of the Corporation’s advance occurs only after other parties in the securitization have received all of the cash flows to which they are entitled. This has the effect of extending the time period for which the Corporation’s advances are outstanding. In particular, if loan losses requiring draws on monoline insurers’ policies, which protect the bondholders in the securitization, exceed a specified threshold or duration, the Corporation may not receive reimbursement for all of the funds advanced to borrowers, as the senior bondholders and the monoline insurers have priority for repayment.

The Corporation evaluates all of its home equity securitizations for their potential to experience a rapid amortization event by estimating the amount and timing of future losses on the underlying loans, the excess spread available to cover such losses and by evaluating any estimated shortfalls in relation to contractually defined triggers. A maximum funding obligation attributable to rapid amortization cannot be calculated as a home equity borrower has the ability to pay down and redraw balances. At December 31, 2009 and 2008, home equity securitization transactions in rapid amortization had $14.1 billion and $13.1 billion of trust certificates outstanding. This amount is significantly greater than the amount the Corporation expects to fund. At December 31, 2009, an additional $1.1 billion of trust certificates outstanding pertain to home equity securitization transactions that are expected to enter rapid amortization during the next 24 months. The charges that will ultimately be recorded as a result of the rapid amortization events are dependent on the performance of the loans, the amount of subsequent draws, and the timing of related cash flows. At December 31, 2009 and 2008, the reserve for losses on expected future draw obligations on the home equity securitizations in or expected to be in rapid amortization was $178 million and $345 million.

The Corporation has consumer MSRs from the sale or securitization of home equity loans. The Corporation recorded $128 million and $78 million of servicing fee income related to home equity securitizations during 2009 and 2008. For more information on MSRs, seeNote 22 – Mortgage Servicing Rights. At December 31, 2009 and 2008, there were no recognized servicing assets or liabilities associated with any of the automobile securitization transactions. The Corporation recorded $43 million and $30 million in servicing fees related to automobile securitizations during 2009 and 2008.

The Corporation provides financing to certain entities under asset-backed financing arrangements. These entities are controlled and consolidated by third parties. At December 31, 2009, the principal balance outstanding for these asset-backed financing arrangements was $10.4 billion, the maximum loss exposure was $6.8 billion, and on-balance sheet assets were $6.7 billion which are primarily recorded in loans and leases. The total cash flows for 2009 were $491 million and are primarily related to principal and interest payments received.

NOTE 9 –Securitizations and Other Variable Interest Entities

The Corporation utilizes SPEsVIEs in the ordinary course of business to support its own and its customers’ financing and investing needs. These SPEs are typically structuredThe Corporation routinely securitizes loans and debt securities using VIEs as VIEsa source of funding for the Corporation and are thus subject to consolidation byas a means of transferring the reporting enterprise that absorbs the majorityeconomic risk of the economic risks and rewards of the VIE. To determine whether it must consolidate a VIE, the Corporation qualitatively analyzes the design of the VIEloans or debt securities to identify the creators of variability within the VIE, including an assessment as to the nature of the risks that are created by the assets and other contractual arrangements of the VIE, and identifies whether it will absorb a majority of that variability.

In addition, the Corporation uses VIEs such as trust preferred securities trusts in connection with its funding activities, as described in more detail inNote 13 – Long-term Debt.third parties. The Corporation also uses VIEsadministers structures or invests in the form of synthetic securitization vehicles to mitigate a portion of the credit risk on its residential mortgage loan portfolio as described in


146Bank of America 2009


Note 6Outstanding Loans and Leases.The Corporation has also provided support to or has loss exposure resulting from its involvement with other VIEs including certain cash funds managed withinGWIM, as described in more detail inNote 14 – CommitmentsCDOs, investment vehicles and Contingencies.These VIEs areother entities.

A VIE is an entity that lacks equity investors or whose equity investors do not includedhave a controlling financial interest in the tables below.

entity through their equity investments. The table below presentsentity that has a controlling financial interest in a VIE is referred to as the primary beneficiary and consolidates the VIE. In accordance with the new consolidation guidance effective January 1, 2010, the Corporation is deemed to have a controlling financial interest and is the primary beneficiary of a VIE if it has both the power to direct the activities of the VIE

that most significantly impact the VIE’s economic performance and an obligation to absorb losses or the right to receive benefits that could potentially be significant to the VIE. As a result of this change in accounting, the Corporation consolidated certain VIEs and former QSPEs that were previously unconsolidated. Incremental assets of newly consolidated VIEs on January 1, 2010, after elimination of intercompany balances and liabilitiesnet of VIEs that are consolidateddeferred taxes, included $69.7 billion in credit card securitizations, $15.6 billion in commercial paper conduits, $4.7 billion in home equity securitizations, $4.7 billion in municipal bond trusts and $5.7 billion in other VIEs. The net incremental impact of this accounting change on the Corporation’s Consolidated Balance Sheet at December 31, 2009, totalis set forth in the table below. The net effect of the accounting change on January 1, 2010 shareholders’ equity was a $6.2 billion charge to retained earnings,net-of-tax, primarily from the increase in the allowance for loan and lease losses, as well as a $116 million charge to accumulated OCI,net-of-tax, for the net unrealized losses on AFS debt securities in newly consolidated VIEs.


  Ending
     Beginning
 
  Balance Sheet
  Net Increase
  Balance Sheet
 
(Dollars in millions) December 31, 2009  (Decrease)  January 1, 2010 
Assets
            
Cash and cash equivalents $121,339  $2,807  $124,146 
Trading account assets  182,206   6,937   189,143 
Derivative assets  87,622   556   88,178 
Debt securities:            
Available-for-sale  301,601   (2,320)  299,281 
Held-to-maturity  9,840   (6,572)  3,268 
             
Total debt securities  311,441   (8,892)  302,549 
             
Loans and leases  900,128   102,595   1,002,723 
Allowance for loan and lease losses  (37,200)  (10,788)  (47,988)
             
Loans and leases, net of allowance  862,928   91,807   954,735 
             
Loansheld-for-sale
  43,874   3,025   46,899 
Deferred tax asset  27,279   3,498   30,777 
All other assets  593,543   701   594,244 
             
Total assets
 $2,230,232  $100,439  $2,330,671 
             
Liabilities
            
Commercial paper and other short-term borrowings $69,524  $22,136  $91,660 
Long-term debt  438,521   84,356   522,877 
All other liabilities  1,490,743   217   1,490,960 
             
Total liabilities
  1,998,788   106,709   2,105,497 
             
Shareholders’ equity
            
Retained earnings  71,233   (6,154)  65,079 
Accumulated other comprehensive income (loss)  (5,619)  (116)  (5,735)
All other shareholders’ equity  165,830      165,830 
             
Total shareholders’ equity
  231,444   (6,270)  225,174 
             
Total liabilities and shareholders’ equity
 $2,230,232  $100,439  $2,330,671 
             
Bank of America 2010     173


The following tables present the assets and liabilities of consolidated and unconsolidated VIEs at December 31, 2008,2010 and 2009, in situations where the Corporation has continuing involvement with transferred assets or if the Corporation otherwise has a variable interest in the VIE. The tables also present the Corporation’s maximum exposure to loss at December 31, 2010 and 2009 resulting from its

involvement with consolidated VIEs as of December 31, 2009 and 2008.unconsolidated VIEs in which the Corporation holds a variable interest. The Corporation’s maximum exposure to loss is based on the unlikely event that all of the assets in the VIEs become worthless and incorporates not only potential losses associated with assets recorded on the Corporation’s Consolidated Balance Sheet but also potential losses associated with off-balance sheet commitments such as unfunded liquidity commitments and other contractual arrangements. The Corporation’s maximum exposure to loss does not include losses previously recognized through write-downs of assets.


Consolidated VIEs

(Dollars in millions) Multi-Seller
Conduits
    

Loan and Other

Investment
Vehicles

    CDOs    Leveraged
Lease Trusts
    Other
Vehicles
    Total

Consolidated VIEs, December 31, 2009


Maximum loss exposure

 $9,388    $8,265    $3,863    $5,634    $1,463    $28,613

Consolidated Assets(1)


Trading account assets

 $    $145    $2,785    $    $548    $3,478

Derivative assets

       579               830     1,409

Available-for-sale debt securities

  3,492     1,799     1,414          23     6,728

Held-to-maturity debt securities

  2,899                         2,899

Loans and leases

  318     11,752          5,650          17,720

All other assets

  4     3,087               184     3,275

Total

 $6,713    $17,362    $4,199    $5,650    $1,585    $35,509

Consolidated Liabilities (1)


Commercial paper and other short-term borrowings

 $6,748    $    $    $    $987    $7,735

All other liabilities

       12,127     2,753     17     163     15,060

Total

 $6,748    $12,127    $2,753    $17    $1,150    $22,795

Consolidated VIEs, December 31, 2008


Maximum loss exposure

 $11,304    $3,189    $2,443    $5,774    $1,497    $24,207

Total assets of VIEs(1)

  9,368     4,449     2,443     5,829     1,631     23,720
(1)

Total assets and liabilities of consolidated VIEs are reported net of intercompany balances that have been eliminated in consolidation.

At December 31, 2009, the Corporation’s total maximum loss exposure to consolidated VIEs was $28.6 billion, which includes $5.9 billion attributable to the addition of Merrill Lynch, primarily loan and other investment vehicles and CDOs.

The table below presents total assets of unconsolidated VIEs in which the Corporation holds a significant variable interest and Corporation-sponsored unconsolidated VIEs in which the Corporation holds a variable interest, even if not significant, at December 31, 2009 and 2008. The table also presents the Corporation’s maximum exposure to loss resulting from its involvement with these VIEs at December 31, 2009 and 2008. The Corporation’s maximum exposure to loss is based on the unlikely event that all of the assets in the VIEs become worthless and

incorporates not only potential losses associated with assets recorded on the Corporation’s Consolidated Balance Sheet but also potential losses associatedSheet.

The Corporation invests in asset-backed securities issued by third-party VIEs with off-balance sheet commitmentswhich it has no other form of involvement. These securities are included inNote 3 – Trading Account Assets and LiabilitiesandNote 5 – Securities.In addition, the Corporation uses VIEs such as unfunded liquidity commitments and other contractual arrangements. The Corporation’s maximum exposure to loss does not include losses previously recognized through write-downs of assets. Certain QSPEs, principally municipal bondtrust preferred securities trusts in whichconnection with its funding activities as described inNote 13 – Long-term Debt. The Corporation also uses VIEs in the form of synthetic securitization vehicles to mitigate a portion of the credit risk on its residential mortgage loan portfolio, as described inNote 6 – Outstanding Loans and Leases. The Corporation uses VIEs, such as cash funds managed withinGWIM, to provide investment opportunities for clients. Prior to 2010, the Corporation has continuing involvementprovided support to certain of these cash funds in the form of capital commitments in the event the net asset value per unit of a fund declined below certain thresholds. The Corporation recorded a loss of

$195 million in 2009 as the result of these commitments, which were terminated in 2009. These VIEs, which are discussed inNote 8 – Securitizations andnot consolidated by the Corporation, are alsonot included in the table. Assets and liabilities of unconsolidated VIEs recorded on the Corporation’s Consolidated Balance Sheet at December 31, 2009 are also summarized below.

tables within this Note.

Unconsolidated VIEs

(Dollars in millions) Multi-
Seller
Conduits
    

Loan and
Other

Investment
Vehicles

    Real Estate
Investment
Vehicles
    Municipal
Bond
Trusts
    CDOs    Customer
Vehicles
    Other
Vehicles
    Total

Unconsolidated VIEs, December 31, 2009


Maximum loss exposure

 $25,135    $5,571    $4,812    $10,143    $6,987    $9,904    $1,232    $63,784

Total assets of VIEs

  13,893     11,507     4,812     12,247     56,590     13,755     1,232     114,036

On-balance sheet assets


Trading account assets

 $    $216    $    $191    $1,253    $1,118    $    $2,778

Derivative assets

       128          167     2,085     4,708     62     7,150

Available-for-sale debt securities

                      368               368

Loans and leases

  318     933                              1,251

All other assets

  60     4,287     4,812          166               9,325

Total

 $378    $5,564    $4,812    $358    $3,872    $5,826    $62    $20,872

On-balance sheet liabilities


Derivative liabilities

 $    $139    $    $287    $781    $154    $54    $1,415

All other liabilities

       581     1,460               856          2,897

Total

 $    $720    $1,460    $287    $781    $1,010    $54    $4,312

Unconsolidated VIEs, December 31, 2008


Maximum loss exposure

 $42,046    $2,789    $5,696    $7,145    $2,383    $5,741    $4,170    $69,970

Total assets of VIEs

  27,922     5,691     5,980     7,997     2,570     6,032     4,211     60,403

Bank of America 2009147


At December 31, 2009, the Corporation’s total maximum loss exposure to unconsolidated VIEs was $63.8 billion, which includes $19.7 billion attributable to the addition of Merrill Lynch, primarily customer vehicles, municipal bond trusts and CDOs.

Except as described below and with regard to the cash funds, as of December 31, 2010, the Corporation has not provided financial or other support to consolidated or unconsolidated VIEs that it was not previously contractually required to provide, nor does it intend to do so.

Multi-seller ConduitsMortgage-related Securitizations

First-lien Mortgages
As part of its mortgage banking activities, the Corporation securitizes a portion of the first-lien residential mortgage loans it originates or purchases from third parties, generally in the form of MBS guaranteed by GSEs, or GNMA in the case of FHA-insured and U.S. Department of Veteran Affairs (VA)-guaranteed mortgage loans. Securitization occurs in conjunction with or shortly after loan closing or purchase. In addition, the Corporation may, from time to time, securitize commercial mortgages it originates or purchases from other entities. The Corporation administers four multi-seller conduits which provide a low-cost funding alternative to its customers by facilitating their access totypically services the commercial paper market. These customers sell or otherwise transfer assets toloans it securitizes. Further, the conduits, whichCorporation may retain beneficial interests in turn issue short-term commercial paper that is rated high-gradethe securitization trusts including senior and is collateralizedsubordinate securities and equity tranches issued by the underlying assets. The Corporation receives fees for providing combinations of liquiditytrusts. Except as described below and SBLCs or similar loss protection commitments toinNote 9 – Representations and Warranties Obligations and Corporate Guarantees, the conduits. The Corporation also receives fees for serving as commercial paper placement agent and for providing administrative services to the conduits. The Corporation’s liquidity commitments are collateralized by various classes of assets and incorporate features such as overcollateralization and cash reserves that are designed to provide credit support to the conduits at a level equivalent to investment grade as determined in accordance with internal risk rating guidelines. Third parties participate in a small number of the liquidity facilities on a pari passu basis with the Corporation.

The Corporation determines whether it must consolidate a multi-seller conduit based on an analysis of projected cash flows using Monte Carlo simulations which are driven principally by credit risk inherent in the assets of the conduits. Interest rate risk is not included in the cash flow analysis because the conduits are not designed to absorb and pass along interest rate risk to investors. Instead, the assets of the conduits pay variable rates of interest based on the conduits’ funding costs. The assets of the conduits typically carry a risk rating of AAA to BBB based on the Corporation’s current internal risk rating equivalent which reflects structural enhancements of the assets including third party insurance. Projected loss calculations are based on maximum binding commitment amounts, probability of default based on the average one-year Moody’s Corporate Finance transition table, and recovery rates of 90 percent, 65 percent and 45 percent for senior, mezzanine and subordinate exposures. Approximately 98 percent of commitments in the unconsolidated conduits and 69 percent of commitments in the consolidated conduit are supported by senior exposures. Certain assets funded by one of the unconsolidated conduits benefit from embedded credit enhancement provided by the Corporation. Credit risk created by these assets is deemed to be credit risk of the Corporation which is absorbed by third party investors.

The Corporation does not consolidate three conduitsprovide guarantees or recourse to the securitization trusts other than standard representations and warranties.

The table below summarizes select information related to first-lien mortgage securitizations for 2010 and 2009.


  Residential Mortgage       
        Non-Agency  Commercial 
  Agency  Prime  Subprime  Alt-A  Mortgage 
(Dollars in millions) 2010  2009  2010  2009  2010  2009  2010  2009  2010  2009 
Cash proceeds from new securitizations (1)
 $243,901  $346,448  $  $  $  $  $7  $  $4,227  $313 
Gain (loss) on securitizations, net of hedges (2)
  (473)  73                         
Cash flows received on residual interests        18   25   58   71   2   5   20   23 
                                         
(1)The Corporation sells residential mortgage loans to GSEs in the normal course of business and receives MBS in exchange which may then be sold into the market to third-party investors for cash proceeds.
(2)Substantially all of the first-lien residential mortgage loans securitized are initially classified as LHFS and accounted for under the fair value option. As such, gains are recognized on these LHFS prior to securitization. During 2010 and 2009, the Corporation recognized $5.1 billion and $5.5 billion of gains on these LHFS, net of hedges.

In addition to cash proceeds as it does not expect to absorb a majority of the variability created by the credit risk of the assets heldreported in the conduits. On a combined basis,table above, the Corporation received securities with an initial fair value of $23.7 billion in connection with agency first-lien residential mortgage securitizations in 2010. All of these three conduits have issued approximately $147 millionsecurities were initially classified as Level 2 assets within the fair value hierarchy. During 2010, there were no changes to the initial classification.
The Corporation recognizes consumer MSRs from the sale or securitization of capital notesfirst-lien mortgage loans. Servicing fee and equity interests to third parties, $142 million of which was outstandingancillary fee income on consumer mortgage loans serviced, including securitizations where the Corporation has continuing involvement, were $6.4 billion and $6.2 billion in 2010 and 2009. Servicing advances on consumer mortgage loans, including securitizations where the Corporation has continuing involvement, were $24.3 billion and $19.3 billion at December 31, 2010 and 2009. These instruments will absorb credit risk on a first loss basis. The Corporation consolidatesmay have the fourth conduitoption to repurchase delinquent loans out of

securitization trusts, which reduces the amount of servicing advances it is required to make. During 2010 and 2009, $14.5 billion and $13.1 billion of loans were repurchased from first-lien securitization trusts as a result of loan delinquencies or in order to perform modifications. The majority of these loans repurchased were FHA insured mortgages collateralizing GNMA securities. In addition, the Corporation has not issued capital notesretained commercial MSRs from the sale or equity interests to third parties.

Atsecuritization of commercial mortgage loans. Servicing fee and ancillary fee income on commercial mortgage loans serviced, including securitizations where the Corporation has continuing involvement, were $21 million and $49 million in 2010 and 2009. Servicing advances on commercial mortgage loans, including securitizations where the Corporation has continuing involvement, were $156 million and $109 million at December 31, 2009,2010 and 2009.


174     Bank of America 2010


The table below summarizes select information related to first-lien mortgage securitization trusts in which the assetsCorporation held a variable interest at December 31, 2010 and 2009.
                                         
  Residential Mortgage       
        Non-Agency       
  Agency  Prime  Subprime  Alt-A  Commercial Mortgage 
  December 31        December 31        December 31 
(Dollars in millions) 2010  2009  2010  2009  2010  2009  2010  2009  2010  2009 
Unconsolidated VIEs
                                        
Maximum loss exposure (1)
 $44,988  $14,398  $2,794  $4,068  $416  $224  $651  $996  $1,199  $1,877 
                                         
On-balance sheet assets                                        
Senior securities held(2):
                                        
Trading account assets $9,526  $2,295  $147  $201  $126  $12  $645  $431  $146  $469 
AFS debt securities  35,400   12,103   2,593   3,845   234   188      561   984   1,215 
Subordinate securities held(2):
                                        
Trading account assets              12            8   122 
AFS debt securities        39   13   35   22   6   4       23 
Residual interests held  62      6   9   9   2         61   48 
All other assets        9                      
                                         
Total retained positions
 $44,988  $14,398  $2,794  $4,068  $416  $224  $651  $996  $1,199  $1,877 
                                         
Principal balance outstanding(3)
 $1,297,159  $1,255,650  $75,762  $81,012  $92,710  $83,065  $116,233  $147,072  $73,597  $65,397 
                                         
Consolidated VIEs
                                        
Maximum loss exposure (1)
 $32,746  $1,683  $46  $472  $42  $1,261  $  $  $  $ 
                                         
On-balance sheet assets                                        
Loans and leases $32,563  $1,689  $  $  $  $450  $  $  $  $ 
Allowance for loan and lease losses  (37)  (6)                        
Loansheld-for-sale
           436   732   2,030             
All other assets  220      46   86   16   271             
                                         
Total assets
 $32,746  $1,683  $46  $522  $748  $2,751  $  $  $  $ 
                                         
On-balance sheet liabilities                                        
Long-term debt $  $  $  $48  $  $1,737  $  $  $  $ 
All other liabilities  3      9   3   768   3             
                                         
Total liabilities
 $3  $  $9  $51  $768  $1,740  $  $  $  $ 
                                         
(1)Maximum loss exposure excludes the liability for representations and warranties obligations and corporate guarantees and also excludes servicing advances. For more information, seeNote 9 – Representations and Warranties Obligations and Corporate Guarantees.
(2)As a holder of these securities, the Corporation receives scheduled principal and interest payments. During 2010 and 2009, there were no OTTI losses recorded on those securities classified as AFS debt securities.
(3)Principal balance outstanding includes loans the Corporation transferred with which the Corporation has continuing involvement, which may include servicing the loans.
Bank of America 2010     175


Home Equity Mortgages
The Corporation maintains interests in home equity securitization trusts to which the consolidated conduit, which consist primarily of debtCorporation transferred home equity loans. These retained interests include senior and subordinate securities and the conduit’s unfunded liquidity commitments were mainly collateralized by $2.2 billion in credit card loans (25 percent), $1.1 billion in student loans (12 percent), $1.0 billion in auto loans (11 percent), $680 million in trade receivables (eight percent) and $377 million in equipment loans (four percent).residual interests. In addition, $3.0 billion of the Corporation’s liquidity commitments were collateralized by projected cash flows from long-term contracts (e.g., television broad - -

cast contracts, stadium revenues and royalty payments) which, as mentioned above, incorporate features that provide credit support. Amounts advanced under these arrangements will be repaid when cash flows due under the long-term contracts are received. Approximately 74 percent of this exposure is insured. At December 31, 2009, the weighted-average life of assets in the consolidated conduit was estimated to be 3.4 years and the weighted-average maturity of commercial paper issued by this conduit was 33 days. Assets of the Corporation are not available to pay creditors of the consolidated conduit except to the extent the Corporation may be obligated to perform under the liquidity commitments and SBLCs. Assets of the consolidated conduit are not available to pay creditors of the Corporation.

The Corporation’s liquidity commitmentsprovide subordinate funding to the unconsolidated conduits, alltrusts during a rapid amortization event. The Corporation also services the loans in the trusts. Except as described below and inNote 9 – Representations and Warranties Obligations and Corporate Guarantees, the Corporation does not provide guarantees or recourse to the securitization trusts other

than standard representations and warranties. There were no securitizations of home equity loans during 2010 and 2009. Collections reinvested in revolving period securitizations were $21 million and $177 million during 2010 and 2009. Cash flows received on residual interests were $12 million and $35 million in 2010 and 2009.
The table below summarizes select information related to home equity loan securitization trusts in which were unfundedthe Corporation held a variable interest at December 31, 2010 and 2009.


  December 31 
  2010  2009 
     Retained
     Retained
 
     Interests in
     Interests in
 
  Consolidated
  Unconsolidated
     Unconsolidated
 
(Dollars in millions) VIEs  VIEs  Total  VIEs 
Maximum loss exposure(1)
 $3,192  $9,132  $12,324  $13,947 
                 
On-balance sheet assets                
Trading account assets(2, 3)
 $  $209  $209  $16 
Available-for-sale debt securities(3, 4)
     35   35   147 
Loans and leases  3,529      3,529    
Allowance for loan and lease losses  (337)     (337)   
                 
Total
 $3,192  $244  $3,436  $163 
                 
On-balance sheet liabilities                
Long-term debt $3,635  $  $3,635  $ 
All other liabilities  23      23    
                 
Total
 $3,658  $  $3,658  $ 
                 
Principal balance outstanding $3,529  $20,095  $23,624  $31,869 
                 
(1)For unconsolidated VIEs, the maximum loss exposure includes outstanding trust certificates issued by trusts in rapid amortization, net of recorded reserves, and excludes the liability for representations and warranties and corporate guarantees.
(2)At December 31, 2010 and 2009, $204 million and $15 million of the debt securities classified as trading account assets were senior securities and $5 million and $1 million were subordinate securities.
(3)As a holder of these securities, the Corporation receives scheduled principal and interest payments. During 2010 and 2009, there were no OTTI losses recorded on those securities classified as AFS debt securities.
(4)At December 31, 2010 and 2009, $35 million and $47 million represent subordinate debt securities held. At December 31, 2009, $100 million are residual interests classified as AFS debt securities.

Under the terms of the Corporation’s home equity loan securitizations, advances are made to borrowers when they draw on their lines of credit and the Corporation is reimbursed for those advances from the cash flows in the securitization. During the revolving period of the securitization, this reimbursement normally occurs within a short period after the advance. However, when certain securitization transactions have begun a rapid amortization period, reimbursement of the Corporation’s advance occurs only after other parties in the securitization have received all of the cash flows to which they are entitled. This has the effect of extending the time period for which the Corporation’s advances are outstanding. In addition, if loan losses requiring draws on monoline insurers’ policies, which protect the bondholders in the securitization, exceed a specified threshold or duration, the Corporation may not receive reimbursement for all of the funds advanced to borrowers, as the senior bondholders and the monoline insurers have priority for repayment.
Substantially all of the home equity loan securitizations for which the Corporation has an obligation to provide subordinate advances have entered rapid amortization. The Corporation evaluates each of these securitizations for potential losses due to non-recoverable advances by estimating the amount and timing of future losses on the underlying loans, the excess spread available to cover such losses and potential cash flow shortfalls during rapid amortization. A maximum funding obligation attributable to rapid

amortization cannot be calculated as a home equity borrower has the ability to pay down and re-draw balances. At December 31, 2010 and 2009, pertainedhome equity loan securitization transactions in rapid amortization, including both consolidated and unconsolidated trusts, had $12.5 billion and $14.1 billion of trust certificates outstanding. This amount is significantly greater than the amount the Corporation expects to facilitiesfund. At December 31, 2010, the remaining $93 million of trust certificates outstanding related to these types of securitization transactions are expected to enter rapid amortization during the next 12 months. The charges that were mainly collateralized by $4.4 billionwill ultimately be recorded as a result of the rapid amortization events depend on the performance of the loans, the amount of subsequent draws and the timing of related cash flows. At December 31, 2010 and 2009, the reserve for losses on expected future draw obligations on the home equity loan securitizations in trade receivables (18 percent), $3.9 billionor expected to be in autorapid amortization was $131 million and $178 million.
The Corporation has consumer MSRs from the sale or securitization of home equity loans. The Corporation recorded $79 million and $128 million of servicing fee income related to home equity securitizations during 2010 and 2009. The Corporation repurchased $17 million and $31 million of loans (16 percent), $3.5 billionfrom home equity securitization trusts in order to perform modifications or pursuant to clean up calls during 2010 and 2009.


176     Bank of America 2010


Credit Card Securitizations
The Corporation securitizes originated and purchased credit card loans. The Corporation’s continuing involvement with the securitization trusts includes servicing the receivables, retaining an undivided interest (seller’s interest) in the receivables, and holding certain retained interests including senior and subordinate securities, discount receivables, subordinate interests in accrued interest and fees on the securitized receivables, and cash reserve accounts. The Corporation consolidated all credit card securitization trusts on

January 1, 2010 in accordance with new consolidation guidance. Certain retained interests, including senior and subordinate securities, were eliminated in consolidation. The seller’s interest in the trusts, which is pari passu to the investors’ interest, and the discount receivables continue to be classified in loans (15 percent), $2.6and leases.
The table below summarizes select information related to credit card securitization trusts in which the Corporation held a variable interest at December 31, 2010 and 2009.


  December 31 
  2010  2009 
  Consolidated
  Retained Interests in
 
(Dollars in millions) VIEs  Unconsolidated VIEs 
Maximum loss exposure(1)
 $36,596  $32,167 
         
On-balance sheet assets        
Trading account assets $  $80 
Available-for-sale debt securities (2)
     8,501 
Held-to-maturity securities (2)
     6,573 
Loans and leases (3)
  92,104   14,905 
Allowance for loan and lease losses  (8,505)  (1,727)
Derivative assets  1,778    
All other assets (4)
  4,259   1,547 
         
Total
 $89,636  $29,879 
         
On-balance sheet liabilities        
Long-term debt $52,781  $ 
All other liabilities  259    
         
Total
 $53,040  $ 
         
Trust loans $92,104  $103,309 
         
(1)At December 31, 2009, maximum loss exposure represents the total retained interests held by the Corporation and also includes $2.3 billion related to a liquidity support commitment the Corporation provided to one of the U.S. Credit Card Securitization Trust’s commercial paper program. This commercial paper program was terminated in 2010.
(2)As a holder of these securities, the Corporation receives scheduled principal and interest payments. During 2009, there were no OTTI losses recorded on those securities classified as AFS or HTM debt securities.
(3)At December 31, 2010 and 2009, loans and leases includes $20.4 billion and $10.8 billion of seller’s interest and $3.8 billion and $4.1 billion of discount receivables.
(4)At December 31, 2010, all other assets includes restricted cash accounts and unbilled accrued interest and fees. At December 31, 2009, all other assets includes discount subordinate interests in accrued interest and fees on the securitized receivables, cash reserve accounts and interest-only strips which are carried at fair value.

During 2010, $2.9 billion of new senior debt securities were issued to external investors from the credit card securitization trusts. There were no new debt securities issued to external investors from the credit card securitization trusts during 2009. Collections reinvested in student loans (11 percent),revolving period securitizations were $133.8 billion and cash flows received on residual interests were $5.5 billion during 2009.
At December 31, 2009, there were no recognized servicing assets or liabilities associated with any of the credit card securitization transactions. The Corporation recorded $2.0 billion in equipment loans (eight percent).servicing fees related to credit card securitizations during 2009.
During 2010 and 2009, subordinate securities with a notional principal amount of $11.5 billion and $7.8 billion and a stated interest rate of zero percent were issued by certain credit card securitization trusts to the Corporation. In addition, $5.6 billion (24 percent)the Corporation has elected to designate a specified percentage of new receivables transferred to the trusts as “discount

receivables” such that principal collections thereon are added to finance charges which increases the yield in the trust. Through the designation of newly transferred receivables as discount receivables, the Corporation has subordinated a portion of its seller’s interest to the investors’ interest. These actions, which were specifically permitted by the terms of the trust documents, were taken in an effort to address the decline in the excess spread of the U.S. and U.K. Credit Card Securitization Trusts. As these trusts were consolidated on January 1, 2010, the issuance of subordinate securities and the discount receivables election had no impact on the Corporation’s commitments were collateralized by the conduits’ short-term lending arrangements with investment funds, primarily real estate funds, which, as mentioned above, incorporate features that provide credit support. Amounts advanced under these arrangements are secured by a diverse group of high quality equity investors. Outstanding advances under these facilities will be repaid when the investment funds issue capital calls.consolidated results during 2010 or 2009. At December 31, 2009, the weighted-average life of assets in the unconsolidated conduits was estimated to be 2.4 yearscarrying amount and the weighted-average maturity of commercial paper issued by these conduits was 37 days. At December 31, 2009 and 2008, the Corporation did not hold any commercial paper issued by the multi-seller conduits other than incidentally and in its role as a commercial paper dealer.

The Corporation’s liquidity, SBLCs and similar loss protection commitments obligate it to purchase assets from the conduits at the conduits’ cost. Subsequent realized losses on assets purchased from the unconsolidated conduits would be reimbursed from restricted cash accounts that were funded by the issuance of capital notes and equity interests to third party investors. The Corporation would absorb losses in excess of such amounts. If a conduit is unable to re-issue commercial paper due to illiquidity in the commercial paper markets or deterioration in the asset portfolio, the Corporation is obligated to provide funding subject to the following limitations. The Corporation’s obligation to purchase assets under the SBLCs and similar loss protection commitments is subject to a maximum commitment amount which is typically set at eight to 10 percent of total outstanding commercial paper. The Corporation’s obligation to purchase assets under the liquidity agreements, which comprise the remainder of its exposure, is generally limited to the amount of non-defaulted assets. Although the SBLCs are unconditional, the Corporation is not obligated to fund under other liquidity or loss protection commitments if the conduit is the subject of a voluntary or involuntary bankruptcy proceeding.

Onefair value of the unconsolidated conduits holds CDO investmentsretained subordinate securities were $6.6 billion and $6.4 billion. These balances were eliminated on January 1, 2010 with aggregatethe consolidation of the trusts. The outstanding funded amountsprincipal balance of $318 milliondiscount receivables, which are classified in loans and $388 millionleases, was $3.8 billion and unfunded commitments of $225 million and $162 million$4.1 billion at December 31, 20092010 and 2009.


Bank of America 2010     177


Other Asset-backed Securitizations
Other asset-backed securitizations include resecuritization trusts, municipal bond trusts, and automobile and other securitization trusts. The table below summarizes select information related to other asset-backed securitizations in which the Corporation held a variable interest at December 31, 2008. At December 31, 2009, $190 million of the conduit’s total exposure pertained to an insured CDO which holds middle market loans. The underlying collateral of the remaining CDO investments includes $33 million of subprime mortgages2010 and other investment grade securities. All of the unfunded commitments are revolving commitments to the insured CDO. During 2009 and 2008, these investments were downgraded or threatened with a downgrade by the ratings agencies. In accordance with the terms of the Corporation’s

2009.

                         
        Automobile and Other
 
  Resecuritization Trusts  Municipal Bond Trusts  Securitization Trusts 
  December 31  December 31  December 31 
(Dollars in millions) 2010  2009  2010  2009  2010  2009 
Unconsolidated VIEs
                        
Maximum loss exposure
 $21,425  $543  $4,261  $10,143  $141  $2,511 
                         
On-balance sheet assets                        
Senior securities held(1, 2):
                        
Trading account assets $2,324  $543  $255  $155  $  $ 
AFS debt securities  17,989            109   2,212 
Subordinate securities held(1, 2):
                        
Trading account assets  2                
AFS debt securities  1,036               195 
Residual interests held (3)
  74         203      83 
All other assets              17   5 
                         
Total retained positions
 $21,425  $543  $255  $358  $126  $2,495 
                         
Total assets of VIEs $55,006  $7,443  $6,108  $12,247  $774  $3,636 
                         
Consolidated VIEs
                        
Maximum loss exposure
 $  $  $4,716  $241  $2,061  $908 
                         
On-balance sheet assets                        
Trading account assets $68  $  $4,716  $241  $  $ 
Loans and leases              9,583   8,292 
Allowance for loan and lease losses              (29)  (101)
All other assets              196   25 
                         
Total assets
 $68  $  $4,716  $241  $9,750  $8,216 
                         
On-balance sheet liabilities                        
Commercial paper and other short-term borrowings $  $  $4,921  $  $  $ 
Long-term debt  68            7,681   7,308 
All other liabilities           2   101    
                         
Total liabilities
 $68  $  $4,921  $2  $7,782  $7,308 
                         
148(1)BankAs a holder of Americathese securities, the Corporation receives scheduled principal and interest payments. During 2010 and 2009, there were no significant OTTI losses recorded on those securities classified as AFS debt securities.
(2)The retained senior and subordinate securities were valued using quoted market prices or observable market inputs (Level 2 of the fair value hierarchy).
(3)The retained residual interests are carried at fair value which was derived using model valuations (Level 3 of the fair value hierarchy).


Resecuritization Trusts
The Corporation transfers existing securities, typically MBS, into resecuritization vehicles at the request of customers seeking securities with specific characteristics. The Corporation may also enter into resecuritizations of securities within its investment portfolio for purposes of improving liquidity obligations,and capital, and managing credit or interest rate risk. Generally, there are no significant ongoing activities performed in a resecuritization trust and no single investor has the conduit had transferredunilateral ability to liquidate the funded investments totrust.
During 2010, the Corporation resecuritized $97.7 billion of MBS, including $71.3 billion of securities purchased from third parties compared to $49.2 billion in a transaction that was accounted for as a financing transaction due2009. Net losses upon sale totaled $144 million during 2010 compared to the conduit’s continuing exposure to credit lossesnet gains of the investments. As a result of the transfer, the CDO investments no longer serve as collateral for commercial paper issuances.

The transfers were performed$213 million in accordance with existing contractual requirements. The Corporation did not provide support to the conduit that was not contractually required nor does it intend to provide support in the future that is not contractually required. The Corporation performs reconsideration analyses for the conduit at least quarterly, and the CDO investments are included in these analyses. The Corporation will be reimbursed for any realized credit losses on these CDO investments up to the amount of capital notes issued by the conduit which totaled $116 million at December 31, 2009 and $66 million at December 31, 2008. Any realized losses on the CDO investments that are caused by market illiquidity or changes in market rates of interest will be borne by the Corporation. The Corporation will also bear any credit-related losses in excess of the amount of capital notes issued by the conduit. The Corporation’s maximum exposure to loss from the CDO investments was $428 million at December 31, 2009 and $484 million at December 31, 2008, based on the combined funded amounts and unfunded commitments less the amount of cash proceeds from the issuance of capital notes which are held in a segregated account.

There were no other significant downgrades or losses recorded in earnings from write-downs of assets held by any of the conduits during 2009.

The liquidity commitments and SBLCs provided to unconsolidated conduits are included inNote 14 – Commitments and Contingencies.

Loan and Other Investment Vehicles

Loan and other investment vehicles at December 31, 2009 and 2008 include loan securitization trusts that did not meet the requirements to be QSPEs, loan financing arrangements, and vehicles that invest in financial assets, typically debt securities or loans. The Corporation determines whether it is the primary beneficiary of and must consolidate these investment vehicles based principally on a determination as to which party is expected to absorb a majority of the credit risk or market risk created by the assets of the vehicle. Typically, the party holding subordinated or residual interests in a vehicle will absorb a majority of the risk.

Certain loan securitization trusts were designed to meet QSPE requirements but fail to do so, typically as a result of derivatives entered into by the trusts that pertain to interests ultimately retained by the Corporation due to its inability to sell such interests as a result of illiquidity in the market. The assets have been pledged to the investors in the trusts. The Corporation consolidates these loan securitization trustsa resecuritization trust if it has sole discretion over the design of the trust, including the identification of securities to be transferred in and the structure of securities to be issued, and also retains a variable interest that could potentially be significant to the residual interest intrust. If one or a limited number of third-party investors share responsibility for the design of the trust and expectspurchase a significant portion of subordinate securities, the Corporation does not consolidate the trust. Prior to absorb a majority of the variability in cash flows created2010, these resecuritization trusts were typically QSPEs and as such were not subject to consolidation by the loans held in the trust. Investors in consolidated loan securitization trusts have no recourse to the general credit of the Corporation as their investments are repaid solely from the assets of the vehicle.

The Corporation uses financing arrangements with SPEs administered by third parties to obtain low-cost funding for certain financial assets, principally commercial loans and debt securities. The third party SPEs, typically commercial paper conduits, hold the specified assets subject to total return swaps with the Corporation. If the assets are transferred to the third party from the Corporation, the transfer is accounted for as a secured borrowing. If the third party commercial paper conduit issues a discrete series of commercial paper whose only source of repayment is the specified asset and the total return swap with the Corporation, thus creating a “silo” structure within the conduit, the Corporation consolidates that silo.

The Corporation has made investments in alternative investment funds that are considered to be VIEs because they do not have sufficient legal form equity at risk to finance their activities or the holders of the equity at risk do not have control over the activities of the vehicles. The Corporation consolidates these funds if it holds a majority of the investment in the fund. The Corporation also sponsors funds that provide a guaranteed return to investors at the maturity of the fund. This guarantee may include a guarantee of the return of an initial investment or the initial investment plus an agreed upon return depending on the terms of the fund. Investors in certain of these funds have recourse to the Corporation to the extent that the value of the assets held by the funds at maturity is less than the guaranteed amount. The Corporation consolidates these funds if the Corporation’s guarantee is expected to absorb a majority of the variability created by the assets of the fund.

Real Estate Investment Vehicles

The Corporation’s investment in real estate investment vehicles at December 31, 2009 and 2008 consisted principally of limited partnership investments in unconsolidated limited partnerships that finance the construction and rehabilitation of affordable rental housing. The Corporation earns a return primarily through the receipt of tax credits allocated to the affordable housing projects.

The Corporation determines whether it must consolidate these limited partnerships based on a determination as to which party is expected to absorb a majority of the risk created by the real estate held in the vehicle, which may include construction, market and operating risk. Typically, the general partner in a limited partnership will absorb a majority of this risk due to the legal nature of the limited partnership structure and accordingly will consolidate the vehicle. The Corporation’s risk of loss is mitigated by policies requiring that the project qualify for the expected tax credits prior to making its investment. The Corporation may from time to time be asked to invest additional amounts to support a troubled project. Such additional investments have not been and are not expected to be significant.

Municipal Bond Trusts

The Corporation administers municipal bond trusts that hold highly-rated,highly rated, long-term, fixed-rate municipal bonds, some of which are callable prior to maturity.bonds. The vast majority of the bonds are rated AAA or AA and some of the bonds benefit from insurance provided by monolines. The trusts obtain financing by issuing floating-rate trust certificates that reprice on a weekly or other basis to third partythird-party investors. The Corporation may serve as remarketing agentand/or liquidity provider for the trusts. The floating-rate investors have the right to tender the certificates at specified dates, often with as little as seven days’ notice. Should the Corporation be unable to remarket the tendered certificates, it is generally obligated to purchase them at par under standby liquidity facilities. The Corporation is not obligated to purchasefacilities unless the certificates under the standby liquidity facilities if a bond’s credit rating declineshas declined below investment gradeinvestment-grade or in thethere has been an event of certain defaultsdefault or bankruptcy of the issuer and insurer. The weighted-average remaining life


178     Bank of bonds held in the trusts at December 31, 2009 was 13.6 years. There were no material write-downs or downgrades of assets or issuers during 2009.America 2010

In addition to standby liquidity facilities, the


The Corporation also provides default protection or credit enhancement to investors in securities issued by certain municipal bond trusts. Interesttrusts whereby the Corporation guarantees the payment of interest and principal payments on floating-rate certificates issued by these trusts are secured by an unconditional guarantee issued by the Corporation. Inin the event thatof default by the issuer of the underlying municipal bond defaults on any payment of principal and/or interest when due, the Corporation will make any required payments to the holders of the floating-rate certificates.


Bank of America 2009149


Some of these trusts are QSPEs and, as such, are not subject to consolidation by the Corporation. The Corporation consolidates those trusts that are not QSPEs if it holds the residual interests or otherwise expects to absorbbond. If a majority of the variability created by changes in market value of assets in the trusts and changes in market rates of interest. The Corporation does not consolidate a trust if the customer holds the residual interest andin a trust, that customer typically has the unilateral ability to liquidate the trust at any time, while the Corporation is protected from loss in connection with its liquidity obligations. For example, the Corporation may havetypically has the ability to trigger the liquidation of athat trust that is not a QSPE if the market value of the bonds held in the trust declines below a specified threshold whichthreshold. This arrangement is designed to limit market losses to an amount that is less than the customer’s residual interest, effectively preventing the Corporation from absorbing the losses incurred on the assets held within that trust. The weighted-average remaining life of bonds held in the trust.

trusts at December 31, 2010 was 13.3 years. There were no material write-downs or downgrades of assets or issuers during 2010.

During 2010 and 2009, the Corporation was the transferor of assets into unconsolidated municipal bond trusts and received cash proceeds from new securitizations of $1.2 billion and $664 million. At December 31, 2010 and 2009, the principal balance outstanding for unconsolidated municipal bond securitization trusts for which the Corporation was transferor was $2.2 billion and $6.9 billion.
The Corporation’s liquidity commitments to unconsolidated municipal bond trusts, including those for which the Corporation was transferor, totaled $9.8$4.0 billion and $6.8$9.8 billion at December 31, 20092010 and 2008. 2009.
Automobile and Other Securitization Trusts
The increase is due principallyCorporation transfers automobile and other loans into securitization trusts, typically to improve liquidity or manage credit risk. At December 31, 2010, the additionCorporation serviced assets or otherwise had continuing

involvement with automobile and other securitization trusts with outstanding balances of unconsolidated$10.5 billion, including trusts acquired through the Merrill Lynch acquisition.collateralized by automobile loans of $8.4 billion, student loans of $1.3 billion, and other loans and receivables of $774 million. At December 31, 2009, the Corporation serviced assets or otherwise had continuing involvement with automobile and 2008,other securitization trusts with outstanding balances of $11.9 billion, including trusts collateralized by automobile loans of $11.0 billion and other loans of $905 million. The Corporation transferred $3.0 billion of automobile loans, $1.3 billion of student loans and $303 million of other receivables to the trusts during 2010 and $9.0 billion of automobile loans during 2009.
Multi-seller Conduits
The Corporation previously administered four multi-seller conduits which provided a low-cost funding alternative to the conduits’ customers by facilitating access to the commercial paper market. These customers sold or otherwise transferred assets to the conduits, which in turn issued short-term commercial paper that was rated high-grade and was collateralized by the underlying assets. The Corporation provided combinations of liquidity and SBLCs to the conduits for the benefit of third-party investors. These commitments had an aggregate notional amount outstanding of $34.5 billion at December 31, 2009. The Corporation liquidated the four conduits and terminated all liquidity and other commitments during 2010. Liquidation of the conduits did not impact the Corporation’s consolidated results of operations.
The table below summarizes select information related to multi-seller conduits in which the Corporation held $155 million and $688 milliona variable interest at December 31, 2009.


  December 31, 2009 
(Dollars in millions) Consolidated  Unconsolidated  Total 
Maximum loss exposure
 $9,388  $25,135  $34,523 
             
On-balance sheet assets            
Available-for-sale debt securities
 $3,492  $  $3,492 
Held-to-maturity debt securities
  2,899      2,899 
Loans and leases  318   318   636 
All other assets  4   60   64 
             
Total
 $6,713  $378  $7,091 
             
On-balance sheet liabilities            
Commercial paper and other short-term borrowings $6,748  $  $6,748 
             
Total
 $6,748  $  $6,748 
             
Total assets of VIEs $6,713  $13,893  $20,606 
             
Bank of floating-rate certificates issued by the municipal bond trusts in trading account assets.America 2010     179


Collateralized Debt Obligation Vehicles

CDO vehicles hold diversified pools of fixed incomefixed-income securities, typically corporate debt or asset-backed securities, which they fund by issuing multiple tranches of debt and equity securities. Synthetic CDOs enter into a portfolio of credit default swaps to synthetically create exposure to fixed incomefixed-income securities. Collateralized loan obligations (CLOs)CLOs are a subset of CDOs which hold pools of loans, typically corporate loans or commercial mortgages. CDOs are typically managed by third partythird-party portfolio managers. The Corporation transfers assets to these CDOs, holds securities issued by the CDOs and may be a derivative counterparty to the CDOs, including a credit default swap counterparty for synthetic CDOs. The

Corporation has also entered into total return swaps with certain CDOs whereby the Corporation absorbs the economic returns generated by specified assets held by the CDO. The Corporation receives fees for structuring CDOs and providing liquidity support for super senior tranches of securities issued by certain CDOs. The Corporation has also entered into total return swaps with certain CDOs whereby the Corporation will absorb the economic returns generated by specified assets held by the CDO. No third parties provide a significant amount of similar commitments to these CDOs.

The Corporation evaluates whether it must consolidate atable below summarizes select information related to CDO based principally on a determination as tovehicles in which party is expected to absorb a majority of the credit risk created by the assets of the CDO. The Corporation does not typically retain a significant portion of debt securities issued by a CDO. When the Corporation structured certain CDOs, it acquired the super senior tranches, which are the most senior classheld a variable interest at December 31, 2010 and 2009.


  December 31 
  2010  2009 
(Dollars in millions) Consolidated  Unconsolidated  Total  Consolidated  Unconsolidated  Total 
Maximum loss exposure(1)
 $2,971  $3,828  $6,799  $3,863  $6,987  $10,850 
                         
On-balance sheet assets                        
Trading account assets $2,485  $884  $3,369  $2,785  $1,253  $4,038 
Derivative assets  207   890   1,097      2,085   2,085 
Available-for-sale debt securities
  769   338   1,107   1,414   368   1,782 
All other assets  24   123   147      166   166 
                         
Total
 $3,485  $2,235  $5,720  $4,199  $3,872  $8,071 
                         
On-balance sheet liabilities                        
Derivative liabilities $  $58  $58  $  $781  $781 
Long-term debt  3,162      3,162   2,753      2,753 
                         
Total
 $3,162  $58  $3,220  $2,753  $781  $3,534 
                         
Total assets of VIEs $3,485  $43,476  $46,961  $4,199  $56,590  $60,789 
                         
(1)Maximum loss exposure is net of credit protection purchased from the CDO with which the Corporation has involvement but has not been reduced to reflect the benefit of insurance purchased from other third parties.

The Corporation’s maximum loss exposure of securities issued by the CDOs and benefit from the subordination of all other securities issued by the vehicle, or provided commitments to support the issuance$6.8 billion at December 31, 2010 includes $1.8 billion of super senior commercial paperCDO exposure, $2.2 billion of exposure to CDO financing facilities and $2.8 billion of other non-super senior exposure. This exposure is calculated on a gross basis and does not reflect any benefit from insurance purchased from third parties. Whenparties other than the CDOs were first created, the Corporation did not expect its investments or its liquidity commitments to absorb a significant amountCDO itself. Net of the variability driven by the credit risk within the CDOs and did not consolidate the CDOs. When the Corporation subsequently acquired commercial paper or termpurchased insurance but including securities issued by certain CDOs during 2009 and 2008, principally as a resultretained from liquidations of its liquidity obligations, updated consolidation analyses were performed. Due to credit deterioration in the pools of securities held by the CDOs, the updated analyses indicated that the Corporation would now be expectedCorporation’s net exposure to absorb a majority of the variability, and accordingly, these CDOs were consolidated. Consolidation did not have a significant impactsuper senior CDO-related positions was $1.2 billion at December 31, 2010. The CDO financing facilities, which are consolidated, obtain funding from third parties for CDO positions which are principally classified in trading account assets on the Corporation’s resultsConsolidated Balance Sheet. The CDO financing facilities’ long-term debt at December 31, 2010 totaled $2.6 billion, all of operations, as the Corporation’s investments and liquidity obligations were recorded at fair value prior to consolidation. The creditors of the consolidated CDOs have nowhich has recourse to the general credit of the Corporation.

The

At December 31, 2009 CDO balances include a portfolio of liquidity exposures obtained in connection with2010, the Merrill Lynch acquisition,

including $1.9 billionCorporation had $951 million notional amount of liquidity support provided to certain synthetic CDOs in the form of unfunded lending commitments related to super senior securities. The lending commitments obligate the Corporation to purchase the super senior CDO securities at par value if the CDOs need cash to make payments due under credit default swaps held by the CDOs. This portfolio also includes an additional $1.3 billion notional amount of liquidity exposure, to non-SPEincluding derivatives and other exposures with third parties that hold super senior cash positions on the Corporation’s behalf. The Corporation’s net exposurebehalf and to loss on these positions, after write-downs and insurance, was $88 millioncertain synthetic CDOs through which the Corporation is obligated to purchase super senior CDO securities at December 31, 2009.par value if the CDOs

need cash to make payments due under credit default swaps written by the CDO vehicles. Liquidity-related commitments also include $1.4$1.7 billion notional amount of derivative contracts with unconsolidated SPEs,special purpose entities (SPEs), principally CDO vehicles, which hold non-super senior CDO debt securities or other debt securities on the Corporation’s behalf. These derivatives are typically in the form of total return swaps which obligate the Corporation to purchase the securities at the SPE’s cost to acquire the securities, generally as a result of ratings downgrades. The underlying securities are senior securities andcomprise substantially all of the Corporation’s exposures are insured. Accordingly, the Corporation’s exposure to loss consists principally of counterparty risk to the insurers. These derivatives are included in the $2.8$1.7 billion notional amount of derivative contracts through which the Corporation obtains funding from third partythird-party SPEs, discussedas described inNote 14 –Commitments and ContingenciesContingencies..

The $4.6Corporation’s $2.7 billion of aggregate liquidity exposure described aboveto CDOs at December 31, 2010 is included in the Unconsolidated VIEs table above to the extent that the Corporation’s involvement withCorporation sponsored the CDO vehicle meetsor the requirements for disclosure. For example, ifliquidity exposure is more than insignificant compared to total assets of the Corporation did not sponsor a CDO vehicle and does not hold a significant variable interest, the vehicle is notvehicle. Liquidity exposure included in the table.

Including such liquidity commitments, the portfoliotable is reported net of CDO investments obtained in connection with the Merrill Lynch acquisition and included in the Unconsolidated VIEs table pertains to CDO vehicles with total assets of $55.6 billion. previously recorded losses.

The Corporation’s maximum exposure to loss with regard to these positions is $6.0 billion. This amount is significantly less than the total assets of the CDO vehicles in the table above because the Corporation typically has exposure to only a portion of the total assets. The Corporation has also purchased credit protection from some of the same CDO vehicles in which it invested, thus reducing net exposure to future loss.

At December 31, 2008, liquidity commitments provided to CDOs included written put options with a notional amount of $542 million. All of these written put options were terminated in the first quarter of 2009.

Leveraged Lease Trusts

The Corporation’s net involvement with consolidated leveraged lease trusts totaled $5.6 billion and $5.8 billion at December 31, 2009 and 2008. The trusts hold long-lived equipment such as rail cars, power generation and distribution equipment, and commercial aircraft. The Corporation consolidates these trusts because it holds a residual interest which is expected to absorb a majority of the variability driven by credit risk of the lessee and, in some cases, by the residual risk of the leased property. The net investment represents the Corporation’s maximum loss exposure to the trusts in the unlikely event that the leveraged lease investments become worthless. Debt issued by the leveraged lease trusts is nonrecourse to the Corporation. The Corporation has no liquidity exposure to these leveraged lease trusts.loss.


180     Bank of America 2010


Customer Vehicles

Customer vehicles include credit-linked and equity-linked note vehicles, repackaging vehicles and asset acquisition vehicles, which are typically created on behalf of customers who wish to obtain market or credit exposure to a specific company or financial instrument.


The table below summarizes select information related to customer vehicles in which the Corporation held a variable interest at December 31, 2010 and 2009.
                         
  December 31 
  2010  2009 
(Dollars in millions) Consolidated  Unconsolidated  Total  Consolidated  Unconsolidated  Total 
Maximum loss exposure
 $4,449  $2,735  $7,184  $277  $10,229  $10,506 
                         
On-balance sheet assets                        
Trading account assets $3,458  $876  $4,334  $183  $1,334  $1,517 
Derivative assets  1   722   723   78   4,815   4,893 
Loans and leases              65   65 
Loansheld-for-sale
  959      959          
All other assets  1,429      1,429   16      16 
                         
Total
 $5,847  $1,598  $7,445  $277  $6,214  $6,491 
                         
On-balance sheet liabilities                        
Derivative liabilities $1  $23  $24  $  $267  $267 
Commercial paper and other short-term borrowings           22      22 
Long-term debt  3,457      3,457   50   74   124 
All other liabilities     140   140      1,357   1,357 
                         
Total
 $3,458  $163  $3,621  $72  $1,698  $1,770 
                         
Total assets of VIEs $5,847  $6,090  $11,937  $277  $16,487  $16,764 
                         

150Bank of America 2009


Credit-linked and equity-linked note vehicles issue notes which pay a return that is linked to the credit or equity risk of a specified company or debt instrument. The vehicles purchase high-grade assets as collateral and enter into credit default swaps or equity derivatives to synthetically create the credit or equity risk to pay the specified return on the notes. The Corporation is typically the counterparty for some or all of the credit and equity derivatives and, to a lesser extent, it may invest in securities issued by the vehicles. The Corporation may also enter into interest rate or foreign currency derivatives with the vehicles. The Corporation does not typically consolidate the vehicles because the derivatives create variability which is absorbed by the third party investors. The Corporation is exposed to loss if the collateral held by the vehicle declines in value and is insufficient to cover the vehicle’s obligation to the Corporation under the above-referenced derivatives. In addition, the Corporation has entered into derivative contracts, typically total return swaps, with certain vehicles which obligate the Corporation to purchase securities held as collateral at the vehicle’s cost, typically as a result of ratings downgrades. These exposures were obtained in connection with the Merrill Lynch acquisition. The underlying securities are senior securities and substantially all of the Corporation’s exposures are insured. Accordingly, the Corporation’s exposure to loss consists principally of counterparty risk to the insurers. The Corporation consolidates these vehicles if the variability in cash flows expected to be generated by the collateral is greater than the variability in cash flows expected to be generated by the credit or equity derivatives. At December 31, 2009, the notional amount of such derivative contracts with unconsolidated vehicles was $1.4 billion. This amount is included in the $2.8 billion notional amount of derivative contracts through which the Corporation obtains funding from unconsolidated SPEs, described inNote 14 – Commitments and Contingencies. The Corporation also hashad approximately $628$338 million of other liquidity commitments, including written put options and collateral value guarantees, with unconsolidated credit-linked and equity-linked note vehicles at December 31, 2009.

2010.

Repackaging vehicles issue notes that are createddesigned to provide an investorincorporate risk characteristics desired by customers. The vehicles hold debt instruments such as corporate bonds, convertible bonds or asset-backed securities with a specificthe desired credit risk profile. The Corporation enters into derivatives with the vehicles typically hold a security and a derivative that modifyto change the interest rate or foreign currency profile of that security,the debt instruments. If a vehicle holds convertible bonds and issues one class of notesthe Corporation retains

the conversion option, the Corporation is deemed to a single investor. These vehicles are generally QSPEshave controlling financial interest and as such are not subject to consolidation byconsolidates the Corporation.

vehicle.

Asset acquisition vehicles acquire financial instruments, typically loans, at the direction of a single customer and obtain funding through the issuance of structured notes to the Corporation. At the time the vehicle acquires an asset, the Corporation enters into a total return swapswaps with the customer such that the economic returns of the asset are passed through to the customer. As a result, the Corporation does not consolidate the vehicles. The Corporation is exposed to counterparty credit risk if the asset declines in value and the customer defaults on its obligation to the Corporation under the total return swap.swaps. The Corporation’s risk may be mitigated by collateral or other arrangements. The Corporation consolidates these vehicles because it has the power to manage the assets in the vehicles and owns all of the structured notes issued by the vehicles.
The Corporation’s maximum exposure to loss from customer vehicles includes the notional amount of the credit or equity derivatives to which the Corporation is a counterparty, net of losses previously recorded, and the Corporation’s investment, if any, in securities issued by the vehicles. It has not been reduced to reflect the benefit of offsetting swaps with the customers or collateral arrangements.


Bank of America 2010     181


Other VehiclesVariable Interest Entities

Other consolidated vehiclesVIEs primarily include investment vehicles, a collective investment fund, leveraged lease trusts and asset acquisition conduitsconduits. Other unconsolidated VIEs primarily include investment vehicles and real estate vehicles.
The table below summarizes select information related to other VIEs in which the Corporation held a variable interest at December 31, 2010 and 2009.
                         
  December 31 
  2010  2009 
(Dollars in millions) Consolidated  Unconsolidated  Total  Consolidated  Unconsolidated  Total 
Maximum loss exposure
 $19,248  $8,796  $28,044  $12,073  $11,290  $23,363 
                         
On-balance sheet assets                        
Trading account assets $8,900  $  $8,900  $269  $  $269 
Derivative assets     228   228   1,096   83   1,179 
Available-for-sale debt securities
  1,832   73   1,905   1,822      1,822 
Loans and leases  7,690   1,122   8,812   7,820   1,200   9,020 
Allowance for loan and lease losses  (27)  (22)  (49)  (29)  (10)  (39)
Loansheld-for-sale
  262   949   1,211   197      197 
All other assets  937   6,440   7,377   1,285   8,777   10,062 
                         
Total
 $19,594  $8,790  $28,384  $12,460  $10,050  $22,510 
                         
On-balance sheet liabilities                        
Derivative liabilities $  $9  $9  $  $80  $80 
Commercial paper and other short-term borrowings  1,115      1,115   965      965 
Long-term debt  229      229   33      33 
All other liabilities  8,683   1,657   10,340   3,123   1,466   4,589 
                         
Total
 $10,027  $1,666  $11,693  $4,121  $1,546  $5,667 
                         
Total assets of VIEs $19,594  $13,416  $33,010  $12,460  $14,819  $27,279 
                         

Investment Vehicles
The Corporation sponsors, invests in or provides financing to a variety of investment vehicles that hold loans, real estate, debt securities or other financial instruments and are designed to provide the desired investment profile to investors. At December 31, 2010 and 2009, the Corporation’s consolidated investment vehicles had total assets of $5.6 billion and $5.7 billion. The Corporation also held investments in unconsolidated vehicles with total assets of $7.9 billion and $8.8 billion at December 31, 2010 and 2009. The Corporation’s maximum exposure to loss associated with both consolidated and unconsolidated investment vehicles totaled $8.7 billion and $10.7 billion at December 31, 2010 and 2009.
On January 1, 2010, the Corporation consolidated $2.5 billion of investment vehicles. Other unconsolidated vehicles include asset acquisition conduitsThis amount included a real estate investment fund with assets of $1.5 billion which is designed to provide returns to clients through limited partnership holdings. At that time, the Corporation was the general partner and other corporate conduits.

also had a limited partnership interest in the fund. The Corporation provided support to the fund and therefore considers the fund to be a VIE. In late 2010, the Corporation transferred its general partnership interest to a third party, conveying all ongoing management responsibilities to that third party. As a result, the Corporation deconsolidated the fund because it no longer has a controlling financial interest. The Corporation continues to retain a limited partnership interest, which is included in the table above.

Collective Investment Funds
The Corporation is trustee for certain common and collective investment funds that provide investment opportunities for eligible clients ofGWIM. These funds, which had total assets of $21.2 billion at December 31, 2010, hold a variety of cash, debt and equity investments. The Corporation does not have a variable interest in these funds, except as described below.
In 2010, the governing documents of a stable value collective investment fund with total assets of $8.1 billion at December 31, 2010 were modified to facilitate the planned liquidation of the fund. The modifications resulted in the termination of third-party insurance contracts which were replaced by a guarantee from the Corporation of the net asset value of the fund, which principally holds short-term U.S. Treasury and agency securities. In addition, the Corporation acquired the unilateral ability to replace the fund’s asset manager. As a result of these changes, the Corporation acquired a controlling financial interest in and consolidated the fund. Consolidation did not have a significant impact on the Corporation’s 2010 results of operations. This fund was not previously consolidated because the Corporation did not have the unilateral power to replace the asset manager, nor did it have a variable interest in the fund that was more than insignificant. Liquidation of the fund will be finalized in 2011.


182     Bank of America 2010


Leveraged Lease Trusts
The Corporation’s net investment in consolidated leveraged lease trusts totaled $5.2 billion and $5.6 billion at December 31, 2010 and 2009. The trusts hold long-lived equipment such as rail cars, power generation and distribution equipment, and commercial aircraft. The Corporation structures the trusts and holds a significant residual interest. The net investment represents the Corporation’s maximum loss exposure to the trusts in the unlikely event that the leveraged lease investments become worthless. Debt issued by the leveraged lease trusts is nonrecourse to the Corporation. The Corporation has no liquidity exposure to these leveraged lease trusts.
Asset Acquisition Conduits
The Corporation currently administers threetwo asset acquisition conduits which acquire assets on behalf of the Corporation or its customers. TwoThe Corporation liquidated a third conduit during 2010. Liquidation of the conduit did not impact the Corporation’s consolidated results of operations.
These conduits had total assets of $640 million and $2.2 billion at December 31, 2010 and 2009. One of the conduits which are unconsolidated, acquireacquires assets at the request of customers who wish to benefit from the economic returns of the specified assets on a leveraged basis, which consist principally of liquid exchange- tradedexchange-traded equity securities. The consolidatedsecond conduit holds subordinatedsubordinate AFS debt securities for the Corporation’s benefit. The conduits obtain funding by issuing commercial paper and subordinatedsubordinate certificates to third partythird-party investors. Repayment of the commercial paper and certificates is assured by total return swaps between the Corporation and the conduits andconduits. When a conduit acquires assets for unconsolidated conduitsthe benefit of the Corporation’s customers, the Corporation is reimbursed throughenters intoback-to-back total return swaps with the conduit and the customer such that the economic returns of the assets are passed through to the customer. The Corporation’s exposure to the counterparty credit risk of its customers. The weighted-average maturity of commercial paper issuedcustomers is mitigated by the conduits at December 31, 2009 was 68 days.ability to liquidate an asset held in the conduit if the customer defaults on its obligation. The Corporation receives fees for serving as commercial paper placement agent and for providing administrative services to the conduits. At December 31, 20092010 and 2008,2009, the Corporation did not hold any commercial paper issued by the asset acquisition conduits other than incidentally and in its role as a commercial paper dealer.

Real Estate Vehicles
The Corporation determines whether it must consolidate an asset acquisition conduit basedheld investments in unconsolidated real estate vehicles of $5.4 billion and $4.8 billion at December 31, 2010 and 2009, which consisted of limited partnership investments in unconsolidated limited partnerships that finance the construction and rehabilitation of affordable rental housing. An unrelated third party is typically the general partner and has control over the significant activities of the partnership. The Corporation earns a return primarily through the receipt of tax credits allocated to the affordable housing projects. The Corporation’s risk of loss is mitigated by policies requiring that the project qualify for the expected tax credits prior to making its investment. The Corporation may from time to time be asked to invest additional amounts to support a troubled project. Such additional investments have not been and are not expected to be significant.
Other Transactions
In 2010 and prior years, the Corporation transferred pools of securities to certain independent third parties and provided financing for approximately 75 percent of the purchase price under asset-backed financing arrangements. At December 31, 2010 and 2009, the Corporation’s maximum loss exposure under these financing arrangements was $6.5 billion and $6.8 billion, substantially all of which was classified as loans on the design of the conduitCorporation’s Consolidated Balance Sheet. All principal and whether the third party investorsinterest payments have been received when due in accordance with their contractual terms. These arrangements are exposed to the Corporation’s credit risk or the market risk of the assets. Interest rate risk is not included in the cash flow analysistable on page 182 because the conduitspurchasers are not designedVIEs.

NOTE 9 Representations and Warranties Obligations and Corporate Guarantees
Background
The Corporation securitizes first-lien residential mortgage loans, generally in the form of MBS guaranteed by GSEs or GNMA in the case of FHA-insured and VA-guaranteed mortgage loans. In addition, in prior years, legacy companies and certain subsidiaries have sold pools of first-lien residential mortgage loans, home equity loans and other second-lien loans as private-label securitizations or in the form of whole loans. In connection with these transactions, the Corporation or certain subsidiaries or legacy companies made various representations and warranties. These representations and warranties, as governed by the agreements, related to, absorbamong other things, the ownership of the loan, the validity of the lien securing the loan, the absence of delinquent taxes or liens against the property securing the loan, the process used to select the loan for inclusion in a transaction, the loan’s compliance with any applicable loan criteria, including underwriting standards, and pass alongthe loan’s compliance with applicable federal, state and local laws. Breaches of these representations and warranties may result in a requirement to repurchase mortgage loans, or to otherwise make whole or provide other remedy to a whole-loan buyer or securitization trust. In such cases, the Corporation would be exposed to any subsequent credit loss on the mortgage loans. The Corporation’s credit loss would be reduced by any recourse to sellers of loans (i.e., correspondents) for representations and warranties previously provided. When a loan was originated by a third-party correspondent, the Corporation typically has the right to seek a recovery of related repurchase losses from the correspondent originator. At December 31, 2010, loans purchased from correspondents comprised approximately 25 percent of loans underlying outstanding repurchase demands. During 2010, the Corporation experienced a decrease in recoveries from correspondents, however, the actual recovery rate may vary from period to period based upon the underlying mix of correspondents (e.g., active, inactive,out-of-business originators) from which recoveries are sought.
Subject to the requirements and limitations of the applicable agreements, these representations and warranties can be enforced by the securitization trustee or the whole-loan buyer as governed by the applicable agreement or, in certain first-lien and home equity securitizations where monolines have insured all or some of the related bonds issued, by the monoline insurer at any time over the life of the loan. Importantly, in the case of non-GSE loans, the contractual liability to repurchase arises if there is a breach of the representations and warranties that materially and adversely affects the interest rate riskof all investors, or if there is a breach of other standards established by the terms of the related sale agreement. The Corporation believes that the longer a loan performs prior to investors who receivedefault, the less likely it is that an alleged underwriting breach of representations and warranties had a material impact on the loan’s performance. Historically, most demands for repurchase have occurred within the first few years after origination, generally after a loan has defaulted. However, in recent periods the time horizon has lengthened due to increased repurchase request activity across all vintages.
The Corporation’s current rates of interest thatoperations are appropriate forstructured to limit the tenor and relative risk of their investments. Whenrepurchase and accompanying credit exposure by seeking to ensure consistent production of mortgages in accordance with its underwriting procedures and by servicing those mortgages consistent with its contractual obligations. In addition, certain securitizations include guarantees written to protect certain purchasers of the loans from credit losses up to a conduit acquires assetsspecified amount. The fair value of the probable losses to be absorbed under the representations and warranties obligations and the guarantees is recorded as an accrued liability when the loans are sold. The liability for probable losses is updated by accruing a representations and warranties provision in mortgage banking income throughout the benefitlife of the loan as necessary when additional relevant information becomes available. The methodology used to estimate


Bank of America 2010     183


the liability for representations and warranties is a function of the representations and warranties given and considers a variety of factors, which include, depending on the counterparty, actual defaults, estimated future defaults, historical loss experience, estimated home prices, probability that a repurchase request will be received, number of payments made by the borrower prior to default and probability that a loan will be required to be repurchased. Historical experience also considers recent events such as the agreements with the GSEs on December 31, 2010, as discussed below. Changes to any one of these factors could significantly impact the estimate of the Corporation’s customers,liability.
Although the timing and volume has varied, repurchase and similar requests have increased in recent periods from buyers and insurers, including monolines. The Corporation expects that efforts to attempt to assert repurchase requests by monolines, whole-loan investors and private-label securitization investors may increase in the future. Aloan-by-loan review of all properly presented repurchase requests is performed and demands have been and will continue to be contested to the extent not considered valid. In addition, the Corporation enters into back-to-back total return swapsmay reach a bulk settlement with a counterparty (in lieu of theloan-by-loan review process), on terms determined to be advantageous to the Corporation.
On December 31, 2010, the Corporation reached agreements with the conduitGSEs under which the Corporation paid $2.8 billion to resolve repurchase claims involving certain residential mortgage loans sold directly to the GSEs by entities related to legacy Countrywide. The agreements with FHLMC for $1.28 billion extinguishes all outstanding and potential mortgage repurchase and make-whole claims arising out of any alleged breaches of selling representations and warranties related to loans sold directly by legacy Countrywide to FHLMC through 2008, subject to certain exceptions the customer such thatCorporation does not believe to be material. The agreement with FNMA for $1.52 billion substantially resolves the economic returnsexisting pipeline of repurchase and make-whole claims outstanding as of September 20, 2010 arising out of alleged breaches of selling representations and warranties related to loans sold directly by legacy Countrywide to FNMA. These agreements with the GSEs do not cover legacy Bank of America first-lien residential mortgage loans sold directly to the GSEs, other loans sold to the GSEs other than described above, loan servicing obligations, other contractual obligations or loans contained in private-label securitizations.
Overall, repurchase requests and disputes with buyers and insurers regarding representations and warranties have increased in recent periods which has resulted in an increase in unresolved repurchase requests for monolines and other non-GSE counterparties. Generally the volume of unresolved repurchase requests from the FHA and VA for loans in GNMA-guaranteed securities is not significant because the requests are limited in number and are typically resolved quickly. The volume of repurchase claims as a percentage of the assets are passed through tovolume of loans purchased arising from loans sourced from brokers or purchased from third-party sellers is relatively consistent with the customer. The Corporation’s performance under

volume of repurchase claims as a percentage of the derivatives is collateralizedvolume of loans originated by the underlying assetsCorporation or its subsidiaries or legacy companies.
The table below presents outstanding claims by counterparty and as such the third party investors are exposed primarily to the credit risk of the Corporation. The Corporation’s exposure to the counterparty credit risk of its customers is mitigated by the aforementioned collateral arrangements and the ability to liquidate an asset held in the conduit if the customer defaults on its obligation. When a conduit acquires assets on the Corporation’s behalf and the Corporation absorbs the market risk of the assets, it consolidates the conduit. Derivatives related to unconsolidated conduits are carried at fair value with changes in fair value recorded in trading account profits (losses).

Other corporate conduitsproduct type at December 31, 2008 included several commercial paper conduits which held primarily high-grade, long-term municipal, corporate2010 and mortage-backed securities. During2009. The information for 2010 reflects the second quarter of 2009, the Corporation was unable to remarket the conduits’ commercial paper and, in accordance with existing contractual arrangements, the conduits were liquidated. Due to illiquidity in the financial markets, the Corporation purchased a majority of these assets. At December 31, 2009, the Corporation held $207 million of assets acquired from the liquidation of other corporate conduits and previous mandatory sales of assets outimpact of the conduits. These assets are recorded onrecent agreements with the Consolidated Balance Sheet in trading account assets.

GSEs.

Outstanding Claims by Counterparty and Product
         
  December 31 
(Dollars in millions) 2010  2009 
By counterparty
        
GSEs $2,821  $3,284 
Monolines  4,799   2,944 
Whole loan and private-label securitization investors and other (1)
  3,067   1,372 
         
Total outstanding claims by counterparty
 $10,687  $7,600 
         
By product type
        
Prime loans $2,040  $1,778 
Alt-A  1,190   1,629 
Home equity  3,658   2,223 
Pay option  2,889   1,122 
Subprime  734   540 
Other  176   308 
         
Total outstanding claims by product type
 $10,687  $7,600 
         
Bank(1)December 31, 2010 includes $1.7 billion in claims contained in correspondence from private-label securitizations investors that do not have the right to demand repurchase of America 2009151loans directly or the right to access loan files. The inclusion of these claims in the amounts noted does not mean that the Corporation believes these claims have satisfied the contractual thresholds to direct the securitization trustee to take action or are otherwise procedurally or substantively valid.
As presented in the table on page 185, during 2010 and 2009, the Corporation paid $5.2 billion and $2.6 billion to resolve $6.6 billion and $3.0 billion of repurchase claims through repurchase or reimbursement to the investor or securitization trust for losses they incurred, resulting in a loss on the related loans at the time of repurchase or reimbursement of $3.5 billion and $1.6 billion. The amount of loss for loan repurchases is reduced by the fair value of the underlying loan collateral. The repurchase of loans and indemnification payments related to first-lien and home equity repurchase claims generally resulted from material breaches of representations and warranties related to the loans’ material compliance with the applicable underwriting standards, including borrower misrepresentation, credit exceptions without sufficient compensating factors and non-compliance with underwriting procedures, although the actual representations made in a sales transaction and the resulting repurchase and indemnification activity can vary by transaction or investor. A direct relationship between the type of defect that causes the breach of representations and warranties and the severity of the realized loss has not been observed. Transactions to repurchase or indemnification payments related to first-lien residential mortgages primarily involved the GSEs while transactions to repurchase or indemnification payments for home equity loans primarily involved the monolines.


184     Bank of America 2010


The table below presents first-lien and home equity loan repurchases and indemnification payments for 2010 and 2009. These amounts include the agreement that was reached with FNMA as discussed on page 184. These amounts do not include $1.3 billion paid related to the agreement with FHLMC due to the global nature of the agreement and, specifically, the absence of a formal apportionment of the agreement amount between current and future claims.
Loan Repurchases and Indemnification Payments
                         
  December 31 
  2010  2009 
  Unpaid
        Unpaid
       
  Principal
        Principal
       
(Dollars in millions) Balance  Cash  Loss  Balance  Cash  Loss 
First-lien 
                        
Repurchases $2,557  $2,799  $1,142  $1,461  $1,588  $583 
Indemnification payments  3,785   2,173   2,173   1,267   730   730 
                         
Total first-lien
  6,342   4,972   3,315   2,728   2,318   1,313 
                         
Home equity
                        
Repurchases  78   86   44   116   128   110 
Indemnification payments  149   146   146   142   141   141 
                         
Total home equity
  227   232   190   258   269   251 
                         
Total first-lien and home equity
 $6,569  $5,204  $3,505  $2,986  $2,587  $1,564 
                         

Government-sponsored Enterprises
The Corporation and its subsidiaries have an established history of working with the GSEs on repurchase requests. Generally, the Corporation first becomes aware that a GSE is evaluating a particular loan for repurchase when the Corporation receives a request from a GSE to review the underlying loan file (file request). Upon completing its review, the GSE may submit a repurchase claim to the Corporation. Historically, most file requests have not resulted in a repurchase claim. As soon as practicable after receiving a repurchase request from either of the GSEs, the Corporation evaluates the request and takes appropriate action. Claim disputes are generally handled through loan-level negotiations with the GSEs and the Corporation seeks to resolve the repurchase request within 90 to 120 days of the receipt of the request although tolerances exist for claims that remain open beyond this timeframe. Experience with the GSEs continues to evolve and any disputes are generally related to areas including reasonableness of stated income, occupancy and undisclosed liabilities in the vintages with the highest default rates.
Monoline Insurers
Unlike the repurchase protocols and experience established with GSEs, experience with the monolines has been varied and the protocols and experience with these counterparties has not been as predictable as with the GSEs. The timetable for the loan file request, the repurchase request, if any, response and resolution varies by monoline. Where a breach of representations and warranties given by the Corporation or subsidiaries or legacy companies is confirmed on a given loan, settlement is generally reached as to that loan within 60 to 90 days.
Properly presented repurchase requests for the monolines are reviewed on aloan-by-loan basis. As part of an ongoing claims process, if the Corporation does not believe a claim is valid, it will deny the claim and generally indicate the reason for the denial to facilitate meaningful dialogue with the counterparty although it is not contractually obligated to do so. When there is disagreement as to the resolution of a claim, meaningful dialogue and negotiation is generally necessary between the parties to reach conclusion on an individual claim. Certain monolines have instituted litigation against legacy Countrywide and the Corporation. When claims from these counterparties are denied, the Corporation does not indicate its reason for denial as it is not contractually obligated to do so. In the Corporation’s experience, the monolines have been generally unwilling to withdraw repurchase claims, regardless of whether and what evidence was offered to refute a claim.

The pipeline of unresolved monoline claims where the Corporation believes a valid defect has not been identified which would constitute an actionable breach of representations and warranties continued to grow in 2010. Through December 31, 2010, approximately 11 percent of monoline claims that the Corporation initially denied have subsequently been resolved through repurchase or make-whole payments and two percent have been resolved through rescission. When a claim has been denied and there has not been communication with the counterparty for six months, the Corporation views these claims as inactive; however, they remain in the outstanding claims balance until resolution.
A liability for representations and warranties has been established with respect to all monolines for monoline repurchase requests based on valid identified loan defects and for repurchase requests that are in the process of review based on historical repurchase experience with a specific monoline to the extent such experience provides a reasonable basis on which to estimate incurred losses from repurchase activity. With respect to certain monolines where the Corporation believes a more consistent purchase experience has been established, a liability has also been established related to repurchase requests subject to negotiation and unasserted requests to repurchase current and future defaulted loans. The Corporation has had limited experience with most of the monoline insurers in the repurchase process, including limited experience resolving disputed claims. Also, certain monoline insurers have instituted litigation against legacy Countrywide and Bank of America, which limits the Corporation’s relationship and ability to enter into constructive dialogue with these monolines to resolve the open claims. For such monolines and other monolines with whom the Corporation has limited repurchase experience, in view of the inherent difficulty of predicting the outcome of those repurchase requests where a valid defect has not been identified or in predicting future claim requests and the related outcome in the case of unasserted requests to repurchase loans from the securitization trusts in which these monolines have insured all or some of the related bonds, the Corporation cannot reasonably estimate the eventual outcome. In addition, the timing of the ultimate resolution or the eventual loss, if any, related to those repurchase requests cannot be reasonably estimated. Thus, with respect to these monolines, a liability for representations and warranties has not been established related to repurchase requests where a valid defect has not been identified, or in the case of any unasserted requests to repurchase loans from the securitization trusts in which such monolines have insured all or some of the related bonds. However, certain monoline insurers have engaged with the Corporation and legacy Countrywide in a consistent


Bank of America 2010     185


repurchase process and the Corporation has used that experience to record a liability related to existing and future claims from such counterparties.
At December 31, 2010, the unpaid principal balance of loans related to unresolved repurchase requests previously received from monolines was $4.8 billion, including $3.0 billion in repurchase requests that have been reviewed where it is believed a valid defect has not been identified which would constitute an actionable breach of representations and warranties and $1.8 billion in repurchase requests that are in the process of review. As discussed on the previous page, a portion of the repurchase requests that are initially denied are ultimately resolved through repurchase or make-whole payments, after additional dialogue and negotiation with the monoline insurer. At December 31, 2010, the unpaid principal balance of loans for which the monolines had requested loan files for review but for which no repurchase request had been received was $10.2 billion, excluding loans that had been paid in full. There will likely be additional requests for loan files in the future leading to repurchase requests. Such requests may relate to loans that are currently in securitization trusts or loans that have defaulted and are no longer included in the unpaid principal balance of the loans in the trusts. However, it is unlikely that a repurchase request will be received for every loan in a securitization or every file requested or that a valid defect exists for every loan repurchase request. In addition, any claims paid related to repurchase requests from a monoline are paid to the securitization trust and may be used by the securitization trust to repay any outstanding monoline advances or reduce future advances from the monolines. To the extent that a monoline has not advanced funds or does not anticipate that it will be required to advance funds to the securitization trust, the likelihood of receiving a repurchase request from a monoline may be reduced as the monoline would receive limited or no benefit from the payment of repurchase claims. Moreover, some monolines are not currently performing their obligations under the financial guaranty policies they issued which may, in certain circumstances, impact their ability to present repurchase claims.
Whole Loan Sales and Private-label Securitizations
The Corporation and its subsidiaries have limited experience with private-label securitization repurchases as the number of recent repurchase requests received has been limited as shown in the outstanding claims table on page 184. The representations and warranties, as governed by the private-label securitizations, generally require that counterparties have the ability to both assert a claim and actually prove that a loan has an actionable defect under the applicable contracts. While a securitization trustee may always investigate or demand repurchase on its own action, in order for investors to direct the securitization trustee to investigate loan files or demand the repurchase of loans, the securitization agreements generally require the security holders to hold a specified percentage, such as 25 percent, of the voting rights of the outstanding securities. In addition, the Corporation believes the agreements for private-label securitizations generally contain less rigorous representations and warranties and higher burdens on investors seeking repurchases than the comparable agreements with the GSEs.
The majority of repurchase requests that the Corporation has received relate to whole loan sales. Most of the loans sold in the form of whole loans were subsequently pooled with other mortgages into private-label securitizations issued by third-party buyers of the loans. The buyers of the whole loans received representations and warranties in the sales transaction and may retain those rights even when the loans are aggregated with other collateral into private-label securitizations. Properly presented repurchase requests for these whole loans are reviewed on aloan-by-loan basis. If, after the Corporation’s review, it does not believe a claim is valid, it will deny the claim and generally indicate a reason for the denial. When the counterparty agrees with the Corporation’s denial of the claim, the counterparty may rescind the claim. When there is disagreement as to the resolution of the claim, meaningful

dialogue and negotiation between the parties is generally necessary to reach conclusion on an individual claim. Generally, a whole loan sale claimant is engaged in the repurchase process and the Corporation and the claimant reach resolution, either throughloan-by-loan negotiation or at times, through a bulk settlement. Through December 31, 2010, approximately 17 percent of the whole loan claims that the Corporation initially denied have subsequently been resolved through repurchase or make-whole payments and 53 percent have been resolved through rescission or repayment in full by the borrower. Although the timeline for resolution varies, once an actionable breach is identified on a given loan, settlement is generally reached as to that loan within 60 to 90 days. When a claim has been denied and the Corporation does not have communication with the counterparty for six months, the Corporation views these claims as inactive; however, they remain in the outstanding claims balance until resolution.
On October 18, 2010, Countrywide Home Loans Servicing, LP (which changed its name to BAC Home Loans Servicing, LP), a wholly-owned subsidiary of the Corporation, in its capacity as servicer on 115 private-label securitizations, which was subsequently extended to 225 securitizations, received a letter that asserts breaches of certain servicing obligations, including an alleged failure to provide notice of breaches of representations and warranties with respect to mortgage loans included in the transactions. Additionally, the Corporation received new claim demands totaling $1.7 billion in correspondence from private-label securitization investors. Private-label securitization investors generally do not have the contractual right to demand repurchase of loans directly or the right to access loan files. The inclusion of the $1.7 billion in outstanding claims does not mean that the Corporation believes these claims have satisfied the contractual thresholds required for the private-label securitization investors to direct the securitization trustee to take action or are otherwise procedurally or substantively valid.
Liability for Representations and Warranties and Corporate Guarantees
The liability for representations and warranties and corporate guarantees is included in accrued expenses and other liabilities and the related provision is included in mortgage banking income.
The table below presents a rollforward of the liability for representations and warranties and corporate guarantees.
         
(Dollars in millions) 2010  2009 
Liability for representations and warranties and corporate guarantees, beginning of year
 $3,507  $2,271 
Merrill Lynch acquisition     580 
Additions for new sales  30   41 
Charge-offs  (4,803)  (1,312)
Provision  6,786   1,851 
Other  (82)  76 
         
Liability for representations and warranties and corporate guarantees, December 31
 $5,438  $3,507 
         
The liability for representations and warranties has been established when those obligations are both probable and reasonably estimable. As previously discussed, the Corporation reached agreements with the GSEs resolving repurchase claims involving certain residential mortgage loans sold to them by entities related to legacy Countrywide. The Corporation’s liability for obligations under representations and warranties given to the GSEs considers the recent agreements and their impact on the repurchase rates on future claims that may be received on loans that have defaulted or that are estimated to default. The Corporation believes that its remaining exposure to repurchase obligations for first-lien residential mortgage loans sold directly to the GSEs has been accounted for as a result of these agreements and the associated adjustments to the recorded liability for representations and


186     Bank of America 2010


warranties for first-lien residential mortgage loans sold directly to the GSEs in 2010 and 2009, and for other loans sold directly to the GSEs and not covered by these agreements. The Corporation believes its predictive repurchase models, utilizing its historical repurchase experience with the GSEs while considering current developments, including the recent agreements, projections of future defaults, as well as certain assumptions regarding economic conditions, home prices and other matters, allows it to reasonably estimate the liability for representations and warranties on loans sold to the GSEs. However, future provisions for representations and warranties liability to the GSEs may be affected if actual experience is different from the Corporation’s historical experience with the GSEs or the Corporation’s projections of future defaults and assumptions regarding economic conditions, home prices and other matters that are incorporated in the provision calculation. Although experience with non-GSE claims remains limited, the Corporation expects additional activity in this area going forward and the volume of repurchase claims from monolines, whole-loan investors and investors in private-label securitizations could increase in the future. It is reasonably possible that future losses may occur and the Corporation’s estimate is that the upper range of possible loss related to non-GSE sales could be $7 billion to $10 billion over existing accruals. This estimate does not represent a probable loss, is based on currently available information, significant judgment, and a number of assumptions that are subject to change. A significant portion of this estimate relates to loans originated through legacy Countrywide, and the repurchase liability is generally limited to the original seller of the loan. Future provisions and possible loss or range of loss may be impacted if actual results are different from the Corporation’s assumptions regarding economic conditions, home prices and other matters and may vary by counterparty. The resolution of the repurchase claims process with the non-GSE counterparties will likely be a protracted process, and the Corporation will vigorously contest any request for repurchase if it concludes that a valid basis for repurchase claim does not exist.
NOTE 10 Goodwill and Intangible Assets

Goodwill
The following table below presents goodwill balances by business segment at December 31, 20092010 and 2008, which includes $5.1 billion of goodwill from the acquisition of Merrill Lynch and $4.4 billion of goodwill from the acquisition of Countrywide.2009. As discussed in more detail inNote 23 –26 — Business Segment Information,, the

Corporation changed its basis of presentation from three segments to six segments effectiveon January 1, 20092010, the Corporation realigned the formerGlobal BankingandGlobal Marketsbusiness segments. There was no impact on the reporting units used in connection with the Merrill Lynch acquisition.goodwill impairment testing. The reporting units utilized for goodwill impairment tests are the business segments or one level below the business segments.


  December 31
(Dollars in millions) 2009    2008

Deposits

 $17,875    $17,805

Global Card Services

  22,292     22,271

Home Loans & Insurance

  4,797     4,797

Global Banking

  27,550     28,409

Global Markets

  3,358     2,080

Global Wealth & Investment Management

  10,411     6,503

All Other

  31     69

Total goodwill

 $86,314    $81,934

segments as outlined in the following table. Substantially all of the decline in goodwill in 2010 is the result of $12.4 billion of goodwill impairment charges, as described below. No goodwill impairment was recognized for 2009in 2009. The decline inGWIMwas attributable to the sale of Columbia Management’s long-term asset management business.

         
  December 31 
(Dollars in millions) 2010  2009 
Deposits $17,875  $17,875 
Global Card Services  11,889   22,292 
Home Loans & Insurance  2,796   4,797 
Global Commercial Banking  20,656   20,656 
Global Banking & Markets  10,682   10,252 
Global Wealth & Investment Management  9,928   10,411 
All Other  35   31 
         
Total goodwill
 $73,861  $86,314 
         

Global Card Services Impairment
On July 21, 2010, the Financial Reform Act was signed into law. Under the Financial Reform Act and 2008. For more informationits amendment to the Electronic Fund Transfer Act, the Federal Reserve must adopt rules within nine months of enactment of the Financial Reform Act regarding the interchange fees that may be charged with respect to electronic debit transactions. Those rules will take effect one year after enactment of the Financial Reform Act. The Financial Reform Act and the applicable rules are expected to materially reduce the future revenues generated by the debit card business of the Corporation. The Corporation’s consumer and small business card products, including the debit card business, are part of an integrated platform withinGlobal Card Services. During the three months ended September 30, 2010, the Corporation’s estimate of revenue loss due to the Financial Reform Act was approximately $2.0 billion annually based on goodwillcurrent volumes. Accordingly, the Corporation performed an impairment testing, seetest forGlobal Card Servicesduring the three months ended September 30, 2010.
In step one of the impairment test, the fair value ofGoodwillGlobal Card Serviceswas estimated under the income approach where the significant assumptions included the discount rate, terminal value, expected loss rates and Intangible Assets section ofNote 1 – Summary of Significant Accounting Principles.

expected new account growth. The Corporation also updated its estimated cash flows to reflect the current strategic plan forecast and other portfolio assumptions. Based on the results of step one of the annual impairment test, at June 30, 2009, and due to continued stress onthe Corporation determined that the carrying amount of Home Loans & Insurance andGlobal Card Services as a result of current market conditions, the Corporation concluded that an additional impairment analysis should be performed for these two reporting units as of December 31, 2009. In performing the first step of the additional impairment analysis, the Corporation compared, including goodwill, exceeded the fair value of each reporting unit to itsvalue. The carrying amount, including goodwill. Consistent withfair value and goodwill for the annual test, the Corporation utilized a combination of the market approach and the income approach for Home Loans & Insurance and the income approach forGlobal Card Services. ForHome Loans & Insurancereporting unit were $39.2 billion, $25.9 billion and $22.3 billion, respectively. Accordingly, the carrying value exceededCorporation performed step two of the fair value, and

accordingly,goodwill impairment test for this reporting unit. In step two, the second step analysis of comparingCorporation compared the implied fair value of the reporting unit’s goodwill with the carrying amount of that goodwill. Under step two of the impairment test, significant assumptions in measuring the fair value of the assets and liabilities including discount rates, loss rates and interest rates were updated to reflect the current economic conditions. Based on the results of this goodwill was performed. Althoughimpairment test forGlobal Card Services, the carrying value of the goodwill assigned to the reporting unit exceeded the implied fair value by $10.4 billion. Accordingly, the Corporation recorded a non-cash, non-tax deductible goodwill impairment charge of $10.4 billion to reduce the carrying value of goodwill inGlobal Card Servicesfrom $22.3 billion to $11.9 billion. The goodwill impairment test included limited mitigation actions inGlobal Card Services passedto recapture lost revenue. Although the Corporation has identified other potential mitigation actions, the impact of these actions going forward did not reduce the goodwill impairment charge because these actions are in the early stages of development and, additionally, certain of them may impact segments other thanGlobal Card Services(e.g., Deposits).

Due to the continued stress onGlobal Card Servicesas a result of the Financial Reform Act, the Corporation concluded that an additional impairment test should be performed for this reporting unit during the three months ended December 31, 2010. In step one of the goodwill impairment analysis,test, the fair value ofGlobal Card Serviceswas estimated under the income approach. The significant assumptions under the income approach included the discount rate, terminal value, expected loss rates and expected new account growth. The carrying amount, fair value and goodwill for theGlobal Card Servicesreporting unit were $27.5 billion, $27.6 billion and $11.9 billion, respectively. The estimated fair value as a percent of the carrying amount at December 31, 2010 was 100 percent. Although the fair value exceeded the carrying amount in step one of theGlobal Card Servicesgoodwill impairment test, to further substantiate the value of the goodwill, balance, the Corporation also performed the step two analysistest for this reporting unit. The results of the secondUnder step two of the goodwill impairment test whichfor this reporting unit, significant assumptions in measuring the fair value of the assets and liabilities of the reporting unit including discount rates, loss rates and interest rates were consistent withupdated to reflect the current economic conditions. The results of step two of the annualgoodwill impairment test indicated that nothe remaining balance of goodwill of $11.9 billion was not impaired as of December 31, 2010.


Bank of America 2010     187


On December 16, 2010, the Federal Reserve released proposed regulations to implement the Durbin Amendment of the Financial Reform Act, which are scheduled to be effective July 21, 2011. The proposed regulations included two alternative interchange fee standards that would apply to all covered issuers: one based on each issuer’s costs, with a safe harbor initially set at $0.07 per transaction and a cap initially set at $0.12 per transaction, and the other a stand-alone cap initially set at $0.12 per transaction. Although the range of estimated revenue loss based on the proposed regulations was slightly higher than the Corporation’s original estimate of $2.0 billion, given the uncertainty around the potential outcome, the Corporation did not change the revenue loss estimate used in the goodwill impairment test during the three months ended December 31, 2010. If the final Federal Reserve rule sets interchange fee standards that are significantly lower than the interchange fee assumptions the Corporation used in this goodwill impairment test, the Corporation will be required to perform an additional goodwill impairment test. If the final interchange fee standards are at the lowest proposed fee alternative, the Corporation’s current estimate of the revenue loss could result in an additional goodwill impairment charge forGlobal Card Services. In view of the uncertainty with model inputs including the final ruling, changes in the economic outlook and the corresponding impact to revenues and asset quality, and the impacts of mitigation actions, it is not possible to estimate the amount or range of amounts of additional goodwill impairment, if any.
Home Loans & Insurance Impairment
During the three months ended December 31, 2010, the Corporation performed an impairment test for 2009.theHome Loans & Insurancereporting unit as it was likely that there was a decline in its fair value as a result of increased

uncertainties, including existing and potential litigation exposure and other potential risks, higher current servicing costs including loss mitigation efforts, foreclosure related issues and the redeployment of centralized sales resources to address servicing needs. In step one of the goodwill impairment test, the fair value ofHome Loans & Insurancewas estimated based on a combination of the market approach and the income approach. Under the market approach valuation, significant assumptions included market multiples and a control premium. The followingsignificant assumptions for the valuation ofHome Loans & Insuranceunder the income approach included cash flow estimates, the discount rate and the terminal value. These assumptions were updated to reflect the current strategic plan forecast and to address the increased uncertainties referenced above. Based on the results of step one of the impairment test, the Corporation determined that the carrying amount ofHome Loans & Insurance, including goodwill, exceeded the fair value. The carrying amount, fair value and goodwill for theHome Loans & Insurancereporting unit were $24.7 billion, $15.1 billion and $4.8 billion, respectively. Accordingly, the Corporation performed step two of the goodwill impairment test for this reporting unit. In step two, the Corporation compared the implied fair value of the reporting unit’s goodwill with the carrying amount of that goodwill. Under step two of the goodwill impairment test, significant assumptions in measuring the fair value of the assets and liabilities of the reporting unit including discount rates, loss rates and interest rates were updated to reflect the current economic conditions. Based on the results of step two of the impairment test, the carrying value of the goodwill assigned toHome Loans & Insuranceexceeded the implied fair value by $2.0 billion. Accordingly, the Corporation recorded a non-cash, non-tax deductible goodwill impairment charge of $2.0 billion as of December 31, 2010 to reduce the carrying value of goodwill in theHome Loans & Insurancereporting unit.


Intangible Assets
The table below presents the gross carrying valuesamounts and accumulated amortization related to intangible assets at December 31, 20092010 and 2008. Gross carrying amounts include $5.4 billion2009.
                 
  December 31 
  2010  2009 
  Gross
  Accumulated
  Gross
  Accumulated
 
(Dollars in millions) Carrying Value  Amortization  Carrying Value  Amortization 
Purchased credit card relationships $7,162  $4,085  $7,179  $3,452 
Core deposit intangibles  5,394   4,094   5,394   3,722 
Customer relationships  4,232   1,222   4,232   760 
Affinity relationships  1,647   902   1,651   751 
Other intangibles  3,087   1,296   3,438   1,183 
                 
Total intangible assets
 $21,522  $11,599  $21,894  $9,868 
                 
None of the intangible assets related to the Merrill Lynch acquisition consisting of $800 million of core deposit intangibles, $3.1 billion of customer relationships and $1.5 billion of non-amortizing other intangibles.


  December 31
  2009      2008
(Dollars in millions) Gross Carrying
Value
    Accumulated
Amortization
       Gross Carrying
Value
    Accumulated
Amortization

Purchased credit card relationships

 $7,179    $3,452     $7,080    $2,740

Core deposit intangibles

  5,394     3,722      4,594     3,284

Customer relationships

  4,232     760      1,104     259

Affinity relationships

  1,651     751      1,638     587

Other intangibles

  3,438     1,183       2,009     1,020

Total intangible assets

 $21,894    $9,868      $16,425    $7,890

were impaired at December 31, 2010 or 2009. Amortization of intangibles expense was $1.7 billion, $2.0 billion and $1.8 billion in 2010, 2009 and $1.7 billion in 2009, 2008 and 2007, respectively.2008. The Corporation estimates aggregate amortization expense will be approximately $1.8 bil - -

lion, $1.6$1.5 billion, $1.4$1.3 billion, $1.2 billion, and $1.0 billion and $900 million for 20102011 through 2014,2015, respectively.


152Bank of America 2009
188     Bank of America 2010


NOTE 11 Deposits

The Corporation had domesticU.S. certificates of deposit and other domesticU.S. time deposits of $100 thousand or more totaling $99.4$60.5 billion and $136.6$99.4 billion at December 31, 20092010 and 2008. Foreign2009.Non-U.S. certificates of deposit and other foreignnon-U.S. time deposits of $100 thousand or more totaled $64.9 billion and $67.2 billion at December 31, 2010 and 2009. The table below presents the contractual maturities for time deposits of $100 thousand or more totaled $67.2 billion and $85.4 billion at December 31, 2009 and 2008.

2010.

Time deposits of $100 thousand or more

(Dollars in millions) Three months
or less
    Over three months
to twelve months
    Thereafter    Total

Domestic certificates of deposit and other time deposits

 $44,723    $45,651    $9,058    $99,432

Foreign certificates of deposit and other time deposits

  62,473     3,488     1,282     67,243

At December 31, 2009, the

                 
     Over Three
       
  Three months
  Months to
       
(Dollars in millions) or Less  Twelve Months  Thereafter  Total 
U.S. certificates of deposit and other time deposits $21,486  $29,097  $9,954  $60,537 
Non-U.S. certificates of deposit and other time deposits
  61,717   2,559   660   64,936 
                 
The scheduled contractual maturities for total time deposits were as follows:

(Dollars in millions) Domestic    Foreign    Total

Due in 2010

 $174,731    $72,507    $247,238

Due in 2011

  14,511     402     14,913

Due in 2012

  3,256     312     3,568

Due in 2013

  3,284     216     3,500

Due in 2014

  2,873     40     2,913

Thereafter

  2,282     342     2,624

Total time deposits

 $200,937    $73,819    $274,756

at December 31, 2010 are presented in the table below.

             
(Dollars in millions) U.S.  Non-U.S.  Total 
Due in 2011 $110,176  $71,104  $181,280 
Due in 2012  12,853   150   13,003 
Due in 2013  4,426   119   4,545 
Due in 2014  2,944   14   2,958 
Due in 2015  1,793   1   1,794 
Thereafter  4,091   87   4,178 
             
Total time deposits
 $136,283  $71,475  $207,758 
             
NOTE 12 Federal Funds Sold, Securities Borrowed or Purchased Under Agreements to Resell and Short-term Borrowings
The following table presents federal funds sold or purchased, securities borrowed or purchased and loaned or sold under agreements to resell or repurchase, and other short-term borrowings.
                         
  2010  2009  2008 
(Dollars in millions) Amount  Rate  Amount  Rate  Amount  Rate 
Federal funds sold and securities borrowed or purchased under agreements to resell
                        
At December 31 $209,616   0.85% $189,933   0.78% $82,478   0.95%
Average during the year  256,943   0.71   235,764   1.23   128,053   2.59 
Maximum month-end balance during year  314,932   n/a   271,321   n/a   152,436   n/a 
                         
Federal funds purchased
                        
At December 31  1,458   0.14   4,814   0.09   14,432   0.11 
Average during year  4,718   0.15   4,239   0.05   8,969   1.67 
Maximum month-end balance during year  8,320   n/a   4,814   n/a   18,788   n/a 
Securities loaned or sold under agreements to repurchase
                        
At December 31  243,901   1.15   250,371   0.39   192,166   0.84 
Average during year  348,936   0.74   365,624   0.96   264,012   2.54 
Maximum month-end balance during year  458,532   n/a   407,967   n/a   295,537   n/a 
Commercial paper
                        
At December 31  15,093   0.65   13,131   0.65   37,986   1.80 
Average during year  25,923   0.56   26,697   1.03   57,337   3.09 
Maximum month-end balance during year  36,236   n/a   37,025   n/a   65,399   n/a 
Other short-term borrowings
                        
At December 31  44,869   2.02   56,393   1.72   120,070   2.07 
Average during year  50,752   1.88   92,084   1.87   125,385   2.99 
Maximum month-end balance during year  63,081   n/a   169,602   n/a   160,150   n/a 
                         
n/a = not applicable

Bank of America, N.A. maintains a global program to offer up to a maximum of $75.0 billion outstanding at any one time, of bank notes with fixed or floating rates and maturities of at least seven days from the date of issue. Short-term bank notes outstanding under this program totaled $14.6 billion and $20.6 billion at December 31, 2009 compared to $10.5 billion at December 31, 2008.2010 and 2009. These short-term bank notes, along with Federal

Home Loan Bank (FHLB) advances, U.S. Treasury

tax and loan notes, and term federal funds purchased, are reflectedincluded in commercial paper and other short-term borrowings on the Consolidated Balance Sheet. SeeNote 13 – Long-term Debtfor information regarding the long-term notes that may be issued under the $75.0 billion bank note program.

The following table presents information for short-term borrowings.


Short-term Borrowings                              
  2009     2008     2007 
(Dollars in millions) Amount    Rate      Amount    Rate      Amount    Rate 

Federal funds purchased


At December 31

 $4,814    0.09   $14,432    0.11   $14,187    4.15

Average during year

  4,239    0.05      8,969    1.67      7,595    4.84  

Maximum month-end balance during year

  4,814          18,788          14,187      

Securities loaned or sold under agreements to repurchase


At December 31

  250,371    0.39      192,166    0.84      207,248    4.63  

Average during year

  365,624    0.96      264,012    2.54      245,886    5.21  

Maximum month-end balance during year

  430,067          295,537          277,196      

Commercial paper


At December 31

  13,131    0.65      37,986    1.80      55,596    4.85  

Average during year

  26,697    1.03      57,337    3.09      57,712    5.03  

Maximum month-end balance during year

  37,025          65,399          69,367      

Other short-term borrowings


At December 31

  56,393    1.72      120,070    2.07      135,493    4.95  

Average during year

  92,083    1.87      125,392    2.99      113,621    5.18  

Maximum month-end balance during year

  169,602           160,150           142,047      

Bank of America 2009153

Bank of America 2010     189


NOTE 13 Long-term Debt

Long-term debt consists of borrowings having an original maturity of one year or more. The following table below presents the balance of long-term debt at December 31, 20092010 and 20082009, and the related contractual rates and maturity dates at December 31, 2009.

2010.
         
  December 31 
(Dollars in millions) 2010  2009 
Notes issued by Bank of America Corporation
        
Senior notes:        
Fixed, with a weighted-average rate of 4.82%, ranging from 0.25% to 9.00%, due 2011 to 2043 $85,157  $78,282 
Floating, with a weighted-average rate of 1.26%, ranging from 0.19% to 7.18%, due 2011 to 2041  36,162   47,731 
Senior structured notes  18,796   8,897 
Subordinated notes:        
Fixed, with a weighted-average rate of 5.69%, ranging from 2.40% to 10.20%, due 2011 to 2038  26,553   28,017 
Floating, with a weighted-average rate of 2.00%, ranging from 0.04% to 5.43%, due 2016 to 2019  705   681 
Junior subordinated notes (related to trust preferred securities):        
Fixed, with a weighted-average rate of 6.72%, ranging from 5.25% to 11.45%, due 2026 to 2055  15,709   15,763 
Floating, with a weighted-average rate of 0.91%, ranging from 0.55% to 3.64%, due 2027 to 2056  3,514   3,517 
         
Total notes issued by Bank of America Corporation
  186,596   182,888 
         
Notes issued by Merrill Lynch & Co., Inc. and subsidiaries
        
Senior notes:        
Fixed, with a weighted-average rate of 5.44%, ranging from 0.05% to 8.83%, due 2011 to 2037  43,495   52,506 
Floating, with a weighted-average rate of 1.21%, ranging from 0.02% to 5.21%, due 2011 to 2037  27,447   36,624 
Senior structured notes  38,891   48,518 
Subordinated notes:        
Fixed, with a weighted-average rate of 6.05%, ranging from 2.61% to 8.125%, due 2016 to 2038  9,423   9,258 
Floating, with a weighted-average rate of 2.09%, ranging from 0.89% to 5.29%, due 2017 to 2026  1,935   1,857 
Junior subordinated notes (related to trust preferred securities):        
Fixed, with a weighted-average rate of 6.91%, ranging from 6.45% to 7.38%, due 2062 to perpetual  3,576   3,552 
Other long-term debt  986   2,636 
         
Total notes issued by Merrill Lynch & Co., Inc. and subsidiaries
  125,753   154,951 
         
Notes issued by Bank of America, N.A. and other subsidiaries
        
Senior notes:        
Fixed, with a weighted-average rate of 1.13%, ranging from 0.25% to 7.00%, due 2011 to 2027  169   12,461 
Floating, with a weighted-average rate of 0.30%, ranging from 0.20% to 0.85%, due 2011 to 2051  12,562   24,846 
Senior structured notes  1,319    
Subordinated notes:        
Fixed, with a weighted-average rate of 5.91%, ranging from 5.30% to 7.13%, due 2012 to 2036  5,194   5,193 
Floating, with a weighted-average rate of 0.59%, ranging from 0.29% to 0.60%, due 2016 to 2019  2,023   2,272 
         
Total notes issued by Bank of America, N.A. and other subsidiaries
  21,267   44,772 
         
Other debt
        
Advances from Federal Home Loan Banks:        
Fixed, with a weighted-average rate of 3.43%, ranging from 0.38% to 8.29%, due 2011 to 2034  41,001   53,032 
Floating, with a weighted-average rate of 0.16%, ranging from 0.16% to 0.18%, due 2011 to 2013  750   750 
Other  2,051   2,128 
         
Total other debt
  43,802   55,910 
         
Total long-term debt excluding consolidated VIEs
  377,418   438,521 
Long-term debt of consolidated VIEs under new consolidation guidance  71,013   n/a 
         
Total long-term debt
 $448,431  $438,521 
         
n/a = not applicable

  December 31
(Dollars in millions) 2009    2008

Notes issued by Bank of America Corporation


Senior notes:


Fixed, with a weighted-average rate of 4.80%, ranging from 0.61% to 7.63%, due 2010 to 2043

 $78,282    $64,799

Floating, with a weighted-average rate of 1.17%, ranging from 0.15% to 4.57%, due 2010 to 2041

  47,731     51,488

Structured notes

  8,897     5,565

Subordinated notes:


Fixed, with a weighted-average rate of 5.69%, ranging from 2.40% to 10.20%, due 2010 to 2038

  28,017     29,618

Floating, with a weighted-average rate of 1.60%, ranging from 0.60% to 4.39%, due 2016 to 2019

  681     650

Junior subordinated notes (related to trust preferred securities):


Fixed, with a weighted-average rate of 6.71%, ranging from 5.25% to 11.45%, due 2026 to 2055

  15,763     15,606

Floating, with a weighted-average rate of 0.88%, ranging from 0.50% to 3.63%, due 2027 to 2056

  3,517     3,736

Total notes issued by Bank of America Corporation

  182,888     171,462

Notes issued by Merrill Lynch & Co., Inc. and subsidiaries


Senior notes:


Fixed, with a weighted-average rate of 5.24%, ranging from 0.05% to 8.83%, due 2010 to 2066

  52,506     

Floating, with a weighted-average rate of 0.80%, ranging from 0.13% to 5.29%, due 2010 to 2044

  36,624     

Structured notes

  48,518     

Subordinated notes:


Fixed, with a weighted-average rate of 6.07%, ranging from 0.12% to 8.13%, due 2010 to 2038

  9,258     

Floating, with a weighted-average rate of 1.12%, ranging from 0.83% to 1.26%, due 2017 to 2037

  1,857     

Junior subordinated notes (related to trust preferred securities):


Fixed, with a weighted-average rate of 6.93%, ranging from 6.45% to 7.38%, due 2062 to 2066

  3,552     

Other long-term debt

  2,636     

Total notes issued by Merrill Lynch & Co., Inc. and subsidiaries

  154,951     

Notes issued by Bank of America, N.A. and other subsidiaries


Senior notes:


Fixed, with a weighted-average rate of 2.16%, ranging from 0.40% to 8.10%, due 2010 to 2027

  12,461     6,103

Floating, with a weighted-average rate of 0.38%, ranging from 0.15% to 3.31%, due 2010 to 2051

  24,846     28,467

Subordinated notes:


Fixed, with a weighted-average rate of 5.91%, ranging from 5.30% to 7.13%, due 2012 to 2036

  5,193     5,593

Floating, with a weighted-average rate of 0.73%, ranging from 0.25% to 3.76%, due 2010 to 2027

  2,272     2,796

Total notes issued by Bank of America, N.A. and other subsidiaries

  44,772     42,959

Notes issued by NB Holdings Corporation


Junior subordinated notes (related to trust preferred securities):


Floating, 0.85%, due 2027

  258     258

Total notes issued by NB Holdings Corporation

  258     258

Notes issued by BAC North America Holding Company and subsidiaries


Senior notes:


Fixed, with a weighted-average rate of 5.40%, ranging from 3.00% to 7.00%, due 2010 to 2026

  420     562

Junior subordinated notes (related to trust preferred securities):


Fixed, 6.97%, perpetual

  490     491

Floating, with a weighted-average rate of 1.54%, ranging from 0.31% to 2.03%, perpetual

  945     940

Total notes issued by BAC North America Holding Company and subsidiaries

  1,855     1,993

Other debt


Advances from Federal Home Loan Banks:


Fixed, with a weighted-average rate of 4.08%, ranging from 0.36% to 8.29%, due 2010 to 2028

  53,032     48,495

Floating, with a weighted-average rate of 0.14%, ranging from 0.13% to 0.14%, due 2011 to 2013

  750     2,750

Other

  15     375

Total other debt

  53,797     51,620

Total long-term debt

 $438,521    $268,292

At December 31, 2010, long-term debt of consolidated VIEs included credit card, automobile, home equity and other VIEs of $52.8 billion, $6.5 billion, $3.6 billion and $8.1 billion, respectively. Long-term debt of VIEs is collateralized by the assets of the VIEs. For more information, seeNote 8 – Securitizations and Other Variable Interest Entities.
The majority of the floating rates are based on three- and six-month London InterBankInterbank Offered RatesRate (LIBOR).

Bank of America Corporation, Merrill Lynch & Co., Inc. and subsidiaries, and Bank of America, N.A. maintain various domesticU.S. and internationalnon-U.S. debt programs to offer both senior and subordinated notes. The notes may be denominated in U.S. dollars or foreign currencies. At December 31, 20092010 and 2008,2009, the amount of foreign currency-denominated debt translated into U.S. dollars included in total long-term debt was $156.8$145.9 billion and $53.3$156.8 billion. Foreign currency contracts are used to convert certain foreign currency-denominated debt into U.S. dollars.

At December 31, 20092010 and 2008,2009, Bank of America Corporation was authorized to issuehad approximately $88.4 billion and $119.1 billion and $92.9 billion of additionalauthorized, but unissued, corporate debt and other securities under its existing domesticU.S. shelf registration statements. At December 31, 20092010 and 2008,2009, Bank of

America, N.A. was authorized to issuehad approximately $53.3 billion and $35.3 billion and $48.3of authorized, but unissued, bank notes under its existing $75.0 billion of additional bank notes.note program. Long-term bank notes issued and outstanding under Bank of America, N.A.’s $75.0 billion bank note program totaled $19.1$7.1 billion and $16.2$19.1 billion at December 31, 20092010 and 2008. In addition,2009. At both December 31, 2010 and 2009, Bank of America, N.A. was authorized to issuehad approximately $20.6 billion of additionalauthorized, but unissued, mortgage notes under theits $30.0 billion mortgage bond program at both December 31, 2009 and 2008.

program.

The weighted-average effective interest rates for total long-term debt, (excludingexcluding senior structured notes),notes, total fixed-rate debt and total floating-rate debt, (basedbased on the rates in effect at December 31, 2009)2010, were 3.96 percent, 5.02 percent and 1.09 percent, respectively, at December 31, 2010 and,


190     Bank of America 2010


based on the rates in effect at December 31, 2009, were 3.62 percent, 4.93 percent and 0.80 percent, respectively, at December 31, 2009 and (based2009. The Corporation’s ALM activities maintain an overall interest rate risk management strategy that incorporates the use of interest rate contracts to manage fluctuations in earnings that are caused by interest rate volatility. The Corporation’s goal is to manage interest rate sensitivity so that movements in interest rates do not significantly adversely affect net interest income. The above weighted-average rates are the contractual interest rates on the rates in effect at December 31, 2008) were 4.26 percent, 5.05 percentdebt, and 2.80 percent, respectively, at December 31, 2008.

do not reflect the impacts of derivative transactions.

154Bank of America 2009


The weighted-average interest rate for debt, (excludingexcluding senior structured notes)notes, issued by Merrill Lynch & Co., Inc. and subsidiaries was 4.11 percent and 3.73 percent at December 31, 2010 and 2009. TheAt December 31, 2010, the Corporation has not assumed or guaranteed the $154$120.9 billion of long-term debt that was issued or guaranteed by Merrill Lynch & Co., Inc. or its subsidiaries prior to the acquisition of Merrill Lynch by the Corporation.

Beginning late in the third quarter of 2009, in connection with the update or renewal of certain Merrill Lynch internationalnon-U.S. securities offering programs, the Corporation agreed to guarantee debt securities, warrantsand/or certificates issued by certain subsidiaries of Merrill Lynch & Co., Inc. on a going forwardgoing-forward basis. All existing Merrill Lynch & Co., Inc. guarantees of securities issued by those

same Merrill Lynch subsidiaries under various internationalnon-U.S. securities offering programs will remain in full force and effect as long as those securities are outstanding, and the Corporation has not assumed any of those prior Merrill Lynch & Co., Inc. guarantees or otherwise guaranteed such securities.

In addition, certain

Certain senior structured notes acquired in the acquisition ofissued by Merrill Lynch are accounted for under the fair value option. For more information on these senior structured notes, seeNote 2023 – Fair Value MeasurementsOption..

Aggregate

The table below represents the book value for aggregate annual maturities of long-term debt obligations at December 31, 20092010.


(Dollars in millions) 2011  2012  2013  2014  2015  Thereafter  Total 
Bank of America Corporation $16,419  $40,432  $8,731  $21,890  $13,236  $85,888  $186,596 
Merrill Lynch & Co., Inc. and subsidiaries  26,554   18,611   18,053   16,650   4,515   41,370   125,753 
Bank of America, N.A. and other subsidiaries  4,382   5,796   86   503   1,015   9,485   21,267 
Other debt  22,760   12,549   5,031   1,293   105   2,064   43,802 
                             
Total long-term debt excluding consolidated VIEs
  70,115   77,388   31,901   40,336   18,871   138,807   377,418 
Long-term debt of consolidated VIEs under new consolidation guidance  19,136   11,800   17,514   9,103   1,229   12,231   71,013 
                             
Total long-term debt
 $89,251  $89,188  $49,415  $49,439  $20,100  $151,038  $448,431 
                             

Included in the above table are as follows:


(Dollars in millions) 2010    2011    2012    2013    2014    Thereafter  Total

Bank of America Corporation

 $23,354    $15,711    $39,880    $7,714    $16,119    $80,110  $182,888

Merrill Lynch & Co., Inc. and subsidiaries

  31,680     19,867     18,760     21,246     17,210     46,188   154,951

Bank of America, N.A. and other subsidiaries

  20,779     58     5,759     3,240     99     14,837   44,772

NB Holdings Corporation

                           258   258

BAC North America Holding Company and subsidiaries

  74     43     15     26     45     1,652   1,855

Other

  23,257     18,364     5,597     5,132     1,272     175   53,797

Total

 $99,144    $54,043    $70,011    $37,358    $34,745    $143,220  $438,521

Certaincertain structured notes that contain provisions whereby the borrowings are redeemable at the option of the holder (put options) at specified dates prior to maturity. Other structured notes have coupon or repayment terms linked to the performance of debt or equity securities, indices, currencies or commodities and the maturity may be accelerated based on the value of a referenced index or security. In both cases, the Corporation or a subsidiary may be required to settle the obligation for cash or other securities prior to the contractual maturity date. These borrowings are reflected in the above table as maturing at their earliest put or redemption date.

Trust Preferred and Hybrid Securities

Trust preferred securities (Trust Securities) are issued by trust companies (the Trusts) that are not consolidated. These Trust Securities are mandatorily redeemable preferred security obligations of the Trusts. The sole assets of the Trusts generally are junior subordinated deferrable interest notes of the Corporation or its subsidiaries (the Notes). The Trusts generally are 100 percent owned finance subsidiaries of the Corporation. Obligations associated with the Notes are included in the Long-term Debtlong-term debt table on the previous page.

page 190.

Certain of the Trust Securities were issued at a discount and may be redeemed prior to maturity at the option of the Corporation. The Trusts generally have invested the proceeds of such Trust Securities in the Notes. Each issue of the Notes has an interest rate equal to the corresponding Trust Securities distribution rate. The Corporation has the right to defer payment of interest on the Notes at any time or from time to time for a period not exceeding five years provided that no extension period may extend beyond the stated maturity of the relevant Notes. During any such extension period, distributions on the Trust Securities will also be deferred and the Corporation’s ability to pay dividends on its common and preferred stock will be restricted.

The Trust Securities generally are subject to mandatory redemption upon repayment of the related Notes at their stated maturity dates or their earlier redemption at a redemption price equal to their liquidation amount plus accrued distributions to the date fixed for redemption and the premium, if any, paid by the Corporation upon concurrent repayment of the related Notes.

Periodic cash payments and payments upon liquidation or redemption with respect to Trust Securities are guaranteed by the Corporation or its

subsidiaries to the extent of funds held by the Trusts (the Preferred Securities Guarantee). The Preferred Securities Guarantee, when taken together with the Corporation’s other obligations including its obligations under the Notes, generally will constitute a full and unconditional guarantee, on a subordinated basis, by the Corporation of payments due on the Trust Securities.

Hybrid Income Term Securities (HITS) totaling $1.6 billion were also issued by the Trusts to institutional investors in 2007. The BAC Capital Trust XIII Floating RateFloating-Rate Preferred HITS have a distribution rate of three-month LIBOR plus 40 bps and the BAC Capital Trust XIV Fixed-to-Floating RateFixed-to-Floating-Rate Preferred HITS have an initial distribution rate of 5.63 percent. Both series of HITS represent beneficial interests in the assets of the respective capital trust, which consist of a series of the Corporation’s junior subordinated notes and a stock purchase contract for a specified series of the Corporation’s preferred stock. The Corporation will remarket the junior subordinated notes underlying each series of HITS on or about the five-year anniversary of the issuance to obtain sufficient funds for the capital trusts to buy the Corporation’s preferred stock under the stock purchase contracts.

In connection with the HITS, the Corporation entered into two replacement capital covenants for the benefit of investors in certain series of the Corporation’s long-term indebtedness (Covered Debt). As of December 31, 2009,2010, the Corporation’s 6.625% Junior Subordinated Notes due 2036 constitute the Covered Debt under the covenant corresponding to the Floating RateFloating-Rate Preferred HITS and the Corporation’s 5.625% Junior Subordinated Notes due 2035 constitute the Covered Debt under the covenant corresponding to the Fixed-to-Floating RateFixed-to-Floating-Rate Preferred HITS. These covenants generally restrict the ability of the Corporation and its subsidiaries to redeem or purchase the HITS and related securities unless the Corporation has obtained the prior approval of the Board of Governors of the Federal Reserve System (Federal Reserve) if required under the Federal Reserve’s capital guidelines, the redemption or purchase price of the HITS does not exceed the amount received by the Corporation from the sale of certain qualifying securities, and such replacement securities qualify as Tier 1 Capital and are not “restricted core capital elements” under the Federal Reserve’s guidelines.

Also included in the outstanding Trust Securities and Notes in the following table are non-consolidated wholly owned subsidiary funding vehicles


Bank of BAC North America Holding Company (BACNAH, formerly ABN

2010     
191

Bank of America 2009155


AMRO North America Holding Company) and its subsidiary, LaSalle, that issued preferred securities (Funding Securities). These subsidiary funding vehicles have invested the proceeds of their Funding Securities in separate series of preferred securities of BACNAH or LaSalle, as applicable (BACNAH Preferred Securities).

The BACNAH Preferred Securities (and the corresponding Funding Securities) are non-cumulative and permit nonpayment of dividends within certain limitations. The issuance dates for the BACNAH Preferred Securities (and the related Funding Securities)

range from 2000 to 2001. These Funding Securities are subject to mandatory redemption upon repayment by the issuer of the corresponding series of BACNAH Preferred Securities at a redemption price equal to their liquidation amount plus accrued and unpaid distributions for up to one quarter.

For additional information on Trust Securities for regulatory capital purposes,see Note 16 – Regulatory Requirements and Restrictions.


156Bank of America 2009


The following table below is a summary of the outstanding Trust and Hybrid Securities and the related Notes at December 31, 20092010 as originated by Bank of America Corporation and its predecessor companies and subsidiaries.

  Issuance Date  Aggregate
Principal
Amount
of Trust
Securities
  Aggregate
Principal
Amount
of the
Notes
  Stated Maturity
of the Notes
 

Per Annum Interest

Rate of the Notes

   Interest Payment
Dates
  Redemption Period
(Dollars in millions)            
Issuer            

Bank of America


Capital Trust I

 December 2001  $575  $593  December 2031 7.00  3/15,6/15,9/15,12/15  On or after 12/15/06

Capital Trust II

 January 2002   900   928  February 2032 7.00    2/1,5/1,8/1,11/1  On or after 2/01/07

Capital Trust III

 August 2002   500   516  August 2032 7.00    2/15,5/15,8/15,11/15  On or after 8/15/07

Capital Trust IV

 April 2003   375   387  May 2033 5.88    2/1,5/1,8/1,11/1  On or after 5/01/08

Capital Trust V

 November 2004   518   534  November 2034 6.00    2/3,5/3,8/3,11/3  On or after 11/03/09

Capital Trust VI

 March 2005   1,000   1,031  March 2035 5.63    3/8,9/8  Any time

Capital Trust VII(1)

 August 2005   1,415   1,415  August 2035 5.25    2/10,8/10  Any time

Capital Trust VIII

 August 2005   530   546  August 2035 6.00    2/25,5/25,8/25,11/25  On or after 8/25/10

Capital Trust X

 March 2006   900   928  March 2055 6.25    3/29,6/29,9/29,12/29  On or after 3/29/11

Capital Trust XI

 May 2006   1,000   1,031  May 2036 6.63    5/23,11/23  Any time

Capital Trust XII

 August 2006   863   890  August 2055 6.88    2/2,5/2,8/2,11/2  On or after 8/02/11

Capital Trust XIII

 February 2007   700   700  March 2043 3-mo. LIBOR +40 bps    3/15,6/15,9/15,12/15  On or after 3/15/17

Capital Trust XIV

 February 2007   850   850  March 2043 5.63    3/15,9/15  On or after 3/15/17

Capital Trust XV

 May 2007   500   500  June 2056 3-mo. LIBOR +80 bps    3/1,6/1,9/1,12/1  On or after 6/01/37

NationsBank


Capital Trust II

 December 1996   365   376  December 2026 7.83    6/15,12/15  On or after 12/15/06

Capital Trust III

 February 1997   500   515  January 2027 3-mo. LIBOR +55 bps    1/15,4/15,7/15,10/15  On or after 1/15/07

Capital Trust IV

 April 1997   500   515  April 2027 8.25    4/15,10/15  On or after 4/15/07

BankAmerica


Institutional Capital A

 November 1996   450   464  December 2026 8.07    6/30,12/31  On or after 12/31/06

Institutional Capital B

 November 1996   300   309  December 2026 7.70    6/30,12/31  On or after 12/31/06

Capital II

 December 1996   450   464  December 2026 8.00    6/15,12/15  On or after 12/15/06

Capital III

 January 1997   400   412  January 2027 3-mo. LIBOR +57 bps    1/15,4/15,7/15,10/15  On or after 1/15/02

Barnett


Capital III

 January 1997   250   258  February 2027 3-mo. LIBOR +62.5 bps    2/1,5/1,8/1,11/1  On or after 2/01/07

Fleet


Capital Trust II

 December 1996   250   258  December 2026 7.92    6/15,12/15  On or after 12/15/06

Capital Trust V

 December 1998   250   258  December 2028 3-mo. LIBOR +100 bps    3/18,6/18,9/18,12/18  On or after 12/18/03

Capital Trust VIII

 March 2002   534   550  March 2032 7.20    3/15,6/15,9/15,12/15  On or after 3/08/07
Capital Trust IX July 2003   175   180  August 2033 6.00    2/1,5/1,8/1,11/1  On or after 7/31/08

BankBoston


Capital Trust III

 June 1997   250   258  June 2027 3-mo. LIBOR +75 bps    3/15,6/15,9/15,12/15  On or after 6/15/07

Capital Trust IV

 June 1998   250   258  June 2028 3-mo. LIBOR +60 bps    3/8,6/8,9/8,12/8  On or after 6/08/03

Progress


Capital Trust I

 June 1997   9   9  June 2027 10.50    6/1,12/1  On or after 6/01/07

Capital Trust II

 July 2000   6   6  July 2030 11.45    1/19,7/19  On or after 7/19/10

Capital Trust III

 November 2002   10   10  November 2032 3-mo. LIBOR +335 bps    2/15,5/15,8/15,11/15  On or after 11/15/07

Capital Trust IV

 December 2002   5   5  January 2033 3-mo. LIBOR +335 bps    1/7,4/7,7/7,10/7  On or after 1/07/08

MBNA


Capital Trust A

 December 1996   250   258  December 2026 8.28��   6/1,12/1  On or after 12/01/06

Capital Trust B

 January 1997   280   289  February 2027 3-mo. LIBOR +80 bps    2/1,5/1,8/1,11/1  On or after 2/01/07

Capital Trust D

 June 2002   300   309  October 2032 8.13    1/1,4/1,7/1,10/1  On or after 10/01/07

Capital Trust E

 November 2002   200   206  February 2033 8.10    2/15,5/15,8/15,11/15  On or after 2/15/08

ABN AMRO North America


Series I

 May 2001   77   77  Perpetual 3-mo. LIBOR +175 bps    2/15,5/15,8/15,11/15  On or after 11/8/12

Series II

 May 2001   77   77  Perpetual 3-mo. LIBOR +175 bps    3/15,6/15,9/15,12/15  On or after 11/8/12

Series III

 May 2001   77   77  Perpetual 3-mo. LIBOR +175 bps    1/15,4/15,7/15,10/15  On or after 11/8/12

Series IV

 May 2001   77   77  Perpetual 3-mo. LIBOR +175 bps    2/28,5/30,8/30,11/30  On or after 11/8/12

Series V

 May 2001   77   77  Perpetual 3-mo. LIBOR +175 bps    3/30,6/30,9/30,12/30  On or after 11/8/12

Series VI

 May 2001   77   77  Perpetual 3-mo. LIBOR +175 bps    1/30,4/30,7/30,10/30  On or after 11/8/12

Series VII

 May 2001   88   88  Perpetual 3-mo. LIBOR +175 bps    3/15,6/15,9/15,12/15  On or after 11/8/12

Series IX

 June 2001   70   70  Perpetual 3-mo. LIBOR +175 bps    3/5,6/5,9/5,12/5  On or after 11/8/12

Series X

 June 2001   53   53  Perpetual 3-mo. LIBOR +175 bps    3/12,6/12,9/12,12/12  On or after 11/8/12

Series XI

 June 2001   27   27  Perpetual 3-mo. LIBOR +175 bps    3/26,6/26,9/26,12/26  On or after 11/8/12

Series XII

 June 2001   80   80  Perpetual 3-mo. LIBOR +175 bps    1/10,4/10,7/10,10/10  On or after 11/8/12

Series XIII

 June 2001   70   70  Perpetual 3-mo. LIBOR +175 bps    1/24,4/24,7/24,10/24  On or after 11/8/12

LaSalle


Series I

 August 2000   491   491  Perpetual 6.97% through 9/15/2010;
3-mo. LIBOR +105.5 bps
thereafter


  3/15,6/15,9/15,12/15  On or after 9/15/10

Series J

 September 2000   95   95  Perpetual 3-mo. LIBOR +5.5 bps
through 9/15/2010; 3-mo.
LIBOR +105.5 bps
thereafter


  3/15,6/15,9/15,12/15  On or after 9/15/10

Countrywide


Capital III

 June 1997   200   206  June 2027 8.05    6/15,12/15  Only under special event

Capital IV

 April 2003   500   515  April 2033 6.75    1/1,4/1,7/1,10/1  On or after 4/11/08

Capital V

 November 2006   1,495   1,496  November 2036 7.00    2/1,5/1,8/1,11/1  On or after 11/1/11

Merrill Lynch


Preferred Capital Trust III

 January 1998   750   900  Perpetual 7.00    3/30,6/30,9/30,12/30  On or after 3/08

Preferred Capital Trust IV

 June 1998   400   480  Perpetual 7.12    3/30,6/30,9/30,12/30  On or after 6/08

Preferred Capital Trust V

 November 1998   850   1,021  Perpetual 7.28    3/30,6/30,9/30,12/30  On or after 9/08

Capital Trust I

 December 2006   1,050   1,051  December 2066 6.45    3/15,6/15,9/15,12/15  On or after 12/11

Capital Trust II

 May 2007   950   951  June 2062 6.45    3/15,6/15,9/15,12/15  On or after 6/12

Capital Trust III

 August 2007   750   751  September 2062 7.375    3/15,6/15,9/15,12/15  On or after 9/12

Total

    $24,991  $25,823            
For additional information on Trust Securities for regulatory capital purposes, seeNote 18 – Regulatory Requirements and Restrictions.
                             
     Aggregate
  Aggregate
             
     Principal
  Principal
             
     Amount
  Amount
             
(Dollars in millions)
    of Trust
  of the
  Stated Maturity
  Per Annum Interest
  Interest Payment
    
Issuer Issuance Date  Securities  Notes  of the Notes  Rate of the Notes  Dates  Redemption Period 
Bank of America
                            
Capital Trust I  December 2001  $575  $593   December 2031   7.00%  3/15,6/15,9/15,12/15   On or after 12/15/06 
Capital Trust II  January 2002   900   928   February 2032   7.00   2/1,5/1,8/1,11/1   On or after 2/01/07 
Capital Trust III  August 2002   500   516   August 2032   7.00   2/15,5/15,8/15,11/15   On or after 8/15/07 
Capital Trust IV  April 2003   375   387   May 2033   5.88   2/1,5/1,8/1,11/1   On or after 5/01/08 
Capital Trust V  November 2004   518   534   November 2034   6.00   2/3,5/3,8/3,11/3   On or after 11/03/09 
Capital Trust VI  March 2005   1,000   1,031   March 2035   5.63   3/8,9/8   Any time 
Capital Trust VII (1)
  August 2005   1,320   1,361   August 2035   5.25   2/10,8/10   Any time 
Capital Trust VIII  August 2005   530   546   August 2035   6.00   2/25,5/25,8/25,11/25   On or after 8/25/10 
Capital Trust X  March 2006   900   928   March 2055   6.25   3/29,6/29,9/29,12/29   On or after 3/29/11 
Capital Trust XI  May 2006   1,000   1,031   May 2036   6.63   5/23,11/23   Any time 
Capital Trust XII  August 2006   863   890   August 2055   6.88   2/2,5/2,8/2,11/2   On or after 8/02/11 
Capital Trust XIII  February 2007   700   700   March 2043   3-mo. LIBOR +40 bps   3/15,6/15,9/15,12/15   On or after 3/15/17 
Capital Trust XIV  February 2007   850   850   March 2043   5.63   3/15,9/15   On or after 3/15/17 
Capital Trust XV  May 2007   500   500   June 2056   3-mo. LIBOR +80 bps   3/1,6/1,9/1,12/1   On or after 6/01/37 
                             
NationsBank
                            
Capital Trust II  December 1996   365   376   December 2026   7.83   6/15,12/15   On or after 12/15/06 
Capital Trust III  February 1997   500   515   January 2027   3-mo. LIBOR +55 bps   1/15,4/15,7/15,10/15   On or after 1/15/07 
Capital Trust IV  April 1997   500   515   April 2027   8.25   4/15,10/15   On or after 4/15/07 
                             
BankAmerica
                            
Institutional Capital A  November 1996   450   464   December 2026   8.07   6/30,12/31   On or after 12/31/06 
Institutional Capital B  November 1996   300   309   December 2026   7.70   6/30,12/31   On or after 12/31/06 
Capital II  December 1996   450   464   December 2026   8.00   6/15,12/15   On or after 12/15/06 
Capital III  January 1997   400   412   January 2027   3-mo. LIBOR +57 bps   1/15,4/15,7/15,10/15   On or after 1/15/02 
                             
Barnett
                            
Capital III  January 1997   250   258   February 2027   3-mo. LIBOR +62.5 bps   2/1,5/1,8/1,11/1   On or after 2/01/07 
                             
Fleet
                            
Capital Trust II  December 1996   250   258   December 2026   7.92   6/15,12/15   On or after 12/15/06 
Capital Trust V  December 1998   250   258   December 2028   3-mo. LIBOR +100 bps   3/18,6/18,9/18,12/18   On or after 12/18/03 
Capital Trust VIII  March 2002   534   550   March 2032   7.20   3/15,6/15,9/15,12/15   On or after 3/08/07 
Capital Trust IX  July 2003   175   180   August 2033   6.00   2/1,5/1,8/1,11/1   On or after 7/31/08 
                             
BankBoston
                            
Capital Trust III  June 1997   250   258   June 2027   3-mo. LIBOR +75 bps   3/15,6/15,9/15,12/15   On or after 6/15/07 
Capital Trust IV  June 1998   250   258   June 2028   3-mo. LIBOR +60 bps   3/8,6/8,9/8,12/8   On or after 6/08/03 
                             
Progress
                            
Capital Trust I  June 1997   9   9   June 2027   10.50   6/1,12/1   On or after 6/01/07 
Capital Trust II  July 2000   6   6   July 2030   11.45   1/19,7/19   On or after 7/19/10 
Capital Trust III  November 2002   10   10   November 2032   3-mo. LIBOR +335 bps   2/15,5/15,8/15,11/15   On or after 11/15/07 
Capital Trust IV  December 2002   5   5   January 2033   3-mo. LIBOR +335 bps   1/7,4/7,7/7,10/7   On or after 1/07/08 
                             
MBNA
                            
Capital Trust A  December 1996   250   258   December 2026   8.28   6/1,12/1   On or after 12/01/06 
Capital Trust B  January 1997   280   289   February 2027   3-mo. LIBOR +80 bps   2/1,5/1,8/1,11/1   On or after 2/01/07 
Capital Trust D  June 2002   300   309   October 2032   8.13   1/1,4/1,7/1,10/1   On or after 10/01/07 
Capital Trust E  November 2002   200   206   February 2033   8.10   2/15,5/15,8/15,11/15   On or after 2/15/08 
                             
ABN AMRO North America
                            
Series I  May 2001   77   77   Perpetual   3-mo. LIBOR +175 bps   2/15,5/15,8/15,11/15   On or after 11/08/12 
Series II  May 2001   77   77   Perpetual   3-mo. LIBOR +175 bps   3/15,6/15,9/15,12/15   On or after 11/08/12 
Series III  May 2001   77   77   Perpetual   3-mo. LIBOR +175 bps   1/15,4/15,7/15,10/15   On or after 11/08/12 
Series IV  May 2001   77   77   Perpetual   3-mo. LIBOR +175 bps   2/28,5/30,8/30,11/30   On or after 11/08/12 
Series V  May 2001   77   77   Perpetual   3-mo. LIBOR +175 bps   3/30,6/30,9/30,12/30   On or after 11/08/12 
Series VI  May 2001   77   77   Perpetual   3-mo. LIBOR +175 bps   1/30,4/30,7/30,10/30   On or after 11/08/12 
Series VII  May 2001   88   88   Perpetual   3-mo. LIBOR +175 bps   3/15,6/15,9/15,12/15   On or after 11/08/12 
Series IX  June 2001   70   70   Perpetual   3-mo. LIBOR +175 bps   3/5,6/5,9/5,12/5   On or after 11/08/12 
Series X  June 2001   53   53   Perpetual   3-mo. LIBOR +175 bps   3/12,6/12,9/12,12/12   On or after 11/08/12 
Series XI  June 2001   27   27   Perpetual   3-mo. LIBOR +175 bps   3/26,6/26,9/26,12/26   On or after 11/08/12 
Series XII  June 2001   80   80   Perpetual   3-mo. LIBOR +175 bps   1/10,4/10,7/10,10/10   On or after 11/08/12 
Series XIII  June 2001   70   70   Perpetual   3-mo. LIBOR +175 bps   1/24,4/24,7/24,10/24   On or after 11/08/12 
                             
LaSalle
                            
Series I  August 2000   491   491   Perpetual   6.97% through 9/15/2010;
3-mo. LIBOR +105.5 bps
thereafter
   3/15,6/15,9/15,12/15   On or after 9/15/10 
Series J  September 2000   95   95   Perpetual   3-mo. LIBOR +5.5 bps
through 9/15/2010; 3-mo.
LIBOR +105.5 bps
thereafter
   3/15,6/15,9/15,12/15   On or after 9/15/10 
                             
Countrywide
                            
Capital III  June 1997   200   206   June 2027   8.05   6/15,12/15   Only under special event 
Capital IV  April 2003   500   515   April 2033   6.75   1/1,4/1,7/1,10/1   On or after 4/11/08 
Capital V  November 2006   1,495   1,496   November 2036   7.00   2/1,5/1,8/1,11/1   On or after 11/01/11 
                             
Merrill Lynch
                            
Preferred Capital Trust III  January 1998   750   900   Perpetual   7.00   3/30,6/30,9/30,12/30   On or after 3/08 
Preferred Capital Trust IV  June 1998   400   480   Perpetual   7.12   3/30,6/30,9/30,12/30   On or after 6/08 
Preferred Capital Trust V  November 1998   850   1,021   Perpetual   7.28   3/30,6/30,9/30,12/30   On or after 9/08 
Capital Trust I  December 2006   1,050   1,051   December 2066   6.45   3/15,6/15,9/15,12/15   On or after 12/11 
Capital Trust II  May 2007   950   951   June 2062   6.45   3/15,6/15,9/15,12/15   On or after 6/12 
Capital Trust III  August 2007   750   751   September 2062   7.375   3/15,6/15,9/15,12/15   On or after 9/12 
                             
Total
     $24,896  $25,769                 
                             
(1)

Aggregate principal amount of notes

Notes were issued in British Pound. Presentation currency is U.S. Dollar.

Bank of America 2009157
192     Bank of America 2010


NOTE 14 Commitments and Contingencies

In the normal course of business, the Corporation enters into a number of off-balance sheet commitments. These commitments expose the Corporation to varying degrees of credit and market risk and are subject to the same credit and market risk limitation reviews as those instruments recorded on the Corporation’s Consolidated Balance Sheet.

Credit Extension Commitments

The Corporation enters into commitments to extend credit such as loan commitments, SBLCs and commercial letters of credit to meet the financing needs of its customers. The table below shows the notional amount of unfunded legally binding lending commitments shown in the following table are net of amounts distributed (e.g., syndicated) to other financial institutions of $30.9$23.3 billion and $46.9$30.9 billion at December 31, 20092010 and 2008.2009. At December 31, 2009,2010, the carrying

carrying

amount of these commitments, excluding commitments accounted for under the fair value option, was $1.5$1.2 billion, including deferred revenue of $34$29 million and a reserve for unfunded legally binding lending commitments of $1.5$1.2 billion. At December 31, 2008,2009, the comparable amounts were $454 million, $33$1.5 billion, $34 million and $421 million.$1.5 billion, respectively. The carrying amount of these commitments is recordedclassified in accrued expenses and other liabilities.

The table below also includes the notional amount of commitments of $27.0$27.3 billion and $16.9$27.0 billion at December 31, 2010 and 2009, and 2008, whichthat are accounted for under the fair value option. However, the table below excludes the fair value adjustmentadjustments of $950$866 million and $1.1 billion$950 million on these commitments, that was recordedwhich are classified in accrued expenses and other liabilities. For information regarding the Corporation’s loan commitments accounted for atunder the fair value option, seeNote 2023 – Fair Value Measurements.Option.


(Dollars in millions) Expires in 1
Year or Less
    Expires after 1
Year through 3
Years
    Expires after 3
Years through
5 Years
    Expires after
5 Years
    Total

Credit extension commitments, December 31, 2009


Loan commitments

 $149,248    $187,585    $30,897    $28,489    $396,219

Home equity lines of credit

  1,810     3,272     10,667     76,924     92,673

Standby letters of credit and financial guarantees(1)

  29,794     27,789     4,923     13,739     76,245

Commercial letters of credit

  2,020     40          1,465     3,525

Legally binding commitments(2)

  182,872     218,686     46,487     120,617     568,662

Credit card lines(3)

  541,919                    541,919

Total credit extension commitments

 $724,791    $218,686    $46,487    $120,617    $1,110,581

Credit extension commitments, December 31, 2008


Loan commitments

 $128,992    $120,234    $67,111    $31,200    $347,537

Home equity lines of credit

  3,883     2,322     4,799     96,415     107,419

Standby letters of credit and financial guarantees(1)

  33,350     26,090     8,328     9,812     77,580

Commercial letters of credit

  2,228     29     1     1,507     3,765

Legally binding commitments(2)

  168,453     148,675     80,239     138,934     536,301

Credit card lines(3)

  827,350                    827,350

Total credit extension commitments

 $995,803    $148,675    $80,239    $138,934    $1,363,651

                     
  December 31, 2010 
     Expire after 1
  Expire after 3
       
  Expire in 1
  Year through
  Years through
  Expire after 5
    
(Dollars in millions) Year or Less  3 Years  5 Years  Years  Total 
Notional amount of credit extension commitments
                    
Loan commitments $152,926  $144,461  $43,465  $16,172  $357,024 
Home equity lines of credit  1,722   4,290   18,207   55,886   80,105 
Standby letters of credit and financial guarantees (1)
  35,275   18,940   4,144   5,897   64,256 
Letters of credit  3,698   110      874   4,682 
                     
Legally binding commitments  193,621   167,801   65,816   78,829   506,067 
Credit card lines (2)
  497,068            497,068 
                     
Total credit extension commitments
 $690,689  $167,801  $65,816  $78,829  $1,003,135 


  December 31, 2009 
Notional amount of credit extension commitments
                    
Loan commitments $149,248  $187,585  $30,897  $28,488  $396,218 
Home equity lines of credit  1,810   3,272   10,667   76,923   92,672 
Standby letters of credit and financial guarantees (1)
  29,794   21,285   4,923   13,740   69,742 
Letters of credit  2,020   40      1,467   3,527 
                     
Legally binding commitments  182,872   212,182   46,487   120,618   562,159 
Credit card lines (2)
  541,919            541,919 
                     
Total credit extension commitments
 $724,791  $212,182  $46,487  $120,618  $1,104,078 
                     
(1)

At December 31, 2009, the

The notional amountamounts of SBLCSBLCs and financial guarantees classified as investment grade and non-investment grade based on the credit quality of the underlying reference name within the instrument were $45.1$41.1 billion and $31.2 billion compared to $54.4 billion and $23.2$22.4 billion at December 31, 2008.

2010 and $39.7 billion and $30.0 billion at December 31, 2009.
(2)

Includes commitments to unconsolidated VIEs and certain QSPEs disclosed inNote 9 – Variable Interest Entities, including $25.1 billion and $41.6 billion to multi-seller conduits, and $9.8 billion and $6.8 billion to municipal bond trusts at December 31, 2009 and 2008. Also includes commitments to SPEs that are not disclosed inNote 9 – Variable Interest Entitiesbecause the Corporation does not hold a significant variable interest, including $368 million and $980 million to customer-sponsored conduits at December 31, 2009 and 2008.

(3)

Includes business card unused lines of credit.

Legally binding commitments to extend credit generally have specified rates and maturities. Certain of these commitments have adverse change clauses that help to protect the Corporation against deterioration in the borrowers’borrower’s ability to pay.

Other Commitments

Global Principal Investments and Other Equity Investments

At December 31, 20092010 and 2008,2009, the Corporation had unfunded equity investment commitments of approximately $2.8$1.5 billion and $1.9$2.8 billion. In light of proposed Basel regulatory capital changes related to unfunded

commitments, the Corporation has actively reduced these commitments in a series of transactions involving its private equity fund investments. For more information on these Basel regulatory capital changes, seeNote 18 – Regulatory Requirements and Restrictions. In 2010, the Corporation completed the sale of its exposure to certain private equity funds. For more information on these transactions, seeNote 5 – Securities. These commitments generally relate to the Corporation’s Global Principal Investments business which is comprised of a diversified portfolio of investments in private equity, real estate and other alternative investments. These investments are made either directly in a company or held through a fund. Bridge equity commitments provide equity bridge financing to facilitate clients’ investment activities. These conditional commitments are generally retired prior to or shortly following funding via syndication or the client’s decision to terminate. Where the Corporation has a binding equity bridge commitment and there is a market disruption or other unexpected event, there is heightened exposure in the portfolio and higher potential for loss, unless an orderly disposition


Bank of the exposure can be made. At December 31, 2009, the Corporation did not

America 2010     
193

have any unfunded bridge equity commitments. The Corporation had funded equity bridges of $1.2 billion that were committed prior to the market disruption. These equity bridges are considered held for investment and recorded in other assets. In 2009, the Corporation recorded a total of $670 million in losses in equity investment income related to these investments. At December 31, 2009, these equity bridges had a zero balance.


Loan Purchases

In 2005, the Corporation entered into an agreement for the committed purchase of retail automotive loans over a five-year period endingthat ended on June 30,22, 2010. TheUnder this agreement, the Corporation purchased $6.6 billion of such loans in 2009during the six months ended June 30, 2010 and purchased $12.0 billion of such loans in 2008 under this agreement. As ofalso the year ended December 31, 2009, the Corporation was committed for additional purchases of $6.5 billion over the remaining term of the agreement.2009. All loans purchased under this agreement arewere subject to a comprehensive set of credit criteria. This agreement iswas accounted for as a derivative liability with a fair value of $189 million and $316 million at December 31, 2009 and 2008.

2009. As of December 31, 2010, the Corporation was no longer committed for any additional purchases. As part of this agreement, the Corporation recorded a liability which may increase or decrease based on credit performance of the purchased loans over a period extending through 2016.

At December 31, 2010 and 2009, the Corporation had other commitments to purchase loans (e.g., residential mortgage and commercial real estate) of $2.6 billion and $2.2 billion, which upon settlement will be included in loans or LHFS.


158Bank of America 2009


Operating Leases

The Corporation is a party to operating leases for certain of its premises and equipment. Commitments under these leases are approximately $3.1$3.0 billion, $2.8$2.6 billion, $2.3$2.1 billion, $1.9$1.6 billion and $1.5$1.3 billion for 20102011 through 2014,2015, respectively, and $8.1$6.6 billion in the aggregate for all years thereafter.

Other Commitments

At December 31, 2010 and 2009, the Corporation had commitments to enter into forward-dated resale and securities borrowing agreements of $39.4 billion and $51.8 billion. In addition, the Corporation had commitments to enter into forward-dated repurchase and securities lending agreements of $33.5 billion and $58.3 billion. All of these commitments expire within the next 12 months.

Beginning in the second half of 2007, the Corporation provided support to certain cash funds managed withinGWIM.

The funds for which the Corporation provided support typically invested in high quality, short-term securities with a portfolio weighted-average maturity of 90 days or less, including securities issued by SIVs and senior debt holdings of financial service companies. Due to market disruptions, certain investments in SIVs and senior debt securities were downgraded by the ratings agencies and experienced a decline in fair value. The Corporation entered into capital commitments under which the Corporation provided cash to these funds as a result of the net asset value per unit of a fund declining below certain thresholds. All capital commitments to these cash funds have been terminated. In 2009 and 2008, the Corporation recorded losses of $195 million and $1.1 billion related to these capital commitments.

The Corporation does not consolidate the cash funds managed withinGWIM because the subordinated support provided by the Corporation did not absorb a majority of the variability created by the assets of the funds. In reaching this conclusion, the Corporation considered both interest rate and credit risk. The cash funds had total assets under management of $104.4 billion and $185.9 billion at December 31, 2009 and 2008.

In connection with federal and state securities regulators, the Corporation agreed to purchase at par ARS held by certain customers. During 2009, the Corporation purchased a net $3.8 billion of ARS from its customers. At December 31, 2009, the Corporation’s outstanding buyback commitment was $291 million.

In addition, the Corporation has entered into agreements with providers of market data, communications, systems consulting and other office-related services. At December 31, 2010 and 2009, the minimum fee commitments over the remaining lifeterms of these agreements totaled $2.1 billion and $2.3 billion.

Other Guarantees

Bank-owned Life Insurance Book Value Protection

The Corporation sells products that offer book value protection to insurance carriers who offer group life insurance policies to corporations, primarily banks. The book value protection is provided on portfolios of intermediate investment-grade fixed incomefixed-income securities and is intended to cover any shortfall in the event that policyholders surrender their policies and market value is

below book value. To manage its exposure, the Corporation imposes significant restrictions on surrenders and the manner in which the portfolio is liquidated and the funds are accessed. In addition, investment parameters of the underlying portfolio are restricted. These constraints, combined with structural protections, including a cap on the amount of risk assumed on each policy, are designed to provide adequate buffers and guard against payments even under extreme stress scenarios. These guarantees are recorded as derivatives and carried at fair value in the trading portfolio. At December 31, 20092010 and 2008,2009, the notional amount of these guarantees totaled $15.6$15.8 billion and $15.1$15.6 billion and the Corporation’s maximum exposure related to these guaran - -

teesguarantees totaled $4.9$5.0 billion and $4.8$4.9 billion with estimated maturity dates between 2030 and 2040. As of December 31, 2009 and 2008,2010, the Corporation has not made a payment under these products. The probability of surrender has increased due to investment manager underperformance and the deteriorating financial health of policyholders, but remains a small percentage of total notional.

Employee Retirement Protection

The Corporation sells products that offer book value protection primarily to plan sponsors of Employee Retirement Income Security Act of 1974 (ERISA) governed pension plans, such as 401(k) plans and 457 plans. The book value protection is provided on portfolios of intermediate/short-term investment-grade fixed incomefixed-income securities and is intended to cover any shortfall in the event that plan participants continue to withdraw funds after all securities have been liquidated and there is remaining book value. The Corporation retains the option to exit the contract at any time. If the Corporation exercises its option, the purchaser can require the Corporation to purchase high quality fixed incomefixed-income securities, typically government or government-backed agency securities, with the proceeds of the liquidated assets to assure the return of principal. To manage its exposure, the Corporation imposes significant restrictions and constraints on the timing of the withdrawals, the manner in which the portfolio is liquidated and the funds are accessed, and the investment parameters of the underlying portfolio. These constraints, combined with structural protections, are designed to provide adequate buffers and guard against payments even under extreme stress scenarios. These guarantees are recorded as derivatives and carried at fair value in the trading portfolio. At December 31, 20092010 and 2008,2009, the notional amount of these guarantees totaled $36.8$33.8 billion and $37.4$36.8 billion with estimated maturity dates between 2010 andup to 2014 if the exit option is exercised on all deals. As of December 31, 2009 and 2008,2010, the Corporation has not made a payment under these products and has assessed the probability of payments under these guarantees as remote.


194     Bank of America 2010


Indemnifications

In the ordinary course of business, the Corporation enters into various agreements that contain indemnifications, such as tax indemnifications, whereupon payment may become due if certain external events occur, such as a change in tax law. The indemnification clauses are often standard contractual terms and were entered into in the normal course of business based on an assessment that the risk of loss would be remote. These agreements typically contain an early termination clause that permits the Corporation to exit the agreement upon these events. The maximum potential future payment under indemnification agreements is difficult to assess for several reasons, including the occurrence of an external event, the inability to predict future changes in tax and other laws, the difficulty in determining how such laws would apply to parties in contracts, the absence of exposure limits contained in standard contract language and the timing of the early termination clause. Historically, any payments made under these guarantees have been de minimis. The Corporation has assessed the probability of making such payments in the future as remote.

Merchant Services

On June 26, 2009, the Corporation contributed its merchant processing business to a joint venture in exchange for a 46.5 percent ownership interest in the joint venture. The Corporation indemnifiedDuring the second quarter of 2010, the joint venture for any losses resulting from transactions processed through June 26, 2009purchased the interest held by one of the three initial investors bringing the Corporation’s ownership interest up to 49 percent. For additional information on the contributed merchant portfolio.

joint venture agreement, seeNote 5 – Securities.

The Corporation, on behalf of the joint venture, provides credit and debit card processing services to various merchants by processing credit and debit card transactions on the merchants’ behalf. In connection with these services, a liability may arise in the event of a billing dispute between the merchant and a cardholder that is ultimately resolved in the


Bank of America 2009159


cardholder’s favor and the merchant defaults uponon its obligation to reimburse the cardholder. A cardholder, through its issuing bank, generally has until the later of up to six months after the date a transaction is processed or the delivery of the product or service to present a chargeback to the joint venture as the merchant processor. If the joint venture is unable to collect this amount from the merchant, it bears the loss for the amount paid to the cardholder. The joint venture is primarily liable for any losses on transactions from the contributed portfolio that occur after June 26, 2009. However, if the joint venture fails to meet its obligation to reimburse the cardholder for disputed transactions, then the Corporation could be held liable for the disputed amount. In 2010 and 2009, the joint venture processed and 2008, the Corporation processed $323.8settled $265.5 billion and $369.4$250.0 billion of transactions and it recorded losses as a result of these chargebacks of $26$17 million and $21$26 million.

At December 31, 20092010 and 2008,2009, the Corporation, on behalf of the joint venture, held as collateral $26$25 million and $38$26 million of merchant escrow deposits which may be used to offset amounts due from the individual merchants. The joint venture also has the right to offset any payments with cash flows otherwise due to the merchant. Accordingly, the Corporation believes that the maximum potential exposure is not representative of the actual potential loss exposure. The Corporation believes the maximum potential exposure for chargebacks would not exceed the total amount of merchant transactions processed through Visa and MasterCard for the last six months, which represents the claim period for the cardholder, plus any outstanding delayed-delivery transactions. As of December 31, 20092010 and 2008,2009, the maximum potential exposure totaled approximately $131.0$139.5 billion

and $147.1$131.0 billion. The Corporation does not expect to make material payments in connection with these guarantees. The maximum potential exposure disclosed above does not include volumes processed by First Data contributed portfolios.

Brokerage Business

For a portion of the Corporation’s brokerage business, the Corporation has contracted with a third party to provide clearing services that include underwriting margin loans to the Corporation’s clients. This contract stipulates that the Corporation will indemnify the third party for any margin loan losses that occur in its issuing margin to the Corporation’s clients. The maximum potential future payment under this indemnification was $657 million and $577 million at December 31, 2009 and 2008. Historically, any payments made under this indemnification have not been material. As these margin loans are highly collateralized by the securities held by the brokerage clients, the Corporation has assessed the probability of making such payments in the future as remote. This indemnification would end with the termination of the clearing contract.

Other Derivative Contracts

The Corporation funds selected assets, including securities issued by CDOs and CLOs, through derivative contracts, typically total return swaps, with third parties and SPEs that are not consolidated on the Corporation’s Consolidated Balance Sheet. At December 31, 2010 and 2009, the total notional amount of these derivative contracts was approximately $4.3 billion and $4.9 billion with commercial banks and $1.7 billion and $2.8 billion with SPEs. The underlying securities are senior securities and substantially all of the Corporation’s exposures are insured. Accordingly, the Corporation’s exposure to loss consists principally of counterparty risk to the insurers. In certain circumstances, generally as a result of ratings downgrades, the Corporation may be required to purchase the underlying assets, which would not result in additional gain or loss to the Corporation as such exposure is already reflected in the fair value of the derivative contracts.

Other Guarantees

The Corporation sells products that guarantee the return of principal to investors at a preset future date. These guarantees cover a broad range of underlying asset classes and are designed to cover the shortfall between the market value of the underlying portfolio and the principal amount on the preset future date. To manage its exposure, the Corporation requires that these guarantees be backed by structural and investment constraints and certain pre-defined triggers that would require the underlying assets or portfolio to be liquidated and invested in zero-coupon bonds that mature at the preset future date. The Corporation is required to fund any shortfall at the preset future date between the proceeds of the liquidated assets and the purchase price of the zero-coupon bonds.bonds at the preset future date. These guarantees are recorded as derivatives and carried at fair value in the trading portfolio. At December 31, 20092010 and 2008,2009, the notional amount of these guarantees totaled $2.1 billion$666 million and $1.3$2.1 billion. These guarantees have various maturities ranging from two to five years. AtAs of December 31, 20092010 and 2008,2009, the Corporation had not made a payment under these products and has assessed the probability of payments under these guarantees as remote.

The Corporation has entered into additional guarantee agreements and commitments, including lease endlease-end obligation agreements, partial credit guarantees on certain leases, real estate joint venture guarantees, sold risk participation swaps, divested business commitments and sold put options that require gross settlement. The maximum potential future payment under these agreements was approximately $3.6$3.4 billion and $7.3$3.6 billion at December 31, 20092010 and 2008.2009. The estimated maturity dates of these obligations are between 2010 andextend up to 2033. The Corporation has made no material payments under these guarantees.

In addition, the Corporation has guaranteed the payment obligations of certain subsidiaries of Merrill Lynch on certain derivative transactions. The aggregate notional amount of such derivative liabilities was approximately $2.1 billion and $2.5 billion at December 31, 2010 and 2009. In the normal course of business, the Corporation periodically guarantees the obligations of its affiliates in a variety of transactions including ISDA-related transactions and non ISDA-related transactions such as commodities trading, repurchase agreements, prime brokerage agreements and other transactions.


Bank of America 2010     195


Payment Protection Insurance Claims Matter
In the U.K., the Corporation sells payment protection insurance (PPI) through itsGlobal Card Services business to credit card customers and has previously sold this insurance to consumer loan customers. PPI covers a consumer’s loan or debt repayment if certain events occur such as loss of job or illness. In response to an elevated level of customer complaints of misleading sales tactics across the industry, heightened media coverage and pressure from consumer advocacy groups, the U.K. Financial Services Authority (FSA) has investigated and raised concerns about the way some companies have handled complaints relating to the sale of these insurance policies. In August 2010, the FSA issued a policy statement on the assessment and remediation of PPI claims which is applicable to the Corporation’s U.K. consumer businesses and is intended to address concerns among consumers and regulators regarding the handling of PPI complaints across the industry. The policy statement sets standards for the sale of PPI that apply to current and prior sales, and in the event a company does not or did not comply with the standards, it is alleged that the insurance was incorrectly sold, giving the customer rights to remedies. The FSA gave companies until December 1, 2010 to comply with the new regulations, but the judicial review to assess compliance is still underway. Given the new regulatory guidance, as of December 31, 2010, the Corporation has a liability of $630 million based on its current claims history and an estimate of future claims that have yet to be asserted against the Corporation. The liability is included in accrued expenses and other liabilities and the related expense is included in insurance income. The policy statement also requires companies to review their sales practices and to proactively remediate non-complaining customers if evidence of a systematic breach of the newly articulated sales standards is discovered, which could include refunding premiums paid. Subject to the outcome of the Corporation’s review and the new regulatory guidance, it is possible that an additional liability may be required. Industry groups have challenged the policy statement through a judicial review process. The judicial review is not expected to be completed until the end of the first quarter of 2011. Therefore, the Corporation is unable to reasonably estimate the total amount of additional possible loss or a range of loss as of December 31, 2010.
Litigation and Regulatory Matters

In the ordinary course of business, the Corporation and its subsidiaries are routinely defendants in or parties to many pending and threatened legal actions and proceedings, including actions brought on behalf of various classes of claimants. Certain of theseThese actions and proceedings are generally based on alleged violations of consumer protection, securities, environmental, banking, employment and other laws. In certainsome of these actions and proceedings, claims for substantial monetary damages are asserted against the Corporation and its subsidiaries.

In the ordinary course of business, the Corporation and its subsidiaries are also subject to regulatory examinations, information gathering requests, inquiries and investigations. Certain subsidiaries of the Corporation are registered broker/dealers or investment advisors and are subject to regulation by the SEC, the Financial Industry Regulatory Authority (FINRA), the New York Stock Exchange, the Financial Services AuthorityFSA and other domestic, international and state securities regulators. In connection with formal and informal inquiries by those agencies, such subsidiaries receive numerous requests, subpoenas and orders for documents, testimony and information in connection with various aspects of their regulated activities.

In view of the inherent difficulty of predicting the outcome of such litigation and regulatory matters, particularly where the claimants seek very large or indeterminate damages or where the matters present novel legal theories or involve a large number of parties, the Corporation generally cannot state with confidencepredict what the eventual outcome of the pending matters will be, what the timing of

the ultimate resolution of these matters will be, or what the eventual loss, fines or penalties related to each pending matter may be.


160Bank of America 2009


In accordance with applicable accounting guidance, the Corporation establishes reservesan accrued liability for litigation and regulatory matters when those matters present loss contingencies that are both probable and estimable. In such cases, there may be an exposure to loss in excess of any amounts accrued. When a loss contingencies arecontingency is not both probable and estimable, the Corporation does not establish reserves. In somean accrued liability. As a litigation or regulatory matter develops, the Corporation, in conjunction with any outside counsel handling the matter, evaluates on an ongoing basis whether such matter presents a loss contingency that is probable and estimable. If, at the time of evaluation, the matters described below, including but not limitedloss contingency related to the Lehman Brothers Holdings, Inc. matters, loss contingencies area litigation or regulatory matter is not both probable and estimable, the matter will continue to be monitored for further developments that would make such loss contingency both probable and estimable. Once the loss contingency related to a litigation or regulatory matter is deemed to be both probable and estimable, the Corporation will establish an accrued liability with respect to such loss contingency and record a corresponding amount of litigation-related expense. The Corporation continues to monitor the matter for further developments that could affect the amount of the accrued liability that has been previously established. Excluding fees paid to external legal service providers, litigation-related expense of $2.6 billion was recognized in 2010 compared to $1.0 billion for 2009.

For a limited number of the viewmatters disclosed in this Note for which a loss is probable or reasonably possible in future periods, whether in excess of a related accrued liability or where there is no accrued liability, the Corporation is able to estimate a range of possible loss. In determining whether it is possible to provide an estimate of loss or range of possible loss, the Corporation reviews and evaluates its material litigation and regulatory matters on an ongoing basis, in conjunction with any outside counsel handling the matter, in light of potentially relevant factual and legal developments. These may include information learned through the discovery process, rulings on dispositive motions, settlement discussions, and other rulings by courts, arbitrators or others. In cases in which the Corporation possesses sufficient appropriate information to develop an estimate of loss or range of possible loss, that estimate is aggregated and disclosed below. There may be other disclosed matters for which a loss is probable or reasonably possible but such an estimate may not be possible. For those matters where an estimate is possible, management and accordingly, reserves have not been established forcurrently estimates the aggregate range of possible loss is $145 million to $1.5 billion in excess of the accrued liability (if any) related to those matters. This estimated range of possible loss is based upon currently available information and is subject to significant judgment and a variety of assumptions, and known and unknown uncertainties. The matters underlying the estimated range will change from time to time, and actual results may vary significantly from the current estimate. Those matters for which an estimate is not possible are not included within this estimated range. Therefore, this estimated range of possible loss represents what the Corporation believes to be an estimate of possible loss only for certain matters meeting these criteria. It does not represent the Corporation’s maximum loss exposure. Information is provided below regarding the nature of all of these contingencies and, where specified, the amount of the claim associated with these loss contingencies. Based on current knowledge, management does not believe that loss contingencies if any, arising from pending litigation and regulatory matters, including the litigation and regulatory matters described below,herein, will have a material adverse effect on the consolidated financial position or liquidity of the Corporation, but mayCorporation. However, in light of the inherent uncertainties involved in these matters, some of which are beyond the Corporation’s control, and the very large or indeterminate damages sought in some of these matters, an adverse outcome in one or more of these matters could be material to the Corporation’s results of operations or cash flows for any particular reporting period.


Adelphia Litigation196     

Adelphia Recovery Trust is the plaintiff in a lawsuit pending in the U.S. District Court for the Southern District of New York, entitledAdelphia Recovery Trust v. Bank of America N.A., et al. The lawsuit was filed on July 6, 2003 and originally named over 700 defendants, including Bank of America, N.A. (BANA), Banc of America Securities LLC (BAS), Merrill Lynch, Merrill Lynch Capital Corp., Fleet National Bank and Fleet Securities, Inc. (collectively Fleet) and other affiliated entities, and asserted over 50 claims under federal statutes and state common law relating to loans and other services provided to various affiliates of Adelphia Communications Corporation (ACC) and entities owned by members of the founding family of ACC. The plaintiff seeks compensatory damages of approximately $5 billion, plus fees, costs and exemplary damages. The District Court granted in part defendants’ motions to dismiss, which resulted in the dismissal of approximately 650 defendants from the lawsuit. The plaintiff appealed the dismissal decision. The primary claims remaining against BANA, BAS, Merrill Lynch, Merrill Lynch Capital Corp. and Fleet include fraud, aiding and abetting fraud and aiding and abetting breach of fiduciary duty. There are several pending defense motions for summary judgment. Trial is scheduled for September 13, 2010.2010


Auction Rate Securities ClaimsLitigation

On March 25,

Since October 2007, the Corporation, Merrill Lynch and certain affiliates have been named as defendants in a variety of lawsuits and other proceedings brought by customers and both individual and institutional investors regarding ARS. These actions generally allege that the defendants: (i) misled the plaintiffs into believing that there was a deeply liquid market for ARS, and (ii) failed to adequately disclose their or their affiliates’ practice of placing their own bids to support ARS auctions. Plaintiffs assert that ARS auctions started failing from August 2007 through February 2008 when the defendants and other broker-dealers stopped placing those “support bids.” In addition to the matters described in more detail below, numerous arbitrations and individual lawsuits have been filed against the Corporation, Merrill Lynch and certain affiliates by parties who purchased ARS and are seeking relief that includes compensatory and punitive damages totaling in excess of $1.8 billion, as well as rescission, among other relief.
Securities Actions
The Corporation and Merrill Lynch face a number of civil actions relating to the sales of ARS and management of ARS auctions, including two putative class action entitledBurton v. Merrill Lynch & Co., Inc., et al., was filedlawsuits in which the U.S. District Court for the Southern District of New York against Merrill Lynch Pierce, Fenner and Smith Incorporated (MLPF&S) and Merrill Lynch on behalf of persons who purchased and continue to hold ARS offered for sale by MLPF&S between March 25, 2003 and February 13, 2008. The complaint alleges, among other things, that MLPF&S failed to disclose material facts about ARS. A similar action, entitledStanton v. Merrill Lynch & Co., Inc., et al., was filed the next day in the same court. On October 31, 2008, the two cases, entitledIn Re Merrill Lynch Auction Rate Securities Litigation, were consolidated, and, on December 10, 2008, plaintiffs filed a consolidated class action amended complaint. Plaintiffs seek to recover the alleged losses in the market value of ARS allegedlysecurities purportedly caused by the decision of MLPF&S and Merrill Lynch to discontinue supporting auctions for ARS.defendants’ actions. Plaintiffs also seek unspecified damages, including rescission, other compensatory and consequential damages, costs, fees and interest. On February 27, 2009, defendants filed a motion to dismiss the consolidated amended complaint inThe first action,In Re Merrill Lynch Auction Rate Securities Litigation, is the result of the consolidation of two separate class action suits in the U.S. District Court for the Southern District of New York. These suits were brought by two customers of Merrill Lynch, on behalf of all persons who purchased ARS in auctions managed by Merrill Lynch, against Merrill Lynch and its subsidiary Merrill Lynch, Pierce, Fenner & Smith Incorporated (MLPFS). On MayMarch 31, 2010, the U.S. District Court for the Southern District of New York granted Merrill Lynch’s motion to dismiss. On April 22, 2009, the plaintiffs2010, a lead plaintiff filed a notice of appeal to the U.S. Court of Appeals for the Second Circuit, which is currently pending. The second amended consolidated complaint. On July 24, 2009, Merrill Lynch filed a motion to dismiss the second amended consolidated complaint.

On May 22, 2008, a putative class action, entitledBondar v. Bank of America Corporation, was filed in the U.S. District Court for the Northern

Districtbrought by a putative class of CaliforniaARS purchasers against the Corporation and Banc of America Investment Services, Inc. (BAI)Securities, LLC (BAS) and BAS on behalf of persons who purchased ARS from the defendants. The amended complaint, which was filed on January 22, 2009, alleges, among other things, that the Corporation, BAI and BAS manipulated the market for, and failed to disclose material facts about ARS, and seeks to recover unspecified damages for losses in the market value of ARS allegedly caused by the decision of BAS and other broker/dealers to discontinue supporting auctions for ARS. On February 12, 2009, the Judicial Panel on Multidistrict Litigation (MDL Panel) consolidated Bondar and two related, individual federal actions into one proceedingis currently pending in the U.S. District Court for the Northern District of California. On September 9, 2009, defendantsThe Corporation and BAS have filed theira motion to dismiss the second amended consolidated complaint.

complaint, which remains pending.

On September 4, 2008,Antitrust Actions
The Corporation, Merrill Lynch and other financial institutions were also named in two civilputative antitrust putative class actionsMayor and City Council of Baltimore, Maryland v. Citigroup et al., and Mayfield et al. v. Citigroup Inc. et al., were filed in the U.S. District Court for the Southern District of New York againstYork. Plaintiffs in both actions assert federal antitrust claims under Section 1 of the Corporation, Merrill Lynch, and other financial institutions allegingSherman Act based on allegations that the defendants conspired to restrain trade in ARS by artificially supportingplacing support bids in ARS auctions, only to collectively withdraw those bids in February 2008, which allegedly caused ARS auctions to fail. The plaintiff in the first action,Mayor and later withdrawing that support. City Council of Baltimore, Maryland v. Citigroup, Inc., et al. is filed on behalf of, seeks to represent a class of issuers of ARS underwritten bythat the defendants underwrote between May 12, 2003 and February 13, 2008 who seek2008. This issuer action seeks to recover, among other relief, the alleged above-market interest payments they claim they were forcedthat ARS issuers allegedly have had to make whenafter the Corporation, Merrill Lynch and othersdefendants allegedly discontinued supporting ARS. In addition,stopped placing “support bids” in ARS auctions. The plaintiff in the plaintiffs who alsosecond action,Mayfield, et al. v. Citigroup, Inc., et al., seeks to represent a class of investors that purchased ARS seekfrom the defendants and held those securities when ARS auctions failed on February 13, 2008. Plaintiff seeks to recover, claimedamong other relief, unspecified damages for losses in the ARS’ market value, of those securities allegedly caused by the decisionand rescission of the financial institutions to discontinue supporting auctions for the securities. These plaintiffsinvestors’ ARS purchases. Both actions also seek treble damages and seek to rescind at par their purchases of ARS.Mayfield is filed on behalf of a class of persons who acquired ARS directly from defendants and who held those securities as of February 13, 2008. Plaintiffs seek to recover alleged losses inattorneys’ fees under the market value of ARS allegedly caused by the decision of the Corporation and Merrill Lynch and others to discontinue supporting auctions for the securities. Plaintiffs seek treble damages and seek to rescind at par their purchases of ARS. On January 15, 2009, defendants, including the Corporation and Merrill Lynch, filed a motion to dismiss the complaints.Sherman Act’s private civil remedy. On January 25, 2010, the court dismissed both actions with prejudice and the

plaintiffs’ respective appeals are currently pending in the U.S. Court of Appeals for the Second Circuit.
Checking Account Overdraft Litigation
Bank of America, N.A. (BANA) is currently a defendant in several consumer suits challenging certain deposit account-related business practices. Three of the suits are presently part of a multi-district litigation (MDL) proceeding involving approximately 65 individual cases against 30 financial institutions assigned by the Judicial Panel on Multi-district Litigation to the U.S. District Court dismissedfor the twoSouthern District of Florida. The three cases,Tornes v. Bank of America, N.A., Yourke, et al. v. Bank of America, N.A., et al.andKnighten v. Bank of America, N.A., allege that BANA improperly and unfairly increased the number of overdraft fees it assessed on consumer deposit accounts by various means. The cases challenge the practice of reordering debit card transactions to posthigh-to-low and BANA’s failure to notify customers at the point of sale that the transaction may result in an overdraft charge. The cases also allege that BANA’s disclosures and advertising regarding the posting of debit card transactions are false, deceptive and misleading. These cases assert claims including breach of the implied covenant of good faith and fair dealing, conversion, unjust enrichment and violation of the unfair and deceptive practices statutes of various states. Plaintiffs generally seek restitution of all overdraft fees paid to BANA as a result of BANA’s allegedly wrongful business practices, as well as disgorgement, punitive damages, injunctive relief, pre-judgment interest and attorneys’ fees. Omnibus motions to dismiss many of the complaints involved in the MDL, includingTornes, YourkeandKnighten, were denied on March 12, 2010. Trial is currently scheduled for March 26, 2012. A fourth putative class action,Phillips, et al. v. Bank of America, N.A., which includes similar allegations, will shortly become part of the MDL proceedings.
In December 2004, BANA was also named as the defendant inClosson, et al. v. Bank of America, et al., a putative class action currently pending in the California Court of Appeal, First District, Division 1, which also challenges BANA’s practice of reordering debit card transactions to post deposits inhigh-to-low order.Clossonasserts claims for violations of California state law, and seeks restitution, disgorgement, actual and punitive damages, a corrective advertising campaign and injunctive relief. BANA entered into a settlement inClosson, which received final approval by the Superior Court of the State of California for the County of San Francisco on August 3, 2009. The settlement provides for a $35 million payment by BANA in exchange for a release of the claims against BANA by the members of the nationwide settlement class. Several settlement class members who objected to the final approval of the settlement have appealed. If theClossonsettlement is affirmed, it will likely bar the claims of many of the putative class members inTornes, YourkeandKnighten, as many of those class members are covered by the putative class inClosson.
On January 27, 2011, the Corporation reached a settlement in principle with prejudice.

Since October 2007, numerous arbitrationsthe lead plaintiffs in the MDL, subject to complete final documentation and individual lawsuits have been filedcourt approvals. The settlement will provide for a payment by the Corporation of $410 million (which amount was fully accrued by the Corporation as of December 31, 2010) in exchange for a complete release of claims asserted against the Corporation BANA, BAS, BAI, MLPF&Sin the MDL. The settlement also contemplates that a stay will be requested in theClossonappeal and in some cases Merrill Lynch by parties who purchased ARS. Plaintiffs in these cases, which assert substantiallythat, when this settlement becomes effective, the same types of claims, allege that defendants manipulatedappeal inClossonwill be withdrawn and the market for, and failedsettlement inClossonwill be effectuated according to disclose material facts about, ARS. Plaintiffs seek compensatory and punitive damages totaling in excess of $2.6 billion as well as rescission, among other relief.

its terms.

Countrywide Bond Insurance Litigation

On September 30, 2008,

The Corporation, Countrywide Financial Corporation (CFC) and various other Countrywide entities were named as defendants in an action filed by MBIA Insurance Corporation (MBIA), entitledMBIA Insurance Corporation, Inc. v. Countrywide Home Loans, et al., in New York Supreme Court, New York County. The action relatesare subject to claims from several monoline bond insurance companies. These claims generally relate to bond insurance policies provided by MBIA with regard tothe insurers on certain securitized pools of home equity lines


Bank of America 2010     197


of credit and fixed-rate second liensecond-lien mortgage loans. MBIA allegedly hasPlaintiffs in these cases generally allege that they have paid claims as a result of defaults in the underlying loans and claimsassert that these defaults are the result of improper underwriting. On August 24, 2009,underwriting by the defendants.
MBIA
The Corporation, CFC and various other Countrywide entities are named as defendants in two actions filed by MBIA filed an amended complaint in theInsurance Corporation (MBIA). The first action, which includes allegations regarding five additional securitizations, and adds theMBIA Insurance Corporation, and Countrywide Home Loans Servicing, LP as defendants. The amended complaint alleges misrepresentation and breach of contract,


Bank of America 2009161


among other claims, and seeks unspecified actual and punitive damages, and attorneys’ fees from the Countrywide defendants and from the Corporation as an alleged successor to the Countrywide defendants. On October 9, 2009, the Corporation and the Countrywide defendants filed a motion to dismiss certain claims asserted in the amended complaint.

On January 28, 2009, Syncora Guarantee Inc. (Syncora) filed suit, entitledSyncora Guarantee Inc. v. Countrywide Home Loans, Inc.et al., et al.,is pending in New York Supreme Court, New York County against CFCCounty. In April 2010, the court granted in part and certain otherdenied in part the Countrywide entities.defendants’ motion to dismiss and denied the Corporation’s motion to dismiss. The action relatesparties have filed cross-appeals from this order. On December 22, 2010, the court issued an order on MBIA’s motion for use of sampling at trial, in which the court held that MBIA may attempt to bond insurance policies provided by Syncora with regard to certain securitized pools of home equity lines of credit. Syncora allegedly has paid claims as a result of defaults in the underlying loans, and claims that these defaults are the result of improper loan underwriting. The complaint alleges misrepresentation andprove its breach of contract among otherand fraudulent inducement claims through examination of statistically significant samples of the securitizations at issue. In its order, the court did not endorse any of MBIA’s specific sampling proposals and seeks unspecified actual and punitive damages, and attorneys’ fees. Thestated that defendants have moved“significant valid challenges” to dismiss certain of the claims.

On July 10, 2009,MBIA’s methodology that they may present at trial, together with defendants’ own views and evidence.

The second MBIA filed a complaint, entitledaction,MBIA Insurance Corporation, Inc. v. Bank of America Corporation, Countrywide Financial Corporation, Countrywide Home Loans, Inc., Countrywide Securities Corporation, et al., is pending in the Superior Court of the State of California, County of Los Angeles, against the Corporation, CFC, various Countrywide entities and other individuals and entities.Angeles. MBIA which amended the complaint on November 3, 2009, purports to bring thethis action as subrogee to the note holders for certain securitized pools of home equity lines of credit and fixed-rate second liensecond-lien mortgage loans. The complaint is based upon the same allegations set forth in the complaints filed in theMBIA Insurance Corporation Inc., v. Countrywide Home Loan et al., actionloans and asserts claims for, among other things, misrepresentation, breach of contract, and violations of certain California statutes. The complaint seeks unspecified damages and declaratory relief. On December 4, 2009,May 17, 2010, the court dismissed the claims against the Countrywide defendants with leave to amend, but denied the request to dismiss MBIA’s successor liability claims against the Corporation. On June 21, 2010, MBIA filed an amended complaint re-asserting its previously dismissed claims against the Countrywide defendants, re-asserting the successor liability claim against the Corporation and variousadding Countrywide Capital Markets, LLC as a defendant. The Countrywide defendants filed demurrers in responsea demurrer to the amended complaint.complaint, but the court declined to rule on the demurrer and instead entered an order which stays this case until August 1, 2011.
Syncora

On December 11, 2009, Financial Guaranty Insurance Company (FGIC)

The Corporation, CFC and various other Countrywide entities are named as defendants in an action filed a complaint,by Syncora Guarantee Inc. (Syncora) entitledFinancial Guaranty Insurance Co.,Syncora Guarantee Inc. v. Countrywide Home Loans, IncInc., et al..,This action, currently pending in New York Supreme Court, New York County, againstrelates to bond insurance policies provided by Syncora on certain securitized pools of home equity lines of credit. In March 2010, the court issued an order that granted in part and denied in part the Countrywide defendants’ motion to dismiss. Syncora and the Countrywide defendants have filed cross-appeals from this order. In May 2010, Syncora amended its complaint. Defendants filed an answer to Syncora’s amended complaint on July 9, 2010, as well as a counterclaim for breach of contract and declaratory judgment. The parties have agreed to stay the counterclaim until August 15, 2011.
FGIC
The Corporation, CFC and various other Countrywide entities are named as defendants in an action filed by Financial Guaranty Insurance Company (FGIC) entitledFinancial Guaranty Insurance Co. v. Countrywide Home Loans, Inc. TheInc. This action, currently pending in New York Supreme Court, New York County, relates to bond insurance policies provided by FGIC with regard toon certain securitized pools of home equity lines of credit and fixed-rate second liensecond-lien mortgage loans. In June 2010, the court entered an order that granted in part and denied in part the Countrywide defendants’ motion to dismiss. FGIC allegedly has paidand the

Countrywide defendants have filed cross-appeals from this order. Defendants filed an answer to FGIC’s amended complaint on July 19, 2010. On March 24, 2010, CFC and certain other Countrywide entities filed a separate but related action against FGIC in New York Supreme Court seeking monetary damages of at least $100 million against FGIC in connection with FGIC’s failure to pay claims under certain bond insurance policies.
Ambac
The Corporation, CFC and various other Countrywide entities are named as a resultdefendants in an action filed by Ambac Assurance Corporation (Ambac) entitledAmbac Assurance Corporation and The Segregated Account of defaultsAmbac Assurance Corporation v. Countrywide Home Loans, Inc., et al.This action, currently pending in New York Supreme Court, New York County, relates to bond insurance policies provided by Ambac on certain securitized pools of home equity lines of credit and fixed-rate second-lien mortgage loans. On December 10, 2010, defendants filed answers to the underlying loans, and claims that these defaults are the result of improper loan underwriting. The complaint alleges misrepresentation and breach of contract, among other claims, and seeks unspecified actual and punitive damages, and attorneys’ fees.

complaint.

Countrywide Equity and Debt Securities Matters

CFC, certain other Countrywide entities,

Certain New York state and certain former officers and directors of CFC, among others,municipal pension funds have been named as defendants in two putative class actions filedcommenced litigation in the U.S. District Court for the Central District of California, relating to certain CFC equity and debt securities. One case, entitledIn re Countrywide Financial Corp.Corporation Securities Litigation, was filed on January 25, 2008 by certain New York state and municipal pension funds on behalf of purchasers of CFC’s common stock andagainst CFC, certain other equityCountrywide entities and debt securities. The complaintseveral former CFC officers and directors. This action alleges among other things, that CFC made misstatements (including in certain SEC filings) concerning the nature and quality of its loan underwriting practices and its financial results, in violationviolations of the antifraud provisions of the Securities Exchange Act of 1934 and Sections 11 and 12 of the Securities Act of 1933. Plaintiffs claim losses in excess of $25.0 billion that plaintiffs allegedly experienced on certain CFC equity and debt securities. Plaintiffs also assert additional claims against BAS, MLPF&SMLPFS and other underwriter defendants under Sections 11 and 12 of the Securities Act of 1933. Plaintiffs seek unspecified compensatory damages, among other remedies.Plaintiffs’ allege that CFC made false and misleading statements in certain SEC filings and elsewhere concerning the nature and quality of its loan underwriting practices and its financial results. On April 2, 2010, the parties reached an agreement in principle to settle this action for $624 million in exchange for a dismissal of all claims with prejudice. On August 2, 2010, the court preliminarily approved the settlement. On December 1, 2008, the court granted in part and denied in

part the defendants’ motions to dismiss the first consolidated amended complaint, with leave to amend certain claims. Plaintiffs filed a second consolidated amended complaint. On April 6, 2009, the District Court denied the motions to dismiss the amended complaint made by2010, CFC and the underwriters. On December 9, 2009,plaintiffs agreed to amend the District Court granted in part and denied in part plaintiffs’ motion for class certification. On December 23, 2009, defendants sought interlocutory appeal of certain aspectssettlement to allow CFC to use up to $22.5 million of the District Court’s class certification decision. Trial is scheduledsettlement funds for August 2010.

The other case, entitledArgent Classic Convertible Arbitrage Fund L.P. v. Countrywide Financial Corp. et al., was filed in the U.S. District Court for the Central District of California on October 5, 2007 against CFC on behalf of purchasers of certain Series A and B debentures issued in various private placements pursuant to a May 16, 2007 CFC offering memorandum. This matter involves allegations similar to those in theIn re Countrywide Financial Corporation Securities Litigation case, asserts claims under the antifraud provisionstwo-year period following final approval of the Securities Exchange Act of 1934 and California state law, and seeks unspecified damages. Plaintiff filed an amended complaint that added the Corporation as a defendant. On March 9, 2009, the District Court dismissed the Corporationsettlement to resolve any claims asserted by investors who chose to exclude themselves from the case; CFCclass. On January 7, 2011, the court preliminarily approved this amendment. The settlement remains as a named defendant. On December 9, 2009, the District Court denied plaintiff’s motion for class certification. CFC and Argent Classic, on its own behalf, have reached a settlement in principle to dismiss the case with prejudice subject to executionfinal court approval.

Interchange and Related Litigation
A group of merchants have filed a definitive settlement agreement. Trial is scheduled for July 2010.

CFC has also responded to subpoenas from the SEC and the U.S. Departmentseries of Justice (the DOJ).

Countrywide FTC Investigation

On June 20, 2008, the Federal Trade Commission (FTC) issued Civil Investigative Demands to CFC regarding Countrywide’s mortgage servicing practices. On January 6, 2010, FTC Staff sent a letter to the Corporation offering an opportunity to discuss settlement and enclosing a proposed consent order and draft complaint that reflects FTC Staff’s views that certain servicing practices of Countrywide Home Loans, Inc., and Countrywide Home Loans Servicing, LP, which is now known as BAC Home Loans Servicing, LP, violate Section 5 of the Federal Trade Commission Act (the FTC Act) and the Fair Debt Collection Practices Act. FTC Staff also advised that if consent negotiations are not successful, it will recommend that an enforcement action seeking injunctive relief and consumer redress be filed against Countrywide Home Loans, Inc. and BAC Home Loans Servicing, LP for violations of Section 5 of the FTC Act and the Fair Debt Collections Practices Act. The Corporation believes that the servicing practices of Countrywide Home Loans, Inc. and BAC Home Loans Servicing, LP did not and do not violate Section 5 of the FTC Act and the Fair Debt Collections Practices Act. The Corporation is currently involved in discussions with FTC Staff concerning the Staff’s views.

Countrywide Mortgage-Backed Securities Litigation

CFC, certain other Countrywide entities, certain former CFC officers and directors, as well as BAS and MLPF&S, are named as defendants in a consolidated putative class action, entitledLuther v. Countrywide Home Loans Servicing LP, et al., filed on November 14, 2007 in the Superior Court of the State of California, County of Los Angeles, that relatesactions and individual actions with regard to public offerings of various MBS. The consolidated complaint alleges, among other things, that the mortgage loans underlying these securities were improperly underwritten and failed to comply with the guidelines and processes described in the applicable registration statements and prospectus supplements, in violation of Sections 11 and 12 of the Securities Act of 1933, and seeks unspecified compensatory damages, among other relief. In March 2009, defendants moved to dismiss the case in the


162Bank of America 2009


Superior Court. On June 15, 2009, the Superior Court entered an order staying the state court proceeding and directing the plaintiffs to file suit in Federal Court. On August 24, 2009, the plaintiffs filed a complaint in the U.S. District Court for the Central District of California seeking a declaratory judgment that the Superior Court had subject matter jurisdiction over their claims. The District Court dismissed the declaratory judgment action. On January 6, 2010, the Superior Court lifted the stay entered on June 15, 2009 and dismissed plaintiffs’ consolidated complaint with prejudice for lack of subject matter jurisdiction. On January 14, 2010, one of the plaintiffs in theLuther case, the Maine State Retirement System, filed a new putative class action complaint in the U.S. District Court for the Central District of California entitledMaine State Retirement System v. Countrywide Financial Corporation, et al. The complaint names CFC, certain other Countrywide entities, certain former CFC officers and directors, as well as BAS and MLPF&S as defendants. Plaintiff’s allegations, claims and remedies sought are substantially similar and concern the same offerings of MBS at issue in theLuther case that was dismissed by the Superior Court.

On August 15, 2008, a complaint, entitledNew Mexico State Investment Council, et al. v. Countrywide Financial Corporation, et al., was filed in the First Judicial Court for the County of Santa Fe against CFC, certain other CFC entities and certain former officers and directors of CFC by three New Mexico governmental entities that allegedly acquired certain of the MBS also at issue in theLuther case. The complaint initially asserted claims under the Securities Act of 1933 and New Mexico state law and seeks unspecified compensatory damages and rescission. On March 25, 2009, the court denied the motion to dismiss the complaint. The individual defendants were dismissed based on lack of personal jurisdiction. On November 13, 2009, plaintiffs voluntarily dismissed the New Mexico state law claims. Trial is scheduled for October 2010.

On October 13, 2009, the Federal Home Loan Bank of Pittsburgh (FHLB Pittsburgh) filed a complaint, entitledFederal Home Loan Bank of Pittsburgh v. Countrywide Securities Corporation et al., in the Court of Common Pleas of Allegheny County Pennsylvania against CFC, Countrywide Securities Corporation (CSC), Countrywide Home Loans, Inc., CWALT, Inc. and CWMBS, Inc., among other defendants, alleging violations of the Securities Act of 1933 and the Pennsylvania Securities Act of 1972, as well as fraud and negligent misrepresentation under Pennsylvania common law in connection with various offerings of MBS. The complaint asserts, among other things, misstatements and omissions concerning the credit quality of the mortgage loans underlying the securities and the loan origination practicesinterchange fees associated with those loansVisa and seeks unspecified damages and rescission, among other relief. The Countrywide defendants moved to dismiss the complaint on February 26, 2010.

On December 23, 2009, the Federal Home Loan Bank of Seattle (FHLB Seattle) filed three complaints in the Superior Court of Washington for King County alleging violations of the Securities Act of Washington in connection with various offerings of MBS and makes allegations similar to those in the FHLB Pittsburgh matter. The complaints seek rescission, interest, costs and attorneys’ fees. The case, entitledFederal Home Loan Bank of Seattle v. Banc of America Securities LLC, et al., was filed against CFC, CWALT, Inc., BAS, Banc of America Funding Corporation, and the Corporation. The case, entitledFederal Home Loan Bank of Seattle v. Countrywide Securities Corporation, et al., was filed against CFC, CSC, CWALT, Inc., Merrill Lynch Mortgage Investors, Inc., and Merrill Lynch Mortgage Capital, Inc. The case, entitledFederal Home Loan Bank of Seattle v. UBS Securities LLC, et al., was filed against CFC, CWMBS, Inc., CWALT, Inc., and UBS Securities LLC.

Data Treasury Litigation

The Corporation and BANA were named as defendants in two cases filed by Data Treasury Corporation (Data Treasury)MasterCard payment card transactions. These actions, which have been consolidated in the U.S. District Court for the Eastern District of Texas. New York under the captionIn one case filed on June 25, 2005 (Ballard)Re Payment Card Interchange Fee and Merchant Discount Anti-Trust Litigation(Interchange), Data Treasury alleged that defendants “provided, sold, installed, utilized,name Visa, MasterCard and assisted others to useseveral banks and utilize image-based banking and archival solutions” in a manner that infringed United States Patent Nos. 5,910,988 and 6,032,137. Inbank holding companies, including the other case filed on February 24, 2006 (Huntington), Data Treasury allegedCorporation, as defendants. Plaintiffs allege that the Corporation and BANA, along with LaSalle Bank Corporation and LaSalle Bank, N.A., were “making, using, selling, offering for sale, and/or importing intodefendants conspired to fix the United States, directly, contributory, and/or by inducement, without authority, products and services that fall withinlevel of default interchange rates, which represent the scopefee an issuing bank charges an acquiring bank on every transaction. Plaintiffs also challenge as unreasonable restraints of trade under Section 1 of the claims of” United States Patent Nos. 5,265,007; 5,583,759; 5,717,868;Sherman Act certain rules of Visa and 5,930,778. The Huntington case also claimed infringement against the LaSalle defendants of the patents at issue in the Ballard case. The Ballard and Huntington cases are now consolidated in theData Treasury Corporation v. Wells Fargo, et al., action, although the claimsMasterCard related to merchant acceptance of payment cards at the Huntington patents are currently stayed. Data Treasury seeks significant compensatory damages and equitable relief in the Ballard case andpoint of sale. Plaintiffs seek unspecified compensatory damages and injunctive relief inbased on their assertion that interchange would be lower or eliminated absent the Huntington case. The District Court has scheduledalleged conduct. On January 8, 2008, the Ballard case for trial in October 2010.

Enron Litigation

On April 8, 2002, Merrill Lynch and MLPF&S were added as defendants in a consolidated class action, entitledNewby v. Enron Corp. et al., filed in the U.S. District Court for the Southern District of Texas on behalf of certain purchasers of Enron’s publicly traded equity and debt securities. The complaint alleges, among other things, that Merrill Lynch and MLPF&S engaged in improper transactions that helped Enron misrepresent its earnings and revenues. On March 5, 2009, the District Courtcourt granted Merrill Lynch and MLPF&S’s motion for summary judgment and dismissed the claims against Merrill Lynch and MLPF&S with prejudice. Subsequently, the lead plaintiff, Merrill Lynch and certain other defendants filed adefendants’ motion to dismiss and for entry of final judgment. The District Court granted the motion on December 2, 2009 and dismissed all claims for pre-2004 damages. Motions to dismiss the remainder of the complaint and plaintiffs’ motion for class certification are pending.

In addition, plaintiffs filed supplemental complaints against Merrill Lynch and MLPF&S with prejudice.

certain defendants, including the Corporation, relating to initial public offerings (the


Heilig-Meyers Litigation198     

InAIG Global Securities Lending Corp., et al. v. BancBank of America Securities LLC, filed on December 7, 20012010


IPOs) of MasterCard and formerly pending in the U.S. District Court for the Southern District of New York, the plaintiffs purchased ABS issued by a trust formed by Heilig-Meyers Co., andVisa. Plaintiffs allege that BAS, as underwriter, made misrepresentationsthe MasterCard and Visa IPOs violated Section 7 of the Clayton Act and Section 1 of the Sherman Act. Plaintiffs also assert that the MasterCard IPO was a fraudulent conveyance. Plaintiffs seek unspecified damages and to undo the IPOs. Motions to dismiss both supplemental complaints remain pending.
The Corporation and certain of its affiliates previously entered into loss-sharing agreements with Visa and other financial institutions in connection with certain antitrust litigation against Visa, includingInterchange. The Corporation and these same affiliates have now entered into additional loss-sharing agreements forInterchangethat cover all defendants, including MasterCard. Collectively, the sale of those securities in violationloss-sharing agreements require the Corporationand/or certain affiliates to pay 11.6 percent of the federal securities lawsmonetary portion of any comprehensiveInterchange settlement. In the event of an adverse judgment, the agreements require the Corporationand/or certain affiliates to pay 12.8 percent of any damages associated with Visa-related claims (Visa-related damages), 9.1 percent of any damages associated with MasterCard-related claims, and New York common law. The case was tried11.6 percent of any damages associated with internetwork claims (internetwork damages) or not associated specifically with Visa or MasterCard-related claims (unassigned damages).
Pursuant to Visa’s publicly-disclosed Retrospective Responsibility Plan (the RRP), Visa placed certain proceeds from its IPO into an escrow fund (the Escrow). Under the RRP, funds in the Escrow may be accessed by Visa and its members, including Bank of America, to pay for a jury rendered a verdict against BAScomprehensive settlement or damages in favorInterchange, with the Corporation’s payments from the Escrow capped at 12.81 percent of the plaintiffsfunds that Visa places therein. Subject to that cap, the Corporation may use Escrow funds to cover: 66.7 percent of its monetary payment towards a comprehensiveInterchangesettlement, 100 percent of its payment for violations of Section 10(b) of the Securities Exchange Act of 1934 and Rule 10b-5 and for common law fraud. The jury awarded aggregate compensatory damages of $84.9 million plus prejudgment interest totaling approximately $59 million. On May 14, 2009, the District Court denied BAS’s post trial motions to set aside the verdict. BAS has filed an appeal in the U.S. Court of Appeals for the Second Circuit.

IndyMac Litigation

On January 20, 2009, BAS and MLPF&S, in their capacity as underwriters, along with IndyMac MBS, IndyMac ABS, and other underwriters and individuals, were named as defendants in a putative class action complaint, entitledIBEW Local 103 v. Indymac MBS et al., filed in the Superior Court of the State of California, County of Los Angeles, by purchasers of IndyMac mortgage pass-through certificates. The complaint


Bank of America 2009163


alleges, among other things, that the mortgage loans underlying these securities were improperly underwritten and failed to comply with the guidelines and processes described in the applicable registration statements and prospectus supplements, in violation of Sections 11 and 12 of the Securities Act of 1933, and seeks unspecified compensatoryany Visa-related damages and rescission, among other relief.

On May 14, 2009, the Corporation (as the alleged successor-in-interest to MLPF&S), CSC, IndyMac MBS, IndyMac ABS,66.7 percent of its payment for any internetwork and other underwriters and individuals, were named as defendants in a putative class action complaint, entitledPolice & Fire Retirement System of the City of Detroit v. IndyMac MBS, Inc., et al., filed in the U.S. District Court for the Southern District of New York. On June 29, 2009, the Corporation (as the alleged successor-in-interest to CSC and MLPF&S) and other underwriters and individuals were named as defendants in another putative class action complaint, entitledWyoming State Treasurer, et al. v. John Olinski, et al., also filed in the U.S. District Court for the Southern District of New York. The allegations, claims, and remedies sought in these cases are substantially similar to those in theIBEW Local 103 case. On July 29, 2009,Police & Fire Retirement SystemandWyoming State Treasurer were consolidated by the U.S. District Court for the Southern District of New York and a consolidated amended complaint was filed on October 9, 2009. The consolidated complaint named the Corporation as a defendant based on allegations that the Corporation is the “successor-in-interest” to CSC and MLPF&S. BAS and CSC were not named as defendants. Prior to the consolidation of these matters, theIBEW Local 103 case was voluntarily dismissed by plaintiffs and its allegations and claims were incorporated into the consolidated amended complaint. A motion to dismiss the consolidated amended complaint was filed on November 23, 2009.

unassigned damages.

In re Initial Public Offering Securities Litigation

Beginning in 2001,

BAS, Merrill Lynch, MLPF&S,MLPFS, and certain of their subsidiaries, along with other underwriters, and various issuers and others, were named as defendants in certaina number of putative class action lawsuits that have been consolidated in the U.S. District Court for the Southern District of New York asIn re Initial Public Offering Securities LitigationLitigation.. Plaintiffs contend, among other things, that the defendants failed to make certain required disclosures in the registration statements and manipulated prices of securities sold in initial publicprospectuses for applicable offerings through, among other things,regarding alleged agreements with institutional investors receivingthat tied allocations in certain offerings to the purchase additional sharesorders by those investors in the aftermarketaftermarket. Plaintiffs allege that such agreements allowed defendants to manipulate the price of the securities sold in these offerings in violation of Section 11 of the Securities Act of 1933 and seek unspecified damages. On December 5, 2006,Section 10(b) of the Securities Exchange Act of 1934, and SEC rules promulgated thereunder. The parties agreed to settle the matter, for which the court granted final approval. Some putative class members have filed an appeal, which remains pending, in the U.S. Court of Appeals for the Second Circuit reversed the District Court’s order certifying the proposed classes. On September 27, 2007, plaintiffs filed a motion to certify modified classes, which defendants opposed. On October 10, 2008, the District Court granted plaintiffs’ request to withdraw without prejudice their class certification motion. The parties agreed to settle the matter in an amount that is not material to the Corporation’s Consolidated Financial Statements and, on October 5, 2009, the District Court granted final approvalseeking reversal of the settlement. Certain objectors to the settlement have filed an appeal of the District Court’s certification of the settlement class to the U.S. Court of Appeals for the Second Circuit.

Interchange and Related Litigation

The Corporation, BANA, BA Merchant Services LLC (f/k/a National Processing, Inc.) and MBNA America Bank, N.A. are defendants in putative class actions filed on behalf of retail merchants that accept Visa and MasterCard payment cards. Additional defendants include Visa, MasterCard, and other financial institutions. Plaintiffs seeking unspecified treble damages and injunctive relief, allege that the defendants conspired to fix the level of interchange and merchant discount fees and that certain other practices, including various Visa and MasterCard rules, violate

final approval.

federal and California antitrust laws. The class actions, the first of which was filed on June 22, 2005, are coordinated for pre-trial proceedings in the U.S. District Court for the Eastern District of New York, together with individual actions brought only against Visa and MasterCard, under the captionIn Re Payment Card Interchange Fee and Merchant Discount Anti-Trust Litigation. On January 8, 2008, the District Court dismissed all claims for pre-2004 damages. On May 8, 2008, plaintiffs filed a motion for class certification, which the defendants opposed. On January 29, 2009, the class plaintiffs filed a second amended consolidated complaint.

The class plaintiffs have also filed two supplemental complaints against certain defendants, including the Corporation, BANA, BA Merchant Services LLC (f/k/a National Processing, Inc.) and MBNA America Bank, N.A., relating to MasterCard’s 2006 initial public offering (MasterCard IPO) and Visa’s 2008 initial public offering (Visa IPO). The supplemental complaints, which seek unspecified treble damages and injunctive relief, assert, among other things, claims under federal antitrust laws. On November 25, 2008, the District Court granted defendants’ motion to dismiss the supplemental complaint relating to the MasterCard IPO, with leave to amend. On January 29, 2009, plaintiffs amended the MasterCard IPO supplemental complaint and also filed a supplemental complaint relating to the Visa IPO.

Defendants have filed motions to dismiss the second amended consolidated complaint and the MasterCard IPO and Visa supplemental complaints.

The Corporation and certain of its affiliates have entered into agreements with Visa and other financial institutions that provide for sharing liabilities in connection with certain antitrust litigation against Visa, including the Interchange case (the Visa-Related Litigation). Under these agreements, the Corporation’s obligations to Visa in the Visa-Related Litigation are capped at the Corporation’s membership interest in Visa USA, which currently is 12.9 percent. Under these agreements, Visa Inc. placed a portion of the proceeds from the Visa IPO into an escrow to fund liabilities arising from the Visa-Related Litigation, including the 2008 settlement ofDiscover Financial Services v. Visa USA, et al. and the 2007 settlement ofAmerican Express Travel Related Services Company v. Visa USA, et al. Since the Visa IPO, Visa Inc. has added funds to the escrow, which has the effect of repurchasing Visa Inc. Class A common stock equivalents from the Visa USA members, including the Corporation.

Lehman Brothers Holdings, Inc. Litigation

Beginning in September 2008, BAS, MLPF&S, CSCMLPFS, Countrywide Securities Corporation (CSC) and LaSalle Financial Services Inc., along with other underwriters and individuals, were named as defendants in several putative class action complaintslawsuits filed in federal and state courts. All of these cases have since been transferred or conditionally transferred to the U.S. District Court for the Southern District of New York and state courts in Arkansas, California, New York and Texas. Plaintiffs allege thatunder the underwriter defendants violated Sections 11 and 12 of the Securities Act of 1933 by making false or misleading disclosures in connection with various debt and convertible stock offerings of Lehman Brothers Holdings, Inc. and seek unspecified damages. All cases against the defendants have now been transferred or conditionally transferred to the multi-district litigation captionedcaptionIn re Lehman Brothers Securities and ERISA Litigation pending. Plaintiffs allege that the underwriter defendants violated Section 11 of the Securities Act of 1933, as well as various state laws, by making false or misleading disclosures about the real estate-related investments and mortgage lending practices of Lehman Brothers Holdings, Inc. (LBHI) in the U.S. District Court for the Southern Districtconnection with various debt and convertible stock

offerings of New York. BAS, MLPF&S and otherLBHI. Plaintiffs seek unspecified damages. On June 4, 2010, defendants movedfiled a motion to dismiss the consolidated amended complaint.

complaint, which remains pending.

Lehman Set-offSetoff Litigation

In 2008, following the bankruptcy filing of LBHI, Lehman Brothers Special Financing Inc. (LBSF) owed money to BANA as a result of various terminated derivatives transactions entered into pursuant to one or more ISDA Master Agreements between the parties. The net termination values of these derivative transactions resulted in estimated claims by BANA against LBSF in excess of $1.0 billion. LBHI had guaranteed this exposure and, as part of an arrangement through which various LBHI subsidiaries and affiliates would retain an ability to overdraw their accounts during working hours, had $500 million in cash (plus $1.8 million in accrued interest) on deposit with BANA in a deposit account (the Deposit Account).
On November 10, 2008, BANA exercised its right of setoff against the Deposit Account to partially satisfy claims that BANA had asserted against LBSF and LBHI pursuant to the ISDA agreements and the LBHI guarantee. At the same time, BANA exercised its right of set off against five other LBHI accounts holding an additional $7.5 million (one of which, in the amount of approximately $500,000, was later reversed). On November 26, 2008, BANA commenced an adversary proceeding against Lehman Brothers Holdings, Inc. (LBHI)LBSF and Lehman Brothers Special Financing, Inc. (LBSF)LBHI in LBHI’s and LBSF’stheir Chapter 11 bankruptcy proceedings in the U.S. Bankruptcy Court for the Southern District


164Bank of America 2009


of New York. In the adversary proceeding, BANA is seekingsought a declaration that it properly set-offits setoff of LBHI’s funds heldwas proper and not in Lehman deposit accounts against monies owed to BANA by LBSF and LBHIviolation of the automatic stay imposed under various derivatives and guarantee agreements. LBSF and LBHI answered the complaint, andBankruptcy Code. In response, LBHI filed counterclaims against BANA and Bank of America Trust and Banking Corporation (Cayman) Limited (BofA Cayman) on January 2, 2009, alleging that BANA’s set-offBANA had no right to set off against the $502 million held in the Deposit Account, and that the entire setoff was improper and violatedin violation of the automatic stay in bankruptcy. LBHI’s counterclaimsstay. LBHI sought among other relief, the return of the set-off funds. BANAfunds plus prejudgment interest and BofA Cayman filed their answer to LBHI’s counterclaims, which denied the material allegationsunspecified damages for violation of the counterclaims, on February 9, 2009. On July 23, 2009, LBHI voluntarily dismissed its counterclaims against BofA Cayman, but BANA remains a defendant. On September 14, 2009, LBHI,automatic stay, including attorneys’ fees and interest. LBSF and BANA submitted cross-motions forLBHI also argued in their summary judgment.

Lyondell Litigation

On July 23, 2009, an adversary proceeding, entitledOfficial Committeejudgment papers that the entire setoff was in violation of Unsecured Creditors v. Citibank, N.A., et al., was filedthe automatic stay, although they did not plead turnover of the funds held in the U.S. Bankruptcy Court for the Southern District of New York. This adversary proceeding, in which MLPF&S, Merrill Lynch Capital Corporation and more than 50 other individuals and entities were named as defendants, relates to ongoing Chapter 11 bankruptcy proceedings inIn re Lyondell Chemical Company, et al. The plaintiff in the adversary proceeding, the Official Committee of Unsecured Creditors of Lyondell Chemical Company (the Committee), alleged in its complaint that certain loans made and liens granted in connection with theaccounts.

On December 20, 2007 merger between Lyondell Chemical Company and Basell AF S.C.A. were avoidable fraudulent transfers under state and federal fraudulent transfer laws. MLPF&S is named as a defendant in its capacity as: (i) a joint lead arranger under a senior credit facility and individually as lender thereunder; and (ii) a joint lead arranger under a bridge loan facility and individually as lender thereunder. Merrill Capital Corporation is named as a defendant in its capacity as: (i) a joint lead arranger under the senior credit facility and individually as lender thereunder; and (ii) administrative agent under the bridge loan facility. The Committee sought both to avoid the obligations under the loans made under the facilities and to recover fees and interest paid in connection therewith. The Committee also sought unspecified damages from MLPF&S for allegedly aiding and abetting a breach of fiduciary duty in connection with its role as advisor to Basell’s parent company, Access Industries.

On October 1, 2009, a second adversary proceeding, entitledThe Wilmington Trust Co. v. LyondellBasell Industries AF S.C.A., et al., was filed in the U.S. Bankruptcy Court for the Southern District of New York. This adversary proceeding, in which MLPF&S, Merrill Lynch Capital Corporation and Merrill Lynch International Bank Limited (MLIB) along with more than 70 other entities are named defendants, was filed by the successor trustee for holders of certain Lyondell senior notes, and asserts causes of action for declaratory judgment, breach of contract, and equitable subordination. The complaint alleges that the 2007 leveraged buyout of Lyondell violated a 2005 intercreditor agreement executed in connection with the August 2005 issuance of the Lyondell senior notes and therefore asks3, 2010, the Bankruptcy Court entered summary judgment against BANA with respect to declare the 2007 intercreditor agreement, and specifically the debt priority provisions contained therein, null and void. The breach of contract action, brought against Merrill Lynch Capital Corporation and one other entity as signatories to the 2005 intercreditor agreement, seeks unspecified damages. The equitable subordination action is brought against all defendants and seeks to subordinate the bankruptcy claims of those defendants to the claimssetoff of the holdersDeposit Account and directed BANA to pay to LBSF and LBHI $502 million, plus interest at nine percent per annum from November 10, 2008 through the date of the Lyondell senior notes. A motionjudgment. The court conducted a status conference on January 19, 2011 and directed the parties to dismiss this complaintdiscuss and present a further order regarding LBHI’s request for sanctions pertaining to BANA’s alleged violation of the automatic stay. LBSF and LBHI publicly indicated that they would request turnover of the $7 million that was filed.

On February 16, 2010, certain defendants, including MLPF&S, Merrill Lynch Capital Corporationset off from the other accounts plus an additional amount to account for changes in foreign exchange rates. The parties have since agreed in principle to settle both the sanctions issue and MLIB, advised the Bankruptcy Court that

they have reached aquestion of turnover of the additional $7 million for an irrevocable payment of $1.5 million by BANA. The settlement, in principal with the Lyondell debtors in bankruptcy, the Committee and Wilmington Trust that would dispose of all claims asserted against MLPF&S, Merrill Lynch Capital Corporation and MLIB in these adversary proceedings. This settlement is not materialwhich has still to the Corporation’s Consolidated Financial Statementsbe finally documented and is subject to approval of the Bankruptcy Court, approval.

would express that BANA admits no liability or wrongdoing with respect to sanctions, and that LBHI and LBSF reserve no rights to seek recovery of the $7 million, on appeal or otherwise. BANA will oppose that request. BANA has preserved its appellate rights as to the December 3 order and intends to file an appeal upon entry of a final order approving the settlement.

MBIA Insurance Corporation CDO Litigation

On April 30, 2009, MBIA and LaCrosse Financial Products, LLC filed a complaint in New York State Supreme Court, New York County, against MLPF&SMLPFS and Merrill Lynch International entitled(MLI) under the captionMBIA Insurance Corporation and LaCrosse Financial Products, LLC v. Merrill Lynch Pierce Fenner &and Smith Inc., et aland Merrill Lynch International.., in New York Supreme Court, New York County. The complaint relates to certain credit default swap (CDS) agreements and insurance agreements by which plaintiffs provided credit protection to the Merrill Lynch entitiesMLPFS and MLI and other parties on certain CDO securities held by them.


Bank of America 2010     199


securities. Plaintiffs claim that the Merrill Lynch entitiesMLPFS and MLI did not adequately disclose the credit quality and other risks of the CDO securities and underlying collateral. The complaint alleges claims for fraud, negligent misrepresentation, breach of the implied covenant of good faith and fair dealing and breach of contract among other claims, and seeks rescission and unspecified compensatory and punitive damages, among other relief. Defendants filed aOn April 9, 2010, the court granted defendants’ motion to dismiss on July 1, 2009.

Mediafiction Litigation

Approximately a decade ago, MLIB acted as manager for a $284 million issuance of notes for an Italian library of movies, backed by the future flow of receivables to such movie rights. Mediafiction S.p.A (Mediafiction) was responsible for collecting payments in connection with the rights to the moviesfraud, negligent misrepresentation, breach of the implied covenant of good faith and forwardingfair dealing and rescission claims, as well as a portion of the paymentsbreach of contract claim. Plaintiffs have appealed the dismissal of their claims and MLI has cross-appealed the denial of its motion to MLIB for distribution to note holders. Mediafiction failed to makedismiss the required payments to MLIB and a declarationbreach of bankruptcy under Italian law was made with respect to Mediafiction on March 9, 2006.contract claim in its entirety. On July 18, 2006, MLIB filed an opposition to haveFebruary 1, 2011, the appellate court dismissed the case against MLI in its claims recognized in the Mediafiction bankruptcy proceeding for amounts that Mediafiction failed to pay on the notes. Thereafter, Mediafictionentirety. MBIA has filed a counterclaim alleging thatrequest to appeal the agreement between MLIB and Mediafiction was null and void and seeking return ofappellate court’s decision to the payments previously made by Mediafiction to MLIB. In October 2008, the Court of Rome granted Mediafiction’s counter claim against MLIB in the amount of $137 million. MLIB has appealed the ruling to theNew York State Court of Appeals ofand has requested permission from the Court of Rome.

trial court to file an amended complaint.

Merrill Lynch Acquisition-related Matters

Since January 2009, the Corporation and certain of its current and former officers and directors, among others, have been named as defendants in putative classa variety of actions referred to as the securities actions, brought by shareholders alleging violations offiled in state and federal securities laws in connection with certain public statements and the proxy statement with respectcourts relating to the Corporation’s acquisition of Merrill Lynch (the Acquisition). SeveralThese acquisition-related cases consist of securities actions, derivative actions and actions under ERISA. The claims in these actions generally concern (i) the Acquisition; (ii) the financial condition and 2008 fourth-quarter losses experienced by the Corporation and Merrill Lynch; (iii) due diligence conducted in connection with the Acquisition; (iv) the Corporation’s agreement that Merrill Lynch could pay up to $5.8 billion in bonus payments to Merrill Lynch employees; (v) the Corporation’s discussions with government officials in December 2008 regarding the Corporation’s consideration of invoking the material adverse change clause in the Acquisition agreement and the possibility of obtaining government assistance in completing the Acquisition;and/or (vi) alleged material misrepresentationsand/or material omissions in the proxy statement and related materials for the Acquisition.
Securities Actions
Plaintiffs in the putative securities class actions in theIn re Bank of America Securities, Derivative and Employment Retirement Income Security Act (ERISA) Litigation(Securities Plaintiffs) represent all (i) purchasers of the Corporation’s common and preferred securities between September 15, 2008 and January 21, 2009; (ii) holders of the Corporation’s common stock or Series B Preferred Stock as of October 10, 2008; and (iii) purchasers of the Corporation’s common stock issued in the offering that occurred on or about October 7, 2008. During the purported class period, the Corporation had between 4,560,112,687 and 5,017,579,321 common shares outstanding and the price of those securities declined from $33.74 on September 12, 2008 to $6.68 on January 21, 2009. Securities Plaintiffs claim violations of Sections 10(b), 14(a) and 20(a) of the Securities Exchange Act of 1934, and SEC rules promulgated thereunder. Securities Plaintiffs’ amended complaint also alleges violations of Sections 11, 12(a)(2) and 15 of the Securities Act of 1933 related to an offering of the Corporation’s common stock that occurred on or about October 7, 2008, and names BAS and MLPFS, among others, as defendants on the Section 11 and 12(a)(2) claims. The Corporation and its co-defendants filed motions to dismiss, which the court granted in part by dismissing certain of the Securities Plaintiffs’ claims under Section 10(b) of the Securities Exchange Act of 1934. Securities Plaintiffs have been consolidatedfiled a second amended complaint which seeks to replead some of the dismissed claims as well as add claims under Sections 10(b) and 20(a) of the Securities Exchange Act of 1934 on behalf of holders of certain debt, preferred securities and option securities. The Corporation and its co-defendants have filed a consolidatedmotion to dismiss the second amended complaint’s new and amended

allegations, which remains pending. Securities Plaintiffs seek unspecified monetary damages, legal costs and attorneys’ fees.
Several individual plaintiffs have opted to pursue claims apart from theIn re Bank of America Securities, Derivative, and Employment Retirement Income Security Act (ERISA) Litigation and, accordingly, have initiated individual actions relying on substantially the same facts and claims as the Securities Plaintiffs in the U.S. District Court for the Southern District of New York.
On January 13, 2010, the Corporation, Merrill Lynch and certain of the Corporation’s current and former officers and directors were named in a purported class action complaint has been filed in the U.S. District Court for the Southern District of New York as described below.

In addition, several derivative actions, referred to as the derivative actions, have been filed against certain current and former directors and officers of the Corporation, and certain other parties, and the Corporation as nominal defendant, in the federal and state courts, as described below.

Other putative class actions, referred to as the ERISA actions, have been filed in the U.S. District Court for the Southern District of New York against the Corporation and certain of its current and former officers and directors seeking recovery for losses from theentitledDornfest v. Bank of America 401(k) Plan pursuant to ERISACorp., et al. The action is purportedly brought on behalf of investors in Corporation option contracts between September 15, 2008 and aJanuary 22, 2009 and alleges that during the class period approximately 9.5 million Corporation call option contracts and approximately eight million Corporation put option contracts were already traded on seven of the Options Clearing Corporation exchanges. The complaint alleges that defendants violated Sections 10(b) and 20(a) of the Securities Exchange Act of 1934 and SEC rules promulgated thereunder. On April 9, 2010, the court consolidated amended classthis action com - -


Bank of America 2009165


plaintwith the consolidated securities action in these ERISA actions has been filed, as described below.

theIn Rere Bank of America Securities, Derivative & ERISAand Employment Retirement Income Security Act (ERISA) Litigation

On June 10, 2009,, and ruled that the MDL Panel issuedplaintiffs may pursue the action as an order transferringindividual action. Plaintiffs seek unspecified monetary damages, legal costs and attorneys’ fees.

Derivative Actions
Several of the derivative actions related to the Acquisition that were pending in the Delaware Court of Chancery were consolidated under the captionIn re Bank of America Corporation Stockholder Derivative Litigation. In addition, the MDL ordered the transfer of actions related to the Acquisition that had been pending in various federal courts outsideto the U.S. District Court for the Southern District of New York for coordinated or consolidated pretrial proceedings with the securities actions, ERISA actions, and derivative actions pending in the U.S. District Court for the Southern District of New York. The securities actions, ERISA actions and derivativeproceedings. These actions have been separately consolidated and are now pending under the captionIn re Bank of America Securities, Derivative, and Employment Retirement Income Security Act (ERISA) LitigationLitigation..

On September 25, 2009, plaintiffs in the securities actions in theIn re Bank of America Securities, Derivative and Employment Retirement Income Security Act (ERISA) Litigation filed a consolidated amended class action complaint. The amended complaint is brought on behalf of a purported class, which consists of purchasers of the Corporation’s common and preferred securities between September 15, 2008 and January 21, 2009, holders of the Corporation’s common stock or Series B Preferred Stock as of October 10, 2008 and purchasers of the Corporation’s common stock issued in the offering that occurred on or about October 7, 2008, and names as defendants the Corporation, Merrill Lynch and certain of their current and former directors, officers and affiliates. The amended complaint alleges violations of Sections 10(b), 14(a) and 20(a) of the Securities Exchange Act of 1934, and SEC rules promulgated thereunder, based on, among other things, alleged false statements and omissions related to: (i) the financial condition and 2008 fourth quarter losses experienced by the Corporation and Merrill Lynch; (ii) due diligence conducted in connection with the Acquisition; (iii) bonus payments to Merrill Lynch employees; and (iv) the Corporation’s contacts with government officials regarding the Corporation’s consideration of invoking the material adverse change clause in the merger agreement and the possibility of obtaining government assistance in completing the Acquisition. The amended complaint also alleges violations of Sections 11, 12(a)(2) and 15 of the Securities Act of 1933 related to an offering of the Corporation’s common stock announced on or about October 6, 2008, and based on, among other things, alleged false statements and omissions related to bonus payments to Merrill Lynch employees and the benefits and impact of the Acquisition on the Corporation, and names BAS and MLPF&S, among others, as defendants on the Section 11 and 12(a)(2) claims. The amended complaint seeks unspecified damages and other relief. On November 24, 2009, the Corporation, BAS, Merrill Lynch, MLPF&S and the officer and director defendants moved to dismiss the consolidated amended class action complaint.

On October 9, 2009, plaintiffs in the derivative actions in theIn re Bank of America Securities, Derivative and Employment Retirement Income Security Act (ERISA) Litigation(the Derivative Plaintiffs) filed a consolidated amended derivative and class action complaint. The amended complaint names as defendants certain of the Corporation’s current and former directors, officers and financial advisors, and certain of Merrill Lynch’s current and former directors and officers. The amended complaint alleges, among other things, that: (i) certain of the Corporation’s officers breached fiduciary duties by conducting an inadequate due diligence process surrounding the Acquisition, failing to make adequate disclosures regarding Merrill Lynch’s 2008 fourth quarter losses and an alleged agreement to permit Merrill Lynch to pay bonuses, and failing to invoke the material adverse change clause or otherwise renegotiate the Acquisition; (ii) certain of the Corporation’s officers and certain Merrill Lynch officers received incentive compensation that was inappropriate in view of the work performed and the results achieved and, therefore, that such person should return unearned compensation; (iii) certain of the Corporation’s officers and

directors exposed the Corporation to significant liability under state and federal law and should be held responsible to the Corporation for contribution; (iv) certain Merrill Lynch officers and directors and certain financial advisors to the Corporation aided and abetted breaches of fiduciary duties by causing and/or assisting with the consummation of the Acquisition; and (v) certain of the Corporation’s officers and directors, certain of the Merrill Lynch officers and directors and certain of the Corporation’s financial advisors violated Section 14(a) of the Securities Exchange Act of 1934 and Rule 14a-9 promulgated thereunder by allegedly making material misrepresentations and/or material omissions in the proxy statement for the Acquisition and related materials and failing to update those materials to reflect, among other things, Merrill Lynch’s 2008 fourth quarter losses and Merrill Lynch’s ability and intention to pay bonuses to its employees in 2008. The amended complaint also purports to bring a direct class action claim for breach of a duty of full disclosure and complete candor by failing to correct or update disclosures made in the proxy statement for the Acquisition and for concealing an alleged agreement authorizing Merrill Lynch to pay bonuses. The direct claim is brought on behalf of a purported class of all persons who owned shares of the Corporation’s common stock as of October 10, 2008 and is brought against certain of the Corporation’s current and former officers and directors. The Corporation is named as a nominal defendant with respect to the derivative claims. The amended complaint asserts claims for, among other things: (i) violation of federal securities laws; (ii) breach of fiduciary duties; (iii) the return of incentive compensation that is alleged to be inappropriate in view of the work performed and is not named as a defendantthe results achieved by certain of the defendants; and (iv) contribution in connection with the direct class action claim.Corporation’s exposure to significant liability under state and federal law. The amended complaint seeks an unspecified amount of monetary damages, equitable remedies and other relief. On December 8, 2009, the Corporation, the officer and director defendants and the financial advisors moved to dismiss the consolidated amended derivative and class complaint. On February 8, 2010, the plaintiffsDerivative Plaintiffs voluntarily dismissed their claims against each of the former Merrill Lynch officers and directors without prejudice. The Corporation and its co-defendants filed motions to dismiss, which were granted in part on August 27, 2010. On October 18, 2010, the Corporation and its co-defendants answered the remaining allegations asserted by the Derivative Plaintiffs.

On February 17, 2010, an alleged shareholder of the Corporation filed a purported derivative action, entitledBahnmaier v. Lewis, et al., in the U.S. District Court for the Southern District of New York. The complaint names as defendants certain of the Corporation’s current and former directors and officers, and one of Merrill Lynch’s former officers. The complaint alleges, among other things, that the individual defendants breached their fiduciary


200     Bank of America 2010


duties by failing to provide accurate and complete information to shareholders regarding: (i) certain Acquisition-related events; (ii) the potential for litigation resulting from Countrywide’s lending practices; and (iii) the risk posed to the Corporation’s capital levels as a result of Countrywide’s loan losses. The complaint also asserts claims against the individual defendants for breach of fiduciary duty by failing to maintain adequate internal controls, unjust enrichment, abuse of control and gross mismanagement in connection with the supervision and management of the operations, business and disclosure controls of the Corporation. The Corporation is named as a nominal defendant only and no monetary relief is sought against it. The complaint seeks, among other things, unspecified monetary damages, equitable remedies and other relief. On December 14, 2010, the court entered an order dismissing the complaint without prejudice.
The Corporation and certain of its current and former directors are also named as defendants in several putative class and derivative actions in the Delaware Court of Chancery, includingRothbaum v. Lewis;Southeastern Pennsylvania Transportation Authority v. Lewis; Tremont Partners LLC v. Lewis; Kovacs v. Lewis; Stern v. Lewis; andHoux v. Lewis, brought by shareholders alleging breaches of fiduciary duties and waste of corporate assets in connection with the Acquisition. On April 27, 2009, the Delaware Court of Chancery consolidated the derivative actions under the captionIn re Bank of America Corporation Stockholder Derivative Litigation. The complaint seeks, among other things, unspecified monetary damages, equitable remedies and other relief. On April 30, 2009, the putative class claims in theStern v. LewisandHoux v. Lewisactions were voluntarily dismissed without prejudice. Trial is scheduled for October 2012.
ERISA Actions
On October 9, 2009, plaintiffs in the ERISA actions in theIn re Bank of America Securities, Derivative and Employment Retirement Income Security Act (ERISA) Litigation(the ERISA Plaintiffs) filed a consolidated amended complaint for breaches of duty under ERISA. The amended complaint is brought on behalf of a purported class that consists of participants in the Corporation’s 401(k) Plan, the Corporation’s 401(k) Plan for Legacy Companies, the Countrywide Financial CorporationCFC 401(k) Plan (collectively, the 401(k) Plans), and the Corporation’s Pension Plan. The amended complaint names as defendants the Corporation, members of the Corporation’s Corporate Benefits Committee, members of the Compensation and Benefits Committee of the Corporation’s Board of Directors and certain of the Corporation’s current and former directors and officers. The amended complaint alleges violations of ERISA, based on, among other things: (i) an alleged failure to prudently and loyally manage the 401(k) Plans and Pension Plan by continuing to offer the Corporation’s common stock as an investment option or measure for participant contributions; (ii) an alleged failure to monitor the fiduciaries of the 401(k) Plans and Pension Plan; (iii) an alleged failure to provide complete and accurate information to the 401(k) Plans and Pension Plan participants with respect to the Merrill Lynch and Countrywide acquisitions and related matters; and (iv) alleged co-fiduciary liability for these purported fiduciary breaches. The amended complaint seeks an unspecified amount of monetary damages, equitable remedies and other relief. On December 8, 2009,August 27, 2010, the Corporation andcourt dismissed the officer and director defendants moved to dismisscomplaint brought by plaintiffs in the consolidated amended complaint.

Other Acquisition-related Litigation

Since January 21, 2009,ERISA action in its entirety. The ERISA Plaintiffs filed a notice of appeal of the Corporation and certaincourt’s dismissal of its current and former directors have been named as defendants in several putative class and derivative actions, includingRothbaum v. Lewis, Southeastern Pennsylvania Transportation Authority v. Lewis, Tremont Partners LLC v.


166Bank of America 2009


Lewis, Kovacs v. Lewis, Stern v. Lewis, andHoux v. Lewis, brought by shareholders intheir actions. The parties then stipulated to the Delaware Courtdismissal of Chancery alleging breaches of fiduciary duties in connectionthe appeal with the Acquisition. On April 27, 2009, the Delaware Court of Chancery consolidated the derivative actions under the captionIn re Bank of America Corporation Stockholder Derivative Litigation. On April 30, 2009, the putative class claims in the actions, entitledStern v. Lewis andHoux v. Lewis, were voluntarily dismissed without prejudice by order of the Chancery Court. On May 8, 2009, plaintiffs filed an amended consolidated complaint in the Chancery Court, asserting claims derivatively on behalf of the Corporationagreement that the defendants breachedERISA Plaintiffs can reinstate their fiduciary duty of loyalty by, among other things, failing to make adequate disclosures regarding Merrill Lynch’s 2008 fourth quarter losses and bonuses paid to Merrill Lynch employees in 2008 and breached their fiduciary duty of loyalty and committed waste by failing to invoke the material adverse change clause in the merger agreement or otherwise renegotiate the Acquisition. The amended consolidated complaint seeks damages sustained as a result of the alleged wrongdoing, disgorgement of bonuses paid to the defendants and to the Corporation’s management team or to former Merrill Lynch executives, as well as attorneys’ fees and costs and other equitable relief. On June 19, 2009, the Corporation and the individual defendants filed motions to dismiss. On October 12, 2009, the Chancery Court denied defendants’ motions to dismiss.

On February 17, 2009, an additional derivative action, entitledCunniff v. Lewis, et al., was filed in North Carolina Superior Court. The complaint, which names certain of the Corporation’s current and former officers and directors as defendants and names the Corporation as a nominal defendant, alleges that defendants violated fiduciary duties in connection with the Acquisition by, among other things, failing to disclose: (i) the financial condition and 2008 fourth quarter losses experienced by Merrill Lynch and (ii) the extent of the due diligence conducted in connection with the Acquisition. The complaint also brings a cause of action for waste of corporate assets for, among other things, allegedly subjecting the Corporation to potential material liability for securities fraud. The complaint seeks unspecified damages and other relief. On October 6, 2009, the Superior Court granted defendants’ motion to stay the action in favor of derivative actions pending in the Delaware Court of Chancery.

On September 25, 2009, an alleged shareholder of the Corporation filed an action against the Corporation, and its then Chief Executive Officer in Superior Court of the State of California, San Francisco County. The complaint alleges state law causes of action for breach of fiduciary duty, misrepresentation and fraud in connection with plaintiff’s purchase of the Corporation’s common stock, based on alleged failures to disclose information regarding Merrill Lynch’s value. The action, entitledCatalano v. Bank of America, seeks unspecified damages and other relief. Defendants have removed the action to the U. S. District Court for the Northern District of California, and have requested that the MDL Panel transfer the action to the U.S. District Court for the Southern District of New York for coordinated or consolidated pre-trial proceedings with the related litigation pending in that Court. On December 11, 2009, defendants removed the action to the U.S. District Court for the Northern District of California. On February 5, 2010, the MDL Panel transferred the action to the U.S. District Court for the Southern District of New York for coordinated or consolidated pre-trial proceedings with the related litigation pending in that Court.

On December 22, 2009, the Corporation and certain of its officers were named in a purported class action filed in the U.S. District Court for the Southern District of New York, entitledIron Workers of Western Pennsylvania Pension Plan v. Bank of America Corp., et al. The action is purportedly brought on behalf of all persons who purchased or acquired certain Corporation debt securities between September 15, 2008 and January 21, 2009 and alleges that defendants violated Sections 10(b)

appeal at any time up until July 27, 2011.

and 20(a) of the Securities Exchange Act of 1934, and SEC rules promulgated thereunder, based on, among other things, alleged false statements and omissions related to: (i) the financial condition and 2008 fourth quarter losses experienced by the Corporation and Merrill Lynch; (ii) due diligence conducted in connection with the Acquisition; (iii) bonus payments to Merrill Lynch employees; and (iv) certain defendants’ contacts with government officials regarding the Corporation’s consideration of invoking the material adverse change clause in the merger agreement and the possibility of obtaining additional government assistance in completing the Acquisition. The complaint seeks unspecified damages and other relief. The parties in the securities actions in theIn re Bank of America Securities, Derivative and Employment Retirement Income Security Act (ERISA) Litigation have requested that the District Court consolidate this action with their actions.

On January 13, 2010, the Corporation, Merrill Lynch and certain of the Corporation’s current and former officers and directors were named in a purported class action filed in the U.S. District Court for the Southern District of New York entitledDornfest v. Bank of America Corp., et al. The action is purportedly brought on behalf of investors in Corporation option contracts between September 15, 2008 and January 22, 2009 and alleges that during the class period approximately 9.5 million Corporation call option contracts and approximately eight million Corporation put option contracts were already traded on seven of the Options Clearing Corporation exchanges. The complaint alleges that defendants violated Sections 10(b) and 20(a) of the Securities Exchange Act of 1934, and SEC rules promulgated thereunder, based on, among other things, alleged false statements and omissions related to: (i) the financial condition and 2008 fourth quarter losses experienced by the Corporation and Merrill Lynch; (ii) due diligence conducted in connection with the Acquisition; (iii) bonus payments to Merrill Lynch employees; and (iv) certain defendants’ contacts with government officials regarding the Corporation’s consideration of invoking the material adverse change clause in the merger agreement and the possibility of obtaining additional government assistance in completing the Acquisition. The plaintiff class allegedly suffered damages because they invested in Corporation option contracts at allegedly artificially inflated prices and were adversely affected as the artificial inflation was removed from the market price of the securities. The complaint seeks unspecified damages and other relief. Plaintiffs in the securities actions in theIn re Bank of America Securities, Derivative and Employment Retirement Income Security Act (ERISA) Litigation have requested that the District Court consolidate this action with their actions.

On February 17, 2010, an alleged shareholder of the Corporation filed a purported derivative action, entitledBahnmeier v. Lewis, et al., in the U.S. District Court for the Southern District of New York. The complaint names as defendants certain of the Corporation’s current and former directors and officers, and one of Merrill Lynch’s former officers. The complaint alleges, among other things, that the individual defendants breached their fiduciary duties by failing to provide accurate and complete information to shareholders regarding, among other things: (i) the potential for litigation resulting from Countrywide’s lending practices and the risk posed to the Corporation’s capital levels as a result of Countrywide’s loan losses; (ii) the deterioration of Merrill Lynch’s financial condition during the fourth quarter of 2008, which was allegedly sufficient to trigger the material adverse change clause in the merger agreement with Merrill Lynch; (iii) the agreement to permit Merrill Lynch to pay up to $5.8 billion in bonuses to its employees; and (iv) the discussions with regulators in December 2008 concerning possibly receiving additional government assistance in completing the Acquisition. The complaint also asserts claims against the individual defendants for breach of fiduciary duty by failing to maintain adequate internal controls, unjust enrichment, abuse


Bank of America 2009167


of control and gross mismanagement in connection with the supervision and management of the operations, business and disclosure controls of the Corporation. The Corporation is named as a nominal defendant only and no monetary relief is sought against it. The complaint seeks, among other things, an unspecified amount of monetary damages, equitable remedies and other relief.

Regulatory Matters

The Corporation and Merrill Lynch have also received and are responding to inquiries from a variety of regulators and governmental authorities relating to among other things: (i) the payment by Merrill Lynch of bonuses for 2008 and disclosures related thereto; (ii) disclosures relating to Merrill Lynch’s losses in the fourth quarter of 2008; (iii) disclosures relating to the Corporation’s consideration of whether there had been a material adverse change relating to Merrill Lynch and discussions with U.S. government officials in late December 2008; and (iv) the Acquisition and related proxy statement.

On August 3, 2009, the SEC filed a complaint against the Corporation, entitledSEC v. Bank of America, in the U.S. District Court for the Southern District of New York, alleging that the Corporation’s proxy statement filed on November 3, 2008 failed to disclose the discretionary incentive compensation that Merrill Lynch could award to its employees prior to completion of the Acquisition. On September 14, 2009, the District Court declined to approve a proposed consent judgment agreed to by the Corporation and the SEC. On October 9, 2009, the Corporation’s Board of Directors approved a limited waiver of the Corporation’s attorney-client and attorney work product privileges as to certain subject matters under investigation by the U.S. Congress, and federal and state regulatory authorities.

On January 12, 2010, the SEC filed a second complaint against the Corporation, entitledSEC v. Bank of America Corp., in the U.S. District Court for the Southern District of New York alleging that the Corporation violated the federal proxy rules for failing to disclose information concerning Merrill Lynch’s known and estimated losses prior to the shareholder vote on December 5, 2008, to approve the Acquisition. The SEC alleges that the Corporation was required to describe in its proxy and registration statement any material changes in Merrill Lynch’s affairs that were not already reflected in Merrill Lynch’s quarterly reports or certain other public filings, and to update shareholders on any “fundamental change” arising after the effective date of the registration statement. The SEC alleges that the Corporation’s failure to provide such an update violated Section 14(a) of the Securities Exchange Act of 1934 and Rule 14a-9 thereunder. The SEC is seeking an injunction against the Corporation to prohibit any future violations of Section 14(a) and Rule 14a-9, as well as an unspecified civil monetary penalty.

On February 1, 2010, the Corporation entered into a proposed settlement with the SEC to resolve all cases filed by the SEC relating to the Acquisition. Also, on February 4, 2010, the Corporation entered into an agreement with the Office of the Attorney General for the State of North Carolina (NC AG) to resolve all matters that are the subject of an investigation by that Office relating to the Acquisition. Under the terms of the proposed settlements, the Corporation agreed, without admitting or denying any wrongdoing, to pay $150 million as a civil penalty to be distributed to former Bank of America shareholders as part of the SEC’s Fair Fund program and a payment of $1 million to be made to the NC AG for its consumer protection purposes. The payment to the NC AG is not a penalty or a fine. As part of the settlements, the Corporation also agreed to implement a number of additional undertakings for a period of three years, including: engaging an independent auditor to perform an assessment and provide an attestation report on the effectiveness of the Corporation’s disclosure controls and procedures; furnishing management

certifications signed by the CEO and CFO with respect to proxy statements; retaining disclosure counsel to the Audit Committee of the Corporation’s Board; adopting independence requirements beyond those already applicable for all members of the Compensation and Benefits Committee of the Board; continuing to retain an independent compensation consultant to the Compensation and Benefits Committee; implementing and disclosing written incentive compensation principles on the Corporation’s website and providing the Corporation’s shareholders with an advisory vote concerning any proposed changes to such principles; and providing the Corporation’s shareholders with an annual “say on pay” advisory vote regarding the compensation of senior executives. These proposed undertakings may be amended or modified in light of any new regulation or requirement that comes into effect during the three-year period and is applicable to the Corporation with respect to the same subject matter. On February 22, 2010, the District Court approved the settlement subject to the Corporation and the SEC making certain modifications to the settlement to require agreement between the SEC and the Corporation on the selection of the independent auditor and disclosure counsel and to clarify certain issues regarding the distribution of the civil penalty. The parties made the modifications and on February 24, 2010, the District Court entered the Consent Judgment encompassing the settlement terms.

NYAG Action

On February 4, 2010, the Office of the New York State Attorney General (NY AG)(NYAG) filed a civil complaint in the Supreme Court of New York State, entitledPeople of the State of New York v. Bank of America, et al. The complaint names as defendants the Corporation and the Corporation’s former chief executiveCEO and chief financial officers, Kenneth D. Lewis, and Joseph L. Price,CFO, and alleges violations of Sections 352, 352-c(1)(a), 352-c(1)(c), and 353 of the New York General Business Law, commonly known as the Martin Act, and Section 63(12) of the New York Executive Law. The complaint is based on, among other things, alleged false statements and omissions and fraudulent practices related to: (i) the disclosure of Merrill Lynch’s financial condition and its interim and projected losses during the fourth quarter of 2008; (ii) the Corporation’s contacts with federal government officials regarding the Corporation’s consideration of invoking the material adverse effect clause in the merger agreement and the possibility of obtaining additional government assistance; (iii) the disclosure of the payment and timing of year-end incentive compensation to Merrill Lynch employees; and (iv) public statements regarding the due diligence conducted in connection with the Acquisition and positive statements regarding the Acquisition. The complaint seeks an

unspecified amount in disgorgement, penalties, restitution, and damages and other equitable relief.

The court has ordered fact discovery to be complete by September 30, 2011.

Merrill Lynch Subprime-related MattersMontgomery

Louisiana Sheriffs’ Pension & Relief Fund v. Conway, et al.

On October 3, 2008,

The Corporation, several of its current and former officers and directors, BAS, MLPFS and other unaffiliated underwriters have been named as defendants in a putative class action was filed against Merrill Lynch, Merrill Lynch Capital Trust I, Merrill Lynch Capital Trust II, Merrill Lynch Capital Trust III, MLPF&S (collectively the Merrill Lynch entities), and certain present and former Merrill Lynch officers and directors, and underwriters, including BAS, in New York Supreme Court, New York County. The complaint seeks relief on behalf of all persons who purchased or otherwise acquired debt securities issued by the Merrill Lynch entities pursuant to a shelf registration statement dated March 31, 2006. The complaint alleged that prospectuses misstated the financial condition of the Merrill Lynch entities and failed to disclose their exposure to losses from investments tied to subprime and other mortgages, as well as their liability arising from its participation in the ARS market. On October 22, 2008, the action was removed to the U.S. District Court for the Southern District of New York and on November 5, 2008 it was accepted as a


168Bank of America 2009


related case toIn re Merrill Lynch & Co., Inc. Securities, Derivative, and ERISA Litigation. On April 21, 2009, the parties reached an agreement in principle to settle the Louisiana Sheriff’s matter in an amount that is not material to the Corporation’s Consolidated Financial Statements and dismiss all claims with prejudice. On November 30, 2009, the U.S. District Court for the Southern District of New York granted final approval of the settlement.

Connecticut Carpenters Pension Fund, et al. v. Merrill Lynch & Co., Inc., et al.; Iron Workers Local No. 25 Pension Fund v. Credit-Based Asset Servicing and Securitization LLC, et al.; Public Employees’ Ret. System of Mississippi v. Merrill Lynch & Co. Inc. et al.; Wyoming State Treasurer v. Merrill Lynch & Co. Inc.

Beginning in December 2008, Merrill Lynch affiliated entities, including Merrill Lynch Mortgage Investors, Inc., and officers and directors of Merrill Lynch Mortgage Investors, Inc., and others were named in four putative class actions arising out of the underwriting and sale of more than $55 billion of MBS. The complaints alleged, among other things, that the relevant registration statements and accompanying prospectuses or prospectus supplements misrepresented or omitted material facts regarding the underwriting standards used to originate the mortgages in the mortgage pools underlying the MBS, the process by which the mortgage pools were acquired, and the appraisals of the homes secured by the mortgages. Plaintiffs seek to recover alleged losses in the market value of the MBS allegedly caused by the performance of the underlying mortgages or to rescind their purchases of the MBS. These cases were consolidated under the captionPublic Employees’ Ret. System of Mississippi v. Merrill Lynch & Co. Inc. and, on May 20, 2009, a consolidated amended complaint was filed. On June 17, 2009, all defendants filed a motion to dismiss the consolidated amended complaint.

Federal Home Loan Bank of Seattle Litigation

On December 23, 2009, FHLB Seattle filed a complaint, entitledFederal Home Loan Bank of Seattle v. Merrill Lynch, Pierce, Fenner & Smith, Inc., et al., in the Superior Court of Washington for King County against MLPF&S, Merrill Lynch Mortgage Investors, Inc., and Merrill Lynch Mortgage Capital, Inc. The complaint alleges violations of the Securities Act of Washington in connection with the offering of various MBS and asserts, among other things, misstatements and omissions concerning the credit quality of the mortgage loans underlying the MBS and the loan origination practices associated with those loans. The complaint seeks rescission, interest, costs and attorneys’ fees.

Merrill Lynch & Co., Inc. is cooperating with the SEC and other governmental authorities investigating subprime mortgage-related activities.

Montgomery

On January 19, 2010, a putative class action entitledMontgomery v. Bank of America, et al., was filed in the U.S. District Court for the Southern District of New York against the Corporation, BAS, MLPF&S and a numberentitledMontgomery v. Bank of its current and former officers and directorsAmerica, et al. Plaintiff filed an amended complaint on January 14, 2011. Plaintiff seeks to sue on behalf of all persons who acquired certain series of preferred stock offered by the Corporation pursuant to a shelf registration statement dated May 5, 2006, specifically two2006. Plaintiff’s claims arise from three offerings dated January 24, 2008, January 28, 2008 and another dated May 20, 2008.2008, from which the Corporation allegedly received proceeds of $15.8 billion. TheMontgomery amended complaint asserts claims under Sections 11, 12(a)(2), and 15 of the Securities Act of 1933, and alleges that the prospectus supplements associated with the offerings: (i) failed to disclose that the Corporation’s loans, leases, CDOs and commercial MBS were impaired to a greater extent than disclosed; (ii) misrepresented the extent of the impaired assets by failing to establish adequate reserves or properly record losses for its impaired assets; and (iii) misrepresented the adequacy of the Corporation’s internal controls and the Corporation’s capital base in light of the alleged impairment of its assets.assets; (iv) misrepresented the Corporation’s capital base and Tier 1 leverage ratio for risk-based capital in light of the allegedly impaired assets; and (v) misrepresented the thoroughness and adequacy of the Corporation’s due diligence in connection with its acquisition of Countrywide. The amended complaint seeks rescission, compensatory and other damages.

Mortgage-backed Securities Litigation
The Corporation and its affiliates, Countrywide entities and their affiliates, and Merrill Lynch entities and their affiliates have been named as defendants in several cases relating to their various roles as issuer, originator, seller, depositor, sponsor, underwriterand/or controlling entity in MBS offerings, pursuant to which the MBS investors were entitled to a portion of the cash flow from the underlying pools of mortgages. These cases generally include purported class action suits and actions by individual MBS purchasers. Although the allegations vary by lawsuit, these cases generally allege that the registration statements, prospectuses and prospectus supplements for securities issued by securitization trusts contained material misrepresentations and omissions, in violation of Sections 11 and 12 of the Securities Act of 1933and/or state securities laws and other state statutory and common laws.
These cases generally involve allegations of false and misleading statements regarding: (i) the process by which the properties that served as collateral for the mortgage loans underlying the MBS were appraised; (ii) the percentage of equity that mortgage borrowers had in their homes; (iii) the borrowers’ ability to repay their mortgage loans; and (iv) the underwriting practices by which those mortgage loans were originated (collectively, the MBS Claims). In addition, several of the cases discussed below assert claims related to the ratings given to the different tranches of MBS by rating agencies. Plaintiffs in these cases generally seek unspecified compensatory damages, unspecified costs and legal fees and, in some instances, seek rescission.
Luther Litigation and Related Actions
David H. Luther and various pension funds (collectively, Luther Plaintiffs) commenced a putative class action against CFC, several of its affiliates, BAS, MLPFS and other entities and individuals in California Superior Court for Los Angeles County entitledLuther v. Countrywide Financial Corporation, et al(the Luther Action). The Luther Plaintiffs claim that they and other unspecified investors purchased MBS issued by subsidiaries of CFC in 429 offerings


Bank of America 2010     201


between January 2005 and December 2007. The Luther Plaintiffs certified that they collectively purchased securities in 61 of the 429 offerings for approximately $216 million. On January 6, 2010, the court granted CFC’s motion to dismiss, with prejudice, due to lack of subject matter jurisdiction. The Luther Plaintiffs’ appeal to the California Court of Appeal is currently pending.
Following the dismissal of the Luther Action, the Maine State Retirement System filed a putative class action in the U.S. District Court for the Central District of California, entitledMaine State Retirement System v. Countrywide Financial Corporation, et al.(the Maine Action). The Maine Action names the same defendants as the Luther Action, as well as the Corporation and NB Holdings Corporation, and asserts substantially the same allegations regarding 427 of the MBS offerings that were at issue in the Luther Action. On May 14, 2010, the court appointed the Iowa Public Employees’ Retirement System (IPERS) as Lead Plaintiff. On July 13, 2010, IPERS filed an amended complaint, which added additional pension fund plaintiffs (collectively, the Maine Plaintiffs). The Maine Plaintiffs certified that they purchased securities in 81 of those 427 offerings, for approximately $538 million. On November 4, 2010, the court granted CFC’s motion to dismiss the amended complaint in its entirety, and ordered the Maine Plaintiffs to file a second amended complaint within 30 days. In so doing, the court held that the Maine Plaintiffs only have standing to sue over the 81 offerings in which they actually purchased MBS. The court also held that the applicable statute of limitations could be tolled by the filing of the Luther Action only with respect to the offerings in which the Luther Plaintiffs actually purchased MBS. On December 6, 2010, the Maine Plaintiffs filed a second amended complaint that relates to 14 MBS offerings.
Western Conference of Teamsters Pension Trust Fund (Western Teamsters) filed suit against the same defendants named in the Maine Action on November 17, 2010 in the Superior Court of California, Los Angeles County, entitledWestern Conference of Teamsters Pension Trust Fund v. Countrywide Financial Corporation, et al. Western Teamsters claims that it and other unspecified investors purchased MBS issued in the 428 offerings that were also at issue in the Luther Action. The Western Teamsters action has been stayed by the Superior Court pending resolution of the appeal of the Luther Action.
The New Mexico State Investment Council, New Mexico Educational Retirement Board and New Mexico Public Employees Retirement Association (the New Mexico Plaintiffs) have also brought an action against CFC and several of its affiliates, current and former officers, as well as third-party underwriters in New Mexico District Court for the County of Santa Fe, entitledNew Mexico State Investment Council, et al. v. Countrywide Financial Corporation, et al. A related action was later filed against the individual defendants in California Superior Court, entitledNew Mexico State Investment Council, et al. v. Stanford L. Kurland, et al.On November 15, 2010, the parties agreed to resolve and dismiss these two cases in their entirety with prejudice for an amount that is not material to the Corporation’s results of operations.
Putnam Bank filed a putative class action lawsuit on January 27, 2011 against CFC, the Corporation, certain of their subsidiaries, and certain individuals in the U.S. District Court for the District of Connecticut, entitledPutnam Bank v. Countrywide Financial Corporation, et al. Putnam Bank alleges that it purchased approximately $33 million in eight MBS offerings issued by subsidiaries of CFC between August 2005 and September 2007. All eight offerings were also included in the Luther Action and the Maine Action. In addition to certain MBS Claims, Putnam Bank contends among other things that defendants made false and misleading statements regarding: (i) the number of mortgage loans in each offering that were originated under reduced documentation programs; (ii) the method by which mortgages were selected for inclusion in the collateral pools underlying the offerings; and (iii) the analysis conducted by ratings agencies prior to assigning ratings to the MBS.

Countrywide may also be subject to contractual indemnification obligations for the benefit of certain defendants involved in the MBS matters discussed above.
IndyMac Litigation
In 2006 and 2007, MLPFS, CSC and other financial institutions participated as underwriters in MBS offerings in which IndyMac MBS, Inc. securitized residential mortgage loans originated or acquired by IndyMac Bank, F.S.B. (IndyMac Bank) and created trusts that issued MBS. In 2009, the Corporation was named as an underwriter defendant, along with several other financial institutions, in its alleged capacity as“successor-in-interest” to MLPFS and CSC in a consolidated class action in the U.S. District Court for the Southern District of New York, entitledIn re IndyMac Mortgage-Backed Securities Litigation. In their complaint, plaintiffs assert MBS Claims relating to 106 offerings of IndyMac-related MBS. On June 21, 2010, the court dismissed the Corporation from the action because the plaintiffs failed to plead sufficient facts to support their allegation that the Corporation is the“successor-in-interest” to MLPFS and CSC. On August 3, 2010, plaintiffs filed a motion to add MLPFS and CSC as defendants, which MLPFS and CSC have opposed.
Merrill Lynch MBS Litigation
Merrill Lynch, MLPFS, Merrill Lynch Mortgage Investors, Inc. (MLMI) and certain current and former directors of MLMI are named as defendants in a putative consolidated class action in the U.S. District Court in the Southern District of New York, entitledPublic Employees’ Ret. System of Mississippi v. Merrill Lynch & Co. Inc. In addition to MBS Claims, plaintiffs also allege that the offering documents for the MBS misrepresented or omitted material facts regarding the credit ratings assigned to the securities. In March 2010, the court dismissed claims related to 65 of 84 offerings with prejudice due to lack of standing as no named plaintiff purchased securities in those offerings. On November 8, 2010, the court dismissed claims related to 1 of 19 remaining offerings on separate grounds. MLPFS was the sole underwriter of these 18 offerings. On December 1, 2010, the defendants filed an answer to the consolidated amended complaint.
Cambridge Place Investment Management Litigation
Cambridge Place Investment Management Inc. (CPIM), as the alleged exclusive assignee of certain entities that allegedly purchased MBS offered or sold by BAS, MLPFS and CSC, brought an action against BAS, MLPFS, CSC and several of their affiliates in Massachusetts Superior Court, Suffolk County, entitledCambridge Place Investment Management Inc. v. Morgan Stanley & Co., Inc., et al. CPIM also brought claims against more than 50 other defendants in this action. In addition to MBS Claims, CPIM contends that BAS, MLPFS, CSC and their affiliates made false and misleading statements in violation of the Massachusetts Uniform Securities Act regarding: (i) due diligence performed by the underwriters on the mortgage loans and the mortgage originators’ underwriting practices; and (ii) the credit enhancements applicable to certain tranches of the MBS. On August 13, 2010, certain defendants removed the case to the U.S. District Court for the District of Massachusetts. On September 13, 2010, CPIM filed a motion to remand the case back to state court. On October 12, 2010, the court referred the motion to remand to a Magistrate Judge for consideration. On December 28, 2010, the Magistrate Judge issued a report and recommendation that the action be remanded to state court. On January 18, 2011, the defendants filed an objection to that recommendation, which CPIM opposed on February 1, 2011. The objection to the Magistrate Judge’s recommendation remains pending.
On February 11, 2011, CPIM commenced a separate civil action in Massachusetts Superior Court, Suffolk County, captionedCambridge Place Investment Management Inc. v. Morgan Stanley & Co., Inc., et al., in


202     Bank of America 2010


connection with the offering or sale of certain additional mortgage-backed securities by BAS, MLPFS, CSC, several of their affiliates and more than 40 other defendants. CPIM alleges that it is the assignee of the claims of certain entities that allegedly purchased mortgage-backed securities issued or sold by BAS, MLPFS and CSC in various offerings. In addition to MBS Claims, CPIM contends that BAS, MLPFS, CSC and their affiliates made false and misleading statements in violation of the Massachusetts Uniform Securities Act in connection with these offerings regarding: (i) due diligence performed by the underwriters on the mortgage loans and the mortgage originators’ underwriting practices; (ii) the credit enhancements applicable to certain tranches of the MBS; and (iii) the validity of each issuing trust’s title to the mortgage loans comprising the pool for that securitization.
Federal Home Loan Bank Litigation
The Federal Home Loan Bank of Atlanta (FHLB Atlanta) filed a complaint on January 18, 2011 against the Corporation, CFC, CSC and Countrywide Home Loans (CHL) in the State Court of Georgia, Fulton County, entitledFederal Home Loan Bank of Atlanta v. Countrywide Financial Corporation, et al. In addition to certain MBS Claims, FHLB Atlanta contends that defendants made false and misleading statements regarding: (i) the credit ratings of the securities; and (ii) the transfer and assignment of the loans to the trusts.
The Federal Home Loan Bank of Chicago (FHLB Chicago) filed a complaint against the Corporation, BAS, MLPFS and CSC in the Illinois Circuit Court, Cook County, entitledFederal Home Loan Bank of Chicago v. Banc of America Funding Corp., et al.(the Illinois Action). FHLB Chicago also filed a complaint against BAS, CFC and subsidiaries of CFC in the Superior Court of California, Los Angeles County, entitledFederal Home Loan Bank of Chicago v. Banc of America Securities LLC, et al. (the California Action). In addition to certain MBS Claims, FHLB Chicago contends that defendants made false and misleading statements regarding among other things, the guidelines for extending mortgages to borrowers and the due diligence performed on repurchased and pooled loans. Both actions have been removed to federal court.
The Federal Home Loan Bank of Pittsburgh (FHLB Pittsburgh) commenced an action against CFC, CSC and certain other Countrywide affiliates, as well as several ratings agencies, in the Court of Common Pleas of Allegheny County Pennsylvania, entitledFederal Home Loan Bank of Pittsburgh v. Countrywide Securities Corporation et al. FHLB Pittsburgh claims to have purchased MBS issued by subsidiaries of CFC in five offerings for approximately $366 million. In addition to certain MBS Claims, FHLB Pittsburgh contends that defendants made false and misleading statements regarding the risk associated with the MBS based on their credit ratings. Countrywide’s motion to dismiss was denied on November 29, 2010.
The Federal Home Loan Bank of Seattle (FHLB Seattle) filed four separate complaints, each against different defendants, including the Corporation and several of its subsidiaries, Countrywide and Merrill Lynch, as well as certain other defendants, in the Superior Court of Washington for King County concerning four separate issuances entitledFederal Home Loan Bank of Seattle v. UBS Securities LLC, et al.;Federal Home Loan Bank of Seattle v. Countrywide Securities Corp., et al.;Federal Home Loan Bank of Seattle v. Banc of America Securities LLC, et al.andFederal Home Loan Bank of Seattle v. Merrill Lynch, Pierce, Fenner & Smith, Inc., et al. In addition to certain MBS Claims, FHLB Seattle contends that defendants made false and misleading statements regarding the number of borrowers who actually lived in the houses that secured the mortgage loans and the business practices of the lending institutions that made the mortgage loans. FHLB Seattle claims that the sales violated the Securities Act of Washington. On October 18, 2010, the Corporation entities and Countrywide entities named as defendants in three of the cases filed a consolidated motion to dismiss the amended complaints, which is currently pending. On the same date, the

Merrill Lynch entities named as defendants in the fourth case filed a motion to dismiss the amended complaint, which is currently pending.
The Federal Home Loan Bank of San Francisco (FHLB San Francisco) filed two actions against various affiliates of the Corporation, as well as various Countrywide and Merrill Lynch entities in the Superior Court of California, County of San Francisco, entitled: (i) Federal Home Loan Bank of San Francisco v. Credit Suisse Securities (USA) LLC, et al., which asserts claims against CFC, CSC, BAS and several of their affiliates; and (ii) Federal Home Loan Bank of San Francisco v. Deutsche Bank Securities Inc., et al., which asserts claims against CSC and MLPFS. In addition to certain MBS Claims, FHLB San Francisco contends that defendants made false and misleading statements regarding the original mortgage lenders’ guidelines for extending the loans to borrowers. FHLB San Francisco also claims that defendants failed to disclose that third-party ratings services’ credit ratings of the MBS did not take into account defendants’ false and misleading statements about the mortgage loans underlying the MBS. On November 5, 2010, FHLB San Francisco sought permission from the court to amend its complaint in the first action to include the Corporation as a defendant and, among other things, to assert control person liability claims against the Corporation under state and federal securities laws and to assert that the Corporation succeeded to CFC’s interests. Defendants had removed the state court actions to federal court, but on December 20, 2010, the U.S. District Court, Northern District of California remanded the cases to state court and denied a motion to amend the complaint as moot when it granted remand. On November 5, 2010, FHLB San Francisco also filed a declaratory action in the Superior Court of California, County of San Francisco, entitledFederal Home Loan Bank of San Francisco v. Bank of America Corporation and Does 1-10, seeking a determination that the Corporation is a successor to the liabilities of CFC including the liabilities at issue inFederal Home Loan Bank of San Francisco v. Credit Suisse Securities (USA) LLC, et al.
Charles Schwab Litigation
The Charles Schwab Corporation (Schwab) has filed an action against the Corporation, BAS, Countrywide, and several of their affiliates, in the Superior Court of California, County of San Francisco, on July 15, 2010 entitledThe Charles Schwab Corp. v. BNP Paribas Securities Corp., et al. This action is in connection with the purchase by Schwab of approximately $577 million of MBS, $166 million of which relates to claims with respect to the Corporation and BAS and $411 million of which relates to claims with respect to Countrywide. In addition to MBS Claims, Schwab contends that the Corporation, BAS and Countrywide are liable for false and misleading statements regarding among other things, the business practices of the lending institution that made the original loan and MBS credit ratings. In September 2010, the Corporation, BAS and Countrywide joined in or consented to the removal of this action to the U.S. District Court for the Northern District of California. Schwab has filed a motion to remand the action to California state court, which remains pending.
Allstate Litigation
Allstate Insurance Company, Allstate Life Insurance Company, Allstate Life Insurance Company of New York and American Heritage Life Insurance Company (collectively, the Allstate Plaintiffs) filed an action on December 27, 2010 against CFC, the Corporation, several of their affiliates and several individuals in the U.S. District Court for the Southern District of New York, entitledAllstate Insurance Company, et al., v. Countrywide Financial Corporation, et al. (the Allstate Action). The Allstate Plaintiffs allege that they purchased MBS issued by CFC related entities in 25 offerings between March 2005 and June 2007. All but three of the 25 offerings in the Allstate Action are also at issue in the Luther and Western Teamsters Actions. Two of the 25 offerings in the Allstate Action are also at issue in the second amended complaint filed by plaintiffs in


Bank of America 2010     203


the Maine Action on December 6, 2010. In addition to certain MBS Claims, the Allstate Plaintiffs contend that defendants made false and misleading statements regarding: (i) the number of borrowers who used the properties securing the mortgage loans as their primary residence; (ii) the number of mortgage loans in each offering that were originated under reduced documentation programs; and (iii) the standards by which the mortgage loans were serviced after origination.
Regulatory Investigations
In addition to the MBS litigation discussed beginning on page 201, the Corporation has also received a number of subpoenas and other informal requests for information from federal regulators regarding MBS matters, including inquiries related to the Corporation’s underwriting and issuance of MBS and its participation in certain CDO offerings.
Municipal Derivatives Matters

The Antitrust DivisionSEC, the Department of the DOJ, the SEC, andJustice (DOJ), the Internal Revenue Service (IRS) are investigating, the Office of Comptroller of the Currency (OCC), the Federal Reserve and a Working Group of State Attorneys General (the Working Group) have investigated the Corporation, BANA and BAS concerning possible anticompetitive bidding practices in the municipal derivatives industry involving various parties, including

BANA, dating back to the early 1990s. The activities at issue in these industry-wide governmentThese investigations concernhave focused on the bidding processpractices for guaranteed investment contracts, the investment vehicles in which the proceeds of municipal derivatives thatbond offerings are offereddeposited, as well as other types of derivative transactions related to states, municipalities and other issuers of tax-exemptmunicipal bonds. The Corporation has cooperated, and continues to cooperate, with the DOJ, the SEC and the IRS. On January 11, 2007, the Corporation entered into a Corporate Conditional Leniency Letter (the Letter) with DOJ. Under the Letter andDOJ, under which the DOJ agreed not to prosecute the Corporation for criminal antitrust violations in connection with matters the Corporation has reported to the DOJ, subject to the Corporation’s continuing cooperation, the DOJ will not bring any criminal antitrust prosecution againstcontinued cooperation. On December 7, 2010, the Corporation in connectionand its affiliates settled inquiries with the mattersSEC, OCC, IRS and the Working Group for an aggregate amount that is not material to the Corporation’s results of operations. In addition, the Corporation reportedentered into an agreement with the Federal Reserve providing for additional oversight and compliance risk management.

BANA and Merrill Lynch, along with other financial institutions, are named as defendants in several substantially similar class actions and individual actions, filed in various state and federal courts by several municipalities that issued municipal bonds, as well as purchasers of municipal derivatives. These actions generally allege that defendants conspired to DOJ. Subjectviolate federal and state antitrust laws by allocating customers, and fixing or stabilizing rates of return on certain municipal derivatives from 1992 to satisfying the DOJ and the court presiding over any civil litigationpresent. These actions seek unspecified damages, including treble damages. However, as a result of the Corporation’s cooperation,receipt of the Corporate Leniency Letter from the DOJ referenced above, the Corporation is eligible for: (i)to seek a limit on liabilityruling that certain civil plaintiffs are limited to single, rather than treble, damages in certain types of related civil antitrust actions; and (ii) relief from joint and several antitrust liability with other civil defendants.

On February 4, 2008, BANA received a Wells notice advising that the SEC staff is considering recommending that the SEC bring a civil injunctive action and/or an administrative proceeding against BANA “in connection with the bidding of various financial instruments associated with municipal securities.” An SEC action or proceeding could seek a permanent injunction, disgorgement plus prejudgment interest, civil penalties and other remedial relief. Merrill Lynch is also being investigated by the SEC and the DOJ concerning bidding practicesco-defendants in the municipal derivatives industry.

Beginning in March 2008, the Corporation, BANA and other financial institutions, including Merrill Lynch, have been named as defendants in complaints filed in federal courts in the District of Columbia, New York and elsewhere. Plaintiffs in those cases purport to represent classes of government and private entities that purchased municipal derivatives from defendants. The complaints allege that defendants conspired to allocate customers and fix or stabilize the prices of certain municipal derivatives from 1992 through the present. The plaintiffs’ complaints seek unspecified damages, including treble damages. These lawsuits were consolidated for pre-trial proceedings in theIn re Municipal Derivatives Antitrust Litigation, pending in the U.S. District Court for the Southern District of New York. BANA, BAS, Merrill Lynch and other financial institutions have also been named in several related individualcivil suits originally filed in California state courts on behalf of a number of cities and counties in California and asserting state law causes of action.discussed below. All of these cases have been removed to the U.S. District Court for the Southern District of New York and are now part ofIn re Municipal Derivatives Antitrust Litigation. The amended complaints filed in these actions continue to allege a substantially similar conspiracy and now assert violations of the Sherman Act and California’s Cartwright Act. Six individual actions have been filed in the U.S. District Courts for the Eastern and Central Districts of California. All of these cases allege a substantially similar conspiracy and violations of the Sherman and Cartwright Acts, and seek unspecified damages, and in some cases, treble damages. All six cases are in the process of being transferred for consolidation in theIn re Municipal Derivatives Antitrust Litigation.

On September 3, 2009, BANA was sued by the West Virginia Attorney General on behalf of the State of West Virginia for the same conspiracy alleged in theIn re Municipal Derivatives Antitrust Litigation. The suit was originally filed in the Circuit Court of Mason County, West Virginia. BANA removed the case to the U.S. District Court for the Southern District of West Virginia (Huntington Division). The State’s motion to remand is fully briefed. Upon removal, BANA noticed the State’s case as a tag-along action subject to transfer by the MDL Panel. The MDL Panel has issued a Conditional Transfer Order transferring the action to the U.S. District Court for the Southern District of New York. The State objected and filed a motion to vacate. That motion was denied on February 2, 2010.

Beginning in April 2008, the Corporation and BANA received subpoenas, interrogatories and/or civil investigative demands from a number of state attorneys general requesting documents and information regarding municipal derivatives transactions from 1992 through the present.


Bank of America 2009169


The Corporation and BANA are cooperating with the state attorneys general.

Ocala Litigation

On November 25, 2009, BANA was named as a defendant in two related lawsuits filed in the U.S. District Court for the Southern District of New York. InBNP Paribas Mortgage Corporation v. Bank of America, N.A. andDeutsche Bank, AG v. Bank of America, N.A., plaintiffs assert breach of contract, negligence and indemnification claims in connection with BANA’s roles as, among other things, collateral agent, custodian and indenture trustee of Ocala Funding, LLC (Ocala). Ocala was a mortgage warehousing facility that provided funding to Taylor, Bean & Whitaker Mortgage Corp. (TBW) by issuing commercial paper and term securities backed by mortgage loans originated by TBW. Plaintiffs claim that they purchased in excess of $1.6 billion in securities issued by Ocala and that BANA allegedly failed, among other things, to protect the collateral backing plaintiffs’ securities. Plaintiffs seek unspecified compensatory damages, among other relief. On February 4, 2010, BANA moved to dismiss the complaints.

Parmalat Finanziaria S.p.A. Matters

On December 24, 2003, Parmalat Finanziaria S.p.A. (Parmalat) was admitted into insolvency proceedings in Italy, known as “extraordinary administration.” The Corporation, through certain of its subsidiaries, including BANA, provided financial services and extended credit to Parmalat and its related entities. On June 21, 2004, Extraordinary Commissioner Dr. Enrico Bondi filed with the Italian Ministry of Production Activities a plan of reorganization for the restructuring of the companies of the Parmalat group that are included in the Italian extraordinary administration proceeding. In July 2004, the Italian Ministry of Production Activities approved the Extraordinary Commissioner’s restructuring plan, as amended, for the Parmalat group companies that are included in the Italian extraordinary administration proceeding. This plan was approved by the voting creditors and the Court of Parma, Italy in October of 2005.

Litigation and investigations relating to Parmalat are pending in both Italy and the United States.

Proceedings in Italy

On May 26, 2004, the Public Prosecutor’s Office for the Court of Milan, Italy filed criminal charges against Luca Sala, Luis Moncada, and Antonio Luzi, three former employees of the Corporation, alleging the crime of market manipulation in connection with a press release issued by Parmalat. On December 18, 2008, the Court of Milan, Italy fully acquitted each of the former employees of all charges. On June 17, 2009, the Public Prosecutor’s Office for the Court of Milan, Italy filed an appeal of the decision. The initial hearing date for the appeal is set for January 26, 2010. The Public Prosecutor’s Office also filed a related charge in May 2004 against the Corporation asserting administrative liability based on an alleged failure to maintain an organizational model sufficient to prevent the alleged criminal activities of its former employees. The trial on this administrative charge is ongoing, with hearing dates scheduled in 2010.

On July 31, 2009, the Public Prosecutor’s Office for the Court of Parma, Italy filed formal charges against 10 former employees and one current employee of the Corporation, alleging the commission of crimes of fraudulent bankruptcy, fraud, usury and embezzlement in connection with the insolvency of Parmalat. The first preliminary hearing was held on November 16, 2009, with further hearings in 2010.

Proceedings in the United States

All cases listed herein have been transferred to the U.S. District Court for the Southern District of New York for coordinated pre-trial purposes under the captionand consolidated in a single proceeding, entitledIn re SecuritiesMunicipal Derivatives Antitrust Litigation Parmalat.

Since December 2003, certain purchasers of Parmalat-related private placement offerings have. Defendants other than BANA and Merrill Lynch filed motions to dismiss plaintiffs’ complaints, againstwhich the court denied in large part in April 2010. The action has otherwise been largely stayed while the DOJ completes its criminal trials concerning other parties.

Ocala Litigation
BNP Paribas Mortgage Corporation and

various related entities in the following actions:Principal Global Investors,LLC, et al. v. Deutsche Bank of America Corporation, et al. in the U.S. District Court for the Southern District of Iowa;Monumental Life Insurance Company, et

al. v. Bank of America Corporation, et al. in the U.S. District Court for the Northern District of Iowa;Prudential Insurance Company of America andHartford Life Insurance Company v. Bank of America Corporation, et al. in the U.S. District Court for the Northern District of Illinois;Allstate Life Insurance Company v. Bank of America Corporation, et al. in the U.S. District Court for the Northern District of Illinois;Hartford Life Insurance v. Bank of America Corporation, et al.AG each filed claims (the 2009 Actions) against BANA in the U.S. District Court for the Southern District of New York; andYork entitledJohn Hancock Life Insurance Company, et al.BNP Paribas Mortgage Corporation v. Bank of America, N.A.andDeutsche Bank AG v. Bank of America, N.A. Plaintiffs allege that BANA failed to properly perform its duties as indenture trustee, collateral agent, custodian and depositary for Ocala Funding, LLC (Ocala), a home

mortgage warehousing facility, resulting in the loss of plaintiffs’ investment in Ocala. Ocala was a wholly-owned subsidiary of Taylor, Bean & Whitaker Mortgage Corp. (TBW), a home mortgage originator and servicer which is alleged to have committed fraud that led to its eventual bankruptcy. Ocala provided funding for TBW’s mortgage origination activities by issuing notes, the proceeds of which were to be used by TBW to originate home mortgages. Such mortgages and other Ocala assets in turn were pledged to BANA, as collateral agent, to secure the notes. Plaintiffs lost most or all of their investment in Ocala when, as the result of the alleged fraud committed by TBW, Ocala was unable to repay the notes purchased by plaintiffs and there was insufficient collateral to satisfy Ocala’s debt obligations. Plaintiffs allege that BANA breached its contractual, fiduciary and other duties to Ocala, thereby permitting TBW’s alleged fraud to go undetected. Plaintiffs seek compensatory damages and other relief from BANA, including interest and attorneys’ fees, in an unspecified amount, but which plaintiffs allege exceeds $1.6 billion. BANA’s motions to dismiss these actions are currently pending.
On August 30, 2010, plaintiffs each filed a new lawsuit (the 2010 Actions) against BANA in the U.S. District Court for the Southern District of Florida entitledBNP Paribas Mortgage Corporation et al.v. Bank of America, N.A.andDeutsche Bank AG v. Bank of America, N.A., which the parties agreed to transfer to the U.S. District Court for the Southern District of New York as related to the 2009 Actions. The 2010 Actions assert an alternative theory for plaintiffs to recover a portion of their Ocala losses from BANA. Plaintiffs allege that BANA’s commercial division purchased from TBW participation interests in pools of mortgage loans that allegedly included loans that were already pledged as collateral for plaintiffs’ Ocala notes. Plaintiffs allege that the purchase of these participation interests constituted conversion of the underlying mortgage loans and that BANA is thus required to reimburse plaintiffs for the value of these loans. Plaintiffs seek compensatory and other damages, interest and attorneys’ fees in amounts that are unspecified but which plaintiffs allege exceed approximately $665 million, representing a portion of the same losses alleged in the 2009 Actions. BANA’s motion to dismiss the 2010 Actions was argued in the U.S. District Court for the Southern District of New York on January 26, 2011.
On October 1, 2010, BANA, on behalf of Ocala’s investors, filed suit in the U.S. District Court for the District of Massachusetts.Columbia against the Federal Deposit Insurance Corporation (FDIC) as receiver of Colonial Bank (TBW’s primary bank) and Platinum Community Bank (a wholly-owned subsidiary of TBW) entitledBank of America, National Association as indenture trustee, custodian and collateral agent for Ocala Funding, LLC v. Federal Deposit Insurance Corporation. The actions variouslysuit seeks judicial review of the FDIC’s denial of the administrative claims brought by BANA, on behalf of Ocala, in the FDIC’s Colonial and Platinum receivership proceedings. BANA’s claims allege violationsthat Ocala’s losses were in whole or in part the result of federalColonial’s and state securities lawsPlatinum’s participation in TBW’s alleged fraud. BANA seeks a court order requiring the FDIC to allow BANA’s claims in an amount equal to Ocala’s losses and, state common law,accordingly, to permit BANA, as trustee, collateral agent, custodian and seek rescission and unspecified damages based upondepositary for Ocala, to share appropriately in distributions of any receivership assets that the Corporation’s and related entities’ alleged roles in certain private placement offerings issued by Parmalat-related companies. The plaintiffs seek rescission and unspecified damages resulting from alleged purchasesFDIC makes to creditors of approximately $305 million in private placement instruments.the two failed banks.
Parmalat

On November 23, 2005, the Official Liquidators of Food Holdings Limited and Dairy Holdings Limited, two entities in liquidation proceedings in the Cayman Islands, filed a complaint in the U.S. District Court for the Southern District of New York, entitledFood Holdings Ltd, et al. v. Bank of America Corp., et al.(the Food Holdings Action), in the U.S. District Court for the Southern District of New York against the Corporation and several related entities. The complaint in the Food Holdings Action allegesPlaintiffs allege that the Corporation and other defendants conspired with Parmalat, which was admitted to insolvency proceedings in Italy in December 2003, in carrying out transactions involving the plaintiffs in connection with the funding of Parmalat’s Brazilian entities, and assertsentities. Plaintiffs assert claims for fraud, negligent misrepresentation, breach of fiduciary duty and other related claims. The complaint


204     Bank of America 2010


seeks in excess of $400 million in compensatory damages and interest, among other relief. A bench trial was held the week of September 14, 2009. On February 17, 2010, the District Court issued an Opinion and Order dismissingcourt dismissed all of theplaintiffs’ claims.

Pender Litigation

The Corporation is On March 18, 2010, plaintiffs filed a defendant in a putative class action entitledWilliam L. Pender, et al. v. Banknotice of America Corporation, et al.(formerly captioned Anita Pothier, et al. v. Bank of America Corporation, et al.), which is pending inappeal to the U.S. District Court of Appeals for the Western DistrictSecond Circuit and on April 1, 2010, the Corporation filed a cross-appeal. Briefing was completed in December 2010.

NOTE 15 Shareholders’ Equity
Common Stock
In October 2010, July 2010, April 2010 and January 2010, the Board declared the fourth, third, second and first quarters’ cash dividends of North Carolina. The action, filed$0.01 per common share, which were paid on December 24, 2010, September 24, 2010, June 30, 2004, is brought25, 2010 and March 26, 2010 to common shareholders of record on behalf of participants in or beneficiaries of The Bank of America Pension Plan (formerly known as the NationsBank Cash Balance Plan)December 3, 2010, September 3, 2010, June 4, 2010 and The Bank of America 401(k) Plan (formerly known as the NationsBank 401(k) Plan). The Corporation, BANA, The Bank of America Pension Plan, The Bank of America 401(k) Plan, the Bank of America Corporation Corporate Benefits Committee and various members thereof, and PricewaterhouseCoopers LLP are defendants. The complaint alleges violations of ERISA, including that the design of The Bank of America Pension Plan violated ERISA’s defined benefit pension plan standards and that such plan’s definition of normal retirement age is invalid.March 5, 2010, respectively. In addition, in January 2011, the complaint alleges age discrimination by The BankBoard declared a first quarter cash dividend of America Pension Plan, unlawful lump sum benefit calculation, violation$0.01 per common share payable on March 25, 2011 to common shareholders of ERISA’s “anti-backloading” rule, that certain voluntary transfersrecord on March 4, 2011.
On February 23, 2010, the Corporation held a special meeting of assets by participants in The Bankstockholders at which it obtained shareholder approval of America 401(k) Planan amendment to The Bankthe Corporation’s amended and restated certificate of America Pension Plan violated ERISA,incorporation to increase the number of authorized shares of common stock from 10.0 billion to 11.3 billion. On April 28, 2010, at the Corporation’s 2010 Annual Meeting of Stockholders, the Corporation obtained shareholder approval of an amendment to the Corporation’s amended and other related claims. The complaint alleges that plan participants are entitledrestated certificate of incorporation to greater benefits and seeks declaratory relief, monetary relief in an unspecified amount, equitable relief, including an order reforming The Bankincrease the number of America Pension Plan, attorneys’ fees and interest. On September 26, 2005, the bank defendants filed a motionauthorized shares of common stock from 11.3 billion to dismiss. On December 1, 2005, the plaintiffs moved to certify classes consisting of, among others, (i) all persons who accrued or who are currently accruing benefits under The Bank of America Pension Plan and (ii) all persons who elected to have amounts representing their account balances under The Bank of America 401(k) Plan transferred to The Bank of America Pension Plan.

12.8 billion.

170Bank of America 2009


NOTE 15 – Shareholders’ Equity and Earnings Per Common Share

Common Stock

In January 2009, the Corporation issued 1.4 billion shares of common stock in connection with its acquisition of Merrill Lynch. For additional information regarding the Merrill Lynch acquisition, seeNote 2 – Merger and Restructuring Activity. During 2009 and 2008, in connection with preferred stock issuances to the U.S. government under TARP,the Troubled Asset Relief Program (TARP), the Corporation issued warrants to purchase 121.8 million shares of common stock at an exercise price of $30.79 per share and 150.4 million shares of common stock at an exercise price of $13.30 per share. The U.S. Treasury recently announced its intention to auction, duringauctioned these warrants in March 2010, these warrants.

During the second quarter of2010.

In May 2009, the Corporation issued 1.251.3 billion shares of its common stock at an average price of $10.77 per share through anat-the-market issuance program resulting in gross proceeds of approximately $13.5 billion.

The

Through a 2008 authorized share repurchase program, the Corporation mayhad the ability to repurchase shares of its common stock, subject to certain restrictions, from time to time, in the open market or in private transactions through the Corporation’s approvedtransactions. The 2008 authorized repurchase program expired on January 23, 2010. There is no existing Board authorized share repurchase program. In 2009,2010, the Corporation did not repurchase any shares of common stock and issued approximately 7.498.6 million shares under employee stock plans. At December 31, 2009,2010, the Corporation had reserved 1.31.5 billion unissued shares of unissued common sharesstock for future issuances.issuances under employee stock plans, common stock warrants, convertible notes and preferred stock.
Preferred Stock
During 2010, 2009 and 2008, the aggregate dividends declared on preferred stock were $1.4 billion, $4.5 billion and $1.3 billion, respectively. This included $474 million and $536 million in 2010 and 2009 related to preferred stock issued or remaining outstanding as a part of the Merrill Lynch acquisition.

In connection with the Merrill Lynch acquisition, Merrill Lynch non-convertible preferred shareholders received Bank of America Corporation preferred stock having substantially identical terms. On October 15, 2010, all of the outstanding shares of the mandatory convertible preferred stock of Merrill Lynch automatically converted into an aggregate of 50 million shares of the Corporation’s Common Stock in accordance with the terms of these preferred securities.
In October 2009,2008, in connection with TARP, the Board declared a fourth quarter cash dividend of $0.01 per common share which was paid on December 24, 2009Corporation issued to

common shareholders of record on December 4, 2009. In July 2009, the Board declared a third quarter cash dividend of $0.01 per common share which was paid on September 25, 2009 to common shareholders of record on September 4, 2009. In April 2009, the Board declared a second quarter cash dividend of $0.01 per common share which was paid on June 26, 2009 to shareholders of record on June 5, 2009. In January 2009, the Board declared a first quarter cash dividend of $0.01 per common share which was paid on March 27, 2009 to shareholders of record on March 6, 2009.

U.S. Treasury non-voting perpetual preferred stock and warrants for $15.0 billion. In addition, in January 2009, in connection with TARP and the Merrill Lynch acquisition, the Corporation issued additional preferred stock for $30.0 billion.

In December 2009, the Corporation repurchased the non-voting perpetual preferred stock previously issued to the U.S. Treasury (TARP Preferred Stock) through the use of $25.7 billion in excess liquidity and $19.3 billion in proceeds from the sale of 1.3 billion Common Equivalent Securities (CES) valued at $15.00 per unit. The CES consisted of depositary shares representing interests in shares of Common Equivalent Junior Preferred Stock, Series S (Common Equivalent Stock) and contingent warrants to purchase an aggregate of 60 million shares of the Corporation’s common stock. On February 23, 2010, the Board declaredCorporation held a regular quarterly cash dividend onspecial meeting of stockholders at which it obtained shareholder approval of an amendment to the Corporation’s amended and restated certificate of incorporation to increase the number of authorized shares of common stock. Accordingly, the Common Equivalent Stock automatically converted in full into 1.286 billion shares of common stock of $0.01 per share, payable on March 26, 2010February 24, 2010. In addition, as a result, the contingent warrants expired without having become exercisable and the CES ceased to common shareholders of record on March 5, 2010.

Preferred Stock

exist.

During 2009, the Corporation entered into agreements with certain holders of non-government perpetual preferred stock to exchange their holdings of approximately $7.3 billion aggregate liquidation preference, before third-party issuance costs, of approximately 323 million shares of perpetual preferred stock for approximately 545 million shares of common stock.stock with a fair value of stock issued of $6.1 billion. In addition, the Corporation exchanged approximately $3.9 billion aggregate liquidation preference, before third-party issuance costs, of approximately 144 million shares of non-government preferred stock for approximately 200 million shares of common stock in an exchange offer.offer with a fair value of stock issued of $2.5 billion. In total, these exchanges resulted in the exchange of approximately $11.3 billion aggregate liquidation preference, before third-party issuance costs, of approximately 467 million shares of preferred stock into approximately 745 million shares of common stock. The table below provides further detail on the non-convertible perpetual preferred stock exchanges.

with a fair value of stock issued of $8.6 billion.

(Dollars in millions, actual shares)

Series

 Preferred
Shares
Exchanged
    Carrying
Value(1)
    Common
Shares Issued
    Fair Value
of Stock
Issued

Negotiated Exchanges


Series K

 173,298    $4,332    328,193,964    $3,635

Series M

 102,643     2,566    192,970,068     2,178

Series 4

 7,024     211    11,642,232     131

Series D

 6,566     164    10,104,798     114

Series 7

 33,404     33    2,069,047     23

Total Negotiated Exchanges

 322,935     7,306    544,980,109     6,081

Exchange Offer


Series E

 61,509     1,538    78,670,451     1,003

Series 5

 29,810     894    45,753,525     583

Series 1

 16,139     484    22,866,796     292

Series 2

 19,453     584    27,562,975     351

Series 3

 4,664     140    7,490,194     95

Series I

 7,416     185    10,215,305     130

Series J

 2,289     57    3,378,098     43

Series H

 2,517     63    4,062,655     52

Total Exchange Offer

 143,797     3,945    199,999,999     2,549

Total Preferred Exchanges

 466,732    $11,251    744,980,108    $8,630
(1)

Amounts shown are before third party issuance costs.

During 2009, inIn addition, to the exchanges detailed in the table above,during 2009, the Corporation exchanged 3.6 million shares, or $3.6 billion aggregate liquidation preference of Series L 7.25% Non-Cumulative Perpetual Convertible Preferred Stock into 255 million shares of common stock valued at $2.8 billion, which was accounted for as an induced conversion of preferred stock.

As a result of the exchange,these exchanges, the Corporation recorded an increase to retained earnings and net income (loss) applicable to common shareholders of approximately $580$576 million. This represents the net of a $2.62 billion benefit due to the excess of the carrying value of the Corporation’s non-convertible preferred stock over the fair value of the common stock

exchanged. This was partially offset by a $2.04 billion inducement representing the excess of the fair value of the common stock exchanged over the fair value of the common stock that would have been issued under the original conversion terms.

In connection with the Merrill Lynch acquisition, Merrill Lynch non-convertible preferred shareholders received


Bank of America Corporation preferred stock having substantially identical terms. Merrill Lynch convertible preferred stock remains outstanding and is now convertible into Bank of America common stock at an exchange ratio equivalent to the exchange ratio for Merrill Lynch common stock in connection with the acquisition.

2010     
205

Bank of America 2009171


The following table below presents a summary of perpetual preferred stock previously issued by the Corporation and remaining outstanding, (includingincluding the series of preferred stock issued and remaining outstanding in connection with the acquisition of Merrill Lynch),Lynch, after consideration of the exchanges discussed on the previous page.

Preferred Stock Summary

(Dollars in millions, except as noted)

Series


Description

    Initial
Issuance
Date
    Total
Shares
Outstanding
    Liquidation
Preference
per Share
(in dollars)
    Carrying
Value(1)
    

Per Annum

Dividend Rate

  Redemption Period

Series B(2)

 7% Cumulative
Redeemable
    

June

1997

    7,571    $100    $1    7.00%  n/a

Series D(3, 9)

 6.204% Non-
Cumulative
    

September

2006

    26,434     25,000     661    6.204%  

On or after

September 14, 2011

Series E(3, 9)

 Floating Rate
Non-Cumulative
    

November

2006

    19,491     25,000     487    Annual rate equal to the greater of (a) 3-mo. LIBOR + 35 bps and (b) 4.00%  On or after November 15, 2011

Series H(3, 9)

 8.20% Non-
Cumulative
    

May

2008

    114,483     25,000     2,862    8.20%  

On or after

May 1, 2013

Series I(3, 9)

 6.625% Non-
Cumulative
    

September

2007

    14,584     25,000     365    6.625%  

On or after

October 1, 2017

Series J(3, 9)

 7.25% Non-
Cumulative
    

November

2007

    39,111     25,000     978    7.25%  On or after November 1, 2012

Series K(3,10)

 Fixed-to-Floating
Rate Non-
Cumulative
    

January

2008

    66,702     25,000     1,668    8.00% through 1/29/18; 3-mo. LIBOR + 363 bps thereafter  On or after
January 30, 2018

Series L

 7.25% Non-
Cumulative
Perpetual
Convertible
    

January

2008

    3,349,321     1,000     3,349    7.25%  n/a

Series M(3, 10)

 Fixed-to-Floating
Rate Non-
Cumulative
    

April

2008

    57,357     25,000     1,434    8.125% through 5/14/18; 3-mo. LIBOR + 364 bps thereafter  On or after
May 15, 2018

Series S

 Common
Equivalent Stock
    December 2009    1,286,000     15,000     19,290    Same as dividend per common share  n/a

Series 1(3, 4)

 Floating Rate
Non-Cumulative
    November 2004    4,861     30,000     146    3-mo LIBOR + 75 bps(5)  On or after November 28, 2009

Series 2(3, 4)

 Floating Rate
Non-Cumulative
    

March

2005

    17,547     30,000     526    3-mo LIBOR + 65 bps(5)  On or after November 28, 2009

Series 3(3, 4)

 6.375% Non-
Cumulative
    November 2005    22,336     30,000     670    6.375%  On or after November 28, 2010

Series 4(3, 4)

 Floating Rate
Non-Cumulative
    November 2005    12,976     30,000     389    3-mo LIBOR + 75 bps(6)  On or after November 28, 2010

Series 5(3, 4)

 Floating Rate
Non-Cumulative
    

March

2007

    20,190     30,000     606    3-mo LIBOR + 50 bps(6)  

On or after

May 21, 2012

Series 6(3, 7)

 6.70% Non-
Cumulative
Perpetual
    September 2007    65,000     1,000     65    6.70%  On or after February 03, 2009

Series 7(3, 7)

 6.25% Non-
Cumulative
Perpetual
    September 2007    16,596     1,000     17    6.25%  

On or after

March 18, 2010

Series 8(3, 4)

 8.625% Non-
Cumulative
    

April

2008

    89,100     30,000     2,673    8.625%  

On or after

May 28, 2013

Series 2

(MC)(3, 8)

 9.00% Non-Voting
Mandatory
Convertible Non-
Cumulative
    

July

2008

    12,000     100,000     1,200    9.00%  On October 15, 2010

Series 3

(MC)(3, 8)

 9.00% Non-Voting
Mandatory
Convertible Non-
Cumulative
    

July

2008

    5,000     100,000     500    9.00%  On October 15, 2010

Total

           5,246,660          $37,887        
                       
         Liquidation
         
    Initial
 Total
  Preference
         
(Dollars in millions, except as noted) Issuance
 Shares
  per Share
  Carrying
  Per Annum
   
Series Description Date Outstanding  (in dollars)  Value (1)  Dividend Rate  Redemption Period
Series B (2)
 7% Cumulative Redeemable June
1997
  7,571  $100  $1   7.00% n/a
                       
Series D(3, 8)
 6.204% Non-Cumulative September
2006
  26,434   25,000   661   6.20% On or after
September 14, 2011
                       
Series E(3, 8)
 Floating Rate Non-Cumulative November
2006
  19,491   25,000   487   Annual rate equal to the greater of (a)3-mo. LIBOR + 35 bps and (b) 4.00% On or after
November 15, 2011
                       
Series H(3, 8)
 8.20% Non-Cumulative May
2008
  114,483   25,000   2,862   8.20% On or after
May 1, 2013
                       
Series I(3, 8)
 6.625% Non-Cumulative September
2007
  14,584   25,000   365   6.625% On or after
October 1, 2017
                       
Series J(3, 8)
 7.25% Non-Cumulative November
2007
  39,111   25,000   978   7.25% On or after
November 1, 2012
                       
Series K(3, 9)
 Fixed-to-Floating Rate Non-Cumulative January
2008
  66,702   25,000   1,668   8.00% through 1/29/18;3-mo. LIBOR + 363 bps thereafter  On or after
January 30, 2018
                       
Series L 7.25% Non-Cumulative Perpetual Convertible January
2008
  3,349,321   1,000   3,349   7.25%  n/a
                       
Series M(3, 9)
 Fixed-to-Floating Rate Non-Cumulative April
2008
  57,357   25,000   1,434   8.125% through 5/14/18;
3-mo. LIBOR + 364 bps thereafter
  On or after
May 15, 2018
                       
Series 1(3, 4)
 Floating Rate Non-Cumulative November
2004
  4,861   30,000   146   3-mo. LIBOR + 75 bps (5) On or after
November 28, 2009
                       
Series 2(3, 4)
 Floating Rate Non-Cumulative March
2005
  17,547   30,000   526   3-mo. LIBOR + 65 bps (5) On or after
November 28, 2009
                       
Series 3(3, 4)
 6.375% Non-Cumulative November
2005
  22,336   30,000   670   6.375% On or after
November 28, 2010
                       
Series 4(3, 4)
 Floating Rate Non-Cumulative November
2005
  12,976   30,000   389   3-mo. LIBOR + 75 bps (6) On or after
November 28, 2010
                       
Series 5(3, 4)
 Floating Rate Non-Cumulative March
2007
  20,190   30,000   606   3-mo. LIBOR + 50 bps (6) On or after
May 21, 2012
                       
Series 6(3, 7)
 6.70% Non-Cumulative Perpetual September
2007
  65,000   1,000   65   6.70% On or after
February 3, 2009
                       
Series 7(3, 7)
 6.25% Non-Cumulative Perpetual September
2007
  16,596   1,000   17   6.25% On or after
March 18, 2010
                       
Series 8(3, 4)
 8.625% Non-Cumulative April
2008
  89,100   30,000   2,673   8.625% On or after
May 28, 2013
                       
Total
      3,943,660      $16,897       
                       
(1)

Amounts shown are before third partythird-party issuance costs and other Merrill Lynch purchase accounting related adjustments of $679$335 million.

(2)

Series B Preferred Stock does not have early redemption/call rights.

(3)

The Corporation may redeem series of preferred stock on or after the redemption date, in whole or in part, at its option, at the liquidation preference plus declared and unpaid dividends.

(4)

Ownership is held in the form of depositary shares, each representing a 1/1200th1200th interest in a share of preferred stock, paying a quarterly cash dividend, if and when declared.

(5)

Subject to 3.00% minimum rate per annum.

(6)

Subject to 4.00% minimum rate per annum.

(7)

Ownership is held in the form of depositary shares, each representing a 1/40th40th interest in a share of preferred stock, paying a quarterly cash dividend, if and when declared.

(8)

Represents shares outstanding of Merrill Lynch & Co., Inc. Each share of Mandatory Convertible Preferred Stock Series 2 and Series 3 will be converted on October 15, 2010 into a maximum of 2,605 and 3,820 shares of the Corporation’s common stock plus cash in lieu of fractional shares and are optionally convertible prior to that time into 2,227 and 3,265 shares.

(9)

Ownership is held in the form of depositary shares, each representing a 1/1000th1000th interest in a share of preferred stock, paying a quarterly cash dividend, if and when declared.

(10)(9)

Ownership is held in the form of depositary shares, each representing a 1/25th25th interest in a share of preferred stock, paying a semi-annual cash dividend, if and when declared, until the redemption date adjusts to a quarterly cash dividend, if and when declared, thereafter.

n/a = not applicable

172Bank of America 2009
206     Bank of America 2010


Series L Preferred Stock does not have early redemption/call rights. Each share of the Series L Preferred Stock may be converted at any time, at the option of the holder, into 20 shares of the Corporation’s common stock plus cash in lieu of fractional shares. On or after January 30, 2013, the Corporation may cause some or all of the Series L Preferred Stock, at its option, at any time or from time to time, to be converted into shares of common stock at the then-applicable conversion rate if, for 20 trading days during any period of 30 consecutive trading days, the closing price of common stock exceeds 130 percent of the then-applicable conversion price of the Series L Preferred Stock. If the Corporation exercises its rights to cause the automatic conversion of Series L Preferred Stock on January 30, 2013, it will still pay any accrued dividends payable on January 30, 2013 to the applicable holders of record.

Common Equivalent Junior Preferred Stock Series S (Common Equivalent Stock) does not have early redemption/call rights. Each share of the Common Equivalent Stock is automatically convertible into 1,000 shares of the Corporation’s common stock following effectiveness of an amendment to the Corporation’s certificate of incorporation to increase the amount of authorized common stock. Ownership of the Common Equivalent Stock is held in the form of depositary shares each representing a 1/1000th interest in a share of preferred stock, paying cash dividends, on an as converted basis, with the Corporation’s common stock, if and when declared. In certain circumstances following the failure of the Corporation’s stockholders to approve the amendment to the certificate of incorporation, the Common Equivalent Stock will partially convert into common stock, the liquidation preference per share will be proportionally reduced, and the shares will be entitled to additional quarterly cash dividends, if and when declared.

All series of preferred stock inon the previous tablepage have a par value of $0.01 per share. The shares of the series of preferred stock aboveshare, are not subject to the operation of a sinking fund, and other than the right of the Series S Preferred Stock to participate in certain common dividends and liquidating distributions, have no participation rights. Withrights, and with the exception of the Series L Preferred Stock, Common Equivalent Stock, and Mandatory Convertible Preferred Stock Series 2 and 3, the shares of the series of preferred stock in the previous table are

not convertible. The holders of the Series B Preferred Stock Common Equivalent Stock andSeries 1-8 Preferred Stock have general voting rights, and the holders of the other series included inon the previous tablepage have no general voting rights. All preferred stock of the Corporation outstanding has preference over the Corporation’s common stock with respect to the payment of dividends and distribution of the Corporation’s assets in the event of a liquidation or dissolution except the Series S, which ranks equally with the common stock in certain circumstances.dissolution. If any dividend payable on these series is in arrears for three or more semi-annual or six or more quarterly dividend periods, as applicable (whether consecutive or not), the holders of these series and any other class or series of preferred stock ranking equally as to payment of dividends and upon which equivalent voting

rights have been conferred and are exercisable (voting as a single class) will be entitled to vote for the election of two additional directors. These voting rights terminate when the Corporation has paid in full dividends on these series for at least two semi-annual or four quarterly dividend periods, as applicable, following the dividend arrearage.

In October 2008, in connection with TARP, the Corporation issued to the U.S. Treasury non-voting perpetual preferred stock and warrants for $15.0 billion. In addition, in January 2009, in connection with TARP and the Merrill Lynch acquisition, the Corporation issued additional preferred stock for $30.0 billion. On December 2, 2009, the Corporation received approval from the U.S. Treasury and Federal Reserve to repay the U.S. government’s $45.0 billion preferred stock investment provided under TARP. In accordance with the authorization, on December 9, 2009, the Corporation repurchased all outstanding shares of Fixed-Rate Cumulative Perpetual Preferred Stock Series N, Series Q and Series R preferred stock (collectively, TARP Preferred Stock) previously issued to the U.S. Treasury. The U.S. Treasury recently announced its intention to auction, during March 2010, the common stock warrants the Corporation issued in connection with the sale of the TARP Preferred Stock.

The Corporation repurchased the TARP Preferred Stock through use of $25.7 billion in excess liquidity and $19.2 billion in proceeds from the sale of 1.3 billion Common Equivalent Securities (CES) valued at $15.00 per unit. The Common Equivalent Securities consist of depositary shares representing interests in shares of Common Equivalent Stock, and warrants (Contingent Warrants) to purchase an aggregate of 60 million shares of the Corporation’s common stock. Each CES consisted of one depositary share representing a 1/1000th interest in a share of Common Equivalent Stock and each Contingent Warrant granted the holder the right to purchase 0.0467 of a share of a common stock for $0.01 per share. Each depositary share entitled the holder, through the depository to a proportional fractional interest in all rights and preferences of the Common Equivalent Stock, including conversion, dividend, liquidation and voting rights.

The Corporation held a special meeting of stockholders on February 23, 2010 at which it obtained stockholder approval of an amendment to the amended and restated certificate of incorporation to increase the number of authorized shares of common stock, and accordingly the Common Equivalent Stock automatically converted in full into 1.286 billion shares of common stock on February 24, 2010 following the filing of the amendment with the Delaware Secretary of State on February 23, 2010. In addition, as a result, the Contingent Warrants expired without having become exercisable and the CES ceased to exist.

During 2009, 2008 and 2007, the aggregate dividends declared on preferred stock were $4.5 billion, $1.3 billion and $182 million, respectively. This included $536 million in 2009 related to preferred stock issued or remaining outstanding as a part of the Merrill Lynch acquisition.


Bank of America 2009173


NOTE 16 Accumulated OCIOther Comprehensive Income

The following table below presents the changes in accumulated OCI forin 2008, 2009 2008 and 2007, 2010,net-of-tax.

(Dollars in millions) Available-for-
Sale Debt
Securities
   Available-for-
Sale Marketable
Equity Securities
   Derivatives   

Employee

Benefit Plans (1)


Foreign

Currency (2)

   Total 

Balance, December 31, 2008

 $(5,956  $3,935    $(3,458  $(4,642  $(704  $(10,825

Cumulative adjustment for accounting change – OTTI(3)

  (71                       (71

Net change in fair value recorded in accumulated OCI

  6,364     2,651     197     318     211     9,741  

Net realized (gains) losses reclassified into earnings

  (965   (4,457   726     232          (4,464

Balance, December 31, 2009

 $(628  $2,129    $(2,535  $(4,092  $(493  $(5,619

Balance, December 31, 2007

 $(1,880  $8,416    $(4,402  $(1,301  $296    $1,129  

Net change in fair value recorded in accumulated OCI(4)

  (5,496   (4,858   104     (3,387   (1,000   (14,637

Net realized losses reclassified into earnings

  1,420     377     840     46          2,683  

Balance, December 31, 2008

 $(5,956  $3,935    $(3,458  $(4,642  $(704  $(10,825

Balance, December 31, 2006

 $(3,117  $384    $(3,697  $(1,428  $147    $(7,711

Net change in fair value recorded in accumulated OCI

  1,100     8,316     (1,252   4     142     8,310  

Net realized losses reclassified into earnings

  137     (284   547     123     7     530  

Balance, December 31, 2007

 $(1,880  $8,416    $(4,402  $(1,301  $296    $1,129  
                         
  Available-for-
  Available-for-
             
  Sale Debt
  Sale Marketable
     Employee
  Foreign
    
(Dollars in millions) Securities  Equity Securities  Derivatives  Benefit Plans (1)  Currency (2)  Total 
Balance, December 31, 2007
 $(1,880) $8,416  $(4,402) $(1,301) $296  $1,129 
Net change in fair value recorded in accumulated OCI (3)
  (5,496)  (4,858)  147   (3,387)  (1,000)  (14,594)
Net realized losses reclassified into earnings  1,420   377   797   46      2,640 
                         
Balance, December 31, 2008
 $(5,956) $3,935  $(3,458) $(4,642) $(704) $(10,825)
                         
Cumulative adjustment for accounting change – OTTI (4)
  (71)              (71)
Net change in fair value recorded in accumulated OCI  6,364   2,651   153   318   211   9,697 
Net realized (gains) losses reclassified into earnings  (965)  (4,457)  770   232      (4,420)
                         
Balance, December 31, 2009
 $(628) $2,129  $(2,535) $(4,092) $(493) $(5,619)
                         
Cumulative adjustments for accounting changes:                        
Consolidation of certain variable interest entities  (116)              (116)
Credit-related notes  229               229 
Net change in fair value recorded in accumulated OCI  2,210   5,657   (1,108)  (104)  (44)  6,611 
Net realized (gains) losses reclassified into earnings  (981)  (1,127)  407   249   281   (1,171)
                         
Balance, December 31, 2010
 $714  $6,659  $(3,236) $(3,947) $(256) $(66)
                         
(1)

Net change in fair value represents after-tax adjustments based on the final year-end actuarial valuations.

(2)

Net change in fair value represents only the impact of changes in spot foreign exchange rates on the Corporation’s net investment in foreign operations.

non-U.S. operations and related hedges.
(3)

For more information on employee benefit plans, seeNote 19 – Employee Benefit Plans.
(4)Effective January 1, 2009, the Corporation adopted new accounting guidance on the recognition of other-than-temporary impairmentOTTI losses on debt securities. For additional information on the adoption of this accounting guidance, seeNote 1 – Summary of Significant Accounting PrinciplesandNote 5 – SecuritiesSecurities..

(4)

For more information on employee benefit plans, seeNote

Bank of America 2010     207


NOTE 17 – Employee Benefit Plans.

Earnings Per Common Share

On January 1,

The calculation of EPS and diluted EPS for 2010, 2009 the Corporation adopted new accounting guidance on EPS which defines unvested share-based payment awards that contain nonforfeitable rights to dividends as participating securities that are included in computing EPS using the two-class method. Prior period EPS amounts have been reclassified to conform to current period presentation.and 2008 is presented below. SeeNote 1  Summary of Significant Accounting Principlesfor additional information.information on the calculation of EPS.
             
(Dollars in millions, except per share information; shares in thousands) 2010  2009  2008 
Earnings (loss) per common share
            
Net income (loss) $(2,238) $6,276  $4,008 
Preferred stock dividends  (1,357)  (4,494)  (1,452)
Accelerated accretion from redemption of preferred stock issued to the U.S. Treasury     (3,986)   
             
Net income (loss) applicable to common shareholders  (3,595)  (2,204)  2,556 
Dividends and undistributed earnings allocated to participating securities  (4)  (6)  (69)
             
Net income (loss) allocated to common shareholders $(3,599) $(2,210) $2,487 
             
Average common shares issued and outstanding  9,790,472   7,728,570   4,592,085 
             
Earnings (loss) per common share
 $(0.37) $(0.29) $0.54 
             
Diluted earnings (loss) per common share
            
Net income (loss) applicable to common shareholders $(3,595) $(2,204) $2,556 
Dividends and undistributed earnings allocated to participating securities  (4)  (6)  (69)
             
Net income (loss) allocated to common shareholders $(3,599) $(2,210) $2,487 
             
Average common shares issued and outstanding  9,790,472   7,728,570   4,592,085 
Dilutive potential common shares (1)
        4,343 
             
Total diluted average common shares issued and outstanding  9,790,472   7,728,570   4,596,428 
             
Diluted earnings (loss) per common share
 $(0.37) $(0.29) $0.54 
             
(1)Includes incremental shares from RSUs, restricted stock shares, stock options and warrants.

Due to the net loss applicable to common shareholders for 2010 and 2009, no dilutive potential common shares were included in the calculation of diluted EPS because they would have been antidilutive.
For 2010, 2009 2008 and 2007,2008, average options to purchase 271 million, 315 million 181 million and 28181 million shares, respectively, of common stock were outstanding but not included in the computation of earnings per common shareEPS because they were antidilutive under the treasury stock method. For 2010 and 2009, average warrants to purchase 272 million and 265 million shares of common stock were outstanding but not included in the computation of EPS because they were antidilutive under the treasury stock method. For 2010 and 2009, 107 million and 147 million average dilutive potential common shares associated with the convertible Series L Preferred Stock, and Mandatory Convertiblethe mandatory convertible Preferred Stock Series 2 and Series 3 of Merrill Lynch were excluded from the diluted

share count because the result would have been antidilutive under the “if-converted” method. For 2009, 81 million average dilutive potential dilutive common shares associated with the Common Equivalent SecuritiesCES were also excluded from the diluted share count because the result would have been antidilutive under the “if-converted” method. For 2009, average warrants to purchase 265 million shares of common stock were outstanding but not included in the computation of earnings per common share because they were antidilutive under the treasury stock method. For 2008, 128 million average dilutive potential common shares associated with the convertible Series L Preferred Stock issued in January 2008 were excluded from the diluted share count because the result would have been antidilutive under the “if-converted” method.

For purposes of computing basic EPS, CES were considered to be participating securities prior to February 24, 2010, however, due to a net loss for 2010, CES were not allocated earnings. The two-class method prohibits the allocation of an undistributed loss to participating securities. For purposes of computing diluted EPS, there was no dilutive effect of the CES, which were outstanding prior to February 24, 2010, due to a net loss for 2010.
For 2009, as a result of repurchasing the TARP Preferred Stock, the Corporation accelerated the remaining accretion of the issuance discount on the TARP Preferred Stock of $4.0 billion and recorded a corresponding charge to retained earnings and income (loss) applicable to common shareholders in the calculation of earnings per common share and diluted earnings per common shareshare. In addition, in 2009, the Corporation recorded an increase to retained earnings and net income (loss) available to common shareholders of $576 million related to the Corporation’s preferred stock exchange for 2009, 2008 and 2007 is presented below.

common stock.

(Dollars in millions, except per share information; shares in thousands) 2009     2008   2007 

Earnings (loss) per common share


Net income

 $6,276      $4,008    $14,982  

Preferred stock dividends

  (4,494     (1,452   (182

Accelerated accretion from redemption of preferred stock issued to the U.S. Treasury

  (3,986            

Net income (loss) applicable to common shareholders

 $(2,204    $2,556    $14,800  

Income (loss) allocated to participating securities

  (6     (69   (108

Net income (loss) allocated to common shareholders

 $(2,210    $2,487    $14,692  

Average common shares issued and outstanding

  7,728,570       4,592,085     4,423,579  

Earnings (loss) per common share

 $(0.29    $0.54    $3.32  

Diluted earnings (loss) per common share


Net income (loss) applicable to common shareholders(1)

 $(2,204    $2,556    $14,800  

Income (loss) allocated to participating securities

  (6     (69   (108

Net income (loss) allocated to common shareholders

 $(2,210    $2,487    $14,692  

Average common shares issued and outstanding

  7,728,570       4,592,085     4,423,579  

Dilutive potential common shares(2)

         4,343     39,634  

Total diluted average common shares issued and outstanding

  7,728,570       4,596,428     4,463,213  

Diluted earnings (loss) per common share

 $(0.29    $0.54    $3.29  
(1)

For 2009, the Corporation recorded an increase to retained earnings and net income applicable to common shareholders of approximately $580 million related to the Corporation’s preferred stock exchange for common stock.

(2)

Includes incremental shares from restricted stock units, restricted stock shares, stock options and warrants. Due to a net loss applicable to common shareholders for 2009, no dilutive potential common shares were included in the calculations of diluted EPS because they were antidilutive.

174Bank of America 2009


NOTE 16 – 18 Regulatory Requirements and Restrictions

The Federal Reserve requires the Corporation’s banking subsidiaries to maintain reserve balances based on a percentage of certain deposits. Average daily reserve balances required by the Federal Reserve were $12.9 billion and $10.9 billion for 2010 and $7.1 billion for 2009 and 2008.2009. Currency and coin residing in branches and cash vaults (vault cash) are used to partially satisfy the reserve requirement. The average daily reserve balances, in excess of vault cash, held with the Federal Reserve amounted to $5.5 billion and $3.4 billion for 2010 and $133 million for 2009 and 2008.

2009.

The primary sources of funds for cash distributions by the Corporation to its shareholders are dividends received from its banking subsidiaries, Bank of America, N.A. and FIA Card Services, N.A. In 2009,2010, the Corporation received $3.4$4.6 billion in dividends from Bank of America, N.A. In 2010,2011, Bank of America, N.A. and FIA Card Services, N.A. can declare and pay dividends to the Corporation of $1.4$5.8 billion and $0 plus an additional amount equal to their net profits for 2010,2011, as defined by statute, up to the date of any such dividend declaration. The other subsidiary national banks can initiatepay dividends in aggregate dividend payments in 20102011 of $373$53 million plus an additional amount equal to their net profits for 2010,2011, as defined by statute, up to the date of any such dividend declaration. The amount of dividends that each subsidiary bank may declare in a calendar year without approval by the Office of the Comptroller of the Currency (OCC)OCC is the subsidiary bank’s net profits for that year combined with its net retained profits, as defined, for the preceding two years.

The Federal Reserve, OCC, Federal Deposit Insurance Corporation (FDIC)FDIC and Office of Thrift Supervision (collectively, joint agencies) have in place regulatory capital guidelines for U.S. banking organizations. Failure to meet the capital requirements can initiate certain mandatory and discretionary actions by regulators that could have a material effect on the Corporation’s financial position. The regulatory capital guidelines measure capital in relation to the credit and market risks of both on- and off-balance sheet items using various risk weights. Under the regulatory capital guidelines, Total capital consists of three tiers of capital. Tier 1 capital includes qualifying common shareholders’ equity, CES, qualifying noncumulative perpetual preferred stock, qualifying Trust Securities, noncontrolling interestshybrid securities and qualifying preferred stock,non-controlling interests, less goodwill and other adjustments. Tier 2 capital consists of preferred stock not qualifying as Tier 1 capital, mandatorily convertible debt, limited amounts of subordinated debt, other qualifying term debt,a limited portion of the


208     Bank of America 2010


allowance for creditloan and lease losses, up to 1.25 percenta portion of risk-weighted assetsnet unrealized gains on AFS marketable equity securities and other adjustments. Tier 3 capital includes subordinated debt that is unsecured, fully paid, has an original maturity of at least two years, is not redeemable before maturity without prior approval by the Federal Reserve and includes a lock-in clause precluding payment of either interest or principal if the payment would cause the issuing bank’s risk-based capital ratio to fall or remain

below the required minimum. Tier 3 capital can only be used to satisfy the Corporation’s market risk capital requirement and may not be used to support its credit risk requirement. At December 31, 20092010 and 2008,2009, the Corporation had no subordinated debt that qualified as Tier 3 capital.

Certain corporate-sponsored trust companies which issue Trust Securities are not consolidated. In accordance with Federal Reserve guidance, the Federal Reserve allows Trust Securities continue to qualify as Tier 1 capital with revised quantitative limits that will be effective on March 31, 2011. As a result, the Corporation includes Trust Securities in Tier 1 capital. The Financial Reform Act includes a provision under which the Corporation’s previously issued and outstanding Trust Securities in the aggregate amount of $19.9 billion (approximately 137 bps of Tier 1 capital) at December 31, 2010, will no longer qualify as Tier 1 capital effective January 1, 2013. This amount excludes $1.6 billion of hybrid Trust Securities that are expected to be converted to preferred stock prior to the date of implementation. The exclusion of Trust Securities from Tier 1 capital will be phased in incrementally over a three-year phase-in period. The treatment of Trust Securities during the phase-in period remains unclear and is subject to future rulemaking.
Current limits restrict core capital elements to 15 percent of total core capital elements for internationally active bank holding companies. Internationally active bank holding companies are those that have significant activities innon-U.S. markets with consolidated assets greater than $250 billion or on-balance sheetnon-U.S. exposure greater than $10 billion. In addition, the Federal Reserve revised the qualitative standards for capital instruments included in regulatory capital. Internationally active bank holding companies are those that have significant activities in non-U.S. markets with consolidated assets greater than $250 billion or on-balance sheet foreign exposure greater than $10 billion. At December 31, 2009,2010, the Corporation’s restricted core capital elements comprised 11.811.4 percent of total core capital elements. The Corporation is and expects to remain fully compliant with the revised limits prior to the implementation date of March 31, 2011.limits.

To meet minimum, adequately-capitalizedadequately capitalized regulatory requirements, an institution must maintain a Tier 1 capital ratio of four percent and a Total capital ratio of eight percent. A “well-capitalized” institution must generally maintain capital ratios 200 bps higher than the minimum guidelines. The risk-based capital rules have been further supplemented by a Tier 1 leverage ratio, defined as Tier 1 capital divided by adjusted quarterly average total assets, after certain adjustments. “Well-capitalized” bank holding companies must have a minimum Tier 1 leverage ratio of four percent. National banks must maintain a Tier 1 leverage ratio of at least five percent to be classified as “well-capitalized.”

At December 31, 2010, the Corporation’s Tier 1 capital, Total capital and Tier 1 leverage ratios were 11.24 percent, 15.77 percent and 7.21 percent, respectively. This classifies the Corporation as “well-capitalized” for regulatory purposes, the highest classification.

Net unrealized gains (losses)or losses on AFS debt securities net unrealized gains on AFSand marketable equity securities, net unrealized gains (losses)and losses on derivatives, and employee benefit plan adjustments in shareholders’ equity are excluded from the calculations of Tier 1 common capital as discussed below, Tier 1 capital and leverage ratios. The Total capital ratio excludes all of the above with the exception of up to 45 percent of the pre-tax net unrealized pre-tax gains on AFS marketable equity securities.

The Corporation calculates Tier 1 common capital as Tier 1 capital including any CES less preferred stock, qualifying trust preferred securities,Trust Securities, hybrid securities and qualifying noncontrolling interest in subsidiaries. CES iswas included in Tier 1 common capital based upon applicable regulatory guidance and the expectation at December 31, 2009 that the underlying Common Equivalent Junior Preferred Stock, Series S would convert into common stock following shareholder approval of additional authorized shares. Shareholders approved the increase in the number of authorized shares of common stock and the Common Equivalent Stock converted into common stock on February 24, 2010. Tier 1 common capital was $120.4$125.1 billion and $63.3$120.4 billion and the Tier 1 common capital ratio was 7.818.60 percent and 4.807.81 percent at December 31, 20092010 and 2008.

2009.
The table below presents actual and minimum required regulatory capital amounts for 2010 and 2009.


Regulatory Capital
                         
  December 31 
  2010  2009 
  Actual     Actual    
    Minimum
    Minimum
 
(Dollars in millions) Ratio  Amount  Required (1)  Ratio  Amount  Required(1) 
Risk-based capital
                        
Tier 1 common
                        
Bank of America Corporation
  8.60% $125,139   n/a   7.81% $120,394   n/a 
Tier 1
                        
Bank of America Corporation
  11.24   163,626  $58,238   10.40   160,388  $61,676 
Bank of America, N.A.  10.78   114,345   42,416   10.30   111,916   43,472 
FIA Card Services, N.A.  15.30   25,589   6,691   15.21   28,831   7,584 
Total
                        
Bank of America Corporation
  15.77   229,594   116,476   14.66   226,070   123,401 
Bank of America, N.A.  14.26   151,255   84,831   13.76   149,528   86,944 
FIA Card Services, N.A.  16.94   28,343   13,383   17.01   32,244   15,168 
Tier 1 leverage
                        
Bank of America Corporation
  7.21   163,626   90,811   6.88   160,388   93,267 
Bank of America, N.A.  7.83   114,345   58,391   7.38   111,916   60,626 
FIA Card Services, N.A.  13.21   25,589   7,748   23.09   28,831   4,994 
                         
Bank of America 2009175


Regulatory Capital

  December 31
  2009      2008
  Actual    

Minimum

Required (1)

      Actual    

Minimum

Required (1)

(Dollars in millions) Ratio   Amount          Ratio   Amount    

Risk-based capital


Tier 1 common


Bank of America Corporation

 7.81  $120,394     n/a     4.80  $63,339     n/a

Tier 1


Bank of America Corporation

 10.40     160,388    $61,676     9.15     120,814    $52,833

Bank of America, N.A.

 10.30     111,916     43,472     8.51     88,979     41,818

FIA Card Services, N.A.

 15.21     28,831     7,584     13.90     19,573     5,632

Total


Bank of America Corporation

 14.66     226,070     123,401     13.00     171,661     105,666

Bank of America, N.A.

 13.76     149,528     86,944     11.71     122,392     83,635

FIA Card Services, N.A.

 17.01     32,244     15,168     16.25     22,875     11,264

Tier 1 leverage


Bank of America Corporation

 6.91     160,388     92,882     6.44     120,814     56,155

Bank of America, N.A.

 7.38     111,916     60,626     5.94     88,979     44,944

FIA Card Services, N.A.

 23.09     28,831     4,994      14.28     19,573     4,113
(1)

Dollar amount required to meet guidelines for adequately capitalized institutions.

n/a = not applicable
Bank of America 2010     209


Regulatory Capital Developments

In June 2004, the Basel II Accord was published with the intent of more closely aligning regulatory capital requirements with underlying risks, similar to economic capital. While economic capital is measured to cover unexpected losses, the Corporation also manages regulatory capital to adhere to regulatory standards of capital adequacy.
The Basel II Final Rule (Basel II Rules), which was published on December 7, 2007, established requirements for the U.S. implementation and provided detailed capital requirements for a new regulatory capital framework related to credit and operational risk under Pillar 1,(Pillar 1), supervisory requirements under Pillar 2(Pillar 2) and disclosure requirements under Pillar 3.(Pillar 3). The Corporation will beginbegan Basel II parallel implementation during the second quarter ofon April 1, 2010.

In July 2009,

Subsequently, amended rules issued by the Basel Committee on BankingBank Supervision released a consultative document entitled “Revisions to theknown as Basel IIIII were published in December 2010 along with final Market Risk Framework” that would significantly increaseRules issued by the Federal Reserve. The Basel III rules and the Financial Reform Act seek to disqualify trust preferred securities and other hybrid capital requirements for trading book activities if adopted as proposed. The proposal recommended implementation by December 31, 2010, but regulatory agencies have not yet issued a notice of proposed rulemaking, which is required before establishing final rules. As a result, the Corporation cannot determine the implementation date or the final capital impact.

In December 2009, the Basel Committee on Banking Supervision issued a consultative document entitled “Strengthening the Resilience of the Banking Sector.” If adopted as proposed, this could increase significantly the aggregate equity that bank holding companies are required to hold by disqualifying certain instruments that previously have qualified assecurities from Tier 1 capital. In addition,capital treatment with the Financial Reform Act proposing it would increaseto be phased in over a period from 2013 to 2015. Basel III also proposes the leveldeduction of risk-weighted assets. The proposal could also increase the capital charges imposed on certain assets potentially makingfrom capital (deferred tax assets, MSRs, investments in financial firms and pension assets, among others, within prescribed limitations certain businesses more expensiveof which may be significant), increased capital for counterparty credit risk, and three capital buffers to conduct. Regulatory agencies have not opined on the proposal for implementation.strengthen capital levels which would be also phased in over time. The three capital buffers include a capital conservation buffer, a countercyclical buffer and a systematically important financial institution buffer, which would result in a minimum Total capital ratio of at least eight percent by 2013. Market Risk Rules include additional VaR based measurements, among others, that are meant to further strengthen capital levels. The Corporation continues to assessmonitor the development and potential impact of these rules, and has determined that given current initiatives and continued focus on all of these rules by the proposal.

As partdate of the Capital Assistance Program (CAP),full implementation in 2018, the Corporation as well as several other large financial institutions, are subject to the SCAP conducted by the federal regulators. The objective of the SCAP is to assess losses that could occur under certain economic scenarios, including economic conditions more severe than the Corporation currently anticipates. Asmust have a result of the SCAP, in May 2009 federal regulators determined that the Corporation required an additional $33.9 billion of Tier 1 common capital to sustain the most severe economic circum - -

stances assuming a more prolonged and deeper recession over a two-year period than both private and government economists currently project.ratio of seven percent which it anticipates it will meet. The Corporation achieveddoes not expect the increased capital requirement during 2009 through strategic transactions that increased common capital by approximately $39.7 billion which significantly exceeded the SCAP buffer. This included a gain from the sale of shares in CCB, direct sale ofneed to issue any common stock reduced dividendsto meet the new Basel proposals.

There remains significant uncertainty on preferred shares associated with shares exchangedthe final impacts as the U.S. has issued final rules only for common stockBasel II and related deferred tax disallowances.

a Notice of Proposed Rulemaking for the Market Risk Rules at this time. Impacts may change as the U.S. finalizes rules for Basel III and the regulatory agencies interpret the final rules during the implementation process.

NOTE 17 – 19 Employee Benefit Plans

Pension and Postretirement Plans

The Corporation sponsors noncontributory trusteed pension plans that cover substantially all officers and employees, a number of noncontributory nonqualified pension plans, and postretirement health and life plans. The plans provide defined benefits based on an employee’s compensation and years of service. The Bank of America Pension Plan (the Pension Plan) provides participants with compensation credits, generally based on years of service. For account balances based on compensation credits prior to January 1, 2008, the Pension Plan allows participants to select from various earnings measures, which are based on the returns of certain funds or common stock of the Corporation. The participant-selected earnings measures determine the earnings rate on the individual participant account balances in the Pension Plan. Participants may elect to modify earnings measure allocations on a periodic basis subject to the provisions of the Pension Plan. For account balances based on compensation credits subsequent to December 31, 2007, the account balance earnings rate is based on a benchmark rate. For eligible employees in the Pension Plan on or after January 1, 2008, the benefits become vested upon completion of three years of service. It is the

policy of the Corporation to fund not less than the minimum funding amount required by ERISA.

The Pension Plan has a balance guarantee feature for account balances with participant-selected earnings, applied at the time a benefit payment is made from the plan that effectively provides principal protection for participant balances transferred and certain compensation credits. The Corporation is responsible for funding any shortfall on the guarantee feature.


176Bank of America 2009


In May 2008, the Corporation and the IRS entered into a closing agreement resolving all matters relating to an audit by the IRS of the Pension Plan and the Bank of America 401(k) Plan. The audit included a review of voluntary transfers by participants of 401(k) Plan accounts to the Pension Plan. In connection with the agreement, during 2009 the Pension Plan transferred approximately $1.2 billion of assets and liabilities associated with the transferred accounts to a newly established defined contribution plan during 2009.

plan.

As a result of recent acquisitions, the Corporation assumed the obligations related to the pension plans of FleetBoston, MBNA, U.S. Trust Corporation, LaSalle and Countrywide. These five acquired pension plans have been merged into a separate defined benefit pension plan, which, together with the Pension Plan, are referred to as the Qualified Pension Plans. The Bank of America Pension Plan for Legacy Fleet (the FleetBoston Pension Plan)benefit structures under these acquired plans have not changed and remain intact in the Bank of America Pension Plan for Legacy U.S. Trust Corporation (the U.S. Trust Pension Plan)merged plan. Certain benefit structures are substantially similar to the Pension Plan discussed above; however, certain of these plansstructures do not allow participants to select various earnings measures; rather the earnings rate is based on a benchmark rate. In addition, both plansthese benefit structures include participants with benefits determined under formulas based on average or career compensation and years of service rather than by reference to a pension account. The BankCertain of America Pension Plan for Legacy MBNA (the MBNA Pension Plan), the Bank of America Pension Plan for Legacy LaSalle (the LaSalle Pension Plan) and the Countrywide Financial Corporation Inc. Defined Benefit Pension Plan (the Countrywide Pension Plan)other benefit structures provide participant’s retirement benefits based on the number of years of benefit service and a percentage of the participant’s average annual compensation during the five highest paid consecutive years of the last ten years of employment. Effective December 31, 2008, the Countrywide Pension Plan, LaSalle Pension Plan, MBNA Pension Plan and U.S. Trust Pension Plan merged into the FleetBoston Pension Plan, which was renamed the Bank of America Pension Plan for Legacy Companies. The plan merger did not change participant benefits or benefit accruals as the Bank of America Pension Plan for Legacy Companies continues the respective benefit structures of the five plans for their respective participant groups.

As a result of the Merrill Lynch acquisition, the Corporation assumed the obligations related to the plans of Merrill Lynch. These plans include a terminated U.S. pension plan,non-U.S. pension plans, nonqualified pension plans and postretirement plans. Thenon-U.S. pension plans vary based on the country and local practices. The terminated U.S. pension plan and the non-U.S. pension plans areis referred to as the Other Pension Plans.

Plan.

In 1988, Merrill Lynch purchased a group annuity contract that guarantees the payment of benefits vested under the terminated U.S. pension plan. The Corporation, under a supplemental agreement, may be responsible for, or benefit from actual experience and investment performance of the annuity assets. The Corporation made no contribution in 2010 and contributed $120 million during 2009 under this agreement during 2009.agreement. Additional contributions may be required in the future under this agreement.

The Corporation sponsors a number of noncontributory, nonqualified pension plans (the Nonqualified Pension Plans). As a result of acquisitions, the Corporation assumed the obligations related to the noncontributory, nonqualified pension plans of former FleetBoston, MBNA, U.S. Trust Corporation, LaSalle, Countrywide andcertain legacy companies including Merrill Lynch. These plans, which are unfunded, provide defined pension benefits to certain employees.

In addition to retirement pension benefits, full-time, salaried employees and certain part-time employees may become eligible to continue participation as retirees in health careand/or life insurance plans sponsored by the Corporation. Based on the other provisions of the individual plans, certain retirees may also have the cost of these benefits partially paid by the Corporation. The obligations assumed as a result of the acquisitions are substantially similar to the Corporation’s postretirement health and life plans, except for Countrywide which did not have a postretirement health and life plan. Collectively, these plans are referred to as the Postretirement Health and Life Plans.

The tables within this Note include the information related to the Countrywide plans beginning July 1, 2008 and the Merrill Lynch plans beginning January 1, 2009.


Bank of America 2009177

210     Bank of America 2010


The following table below summarizes the changes in the fair value of plan assets, changes in the projected benefit obligation (PBO), the funded status of both the accumulated benefit obligation (ABO) and the PBO, and the weighted-average assumptions used to determine benefit obligations for the pension plans and postretirement plans at December 31, 20092010 and 2008.2009. Amounts recognized at December 31, 20092010 and 20082009 are reflected in other assets, and accrued expenses and other liabilities on the Consolidated Balance Sheet. The discount rate assumption is based

on a cash flow matching

technique and is subject to change each year. This technique utilizes yield curves that are based on Aa-rated corporate bonds with cash flows that match estimated benefit payments of each of the plans to produce the discount rate assumptions. The asset valuation method for the Qualified Pension Plans recognizes 60 percent of the prior year’s market gains or losses at the next measurement date with the remaining 40 percent spread equally over the subsequent four years.


  Qualified Pension Plans(1)     Nonqualified and Other
Pension Plans(1)
     Postretirement Health
and Life Plans(1)
 
(Dollars in millions) 2009   2008      2009   2008      2009   2008 

Change in fair value of plan assets


Fair value, January 1

 $14,254    $18,720     $2    $2     $110    $165  

Countrywide balance, July 1, 2008

       305                        

Merrill Lynch balance, January 1, 2009

             3,788                  

Actual return on plan assets

  2,238     (5,310    (58         21     (43

Company contributions(2)

       1,400      322     154      92     83  

Plan participant contributions

             2           141     117  

Benefits paid

  (791   (861    (309   (154    (272   (227

Plan transfer

  (1,174                           

Federal subsidy on benefits paid

  n/a     n/a      n/a     n/a      21     15  

Foreign currency exchange rate changes

  n/a     n/a       100     n/a              

Fair value, December 31

 $14,527    $14,254      $3,847    $2      $113    $110  

Change in projected benefit obligation


Projected benefit obligation, January 1

 $13,724    $14,200     $1,258    $1,307     $1,404    $1,576  

Countrywide balance, July 1, 2008

       439           53             

Merrill Lynch balance, January 1, 2009

             2,963           226       

Service cost

  387     343      34     7      16     16  

Interest cost

  740     837      243     77      93     87  

Plan participant contributions

             2           141     117  

Plan amendments

  37     5                        

Actuarial loss (gain)

  89     (1,239    137     (32    (11   (180

Benefits paid

  (791   (861    (309   (154    (272   (227

Plan transfer

  (1,174                           

Termination benefits

  36                             

Curtailments

             (3                

Federal subsidy on benefits paid

  n/a     n/a      n/a     n/a      21     15  

Foreign currency exchange rate changes

  n/a     n/a       111     n/a       2       

Projected benefit obligation, December 31

 $13,048    $13,724      $4,436    $1,258      $1,620    $1,404  

Amount recognized, December 31

 $1,479    $530      $(589  $(1,256    $(1,507  $(1,294

Funded status, December 31


Accumulated benefit obligation

 $12,198    $12,864     $4,317    $1,246      n/a     n/a  

Overfunded (unfunded) status of ABO

  2,329     1,390      (470   (1,244    n/a     n/a  

Provision for future salaries

  850     860      119     12      n/a     n/a  

Projected benefit obligation

  13,048     13,724       4,436     1,258      $1,620    $1,404  

Weighted-average assumptions,

December 31


Discount rate

  5.75   6.00    5.63   6.00    5.75   6.00

Rate of compensation increase

  4.00     4.00       4.69     4.00       n/a     n/a  

                                 
              Nonqualified
       
  Qualified
  Non-U.S.
  and Other
  Postretirement
 
  Pension Plans(1)  Pension Plans(1)  Pension Plans(1)  Health and Life Plans (1) 
(Dollars in millions) 2010  2009  2010  2009  2010  2009  2010  2009 
Change in fair value of plan assets
                                
Fair value, January 1
 $14,527  $14,254  $1,312  $  $2,535  $2  $113  $110 
Merrill Lynch balance, January 1, 2009           1,025      2,763       
Actual return on plan assets  1,835   2,238   157   177   272   (235)  13   21 
Company contributions (2)
        82   61   196   261   100   92 
Plan participant contributions        2   2         139   141 
Benefits paid  (714)  (791)  (55)  (53)  (314)  (256)  (275)  (272)
Plan transfer     (1,174)                  
Federal subsidy on benefits paid  n/a   n/a   n/a   n/a   n/a   n/a   18   21 
Foreign currency exchange rate changes  n/a   n/a   (26)  100   n/a   n/a       
                                 
Fair value, December 31
 $15,648  $14,527  $1,472  $1,312  $2,689  $2,535  $108  $113 
                                 
Change in projected benefit obligation
                                
Projected benefit obligation, January 1
 $13,048  $13,724  $1,518  $  $2,918  $1,258  $1,620  $1,404 
Merrill Lynch balance, January 1, 2009           1,280      1,683      226 
Service cost  397   387   30   30   3   4   14   16 
Interest cost  748   740   79   76   163   167   92   93 
Plan participant contributions        2   2         139   141 
Plan amendments     37   2            64    
Actuarial loss (gain)  459   89   78   75   308   62   32   (11)
Benefits paid  (714)  (791)  (55)  (53)  (314)  (256)  (275)  (272)
Plan transfer     (1,174)                  
Termination benefits     36                   
Curtailments           (3)            
Federal subsidy on benefits paid  n/a   n/a   n/a   n/a   n/a   n/a   18   21 
Foreign currency exchange rate changes  n/a   n/a   (30)  111            2 
                                 
Projected benefit obligation, December 31
 $13,938  $13,048  $1,624  $1,518  $3,078  $2,918  $1,704  $1,620 
                                 
Amount recognized, December 31
 $1,710  $1,479  $(152) $(206) $(389) $(383) $(1,596) $(1,507)
                                 
Funded status, December 31
                                
Accumulated benefit obligation $13,192  $12,198  $1,504  $1,401  $ 3,077  $2,916   n/a   n/a 
Overfunded (unfunded) status of ABO  2,456   2,329   (32)  (89)  (388)  (381)  n/a   n/a 
Provision for future salaries  746   850   120   117   1   2   n/a   n/a 
Projected benefit obligation  13,938   13,048   1,624   1,518   3,078   2,918  $1,704  $1,620 
                                 
Weighted-average assumptions, December 31
                                
Discount rate  5.45%  5.75%  5.29%  5.40%  5.20%  5.75%  5.10%  5.75%
Rate of compensation increase  4.00   4.00   4.88   4.69   4.00   4.00   n/a   n/a 
                                 
(1)

The measurement date for the Qualified Pension Plans,Non-U.S. Pension Plans, Nonqualified and Other Pension Plans, and Postretirement Health and Life Plans was December 31 of each year reported.

(2)

The Corporation’s best estimate of its contributions to be made to the Qualified Pension Plans,Non-U.S. Pension Plans, Nonqualified and Other Pension Plans, and Postretirement Health and Life Plans in 20102011 is $0, $230$82 million, $103 million and $116$121 million, respectively.

n/a = not applicable

Amounts recognized in the Corporation’s Consolidated Financial StatementsBalance Sheet at December 31, 2010 and 2009 are presented in the table below.
                                 
              Nonqualified
  Postretirement
 
  Qualified
  Non-U.S.
  and Other
  Health and Life
 
  Pension Plans  Pension Plans  Pension Plans  Plans 
(Dollars in millions) 2010  2009  2010  2009  2010  2009  2010  2009 
Other assets $ 1,710  $ 1,479  $32  $1  $809  $830  $  $ 
Accrued expenses and other liabilities        (184)  (207)  (1,198)  (1,213)  (1,596)  (1,507)
                                 
Net amount recognized at December 31
 $1,710  $1,479  $ (152) $(206) $(389) $(383) $(1,596) $(1,507)
                                 
Bank of America 2010     211


Pension Plans with ABO and 2008 werePBO in excess of plan assets as follows:

  Qualified
Pension Plans
     Nonqualified and Other
Pension Plans
     Postretirement Health
and Life Plans
 
(Dollars in millions) 2009    2008      2009     2008      2009     2008 

Other assets

 $1,479    $607     $831      $     $      $  

Accrued expenses and other liabilities

       (77     (1,420     (1,256     (1,507     (1,294

Net amount recognized at December 31

 $1,479    $530      $(589    $(1,256    $(1,507    $(1,294

of December 31, 2010 and 2009 are presented in the table below. These plans primarily represent non-qualified plans not subject to ERISA ornon-U.S. pension plans where funding strategies vary due to legal requirements and local practices.
                 
        Nonqualified
 
  Non-U.S.
  and Other
 
  Pension Plans  Pension Plans 
(Dollars in millions) 2010  2009  2010  2009 
Plans with ABO in excess of plan assets(1)
                
PBO $249  $221  $1,200  $1,216 
ABO  242   214   1,199   1,214 
Fair value of plan assets  106   72   2   2 
                 
Plans with PBO in excess of plan assets (1)
                
PBO $414  $1,473  $1,200  $1,216 
Fair value of plan assets  230   1,266   2   2 
                 
178(1)BankThere were no Qualified Pension Plans with ABO or PBO in excess of America 2009plan assets at December 31, 2010 and 2009.


Net periodic benefit cost (income) for 2010, 2009 2008 and 20072008 included the following components:

  Qualified Pension Plans     Nonqualified and Other
Pension Plans
     

Postretirement Health

and Life Plans

 
(Dollars in millions) 2009   2008   2007      2009   2008   2007      2009   2008   2007 

Components of net periodic benefit cost (income)


Service cost

 $387    $343    $316     $34    $7    $9     $ 16    $ 16    $ 16  

Interest cost

  740     837     761      243     77     71      93     87     84  

Expected return on plan assets

  (1,231   (1,444   (1,312    (222              (8   (13   (8

Amortization of transition obligation

                                  31     31     32  

Amortization of prior service cost (credits)

  39     33     47      (8   (8   (7                

Amortization of net actuarial loss (gain)

  377     83     156      5     14     17      (77   (81   (60

Recognized loss (gain) due to settlements
and curtailments

                            14                (2

Recognized termination benefit costs

  36                                              

Net periodic benefit cost (income)

 $348    $(148  $(32    $52    $90    $104      $55    $40    $62  

Weighted-average assumptions used to determine
net cost for the years ended December 31


Discount rate

  6.00   6.00   5.75    5.86   6.00   5.75    6.00   6.00   5.75

Expected return on plan assets

  8.00     8.00     8.00      5.66     n/a     n/a      8.00     8.00     8.00  

Rate of compensation increase

  4.00     4.00     4.00       4.61     4.00     4.00       n/a     n/a     n/a  

components.

                         
  Qualified Pension Plans  Non-U.S. Pension Plans 
(Dollars in millions) 2010  2009  2008  2010  2009  2008 
Components of net periodic benefit cost (income)
                        
Service cost $397  $387  $343  $30  $30  $ 
Interest cost  748   740   837   79   76    
Expected return on plan assets  (1,263)  (1,231)  (1,444)  (88)  (74)   
Amortization of prior service cost (credits)  28   39   33          
Amortization of net actuarial loss  362   377   83          
Recognized loss (gain) due to settlements and curtailments              (2)   
Recognized termination benefit costs     36             
                         
Net periodic benefit cost (income)
 $272  $348  $(148) $21  $30  $ 
                         
Weighted-average assumptions used to determine net cost for years ended December 31
                        
Discount rate  5.75%  6.00%  6.00%  5.40%  5.55%  n/a 
Expected return on plan assets  8.00   8.00   8.00   6.82   6.78   n/a 
Rate of compensation increase  4.00   4.00   4.00   4.69   4.61    n/a 
                         
                         
  Nonqualified and
  Postretirement Health
 
  Other Pension Plans  and Life Plans 
(Dollars in millions) 2010  2009  2008  2010  2009  2008 
Components of net periodic benefit cost (income)
                        
Service cost $3  $4  $7  $14  $16  $16 
Interest cost  163   167   77   92   93   87 
Expected return on plan assets  (138)  (148)     (9)  (8)  (13)
Amortization of transition obligation           31   31   31 
Amortization of prior service cost (credits)  (8)  (8)  (8)  6       
Amortization of net actuarial loss (gain)  10   5   14   (49)  (77)  (81)
Recognized loss (gain) due to settlements and curtailments  17   2             
                         
Net periodic benefit cost (income)
 $47  $22  $90  $85  $55  $40 
                         
Weighted-average assumptions used to determine net cost for years ended December 31
                        
Discount rate  5.75%    6.00%    6.00%  5.75%  6.00%  6.00%
Expected return on plan assets  5.25   5.25   n/a   8.00   8.00   8.00 
Rate of compensation increase  4.00   4.00   4.00   n/a   n/a   n/a 
                         
n/a = not applicable

The net periodic benefit cost (income) for each of the Plansplans in 2010 and 2009 includes the results of Merrill Lynch. The net periodic benefit cost (income) of the Merrill Lynch Nonqualified and Other Pension Plans, and Postretirement Health and Life Plans was $(20) million and $18 million in 2009 using a blended discount rate of 5.59 percent at January 1, 2009. The net periodic benefit cost (income) for 2009 and 2008 includes the results of Countrywide. The net periodic benefit cost of the Countrywide Qualified Pension Plan was $29 million in 2008 using a discount rate of 6.75 percent at July 1, 2008. The net periodic benefit cost of the Countrywide Nonqualified Pension Plan was $1 million. Countrywide did not have a Postretirement Health and Life Plan.

Net periodic postretirement health and life expense was determined using the “projected unit credit” actuarial method. Gains and losses for all benefits except postretirement health care are recognized in accordance with the standard amortization provisions of the applicable accounting guidance. For the Postretirement Health Care Plans, 50 percent of the

unrecognized gain or

loss at the beginning of the fiscal year (or at subsequent remeasurement) is recognized on a level basis during the year.
The discount rate and expected return on plan assets impact the net periodic benefit cost (income) recorded for the plans. With all other assumptions held constant, a 25-basis point decline in the discount rate and expected return on plan assets would result in an increase of approximately $50 million and $41 million, respectively, for the Qualified Pension Plans. For theNon-U.S. Pension Plans, the Nonqualified and Other Pension Plans, and Postretirement Health and Life Plans, the 25-basis point decline in rates would not have a significant impact.


212     Bank of America 2010


Assumed health care cost trend rates affect the postretirement benefit obligation and benefit cost reported for the Postretirement Health Careand Life Plans. The assumed health care cost trend rate used to measure the expected cost of benefits covered by the Postretirement Health Careand Life Plans was 8.007.50 percent for 2010,2011, reducing in steps to 5.00 percent in 2017 and later years. A one-percentage-point increase in assumed health care cost trend rates would have increased the service and interest costs and the

benefit obligation by $4 million and $57$62 million in 2009, $4 million and $35 million in 2008, and $5 million and $64 million in 2007.2010. A one-percentage-point decrease in assumed health care cost trend rates would have lowered the service and interest costs and the benefit obligation by $4 million and $50$58 million in 2009, $4 million and $31 million in 2008, and $4 million and $54 million in 2007.

2010.

Pre-tax amounts included in accumulated OCI for employee benefit plans at December 31, 2010 and 2009 and 2008 were as follows:

are presented in the table below.

  Qualified Pension
Plans
      Nonqualified and Other
Pension Plans
     Postretirement Health
and Life Plans
     Total
(Dollars in millions) 2009    2008       2009     2008      2009     2008      2009    2008

Net actuarial (gain) loss

 $5,937    $7,232     $479      $70     $(106    $(158   $6,310    $7,144

Transition obligation

                          95       126      95     126

Prior service cost (credits)

  126     129       (22     (30                   104     99

Amounts recognized in accumulated OCI

 $6,063    $7,361      $457      $40      $(11    $(32    $6,509    $7,369


              Nonqualified
  Postretirement
       
  Qualified
  Non-U.S.
  and Other
  Health and
       
  Pension Plans  Pension Plans  Pension Plans  Life Plans  Total 
(Dollars in millions) 2010  2009  2010  2009  2010  2009  2010  2009  2010  2009 
Net actuarial (gain) loss $5,461  $5,937  $(20) $(30) $656  $509  $(27) $(106) $6,070  $6,310 
Transition obligation                    63   95   63   95 
Prior service cost (credits)  98   126   1      (15)  (22)  58      142   104 
                                         
Amounts recognized in accumulated OCI
 $5,559  $6,063  $(19) $(30) $641  $487  $94  $(11) $6,275  $6,509 
                                         
Pre-tax amounts recognized in OCI for 2009employee benefit plans in 2010 included the following components:

(Dollars in millions) Qualified
Pension
Plans
   Nonqualified
and Other
Pension
Plans
   Postretirement
Health and
Life Plans
   Total 

Other changes in plan assets and benefit obligations recognized in OCI


Current year actuarial (gain) loss

 $(918  $416    $(24  $(526

Amortization of actuarial gain (loss)

  (377   (8   77     (308

Current year prior service cost

  36               36  

Amortization of prior service credit (cost)

  (39   8          (31

Amortization of transition obligation

            (31   (31

Total recognized in OCI

 $(1,298  $416    $22    $(860

Bank of America 2009179


components.

                     
        Nonqualified
  Postretirement
    
  Qualified
  Non-U.S.
  and Other
  Health and
    
(Dollars in millions) Pension Plans  Pension Plans  Pension Plans  Life Plans  Total 
Other changes in plan assets and benefit obligations recognized in OCI
                    
Current year actuarial (gain) loss $(114) $9  $173  $29  $97 
Amortization of actuarial gain (loss)  (362)     (27)  49   (340)
Current year prior service cost     2      64   66 
Amortization of prior service credit (cost)  (28)     8   (6)  (26)
Amortization of transition obligation           (31)  (31)
                     
Total recognized in OCI
 $(504) $11  $154  $105  $(234)
                     
The estimated net actuarial loss and prior service cost (credits) for the Qualified Pension Planspre-tax amounts that will be amortized from accumulated OCI into net periodic benefitperiod cost (income) during 2010in 2011 are pre-tax amounts of $358 million and $28 million. The estimated net actuarial loss and prior service cost forpresented in the Nonqualified and Other Pension Plans that will be amortized from accumulated OCI into net periodic benefit cost (income) during 2010 are pre-tax amounts of $2 million and $(8) million. The estimated net actuarial loss and transition obligation for the Postretirement Health and Life Plans that will be amortized from accumulated OCI into net periodic benefit cost (income) during 2010 are pre-tax amounts of $(32) million and $31 million.table below.
                     
        Nonqualified
  Postretirement
    
  Qualified
  Non-U.S.
  and Other
  Health and
    
(Dollars in millions) Pension Plans  Pension Plans  Pension Plans  Life Plans  Total 
Net actuarial loss $395  $  $15  $  $410 
Prior service cost (credit)  22      (8)  6   20 
Transition obligation           31   31 
                     
Total amortized from accumulated OCI
 $417  $  $7  $ 37  $ 461 
                     

Plan Assets

The Qualified Pension Plans have been established as retirement vehicles for participants, and trusts have been established to secure benefits promised under the Qualified Pension Plans. The Corporation’s policy is to invest the trust assets in a prudent manner for the exclusive purpose of providing benefits to participants and defraying reasonable expenses of administration. The Corporation’s investment strategy is designed to provide a total return that, over the long term, increases the ratio of assets to liabilities. The strategy attempts to maximize the investment return on assets at a level of risk deemed appropriate by the Corporation while complying with ERISA and any applicable regulations and laws. The investment strategy utilizes asset allocation as a principal determinant for establishing the risk/rewardreturn profile of the assets. Asset allocation ranges are established, periodically reviewed and adjusted as funding levels and liability characteristics change. Active and passive investment managers are employed to help enhance the risk/return profile of the assets. An additional aspect of the investment strategy used to minimize risk (part of the asset allocation plan) includes matching the equity exposure of participant-selected earnings measures. For example, the common stock of the Corporation held in the trust is maintained as an offset to the exposure related to participants who selectedelected to receive an earnings measure

measure

based on the return performance of common stock of the Corporation. No plan assets are expected to be returned to the Corporation during 2010.

2011.

The assets of the non-U.S. plansNon-U.S. Pension Plans are primarily attributable to the U.K. pension plan. The U.K. pension plan’s assets are invested prudently so that the benefits promised to members are provided with consideration given to the nature and the duration of the plan’s liabilities. The current planned investment strategy was set following an asset-liability study and advice from the Trustee’strustee’s investment advisors. The selected asset allocation strategy is designed to achieve a higher return than the lowest risk strategy while maintaining a prudent approach to meeting the plan’s liabilities.

The Expected Return on Asset assumption (EROA assumption) was developed through analysis of historical market returns, historical asset class volatility and correlations, current market conditions, anticipated future asset allocations, the funds’ past experience, and expectations on potential future market returns. The EROA assumption is determined using the calculated market-related value for the Qualified Pension Plans and the Other Pension Plan and the fair value for theNon-U.S. Pension Plans and Postretirement Health and Life Plans. The EROA assumption represents a long-term average view of the performance of the assets in the Qualified Pension Plans, the Nonqualified andNon-U.S. Pension Plans, the Other Pension Plans,Plan, and the Postretirement Health and Life Plans, a return that may or may not be achieved during any one


Bank of America 2010     213


calendar year. Some of the building blocks used to arrive at the long-term return assumption include an implied return from equity securities of 8.75 percent, debt securities of 5.75 percent and real estate of 7.00 percent for the Qualified Pension Plans, Nonqualified andtheNon-U.S. Pension Plans, the Other Pension Plans,Plan, and Postretirement Health and Life Plans. The terminated U.S. pension plan is solely invested in a group annuity contract which was primarily invested in fixed fixed-

income securities structured such that asset maturities match the duration of the plan’s obligations.

The target allocations for 20102011 by asset category for the Qualified Pension Plans,Non-U.S. Pension Plans, Nonqualified and Other Pension Plans, and Postretirement Health and Life Plans are as follows:

presented in the following table.

Asset Category


    2010
2011 Target Allocation 
    Qualified
Pension
Plans
  Nonqualified
and Other
Pension
Plans
  Postretirement
Qualified
Non-U.S.
and Other
Health and Life
Life
Asset CategoryPension PlansPension PlansPension PlansPlans 
Equity securities  60 – 80% 5251575%0 – 5%  50 – 75%
Debt securities  20 – 40  6510806095 – 100  25 – 45 
Real estate  0 – 5  0 – 150 – 5  0 – 5 
Other  0 – 10  5 – 20400 – 5  0 – 5 

Equity securities for the Qualified Pension Plans include common stock of the Corporation in the amounts of $189 million (1.21 percent of total plan assets) and $224 million (1.54 percent of total plan assets) and $269 million (1.88 percent of total plan assets) at December 31, 20092010 and 2008.2009.
214     Bank of America 2010


Fair Value Measurements

For information on fair value measurements, including descriptions of Level 1, 2 and 3 of the fair value hierarchy and the valuation methods employed by the Corporation, seeNote 1 – Summary of Significant Accounting PrinciplesandNote 2022 – Fair Value Measurements.


180Bank of America 2009


Plan investment assets measured at fair value by level and in total at December 31, 2010 and 2009 are summarized in the table below.

  Fair Value Measurements Using     
(Dollars in millions) Level 1    Level 2    Level 3    Total

Money market and interest-bearing cash

 $1,282    $    $    $1,282

U.S. government and government agency obligations

  1,460     1,422          2,882

Corporate debt

       1,301          1,301

Asset-backed securities

       1,116          1,116

Mutual funds(1)

  777               777

Common and collective trusts(2)

       2,764     18     2,782

Common and preferred stocks

  5,424               5,424

Foreign equity securities

  653               653

Foreign debt securities

  268     611     6     885

Foreign common collective trusts

       289          289

Foreign other

       18     266     284

Real estate

            119     119

Participant loans

            74     74

Other investments

  30     402     187     619

Total plan investment assets, at fair value

 $9,894    $7,923    $670    $18,487
                 
  December 31, 2010 
  Fair Value Measurements    
(Dollars in millions) Level 1  Level 2  Level 3  Total 
Cash and short-term investments
                
Money market and interest-bearing cash $1,469  $  $  $1,469 
Cash and cash equivalent commingled/mutual funds     45      45 
Fixed income
                
U.S. government and government agency securities  701   2,604   14   3,319 
Corporate debt securities     1,106      1,106 
Asset-backed securities     796      796 
Non-U.S. debt securities
  36   397   9   442 
Fixed income commingled/mutual funds  240   1,359      1,599 
Equity
                
Common and preferred equity securities  6,980   1      6,981 
Equity commingled/mutual funds  637   2,307      2,944 
Public real estate investment trusts     168      168 
Real estate
                
Private real estate        110   110 
Real estate commingled/mutual funds  30   2   215   247 
Limited partnerships
     101   230   331 
Other investments (1)
  19   258   83   360 
                 
Total plan investment assets, at fair value
 $10,112  $9,144  $661  $19,917 


  December 31, 2009 
Cash and short-term investments
                
Money market and interest-bearing cash $1,311  $  $  $1,311 
Cash and cash equivalent commingled/mutual funds     18      18 
Fixed income
                
U.S. government and government agency securities  1,460   1,422      2,882 
Corporate debt securities  22   1,279      1,301 
Asset-backed securities     1,116      1,116 
Non-U.S. debt securities
  278   601   6   885 
Fixed income commingled/mutual funds  57   1,202      1,259 
Equity
                
Common and preferred equity securities  6,077         6,077 
Equity commingled/mutual funds  697   2,026      2,723 
Public real estate investment trusts     116      116 
Real estate
                
Private real estate        119   119 
Real estate commingled/mutual funds  23      195   218 
Limited partnerships
     91   162   253 
Other investments (1)
  1   20   188   209 
                 
Total plan investment assets, at fair value
 $9,926  $7,891  $670  $18,487 
                 
(1)

Balance as

Other investments represent interest rate swaps of $198 million and $110 million, participant loans of $79 million and $74 million, commodity and balanced funds of $44 million and $14 million and other various investments of $39 million and $11 million at December 31, 2009 includes $386 million of international equity developed markets funds, $230 million of U.S. large cap equity funds, $68 million of U.S. small cap equity funds, $55 million of emerging market bond funds, $23 million of real estate funds, $13 million of emerging market equity funds2010 and $2 million of short-term bond funds.

2009.
(2)

Balance as of December 31, 2009 includes $1 billion of U.S. large cap equity funds, $646 million of international equity developed markets funds, $883 million of intermediate-term bond funds, $149 million of short-term bond funds, $39 million of U.S. mid cap equity funds, $18 million of real estate funds, $14 million of alternative commodities funds, $10 million of emerging markets equity funds and $23 million of U.S. small cap equity funds.

Bank of America 2010     215


The table below presents a reconciliation of all Planplan investment assets measured at fair value using significant unobservable inputs (Level 3) during 2010 and 2009.

Level 3 – Fair Value Measurements

(Dollars in millions) Balance
January 1, 2009
    Actual Return on Plan
Assets Still Held at the
Reporting Date(1)
   Purchases, Sales
and Settlements
    

Transfers into /

(out of) Level 3

    Balance
December 31, 2009

Common and Collective Trusts

 $26    $(8  $    $    $18

Foreign debt securities

  7     (1             6

Foreign other

  328     (100   38          266

Real estate

  149     (30             119

Participant loans

  74                    74

Other investments

  237     (75   5     20     187

Total

 $821    $(214  $43    $20    $670
                     
  2010 
     Actual Return on
          
     Plan Assets Still
          
  Balance
  Held at the
  Purchases, Sales
  Transfers into/
  Balance
 
(Dollars in millions) January 1  Reporting Date(1)  and Settlements  (out of) Level 3  December 31 
Fixed income
                    
U.S. government and government agency securities $  $  $  $14  $14 
Non-U.S. debt securities
  6   1      2   9 
Real estate
                    
Private real estate  119   (9)        110 
Real estate commingled/mutual funds  195   (4)  24      215 
Limited partnerships
  162   13   2   53   230 
Other investments
  188      6   (111)  83 
                     
Total
 $670  $1  $32  $(42) $661 
                     
  2009 
Fixed income
                    
Corporate debt securities $1  $(1) $  $  $ 
Non-U.S. debt securities
  6            6 
Real estate
                    
Private real estate  149   (29)  (1)     119 
Real estate commingled/mutual funds  281   (92)  6      195 
Limited partnerships
  91   14   37   20   162 
Other investments
  293   (106)  1      188 
                     
Total
 $821  $(214) $43  $20  $670 
                     
(1)

The

During 2009, the Corporation did not sell any levelLevel 3 plan assets during the year.

period.

Projected Benefit Payments

Benefit payments projected to be made from the Qualified Pension Plans, theNon-U.S. Pension Plans, Nonqualified and Other Pension Plans, and the Postretirement Health and Life Plans are as follows:

  Qualified
Pension Plans (1)
    Nonqualified and Other
Pension Plans (2)
    Postretirement Health and Life Plans
(Dollars in millions)         Net Payments (3)    Medicare Subsidy

2010

 $883    $309    $163    $20

2011

  896     265     166     20

2012

  902     287     167     20

2013

  900     285     167     21

2014

  900     278     167     21

2015 - 2019

  4,582     1,461     785     100
presented in the following table.
                     
           Postretirement Health and Life Plans 
        Nonqualified
   
  Qualified
  Non-U.S.
  and Other
     Medicare
 
(Dollars in millions) Pension Plans(1)  Pension Plans(2)  Pension Plans(2)  Net Payments(3)  Subsidy 
2011 $1,016  $60  $231  $167  $19 
2012  1,031   62   250   168   19 
2013  1,038   63   242   168   19 
2014  1,037   65   232   168   19 
2015  1,041   66   235   166   18 
2016 – 2020  5,231   350   1,147   757   87 
                     
(1)

Benefit payments expected to be made from the plans’ assets.

(2)

Benefit payments expected to be made from a combination of the plans’ and the Corporation’s assets.

(3)

Benefit payments (net of retiree contributions) expected to be made from a combination of the plans’ and the Corporation’s assets.

Defined Contribution Plans

The Corporation maintains qualified defined contribution retirement plans and nonqualified defined contribution retirement plans. As a result of the Merrill Lynch acquisition, the Corporation also maintains the defined contribution plans of Merrill Lynch which include the 401(k) Savings & Investment Plan, the Retirement and Accumulation Plan (RAP) and the Employee Stock Ownership Plan (ESOP). The Corporation contributed

approximately $670 million, $605 million and $454 million in 2010, 2009 and $420 million in 2009, 2008, and 2007, respectively, in

cash, to the qualified defined contribution plans. At December 31, 2010 and 2009, and 2008, 203208 million shares and 104203 million shares of the Corporation’s common stock were held by plans. Payments to the plans for dividends on common stock were $8 million, $8 million and $214 million in 2010, 2009 and $228 million in 2009, 2008, and 2007, respectively.


Bank of America 2009181


In addition, certainnon-U.S. employees within the Corporation are covered under defined contribution pension plans that are separately administered in accordance with local laws.


216     Bank of America 2010


NOTE 18 – Stock-Based20 Stock-based Compensation Plans

The Corporation administers a number of equity compensation plans, including the Key Employee Stock Plan, the Key Associate Stock Plan and the Merrill Lynch Employee Stock Compensation Plan. Descriptions of the material features of the equity compensation plans are below. Under these plans, the Corporation grants long-term stock-based awards, including stock options, restricted stock shares and RSUs. For 2010, restricted stock awards generally vest in three equal annual installments beginning one year from the grant date, with the exception of certain awards to financial advisors that vest eight years from the grant date, and an award of restricted stock shares that was vested on the grant date but released from restrictions over 18 months.
For most awards, expense is generally recognized ratably over the vesting period net of estimated forfeitures, unless the associate meets certain retirement eligibility criteria. For associate awards that meet retirement eligibility criteria, the Corporation records the expense upon grant. For associates that become retirement eligible during the vesting period, the Corporation recognizes expense from the grant date to the date on which the associate becomes retirement eligible, net of estimated forfeitures. The compensation cost for the following stock-based plans described below was $2.8$2.0 billion, $2.4 billion and $885 million in 2010, 2009 and $1.2 billion in 2009, 2008, and 2007, respectively. The related income tax benefit was $1.0 billion,$727 million, $892 million and $328 million for 2010, 2009 and $4382008, respectively.
Key Employee Stock Plan
The Key Employee Stock Plan, as amended and restated, provided for different types of awards including stock options, restricted stock shares and RSUs. Under the plan,10-year options to purchase approximately 260 million shares of common stock were granted through December 31, 2002 to certain employees at the closing market price on the respective grant dates. At December 31, 2010, approximately 36 million fully vested options were outstanding under this plan. No further awards may be granted.
Key Associate Stock Plan
The Key Associate Stock Plan became effective January 1, 2003. It provides for different types of long-term awards, including stock options, restricted stock shares and RSUs. As of December 31, 2010, the shareholders had authorized approximately 1.1 billion shares for grant under this plan. Additionally, any shares covered by awards under the Key Employee Stock Plan or certain legacy company plans that cancel, terminate, expire, lapse or settle in cash after a specified date may be re-granted under the Key Associate Stock Plan.
In February 2010, the Corporation issued approximately 191 million RSUs to certain employees under the Key Associate Stock Plan. These awards generally vest in three equal annual installments beginning one year from the grant date. Vested RSUs will be settled in cash unless the Corporation authorizes settlement in common shares. Certain awards contain clawback provisions which permit the Corporation to cancel all or a portion of the award under specified circumstances. The compensation cost for cash-settled awards and awards subject to certain clawback provisions is accrued over the vesting period and adjusted to fair value based upon changes in the share price of the Corporation’s common stock. The compensation cost for the remaining awards is fixed and based on the share price of the common stock on the date of grant, or the date upon which settlement in common stock has been authorized. The Corporation hedges a portion of its exposure to variability in the expected cash flows for unvested awards using a combination of economic and cash flow hedges as described inNote 4 – Derivatives. During 2010, the Corporation authorized approximately 100 million RSUs to be settled in common shares and terminated a portion of the corresponding economic and cash flow hedges. As a result of the decision to share-settle these RSUs, these share-settled RSUs are no longer adjusted to fair value based upon changes in the share price of the Corporation’s common stock.

At December 31, 2010, approximately 140 million options were outstanding under this plan. There were no options granted under this plan during 2010 or 2009.
Merrill Lynch Employee Stock Compensation Plan
The Corporation assumed the Merrill Lynch Employee Stock Compensation Plan. Shares can be granted under this plan in the future. Approximately 34 million shares of RSUs were granted in 2009 which generally vest in three equal annual installments beginning one year from the grant date. Awards granted prior to 2009 generally vest in four equal annual installments beginning one year from the grant date. There were no shares granted under this plan during 2010. At December 31, 2010, there were approximately 28 million shares outstanding.
Other Stock Plans
As a result of the Merrill Lynch acquisition, the Corporation assumed the obligations of outstanding awards granted under the Merrill Lynch Financial Advisor Capital Accumulation Award Plans (FACAAP) and the Merrill Lynch Employee Stock Purchase Plan (ESPP). The FACAAP is no longer an active plan and no awards were granted in 2010 or 2009. Awards granted in 2003 and thereafter are generally payable eight years from the grant date in a fixed number of the Corporation’s common stock. For outstanding awards granted prior to 2003, payment is generally made ten years from the grant date in a fixed number of the Corporation’s common shares unless the fair value of such shares is less than a specified minimum value, in which case the minimum value is paid in cash. At December 31, 2010, there were 18 million shares outstanding under this plan.
The ESPP allows eligible associates to invest from one percent to 10 percent of eligible compensation to purchase the Corporation’s common stock, subject to legal limits. Purchases were made at a discount of up to five percent of the average high and low market price on the relevant purchase date and the maximum annual contribution per employee was $23,750 in 2010. Up to 107 million shares have been authorized for issuance under the ESPP in 2010. There were 12 million shares available at January 1, 2010 and 3 million shares purchased during the year. There were 9 million shares available at December 31, 2010.
The weighted-average fair value of the ESPP stock purchase rights (i.e., the five percent discount on the Corporation’s common stock purchases) exercised by employees in 2010 is $0.80 per stock purchase right.
Restricted Stock/Unit Details
The following table presents the status of the share-settled restricted stock/unit awards at December 31, 2010 and changes during 2010.
          
      Weighted-
 
      average
 
   Shares  Exercise Price 
Outstanding at January 1, 2010   175,028,022  $14.30 
Granted   216,874,053   14.40 
Vested   (164,904,893)  15.66 
Cancelled   (14,924,513)  13.81 
          
Outstanding at December 31, 2010
   212,072,669   13.37 
 
At December 31, 2010, there was $944 million of total unrecognized compensation cost related to share-based compensation arrangements for all awards and it is expected to be recognized over a period up to seven years, with a weighted-average period of 1.07 years. The total fair value of restricted stock vested in 2010 was $2.4 billion. In 2010, the amount of cash used to settle equity instruments was $186 million.


Bank of America 2010     217


Stock Options Details
The following table presents the status of all option plans at December 31, 2010 and changes during 2010. Outstanding options at December 31, 2010 include 36 million options under the Key Employee Stock Plan, 140 million options under the Key Associate Stock Plan and 85 million options to employees of predecessor companies assumed in mergers.
         
      Weighted-
      average
      Exercise
   Options  Price
Outstanding at January 1, 2010   303,722,748  $49.71
Exercised   (4,959)  14.82
Forfeited   (42,594,970)  44.16
         
Outstanding at December 31, 2010
   261,122,819   50.61
         
Options exercisable at December 31, 2010   255,615,840   50.77
Options vested and expected to vest (1)
   261,113,002   50.61
         
(1)Includes vested shares and nonvested shares after a forfeiture rate is applied.
At December 31, 2010, there was no aggregate intrinsic value of options outstanding, exercisable, and vested and expected to vest. The weighted-average remaining contractual term of options outstanding was 3.0 years, options exercisable was 3.0 years, and options vested and expected to vest was 3.1 years at December 31, 2010. These remaining contractual terms are similar because options have not been granted since 2008 and 2007, respectively.

they generally vest in three years.

The weighted-average grant-date fair value of options granted in 2008 was $8.92. No options were granted in 2010 or 2009.
The table below presents the assumptions used to estimate the fair value of stock options granted on the date of grant using the lattice option-pricing model.model for 2008. No stock options were granted in 2010 or 2009. Lattice option-pricing models incorporate ranges of assumptions for inputs and those ranges are disclosed in the table below. The risk-free interest rate for periods within the contractual life of the stock option is based on the U.S. Treasury yield curve in effect at the time of grant. Expected volatilities are based on implied volatilities from traded stock options on the Corporation’s common stock, historical volatility of the Corporation’s common stock, and other factors. The Corporation uses historical data to estimate stock option exercise and employee termination within the model. The expected term of stock options granted is derived from the output of the model and represents the period of time that stock options granted are expected to be outstanding. The estimates of fair value from these models are theoretical values for stock options and changes in the assumptions used in the models could result in materially different fair value estimates. The actual value of the stock options will depend on the market value of the Corporation’s common stock when the stock options are exercised. No stock options were granted in 2009.
2008
Risk-free interest rate2.05 – 3.85%
Dividend yield5.3
Expected volatility26.00 – 36.00
Weighted-average volatility32.8
Expected lives (years)6.6

  2008   2007 

Risk-free interest rate

 2.05 – 3.85  4.72 – 5.16

Dividend yield

 5.30    4.40  

Expected volatility

 26.00 – 36.00    16.00 – 27.00  

Weighted-average volatility

 32.80    19.70  

Expected lives (years)

 6.6    6.5  

Excluded from the previous table above are assumptions used to estimate the fair value of approximately 108 million stock options assumed in connection with the Merrill Lynch acquisition.acquisition with an aggregate fair value of $1.1 billion. The fair value of these awards was estimated using a Black-Scholes option pricing model. Similar to options valued using the lattice option-pricing model described above, key assumptions used include the implied volatility based on the Corporation’s common stock of 75 percent, the risk-free interest rate based on the U.S. Treasury yield curve in effect at December 31, 2008, an expected dividend yield of 4.2 percent and the expected life of the options based on their actual remaining term.

The Corporation has equity compensation plans which include the Key Employee Stock Plan, the Key Associate Stock Plan and the Merrill Lynch Employee Stock Compensation Plan. Descriptions of the material features of the equity compensation plans follow.

Key Employee Stock Plan

The Key Employee Stock Plan, as amended and restated, provided for different types of awards including stock options, restricted stock shares and restricted stock units. Under the plan, 10-year options to purchase approximately 260 million shares of common stock were granted through

December 31, 2002 to certain employees at the closing market price on the respective grant dates. At December 31, 2009, approximately 45 million fully vested options were outstanding under this plan. No further awards may be granted.

Key Associate Stock Plan

On April 24, 2002, the shareholders approved the Key Associate Stock Plan to be effective January 1, 2003. This approval authorized and reserved 200 million shares for grant in addition to the remaining amount under the Key Employee Stock Plan as of December 31, 2002, which was approximately 34 million shares plus any shares covered by awards under the Key Employee Stock Plan that terminate, expire, lapse or are cancelled after December 31, 2002. Subsequently, the shareholders authorized an additional 282 million shares for grant under the Key Associate Stock Plan. In conjunction with the Merrill Lynch acquisition, the shareholders authorized an additional 105 million shares for grant under the Key Associate Stock Plan. At December 31, 2009, approximately 152 million options were outstanding under this plan. Approximately 90 million shares of restricted stock and restricted stock units were granted in 2009. These shares of restricted stock generally vest in three equal annual installments beginning one year from the grant date with the exception of financial advisor awards that vest eight years from grant date.

Employee Stock Compensation Plan

The Corporation assumed the Merrill Lynch Employee Stock Compensation Plan. Future shares can be granted under this plan. Approximately 34 million shares of restricted stock units were granted in 2009 which generally vest in three equal annual installments beginning one year from the grant date. Awards granted prior to 2009 generally vest in four equal annual installments beginning one year from the grant date. At December 31, 2009, there were approximately 48 million shares outstanding.

The following table presents the status of all option plans at December 31, 2009, and changes during 2009.

Employee stock options

  Shares  Weighted-
average Exercise
Price

Outstanding at January 1, 2009

 232,429,057   $43.08

Merrill Lynch acquisition, January 1, 2009

 107,521,280    62.89

Exercised

 (2,835  12.56

Forfeited

 (36,224,754  46.31

Outstanding at December 31, 2009(1)

 303,722,748    49.71

Options exercisable at December 31, 2009

 275,180,674    49.45

Options vested and expected to vest(2)

 303,640,869    49.71
(1)

Includes 45 million options under the Key Employee Stock Plan, 152 million options under the Key Associate Stock Plan and 107 million options to employees of predecessor companies assumed in mergers.

(2)

Includes vested shares and nonvested shares after a forfeiture rate is applied.

At December 31, 2009, the Corporation had no aggregate intrinsic value of options outstanding, exercisable, and vested and expected to vest. The weighted-average remaining contractual term of options outstanding was 3.7 years, options exercisable was 3.2 years, and options vested and expected to vest was 3.7 years at December 31, 2009.

The weighted-average grant-date fair value of options granted in 2008 and 2007 was $8.92 and $8.44. No options were granted in 2009.


182Bank of America 2009


The following table presents the status of the restricted stock/unit awards at December 31, 2009, and changes during 2009.

Restricted stock/unit awards

  Shares     Weighted-
average Grant
Date Fair
Value

Outstanding at January 1, 2009

 32,715,964      $45.45

Merrill Lynch acquisition, January 1, 2009

 83,446,110       14.08

Granted

 124,146,773       10.57

Vested

 (31,181,360     31.46

Cancelled

 (34,099,465     14.39

Outstanding at December 31, 2009

 175,028,022       14.30

At December 31, 2009, there was $677 million of total unrecognized compensation cost related to share-based compensation arrangements for all awards that is expected to be recognized over a weighted-average period of 0.89 years. The total fair value of restricted stock vested in 2009 was $203 million. In 2009, the amount of cash used to settle equity instruments was $397 million.

Other Stock Plans

As a result of the Merrill Lynch acquisition, the Corporation assumed the obligations of outstanding awards granted under the Merrill Lynch Financial Advisor Capital Accumulation Award Plans (FACAAP) and the Merrill

Lynch Employee Stock Purchase Plan (ESPP). The FACAAP is no longer an active plan and no awards were granted in 2009. Awards granted in 2003 and thereafter are generally payable eight years from the grant date in a fixed number of the Corporation’s common stock. For outstanding awards granted prior to 2003, payment is generally made ten years from the grant date in a fixed number of the Corporation’s common stock unless the fair value of such shares is less than a specified minimum value, in which case, the minimum value is paid in cash. At December 31, 2009, there were 23 million shares outstanding under this plan.

The ESPP allows eligible associates to invest from one percent to 10 percent of eligible compensation to purchase the Corporation’s common stock, subject to legal limits. Purchases were made at a discount of up to five percent of the average high and low market price on the relevant purchase date and the maximum annual contribution per employee was $23,750 in 2009. Up to 107 million shares have been authorized for issuance under the ESPP in 2009. The activity during 2009 is as follows:

Shares

Available at January 1, 2009

16,449,696

Purchased through plan

(4,019,593

Available at December 31, 2009

12,430,103

The weighted-average fair value of the ESPP stock purchase rights (i.e. the five percent discount on the Corporation’s common stock purchases) exercised by employees in 2009 is $0.57 per stock purchase right.


NOTE 19 – 21 Income Taxes

The components of income tax expense (benefit) for 2010, 2009 2008 and 20072008 were as follows:

(Dollars in millions) 2009     2008   2007 

Current income tax expense (benefit)


Federal

 $(3,576    $5,075    $5,210  

State

  555       561     681  

Foreign

  735       585     804  

Total current expense (benefit)

  (2,286     6,221     6,695  

Deferred income tax expense (benefit)


Federal

  792       (5,269   (710

State

  (620     (520   (18

Foreign

  198       (12   (25

Total deferred expense (benefit)

  370       (5,801   (753

Total income tax expense (benefit) (1)

 $(1,916    $420    $5,942  
(1)

Does not reflect the deferred tax effects of unrealized gains and losses on AFS debt and marketable equity securities, foreign currency translation adjustments, derivatives and employee benefit plan adjustments that are included in accumulated OCI. As a result of these tax effects, accumulated OCI decreased $1.6 billion in 2009, increased $5.9 billion in 2008 and decreased $5.0 billion in 2007. Also, does not reflect the tax effects associated with the Corporation’s employee stock plans which decreased common stock and additional paid-in capital $295 million and $9 million in 2009 and 2008, and increased common stock and additional paid-in capital $251 million in 2007. Goodwill was reduced $0, $9 million and $47 million in 2009, 2008 and 2007, respectively, reflecting certain tax benefits attributable to exercises of employee stock options issued by acquired companies which had vested prior to the merger dates.

Bank of America 2009183
presented in the table below.
             
(Dollars in millions) 2010  2009  2008 
Current income tax expense (benefit)
            
U.S. federal $(666) $(3,576) $5,075 
U.S. state and local  158   555   561 
Non-U.S.   815   735   585 
             
Total current expense (benefit)  307   (2,286)  6,221 
             
Deferred income tax expense (benefit)
            
U.S. federal  (287)  792   (5,269)
U.S. state and local  201   (620)  (520)
Non-U.S.   694   198   (12)
             
Total deferred expense (benefit)  608   370   (5,801)
             
Total income tax expense (benefit)
 $915  $(1,916) $420 
             
Total income tax expense (benefit) does not reflect the deferred tax effects of unrealized gains and losses on AFS debt and marketable equity securities, foreign currency translation adjustments, derivatives and employee benefit plan adjustments that are included in accumulated OCI. As a result of these tax effects, accumulated OCI decreased $3.2 billion and $1.6 billion in 2010 and 2009, and increased $5.9 billion in 2008. In addition, total income tax expense (benefit) does not reflect tax effects associated with the Corporation’s employee stock plans which decreased common stock and additional paid-in capital $98 million, $295 million and $9 million in 2010, 2009 and 2008, respectively.


218     Bank of America 2010


Income tax expense (benefit) for 2010, 2009 2008 and 20072008 varied from the amount computed by applying the statutory income tax rate to income (loss) before income taxes. A reconciliation between the expected U.S. federal

income tax expense using the federal statutory tax rate of 35 percent to the Corporation’s actual income tax expense (benefit) and resulting effective tax rate for 2010, 2009 2008 and 20072008 is presented in the following table.

table below.

  2009     2008     2007 
(Dollars in millions) Amount     Percent      Amount   Percent      Amount   Percent 

Expected federal income tax expense

 $1,526      35.0   $1,550    35.0   $7,323    35.0

Increase (decrease) in taxes resulting from:


State tax expense (benefit), net of federal effect

  (42    (1.0    27    0.6      431    2.1  

Tax-exempt income, including dividends

  (863    (19.8    (631  (14.3    (683  (3.3

Foreign tax differential

  (709    (16.3    (192  (4.3    (485  (2.3

Low income housing credits/other credits

  (668    (15.3    (722  (16.3    (590  (2.8

Change in U.S. federal valuation allowance

  (650    (14.9                    

Loss on certain foreign subsidiary stock

  (595    (13.7                    

Non-U.S. leasing — restructuring

                        (221  (1.1

Leveraged lease tax differential

  59      1.4      216    4.9      148    0.7  

Changes in prior period UTBs (including interest)

  87      2.0      169    3.8      143    0.7  

Other

  (61    (1.4     3    0.1       (124  (0.6

Total income tax expense (benefit)

 $(1,916    (44.0)%     $420    9.5    $5,942    28.4


  2010  2009  2008 
(Dollars in millions) Amount  Percent  Amount  Percent  Amount  Percent 
Expected U.S. federal income tax expense (benefit) $(463)  35.0% $1,526   35.0% $1,550   35.0%
Increase (decrease) in taxes resulting from:                        
State tax expense (benefit), net of federal effect  233   (17.6)  (42)  (1.0)  27   0.6 
Goodwill impairment and other  4,508   (341.0)            
U.K. corporate tax rate reduction  392   (29.7)            
Nondeductible expenses  99   (7.5)  69   1.6   79   1.8 
Leveraged lease tax differential  98   (7.4)  59   1.4   216   4.9 
Change in federal deferred tax asset valuation allowance  (1,657)  125.4   (650)  (14.9)      
Tax-exempt income, including dividends  (981)  74.2   (863)  (19.8)  (631)  (14.3)
Low income housing credits/other credits  (732)  55.4   (668)  (15.3)  (722)  (16.3)
Non-U.S. tax differential
  (190)  14.4   (709)  (16.3)  (192)  (4.3)
Changes in prior period UTBs (including interest)  (349)  26.4   87   2.0   169   3.8 
Loss on certainnon-U.S. subsidiary stock
        (595)  (13.7)      
Other  (43)  3.2   (130)  (3.0)  (76)  (1.7)
                         
Total income tax expense (benefit)
 $915   (69.2)% $(1,916)  (44.0)% $420   9.5%
                         
The reconciliation of the beginning unrecognized tax benefits (UTB) balance to the ending balance is presented in the following table.

table below.

Reconciliation of the Change in Unrecognized Tax Benefits

(Dollars in millions) 2009     2008   2007 

Beginning balance

 $3,541      $3,095    $2,667  

Increases related to positions taken during prior years

  791       688     67  

Increases related to positions taken during the current year

  181       241     456  

Positions acquired or assumed in business combinations

  1,924       169     328  

Decreases related to positions taken during prior years

  (554     (371   (227

Settlements

  (615     (209   (108

Expiration of statute of limitations

  (15     (72   (88

Ending balance

 $5,253      $3,541    $3,095  
             
(Dollars in millions) 2010  2009  2008 
Beginning balance
 $5,253  $3,541  $3,095 
Increases related to positions taken during prior years  755   791   688 
Increases related to positions taken during the current year  172   181   241 
Positions acquired or assumed in business combinations     1,924   169 
Decreases related to positions taken during prior years  (657)  (554)  (371)
Settlements  (305)  (615)  (209)
Expiration of statute of limitations  (49)  (15)  (72)
             
Ending balance
 $5,169  $5,253  $3,541 
             

As of

At December 31, 2010, 2009 2008 and 2007,2008, the balance of the Corporation’s UTBs which would, if recognized, affect the Corporation’s effective tax rate was $3.4 billion, $4.0 billion $2.6 billion and $1.8$2.6 billion, respectively. Included in the UTB balance are some items the recognition of which would not affect the effective tax rate, such as the tax effect of certain temporary differences, the portion of gross state UTBs that would be offset by the tax benefit of the associated federal deduction and the portion of gross foreignnon-U.S. UTBs that would be offset by tax reductions in other jurisdictions.

The Corporation is under examination by the IRS and other tax authorities in countries and states in which it has significant business operations. The table below summarizes the status of significant U.S. federal examinations (unless otherwise noted) for the Corporation and various acquired subsidiaries as of December 31, 2009.

2010.
  Status at
Years under
examination (1)
 

Status at

December 31, 2009


examination(1)2010
Bank of America Corporation

 – U.S. (2)
 2000-20022001 – 2004 In Appeals process

Bank of America Corporation

 – U.S. 
 2003-20052005 – 2009 Field examination

Bank of America Corporation – New York

1999 – 2004Field examination
Merrill Lynch – U.S.

 2004 In Appeals process

Merrill Lynch – U.S.

 2005-20072005 – 2008 Field examination

Merrill Lynch – U.K.

 20072008 Field examination

FleetBoston

Merrill Lynch – Japan
 1997-20002007 – 2009Field examination
Merrill Lynch – New York2007 – 2008Field examination
FleetBoston – U.S. 1997 – 2004 In Appeals process

FleetBoston

LaSalle – U.S. 
 2001-20042006 – 2007 Field examination

LaSalle

 2003-2005 Field examination

Countrywide

 2005-2006Field examination

Countrywide

2007Field examination
(1)

All tax years in material jurisdictions subsequent to the above years shown remain open to examination.
(2)

The2001-2002 years in Appeals process relate to the separate returns of a subsidiary.

In addition to the above examinations, the Corporation is in the process of appealing an adverse decision by the U.S. Tax Court with respect to a 1987 Merrill Lynch transaction. The income tax associated with this matter has been remitted and is included in the UTB balance above.

With the exception of the 2003 through 2005 tax years of Bank of America and the issues for which protests have been filed for Bank of America and Merrill Lynch as described below, it is reasonably possible that all above U.S. federal examinations will be concluded during the next twelve months.

During 2008, the IRS announced a settlement initiative related to lease-in, lease-out (LILO) and sale-in, lease-out (SILO) leveraged lease transactions. The Corporation executed closing agreements under this settlement initiative in late 2009 for all of these transactions for Bank of America Corporation and predecessor companies. Determinations of final tax and interest are expected to be finalized by the end of the first quarter of 2010. As a result of prior remittances, the Corporation does not expect to pay additional tax and interest related to the settlement initiative.

The remaining unagreed proposed adjustment for Bank of America Corporation for 2000 through 2002 tax years is the disallowance of foreign tax credits related to certain structured investment transactions. The Corporation continues to believe the crediting of these foreign taxes against U.S. income taxes was appropriate and has filed a protest to that effect with the Appeals Office.

The IRS proposed adjustments for two issues in the audit of Merrill Lynch for the tax year 2004 which have been protested to the Appeals Office. The issues involve eligibility for the dividends received deduction


184Bank of America 2009


and foreign tax credits with respect to a structured investment transaction. The Corporation also intends to protest any adjustments the IRS proposes for these same issues in tax years 2005 through 2007.

In 2005 and 2008, Merrill Lynch paid income tax assessments for the fiscal years April 1, 1998 through March 31, 2007 in relation to the taxation of income that was originally reported in other jurisdictions, primarily the U.S. Upon making these payments, Merrill Lynch began the process of obtaining clarification from international tax authorities on the appropriate allocation of income among multiple jurisdictions (Competent Authority) to prevent double taxation of the income. During 2009, an agreement was reached between Japan and the U.S. on the allocation of income during these years. The impact of these settlements resulted in UTB decreases that are reflectedIRS has proposed similar adjustments in the previous table. AllBank of America Corporation audit cycles currently in the Appeals process and is expected to propose further adjustments disallowing foreign tax yearscredits related to certain structured investment transactions. The Corporation intends to protest these adjustments in Japan subsequent to those settled remain open to examination.

all relevant tax years.

The Corporation files income tax returns in more than 100 state and foreignnon-U.S. jurisdictions each year and is under continuous examination by various state and foreignnon-U.S. taxing authorities. While many of these examinations are resolved every year, the Corporation does not anticipate that resolutions occurring within the next twelve months wouldwill result in a material change to the Corporation’s financial position.

During 2009, the Corporation resolved many state examinations and issues under state audits. The most significant of these settlements, all of which resulted in UTB decreases, were with California and New York.

Considering all U.S. federal and foreignnon-U.S. examinations, it is reasonably possible that the UTB balance will decrease by as much as $1.3$1.0 billion during the next twelve months, since resolved items wouldwill be removed from the balance whether their resolution resulted in payment or recognition.


Bank of America 2010     219


During 20092010 and 2008,2009, the Corporation recognized in income tax expense $184$99 million and $147$184 million of interest and penalties, net of tax. As ofnet-of-tax. At both December 31, 20092010 and 2008,2009, the Corporation’s accrual for interest and penalties that related to income taxes, net of taxes and remittances, was $1.1 billion and $677 million.

billion.

Significant components of the Corporation’s net deferred tax assets and liabilities at December 31, 20092010 and 20082009 are presented in the following table.

  December 31 
(Dollars in millions) 2009     2008 

Deferred tax assets


Net operating loss carryforwards (NOL)

 $17,236      $1,263  

Allowance for credit losses

  13,011       8,042  

Security and loan valuations

  4,590       5,590  

Employee compensation and retirement benefits

  4,021       2,409  

Capital loss carryforwards

  3,187         

Other tax credit carryforwards

  2,263         

Accrued expenses

  2,134       2,271  

State income taxes

  1,636       279  

Available-for-sale securities

         1,149  

Other

  2,308       1,987  

Gross deferred tax assets

  50,386       22,990  

Valuation allowance

  (4,315     (272

Total deferred tax assets, net of
valuation allowance

  46,071       22,718  

Deferred tax liabilities


Mortgage servicing rights

  5,663       3,404  

Long-term borrowings

  3,320         

Intangibles

  2,497       1,712  

Equipment lease financing

  2,411       5,720  

Fee income

  1,382       1,637  

Available-for-sale securities

  878         

Other

  2,641       1,549  

Gross deferred liabilities

  18,792       14,022  

Net deferred tax assets(1)

 $27,279      $8,696  
(1)

The Corporation’s net deferred tax assets were adjusted during 2009 and 2008 to include $20.6 billion and $3.5 billion of net deferred tax assets related to business combinations.

table below.

         
  December 31 
(Dollars in millions) 2010  2009 
Deferred tax assets
        
Net operating loss carryforwards (NOL) $18,732  $17,236 
Allowance for credit losses  14,659   13,011 
Credit carryforwards  4,183   2,263 
Employee compensation and retirement benefits  3,868   4,021 
Accrued expenses  3,550   2,134 
State income taxes  1,791   1,636 
Capital loss carryforwards  1,530   3,187 
Security and loan valuations  427   4,590 
Other  1,960   2,308 
         
Gross deferred tax assets  50,700   50,386 
Valuation allowance  (2,976)  (4,315)
         
Total deferred tax assets, net of valuation allowance  47,724   46,071 
         
Deferred tax liabilities
        
Available-for-sale securities
  4,330   878 
Mortgage servicing rights  4,280   5,663 
Long-term borrowings  3,328   3,320 
Equipment lease financing  2,957   2,411 
Intangibles  2,146   2,497 
Fee income  1,235   1,382 
Other  2,375   2,641 
         
Gross deferred liabilities  20,651   18,792 
         
Net deferred tax assets
 $27,073  $27,279 
         
On January 1, 2010, the Corporation adopted new consolidation guidance and the transition adjustment included an increase of $3.5 billion in retained earnings which was offset against net deferred tax assets. On July 1, 2010, the Corporation adopted new accounting guidance on embedded credit derivatives and the related fair value option election and the transition adjustment included an increase of $128 million in retained earnings which is offset against net deferred tax assets.
The followingU.S. federal deferred tax asset excludes $56 million related to certain employee stock plan deductions that will be recognized and will increase additional paid-in capital when realized.
The table below summarizes the deferred tax assets and related valuation allowances recognized for the net operating and othercapital loss carryforwards and tax credit carryforwards at December 31, 2009.

(Dollars in millions) Deferred
Tax Asset
    Valuation
Allowance
   Net
Deferred
Tax Asset
    First Year
Expiring
 

Net operating losses – U.S.

 $7,378    $    $7,378    After 2027  

Net operating losses – U.K.

  9,817          9,817    None(1) 

Net operating losses – U.S. states(2)

  1,232     (443   789    Various  

Net operating losses – other

  41     (41       Various  

Capital losses

  3,187     (3,187       After 2013  

General business credits

  1,525          1,525    After 2027  

Alternative minimum tax credits

  123          123    None  

Foreign tax credits

  615     (306   309    After 2017  
2010.
                 
        Net
    
  Deferred
  Valuation
  Deferred
  First Year
 
(Dollars in millions) Tax Asset  Allowance  Tax Asset  Expiring 
Net operating losses – U.S.  $9,037  $  $9,037   After 2027 
Net operating losses – U.K.  9,432      9,432   None (1)
Net operating losses – othernon-U.S. 
  263   (36)  227   Various 
Net operating losses – U.S. states (2)
  2,221   (847)  1,374   Various 
Capital losses  1,530   (1,530)     After 2013 
General business credits  2,442      2,442   After 2027 
Alternative minimum and other tax credits  214      214   None 
Foreign tax credits  1,527   (306)  1,221   After 2017 
                 
(1)

The U.K. NOL may be carried forward indefinitely. Due tochange-in-control limitations in the three years prior to and following the change in ownership, this unlimited carryforward period may be jeopardized by certain major changes in the nature or conduct of the U.K. businesses.

(2)(2)

The NOL and related valuation allowance for U.S. states before considering the benefit of federal deductions were $1.9$3.4 billion and $682 million.

$1.3 billion.

The Corporation concluded that no valuation allowance is necessary to reduce the U.K. NOL, U.S. NOL and general business credit carryforwards since estimated future taxable income will be sufficient to utilize these assets prior to their expiration. With the acquisition of Merrill Lynch on January 1, 2009, the Corporation established a valuation allowance to reduce certain other deferred tax assets to the amount more-likely-than-not to be realized before their expiration. During 2010 and 2009, the Corporation released $1.7 billion and $650 million of the valuation allowance attributable to Merrill Lynch’s capital loss carryforward due to utilization against net capital gains generatedrealized in 2010 and 2009. The valuation allowance also increased by $139 million due primarily to increases in operating loss carryforwards and other deferred tax assets generated in certain state and foreign jurisdictions for which management believes it is more-likely-than-not that realization of these assets will not occur.

The Corporation concluded that no valuation allowance is necessary to reduce the U.K. NOL, U.S. federal NOL, and general business credit carryforwards since estimated future taxable income will be sufficient to utilize

these assets prior to their expiration. Merrill Lynch also has U.S. federal capital loss and foreign tax credit carryforwards against which valuation allowances have been recorded to reduce the assets to the amounts the Corporation believes are more-likely-than-not to be realized.

At December 31, 2010 and 2009, and 2008,U.S. federal income taxes had not been provided on $16.7$17.9 billion and $6.5$16.7 billion of undistributed earnings of foreignnon-U.S. subsidiaries earned prior to 1987 and after 1997 that have been reinvested for an indefinite period of time. If the earnings were distributed, an additional $2.5$2.6 billion and $1.1$2.5 billion of tax expense, net of credits for foreignnon-U.S. taxes paid on such earnings and for the related foreignnon-U.S. withholding taxes, would have resulted as of December 31, 20092010 and 2008.

2009.

Bank of America 2009185


NOTE 20 – 22 Fair Value Measurements

Under applicable accounting guidance, fair value is defined as the exchange price that would be received for an asset or paid to transfer a liability (an exit price) in the principal or most advantageous market for the asset or liability in an orderly transaction between market participants on the measurement date. The Corporation determines the fair values of its financial instruments based on the fair value hierarchy established under applicable accounting guidance which requires an entity to maximize the use of observable inputs and minimize the use of unobservable inputs when measuring fair value. There are three levels of inputs that may be used to measure fair value. For more information regarding the fair value hierarchy and how the Corporation measures fair value, seeNote 1 – Summary of Significant Accounting Principles. The Corporation accounts for certain corporate loans and loan commitments, LHFS, structured reverse repurchase agreements, long-term deposits and long-term debt under the fair value option. For a detailed discussion regarding the fair value hierarchy and how the Corporation measures fair value,more informations, seeNote 123 – Summary of Significant Accounting PrinciplesFair Value Option.

Level 1, 2 and 3 Valuation Techniques

Financial instruments are considered Level 1 when the valuation can beis based on quoted prices in active markets for identical assets or liabilities. Level 2 financial instruments are valued using quoted prices for similar assets or liabilities, quoted prices in markets that are not active, or models using inputs that are observable or can be corroborated by observable market data offor substantially the full term of the assets or liabilities. Financial instruments are considered Level 3 when their values are determined using pricing models, discounted cash flow methodologies or similar techniques, and at least one significant model assumption or input is unobservable and when determination of the fair value requires significant management judgment or estimation.

The Corporation also uses market indices for direct inputs to certain models where the cash settlement is directly linked to appreciation or depreciation of that particular index (primarily in the context of structured credit products). In those cases, no material adjustments are made to the index-based values. In other cases, the use of market indices is inherently limited because the fair value of an individual position being valued may not move in tandem with changes in fair value of a specific market index. Accordingly, market indices are also used as inputs to the valuation, but are adjusted for trade specific factors such as rating, credit quality, vintage and other factors.


220     Bank of America 2010


Trading Account Assets and Liabilities andAvailable-for-Sale Debt Securities

The fair values of trading account assets and liabilities are primarily based on actively traded markets where prices are based on either direct market quotes or observed transactions. The fair values of AFS debt securities are generally based on quoted market prices or market prices for similar assets. Liquidity is a significant factor in the determination of the fair values of trading account assets and liabilities and AFS debt securities. Market price quotes may not be readily available for some positions, or positions within a market sector where trading activity has slowed significantly or ceased such as certain CDO positions and other ABS.ceased. Some of these instruments are valued using a discounted cash flow model, which estimates the fair value of the securities using internal credit risk, interest rate and prepayment risk models that incorporate management’s best estimate of current key assumptions such as default rates, loss severity and prepayment rates. Principal and interest cash flows are discounted using an observable discount rate for similar instruments with adjustments that management believes a market participant would consider in determining fair value for the specific security. Others are valued using a net asset value approach which considers the value of the underlying securities. Underlying assets are valued using external pricing services, where available, or matrix pricing based on the vintages and ratings. Situations of illiquidity generally are triggered by the market’s perception of credit uncertainty regarding a single company or a specific market sector. In these instances, fair value is determined based on limited available market information and other factors, principally from reviewing the issuer’s

financial statements and changes in credit ratings made by one or more ratings agencies.

Derivative Assets and Liabilities

The fair values of derivative assets and liabilities traded in theover-the-counter (OTC) market are determined using quantitative models that require the use ofutilize multiple market inputs including interest rates, prices and indices to generate continuous yield or pricing curves and volatility factors which are used to value the position. The majority of market inputs are actively quoted and can be validated through external sources, including brokers, market transactions and third-party pricing services. Estimation risk is greater for derivative asset and liability positions that are either option-based or have longer maturity dates where observable market inputs are less readily available or are unobservable, in which case, quantitative-based extrapolations of rate, price or index scenarios are used in determining fair values. The fair values of derivative assets and liabilities include adjustments for market liquidity, counterparty credit quality and other deal specific factors, where appropriate. The Corporation incorporates within its fair value measurements of over-the-counterOTC derivatives the net credit differential between the counterparty credit risk and the Corporation’s own credit risk. An estimate of severity of loss is also used in the determination of fair value, primarily based on market data.

Corporate Loans and Loan Commitments

The fair values of loans and loan commitments are based on market prices, where available, or discounted cash flow analyses using market-based credit spreads of comparable debt instruments or credit derivatives of the specific borrower or comparable borrowers. Results of discounted cash flow calculations may be adjusted, as appropriate, to reflect other market conditions or the perceived credit risk of the borrower.

Mortgage Servicing Rights

The fair values of MSRs are determined using models which dependthat rely on estimates of prepayment rates, the resultant weighted-average lives of the MSRs and

the OAS levels. For more information on MSRs, seeNote 2225 – Mortgage Servicing Rights.

LoansHeld-for-Sale

The fair values of LHFS are based on quoted market prices, where available, or are determined by discounting estimated cash flows using interest rates approximating the Corporation’s current origination rates for similar loans adjusted to reflect the inherent credit risk.

Other Assets

The Corporation estimates the fair values of certain other assets including AFS marketable equity securities and certain retained residual interests in securitization vehicles.

The fair values of AFS marketable equity securities are generally based on quoted market prices or market prices for similar assets. However, non-public investments are initially valued at the transaction price and subsequently adjusted when evidence is available to support such adjustments. The fair value of retained residual interests in securitization vehicles are based on certain observable inputs such as interest rates and credit spreads, as well as unobservable inputs such as estimated net charge-off and payment rates.


186Bank of America 2009


Securities Financing Agreements

The fair values of certain reverse repurchase arrangements,agreements, repurchase arrangementsagreements and securities borrowed transactions are determined using quantitative models, including discounted cash flow models that require the use of multiple market inputs including interest rates and spreads to generate continuous yield or pricing curves, and volatility factors. The majority of market inputs are actively quoted and can be validated through external sources, including brokers, market transactions and third partythird-party pricing services.

Deposits, Commercial Paper and Other Short-term Borrowings and Certain Structured Notes Classified as Long-term Debt

The fair values of deposits, commercial paper and other short-term borrowings and certain structured notes that are classified as long-term debt are determined using quantitative models, including discounted cash

flow models that require the use of multiple market inputs including interest rates and spreads to generate continuous yield or pricing curves, and volatility factors. The majority of market inputs are actively quoted and can be validated through external sources, including brokers, market transactions and third partythird-party pricing services. The Corporation considers the impact of its own creditworthinesscredit spreads in the valuation of these liabilities. The credit risk is determined by reference to observable credit spreads in the secondary cash market.

Long-term Borrowings
The Corporation issues structured notes that have coupons or repayment terms linked to the performance of debt or equity securities, indices, currencies or commodities. The fair value of structured notes is estimated using valuation models for the combined derivative and debt portions of the notes accounted for under the fair value option. These models incorporate observable and, in some instances, unobservable inputs including security prices, interest rate yield curves, option volatility, currency, commodity or equity rates and correlations between these inputs. The impact of the Corporation’s own credit spreads is also included based on the Corporation’s observed secondary bond market spreads.
Asset-backed Secured Financings

The fair values of asset-backed secured financings are based on external broker bids, where available, or are determined by discounting estimated cash flows using interest rates approximating the Corporation’s current origination rates for similar loans adjusted to reflect the inherent credit risk.


Bank of America 2010     221


Recurring Fair Value

Assets and liabilities carried at fair value on a recurring basis at December 31, 2010 and 2009, including financial instruments which the Corporation accounts for under the fair value option, are summarized in the table below.

  December 31, 2009
  Fair Value Measurements Using           
(Dollars in millions) Level 1    Level 2    Level 3    Netting
Adjustments (1)
     Assets/Liabilities
at Fair Value

Assets


Federal funds sold and securities borrowed or purchased under agreements to resell

 $    $57,775    $    $      $57,775

Trading account assets:


U.S. government and agency securities

  17,140     27,445                 44,585

Corporate securities, trading loans and other

  4,772     41,157     11,080            57,009

Equity securities

  25,274     7,204     1,084            33,562

Foreign sovereign debt

  18,353     8,647     1,143            28,143

Mortgage trading loans and asset-backed securities

       11,137     7,770            18,907

Total trading account assets

  65,539     95,590     21,077            182,206

Derivative assets

  3,326     1,467,855     23,048     (1,413,540     80,689

Available-for-sale debt securities:


U.S. Treasury securities and agency debentures

  19,571     3,454                 23,025

Mortgage-backed securities:


Agency

       166,246                 166,246

Agency-collateralized mortgage obligations

       25,781                 25,781

Non-agency residential

       27,887     7,216            35,103

Non-agency commercial

       6,651     258            6,909

Foreign securities

  158     3,271     468            3,897

Corporate/Agency bonds

       5,265     927            6,192

Other taxable securities

  676     14,017     4,549            19,242

Tax-exempt securities

       8,278     6,928            15,206

Total available-for-sale debt securities

  20,405     260,850     20,346            301,601

Loans and leases

            4,936            4,936

Mortgage servicing rights

            19,465            19,465

Loans held-for-sale

       25,853     6,942            32,795

Other assets

  35,411     12,677     7,821            55,909

Total assets

 $124,681    $1,920,600    $103,635    $(1,413,540    $735,376

Liabilities


Interest-bearing deposits in domestic offices

 $    $1,663    $    $      $1,663

Federal funds purchased and securities loaned or sold under agreements to repurchase

       37,325                 37,325

Trading account liabilities:


U.S. government and agency securities

  22,339     4,180                 26,519

Equity securities

  17,300     1,107                 18,407

Foreign sovereign debt

  12,028     483     386            12,897

Corporate securities and other

  282     7,317     10            7,609

Total trading account liabilities

  51,949     13,087     396            65,432

Derivative liabilities

  2,925     1,443,494     15,185     (1,417,876     43,728

Commercial paper and other short-term borrowings

       813                 813

Accrued expenses and other liabilities

  16,797     620     1,598            19,015

Long-term debt

       40,791     4,660            45,451

Total liabilities

 $71,671    $1,537,793    $21,839    $(1,417,876    $213,427
following tables.
                     
  December 31, 2010 
  Fair Value Measurements  Netting  Assets/Liabilities 
(Dollars in millions) Level 1 (1)  Level 2(1)  Level 3  Adjustments(2)  at Fair Value 
Assets
                    
Federal funds sold and securities borrowed or purchased under agreements to resell $  $78,599  $  $  $78,599 
Trading account assets:                    
U.S. government and agency securities  17,647   43,164         60,811 
Corporate securities, trading loans and other  732   40,869   7,751      49,352 
Equity securities  23,249   8,257   623      32,129 
Non-U.S. sovereign debt
  24,934   8,346   243      33,523 
Mortgage trading loans and asset-backed securities     11,948   6,908      18,856 
                     
Total trading account assets  66,562   112,584   15,525      194,671 
Derivative assets (3)
  2,627   1,516,244   18,773   (1,464,644)  73,000 
Available-for-sale debt securities:
                    
U.S. Treasury securities and agency securities  46,003   3,102         49,105 
Mortgage-backed securities:                    
Agency     191,213   4      191,217 
Agency-collateralized mortgage obligations     37,017         37,017 
Non-agency residential     21,649   1,468      23,117 
Non-agency commercial     6,833   19      6,852 
Non-U.S. securities
  1,440   2,696   3      4,139 
Corporate/Agency bonds     5,154   137      5,291 
Other taxable securities  20   2,354   13,018      15,392 
Tax-exempt securities     4,273   1,224      5,497 
                     
Totalavailable-for-sale debt securities
  47,463   274,291   15,873      337,627 
Loans and leases        3,321      3,321 
Mortgage servicing rights        14,900      14,900 
Loansheld-for-sale
     21,802   4,140      25,942 
Other assets  32,624   31,051   6,856      70,531 
                     
Total assets
 $149,276  $2,034,571  $79,388  $(1,464,644) $798,591 
                     
Liabilities
                    
Interest-bearing deposits in U.S. offices $  $2,732  $  $  $2,732 
Federal funds purchased and securities loaned or sold under agreements to repurchase     37,424         37,424 
Trading account liabilities:                    
U.S. government and agency securities  23,357   5,983         29,340 
Equity securities  14,568   914         15,482 
Non-U.S. sovereign debt
  14,748   1,065         15,813 
Corporate securities and other  224   11,119   7      11,350 
                     
Total trading account liabilities  52,897   19,081   7      71,985 
Derivative liabilities (3)
  1,799   1,492,963   11,028   (1,449,876)  55,914 
Commercial paper and other short-term borrowings     6,472   706      7,178 
Accrued expenses and other liabilities  31,470   931   828      33,229 
Long-term debt     47,998   2,986      50,984 
                     
Total liabilities
 $86,166  $1,607,601  $15,555  $(1,449,876) $259,446 
                     
(1)

Gross transfers between Level 1 and Level 2 were approximately $1.3 billion during the year ended December 31, 2010.
(2)Amounts represent the impact of legally enforceable master netting agreements that allow the Corporation to settle positive and negative positions and also cash collateral held or placed with the same counterparties.

(3)For further disaggregation of derivative assets and liabilities, seeNote 4 – Derivatives.
222     Bank of America 2010


  December 31, 2009 
  Fair Value Measurements       
    Netting
  Assets/Liabilities
 
(Dollars in millions) Level 1  Level 2  Level 3  Adjustments(1)  at Fair Value 
Assets
                    
Federal funds sold and securities borrowed or purchased under agreements to resell $  $57,775  $  $  $57,775 
Trading account assets:                    
U.S. government and agency securities  17,140   27,445         44,585 
Corporate securities, trading loans and other  4,772   41,157   11,080      57,009 
Equity securities  25,274   7,204   1,084      33,562 
Non-U.S. sovereign debt
  19,827   7,173   1,143      28,143 
Mortgage trading loans and asset-backed securities     11,137   7,770      18,907 
                     
Total trading account assets  67,013   94,116   21,077      182,206 
Derivative assets  3,326   1,467,855   23,048   (1,406,607)  87,622 
Available-for-sale debt securities:
                    
U.S. Treasury securities and agency securities  19,571   3,454         23,025 
Mortgage-backed securities:                    
Agency     166,246         166,246 
Agency-collateralized mortgage obligations     25,781         25,781 
Non-agency residential     27,887   7,216      35,103 
Non-agency commercial     6,651   258      6,909 
Non-U.S. securities
  660   2,769   468      3,897 
Corporate/Agency bonds     5,265   927      6,192 
Other taxable securities  676   14,721   9,854      25,251 
Tax-exempt securities     7,574   1,623      9,197 
                     
Totalavailable-for-sale debt securities
  20,907   260,348   20,346      301,601 
Loans and leases        4,936      4,936 
Mortgage servicing rights        19,465      19,465 
Loansheld-for-sale
     25,853   6,942      32,795 
Other assets  35,411   12,677   7,821      55,909 
                     
Total assets
 $126,657  $1,918,624  $103,635  $(1,406,607) $742,309 
                     
Liabilities
                    
Interest-bearing deposits in U.S. offices $  $1,663  $  $  $1,663 
Federal funds purchased and securities loaned or sold under agreements to repurchase     37,325         37,325 
Trading account liabilities:                    
U.S. government and agency securities  22,339   4,180         26,519 
Equity securities  17,300   1,107         18,407 
Non-U.S. sovereign debt
  12,028   483   386      12,897 
Corporate securities and other  282   7,317   10      7,609 
                     
Total trading account liabilities  51,949   13,087   396      65,432 
Derivative liabilities  2,925   1,443,494   15,185   (1,410,943)  50,661 
Commercial paper and other short-term borrowings     813   707      1,520 
Accrued expenses and other liabilities  16,797   620   891      18,308 
Long-term debt     40,791   4,660      45,451 
                     
Total liabilities
 $71,671  $1,537,793  $21,839  $(1,410,943) $220,360 
                     
Bank of America 2009187


Assets and liabilities carried at fair value on a recurring basis at December 31, 2008, including financial instruments which the Corporation accounts for under the fair value option, are summarized in the table below.

  December 31, 2008
  Fair Value Measurements Using         
(Dollars in millions) Level 1    Level 2    Level 3    Netting
Adjustments (1)
   Assets/Liabilities
at Fair Value

Assets


Federal funds sold and securities borrowed or purchased under agreements to resell

 $    $2,330    $    $    $2,330

Trading account assets

  44,571     83,011     6,733          134,315

Derivative assets

  2,109     1,525,106     8,289     (1,473,252   62,252

Available-for-sale debt securities

  2,789     255,413     18,702          276,904

Loans and leases

            5,413          5,413

Mortgage servicing rights

            12,733          12,733

Loans held-for-sale

       15,582     3,382          18,964

Other assets

  25,407     25,549     4,157          55,113

Total assets

 $74,876    $1,906,991    $59,409    $(1,473,252  $568,024

Liabilities


Interest-bearing deposits in domestic offices

 $    $1,717    $    $    $1,717

Trading account liabilities

  37,410     14,313               51,723

Derivative liabilities

  4,872     1,488,509     6,019     (1,468,691   30,709

Accrued expenses and other liabilities

  5,602          1,940          7,542

Total liabilities

 $47,884    $1,504,539    $7,959    $(1,468,691  $91,691
(1)

Amounts represent the impact of legally enforceable master netting agreements that allow the Corporation to settle positive and negative positions and also cash collateral held or placed with the same counterparties.

188Bank of America 2009
Bank of America 2010     223


The following tables below present a reconciliation of all assets and liabilities measured at fair value on a recurring basis using significant unobservable inputs (Level 3) during 2010, 2009 and 2008, and 2007, including net realized and unrealized gains (losses) included in earnings and accumulated OCI.

Level 3 – Fair Value Measurements

  2009 
(Dollars in millions) Balance
January 1,
2009 (1)
   

Merrill

Lynch

Acquisition


Gains

(Losses)

Included in
Earnings


Gains

(Losses)

Included
in OCI

   Purchases,
Issuances
and
Settlements
   Transfers
into / (out of)
Level 3 (1)
   Balance
December 31,
2009 (1)
 

Trading account assets:


Corporate securities, trading loans and other

 $4,540    $7,012    $370    $    $(2,015  $1,173    $11,080  

Equity securities

  546     3,848     (396        (2,425   (489   1,084  

Foreign sovereign debt

       30     136          167     810     1,143  

Mortgage trading loans and asset-backed securities

  1,647     7,294     (262        933     (1,842   7,770  

Total trading account assets

  6,733     18,184     (152        (3,340   (348   21,077  

Net derivative assets(2)

  2,270     2,307     5,526          (7,906   5,666     7,863  

Available-for-sale debt securities:


Non-agency MBS:


Residential

  5,439     2,509     (1,159   2,738     (4,187   1,876     7,216  

Commercial

  657          (185   (7   (155   (52   258  

Foreign securities

  1,247          (79   (226   (73   (401   468  

Corporate/Agency bonds

  1,598          (22   127     324     (1,100   927  

Other taxable securities

  9,599          (75   669     (4,490   (1,154   4,549  

Tax-exempt securities

  162          2     26     6,093     645     6,928  

Total available-for-sale debt securities

  18,702     2,509     (1,518   3,327     (2,488   (186   20,346  

Loans and leases(3)

  5,413     2,452     515          (3,718   274     4,936  

Mortgage servicing rights

  12,733     209     5,286          1,237          19,465  

Loans held-for-sale(3)

  3,382     3,872     678          (1,048   58     6,942  

Other assets(4)

  4,157     2,696     1,273          (308   3     7,821  

Trading account liabilities:


Foreign sovereign debt

            (38             (348   (386

Corporate securities and other

                      4     (14   (10

Total trading account liabilities

            (38        4     (362   (396

Accrued expenses and other
liabilities(3)

  (1,940   (1,337   1,385          294          (1,598

Long-term debt(3)

       (7,481   (2,310        830     4,301     (4,660
  2008 
(Dollars in millions) Balance
January 1,
2008 (1)
   Countrywide
Acquisition
   

Gains
(Losses)

Included in
Earnings


Gains
(Losses)

Included
in OCI

   Purchases,
Issuances
and
Settlements
   

Transfers
into / (out of)

Level 3 (1)


Balance

December 31,
2008 (1)


Trading account assets

 $4,027    $    $(3,222  $    $(1,233  $7,161    $6,733  

Net derivative assets(2)

  (1,203   (185   2,531          1,380     (253   2,270  

Available-for-sale debt securities

  5,507     528     (2,509   (1,688   2,754     14,110     18,702  

Loans and leases(3)

  4,590          (780        1,603          5,413  

Mortgage servicing rights

  3,053     17,188     (7,115        (393        12,733  

Loans held-for-sale(3)

  1,334     1,425     (1,047        (542   2,212     3,382  

Other assets(4)

  3,987     1,407     175          (1,372   (40   4,157  

Accrued expenses and other
liabilities(3)

  (660   (1,212   (169        101          (1,940
                                 
  2010 
        Gains
  Gains
  Purchases,
  Gross
  Gross
    
  Balance
     (Losses)
  (Losses)
  Issuances
  Transfers
  Transfers
  Balance
 
  January 1
  Consolidation
  Included in
  Included in
  and
  into
  out of
  December 31
 
(Dollars in millions) 2010 (1)  of VIEs  Earnings  OCI  Settlements  Level 3 (1)  Level 3 (1)  2010(1) 
Trading account assets:                                
Corporate securities, trading loans and other $11,080  $117  $848  $  $(4,852) $2,599  $(2,041) $7,751 
Equity securities  1,084      (81)     (342)  131   (169)  623 
Non-U.S. sovereign debt
  1,143      (138)     (157)  115   (720)  243 
Mortgage trading loans and asset-backed securities  7,770   175   653      (1,659)  396   (427)  6,908 
                                 
Total trading account assets  21,077   292   1,282      (7,010)  3,241   (3,357)  15,525 
Net derivative assets (2)
  7,863      8,118      (8,778)  1,067   (525)  7,745 
Available-for-sale debt securities:
                                
Agency              4         4 
Non-agency MBS:                                
Residential  7,216   113   (646)  (169)  (6,767)  1,909   (188)  1,468 
Commercial  258      (13)  (31)  (178)  71   (88)  19 
Non-U.S. securities
  468      (125)  (75)  (321)  56      3 
Corporate/Agency bonds  927      (3)  47   (847)  32   (19)  137 
Other taxable securities  9,854   5,603   (296)  44   (3,263)  1,119   (43)  13,018 
Tax-exempt securities  1,623      (25)  (9)  (574)  316   (107)  1,224 
                                 
Totalavailable-for-sale debt securities
  20,346   5,716   (1,108)  (193)  (11,946)  3,503   (445)  15,873 
Loans and leases (3)
  4,936      (89)     (1,526)        3,321 
Mortgage servicing rights  19,465      (4,321)     (244)        14,900 
Loansheld-for-sale (3)
  6,942      482      (3,714)  624   (194)  4,140 
Other assets (4)
  7,821      1,946      (2,612)     (299)  6,856 
Trading account liabilities:                                
Non-U.S. sovereign debt
  (386)     23      (17)     380    
Corporate securities and other  (10)     (5)     11   (52)  49   (7)
                                 
Total trading account liabilities  (396)     18      (6)  (52)  429   (7)
Commercial paper and other short-term borrowings (3)
  (707)     (95)     96         (706)
Accrued expenses and other liabilities (3)
  (891)     146      (83)        (828)
Long-term debt (3)
  (4,660)     697      1,074   (1,881)  1,784   (2,986)
                                 
(1)

Assets (liabilities)

. For assets, increase / (decrease) to Level 3 and for liabilities, (increase) / decrease to Level 3.
(2)

Net derivatives at December 31, 2009 and 20082010 include derivative assets of $23.0 billion and $8.3$18.8 billion and derivative liabilities of $15.2 billion and $6.0 billion, respectively.

$11.0 billion.
(3)

Amounts represent items which are accounted for under the fair value option including commercial loans, loan commitments and LHFS.

option.
(4)

Other assets is primarily comprised of AFS marketable equity securities and other equity investments.

securities.

During 2010, the more significant transfers into Level 3 included $3.2 billion of trading account assets, $3.5 billion of AFS debt securities, $1.1 billion of net derivative contracts and $1.9 billion of long-term debt. Transfers into Level 3 for trading account assets were driven by reduced price transparency as a result of lower levels of trading activity for certain municipal auction rate securities and corporate debt securities as well as a change in valuation methodology for certain ABS to a discounted cash flow model. Transfers into Level 3 for AFS debt securities were due to an increase in the number of non-agency RMBS and other taxable securities priced using a discounted cash flow model. Transfers into Level 3 for net derivative contracts were primarily related to a lack of price observability for certain credit default and total return

swaps. Transfers in and transfers out of Level 3 for long-term debt are primarily due to changes in the impact of unobservable inputs on the value of certain equity-linked structured notes.
During 2010, the more significant transfers out of Level 3 were $3.4 billion of trading account assets and $1.8 billion of long-term debt. Transfers out of Level 3 for trading account assets were driven by increased price verification of certain mortgage-backed securities, corporate debt andnon-U.S. government and agency securities. Transfers out of Level 3 for long-term debt were the result of a decrease in the significance of unobservable pricing inputs for certain equity-linked structured notes.


224     Bank of America 2010


Level 3 – Fair Value Measurements
                             
  2009 
        Gains
  Gains
          
  Balance
  Merrill
  (Losses)
  (Losses)
  Purchases,
  Transfers
  Balance
 
  January 1
  Lynch
  Included in
  Included in
  Issuances and
  into/(out of)
  December 31
 
(Dollars in millions) 2009 (1)  Acquisition  Earnings  OCI  Settlements  Level 3 (1)  2009(1) 
Trading account assets:                            
Corporate securities, trading loans and other $4,540  $7,012  $370  $  $(2,015) $1,173  $11,080 
Equity securities  546   3,848   (396)     (2,425)  (489)  1,084 
Non-U.S. sovereign debt
     30   136      167   810   1,143 
Mortgage trading loans and asset-backed securities  1,647   7,294   (262)     933   (1,842)  7,770 
                             
Total trading account assets  6,733   18,184   (152)     (3,340)  (348)  21,077 
Net derivative assets (2)
  2,270   2,307   5,526      (7,906)  5,666   7,863 
Available-for-sale debt securities:
                            
Non-agency MBS:                            
Residential  5,439   2,509   (1,159)  2,738   (4,187)  1,876   7,216 
Commercial  657      (185)  (7)  (155)  (52)  258 
Non-U.S. securities
  1,247      (79)  (226)  (73)  (401)  468 
Corporate/Agency bonds  1,598      (22)  127   324   (1,100)  927 
Other taxable securities  9,599      (75)  669   815   (1,154)  9,854 
Tax-exempt securities  162      2   26   788   645   1,623 
                             
Totalavailable-for-sale debt securities
  18,702   2,509   (1,518)  3,327   (2,488)  (186)  20,346 
Loans and leases (3)
  5,413   2,452   515      (3,718)  274   4,936 
Mortgage servicing rights  12,733   209   5,286      1,237      19,465 
Loansheld-for-sale (3)
  3,382   3,872   678      (1,048)  58   6,942 
Other assets (4)
  4,157   2,696   1,273      (308)  3   7,821 
Trading account liabilities:                            
Non-U.S. sovereign debt
        (38)        (348)  (386)
Corporate securities and other              4   (14)  (10)
                             
Total trading account liabilities        (38)     4   (362)  (396)
Commercial paper and other short-term borrowings (3)
  (816)     (11)     120      (707)
Accrued expenses and other liabilities (3)
  (1,124)  (1,337)  1,396      174      (891)
Long-term debt (3)
     (7,481)  (2,310)     830   4,301   (4,660)
                             
Bank of America 2009189


Level 3Fair Value Measurements

  2007 
(Dollars in millions) Balance
January 1,
2007 (1)
   

Gains

(Losses)

Included in
Earnings


Gains
(Losses)

Included
in OCI

   Purchases,
Issuances,
and
Settlements
   

Transfers

into / (out of)
Level 3 (1)


Balance

December 31,
2007 (1)


Trading account assets(2)

 $303    $(2,959  $    $708    $5,975    $4,027  

Net derivative assets(3)

  788     (341        (333   (1,317   (1,203

Available-for-sale debt securities(2)

  1,133     (398   (206   4,588     390     5,507  

Loans and leases

  3,947     (140        783          4,590  

Mortgage servicing rights(2)

  2,869     231          (47        3,053  

Loans held-for-sale(2)

       (90        (1,259   2,683     1,334  

Other assets(4)

  6,605     2,149     (79   (4,638   (50   3,987  

Accrued expenses and other liabilities

  (349   (279        (32        (660
(1)

Assets (liabilities)

. For assets, increase / (decrease) to Level 3 and for liabilities, (increase) / decrease to Level 3.
(2)

Amounts represent items which were carried at fair value prior to the adoption of the fair value option.

(3)

Net derivatives at December 31, 2007 included2009 include derivative assets of $9.0$23.0 billion and derivative liabilities of $10.2$15.2 billion.

(3)Amounts at January 1, 2007 wererepresent items which are accounted for at fair value prior to the adoption ofunder the fair value option.

(4)

Other assets is primarily comprised of AFS marketable equity securities and other equity investments.

securities.

Level 3 – Fair Value Measurements
                             
  2008 
        Gains
  Gains
          
  Balance
     (Losses)
  (Losses)
  Purchases,
  Transfers
  Balance
 
  January 1
  Countrywide
  Included in
  Included in
  Issuances and
  into/(out of)
  December 31
 
(Dollars in millions) 2008 (1)  Acquisition  Earnings  OCI  Settlements  Level 3 (1)  2008(1) 
Trading account assets $4,027  $  $(3,222) $  $(1,233) $7,161  $6,733 
Net derivative assets (2)
  (1,203)  (185)  2,531      1,380   (253)  2,270 
Available-for-sale debt securities
  5,507   528   (2,509)  (1,688)  2,754   14,110   18,702 
Loans and leases (3)
  4,590      (780)     1,603      5,413 
Mortgage servicing rights  3,053   17,188   (7,115)     (393)     12,733 
Loansheld-for-sale (3)
  1,334   1,425   (1,047)     (542)  2,212   3,382 
Other assets (4)
  3,987   1,407   175      (1,372)  (40)  4,157 
Accrued expenses and other liabilities (3)
  (660)  (1,212)  (169)     101      (1,940)
                             
190(1)BankAssets (liabilities). For assets, increase / (decrease) to Level 3 and for liabilities, (increase) / decrease to Level 3.
(2)Net derivatives at December 31, 2008 include derivative assets of America 2009$8.3 billion and derivative liabilities of $6.0 billion.
(3)Amounts represent items which are accounted for under the fair value option.
(4)Other assets is primarily comprised of AFS marketable equity securities.
Bank of America 2010     225


The following tables below summarize gains and losses due to changes in fair value, including both realized and unrealized gains (losses), recorded in earnings for Level 3 assets and liabilities during 2010, 2009 2008 and 2007.2008. These amounts include those gains (losses) generated byon loans, LHFS, loan commitments and structured notes which are accounted for under the fair value option.

Level 3 – Total Realized and Unrealized Gains (Losses) Included in Earnings

  2009 
(Dollars in millions) Card Income
(Loss)
    Equity
Investment
Income
    Trading
Account
Profits
(Losses)
   Mortgage
Banking
Income
(Loss) (1)
   Other
Income
(Loss)
   Total 

Trading account assets:


Corporate securities, trading loans and other

 $    $    $370    $    $    $370  

Equity securities

            (396             (396

Foreign sovereign debt

            136               136  

Mortgage trading loans and asset-backed securities

            (262             (262

Total trading account assets

            (152             (152

Net derivative assets

            (2,526   8,052          5,526  

Available-for-sale debt securities:


Non-agency MBS:


Residential

                 (20   (1,139   (1,159

Commercial

                      (185   (185

Foreign securities

                      (79   (79

Corporate/Agency bonds

                      (22   (22

Other taxable securities

                      (75   (75

Tax-exempt securities

                      2     2  

Total available-for-sale debt securities

                 (20   (1,498   (1,518

Loans and leases(2)

            (11        526     515  

Mortgage servicing rights

                 5,286          5,286  

Loans held-for-sale(2)

            (216   306     588     678  

Other assets

  21     947          244     61     1,273  

Trading account liabilities – Foreign sovereign debt

            (38             (38

Accrued expenses and other liabilities(2)

            36     (11   1,360     1,385  

Long-term debt(2)

            (2,083        (227   (2,310

Total

 $21    $947    $(4,990  $13,857    $810    $10,645  
  2008 

Trading account assets

 $    $    $(3,044  $(178  $    $(3,222

Net derivative assets

            103     2,428          2,531  

Available-for-sale debt securities

                 (74   (2,435   (2,509

Loans and leases(2)

            (5        (775   (780

Mortgage servicing rights

                 (7,115        (7,115

Loans held-for-sale(2)

            (195   (848   (4   (1,047

Other assets

  55     110               10     175  

Accrued expenses and other liabilities(2)

            9     295     (473   (169

Total

 $55    $110    $(3,132  $(5,492  $(3,677  $(12,136
  2007 

Trading account assets(3)

 $    $    $(2,959  $    $    $(2,959

Net derivative assets(3)

            (515   174          (341

Available-for-sale debt securities(3, 4)

                      (398   (398

Loans and leases(2)

            (1        (139   (140

Mortgage servicing rights(3)

                 231          231  

Loans held-for-sale(2)

            (61   (29        (90

Other assets(5)

  103     1,971               75     2,149  

Accrued expenses and other liabilities(2)

            (5        (274   (279

Total

 $103    $1,971    $(3,541  $376    $(736  $(1,827
                     
  2010 
  Equity
  Trading
  Mortgage
       
  Investment
  Account
  Banking
  Other
    
  Income
  Profits
  Income
  Income
    
(Dollars in millions) (Loss)  (Losses)  (Loss)(1)  (Loss)  Total 
Trading account assets:                    
Corporate securities, trading loans and other $  $848  $  $  $848 
Equity securities     (81)        (81)
Non-U.S. sovereign debt
     (138)        (138)
Mortgage trading loans and asset-backed securities     653         653 
                     
Total trading account assets     1,282         1,282 
Net derivative assets     (1,257)  9,375      8,118 
Available-for-sale debt securities:
                    
Non-agency MBS:                    
Residential        (16)  (630)  (646)
Commercial           (13)  (13)
Non-U.S. securities
           (125)  (125)
Corporate/Agency bonds           (3)  (3)
Other taxable securities     (295)     (1)  (296)
Tax-exempt securities     23      (48)  (25)
                     
Totalavailable-for-sale debt securities
     (272)  (16)  (820)  (1,108)
Loans and leases (2)
           (89)  (89)
Mortgage servicing rights        (4,321)     (4,321)
Loansheld-for-sale (2)
        72   410   482 
Other assets  1,967      (21)     1,946 
Trading account liabilities –Non-U.S. sovereign debt
     18         18 
Commercial paper and other short-term borrowings (2)
        (95)     (95)
Accrued expenses and other liabilities (2)
     (26)     172   146 
Long-term debt (2)
     677      20   697 
                     
Total
 $1,967  $422  $4,994  $(307) $7,076 
                     
(1)

Mortgage banking income does not reflect the impact of Level 1 and Level 2 hedges againston MSRs.

(2)

Amounts represent items which are accounted for under the fair value option.

226     Bank of America 2010


Level 3 – Total Realized and Unrealized Gains (Losses) Included in Earnings
                     
  2009 
  Equity
  Trading
  Mortgage
       
  Investment
  Account
  Banking
  Other
    
  Income
  Profits
  Income
  Income
    
(Dollars in millions) (Loss)  (Losses)  (Loss) (1)  (Loss)  Total 
Trading account assets:                    
Corporate securities, trading loans and other $  $370  $  $  $370 
Equity securities     (396)        (396)
Non-U.S. sovereign debt
     136         136 
Mortgage trading loans and asset-backed securities     (262)        (262)
                     
Total trading account assets     (152)        (152)
Net derivative assets     (2,526)  8,052      5,526 
Available-for-sale debt securities:
                    
Non-agency MBS:                    
Residential        (20)  (1,139)  (1,159)
Commercial           (185)  (185)
Non-U.S. securities
           (79)  (79)
Corporate/Agency bonds           (22)  (22)
Other taxable securities           (73)  (73)
                     
Totalavailable-for-sale debt securities
        (20)  (1,498)  (1,518)
Loans and leases (2)
     (11)     526   515 
Mortgage servicing rights        5,286      5,286 
Loansheld-for-sale (2)
     (216)  306   588   678 
Other assets  968      244   61   1,273 
Trading account liabilities –Non-U.S. sovereign debt
     (38)        (38)
Commercial paper and other short-term borrowings (2)
        (11)     (11)
Accrued expenses and other liabilities (2)
     36      1,360   1,396 
Long-term debt (2)
     (2,083)     (227)  (2,310)
                     
Total
 $968  $(4,990) $13,857  $810  $10,645 
                     
                     
  2008 
Trading account assets $  $(3,044) $(178) $  $(3,222)
Net derivative assets     103   2,428      2,531 
Available-for-sale debt securities
        (74)  (2,435)  (2,509)
Loans and leases (2)
     (5)     (775)  (780)
Mortgage servicing rights        (7,115)     (7,115)
Loansheld-for-sale (2)
     (195)  (848)  (4)  (1,047)
Other assets  165         10   175 
Accrued expenses and other liabilities (2)
     9   295   (473)  (169)
                     
Total
 $165  $(3,132) $(5,492) $(3,677) $(12,136)
                     
(3)(1)

Amounts represent items which are carried at fair value prior to

Mortgage banking income does not reflect the adoptionimpact of the fair value option.

Level 1 and Level 2 hedges on MSRs.
(4)(2)

Amounts represent write-downs on certain securities that were deemed to be other-than-temporarily impaired during 2007.

(5)

Amounts represent items which are accounted for under the fair value option.

Bank of America 2009191
Bank of America 2010     227


The following tables below summarize changes in unrealized gains (losses) recorded in earnings during 2010, 2009 2008 and 20072008 for Level 3 assets and liabilities that were still held at December 31, 2010, 2009 2008 and 2007.2008. These amounts include changes in fair value generated byon loans, LHFS, loan commitments and structured notes which are accounted for under the fair value option.

Level 3 – Changes in Unrealized Gains (Losses) Relating to Assets and Liabilities Still Held at Reporting Date

  2009 
(Dollars in millions) Card Income
(Loss)
   Equity
Investment
Income
   Trading
Account
Profits
(Losses)
   Mortgage
Banking
Income
(Loss) (1)
   Other
Income
(Loss)
   Total 

Trading account assets:


Corporate securities, trading loans and other

 $    $    $89    $    $    $89  

Equity securities

            (328             (328

Foreign sovereign debt

            137               137  

Mortgage trading loans and asset-backed securities

            (332             (332

Total trading account assets

            (434             (434

Net derivative assets

            (2,761   348          (2,413

Available-for-sale debt securities:


Mortgage-backed securities:


Non-agency MBS:


Residential

                 (20   (659   (679

Other taxable securities

            (11        (3   (14

Tax-exempt securities

            (2        (8   (10

Total available-for-sale debt securities

            (13   (20   (670   (703

Loans and leases(2)

                      210     210  

Mortgage servicing rights

                 4,100          4,100  

Loans held-for-sale(2)

            (195   164     695     664  

Other assets

  (71   (106        6     1,061     890  

Trading account liabilities – Foreign sovereign debt

            (38             (38

Accrued expenses and other liabilities(2)

                 (11   1,740     1,729  

Long-term debt(2)

            (2,303        (225   (2,528

Total

 $(71  $(106  $(5,744  $4,587    $2,811    $1,477  
  2008 

Trading account assets

 $    $    $(2,144  $(178  $    $(2,322

Net derivative assets

            2,095     1,154          3,249  

Available-for-sale debt securities

                 (74   (1,840   (1,914

Loans and leases(2)

                      (1,003   (1,003

Mortgage servicing rights

                 (7,378        (7,378

Loans held-for-sale(2)

            (154   (423   (4   (581

Other assets

  (331   (193                  (524

Accrued expenses and other liabilities(2)

                 292     (880   (588

Total

 $(331  $(193  $(203  $(6,607  $(3,727  $(11,061
  2007 

Trading account assets(3)

 $    $    $(2,857  $    $    $(2,857

Net derivative assets(3)

            (196   139          (57

Available-for-sale debt securities(3)

                      (398   (398

Loans and leases(2)

                      (167   (167

Mortgage servicing rights(3)

                 (43        (43

Loans held-for-sale(2)

      (58   (22     (80

Other assets(4)

  (136   (65                  (201

Accrued expenses and other liabilities(4)

            (1        (395   (396

Total

 $(136  $(65  $(3,112  $74    $(960  $(4,199
                     
  2010 
  Equity
  Trading
  Mortgage
       
  Investment
  Account
  Banking
  Other
    
  Income
  Profits
  Income
  Income
    
(Dollars in millions) (Loss)  (Losses)  (Loss) (1)  (Loss)  Total 
Trading account assets:                    
Corporate securities, trading loans and other $  $289  $  $  $289 
Equity securities     (50)        (50)
Non-U.S. sovereign debt
     (144)        (144)
Mortgage trading loans and asset-backed securities     227         227 
                     
Total trading account assets     322         322 
Net derivative assets     (945)  676      (269)
Available-for-sale debt securities:
                    
Non-agency MBS:                    
Residential        (2)  (162)  (164)
Commercial               
Non-U.S. securities
               
Other taxable securities               
                     
Totalavailable-for-sale debt securities
        (2)  (162)  (164)
Loans and leases (2)
           (142)  (142)
Mortgage servicing rights        (5,740)     (5,740)
Loansheld-for-sale (2)
     10   (9)  258   259 
Other assets  50      (22)     28 
Trading account liabilities –Non-U.S. sovereign debt
     52         52 
Commercial paper and other short-term borrowings (2)
        (46)     (46)
Accrued expenses and other liabilities (2)
           (182)  (182)
Long-term debt (2)
     585      43   628 
                     
Total
 $50  $24  $(5,143) $(185) $(5,254)
                     
(1)

Mortgage banking income does not reflect the impact of Level 1 and Level 2 hedges againston MSRs.

(2)

Amounts represent items which are accounted for under the fair value option.

228     Bank of America 2010


Level 3 – Changes in Unrealized Gains (Losses) Relating to Assets and Liabilities Still Held at Reporting Date
                     
  2009 
  Equity
  Trading
  Mortgage
       
  Investment
  Account
  Banking
  Other
    
  Income
  Profits
  Income
  Income
    
(Dollars in millions) (Loss)  (Losses)  (Loss) (1)  (Loss)  Total 
Trading account assets:                    
Corporate securities, trading loans and other $  $89  $  $  $89 
Equity securities     (328)        (328)
Non-U.S. sovereign debt
     137         137 
Mortgage trading loans and asset-backed securities     (332)        (332)
                     
Total trading account assets     (434)        (434)
Net derivative assets     (2,761)  348      (2,413)
Available-for-sale debt securities:
                    
Non-agency MBS – Residential        (20)  (659)  (679)
Other taxable securities     (11)     (3)  (14)
Tax-exempt securities     (2)     (8)  (10)
                     
Totalavailable-for-sale debt securities
     (13)  (20)  (670)  (703)
Loans and leases (2)
           210   210 
Mortgage servicing rights        4,100      4,100 
Loansheld-for-sale (2)
     (195)  164   695   664 
Other assets  (177)     6   1,061   890 
Trading account liabilities –Non-U.S. sovereign debt
     (38)        (38)
Commercial paper and other short-term borrowings (2)
        (11)     (11)
Accrued expenses and other liabilities (2)
           1,740   1,740 
Long-term debt (2)
     (2,303)     (225)  (2,528)
                     
Total
 $(177) $(5,744) $4,587  $2,811  $1,477 
                     
                     
  2008 
Trading account assets $  $(2,144) $(178) $  $(2,322)
Net derivative assets     2,095   1,154      3,249 
Available-for-sale debt securities
        (74)  (1,840)  (1,914)
Loans and leases (2)
           (1,003)  (1,003)
Mortgage servicing rights        (7,378)     (7,378)
Loansheld-for-sale (2)
     (154)  (423)  (4)  (581)
Other assets  (524)           (524)
Accrued expenses and other liabilities (2)
        292   (880)  (588)
                     
Total
 $(524) $(203) $(6,607) $(3,727) $(11,061)
                     
(3)(1)

Mortgage banking income does not reflect the impact of Level 1 and Level 2 hedges on MSRs.
(2)Amounts represent items which were accounted for prior to the adoption of the fair value option.

(4)

Amounts represent items which were carried at fair value prior to the adoption of the fair value option and certain portfolios of LHFS which are accounted for under the fair value option.

192Bank of America 2009
Bank of America 2010     229


Nonrecurring Fair Value

Certain assets and liabilities are measured at fair value on a nonrecurring basis and are not included in the previous tables in this Note. These assets and liabilities primarily include LHFS, unfunded loan commitmentsheld-for-sale, goodwill and foreclosed properties. During 2010, the Corporation recorded goodwill impairment charges associated with theGlobal Card ServicesandHome Loans & Insurancebusiness segments of $10.4 billion and $2.0 billion. The fair value of the goodwill balance forGlobal Card ServicesandHome Loans & Insurancewas $11.9 billion and $2.8 billion at December 31, 2010. SeeNote 10 – Goodwill and Intangible Assetsfor additional information on the goodwill impairment charges. The amounts below represent only balances measured at fair value during the year and still held as of the reporting date.

Assets and Liabilities Measured at Fair Value on a Nonrecurring Basis

  At and for the Year Ended
December 31, 2009
       At and for the Year Ended
December 31, 2008
 
(Dollars in millions) Level 2    Level 3    (Losses)        Level 2    Level 3    (Losses) 

Assets


Loans held-for-sale

 $2,320    $7,248    $(1,288     $1,828    $9,782    $(1,699

Loans and leases(1)

  7     8,426     (4,858           2,131     (1,164

Foreclosed properties(2)

       644     (322           590     (171

Other assets

  31     322     (268                   
             
  December 31, 2010  Gains (Losses) 
(Dollars in millions) Level 2  Level 3  in 2010 
Assets
            
Loansheld-for-sale
 $931  $6,408  $174 
Loans and leases (1)
  23   11,917   (6,074)
Foreclosed properties (2)
  10   2,125   (240)
Other assets  8   95   (50)
             
             
  December 31, 2009  Gains (Losses) 
(Dollars in millions) Level 2  Level 3  in 2009 
Assets
            
Loansheld-for-sale
 $2,320  $7,248  $(1,288)
Loans and leases (1)
     8,602   (5,596)
Foreclosed properties (2)
     644   (322)
Other assets  31   322   (268)
             
(1)

Gains (losses) represent charge-offs associated with real estate-secured loans that exceed 180 days past due which are netted against the allowance for loan and lease losses.

due.
(2)

Amounts are included in other assets on the Consolidated Balance Sheet and represent fair value and related losses ofon foreclosed properties that were written down subsequent to their initial classification as foreclosed properties.

NOTE 23 Fair Value Option Elections

Corporate Loans and Loan Commitments

The Corporation elected to account for certain large corporate loans and loan commitments which exceeded the Corporation’s single name credit risk concentration guidelines under the fair value option. Lending commitments, both funded and unfunded, are actively managed and monitored and, as appropriate, credit risk for these lending relationships may be mitigated through the use of credit derivatives, with the Corporation’s public side credit view and market perspectives determining the size and timing of the hedging activity. These credit derivatives do not meet the requirements for derivatives designated as hedging instrumentsaccounting hedges and therefore are therefore carried at fair value with changes in fair value recorded in other income.income (loss). Electing the fair value option allows the Corporation to carry these loans and loan commitments at fair value, which is more consistent with management’s view of the underlying economics and the manner in which they are managed. In addition, accounting for these loans and loan commitments at fair value reduces the accounting asymmetry that would otherwise result from carrying the loans at historical cost and the credit derivatives at fair value.

At December 31, 2009 and 2008, funded loans which the Corporation elected to carry at fair value had an aggregate fair value of $4.9 billion and $5.4 billion recorded in loans and leases and an aggregate outstanding principal balance of $5.4 billion and $6.4 billion. At December 31, 2009 and 2008, unfunded loan commitments that the Corporation has elected to carry at fair value had an aggregate fair value of $950 million and $1.1 billion recorded in accrued expenses and other liabilities and an aggregate committed exposure of $27.0 billion and $16.9 billion. Interest income on these loans is recorded in interest and fees on loans and leases.

LoansHeld-for-Sale

The Corporation also elected to account for certain LHFS at fair value. Electing to usethe fair value option allows a better offset of the changes in fair values of the

loans and the derivative instruments used to economically hedge them. The Corporation has not elected to account for other LHFS under the fair value other LHFSoption primarily because these loans are floating ratefloating-rate loans that are not economically hedged using derivative instruments. At December 31, 2009 and 2008, residentialResidential mortgage loans,LHFS, commercial mortgage loans,LHFS and other LHFS are accounted for whichunder the fair value option was elected had an aggregate fair

value of $32.8 billion and $18.9 billion and an aggregate outstanding principal balance of $36.5 billion and $20.7 billion. Interestwith interest income on these loans isLHFS recorded in other interest income. TheseThe changes in fair value are mostlylargely offset by hedging activities. An immaterial portion of these amounts was attributable to changes in instrument-specific credit risk.

Other Assets

The Corporation elected to account for certain other assets under the fair value option for certain other assets. Other assets primarily represents non-marketable convertible preferred shares for which the Corporation has economically hedged a majority of the position with derivatives. At December 31, 2009, these assets had a fair value of $253 million.

including private equity investments.

Securities Financing Agreements

The Corporation elected the fair value option for certain securities financing agreements. The fair value option election was madeto account for certain securities financing agreements, including resale and repurchase agreements, under the fair value option based on the tenor of the agreements, which reflects the magnitude of the interest rate risk. The majority of securities financing agreements collateralized by U.S. government securities were excluded from the fair value option election as these contracts are generally short-dated and therefore the interest rate risk is not considered significant. At December 31, 2009, securities financing agreements for which the fair value option has been elected had an aggregate fair value of $95.1 billion and a principal balance of $94.6 billion.

Long-term Deposits

The Corporation elected to fair valueaccount for certain long-term fixed-rate and rate-linked deposits, which are economically hedged with derivatives. At December 31, 2009 and 2008, these instruments had an aggregatederivatives, under the fair value of $1.7 billion for both years ended and principal balance of $1.6 billion and $1.7 billion recorded in interest-bearing deposits. Interest paid on these instruments continues to be recorded in interest expense.option. Election of the fair value option will allowallows the Corporation to reduce the accounting volatility that would otherwise result from the accounting asymmetry created by accounting for the financial instruments at historical cost and the economic hedges at fair value. The Corporation did not elect to carry other long-term deposits at fair value other financial instruments within the same balance sheet category because they were not economically hedged using derivatives.


Bank of America 2009193


Commercial Paper and Other Short-term Borrowings

The Corporation elected to fair valueaccount for certain commercial paper and other short-term borrowings that were acquired as part ofunder the Merrill Lynch acquisition.fair value option. This debt is risk-managed on a fair value basis. At December 31, 2009, this debt had both an aggregate fair value and a principal balance of $813 million recorded in commercial paper and other short-term borrowings.

Long-term Debt

The Corporation elected to fair valueaccount for certain long-term debt, primarily structured notes that were acquired as part of the Merrill Lynch acquisition.acquisition, under the fair value option. This long-term debt is risk-managed on a fair value basis. Election of the fair value option will allowallows the Corporation to reduce the accounting volatility that would otherwise result from the accounting asymmetry created by accounting for thethese financial instruments at historical cost and the related economic hedges at fair value. The Corporation did not elect to fair value other financial instruments within the same balance sheet category because they were not economically hedged using derivatives. At

December 31, 2009, this long-term debt had an aggregate fair value of $45.5 billion and a principal balance of $48.6 billion recorded in long-term debt.

Asset-backed Secured Financings

The Corporation elected to fair valueaccount for certain asset-backed secured financings that were acquired as part of the Countrywide acquisition. At December 31, 2009, these secured financings had an aggregate fair value of $707 million and principal balance of $1.5 billion recordedacquisition, which are classified in accrued expensescommercial paper and other liabilities. Usingshort-term borrowings, under the fair value option. Election of the fair value option election allows the Corporation to reduce the accounting volatility that would otherwise result from the accounting asymmetry created by accounting for the asset-backed secured financings at historical cost and the corresponding mortgage LHFS securing these financings at fair value.


230     Bank of America 2010


The following table below provides information about the fair value carrying amount and the contractual principal outstanding of assets or liabilities accounted for under the fair value option at December 31, 2010 and 2009.
Fair Value Option Elections
                         
  December 31 
  2010  2009 
        Fair Value
        Fair Value
 
        Carrying
        Carrying
 
  Fair Value
  Contractual
  Amount
  Fair Value
  Contractual
  Amount
 
  Carrying
  Principal
  Less Unpaid
  Carrying
  Principal
  Less Unpaid
 
(Dollars in millions) Amount  Outstanding  Principal  Amount  Outstanding  Principal 
Corporate loans and loan commitments (1)
 $4,135  $3,638  $497  $5,865  $5,460  $405 
Loansheld-for-sale
  25,942   28,370   (2,428)  32,795   36,522   (3,727)
Securities financing agreements  116,023   115,053   970   95,100   94,641   459 
Other assets  310   n/a   n/a   253   n/a   n/a 
Long-term deposits  2,732   2,692   40   1,663   1,605   58 
Asset-backed secured financings  706   1,356   (650)  707   1,451   (744)
Commercial paper and other short-term borrowings  6,472   6,472      813   813    
Long-term debt  50,984   54,656   (3,672)  45,451   48,560   (3,109)
                         
(1)Includes unfunded loan commitments with an aggregate fair value of $866 million and $950 million and aggregated committed exposure of $27.3 billion and $27.0 billion at December 31, 2010 and 2009, respectively.
n/a = not applicable
The tables below provide information about where changes in the fair value of assets or liabilities accounted for whichunder the fair value option has been elected are included in the Consolidated Statement of Income for 2010, 2009 and 2008.


Gains (Losses) Relating to Assets and Liabilities Accounted for UsingUnder the Fair Value Option
                     
  2010 
  Trading
  Mortgage
  Equity
       
  Account
  Banking
  Investment
  Other
    
  Profits
  Income
  Income
  Income
    
(Dollars in millions) (Losses)  (Loss)  (Loss)  (Loss)  Total 
Corporate loans and loan commitments $2  $  $  $105  $107 
Loansheld-for-sale
     9,091      493   9,584 
Securities financing agreements           52   52 
Other assets           107   107 
Long-term deposits           (48)  (48)
Asset-backed secured financings     (95)        (95)
Commercial paper and other short-term borrowings  (192)           (192)
Long-term debt  (625)        22   (603)
                     
Total
 $(815) $8,996  $  $731  $8,912 
                     
                     
  2009 
Corporate loans and loan commitments $25  $  $  $1,886  $1,911 
Loansheld-for-sale
  (211)  8,251      588   8,628 
Securities financing agreements           (292)  (292)
Other assets  379      (177)     202 
Long-term deposits           35   35 
Asset-backed secured financings     (11)        (11)
Commercial paper and other short-term borrowings  (236)           (236)
Long-term debt  (3,938)        (4,900)  (8,838)
                     
Total $(3,981) $8,240  $(177) $(2,683) $1,399 
                     
                     
  2008 
Corporate loans and loan commitments $4  $  $  $(1,248) $(1,244)
Loansheld-for-sale
  (680)  281      (215)  (614)
Securities financing agreements           (18)  (18)
Long-term deposits           (10)  (10)
Asset-backed secured financings     295         295 
                     
Total $(676) $576  $  $(1,491) $(1,591)
                     
Bank of America 2010     231


  2009 
(Dollars in millions) Corporate
Loans and
Loan
Commitments
   Loans
Held-for-Sale
   Securities
Financing
Agreements
   Other
Assets
   Long-
term
Deposits
   Asset-
backed
Secured
Financings
   Commercial
Paper and
Other
Short-term
Borrowings
   

Long-

term
Debt

   Total 
Trading account profits (losses) $25    $(211  $    $379    $    $    $(236  $(3,938  $(3,981
Mortgage banking income (loss)       8,251                    (11             8,240  
Equity investment income (loss)                 (177                       (177
Other income (loss)  1,886     588     (292        35               (4,900   (2,683

Total

 $1,911    $8,628    $(292  $202    $35    $(11  $(236  $(8,838  $1,399  
  2008 
Trading account profits (losses) $4    $(680  $    $    $    $    $    $    $(676
Mortgage banking income       281                    295               576  
Other income (loss)  (1,248   (215   (18        (10                  (1,491

Total

 $(1,244  $(614  $(18  $    $(10  $295    $    $    $(1,591

NOTE 21 – 24 Fair Value of Financial Instruments

The fair values of financial instruments have been derived using methodologies described in part, by the Corporation’s assumptions, the estimated amount and timing of future cash flows and estimated discount rates. Different assumptions could significantly affect these estimated fair values. Accordingly, the net realizable values could be materially different from the estimates presented below. In addition, the estimates are only indicative of the value of individual financial instruments and should not be considered an indication of the fair value of the Corporation.

Note 22 – Fair Value Measurements. The following disclosures representinclude financial instruments in whichwhere only a portion of the ending balancebalances at December 31, 2010 and 2009 and 2008 are notis carried at fair value in its entirety on the Corporation’s Consolidated Balance Sheet.

Short-term Financial Instruments

The carrying value of short-term financial instruments, including cash and cash equivalents, time deposits placed, federal funds sold and purchased, resale and certain repurchase agreements, commercial paper and other short-term investments and borrowings approximates the fair value of these instruments. These financial instruments generally expose the Corporation to limited credit risk and have no stated maturities or

have short-term maturities and carry interest rates that approximate market. The Corporation elected to account for certain structured reverse repurchase agreements under the fair value option. SeeNote 20 – Fair Value Measurements for additional information on these structured reverse repurchase agreements.

Loans

Fair values were generally determined by discounting both principal and interest cash flows expected to be collected using an observable discount rate for similar instruments with adjustments that the Corporation believes a market participant would consider in determining fair value. The Corporation estimates the cash flows expected to be collected using internal credit risk, interest rate and prepayment risk models that incorporate the Corporation’s best estimate of current key assumptions, such as default rates, loss severity and prepayment speeds for the life of the loan. The carrying value of loans is presented net of the applicable allowance for loan and lease losses and excludes leases. The Corporation elected to account for certain large corporate loans which exceeded the Corporation’s single name credit risk concentration guidelines under the fair value option. SeeNote 20 – FairValue Measurements for additional information on loans for which the Corporation adopted the fair value option.


194Bank of America 2009


Deposits

The fair value for certain deposits with stated maturities was calculateddetermined by discounting contractual cash flows using current market rates for instruments with similar maturities. The carrying value of foreignnon-U.S. time deposits approximates fair value. For deposits with no stated maturities, the carrying amount was considered to approximate fair value and does not take into account the significant value of the cost advantage and stability of the Corporation’s long-term relationships with depositors. The Corporation elected to accountaccounts for certain long-term fixed-rate deposits which are economically hedged with derivatives under the fair value option. SeeNote 20 – Fair Value Measurements for additional information on these long-term fixed-rate deposits.

Long-term Debt

The Corporation uses quoted market prices, when available, to estimate fair value for its long-term debt when available.debt. When quoted market prices are not available, fair value is estimated based on current market interest rates and credit spreads for debt with similar terms and maturities. The Corporation elected to accountaccounts for certain structured notes under the fair value option. SeeNote 20 –

Fair Value Measurements for additional information on these structured notes.of Financial Instruments

The carrying values and fair values of certain financial instruments that are not carried at fair value at December 31, 2010 and 2009 and 2008 were as follows:

are presented in the table below.

  December 31
  2009      2008
(Dollars in millions) Carrying Value (1)    Fair Value       Carrying Value (1)    Fair Value

Financial assets


Loans(2)

 $841,020    $813,596     $886,198    $841,629

Financial liabilities


Deposits

  991,611     991,768      882,997     883,987

Long-term debt

  438,521     440,246       268,292     260,291
(1)

The carrying value of loans is presented net of allowance for loan and lease losses. Amounts exclude leases.

(2)

Fair value is determined based on the present value of future cash flows using credit spreads or risk adjusted rates of return that a buyer of the portfolio would require at December 31, 2009 and 2008. However, the Corporation expects to collect the principal cash flows underlying the book values as well as the related interest cash flows.

                 
  December 31 
  2010  2009 
  Carrying
  Fair
  Carrying
  Fair
 
(Dollars in millions) Value  Value  Value  Value 
Financial assets
                
Loans $876,739  $861,695  $841,020  $811,831 
Financial liabilities
                
Deposits  1,010,430   1,010,460   991,611   991,768 
Long-term debt  448,431   433,107   438,521   440,246 
                 
NOTE 22 – 25 Mortgage Servicing Rights

The Corporation accounts for consumer MSRs at fair value with changes in fair value recorded in the Consolidated Statement of Income in mortgage banking income. The Corporation economically hedges these MSRs with certain derivatives and securities including MBS and U.S. Treasuries. The securities that economically hedge the MSRs are recordedclassified in other assets with changes in the fair value of the securities and the related interest income recorded asin mortgage banking income.

The following table below presents activity for residential first mortgage MSRs for 20092010 and 2008.

(Dollars in millions) 2009     2008 

Balance, January 1

 $12,733      $3,053  

Merrill Lynch balance, January 1, 2009

  209         

Countrywide balance, July 1, 2008

         17,188  

Additions / sales

  5,728       2,587  

Impact of customer payments

  (3,709     (3,313

Other changes in MSR market value

  4,504       (6,782

Balance, December 31

 $19,465      $12,733  

Mortgage loans serviced for investors (in billions)

 $1,716      $1,654  

During 2009 and 2008, other changes in MSR market value were $4.5 billion and $(6.8) billion. These amounts reflect the change in discount rates and prepayment speed assumptions, mostly due to changes in interest rates, as well as the effect of changes in other assumptions. The

2009.

amounts do not include $782 million in gains in 2009 resulting from lower than expected prepayments and $(333) million in losses in 2008 resulting from higher than expected prepayments. The net amounts of $5.3 billion and $(7.1) billion are included in the line “mortgage banking income (loss)” in the table “Level 3 – Total Realized and Unrealized Gains (Losses) Included in Earnings” inNote 20 – Fair Value Measurements.

At December 31, 2009 and 2008, the fair value of consumer MSRs was $19.5 billion and $12.7 billion.

             
(Dollars in millions) 2010     2009 
Balance, January 1
 $19,465      $12,733 
Merrill Lynch balance, January 1, 2009         209 
Net additions  3,516       5,728 
Impact of customer payments  (3,760)      (4,491)
Other changes in MSR fair value (1)
  (4,321)      5,286 
             
Balance, December 31
 $14,900      $19,465 
             
Mortgage loans serviced for investors (in billions)
 $1,628      $1,716 
             
(1)These amounts reflect the change in discount rates and prepayment speed assumptions, mostly due to changes in interest rates, as well as the effect of changes in other assumptions.
The Corporation uses an OAS valuation approach to determine the fair value of MSRs which factors in prepayment risk. This approach consists of projecting servicing cash flows under multiple interest rate scenarios and discounting these cash flows using risk-adjusted discount rates. The key economic assumptions used in valuations of MSRs include weighted-average lives of the MSRs and the OAS levels.

Key economic assumptions used in determining the fair value of MSRs at December 31, 2010 and 2009 and 2008 were as follows:

  December 31 
  2009     2008 
(Dollars in millions) Fixed   Adjustable      Fixed   Adjustable 

Weighted-average option adjusted spread

 1.67  4.64   1.71  6.40

Weighted-average life,
in years

 5.62    3.26      3.26    2.71  
are presented below.
                 
  December 31 
  2010  2009 
(Dollars in millions) Fixed  Adjustable  Fixed  Adjustable 
Weighted-average option adjusted spread  2.21%  3.25%  1.67%  4.64%
Weighted-average life, in years  4.85   2.29   5.62   3.26 
                 

Bank of America 2009195

232     Bank of America 2010


The following table below presents the sensitivity of the weighted-average lives and fair value of MSRs to changes in modeled assumptions. TheThese sensitivities in the following table are hypothetical and should be used with caution. As the amounts indicate, changes in fair value based on variations in assumptions generally cannot be extrapolated because the relationship of the change in assumption to the change in fair value may not be linear. Also, the effect of a variation in a particular assumption on the fair value of a MSRMSRs that continuescontinue to be held by the Corporation is calculated without changing any other assumption. In reality, changes in one factor may result in changes in another, which might magnify or counteract the sensitivities. Additionally, the Corporation has the ability to hedge interest rate and market valuation fluctuations associated with MSRs. The below sensitivities do not reflect any hedge strategies that may be undertaken to mitigate such risk.

  December 31, 2009 
  Change in Weighted-
average Lives
    
(Dollars in millions) Fixed  Adjustable  Change
in Fair
Value
 

Prepayment rates


Impact of 10% decrease

 0.32 years  0.14 years  $895  

Impact of 20% decrease

 0.68   0.31    1,895  

Impact of 10% increase

 (0.29 (0.12  (807

Impact of 20% increase

 (0.54 (0.22  (1,540

OAS level


Impact of 100 bps decrease

 n/a   n/a   $900  

Impact of 200 bps decrease

 n/a   n/a    1,882  

Impact of 100 bps increase

 n/a   n/a    (828

Impact of 200 bps increase

 n/a   n/a    (1,592

n/a = not applicable

Commercial and residential reverse mortgage MSRs, which are carried at the lower of cost or market value and accounted for using the amortization method, (i.e., lower of cost or market). Commercial and residential reverse mortgage MSRs totaled $309$278 million and $323$309 million at December 31, 20092010 and 20082009, and are not included in the tables above.

table below.

             
  December 31, 2010 
  Change in
    
  Weighted-average Lives    
    Change in
 
(Dollars in millions) Fixed  Adjustable  Fair Value 
Prepayment rates
            
Impact of 10% decrease  0.33 years   0.16 years  $907 
Impact of 20% decrease  0.70   0.34   1,925 
Impact of 10% increase  (0.29)  (0.14)  (814)
Impact of 20% increase  (0.55)  (0.26)  (1,551)
             
OAS level
            
Impact of 100 bps decrease  n/a   n/a  $796 
Impact of 200 bps decrease  n/a   n/a   1,668 
Impact of 100 bps increase  n/a   n/a   (729)
Impact of 200 bps increase  n/a   n/a   (1,398)
             
n/a = not applicable
NOTE 23 – 26 Business Segment Information

The Corporation reports the results of its operations through six business segments:Deposits, Global Card Services, Home Loans & Insurance, Global Commercial Banking, Global Banking & Markets (GBAM)andGlobal Wealth & Investment Management (GWIM), with the remaining operations recorded inAll Other.Other The. Effective January 1, 2010, the Corporation realigned the Global Corporate and Investment Banking portion of the formerGlobal Bankingbusiness segment with the formerGlobal Marketsbusiness segment to form GBAMand to reflectGlobal Commercial Bankingas a standalone segment. In addition, the Corporation may periodically reclassify business segment results based on modifications to its management reporting methodologies and changes in organizational alignment. Prior period amounts have been reclassified to conform to current period presentation.

Deposits

Depositsincludes the results of consumer deposits activities which consist of a comprehensive range of products provided to consumers and small businesses. In addition,Depositsincludes student lending results and the net effectan allocation of its ALM activities.Deposits Deposit products include traditional savings accounts, money market savings accounts, CDs and IRAs, and noninterest- and interest-bearing checking accounts.accounts. These products provide a relatively stable source of funding and liquidity. The Corporation earns net interest spread revenue from investing this liquidity in earning assets through client-facing lending and ALM activities. The revenue is allocated to the deposit products using a funds transfer pricing

process which takes into account the interest rates and maturity characteristics of

the deposits.Depositsalso generategenerates fees such as account service fees, non-sufficient funds fees, overdraft charges and ATM fees. In addition,Depositsincludes the net impact of migrating customers and their related deposit balances betweenGWIMandDeposits. As ofSubsequent to the date of migration, the associated net interest income, service feescharges and noninterest expense are recorded in the segmentbusiness to which deposits were transferred.

Global Card Services

Global Card Servicesprovides a broad offering of products including U.S. consumer and business card, consumer lending, international card and debit card to consumers and small businesses. The Corporation reports itsGlobal Card Servicescurrent period results in accordance with new consolidation guidance that was effective on January 1, 2010. Under this new consolidation guidance, the Corporation consolidated all previously unconsolidated credit card trusts. Accordingly, current year results are comparable to prior year results that were presented on a managed basis, which iswas consistent with the way that management evaluatesevaluated the results ofGlobal Card Services. the business. Managed basis assumesassumed that securitized loans were not sold and presentspresented earnings on these loans in a manner similar to the way loans that have not been sold (i.e., held loans) are presented. Loan securitization is an alternative funding process that is used by the Corporation to diversify funding sources. Loan securitization removes loans from the Consolidated Balance Sheet through the sale of loans to an off-balance sheet QSPE that is excluded from the Corporation’s Consolidated Financial Statements in accordance with applicable accounting guidance.

The performance of the managed portfolio is important in understandingGlobal Card Services results as it demonstrates the results of the entire portfolio serviced by the business. Securitized loans continue to be serviced by the business and are subject to the same underwriting standards and ongoing monitoring as held loans. In addition, excess servicing income is exposed to similar credit risk and repricing of interest rates as held loans.Global Card Servicesmanaged income statement line items differ from a held basis as follows:

Managed net interest income includesGlobal Card Services net interest income on held loans and interest income on the securitized loans less the internal funds transfer pricing allocation related to securitized loans.

Managed noninterest income includesGlobal Card Services noninterest income on a held basis less the reclassification of certain components of card income (e.g., excess servicing income) to record securitized net interest income and provision for credit losses. Noninterest income, both on a held and managed basis, also includes the impact of adjustments to the interest-only strips that are recorded in card income as management continues to manage this impact withinGlobal Card Services.

Provision for credit losses represents the provision for credit losses on held loans combined with realized credit losses associated with the securitized loan portfolio.

managed net interest income includesGlobal Card Servicesnet interest income on held loans and interest income on the securitized loans less the internal funds transfer pricing allocation related to securitized loans; managed noninterest income includesGlobal Card Servicesnoninterest income on a held basis less the reclassification of certain components of card income (e.g., excess servicing income) to record securitized net interest income and provision for credit losses; and provision for credit losses represents the provision for credit losses on held loans combined with realized credit losses associated with the securitized loan portfolio.

Home Loans & Insurance

Home Loans & Insuranceprovides an extensive line of consumer real estate products and services to customers nationwide.Home Loans & Insuranceproducts include fixed and adjustable rateadjustable-rate first-lien mortgage loans for home purchase and refinancing needs, reverse mortgages, home equity lines of credit and home equity loans. First mortgage products are either sold into the secondary mortgage market to investors while retaining MSRs and the Bank of America customer relationships, or are held on the Corporation’s balance sheetConsolidated Balance Sheet for ALM purposes and reported inAll Otherfor ALM purposes.Other. Home Loans & Insuranceis not impacted by the Corporation’s first mortgage production retention decisions asHome Loans & Insuranceis compensated for the decision on a management accounting basis with a corresponding offset recorded inAll Other. Funded home equity lines of credit and home equity loans are held on the Corporation’s Consolidated Balance Sheet. In addition,Home Loans & Insuranceoffers property, casualty, life, disability and credit insurance.Home Loans & Insurancealso includes the impact of migrating customers and their related loan balances betweenGWIMandHome Loans &


196Bank of America 2009


Insurance. As ofbased on client segmentation thresholds. Subsequent to the date of migration, the associated net interest income and noninterest expense are recorded in the business segment to which loans were transferred.


Bank of America 2010     233


Global Commercial Banking

Global Commercial Bankingprovides a wide range of lending-related products and services, integrated working capital management and treasury solutions and investment banking services to clients worldwide.through the Corporation’s network of offices and client relationship teams along with various product partners. Clients include business banking and middle-market companies, commercial real estate firms and governments, and are generally defined as companies with sales up to $2 billion. Lending products and services include commercial loans and commitment facilities, real estate lending, leasing, trade finance, short-term credit facilities, asset-based lending and indirect consumer loans. Capital management and treasury solutions include treasury management, foreign exchange and short-term investing options. Investment banking services provide the Corporation’s commercial and corporate issuer clients with debt and equity underwriting and distribution capabilities as well as merger-related and other advisory services.
Global Banking also includes the results of economic hedging of the credit risk to certain exposures utilizing various risk mitigation tools. Product specialists withinGlobal Markets work closely withGlobal Banking on the underwriting and distribution of debt and equity securities and certain other products. In order to reflect the efforts ofGlobal Markets andGlobal Banking in servicing the Corporation’s clients with the best product capabilities, the Corporation allocates revenue and expenses to the two segments based on relative contribution.

Global & Markets

Global MarketsGBAMprovides financial products, advisory services, financing, securities clearing, settlement and custody services globally to institutional investor clients in support of their investing and trading activities.Global MarketsGBAMalso works with commercial and corporate issuer clients to provide debt and equity underwriting and distribution capabilities, merger-related and other advisory services, and risk management products using interest rate, equity, credit, currency and commodity derivatives, foreign exchange, fixed incomefixed-income and mortgage-related products. The business may take positionsAs a result of the Corporation’s market-making activities in these products, and participate in market-making activities dealingit may be required to manage positions in government securities, equity and equity-linked securities, high-grade and high-yield corporate debt securities, commercial paper, MBS and ABS. Product specialists withinGlobal Markets work closely withGlobal Banking on the underwritingCorporate banking services provide a wide range of lending-related products and distribution of debtservices, integrated working capital management and equity securities and certain other products. In ordertreasury solutions to reflect the efforts ofGlobal Markets andGlobal Banking in servicingclients through the Corporation’s network of offices and client relationship teams along with various product partners. Corporate clients are generally defined as companies with sales greater than $2 billion. In addition,GBAMalso includes the best product capabilities, the Corporation allocates revenue and expensesresults related to the two segments based on relative contribution.

merchant services joint venture.

Global Wealth & Investment Management

GWIM offersprovides comprehensive wealth management capabilities to a broad base of clients from emerging affluent to the ultra-high-net-worth. These services include investment and brokerage services, estate management,and financial planning, fiduciary portfolio management, cash and liability management and specialty asset management.GWIMalso provides retirement and benefit plan services, fiduciaryphilanthropic management credit and banking expertise, and diversified asset management products to individual and institutional clients, as well as affluent and high net-worth individuals.clients. In addition,GWIMincludes the results of RetirementBofA Capital Management, the cash and Philanthropic Services,liquidity asset management business that the Corporation’s approximately 34 percent economic ownershipCorporation retained following the sale of BlackRock,the Columbia long-term asset management business, and other miscellaneous items.GWIMalso reflects the impact of migrating customers,clients and their related deposit and loan balances betweento or fromGWIMandDeposits,and GWIMand Home Loans & Insurance. As ofand the Corporation’s ALM activities. Subsequent to the date of migration, the associated net interest income, noninterest income and noninterest expense are recorded in the segmentbusiness to which deposits and loans were transferred.

the clients migrated.

All Other

All Otherconsists of equity investment activities including Global Principal Investments, corporate investments and strategic investments,Strategic Investments, the residential mortgage portfolio associated with ALM activities, the residual impact of the cost allocation processes, merger

and restructuring charges, intersegment eliminations, and the results of certain businesses that are expected to be or have been sold or are in the process of being liquidated.All Otheralso includes certain amounts associated with ALM activities, amounts associated with the change in the value of derivatives used as economic hedges of interest rate and foreign exchange rate fluctuations, the impact of foreign exchange rate fluctuations related to revaluation of foreign currency-denominated debt, issuances,fair value adjustments related to certain structured notes, certain gains (losses) on sales of whole mortgage loans, gains (losses) on sales of debt securities, OTTI write-downs on certain AFS securities and for periods prior to January 1, 2010, a securitization offset which removesremoved the securitization impact of sold loans inGlobal Card Servicesin order to present the consolidated results of the Corporation on a GAAP basis (i.e., held basis). Effective January 1, 2009, as part
Basis of Presentation
The management accounting and reporting process derives segment and business results by utilizing allocation methodologies for revenue and expense. The net income derived for the Merrill Lynch acquisition,All Other includesbusinesses is dependent upon revenue and cost allocations using an activity-based costing model, funds transfer pricing, and other methodologies and assumptions management believes are appropriate to reflect the results of First Republic Bank and fair value adjustments related to certain Merrill Lynch structured notes.

Basis of Presentation

the business.

Total revenue, net of interest expense, includes net interest income on a FTEfully taxable-equivalent (FTE) basis and noninterest income. The adjustment of net interest income to a FTE basis results in a corresponding increase in income tax expense. The segment results also reflect certain revenue and expense methodologies that are utilized to determine net income. The net interest income of the businesses includes the results of a funds transfer pricing process that matches assets and liabilities with similar interest rate sensitivity and maturity characteristics. For presentation purposes, in segments where the total of liabilities and equity exceeds assets, which are generally deposit-taking segments, the Corporation allocates assets to match liabilities. Net interest income of the business segments also includes an allocation of net interest income generated by the Corporation’s ALM activities.

The management accounting and reporting process derives segment and business results by utilizing allocation methodologies for revenue and expense. The net income derived for the businesses is dependent upon revenue and cost allocations using an activity-based costing model, funds transfer pricing, and other methodologies and assumptions management believes are appropriate to reflect the results of the business.

The Corporation’s ALM activities maintaininclude an overall interest rate risk management strategy that incorporates the use of interest rate contracts to manage fluctuations in earnings that are caused by interest rate volatility. The Corporation’s goal is to manage interest rate sensitivity so that movements in interest rates do not significantly adversely affect net interest income. The results ofCorporation’s ALM activities are allocated to the business segments willand fluctuate based on the performance of corporate ALM activities.performance. ALM activities are recorded in the business segments such asinclude external product pricing decisions including deposit pricing strategies, the effects of the Corporation’s internal funds transfer pricing process as well asand the net effects of other ALM activities. Certain residual impacts of the funds transfer pricing process are retained inAll Other.

Certain expenses not directly attributable to a specific business segment are allocated to the segments. The most significant of these expenses include data and item processing costs and certain centralized or shared functions. Data processing costs are allocated to the segments based on equipment usage. Item processing costs are allocated to the segments based on the volume of items processed for each segment. The costs of certain centralized or shared functions are allocated based on methodologies that reflect utilization.


Bank of America 2009197

234     Bank of America 2010


The following tables present total revenue, net of interest expense, on a FTE basis and net income (loss) for 2010, 2009 2008 and 2007,2008, and total assets at December 31, 20092010 and 20082009 for each business segment, as well asAll Other.
Business Segments

Business Segments


At and for the Year Ended December 31

  Total Corporation(1)     Deposits(2)     Global Card Services(3) 
(Dollars in millions)  2009  2008  2007     2009  2008  2007     2009  2008  2007 

Net interest income(4)

  $48,410   $46,554   $36,190    $7,160   $10,970   $10,215     $20,264   $19,589   $16,627  

Noninterest income

   72,534    27,422    32,392      6,848    6,870    6,187       9,078    11,631    11,146  

Total revenue, net of
interest expense

   120,944    73,976    68,582     14,008    17,840    16,402      29,342    31,220    27,773  

Provision for credit losses(5)

   48,570    26,825    8,385     380    399    227      30,081    20,164    11,678  

Amortization of intangibles

   1,978    1,834    1,676     238    297    294      911    1,048    1,040  

Other noninterest expense

   64,735    39,695    35,848      9,455    8,486    8,056       7,050    8,112    8,337  

Income (loss) before
income taxes

   5,661    5,622    22,673     3,935    8,658    7,825      (8,700  1,896    6,718  

Income tax expense (benefit)(4)

   (615  1,614    7,691      1,429    3,146    2,751       (3,145  662    2,457  

Net income (loss)

  $6,276   $4,008   $14,982     $2,506   $5,512   $5,074      $(5,555 $1,234   $4,261  

Year end total assets

  $2,223,299   $1,817,943       $445,363   $390,487      $217,139   $252,683   
   Home Loans & Insurance     Global Banking(2)     Global Markets 
(Dollars in millions)  2009  2008  2007     2009  2008  2007     2009  2008  2007 

Net interest income(4)

  $4,974   $3,311   $1,899    $11,250   $10,755   $8,679     $6,120   $5,151   $2,308  

Noninterest income (loss)

   11,928    5,999    1,806      11,785    6,041    6,083       14,506    (8,982  (3,618

Total revenue, net of
interest expense

   16,902    9,310    3,705     23,035    16,796    14,762      20,626    (3,831  (1,310

Provision for credit losses

   11,244    6,287    1,015     8,835    3,130    658      400    (50  2  

Amortization of intangibles

   63    39    2     187    217    182      65    2    3  

Other noninterest expense

   11,620    6,923    2,527      9,352    6,467    7,376       9,977    3,904    4,737  

Income (loss) before
income taxes

   (6,025  (3,939  161     4,661    6,982    6,546      10,184    (7,687  (6,052

Income tax expense (benefit)(4)

   (2,187  (1,457  60      1,692    2,510    2,415       3,007    (2,771  (2,241

Net income (loss)

  $(3,838 $(2,482 $101     $2,969   $4,472   $4,131      $7,177   $(4,916 $(3,811

Year end total assets

  $232,706   $205,046       $398,061   $394,541      $538,456   $306,693   
   GWIM(2)     All Other(2, 3)       
(Dollars in millions)  2009  2008  2007     2009  2008  2007             

Net interest income(4)

  $5,564   $4,797   $3,920    $(6,922 $(8,019 $(7,458     

Noninterest income

   12,559    3,012    3,637      5,830    2,851    7,151       

Total revenue, net of
interest expense

   18,123    7,809    7,557     (1,092  (5,168  (307     

Provision for credit losses(5)

   1,061    664    15     (3,431  (3,769  (5,210     

Amortization of intangibles

   512    231    150     2        5       

Other noninterest expense

   12,565    4,679    4,341      4,716    1,124    474       

Income (loss) before
income taxes

   3,985    2,235    3,051     (2,379  (2,523  4,424       

Income tax expense (benefit)(4)

   1,446    807    1,096      (2,857  (1,283  1,153       

Net income (loss)

  $2,539   $1,428   $1,955     $478   $(1,240 $3,271       

Year end total assets

  $254,192   $189,073       $137,382   $79,420        
                                     
  Total Corporation (1)  Deposits  Global Card Services (2) 
At and for the Year Ended December 31
      
(Dollars in millions) 2010  2009  2008  2010  2009  2008  2010  2009  2008 
Net interest income (3)
 $52,693  $48,410  $46,554  $8,128  $7,089  $10,910  $17,821  $19,972  $19,305 
Noninterest income  58,697   72,534   27,422   5,053   6,801   6,854   7,800   9,074   11,628 
                                     
Total revenue, net of interest expense  111,390   120,944   73,976   13,181   13,890   17,764   25,621   29,046   30,933 
Provision for credit losses  28,435   48,570   26,825   201   343   390   12,648   29,553   19,575 
Amortization of intangibles  1,731   1,977   1,834   195   238   297   813   911   1,048 
Goodwill impairment  12,400                  10,400       
Other noninterest expense  68,977   64,736   39,695   10,636   9,263   8,296   6,140   6,815   7,905 
                                     
Income (loss) before income taxes  (153)  5,661   5,622   2,149   4,046   8,781   (4,380)  (8,233)  2,405 
Income tax expense (benefit) (3)
  2,085   (615)  1,614   797   1,470   3,192   2,223   (2,972)  850 
                                     
Net income (loss)
 $(2,238) $6,276  $4,008  $1,352  $2,576  $5,589  $(6,603) $(5,261) $1,555 
                                     
Year end total assets
 $2,264,909  $2,230,232      $432,334  $444,612      $169,762  $212,668     
                                     
                                     
  Home Loans & Insurance  Global Commercial Banking  Global Banking & Markets 
  2010  2009  2008  2010  2009  2008  2010  2009  2008 
Net interest income (3)
 $4,690  $4,975  $3,311  $8,086  $8,054  $8,142  $7,989  $9,553  $8,297 
Noninterest income  5,957   11,928   6,001   2,817   3,087   2,535   20,509   23,070   (5,506)
                                     
Total revenue, net of interest expense  10,647   16,903   9,312   10,903   11,141   10,677   28,498   32,623   2,791 
Provision for credit losses  8,490   11,244   6,287   1,971   7,768   3,316   (155)  1,998   424 
Amortization of intangibles  38   63   39   72   87   127   144   165   91 
Goodwill impairment  2,000                         
Other noninterest expense  13,125   11,642   6,977   3,802   3,746   3,205   17,894   15,756   7,221 
                                     
Income (loss) before income taxes  (13,006)  (6,046)  (3,991)  5,058   (460)  4,029   10,615   14,704   (4,945)
Income tax expense (benefit) (3)
  (4,085)  (2,195)  (1,477)  1,877   (170)  1,418   4,296   4,646   (1,756)
                                     
Net income (loss)
 $(8,921) $(3,851) $(2,514) $3,181  $(290) $2,611  $6,319  $10,058  $(3,189)
                                     
Year end total assets
 $213,455  $232,588      $310,131  $295,947      $655,535  $649,876     
                                     
                         
  Global Wealth &
          
  Investment Management  All Other(2) 
  2010  2009  2008  2010  2009  2008 
Net interest income (3)
 $5,831  $5,988  $4,780  $148  $(7,221) $(8,191)
Noninterest income  10,840   10,149   1,527   5,721   8,425   4,383 
                         
Total revenue, net of interest expense  16,671   16,137   6,307   5,869   1,204   (3,808)
Provision for credit losses  646   1,061   664   4,634   (3,397)  (3,831)
Amortization of intangibles  458   480   192   11   33   40 
Other noninterest expense  13,140   11,917   3,872   4,240   5,597   2,219 
                         
Income (loss) before income taxes  2,427   2,679   1,579   (3,016)  (1,029)  (2,236)
Income tax expense (benefit) (3)
  1,080   963   565   (4,103)  (2,357)  (1,178)
                         
Net income (loss)
 $1,347  $1,716  $1,014  $1,087  $1,328  $(1,058)
                         
Year end total assets
 $297,301  $250,963      $186,391  $143,578     
(1)

There were no material intersegment revenues.

(2)

Total assets include asset allocations to match liabilities (i.e., deposits).

(3)

2010 is presented in accordance with new consolidation guidance. 2009 and 2008Global Card Services isresults are presented on a managed basis with a corresponding offset recorded inAll Other.

(4)(3)

FTE basis

(5)

Provision for credit losses represents: ForGlobal Card Services – Provision for credit losses on held loans combined with realized credit losses associated with the securitized loan portfolio and forAll Other – Provision for credit losses combined with theGlobal Card Services securitization offset.

198Bank of America 2009
Bank of America 2010     235


Global Card Services is reported on a managed basis which includes a securitization impact adjustment that has the effect of presenting securitized loans in a manner similar to the way loans that have not been sold are presented.All Other results include a corresponding securitization offset that removes the impact of these securitized loans in order to present the consolidated results of the Corporation on a held basis.

The table below reconcilesGlobal Card ServicesandAll Otherfor 2009 and 2008 to a held basis by reclassifying net interest income, all other income and realized credit losses associated with the securitized loans to card income.

New consolidation guidance effective January 1, 2010 does not require reconciliation ofGlobal Card ServicesandAll Otherto a held basis after 2009.

Global Card Services – Reconciliation

  2009    2008    2007
(Dollars in millions) Managed
Basis(1)
  Securitization
Impact(2)
  Held
Basis
    Managed
Basis(1)
  Securitization
Impact(2)
  Held
Basis
    Managed
Basis(1)
  Securitization
Impact(2)
  Held
Basis

Net interest income(3)

 $20,264   $(9,250 $11,014    $19,589  $(8,701 $10,888   $16,627  $(8,027 $8,600

Noninterest income:


Card income

  8,555    (2,034  6,521     10,033   2,250    12,283    10,170   3,356    13,526

All other income

  523    (115  408      1,598   (219  1,379     976   (288  688

Total noninterest income

  9,078    (2,149  6,929      11,631   2,031    13,662     11,146   3,068    14,214

Total revenue, net of interest expense

  29,342    (11,399  17,943     31,220   (6,670  24,550    27,773   (4,959  22,814

Provision for credit losses

  30,081    (11,399  18,682     20,164   (6,670  13,494    11,678   (4,959  6,719

Noninterest expense

  7,961        7,961      9,160       9,160     9,377       9,377

Income (loss) before income taxes

  (8,700      (8,700   1,896       1,896    6,718       6,718

Income tax expense (benefit)(3)

  (3,145      (3,145    662       662     2,457       2,457

Net income (loss)

 $(5,555 $   $(5,555   $1,234  $   $1,234    $4,261  $   $4,261

                         
  2009  2008 
  Managed
  Securitization
  Held
  Managed
  Securitization
  Held
 
(Dollars in millions) Basis(1)  Impact(2)  Basis  Basis(1)  Impact(2)  Basis 
Net interest income (3)
 $19,972  $(9,250) $10,722  $19,305  $(8,701) $10,604 
Noninterest income:                        
Card income  8,553   (2,034)  6,519   10,032   2,250   12,282 
All other income  521   (115)  406   1,596   (219)  1,377 
                         
Total noninterest income  9,074   (2,149)  6,925   11,628   2,031   13,659 
                         
Total revenue, net of interest expense  29,046   (11,399)  17,647   30,933   (6,670)  24,263 
Provision for credit losses  29,553   (11,399)  18,154   19,575   (6,670)  12,905 
Noninterest expense  7,726      7,726   8,953      8,953 
                         
Income (loss) before income taxes  (8,233)     (8,233)  2,405      2,405 
Income tax expense (benefit) (3)
  (2,972)     (2,972)  850      850 
                         
Net income (loss) $(5,261) $  $(5,261) $1,555  $  $1,555 
                         
All Other – Reconciliation

  2009    2008    2007 
(Dollars in millions) Reported
Basis(1)
  Securitization
Offset(2)
  As
Adjusted
    Reported
Basis(1)
  Securitization
Offset(2)
  As
Adjusted
    Reported
Basis(1)
  Securitization
Offset(2)
  As
Adjusted
 

Net interest income(3)

 $(6,922 $9,250  $2,328    $(8,019 $8,701   $682    $(7,458 $8,027   $569  

Noninterest income:


Card income (loss)

  (895  2,034   1,139     2,164    (2,250  (86   2,817    (3,356  (539

Equity investment income

  9,020       9,020     265        265     3,745        3,745  

Gains on sales of debt securities

  4,440       4,440     1,133        1,133     179        179  

All other income (loss)

  (6,735  115   (6,620    (711  219    (492    410    288    698  

Total noninterest income

  5,830    2,149   7,979      2,851    (2,031  820      7,151    (3,068  4,083  

Total revenue, net of interest expense

  (1,092  11,399   10,307     (5,168  6,670    1,502     (307  4,959    4,652  

Provision for credit losses

  (3,431  11,399   7,968     (3,769  6,670    2,901     (5,210  4,959    (251

Merger and restructuring charges

  2,721       2,721     935        935     410        410  

All other noninterest expense

  1,997       1,997      189        189      69        69  

Income (loss) before income taxes

  (2,379     (2,379   (2,523      (2,523   4,424        4,424  

Income tax expense (benefit)(3)

  (2,857     (2,857    (1,283      (1,283    1,153        1,153  

Net income (loss)

 $478   $  $478     $(1,240 $   $(1,240   $3,271   $   $3,271  
                         
  2009  2008 
  Reported
  Securitization
  As
  Reported
  Securitization
  As
 
(Dollars in millions) Basis(1)  Offset(2)  Adjusted  Basis(1)  Offset(2)  Adjusted 
Net interest income (3)
 $(7,221) $9,250  $2,029  $(8,191) $8,701  $510 
Noninterest income:                        
Card income (loss)  (896)  2,034   1,138   2,164   (2,250)  (86)
Equity investment income  10,589      10,589   265      265 
Gains on sales of debt securities  4,437      4,437   1,133      1,133 
All other income (loss)  (5,705)  115 �� (5,590)  821   219   1,040 
                         
Total noninterest income  8,425   2,149   10,574   4,383   (2,031)  2,352 
                         
Total revenue, net of interest expense  1,204   11,399   12,603   (3,808)  6,670   2,862 
Provision for credit losses  (3,397)  11,399   8,002   (3,831)  6,670   2,839 
Merger and restructuring charges  2,721      2,721   935      935 
All other noninterest expense  2,909      2,909   1,324      1,324 
                         
Loss before income taxes  (1,029)     (1,029)  (2,236)     (2,236)
Income tax benefit (3)
  (2,357)     (2,357)  (1,178)     (1,178)
                         
Net income (loss) $1,328  $  $1,328  $(1,058) $  $(1,058)
                         
(1)

Provision for credit losses represents: ForinGlobal Card Services – Provision for credit lossesis presented on held loans combined with realized credit losses associateda managed basis with the securitized loan portfolio and forsecuritization offset inAll Other – Provision for credit losses combined with theGlobal Card Services securitization offset..

(2)

The securitization impact/offset onto net interest income is on a funds transfer pricing methodology consistent with the way funding costs are allocated to the businesses.

(3)

FTE basis

Bank of America 2009199
236     Bank of America 2010


The following tables below present a reconciliation of the six business segments’ (Deposits, Global Card Services, Home Loans & Insurance, Global Banking, Global Markets andGWIM) total revenue, net of interest expense, on a FTE basis, and net income (loss) to the Consolidated Statement of Income, and total assets to the Consolidated Balance Sheet. The adjustments presented in the tables below include consolidated income, expense and asset amounts not specifically allocated to individual business segments.

(Dollars in millions) 2009     2008   2007 

Segment total revenue, net of interest expense(1)

 $122,036      $79,144    $68,889  

Adjustments:


ALM activities

  (960     2,605     66  

Equity investment income

  9,020       265     3,745  

Liquidating businesses

  1,300       256     1,060  

FTE basis adjustment

  (1,301     (1,194   (1,749

Managed securitization impact to total revenue, net of interest expense

  (11,399     (6,670   (4,959

Other

  947       (1,624   (219

Consolidated revenue, net of interest expense

 $119,643      $72,782    $66,833  

Segment net income

 $5,798      $5,248    $11,711  

Adjustments, net of taxes:


ALM activities

  (6,278     (554   (241

Equity investment income

  5,683       167     2,359  

Liquidating businesses

  445       86     613  

Merger and restructuring charges

  (1,714     (630   (258

Other

  2,342       (309   798  

Consolidated net income

 $6,276      $4,008    $14,982  
(1)

FTE basis

  December 31 
(Dollars in millions) 2009     2008 

Segment total assets

 $2,085,917      $1,738,523  

Adjustments:


ALM activities, including securities portfolio

  560,063       552,796  

Equity investments

  34,662       31,422  

Liquidating businesses

  22,244       3,172  

Elimination of segment excess asset allocations to match liabilities

  (561,607     (439,162

Elimination of managed securitized loans (1)

  (89,715     (100,960

Other

  171,735       32,152  

Consolidated total assets

 $2,223,299      $1,817,943  
(1)

RepresentsGlobal Card Services securitized loans.

             
(Dollars in millions) 2010  2009  2008 
Segments’ total revenue, net of interest expense(1)
 $105,521  $119,740  $77,784 
Adjustments:            
ALM activities  1,924   (766)  2,390 
Equity investment income  4,532   10,589   265 
Liquidating businesses  1,336   2,268   1,819 
FTE basis adjustment  (1,170)  (1,301)  (1,194)
Managed securitization impact to total revenue, net of interest expense  n/a   (11,399)  (6,670)
Other  (1,923)  512   (1,612)
             
Consolidated revenue, net of interest expense
 $110,220  $119,643  $72,782 
             
Segments’ net income (loss) $(3,325) $4,948  $5,066 
Adjustments, net of taxes:            
ALM activities  (1,966)  (6,597)  (641)
Equity investment income  2,855   6,671   167 
Liquidating businesses  318   477   378 
Merger and restructuring charges  (1,146)  (1,714)  (630)
Other  1,026   2,491   (332)
             
Consolidated net income (loss)
 $(2,238) $6,276  $4,008 
             
200(1)Bank of America 2009FTE basis
n/a = not applicable
         
  December 31 
(Dollars in millions) 2010  2009 
Segment total assets $2,078,518  $2,086,654 
Adjustments:        
ALM activities, including securities portfolio  637,439   573,525 
Equity investments  34,201   44,640 
Liquidating businesses  10,928   34,761 
Elimination of segment excess asset allocations to match liabilities  (645,846)  (585,994)
Elimination of managed securitized loans (1)
  n/a   (89,716)
Other  149,669   166,362 
         
Consolidated total assets
 $2,264,909  $2,230,232 
         
(1)RepresentsGlobal Card Servicessecuritized loans. 2010 is presented in accordance with new consolidation guidance effective January 1, 2010. 2009 is presented on a managed basis.
n/a = not applicable
Bank of America 2010     237


NOTE 24 – 27 Parent Company Information

The following tables present the Parent Company Onlyonly financial information:

information.

Condensed Statement of Income

(Dollars in millions)  2009       2008     2007  

Income


Dividends from subsidiaries:


Bank holding companies and related subsidiaries

 $4,100      $18,178    $20,615  

Nonbank companies and related subsidiaries

  27       1,026     181  

Interest from subsidiaries

  1,179       3,433     4,939  

Other income

  7,784       940     3,319  

Total income

  13,090       23,577     29,054  

Expense


Interest on borrowed funds

  4,737       6,818     7,834  

Noninterest expense

  4,238       1,829     3,127  

Total expense

  8,975       8,647     10,961  

Income before income taxes and equity in undistributed earnings of subsidiaries

  4,115       14,930     18,093  

Income tax benefit

  85       1,793     1,136  

Income before equity in undistributed earnings of subsidiaries

  4,200       16,723     19,229  

Equity in undistributed earnings (losses) of subsidiaries:


Bank holding companies and related subsidiaries

  (2,183     (11,221   (4,497

Nonbank companies and related subsidiaries

  4,259       (1,494   250  

Total equity in undistributed earnings (losses) of subsidiaries

  2,076       (12,715   (4,247

Net income

 $6,276      $4,008    $14,982  

Net income (loss) applicable to common shareholders

 $(2,204    $2,556    $14,800  

             
(Dollars in millions) 2010  2009  2008 
Income
            
Dividends from subsidiaries:            
Bank holding companies and related subsidiaries $7,263  $4,100  $18,178 
Nonbank companies and related subsidiaries  226   27   1,026 
Interest from subsidiaries  999   1,179   3,433 
Other income  2,781   7,784   940 
             
Total income
  11,269   13,090   23,577 
             
Expense
            
Interest on borrowed funds  4,484   4,737   6,818 
Noninterest expense  8,030   4,238   1,829 
             
Total expense
  12,514   8,975   8,647 
             
Income (loss) before income taxes and equity in undistributed earnings of subsidiaries
  (1,245)  4,115   14,930 
Income tax benefit  (3,709)  (85)  (1,793)
             
Income before equity in undistributed earnings of subsidiaries  2,464   4,200   16,723 
Equity in undistributed earnings (losses) of subsidiaries:            
Bank holding companies and related subsidiaries  7,647   (21,614)  (10,559)
Nonbank companies and related subsidiaries  (12,349)  23,690   (2,156)
             
Total equity in undistributed earnings (losses) of subsidiaries
  (4,702)  2,076   (12,715)
             
Net income (loss)
 $(2,238) $6,276  $4,008 
             
Net income (loss) applicable to common shareholders
 $(3,595) $(2,204) $2,556 
             
Condensed Balance Sheet

  December 31
(Dollars in millions)  2009     2008

Assets


Cash held at bank subsidiaries

 $91,892    $98,525

Debt securities

  8,788     16,241

Receivables from subsidiaries:


Bank holding companies and related subsidiaries

  58,931     39,239

Nonbank companies and related subsidiaries

  13,043     23,518

Investments in subsidiaries:


Bank holding companies and related subsidiaries

  206,994     172,460

Nonbank companies and related subsidiaries

  47,078     20,355

Other assets

  13,773     20,428

Total assets

 $440,499    $390,766

Liabilities and shareholders’ equity


Commercial paper and other short-term borrowings

 $5,968    $26,536

Accrued expenses and other liabilities

  19,204     15,244

Payables to subsidiaries:


Bank holding companies and related subsidiaries

  363     469

Nonbank companies and related subsidiaries

  632     3

Long-term debt

  182,888     171,462

Shareholders’ equity

  231,444     177,052

Total liabilities and shareholders’ equity

 $440,499    $390,766

Bank of America 2009201
         
  December 31 
(Dollars in millions) 2010  2009 
Assets
        
Cash held at bank subsidiaries $117,124  $91,892 
Debt securities  19,518   8,788 
Receivables from subsidiaries:        
Bank holding companies and related subsidiaries  50,589   54,442 
Nonbank companies and related subsidiaries  8,320   13,043 
Investments in subsidiaries:        
Bank holding companies and related subsidiaries  188,538   186,673 
Nonbank companies and related subsidiaries  61,374   67,399 
Other assets  10,837   18,262 
         
Total assets
 $456,300  $440,499 
         
Liabilities and shareholders’ equity
        
Commercial paper and other short-term borrowings $13,899  $5,968 
Accrued expenses and other liabilities  22,803   19,204 
Payables to subsidiaries:        
Bank holding companies and related subsidiaries  4,241   363 
Nonbank companies and related subsidiaries  513   632 
Long-term debt  186,596   182,888 
Shareholders’ equity  228,248   231,444 
         
Total liabilities and shareholders’ equity
 $456,300  $440,499 
         
238     Bank of America 2010


Condensed Statement of Cash Flows
             
(Dollars in millions) 2010  2009  2008 
Operating activities
            
Net income (loss) $(2,238) $6,276  $4,008 
Reconciliation of net income (loss) to net cash provided by operating activities:            
Equity in undistributed (earnings) losses of subsidiaries  4,702   (2,076)  12,715 
Other operating activities, net  (996)  4,400   (598)
             
Net cash provided by operating activities  1,468   8,600   16,125 
             
Investing activities
            
Net (purchases) sales of securities  5,972   3,729   (12,142)
Net payments from (to) subsidiaries  3,531   (25,437)  2,490 
Other investing activities, net  2,592   (17)  43 
             
Net cash provided by (used in) investing activities  12,095   (21,725)  (9,609)
             
Financing activities
            
Net increase (decrease) in commercial paper and other short-term borrowings  8,052   (20,673)  (14,131)
Proceeds from issuance of long-term debt  29,275   30,347   28,994 
Retirement of long-term debt  (27,176)  (20,180)  (13,178)
Proceeds from issuance of preferred stock     49,244   34,742 
Repayment of preferred stock     (45,000)   
Proceeds from issuance of common stock     13,468   10,127 
Cash dividends paid  (1,762)  (4,863)  (11,528)
Other financing activities, net  3,280   4,149   5,030 
             
Net cash provided by financing activities  11,669   6,492   40,056 
             
Net increase (decrease) in cash held at bank subsidiaries  25,232   (6,633)  46,572 
Cash held at bank subsidiaries at January 1  91,892   98,525   51,953 
             
Cash held at bank subsidiaries at December 31
 $117,124  $91,892  $98,525 
             
Bank of America 2010     239


(Dollars in millions) 2009     2008   2007 

Operating activities


Net income

 $6,276      $4,008    $14,982  

Reconciliation of net income to net cash provided by operating activities:


Equity in undistributed (earnings) losses of subsidiaries

  (2,076     12,715     4,247  

Other operating activities, net

  8,889       (598   (276

Net cash provided by operating activities

  13,089       16,125     18,953  

Investing activities


Net (purchases) sales of securities

  3,729       (12,142   (839

Net payments from (to) subsidiaries

  (29,926     2,490     (44,457

Other investing activities, net

  (17     43     (824

Net cash used in investing activities

  (26,214     (9,609   (46,120

Financing activities


Net increase (decrease) in commercial paper and other short-term borrowings

  (20,673     (14,131   8,873  

Proceeds from issuance of long-term debt

  30,347       28,994     38,730  

Retirement of long-term debt

  (20,180     (13,178   (12,056

Proceeds from issuance of preferred stock

  49,244       34,742     1,558  

Repayment of preferred stock

  (45,000            

Proceeds from issuance of common stock

  13,468       10,127     1,118  

Common stock repurchased

              (3,790

Cash dividends paid

  (4,863     (11,528   (10,878

Other financing activities, net

  4,149       5,030     576  

Net cash provided by financing activities

  6,492       40,056     24,131  

Net increase (decrease) in cash held at bank subsidiaries

  (6,633     46,572     (3,036

Cash held at bank subsidiaries at January 1

  98,525       51,953     54,989  

Cash held at bank subsidiaries at December 31

 $91,892      $98,525    $51,953  

NOTE 25 – 28 Performance by Geographical Area

Since the Corporation’s operations are highly integrated, certain asset, liability, income and expense amounts must be allocated to arrive at total assets, total revenue, net of interest expense, income (loss) before income taxes and net income (loss) by geographic area. The Corporation identifies its geographic performance based on the business unit structure used to manage the capital or expense deployed in the region as applicable. This requires certain judgments related to the allocation of revenue so that revenue can be appropriately matched with the related expense or capital deployed in the region.

    December 31      Year Ended December 31 
(Dollars in millions) Year Total Assets (1)       Total
Revenue, Net
of Interest
Expense (2)
    

Income
(Loss)

Before
Income Taxes

   Net Income
(Loss)
 

Domestic(3)

 2009 $1,840,232     $98,278    $(6,901  $(1,025
 2008  1,678,853      67,549     3,289     3,254  
  2007          60,245     18,039     13,137  

Asia(4)

 2009  118,921      10,685     8,096     5,101  
 2008  50,567      1,770     1,207     761  
 2007       1,613     1,146     721  

Europe, Middle East and Africa

 2009  239,374      9,085     2,295     1,652  
 2008  78,790      3,020     (456   (252
 2007       4,097     894     592  

Latin America and the Caribbean

 2009  24,772      1,595     870     548  
 2008  9,733      443     388     245  
  2007          878     845     532  

Total Foreign

 2009  383,067      21,365     11,261     7,301  
 2008  139,090      5,233     1,139     754  
  2007          6,588     2,885     1,845  

Total Consolidated

 2009 $2,223,299     $119,643    $4,360    $6,276  
 2008  1,817,943      72,782     4,428     4,008  
  2007          66,833     20,924     14,982  
                     
     December 31  Year Ended December 31 
        Total
       
        Revenue, Net
  Income
    
        of Interest
  (Loss) Before
  Net Income
 
(Dollars in millions) Year  Total Assets(1)  Expense(2)  Income Taxes  (Loss) 
U.S. (3)
  2010  $1,954,517  $88,679  $(5,370) $(4,511)
   2009   1,847,165   98,278   (6,901)  (1,025)
   2008       67,549   3,289   3,254 
                     
Asia (4)
  2010   106,186   6,115   1,380   869 
   2009   118,921   10,685   8,096   5,101 
   2008       1,770   1,207   761 
Europe, Middle East and Africa  2010   186,045   12,369   1,273   525 
   2009   239,374   9,085   2,295   1,652 
   2008       3,020   (456)  (252)
Latin America and the Caribbean  2010   18,161   3,057   1,394   879 
   2009   24,772   1,595   870   548 
   2008       443   388   245 
                     
TotalNon-U.S. 
  2010   310,392   21,541   4,047   2,273 
   2009   383,067   21,365   11,261   7,301 
   2008       5,233   1,139   754 
                     
Total Consolidated
  2010  $2,264,909  $110,220  $(1,323) $(2,238)
   2009   2,230,232   119,643   4,360   6,276 
   2008       72,782   4,428   4,008 
                     
(1)

Total assets include long-lived assets, which are primarily located in the U.S.

(2)

There were no material intercompany revenues between geographic regions for any of the periods presented.

(3)

Includes the Corporation’s Canadian operations, which had total assets of $31.1$16.1 billion and $13.5$31.1 billion at December 31, 20092010 and 2008;2009; total revenue, net of interest expense of $1.5 billion, $2.5 billion and $1.2 billion and $770 million;billion; income before income taxes of $459 million, $723 million $552 million and $292$552 million; and net income of $328 million, $488 million and $404 million for 2010, 2009 and $195 million for 2009, 2008, and 2007, respectively.

(4)

The year ended December 31, 2009 amount includes pre-tax gains of $7.3 billion ($4.74.6 billionnet-of-tax) on the sale of common shares of the Corporation’s initial investment in CCB.

202Bank of America 2009
240     Bank of America 2010


Item 9. Changes in and Disagreements with Accountants on Accounting and Financial Disclosure

There were no changes in or disagreements with accountants on accounting and financial disclosure.

Item 9A. Controls And Procedures
Item 9A.  Controls And Procedures

Disclosure Controls and Procedures

As of the end of the period covered by this report and pursuant toRule 13a-15 of the Securities Exchange Act of 1934 (Exchange Act), Bank of America’s

management, including the Chief Executive Officer and Interim Chief Financial Officer, conducted an evaluation of the effectiveness and design of our disclosure controls and procedures (as that term is defined inRule 13a-15(e) of the Exchange Act). Based upon that evaluation, Bank of America’s Chief Executive Officer and Interim Chief Financial Officer concluded that Bank of America’s disclosure controls and procedures were effective, as of the end of the period covered by this report, in recording, processing, summarizing and reporting information required to be disclosed, within the time periods specified in the SEC’s rules and forms.


Bank of America 2010     241


Report of Independent Registered Public Accounting Firm

To the Board of Directors of Bank of America Corporation:
We have examined, based on criteria established inInternal Control – Integrated Framework issued by the Committee of Sponsoring Organizations of the Treadway Commission, Bank of America Corporation’s (the “Corporation”) assertion, included under Item 9A, that the Corporation’s disclosure controls and procedures were effective as of December 31, 2010 (“Management’s Assertion”). Disclosure controls and procedures mean controls and other procedures of an issuer that are designed to ensure that information required to be disclosed by an issuer in reports that it files or submits under the Securities Exchange Act of 1934 is recorded, processed, summarized, and reported within the time periods specified in the Securities and Exchange Commission’s rules and forms, and that information required to be disclosed by an issuer in reports that it files or submits under the Securities Exchange Act of 1934 is accumulated and communicated to the issuer’s management, including its principal executive and principal financial officer, or persons performing similar functions, as appropriate, to allow timely decisions regarding required disclosure. The Corporation’s management is responsible for maintaining effective disclosure controls and procedures and for Management’s Assertion of the effectiveness of its disclosure controls and procedures. Our responsibility is to express an opinion on Management’s Assertion based on our examination.
There are inherent limitations to disclosure controls and procedures. Because of these inherent limitations, effective disclosure controls and procedures can only provide reasonable assurance of achieving the intended objectives. Disclosure controls and procedures may not prevent, or detect and correct, material misstatements, and they may not identify all information relating to the Corporation to be accumulated and communicated to the Corporation’s management to allow timely decisions regarding required disclosures. Also, projections of any evaluation of effectiveness to future periods

are subject to the risk that disclosure controls and procedures may become inadequate because of changes in conditions, or that the degree of compliance with the policies or procedures may deteriorate.
We conducted our examination in accordance with attestation standards established by the Public Company Accounting Oversight Board (United States). Those standards require that we plan and perform the examination to obtain reasonable assurance about whether effective disclosure controls and procedures were maintained in all material respects. Our examination included obtaining an understanding of the Corporation’s disclosure controls and procedures and testing and evaluating the design and operating effectiveness of the Corporation’s disclosure controls and procedures based on the assessed risk. Our examination also included performing such other procedures as we considered necessary in the circumstances. We believe that our examination provides a reasonable basis for our opinion. Our examination was not conducted for the purpose of expressing an opinion, and accordingly we express no opinion, on the accuracy or completeness of the Corporation’s disclosures in its reports, or whether such disclosures comply with the rules and regulations adopted by the Securities and Exchange Commission.
In our opinion, Management’s Assertion that the Corporation’s disclosure controls and procedures were effective as of December 31, 2010 is fairly stated, in all material respects, based on criteria established inInternal Control – Integrated Frameworkissued by the Committee of Sponsoring Organizations of the Treadway Commission.
Charlotte, North Carolina
February 25, 2011


242     Bank of America 2010


Report of Management on Internal Control Over Financial Reporting

The Report of Management on Internal Control over Financial Reporting is set forth on page 112135 and incorporated herein by reference. The Report of our Independent Registered Public Accounting Firm with respect to the Corporation’s internal control over financial reporting is set forth on page 113136 and incorporated herein by reference.

Changes in Internal Control Over Financial Reporting

There have been no changes in our internal control over financial reporting (as defined inRule 13a-15(f) of the Exchange Act) during the quarter ended December 31, 2009,2010, that materially affected, or are reasonably likely to materially affect, our internal control over financial reporting.

Item 9B.  Other Information

None


Bank of America 2009Item 9B. 203Other Information
On February 24, 2011, the Board approved amendments to the Corporation’s Bylaws that provide for the number of directors to be established by resolution of the Board as well as other non-substantive changes, such as updating the names of the Board committees. The prior Bylaw provision stated that the number of directors would be no less than five nor more than 30 with the minimum and maximum to be established by the Board. The description of the

Amended and Restated Bylaws does not purport to be complete and is qualified in its entirety by reference to the Amended and Restated Bylaws, which are attached as Exhibit 3(b) to this report.
On February 24, 2011, the company and Brian T. Moynihan, President and Chief Executive Officer, entered into a non-exclusive aircraft time sharing agreement (the “Agreement”), which will permit Mr. Moynihan to lease the company’s aircraft for his use. Mr. Moynihan will pay the company for such use of the aircraft pursuant to the terms of the Agreement, provided such payment does not exceed the maximum amount allowed under Federal Aviation Administration regulations. The Agreement automatically renews each year and each party shall have the right to terminate the Agreement at anytime with 30 days’ written notice to the other party. The Agreement also shall terminate immediately if Mr. Moynihan no longer serves as the company’s Chief Executive Officer. The company and Pilot In Command retain the authority to determine what flights may be scheduled under the Agreement and when a flight may be cancelled or changed for safety reasons. The description of the Agreement does not purport to be complete and is qualified in its entirety by reference to the Agreement, which is attached as Exhibit 10(jjj) to this report.


Bank of America 2010     243


Part III
Bank of America Corporation and Subsidiaries

Part III

Bank of America Corporation and Subsidiaries

Item 10. Directors, Executive Officers and Corporate Governance

Information included under the following captions in the Corporation’s proxy statement relating to its 20102011 annual meeting of stockholders, scheduled to be held on May 11, 2011 (the 20102011 Proxy Statement), is incorporated herein by reference:


ItemProposal 1: Election of Directors – The Nominees”;

“Section 16(a) Beneficial Ownership Reporting Compliance”;

“Corporate Governance – Additional Corporate Governance Information, Committee Charters and Code of Ethics”;

and

“Corporate Governance – Code of Ethics”; and

.

Additional information required by Item 10 with respect to executive officers is set forth under “Executive Officers of The Registrant” in Part I of this report. Information regarding the Corporation’s directors is set forth in the 20102011 Proxy Statement under the caption “Item“Proposal 1: Election of Directors – The Nominees.”

Item 11.  Executive Compensation

Information included under the following captions in the 2010 Proxy Statement is incorporated herein by reference:

Item 11. 

Executive Compensation

Incorporated by reference to:
• “Compensation Discussion and Analysis”;

“Executive Compensation”;

“Director Compensation”;

“Compensation and Benefits Committee Report”; and

“Compensation and Benefits Committee Interlocks and Insider Participation.”

Participation” in the 2011 Proxy Statement.

Item 12. Security Ownership of Certain Beneficial Owners and Management and Related Stockholder Matters

Information included under the following caption in the 2010 Proxy Statement is incorporated herein

Incorporated by reference:

reference to:
 

“Stock Ownership.”

Ownership of Directors and Executive Officers” in the 2011 Proxy Statement.


The following table presents information on equity compensation plans at December 31, 2009:

Plan Category(1)(2)  Number of Shares to
be Issued Under
Outstanding Options
and Rights(3)
  Weighted Average
Exercise Price of
Outstanding
Options(4)
  

Number of

Shares
Remaining for
Future Issuance
Under Equity
Compensation
Plans


Plans approved by the Corporation’s shareholders

  286,824,064  $40.53  283,604,110(5) 

Plans not approved by the Corporation’s shareholders(6)

  126,222,932  $66.99  49,092,032(7) 
          

Total

  413,046,996  $48.11  332,696,142  
2010:
             
        Number of
 
        Shares
 
        Remaining for
 
  Number of Shares to
  Weighted-Average
  Future Issuance
 
  be Issued Under
  Exercise Price of
  Under Equity
 
  Outstanding Options
  Outstanding
  Compensation
 
Plan Category (1, 2) and Rights (3)  Options (4)  Plans 
Plans approved by the Corporation’s shareholders  336,787,693  $41.09   522,759,571(5)
Plans not approved by the Corporation’s shareholders (6)
  94,581,419  $69.91   69,633,770(7)
             
Total
  431,369,112  $48.95   592,393,341 
             
(1)

This table does not include outstanding options to purchase 14,078,2699,365,888 shares of the Corporation’s common stock that were assumed by the Corporation in connection with prior acquisitions, under whose plans the options were originally granted. The weighted averageweighted-average option price of these assumed options was $73.55$87.21 at December 31, 2009.2010. Also, at December 31, 20092010 there were 324,681216,956 vested deferred restricted stock units associated with these plans. No additional awards were granted under these plans following the respective dates of acquisition.

(2)

This table does not include outstanding options to purchase 13,726,6089,560,763 shares of the Corporation’s common stock that were assumed by the Corporation in connection with the Merrill Lynch acquisition, which were originally issued under certain Merrill Lynch plans. The weighted averageweighted-average option price of these assumed options was $57.50$56.85 at December 31, 2009.2010. Also, at December 31, 20092010 there were 27,242,81618,985,432 outstanding restricted stock units and 1,980,8471,760,307 vested deferred restricted stock units and stock option gain deferrals associated with such plans. These Merrill Lynch plans were frozen at the time of the acquisition and no additional awards may be granted under these plans. However, as previously approved by the Corporation’s shareholders, if any of the outstanding awards under these frozen plans subsequently are cancelled, forfeited or settled in cash, the shares relating to such awards thereafter will be available for future awards issued under the Corporation’s Key Associate Stock Plan (KASP).

(3)

Includes 89,089,935160,534,411 outstanding restricted stock units and 834,728117,363 vested deferred restricted stock units under plans approved by the Corporation’s shareholders and 47,204,46228,521,170 outstanding restricted stock units under plans not approved by the Corporation’s shareholders.

(4)

Does not reflect restricted stock units included in the first column, which do not have an exercise price.

(5)

Includes 282,870,925522,081,106 shares of common stock available for future issuance under the KASP (including 9,479,67620,875,047 shares originally subject to awards outstanding under frozen Merrill Lynch plans at the time of the acquisition which subsequently have been cancelled, forfeited or settled in cash and become available for issuance under the KASP, as described in note (2) above) and 733,185678,465 shares of common stock which are available for future issuance under the Corporation’s Directors’ Stock Plan.

(6)

In connection with the Merrill Lynch acquisition, the Corporation assumed and has continued to issue awards in accordance with applicable NYSE listing standards under the following plans, which were not approved by the Corporation’s shareholders: the Merrill Lynch Employee Stock Compensation Plan (ESCP) and the Merrill Lynch Employee Stock Purchase Plan (ESPP), both of which were approved by Merrill Lynch’s shareholders prior to the acquisition. The material features of these plans are described below under the heading “Description of Plans Not Approved by the Corporation’s Shareholders.”

(7)

This amount includes 36,661,92960,189,074 shares of common stock available for future issuance under the ESCP and 12,430,1039,444,696 shares of common stock available for future issuance under the ESPP.

Description of Plans Not Approved by the Corporation’s Shareholders

Merrill Lynch Employee Stock Compensation Plan.Plan(ESCP).  The ESCP covers associates who were salaried key employees of Merrill Lynch or its subsidiaries immediately prior to the effective date of the Merrill Lynch acquisition, other than executive officers. Under the ESCP, the Corporation may award restricted shares, restricted units, incentive stock options, nonqualified stock options and stock appreciation rights. Awards of restricted shares and restricted units are subject to a vesting schedule

specified in the grant documentation. Restricted shares and restricted units under the ESCP may generally be cancelled prior to the vesting date in the event of (i) violation of covenants specified in the grant documentation (including, but not limited to, non-competition, non-solicitation, nondisparagement and confidentiality

covenants) or (ii) termination of employment prior to the end of the vesting period (except in certain limited circumstances, such as death, disability and retirement). Options have an exercise price equal to the fair market value of the stock on the date of grant. Options granted under the ESCP expire


204Bank of America 2009


not more than 10 years from the date of grant, and the applicable grant documentation specifies the extent to which options may be exercised during their respective terms, including in the event of an associate’s death, disability or termination of employment. Shares that are cancelled, forfeited or settled in cash from an additional frozen Merrill Lynch plan also will become available for grant under the ESCP.

Merrill Lynch Employee Stock Purchase Plan(ESPP).  The purpose of the ESPP is to give employees ofassociates employed by Merrill Lynch and itsor an eligible subsidiariessubsidiary an opportunity to purchase the Corporation’s common stock through payroll


244     Bank of America 2010


deductions (an employee can elect either payroll deductions of 1%one percent to 10%10 percent of current compensation or an annual dollar amount equal to a maximum of 10%10 percent of current eligible compensation). Shares are purchased quarterly at 95%95 percent of the fair market value (average of the highest and lowest share prices) on the date of the purchase and the maximum annual contribution is $23,750. An associate is eligible to participate if he or she was employed by Merrill Lynch or any participating subsidiary for at least one full year by12 months prior to the start of the new plan year.

For additional information on our equity compensation plans seeNote 1820Stock-BasedStock-based Compensation Plansto the Consolidated Financial Statements beginning on page 182 which is incorporated herein by reference.

Item 13. Certain Relationships and Related Transactions, and Director Independence

Information included under the following captions in the 2010 Proxy Statement is incorporated herein

Incorporated by reference:

reference to:
 

“Certain Transactions”;

“Review of Related Person Transactions and Certain Transactions”; and

“Corporate Governance – Director Independence.”

Independence” in the 2011 Proxy Statement.

Item 14.  Principal Accounting Fees and Services

Information included under the following caption in the 2010 Proxy Statement is incorporated herein

Item 14. Principal Accounting Fees and Services
Incorporated by reference:

reference to:
 

“Item 2:Proposal 4: Ratification of the Registered Independent Public Accounting Firm for 2011 – PwC’s 2010 – Fees to Registered Independent Public Accounting Firm forand 2009 and 2008”Fees” and “– Pre-approvalPre-Approval Policies and Procedures.”

Procedures” in the 2011 Proxy Statement.


Bank of America 2010     245


Part IV
Bank of America Corporation and Subsidiaries
Bank of America 2009Item 15. Exhibits, Financial Statement Schedules
 205


Part IV

Bank of America Corporation and Subsidiaries

Item 15.  Exhibits, Financial Statement Schedules


The following documents are filed as part of this report:

(1) Financial Statements:
(1)  

Financial Statements:

Report of Independent Registered Public Accounting Firm


Consolidated Statement of Income for the years ended December 31, 2010, 2009 2008 and 2007

2008
 

Consolidated Balance Sheet at December 31, 20092010 and 2008

2009
 

Consolidated Statement of Changes in Shareholders’ Equity for the years ended December 31, 2008, 20072010, 2009 and 2006

2008
 

Consolidated Statement of Cash Flows for the years ended December 31, 2010, 2009 2008 and 2007

2008
 

Notes to Consolidated Financial Statements

(2) Schedules:
(2)  

Schedules:

None
(3) 

None

(3

The exhibits filed as part of this report and exhibits incorporated herein by reference to other documents are listed in the Index to Exhibits to this Annual Report on Form 10-K (pages E-1 through E-5,E-6, including executive compensation plans and arrangements which are listed under Exhibit Nos. 10(a)10 (a) through 10(ddd)10(III)).

With the exception of the information expressly incorporated herein by reference, the 20102011 Proxy Statement isshall not to be deemed filed as part of this Annual Report onForm 10-K.

206Bank of America 2009
246     Bank of America 2010


Signatures

Pursuant to the requirements of Section 13 of the Securities Exchange Act of 1934, the registrant has duly caused this report to be signed on its behalf by the undersigned, thereunto duly authorized.

Date: February 26, 2010

25, 2011
Bank of America Corporation
By:

*

/s/  Brian T. Moynihan

Brian T. Moynihan

Chief Executive Officer and President

Brian T. Moynihan
Chief Executive Officer and President
Pursuant to the requirements of the Securities Exchange Act of 1934, this report has been signed below by the following persons on behalf of the registrant and in the capacities and on the dates indicated.

Signature


Title


Date

SignatureTitleDate

*/s/ Brian T. Moynihan


Brian T. Moynihan


Chief Executive Officer,
President and Director
(Principal Executive Officer)

 February 26, 201025, 2011

*/s/ Charles H. Noski

Charles H. Noski
Chief Financial Officer and Executive Vice President
(Principal Financial Officer)
February 25, 2011
*/s/ Neil A. Cotty


Neil A. Cotty


Interim Chief Financial Officer
and Chief Accounting Officer
(Principal Financial Officer and Principal Accounting Officer)

 February 26, 201025, 2011

*/s/ Susan S. Bies


Susan S. Bies

 Director February 26, 201025, 2011

*/s/ William P. Boardman


William P. Boardman

 Director February 26, 201025, 2011

*/s/ Frank P. Bramble, Sr.


Frank P. Bramble, Sr.

 Director February 26, 201025, 2011

*/s/ Virgis W. Colbert


Virgis W. Colbert

 Director February 26, 201025, 2011

*/s/ Charles K. Gifford


Charles K. Gifford

 Director February 26, 201025, 2011

*/s/ Charles O. Holliday, Jr.


Charles O. Holliday, Jr.

 Director February 26, 201025, 2011

*/s/ D. Paul Jones


D. Paul Jones

 Director February 26, 2010

25, 2011
Bank of America 2009 207


Signature


Title

Date

*/s/ Monica C. Lozano


Monica C. Lozano

 Director February 26, 201025, 2011

*/s/ Walter E. Massey

Walter E. Massey

Thomas J. May
Thomas J. May
 Director February 26, 201025, 2011

*/s/ Thomas J. May

Thomas J. May

Donald E. Powell
Donald E. Powell
 Director February 26,25, 2011
Bank of America 2010247


SignatureTitleDate

*/s/ Donald E. Powell

Donald E. Powell

Charles O. Rossotti
Charles O. Rossotti
 Director February 26, 201025, 2011

*/s/ Charles O. Rossotti

Charles O. Rossotti

Robert W. Scully
Robert W. Scully
 Director February 26, 201025, 2011

*/s/ Thomas M. Ryan

Thomas M. Ryan

 Director February 26, 2010

*By:

/s/  Robert W. Scully

Robert W. Scully

Craig T. Beazer

Craig T. Beazer
Attorney-in-Fact
 Director February 26, 2010
248     Bank of America 2010


Index to Exhibits

*By:                     /s/ Teresa M. Brenner

Teresa M. Brenner

Attorney-in-Fact

 
Exhibit No. 

208Bank of America 2009


Index to Exhibits

Exhibit No.

Description

2(a) 

Agreement and Plan of Merger dated as of September 15, 2008 by and between Merrill Lynch & Co., Inc. and the registrant, incorporated by reference to Exhibit 2.1 of registrant’s Current Report onForm 8-K (FileNo. 1-6523) filed September 18, 2008.

3(a) 

Amended and Restated Certificate of Incorporation of registrant, as in effect on the date hereof, filed herewith.

incorporated by reference to Exhibit 3(a) of the registrant’s Quarterly Report onForm 10-Q (FileNo. 1-6523) for the quarter ended March 31, 2010.
(b) 

Amended and Restated Bylaws of registrant as in effect on the date hereof, incorporated by reference to Exhibit 3.2 of registrant’s Current Report on Form 8-K (File No. 1-6523)February 24, 2011, filed December 15, 2008.

herewith.
4(a) 

Indenture dated as of January 1, 1995 between registrant (successor to NationsBank Corporation) and BankAmerica National Trust Company incorporated by reference to Exhibit 4.1 of registrant’s Registration Statement onForm S-3 (RegistrationNo. 33-57533); filed on February 1, 1995; First Supplemental Indenture thereto dated as of September 18, 1998, between registrant and U.S. Bank Trust National Association (successor to BankAmerica National Trust Company), incorporated by reference to Exhibit 4.3 of registrant’s Current Report onForm 8-K (FileNo. 1-6523) filed November 18, 1998; Second Supplemental Indenture thereto dated as of May 7, 2001 between registrant, U.S. Bank Trust National Association, as Prior Trustee, and The Bank of New York, as Successor Trustee, incorporated by reference to Exhibit 4.4 of registrant’s Current Report onForm 8-K (FileNo. 1-6523) filed June 14, 2001; Third Supplemental Indenture thereto dated as of July 28, 2004, between registrant and The Bank of New York, incorporated by reference to Exhibit 4.2 of registrant’s Current Report onForm 8-K (FileNo. 1-6523) filed August 27, 2004; Fourth Supplemental Indenture thereto dated as of April 28, 2006 between the registrant and The Bank of New York, incorporated by reference to Exhibit 4.6 of registrant’s Registration Statement onForm S-3 (RegistrationNo. 333-133852); filed on May 5, 2006; and Fifth Supplemental Indenture dated as of December 1, 2008 between the registrant and The Bank of New York Mellon Trust Company, N.A. (successor to The Bank of New York), incorporated by reference to Exhibit 4.1 of registrant’s Current Report onForm 8-K (FileNo. 1-6523) filed December 5, 2008.

(b) 

Form of Senior Registered Note, incorporated by reference to Exhibit 4.7 of registrant’s Registration Statement onForm S-3 (RegistrationNo. 333-133852).

filed on May 5, 2006.
(c) 

Form of Global Senior Medium-Term Note, Series L, incorporated by reference to Exhibit 4.12 of registrant’s Registration Statement onForm S-3 (RegistrationNo. 333-158663).

filed on April 20, 2009.
(d) 

Indenture dated as of January 1, 1995 between registrant (successor to NationsBank Corporation) and The Bank of New York, incorporated by reference to Exhibit 4.5 of registrant’s Registration Statement onForm S-3 (RegistrationNo. 33-57533); filed on February 1, 1995; First Supplemental Indenture thereto dated as of August 28, 1998, between registrant and The Bank of New York, incorporated by reference to Exhibit 4.8 of registrant’s Current Report onForm 8-K (FileNo. 1-6523) filed November 18, 1998; and Second Supplemental Indenture thereto dated as of January 25, 2007, between registrant and The Bank of New York Trust Company, N.A. (successor to The Bank of New York), incorporated by reference to Exhibit 4.3 of registrant’s Registration Statement onForm S-4 (RegistrationNo. 333-141361).

filed on March 16, 2007.
(e) 

Form of Subordinated Registered Note, incorporated by reference to Exhibit 4.10 of registrant’s Registration Statement onForm S-3 (RegistrationNo. 333-133852).

filed on May 5, 2006.
(f) 

Form of Global Subordinated Medium-Term Note, Series L, incorporated by reference to Exhibit 4.17 of registrant’s Registration Statement onForm S-3 (RegistrationNo. 333-158663).

filed on April 20, 2009.
(g) 

Amended and Restated Agency Agreement dated as of July 22, 2009,2010, among the registrant, The Bank of New York Mellon, Bank of America, N.A., London Branch, as Principal Agent, and Merrill Lynch International Bank Limited, as Registrar and other agents,Transfer Agent, incorporated by reference to Exhibit 4.1 of the registrant’s Current Report onForm 8-K (FileNo. 1-6523) filed July 28, 2009.

27, 2010.
(h) 

Amended and Restated Senior Indenture dated as of July 1, 2001 between registrant and The Bank of New York, pursuant to which registrant issued its Senior InterNotesSMsm, incorporated by reference to Exhibit 4.1 of registrant’s Registration Statement onForm S-3 (RegistrationNo. 333-65750).

filed on July 24, 2001.
(i) 

Amended and Restated Subordinated Indenture dated as of July 1, 2001 between registrant and The Bank of New York, pursuant to which registrant issued its Subordinated InterNotesSMsm, incorporated by reference to Exhibit 4.2 of registrant’s Registration Statement onForm S-3 (RegistrationNo. 333-65750).

filed on July 24, 2001.
(j) 

Restated Indenture dated as of November 1, 2001 between registrant and The Bank of New York, incorporated by reference to Exhibit 4.10 of amendment No. 1 to registrant’s Registration Statement onForm S-3 (RegistrationNo. 333-70984).

filed on November 15, 2001.
(k) 

First Supplemental Indenture dated as of December 14, 2001 to the Restated Indenture dated as of November 1, 2001 between registrant and The Bank of New York pursuant to which registrant issued its 7% Junior Subordinated Notes due 2031, incorporated by reference to Exhibit 4.3 of registrant’s Current Report onForm 8-K (FileNo. 1-6523) filed December 14, 2001.

(l) 

Second Supplemental Indenture dated as of January 31, 2002 to the Restated Indenture dated as of November 1, 2001 between registrant and The Bank of New York pursuant to which registrant issued its 7% Junior Subordinated Notes due 2032, incorporated by reference to Exhibit 4.3 of registrant’s Current Report onForm 8-K (FileNo. 1-6523) filed January 31, 2002.

(m) 

Third Supplemental Indenture dated as of August 9, 2002 to the Restated Indenture dated as of November 1, 2001 between registrant and The Bank of New York pursuant to which registrant issued its 7% Junior Subordinated Notes due 2032, incorporated by reference to Exhibit 4.3 of registrant’s Current Report onForm 8-K (FileNo. 1-6523) filed August 9, 2002.

(n) 

Fourth Supplemental Indenture dated as of April 30, 2003 to the Restated Indenture dated as of November 1, 2001 between registrant and The Bank of New York pursuant to which registrant issued its 57//8% Junior Subordinated Notes due 2033, incorporated by reference to Exhibit 4.3 of registrant’s Current Report onForm 8-K (FileNo. 1-6523) filed April 30, 2003.


E-1


 E-1


Exhibit No.


Description

(o) 

Fifth Supplemental Indenture dated as of November 3, 2004 to the Restated Indenture dated as of November 1, 2001 between registrant and The Bank of New York pursuant to which registrant issued its 6% Junior Subordinated Notes due 2034, incorporated by reference to Exhibit 4.3 of registrant’s Current Report onForm 8-K (FileNo. 1-6523) filed November 3, 2004.

(p) 

Sixth Supplemental Indenture dated as of March 8, 2005 to the Restated Indenture dated as of November 1, 2001 between the registrant and The Bank of New York pursuant to which registrant issued its 55//8% Junior Subordinated Notes due 2035, incorporated by reference to Exhibit 4.3 of registrant’s Current Report onForm 8-K (FileNo. 1-6523) filed March 9, 2005.

(q) 

Seventh Supplemental Indenture dated as of August 10, 2005 to the Restated Indenture dated as of November 1, 2001 between the registrant and The Bank of New York pursuant to which registrant issued its 51//4% Junior Subordinated Notes due 2035, incorporated by reference to Exhibit 4.3 of registrant’s Current Report onForm 8-K (FileNo. 1-6523) filed August 11, 2005.

(r) 

Eighth Supplemental Indenture dated as of August 25, 2005 to the Restated Indenture dated as of November 1, 2001 between the registrant and The Bank of New York pursuant to which registrant issued its 6% Junior Subordinated Notes due 2035, incorporated by reference to Exhibit 4.3 of the Current Report onForm 8-K (FileNo. 1-6523) filed August 26, 2005.

(s) 

Tenth Supplemental Indenture dated as of March 28, 2006 to the Restated Indenture dated as of November 1, 2001 between the registrant and The Bank of New York pursuant to which registrant issued its 61//4% Junior Subordinated Notes due 2055, incorporated by reference to Exhibit 4(bb) of registrant’s 2006 Annual Report onForm 10-K (FileNo. 1-6523) (the “200610-K”).

(t) 

Eleventh Supplemental Indenture dated as of May 23, 2006 to the Restated Indenture dated as of November 1, 2001 between the registrant and The Bank of New York pursuant to which registrant issued its 65//8% Junior Subordinated Notes due 2036, incorporated by reference to Exhibit 4(cc) of the 200610-K.

(u) 

Twelfth Supplemental Indenture dated as of August 2, 2006 to the Restated Indenture dated as of November 1, 2001 between the registrant and The Bank of New York pursuant to which registrant issued its 67//8% Junior Subordinated Notes due 2055, incorporated by reference to Exhibit 4(dd) of the 200610-K.

(v) 

Thirteenth Supplemental Indenture dated as of February 16, 2007 to the Restated Indenture dated as of November 1, 2001 between the registrant and The Bank of New York Trust Company, N.A. (successor to The Bank of New York) pursuant to which registrant issued its Remarketable Floating Rate Junior Subordinated Notes due 2043, incorporated by reference to Exhibit 4.6 of registrant’s Current Report onForm 8-K (FileNo. 1-6523) filed February 16, 2007.

(w) 

Fourteenth Supplemental Indenture dated as of February 16, 2007 to the Restated Indenture dated as of November 1, 2001 between the registrant and The Bank of New York Trust Company, N.A. (successor to The Bank of New York) pursuant to which registrant issued its Remarketable Fixed Rate Junior Subordinated Notes due 2043, incorporated by reference to Exhibit 4.7 of registrant’s Current Report onForm 8-K (FileNo. 1-6523) filed February 16, 2007.

(x) 

Fifteenth Supplemental Indenture dated as of May 31, 2007 to the Restated Indenture dated as of November 1, 2001 between the registrant and The Bank of New York Trust Company, N.A. (successor to The Bank of New York) pursuant to which registrant issued its Floating Rate Junior Subordinated Notes due 2056, incorporated by reference to Exhibit 4.4 of registrant’s Current Report onForm 8-K (FileNo. 1-6523) filed June 1, 2007.

(y) 

Form of Supplemental Indenture to be used in connection with the issuance of registrant’s junior subordinated notes, including form of Junior Subordinated Note, incorporated by reference to Exhibit 4.44 of registrant’s Registration Statement onForm S-3 (RegistrationNo. 333-133852).

filed on May 5, 2006.
(z) 

Form of Guarantee with respect to capital securities to be issued by various capital trusts, incorporated by reference to Exhibit 4.47 of registrant’s Registration Statement onForm S-3 (RegistrationNo. 333-133852).

filed on May 5, 2006.
(aa) 

Agreement of Appointment and Acceptance dated as of December 29, 2006 between registrant and The Bank of New York Trust Company, N.A., incorporated by reference to Exhibit 4(aaa) of the 200610-K.

(bb) 

Global Agency Agreement dated as of July 25, 2007 among Bank of America, N.A., Deutsche Bank Trust Company Americas, Deutsche Bank AG, London Branch, and Deutsche Bank Luxembourg S.A, incorporated by reference to Exhibit 4(x) of registrant’s 2008 Annual Report onForm 10-K (FileNo. 1-6523) (the “200810-K”).

(cc) 

Supplement to Global Agency Agreement dated as of December 19, 2008 among Bank of America, N.A., Deutsche Bank Trust Company Americas, Deutsche Bank AG, London Branch and Deutsche Bank Luxembourg S.A, incorporated by reference to Exhibit 4(y) of the 200810-K.

(dd) Supplement to Global Agency Agreement dated as of April 30, 2010 among Bank of America, N.A., Deutsche Bank Trust Company Americas, Deutsche Bank AG, London Branch and Deutsche Bank Luxembourg, S.A., incorporated by reference to Exhibit 4(a) of the registrant’s Quarterly Report onForm 10-Q (FileNo. 1-6523) for the quarter ended June 30, 2010.
(ee)Sixth Supplemental Indenture dated as of February 23, 2011 to the Indenture dated as of January 1, 1995 between the registrant and The Bank of New York Mellon Trust Company, N.A., filed herewith.
(ff)Third Supplemental Indenture dated as of February 23, 2011 to the Indenture dated as of January 1, 1995 between the registrant and The Bank of New York Mellon Trust Company, N.A., filed herewith.
(gg)First Supplemental Indenture dated as of February 23, 2011 to the Amended and Restated Senior Indenture dated as of July 1, 2001 between the registrant and The Bank of New York Mellon Trust Company, N.A. (successor to The Bank of New York ), filed herewith.
(hh)First Supplemental Indenture dated as of February 23, 2011 to the Amended and Restated Subordinated Indenture dated as of July 1, 2001 between the registrant and The Bank of New York Mellon Trust Company, N.A. (successor to The Bank of New York), filed herewith.

E-2


Exhibit No.Description
The registrant hasand its subsidiaries have other long-term debt agreements, but these are omitted pursuant Item 601(6)601(b)(4)(iii) ofRegulation S-K. Copies of these agreements will be furnished to the Commission on request.

10(a) 

NationsBank Corporation and Designated Subsidiaries Supplemental Executive Retirement Plan, incorporated by reference to Exhibit 10(j) of registrant’s 1994 Annual Report onForm 10-K (FileNo. 1-6523) (the “199410-K”); Amendment thereto dated as of June 28, 1989, incorporated by reference to Exhibit 10(g) of registrant’s 1989 Annual Report onForm 10-K (FileNo. 1-6523) (the “198910-K”); Amendment thereto dated as of June 27, 1990, incorporated by reference to Exhibit 10(g) of registrant’s 1990 Annual Report onForm 10-K (FileNo. 1-6523) (the “199010-K”); Amendment thereto dated as of July 21, 1991, incorporated by reference to Exhibit 10(bb) of registrant’s 1991 Annual Report onForm 10-K (FileNo. 1-6523) (the “199110-K”); Amendments thereto dated as of December 3, 1992 and December 15, 1992, incorporated by reference to Exhibit 10(l) of registrant’s 1992 Annual Report onForm 10-K (FileNo. 1-6523) (the “199210-K”); Amendment thereto dated as of September 28, 1994, incorporated by reference to Exhibit 10(j) of registrant’s 199410-K;

E-2


Exhibit No.

Description

Amendments thereto dated March 27, 1996 and June 25, 1997, incorporated by reference to Exhibit 10(c) of registrant’s 1997 Annual Report onForm 10-K; Amendments thereto dated April 10, 1998, June 24, 1998 and October 1, 1998, incorporated by reference to Exhibit 10(b) of registrant’s 1998 Annual Report onForm 10-K (FileNo. 1-6523) (the “199810-K”); Amendment thereto dated December 14, 1999, incorporated by reference to Exhibit 10(b) of registrant’s 1999 Annual Report onForm 10-K; Amendment thereto dated as of March 28, 2001, incorporated by reference to Exhibit 10(b) of registrant’s 2001 Annual Report onForm 10-K (FileNo. 1-6523) (the “200110-K”); and Amendment thereto dated December 10, 2002, incorporated by reference to Exhibit 10(b) of registrant’s 2002 Annual Report onForm 10-K (FileNo. 1-6523) (the “200210-K”).*

(b) 

NationsBank Corporation and Designated Subsidiaries Deferred Compensation Plan for Key Employees, incorporated by reference to Exhibit 10(k) of the 199410-K; Amendment thereto dated as of June 28, 1989, incorporated by reference to Exhibit 10(h) of the 198910-K; Amendment thereto dated as of June 27, 1990, incorporated by reference to Exhibit 10(h) of the 199010-K; Amendment thereto dated as of July 21, 1991, incorporated by reference to Exhibit 10(bb) of the 199110-K; Amendment thereto dated as of December 3, 1992, incorporated by reference to Exhibit 10(m) of the 199210-K; and Amendments thereto dated April 10, 1998 and October 1, 1998, incorporated by reference to Exhibit 10(b) of the 199810-K.*

(c) 

Bank of America Pension Restoration Plan, as amended and restated effective January 1, 2009, incorporated by reference to Exhibit 10(c) of registrant’s 2008 10-K, and10-K; Amendment thereto dated December 18, 2009, incorporated by reference to Exhibit 10(c) of the registrant’s 2009 Annual Report onForm 10-K (FileNo. 1-6523) (the “200910-K”); and Amendment thereto dated December 16, 2010, filed herewith.*

(d) 

NationsBank Corporation Benefit Security Trust dated as of June 27, 1990, incorporated by reference to Exhibit 10(t) of the 199010-K; First Supplement thereto dated as of November 30, 1992, incorporated by reference to Exhibit 10(v) of the 199210-K; and Trustee Removal/Appointment Agreement dated as of December 19, 1995, incorporated by reference to Exhibit 10(o) of registrant’s 1995 Annual Report onForm 10-K (FileNo. 1-6523).*

(e) 

Bank of America 401(k) Restoration Plan, as amended and restated effective January 1, 2009, incorporated by reference to Exhibit 10(a) of registrant’s Quarterly Report onForm 10-Q (FileNo. 1-6523) for the quarter ended September 30, 2009, and2009; Amendment thereto dated December 18, 2009, incorporated by reference to Exhibit 10(e) of the 200910-K; and Amendment thereto dated December 16, 2010, filed herewith.herewith in Exhibit 10(c).*

(f) 

Bank of America Executive Incentive Compensation Plan, as amended and restated effective December 10, 2002, incorporated by reference to Exhibit 10(g) of the 200210-K.*

(g) 

Bank of America Director Deferral Plan, as amended and restated effective January 1, 2005, incorporated by reference to Exhibit 10(g) of the registrant’s 200610-K.*

(h) 

Bank of America Corporation Directors’ Stock Plan as amended and restated effective April 26, 2006, incorporated by reference to Exhibit 10.2 to the registrant’s Current Report onForm 8-K filed December 14, 2005; form of Restricted Stock Award Agreement incorporated by reference to Exhibit 10(h) of registrant’s 2004 Annual Report onForm 10-K (FileNo. 1-6523) (the “200410-K”); and Form of Directors Stock Plan Restricted Stock Award Agreement for Nonemployee Chairman, incorporated by reference to Exhibit 10(b) of registrant’s Quarterly Report onForm 10-Q (FileNo. 1-6523) for the quarter ended September 30, 2009.

E-3


Exhibit No.Description
(i) 

Bank of America Corporation 2003 Key Associate Stock Plan, effective January 1, 2003, as amended and restated effective April 1, 2004,28, 2010, incorporated by reference to Exhibit 10(f)10.2 of registrant’s Registration StatementCurrent Report onForm S-48-K (FileNo. 333-110924)1-6523) filed May 3, 2010*; Amendment thereto dated March 13, 2006, formand the following forms of award agreement under the plan:

•   Form of Restricted Stock Units Award Agreement and form of Stock Option Award Agreement,(February 2007 grant), incorporated by reference to Exhibit 10(i) of the registrant’s 2007 Annual Report onForm 10-K (FileNo. 1-6523) (the “200710-K”)*; Amendment thereto dated December 17, 2008,

•   Form of Stock Option Award Agreement (February 2007 grant), incorporated by reference to Appendix FExhibit 10(i) of Part I to the document included in registrant’s Registration Statement on200710-K*;
   Form S-4/A (Registration No. 333-153771); and 2008 form of Restricted Stock Units Award Agreement for non-executives and(February 2008 formgrant), incorporated by reference to Exhibit 10(i) of the 200910-K*;
•   Form of Stock Option Award Agreement for non-executives filed herewith.*

    (j)

Split Dollar Life Insurance Agreement dated as of September 28, 1998 between registrant and J. Steele Alphin, as Trustee under that certain Irrevocable Trust Agreement dated June 23, 1998, by and between Kenneth D. Lewis, as Grantor, and J. Steele Alphin, as Trustee,(February 2008 grant), incorporated by reference to Exhibit 10(ee)10(i) of the 1998 10-K; and Amendment thereto200910-K*;

•   Restricted Stock Units Award Agreement for Sallie L. Krawcheck dated January 24, 2002,15, 2010, filed herewith*;
•   Form of Restricted Stock Units Award Agreement for executives (February 2010 grant), filed herewith*;
•   Form of Restricted Stock Award Agreement (February 2010 grant), filed herewith*;
•   Form of Performance Contingent Restricted Stock Units Award Agreement, incorporated by reference to Exhibit 10(p)10.3 of the 2001 10-K.*

registrant’s Current Report onForm 8-K (FileNo. 1-6523) filed January 31, 2011*;
 (k) 

•   Form of Performance Contingent Restricted Stock Units Award Agreement (February 2011 grant), filed herewith*; and

•   Form of Restricted Stock Units Award Agreement for non-executives (February 2011 grant), filed herewith*.
(j)Amendment to various plans in connection with FleetBoston Financial Corporation merger, incorporated by reference to Exhibit 10(v) of registrant’s 2003 Annual Report onForm 10-K.*

    (l)(k) 

FleetBoston Supplemental Executive Retirement Plan, as amended by Amendment One thereto effective January 1, 1997, Amendment Two thereto effective October 15, 1997, Amendment Three thereto effective July 1, 1998, Amendment Four thereto effective August 15, 1999, Amendment Five thereto effective January 1, 2000, Amendment Six thereto effective October 10, 2001, Amendment Seven thereto effective February 19, 2002, Amendment Eight thereto effective October 15, 2002, Amendment Nine thereto effective January 1, 2003, Amendment Ten thereto effective October 21, 2003, and Amendment Eleven thereto effective December 31, 2004, incorporated by reference to Exhibit 10(r) of the 200410-K.*

    (m)(l) 

FleetBoston Amended and Restated 1992 Stock Option and Restricted Stock Plan, incorporated by reference to Exhibit 10(s) of the 200410-K.*

    (n)(m) 

FleetBoston Executive Deferred Compensation Plan No. 2, as amended by Amendment One thereto effective February 1, 1999, Amendment Two thereto effective January 1, 2000, Amendment Three thereto effective January 1, 2002, Amendment Four thereto effective October 15, 2002, Amendment Five thereto effective January 1, 2003, and Amendment Six thereto effective December 16, 2003, incorporated by reference to Exhibit 10(u) of the 200410-K.*

    (o)(n) 

FleetBoston Executive Supplemental Plan, as amended by Amendment One thereto effective January 1, 2000, Amendment Two thereto effective January 1, 2002, Amendment Three thereto effective January 1, 2003, Amendment Four thereto effective January 1, 2003, and Amendment Five thereto effective December 31, 2004, incorporated by reference to Exhibit 10(v) of the 200410-K.*

    (p)(o) 

Retirement Income Assurance Plan for Legacy Fleet, as amended and restated effective January 1, 2009, incorporated by reference to Exhibit 10(p) of the 200910-K; and Amendment thereto dated December 16, 2010, filed herewith.herewith in Exhibit 10(c).*

(p) E-3


Exhibit No.

Description

    (q)

Trust Agreement for the FleetBoston Executive Deferred Compensation Plans No. 1 and 2, incorporated by reference to Exhibit 10(x) of the 200410-K.*

    (r)(q) 

Trust Agreement for the FleetBoston Executive Supplemental Plan, incorporated by reference to Exhibit 10(y) of the 200410-K.*

    (s)(r) 

Trust Agreement for the FleetBoston Retirement Income Assurance Plan and the FleetBoston Supplemental Executive Retirement Plan, incorporated by reference to Exhibit 10(z) of the 200410-K.*

    (t)(s) 

FleetBoston Directors Deferred Compensation and Stock Unit Plan, as amended by an amendment thereto effective as of July 1, 2000, a Second Amendment thereto effective as of January 1, 2003, a Third Amendment thereto dated April 14, 2003, and a Fourth Amendment thereto effective January 1, 2004, incorporated by reference to Exhibit 10(aa) of the 200410-K.*

    (u)(t) 

FleetBoston 1996 Long-Term Incentive Plan, incorporated by reference to Exhibit 10(bb) of the 200410-K.*

    (v)(u) 

BankBoston Corporation and its Subsidiaries Deferred Compensation Plan, as amended by a First Amendment thereto, a Second Amendment thereto, a Third Amendment thereto, an Instrument thereto (providing for the cessation of accruals effective December 31, 2000) and an Amendment thereto dated December 24, 2001, incorporated by reference to Exhibit 10(cc) of the 200410-K.*

    (w)(v) 

BankBoston, N.A. Bonus Supplemental Employee Retirement Plan, as amended by a First Amendment, a Second Amendment, a Third Amendment and a Fourth Amendment thereto, incorporated by reference to Exhibit 10(dd) of the 200410-K.*

    (x)(w) 

Description of BankBoston Supplemental Life Insurance Plan, incorporated by reference to Exhibit 10(ee) of the 200410-K.*

    (y)(x) 

BankBoston, N.A. Excess Benefit Supplemental Employee Retirement Plan, as amended by a First Amendment, a Second Amendment, a Third Amendment thereto (assumed by FleetBoston on October 1, 1999) and an Instrument thereto, incorporated by reference to Exhibit 10(ff) of the 200410-K.*

    (z)(y) 

Description of BankBoston Supplemental Long-Term Disability Plan, incorporated by reference to Exhibit 10(gg) of the 200410-K.*

    (aa)(z) 

BankBoston Director Stock Award Plan, incorporated by reference to Exhibit 10(hh) of the 200410-K.*

E-4


 (bb) 

Exhibit No.Description
(aa)BankBoston Directors Deferred Compensation Plan, as amended by a First Amendment and a Second Amendment thereto, incorporated by reference to Exhibit 10(ii) of the 200410-K.*

    (cc)(bb) 

BankBoston, N.A. Directors’ Deferred Compensation Plan, as amended by a First Amendment and a Second Amendment thereto, incorporated by reference to Exhibit 10(jj) of the 200410-K.*

    (dd)(cc) 

BankBoston 1997 Stock Option Plan for Non-Employee Directors, as amended by an amendment thereto dated as of October 16, 2001, incorporated by reference to Exhibit 10(kk) of the 200410-K.*

    (ee)(dd) 

Description of BankBoston Director Retirement Benefits Exchange Program, incorporated by reference to Exhibit 10(ll) of the 200410-K.*

    (ff)(ee) 

Employment Agreement, dated as of March 14, 1999, between FleetBoston and Charles K. Gifford, as amended by an amendment thereto effective as of February 7, 2000, a Second Amendment thereto effective as of April 22, 2002, and a Third Amendment thereto effective as of October 1, 2002, incorporated by reference to Exhibit 10(mm) of the 200410-K.*

    (gg)(ff) 

Form of Change in Control Agreement entered into with Charles K. Gifford, incorporated by reference to Exhibit 10(nn) of the 200410-K.*

    (hh)(gg) 

Global amendment to definition of “change in control” or “change of control,” together with a list of plans affected by such amendment, incorporated by reference to Exhibit 10(oo) of the 200410-K.*

    (ii)(hh) 

Retirement Agreement dated January 26, 2005 between Bank of America Corporation and Charles K. Gifford, incorporated by reference to Exhibit 10.1 to the registrant’s Current Report onForm 8-K (FileNo. 1-6523) filed January 26, 2005.*

    (jj)(ii) 

Amendment to various FleetBoston stock option awards, dated March 25, 2004, incorporated by reference to Exhibit 10(ss) of the 200410-K.*

    (kk)(jj) 

MBNA Corporation Supplemental Executive Retirement Plan, as amended and restated effective January 1, 2005, incorporated by reference to Exhibit 10(kk) of the 2008 10-K.*

    (ll)

Supplemental Executive Insurance Plan, as amended and restated effective January 1, 2005, incorporated by reference to Exhibit 10(ll) of the 2008 10-K.*

    (mm)

MBNA Corporation Executive Deferred Compensation Plan, as amended and restated effective January 1, 2005, incorporated by reference to Exhibit 10(mm) of the 2008 10-K.

    (nn)

MBNA Corporation 1997 Long Term Incentive Plan, as amended effective April 24, 2000 and restated, as adjusted for July 2002 stock split and as further amended effective April 15, 2005 and restated, and Amendment thereto dated December 15, 2006, incorporated by reference to Exhibit 10(nn) of the 2008 10-K.*

    (oo)

Executive Non-Competition Agreement dated August 9, 1999 among Richard K. Struthers, MBNA Corporation and MBNA America Bank, N.A., incorporated by reference to Exhibit 10(pp) of the 2008 10-K.*

    (pp)

Agreement Regarding Participation in the MBNA Corporation Supplemental Executive Retirement Plan dated December 22, 2008 between Bank of America Corporation and Richard K. Struthers, incorporated by reference to Exhibit 10(qq) of the 2008 10-K.*

    (qq)

Merrill Lynch & Co., Inc. Employee Stock Compensation Plan, incorporated by reference to Exhibit 10(rr) of the 200810-K, and 2009 Restricted Stock Unit Award Agreement for Thomas K. Montag, filed herewith.incorporated by reference to Exhibit 10(qq) of the 200910-K.*

    (rr)(kk) 

Employment Agreement dated October 27, 2003 between Bank of America Corporation and Brian T. Moynihan, incorporated by reference to Exhibit 10(d) of registrant’s Registration Statement onForm S-4 (RegistrationNo. 333-110924). filed on December 4, 2003.*

    (ss)(ll) 

Cancellation Agreement dated October 26, 2005 between Bank of America Corporation and Brian T. Moynihan, incorporated by reference to Exhibit 10.1 of registrant’s Current Report onForm 8-K (FileNo. 1-6523) filed October 26, 2005.*

    (tt)(mm) 

Agreement Regarding Participation in the Fleet Boston Supplemental Executive Retirement Plan dated October 26, 2005 between Bank of America Corporation and Brian T. Moynihan, incorporated by reference to Exhibit 10.2 of registrant’s Current Report onForm 8-K (FileNo. 1-6523) filed October 26, 2005.*

(nn) E-4


Exhibit No.

Description

    (uu)

Forms of Stock Unit Agreements for salary stock units awarded to certain executive officers in connection with registrant’s participation in the U.S. Department of Treasury’s Troubled Asset Relief Program, filed herewith.incorporated by reference to Exhibit 10(uu) of the 200910-K.*

    (vv)(oo) 

Boatmen’s Supplemental Retirement Plan, effective as of August 8, 1989, filed herewith.incorporated by reference to Exhibit 10(vv) of the 200910-K.*

    (ww)(pp) 

Employment Agreement dated January 30, 1996 between Boatmen’s Bancshares, Inc. and Gregory L. Curl, filed herewith.incorporated by reference to Exhibit 10(ww) of the 200910-K.*

    (xx)(qq) 

Employment Agreement dated September 26, 1996 between NationsBank Corporation and Gregory L. Curl, filed herewith.incorporated by reference to Exhibit 10(xx) of the 200910-K.*

    (yy)(rr) 

Employment Letter dated May 7, 2001 between Bank of America Corporation and Gregory L. Curl, filed herewith.incorporated by reference to Exhibit 10(yy) of the 200910-K.*

    (zz)(ss) 

Bank of America Corporation Equity Incentive Plan amended and restated effective as of January 1, 2008, filed herewith.incorporated by reference to Exhibit 10(zz) of the 200910-K.*

    (aaa)(tt) 

Merrill Lynch & Co., Inc. Long-Term Incentive Compensation Plan amended as of January 1, 2009 and 2008 Restricted Units/Stock Option Grant Document for Thomas K. Montag, filed herewith.incorporated by reference to Exhibit 10(aaa) of the 200910-K.*

    (bbb)(uu) 

Employment Letter dated May 1, 2008 between Merrill Lynch & Co., Inc. and Thomas K. Montag and Summary of Agreement with respect to Post-Employment Medical Coverage, filed herewith.incorporated by reference to Exhibit 10(bbb) of the 200910-K.*

    (ccc)(vv) 

Amendment to various plans as required to the extent necessary to comply with Section III of the Emergency Economic Stabilization Act of 2008 (EESA) and form of waiver for any changes to compensation or benefits required to comply with the EESA, all in connection with the registrant’s October 26, 2008 participation in the U.S. Department of Treasury’s Troubled Assets Relief Program, incorporated by reference to Exhibit 10(ss) of the 200810-K.*

    (ddd)(ww) 

Further amendment to various plans and further form of waiver for any changes to compensation or benefits in connection with the registrant’s January 15, 2009 participation in the U.S. Department of Treasury’s Troubled Assets Relief Program, incorporated by reference to Exhibit 10(tt) of the 200810-K.*

    (eee)(xx) 

Letter Agreement, dated October 26, 2008, between the registrant and U.S. Department of the Treasury, with respect to the issuance and sale of registrant’s Fixed Rate Cumulative Perpetual Preferred Stock, Series N and a warrant to purchase common stock, incorporated by reference to Exhibit 10.1 of registrant’s Current Report onForm 8-K (FileNo. 1-6523) filed October 30, 2008.

E-5


 (fff) 

Exhibit No.Description
(yy)Letter Agreement, dated January 9, 2009, between the registrant and U.S. Department of the Treasury, with respect to the issuance and sale of registrant’s Fixed Rate Cumulative Perpetual Preferred Stock, Series Q and a warrant to purchase common stock, incorporated by reference to Exhibit 10.1 of registrant’s Current Report onForm 8-K (FileNo. 1-6523) filed January 13, 2009.

    (ggg)(zz) 

Securities Purchase Agreement, dated January 15, 2009, between the registrant and U.S. Department of the Treasury, with respect to the issuance and sale of registrant’s Fixed Rate Cumulative Perpetual Preferred Stock, Series R and a warrant to purchase common stock, incorporated by reference to Exhibit 10.1 of registrant’s Current Report onForm 8-K (FileNo. 1-6523) filed January 22, 2009.

    (hhh)(aaa) 

Summary of Terms, dated January 15, 2009, incorporated by reference to Exhibit 10.2 of registrant’s Current Report onForm 8-K (FileNo. 1-6523) filed January 22, 2009.

    (iii)(bbb) 

Letter Agreement dated December 9, 2009 between the registrant and the U.S. Department of the Treasury, amending the Securities Purchase Agreement dated January 9, 2009, filed herewith.

incorporated by reference to Exhibit 10(iii) of the 2009 10-K.
    (jjj)(ccc) 

Letter Agreement dated December 9, 2009 between the registrant and the U.S. Department of the Treasury, amending the Securities Purchase Agreement dated January 15, 2009, incorporated by reference to Exhibit 10(jjj) of the 2009 10-K.

(ddd)Retention Award Letter Agreement with Bruce R. Thompson dated January 26, 2009, filed herewith.

*
(eee)Offer letter between Bank of America Corporation and Sallie L. Krawcheck dated August 3, 2009, filed herewith.*
(fff)Letter Agreement dated February 22, 2010 between the registrant and Gregory L. Curl, incorporated by reference to Exhibit 10(c) of registrant’s Quarterly Report onForm 10-Q (File No. 1-6523) for the quarter ended March 31, 2010.
(ggg)Offer letter between Bank of America Corporation and Charles H. Noski dated April 13, 2010, incorporated by reference to Exhibit 10.1 of registrant’s Current Report onForm 8-K (FileNo. 1-6523) filed April 16, 2010.*
(hhh)Form of Cash Settled Stock Unit Award Agreement, incorporated by reference to Exhibit 10.2 of registrant’s Current Report onForm 8-K (FileNo. 1-6523) filed January 31, 2011.*
(iii)Form of Cash Settled Stock Unit Award Agreement (February 2011 grant), filed herewith.*
(jjj)Aircraft Time Sharing Agreement (Multiple Aircraft) dated February 24, 2011 between Bank of America, N. A. and Brian T. Moynihan, filed herewith.*
(kkk)Form of Bank of America Corporation Long-Term Cash Award Agreement for non-executives (February 2009 EIP award), filed herewith.*
(lll)Form of Bank of America Corporation Long-Term Cash Award Agreement for non-executives (February 2009 APP award), filed herewith.*
12 

Ratio of Earnings to Fixed Charges, filed herewith.


Ratio of Earnings to Fixed Charges and Preferred Dividends, filed herewith.

21 

List of Subsidiaries, filed herewith.

23 

Consent of PricewaterhouseCoopers LLP, filed herewith.

24(a) 

Power of Attorney, filed herewith.

(b) 

Corporate Resolution, filed herewith.

31(a) 

Certification of the Chief Executive Officer pursuant to Section 302 of the Sarbanes-Oxley Act of 2002, filed herewith.

(b) 

Certification of the Interim Chief Financial Officer pursuant to Section 302 of the Sarbanes-Oxley Act of 2002, filed herewith.

32(a) 

Certification of the Chief Executive Officer pursuant to 18 U.S.C. Section 1350, as adopted pursuant to Section 906 of the Sarbanes-Oxley Act of 2002, filed herewith.

(b) 

Certification of the Interim Chief Financial Officer pursuant to 18 U.S.C. Section 1350, as adopted pursuant to Section 906 of the Sarbanes-Oxley Act of 2002, filed herewith.

Exhibit 101.INS 

XBRL Instance Document,

filed herewith(1)
Exhibit 101.SCH 

XBRL Taxonomy Extension Schema Document,

filed herewith(1)
Exhibit 101.CAL 

XBRL Taxonomy Extension Calculation Linkbase Document,

filed herewith(1)
Exhibit 101.LAB 

XBRL Taxonomy Extension Label Linkbase Document,

filed herewith(1)
Exhibit 101.PRE 

XBRL Taxonomy Extension Presentation Linkbase Document,

filed herewith(1)
Exhibit 101.DEF 

XBRL Taxonomy Extension Definitions Linkbase Document,

filed herewith(1)

*

Exhibit is a management contract or a compensatory plan or arrangement.

(1)These interactive data files shall not be deemed filed for purposes of Section 11 or 12 of the Securities Act of 1933, as amended, or Section 18 of the Securities Exchange Act of 1934, as amended, or otherwise be subject to liability under those sections.

E-6

E-5