UNITED STATES
SECURITIES AND EXCHANGE COMMISSION
WASHINGTON, D.C. 20549
FORM 10-K
| x | ANNUAL REPORT PURSUANT TO SECTION 13 OR 15(d) OF THE SECURITIES EXCHANGE ACT OF 1934 |
For the fiscal year ended December 31, 20092011
or
| ¨ | TRANSITION REPORT PURSUANT TO SECTION 13 OR 15(d) OF THE SECURITIES EXCHANGE ACT OF 1934 |
For the transition period from to
Commission File Number: 001-33164
Domtar Corporation
(Exact name of registrant as specified in its charter)
| Delaware | 20-5901152 | |
(State or Other Jurisdiction of Incorporation or Organization) | (I.R.S. Employer Identification No.) |
395 de Maisonneuve Blvd. West
Montreal, Quebec H3A 1L6 Canada
(Address of Principal Executive Offices)(Zip (Zip Code)
Registrant’s telephone number, including area code: (514) 848-5555
Securities registered pursuant to Section 12(b) of the Act:
Title of Each Class | Name of Each Exchange on Which Registered | |
Common Stock, par value $0.01 per share | New York Stock Exchange |
Securities registered pursuant to Section 12(g) of the Act: None
Indicate by check mark if the registrant is a well-known seasoned issuer, as defined in Rule 405 of the Securities Act. Yes x No ¨
Indicate by check mark if the registrant is not required to file reports pursuant to Section 13 or Section 15(d) of the Act. Yes ¨ No x
Indicate by check mark whether the registrant: (1) has filed all reports required to be filed by Section 13 or 15(d) of the Securities Exchange Act of 1934 during the preceding 12 months (or for such shorter period that the registrant was required to file such reports), and (2) has been subject to such filing requirements for the past 90 days. Yes x No ¨
Indicate by check mark whether the registrant has submitted electronically and posted on its corporate Website, if any, every Interactive Data File required to be submitted and posted pursuant to Rule 405 of Regulations S-T during the preceding 12 months (or for such shorter period that the registrant was required to submit and post such files). Yes ¨x No ¨
Indicate by check mark if disclosure of delinquent filers pursuant to Item 405 of Regulation S-K is not contained herein, and will not be contained, to the best of registrant’s knowledge, in definitive proxy or information statements incorporated by reference in Part III of this Form 10-K or any amendment to this Form 10-K. ¨
Indicate by check mark whether the registrant is a large accelerated filer, an accelerated filer, a non-accelerated filer, or a smaller reporting company. See definition of “large accelerated filer,” “accelerated filer” and “smaller reporting company” in Rule 12b-2 of the Exchange Act. (Check one):
Large Accelerated Filer x Accelerated Filer ¨ Non-Accelerated Filer ¨ Smaller reporting company ¨
(Do not check if a smaller reporting company)
Indicate by check mark whether the registrant is a shell company (as defined in Rule 12b-2 of the Exchange Act). Yes ¨ No x
As of June 30, 2009,2011, the aggregate market value of the registrant’s common stock held by non-affiliates of the registrant was $689,235,723.$3,742,000,932.
Number of shares of common stock outstanding as of February 24, 2010: 42,083,66417, 2012: 36,134,262
DOCUMENTS INCORPORATED BY REFERENCE
Portions of the Registrant’s Proxy Statement, to be filed within 120 days of the close of the registrant’s fiscal year, in connection with its 20102012 Annual Meeting of Stockholders are incorporated by reference into Part III of this Annual Report on Form 10-K.
DOMTAR CORPORATION
ANNUAL REPORT ON FORM 10-K
FOR THE YEAR ENDED DECEMBER 31, 20092011
| PAGE | ||||||
| PART I | ||||||
ITEM 1 | 4 | |||||
| 4 | ||||||
| 4 | ||||||
| 5 | ||||||
| 6 | ||||||
| 11 | ||||||
| 12 | ||||||
| 12 | ||||||
| 13 | ||||||
| 14 | ||||||
| 14 | ||||||
| 15 | ||||||
| 15 | ||||||
| 16 | ||||||
| 16 | ||||||
| 17 | ||||||
ITEM 1A | ||||||
ITEM 1B | ||||||
ITEM 2 | ||||||
ITEM 3 | ||||||
ITEM 4 |
| |||||
| PART II | ||||||
ITEM 5 | ||||||
| 31 | ||||||
| 31 | ||||||
| 31 | ||||||
| 33 | ||||||
ITEM 6 | ||||||
ITEM 7 | MANAGEMENT’S DISCUSSION AND ANALYSIS OF FINANCIAL CONDITION AND RESULTS OF OPERATIONS | |||||
| 35 | ||||||
| 39 | ||||||
| 39 | ||||||
| 41 | ||||||
| 54 | ||||||
| 54 | ||||||
| 57 | ||||||
| PAGE | ||||||
| 57 | ||||||
Contractual | 58 | |||||
| 58 | ||||||
| 59 | ||||||
ITEM 7A | ||||||
ITEM 8 | ||||||
| 74 | ||||||
Report of PricewaterhouseCoopers LLP, Independent Registered Public Accounting Firm | 75 | |||||
| 76 | ||||||
| 77 | ||||||
| 78 | ||||||
| 79 | ||||||
| 81 | ||||||
ITEM 9 | CHANGES IN AND | |||||
ITEM 9A | ||||||
ITEM 9B | ||||||
| PART III | ||||||
ITEM 10 | ||||||
ITEM 11 | ||||||
ITEM 12 | SECURITY OWNERSHIP OF CERTAIN BENEFICIAL OWNERS AND MANAGEMENT AND RELATED STOCKHOLDER MATTERS | |||||
ITEM 13 | CERTAIN RELATIONSHIPS AND RELATED TRANSACTIONS, AND DIRECTOR INDEPENDENCE | |||||
ITEM 14 | ||||||
| PART IV | ||||||
ITEM 15 | ||||||
Report of Independent Registered Public Accounting Firm on Financial Statement | 159 | |||||
| 164 | ||||||
| 165 | ||||||
PART I
| ITEM 1. | BUSINESS |
We design, manufacture, market and distribute a wide variety of fiber-based products including communication papers, specialty and packaging papers and adult incontinence products. We are the largest integrated manufacturermarketer and marketermanufacturer of uncoated freesheet paper in North America and the second largest in the world based on production capacity. We are also a manufacturer of papergrade, fluff and specialty pulp. We design, manufacture, market and distribute a wide range of paper products for a variety of customers, including merchants, retail outlets, stationers, printers, publishers, converters and end-users. On September 1, 2011, we completed the acquisition of Attends Healthcare Inc. (“Attends”), a producer of adult incontinence products. We also own and operate Domtar Distribution Group,Ariva, an extensive network of strategically located paper and printing supplies distribution facilities. The foundation of our business is the efficient operation of pulp mills, converting fiber into papergrade, fluff and specialty pulp. The majority of this pulp is consumed internally to make communication and specialty papers with the balance being sold as market pulp.
We also produce lumber and other specialty and industrial wood products. We have threeoperate the following business segments: Papers,Pulp and Paper, MerchantsDistribution and Wood.Personal Care. We had revenues of $5.5$5.6 billion in 2009,2011, of which approximately 81%85% was from the PapersPulp and Paper segment, approximately 16%14% was from the Paper MerchantsDistribution segment and approximately 3%1% was from the WoodPersonal Care segment. Our Personal Care segment was formed on September 1, 2011, upon completion of the acquisition of Attends.
Throughout this Annual Report on Form 10-K, unless otherwise specified, “Domtar Corporation,” “the Company,” “Domtar,” “we,” “us” and “our” refer to Domtar Corporation, its subsidiaries, as well as its investments. Unless otherwise specified, “Domtar Inc.” refers to Domtar Inc., a 100% owned Canadian subsidiary.
Domtar Corporation was incorporated on August 16, 2006, for the sole purpose of holding the Weyerhaeuser Fine Paper Business (the “Predecessor”) and consummating the combination of the Weyerhaeuser Fine Paper Business with Domtar Inc. (the “Transaction”). The Predecessor was owned by Weyerhaeuser Company (“Weyerhaeuser”) prior to the completion of the Transaction on March 7, 2007. Domtar Corporation had no operations prior to March 7, 2007 when, upon the completion of the Transaction, we became an independent public holding company. Information regarding the Transaction is included in Part II, Item 7, Management’s Discussion and Analysis of Financial Conditions and Results of Operations of this Annual Report on Form 10-K, under the caption “The Transaction” and “Accounting for the Transaction.”
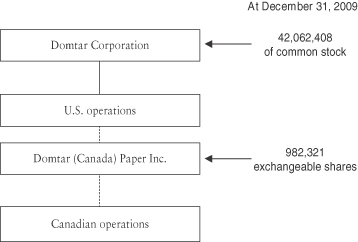
At December 31, 2009,2011, Domtar Corporation had a total of 42,062,40836,131,200 shares of common stock issued and outstanding, and Domtar (Canada) Paper Inc., an indirectly 100% owned subsidiary, had a total of 982,321619,108 exchangeable shares issued and outstanding. These exchangeable shares are intended to be substantially the economic equivalent to shares of our common stock and are currently exchangeable at the option of the holder on a one-for-one basis for shares of our common stock. As such, the total combined number of shares of common stock and exchangeable shares issued and outstanding was 43,044,72936,750,308 at December 31, 2009.2011. Our common shares are traded on the New York Stock Exchange and the Toronto Stock Exchange under the symbol “UFS” and our exchangeable shares are traded on the Toronto Stock Exchange under the symbol “UFX.” Information regarding our common stock and the exchangeable shares is included in Part II, Item 8, Financial Statements and Supplementary Data of this Annual Report on Form 10-K, under Note 2221 “Shareholders’ Equity.”Equity”.
4
The following chart summarizes our corporate structure.

We operate in the three reportable segments described below. Each reportable segment offers different products and services and requires different manufacturing processes, technology and/or marketing strategies.
The following summary briefly describes the operations included in each of our reportable segments:
PapersPulp and Paper – representsOur Pulp and Paper segment comprises the aggregation of the manufacturing, sale and distribution of business, commercial printingcommunication, specialty and publishing, and converting and specialtypackaging papers, as well as softwood, fluff and hardwood market pulp.
Paper MerchantsDistribution – Our Distribution segment involves the purchasing, warehousing, sale and distribution of our paper products and those of other paper manufacturers. These products include business and printing papers, and certain industrial products and printing supplies.
Personal Care– Our Personal Care segment, which we formed in September 2011, consists of the manufacturing, sale and distribution of adult incontinence products.
Wood – comprises the manufacturing and marketing of lumber and other specialty and industrial wood products and the management of forest resources.
Information regarding our reportable segments is included in Part II, Item 7, Management’s Discussion and Analysis of Financial Condition and Results of Operations as well as Item 8, Financial Statements and Supplementary Data, under Note 25,24, of this Annual Report on Form 10-K. Geographic information is also included under Note 2524 of the Financial Statements and Supplementary Data.
5
FINANCIAL HIGHLIGHTS PER SEGMENT | Year ended December 31, 2009 | Year ended December 31, 2008 | Year ended December 30, 2007 (1) | Year ended December 31, 2011 | Year ended December 31, 2010 | Year ended December 31, 2009 | ||||||||||||||||||
| (In millions of dollars, unless otherwise noted) | ||||||||||||||||||||||||
| (In millions of dollars, unless otherwise noted) | ||||||||||||||||||||||||
Sales: | ||||||||||||||||||||||||
Papers | $ | 4,632 | $ | 5,440 | $ | 5,116 | ||||||||||||||||||
Paper Merchants | 873 | 990 | 813 | |||||||||||||||||||||
Wood | 211 | 268 | 304 | |||||||||||||||||||||
Pulp and Paper | $ | 4,953 | $ | 5,070 | $ | 4,632 | ||||||||||||||||||
Distribution | 781 | 870 | 873 | |||||||||||||||||||||
Personal Care(2) | 71 | — | — | |||||||||||||||||||||
Wood(3) | — | 150 | 211 | |||||||||||||||||||||
|
|
| ||||||||||||||||||||||
Total for reportable segments | 5,716 | 6,698 | 6,233 | 5,805 | 6,090 | 5,716 | ||||||||||||||||||
Intersegment sales—Papers | (231 | ) | (276 | ) | (235 | ) | ||||||||||||||||||
Intersegment sales—Paper Merchants | — | — | (1 | ) | ||||||||||||||||||||
Intersegment sales—Pulp and Paper | (193 | ) | (229 | ) | (231 | ) | ||||||||||||||||||
Intersegment sales—Wood | (20 | ) | (28 | ) | (50 | ) | — | (11 | ) | (20 | ) | |||||||||||||
|
|
| ||||||||||||||||||||||
Consolidated sales | $ | 5,465 | $ | 6,394 | $ | 5,947 | $ | 5,612 | $ | 5,850 | $ | 5,465 | ||||||||||||
Operating income (loss): | ||||||||||||||||||||||||
Papers(2) | $ | 650 | $ | (369 | ) | $ | 321 | |||||||||||||||||
Paper Merchants | 7 | 8 | 13 | |||||||||||||||||||||
Wood(2) | (42 | ) | (73 | ) | (63 | ) | ||||||||||||||||||
Pulp and Paper | $ | 581 | $ | 667 | $ | 650 | ||||||||||||||||||
Distribution | — | (3 | ) | 7 | ||||||||||||||||||||
Personal Care(2) | 7 | — | — | |||||||||||||||||||||
Wood(3) | — | (54 | ) | (42 | ) | |||||||||||||||||||
Corporate | — | (3 | ) | (1 | ) | 4 | (7 | ) | — | |||||||||||||||
|
|
| ||||||||||||||||||||||
Total | $ | 615 | $ | (437 | ) | $ | 270 | $ | 592 | $ | 603 | $ | 615 | |||||||||||
Segment assets: | ||||||||||||||||||||||||
Papers | $ | 5,538 | $ | 5,399 | ||||||||||||||||||||
Paper Merchants | 101 | 120 | ||||||||||||||||||||||
Wood | 250 | 247 | ||||||||||||||||||||||
Pulp and Paper | $ | 4,874 | $ | 5,088 | $ | 5,538 | ||||||||||||||||||
Distribution | 84 | 99 | 101 | |||||||||||||||||||||
Personal Care(2) | 458 | — | — | |||||||||||||||||||||
Wood(3) | — | — | 250 | |||||||||||||||||||||
Corporate | 630 | 338 |
|
453 |
|
|
839 |
|
|
630 |
| |||||||||||||
|
|
| ||||||||||||||||||||||
Total | $ | 6,519 | $ | 6,104 | $ | 5,869 | $ | 6,026 | $ | 6,519 | ||||||||||||||
|
|
| ||||||||||||||||||||||
| (1) |
| Factors that affected the year-over-year comparison of financial results are discussed in the year-over-year and segment analysis included in Part II, Item 7, |
6
| (2) | On September 1, 2011 we acquired Attends Healthcare Inc (“Attends”) and formed a new reportable segment entitled Personal Care. Results of Attends are included in the consolidated financial statements as of September 1, 2011. |
| (3) | We sold our Wood Products business on June 30, 2010. |
Our Operations
We produce 4.3 million metric tons of hardwood, softwood and fluff pulp at 12 of our 13 mills. The majority of our pulp is consumed internally to manufacture paper and consumer products, with the balance being sold as market pulp. We also purchase papergrade pulp from third parties allowing us to optimize the logistics of our pulp capacity while reducing transportation costs.
We are the largest integrated manufacturermarketer and marketermanufacturer of uncoated freesheet paper in North America and the second largest in the world based on production capacity.America. We have 10 pulp and paper mills in operation (eight in the United States and two in Canada), with an annual paper production capacity of approximately 3.93.5 million tons of uncoated freesheet paper, after giving effect to the conversion of our Plymouth facility to 100% fluff pulp production in 2010. In addition, we have an annual production capacity of 238,000 tons of coated groundwood at our Columbus paper mill. Approximately 81% of our paper production capacity is domestic and the remaining 19% is located in Canada.paper. Our paper manufacturing operations are supported by 15 converting and distribution operations including a network of 12 plants located offsite of our paper making operations. Also, we have forms manufacturing operations at three of theone offsite converting and distribution operations and two stand-alone forms manufacturing operations. Approximately 78% of our paper production capacity is in the U.S., and the remaining 22% is located in Canada.
In addition, we manufacture and sellWe produce market pulp in excess of our internal requirements and we purchase papergrade pulp from third parties allowing us to optimize the logistics of our pulp capacity while reducing transportation costs. We have the capacity to sell approximately 1.9 million metric tonnes of pulp per year depending on market conditions, after giving effect to the conversion of our Plymouth facility to 100% fluff pulp production in 2010. Approximately 51% of our trade pulp production capacity is domestic, and the remaining 49% is located in Canada. We produce market pulp at our three non-integrated pulp mills in Kamloops, WoodlandDryden, and Dryden,Plymouth as well as at our pulp and paper mills in Espanola, Ashdown, Hawesville, Windsor, Marlboro and Windsor.Nekoosa. We also producehave the capacity to sell approximately 1.7 million metric tons of pulp atper year depending on market conditions. Approximately 43% of our Plymouth mill.trade pulp production capacity is in the U.S., and the remaining 57% is located in Canada.
7
The table below lists our operating pulp and paper mills and their annual production capacity.
| Saleable | Saleable | |||||||||||||||||||||||||||||||
Production Facility | Fiberline Pulp Capacity | Paper Capacity | Trade Pulp (1) | Fiberline Pulp Capacity | Paper(1) | Trade Pulp(2) | ||||||||||||||||||||||||||
| # lines | (‘000 ADMT) | # machines | (‘000 ST) | (‘000 ADMT) | # lines | (’000 ADMT) (4) | # machines | Category(3) | (’000 ST) | (’000 ADMT) (4) | ||||||||||||||||||||||
Uncoated freesheet | Uncoated freesheet | Uncoated freesheet | ||||||||||||||||||||||||||||||
Ashdown, Arkansas | 3 | 810 | 4 | 933 | 86 | 3 | 747 | 3 | Communication | 703 | 129 | |||||||||||||||||||||
Windsor, Quebec | 1 | 454 | 2 | 670 | 33 | 1 | 447 | 2 | Communication | 646 | 54 | |||||||||||||||||||||
Hawesville, Kentucky | 1 | 455 | 2 | 634 | 47 | 1 | 430 | 2 | Communication | 578 | 100 | |||||||||||||||||||||
Kingsport, Tennessee | 1 | 272 | 1 | 425 | 1 | 276 | 1 | Communication | 416 | — | ||||||||||||||||||||||
Marlboro, South Carolina | 1 | 356 | 1 | 391 | 1 | 325 | 1 | Communication | 351 | 46 | ||||||||||||||||||||||
Johnsonburg, Pennsylvania | 1 | 231 | 2 | 374 | 1 | 238 | 2 | Communication | 369 | — | ||||||||||||||||||||||
Nekoosa, Wisconsin | 1 | 162 | 3 | 167 | 1 | 161 | 3 | Specialty & Packaging | 149 | 10 | ||||||||||||||||||||||
Rothschild, Wisconsin | 1 | 60 | 1 | 147 | 1 | 66 | 1 | Communication | 138 | — | ||||||||||||||||||||||
Port Huron, Michigan | — | — | 4 | 116 | — | — | 4 | Specialty & Packaging | 114 | — | ||||||||||||||||||||||
Espanola, Ontario | 2 | 351 | 2 | 77 | 114 | 2 | 352 | 2 | Specialty & Packaging | 77 | 117 | |||||||||||||||||||||
|
|
|
|
|
| |||||||||||||||||||||||||||
Total Uncoated freesheet | 12 | 3,151 | 22 | 3,934 | 280 | 12 | 3,042 | 21 | 3,541 | 456 | ||||||||||||||||||||||
Coated groundwood | ||||||||||||||||||||||||||||||||
Columbus, Mississippi | 1 | 70 | 1 | 238 | — | |||||||||||||||||||||||||||
Total Coated groundwood | 1 | 70 | 1 | 238 | — | |||||||||||||||||||||||||||
Pulp | ||||||||||||||||||||||||||||||||
Kamloops, British Columbia | 2 | 477 | — | — | 477 | 2 | 475 | — | — | 470 | ||||||||||||||||||||||
Woodland, Maine | 1 | 398 | — | — | 398 | |||||||||||||||||||||||||||
Dryden, Ontario | 1 | 319 | — | — | 319 | 1 | 328 | — | — | 322 | ||||||||||||||||||||||
Plymouth, North Carolina | 2 | 444 | — | — | 444 | 2 | 438 | — | — | 436 | ||||||||||||||||||||||
|
|
|
|
|
| |||||||||||||||||||||||||||
Total Pulp | 6 | 1,638 | — | — | 1,638 | 5 | 1,241 | — | — | 1,228 | ||||||||||||||||||||||
Total | 19 | 4,859 | 23 | 4,172 | 1,918 | 17 | 4,283 | 21 | 3,541 | 1,684 | ||||||||||||||||||||||
Pulp purchases | 171 | 131 | ||||||||||||||||||||||||||||||
| ||||||||||||||||||||||||||||||||
Net pulp | 1,747 | 1,553 | ||||||||||||||||||||||||||||||
| ||||||||||||||||||||||||||||||||
| (1) | Paper capacity is based on an operating schedule of 360 days and the production at the winder. |
| (2) | Estimated third-party shipments dependent upon market conditions. |
8
| (3) | Represents the majority of the capacity at each of these facilities. |
| (4) | ADMT refers to an air dry metric ton. |
Our Raw Materials
The manufacturing of pulp and paper requires wood fiber, chemicals and energy. We discuss below these three major raw materials used in our manufacturing operations.operations below.
Wood Fiber
United States pulp and paper mills
The fiber used by our pulp and paper mills in the United States is primarily hardwood and secondarily softwood, both being readily available in the market from multiple third-party sources. The mills obtain fiber from a variety of sources, depending on their location. These sources include a combination of long-term supply contracts, wood lot management arrangements, advance stumpage purchases and spot market purchases.
Canadian pulp and paper mills
The fiber used at our Windsor pulp and paper mill is hardwood originating from a variety of sources, including purchases on the open market in Canada and the United States, contracts with Quebec wood producers’ marketing boards, public land where we have wood fiber harvesting rightssupply allocations and from Domtar’s private lands. OurThe softwood and hardwood fiber for our Espanola pulp and paper mill and the softwood fiber for our Dryden pulp mill, which consume both hardwood and softwood, obtain fiberis obtained from third parties, directly or indirectly from public lands, either through designated wood harvesting rightssupply allocations for the pulp mills or from our Ontario sawmills.mills. The fiber used at our Kamloops pulp mill is all softwood, originating mostly from third-party sawmilling operations in the southernsouthern-interior part of the British Columbia interior.Columbia.
Cutting rights on public lands related to our pulp and paper mills in Canada represent about 0.70.9 million cubic meters of softwood and 1.21.0 million cubic meters of hardwood, for a total of 1.9 million cubic meters of wood per year. Access to harvesting of fiber on public lands in Ontario and Quebec is subject to licenses and review by the respective governmental authorities.
During 2009,2011, the cost of wood fiber relating to our PapersPulp and Paper segment for our pulp and paper mills in the United States and in Canada, comprised approximately 24%20% of the total consolidated cost of sales.
Chemicals
We use various chemical compounds in our pulp and paper manufacturing facilities that we purchase, primarily on a central basis, through contracts varying between one and twelve years in length to ensure product availability. Most of the contracts have pricing that fluctuates based on prevailing market conditions. For pulp manufacturing, we use numerous chemicals including caustic soda, sodium chlorate, sulfuric acid, lime and peroxide. For paper manufacturing, we also use several chemical products including starch, precipitated calcium carbonate, optical brighteners, dyes and aluminum sulfate.
During 2009,2011, the cost of chemicals relating to our PapersPulp and Paper segment comprised approximately 12%13% of the total consolidated cost of sales.
Energy
Our operations consume substantial amounts of fuel including natural gas, fuel oil, coal and hog fuelbiomass, as well as electricity. We purchase substantial portions of the fuel we consume under supply contracts. Under most of these contracts, suppliers are committed to provide quantities within pre-determined ranges that provide us with our needs for a particular type of fuel at a specific facility. Most of these contracts have pricing that fluctuates based on prevailing market conditions. Natural gas, fuel oil, coal and hog fuelbiomass are consumed primarily to produce steam that is used in the manufacturing process and, to a lesser extent, to provide direct heat to be used in the chemical recovery process. About 78%77% of the total energy required to manufacture our products comes from renewable fuels such as bark and spent cooking liquor. The remainder of the energy comes from purchased fossil fuels such as natural gas, oil and coal.
We own power generating assets, including steam turbines, at thirteen locations: Ashdown, Dryden, Espanola, Hawesville, Johnsonburg, Kamloops, Kingsport, Nekoosa, Plymouth, Port Huron, Rothschild, Windsor
9
all of our integrated pulp and Woodland,paper mills, as well as hydro assets at fivefour locations: Espanola, Gatineau,Ottawa-Hull, Nekoosa Woodland and Rothschild. Electricity is primarily used to drive motors and other equipment, as well as provide lighting. Approximately 66%68% of our electric power requirements are produced internally. We purchase the balance of our power requirements from local utilities.
During 2009,2011, energy costs relating to our PapersPulp and Paper segment comprised approximately 7%6% of the total consolidated cost of sales.
Our Product Offering and Go-to-Market Strategy
Our uncoated freesheet papers and coated groundwood papers are used for business, commercial printing and publishing, and converting and specialty applications.
Business papers include copy and electronic imaging papers, which are used with ink jet and laser printers, photocopiers and plain-paper fax machines, as well as computer papers, preprinted forms and digital papers. These products are primarily for office and home use. Business papers accounted for approximately 47% of our shipments of paper products in 2009.
Our commercial printing and publishing papers include uncoated freesheet papers, such as offset papers and opaques and coated groundwood. These uncoated freesheet grades are used in sheet and roll fed offset presses across the spectrum of commercial printing end-uses, including digital printing. Our publishing papers include tradebook and lightweight uncoated papers used primarily in book publishing applications such as textbooks, dictionaries, catalogs, magazines, hard cover novels and financial documents. Design papers, a sub-group of commercial printing and publishing papers, have distinct features of color, brightness and texture and are targeted towards graphic artists, design and advertising agencies, primarily for special brochures and annual reports. Coated groundwood papers are used primarily in magazines, catalogs and inserts. Commercial printing and publishing papers accounted for approximately 29% of our shipments of paper products in 2009.
We also produce paper for several converting and specialty markets. These converting and specialty papers consist primarily of base papers that are converted into finished products, such as envelopes, tablets, business forms and data processing/computer forms and base stock used by the flexible packaging industry in the production of food and medical packaging and other specialty papers for various other industrial applications, including base stock for sandpaper, base stock for medical gowns, drapes and packaging, as well as transfer paper for printing processes. We also participate in several converting grades for specialty and security applications. These converting and specialty papers accounted for approximately 24% of our shipments of paper products in 2009.
The chart below illustrates our main paper products and their applications.
|
|
|
| |||||||||
|
|
|
| |||||||||
|
|
|
|
| ||||||||
|
|
|
|
|
| |||||||
10
Our customer service personnel work closely with sales, marketing and production staff to provide service and support to merchants, converters, end-users, stationers, printers and retailers. We promote our products directly to end-users and others who influence paper purchasing decisions in order to enhance brand recognition and increase product demand. In addition, our sales representatives work closely with mill-based new product development personnel and undertake joint marketing initiatives with customers in order to better understand their businesses and needs and to support their future requirements.
We sell business papers primarily to paper merchants, office equipment manufacturers, stationers and retail outlets. We distribute uncoated commercial printing and publishing papers to end-users and commercial printers, mainly through paper merchants, as well as selling directly to converters. We sell our converting and specialty products mainly to converters, who apply a further production process such as coating, laminating, folding or waxing to our papers before selling them to a variety of specialized end-users. We distributed approximately 41% of our paper products in 2009 through a large network of paper merchants operating throughout North America, one of which we own (see “—Paper Merchants”). Paper merchants, who sell our products to their own customers, represent our largest group of customers.
The chart below illustrates our channels of distribution for our paper products.
| ||||||||||||||
|
|
|
|
|
|
| ||||||||
|
|
|
|
|
| |||||||||
We sell market pulp to customers in North America mainly through a North American sales force while sales to most overseas customers are made directly or through commission agents. We maintain pulp supplies at strategically located warehouses, which allow us to respond to orders on short notice. In 2009, approximately 26% of our sales of market pulp were domestic, 11% were in Canada and 63% were in other countries.
Our ten largest customers represented approximately 52% of our 2009 Papers segment sales or 44% of our total sales in 2009. In 2009, none of our customers represented more than 10% of our total sales. The majority of our customers purchase products through individual purchase orders. In 2009, approximately 79% of our Papers segment sales were domestic, 9% were in Canada, and 12% were in other countries.
Transportation
Transportation of raw materials, wood fiber, chemicals and pulp to our mills is mostly done by rail although trucks are used in certain circumstances. We rely strictly on third parties for the transportation of our pulp and paper products between our mills, converting operations, distribution centers and customers. Our paper products are shipped mostly by truck, and logistics are managed centrally in collaboration with each location. Our pulp is either shipped by vessel, rail or truck. We work with all major railroads and truck companies in the U.S. and Canada. The length of our carrier contracts are generally from one to three years. We pay diesel fuel surcharges which vary depending on market conditions, but are mostly tied to the cost of diesel fuel.
During 2009,2011, outbound transportation costs relating to our PapersPulp and Paper segment comprised approximately 9%11% of the total consolidated cost of sales.
Our Product Offering and Go-to-Market Strategy
11Our uncoated freesheet papers are used for communication and specialty and converting applications. Communication papers are further categorized into business, commercial printing and publishing applications.
Business papers include copy and electronic imaging papers, which are used with ink jet and laser printers, photocopiers and plain-paper fax machines, as well as computer papers, preprinted forms and digital papers. These products are primarily for office and home use. Business papers accounted for approximately 45% of our shipments of paper products in 2011.
Ourcommercial printing and publishing papers include uncoated freesheet papers, such as offset papers and opaques. These uncoated freesheet grades are used in sheet and roll fed offset presses across the spectrum of commercial printing end-uses, including digital printing. Our publishing papers include tradebook and lightweight uncoated papers used primarily in book publishing applications such as textbooks, dictionaries, catalogs, magazines, hard cover novels and financial documents. Design papers, a sub-group of commercial printing and publishing papers, have distinct features of color, brightness and texture and are targeted towards graphic artists, design and advertising agencies, primarily for special brochures and annual reports. These products also include base papers that are converted into finished products, such as envelopes, tablets, business forms and data processing/computer forms. Commercial printing and publishing papers accounted for approximately 43% of our shipments of paper products in 2011.
We also produce paper for severalspecialty and packaging markets. Products consist primarily of base stock used by the flexible packaging industry in the production of food and medical packaging and other specialty papers for various other industrial applications, including base stock for sandpaper, base stock for medical gowns, drapes and packaging, as well as transfer paper for printing processes. We also manufacture products for security applications. These specialty and packaging papers accounted for approximately 12% of our shipments of paper products in 2011. These grades of papers require a certain amount of innovation and agility in the manufacturing system.
The chart below illustrates our main paper products and their applications.
| Communication Papers | Specialty and Converting Papers | |||||||||
Category | Business Papers | Commercial Printing and Publishing Papers | ||||||||
Type | Uncoated Freesheet | Uncoated Freesheet | ||||||||
Grade | Copy | Premium imaging Technology papers | Offset Colors Index Tag Bristol | Opaques Premium opaques Lightweight Tradebook | Food packaging Bag stock Security papers Imaging papers Label papers Medical disposables | |||||
Application | Photocopies Office Presentations | Presentations Reports | Commercial printing Direct mail Pamphlets Brochures Cards Posters | Stationery Brochures Annual reports Books Catalogs, Forms & Envelopes | Food & candy packaging Fast food takeout bag stock Check and security papers Surgical gowns | |||||
Our customer service personnel work closely with sales, marketing and production staff to provide service and support to merchants, converters, end-users, stationers, printers and retailers. We promote our products directly to end-users and others who influence paper purchasing decisions in order to enhance brand recognition and increase product demand. In addition, our sales representatives work closely with mill-based new product development personnel and undertake joint marketing initiatives with customers in order to better understand their businesses and needs and to support their future requirements.
We sell business papers primarily to paper stationers, merchants, office equipment manufacturers and retail outlets. We distribute uncoated commercial printing and publishing papers to end-users and commercial printers, mainly through paper merchants, as well as selling directly to converters. We sell our specialty and packaging products mainly to converters, who apply a further production process such as coating, laminating, folding or waxing to our papers before selling them to a variety of specialized end-users. We distributed approximately 34% of our paper products in 2011 through a large network of paper merchants operating throughout North America, one of which we own (see “Distribution”). Distributors, who sell our products to their own customers, represents our largest group of customers.
The chart below illustrates our channels of distribution for our paper products.
| Communication Papers | Specialty and Converting Papers | |||||||||||||
Category | Business Papers | Commercial Printing and Publishing Papers | ||||||||||||
Domtar sells to: | Merchants i | Office Equipment Manufacturers /Stationers i | Retailers i | Merchants i | Converters i | End-Users | Converters i | |||||||
Customer sells to: | Printers/ Retailers/ End-users | Retailers/ Stationers/ End-users | Printers/ End-users | Printers/ Converters/ End-users | Merchants/ Retailers | End-users | ||||||||
We sell market pulp to customers in North America mainly through a North American sales force while sales to most overseas customers are made directly or through commission agents. We maintain pulp supplies at strategically located warehouses, which allow us to respond to orders on short notice. In 2011, approximately 31% of our sales of market pulp were domestic, 12% were in Canada and 57% were in other countries.
Our ten largest customers represented approximately 47% of our 2011 Pulp and Paper segment sales or 40% of our total sales in 2011. In 2011, Staples, one of our customers of our Pulp and Paper segment represented approximately 10% of our total sales. The majority of our customers purchase products through individual purchase orders. In 2011, approximately 77% of our Pulp and Paper segment sales were domestic, 10% were in Canada, and 13% were in other countries.
Our Operations
Our Paper MerchantsDistribution business involves the purchasing, warehousing, sale and distribution of our various products and those of other manufacturers. ProductsThese products include business, printing and publishing papers and certain industrial products. These products are sold to a wide and diverse customer base, which includes small, medium and large commercial printers, publishers, quick copy firms, catalog and retail companies and institutional entities.
Our Paper Merchants operateDistribution business operates in the United States and Canada under a single banner and umbrella name, the Domtar Distribution Group. Ris Paper, part of the Domtar Distribution Group,Ariva. Ariva operates throughout the Northeast, Mid-Atlantic and Midwest areas from 2017 locations in the United States, including 1613 distribution centers serving customers across North America. The Canadian business operates as Buntin Reid in threetwo locations in Ontario; JBR/La Maison du PapierOntario, in two locations in Quebec; and The Paper House from two locations in Atlantic Canada.
Sales are executed by our sales force, based at branches strategically located in served markets. We distribute about 50%51% of our paper sales from our own warehouse distribution system and about 50%49% of our paper sales through mill-direct deliveries (i.e., deliveries directly from manufacturers, including ourselves, to our customers).
The table below lists all of our Domtar Distribution GroupAriva locations.
|
| |||||||
Eastern Region | MidWest Region | Ontario, Canada | Quebec, Canada | Atlantic Canada | ||||
Albany, New York | Montreal, Quebec | Halifax, Nova Scotia | ||||||
Boston, Massachusetts | Quebec City, Quebec | Mount Pearl, Newfoundland | ||||||
Harrisburg, Pennsylvania | ||||||||
Hartford, Connecticut | ||||||||
Lancaster, Pennsylvania | ||||||||
New York, | ||||||||
Philadelphia, Pennsylvania | Fort Wayne, Indiana | |||||||
Southport, Connecticut | ||||||||
Washington, DC / Baltimore, Maryland | ||||||||
Our Raw Materials
The distributionDistribution business sells annually approximately 0.70.6 million tons of paper, forms and industrial/packaging products from over 60 suppliers located around the world. Domtar products represent approximately 33%30% of the total.
Our Product Offering and Go-to-Market Strategy
Our product offerings address a broad range of printing, publishing, imaging, advertising, consumer and industrial needs and are comprised of uncoated, coated and specialized papers and industrial products. Our go-to-market strategy is to serve numerous segments of the commercial printing, publishing, retail, wholesale, catalog and industrial markets with logistics and services tailored to the needs of our customers. In 2009,2011, approximately 68%63% of our sales were made in the United States and 32%37% were made in Canada.
12
Our Operations
Our WoodPersonal Care business comprises the manufacturing, marketingsells and distribution of lumber and wood-based value-addedmanufactures adult incontinence products and distributes disposable washcloths marketed primarily under the managementAttends® brand name. We are one of forest resources.the leading suppliers of adult incontinence products sold into North American hospitals (acute care) and nursing homes (long-term care) and we have a growing presence in the domestic homecare and retail channels. We operate seven sawmillsnine different production lines to manufacture our products, with a production capacityall nine lines having the ability to produce multiple items within each category.
Attends operates out of approximately 890 million board feet of lumber and one remanufacturing facility. We also have investments in two companies. We seek to optimize the 31 million acres of forestland we directly license or own in Canada and theSoutheastern United States through efficient management and the application of certified sustainable forest management practices to help ensure that a continuous supply of wood is available for future needs.from one location in Greenville, North Carolina.
The table below lists all of our sawmills and their annual production capacity.
| ||||
| ||||
| ||||
| ||||
| ||||
| ||||
| ||||
| ||||
| ||||
| ||||
| ||||
| ||||
The following table lists our investments.
| |||||
| |||||
| |||||
Our Raw Materials
Wood Fiber
Fiber costs, net of revenues from wood chip sales, represent approximately 38% of our total manufacturing costsThe primary raw materials used in our Wood segment, or approximately 1% of the total cost of sales. In Quebec, our annual allowable softwood harvesting amounts to approximately 1.0 million cubic metersmanufacturing process are nonwovens, pulp, super absorbent polymers, polypropylene film, elastics, adhesives and is granted by the Ministry of Natural Resources (Quebec). We obtain most of the wood fiber required for our northern Quebec sawmilling operations either directly or indirectly from these harvesting rights. Additional information regarding wood fiber availability in Quebec is included in Part II, Item 7, Management’s Discussion and Analysis of Financial Condition and Results of Operations of this Annual Report on Form 10-K, under the caption “Fiber Supply.”
In Ontario, our annual allowable softwood harvesting on public lands amounts to approximately 2.8 million cubic meters pursuant to Sustainable Forest Licenses that have been granted by the Ontario Ministry of Natural Resources. We obtain most of the wood fiber required for our northern Ontario sawmilling operations either directly or indirectly from these harvesting rights. The remaining required fiber is purchased under various contractual arrangements and on the open market.
13
All wood fiber received by Domtar mills must conform to Domtar’s Fiber Use and Sourcing Policy, which forbids the inclusion of fiber that is illegally harvested, derived from improperly managed High Conservation Value Forests, or is genetically engineered. Further, 58% of Domtar’s Ontario and Quebec timber supply area is currently third-party certified, with 53% of the total supply area certified to the Forestry Stewardship Council (“FSC”) standards. Domtar’s goal is to reach 100% certification of all lands under its control by the FSC and to have all of its wood suppliers conform to the FSC Controlled Wood Standard.
Energy
Our wood operations require the use of two types of energy: electric energy is used to operate our manufacturing machinery and fossil fuel is used for the drying of wood. The type of fossil fuel used to dry the wood varies among our sawmills and depends on the technology available. Some of our assets operate with energy produced with biomass through residual products such as bark, sawdust and shavings. The use of our own biomass in the production of energy results in lower energy costs. In other sawmills, we use fuel oil and natural gas.packaging materials.
Our Product Offering and Go-to-Market Strategy
We produce primarily dimensional lumber usedOur products, which include branded and private label briefs, protective underwear, underpads, pads and washcloths, are available in the construction industry and our offerings include a variety of grades of kiln-dried softwood lumber, produced mainly from black spruce and jack pine which are known for their strength, stability, light weight and good workability. Most of our production capacity is used to produce studs and random length lumber in dimensions of 2 inches by 3 inches through 2 inches by 10 inches in lengths of 6 feet to 16 feet. We also manufacture quality #1 and #2 wood, utility quality #3 wood, economic woodsizes, as well as “rough” wood that we sell greenwith differing performance levels and dried. We also manufacture a wide variety of value-added products including MSR 2100, MSR 1650, Premium, Select and Mid-line. Our remanufacturing facility produces specialty products mainly for the bed frame industry and home centers and can produce a large variety of products in most dimensions, in lengths of 4 inches to 16 feet.product attributes.
We sell substantially allserve four channels: acute care, long-term care, homecare, and retail. Through the utilization of our softwood lumber through our sales office in Montreal to a wide range of retailers, distributors, manufacturersflexible production platform, manufacturing expertise and wholesalers in the United States and Canada who sell to end-users. These wood products are consumed in the home construction, renovation and industrial markets. Our marketing efforts for lumber products are focused on providing our customers with efficient value-added supply chain integration, in ordermanagement, we are able to achieve a high level of customer satisfaction and a balanced and diversified customer base for our products. In 2009, approximately 47% of our lumber sales were made in the United States and 53% were made in Canada.
Our ten biggest customers represented approximately 45% of our Wood segment sales in 2009. None of these customers represented 10% or more of our total sales in 2009.
We believe that our competitive strengths provide a solid foundation for the executioncomplete and high-quality line of our business strategy:
Leading market position. We are the largest integrated manufacturerbranded and marketer of uncoated freesheet paper in North America and the second largest in the world based on production capacity. This leading market position provides us with key competitive advantages, including economies of scale, wider sales and marketing coverage and a broad product offering of business, printing and publishing and converting and specialty paper grades.
Efficient and cost-competitive assets. Our wide network of world-class assets allows us to be a low-cost producer of high volume papers and an efficient producer of value-added specialty papers. Our five largest mills focus on the production of high volume copy and offset papers while production at our other mills focuses on
14
value-added paperunbranded products where quality, flexibility and service are key factors. Most of our paper is produced at mills with integrated pulp production and cogeneration facilities, reducing their exposure to price volatility for purchased pulp and energy.
Proximity to customers. We have a broad manufacturing footprint supported by a network of converting and distribution operations located across North America. This proximityreliably to customers provides opportunities for direct and enhanced customer service and minimizes freight distances, response time and delivery cost. These constitute key competitive advantages, particularly in the high volume copy and offset paper grades market segment. Customer proximity also allows for just-in-time delivery of high demand paper products in less than 48 hours to most major North American markets.
Strong franchise with attractive service solutions. We sell paper to multiple market segments through a variety of channels, including paper merchants, converters, retail companies and publishers throughout North America. In addition, we maintain a strong market presence through our ownership of the Domtar Distribution Group. We will continue to build on those positions by maximizing our strengths with centralized planning capability and supply-chain management solutions.
High quality products with strong brand recognition. We enjoy a strong reputation for producing high quality paper products and market some of the most recognized and preferred papers in North America, including a wide range of business and commercial printing paper brands, such as Cougar®, Lynx® Opaque, Husky® Offset, First Choice®, and Domtar EarthChoice® Office Paper, part of a family of environmentally and socially responsible paper.
Experienced management team. Our management team has significant experience and a record of success in the pulp and paper industry. We believe our employees’ expertise and know-how not only support the management team but help create operational efficiencies and enable us to deliver improved profitability from our manufacturing operations.across all channels.
OUR STRATEGIC INITIATIVES AND FINANCIAL PRIORITIES
WeAs a leading innovative fiber-based technology company, we strive to be the supplier of choice for our customers, to be a core investment for our shareholders and to be recognized as an industry leader in sustainability. We have three unwavering business objectives: (1) to grow and find ways to become less vulnerable to the suppliersecular decline in communication paper demand, (2) to reduce volatility in our earnings profile by increasing the visibility and predictability of choiceour cash flows, and (3) to create value over time by ensuring that we maximize the strategic and operational use of branded and private branded paper products for consumer channels, stationers, merchants, printers and converters in North America. our capital.
To achieve this goal and to generate cash flow and create shareholder value,these goals, we have established the following business strategies:
Build customer loyaltyPerform:Drive performance in everything we do focusing on customers, costs and cash. We are determined to operate our assets efficiently and to ensure we balance our production with our customer demand.demand in papers. To generate free cash flow, we are focused on assigning our capital expenditures effectively and minimizing working capital requirements. We are buildingapply prudent financial management policies to retain the flexibility needed to successfully execute on our strategic roadmap.
Grow:To counteract the successful relationships thatsecular demand decline in our communication paper products and sustain the success of our company, we have developed with key customers to support their businesses and to provide inventory reduction solutions through just-in-time delivery for the most-demanded products. We believe that we must leverage our core competencies and expertise as operators of large scale operations in fiber sourcing and in the marketing, manufacturing and distribution of fiber-based products. We are a supplierfocused on optimizing and expanding our operations in markets with positive demand dynamics through the repurposing of choice for customers who seek competitively-priced paper products and services.assets, through investments to organically grow or through strategic acquisitions.
ContinueBreak Out: Through agility and innovation, move from a paper to growa fiber-centric organization by seeking opportunities to break out from traditional pulp and paper making. We continue to explore opportunities to invest in innovative fiber-based technologies to bring our business in new directions and leverage our expertise and our assets to extract the maximum value for the wood fiber we consume in our operations.
Grow our line of environmentally and ethically responsible papers.products: We believe we are delivering improvedbest-in-class service to customers through a broad range of product offerings and greater access to volume. We believe thecertified products. The development of EarthChoice®, our line of environmentally and socially responsible paper, is providing a platform upon which to expand our offeringsoffering to customers. The EarthChoice®This product line of papers, a product lineis supported by leading environmental groups and offers customers the solutions and peace of mind through the use of a combination of Forest Stewardship Council (FSC)FSC® virgin fiber and recycled fiber. FSC is the certification recognized by environmental groups as the most stringent and is third-party audited.
Focus on generating free cash flow and maintaining financial discipline.We believe efficiently operated assets and carefully managed manufacturing costs are key to creating shareholder value. To generate free cash flow, we are focused on assigning our capital expenditures effectively and minimizing working capital requirements by reducing discretionary spending, reviewing procurement costs and pursuing the balancing of production and inventory control.
15
Operate in a responsible way:We try to make a positive difference every day by pursuing sustainable way. Customersgrowth, valuing relationships, and responsibly managing our resources. We care for our customers, end-users as well as alland stakeholders in the communities where we operate, seekall seeking assurances from the pulp and paper industry that resources are managed in a sustainable manner. We strive to provide these assurances by certifying our distribution and manufacturing operations and measuring our performance against internationally recognized benchmarks. We are committed to the responsible use of forest manufacturing and distributionresources across our operations and we intendare enrolled in programs and initiatives to subscribeencourage landowners engage towards certification to internationally recognized environmental management systems, namely ISO 14001.improve their market access and increase their revenue opportunities.
The markets in which our businesses operate are highly competitive with well-established domestic and foreign manufacturers.
In the paper business, our paper production does not rely on proprietary processes or formulas, except in highly specialized papers or customized products. In order to gain market share in uncoated freesheet, we compete primarily on the basis of product quality, breadth of offering, service solutions and competitively priced paper products. We seek product differentiation through an extensive offering of high quality FSC-certified paper products. While we have a leading position in the North American uncoated freesheet market, we also compete with other paper grades, including coated freesheet, and uncoated groundwood, and with electronic transmission and document storage alternatives. As the use of these alternative products continues to grow, we continue to see a decrease in the overall demand for paper products or shifts from one type of paper to another. All of our pulp and paper manufacturing facilities are located in the United States or in Canada where we sell 88%86% of our products. The five largest manufacturers of uncoated freesheet papers in North America represent approximately 80% of the total production capacity. On a global basis, there are hundreds of manufacturers that produce and sell uncoated freesheet papers, ten of which have an annual production capacity of over 1 million tons.papers. The level of competitive pressures from foreign producers in the North American market is highly dependent upon exchange rates, including the rate between the U.S. dollar and the Euro as well as the U.S. dollar and the Brazilian real.
The market pulp we sell is either hardwoodfluff, softwood or softwood and, to a lesser extent, fluffhardwood pulp. The pulp market is highly fragmented with many manufacturers competing worldwide, some of whom have lower operating costs than we do.worldwide. Competition is primarily on the basis of access to low-cost wood fiber, product quality and prices.competitively priced pulp products. The fluff pulp we sell is used in absorbent products, incontinence products, diapers and feminine hygiene products. The softwood and hardwood pulp we sell is primarily slow growth northern bleached hardwoodsoftwood and softwoodhardwood kraft, and we produce specialty engineered pulp grades with a pre-determined mix of wood species. Our hardwood and softwood pulps are sold
to a combination of “paper grade” customers who make printing and writing grades, and “non-paper grade” customers who make a variety of products for specialty paper, packaging, tissue and industrial applications.applications, and customers who make printing and writing grades. We also seek product differentiation through the certification of our pulp mills to the FSC chain-of-custody standard and the procurement of FSC-certified virgin fiber. All of our market pulp production capacity is located in the United States or in Canada, and we sell 63%53% of our pulp to other countries.
In Wood, we sell primarily kiln-dried softwood lumberthe adult incontinence segment, there are high barriers to entry and other value added products. Our competitors include other major lumber producers, mostthe top 5 manufacturers supply approximately 90% of which are located in Eastern Canada. the North American market share and have done so for at least the last 10 years.
Competition is primarilyalong the line of four major product categories – briefs, protective underwear, underpads, and pads with customers split between retail and institutional channels. The retail channel has the majority of sales concentrated in drug stores and mass marketers. The institutional channel includes extended care (long term care and homecare) and acute care facilities.
In North America, an estimated $2.7 billion was spent on Adult Incontinence products in 2010 with the spending estimates of $2.83 billion in 2011. Globally, sales of Adult Incontinence products were estimated to be $8.7 billion in 2010 and are estimated to be $9.3 billion in 2011. Our estimated North American market share, based on the basis of access to low-cost fiber, service2011 sales, was between 5% and prices. All of our lumber production capacity is located15% in Canada, and we sell 47% of our wood products to the United States. As a result, we have exposure to currency fluctuations and are potentially subject to softwood lumber export taxes and duties.various channels.
We have over 10,0008,700 employees, of which approximately 62%66% are employed in the United States and 38%34% in Canada. Approximately 60%57% of our employees are covered by collective bargaining agreements, generally on a facility-by-facility basis, certain of which expired in 2011 and some will expire between 20102012 and 2015.
In 2008, we signed a four yearA new umbrella agreement with the United Steelworkers Union (“USW”), expiring in 2015, affecting approximately 4,0002,900 employees at oureight U.S. locations.mills and one converting operation was ratified effective December 1, 2011. This agreement only covers certain economic elements, and all other contract issues will beare negotiated at each operating location, as the related collective bargaining
16
agreements become subject to renewal. The parties have agreed not to strike or lock-out during the terms of the respective local agreements. Should the parties fail to reach an agreement during the local negotiations, the related collective bargaining agreements are automatically renewed for another four years.
In Canada, the collective agreement expired in 2010 at our Windsor facility in Quebec, Canada, with the Confederation of National Trade Unions (“CNTU”). A new agreement was ratified in mid-November 2011. At the Espanola Mill facility, agreements have been reached with the Communication, Energy and Paperworkers Union of Canada (“CEP”), locals 74 and 156 and with the International Brotherhood of Electrical Workers (“IBEW”). Agreements that expired in 2009 at our Dryden facilities in Canada are being negotiated with the CEP and are on-going. These Canadian collective agreements are unrelated to the umbrella agreement with the USW covering our U.S. locations.
OUR APPROACH TO SUSTAINABILITY
Domtar delivers a higher, lasting value to our customers, employees, shareholders and communities by viewing our business decisions within the larger context of sustainability. As a renewable fiber-based company, we take the long-term view on managing natural resources for the future. We adopted our Statement on Sustainable Growthprize efficiency in everything we do. We strive to govern our pathway to sustainability, from excellence in corporateminimize waste and encourage recycling. We have the highest standards for ethical standards to product stewardship. Consistently with our Statement, we define our actions under our Code of Ethics, policies addressingconduct, for caring about the health and safety environment, forestryof each other, and for maintaining the environmental quality in the communities where we live and work. We value the partnerships we have formed with non-governmental organizations and believe they make us a better company, even if we do not always agree on every issue. We pay attention to being agile to respond to new opportunities, and we are focused in order to turn innovation into value creation. By embracing sustainability as our operating philosophy, we seek to internalize the fact that the choices
we have and the impact of the decisions we make on our stakeholders are all interconnected. Further, we believe that our business and the people and communities who depend upon us are better served as we weave this focus on sustainability into the things we do.
Domtar effects this commitment to sustainability at every level and every location across the company. With the support of the Board of Directors, our Management Committee empowers senior managers from manufacturing, technology, finance, sales and marketing and corporate staff functions to regularly come together and establish key sustainability performance metrics, and to routinely assess and report on progress. In 2011, Domtar decided to establish a new, vice-president position to help lead this effort, allowing the company’s organizational structure to better reflect the priority focus the company places on sustainable performance. At the same time, recognizing that the promise of sustainability is only achieved if it is woven into the fiber procurementof an organization, Domtar is committed to establishing EarthChoice Ambassadors – sustainability leaders and others.advocates – in every one of the company’s locations. We believe that weaving sustainability into our business positions Domtar for the future.
Our business is subject to a wide range of general and industry-specific laws and regulations in the United States and Canada relating to the protection of the environment, including those governing harvesting, air emissions, greenhouse gases and climate change, waste water discharges, the storage, management and disposal of hazardous substances and wastes, contaminated sites, landfill operation and closure obligations and health and safety matters. Compliance with these laws and regulations is a significant factor in the operation of our business. We may encounter situations in which our operations fail to maintain full compliance with applicable environmental requirements, possibly leading to civil or criminal fines, penalties or enforcement actions, including those that could result in governmental or judicial orders that stop or interrupt our operations or require us to take corrective measures at substantial costs, such as the installation of additional pollution control equipment or other remedial actions.
Compliance with U.S. federal, state and local and Canadian federal and provincial environmental laws and regulations involves capital expenditures as well as additional operating costs. For example, the United States Environmental Protection Agency has promulgatedwill be promulgating regulations dealing withaddressing the emissions of hazardous air emissionspollutants from all industrial boilers, including those present at pulp and paper mills, including regulations on hazardous air pollutants thatwhich will require the use of maximum achievable control technology and controls for pollutants that contribute to smog and haze.technology. Additional information regarding environmental matters is included in Part I, Item 3, Legal Proceedings, under the caption “Climate change regulation” and in Part II, Item 7, Management’s Discussion and Analysis of Financial Condition and Results of Operations of this Annual Report on Form 10-K, under the section of Critical accounting policies, caption “Environmental matters and other asset retirement obligations.”
Many of our brand name paper products are protected by registered trademarks. Our key trademarks include Attends®, Cougar®, Lynx® Opaque Ultra, Husky® Opaque Offset, First Choice®, Domtar EarthChoice® and Domtar EarthChoiceAriva®. These brand names and trademarks are important to the business. Our numerous trademarks have been registered in the United States and/or in other countries where our products are sold. The current registrations of these trademarks are effective for various periods of time. These trademarks may be renewed periodically, provided that we, as the registered owner, and/or licensee comply with all applicable renewal requirements, including the continued use of the trademarks in connection with similar goods.
We own U.S. and foreign patents, some of which have expired or been abandoned, and have several pending patent applications. Our management regards these patents and patent applications as important but does not consider any single patent or group of patents to be materially important to our business as a whole.
INTERNET AVAILABILITY OF INFORMATION
In this Annual Report on Form 10-K, we incorporate by reference certain information contained in other documents filed with the Securities and Exchange Commission (“SEC”) and we refer you to such information. We file annual, quarterly and current reports and other information with the SEC. You may read and copy any materials we file with the SEC at the SEC’s Public Reference Room at 100F Street, NE, Washington DC, 20549.
17
You may obtain information on the operation of the Public Reference Room by calling 1-800-SEC-0330. The SEC maintains a website at www.sec.gov that contains our quarterly and current reports, proxy and information statements, and other information we file electronically with the SEC. You may also access, free of charge, our reports filed with the SEC through our website. Reports filed or furnished to the SEC will be available through our website as soon as reasonably practicable after they are filed or furnished to the SEC. The information contained on our website, www.domtar.com, is not, and should in no way be construed as, a part of this or any other report that we filed with or furnished to the SEC.
John D. Williams,age 55,57, has been president, chief executive officer and a director of the Company since January 1, 2009. Previously, Mr. Williams served as president of SCA Packaging Europe between 2005 and 2008. Prior to assuming his leadership position with SCA Packaging Europe, Mr. Williams held increasingly senior management and operational roles in the packaging business and related industries.
Melissa Anderson, age 45,47, is the senior vice-president, human resources of the Company. Ms. Anderson joined Domtar in January 2010. Previously, she was senior vice-president, human resources and government relations, at The Pantry, Inc., an independently operated convenience store chain in the southeastern United States. Prior to this, she held senior management positions with International Business Machine (“IBM”) over the span of 1718 years.
Daniel Buron, age 46,48, is the senior vice-president and chief financial officer of the Company. Mr. Buron was senior vice-president and chief financial officer of Domtar Inc. since May 2004. He joined Domtar Inc. in 1999. Prior to May 2004, he was vice-president, finance, pulp and paper sales division and, prior to September 2002, he was vice-president and controller. He has over 2123 years of experience in finance.
Michael Edwards, age 62,64, is the senior vice-president, pulp and paper manufacturing of the Company. Mr. Edwards was vice-president, fine paper manufacturing of Weyerhaeuser since 2002. Since joining Weyerhaeuser in 1994, he has held various management positions in the pulp and paper operations. Prior to Weyerhaeuser, Mr. Edwards worked at Domtar Inc. for 11 years. His career in the pulp and paper industry spans over 4648 years.
Zygmunt Jablonski, age 56,58, is the senior vice-president, law and corporate affairs of the Company. Mr. Jablonski joined Domtar in 2008, after serving in various in-house counsel positions for major manufacturing and distribution companies in the paper industry for 13 years – most recently, as executive vice-president, general counsel and secretary.years. From 1985 to 1994, he practiced law in Washington, DC.
Mark Ushpol, age 46,48, is the senior vice-president, distribution of the Company. Mr. Ushpol joined Domtar in January 2010. Previously, he was sales and marketing director of Mondi Europe & International Uncoated Fine Paper, where he was in charge of global uncoated fine paper sales. He has over 2022 years of experience in senior marketing and sales management with the last 1315 years in the pulp and paper sector. Prior to that, he was involved in the plastics industry in South Africa for 8 years.
Patrick Loulou, age 41,43, is the senior vice-president, corporate development since he joined the Company in March 2007. Previously, he held a number of positions in the telecommunications sector as well as in management consulting. He has over 1113 years of experience in corporate strategy and business development.
Jean-François Mérette, age 43, is the senior vice-president, forest products of the Company. Mr. Mérette was the vice-president, sawmills since he joined Domtar Inc. in 2005. Previously, he held various management positions with a major forest products company. His career in the forest products industry spans over 18 years.
18
Richard L. Thomas, age 56,58, is the senior vice-president, sales and marketing of the Company. Mr. Thomas was vice-president of fine papers of Weyerhaeuser since 2005. Prior to 2005, he was vice-president, business
papers of Weyerhaeuser. Mr. Thomas joined Weyerhaeuser in 2002 when Willamette Industries, Inc. was acquired by Weyerhaeuser. At Willamette, he held various management positions in operations since joining in 1992. Previously, he was with Champion International Corporation for 12 years.
The information included in this Annual Report on Form 10-K may contain forward-looking statements relating to trends in, or representing management’s beliefs about, Domtar Corporation’s future growth, results of operations, performance and business prospects and opportunities. These forward-looking statements are generally denoted by the use of words such as “anticipate,” “believe,” “expect,” “intend,” “aim,” “target,” “plan,” “continue,” “estimate,” “project,” “may,” “will,” “should” and similar expressions. These statements reflect management’s current beliefs and are based on information currently available to management. Forward-looking statements are necessarily based upon a number of estimates and assumptions that, while considered reasonable by management, are inherently subject to known and unknown risks and uncertainties and other factors that could cause actual results to differ materially from historical results or those anticipated. Accordingly, no assurances can be given that any of the events anticipated by the forward-looking statements will occur, or if any occurs, what effect they will have on Domtar Corporation’s results of operations or financial condition. These factors include, but are not limited to:
conditions in the global capital and credit markets, and the economy generally, particularly in the U.S. and Canada;
market demand for Domtar Corporation’scontinued decline in usage of fine paper products which may be tiedin our core North American market;
our ability to the relative strength of various U.S. and/or Canadianimplement our business segments;diversification initiatives, including strategic acquisitions;
product selling prices;
raw material prices, including wood fiber, chemical and energy;
performance of Domtar Corporation’s manufacturing operations, including unexpected maintenance requirements;
the level of competition from domestic and foreign producers;
the effect of, or change in, forestry, land use, environmental and other governmental regulations (including tax), and accounting regulations;
the effect of weather and the risk of loss from fires, floods, windstorms, hurricanes and other natural disasters;
transportation costs;
the loss of current customers or the inability to obtain new customers;
legal proceedings;
changes in asset valuations, including write downs of property, plant and equipment, inventory, accounts receivable or other assets for impairment or other reasons;
changes in currency exchange rates, particularly the relative value of the U.S. dollar to the Canadian dollar;
the effect of timing of retirements and changes in the market price of Domtar Corporation’s common stock on charges for stock-based compensation;
performance of pension fund investments and related derivatives;derivatives, if any; and
the other factors described under “Risk Factors,” in itemPart I, Item 1A of this Annual Report on Form 10-K.
19
You are cautioned not to unduly rely on such forward-looking statements, which speak only as of the date made, when evaluating the information presented in this Annual Report on Form 10-K. Unless specifically required by law, Domtar Corporation assumes no obligation to update or revise these forward-looking statements to reflect new events or circumstances.
| ITEM 1A. | RISK FACTORS |
You should carefully consider the risks described below in addition to the other information presented in this Annual Report on Form 10-K.
RISKS RELATING TO THE INDUSTRIES AND BUSINESSES OF THE COMPANY
Some of the Company’s products are vulnerable to long-term declines in demand due to competing technologies or materials.
The Company’s paper business competes with electronic transmission and document storage alternatives, as well as with paper grades it does not produce, such as uncoated groundwood. As a result of such competition, the Company is experiencing on-going decreasing demand for most of its existing paper products. As the use of these alternatives grows, demand for paper products is likely to further decline. Declines in demand for our paper products may adversely affect the Company’s business, results of operations and financial position.
Failure to successfully implement our business diversification initiatives could have a material adverse affect on our business, financial results or condition.
We are pursuing strategic initiatives that management considers important to our long-term success including, but not limited to, optimizing and expanding our operations in markets with positive demand dynamics to help grow our business and counteract secular demand decline in our core North American paper business. These initiatives may involve organic growth, select joint ventures and strategic acquisitions. The success of these initiatives will depend, among other things, on our ability to identify potential strategic initiatives, understand the key trends and principal drivers affecting businesses to be acquired and to execute the initiatives in a cost effective manner. There are significant risks involved with the execution of these initiatives, including significant business, economic and competitive uncertainties, many of which are outside of our control.
Strategic acquisitions may expose us to additional risks. We may have to compete for acquisition targets and any acquisitions we make may fail to accomplish our strategic objectives or may not perform as expected. In addition, the costs of integrating an acquired business may exceed our estimates and may take significant time and attention from senior management. Accordingly, we cannot predict whether we will succeed in implementing these strategic initiatives. If we fail to successfully diversify our business, it may have a material adverse effect on our competitive position, financial condition and operating results.
The pulp and paper and wood product industries areindustry is highly cyclical. Fluctuations in the prices of and the demand for the Company’s products could result in lower sales volumes and smaller profit margins.
The pulp and paper and wood product industries areindustry is highly cyclical. Historically, economic and market shifts, fluctuations in capacity and changes in foreign currency exchange rates have created cyclical changes in prices, sales volume and margins for the Company’s products. The length and magnitude of industry cycles have varied over time and by product, but generally reflect changes in macroeconomic conditions and levels of industry capacity. Most of the Company’s paper products are commodities that are widely available from other producers. Even the Company’s non-commodity products, such as value-added papers, are susceptible to commodity dynamics. Because commodity products have few distinguishing qualities from producer to producer, competition for these products is based primarily on price, which is determined by supply relative to demand.
The overall levels of demand for the products the Company manufactures and distributes, and consequently its sales and profitability, reflect fluctuations in levels of end-user demand, which depend in part on general
macroeconomic conditions in North America and worldwide, the continuation of the current level of service and cost of postal services, as well as competition from electronic substitution. See—“ConditionsSee “Conditions in the global capital and credit markets, and the economy generally, can adversely affect the Company business, results of operations and financial position” and “Some of the Company’s products are vulnerable to long-term declines in demand due to competing technologies or materials.” For example, demand for cut-size office paper may fluctuate with levels of white-collar employment. Demand for many such products was negatively impacted by the global economic downturn in 2009.
Industry supply of pulp paper and woodpaper products is also subject to fluctuation, as changing industry conditions can influence producers to idle or permanently close individual machines or entire mills. Such closures can result in significant cash and/or non-cash charges. In addition, to avoid substantial cash costs in connection with idling or closing a mill, some producers will choose to continue to operate at a loss, sometimes even a cash loss, which could prolong weak pricing environments due to oversupply. Oversupply can also result from producers introducing new capacity in response to favorable short-term pricing trends.
Industry supply of pulp paper and woodpaper products is also influenced by overseas production capacity, which has grown in recent years and is expected to continue to grow.
As a result, prices for all of the Company’s products are driven by many factors outside of its control, and the Company has little influence over the timing and extent of price changes, which are often volatile. Because market conditions beyond the Company’s control determine the prices for its commodity products, the price for any one or more of these products may fall below its cash production costs, requiring the Company to either incur cash losses on product sales or cease production at one or more of its manufacturing facilities. The Company continuously evaluates potential adjustments to its production capacity, which may include additional closures of machines or entire mills, and the Company could recognize significant cash and/or non-cash charges relating to any such closures in future periods. See Part II, Item 7, Management’s Discussion and Analysis of Financial Condition and Results of Operation, under “Restructuring“Closure and restructuring activities.” Therefore, the Company’s
20
profitability with respect to these products depends on managing its cost structure, particularly wood fiber, chemical and energy costs, which represent the largest components of its operating costs and can fluctuate based upon factors beyond its control, as described below. If the prices of or demand for its products decline, or if its wood fiber, chemical or energy costs increase, or both, its sales and profitability could be materially and adversely affected.
Conditions in the global capital and credit markets, and the economy generally, can adversely affect the CompanyCompany’s business, results of operations and financial position.
A significant or prolonged downturn in general economic conditionconditions may affect the Company’s sales and profitability. The Company has exposure to counterparties with which we routinely execute transactions. Such counterparties include commercial banks, insurance companies and other financial institutions, some of which may be exposed to bankruptcy or liquidity risks. While the Company has not realized any significant losses to date, a bankruptcy or illiquidity event by one of its significant counterparties may materially and adversely affect the CompanyCompany’s access to capital, future business and results of operations.
Some of the Company’s products are vulnerable to long-term declinesIn addition, our customers and suppliers may be adversely affected by severe economic conditions. This could result in demand due to competing technologies or materials.
The Company’s business competes with electronic transmission and document storage alternatives, as well as with paper grades it does not produce, such as uncoated groundwood. As a result of such competition, the Company has experienced decreasedreduced demand for some of its existing pulp and paper products. As the use of these alternatives grows, demand for pulp and paperour products is likelyor our inability to further decline. Moreover, demand for some of the Company’s wood products may decline if customers purchase alternative products.obtain necessary supplies at reasonable costs or at all.
The Company faces intense competition in its markets, and the failure to compete effectively would have a material adverse effect on its business and results of operations.
The Company competes with both U.S. and Canadian producers and, for many of its product lines, global producers, some of which may have greater financial resources and lower production costs than the Company. The principal basis for competition is selling price. The Company’s ability to maintain satisfactory margins depends in large part on its ability to control its costs. The Company cannot provide assurance that it will compete effectively and maintain current levels of sales and profitability. If the Company cannot compete effectively, such failure will have a material adverse effect on its business and results of operations.
The Company’s manufacturing businesses may have difficulty obtaining wood fiber at favorable prices, or at all.
Wood fiber is the principal raw material used by the Company, comprising approximately 24%20% of the total cost of sales during 2009.2011. Wood fiber is a commodity, and prices historically have been cyclical. The primary source for wood fiber is timber. Environmental litigation and regulatory developments, alternative use for energy production and reduction in harvesting related to the housing market, have caused, and may cause in the future, significant reductions in the amount of timber available for commercial harvest in the United States and Canada. In addition, future domestic or foreign legislation and litigation concerning the use of timberlands, the protection of endangered species, the promotion of forest health and the response to and prevention of catastrophic wildfires could also affect timber supplies. Availability of harvested timber may be further limited by adverse weather, fire, insect infestation, disease, ice storms, wind storms, flooding and other natural and man made causes, thereby reducing supply and increasing prices. Wood fiber pricing is subject to regional market influences, and the Company’s cost of wood fiber may increase in particular regions due to market shifts in those regions. Any sustained increase in wood fiber prices would increase the Company’s operating costs, and the Company may be unable to increase prices for its products in response to increased wood fiber costs due to additional factors affecting the demand or supply of these products.
21
The Company currently obtainsmeets its wood fiber requirements in partby purchasing wood fiber from third parties and by harvesting timber pursuant to its forest licenses and forest management agreements and in part by purchasing wood fiber from third parties.agreements. If the Company’s cutting rights, pursuant to its forest licenses or forest management agreements are reduced, or any third-party supplier of wood fiber stops selling or is unable to sell wood fiber to the Company, itsour financial condition or results of operations could be materially and adversely affected.
An increase in the cost of the Company’s purchased energy or chemicals would lead to higher manufacturing costs, thereby reducing its margins.
The Company’s operations consume substantial amounts of energy such as electricity, natural gas, fuel oil, coal and hog fuel. Energy comprised approximately 8%6% of the total cost of sales in 2009.2011. Energy prices, particularly for electricity, natural gas and fuel oil, have been volatile in recent years. As a result, fluctuations in energy prices will impact the Company’s manufacturing costs and contribute to earnings volatility. While the Company purchases substantial portions of its energy under supply contracts, most of these contracts are based on market pricing.
Other raw materials the Company uses include various chemical compounds, such as precipitated calcium carbonate, sodium chlorate and sodium hydroxide, sulfuric acid, dyes, peroxide, methanol and aluminum sulfate. Purchases of chemicals comprised approximately 12%13% of the total consolidated cost of sales in 2009.2011. The costs of these chemicals have been volatile historically, and they are influenced by capacity utilization, energy prices and other factors beyond the Company’s control.
Due to the commodity nature of the Company’s products, the relationship between industry supply and demand for these products, rather than solely changes in the cost of raw materials, will determine the Company’s ability to increase prices. Consequently, the Company may be unable to pass on increases in its operating costs to its customers. Any sustained increase in chemical or energy prices without any corresponding increase in product pricing would reduce the Company’s operating margins and may have a material adverse effect on its business and results of operations.
The Company depends on third parties for transportation services.
The Company relies primarily on third parties for transportation of the products it manufactures and/or distributes, as well as delivery of its raw materials. In particular, a significant portion of the goods it manufactures and raw materials it uses are transported by railroad or trucks, which are highly regulated. If any of its third-party transportation providers were to fail to deliver the goods the Company manufactures or distributes in a timely manner, the Company may be unable to sell those products at full value, or at all. Similarly, if any of
these providers were to fail to deliver raw materials to the Company in a timely manner, it may be unable to manufacture its products in response to customer demand. In addition, if any of these third parties were to cease operations or cease doing business with the Company, it may be unable to replace them at reasonable cost. Any failure of a third-party transportation provider to deliver raw materials or finished products in a timely manner could harm the Company’s reputation, negatively impact its customer relationships and have a material adverse effect on its financial condition and operating results.
The Company could experience disruptions in operations and/or increased labor costs due to labor disputes or restructuring activities.
Employees at 3923 of the Company’s facilities, representing a majority of the Company’s 10,0008,700 employees, are represented by unions through collective bargaining agreements generally on a facility-by-facility basis, whichfacility basis. Certain of these agreements expired in 2011 and others will expire between 20102012 and 2015. Currently, 1312 collective bargaining agreements representing 2,280 employees are up for renegotiation of which only threesix, representing 1,205 employees, are currently under negotiation. The Company may not be able to negotiate acceptable new collective bargaining agreements, which could result in strikes or work stoppages or other labor disputes by affected workers. Renewal of collective bargaining agreements could also result in higher wages or benefits paid to union members. In addition, labor organizing activities could occur at any of the Company’s facilities. Therefore, the Company could experience a disruption of its operations or higher ongoing labor costs, which could have a material adverse effect on its business and financial condition.
In connection with the Company’s restructuring efforts, the Company has suspended operations at, or closed or announced its intention to close, various facilities and may incur liability with respect to affected employees, which could have a material adverse effect on its business or financial condition. In addition, the Company continues to evaluate potential adjustments to its production capacity, which may include additional closures of machines or entire mills, and the Company could recognize significant cash and/or non-cash charges relating to any such closures in the future.
The pulp and paper mill in Prince Albert was closed in the first quarter of 2006 and has not been operated since. In December 2009, we decided to dismantle the Prince Albert facility. In a grievance relating to the closure of the Prince Albert facility, the union is claiming that it is entitled to the accumulated pension benefits
22
during the actual layoff period because, according to the union, a majority of employees still had recall rights during the layoff. Arbitration in this matter was held on February 16 to 18, 2010, and the parties are awaiting the arbitrator’s decision. The Company cannot be certain that it will not incur a liability, which could be in excess of $20 million.
The Company relies heavily on a small number of significant customers, including one customer that represented approximately 8%10% of the Company’s sales in 2009.2011. A loss of any of these significant customers could materially adversely affect the Company’s business, financial condition or results of operations.
The Company heavily relies on a small number of significant customers. The Company’s largest customer, Staples, represented approximately 8%10% of the Company’s sales in 2009.2011. A significant reduction in sales to any of the Company’s key customers, which could be due to factors outside its control, such as purchasing diversification or financial difficulties experienced by these customers, could materially adversely affect the Company’s business, financial condition or results of operations.
A material disruption at one or more of the Company’s manufacturing facilities could prevent it from meeting customer demand, reduce its sales and/or negatively impact its net income.
Any of the Company’s pulp or paper manufacturing facilities, or any of its machines within an otherwise operational facility, could cease operations unexpectedly due to a number of events, including:
unscheduled maintenance outages;
prolonged power failures;
equipment failure;
chemical spill or release;
explosion of a boiler;
the effect of a drought or reduced rainfall on its water supply;
labor difficulties;
labor difficulties;government regulations;
disruptions in the transportation infrastructure, including roads, bridges, railroad tracks and tunnels;
adverse weather, fires, floods, earthquakes, hurricanes or other catastrophes;
terrorism or threats of terrorism; or
other operational problems, including those resulting from the risks described in this section.
Events such as those listed above have resulted in operating losses in the past. Future events may cause shutdowns, which may result in additional downtime and/or cause additional damage to the Company’s facilities. Any such downtime or facility damage could prevent the Company from meeting customer demand for its products and/or require it to make unplanned capital expenditures. If one or more of these machines or facilities were to incur significant downtime, it may have a material adverse effect on the Company financial results and financial position.
The Company’s indebtedness, which is approximately $1.7billion as of December 31, 2009, could adversely affect its financial condition and impair its ability to operate its business.
As of December 31, 2009, the Company had approximately $1.7 billion of outstanding indebtedness, including $336 million of indebtedness under its senior secured credit facilities, $23 million of capital leases and $1.4 billion of unsecured notes.
23
The Company’s degree of indebtedness could have important consequences to the Company’s financial condition, operating results and business, including the following:
it may limit the Company’s ability to obtain additional debt or equity financing for working capital, capital expenditures, product development, debt service requirements, acquisitions and general corporate or other purposes;
a substantial portion of the Company’s cash flows from operations will be dedicated to payments on its indebtedness and will not be available for other purposes, including operations, capital expenditures and future business opportunities;
the debt service requirements of the Company’s indebtedness could make it more difficult for the Company to satisfy its other obligations;
the Company’s borrowings under the senior secured credit facilities are at variable rates of interest, exposing the Company to increased debt service obligations in the event of increased interest rates;
it may limit the Company’s ability to adjust to changing market conditions and place it at a competitive disadvantage compared to its competitors that have less debt; and
it may increase the Company’s vulnerability to a downturn in general economic conditions or in its business, and may make the Company unable to carry out capital spending that is important to its growth.
In addition, the Company is subject to agreements that require meeting and maintaining certain financial ratios and tests. A significant or prolonged downturn in general business and economic conditions may affect the Company’s ability to comply with these covenants or meet those financial ratios and tests and could require the Company to take action to reduce its debt or to act in a manner contrary to its current business objectives.
A breach of any of the senior secured credit facility or long-term note indenture covenants may result in an event of default under those agreements. This may allow the counterparties to those agreements to declare all amounts outstanding thereunder, together with accrued interest, to be immediately due and payable. If this occurs, the Company may not be able to refinance the indebtedness on favorable terms, or at all, or repay the accelerated indebtedness.
The Company’s operations require substantial capital, and it may not have adequate capital resources to provide for all of its capital requirements.
The Company’s businesses are capital intensive and require that it regularly incur capital expenditures in order to maintain its equipment, increase its operating efficiency and comply with environmental laws. In 2009,2011, the Company’s total capital expenditures were $106$144 million (2008—(2010—$163153 million). In addition, $83 million was spent under the Pulp and Paper Green Transformation Program (2010—$51 million), which is reimbursed by the Government of Canada.
If the Company’s available cash resources and cash generated from operations are not sufficient to fund its operating needs and capital expenditures, the Company would have to obtain additional funds from borrowings or other available sources or reduce or delay its capital expenditures. The Company may not be able to obtain additional funds on favorable terms, or at all. In addition, the Company’s debt service obligations will reduce its available cash flows. If the Company cannot maintain or upgrade its equipment as it requires or allocate funds to ensure environmental compliance, it could be required to curtail or cease some of its manufacturing operations, or it may become unable to manufacture products that compete effectively in one or more of its product lines.
Despite current indebtedness levels, theThe Company and its subsidiaries may incur substantially more debt. This could further exacerbate theincrease risks associated with its leverage.
The Company and its subsidiaries may incur substantial additional indebtedness in the future. Although the senior securedrevolving credit facility containcontains restrictions on the incurrence of additional indebtedness, including secured
24
indebtedness, these restrictions are subject to a number of qualifications and exceptions, and additional indebtedness incurred in compliance with these restrictions could be substantial. For example, asAs of December 31, 2009,2011, the Company had $6 million outstanding as overdraft recorded in Bank indebtedness under the revolving credit facilityno borrowings and had outstanding letters of credit amounting to $53$29 million under thisits revolving credit facility, resulting in $691$571 million of availability for future drawings under this credit facility. Also, the Company can use securitization of certain receivables to provide additional liquidity to fund its operations. At December 31, 2011 the Company had no borrowings and $28 million of letters of credit outstanding under the securitization program (2010—nil and nil), resulting in $122 million of availability for future drawings under this program. Other new borrowings could also be incurred by Domtar Corporation or its subsidiaries. Among other things, the Company could determine to incur additional debt in connection with a strategic acquisition. If the Company incurs additional debt, the risks associated with its leverage would increase.
The Company’s ability to generate the significant amount of cash needed to pay interest and principal on the Domtar CorporationCompany’s unsecured long-term notes and service its other debt and financial obligations and its ability to refinance all or a portion of its indebtedness or obtain additional financing depends on many factors beyond the Company’s control.
TheAs of December 31, 2011, the Company has considerablehad approximately $74 million of annual interest payments and its aggregate debt service obligations.obligations are approximately $70 million each year from 2012 through 2015, $50 million in 2016 and $20 million in 2017. The Company’s ability to make payments on and refinance its debt, including the Domtar CorporationCompany’s unsecured long-term notes and amounts borrowed under its senior securedrevolving credit facility, if any, and other financial obligations and to fund its operations will depend on its ability to generate substantial operating cash flow. The Company’s cash flow generation will depend on its future performance, which will be subject to prevailing economic conditions and to financial, business and other factors, many of which are beyond its control.
The Company’s business may not generate sufficient cash flow from operations and future borrowings may not be available to the Company under its senior securedrevolving credit facility or otherwise in amounts sufficient to enable the Company to service its indebtedness, including the Domtar CorporationCompany’s unsecured long-term notes, and borrowings, if any, under its senior securedrevolving credit facilitiesfacility or to fund its other liquidity needs. If the Company cannot service its debt, the Company will have to take actions such as reducing or delaying capital investments, selling assets, restructuring or refinancing its debt or seeking additional equity capital. Any of these remedies may not be effected on commercially reasonable terms, or at all, and may impede the implementation of its business strategy. Furthermore, the senior securedrevolving credit facility may restrict the Company from adopting any of these alternatives. Because of these and other factors that may be beyond its control, the Company may be unable to service its indebtedness.
The Company is affected by changes in currency exchange rates.
The Company manufactures all of its wood products and a significant portion of pulp and paper in Canada. Sales of these products by the Company’s Canadian operations will be invoiced in U.S. dollars or in Canadian dollars linked to U.S. pricing but most of the costs relating to these products will be incurred in Canadian dollars. As a result, any decrease in the value of the U.S. dollar relative to the Canadian dollar will reduce the Company’s profitability.
Exchange rate fluctuations are beyond the Company’s control. From 20032007 to 2009,2011, the Canadian dollar had appreciated over 50%15% relative to the U.S. dollar. In 2009,2011, when compared to 2008,2010, the Canadian dollar increaseddecreased in value by approximately 17%2% relative to the U.S. dollar. The level of the Canadian dollar can have a material adverse effect on the sales and profitability of the Canadian operations.
The Company has liabilities with respect to its pension plans and the actual cost of its pension plan obligations could exceed current provisions. As of December 31, 2009,2011, the Company’s defined benefit plans had a surplus of $32$53 million on certain plans and a deficit of $112$143 million on others on an ongoing basis.
The Company’s future funding obligations for the defined benefit pension plans depend upon changes to the level of benefits provided by the plans, the future performance of assets set aside in trusts for these plans, the level of interest rates used to determine minimum funding levels, actuarial data and experience, and any changes in government laws and regulations. As of December 31, 2009,2011, the Company’s Canadian defined benefit pension plans held assets with a fair value of $1,211$1,445 million (CDN$1,267(CDN $1,470 million), including a fair value of $205 million
25
(CDN$214 (CDN $208 million) of asset backed commercial paper (“ABCP”). Most of the ABCP investments were subject to restructuring (under the court order governing the Montreal Accord that was completed in January 2009) while the remainder areis in conduits restructured outside the Montreal Accord or subject to litigation between the sponsor and the credit counterparty.
At December 31, 2009,2011, the Company determined that the fair value of these ABCP investments was $205 million (CDN$(CDN $208 million) (2010—$214 million) (2008—$198 million (CDN$242(CDN $213 million)). Possible changes that could have a material effect on the future value of the ABCP include (1) changes in the value of the underlying assets and the related derivatives transaction,derivative transactions, (2) developments related to the liquidity of the ABCP market, and (3) a severe and prolonged economic slowdown in North America and the bankruptcy of referenced corporate credits.
The Company does not expect any potential short termshort-term liquidity issues to affect the pension funds since pension fund obligations are primarily long-term in nature. Losses in pension fund investments, if any, would result in future increased contributions by the Company or its Canadian subsidiaries. Additional contributions to these pension funds would be required to be paid over 5 year or 10 year periods, depending upon the applicable provincial requirement for funding solvency deficits. Losses, if any, would also impact operating results over a longer period of time and immediately increase liabilities and reduce equity.
The Company may be required to pay significant lumber export taxes and/or countervailing and antidumping duties.
The Company may experience reduced revenues and margins on its softwood lumber business as a result of lumber export taxes and/or countervailing and antidumping duty applications. In April 2001, the Coalition for Fair Lumber Imports (“Coalition”) filed two petitions with the U.S. Department of Commerce (“Department”) and the International Trade Commission (“ITC”) claiming that production of softwood lumber in Canada was being subsidized by Canada and that imports from Canada were being “dumped” into the U.S. market (sold at less than fair value). The Coalition asked that countervailing duty (“CVD”) and antidumping (“AD”) tariffs be imposed on softwood lumber imported from Canada, commencing in 2002.
In 2006, the Canadian and U.S. governments reached a final settlement to this long-standing dispute, the Softwood Lumber Agreement (“SLA”). The provisions of the SLA included repayment of approximately 81% of the CVD and AD deposits, imposition of export measures in Canada and measures to address long-term policy reform. Under the SLA, Canadian softwood lumber exporters pay an export tax when the price of lumber is at or below a threshold price. Under present market conditions, the Company’s softwood lumber exports are subject to a 5% export charge plus a market restriction on access managed by a quota system.
In February 2009, a tribunal operating under the auspices of the London Court of International Arbitration (“LCIA”) issued its decision on a remedy in the softwood lumber arbitration in which Canada was found to have breached the 2006 SLA between the United States and Canada by failing to calculate quotas properly during the first six months of 2007. The LCIA tribunal determined that, as appropriate adjustment to compensate for its breach, Canada must collect an additional 10%ad valorem export charge on softwood lumber shipments from four Canadian provinces (Ontario, Quebec, Manitoba and Saskatchewan) until $55 million has been collected. Starting in April 2009, the United States imposed tariffs on softwood lumber from four Canadian provinces due to Canada’s failure to comply with the SLA. On September 26, 2009, the tribunal ordered Canada to impose a 10%ad valorem export charge on softwood lumber exports to the United States from the four provinces. Canada has indicated its intention to comply with this ruling. Once Canada has imposed a 10% export tax, the United States is expected to cease collecting its 10% import duty, with the result that the affected exports from Canada will continue to be subject to a 10% charge, as has been in effect since April 2009.
The Company experienced and may continue to experience reduced revenues and margins in the softwood lumber business as a result of the application of the SLA and the potential imposition of CVD and AD tariffs. The SLA, or the potential imposition of CVD and AD tariffs, could have a material adverse effect on the
26
Company’s business, financial results and financial condition, including, but not limited to, facility closures or impairment of assets.
The Company could incur substantial costs as a result of compliance with, violations of or liabilities under applicable environmental laws and regulations. It could also incur costs as a result of asbestos-related personal injury litigation.
The Company is subject, in both the United States and Canada, to a wide range of general and industry-specific laws and regulations relating to the protection of the environment and natural resources, including those governing air emissions, greenhouse gases and climate change, wastewater discharges, harvesting, silvicultural activities, the storage, management and disposal of hazardous substances and wastes, the cleanup of contaminated sites, landfill operation and closure obligations, forestry operations and endangered species habitat, and health and safety matters. In particular, the pulp and paper industry in the United States is subject to the United States Environmental Protection Agency’s (“EPA”) Cluster Rule and was until recently subject to the EPA’s Boiler MACT Rule (the Boiler MACT Rule has been vacated, however, alternative U.S. federal and state regulations are being discussed) that further regulate effluent and air emissions. These laws and regulations require the Company to obtain authorizations from and comply with the requirements of the appropriate governmental authorities, which have considerable discretion over the terms and timing of permits.“Cluster Rules.”
The Company has incurred, and expects that it will continue to incur, significant capital, operating and other expenditures complying with applicable environmental laws and regulations as a result of remedial obligations. The Company incurred approximately $71$62 million of operating expenses and $2$8 million of capital expenditures in connection with environmental compliance and remediation for 2009.in 2011. As of December 31, 2009,2011, the Company had a provision of $111$92 million for environmental expenditures, including certain asset retirement obligations (such as for land filllandfill capping and asbestos removal) ($99107 million as of December 31, 2008)2010). The pulp and paper mill in Prince Albert was closed in the first quarter of 2006 and has not been operated since. In December 2009, the Company decided to dismantle the Prince Albert facility. The Province of Saskatchewan may require active decommissioning and reclamation at the facility. In the event decommissioning and reclamation is required at the facility, the work is likely to include investigation and remedial action for areas of significant environmental impacts. The Company has a reserve for the estimated required environmental remediation at the site.
The Company also could incur substantial costs, such as civil or criminal fines, sanctions and enforcement actions (including orders limiting its operations or requiring corrective measures, installation of pollution control equipment or other remedial actions), cleanup and closure costs, and third-party claims for property damage and personal injury as a result of violations of, or liabilities under, environmental laws and regulations. The Company’s ongoing efforts to identify potential environmental concerns that may be associated with its past and present properties will lead to future environmental investigations. Those efforts will likely result in the determination of additional environmental costs and liabilities which cannot be reasonably estimated at this time.
As the owner and operator of real estate, the Company may be liable under environmental laws for cleanup, closure and other damages resulting from the presence and release of hazardous substances, including asbestos, on or from its properties or operations. The amount and timing of environmental expenditures is difficult to predict, and, in some cases, the Company’s liability may be imposed without regard to contribution or to whether it knew of, or caused, the release of hazardous substances and may exceed forecasted amounts or the value of the property itself. The discovery of additional contamination or the imposition of additional cleanup obligations at the Company’s or third-party sites may result in significant additional costs. Any material liability the Company incurs could adversely impact its financial condition or preclude it from making capital expenditures that would otherwise benefit its business.
In addition, the Company may be subject to asbestos-related personal injury litigation arising out of exposure to asbestos on or from its properties or operations, and may incur substantial costs as a result of any defense, settlement, or adverse judgment in such litigation. The Company may not have access to insurance proceeds to cover costs associated with asbestos-related personal injury litigation.
27
Enactment of new environmental laws or regulations or changes in existing laws or regulations, or interpretation thereof, might require significant expenditures. For example, changes in climate change regulation—See Part I, Item 3, Legal Proceedings, under the caption “Climate change regulation.regulation,” and see Part II, Item 8, Note 22 “Commitments and Contingencies” “Industrial Boiler Maximum Achievable Controlled Technology Standard (“MACT”).”
The Company may be unable to generate funds or other sources of liquidity and capital to fund environmental liabilities or expenditures.
The Company dependsFailure to comply with applicable laws and regulations could have a material adverse affect on third parties for transportation services.our business, financial results or condition.
The Company relies primarily on third parties for transportationIn addition to environmental laws, our business and operations are subject to a broad range of other laws and regulations in the products it manufactures and/or distributes,United States and Canada as well as deliveryother jurisdictions in which we operate, including antitrust and competition laws, occupational health and safety laws and employment laws. Many of its raw materials. In particular, a significant portion of the goods it manufacturesthese laws and raw materials it usesregulations are transported by railroad or trucks, which are highly regulated.complex and subject to evolving and differing interpretation. If any of its third-party transportation providers were to fail to deliver the goods the Company manufacturesis determined to have violated any such laws or distributes in a timely manner, the Company may be unable to sell those products at full value,regulations, whether inadvertently or at all. Similarly, if any of these providers were to fail to deliver raw materials to the Company in a timely manner,willfully, it may be unablesubject to manufacture its products in response to customer demand. In addition, if any of thesecivil and criminal penalties, including substantial fines, or claims for damages by third parties were to cease operations or cease doing business with the Company, itwhich may be unable to replace them at reasonable cost. Any failure of a third-party transportation provider to deliver raw materials or finished products in a timely manner could harm the Company’s reputation, negatively impact its customer relationships and have a material adverse effect on itsthe Company’s financial condition and operating results.position, results of operations or cash flows.
The Company’s intellectual property rights are valuable, and any inability to protect them could reduce the value of its products and its brands.
The Company relies on patent, trademark and other intellectual property laws of the United States and other countries to protect its intellectual property rights. However, the Company may be unable to prevent third parties from using its intellectual property without its authorization, which may reduce any competitive advantage it has developed. If the Company had to litigate to protect these rights, any proceedings could be costly, and it may not prevail. The Company cannot guarantee that any United States or foreign patents, issued or pending, will provide it with any competitive advantage or will not be challenged by third parties. Additionally, the Company has obtained and applied for United States and foreign trademark registrations, and will continue to evaluate the registration of additional service marks and trademarks, as appropriate. The Company cannot guarantee that any of its pending patent or trademark applications will be approved by the applicable governmental authorities and, even if the applications are approved, third parties may seek to oppose or otherwise challenge these registrations. The failure to secure any pending patent or trademark applications may limit the Company’s ability to protect the intellectual property rights that these applications were intended to cover.
If the Company is unable to successfully retain and develop executive leadership and other key personnel, it may be unable to fully realize critical organizational strategies, goals and objectives.
The success of the Company is substantially dependent on the efforts and abilities of its key personnel, including its executive management team, to develop and implement its business strategies and manage its operations. The failure to retain key personnel or to develop successors with appropriate skills and experience for key positions in the Company could adversely affect the development and achievement of critical organizational strategies, goals and objectives. There can be no assurance that the Company will be able to retain or develop the key personnel it needs and the failure to do so may adversely affect its financial condition and results of operations.
A third party has demanded an increase in consideration from Domtar Inc. under an existing contract.
In July 1998, Domtar Inc. (now a 100% owned subsidiary of Domtar Corporation) acquired all of the issued and outstanding shares of E.B. Eddy Limited and E.B. Eddy Paper, Inc. (E.B. Eddy)(“E.B. Eddy”), an integrated producer of specialty paper and wood products. The purchase agreement relating to this acquisition includes a purchase price adjustment whereby, in
the event of the acquisition by a third-party of more than 50% of the shares of Domtar Inc. in specified circumstances, Domtar Inc. may be required to pay an increase in consideration of up to a maximum of $115$118 million (CDN$120 million). This, an amount gradually declinesdeclining over a 25-year period and atperiod. At March 7, 2007, the closing date of the combination of the Weyerhaeuser Fine Paper Business with Domtar Inc., the maximum amount of the purchase price adjustment was approximately $105$108 million (CDN$110 million). No provision was recorded for this potential purchase price adjustment.
On March 14, 2007, the Company received a letter from George Weston Limited (the previous owner of E.B. Eddy and a party to the purchase agreement) demanding payment of $105$108 million (CDN$110 million) as a result of the consummation of the March 2007 combinationseries of transactions whereby the Weyerhaeuser Fine Paper Business with
28
of Weyerhaeuser Company was transferred to the Company and the Company acquired Domtar Inc. (the “Transaction”). On June 12, 2007, an action was commenced by George Weston Limited against Domtar Inc. in the Superior Court of Justice of the provinceProvince of Ontario, Canada, claiming that the consummation of the March 2007 combination of the Weyerhaeuser Fine Paper Business with Domtar Inc.Transaction triggered the purchase price adjustment and sought a purchase price adjustment of $105$108 million (CDN$110 million) as well as additional compensatory damages. The Company does not believe that the consummation of the March 2007 combination of the Weyerhaeuser Fine Paper Business with Domtar Inc.Transaction triggers an obligation to pay an increase in consideration under the purchase price adjustment and intends to defend itself vigorously against any claims with respect thereto. However, the Company may not be successful in its defense of such claims, and if itthe Company is ultimately required to pay an increase in consideration, such payment may have a material adverse effect on the Company’s financial position, results of operations or cash flows. On March 31, 2011, George Weston Limited filed a motion for summary judgment which the Company expects to be resolved by the Court in due course. No provision is recorded for this potential purchase price adjustment.
| ITEM 1B. | UNRESOLVED STAFF COMMENTS |
None.
| ITEM 2. | PROPERTIES |
A description of our mills and related properties is included in Part I, Item I, Business, of this Annual Report on Form 10-K.
Production facilities
We own all of our production facilities with the exception of certain portions that are subject to leases with government agencies in connection with industrial development bond financings or fee-in-lieu-of-tax agreements, and lease substantially all of our sales offices, regional replenishment centers and warehouse facilities. We believe our properties are in good operating condition and are suitable and adequate for the operations for which they are used. We own substantially all of the equipment used in our facilities.
Forestlands
We optimize 31optimized 16 million acres of forestland directly and indirectly licensed or owned in Canada and the United States through efficient management and the application of certified sustainable forest management practices such that a continuous supply of wood is available for future needs.
Listing of facilities and locations
Head Office
Montreal, Quebec
PapersPulp and Paper
Operation Center:
Fort Mill, South Carolina
Uncoated Freesheet:
Ashdown, Arkansas
Espanola, Ontario
Hawesville, Kentucky
Johnsonburg, Pennsylvania
Kingsport, Tennessee
Marlboro, South Carolina
Nekoosa, Wisconsin
Port Huron, Michigan
Rothschild, Wisconsin
Windsor, Quebec
Coated Groundwood:
Columbus, Mississippi
Pulp:
Dryden, Ontario
Kamloops, British Columbia
Plymouth, North Carolina
Woodland, Maine
Chip Mills:
Hawesville, Kentucky
Johnsonburg, Pennsylvania
Kingsport, Tennessee
Marlboro, South Carolina
Converting and Distribution—Onsite:
Ashdown, Arkansas
Rothschild, Wisconsin
Windsor, Quebec
Converting and Distribution—Offsite:
Addison, Illinois
Brownsville, Tennessee
Cerritos, California
Dallas, Texas
29
Dubois,DuBois, Pennsylvania
Griffin, Georgia
Indianapolis, Indiana
Mira Loma, California
Owensboro, Kentucky
Ridgefields, Tennessee
Tatum, South Carolina
Washington Court House, Ohio
Guangzhou, China
Forms Manufacturing:
Cerritos, California
Dallas, Texas
Indianapolis, Indiana
Langhorne, Pennsylvania
Rock Hill, South Carolina
Enterprise Group*—United States:
Birmingham, Alabama
Chandler,Phoenix, Arizona
Little Rock, Arkansas
Cerritos, California
Hayward,San Lorenzo, California
Riverside, California
Denver, Colorado
Jacksonville, Florida
Lakeland, Florida
Miami,Medley, Florida
Duluth, Georgia
Boise, Idaho
Addison, Illinois
East Peoria, Illinois
Evansville, Indiana
Fort Wayne, Indiana
Indianapolis, Indiana
Altoona, Iowa
Kansas City, Kansas
Lexington, Kentucky
Louisville, Kentucky
Harahan,Kenner, Louisiana
Boston,Mansfield, Massachusetts
Wayland, Michigan
Wayne, Michigan
Minneapolis, Minnesota
Jackson, Mississippi
St. Louis,Overland, Missouri
Omaha, Nebraska
Hoboken, New Jersey
Albuquerque, New Mexico
Buffalo, New York
Syracuse, New York
Charlotte, North Carolina
Brookpark, Ohio
Cincinnati, Ohio
Plain City, Ohio
Oklahoma City, Oklahoma
Tulsa, Oklahoma
Langhorne, Pennsylvania
Pittsburgh, Pennsylvania
Rock Hill, South Carolina
Chattanooga, Tennessee
Knoxville, Tennessee
Memphis, Tennessee
Nashville,Antioch, Tennessee
DFW Airport, Texas
El Paso, Texas
Garland, Texas
Houston, Texas
San Antonio, Texas
Salt Lake City, Utah
Richmond, Virginia
Kent, Washington
Vancouver, Washington
Milwaukee, Wisconsin
Enterprise Group*—Canada:
Calgary, Alberta
Montreal,Dorval, Quebec
Toronto,Etobicoke, Ontario
Vancouver,Delta, British Columbia
Regional Replenishment Centers (RRC)—United States:
Charlotte, North Carolina
Chicago,Addison, Illinois
Dallas,Garland, Texas
Jacksonville, Florida
Langhorne, Pennsylvania
Los Angeles,Mira Loma, California
Vancouver,Kent, Washington
Regional Replenishment Centers (RRC)—Canada:
Richmond, Quebec
Toronto,Missisauga, Ontario
Winnipeg, Manitoba
Pulp salesRepresentative office—International
Hong Kong, China
Paper MerchantsDistribution
Head Office:
Covington, Kentucky
RIS Paper—Ariva—Eastern Region:
Albany, New York
Boston, Massachusetts
Harrisburg, Pennsylvania
Hartford, Connecticut
Lancaster, Pennsylvania
New York, New York
Philadelphia, Pennsylvania
Southport, Connecticut
Washington, DC / Baltimore, Maryland
RIS Paper—Ariva—MidWest Region:
Buffalo, New York
Covington, Kentucky
Cincinnati, Ohio
Cincinnati, Ohio (I.T.)
Cleveland, Ohio
Columbus, Ohio
Uniontown, Ohio
Dayton, Ohio
Dallas/Fort Worth, Texas
Fort Wayne, Indiana
Indianapolis, Indiana
Buntin Reid—Ariva—Canada:
London, Ontario
Ottawa, Ontario
Toronto, Ontario
JBR / La Maison du Papier—Canada:
Montreal, Quebec
Quebec City, Quebec
The Paper House—Canada:
Halifax, Nova Scotia
Mount Pearl, Newfoundland
WoodPersonal Care
Ear Falls, OntarioAttends North America—Head Office, Manufacturing and Distribution:
Gogama, Ontario
Nairn Centre, Ontario
Matagami, Quebec
Ste-Marie, Quebec
Sullivan, Quebec
Timmins, Ontario
Val d’Or, QuebecGreenville, North Carolina
* Enterprise Group is involved in the sale and distribution of Domtar papers, notably continuous forms, cut size business papers as well as digital papers, converting rolls and specialty products.
| * | Enterprise Group is involved in the sale and distribution of Domtar papers, notably continuous forms, cut size business papers as well as digital papers, converting rolls and specialty products. |
30
| ITEM 3. | LEGAL PROCEEDINGS |
Currently, a small number of claims and litigation matters have arisen in the ordinary course of business. Although the final outcome of any legal proceeding is subject to a number of variables and cannot be predicted with any degree of certainty, management currently believes that the ultimate outcome of these legal proceedings will not have a material adverse effect on the Company’s long-term results of operations, cash flow or financial position.
In the normal course of operations, the Company becomes involved in various legal actions mostly related to contract disputes, patent infringements, environmental and product warranty claims, and labor issues. The Company periodically reviews the status of these proceedings and assesses the likelihood of any adverse judgments or outcomes of these legal proceedings, as well as analyzes probable losses. WhileAlthough the Companyfinal outcome of any legal proceeding is subject to a number of variables and cannot be predicted with any degree of certainty, management currently believes that the ultimate dispositionoutcome of these matterscurrent legal proceedings will not have a material adverse effect on itsthe Company’s long-term results of operations, cash flow or financial condition,position. However, an adverse outcome in one or more of the following significant legal proceedings could have a material adverse effect on our results or cash flow in a given quarter or year.
Prince Albert facility
The pulp and paper mill in Prince Albert was closed in the first quarter of 20092006 and has not been operated since. In December 2009, the Company decided to dismantle the Prince Albert facility. In a grievance relating to the closure of the Prince Albert facility, the union is claimingclaimed that it iswas entitled to the accumulated pension benefits during the actual layoff period because, according to the union, a majority of employees still had recall rights during the layoff. The Company cannot be certain that it will not incur a liability, which could be in excess of $20 million. Arbitration in this matter was held onin February 16 to 18, 2010, and the parties are awaitingarbitrator ruled in favor of the arbitrator’s decision.Company on August 24, 2010. As a result of the sale of the Prince Albert facility to Paper Excellence Canada Holdings Corporation (“Paper Excellence”) in May 2011, the union agreed to release any claims for judicial review it may have against the Company in relation to the grievance.
Acquisition of E.B. Eddy Limited and E.B. Eddy Paper, Inc.
In July 1998, Domtar Inc. (now a 100% owned subsidiary of Domtar Corporation) acquired all of the issued and outstanding shares of E.B. Eddy Limited and E.B. Eddy Paper, Inc. (E.B. Eddy)(“E.B. Eddy”), an integrated producer of specialty paper and wood products. The purchase agreement relating to this acquisition includesincluded a purchase price adjustment whereby, in the event of the acquisition by a third party of more than 50% of the shares of Domtar Inc. in specified circumstances, Domtar Inc. may be required to pay an increase in consideration of up to a maximum of $115$118 million (CDN$120 million), an amount gradually declining over a 25-year period. At March 7, 2007, the closing date of the combination of the Weyerhaeuser Fine Paper Business with Domtar Inc., the maximum amount of the purchase price adjustment was approximately $105$108 million (CDN$110 million). No provision was recorded for this potential purchase price adjustment.
On March 14, 2007, the Company received a letter from George Weston Limited (the previous owner of E.B. Eddy and a party to the purchase agreement) demanding payment of $105$108 million (CDN$110 million) as a result of the consummation of the March 2007 combination of the Weyerhaeuser Fine Paper Business with Domtar Inc.Transaction. On June 12, 2007, an action was commenced by George Weston Limited against Domtar Inc. in the Superior Court of Justice of the Province of Ontario, Canada, claiming that the consummation of the March 2007 combination of the Weyerhaeuser Fine Paper Business with Domtar Inc.,Transaction triggered the purchase price adjustment and sought a purchase price adjustment of $105$108 million (CDN$110 million) as well as additional compensatory damages. The Company does
not believe that the consummation of the March 2007 combination of the Weyerhaeuser Fine Paper Business with Domtar Inc.Transaction triggers an obligation to pay an increase in consideration under the purchase price adjustment and intends to defend itself vigorously against any claims with respect thereto. However, the Company may not be successful in the defense of such claims, and if the Company is ultimately required to pay an increase in consideration, such payment may have a material adverse effect on the Company’s financial position, results of operations or cash flows. On March 31, 2011, George Weston Limited filed a motion for summary judgment which the Company expects to be resolved by the Court in due course. No provision is recorded for this potential purchase price adjustment.
31
Asbestos claims
Various asbestos-related personal injury claims have been filed in U.S. state and federal courts against Domtar Industries Inc. and certain other affiliates of the Company in connection with alleged exposure by people to products or premises containing asbestos. While the Company believes that the ultimate disposition of these matters, both individually and on an aggregate basis, will not have a material adverse effect on its financial condition, there can be no assurance that the Company will not incur substantial costs as a result of any such claim. These claims have not yielded a significant exposure in the past. The Company has recorded a provision for these claims and any reasonable possible loss in excess of the provision is not considered to be material.
Environment
The Company is subject to environmental laws and regulations enacted by federal, provincial, state and local authorities.
Domtar Inc. and the Company is or may be a “potentially responsible party” with respect to various hazardous waste sites that are being addressed pursuant to the Comprehensive Environmental Response, Compensation, and Liability Act of 1980 (“Superfund”) or similar laws. Domtar Inc. continues to take remedial action under its Care and Control Program, as such sites mostly relate to its former wood preserving operating sites, and a number of operating sites due to possible soil, sediment or groundwater contamination. The investigation and remediation process is lengthy and subject to the uncertainties of changes in legal requirements, technological developments and, if and when applicable, the allocation of liability among potentially responsible parties.
TheDuring the first quarter of 2006, the pulp and paper mill in Prince Albert was closed in the first quarter of 2006 and has not been operated since. In December 2009, the Company decideddue to dismantlepoor market conditions. The Company’s management determined that the Prince Albert facility. The Province of Saskatchewan may require active decommissioningfacility was no longer a strategic fit for the Company and reclamation atwould not be reopened. On May 3, 2011, Domtar sold its Prince Albert facility to Paper Excellence Canada Holdings Corporation (“Paper Excellence”). Paper Excellence agreed to assume all past, present and future known and unknown environmental liabilities and as such, the facility. In the event decommissioning and reclamation is required at the facility, the work is likely to include investigation and remedial action for areas of significant environmental impacts. The Company has aremoved its reserve for environmental liabilities for this site in the estimated required environmental remediation at the site.second quarter of 2011.
An action was commenced by Seaspan International Ltd. (“Seaspan”) in the Supreme Court of British Columbia, on March 31, 1999 against Domtar Inc. and others with respect to alleged contamination of Seaspan’s site bordering Burrard Inlet in North Vancouver, British Columbia, including contamination of sediments in Burrard Inlet, due to the presence of creosote. As of July 3, 2002,creosote and heavy metals. On February 16, 2010, the parties entered into a partial Settlement Agreement (the “Settlement Agreement”) which provided that, while the agreement is performed in accordance with its terms, the action commenced by Seaspan will be held in abeyance. The Settlement Agreement focused on the sharing of costs between Seaspan and Domtar Inc. for certain remediation of contamination referred to in the plaintiff’s claim. The Settlement Agreement did not address all of the plaintiff’s claims and such claims cannot be reasonably determined at this time. On June 3, 2008, Domtar was notified by Seaspan that it terminated the Settlement Agreement. The government of British Columbia issued on February 16, 2010 a Remediation Order to Seaspan and Domtar Inc. in order to define and implement an action plan to address soil, sediment and groundwater issues. This Order may bewas appealed within 30 days fromto the date of this OrderEnvironmental Appeal Board (“Board”) on March 17, 2010 but there is no suspension in the executionsexecution of this Order unless the Appeal Board orders otherwise. The Company is currently reviewing its options in this respect.appeal hearing has been scheduled for October 2012. The relevant government authorities selected a remediation plan on July 15, 2011. In the interim, no stay of execution has been granted or requested. The Company has recorded an environmental reserve to address estimated exposure.exposure and the reasonably possible loss in excess of the reserve is not considered to be material.
At December 31, 2009,2011, the Company had a provision of $111$92 million ($107 million at December 31, 2010) for environmental matters and other asset retirement obligations ($99 million in 2008).obligations. Certain of these amounts have been discounted
due to more certainty of the timing of expenditures. Additional costs, not known or identifiable, could be incurred for remediation efforts. Based on policies and procedures in place to monitor environmental exposure, management believes that such additional remediation costs would not have a material adverse effect on the Company’s financial position, resultsresult of operations or cash flows.
32
Climate change regulation
Since 1997, when an international conference on global warming concluded an agreement known as the Kyoto Protocol, which called for reductions of certain emissions that may contribute to increases in atmospheric greenhouse gas (“GHG”) concentrations, various international, national and local laws have been proposed or implemented focusing on reducing GHG emissions. These actual or proposed laws do or may apply in the countries where the Company currently has, or may have in the future, manufacturing facilities or investments.
In the United States, the U.S. Congress is consideringhas considered legislation to reduce emissions of GHGs. In June 2009,GHGs, although it appears unlikely that any Federal legislation will be actively considered again until after the U.S. House of Representatives passed The American Clean Energy and Security Act of 2009, a cap-and-trade bill designed to reduce GHG emissions. In September 2009 the Clean Energy Jobs and American Power Act was introduced in the U.S. Senate. In December 2009, the Carbon Limits and Energy for America’s Recovery (CLEAR) Act was also introduced in the U.S. Senate. In addition, several2012 elections. Several states already are already requiring the reduction ofregulating GHG emissions by certain companies andfrom public utilities and certain other significant emitters, primarily through the planned development of GHG emission inventories and/or stateregional GHG cap-and-trade programs. In addition,Furthermore, the U.S. Environmental Protection Agency (“EPA”) is beginningexpected, in 2012, to regulatepropose GHG emissions. The U.S. Supreme Court ruled in April 2007 inMassachusetts et al. v. EPA, that GHGs fallpermitting requirements for some existing industrial facilities under the federalagency’s existing Clean Air Act’s definition of “air pollutant.” In December 2009, the EPA issued its “endangerment findings” which found that GHGs endanger public health and welfare. The finding itself does not impose any requirement on our industry but is a pre-requisite for EPA to regulate GHG emissions.Act authority. Passage of climate controlGHG legislation or other regulatory initiatives by Congress or various U.S. States,individual states, or the adoption of regulations by the EPA or analogous state agencies, that restrict emissions of GHGs in areas in which the Company conducts business maycould have a material effect on our operations. Thevariety of impacts upon the Company, expectsincluding requiring it to implement GHG containment and reduction programs or to pay taxes or other fees with respect to any failure to achieve the mandated results. This, in turn, will increase the Company’s operating costs, which, to the extent passed through to customers, could reduce demand for the Company’s products. However, the Company does not expect to be disproportionately affected by these measures compared with other pulp and paper operationsproducers in the United States.
The province of Quebec initiated, as part of its commitment to the Western Climate Initiative (“WCI”), a GHG cap-and-trade system on January 1, 2012. Reduction targets for Quebec are expected to be promulgated later in 2012, to be effective January 1, 2013. There are presently no federal or provincial legislative orlegislation on regulatory obligations to reduce GHGGHGs for ourthe Company’s pulp and paper operations elsewhere in Canada.
While it is likely that there will be increased regulation relating to GHG and climate change,emissions in the future, at this stage it is not possible to estimate either a timetable for the promulgation or implementation of any new regulations or the Company’s cost of compliance to said regulations. The impact could, however, be material.
| ITEM 4. |
There were no matters submitted to a vote of security holders during the fourth quarter of the fiscal year ended December 31, 2009.
33Not applicable.
PART II
| ITEM 5. | MARKET FOR REGISTRANT’S COMMON EQUITY, RELATED STOCKHOLDER MATTERS AND ISSUER PURCHASES OF EQUITY SECURITIES |
Domtar Corporation’s common stock is traded on the New York Stock Exchange and the Toronto Stock Exchange under the symbol “UFS.” The following table sets forth the price ranges of our common stock during 20092011 and 2008 on the New York Stock Exchange and the Toronto Stock Exchange. Effective June 10, 2009 at 6:01 p.m. (ET), the Company effected a reverse stock split of Domtar’s outstanding shares, at a split ratio of 1-for-12. Shareholder approval for the reverse stock split was obtained at the Annual General Meeting held on May 29, 2009. Price ranges for both 2008 and 2009 were adjusted to reflect the reverse stock split.2010.
| New York Stock Exchange ($) | Toronto Stock Exchange (CDN$) | New York Stock Exchange ($) | Toronto Stock Exchange (CDN$) | |||||||||||||||||||||||||||||||||
| High | Low | Close | High | Low | Close | High | Low | Close | High | Low | Close | |||||||||||||||||||||||||
2009 Quarter | ||||||||||||||||||||||||||||||||||||
2011 Quarter | ||||||||||||||||||||||||||||||||||||
First | 25.56 | 6.12 | 11.40 | 30.84 | 7.80 | 14.16 | 93.88 | 75.49 | 91.78 | 92.71 | 75.43 | 89.00 | ||||||||||||||||||||||||
Second | 23.28 | 10.56 | 16.58 | 27.72 | 13.20 | 19.30 | 105.80 | 84.72 | 94.72 | 102.31 | 81.53 | 91.37 | ||||||||||||||||||||||||
Third | 42.00 | 13.91 | 35.22 | 44.93 | 15.60 | 37.86 | 99.65 | 64.58 | 68.17 | 95.44 | 63.88 | 71.36 | ||||||||||||||||||||||||
Fourth | 59.10 | 35.41 | 55.41 | 62.07 | 38.29 | 58.21 | 85.21 | 62.28 | 79.96 | 84.82 | 66.12 | 81.51 | ||||||||||||||||||||||||
|
|
|
|
|
| |||||||||||||||||||||||||||||||
Year | 59.10 | 6.12 | 55.41 | 62.07 | 7.80 | 58.21 | 105.80 | 62.28 | 79.96 | 102.31 | 63.88 | 81.51 | ||||||||||||||||||||||||
2008 Quarter | ||||||||||||||||||||||||||||||||||||
2010 Quarter | ||||||||||||||||||||||||||||||||||||
First | 98.76 | 71.28 | 81.96 | 99.84 | 71.76 | 84.36 | 69.99 | 47.26 | 64.41 | 70.75 | 50.90 | 65.44 | ||||||||||||||||||||||||
Second | 89.40 | 60.24 | 65.40 | 91.08 | 60.96 | 66.24 | 78.93 | 48.33 | 49.15 | 79.36 | 50.75 | 52.02 | ||||||||||||||||||||||||
Third | 78.36 | 52.08 | 55.20 | 83.28 | 52.08 | 59.88 | 66.44 | 46.25 | 64.58 | 69.50 | 48.85 | 67.00 | ||||||||||||||||||||||||
Fourth | 57.24 | 12.12 | 20.04 | 60.60 | 15.60 | 24.84 | 84.96 | 62.86 | 75.92 | 86.28 | 64.36 | 75.69 | ||||||||||||||||||||||||
|
|
|
|
|
| |||||||||||||||||||||||||||||||
Year | 98.76 | 12.12 | 20.04 | 99.84 | 15.60 | 24.84 | 84.96 | 46.25 | 75.92 | 86.28 | 48.85 | 75.69 | ||||||||||||||||||||||||
|
|
|
|
|
| |||||||||||||||||||||||||||||||
At December 31, 2009,2011, the number of shareholders of record (registered and non-registered) of Domtar Corporation common stock was approximately 10,04710,819 and the number of shareholders of record (registered and non-registered) of Domtar (Canada) Paper Inc. exchangeable shares was approximately 11,734.6,311.
DIVIDENDS AND STOCK REPURCHASE PROGRAM
During 2009,In 2011, Domtar Corporation declared and paid four quarterly dividends. The first quarter dividend was $0.25 per share relating to 2010 and the remainder were $0.35 per share relating to 2011, to holders of the Company’s common stock, as well as holders of exchangeable shares of Domtar (Canada) Paper Inc., a subsidiary of Domtar Corporation. The total dividends of approximately $10 million, $15 million and $13 million were paid on April 15, July 15 and October 17, 2011, respectively, and the fourth quarter dividend of approximately $13 million was paid on January 17, 2012.
In 2010, Domtar Corporation declared three and paid two quarterly dividends of $0.25 per share to holders of the Company’s common stock, as well as holders of exchangeable shares of Domtar (Canada) Paper Inc., a subsidiary of Domtar Corporation. The total dividends of approximately $11 million and $10 million were paid on July 15 and October 15, 2010, respectively, and the third total dividend of approximately $11 million was paid on January 17, 2011.
On February 22, 2012, our Board of Directors approved a quarterly dividend of $0.35 per share to be paid to holders of the Company’s common stock, as well as holders of exchangeable shares of Domtar (Canada) Paper Inc. This dividend is to be paid on April 16, 2012 to shareholders of record on March 15, 2012.
In addition, on May 4, 2010 the Board of Directors authorized a stock repurchase program (the “Program”) for up to $150 million of the Company’s common stock. On May 4, 2011, the Company’s Board of Directors approved an increase to the Program from $150 million to $600 million. On December 15, 2011, the Company’s Board of Directors approved another increase to the Program from $600 million to $1 billion. Under the Program, the Company did not pay dividendsis authorized to repurchase from time to time shares of its outstanding common stock on the open market or in privately negotiated transactions in the United States. The timing and did not buy backamount of stock repurchases will depend on a variety of factors, including the market conditions as well as corporate and regulatory considerations. The Program may be suspended, modified or discontinued at any time and the Company has no obligation to repurchase any amount of its common stock under the Program. The Program has no set expiration date. The Company repurchases its common stock, from time to time, in part to reduce the dilutive effects of its stock options, awards, and employee stock purchase plan and to improve shareholders’ returns.
The Company makes open market purchases of its common stock using general corporate funds. Additionally, it may enter into structured stock repurchase agreements with large financial institutions using general corporate funds in order to lower the average cost to acquire shares. The agreements require the Company to make an up-front payment to the counterparty financial institution which results in either (i) the receipt of stock at the beginning of the term of the agreements followed by a share adjustment at the maturity of the agreements, or (ii) the receipt of either stock or cash at the maturity of the agreements depending upon the price of the stock.
During 2011, the Company repurchased 5,921,732 shares at an average price of $83.52 for a total cost of $494 million.
During 2010, the Company repurchased 738,047 shares at an average price of $59.96 for a total cost of $44 million. Also in 2010, the Company entered into structured stock repurchase agreements that did not result in the repurchase of shares but resulted in net gains of $2 million which are recorded as a component of Shareholders’ equity.
All shares repurchased are recorded as Treasury stock on the Consolidated Balance Sheets under the par value method at $0.01 per share.
Share repurchase activity under our share repurchase program was as follows during the year ended December 31, 2011:
34
Period | (a) Total Number of Shares Purchased | (b) Average Price Paid per Share | (c) Total Number of Shares Purchased as Part of Publicly Announced Plans or Programs | (d) Approximate Dollar Value of Shares that May Yet be Purchased under the Plans or Programs (in 000s) | ||||||||||||
January 1 through March 31, 2011 | 789,957 | $ | 87.79 | 789,957 | $ | 36,396 | ||||||||||
April 1 through June 30, 2011 | 1,682,047 | $ | 98.27 | 1,682,047 | $ | 321,105 | ||||||||||
July 1 through September 30, 2011 | 2,515,791 | $ | 76.13 | 2,515,791 | $ | 129,575 | ||||||||||
October 1 through December 31, 2011 | 933,937 | $ | 73.23 | 933,937 | $ | 461,186 | ||||||||||
|
|
|
|
|
|
|
| |||||||||
| 5,921,732 | $ | 83.52 | 5,921,732 | $ | 461,186 | |||||||||||
|
|
|
|
|
|
|
| |||||||||
This graph compares the return on a $100 investment in the Company’s common stock on March 7, 2007 with a $100 investment in an equally-weighted portfolio of a peer group(1), a $100 investment in the S&P 500 Index and a $100 investment in the S&P 500 Materials400 Midcap Index. This graph assumes that returns are in local currencies and assumes quarterly reinvestment of dividends. The measurement dates are the last trading day of the period as shown.


In May 2011, Domtar Corporation was added to the Standard and Poor’s MidCap 400 Index and will be using this Index going forward.
| (1) | On May 18, 2007, the Human Resources Committee of the Board of Directors established performance measures as part of the Performance Conditioned Restricted Stock Unit (“PCRSUs”) Agreement including the achievement of a total shareholder return compared to a peer group. |
AbitibiBowater Inc.This graph assumes that returns are in local currencies and Smurfit-Stone are traded on the Pink OTC Markets effective April 16, 2009assumes quarterly reinvestment of dividends and February 4, 2009, respectively.special dividends.
35
| ITEM 6. | SELECTED FINANCIAL DATA |
The following sets forth selected historical financial data of the Company for the periods and as of the dates indicated. The selected financial data as of December 25, 2005, December 31, 2006, December 30, 2007, December 31, 2008 and December 31, 2009 and for the fiscal years then ended December 25, 2005, December 31, 2006, December 30, 2007, December 31, 2008 and December 31, 2009 have been derived from the audited financial statements of Domtar Corporation for 2009, 2008 andCorporation. The 2007 and the Weyerhaeuser Fine Paper Business for 2006 and 2005. The fiscal years of 2005, 2006 and 2007year ended on the last Sunday of the calendar year. Starting in 2008, the fiscal year was based on the calendar year and ends December 31. Fiscal year 2009 and 2008 consisted of 52 weeks and one day and 52 weeks and three days, respectively, and all other fiscal years presented consisted of 52 weeks, except for fiscal 2006, which consisted of 53 weeks. The additional one day in 2009 and three days in 2008 had no significant impact on our results of operations when compared to other fiscal years presented.
The Company acquired Domtar Inc. as of March 7, 2007. Accordingly, the results of operations for Domtar Inc. are reflected in the financial statements only as of and for the period after that date. Prior to March 7, 2007, the financial statements of the Company reflect only the results of operations of the Weyerhaeuser Fine Paper Business. The following table should be read in conjunction with ItemsPart II, Item 7, Management’s Discussion and Analysis of Financial Condition and Results of Operations and Part II, Item 8, Financial Statements and Supplementary Data of this Annual Report on Form 10-K.
| Year ended | Year ended | |||||||||||||||||||||||||||||||||||||
FIVE YEAR FINANCIAL SUMMARY | December 31, 2009 | December 31, 2008 | December 30, 2007 | December 31, 2006 | December 25, 2005 | December 31, 2011 | December 31, 2010 | December 31, 2009 | December 31, 2008(1) | December 30, 2007 | ||||||||||||||||||||||||||||
| (In millions of dollars, except per share figures) | ||||||||||||||||||||||||||||||||||||||
| (In millions of dollars, except per share figures) | (In millions of dollars, except per share figures) | |||||||||||||||||||||||||||||||||||||
Statement of Income Data: | ||||||||||||||||||||||||||||||||||||||
Sales | $ | 5,465 | $ | 6,394 | $ | 5,947 | $ | 3,306 | $ | 3,267 | $ | 5,612 | $ | 5,850 | $ | 5,465 | $ | 6,394 | $ | 5,947 | ||||||||||||||||||
Closure and restructuring costs and, impairment and write-down of goodwill, property, plant and equipment and intangible assets | 125 | 751 | 110 | 764 | 538 | 137 | 77 | 125 | 751 | 110 | ||||||||||||||||||||||||||||
Depreciation and amortization | 405 | 463 | 471 | 311 | 357 | 376 | 395 | 405 | 463 | 471 | ||||||||||||||||||||||||||||
Operating income (loss) | 615 | (437 | ) | 270 | (556 | ) | (578 | ) | 592 | 603 | 615 | (437 | ) | 270 | ||||||||||||||||||||||||
Net earnings (loss) | 310 | (573 | ) | 70 | (609 | ) | (478 | ) | 365 | 605 | 310 | (573 | ) | 70 | ||||||||||||||||||||||||
Net earnings (loss) per share—basic | $ | 7.21 | ($ | 13.33 | ) | $ | 1.77 | ($ | 25.70 | ) | ($ | 20.17 | ) | $ | 9.15 | $ | 14.14 | $ | 7.21 | ($ | 13.33 | ) | $ | 1.77 | ||||||||||||||
Net earnings (loss) per share—diluted | $ | 7.18 | ($ | 13.33 | ) | $ | 1.76 | ($ | 25.70 | ) | ($ | 20.17 | ) | $ | 9.08 | $ | 14.00 | $ | 7.18 | ($ | 13.33 | ) | $ | 1.76 | ||||||||||||||
Cash dividends declared per common and exchangeable share | $ | 1.30 | $ | 0.75 | — | — | — | |||||||||||||||||||||||||||||||
Balance Sheet Data: | ||||||||||||||||||||||||||||||||||||||
Cash and cash equivalents | $ | 324 | $ | 16 | $ | 71 | $ | 1 | $ | 1 | $ | 444 | $ | 530 | $ | 324 | $ | 16 | $ | 71 | ||||||||||||||||||
Net property, plant and equipment | 4,129 | 4,301 | 5,362 | 3,065 | 3,270 | 3,459 | 3,767 | 4,129 | 4,301 | 5,362 | ||||||||||||||||||||||||||||
Total assets | 6,519 | 6,104 | 7,726 | 3,998 | 4,970 | 5,869 | 6,026 | 6,519 | 6,104 | 7,726 | ||||||||||||||||||||||||||||
Long-term debt | 1,701 | 2,110 | 2,213 | 32 | 24 | 837 | 825 | 1,701 | 2,110 | 2,213 | ||||||||||||||||||||||||||||
Total shareholders’ equity | 2,662 | 2,143 | 3,197 | 2,915 | 3,773 | 2,972 | 3,202 | 2,662 | 2,143 | 3,197 | ||||||||||||||||||||||||||||
36
| (1) | In 2008, the Company conducted an impairment test on its goodwill and concluded that goodwill was impaired and the Company recorded a non-cash impairment charge of $321 million. Also in 2008, the Company conducted impairment tests on its Dryden and Columbus facilities and concluded the assets were impaired and recorded a non-cash impairment charge of $360 million. |
| ITEM 7. | MANAGEMENT’S DISCUSSION AND ANALYSIS OF FINANCIAL CONDITION AND RESULTS OF OPERATIONS |
This Management’s Discussion and Analysis of Financial Condition and Results of Operations (“MD&A”) should be read in conjunction with Domtar Corporation’s audited consolidated financial statements and notes thereto included in Part II, in Item 8, Financial Statements and Supplementary Data of this Annual Report on Form 10-K. Throughout this MD&A, unless otherwise specified, “Domtar Corporation,” “the Company,” “Domtar,” “we,” “us” and “our” refer to Domtar Corporation and its subsidiaries, as well as its investments. Domtar Corporation’s common stock is listed on the New York Stock Exchange and the Toronto Stock Exchange. Except where otherwise indicated, all financial information reflected herein is determined on the basis of accounting principles generally accepted in the United States (“GAAP”).
In accordance with industry practice, in this report, the term “ton” or the symbol “ST” refers to a short ton, an imperial unit of measurement equal to 0.9072 metric tons. The term “metric ton” or the symbol “ADMT” refers to an air dry metric ton and the term “MFBM” refers to million foot board measure. In this report, unless otherwise indicated, all dollar amounts are expressed in U.S. dollars, and the term “dollars” and the symbol “$” refer to U.S. dollars. In the following discussion, unless otherwise noted, references to increases or decreases in income and expense items, prices, contribution to net earnings (loss), and shipment volume are based on the fifty-two weektwelve month periods ended December 31, 2009, December 31, 20082011, 2010 and December 30, 2007.2009. The fifty-two weektwelve month periods are also referred to as 2009, 20082011, 2010 and 2007. Starting in 2008, the fiscal year is based on the calendar year and ends December 31.2009.
In 2009,2011, we reported operating income of $615$592 million, an increasea decrease of $1,052$11 million compared to operating loss of $437$603 million in 2008. The increase was primarily2010. This decrease is mainly attributable to the $498 million in alternative fuel tax credits recorded in 2009, partially offset by an aggregate $62 million charge in 2009 attributable to theincreased asset impairment and write-down of property, plant and equipment compared to an aggregate $708 million charge for the impairment and write-down of goodwill, property, plant and equipment and intangible assets recorded in 2008. Our 2009 results were negatively impacted by the decrease in our paper business, which experienced a 15% decrease in shipments in 2009 compared to 2008. Our strategy of maintaining our production levels in line with our customer demand has resulted in taking lack-of-order downtime and machine slowdowns of 467,000 tons of paper and 261,000 metric tons of pulp in 2009 compared to 234,000 tons of paper and 100,000 metric tons of pulp in 2008. In 2009, we had lower average selling prices on all our products, as well as lower shipmentsrestructuring charges recorded in 2011, combined with an overall decrease in sales. Our overall sales decreased due to decreased demand in our Pulp and Paper and Distribution segments. The operating profit of 2010 included the net loss on the sale of our wood productsWood business and higher closure and restructuring costs. These factors were partially offset by lower freight costs, lower costs related to maintenance, the favorableour Woodland, Maine mill. In addition, we recorded $25 million of fuel tax credits, which had a positive impact of a weaker Canadian dollar (net ofon our hedging program), the realization of savings stemming from restructuring activitiesresults. Excluding those 2010 items, operating profit improved as well as lower costs related to synergies and integration. The cost of raw materials including wood fiber, energy and chemicals was lower for our Papers segment in 2009 when compared to 2008, and we saw an improvement in our pulp shipments, which experienced a 12% volume increase compared to 2008. Other items impacting comparability of 2009 and 2008 results include the 2009 gains on sale of property, plant and equipment of $7 million compared to 2008 during which we recorded a reversal of a provision for $23 million2010. This is due to the early termination byacquisition of Attends Healthcare Inc., in the counterpartythird quarter of an unfavorable contract2011 and a gain of $6 million related to the sale of certain trademarks.increased sales prices in paper.
These and other factors that affected the year-over-year comparison of financial results are discussed in the year-over-year and segment analysis.
We expect that increased economic activity will partially offsetPrices for pulp are still expected to continue to remain under pressure in certain geographies, while market dynamics in the secularAsian markets are stabilizing. In fine papers, North American demand is expected to decline at a rate of 2-4% in 2012, consistent with long-term forecasts. Any acceleration in employment growth may help mitigate the structural decline in paper demanddemand. Inflation on input costs is expected to be moderate in 20102012.
Closure and that pulp demand will remain strong in the short-term. We should also benefit from the recently announced price increases in the upcoming quarters. The economic recovery has been slow and patchy and we will continue to manage our business conservatively. Due to the seasonality of the business and the impact of the price increases being implemented, we expect to make working capital investments in the first quarter of 2010.
37
Restructuringrestructuring activities
We regularly review our overall production capacity with the objective of aligning our production capacity with anticipated long-term demand.
During the fourth quarter of 2011, we decided to withdraw from one of our U.S. multiemployer pension plans and recorded an estimated withdrawal liability and a charge to earnings of $32 million. We also incurred in the fourth quarter of 2011, a $9 million loss from a pension curtailment associated with the conversion of certain of our U.S defined benefit pension plans to defined contribution pension plans.
Following the permanent closure announced on December 18, 2008 of our Lebel-sur-Quévillon pulp mill and sawmill, we recorded a $4 million loss related to pension curtailment in 2009. Operations at the pulp mill had been indefinitely idled since November 2005 due to unfavorable economic conditions and the sawmill had
been indefinitely idled since 2006. At the time, the pulp mill and sawmill employed 425 and 140 employees, respectively. The declineLebel-sur-Quévillon pulp mill had an annual production capacity of 300,000 metric tons. During 2011, we reversed $2 million of severance and termination provision and following the signing of a definitive agreement (see Item II, Part 8, Financial Statements and Supplementary Data of this Annual Report on Form 10-K, under Note 27 “Subsequent events”), we recorded a $12 million write-down for the remaining fixed assets net book value, a component of Impairment and write-down of property, plant and equipment.
On March 29, 2011, we announced that on July 1, 2011, we would permanently shut down one paper machine at our Ashdown, Arkansas pulp and paper mill. We subsequently postponed the shut down of the paper machine until August 1, 2011. The closure resulted in demandan aggregate pre-tax charge to earnings of approximately $75 million, which included $74 million in non-cash charges relating to the accelerated depreciation of the carrying amounts of manufacturing equipment and the write-off of related spare parts and $1 million related to other costs. This closure reduced Domtar’s annual uncoated freesheet paper production capacity by approximately 125,000 short tons and the mill’s workforce by approximately 110 employees. Operations ceased on August 1, 2011.
On February 1, 2011, we announced the closure of our Langhorne, Pennsylvania forms converting center. The closure resulted in a charge to earnings of $4 million for severance and termination costs. The closure affected 48 employees.
In November 2010, we announced the start up of our new fluff pulp machine in Plymouth, North Carolina, which increased annual fluff pulp making capacity to approximately 444,000 metric tons. The conversion of our Plymouth pulp and paper mill in 2009 accelerated beyondis discussed below.
In July 2010, we announced our original expectationsdecision to end all manufacturing activities at our forms converting plant in Cerritos, California. Operations ceased on July 16, 2010. Approximately 50 plant employees were impacted by this decision.
In March 2010, we announced the permanent closure of our coated groundwood paper mill in Columbus, Mississippi. Operations ceased in April 2010. This measure resulted in the permanent curtailment of approximately 238,000 tons of coated groundwood production capacity per year as well as approximately 70,000 metric tons of thermo-mechanical pulp, and affected approximately 219 employees.
Our Prince Albert pulp and paper mill was closed in the first quarter of 2006 due to poor market conditions and had not been operated since. Our management determined that our Prince Albert facility was no longer a resultstrategic fit, and would not be reopened. On May 3, 2011, we sold our Prince Albert pulp and paper mill to Paper Excellence, and recorded a loss on sale of $12 million in the sharp decline in economic activity earlier in 2009. Accordingly, in 2009 we continued to repurpose facilities.second quarter of 2011.
In February 2009, we announced the permanent shut down of a paper machine at our Plymouth pulp and paper mill, effective at the end of February 2009. This measure resulted in the permanent curtailment of approximately 293,000 tons of paper production capacity per year and affected approximately 185 employees. In October 2009, we announced that we willwould convert our Plymouth pulp and paper mill to 100% fluff pulp production. This conversion will require approximatelyproduction at a cost of $74 million of investment.million. Our annual fluff pulp making capacity will increasehas increased to 444,000 metric tons. The mill conversion which is expected to be completed in the fourth quarter of 2010, will also resultresulted in the permanent shut down of Plymouth’s remaining paper machine with aan annual production capacity of 199,000 tons. The mill conversion will helphelped preserve approximately 360 positions. In connection with this announcement, we recognized $13 million of accelerated depreciation in the fourth quarter of 2009, and we expect to record a further $39 million of accelerated depreciation over the first nine months of 2010 was recorded in relation to the assets that will ceaseceased productive use in October 2010. The remaining assets of this facility have beenwere tested for impairment at the time of this 2009 announcement, and no additional impairment charge was required.
In April 2009, we announced that we would idle our Dryden pulp facility for approximately ten weeks, effective April 25, 2009. This decision was taken in response to continued weak global demand at that time for
pulp and the need to manage inventory levels. In addition, we also idled our former Ear Falls sawmill for approximately seven weeks, effective April 10, 2009, as this sawmill iswas a supplier of chips to our Dryden pulp mill. These temporary measures affected approximately 500 employees at the pulp mill, sawmill and related forestland operations. Our Dryden pulp mill has an annual softwood pulp production capacity of 319,000 metric tons. The former Ear Falls sawmill hashad an annual production capacity of 190 MFBM. Our Dryden pulp mill restarted its pulp production in July 2009. Our former Ear Falls sawmill restarted its operations in August 2009, but we decided to indefinitely idle the sawmill again, effective in the fourth quarter of 2009.
In December 2008, we announced the permanent closure of our Lebel-sur-Quévillon pulp mill. Operations at our Lebel-sur-Quévillon pulp mill had been indefinitely idled in November 2005 due to unfavorable economic conditions. As of November 2005, our Lebel-sur-Quévillon pulp mill had an annual production capacity of approximately 300,000 metric tons and employed approximately 425 employees. In addition, we announced the permanent closure of our Lebel-sur-Quévillon sawmill, which had been indefinitely idled since 2006, at which time it employed approximately 140 employees.
In November 2008, we announced and closed our paper machine and converting operations at our Dryden mill. This measure resulted in the permanent curtailment of approximately 151,000 tons of paper capacity per year and affected approximately 195 employees. Our Dryden pulp production and related forestland activities will remain in operation. Dryden has one pulp line with an annual production capacity of 319,000 metric tons.
In December 2007, we announced the reorganization of our Dryden facility as well as the closure of our Port Edwards mill, effective in the first and second quarters of 2008, respectively. These measures resulted in the curtailment of approximately 336,000 tons of paper capacity per year and affected approximately 625 employees.
We continue to evaluate potential adjustments to our production capacity, which may include additional closures of machines or entire mills, and we could recognize significant cash and/or non-cash charges relating to any such closures in future periods.
THE TRANSACTIONSale of Woodland, Maine hardwood market pulp mill
DomtarOn September 30, 2010, we sold our Woodland hardwood market pulp mill, hydro electric assets and related assets, located in Baileyville, Maine and New Brunswick, Canada. The purchase price was for an aggregate value of $60 million plus net working capital of $8 million. The sale resulted in a gain on disposal of the Woodland, Maine mill of $10 million net of related pension curtailments costs of $2 million.
The Woodland, Maine mill was our only non-integrated hardwood market pulp mill. It had an annual production capacity of 395,000 metric tons and employed approximately 300 people.
Sale of Wood business
On June 30, 2010, we sold our Wood business to EACOM Timber Corporation (“EACOM”), following the obtainment of various third party consents and customary closing conditions, which included approvals of transfers of cutting rights in Quebec and Ontario, for proceeds of $75 million (CDN$80 million) plus elements of working capital of approximately $42 million (CDN$45 million). We received 19% of the proceeds in shares of EACOM representing an approximate 12% ownership interest in EACOM. The sale resulted in a loss on disposal of the Wood business and related pension and other post retirement benefit plan curtailments and settlements of $50 million, which was incorporatedrecorded in the second quarter of 2010 in Other operating (income) loss on August 16, 2006the Consolidated Statement of Earnings. Our investment in EACOM was then accounted for under the equity method.
The transaction included the sale of five operating sawmills: Timmins, Nairn Centre and Gogama in Ontario, and Val-d’Or and Matagami in Quebec; as well as two non-operating sawmills: Ear Falls in Ontario and Ste-Marie in Quebec. The sawmills had approximately 3.5 million cubic meters of annual harvesting rights and a production capacity of close to 900 million board feet. Also included in the transaction was the Sullivan remanufacturing facility in Quebec and our interests in two investments: Anthony-Domtar Inc. and Elk Lake Planning Mill Limited.
In December 2010, in an unrelated transaction, we sold our remaining investment in EACOM Timber Corporation for CDN$0.51 per common share for net proceeds of $24 million (CDN$24 million) resulting in no further gain or loss. We have fiber supply agreements in place with our former wood division at our Espanola facility. Since these continuing cash outflows are expected to be significant to the former Wood business, the sale of the Wood business did not qualify as a discontinued operation under ASC 205-20.
Dividend and Stock Repurchase Program
In 2011, we repurchased 5,921,732 shares at $83.52 for a total of $494 million and paid dividends of $49 million.
Cellulosic Biofuel Credit
In July 2010, the U.S. Internal Revenue Service (“IRS”) Office of Chief Counsel released an Advice Memorandum concluding that qualifying cellulose biofuel sold or used before January 1, 2010, is eligible for the sole purposecellulosic biofuel producer credit (“CBPC”) and would not be required to be registered by the Environmental Protection Agency. Each gallon of holdingqualifying cellulose biofuel produced by any taxpayer operating a pulp and paper mill and used as a fuel in the Weyerhaeuser Fine Paper Businesstaxpayer’s trade or business during calendar year 2009 would qualify for the $1.01 non-refundable CBPC. A taxpayer could be able to claim the credit on its federal income tax return for the 2009 tax year upon the receipt of a letter of registration from the IRS and consummatingany unused CBPC could be carried forward until 2015 to offset a portion of federal taxes otherwise payable.
We had approximately 207 million gallons of cellulose biofuel that qualified for this CBPC for which we had not previously claimed under the combinationAlternative Fuel Mixture Credit (“AFMC”) that represented approximately $209 million of CBPC or approximately $127 million of after tax benefit to the Weyerhaeuser Fine Paper BusinessCorporation. In July 2010, we submitted an application with Domtar Inc. (the “Transaction”). The Weyerhaeuser Fine Paper Business was operated by Weyerhaeuser Companythe IRS to be registered for the CBPC and on September 28, 2010, we received our notification from the IRS that we were successfully registered. On October 15, 2010 the IRS Office of Chief Counsel issued an Advice Memorandum concluding that the AFMC and CBPC could be claimed in the same year for different volumes of biofuel. In November 2010, we filed an amended 2009 tax return with the IRS claiming a cellulosic biofuel producer credit of $209 million and recorded a net tax benefit of $127 million in Income tax expense (benefit) on the Consolidated Statement of Earnings for December 31, 2010. As of December 31, 2011, approximately $25 million of this credit remains to offset future U.S. federal income tax liability.
Valuation Allowances
38
(“Weyerhaeuser”)In 2011, we recorded a valuation allowance of $4 million related to state tax credits in U.S. that we expect to expire prior to utilization. This impacted the completion ofU.S. and overall consolidated effective tax rate for 2011.
In 2010, we released the Transaction.valuation allowance on our Canadian net deferred tax assets during the fourth quarter. The Transactionfull $164 million valuation allowance balance that existed at January 1st, 2010 was consummated on March 7, 2007. Domtar Corporation had no operations prior to March 7, 2007 when, upon the completion of the Transaction, it became an independent public holding company that, directlyeither utilized during 2010 or indirectly through its subsidiaries, owns the Weyerhaeuser Fine Paper Business and Domtar Inc. We refer to Domtar Corporation, as of the consummation of the Transaction, as the “Successor.”
Although Weyerhaeuser does not have a continuing proprietary interest in Domtar Corporation, we have entered into several agreements with Weyerhaeuser and/or certain of its subsidiaries in connection with the Transaction, including a tax sharing agreement, an intellectual property licensing agreement, a transition services agreement, fiber and pulp supply agreements and site services agreements. These agreements enabled us to continue to operate the Weyerhaeuser Fine Paper Business efficiently following the completion of the Transaction. Atreversed at the end of 2008,2010 based on future projected income, which impacted the majority of the transition services was completedCanadian and the remainder of the transition services agreement was completed in early 2009.
The following MD&A of Domtar Corporation covers periods prior to the Transaction. For accounting and financial reporting purposes, the Weyerhaeuser Fine Paper Business is considered to be the “Predecessor” to Domtar Corporation and as a result, its historical financial statements now constitute the historical financial statements of Domtar Corporation. Accordingly, the results reported for the year ended 2009 and 2008 include the results of the Successor for the entire period and those reported for 2007 include the results of operations of the Weyerhaeuser Fine Paper Business, on a carve-out basis, for the period from January 1, 2007 to March 6, 2007 and the results of operations of the Successor for the period from March 7, 2007 to December 30, 2007. These historical financial statements may not be indicative of our future performance.overall consolidated effective tax rate.
ACCOUNTING FOR THE TRANSACTIONAlternative Fuel Tax Credits
The TransactionU.S. Internal Revenue Code of 1986, as amended (the “Code”) permitted a refundable excise tax credit, until the end of 2009, for the production and use of alternative bio fuel mixtures derived from biomass. We submitted an application with the IRS to be registered as an alternative fuel mixer and received notification that our registration had been accepted in late March 2009. We began producing and consuming alternative fuel mixtures in February 2009 at our eligible mills. Although the credit ended at the end of 2009, in 2010, we recorded $25 million of such credits in Other operating (income) loss on the Consolidated Statement of Earnings (Loss) compared to $498 million in 2009. The $25 million represented an adjustment to amounts presented as deferred revenue at December 31, 2009 and was considered, for accounting purposes, asreleased to income following guidance issued by the acquisitionIRS in March 2010. We recorded an income tax expense of Domtar Inc. by Domtar Corporation and has been accounted for using the purchase method of accounting. Accordingly, the purchase price was based upon the estimated fair value of Domtar Corporation common stock issued$7 million in addition2010 compared to acquisition costs directly$162 million in 2009 related to the Transaction. Since no quoted market price existedalternative fuel mixture income. The amounts for the shares of Domtar Corporation’s common stock, the purchase price wasrefundable credits were based on the fair valuevolume of thealternative bio fuel mixtures produced and burned during that period.
In 2009, we received a $140 million cash refund and another $368 million cash refund, net assets acquired on August 23, 2006, the date on which the terms of the Transaction were agreed to and announced. The fair value of Domtar Inc. common shares of $79.56 per share usedfederal income tax offsets, in the calculation of the purchase price was based upon the average closing price of Domtar Inc. common shares on the Toronto Stock Exchange for the five trading days beginning August 21, 2006 and ending August 25, 2006, converted at the average daily foreign exchange rate of the Bank of Canada. The number of outstanding Domtar Inc. common shares used2010. Additional information regarding unrecognized tax benefits is included in the calculation of the fair value was based on the same periods.
For more information on the accounting for the Transaction, refer to Note 3 ofPart II, Item 8, Financial Statements and Supplementary Data of this Annual Report on Form10-K.Form 10-K, under Note 10 “Income taxes.”
Although we do not expect a significant change in our unrecognized tax benefits associated with the alternative fuel tax credits from 2009 during the next 12 months, a favorable audit by the IRS or the issuance of authoritative guidance could result in the recognition of some or all of these previously unrecognized tax benefits. As of December 31, 2011, we have gross unrecognized tax benefits and interest of $192 million and related deferred tax assets of $15 million associated with the alternative fuel tax credits. The recognition of these benefits, $177 million net of deferred taxes, would impact the effective tax rate.
Acquisition of Attends Healthcare Limited
On January 26, 2012, we announced the signing of a definitive agreement for the acquisition of privately-held Attends Healthcare Limited (“Attends Europe”), a manufacturer and supplier of adult incontinence care products in Europe, from Rutland Partners. The purchase price is estimated at $236 million (£180 million), including assumed debt. Attends Europe operates a manufacturing, research and development and distribution facility in Aneby, Sweden, and also operates distribution centers in Scotland and Germany. Attends Europe has approximately 413 employees. The transaction is expected to close during the first quarter of 2012, subject to customary closing conditions. The acquired business will be presented under our new reporting segment, “Personal Care”.
Sale of Lebel-sur-Quévillon assets
On January 31, 2012, we announced the signing of a definitive agreement with Fortress Global Cellulose Ltd (“Fortress”), and with a subsidiary of the Government of Quebec, for the sale of our Lebel-sur-Quévillon assets. The transaction is subject to customary closing conditions and is expected to close in the second quarter of 2012. All pulp and sawmilling assets including the buildings and equipment will be sold to Fortress for the nominal sum of $1 and all lands related to the facilities will be sold to a subsidiary of the Government of Quebec for the nominal sum of $1. The manufacturing operations at the pulp mill ceased in November 2005 due to unfavorable economic conditions while sawmilling operations at the facility ceased in 2006.
Tender offer for certain outstanding notes
On February 22, 2012, we announced the commencement of a cash tender offer for our outstanding 10.75% Notes due 2017 (the “First Priority Notes”), 9.5% Notes due 2016 (the “Second Priority Notes”), 7.125% Notes due 2015 (the “Third Priority Notes”) and 5.375% Notes due 2013 (the “Fourth Priority Notes”) such that the maximum aggregate consideration for Notes purchased in the tender offer, excluding accrued and unpaid interest, which will not exceed $250 million. The tender offer is scheduled to expire at 12:00 midnight, New York City time, on March 20, 2012, unless extended or earlier terminated.
We may waive, increase or decrease the maximum payment amount at our sole discretion. Our obligation to consummate the tender offer is conditioned upon the satisfaction or waiver of certain conditions, including obtaining approximately $250 million of proceeds from a debt financing, on terms and conditions reasonably satisfactory to us, at or before the expiration date of the tender.
Our reporting segments correspond toWe operate the following business activities: Papers,Pulp and Paper Merchants(previously named “Papers”), Distribution (previously named “Paper Merchants”) and Wood.Personal Care. A description of our business is included in Part I, Item 1, Business of this Annual Report on Form 10-K.
PapersPulp and Paper
We produce 4.3 million metric tons of hardwood, softwood and fluff pulp at 12 of our 13 mills. The majority of our pulp is consumed internally to manufacture paper and consumer products, with the balance being sold as market pulp. We also purchase papergrade pulp from third parties allowing us to optimize the logistics of our pulp capacity while reducing transportation costs.
We are the largest integrated manufacturer and marketer of uncoated freesheet paper in North America and the second largest in the world based on production capacity. In uncoated freesheet, weAmerica. We have 10 pulp and paper mills in operation (eight in the United States and two in Canada), with an annual paper production capacity of approximately 3.93.5 million tons of uncoated freesheet paper, after giving effect to the conversion of our Plymouth facility to 100% fluff pulp production in 2010. In addition, we have an annual production capacity of
39
238,000 tons of coated groundwood at our Columbus paper mill.paper. Our paper manufacturing operations are supported by 15 converting and distribution operations including a network of 12 plants located offsite of our paper making operations. Also, we have forms manufacturing operations at three of theone offsite converting and distribution operations and two stand-alone forms manufacturing operations.
We design, manufacture, market and distribute a wide range of fine paper products for a variety of consumers, including merchants, retail outlets, stationers, printers, publishers, converters and end-users. Approximately 81%78% of our paper production capacity is domesticin the U.S., and the remaining 19%22% is located in Canada. We also manufacture and sellproduce market pulp in excess of our internal requirements at our three non-integrated pulp mills in Kamloops, Dryden, and we purchase papergrade pulp from third parties allowing us to optimize the logistics ofPlymouth as well as at our pulp capacity while reducing transportation costs.and paper mills in Espanola, Ashdown, Hawesville, Windsor, Marlboro and Nekoosa. We have the capacity to sell to third parties approximately 1.91.7 million metric tons of pulp per year depending on market conditions, after giving effect to the conversion of our Plymouth facility to 100% fluff pulp production in 2010.conditions. Approximately 51%43% of our trade pulp production capacity is domesticin the U.S., and the remaining 49%57% is located in Canada.
Paper MerchantsDistribution
Our Paper MerchantsDistribution business consists of an extensive network of strategically located paper distribution facilities, comprisinginvolves the purchasing, warehousing, sale and distribution of our various products and those of other manufacturers. These products include business, printing and printingpublishing papers and certain industrial products. These products are sold to a wide and diverse customer base, which includes small, medium and large commercial printers, publishers, quick copy firms, catalog and retail companies and institutional entities.
Our paper merchants operateDistribution business operates in the United States and Canada under a single banner and umbrella name, the Domtar Distribution Group. Ris Paper, part of the Domtar Distribution Group,Ariva. Ariva operates throughout the Northeast, Mid-Atlantic and Midwest areas from 2017 locations in the United States, including 1613 distribution centers serving customers across North America. In Canada, Domtar Distribution GroupThe Canadian business operates as Buntin Reid in threetwo locations in Ontario; JBR/La Maison du Papier inOntario, two locations in Quebec; and The Paper House infrom two locations in Atlantic Canada.
Sales are executed by our sales force, based at branches strategically located in served markets. We distribute about 51% of our paper sales from our own warehouse distribution system and approximately 49% of our paper sales through mill-direct deliveries (i.e., deliveries directly from manufacturers, including ourselves, to our customers).
Personal Care
Our Personal Care business sells and markets a complete line of high quality and innovative adult incontinence products and distributes disposable washcloths marketed primarily under the Attends® brand name. We are one of the leading suppliers of adult incontinence products sold into North American hospitals (acute care) and nursing homes (long-term care) and we have a strong and growing presence in the domestic homecare and retail channels. We operate nine different production lines to manufacture our products, with all nine lines having the ability to produce multiples items within each category.
Wood
OurBefore the sale of our Wood business compriseson June 30, 2010, our Wood business comprised the manufacturing, marketing and distribution of lumber and wood-based value-added products, and the management of forest resources. We operateoperated seven sawmills with a production capacity of approximately 890900 million board feet of lumber and one remanufacturing facility. We also have investments in two companies. We seek to optimize the 31 million acres of forestland we directly license or own in Canada and the United States through efficient management and the application of certified sustainable forest management practices to help ensure that a continuous supply of wood is available for future needs.
40
CONSOLIDATED RESULTS OF OPERATIONS AND SEGMENTSEGMENTS REVIEW
The following table includes the consolidated financial results of Domtar Corporation for the yearyears ended December 31, 2009, December 31, 20082011, 2010 and December 30, 2007. The year 2007 consists of the consolidated financial results of the Weyerhaeuser Fine Paper Business, on a carve-out basis, from January 1, 2007 to March 6, 2007 and of the Successor for the period from March 7, 2007 to December 30, 2007.2009:
| Year ended December 31, 2009 | Year ended December 31, 2008 | Year ended December 30, 2007 | ||||||||||||||||||||||
FINANCIAL HIGHLIGHTS | December 31, 2011 | December 31, 2010 | December 31, 2009 | |||||||||||||||||||||
| (In millions of dollars, unless otherwise noted) | ||||||||||||||||||||||||
| (In millions of dollars, unless otherwise noted) | ||||||||||||||||||||||||
Sales | $ | 5,465 | $ | 6,394 | $ | 5,947 | $ | 5,612 | $ | 5,850 | $ | 5,465 | ||||||||||||
Operating income (loss) | 615 | (437 | ) | 270 | ||||||||||||||||||||
Net earnings (loss) | 310 | (573 | ) | 70 | ||||||||||||||||||||
Net earnings (loss) per common share (in dollars)1: | ||||||||||||||||||||||||
Operating income | 592 | 603 | 615 | |||||||||||||||||||||
Net earnings | 365 | 605 | 310 | |||||||||||||||||||||
Net earnings per common share (in dollars) 1: | ||||||||||||||||||||||||
Basic | 7.21 | (13.33 | ) | 1.77 | 9.15 | 14.14 | 7.21 | |||||||||||||||||
Diluted | 7.18 | (13.33 | ) | 1.76 | 9.08 | 14.00 | 7.18 | |||||||||||||||||
Operating income (loss) per segment: | ||||||||||||||||||||||||
Papers | $ | 650 | $ | (369 | ) | $ | 321 | |||||||||||||||||
Paper Merchants | 7 | 8 | 13 | |||||||||||||||||||||
Pulp and Paper | $ | 581 | $ | 667 | $ | 650 | ||||||||||||||||||
Distribution | — | (3 | ) | 7 | ||||||||||||||||||||
Personal Care | 7 | — | — | |||||||||||||||||||||
Wood | (42 | ) | (73 | ) | (63 | ) | — | (54 | ) | (42 | ) | |||||||||||||
Corporate | — | (3 | ) | (1 | ) | 4 | (7 | ) | — | |||||||||||||||
|
|
| ||||||||||||||||||||||
Total | $ | 615 | $ | (437 | ) | $ | 270 | $ | 592 | $ | 603 | $ | 615 | |||||||||||
| At December 31, 2009 | At December 31, 2008 | At December 30, 2007 | At December 31, 2011 | At December 31, 2010 | At December 31, 2009 | |||||||||||||||||||
Total assets | $ | 6,519 | $ | 6,104 | $ | 7,726 | $ | 5,869 | $ | 6,026 | $ | 6,519 | ||||||||||||
Total long-term debt, including current portion | $ | 1,712 | $ | 2,128 | $ | 2,230 | $ | 841 | $ | 827 | $ | 1,712 | ||||||||||||
|
|
| ||||||||||||||||||||||
| 1 | Refer to Part II, Item 8, Financial Statements and Supplementary Data on this Annual Report on Form 10-K, under Note 6 |
41
YEAR ENDED DECEMBER 31, 20092011 VERSUS
YEAR ENDED DECEMBER 31, 20082010
Sales
Sales for 20092011 amounted to $5,465$5,612 million, a decrease of $929$238 million, or 15%4%, from sales of $6,394$5,850 million in 2008.2010. The decrease in sales wasis mainly attributable to lower shipmentsthe closure of our Columbus, Mississippi paper mill, the sale of our Woodland, Maine market pulp mill in 2010 ($150 million) and the sale of our Wood business in 2010 ($139 million). In addition, volumes for paper ($612 million), reflecting softer market demand for uncoated freesheet in our paper business, which declined approximately 15% when compared to 2008, lower average selling prices for pulp and paper decreased ($239 million29 million) and $30 million, respectively)our Distribution segment decreased ($118 million) as a result of the sale of a business unit in the first quarter of 2011 and from difficult market conditions. This decrease was slightly offset by the increase in sales due to the acquisition of Attends Healthcare Inc., lower shipments for our wood productsin 2011 ($71 million), and lower averageslightly higher selling prices ($34 million and $15 million , respectively) as well as lower deliveries forin all our Paper Merchants business. These factors were partially offset by higher shipments for pulpsegments ($11783 million) reflecting an increase of 12% when compared to 2008..
Cost of Sales, excluding Depreciation and Amortization
Cost of sales, excluding depreciation and amortization, amounted to $4,472$4,171 million in 2009,2011, a decrease of $753$246 million, or 14%6%, compared to cost of sales, excluding depreciation and amortization, of $5,225$4,417 million in 2008.2010. This decrease wasis mainly attributable to the impact of lower shipments for paperin our Pulp and Paper ($427140 million), lower freight due to the sale of our Woodland, Maine market pulp mill and Distribution segment ($113 million) due to the sale of a business unit, and the sale of our Wood business ($131 million). In addition, there were decreased maintenance costs ($8834 million), lower costs for maintenanceenergy and fiber ($8633 million and $12 million, respectively). These factors were offset by the acquisition of Attends Healthcare Inc., ($56 million), increased costs for chemicals and freight ($60 million and $33 million, respectively) and the favorablenegative impact of a weakerstronger Canadian dollar on our Canadian denominated expenses, net of our hedging program ($7837 million), lower costs for raw materials, including fiber ($31 million), energy ($22 million) and chemicals ($15 million), and the realization of savings stemming from restructuring activities. These factors were partially offset by higher shipments for pulp ($128 million), higher costs related to the increase in lack-of-order downtime and machine slowbacks ($109 million) as well as higher costs for our variable compensation program. In the first quarter of 2008, we also recorded the reversal of a provision for $23 million due to the early termination by the counterparty of an unfavorable contract..
Depreciation and Amortization
Depreciation and amortization amounted to $405$376 million in 2009,2011, a decrease of $58$19 million, or 13%5%, compared to depreciation and amortization of $463$395 million in 2008.2010. This decrease is primarily due to the implementationsale of restructuring activities in 2008 which resulted in impairment charges and write-down of property, plant and equipmentour Wood business in the fourthsecond quarter of 2008 at2010, the sale of our Dryden facility as well as impairment charges at our Columbus paperWoodland, Maine market pulp mill in the third quarter of 2010 and write-down of property, plant and equipment for accelerated depreciation due to the permanent closure of a paper machine at our Ashdown, Arkansas pulp and paper mill in the firstthird quarter of 2009 at our Plymouth pulp and paper. The decrease was also influenced2011, partially offset by the favorable impactacquisition of a weaker Canadian dollar in 2009 when compared to 2008.Attends of $4 million.
Selling, General and Administrative Expenses
SG&A expenses amounted to $345$340 million in 2009, a decrease2011, an increase of $55$2 million, or 14%1%, compared to SG&A expenses of $400$338 million in 2008.2010. This decreaseincrease in SG&A is primarily due to integration costsa post-retirement curtailment gain of $10 million recorded in 20082010, related to the harmonization of certain of our post-retirement benefit plans and the acquisition of Attends in 2011 ($324 million) not recurring in 2009, the favorable impact of a weaker Canadian dollar ($13 million) as well as lower overall expenses resulting from cost reduction initiatives. These factors were partially. This is offset by higher costsa decrease of $12 million related to our variable compensation program.short-term incentive plan.
Other Operating Income(Income) Loss
Other operating income amounted to $497$4 million in 2009,2011, an increase of $489$24 million compared to other operating incomeloss of $8$20 million in 2008.2010. This increase in other operating income is primarily due to net gains of $6 million from the sale of property, plant and equipment and businesses compared to a $33 million net loss in 2010 which was driven by a gain on sale of our Woodland, Maine market pulp mill of $10 million, offset by a loss on sale of our wood business of $50 million. Also, in 2010, other operating loss included a refundable excise tax credit for the production and use of alternative bio fuel mixtures of $498$25 million recognizedwhich did not recur in 2009 as
422011.
well as gains on sales of land recorded in 2009 ($7 million), partially offset by a gain of $6 million related to the sale of trademarks recorded in the second quarter of 2008.
Operating Income (Loss)
Operating income in 20092011 amounted to $615$592 million, an increasea decrease of $1,052$11 million compared to operating lossincome of $603 million in 2008 of $437 million, primarily2010, in part due to the alternative fuel tax credits recorded in 2009, partially offset by an aggregate $62 million charge in 2009 forfactors mentioned above, as well as higher impairment and write-down of property, plant and equipment compared($35 million), due to accelerated depreciation related to the announced closure of a $325 million charge forpaper machine at our Ashdown, Arkansas pulp and paper mill and the impairment of goodwillassets at our Lebel-sur-Quévillion, Quebec mill, and intangible assets recordedhigher closure and restructuring costs ($25 million) in 2011 primarily due to the fourth quarterwithdrawal from one of 2008,our U.S. multiemployer pension plans and a $383 million charge forrecorded loss from a pension curtailment associated with the impairment and write-down on property, plant and equipment in 2008.conversion of certain of our U.S. defined benefit pension plans to defined contribution plans. Additional information about impairment and write-down charges is included under the section “Impairment of Long-Lived assets,” under the caption “Critical Accounting Policies” of this MD&A. The increase is also attributable to the factors mentioned above. This increase was partially offset by higher closure and restructuring costs ($20 million) in 2009 when compared to 2008. The increase in closure and restructuring costs is primarily due to the aforementioned closure of one paper machine at our Plymouth pulp and paper mill in the first quarter of 2009 and the subsequent announcement in October 2009 of its conversion to 100% fluff pulp production, expected to be effective in the fourth quarter of 2010, as well as the closure of our paper machine at our Dryden pulp and paper mill effective in the fourth quarter of 2008.
Interest Expense
We incurred $125$87 million of net interest expense in 2009,2011, a decrease of $8$68 million compared to interest expense of $133$155 million in 2008.2010. This decrease in interest expense is primarily due to a gainthe repurchase of $15 million related to the reduction of the fair value increment associated with the portion of theour 5.375%, 7.125% and 7.875% Notes we repurchased in the second quarter of 2009, lower long-term debt due toand our repurchase of $60 million and $400 million aggregate principal amount of our outstanding 7.875% Notes due 2011,term loan in the fourth quarter of 20082010, on which we incurred tender offer premiums of $35 million, and second quarter of 2009, respectively, as well as lower interest rates in 2009 compared to 2008 with respect to our tranche B term loan. These factors were partially offset by interest expense from the issuance of the 10.75% Notes due 2017 in the second quarter of 2009, a $4 million premium paidnet loss on the repurchasereversal of our 7.875% Notes due 2011 in the second quartera fair value decrement of 2009 as well as tender expenses of $1$12 million.
Income Taxes
For 2009,2011, our income tax expense amounted to $180$133 million compared to $3 million for 2008.
The following table provides income tax expense by jurisdiction for 2009 and 2008:
| Year ended December 31, 2009 | Year ended December 31, 2008 | |||||||||||||||||||||||
JURISDICTION | U.S. | Canada | Total | U.S. | Canada | Total | ||||||||||||||||||
| (In million of dollars, unless otherwise noted) | ||||||||||||||||||||||||
Income (loss) before income taxes | $ | 560 | $ | (70 | ) | $ | 490 | $ | 15 | $ | (585 | ) | $ | (570 | ) | |||||||||
Income tax (benefit) expense | 180 | — | 180 | 34 | (31 | ) | 3 | |||||||||||||||||
Effective tax rate | 32 | % | — | % | 37 | % | 227 | % | 5 | % | (1 | )% | ||||||||||||
During 2009, we recorded a net liability of $162 million for unrecognized income tax benefits associated with the alternative fuel mixture tax credits income. If our income tax positions with respect to the alternative fuel mixture tax credits are sustained, either all or in part, then we would recognize a tax benefit in the future equal to the amount of the benefits sustained. We do not expect any material changes to the amount of these benefits to occur within the next 12 months. Our tax treatment of the income related to the alternative fuel mixture tax credits resulted in the recognition of a tax benefit of $36$157 million for 2010.
During 2011, we have a significantly larger manufacturing deduction in the U.S. than in prior years since we utilized our remaining federal net operating loss carryforward in 2010. This deduction resulted in a tax benefit of $12 million which impacted the effective tax rate for 2011. We also recorded a $16 million tax benefit related to federal, state, and provincial credits and special deductions which reduced the effective tax rate for 2011. Additionally, we recognized a state tax benefit of $3 million due to the U.S. restructuring cost that impacted the 2011 effective tax rate by reducing state income tax expense.
During 2010, we recorded $25 million of income related to alternative fuel tax credits in Other operating (income) loss on the Consolidated Statement of Earnings. The $25 million represented an adjustment to amounts presented as deferred revenue at December 31, 2009 and was released to income following guidance issued by the IRS in March 2010. This income resulted in an income tax benefit of $9 million and an additional liability for uncertain income tax positions of $7 million, both of which impacted the U.S. effective tax rate. Our current expectation is that this credit will not be availablerate for 2010. Additionally, we recorded a net tax benefit of $127 million from claiming a CBPC in 2010 and thus is not expected to impact our($209 million of CBPC net of tax expense of $82 million), which also impacted the U.S. effective tax rate inrate. Finally, we released the future unless new legislation is introduced and passed. The Canadian effective tax rate was impacted by the additional valuation allowance recorded against newon its Canadian net deferred tax assets induring the amountfourth quarter of $29 million.
43
During 2008, we recorded a non-tax deductible goodwill impairment charge2010. The full $164 million valuation allowance balance that existed at January 1, 2010 was either utilized during 2010 or reversed at the end of $321 million and as a result, both2010 based on future projected income, which impacted the Canadian and U.S.overall consolidated effective tax rates were impacted. The Canadian effective tax rate was also impacted byrate.
Equity Earnings
We incurred a valuation allowance taken on the$7 million loss, net Canadian deferred tax assets in the amount of $52 million.taxes, with regards to our joint venture with Celluforce Inc.
Net Earnings (Loss)
Net earnings amounted to $310$365 million ($7.189.08 per common share on a diluted basis) in 2009, an increase2011, a decrease of $883$240 million compared to net lossearnings of $573$605 million ($13.3314.00 per common share on a diluted basis) in 20082010, mainly due to the charge for impairment of goodwill, property, plant and equipment and intangible assets recorded in the fourth quarter of 2008, as well as the other factors mentioned above.
FOURTH QUARTER OVERVIEW
For the fourth quarter of 2009,2011, we reported operating income of $203$99 million, an increasea decrease of $922$56 million compared to operating lossincome of $719$155 million in the fourth quarter of 2008. This increase is mainly attributable2010. Overall, our core operating results for the fourth quarter of 2011 declined when compared to the alternative fuel tax credits recordedfourth quarter of 2010, primarily due to our Pulp and Paper segment. Sales prices declined quarter over quarter for pulp. Volume for paper decreased in the fourth quarter and volumes for our Distribution segment decreased as a result of 2009 ($162 million pre-tax) partially offset by an aggregate $27 million chargethe sale of a business unit earlier in the fourth quarter2011. The overall cost of 2009 forchemicals and fiber also increased. Other items significantly impacting our operating income comparability are increased impairment and write-down of property, plant and equipment primarily associated withof $12 million due to the accelerated depreciationwrite-off of the aforementioned reorganization of our Plymouth pulp and paper mill in the fourth quarter of 2009 and an impairment charge related to our Prince Albert facility, compared to an aggregate $708 million charge for the impairment and write-down of goodwill, property, plant and equipment and intangible assets recorded in the fourth quarter of 2008 mostly associated with the closure of the paper machine at our Dryden pulp and paperLebel-sur-Quévillon, Quebec mill and the goodwill impairmentincreased closure and restructuring costs of our Papers business. Overall, our operating results for the fourth quarter of 2009 improved when compared$37 million relating primarily to the fourth quarterrestructuring of 2008, primarily due tocertain U.S. pension benefit plans. These factors were offset by lower costs for raw materials including chemicals, fiberenergy and energy, lower freight costs, higher shipments for pulpmaintenance and lower maintenance costs. These factors were partially offset by lower average selling prices and lower shipments for paper as well as the unfavorablepositive impact of a strongerthe weakening Canadian dollar, net of our hedging program.dollar.
Our effective tax rate in the fourth quarter of 20092011 of 25%14% was primarily impacted by the continued alternative fuelresult of additional federal, state, and provincial credits and special deductions, state income tax credits that expired on December 31, 2009.benefits due to U.S. restructuring activity, and the mix of income between U.S. and foreign jurisdictions being subject to different rates. All three of these items resulted in tax benefits which reduced the effective tax rate in the fourth quarter.
YEAR ENDED DECEMBER 31, 20082010 VERSUS
YEAR ENDED DECEMBER 30, 200731, 2009
Sales
Sales for 20082010 amounted to $6,394$5,850 million, an increase of $447$385 million, or 8%7%, from sales of $5,947$5,465 million in 2007 in part due to the acquisition of Domtar Inc. on March 7, 2007.2009. The increase in sales was alsomainly attributable to higher average selling prices for pulp and paper ($346375 million and $145 million, respectively) as well as higher shipments for pulp ($68 million)., reflecting stronger market demand for pulp for the first half of 2010. These factors were partially offset by lower shipments for paper ($151 million) reflecting a decrease of 4% when compared to 2009 mostly due to the closure of our Columbus, Mississippi paper mill and the conversion to 100% fluff pulp production of our Plymouth pulp and paper ($495 million), reflecting softer shipments for uncoated freesheetmill. The sale of our Wood business in our paper business, which declined approximately 10% when compared to the previous year, and the implementationsecond quarter of further restructuring activities2010 also partially offset this increase in 2008 (refer to the section Restructuring activities, above) as well as lower shipments and lower average selling prices for our wood products ($36 million and $6 million, respectively).sales.
Cost of Sales, excluding Depreciation and Amortization
Cost of sales, excluding depreciation and amortization, amounted to $5,225$4,417 million in 2008, an increase2010, a decrease of $468$55 million, or 10%1%, compared to cost of sales, excluding depreciation and amortization, of $4,757$4,472 million in 2007, in part2009. This decrease was mainly attributable to lower shipments for paper ($151 million), lower chemical and energy costs ($55 million and $25 million, respectively) as well as due to the acquisition of Domtar Inc. on March 7, 2007. This increase was also attributable to
44
higher costs related to the increase in lack-of-order downtime and machine slowbacks ($67 million), higher costs for raw materials, including fiber ($121 million), chemicals ($78 million) and energy ($64 million), and higher freight costs ($46 million) as well as the negative impact on costs of a stronger Canadian dollar, netsale of our hedging programWood business ($3373 million). in the second quarter of 2010. These factors were partially offset by lowerhigher shipments for paper and pulp ($36168 million), the reversal of a provision for $23 million due to the early termination by the counterparty of an unfavorable contract in the first quarter of 2008, lowerhigher maintenance costs for maintenance ($2183 million), higher fiber costs ($23 million), higher freight costs ($34 million) and the realizationunfavorable impact of savings stemming from restructuring activities.a stronger Canadian dollar on our Canadian denominated expenses, net of our hedging program ($46 million).
Depreciation and Amortization
Depreciation and amortization amounted to $463$395 million in 2008,2010, a decrease of $8$10 million, or 2%, compared to depreciation and amortization of $471$405 million in 2007.2009. This decrease iswas primarily due to the completionsale of our purchase price allocationWood business in the fourthsecond quarter of 2007 affecting2010 and by the valuationwrite-down of property, plant and equipment acquireddue
to the permanent closure of a paper machine and manufacturing equipment in the Transaction, which reducedfirst and last quarters of 2009 at our depreciationPlymouth pulp and amortization expense, and the implementation of further restructuring activities in 2008.paper mill. These factors were partially offset by the acquisitionnegative impact of Domtar Inc. on March 7, 2007.a stronger Canadian dollar in 2010 when compared to 2009.
Selling, General and Administrative Expenses
SG&A expenses amounted to $407$338 million in 2008,2010, a decrease of $1$7 million, or 2%, compared to SG&A expenses of $408$345 million in 2007.2009. This decrease in SG&A iswas primarily due to lower integration costsa post-retirement curtailment gain of $10 million related to the harmonization of certain of our post-retirement benefit plans. These factors were partially offset by the negative impact of a stronger Canadian dollar in 20082010 when compared to 2007, lower overall expenses resulting from cost reduction initiatives and reduced variable employee compensation costs2009.
Other Operating (Income) Loss
Other operating loss amounted to $20 million in 2008 due to2010, a decrease in our financial results when compared to 2007. These factors were mainly offset by the acquisition of Domtar Inc. on March 7, 2007.
Other Operating Income
Otherother operating income amounted to $15 million in 2008, a decrease of $54$517 million compared to other operating income of $69$497 million in 2007. Other2009. This decrease in other operating income was primarily due to a refundable excise tax credit for the production and use of alternative bio fuel mixtures of $25 million recognized in 2008 included2010 compared to $498 million recognized in 2009 as well as due to a loss on sale of our Wood business of $50 million recorded in 2010, partially offset by a gain related to theon sale of certain trademarks ($6 million), foreign exchange impact on working capital items ($5 million) and net gain on disposalour Woodland, Maine market pulp mill of fixed assets ($3 million). Other operating income$10 million recorded in 2007 included a gain of $51 million related to lawsuit and insurance settlement claims and mark-to-market gains on financial instruments of $18 million.2010.
Operating Income (Loss)
Operating lossincome in 20082010 amounted to $437$603 million, a decrease of $707$12 million compared to operating income of $615 million in 2007 of $270 million, primarily2009, in part due to a $325 million charge for the impairmentfactors mentioned above, partially offset by lower closure and restructuring costs due to the closure of goodwillone paper machine at our Plymouth pulp and intangible assets recordedpaper mill in the first quarter of 2009 and the subsequent announcement in the fourth quarter of 2008, compared2009 of its conversion to $4 million100% fluff pulp production. The decrease in the fourth quarter of 2007, and a $383operating income was also partially offset by an aggregate $50 million charge in 2010 for the impairment and write-down onof property, plant and equipment, in 2008, compared to $92a $62 million charge in 2009. Additional information about impairment and write-down charges is included under the fourth quartersection “Impairment of 2007. The decrease is also attributable toLong-Lived assets,” under the factors mentioned above as well as higher closure and restructuring costs ($29 million) in 2008. The increase in closure and restructuring costs is primarily due to the closurecaption “Critical Accounting Policies” of the paper machine at our Dryden pulp and paper mill, the closure of our Lebel-sur-Quévillon pulp mill and sawmill and the dismantling cost of a paper machine in 2008. These factors were partially offset by the acquisition of Domtar Inc. on March 7, 2007.this MD&A.
Interest Expense
We incurred $133$155 million of interest expense in 2008, a decrease2010, an increase of $38$30 million compared to interest expense of $171$125 million in 2007.2009. This decreaseincrease in interest expense is mainlywas primarily due to a charge of $47 million incurred on the repurchase of the 5.375%, 7.125% and 7.875% Notes in 2010, which included tender premiums and fees of $35 million and a net loss on the reversal of a fair value decrement of $12 million, as compared to a gain of $15 million related to the repurchase of the 7.875% Notes in 2009. This increase was partially offset by a lower long-term debt due to the repayment of ourbalance outstanding Canadian dollar debentures and a portion of our Tranche B term loan, lower interest rates in 20082010 compared to 2007 and a gain of $12 million on debt repurchased in the fourth quarter of 2008. These factors were partially offset by interest expense in the first quarter of 2007 including only 26 days of interest resulting from both the Transaction financing and interest on Domtar Inc. debt.2009.
45
Income Taxes
For 2008,2010, our income tax expensebenefit amounted to $3$157 million compared to $29a tax expense of $180 million for 2007.2009.
During 2010, we recorded $25 million of income related to alternative fuel tax credits in Other operating (income) loss on the Consolidated Statement of Earnings. The $25 million represented an adjustment to amounts presented as deferred revenue at December 31, 2009 and was released to income following table providesguidance issued by the IRS in March 2010. This income resulted in an income tax expense by jurisdictionbenefit of $9 million and an additional liability for 2008 and 2007:
| Year ended December 31, 2008 | Year ended December 30, 2007 | |||||||||||||||||||||||
JURISDICTION | U.S. | Canada | Total | U.S. | Canada | Total | ||||||||||||||||||
| (In million of dollars, unless otherwise noted) | ||||||||||||||||||||||||
Income (loss) before income taxes | $ | 15 | $ | (585 | ) | $ | (570 | ) | $ | 217 | $ | (118 | ) | $ | 99 | |||||||||
Income tax (benefit) expense | 34 | (31 | ) | 3 | 72 | (43 | ) | 29 | ||||||||||||||||
Effective tax rate | 227 | % | 5 | % | (1 | )% | 33 | % | 36 | % | 29 | % | ||||||||||||
During 2008,uncertain income tax positions of $7 million, both of which impacted the U.S. effective tax rate for 2010. Additionally, we recorded a non-tax deductible goodwill impairment chargenet tax benefit of $321$127 million and asfrom claiming a result, bothCBPC in 2010 ($209 million of CBPC net of tax expense of $82 million), which impacted the U.S. effective tax rate. Finally, we released the
valuation allowance on its Canadian net deferred tax assets during the fourth quarter of 2010. The full $164 million valuation allowance balance that existed at January 1st, 2010 was either utilized during 2010 or reversed at the end of 2010 based on future projected income, which impacted the Canadian and overall consolidated effective tax rate.
As of December 31, 2009, the Company had a valuation allowance of $164 million on its Canadian net deferred tax assets, which primarily consisted of net operating losses, scientific research and experimental development expenditures not previously deducted and un-depreciated tax basis of property, plant, and equipment. Evaluating the need for an amount of a valuation allowance for deferred tax assets often requires significant judgment. All available evidence, both positive and negative, is considered when determining whether, based on the weight of that evidence, a valuation allowance is needed. Specifically, we evaluated the following items:
Historical income / (losses)—particularly the most recent three-year period
Reversals of future taxable temporary differences
Projected future income / (losses)
Tax planning strategies
Divestitures
In our evaluation process, we give the most weight to historical income or losses. During the fourth quarter of 2010, after evaluating all available positive and negative evidence, although realization is not assured, we determined that it was more likely than not that the Canadian net deferred tax assets would be fully realized in the future prior to expiration. Key factors contributing to this conclusion that the positive evidence ultimately outweighed the existing negative evidence during the fourth quarter of 2010 included the fact that the Canadian operations, excluding the loss-generating Wood business (sold to a third party on June 30, 2010) and elements of other comprehensive income, went from a three-year cumulative loss position to a three-year cumulative income position during the fourth quarter of 2010; we were able to demonstrate continual profitability throughout 2010 and were projected to continue to be profitable in the coming years.
During 2009, we recorded a net liability of $162 million for unrecognized income tax benefits associated with the alternative fuel mixture tax credits income. If our income tax positions with respect to the alternative fuel mixture tax credits are sustained, either all or in part, then we would recognize a tax benefit in the future equal to the amount of the benefits sustained. Our tax treatment of the income related to the alternative fuel mixture tax credits resulted in the recognition of a tax benefit of $36 million which impacted the U.S. effective tax rates were impacted.rate. This credit expired December 31, 2009. The Canadian effective tax rate was also impacted by athe additional valuation allowance taken on the netrecorded against new Canadian deferred tax assets in the amount of $52 million.$29 million during 2009.
Net Earnings (Loss)
Net lossearnings amounted to $573$605 million ($13.3314.00 per common share on a diluted basis) in 2008, a decrease2010, an increase of $643$295 million compared to net earnings of $70$310 million ($1.767.18 per common share on a diluted basis) in 20072009, mainly due to the charge for impairment of goodwill, property, plant and equipment and intangible assets recorded in the fourth quarter of 2008 as well as the other factors mentioned above.
PAPERSPULP AND PAPER
SELECTED INFORMATION | Year ended December 31, 2009 | Year ended December 31, 2008 | Year ended December 30, 2007 | Year ended December 31, 2011 | Year ended December 31, 2010 | Year ended December 31, 2009 | ||||||||||||||||||
| (In millions of dollars, unless otherwise noted) | ||||||||||||||||||||||||
| (In millions of dollars, unless otherwise noted) | ||||||||||||||||||||||||
Sales | ||||||||||||||||||||||||
Total sales | $ | 4,632 | $ | 5,440 | $ | 5,116 | $ | 4,953 | $ | 5,070 | $ | 4,632 | ||||||||||||
Intersegment sales | (231 | ) | (276 | ) | (235 | ) | (193 | ) | (229 | ) | (231 | ) | ||||||||||||
|
|
| ||||||||||||||||||||||
| $ | 4,401 | $ | 5,164 | $ | 4,881 | $ | 4,760 | $ | 4,841 | $ | 4,401 | |||||||||||||
Operating income (loss) | 650 | (369 | ) | 321 | ||||||||||||||||||||
Operating income | 581 | 667 | 650 | |||||||||||||||||||||
Shipments | ||||||||||||||||||||||||
Paper (in thousands of ST) | 3,757 | 4,406 | 4,501 | 3,534 | 3,597 | 3,757 | ||||||||||||||||||
Pulp (in thousands of ADMT) | 1,539 | 1,372 | 1,329 | 1,497 | 1,662 | 1,539 | ||||||||||||||||||
Sales and Operating Income
Sales
Sales in our PapersPulp and Paper segment amounted to $4,401$4,760 million in 2009,2011, a decrease of $763$81 million, or 15%2%, compared to sales of $5,164$4,841 million in 2008.2010. The decrease in sales is mostly attributable to lower shipments in both pulp and paper, due to the closure of our Columbus, Mississippi mill and the sale of our Woodland, Maine market pulp mill, partially offset by increased selling prices in pulp and paper.
Sales in our Pulp and Paper segment amounted to $4,841 million in 2010, an increase of $440 million, or 10%, compared to sales of $4,401 million in 2009. The increase in sales is mostly attributable to higher average selling prices for paper of approximately 15%, reflecting softer market demand for uncoated freesheet paper and coated groundwood, and lowerhigher average selling prices for pulp, and paper.as well as higher shipments for pulp of approximately 8%, reflecting stronger market demand for pulp in the first half of 2010. As a result of softerstronger market demand, for uncoated freesheet paper and coated groundwood, we also took higherlower lack-of-order downtime and machine slowdown in 20092010 when compared to 2008, resulting in the availability of more market pulp as pulp shipments increased approximately 12%. As a result of the softer demand for uncoated freesheet paper, we have undertook restructuring activities. These activities include the reorganization of our Dryden paper mill at the end of 2007 and its subsequent closure in November 2008, the closure of our Port Edwards paper mill effective at the end of the second quarter of 2008, the closure of one paper machine at our Plymouth pulp and paper mill effective in the first quarter of 2009 and
46
the announcement in October 2009 of its conversion to 100% fluff pulp production, expected to be completed in the fourth quarter of 2010.
Sales in our Papers segment amounted to $5,164 million in 2008, an increase of $283 million, or 6% compared to sales of $4,881 million in 2007. The increase in sales is attributable to the acquisition of Domtar Inc. on March 7, 2007, as well as higher average selling prices for pulp and paper, reflecting the price increases implemented towards the end of 2007 as well as in February and July of 2008. Our pulp shipments increased by 3% in 2008 when compared to 2007, primarily due to the acquisition of Domtar Inc. as well as the higher lack-of-order downtime in paper taken in 2008, resulting in the availability of more market pulp.2009. These factors were partially offset by lower shipments for paper of approximately 2%4%, reflecting softerdue to the exit from the coated groundwood market demand for uncoated freesheet paper which led to our restructuring activities, including the closure of the paper machine at our Woodland pulp and paper mill effective in the third quarter of 2007,with the closure of our OttawaColumbus, Mississippi paper mill effective in the fourth quarter of 2007, the reorganization of our Dryden paper mill at the end of 2007 and subsequently closed in November 2008, and the closure of our Port Edwards paper mill effective at the end of the second quarter of 2008.due to declining demand.
Operating Income (Loss)
Operating income in our PapersPulp and Paper segment amounted to $650$581 million in 2009, an increase2011, a decrease of $1,019$86 million, when compared to operating lossincome of $369$667 million in 2008, mostly attributable2010. Overall, our operating results declined when compared to 2010 primarily due to increased impairment and write-off of property, plant and equipment of $35 million resulting from the impairments at our Ashdown and Lebel-sur-Quévillon mills and increased closure and restructuring of $25 million mainly due to our withdrawal from a U.S. multi-employer plan, and from a pension curtailment loss associated with the conversion of certain of our U.S. defined benefit pension plans to defined contribution pension plans. Our operating results also declined due to the $498overall decrease in sales and shipments as a result of lower demand of 63,000 tons related to paper compared to 2010, higher costs for chemicals and freight ($60 million and $33 million, respectively), and the negative impact of a stronger Canadian dollar ($37 million), partially offset by lower fiber costs and energy usage ($12 million and $33 million, respectively).
Operating income in our Pulp and Paper segment amounted to $667 million in 2010, an increase of $17 million, when compared to operating income of $650 million in 2009. Overall, our operating results improved in 2010 when compared to 2009 primarily due to higher average selling prices for our pulp and paper products. Our strategy of maintaining our production levels in line with our customer demand resulted in taking lack-of-order downtime and machine slowdowns of 30,000 tons of paper and nil metric tons of pulp in 2010 compared to 467,000 tons of paper and 261,000 metric tons of pulp in 2009. We saw an improvement in our pulp
shipments, which experienced an 8% volume increase compared to 2009. In 2010, we also had lower chemicals and energy costs. These factors were partially offset by the $25 million in alternative fuel tax credits recorded in 2010, compared to the $498 million recorded in 2009 partially offsetas well as by the aggregate $62 million charge for impairmenthigher maintenance costs, higher fiber costs, higher freight costs and write-downa negative impact of a stronger Canadian dollar (net of our hedging program). Other items significantly impacting our operating income comparability included net gains on disposals of property, plant and equipment and sale of businesses of $17 million recorded in 2010 compared to net losses of $4 million in 2009 compared to theand an aggregate $694$26 million charge for impairment and write-down of goodwill and property, plant and equipment recorded in the fourth quarter of 2008. In addition, our operating income was impacted by lower freight costs, lower maintenance costs, the favorable impact of a weaker Canadian dollar, higher pulp shipments, lower cost for raw materials, including fiber, energy and chemicals, the realization of savings stemming from restructuring and synergy activities as well as lower depreciation and amortization expense. These factors were more than offset by lower shipments for paper, lower average selling prices for pulp and paper as well as higher closure and restructuring costs. In the first quarter of 2008, we also recorded the reversal of a provision for $23 million due to the early termination by the counterparty of an unfavorable contract.
Operating loss in our Papers segment amounted to $369 million in 2008, a decrease of $690 million, when compared to operating income of $321 million in 2007, mostly2010 attributable to the aggregate $694 million charge for impairment and write-down of goodwill and property, plant and equipment recorded in the fourth quarter of 2008 compared to the $92 million charge for impairment of property, plant and equipment in 2007. In addition, our operating loss was impacted by higher costs for raw materials including fiber, energy and chemicals, especially for starch, caustic soda, sulfuric acid and sodium chlorate, higher freight costs, lower shipments for paper as well as higher closure and restructuring costs and the absence of a gain of $39compared to an aggregate $52 million related to a lawsuit settlementcharge in 2007. These factors were partially offset by the acquisition of Domtar Inc. on March 7, 2007, higher average selling prices for pulp and paper, higher shipments for pulp, lower maintenance costs, the realization of savings stemming from restructuring and synergy activities as well as lower depreciation and amortization expense.2009.
Pricing Environment
Overall average sales prices in our paper business experienced a small decreaseincrease in 20092011 when compared to 2008.2010. Our overall average paper sales prices for offset 50 lb rolls were lower by $40/ton, or 4% in 2009 compared to 2008, while our copy 20lb sheets were higher by $45/$17/ton, or 4%2%, in 2009 when2011 compared to 2008.2010.
Our average pulp sales prices for both Northern Bleached Softwood Kraft (“NBSK”) pulp and Northern Bleached Hardwood Kraft (“NBHK”) pulp decreasedexperienced a small increase in 2011 compared to 2010. Our sales price increased by $152/metric ton and $199/$15/metric ton, or 21% and 30%2%, respectively, in 20092011 compared to 2008, reflecting a significant decrease in2010.
Overall average sales prices for both NBSK and
47
NBHK in the fourth quarter of 2008 and first half ofour paper business experienced a small increase in 2010 compared to 2009. This significant decrease inOur overall average paper sales prices was partially offsetwere higher by $44/ton, or 4%, in 2010 compared to 2009.
Our average pulp sales prices experienced a large increase in 2010 compared to 2009. Our sales price increases implementedincreased by $224/metric ton, or 43%, in the third and fourth quarters of2010 compared to 2009.
Operations
Shipments
Our paper shipments decreased by 649,000 63,000tons, or 15%2%, in 20092011 compared to 2008,2010, primarily due to softer market demand for uncoated freesheet paper and coated groundwood which resulted in higher lack-of-order downtime and paper machine slowbacks in 2009. The continued softer market demand for uncoated freesheet has resulted in the closure of oneour Columbus, Mississippi paper machine atmill and the conversion of our Plymouth, pulp and paperNorth Carolina mill effective in the first quarter of 2009 and the subsequent announcement in October 2009 of its conversion to 100% fluff pulp production facility (expectedproduction.
Our pulp trade shipments decreased by 165,000metric tons, or 10%, in 2011 compared to be effective2010. The decrease is primarily due to the sale of our hardwood market pulp mill in Woodland, Maine in the fourththird quarter of 2010)2010. Excluding shipments from our Woodland, Maine mill, our pulp trade shipments increased by 146,000 metric tons or 11% compared to 2010, which resulted from an increase in market demand.
Our paper shipments decreased by 160,000tons, or 4%, in 2010 compared to 2009, primarily due to the closure of our Port EdwardsColumbus, Mississippi paper mill effective at the end of the second quarter of 2008 and the reorganization of our Dryden paper mill announced in the fourth quarter of 2007 (which began in January 2008 and was permanently closed in November 2008).mill.
Our pulp trade shipments increased by 167,000 123,000metric tons, or 12%8%, in 20092010 compared to 2008.2009. The increase in pulp shipments resulted mostly from an increase in market demand for the availabilityfirst half of market pulp in 2009 due to higher lack-of-order downtime in paper as well as a decrease in our pulp inventory.2010.
Alternative Fuel Tax Credits
The U.S. Internal Revenue Code of 1986, as amended (the “Code”) permitspermitted a refundable excise tax credit, until the end of 2009, for the production and use of alternative bio fuel mixtures derived from biomass. We submitted an application with the U.S. Internal Revenue Service (IRS)IRS to be registered as an alternative fuel mixer and received notification that our registration had been accepted in late March 2009. We began producing and consuming alternative fuel mixtures in February 2009 at our eligible mills. InAlthough the credit ended at the end of 2009, in 2010, we recorded $498$25 million of such credits in “OtherOther operating (income) loss”loss on the Consolidated Statement of Earnings.Earnings compared to $498 million in 2009. The $25 million represented an adjustment to amounts presented as deferred revenue at December 31, 2009 and was released to income following guidance issued by the IRS in March 2010. We recorded an income tax expense of $7 million in 2010 compared to $162 million in 2009 related to the
alternative fuel mixture income. The amounts for the refundable credits are based on the volume of alternative bio fuel mixtures produced and burned during that period. According to the Code, the tax credit expired at the end of 2009.
In 2009, we received a $140 million in cash related to these claims. Any receivables under this program are presented as a componentrefund and another $368 million cash refund, net of Income and other taxes receivables on the Consolidated Balance Sheet. In the second quarter of 2009, we stopped claiming these credits for immediate refund as they were being earned and ultimately decided to claim the remaining refundable credits on our 2009 annual U.S.federal income tax return, which is expected to be filedoffsets, in the first half of 2010. Additional information regarding unrecognized tax benefits is included in Part II, Item 8, Financial Statements and Supplementary Data of this Annual Report on Form 10-K, under Note 10 “Income taxes.”
Although we do not expect a significant change in our unrecognized tax benefits associated with the alternative fuel tax credits from 2009 during the next 12 months, a favorable audit by the IRS or the issuance of authoritative guidance could result in the recognition of some or all of these previously unrecognized tax benefits. As of December 31, 2011, we have gross unrecognized tax benefits and interest of $192 million and related deferred tax assets of $15 million associated with the alternative fuel tax credits. The recognition of these benefits, $177 million net of deferred taxes, would impact the effective tax rate.
Labor
We have anA new umbrella agreement with the United Steelworkers Union (“USW”), expiring in 2012,2015, and affecting approximately 4,0002,900 employees at oureight U.S. locations.mills and one converting operation, was ratified effective December 1, 2011. This agreement only covers certain economic elements, and all other issues will beare negotiated at each operating location, as the related collective bargaining agreements become subject to renewal. The parties have agreed not to strike or lock-out during the terms of the respective local agreements. Should the parties fail to reach an agreement during the local negotiations, the related collective bargaining agreements are automatically renewed for another four years.
We have fourIn Canada, the collective agreements that will expireagreement expired in 2010 one of which expires in April at our Windsor facility twoin Quebec, Canada, with the Confederation of National Trade Unions (“CNTU”). A new agreement was ratified in mid-November 2011. At the Espanola Mill facility, agreements have been reached with the Communication, Energy and Paperworkers Union of Canada (“CEP”), locals 74 and 156 and with the International Brotherhood of Electrical Workers (“IBEW”). Agreements that expireexpired in May2009 at our Nekoosa facilityDryden facilities in Canada are being negotiated with the CEP and one that expiresare on-going. These Canadian collective agreements are unrelated to the umbrella agreement with the USW covering our U.S. locations.
As of December 31, 2011, we have nine outstanding agreements; (including two agreements which are covered by the USW) affecting approximately 1,100 employees and twenty-eight ratified agreements affecting approximately 3,700 employees. The majority of employees are in August at our Hawesville facility. Negotiations have not started for these collective agreements.the U.S. and Canada.
Closure and Restructuring
In 2009,2011, we incurred $114$136 million of closure and restructuring costs ($73276 million in 2008)2010), including the impairment and write-down of property, plant and equipment of $62$85 million in 2009,2011, compared to
48
$373 $50 million in 2008 and impairment of goodwill of nil in 2009, compared to $321 million in 2008.2010. For more details on the closure and restructuring costs, refer to Part II, Item 8, Financial Statements and Supplementary Data Note 17, of this Annual Report on Form 10-K.10-K, under Note 16 “Closure and restructuring costs and liability.”
Closure and restructuring costs are based on management’s best estimates. Although the Company doeswe do not anticipate significant changes, actual costs may differ from these estimates due to subsequent developments such as the results of new environmental studies, as well asthe ability to find a buyer for assets set to be dismantled and demolished and other business developments. As such, additional costs and further write-downs and impairment charges may be required in future periods.
2011
On March 29, 2011, we announced that on July 1, 2011, we would permanently shut down one paper machine at our Ashdown, Arkansas pulp and paper mill. We subsequently postponed the shut down of the paper machine until August 1, 2011. The closure resulted in an aggregate pre-tax charge to earnings of approximately $75 million, which included $74 million in non-cash charges relating to the accelerated depreciation of the carrying amounts of manufacturing equipment and the write-off of related spare parts and $1 million related to other costs. This closure reduced Domtar’s annual uncoated freesheet paper production capacity by approximately 125,000 short tons and the mill’s workforce by approximately 110 employees. Operations ceased on August 1, 2011.
During the fourth quarter of 2011, we decided to withdraw from one of our U.S. multiemployer pension plans and recorded an estimated withdrawal liability and a charge to earnings of $32 million. We also incurred, in the fourth quarter of 2011, a $9 million loss from a pension curtailment associated with the conversion of certain of our U.S. defined benefit pension plans to defined contribution pension plans.
Following the permanent closure announced on December 18, 2008 of our Lebel-sur-Quévillon pulp mill and sawmill, we recorded a $4 million loss related to pension curtailment in 2009. Operations at the pulp mill had been indefinitely idled since November 2005 due to unfavorable economic conditions and the sawmill had been indefinitely idled since 2006. At the time, the pulp mill and sawmill employed 425 and 140 employees, respectively. The Lebel-sur-Quévillon pulp mill had an annual production capacity of 300,000 metric tons. During 2011, we reversed $2 million of severance and termination provision and following the signing of a definitive agreement (see Part II, Item 8, Financial Statements and Supplementary Data of this Annual Report on Form 10-K, under Note 27 “Subsequent events”) we recorded a $12 million write-down for the remaining fixed assets net book value, a component of Impairment and write-down of property, plant and equipment.
On February 1, 2011, we announced the closure of our Langhorne, Pennsylvania forms converting center. The closure resulted in a charge to earnings of $4 million for severance and termination costs. The closure affected 48 employees.
Our Prince Albert pulp and paper mill was closed in the first quarter of 2006 due to poor market conditions and had not been operated since. Our management determined that our Prince Albert facility was no longer a strategic fit, and would not be reopened. On May 3, 2011, we sold our Prince Albert pulp and paper mill to Paper Excellence, and recorded a loss on sale of $12 million in the second quarter of 2011.
2010
In November 2010, we announced the start up of our new fluff pulp machine in Plymouth, North Carolina, which had increased production capacity to approximately 444,000 metric tons. The conversion of our Plymouth pulp and paper mill in 2009 is discussed below.
In July 2010, we announced our decision to end all manufacturing activities at our forms converting plant in Cerritos, California. Operations ceased on July 16, 2010. Approximately 50 plant employees were impacted by this decision.
In March 2010, we announced the permanent closure of our coated groundwood paper mill in Columbus, Mississippi. Operations ceased in April 2010. This measure resulted in the permanent curtailment of approximately 238,000 tons of coated groundwood production capacity per year as well as approximately 70,000 metric tons of thermo-mechanical pulp, and affected approximately 219 employees.
2009
Our Prince Albert pulp and paper mill was closed in the first quarter of 2006 and has not been operated since. In December 2009, we decided to dismantle our Prince Albert facility. We will continue to remove machinery and equipment from the site and will take steps to engage the services of demolition contractors and file for a demolition permit. The dismantling of the paper machine and converting equipment was completed in 2008 and the dismantling of2008. In December 2009, we decided to dismantle the remaining assets is expectedfacility. We removed machinery and equipment from the site and
continue to start in 2010.evaluate other options for the site. As a result of a review of current options for the disposal of the assets of this facility in the fourth quarter of 2009, we revised the estimated net realizable values of the remaining assets and recorded a non-cash write-down of $14 million in the fourth quarter of 2009, related to fixed assets, mainly a turbine and a boiler. The write-down representsrepresented the difference between the new estimated liquidation or salvage value of the fixed assets and their carrying values.
In February 2009, we announced the permanent shut down of a paper machine at our Plymouth pulp and paper mill, effective at the end of February 2009. This measure resulted in the permanent curtailment of approximately 293,000 tons of paper production capacity per year and affected approximately 185 employees. Our Plymouth pulp and paper mill continues to operate two pulp lines, one pulp dryer and one paper machine, with an annual paper production capacity of 199,000 tons. Subsequently, inIn October 2009, we announced that we willwould convert our Plymouth pulp and paper mill to 100% fluff pulp production. This conversion will require approximatelyproduction at a cost of $74 million of investment.million. Our annual fluff pulp making capacity will increaseincreased to 444,000 metric tons.tons as a result. The mill conversion which is expected to be completed in the fourth quarter of 2010, will also resultresulted in the permanent shut down of Plymouth’s remaining paper machine with aan annual production capacity of 199,000 tons. The mill conversion will helphelped preserve approximately 360 positions. In connection with this announcement, we recognized $13 million of accelerated depreciation in the fourth quarter of 2009, and we expect to record a further $39 million of accelerated depreciation over the first nine months of 2010 was recorded in relation to the assets that will ceaseceased productive use in October 2010. The remaining assets of this facility have beenwere tested for impairment at the time of this 2009 announcement, and no additional impairment charge was required.
Our Woodland pulp mill, which was indefinitely idled in May 2009, was reopened effective June 26, 2009, and substantially all employees were called back to work in June for the restart of pulp production. Our Woodland pulp mill has an annual hardwood production capacity of approximately 398,000 metric tons, and approximately 300 employees were reinstated. The timely benefits from the refundable tax credits for the production and use of alternative bio fuel mixtures, and other important conditions, such as stronger global demand, improving prices and favorable currency exchange rates have made the reopening possible. We sold our Woodland pulp mill on September 30, 2010 for $60 million plus net working capital of $8 million.
In April 2009, we announced that we would idle our Dryden pulp facility for approximately ten weeks, effective April 25, 2009. This decision was taken in response to continued weak global demand for pulp and the need to manage inventory levels. Our Dryden pulp mill has an annual softwood pulp production capacity of 319,000 metric tons. Our Dryden pulp mill restarted its pulp production in July 2009.
2008Other
In December 2008, we announced the permanent closure of our Lebel-sur-Quévillon pulp mill. Operations at our Lebel-sur-Quévillon pulp mill had been indefinitely idled in November 2005 due to unfavorable economic conditions. At the time, our Lebel-sur-Quévillon pulp mill had an annual production capacity of approximately 300,000 metric tons and employed approximately 425 employees.
49
In November 2008, we announced the closure of the paper machine and converting operations at our Dryden mill, effective in November 2008. This measure resulted in the permanent curtailment of approximately 151,000 tons of paper capacity per year and affected approximately 195 employees. Our Dryden pulp production and related forestland activities will remain in operation. Dryden has one pulp line with an annual production capacity of 319,000 metric tons.
In December 2007, we announced the reorganization of our Dryden facility as well as the closure of our Port Edwards mill, effective in the first and second quarters of 2008, respectively. These measures resulted in the curtailment of approximately 336,000 tons of paper capacity per year and affected approximately 625 employees.
Other
Our air permit for our Kamloops pulp mill required that the facility reduce air emissions of particulate matter by December 31, 2007. The Province of British Columbia agreed to extend the deadline for compliance under specific conditions for a period of five years. Compliance with the permit requirements is likely to require approximately $35 million in capital expenditures over the next five years. These projects will be funded under the Natural Resources Canada Pulp and Paper Green Transformation Program, see below.
Natural Resources Canada Pulp and Paper Green Transformation Program
On June 17, 2009, the Government of Canada announced that it was developing a Pulp and Paper Green Transformation Program (“the Green Transformation Program”) to help pulp and paper companies make investments to improve the environmental performance of their Canadian facilities. The Green Transformation Program iswas capped at CDN$1 billion, and thebillion. The funding of capital investments at eligible mills must be completed no later than March 31, 2012.
Subject2012 and all projects are subject to the approval of Natural Resources Canada, eligiblethe Government of Canada.
Eligible projects must demonstrate an environmental benefit by either improving energy efficiency or increasing renewable energy production. The investment must be made before the expiration of the program on March 31, 2012, and all projects are subject to the approval of the Government of Canada. Although amounts will not be received until qualifying capital expenditures have been made, we have been allocated $133$141 million (CDN$143 million) through this Program.Green Transformation Program, of which all have been approved. The funds are to be spent on capital projects to improve energy efficiency and environmental performance in our Canadian pulp and paper mills and any amounts received will be accounted for as an offset to the applicable plant and equipment asset amount. As of December 31, 2011, we have received a total of $123 million (CDN$125 million) ($72 million in 2011 and $51 million in 2010), mostly related to eligible projects at our Kamloops, Dryden and Windsor pulp and paper mills.
PAPER MERCHANTSDISTRIBUTION
SELECTED INFORMATION | Year ended December 31, 2009 | Year ended December 31, 2008 | Year ended December 30, 2007 | Year ended December 31, 2011 | Year ended December 31, 2010 | Year ended December 31, 2009 | |||||||||||||||
| (In millions of dollars) | |||||||||||||||||||||
| (In millions of dollars) | |||||||||||||||||||||
Sales | $ | 873 | $ | 990 | $ | 812 | $ | 781 | $ | 870 | $ | 873 | |||||||||
Operating income | 7 | 8 | 13 | ||||||||||||||||||
Operating income (loss) | — | (3 | ) | 7 | |||||||||||||||||
Sales and Operating Income
Sales
Sales in our Paper MerchantsDistribution segment amounted to $873$781 million in 2009,2011, a decrease of $117$89 million compared to sales of $990$870 million in 2008.2010. This decrease in sales is mostly attributable to a decrease in deliveries of 14%, resulting from the sale of a business unit at the end of the first quarter of 2011 and from difficult market conditions.
Sales in our Distribution segment amounted to $870 million in 2010, a decrease of $3 million compared to sales of $873 million in 2009. This decrease in sales was mostly attributable to softer market demand which resulted in a decrease in deliveriesshipments of approximately 9%, as well as a decrease in selling prices.
50
Sales in our Paper Merchants segment amounted to $990 million in 2008, an increase of $178 million compared to sales of $812 million in 2007. This increase in sales was mostly attributable to the acquisition of Domtar Inc. on March 7, 2007, as well as higher selling prices.2%.
Operating Income (Loss)
Operating income amounted to $7nil in 2011, an increase of $3 million when compared to operating loss of $3 million in 2009,2010. The increase in operating income is attributable to the gain on sale of a business unit of $3 million at the end of the first quarter of 2011.
Operating loss amounted to $3 million in 2010, a decrease in operating income of $1$10 million when compared to operating income of $8$7 million in 2008.2009. The decrease in operating income iswas attributable to margins temporarily contracting due to supplier price increases, as well as to a decrease in deliveries in 20092010 when compared to 2008, and an increase in closure and restructuring costs of $2 million in 2009. The factors were partially offset by lower SG&A costs in 2009 when compared to 2008.
Operating income amounted to $8 million in 2008, a decrease of $5 million when compared to operating income of $13 million in 2007. The decrease in operating income is attributable to an increase in costs, including an increase in the “last in first out” (LIFO) reserve and higher energy costs, an increase in the allowance for doubtful accounts and an increase in depreciation and amortization in 2008. These factors were partially offset by the acquisition of Domtar Inc. on March 7, 2007, and an increase in selling prices. In addition, the third quarter of 2007 included a decrease in the allowance for doubtful accounts of $2 million.
Operations
Labor
We have collective agreements covering six locations in the U.S., of which one expired in 2011, one will expire in 2012 and four will expire in 2010 and two in 2013. We have fivefour collective agreements covering four locations in Canada, one of which one expired in 2008, and twoone expired in 2009 (negotiations are expected to begin shortly) and two will expire in 2010.2013.
PERSONAL CARE
SELECTED INFORMATION | Year ended December 31, 2011 | |||
| (In millions of dollars) | ||||
Sales | $ | 71 | ||
Operating income | 7 | |||
Sales and Operating Income
Sales
Sales in our Personal Care segment amounted to $71 million for the year ended December 31, 2011, representing only four months of operations, following the completion of the acquisition on September 1, 2011.
Operating Income
Operating income amounted to $7 million for the year ended December 31, 2011, representing only four months of operations, following the completion of the acquisition on September 1, 2011 and included the negative impact of purchase accounting fair value adjustments of $1 million.
Operations
Labor
We employ approximately 330 non-unionized employees, almost entirely in the United States.
For more details on the acquisition, refer to Part II, Item 8, Financial Statement and Supplementary Data, of this Annual Report on Form 10-K, under Note 3 “ Acquisition of Business”.
WOOD
SELECTED INFORMATION | Year ended December 31, 2009 | Year ended December 31, 2008 | Year ended December 30, 2007 | Year ended December 31, 2010 | Year ended December 31, 2009 | |||||||||||||||
| (In millions of dollars, unless otherwise noted) | ||||||||||||||||||||
| (In millions of dollars, unless otherwise noted) | ||||||||||||||||||||
Sales | $ | 211 | $ | 268 | $ | 304 | $ | 150 | $ | 211 | ||||||||||
Intersegment sales | (20 | ) | (28 | ) | (50 | ) | (11 | ) | (20 | ) | ||||||||||
|
| |||||||||||||||||||
| 191 | 240 | 254 | 139 | 191 | ||||||||||||||||
Operating income (loss) | (42 | ) | (73 | ) | (63 | ) | ||||||||||||||
Operating loss | (54 | ) | (42 | ) | ||||||||||||||||
Shipments (millions of FBM) | 574 | 677 | 684 | 351 | 574 | |||||||||||||||
Benchmark prices1: | ||||||||||||||||||||
Lumber G.L. 2x4x8 stud ($/MFBM) | $ | 259 | $ | 280 | $ | 321 | $ | 348 | $ | 259 | ||||||||||
Lumber G.L. 2x4 R/L no. 1 & no. 2 ($/MFBM) | 270 | 304 | 329 | 350 | 270 | |||||||||||||||
| 1 | Source: Random Lengths. As such, these prices do not necessarily reflect our sales prices. |
SalesSale of Wood business
On June 30, 2010, we sold our Wood business to EACOM and Operating Lossexited the manufacturing and marketing of lumber and wood-based value-added products. We have fiber supply agreements in place with our former wood division at our Espanola facility. Since these continuing cash outflows are expected to be significant to the former Wood business, the sale of the Wood business did not qualify as a discontinued operation under ASC 205-20.
Sales
Sales in our Wood segment amounted to $191$139 million in 2009,2010, a decrease of $49$52 million, or 20%27%, compared to sales of $240$191 million in 2008.2009. The decrease in sales iswas attributable to the slowdownsale of our Wood business at the end of the second quarter of 2010, partially offset by an increase in the U.S. housing industry which resulted in lowersales attributable to higher average selling prices and lower shipments for wood products.
51
Sales in our Wood segment amounted to $240 million in 2008, a decrease of $14 million, or 6%, compared to sales of $254 million in 2007. The decrease in sales is attributable to the slowdown in the U.S. housing industry which resulted in lower average selling prices and lower shipments for wood products, as well as lower sales of wood chips, partially offset by the impact of the reopening of our Val d’Or and Matagami sawmills in June 2007 and January 2008, respectively, as well as the acquisition of Domtar Inc. on March 7, 2007.
Operating Loss
Operating loss in ourthe Wood segment amounted to $42$54 million in 2009, a decrease in operating loss2010, an increase of $31$12 million compared to an operating loss of $73$42 million in 2008,2009, mostly attributable to the aggregate $14loss on sale of our Wood business of $50 million charge for impairment of property, plant and equipment and intangible assets in 2008. This decrease in operating loss is also attributable to the favorable impact of a weaker Canadian dollar in 2009 when compared to 2008, lower depreciation and amortization expense due to the write-down of property, plant and equipment in the fourth quarter of 2008, lower SG&A expenses as well as gains of $8 million on sales of land in the third quarter of 2009 and a gain of $3 million on the dissolution of a subsidiaryrecorded in the second quarter of 2009. These factors were2010, partially offset by lower average selling prices and lower shipments of our wood products as well as higher closure and restructuring costs. Our second quarter of 2008 also included a gain of approximately $1 million on the sale of our investment in Olav Haavaldsrud Timber Company Limited (“Haavaldsrud”).margins.
Operating loss in our Wood segment amounted to $73 million in 2008, an increase in operating loss of $10 million compared to an operating loss of $63 million in 2007, mostly attributable to the aggregate $14 million charge for impairment of property, plant and equipment and intangible assets in 2008, compared to a $4 million impairment charge of goodwill in 2007, as well as the acquisition of Domtar Inc. on March 7, 2007. This increase in operating loss is also attributable to lower average selling prices and lower shipments of our wood products, higher closure and restructuring costs and higher costs for energy. These factors were partially offset by the reopening of our Matagami sawmill, lower costs and better productivity at several operations. Our second quarter of 2008 included a gain of approximately $1 million on the sale of our investment in Olav Haavaldsrud Timber Company Limited (“Haavaldsrud”).
Pricing Environment
Our average sales price for Great Lakes 2x4 stud lumber decreased by $21/MFBM, or 9%, and our average sales price for Great Lakes 2x4 random length lumber decreased by $34/MFBM, or 13%, in 2009 compared to 2008.
Operations
Shipments
Our lumber and wood shipments in 2009 decreased by 103 MFBM, or 15%, compared to shipments in 2008, primarily due to the slowdown in the U.S. housing industry.
Labor
We have three collective agreements that have expired and are currently under negotiation and two that will expire in 2010. Other collective agreements have expiring dates from 2011 to 2014.
In 2009, we signed a two-year collective agreement (expiring in 2011) for our Timmins sawmill, a four-year collective agreement (expiring in 2011) for our Gogama sawmill and a five-year collective agreement (expiring in 2011) for our Val d’Or facility (debarking and slashing department) (expiring in 2014), affecting in total approximately 160 employees. Agreements were also reached with our Elk Lake and Dryden forestland employees to modify their existing collective agreement.
52
Fiber supply
The Province of Quebec adopted legislation, which became effective April 1, 2005, that reduced allowable wood-harvesting volumes by an average of 20% on public lands and 25% on territories covered by an agreement between the Government of Quebec and Cree First Nations. As a result, the amount of fiber, primarily softwood fiber, that we were permitted to harvest annually under our existing licenses from the Quebec government, was reduced by approximately 21%, to approximately 1.8 million cubic meters. In November 2008, the Government of Quebec announced that they had implemented a new consolidation plan affecting harvesting rights for Northern Quebec. This decision, which resulted in the permanent closure of our Lebel-sur-Quévillon sawmill announced in December 2008, provides for the reallocation of volume, for a period of five years, including the reallocation of 665,700 net annual cubic meters of wood for our Val d’Or sawmill (615,700 net annual cubic meters in addition to a temporary volume of 40,000 net annual cubic meters for the next four years) and 450,000 net annual cubic meters of wood for our Matagami sawmill.
United States imposes tariffs on softwood lumber
In February 2009, a tribunal operating under the auspices of the London Court of International Arbitration (“LCIA”) issued its decision on a remedy in the softwood lumber arbitration in which Canada was found to have breached the 2006 Softwood Lumber Agreement (“SLA”) between the United States and Canada by failing to calculate quotas properly during the first six months of 2007. The LCIA tribunal determined that, as appropriate adjustment to compensate for its breach, Canada must collect an additional 10%ad valorem export charge on softwood lumber shipments from four Canadian provinces (Ontario, Quebec, Manitoba and Saskatchewan) until $55 million has been collected. Starting in April 2009, the United States imposed tariffs on softwood lumber from four Canadian provinces due to Canada’s failure to comply with the SLA. On September 26, 2009, the tribunal ordered Canada to impose a 10%ad valorem export charge on softwood lumber exports to the United States from the four provinces. Canada has indicated its intention to comply with this ruling. Once Canada has imposed a 10% export tax, the United States is expected to cease collecting its 10% import duty, with the result that the affected exports from Canada will continue to be subject to a 10% charge, as has been in effect since April 2009. This measure did not have a significant impact on our financial results for 2009.
Other
We indefinitely idled our Ste-Marie sawmill in April 2009 and Ste-Marie planner in July 2009, in response to weak North American lumber market conditions.
In April 2009, we announced that we would idle our Ear Falls sawmill for approximately seven weeks, effective April 10, 2009, in response to weak North American lumber market conditions. Our Ear Falls sawmill restarted its operations in August 2009, but has been indefinitely idled again in the fourth quarter of 2009.
In December 2008, we announced the permanent closure of our Lebel-sur-Quévillon sawmill, which had been indefinitely idled since 2006 and at that time employed approximately 140 employees.
In July 2008, we completed a transaction, for total consideration of $12 million, to acquire full ownership of Gogama Forest Products Inc. (“Gogama”), located in Ostrom, Ontario. We had been operating the facility as a 50% owned investment since 2003. The facility currently employs approximately 45 employees and has an annual lumber production capacity of 65 MFBM. This transaction did not have a significant impact on our financial results.
We intend to continue to seek opportunities to maximize the value of these assets as well as pursue initiatives to improve their operational efficiency.
53
STOCK-BASED COMPENSATION EXPENSE
In April 2009,February and September 2011, a number of new equity awards were granted, consisting of restricted stock units, deferred stock units, non-qualified stock options and performance stock options, which are subject to a variety of service performance and marketperformance conditions.
For the year ended December 31, 2009,2011, compensation expense recognized in our results of operations was approximately $27$23 million, for all of the outstanding awards, compared to $16$25 million in 2008.2010. Compensation costs not yet recognized amounted to approximately $21$16 million in 2009 (2008—2011 (2010—$1122 million), and will be recognized over the remaining service period. Compensation costs for performance awards are based on management’s best estimate of the final performance measurement.
LIQUIDITY AND CAPITAL RESOURCES
Our principal cash requirements are for ongoing operating costs, including pension contributions, working capital and capital expenditures, as well as principal and interest payments on our debt. We expect to fund our liquidity needs primarily with internally generated funds from our operations and, to the extent necessary, through borrowings under our revolving credit facility. Our liquidity requirements can be satisfied by drawing upon our contractually committed revolving credit facility, of which $691$571 million is currently undrawn and available. Under extreme market conditions, there can be no assurance that this agreement would be available or sufficient. See “Capital Resources” below.
Our ability to make payments on and to refinance our indebtedness, including debt we have incurredcould incur under the Credit Agreementcredit facility and outstanding Domtar Corporation notes, and for ongoing operating costs including pension contributions, working capital, and capital expenditures, as well as principal and interest payments on our debt, will depend on our ability to generate cash in the future, which is subject to general economic, financial, competitive, legislative, regulatory and other factors that are beyond our control. Our Credit Agreementcredit facility and debt indentures, as well as terms of any future indebtedness, impose, or may impose, various restrictions and covenants on us that could limit our ability to respond to market conditions, to provide for unanticipated capital investments or to take advantage of business opportunities.
Operating Activities
Cash flows provided from operating activities totaled $792$883 million in 2009,2011, a $595$283 million increasedecrease compared to cash flows provided from operating activities of $197$1,166 million in 2008.2010. This increasedecrease in cash flows provided from operating activities reflected a decrease in requirements for working capital and other items. The decrease in requirements for working capital in 2009 when compared to 2008 is primarily duerelated to inventory reduction (which was impactedthe $368 million cash received in 2009 by a significant decrease in pulp inventory as well as a decrease in our paper inventory). Also, cash flow increased duethe second quarter of 2010 with regards to a decrease in employer pension and other post-retirement expense and contribution of $80 million in 2009 when compared to 2008. These factors were offset by an increase in income and other taxes receivable, including $381 million of receivables related tothe alternative fuel tax credits as well as an increase in receivables, including the use of $90 million of cash related to a reduction in the securitization of trade receivables.credits.
Our operating cash flow requirements are primarily for salaries and benefits, the purchase of fiber, energy and raw materials and other expenses such as property taxes.
Investing Activities
Cash flows used for investing activities in 20092011 amounted to $85$395 million, a $55$453 million decrease compared to cash flows used forprovided from investing activities of $140$58 million in 2008.2010. This decrease in cash flows used forprovided from investing activities is primarily related to the acquisition of Attends Healthcare, Inc. for $288 million. In addition, there were lower capital spendingproceeds from the sale of businesses and investments of $175 million due to the prior year sale of our Wood business and the sale of our Woodland, Maine market pulp mill in 2009 when compared to 2008,2011. This was partially offset by lower proceeds from disposalcapital spending of certain property, plant and equipment and sale of trademarks. In 2008, we also acquired the full ownership of Gogama Forest Products Inc.
54$9 million in 2011.
We intend to limit our annual capital expenditures to below 50%approximately 60% of annual depreciation expense in 2010.2012.
Financing Activities
Cash flows used for financing activities totaled $414$574 million in 20092011 compared to cash flows used for financing activities of $109$1,018 million in 2008.2010. This $305$444 million increasedecrease in cash flows used for financing activities is mainly attributable to the repurchase of $400our 10.75% Notes for $15 million par value ofin 2011 versus the 7.875% Notes due 2011 and $38 million par value of the 5.375% Notes due 2013repayment in the second and third quarter of 2009, repayment of $270 millionfull of our tranche B term loan for $336 million in 2010 and repaymentthe repurchase of borrowings under the revolving credit facility$560 million of our 5.375%, 7.125% and 7.875% Notes in the third and fourth quarters of 2009. This was2010. These factors were partially offset by the issuancehigher common stock repurchases of long-term debt of $385$494 million in the second quarter2011 when compared to $44 million in 2010 as well as dividend payments of 2009. This compares$49 million in 2011 compared to additional borrowings of $10$21 million under our revolving credit facility and repayments of $95 million of our long-term debt in 2008.2010.
Capital Resources
Net indebtedness, consisting of bank indebtedness and long-term debt, net of cash and cash equivalents, was $1,431$404 million at December 31, 2009,2011, compared to $2,155$320 million at December 31, 2008.2010. The $724$84 million decreaseincrease in net indebtedness is primarily due to a higherlower cash level as well asa result of cash from operating activities net of cash used for investing and financing activities resulting in a reduction of cash and cash equivalents partially due to the purchase of Attends Healthcare, Inc., and increased activity under the common stock repurchase program.
On June 23, 2011, we entered into a new $600 million Credit Agreement (the “Credit Agreement”). The Credit Agreement replaced our existing $750 million revolving credit facility that was scheduled to mature March 7, 2012. We intend to use the new revolving Credit Agreement for general corporate purposes, including working capital, capital expenditures and acquisitions.
The Credit Agreement provides for a revolving credit facility (including a letter of $400 million par valuecredit sub-facility and a swingline sub-facility) that matures on June 23, 2015. The initial maximum aggregate amount of the 7.875% Notes due 2011 and $38 million par value of the 5.375% Notes due 2013 in the second quarter of 2009, repayment of $270 million of our tranche B term loan and repayment of borrowingsavailability under the revolving credit facility in the third and fourth quarters of 2009, partially offset by the issuance of long-term debt of $385 million in the second quarter of 2009.
Our Credit Agreement consists of a $336 million senior secured tranche B term loan (remaining outstanding balance at December 31, 2009) and a $750 million senior secured revolving credit facility. The revolving credit facilityis $600 million. Borrowings may be usedmade by the Company,us, by our U.S. subsidiary Domtar Paper Company, LLC, and, subject to a limit of $150 million, by our Canadian subsidiary Domtar Inc. for general corporate purposes and a portion is available for lettersWe may increase the maximum aggregate amount of credit. Borrowings by the Company and Domtar Paper Company, LLCavailability under the revolving Credit Agreement by up to $400 million, and the Borrowers may extend the final maturity of the Credit Agreement by one year, if, in each case, certain conditions are satisfied, including: (i) the absence of any event of default or default under the Credit Agreement, and (ii) the consent of the lenders participating in each such increase or extension, as applicable.
No amounts were borrowed at December 31, 2011 (December 31, 2010—nil). At December 31, 2011, we had outstanding letters of credit amounting to $29 million under this credit facility are available in U.S. dollars, and borrowings by Domtar Inc.(December 31, 2010—$50 million).
Borrowings under the revolving credit facility are available in U.S. dollars and/or Canadian dollars and are limited to $150 million (or the Canadian dollar equivalent thereof).
The tranche B term loan facility matures on March 7, 2014, and the revolving credit facility matures on March 7, 2012. The tranche B term loan amortizes in nominal quarterly installments (equal to one percent of the aggregate initial principal amount thereof per annum) with the balance due on the maturity date. In addition, under certain conditions and to the extent we generate cash flow in excess of cash flow used for operating and capital requirements and repayments of debt, excluding optional repayments of the term loan, we are obligated to apply a portion of such calculated excess cash flow amount towards repayments of the term loan, which amount would include any repayments of the term loan already made.
Amounts drawn under the tranche B term loan facilityCredit Agreement will bear annual interest at either a Eurodollar rate plus a margin of 1.375%, or an alternate base rate plus a margin of 0.375%. Amounts drawn under the revolving credit facility bear annual interest at either a Eurodollar rate plus a margin of between 1.25% and 2.25%, or an alternate base rate plus a margin of between 0.25% and 1.25%. Amounts drawn under the revolving credit facility by Domtar Inc. in U.S. dollars bear annual interest at either a Eurodollar rate plus a margin of between 1.25% and 2.25%, or a U.S. base rate plus a margin of between 0.25% and 1.25%. Amounts drawn under the revolving credit facility by Domtar Inc. in Canadian dollars bear annual interest at the Canadian prime rate plus a margin of between 0.25% and 1.25%. Domtar Inc. may also issue bankers’ acceptances denominated in Canadian dollars which are subject to an acceptance fee, payable on the date of acceptance, which is calculated at a rate per annum equaldependent on our credit ratings at the time of such borrowing and will be calculated at the Borrowers’ option according to between 1.25% and 2.25%. The interesta base rate, margins andprime rate, Eurocurrency rate or the Canadian bankers’ acceptance fee, in eachrate plus an applicable margin, as the case with respect to the revolvingmay be. In addition, we must pay facility fees quarterly at rates dependent on our credit facility, are subject to change based on the Company’s consolidated leverage ratio.ratings.
The Credit Agreement contains a numbercustomary covenants for transactions of covenants that, among other things, limit the ability of the Company and its subsidiaries to make capital expenditures and place restrictions on other matters customarily
55
restricted in senior secured credit facilities,this type, including restrictions on indebtedness (including guarantee obligations), liens (including sale and leasebacks), fundamental changes, sales or disposition of property or assets, investments (including loans, advances, guarantees and acquisitions), transactions with affiliates, hedge agreements, changes in fiscal periods, environmental activity, optional payments and modifications of other material debt instruments, negative pledges and agreements restricting subsidiary distributions and changes in lines of business. As long as the revolving credit commitments are outstanding, we are required to comply with a consolidated EBITDAtwo financial covenants: (i) an interest coverage ratio (as defined underin the Credit Agreement) that must be maintained at a level of not less than 3.0 to consolidated cash interest coverage1 and (ii) a leverage ratio of greater than 2.5x and a consolidated debt to consolidated EBITDA (as defined underin the Credit Agreement) ratiothat must be maintained at a level of lessnot greater than 4.5x. The Credit Agreement contains customary events of default, provided that non-compliance with the consolidated cash interest coverage ratio or consolidated leverage ratio will not constitute an event of default under the tranche B term loan facility unless it has not been waived by the revolving credit lenders within a period of 45 days after notice.3.75 to 1. At December 31, 2009,2011, we were in compliance with our covenants.
All borrowings under the Credit Agreement are unsecured. Certain of our domestic subsidiaries will unconditionally guarantee any obligations from time to time arising under the Credit Agreement, and certain of our Canadian subsidiaries will unconditionally guarantee any obligations of Domtar Inc., the Canadian subsidiary borrower, under the Credit Agreement.
If there is a change of control, as defined under the Credit Agreement, the Credit Agreement will be terminated and any outstanding obligations under the Credit Agreement will automatically become immediately due and payable.
A significant or prolonged downturn in general business and economic conditions may affect our ability to comply with our covenants or meet those financial ratios and tests and could require us to take action to reduce our debt or to act in a manner contrary to our current business objectives.
A breach of any of our Credit Agreement or indenture covenants, orincluding failure to maintain a required ratio or meet a required test, may result in an event of default under those agreements.the Credit Agreement. This may allow the counterparties to those agreementsadministrative agent under the Credit Agreement to declare all amounts outstanding thereunder, together with accrued interest, to be immediately due and payable. If this occurs, we may not be able to refinance the indebtedness on favorable terms, or at all, or repay the accelerated indebtedness.
Receivables Securitization
We use securitization of certain receivables to provide additional liquidity to fund our operations, particularly when it is cost effective to do so. The Company’s direct and indirect, existing and future, U.S. 100% owned subsidiaries serve as guarantorscosts under the program may vary based on changes in interest rates. Our securitization program consists of the sale of our domestic receivables to a bankruptcy remote consolidated subsidiary which, in turn, transfers a senior secured credit facilitiesbeneficial interest in them to a special purpose entity managed by a financial institution for any obligations thereundermultiple sellers of receivables. The program normally allows the daily sale of new receivables to replace those that have been collected. We retain a subordinated interest which is included in Receivables on the Consolidated Balance Sheets and will be collected only after the senior beneficial interest has been settled. The book value of the U.S. borrowers, subjectretained subordinated interest approximates fair value. Fair value is determined on a discounted cash flow basis. We retain responsibility for servicing the receivables sold but do not record a servicing asset or liability as the fees received by us for this service approximate the fair value of the services rendered.
The program contains certain termination events, which include, but are not limited to, agreed exceptions. The Company and its subsidiaries serve as guarantors of Domtar Inc.’s obligations as a borrowermatters related to receivable performance, certain defaults occurring under the senior secured credit facilities, subject to agreed exceptions. Domtar Inc. does not guarantee Domtar Corporation’s obligations under the Credit Agreement. In 2008, we amended the credit facility, and certain judgments being entered against us or our subsidiaries that remain outstanding for 60 consecutive days.
In November 2010, the agreement governing this receivables securitization program was amended and extended to mature in orderNovember 2013. The available proceeds that may be received under the program are limited to allow for the early repurchase$150 million. The agreement was subsequently amended in November 2011 to add a letter of the 7.875% Notes.credit sub-facility.
Our obligations in respect to the senior secured credit facilities are secured by all of the equity interests of the Company’s direct and indirect U.S. subsidiaries, other than 65% of the equity interests of the Company’s direct and indirect “first-tier” foreign subsidiaries, subject to agreed exceptions, and a perfected first priority security interest in substantially all of the Company’s and its direct and indirect U.S. subsidiaries’ tangible and intangible assets. The obligations of Domtar Inc., and the obligations of the non-U.S. guarantors, in respect of the senior secured credit facilities are secured by all of the equity interests of the Company’s direct and indirect subsidiaries, subject to agreed exceptions, and a perfected first priority security interest, lien and hypothec in the inventory of Domtar Inc., its immediate parent, and its direct and indirect subsidiaries.
As ofAt December 31, 2009, there was $6 million outstanding as overdraft recorded in Bank indebtedness under our revolving credit facility (2008—$60 million outstanding and recorded in Long-term debt). In addition, at December 31, 2009,2011 we had outstandingno borrowings and $28 million of letters of credit amounting to $53 millionoutstanding under the program (2010—nil and nil). Sales of receivables under this credit facility (2008—$43 million). We have no other outstanding lettersprogram are accounted for as secured borrowings. Before 2010, gains and losses on securitization of credit (2008—receivables were calculated as the difference between the carrying amount of the receivables sold and the sum of the cash proceeds upon sale and the fair value of the retained subordinated interest in such receivables on the date of the transfer.
In 2011, a net charge of $1 million (2010—$2 million; 2009—$2 million).
Credit Rating
|
|
| ||
| ||||
| ||||
56
resulted from the programs described above and was included in Interest expense in the Consolidated Statements of Earnings. The ratings by Moody’s Investors Services (“Moody’s”) arenet cash outflow in 2011, from the fourth and fifth best ratings in termsreduction of quality within nine rating gradations, withsenior beneficial interest under the numerical modifier 3 indicating a ranking at the low end of a rating category. According to Moody’s, a rating of Baa has moderate credit risk with certain speculative characteristics and the rating of Ba has speculative elements and is subject to substantial credit risk. The ratings by Standard & Poor’s (“S&P”) are the fourth and fifth best ratings in terms of quality within ten rating gradations, with the “minus” indicating a ranking at the lower end of this category. According to S&P, ratings of BBB have adequate protection parameters and ratings of BB have significant speculative characteristics. Moody’s have a “stable” outlook with respect to it ratings and S&P have a “positive” outlook with respect to its rating.
A reduction in our credit ratings would have a negative impact on our access to and cost of capital and financial flexibility. The above ratings are not a recommendation to buy, sell or hold securities and may be subject to revision or withdrawal at any time by the above rating agencies.program was nil (2010—$20 million).
Domtar Canada Paper Inc. Exchangeable Shares
Upon the consummation of the Transaction, Domtar Inc. shareholders had the option to receive either common stock of the Company or shares of Domtar (Canada) Paper Inc. that are exchangeable for common stock of the Company. As of December 31, 2009,2011, there were 982,321619,108 exchangeable shares issued and outstanding. The exchangeable shares of Domtar (Canada) Paper Inc. are intended to be substantially the economicaleconomic equivalent to shares of the Company’s common stock. These shareholders may exchange the exchangeable shares for shares of Domtar Corporation common stock on a one-for-one basis at any time. The exchangeable shares may be
redeemed by Domtar (Canada) Paper Inc. on a redemption date to be set by the Board of Directors, which cannot be prior to July 31, 2023, or upon the occurrence of certain specified events, including, upon at least 60 days prior written notice to the holders, in the event less than 416,667 exchangeable shares (excluding any exchangeable shares held directly or indirectly by us) are outstanding at any time.
On May 29, 2009, our Board of Directors authorized the implementation of a reverse stock split at a 1-for-12 ratio of our outstanding shares. The Board of Directors of Domtar (Canada) Paper Inc. authorized the implementation of a comparable 1-for-12 split of the outstanding exchangeable shares. Shareholder approval for the reverse stock split was obtained at the Company’s Annual General Meeting held on May 29, 2009 and the reverse stock split became effective June 10, 2009 at 6:01p.m. (ET). At the effective time, every 12 exchangeable shares that were issued and outstanding were automatically combined into one issued and outstanding exchangeable share.
OFF BALANCE SHEET ARRANGEMENTS
In the normal course of business, we finance certain of our activities off balance sheet through leases and securitization.
Receivables Securitization
We use securitization of our receivables as a source of financing by reducing our working capital requirements. This securitization program consists of the sale of U.S. and Canadian dollar receivables to a bankruptcy remote entity which, in turn, transfers a senior beneficial interest in them to a special purpose entity managed by a financial institution for multiple sellers of receivables. The agreement governing our receivables securitization program normally allows the daily sale of new receivables to replace those that have been collected. The agreement also limits the cash that can be received from the transfer of the senior beneficial interest. The subordinated interest we retain is included in Receivables on the Consolidated Balance Sheet and will be collected only after the senior beneficial interest has been settled. The book value of the retained subordinated interest approximates fair value.
We retain responsibility for servicing the receivables sold but do not record a servicing asset or liability as the fees received for this service approximate the fair value of the services rendered.
57
In June 2009, we amended the agreement governing our receivables securitization program to include additional receivable pools. The amended agreement expires in October 2010. The maximum cash consideration that can be received from the sale of receivables under the amended agreement is $150 million. The accounting treatment with respect to the transfers of such receivables pursuant to the Transfers and Servicing Topic of FASB ASC has remained unchanged under the amended agreement.
As of December 31, 2009, the senior beneficial interest in receivables held by third parties was $20 million (2008—$110 million). We expect to continue selling receivables on an ongoing basis. Should this program be discontinued either by management’s decision or due to termination of the program by the provider, although not anticipated at this time, our working capital and bank debt requirements will increase.operating leases.
Indemnifications
In the normal course of business, we offer indemnifications relating to the sale of our businesses and real estate. In general, these indemnifications may relate to claims from past business operations, the failure to abide by covenants and the breach of representations and warranties included in sales agreements. Typically, such representations and warranties relate to taxation, environmental, product and employee matters. The terms of these indemnification agreements are generally for an unlimited period of time. At December 31, 2009,2011, we are unable to estimate the potential maximum liabilities for these types of indemnification guarantees as the amounts are contingent upon the outcome of future events, the nature and likelihood of which cannot be reasonably estimated at this time. Accordingly, no provisions havehas been recorded. These indemnifications have not yielded significant expenses in the past.
Tax Sharing Agreement
In conjunction with the Transaction, we signed a Tax Sharing Agreement that governs both our and Weyerhaeuser rights and obligations after the Transaction with respect to taxes for both pre and post-Distribution periods in regards to ordinary course taxes, and also covers related administrative matters. The Distribution refers to the distribution of shares of the Company to Weyerhaeuser shareholders. We will generally be required to indemnify Weyerhaeuser and Weyerhaeuser shareholders against any tax resulting from the Distribution if that tax results from an act or omission to act by us after the Distribution. If Weyerhaeuser, however, should recognize a gain on the Distribution for reasons not related to an act or omission to act by the Company after the Distribution, Weyerhaeuser would be responsible for such taxes and would not be entitled to indemnification by us under the Tax Sharing Agreement.
Pension Plans
We have indemnified and held harmless the trustees of our pension funds, and the respective officers, directors, employees and agents of such trustees, from any and all costs and expenses arising out of the performance of their obligations under the relevant trust agreements, including in respect of their reliance on authorized instructions from us or for failing to act in the absence of authorized instructions. These indemnifications survive the termination of such agreements. At December 31, 2009,2011, we had not recorded a liability associated with these indemnifications, as we do not expect to make any payments pertaining to these indemnifications.
E.B. Eddy Acquisition
InOn July 31, 1998, Domtar Inc. (now a 100% owned subsidiary of Domtar Corporation) acquired all of the issued and outstanding shares of E.B. Eddy Limited and E.B. Eddy Paper, Inc. (E.B. Eddy)(“E.B. Eddy”), an integrated producer of specialty paper and wood products. The purchase agreement relating to this agreement includes a purchase price adjustment whereby, in the event of the acquisition by a third-party of more than 50% of the shares of Domtar Inc. in specified circumstances, Domtar Inc. may be required to pay an increase in consideration of up to a maximum of $115$118 million
58
(CDN$ (CDN$120 million), an amount which is gradually declining over a 25-year period. At March 7, 2007, the closing date of the Transaction, the maximum amount of the purchase price adjustment was $105approximately $108 million (CDN$110 million). No provision was recorded for this potential purchase price adjustment.
On March 14, 2007, we received a letter from George Weston Limited (the previous owner of E.B. Eddy and a party to the purchase agreement) demanding payment of $105$108 million (CDN$110 million) as a result of the consummation of the Transaction. On June 12, 2007, an action was commenced by George Weston Limited against Domtar Inc. in the Superior Court of Justice of the Province of Ontario, Canada, claiming that the consummation of the Transaction triggered the purchase price adjustment and sought a purchase price adjustment of $105$108 million (CDN$110 million) as well as additional compensatory damages. We do not believe that the consummation of the Transaction triggers an obligation to pay an increase in consideration under the purchase price adjustment and intend to defend ourselves vigorously against any claims with respect thereto. However, we may not be successful in our defense of such claims, and if we are ultimately required to pay an increase in consideration, such payment may have a material adverse effect on our financial position, results of operations or
cash flows. On March 31, 2011, George Weston Limited filed a motion for summary judgement which we expect to be resolved by the Court in due course. No provision is recorded for this potential purchase price adjustment.
CONTRACTUAL OBLIGATIONS AND COMMERCIAL COMMITMENTS
In the normal course of business, we enter into certain contractual obligations and commercial commitments. The following tables provide our obligations and commitments at December 31, 2009:2011:
CONTRACTUAL OBLIGATIONS
CONTRACT TYPE | 2010 | 2011 | 2012 | 2013 | 2014 | THEREAFTER | TOTAL | 2012 | 2013 | 2014 | 2015 | 2016 | THEREAFTER | TOTAL | |||||||||||||||||||||||||||||||||||
| (in million of dollars) | (in million of dollars) | ||||||||||||||||||||||||||||||||||||||||||||||||
Notes | $ | 8 | $ | 143 | $ | 8 | $ | 320 | $ | 304 | $ | 925 | $ | 1,708 | |||||||||||||||||||||||||||||||||||
Notes (excluding interest) | — | $ | 74 | — | $ | 213 | $ | 125 | $ | 385 | $ | 797 | |||||||||||||||||||||||||||||||||||||
Capital leases | 3 | 4 | 4 | 3 | 3 | 18 | 35 | 8 | 8 | 7 | 6 | 5 | 38 | 72 | |||||||||||||||||||||||||||||||||||
|
|
|
|
|
|
| |||||||||||||||||||||||||||||||||||||||||||
Long-term debt | 11 | 147 | 12 | 323 | 307 | 943 | 1,743 | 8 | 82 | 7 | 219 | 130 | 423 | 869 | |||||||||||||||||||||||||||||||||||
Operating leases | 30 | 20 | 13 | 7 | 5 | 1 | 76 | 27 | 22 | 18 | 11 | 7 | 5 | 90 | |||||||||||||||||||||||||||||||||||
Liabilities related to uncertain tax benefits(1) | — | — | — | — | — | — | 226 | — | — | — | — | — | — | 253 | |||||||||||||||||||||||||||||||||||
|
|
|
|
|
|
| |||||||||||||||||||||||||||||||||||||||||||
Total obligations | $ | 41 | $ | 167 | $ | 25 | $ | 330 | $ | 312 | $ | 944 | $ | 2,045 | $ | 35 | $ | 104 | $ | 25 | $ | 230 | $ | 137 | $ | 428 | $ | 1,212 | |||||||||||||||||||||
|
|
|
|
|
|
| |||||||||||||||||||||||||||||||||||||||||||
COMMERCIAL OBLIGATIONS
COMMITMENT TYPE | 2010 | 2011 | 2012 | 2013 | 2014 | THEREAFTER | TOTAL | 2012 | 2013 | 2014 | 2015 | 2016 | THEREAFTER | TOTAL | |||||||||||||||||||||||||||||||||||
| (in million of dollars) | (in million of dollars) | ||||||||||||||||||||||||||||||||||||||||||||||||
Other commercial commitments(2) | $ | 117 | $ | 20 | $ | 12 | $ | 2 | $ | 2 | $ | 1 | $ | 154 | $ | 64 | $ | 4 | $ | 4 | $ | 3 | $ | 1 | $ | 3 | $ | 79 | |||||||||||||||||||||
| (1) | We have recognized total liabilities related to uncertain tax benefits of |
| (2) | Includes commitments to purchase property, plant and equipment, roundwood, wood chips, gas and certain chemicals. Purchase orders in the normal course of business are excluded. |
In addition, we expect to contribute a minimum of $40$52 million to the pension plans in 2010.2012.
For 20102012 and the foreseeable future, we expect cash flows from operations and from our various sources of financing to be sufficient to meet our contractual obligations and commercial commitments.
59
RECENT ACCOUNTING PRONOUNCEMENTS
Accounting Change Implemented in 2009
FASB Accounting Standards CodificationStock Compensation
In July 2009,April 2010, the Financial Accounting Standards Board (“FASB”) Accounting Standards Codification (“ASC”) becameissued an update to Compensation—Stock Compensation, which addresses the single sourceclassification of authoritative GAAPan employee share-based payment award with an exercise price denominated in the United States. The previous GAAP hierarchy consistedcurrency of four levels of authoritative accountinga market in which the underlying security trades. This update clarifies that those employee share-based payment awards should not be considered to contain a condition that is not a market, performance, or service condition and reporting guidance, including original pronouncements of the FASB, Emerging Issues Task Force (“EITF”) abstracts, and other accounting literature (together, “previous GAAP”). The Codification eliminated this hierarchy and replaced previous GAAP (other than rules and interpretive releases of the SEC),therefore, an entity would not classify such an award as used by all nongovernmental entities, with just two levels of literature; namely, authoritative and nonauthoritative.
The FASB has indicated that the ASC does not change previous GAAP, instead, the changes aim to reduce the time and efforta liability if it takes for users to research accounting questions and improve the usability of accounting standards by reorganizing them into a topical format, where each topic is subdivided into a number of levels that aggregate all elements of literature related to this topic.
For reporting purposes, the FASB ASC has become effective for financial statements issued for interim and annual periods ended after September 15, 2009.otherwise qualifies as equity. We adopted the FASB ASC in our September 30, 2009 consolidated financial statementsnew requirement on January 1, 2011 with no significant impact.
Fair Value Measurements
We adopted the guidance of Fair Value Measurements and Disclosures Topic of FASB ASC, concerning the fair value measurements and disclosures of financial assets and financial liabilities in the first quarter of 2008. The FASB deferred the effective date of this guidance for one year as it applies to nonfinancial assets and nonfinancial liabilities that are not recognized or disclosed at fair value on a recurring basis. We adopted the deferred guidance in the first quarter of 2009. This guidance provides a common definition of fair value, establishes a framework for measuring fair value, and expands disclosures about fair value. The guidance applies when other accounting standards require or permit fair value measurements but does not require any new fair value measurements.
In April 2009, the FASB issued a modification of the Fair Value Measurements and Disclosures Topic of FASB ASC concerning the determination of fair value when the volume and level of activity for the asset or liability have significantly decreased and for identifying transactions that are not orderly. This modification emphasizes that even if there has been a significant decrease in the volume and level of activity for the asset or liability and regardless of the valuation technique(s) used, the objective of a fair value measurement remains the same. Fair value is the price that would be received to sell an asset or paid to transfer a liability in an orderly transaction (that is, not a forced liquidation or distressed sale) between market participants at the measurement date under current market conditions. The modification also provides guidance on identifying transactions that are not orderly by assessing certain factors among which are: an adequate marketing period for the asset or liability, whether the seller is in a distressed state and whether the transaction price is an outlier compared with recent transactions. The modification amends the disclosure provisions required by the Fair Value Measurements and Disclosures Topic of FASB ASC to require entities to disclose in interim and annual periods the inputs and valuation technique(s) used to measure fair value.
These modifications are effective for interim and annual periods ending after June 15, 2009, and have consequently been adopted by us starting from our June 30, 2009 consolidated financial statements. Since we did not hold any assets or liabilities that are within the scope of these modifications, for which the volume and level of activity have significantly decreased, the measurement requirements outlined were of no impact on our fair value measurements. However, our defined benefit pension plans hold investments in asset backed commercial paper for which there is no active liquid market. See Item 8, Financial Statements and Supplementary Data, Note 7, of this Annual Report on Form 10-K.consolidated financial statements.
60
Faire Value Disclosures for Interim PeriodsComprehensive Income
In April 2009,June 2011, the FASB issued changes to the presentation of comprehensive income. These changes give an entity the option to present the total of comprehensive income, the components of net income, and the
components of other comprehensive income either in a modificationsingle continuous statement of comprehensive income or in two separate but consecutive statements; the option to present components of other comprehensive income as part of the Fair Value Measurementsstatement of changes in stockholders’ equity was eliminated. The items that must be reported in other comprehensive income or when an item of other comprehensive income must be reclassified to net income were not changed. Additionally, no changes were made to the calculation and Disclosures Topicpresentation of FASB ASC concerningearnings per share. These changes become effective on January 1, 2012. We are currently evaluating these changes to determine which option will be chosen for the interim disclosures about fair valuepresentation of financial instruments, to require interim-period disclosures about fair value of financial instruments that were previously madecomprehensive income. Other than the change in presentation, we have determined these changes will not have an impact on an annual basis only.
This modification is effective for interim and annual periods ending after June 15, 2009, with early adoption permitted. We adopted the disclosure requirements in our June 30, 2009 consolidated financial statements with no significant impact.Consolidated Financial Statements.
Measuring Liabilities at Fair ValueCompensation—Retirement Benefits
In August 2009,September 2011, the FASB issued an update to Compensation—Retirement Benefits, which addresses the disclosures about an employer’s participation in a modification of the Fair Value Measurementsmultiemployer plan. The new accounting guidance requires employers participating in multiemployer plans to provide additional quantitative and Disclosures Topic of FASB ASC concerning the measurement of liabilities at fair value when there is a lack of observable market information. This modification provides clarification of the valuation techniques that are requiredqualitative disclosures to provide users with more detailed information regarding an employer’s involvement in circumstances in which a quoted price in an active market for the identical liability is not available. The modification of the valuation techniques hadmultiemployer plans.
We adopted this standard on December 31, 2011, with no impact on our fair value measurements. This modification is effective for the first reporting period (including interim periods) beginning after issuance. We adopted the modification in our September 30, 2009 consolidated financial statements with no significant impact.
Pension Plan Assets
In December 2008, the FASB issued Employers’ Disclosures about Post-retirement Benefit Plan Assets (now included in Compensation—Retirement Benefits Topic of FASB ASC), providing guidance on an employer’s disclosures about plan assets of a defined benefit pension or other post-retirement plan to include:
qualitative disclosures about investments policies and strategies;
disclosures about the major categories of plan assets;
disclosures about fair value measurements of plan assets; and
disclosures about significant concentrations of risk.
This modification is effective for annual periods ending after December 15, 2009, with no obligation to present the same disclosures for earlier periods that are presented for comparative purposes and early adoption is permitted. We adopted the disclosure requirements in our December 31, 2009 consolidated financial statements with no significant impact.
Management’s Assessment of Subsequent Events
In May 2009, the FASB issued Subsequent Events that provides guidance on management’s assessment of subsequent events. Historically, management had relied on U.S. auditing literature for guidance on assessing and disclosing subsequent events. The topic represents the inclusion of guidance on subsequent events in the accounting literature and is directed specifically to management, since management is responsible for preparing an entity’s consolidated financial statements.
This new topic does not significantly change practice because its guidance is similar to that in existing U.S. auditing literature on subsequent events, although with some important modifications. The new topic clarifies that management must evaluate, as of each reporting period, events or transactions that occur after the balance sheet date “through the date that the financial statements are issued or are available to be issued.” Management must perform its assessment for both interim and annual financial reporting periods.
This topic is effective prospectively for interim or annual periods ending after June 15, 2009. We applied the requirements of this topic in the preparation of our consolidated financial statements beginning June 30, 2009 with no significant impact.
61
Equity
In January 2010, the FASB issued Accounting for Distributions to Shareholders with Components of Stock and Cash, which clarifies that the stock portion of a distribution to shareholders that allows them to elect to receive cash or stock with a potential limitation on the total amount of cash that all shareholders can elect to receive in the aggregate is considered a share issuance that is reflected in earnings per share prospectively and not a stock dividend for purposes of applying Equity and Earnings Per Share Topics of FASB ASC.
The amendments in this Update are effective for interim and annual periods ending on or after December 15, 2009, and will not impact us unless we decide to proceed with a distribution to shareholders with components of stock and cash.
Business Combinations
We adopted the guidance of Business Combination Topic of FASB ASC, in the first quarter of 2009. The application of this guidance had no impact on our financial position, results of operations or cash flows as there was no business acquisition during the year. The guidance may materially change the accounting for future business combinations.
Derivative Instruments and Hedging Activities
We adopted during the first quarter of 2009, the guidance of Derivatives and Hedging Topic of FASB ASC, concerning the quarterly disclosure requirements of an entity’s derivative instruments and hedging activities without any significant impact.
Intangible Assets
We adopted during the first quarter of 2009, the guidance of Intangibles—Goodwill and Other Topic of FASB ASC, concerning the factors that should be considered in developing renewal or extensions assumptions used to determine the useful life of a recognized intangible asset and the additional disclosure requirements related to recognized intangible assets. The initial adoption of this accounting guidance had no impact on our financial position, results of operations or cash flows.
Future Accounting Changes The adoption expanded our consolidated financial statements’ footnote disclosures, see Part II, Item 8, Financial Statement and Supplementary Data of this Annual Report on Form 10-K, under Note 7 “Pension plans and other post-retirement benefit plans”.
Transfers of Financial AssetsIntangibles—Goodwill and other
In June 2009,September 2011, the FASB issued Accountingan update to Intangibles—Goodwill and Other, which simplifies how entities test goodwill for Transfersimpairment by permitting an entity to first assess qualitative factors to determine whether it is more likely than not that the fair value of Financial Assets, which amendsa reporting unit is less than its carrying amount as a basis for determining whether it is necessary to perform the derecognitiontwo-step goodwill impairment test. The amendments also improve previous guidance required by expanding upon the Transfersexamples of events and Servicing Topiccircumstances that an entity should consider between annual impairment tests in determining whether it is more likely than not that the fair value of FASB ASC. Some of the major changes undertaken bya reporting unit is less than its carrying amount.
The amended provisions are effective for reporting periods beginning on or after December 15, 2011, with early adoption permitted. We adopted this amendment include:
Eliminating the conceptas of a Qualified Special Purpose Entity (“QSPE”) since the FASB believes,its publication date. This amendment impacts impairment testing steps only, and therefore adoption did not have an impact on the basis of recent experience, that many entities that have been accounted for as QSPEs are not truly passive, a belief that challenges the premise on which the QSPE exception was based.
Modifying the derecognition provisions as required by the Transfers and Servicing Topic of FASB ASC. Specifically aimed to:
62
transfers of individual or groups of financial assets in their entirety, and
transfers of participating interests.
The new amendment is effective for financial asset transfers occurring after the beginning of an entity’s first fiscal year that begins after November 15, 2009. Although the new amendment will impact the way we account for transfers of financial assets, we do not expect the adoption of this accounting guidance to materially impact our consolidated financial position, results of operations or cash flows.
Variable Interest Entities
In June and December 2009, the FASB issued guidance which requires an enterprise to perform an analysis to determine whether the enterprise’s variable interest or interests give it a controlling financial interest in a variable interest entity. This guidance requires ongoing reassessments of whether an enterprise is the primary beneficiary of a variable interest entity, eliminates the quantitative approach previously required for determining the primary beneficiary of a variable interest entity and requires enhanced disclosures that will provide users of financial statements with more transparent information about an enterprise’s involvement in a variable interest entity. This guidance is effective for fiscal years beginning after November 15, 2009, and for interim and annual reporting periods thereafter. The initial adoption of this standard is not expected to have a material effect on our financial position, results of operations or cash flows.
Fair Value Disclosures
In January 2010, the FASB issued an Update of the Fair Value Measurements and Disclosures Topic of FASB ASC requiring new disclosures and amending existing guidance. This Update provides amendments that require new disclosures as follows:
A reporting entity should disclose separately the amounts of significant transfers in and out of Level 1 and Level 2 fair value measurements and describe the reasons for transfers;
In the reconciliation for fair value measurements using significant unobservable inputs (Level 3), a reporting entity should present separately information about purchases, sales, issuances, and settlements.
This Update also provides amendments that clarify existing disclosures as follows:
A reporting entity should provide fair value measurements for each class of assets and liabilities;
A reporting entity should provide disclosures about the valuation techniques and inputs used to measure fair value for both recurring and nonrecurring fair value measurements that fall either in Level 2 or Level 3.
These modifications are effective for interim and annual periods beginning after December 15, 2009, except for the disclosures about purchases, sales, issuances, and settlements in the roll forward activity in Level 3 fair value measurements. Those disclosures are effective for interim and annual periods beginning after December 15, 2010. We do not anticipate these new disclosure requirements to have a significant impact compared to its present level of disclosures.
The preparation of financial statements in conformity with GAAP requires management to make estimates and assumptions that affect our results of operations and financial position. On an ongoing basis, management
63
reviews its estimates, including those related to environmental matters and other asset retirement obligations, useful lives, impairment of long-lived assets, and goodwill, pension plans and other post-retirement benefit plans and income taxes based on currently available information. Actual results could differ from those estimates.
These criticalCritical accounting policies reflect matters that contain a significant level of management estimates about future events, reflect the most complex and subjective judgments, and are subject to a fair degree of measurement uncertainty.
Environmental Matters and Other Asset Retirement Obligations
Environmental expenditures for effluent treatment, air emission, landfill operation and closure, asbestos containment and removal, bark pile management, silvicultural activities and site remediation (together referred to as environmental matters) are expensed or capitalized depending on their future economic benefit. In the normal
course of business, we incur certain operating costs for environmental matters that are expensed as incurred. Expenditures for property, plant and equipment that prevent future environmental impacts are capitalized and amortized on a straight-line basis over 10 to 40 years. Provisions for environmental matters are not discounted, except for a portion which areis discounted due to more certainty with respect to timing of expenditures, and areis recorded when remediation efforts are probable and can be reasonably estimated.
We recognize asset retirement obligations, at fair value, in the period in which we incur a legal obligation associated with the retirement of an asset. Our asset retirement obligations are principally linked to landfill capping obligations, asbestos removal obligations and demolition of certain abandoned buildings. Conditional asset retirement obligations are recognized, at fair value, when the fair value of the liability can be reasonably estimated or on a probability weighted discounted cash flow estimate. The associated costs are capitalized as part of the carrying value of the related asset and depreciated over its remaining useful life. The liability is accreted using the credit adjusted risk-free interest rate used to discount the cash flow.
The estimate of fair value is based on the results of the expected future cash flow approach, in which multiple cash flow scenarios that reflect a range of possible outcomes are considered. We have established cash flow scenarios for each individual asset retirement obligation. Probabilities are applied to each of the cash flow scenarios to arrive at an expected future cash flow. There is no supplemental risk adjustment made to the expected cash flows. The expected cash flow for each of the asset retirement obligations are discounted using the credit adjusted risk-free interest rate for the corresponding period until the settlement date. The rates used vary, based on the prevailing rate at the moment of recognition of the liability and on its settlement period. The rates used vary between 5.5% and 12.0%.
Cash flow estimates incorporate either assumptions that marketplace participants would use in their estimates of fair value, whenever that information is available without undue cost and effort, or assumptions developed by internal experts.
In 2009,2011, our operating expenses for environmental matters amounted to $62 million ($62 million in 2010, $71 million ($81 million in 2008)2009).
We made capital expenditures for environmental matters of $8 million in 2011 ($3 million in 2010, $2 million in 20092009), excluding the $83 million spent under the Pulp and Paper Green Transformation Program, which was reimbursed by the Government of Canada, ($451 million in 2008)2010, nil in 2009) for the improvement of air emissions and energy efficiency, effluent treatment and remedial actions to address environmental compliance. At this time, we cannot reasonably estimate
On December 23, 2011, the additional capital expenditures that may be required. However, management expects that any additional required expenditure would not haveEPA proposed a material adverse effect onnew set of standards related to emissions from boilers and process heaters included in the Company’s financial position, resultsmanufacturing processes. These standards are generally referred to as Boiler MACT. These proposed rules are open for comment and final versions of operations or cash flows.these Rules are expected in mid-2012. It is anticipated compliance will be required by in the fall of 2015. We expect that the capital cost required to comply with the Boiler MACT rules, as they were published in December 2011, is between $34 million to $52 million. We are currently assessing the associated increase in operating costs as well as alternate compliance strategies.
We are also a party to various proceedings relating to the cleanup of hazardous waste sites under the Comprehensive Environmental Response Compensation and Liability Act, commonly known as “Superfund,” and similar state laws. The EPA and/or various state agencies have notified us that we may be a potentially responsible party with respect to other hazardous waste sites as to which no proceedings have been instituted
64
against us. We continue to take remedial action under our Care and Control Program, as such sites mostly relate to our former wood preserving operating sites, and a number of operating sites due to possible soil, sediment or groundwater contamination. The investigation and remediation process is lengthy and subject to the uncertainties of changes in legal requirements, technological developments and, if and when applicable, the allocation of liability among potentially responsible parties.
An action was commenced by Seaspan International Ltd. (“Seaspan”) in the Supreme Court of British Columbia, on March 31, 1999 against Domtar Inc. and others with respect to alleged contamination of Seaspan’s site bordering Burrard Inlet in North Vancouver, British Columbia, including contamination of sediments in Burrard Inlet, due to the presence of creosote. As of July 3, 2002,creosote and heavy metals. On February 16, 2010, the parties entered into a partial Settlement Agreement which provided that while the agreement is performed in accordance with its terms, the action commenced by Seaspan would be held in abeyance. The Settlement Agreement focused on the sharing of costs between Seaspan and Domtar Inc. for certain remediation of contamination referred to in the plaintiff’s claim. The Settlement Agreement did not address all of the plaintiff’s claims, and such claims cannot be reasonably determined at this time. On June 3, 2008, Domtar was notified by Seaspan that it terminated the Settlement Agreement. The government of British Columbia issued on February 16, 2010 a Remediation Order to Seaspan and Domtar Inc. in order to define and implement an action plan to address soil, sediment and groundwater issues. This Order may bewas appealed within 30 days fromto the date of this OrderEnvironmental Appeal Board (“Board”) on March 17, 2010 but there is no suspension in the execution of this Order unless the Appeal Board orderorders otherwise. We are currently reviewing our options in this respect.The appeal hearing has been scheduled for October 2012. The relevant government authorities selected a remediation plan on July 15, 2011. In the interim, no stay of execution has been granted or requested. We have recorded an environmental reserve to address our estimated exposure.exposure in this matter.
While we believe that we have determined the costs for environmental matters likely to be incurred, based on known information, our ongoing efforts to identify potential environmental concerns that may be associated with the properties may lead to future environmental investigations. These efforts may result in the determination of additional environmental costs and liabilities, which cannot be reasonably estimated at this time. For example, changes in climate change regulations—seeregulation – See Part I, Item 3, Legal Proceedings, under the caption “Climate change regulation.”
At December 31, 2009,2011, we had a provision of $111$92 million ($99107 million at December 31, 2008)2010) for environmental matters and other asset retirement obligations. Certain of these amounts have been discounted due to more certainty of the timing of expenditures. Additional costs, not known or identifiable, could be incurred for remediation efforts. Based on policies and procedures in place to monitor environmental exposure, we believe that such additional remediation costs would not have a material adverse effect on our financial position, results of operations or cash flows.
At December 31, 2009,2011, anticipated undiscounted payments in each of the next five years are as follows:
| 2010 | 2011 | 2012 | 2013 | 2014 | THEREAFTER | TOTAL | |||||||||||||||
| (in millions of dollars) | |||||||||||||||||||||
Environmental provision and other asset retirement obligations | $ | 15 | $ | 37 | $ | 18 | $ | 6 | $ | 8 | $ | 27 | $ | 111 | |||||||
| 2012 | 2013 | 2014 | 2015 | 2016 | THEREAFTER | TOTAL | ||||||||||||||||||||||
| (in millions of dollars) | ||||||||||||||||||||||||||||
Environmental provision and other asset retirement obligations | $ | 24 | $ | 26 | $ | 8 | $ | 3 | $ | 2 | $ | 77 | $ | 140 | ||||||||||||||
Useful Lives
Our property, plant and equipment are stated at cost less accumulated depreciation, including asset impairment write-downs. Interest costs are capitalized for significant capital projects. For timber limits and timberlands, amortization is calculated using the unit of production method. For deferred financing fees, amortization is calculated using the effective interest rate method. For all other assets, amortization is calculated using the straight-line method over the estimated useful lives of the assets.
We acquired intangible assets as part of the Transaction. Our intangible assets are stated at cost less accumulated amortization, including any applicable intangible asset impairment write-down. Water rights, customer relationships, certain trade names and a supplier agreement are amortized on a straight-line basis over their
65
estimated useful lives of 40 years, 20 to 40 years, 7 years and 5 years, respectively. Natural gas contracts and powerPower purchase agreements are each amortized on a straight-line basis over the term of the respective contract. The weighted-average amortization period is 4 years for natural gas contracts and 25 years for power purchase agreements. Cutting rights are amortized using the units of production method.One trade name is considered to have an indefinite useful life and is therefore not amortized.
On a regular basis, we review the estimated useful lives of our property, plant and equipment as well as our intangible assets. Assessing the reasonableness of the estimated useful lives of property, plant and equipment and intangible assets requires judgment and is based on currently available information. During 2007, we reviewed the useful lives of the property, plant and equipment and intangible assets acquired from Domtar Inc. using information obtained from the preliminary fair value and purchase price allocation. During the fourth quarter of 2007, we completed the valuation of all assets acquired as well as their useful lives which did not change from our initial estimates. In the process of completing such allocation, in 2007 we revised the amounts allocated to certain assets from those previously reported. The principal significant elements for which such amounts were modified included property, plant and equipment and intangible assets. Changes in circumstances such as technological advances, changes to our business strategy, changes to our capital strategy or changes in regulation can result in the actual useful lives differing from our estimates. Revisions to the estimated useful lives of property, plant and equipment and intangible assets constitute a change in accounting estimate and are dealt with prospectively by amending depreciation and amortization rates.
A change in the remaining estimated useful life of a group of assets, or their estimated net salvage value, will affect the depreciation or amortization rate used to depreciate or amortize the group of assets and thus affect depreciation or amortization expense as reported in our results of operations. A change of one year in the composite estimated useful life of our fixed asset base would impact annual depreciation and amortization expense by approximately $18 million. In 2009,2011, we recorded depreciation and amortization expense of $405$376 million compared to $463$395 million in 2008.2010. At December 31, 2009,2011, we had property, plant and equipment with a net book value of $4,129$3,459 million ($4,3013,767 million in 2008)2010) and intangible assets, net of amortization of $85$204 million ($8156 million in 2008)2010).
Impairment of Long-Lived Assets
Long-lived assets are reviewed for impairment upon the occurrence of events or changes in circumstances indicating that, at the lowest level of determinable cash flows, the carrying value of the long-lived assets may not be recoverable. Step I of the impairment test assesses if the carrying value of the long-lived assets exceeds their estimated undiscounted future cash flows in order to assess if the assets are impaired. In the event the estimated undiscounted future cash flows are lower than the net book value of the assets, a Step II impairment test must be carried out to determine the impairment charge. In Step II, long-lived assets are written down to their estimated fair values. Given that there is generally no readily available quoted value for our long-lived assets, we determine fair value of our long-lived assets using the estimated discounted future cash flow (“DCF”) expected from their use and eventual disposition, and by using the liquidation or salvage value in the case of idled assets. The DCF in Step II is based on the undiscounted cash flows in Step I.
Ashdown, Arkansas pulp and paper mill—Closure of a paper machine
As a result of the decision to permanently shut down one of four paper machines on March 29, 2011, we recognized $73 million of accelerated depreciation, under Impairment and write-down of property, plant and equipment, in 2011 and a charge of $1 million related to the write off of inventory. Given the substantial decline in the production capacity, at our Ashdown Facility, we conducted a quantitative Step I impairment test in the first quarter of 2011 and concluded that the recognition of an impairment loss for our Ashdown mill’s remaining long-lived assets was not required.
Lebel-sur-Quévillon Pulp Mill and Sawmill—Impairment of assets
In the fourth quarter of 2008, we decided to permanently shut down our Lebel-sur-Quévillon pulp mill and sawmills. In 2011, following the signing of a definitive agreement (see Part II, Item 8, Financial Statements and Supplementary Data, Note 27 “Subsequent events”), we recorded a $12 million impairment and write-down of property, plant and equipment relating to the remaining assets net book value.
Plymouth Pulp and Paper Mill—Conversion to Fluff Pulp
In the fourth quarter of 2009, asAs a result of the decision to permanently shut down the remaining paper machine and convert our Plymouth facility to 100% fluff pulp production byin the fourth quarter of 2010,2009, we recognized, under Impairment and write-down of property, plant and equipment, $13$39 million of accelerated depreciation in 2010 in addition to $13 million in the fourth quarter of 2009 and we expect to record a further $39$1 million of accelerated depreciation overwrite-down for the first nine months of 2010related paper machine in relation to the assets that will cease productive use in October 2010 when the conversion is completed.2010.
Given the substantial change in use of the pulp and paper mill, we conducted a Step I impairment test in the fourth quarter of 2009 and concluded that the recognition of an impairment loss for theour Plymouth mill’s remaining long-lived assets was not required as the aggregate estimated undiscounted future cash flows exceeded the then carrying value of the asset group of $336 million at the time of the announcement by a significant amount.
66
Estimates of undiscounted future cash flows used to test the recoverability of the fixed assets included key assumptions related to trend prices, inflation-adjusted cost projections, and the estimated useful life of the fixed assets. The main sources of such assumptions and related benchmarks were largely the same as those listed under “Impairment of Goodwill” below.
Changes in our assumptions and estimates may affect our forecasts and may lead to an outcome where impairment charges would be required. In addition, actual results may vary from our forecasts, and such variations may be material and unfavorable, thereby triggering the need for future impairment tests where our conclusions may differ in reflection of prevailing market conditions.
The following table summarizes the approximate impact that a change in certain key assumptions would have on the estimated undiscounted future cash flows at December 31, 2008, while holding all other assumptions constant:
Key Assumption | Increase of | Approximate impact on the undiscounted cash flows | ||||
| (In millions of dollars) | ||||||
Fluff pulp pricing | $ | 5/ton | $ | 31 | ||
Plymouth Pulp and Paper Mill—Closure of Paper Machine
In the first quarter of 2009, we announced that we would permanently reduce our paper manufacturing at our Plymouth pulp and paper mill, by closing one of the two paper machines comprising the mill’s paper production unit. As a result, at the end of February 2009, there was a curtailment of 293,000 tons of the mill’s paper production capacity and the closure affected approximately 185 employees and a $35employees. Also, $13 million of accelerated depreciation charge was recorded in the firstfourth quarter of 2009, and a further $39 million of accelerated depreciation over the first nine months of 2010, were recorded for the related write-down on plant and equipment. Given the closure of the paper machine, we conducted a Step I impairment test on our Plymouth mill operation’s fixed assets and concluded that the undiscounted estimated future cash flows associated with the remaining long-lived assets exceeded their carrying value and, as such, no additional impairment charge was required.
Columbus Paper Mill
On March 16, 2010, we announced that we would permanently close our coated groundwood paper mill in Columbus, Mississippi. This measure resulted in the permanent curtailment of 238,000 tons of coated groundwood and 70,000 metric tons of thermo-mechanical pulp, as well as affected 219 employees. We recorded a $9 million write-down for the related fixed assets under Impairment and write-down of property, plant and equipment and $16 million of other charges under Closure and restructuring costs, refer to Part II, Item 8, Financial Statements and Supplementary Data of this Annual Report on Form 10-K, under Note 16 “Closure and restructuring costs and liability.” Operations ceased in April 2010.
Cerritos
During the second quarter of 2010, we decided to close our Cerritos, California forms converting plant, and recorded a $1 million write-down for the related assets under Impairment and write-down of property, plant and equipment and $1 million in severance and termination costs under Closure and restructuring costs, refer to Part II, Item 8, Financial Statements and Supplementary Data of this Annual Report on Form 10-K, under Note 16 “Closure and restructuring costs and liability.” Operations ceased on July 16, 2010.
Prince Albert Pulp Mill
As a result of a review of currentavailable options for the disposal of the assets of this facility in the fourth quarter of 2009, we revised the estimated net realizable values of the remaining assets and recorded a non-cash write-down of $14 million, in the fourth quarter of 2009, related to fixed assets, mainlyprimarily a turbine and a boiler. The write-down representsrepresented the difference between the new estimated liquidation or salvage value of the fixed assets and their carrying values.
Dryden Pulp and Paper Mill
In the fourth quarter of 2008, as a result of the decision to permanently shut down the remaining paper machine and converting center of the Dryden mill, we wrote-down $11 million of the net book value to bring these assets to their estimated recoverable amount. Given the substantial change in use of the pulp and paper mill, we conducted a Step I impairment test on the remaining Dryden pulp mill operation’s fixed assets. Estimates of undiscounted future cash flows used to test the recoverability of the fixed assets included key assumptions related to trend prices, inflation-adjusted cost projections, the forecasted exchange rate for the U.S. dollar and the estimated useful life of the fixed assets. The main sources of such assumptions and related benchmarks were largely the same as those listed under “Impairment of Goodwill” below.
Step I of the impairment test demonstrated that the carrying values of the fixed assets exceeded their estimated undiscounted future cash flows, indicating that an impairment exists. A Step II test was undertaken to determine the fair value of the remaining assets and we recorded a non-cash impairment charge of $265 million in the fourth quarter of 2008 to reduce the assets to their estimated fair value.
67
Subsequent to the decision to shut down one paper machine at our Dryden mill and the write-down of $92 million related to this paper machine, we conducted a Step I impairment test on the remaining Dryden mill fixed assets during the fourth quarter of 2007. Estimates of undiscounted future cash flows used to test the recoverability of a long-lived asset included key assumptions related to trend prices, the 15-year forecasted exchange rate for the U.S. dollar and the estimated useful life of the long-lived assets. The trend prices were based on an analysis of external price trends, including published industry guidance. The forecasted Canadian-U.S. foreign exchange rate assumptions were based on independent market information, as well as analysis of historical data, trends and cycles. We concluded that the recognition of an impairment loss for the Dryden mill was not required.
Columbus Paper Mill
During the fourth quarter of 2008, we were informed that beginning in early 2009, our Columbus mill would cease to benefit from a favorable power purchase agreement. This change in circumstances impacted the profitability outlook for the foreseeable future and triggered the need for a Step I impairment test of the fixed assets. Estimates of undiscounted future cash flows used to test the recoverability of the fixed assets included key assumptions related to trend prices, inflation-adjusted cost projections, and the estimated useful life of the fixed assets. The main sources of such assumptions and related benchmarks were largely the same as those listed under “Impairment of Goodwill” below.
Step I of the impairment test demonstrated that the carrying values of the fixed assets exceeded their estimated undiscounted future cash flows, indicating that an impairment exists. A Step II test was undertaken to determine the fair value of the remaining assets, and we recorded a non-cash impairment charge of $95 million in the fourth quarter of 2008 to reduce the assets to their estimated fair value.
Wood Segment
In the fourth quarter of 2009 and 2008, we conducted an impairment test on the fixed assets and intangible assets (“the Asset Group”) of the Wood reportable segment. The need for such test was triggered by operating losses sustained by the segment in 2007, 2008 and 2009, as well as short-term forecasted operating losses.
We completed the Step I impairment test during each period and concluded that the recognition of an impairment loss for the Wood reportable segment’s long-lived assets was not required as the aggregate estimated undiscounted future cash flows exceeded the carrying value of the Asset Group of $161 million by a significant amount.
Estimates of undiscounted future cash flows used to test the recoverability of the Asset Group included key assumptions related to trend prices, inflation-adjusted cost projections, forecasted exchange rate for the U.S. dollar and the estimated useful life of the Asset Group. We believe such assumptions to be reasonable and to reflect forecasted market conditions at the valuation date. They involve a high degree of judgment and complexity and reflect our best estimates with the information available at the time our forecasts were developed. To this end, we evaluate the appropriateness of our assumptions as well as our overall forecasts by comparing projected results of upcoming years with actual results of preceding years and validating that differences therein are reasonable. Key assumptions were related to trend prices (based on data from Resource Information Systems Inc. or “RISI”, an authoritative independent source in the global forest products industry), material and energy costs and foreign exchange rates. A number of benchmarks from independent industry and other economic publications were used in order to develop projections for the forecast period.
68
The following table summarizes the approximate impact that a change in certain key assumptions would have on the estimated undiscounted future cash flows at December 31, 2009, while holding all other assumptions constant:
Key Assumptions | Increase of | Approximate impact on the undiscounted cash flows | |||||
| (In millions of dollars) | |||||||
Foreign exchange rates ($US to $CDN) | $ | 0.01 | $ | (30 | ) | ||
Lumber pricing | $ | 5 /MFBM | 32 | ||||
Changes in our assumptions and estimates may affect our forecasts and may lead to an outcome where impairment charges would be required. In addition, actual results may vary from our forecasts, and such variations may be material and unfavorable, thereby triggering the need for future impairment tests where our conclusions may differ in reflection of prevailing market conditions.
Lebel-sur-Quévillon Pulp Mill and Sawmill
Pursuant to the decision in the fourth quarter of 2008 to permanently shut down the Lebel-sur-Quévillon pulp mill and sawmill of the Papers and Wood reportable segments, respectively, we have recorded a non-cash write-down of $4 million related to fixed assets at both locations consisting mainly of a turbine, a recovery system and saw lines. The write-down represents the difference between the estimated liquidation or salvage value of the fixed assets and their carrying values.
White River Sawmill
In the fourth quarter of 2008, the net assets of the White River sawmill of the Wood reportable segment were held for sale and measured at the lower of its carrying value or estimated fair value less cost to sell. The fair value was determined by analyzing values assigned to it in a current potential sale transaction together with conditions prevailing in the markets where the sawmill operates. Pursuant to such analysis, non-cash write-downs amounting to $8 million related to fixed assets and $4 million related to intangible assets were recorded in the fourth quarter of 2008 to reflect the difference between their respective estimated fair values less cost to sell and their carrying values. The sawmill was sold in June 2009 and we recorded a gain of $1 million related to the transaction.
Impairment of Goodwill
Goodwill is not amortized and ismay be subject to an annual goodwill impairment test. This test is carried outin the fourth quarter of every year or more frequently if events or changes in circumstances indicate that goodwillit might be impaired. AFor purposes of determining whether it is necessary to perform the two-step goodwill impairment test, we first assess qualitative factors to determine whether the existence of events or circumstances leads to a determination that it is more likely than not that the fair value of a reporting unit is less than its carrying amount. If, after assessing the totality of events or circumstances, we determine it is more likely than not that the fair value of a reporting unit is less than its carrying amount, then performing the Step I of the two-step impairment test is unnecessary. The Step I goodwill impairment test determines whether the fair value of a reporting unit exceeds the net carrying amount of that reporting unit, including goodwill, as of the assessment date in order to assess if goodwill is impaired. If the fair value is greater than the net carrying amount, no impairment is necessary. In the event that the net carrying
amount exceeds the fair value, athe Step II goodwill impairment test must be performed in order to determine the amount of the impairment charge. The implied fair value of goodwill in this test is estimated in the same way as goodwill was determined at the date of the acquisition in a business combination. That is, the excess of the fair value of the reporting unit over the fair value of the identifiable net assets of the reporting unit represents the implied value of goodwill. To accomplish this Step II test, the fair value of the reporting unit’s goodwill must be estimated and compared to its carrying value. The excess of the carrying value over the fair value is taken as an impairment charge in the period.
For purposes of impairment testing, goodwill must be assigned to one or more of our reporting units. We test goodwill at the reporting unit level. All goodwill as of December 30, 2007,31, 2011 resided in our Personal Care segment. The goodwill in the PapersPersonal Care segment and based uponoriginates from the impairment test conductedacquisition of Attends in September 2011.
In the fourth quarter of 2008, as described below, was determined to be impaired and written-off.
69
Step I Impairment Test
We determined that the discounted cash flow method (“DCF”) was the most appropriate approach2011, we assessed qualitative factors to determine fair valuewhether the existence of the Papers reporting unit. We have developed our projection of estimated future cash flows for the period from 2009events or circumstances led to 2013 (the “Forecast Period”) to serve asa determination that it was more likely than not that the basis of the DCF as well as a terminal value. In doing so, we have used a number of key assumptions and benchmarks that are discussed under “Key Assumptions” below. Our discounted future cash flow analysis resulted in a fair value of the reporting unit belowwas less than its carrying amount. After assessing the carrying valuetotality of the Papers reporting units net assets.
In order to evaluate the appropriateness of the conclusions of our Step I impairment test, our estimated fair value as a wholeevents and circumstances, we determined it was reconciled to our market capitalization and compared to selected transactions involvingnot more likely than not that the sale of comparable companies.
Step II Impairment Test
In Step II of the impairment test, the estimated fair value of the Papers reporting unit determined in Step I, was allocated toless than its tangible and identified intangible assets, based on their relative fair values, in order to arrive atcarrying amount. Thus, performing the fair value of goodwill. To this end, different valuation techniques were used to determine the fair values of individual tangible and intangible assets. A depreciated replacement cost method was mainly used to determine the fair value of fixed assets to the extent such values did not have economic obsolescence. Economic obsolescence was based on cash flow projections. For idled mills of the Papers reporting unit, liquidation or salvage values were largely used as an indication of the fair values of their assets. The fair value of identified intangible assets, mainly consisting of marketing, customer and contract-related assets, were determined using an income approach.
Thetwo-step impairment test concluded that goodwill was impairedunnecessary and we recorded a non-cashno impairment charge of $321 million in the fourth quarter of 2008 to reflect the complete write-off of thewas recorded for goodwill.
In 2007, we performed our annual impairment test of goodwill. As a result, we determined that the Wood segment goodwill was impaired, necessitating an impairment charge of $4 million. The impairment was largely due to the deteriorating of economic conditions in the Wood segment.
Key Assumptions
The various valuation techniques used in Steps I and II incorporate a number of assumptions that we believe to be reasonable and to reflect forecasted market conditions at the valuation date. Assumptions in estimating future cash flows are subject to a high degree of judgement. We make all efforts to forecast future cash flows as accurately as possible with the information available at the time a forecast is made. To this end, we evaluate the appropriateness of our assumptions as well as our overall forecasts by comparing projected results of upcoming years with actual results of preceding years and validating those differences therein are reasonable. Key assumptions relate to: prices trends, material and energy costs, the discount rate, rate of decline of demand, the terminal growth rate, and foreign exchange rates. A number of benchmarks from independent industry and other economic publications were used in order to develop projections for the forecast period. Examples of such benchmarks and other assumptions include:
Revenues—the evolution of pulp and paper pricing over the forecast period was based on data from RISI.
Direct costs mainly consisted of fiber, wood, chemical and energy costs. The evolution of these direct costs over the forecast period was based on data from a number of benchmarks related to: selling prices of pulp, oil prices, housing starts, US producer price index, mixed chemical index, corn, natural gas, coal and electricity.
Foreign exchange rate estimates were based on a number of economic forecasts including those of Consensus Economics, Inc. reports.
70
Discount rate—The discount rate used to determine the present value of the Papers reporting unit’s forecasted cash flows represented our weighted average cost of capital (“WACC”). Our WACC was determined to be between 10.5% and 11%.
Rate of decline of demand and terminal growth rate—we assumed that a number of business and commercial papers would see demand declines in line with industry expectations. This was reflected in our assumptions in the rate of decline in demand over the forecast period as well as in our assumption of the terminal growth rate.
Pension Plans and Other Post-Retirement Benefit Plans
We have several defined contribution plans and multi-employermultiemployer plans. The pension expense under these plans is equal to our contribution. PensionDefined contribution pension expense was $24 million for the year ended December 31, 20092011 ($2125 million in 2008)2010 and $24 million in 2009).
We have several defined benefit pension plans covering substantially alla majority of employees. In the United States, this includes pension plans that are qualified under the Internal Revenue Code (“qualified”) as well as a plan that provides benefits in addition to those provided under the qualified plans for a select group of employees, which is not qualified under the Internal Revenue Code (“unqualified’unqualified”). In Canada, plans are registered under the Income Tax Act and under their respective provincial pension acts (“registered”), or plans may provide additional benefits to a select group of employees, and not be registered under the Income Tax Act or provincial pension acts (“non-registered”). The defined benefit plans are generally contributory in Canada and non-contributory in the United States. We also provide post-retirement plans to eligible Canadian and U.S. employees; the plans are unfunded and include life insurance programs, medical and dental benefits and short-term and long-term disability programs. TheWe also provide supplemental unfunded benefit plans to certain senior management employees. Related pension and other post-retirement expenseplan expenses and the relatedcorresponding obligations are actuarially determined using management’s most probable assumptions.
We have several defined benefit pension plans covering a majority of employees. The defined benefit pension plans are generally contributory in Canada and non-contributory in the United States. Non-unionized employees in Canada joining our Company after June 1, 2000 participate in defined contribution pension plans. Salaried employees in the U.S. joining our Company after January 1, 2008 participate in a defined contribution pension plan. Also, starting on January 1, 2013, all unionized employees covered under the agreement with the United Steel Workers not grandfathered under the existing defined benefit pension plans will transition to a defined contribution pension plan for future service. We also provide other post-retirement plans to eligible Canadian and U.S. employees; the plans are unfunded and include life insurance programs, medical and dental benefits. We also provide supplemental unfunded defined benefit pension plans to certain senior management employees.
We account for pensions and other post-retirement benefits in accordance with Compensation-Retirement Benefits Topic of FASB ASC which requires employers to recognize the overfunded or underfunded status of defined benefit pension plans as an asset or liability in its Consolidated Balance Sheets. Pension and other post-retirement benefit assumptions include the discount rate, the expected long-term rate of return on plan assets, the rate of compensation increase, health care cost trend rates, mortality rates, employee early retirements and
terminations or disabilities. Changes in these assumptions result in actuarial gains or losses which we have elected to amortizeamortized over the expected average remaining service life of the active employee group covered by the plans only to the extent that the unrecognized net actuarial gains and losses are in excess of 10% of the greater of the accrued benefit obligation and the market-related value of plan assets at the beginning of the year.
An expected rate of return on plan assets of 6.8%6.3% was considered appropriate by our management for the determination of pension expense for 2009.2011. Effective January 1, 2010,2012, we will use 7.0%6.0% as the expected return on plan assets, which reflects the current view of long-term investment returns. The overall expected long-term rate of return on plan assets is based on management’s best estimate of the long-term returns of the major asset classes (cash and cash equivalents, equities and bonds) weighted by the actual allocation of assets at the measurement date, net of expenses. This rate includes an equity risk premium over government bond returns for equity investments and a value-added premium for the contribution to returns from active management.
We set our discount rate assumption annually to reflect the rates available on high-quality, fixed income debt instruments, with a duration that is expected to match the timing and amount of expected benefit payments. High-quality debt instruments are corporate bonds with a rating of AA or better. The discount rates at December 31, 20092011 for pension plans were estimated at 6.4%4.9% for the accrued benefit obligation and 6.8%5.3% for the net periodic benefit cost for 20092011 and for post-retirement benefit plans were estimated at 6.3%5.0% for the accrued benefit obligation and 6.0%5.5% for the net periodic benefit cost for 2009.2011.
The rate of compensation increase is another significant assumption in the actuarial model for pension (set at 2.7% for the accrued benefit obligation and 2.8%2.9% for the net periodic benefit cost) and for post-retirement
71
benefits (set at 2.8% for the accrued benefit obligation and 3.0%2.8% for the net periodic benefit cost) and is determined based upon our long-term plans for such increases.
For measurement purposes, a 7.0%5.8% weighted-average annual rate of increase in the per capita cost of covered health care benefits was assumed for 2010.2012. The rate was assumed to decrease gradually to 4.1% by 20292032 and remain at that level thereafter.
The following table provides a sensitivity analysis of the key weighted average economic assumptions used in measuring the accrued pension benefit obligation, the accrued other post-retirement benefit obligation and related net periodic benefit cost for 2009.2011. The sensitivity analysis should be used with caution as it is hypothetical and changes in each key assumption may not be linear. The sensitivities in each key variable have been calculated independently of each other.
Sensitivity Analysis
| PENSION | OTHER POST-RETIREMENT BENEFIT | |||||||||||||||
PENSION AND OTHER POST-RETIREMENT | ACCRUED BENEFIT OBLIGATION | NET PERIODIC BENEFIT COST | ACCRUED BENEFIT OBLIGATION | NET PERIODIC BENEFIT COST | ||||||||||||
| (In millions of dollars) | ||||||||||||||||
Expected rate of return on assets | ||||||||||||||||
Impact of: | ||||||||||||||||
1% increase | N/A | ($ | 15 | ) | N/A | N/A | ||||||||||
1% decrease | N/A | 15 | N/A | N/A | ||||||||||||
Discount rate | ||||||||||||||||
Impact of: | ||||||||||||||||
1% increase | ($ | 173 | ) | (13 | ) | ($ | 12 | ) | — | |||||||
1% decrease | 201 | 17 | 15 | 1 | ||||||||||||
Assumed overall health care cost trend | ||||||||||||||||
Impact of: | ||||||||||||||||
1% increase | N/A | N/A | 9 | 1 | ||||||||||||
1% decrease | N/A | N/A | (8 | ) | (1 | ) | ||||||||||
The assets of the pension plans are held by a number of independent trustees and are accounted for separately in our pension funds. Our investment strategy for the assets in the pension plans is to maintain a diversified portfolio of assets, invested in a prudent manner to maintain the security of funds while maximizing returns within the guidelines provided in the investment policy. The Company’s pension funds are not permitted to own any of the Company’s shares or debt instruments. The target asset allocation is based on the expected duration of the benefit obligation.
The following table shows the allocation of the plan assets, based on the fair value of the assets held and the target allocation for 2011:
ALLOCATION OF PLAN ASSETSat December 31 | TARGET ALLOCATION | PERCENTAGE PLAN ASSETS AT DECEMBER 31, 2011 | PERCENTAGE PLAN ASSETS AT DECEMBER 31, 2010 | |||||||||
| (in %) | ||||||||||||
Fixed income | ||||||||||||
Cash and cash equivalents | 0% –10% | 5 | % | 3 | % | |||||||
Bonds | 53% – 63% | 58 | % | 58 | % | |||||||
Equity | ||||||||||||
Canadian equity | 7% –15% | 10 | % | 11 | % | |||||||
U.S. equity | 7% –16% | 12 | % | 14 | % | |||||||
International equity | 13% – 22% | 15 | % | 14 | % | |||||||
|
|
|
| |||||||||
Total(1) | 100 | % | 100 | % | ||||||||
|
|
|
| |||||||||
| (1) | Approximately 87% of the pension plan assets relate to Canadian plans and 13% relate to U.S. plans. |
Our pension plan funding policy is to contribute annually the amount required to provide for benefits earned in the year, and to fund both solvency deficiencies and past service obligations over periods not exceeding those permitted by the applicable regulatory authorities. Past service obligations primarily arise from improvements to plan benefits. The other post-retirement benefit plans are not funded and contributions are made annually to cover benefit payments. We expect to contribute a minimum total amount of $52 million in 2012 compared to $95 million in 2011 (2010—$161 million) to the pension plans. The payments made in 2011 to the other post-retirement benefit plans amounted to $8 million (2010—$8 million).
The estimated future benefit payments from the plans for the next ten years at December 31, 2011 are as follows:
ESTIMATED FUTURE BENEFIT PAYMENTS FROM THE PLANS | PENSION PLANS | OTHER POST- RETIREMENT BENEFIT PLANS | ||||||
| (in millions of dollars) | ||||||||
2012 | $ | 206 | $ | 7 | ||||
2013 | 134 | 7 | ||||||
2014 | 99 | 7 | ||||||
2015 | 101 | 7 | ||||||
2016 | 105 | 6 | ||||||
2017 – 2021 | 576 | 34 | ||||||
Asset Backed Commercial Paper
At December 31, 2011, our Canadian defined benefit pension funds held asset backed commercial paper investments (“ABCP”) valued at $205 million (CDN$208 million) representing 12% of the total fair value of assets held in the pension funds. At December 31, 2010, the plans held ABCP valued at $214 million (CDN$213 million). During 2011, the total value of the ABCP benefited from an increase in market value of
$3 million (CDN$3 million). A decrease in value of the Canadian dollar resulted in a decrease in the value of the ABCP of $4 million. Repayments in 2011 totalled $8 million (CDN$8 million).
Most of these ABCP (valued at $178 million (2010 – $193 million; 2009 – $186 million) were subject to restructuring under the court order governing the Montreal Accord that was completed in January 2009, while the remaining ABCP valued at $27 million (2010 – $21 million; 2009 – $19 million) were restructured separately.
While there is a market for the ABCP held by our pension plans, this market is not considered sufficiently liquid to use for valuation purposes. Accordingly, the value of the ABCP is mainly based on a financial model incorporating uncertainties regarding return, credit spreads, the nature and credit risk of underlying assets, and the amounts and timing of cash inflows.
The largest conduit owned by the pension plans in the Montreal Accord, representing 75% of the total value, consists mainly of investments that serve as collateral to back credit default derivatives that protect counterparties against credit defaults above a specified threshold on different portfolios of corporate credits. The valuation methodology was based upon determining an appropriate credit spread for each class of notes based upon the implied protection level provided by each class against potential credit defaults. This was done by comparison to spreads for an investment grade credit default index and the comparable tranches within the index for equivalent credit protection. In addition, a liquidity premium of 1.75% was added to this spread. The resulting spread was used to calculate the present value of all such notes, based upon the anticipated maturity date. An additional discount of 2.5% was applied to the value to reflect uncertainty over collateral values held to support the derivative transactions. The resulting interest rate was used to calculate the present value of this class of ABCP, based upon the anticipated maturity date in early 2017. An increase in the discount rate of 1% would reduce the value by $7 million (CDN$7 million) for these ABCP.
The value of the remaining ABCP that were subject to the Montreal Accord were sourced either from the asset manager of the ABCP, or from trading values for similar securities of similar credit quality. The remaining ABCP that were not subject to the Montreal Accord, which also provide protection to counterparties against credit defaults through derivatives, were valued based upon the value of the investment held in the conduit that serve as collateral for the derivative counterparties, net of the market value of the credit derivatives as provided by the sponsor of the conduit, with an additional discount (equivalent to 1.75% per annum) applied for illiquidity.
Possible changes that could materially impact the future value of the ABCP include (1) changes in the value of the underlying assets and the related derivative transactions, (2) developments related to the liquidity of the ABCP market, (3) a severe and prolonged economic slowdown in North America and the bankruptcy of referenced corporate credits, and (4) the passage of time, as most of the notes will mature in early 2017.
Multiemployer Plans
We contribute to nine multiemployer defined benefit pension plans under the terms of collective agreements that cover certain Canadian union-represented employees (Canadian multiemployer plans) and U.S. union-represented employees (U.S. multiemployer plans). The risks of participating in these multiemployer plans are different from single-employer plans in the following aspects:
| a) | assets contributed to the multiemployer plan by one employer may be used to provide benefits to employees of other participating employers, |
| b) | for the U.S. multiemployer plans, if a participating employer stops contributing to the plan, the unfunded obligations of the plan may be borne by the remaining participating employers, and |
| c) | for the U.S. multiemployer plans, if we choose to stop participating in some of our multiemployer plans, we may be required to pay those plans an amount based on the underfunded status of the plan, referred to as a withdrawal liability. |
Our participation in these plans for the annual periods ended December 31 is outlined in the table below. The plan’s 2011 and 2010 actuarial status certification was completed as of January 1, 2011 and January 1, 2010 respectively, and is based on the plan’s actuarial valuation as of January 1, 2010 and January 1, 2009 respectively. This represents the most recent Pension Protection Act (“PPA”) zone status available. The zone status is based on information that we received from the plan and is certified by the plan’s actuary. Our significant plan is in the red zone, which means it is less than 65 percent funded.
| Pension Protection Act Zone Status | Contributions from Domtar to Multiemployer (b) | |||||||||||||||||||||||||||
Pension Fund | EIN / Pension Plan Number | 2011 | 2010 | FIP / RP Status Pending / Implemented | 2011 | 2010 | 2009 | Surcharge imposed? | Expiration CBA | |||||||||||||||||||
U.S. Multiemployer Plans | $ | $ | $ | |||||||||||||||||||||||||
PACE Industry Union- | ||||||||||||||||||||||||||||
Management Pension Fund | 11-6166763-001 | Red | Red | Yes - Implemented | 3 | 3 | 3 | Yes | November 1, 2011 | |||||||||||||||||||
Canadian Multiemployer Plans | ||||||||||||||||||||||||||||
Pulp and Paper Industry | ||||||||||||||||||||||||||||
Pension Plan (a) | N/A | N/A | N/A | N/A | 3 | 2 | 2 | N/A | April 30, 2012 | |||||||||||||||||||
|
|
|
|
|
| |||||||||||||||||||||||
| Total | 6 | 5 | 5 | |||||||||||||||||||||||||
Total contributions made to all plans that are not individually significant |
| 1 | 1 | 1 | ||||||||||||||||||||||||
|
|
|
|
|
| |||||||||||||||||||||||
Total contributions made to all plans |
| 7 | 6 | 6 | ||||||||||||||||||||||||
|
|
|
|
|
| |||||||||||||||||||||||
| (a) | In the event that the Canadian multiemployer plans are underfunded, the monthly benefit amount can be reduced by the trustees of the plan. Moreover, we are not responsible for the underfunded status of the plan because the Canadian multiemployer plans do not require participating employers to pay a withdrawal liability or penalty upon withdrawal. |
| (b) | For each of the three years presented, our contributions to each multiemployer plan do not represent more than five percent of total contributions to each plan as indicated in the plan’s most recently available annual report. |
We will withdraw from participation in one of the multiemployer plans in 2012. The expected withdrawal liability, recorded in December 2011 (see Part II, Item 8, Financial Statements and Supplementary Data of this Annual Report on Form 10-K, under Note 16 “Closure and restructuring costs and liability”) is $32 million. We are reviewing our participation in the remaining multiemployer pension plans.
Income Taxes
We use the asset and liability method of accounting for income taxes. Under this method, deferred tax assets and liabilities are determined according to differences between the carrying amounts and tax bases of the assets and liabilities. The change in the net deferred tax asset or liability is included in earnings. Deferred tax assets and liabilities are measured using enacted tax rates and laws expected to apply in the years in which assets and liabilities are expected to be recovered or settled. For these years, a projection of taxable income and an assumption of the ultimate recovery or settlement period for temporary differences are required. The projection of future taxable income is based on management’s best estimate and may vary from actual taxable income.
On a quarterly basis, we assess the need to establish a valuation allowance for deferred tax assets and, if it is deemed more likely than not that our deferred tax assets will not be realized based on these taxable income
projections, a valuation allowance is recorded. In general, “realization” refers to the incremental benefit achieved through the reduction in future taxes payable or an increase in future taxes refundable from the deferred tax assets. Evaluating the need for an amount of a valuation allowance for deferred tax assets often requires significant judgment. All available evidence, both positive and negative, should be considered to determine whether, based on the weight of that evidence, a valuation allowance is needed.
In our evaluation process, we give the most weight to historical income or losses. After evaluating all available positive and negative evidence, although realization is not assured, we determined that it is more likely than not that the results of future operations will generate sufficient taxable income to realize the deferred tax assets, with the exception of certain state credits for which a valuation allowance of $4 million has been recorded in 2011.
Our short-term deferred tax assets are mainly composed of temporary differences related to various accruals, accounting provisions, as well as a portion of our net operating loss carry forwards and available tax credits. The majority of these items are expected to be utilized or paid out over the next year. Our long-term deferred tax assets and liabilities are mainly composed of temporary differences pertaining to plant, equipment, pension and post-retirement liabilities, the remaining portion of net operating loss carry forwards and other tax attributes, and other items. Estimating the ultimate settlement period requires judgment and our best estimates. The reversal of timing differences is expected at enacted tax rates, which could change due to changes in income tax laws or the introduction of tax changes through the presentation of annual budgets by different governments. As a result, a change in the timing and the income tax rate at which the components will reverse could materially affect deferred tax expense in our future results of operations.
In addition, U.S. and foreign tax rules and regulations are subject to interpretation and require judgment that may be challenged by taxation authorities. To the best of our knowledge, we have adequately provided for our future tax consequences based upon current facts and circumstances and current tax law. In accordance with Income Taxes Topic of FASB ASC 740, we evaluate new tax positions that result in a tax benefit to us and determine the amount of tax benefits that can be recognized. The remaining unrecognized tax benefits are evaluated on a quarterly basis to determine if changes in recognition or classification are necessary. Significant changes in the amount of unrecognized tax benefits expected within the next 12 months are disclosed quarterly. Future recognition of unrecognized tax benefits would impact the effective tax rate in the period the benefits are recognized. At December 31, 2011, we had gross unrecognized tax benefits of $253 million. If our income tax positions with respect to the alternative fuel mixture tax credits are sustained, either all or in part, then we would recognize a tax benefit in the future equal to the amount of the benefits sustained. Our tax treatment of the income related to the alternative fuel mixture tax credits resulted in the recognition of a tax benefit of $2 million in 2010, which impacted the effective tax rate. This credit expired December 31, 2009. Refer to Part II, Item 8, Financial Statements and Supplementary Data of this Annual Report on Form 10-K, under Note 10 “Income taxes” for details on the unrecognized tax benefits.
Alternative Fuel Tax Credits
The U.S. Internal Revenue Code of 1986, as amended (the “Code”) permitted a refundable excise tax credit, until the end of 2009, for the production and use of alternative bio fuel mixtures derived from biomass. We submitted an application with the IRS to be registered as an alternative fuel mixer and received notification that our registration had been accepted in late March 2009. We began producing and consuming alternative fuel mixtures in February 2009 at our eligible mills. Although the credit ended at the end of 2009, in 2010, we recorded $25 million of such credits in Other operating (income) loss on the Consolidated Statement of Earnings (Loss) compared to $498 million in 2009. The $25 million represented an adjustment to amounts presented as deferred revenue at December 31, 2009 and was released to income following guidance issued by the IRS in March 2010. We recorded an income tax expense of $7 million in 2010 compared to $162 million in 2009 related to the alternative fuel mixture income. The amounts for the refundable credits are based on the volume of alternative bio fuel mixtures produced and burned during that period.
In 2009, we received a $140 million cash refund and another $368 million cash refund, net of federal income tax offsets, in 2010. Additional information regarding unrecognized tax benefits is included in Part II,
Item 8, Financial Statements and Supplementary Data of this Annual Report on Form 10-K, under Note 10 “Income taxes.”
Although we do not expect a significant change in our unrecognized tax benefits associated with the alternative fuel tax credits from 2009 during the next 12 months, a favorable audit by the IRS or the issuance of authoritative guidance could result in the recognition of some or all of these previously unrecognized tax benefits. As of December 31, 2011, we have gross unrecognized tax benefits and interest of $192 million and related deferred tax assets of $15 million associated with the alternative fuel tax credits. The recognition of these benefits, $177 million net of deferred taxes, would impact the effective tax rate.
Cellulosic Biofuel Credit
In July 2010, the IRS Office of Chief Counsel released an Advice Memorandum concluding that qualifying cellulosic biofuel sold or used before January 1, 2010, is eligible for the cellulosic biofuel producer credit (“CBPC”) and would not be required to be registered by the Environmental Protection Agency. Each gallon of qualifying cellulose biofuel produced by any taxpayer operating a pulp and paper mill and used as a fuel in the taxpayer’s trade or business during calendar year 2009 would qualify for the $1.01 non-refundable CBPC. A taxpayer could be able to claim the credit on its federal income tax return for the 2009 tax year upon the receipt of a letter of registration from the IRS and any unused CBPC may be carried forward until 2015 to offset a portion of federal taxes otherwise payable.
We had approximately 207 million gallons of cellulose biofuel that qualifies for this CBPC for which we had not previously claimed under the Alternative Fuel Mixture Credit (“AFMC”) that represents approximately $209 million of CBPC or approximately $127 million of after tax benefit to the Corporation. In July 2010, we submitted an application with the IRS to be registered for the CBPC and on September 28, 2010, we received our notification from the IRS that we were successfully registered. On October 15, 2010 the IRS Office of Chief Counsel issued an Advice Memorandum concluding that the AFMC and CBPC could be claimed in the same year for different volumes of biofuel. In November 2010, we filed an amended 2009 tax return with the IRS claiming a cellulosic biofuel producer credit of $209 million and recorded a net tax benefit of $127 million in Income tax expense (benefit) on the Consolidated Statement of Earnings for December 31, 2010. As of December 31, 2011, approximately $25 million of this credit remains to offset future U.S. federal income tax liability.
Closure and Restructuring Costs
Closure and restructuring costs are recognized as liabilities in the period when they are incurred and are measured at their fair value. For such recognition to occur, management, with the appropriate level of authority, must have approved and committed to a firm plan and appropriate communication to those affected must have occurred. These provisions may require an estimation of costs such as severance and termination benefits, pension and related curtailments, environmental remediation, and may also include expenses related to demolition, training and outplacement. Actions taken may also require an evaluation of any remaining assets to determine the required write-downs, if any, and a review of estimated remaining useful lives which may lead to accelerated depreciation expense.
Estimates of cash flows and fair value relating to closures and restructurings require judgment. Closure and restructuring costs are based on management’s best estimates of future events at December 31, 2011. Although we do not anticipate significant changes, the actual costs may differ from these estimates due to subsequent developments such as the results of environmental studies, the ability to find a buyer for assets set to be dismantled and demolished and other business developments. As such, additional costs and further working capital write-downs may be required in future periods.
| ITEM 7A. | QUANTITATIVE AND QUALITATIVE DISCLOSURE ABOUT MARKET RISK |
Our income can be impacted by the following sensitivities:
Estimates of
Our
| |||||||||||||||||||||||||||||||||||||||||||||||||||||||||||||||||||||||||||||||||||||||||||||||||||||||||||||||||||||||||||||||||||||||||||||||||||||||||||||||||||||||||||||||||||||||||||||||||||||||||||||||||||||||||||||||||||||||||||||||||||||||||||||||||||||||||||||||||||||||||||||||||||||||||||||||||||||||||||||||||||||||||||||||||||||||||||||||||||||||||||||||||||||||||||||||||||||||||||||||||||||||||||||||||||||||||||||||||||||||||||||||||||||||||||||||||||||||||||||||||||||||||||||||||||||||||||||||||||||||||||||||||||||||||||||||||||||||||||||||||||||||||||||||||||||||||||||||||||||||||||||||||||||||||||||||||||||||||||||||||||||||||||||||||||||||||||||||||||||||||||||||||||||||||||||||||||||||||||||||||||||||||||||||||||||||||||||||||||||||||||||||||||||||||||||||||||||||||||||||||||||||||||||||||||||||||||||||||||||||||||||||||||||||||||||||||||||||||||||||||||||||||||||||||||||||||||||||||||||||||||||||||||||||||||||||||||||||||||||||||||||||||||||||||||||||||||||||||||||||