UNITED STATES
SECURITIES AND EXCHANGE COMMISSION
Washington, D.C. 20549
FORM 10-K
| x | ANNUAL REPORT PURSUANT TO SECTION 13 OR 15(d) OF THE SECURITIES EXCHANGE ACT OF 1934 |
For the Fiscal Year ended December 31, 20092011
or
| ¨ | TRANSITION REPORT PURSUANT TO SECTION 13 OR 15(d) OF THE SECURITIES EXCHANGE ACT OF 1934 |
For the transition period from to .
Commission file number: 000-50600
BLACKBAUD, INC.
(Exact name of registrant as specified in its charter)
| Delaware | 11-2617163 | |
(State or other jurisdiction of incorporation or organization) | (I.R.S. Employer Identification No.) |
2000 Daniel Island Drive
Charleston, South Carolina 29492
(Address of principal executive offices, including zip code)
(843) 216-6200
(Registrant’s telephone number, including area code)
Securities Registered Pursuant to Section 12(b) of the Act:
Title of Each Class | Name of Each Exchange on which Registered | |
| Common Stock, $0.001 Par Value | The NASDAQ Stock Market LLC (NASDAQ Global Select Market) |
Securities Registered Pursuant to Section 12(g) of the Act: None
Indicate by check mark if the registrant is a well-known seasoned issuer, as defined in Rule 405 of the Securities Act.
YES x NO ¨
Indicate by check mark if the registrant is not required to file reports pursuant to Section 13 or Section 15(d) of the Act.
YES ¨ NO x
Indicate by check mark whether the registrant (1) has filed all reports required to be filed by Section 13 or 15(d) of the Securities Exchange Act of 1934 during the preceding 12 months (or for such shorter period that the registrant was required to file such reports), and (2) has been subject to such filing requirements for the past 90 days. YES x NO ¨
Indicate by check mark whether the registrant has submitted electronically and posted on its corporate Web site, if any, every Interactive Data File required to be submitted and posted pursuant to Rule 405 of Regulation S-T (Section 232.405 of this chapter) during the preceding 12 months (or for such shorter period that the registrant was required to submit and post such files). YES ¨x NO ¨
Indicate by check mark if disclosure of delinquent filers pursuant to Item 405 of Regulation S-K (Section 229.405 of this chapter) is not contained herein, and will not be contained, to the best of registrant’s knowledge, in definitive proxy or information statements incorporated by reference in Part III of this Form 10-K or any amendment to this Form 10-K. ¨x
Indicate by check mark whether the registrant is a large accelerated filer, an accelerated filer, a non-accelerated filer or a smaller reporting company. See definitions of “large accelerated filer,” “accelerate filer” and “smaller reporting company” in Rule 12b-2 of the Exchange Act.
| Large accelerated filer x | Accelerated filer ¨ | |
| Non-accelerated filer ¨ | Smaller reporting company ¨ |
Indicate by check mark whether registrant is a shell company (as defined in Rule 12b-2 of the Exchange Act).
YES ¨ NO x
The aggregate market value of the registrant’s common stock held by non-affiliates of the registrant on June 30, 20092011 (based on the closing sale price of $15.55$27.72 on that date), was approximately $588,267,650.$1,086,698,096. Common stock held by each officer and director and by each person known to the registrant who owned 10% or more of the outstanding common stock have been excluded in that such persons may be deemed to be affiliates. This determination of affiliate status is not necessarily a conclusive determination for other purposes.
The number of shares of the registrant’s common stock outstanding at February 12, 201010, 2012 was 44,551,083.44,940,623.
DOCUMENTS INCORPORATED BY REFERENCE
Portions of the registrant’s definitive Proxy Statement for the 20102012 Annual Meeting of Stockholders currently scheduled to be held June 23, 201020, 2012 are incorporated by reference into Part III hereof.
ANNUAL REPORT ON FORM 10-K
| Page | ||||||
PART I | ||||||
Item 1. | 1 | |||||
Item 1A. | 15 | |||||
Item 1B. | 30 | |||||
Item 2. | 30 | |||||
Item 3. | 30 | |||||
Item 4. |
| 30 | ||||
PART II | ||||||
Item 5. | 31 | |||||
Item 6. | 35 | |||||
Item 7. | Management’s discussion and analysis of financial condition and results of operations | 38 | ||||
Item 7A. | 62 | |||||
Item 8. | 62 | |||||
Item 9. | Changes in and disagreements with accountants on accounting and financial disclosure | 62 | ||||
Item 9A. | 62 | |||||
Item 9B. | 63 | |||||
PART III | ||||||
Item 10. | 64 | |||||
Item 11. | 64 | |||||
Item 12. | Security ownership of certain beneficial owners and management and related stockholder matters | 64 | ||||
Item 13. | Certain relationships, related transactions and director independence | 64 | ||||
Item 14. | 64 | |||||
PART IV | ||||||
Item 15. | 65 | |||||
i
CAUTIONARY STATEMENT REGARDING FORWARD-LOOKING STATEMENTS
This Annual Report on Form 10-K contains certain statements that may be deemed to be “forward-looking statements” that anticipate results based on our estimates, assumptions and plans that are subject to uncertainty. These statements are made subject to the safe-harbor provisions of the Private Securities Litigation Reform Act of 1995, Section 27A of the Securities Act of 1933 and Section 21E of the Securities Exchange Act of 1934. All statements in this report not dealing with historical results or current facts are forward-looking and are based on estimates, assumptions and projections. Statements which include the words “believes,” “seeks,” “expects,” “may,” “might,” “should,” “intends,” “likely,” “targets,” “plans,” “anticipates,” “estimates” or the negative version of those words and similar statements of a future or forward-looking nature identify forward-looking statements.
Although we attempt to be accurate in making these forward-looking statements, it is possible that future circumstances might differ from the assumptions on which such statements are based. In addition, other important factors that could cause results to differ materially include those set forth under “Item 1A. Risk factors” and elsewhere in this report and in our other SEC filings. We undertake no obligation to update or revise publicly any forward-looking statements, whether as a result of new information, future events or otherwise.
PART I
Overview
We are the leading global provider of software and related services designed specifically for nonprofit organizations. Our missionstated company purpose is to makepower the world a better placebusiness of philanthropy from fundraising to outcomes. We strive to help our customers accomplish their missions and are guided by working with the nonprofit community to improve lives. We support our mission statement through the following corporate values:
Our people make us great.
Customers are at the heart of everything we do.
We must be good stewards of our resources.
Innovation drives success.
Our actions are guided by honesty and integrity.
Service to others makes the world a better place.
Our customers use our products and services to help increase donations, reduce fundraising costs, build online communities and improve communications with constituents, manage their finances and optimize operations. We have focused solely on the nonprofit market since our incorporation in 1982. At the end of 2009,2011, we had approximately 22,00026,000 customers spread over 5560 countries. Our customers come from nearly every segment of the nonprofit sector, including education, foundations, health and human services, faith-based, arts and cultural, public and societal benefits, environment and animal welfare, and international and foreign affairs.
Nonprofit Industry
The nonprofit industry is large and diverse
There were more than 1.71.8 million U.S. nonprofit organizations registered with the Internal Revenue Service in 2008,2010, including 1.21.3 million charitable 501(c)(3) organizations, and we estimate there are approximately another 2.0 million nonprofit organizations internationally. According to Giving USA 2009,2011, donations to nonprofit
organizations in the U.S.United States in 20082010 were $307.7$290.9 billion, amounting to 2.2%2.0% of U.S. GDP.GDP, which increased from donations in 2009 of $280.3 billion. The compound annual growth rate of donations over the 40 year40-year period from 19681970 to 20082010 was 7.2%6.8%, not adjusted for inflation. These organizations also receive fees for services they provide, which are estimated at approximately $850 billionmore than $1 trillion annually.
Johns Hopkins University’s 2006 Nonprofit Employment Data Project, the most recent survey on nonprofit employment data, indicated that nonprofits employ nearly 10% of the work force in the United States and more if volunteers are included. Also according to this study, worldwide, nonprofit organizations accounted for $1.3 trillion in total annual expenditures.
Traditional methods of fundraising are often costly and inefficient
Many nonprofits use manual methods or stand-alone software applications not designed to manage fundraising. Such methods are often costly and inefficient because of the difficulties in effectively collecting, sharing, and using donation-related information. Furthermore, general purpose and Internet-related software applications frequently have limited functionality and do not efficiently integrate multiple databases. Based on our market research, nearly a quarter of every dollar donated is used for fundraising expenses alone. Some nonprofit organizations have developed proprietary software, but doing so is expensive, requiring on-site technical personnel for development, implementation and maintenance.
The nonprofit industry faces particular operational challenges
Nonprofit organizations must efficiently:
Solicit funds and build relationships with major donors;
Garner small cash contributions from numerous contributors;
Manage and develop complex relationships with large numbers of constituents;
Communicate their accomplishments and importance of their mission;
Comply with complex accounting, tax and reporting issues that differ from traditional businesses;
Solicit cash and in-kind contributions from businesses to help raise money or deliver products/services;
Provide a wide array of programs and services to individual constituents; and
Improve the data collection and sharing capabilities of their employees, volunteers and donors by creating and providing distributed access to centralized databases.
In addition, as a result of the negative impact the recent economic environment has had on donations, we believe the nonprofit industrysector has an even greater need for operational efficiencies to maximize the services they can deliver. Because of these challenges, we believe nonprofit organizations can benefit from software applications specifically designed to serve their particular needs.
The Blackbaud Solutions
We offer a broad suite of products and services that address the fundraising needs and operational challenges facing nonprofit organizations by providing themorganizations. We provide our customers with software and services that help them increase donations, reduce the overall costs of managing their businesses and build a strong sense of community while effectively managing communications with their constituents. We provide our solutions to nonprofit organizations in several ways. Today, weWe offer our products principally on a perpetual license basis. However, an increasing number of our products are offered onbasis, a software-as-a-service (SaaS)(“SaaS”), or as a “hosted” software offering and we expect this trend to continue in the future.offerings. We also offer a suite of analytical tools and related services that enable nonprofit organizations to extract, aggregate and analyze vast quantities of data to make better-informed operational decisions. In addition, we help our customers increase the returns on their technology investments by providing a broad range of consulting, training and professional services, as well as maintenance and technical support.
Nonprofit organizations use our products and services to increase donations
Managing the fundraising process is a critical business function for nonprofits. Our fundraising and constituent relationship management solutions allow nonprofit organizations to establish, maintain and develop their relationships with current and prospective donors and other constituents. Our fundraising products and services enable them to use a centralized database, as well as the Internet and an array of analytical tools, to facilitate and expand their fundraising efforts. In addition, we believe our products and services help nonprofit organizations increase donations by enabling them to:
Solicit large numbers of potential donors;
Deliver personalized messages that drive constituent action;
Provide an easy-to-use system for sharing and using critical fundraising information;
Utilize our Internet-based offerings to communicate their missions and receive online donations, and support online volunteer and events management;management, and participate in social networks; and
Simplify and automate business processes.
Nonprofit organizations use Blackbaud software, services and tools to improve operational effectiveness
Our comprehensive suite of software, services and analytical tools help nonprofit organizations manage the key aspects of their operations. By automating business processes, our products streamline operations for our customers and help to reduce the overall costs of operating their organizations. We provide solutions that address many of the technological and business process needs of our customers, including:
Constituent relationship management;
Financial management and reporting;
Cost accounting information for projects and grants;
Integration of financial data and donor information in a centralized system;
Internet basedInternet-based fundraising;
Event, data and information management;
Student information systems for independent schools and small colleges;
Ticketing management;
Data analysis and reporting tools and services;
Online interactive communities for social networking and relationship management;
Management of complex volunteer networks; and
Results tracking for multiple campaigns.
Our Strategy
Our objective is to maintain and extend our position as the leading provider of software and related services designed specifically for nonprofit organizations.organizations, supporting their missions from fundraising to outcomes. Key elementsstrategies for achieving this objective are to:
GrowAchieve worldwide constituent relationship management (“CRM”) leadership for our customer baseBlackbaud CRM product
We intend to expandextend the penetration of our industry-leading customer base and enhanceBlackbaud CRM product line to larger, more complex nonprofit organizations, leveraging our market position. We have established a strong market presenceexpertise with approximately 22,000 customers. However,enterprise implementations to achieve worldwide leadership in a 2007 nonprofit market survey by Addison Whitney, only 30% of respondents were familiar with Blackbaud.CRM. We believe thatour Blackbaud CRM solution is a scalable solution designed specifically to meet the fragmented nature
needs of the industry presents an opportunity for us to continue to increase our market penetration. We plan to achieve this by making use of our experience, the depth of our product capabilities,mid- to-large-sized organizations, bringing together disparate information such as annual and our strong brand recognition. We also intend to expand our overall sales efforts, especially national accounts and enterprise-focused sales teams.
Maintain and expand existing customer relationships
We have historically had success selling maintenance renewals and additional products and services to existing customers. In each of the past five years, approximately 95% of our customers renewed their maintenance and support plans. We will continue to pursue opportunities to expand our existing customer base by increasing both the number of our products and services they use and the frequency with which they use them. To this end, we have dedicated sales teams that focus exclusively on selling products and services to existing customers.
Enable customers to effectively utilize the Internet as a comprehensive business tool
We will enhance our existing products and develop new products and services that will allow our customers to more fully utilize the Internet to effectively achieve their missions. Although online fundraising comprises a small percentage of all charitable contributions, our research indicates that online donations are growing as a percentage of total contributions. A study we conducted together with the ePhilanthropy Foundation found that online donations increased by 44% in 2008. We offer a variety of Internet applications and consulting services that allow nonprofits to use the Internet for online fundraising, e-marketing, alumni and membership directories, newsletters, event managementcapital giving, gift planning, major giving, and volunteer coordination.
Introduce additional productssystems, both online and services
We intend to use our expertiseoffline and experience in developing leading products foracross various chapters and programs within a given organization. With a single system of record that can be securely and efficiently shared, organizations can turn their data into timely, actionable information that increases the nonprofit industry to introduce additional productssuccess of their fundraising efforts, better synchronizes campaigns across chapters and related services. We plan to build strongerfield offices, and strengthens relationships with existing customers and attract new customers. constituents.
We believe that our existing proprietary software can form the foundation for an evena wider range of products and servicessolutions for nonprofit organizations. Our current products share over half of our proprietary software code and were developed using common standards and practices. We believe this shared code allows us to more cost effectively expedite the development and rollout of product offerings and updates. In addition, we are building our future product offerings on athis common platform, which we anticipate will improve our ability to create new offerings
efficiently and expeditiously.expeditiously, while allowing our customers to seamlessly collect and analyze supporter information from a variety of sources. In the future, we plan to offer pre-packaged solutions designed to service an even larger group of nonprofit organizations.
Pursue strategic acquisitions and alliancesGrow our worldwide customer base
We intend to expand our industry-leading customer base and enhance our market position. We have established a strong market presence with approximately 26,000 customers. We believe that the fragmented nature of the industry presents an opportunity for us to continue to increase our market penetration. We plan to achieve this by making use of our next generation solutions to continue transforming our business to cloud-based, which should allow us to serve the whole mid-market customer segment. We also plan to streamline our sales efforts to the small market customer segment and intend to expand our direct sales efforts, especially with regard to national, enterprise and global account-focused sales teams.
We believe the United Kingdom, Canada, Australia and Netherlands, as well as other international markets, represent growing market opportunities for our products and services. We believe the overall market of international nonprofit organizations is changing. Donations to international nonprofit organizations are becoming increasingly important in response to reductions in governmental funding. U.S.-based nonprofit organizations are growing their international activities and opening overseas locations. We believe the international marketplace is currently underserved, and we intend to increase our presence by expanding our sales and marketing efforts internationally. We plan to sell complementary products and services to our installed base of customers, and we plan to develop and offer new products tailored to international markets, including leveraging our market leading domestic analytics solutions to develop offerings tailored specifically to meet the needs of foreign and multi-national nonprofits.
Revolutionize the customer experience
We intend to make our customers’ experience with us effective, efficient and satisfying from the initial interest in our products and services, to purchase, to customer support and product enhancement. We continue to evolve the manner in which we package and sell our offerings to provide higher value combined with flexibility to meet the different needs of our existing and prospective customers. For example, we are increasing the number of our offerings sold under a subscription pricing model, which can make it easier for customers to purchase our solutions. We will continue to focus on providing the highest level of product support while continuing to enhance our existing products and developing new products and services designed to help allow our customers to more effectively achieve their missions.
Pursue strategic partnerships
We intend to continue to selectively pursue acquisitions, expansion of existing partnerships and alliances in the futuredevelopment of new strategic partnerships to enter new markets and pursue significant untapped opportunities. We intend to develop these alliances with companies that provide us with complementary technology, customers and personnel with significant relevant experience, as well as to increase our access to additional geographic and vertical markets. We have completed significant acquisitions over the past five years includingboth in the acquisition of Target Software, Inc.United States and Target Analysis Group, Inc., or the Target Companies, in January 2007, eTapestry.com, or eTapestry, in August 2007, Kintera Inc., or Kintera, in July 2008internationally and RLC Customer Centric Technology B.V., or RLC, in April 2009.expect to continue to do so. We are also currently involved in a number of strategic relationships.relationships which allow us to provide a wider variety of offerings and provide customers with integrated solutions, further enhancing the value of our proprietary technology. We believe that our size and our history of leadership in the nonprofit sector make us an attractive acquirer or partner for others in the industry.
Expand international presenceOur Operating Structure
The nonprofit market is very diverse, with organizations that range from small, local charities to large, multinational relief organizations. The needs of nonprofits can vary greatly according to their size. To better
serve the wide variety of nonprofits in the market, we organize our operating structure into three operating units: the Enterprise Customer Business Unit, or ECBU, the General Markets Business Unit, or GMBU, and the International Business Unit, or IBU.
Following is a description of each of our operating units:
The ECBU is focused on marketing, sales, delivery and support to large and/or strategic customers, specifically identified named prospects and customers in North America. In addition, the ECBU is focused on marketing, sales and delivery of analytic services to all prospects and customers worldwide.
The GMBU is focused on marketing, sales, delivery and support to all emerging and mid-sized prospects and customers in North America that are not specifically identified as ECBU prospects and customers.
The IBU is focused on marketing, sales, delivery and support to all prospects and customers outside of North America.
Each operating unit contains specialized sales, services, support, marketing, and finance functions. We believe the United Kingdom, Canada, and Australia as well as other international markets represent growing market opportunities for our products and services. As further discussed below, we recently established a separate business unitthis structure allows us to servebe more responsive to the needs of our operations in internationalfundamentally different customer segments and to focus on developing solutions appropriate for these unique markets and expand our presence in these markets. The acquisition of RLC in April 2009 provided us a foundation to expand intowhile leveraging the Netherlands and other Western European markets. We currently have offices in Almere, Netherlands; Glasgow, Scotland; London, England; Sydney, Australia; and Toronto, Canada. We believe the overall market of international nonprofit organizations is changing. Donations to nonprofit organizations are increasing in response to reductions
in governmental funding of certain activities. U.S.-based nonprofit organizations are growing their international activities and opening overseas locations. We believe the international marketplace is currently underserved and we intend to increase our international presence by expanding our sales and marketing efforts. We plan to make useinfrastructure of our installed base of customers to sell complementary productsbroader organization and services, and we planshared technology in a cost-effective manner. It also allows us to develop highly customized approaches to marketing and offer newselling our products tailored to international markets.in the markets we serve.
Products and Services
We license software and provide various services to our customers. During 2009,2011, we generated revenue in sixfour reportable segments and in four geographic regions, as described in more detail in Note 1415 of our consolidated financial statements. These revenue segments are license fees, maintenance fees, and subscription fees for our software products, consulting and education services, analytic services and others. Effective January 1, 2010, we reorganized our business into three operating units, which we believe will better align our organization around key customer groups. The three operating units are the General Markets Business Unit, the Enterprise Customer Business Unit and the International Business Unit.
Software products
We offer nonprofit organizations a wide variety of software products, which can be used individually to help organizations with specific functions, such as fundraising, financial management, website management and prospect research, or combined into a fully-integrated suite of tools to help them manage multiple areas of their operations.
Fundraising and Constituent Relationship Management
The Raiser’s Edge
The Raiser’s Edge is the leading software application specificallysolution designed to manage a nonprofit organizations’organization’s constituent relationship management and fundraising activity. It is used by more than 13,000 organizations worldwide and recently won the 2010 Campbell Award for User Satisfaction. The Raiser’s Edge enables nonprofit organizations to communicate with their constituents, manage fundraising activities, expand their development efforts and make better informed decisions through powerful segmentation, analysis and reporting capabilities. The Raiser’s Edge is highly configurable, allowing a nonprofit organizationorganizations to create numerous custom views of constituent records and automate a variety of business processes. Among other things, The Raiser’s Edge allows an organization to access extensive biographical and demographic information about donors and prospects, process gifts, monitor solicitation activity, analyze data and publish reports. The Raiser’s EdgeIt also improves operational efficiency and effectiveness by reducing overall mailing costs, offering faster data entry and gift processing, supporting major donor cultivation and using the Internet to send email appeals and accept online donations. The Raiser’s Edge also integrates with Microsoft® Office® to enable users to take advantage of additional functionality.
In addition to the standard functionality of The Raiser’s Edge, we have built a number of extended applications to address the specific needs of various market segments.
Blackbaud Enterprise CRM
Blackbaud Enterprise CRM (Enterprise CRM) is a flexible, customizable, scalable and secure Constituent Relationship Management (CRM)web-based CRM solution that addresses the unique needs of largermid-size, large, and federated, chapter based nonprofit organizations. EnterpriseBlackbaud CRM helps large institutionsorganizations build their brands, develop deeper and more personalized relationships with constituents, build their constituenciesbrand through
online engagement and multi-channel communication tools, and gain organizational efficiencies. EnterpriseBlackbaud CRM brings together disparate information, such as constituent involvement and engagement information, annual and capital giving, gift planning, major giving, and alumni and parent systems, across multiple locations and within the departments and programs of a mid-sized, large, or federated organization. With a single system of record that can be securely and efficiently shared, larger organizations are able to turn their data into timely, actionable information that maximizes their multi-channel fundraising efforts, synchronizes campaigns across departments and programs, and strengthens relationships and engagement with their constituents.
eTapestry
eTapestry is a SaaS donor management and fundraising solution built specifically for smaller nonprofits. It tracks donors, prospects orand alumni while managing gifts, pledges and payments. eTapestry has beenwas built to be operatedoperate in a hosted environment and to be accessed via the Internet. This technology provides a system that is simple to maintain, costs littleefficient to operate and is intuitively easy to learn without extensive training. It offers nonprofit organizations a cost-effective way to manage donors, process gifts, create reports, accept online donations and communicate with constituents. eTapestry now comes in three packages that are easy to buy, implement and use (Starter, Essential and Pro), and also offers a 30-day free trial. All packages include our database, online forms, email marketing, reporting, training, implementation and support.
Online Solutions
Blackbaud NetCommunity
Blackbaud NetCommunity is an Internet marketing and communications tool that enables organizations that utilize the Raiser’s Edge software to build interactive websites and manage email marketing campaigns. With Blackbaud NetCommunity, organizations can establish online communities for social networking among constituents and also provide a platform for online giving, membership purchases, event registration and more. Because Blackbaud NetCommunity requires the Raiser’s Edge database to operate, it can only be sold with Raiser’s Edge or to existing Raiser’s Edge customers. However, Blackbaud NetCommunity, in concert with The Raiser’s Edge, does provides a single source of up-to-date constituent information across an entire organization, regardless of how individual constituents interact and communicate with the organization. We also have developed versions of Blackbaud NetCommunity with reduced functionality and lower price points to provide alternatives for nonprofit organizations of all sizes and with varied needs for Internet solutions.
Sphere eMarketing
Sphere eMarketing, delivered as software-as-a-service,SaaS, provides organizations with an integrated system of applications to manage e-marketing, communications, programs, services and online fundraising. Sphere eMarketing enables an organization’s volunteers, members, donors and staff to share real-time data and information in an online community to better manage constituent relationships. Sphere eMarketing is designed to help organizations manage sophisticated and targeted e-mail campaigns with efficiency and control. Comprehensive real-time reports are available to help organizations make strategic data-driven decisions for future marketing campaigns.
Additionally, Sphere Connect,Everyday Hero
Everyday Hero is an event-based online fundraising solution in Asia-Pacific and the Sphere open platform technology, provides organizationsUK. The Everyday Hero solution is focused on meeting the peer-to-peer fundraising needs of nonprofits internationally. It is a developer-friendly interfaceleading donor acquisition tool, and helps nonprofits in Asia-Pacific and the UK connect with well documented and supported APIs, and a cost-effective approach to custom application development and integration to meet unique technology and business needs.younger, more online-focused generation of donors, a first step in helping nonprofits develop long-term relationships with their supporters. We acquired the Everyday Hero solution in 2011.
BlackbaudNow
BlackbaudNow offers small organizations and individuals a fast and simple way to develop an online presence and begin accepting online donations. It allows organizations, with no upfront cost,our customers to publish a simple website, accept donations,
manage constituent relationships, run reports and send emails to supporters.supporters, with no upfront cost. BlackbaudNow is free to set up and users pay a per transaction fee. A PayPal® Donate button is built into the product.
Financial Management
The Financial Edge
The Financial Edge is an accounting application designed to address the specific accounting, analytical and financial reporting needs of nonprofit organizations. It integrates with The Raiser’s Edge to simplify gift entry processing and relate information from both systems in an informative manner to eliminate redundant tasks. The Financial Edge improves the transparency and accountability of organizations by allowing them to track and report from multiple views, measure the effectiveness of programs and other initiatives, use budgets as monitoring and strategic planning tools and supervise cash flow. As a result, The Financial Edge provides
nonprofit organizations with the means to help manage fiscal and fiduciary responsibility, enabling them to be more accountable to their constituents. In addition, The Financial Edge is designed specifically to meet governmental accounting and financial reporting requirements prescribed by the Financial Accounting Standards Board, (FASB)or FASB, and Governmental Accounting Standards Board, (GASB).or GASB.
As with The Raiser’s Edge, with the Financial Edge, we have built extended applications to address the specific functional needs of our customers such as Purchase Orders, WebPurchasing, Electronic Funds Transfer, Cash Management, Cash Receipts, Payroll, Fixed Assets, Student Billing, School Store Manager and Accounting Forms.
FundWare
FundWare is a fund accounting solution designed to provide nonprofit and/or government organizations with improved operational efficiencies, reporting flexibility and the ability to manage sophisticated fund allocations. It uses a configurable set of modules designed to provide functionality that meets an organization’s specific needs. FundWare unites accounting, budgeting and reporting tools with a built-in audit trail and easy-to-prepare audit schedules. Users are able to easily produce GASB and FASB financial reports including indirect costs or complex revenue allocations. Further, users have the ability to conduct real-time budget monitoring, maintain budget modification histories, including comparisons between actual and revised budgets and prepare cross-fiscal year budgets. FundWare utilizes an Excel-based reporting tool that enables the use of current Excel spreadsheets and skills while linking to FundWare’s financial database, providing real-time information without the extra step of importing or exporting.customers.
School Management
The Education Edge
The Education Edge is a comprehensive student information management system designed principally to organize an independent school’s admissions and registrar processes, including capturing detailed student information, creating class schedules, managing attendance records and performance/grades, producing demographic, statistic, and analytical reports and printing report cards and transcripts. With The Education Edge, an organization can keep biographical and address information for students, parents, and constituents consistent across all of its Blackbaud software products. This integrated system allows an independent school to reduce data-entry time and ensure that information is current and accurate throughout the school.
Blackbaud’s Student Information System
Blackbaud’s Student Information System is a complete software solution designed for small colleges and other institutions of higher education with a full-time enrollment of less than 5,000. The solution links student information across all campus offices and includes functionality designed specifically to organize the admissions and registrar’s processes. In addition, Blackbaud’s Student Information System can be combined with other applications to offer integration across back-office functions, providing one-time entry for biographical information, financial reliability, and audit trail functionality. This helps significantly reduce time spent on data maintenance and creation of class schedules and allows institutions to communicate efficiently with prospects, students and alumni.
Blackbaud for Small Schools
Blackbaud for Small Schools is a SaaS solution designed for independent schools with less than 500 students. It includes modules to help schools with their registration process, and give parents, students and faculty secure online access to assignments, grades and other relevant school information. As a school’s needs grow and change, these can be integrated with other solutions like The Raiser’s Edge and The Financial Edge.
Ticketing
The Patron Edge
The Patron Edge is a comprehensive ticketing management solution specifically designed to help large or small performing arts organizations, museums, zoos and aquariums boostincrease attendance and increase revenue. The Patron Edge can be integrated with The Raiser’s Edge to allow for a complete profile view of patrons, donors or visitors. The Patron Edge offers a variety of ticketing methods and allows customers to save time and costs by streamlining ticketing, staffing, scheduling, event and membership management and other administrative tasks.
General Admissions Management
Altru is an arts and cultural solution suite provided to Financial Statements
Direct Marketing
Blackbaud Direct Marketing
Blackbaud Direct Marketing allows nonprofit organizations to achieve integrated campaign planning by managing direct marketing campaigns with multiple types of media and channels. It delivers campaign management capabilities including planning and budgeting, predictive analysis and list segmentation, campaign execution, and performance measurement and reporting. The result is that nonprofit organizations can more easily manage their marketing campaigns while maximizing the return on investment of their direct marketing efforts. Nonprofit organizations can integrate Blackbaud Direct Marketing with Blackbaud Enterprise CRM or The Raiser’s Edge to combine fundraising functions with direct marketing campaigns.
Events Management
Sphere EventsFriends Asking Friends
The Sphere Friends Asking Friends software product enables organizations to quickly and easily launch and manage online event fundraising websites. Sphere Friends Asking Friends facilitates growth in donations and participation levels by providing participants tools to become fundraisers and recruiters on behalf of nonprofit organizations. It also allows event participants to reach out to their Facebook® and Twitter® networks, expanding the fundraising and marketing potential of virtual events. It is used by organizations of all sizes and budgets to manage regional to national events.
Consulting and education services
Our consultants provide conversion and implementation services for each of our software products. These services include:
System implementation, including all aspects of installation and configuration, to ensure a smooth transition from the customer’s legacy system and to create a more streamlined business workflow;
Management of the data conversion process to ensure data is a reliable and powerful source of information for an organization;
Business process analysis and application customization to ensure that the organization’s system is properly aligned with an organization’s processes and objectives;
Removal of duplicate records, database merging and enrichment, information cleansing and consolidation, and secure credit card transaction processing;
Database production activities, including direct marketing, business intelligence, cultivation and stewardship processes; and
Website design services, Internet strategy consulting and specialized services, such as email marketing and search engine optimization.
In addition, we apply our industry knowledge and experience, combined with expert knowledge of our products, to evaluate an organization’s needs and provideconsult on how to improve a business process improvement consulting.process. This work is performed by staff consultants who have extensive and relevant domain experience in all aspects of nonprofit management, accounting, project management and IT services. This experience and knowledge allows us to make recommendations and implement best practices to help our customers reach their goals. In addition, we offer software customization services to organizations that do not have the time or in-house resources to create customized solutions for our core products. We believe that no other software company provides asthis broad a range of consulting and technology services and solutions dedicated to the nonprofit industry.
We provide a variety of classroom, onsite, distance-learning and self-paced training services to our customers relating to the use of our software products and application of best practices. Our software instructors have extensive training in the use of our software and present course material that is designed to include hands-on lab exercises, as well as course materials with examples and problems to solve.
Blackbaud OnDemand
The Blackbaud OnDemand hosting solution provides our customers with a convenient, affordable alternative to setting up and managing Blackbaud applications on their own. Our technical team will set up and manage on an ongoing basis the hosting of one or more Blackbaud systems on our secure servers and ensure that they are accessible and current on a 24/7 basis. All that is needed to connect is a web browser. We manage everything from initial data setup through network security configuration.
Analytics services
Target Analytics
We formed Target Analytics was formed in early 2008 by combining Blackbaud’s prospect research division with the then newly acquired Target Analysis Group. We further added to the offerings further in 2008 with the P!N wealth screening service which was added with the acquisition of Kintera.from Kintera, Inc. Target Analytics offers a comprehensive range of products and services for nonprofit organizations’ analytics needs. These include solutions for donor acquisition, identifying best prospects, assessing donor performance and development tools, prospect segmentation, wealth identification and collaborative peer benchmarking.measuring success. Target Analytics offers software, solutions, and services such as:including the following:
Acquisition Lists—Target Analytics’ acquisition mailing lists are built using a proprietary cooperative database designed exclusively for nonprofit mailing lists and response modeling. TheWe developed the database was developed to help locate the best prospects for each organization and make donor acquisition efforts more productive.
WealthPointTarget Tags—A database screeningdirect marketing data modeling solution that delivers detailed wealth identification information on prospects. WealthPoint provides initial prospect qualification, assists with prospect cultivationallows organizations to increase response rates and delivers information on financial capacity.
P!N Service—A wealth profilingnet revenue by identifying best prospects for direct mail and screening service that enables nonprofits to more efficiently identify, profile, monitor and rank the wealth of prospects in their databases. Additionally, this service enables nonprofits to edit, analyze, prioritize and combine external data collected from a wide range of sources with its internal donor database.telemarketing campaigns.
ProspectPoint—A custom data modeling solution that delivers critical information on a prospect’s or donor’s likelihood to make a gift to an organization. It analyzes current and historical data from external sources and behavioral trends to identify an organization’s best potential annual, planned and major giving prospects, as well as recommends appropriate “ask” amounts and gift types.
WealthPoint—A database screening solution that delivers detailed wealth identification information on prospects. WealthPoint provides initial prospect qualification, assists with prospect cultivation and delivers information on financial capacity.
ResearchPoint—CombinesA web-based prospect management software solution that combines public data with donor information from a nonprofit’s database of records to build a complete view of prospects, enabling it to better target and secure gifts. It also enablesThis includes enabling organizations to help uncover major and planned giving prospects within a nonprofit’s database.
donorCentrics—A set of strategic analytic and benchmarking tools designed to drive fundraising at nonprofit organizations. These reports uncover strengths and weaknesses in fundraising programs, highlight opportunities for growth and facilitate strategy-sharing across organizations.
Data Enrichment Services—Services that enrich the quality of the data in our customers’ databases. These include a service that finds outdated address files in the database and makes corrections based on the requirements and certifications of the United States Postal Service, and a serviceas well as services that usesuse known fields in an organization’s constituent records to search and find lost donorskey demographic and prospects.contact information such as age, email address, and phone number.
Maintenance
Most of our customers enroll in one of our maintenance and support programs. In each of the past five years, more than 95% of our customers have renewed their maintenance plans. Customers enrolled in the plansprograms enjoy fast, reliable customer support, receive regular software updates, stay up-to-date with support newsletters and have unlimited, around-the-clock access to support resources, including our extensive knowledgebase and forums. Customers who enroll in upgraded maintenance plans receive enhanced benefits.benefits such as call support priority and dedicated support resources.
Payment Processing
Our products provide our customers payment processing capabilities that enable their donors to make donations and purchase goods and services using numerous payment options, including credit card and ACH checking transactions, through secure online transactions. Through our Sphere products, we provide payment processing services in which we collect funds on behalf of our customers for a processing fee. Blackbaud Merchant Services provides credit card processing services to our customers and is integrated into most other Blackbaud solutions. It includes a gateway, processor and a merchant account. Blackbaud Merchant Services offers one rate across all transactions types and all credit cards, which we believe is unique in the payment processing industry.
Customers
We have customers in every principal vertical market within the nonprofit industry. At the end of 2009,2011, we had approximately 22,00026,000 active customers that rangeranging from small, local charities, to healthcare and higher education organizations to the largest national health and human services organizations. No one customer accountsaccounted for more than 2% of our annual2011 revenue. In addition to our 26,000 active customers, at the end of 2011, we had approximately 10,000 nonprofit organizations that utilize our products and services at no charge.
Sales and Marketing
The majority of our software and related services are sold through direct sales forces. Our direct sales force isforces are complemented by a team of account development representatives responsible for sales lead generation and qualification. These sales and marketing professionals are located in Charleston, South Carolina,Carolina; Cambridge, Massachusetts,Massachusetts; near Indianapolis, IndianaIndiana; and in San Diego, California. We also employ remote sales staff in metropolitan areas throughout the United States, the United Kingdom, Netherlands, Canada, Australia and Australia.New Zealand. As of December 31, 2009,2011, we had approximately 233 direct sales employees. We plan to continue expanding our direct sales force in the Americas, Europe, Australia and Asia as our operations grow internationally and market demand recoverscontinues to recover from the current economic environment. During 2009,
Each of our three operating units contains sales teams focused on the needs of its different customer segments. The GMBU sales teams focus on emerging and mid-sized accounts in North America. Our ECBU sales teams focus exclusively on large, enterprise-wide accounts. The IBU sales teams focus on all accounts outside of North America. Within each operating unit, the sales force wasis divided into two main areas of responsibility:
Selling products and services to existing customers; and
Acquiring new customers.
In addition, a dedicated portionSales representatives for ECBU and IBU sell all of our sales team is focused exclusively on large, enterprise-wide accounts. We have a group of sales engineers who support both newproducts and existing customers in this market segment.services. In general, GMBU sales representatives are responsible for handlinghandle one product line in a designated geographic area. However, sales representatives for the K-12 independent schools market, small college market and the arts and cultural market are responsible for sellingsell all of our software products. In addition, we have a group of sales engineers who support both new and existing customers in the various market segments.
We generally begin a customer relationship with the sale of one of our primary products or services, such as The Raiser’s Edge, Blackbaud CRM or Blackbaud Enterprise CRM,Sphere eMarketing, and then selloffer additional products and services to the customer as the organization’s needs increase.
We conduct marketing programs to create brand recognition and market awareness for our products and services. Our marketing efforts include participation at tradeshows, technical conferences and technology seminars, publication of technical and educational articles in industry journals and preparation of competitive analyses. Our customers and strategic partners provide references and recommendations that we often feature in our advertising and promotional activities.
We believe relationships with third parties can enhance our sales and marketing efforts. We have and will continue to establish additional relationships with companies that provide services to the nonprofit industry, such as consultants, educators, publishers, financial service providers, complementary technology providers and data providers. These companies promote or complement our nonprofit solutions and provide us access to new customers.
Corporate Philanthropy and Volunteerism
We believe that service to others makes the world a better place and champion this value through our global corporate philanthropy and employee-focused programs. In addition to having employees select grant recipients for our endowment fund, we celebrate individual acts of service through a competitive grant program that honors excellent examples of volunteerism and benefits the organizations they serve.
Competition
The market for software and related services in the nonprofit sector is highly competitive, althoughand the competitionmarket is highly fragmented. For certain areas of the market, entry barriers are low. However, we believe our experience and product depth makes us a formidablestrong competitor. We expect to continue to see new competitors as the market matures and as nonprofit organizations become more aware of the advantages and efficiencies attainable through the use of specialized software. A number of diversified software enterprises have made acquisitions or developed products for the market, including SunGuard, Sage and SunGard.Campus Management. Other companies that compete with us, such as Microsoft, Salesforce.com and Oracle, have greater marketing resources, revenue and market recognition than we do. They offer fewsome products that are designed specifically for nonprofits, in addition to some of their products which have a degree of functionality for nonprofits that could be considered competitive. These larger companies could decide to enterfocus more on the market with new, directly competitive products or through acquisitions of our current competitors.
We mainly face competition from four sources:
Software developers offering specialized products designed to address specific needs of nonprofit organizations;
Custom-developed solutions;organizations, some of which are sold with subscription pricing;
Providers of traditional, less automated fundraising services;services such as services that support traditional direct mail campaigns, special events fundraising, telemarketing and personal solicitations;
Custom-developed products created either internally or outsourced to custom service providers; and
Software developers offering general products not designed to address specific needs of nonprofit organizations.
We compete with several software developers that provide specialized products, such as on-demand software specifically designed for nonprofit use. In addition, we compete with custom-developed solutions created either internally by the nonprofit organization or outside by custom service providers. We believe that we compete successfully, against these companies, asbecause building aefficient, highly functional custom solutionsolutions equal to ours requires extensive financial and technical resources that mayare beyond the capabilities or cost-effectiveness of custom solution providers or that might not be available or cost-effective forwithin the nonprofit organization. In addition, the nonprofit organization’s legacy database and software system may not have been designed to support the increasingly complex and advanced needs of today’s growing community of nonprofit organizations.
We also compete with providers of traditional, less automated fundraising services, including parties providing services in support of traditional direct mail campaigns, special events fundraising, telemarketing and personal solicitations. Although there are numerous general software developers marketing products that have some application in the nonprofit market, these competitors have generally neglected to focus specifically on this market and typically lack the domain expertise to cost effectively build or implement integrated solutions for the market’s needs. We believe we compete successfully against these traditional fundraising services, primarily because our products and services are more automated, more robust and more efficient.
Research and Development
We have made substantial investments in research and development and expect to continue to do so as a part of our strategy to introduce additional products and services. As of December 31, 2009,2011, we had approximately 377368 employees working on research and development. Our research and development expenses for the years ending on December 31, 2011, 2010 and 2009 2008, and 2007 were $45.7$47.7 million, $38.7$45.5 million and $28.5$45.5 million, respectively.
Technology and Architecture
We have products, such as Blackbaud Enterprises CRM and Blackbaud Direct Marketing, that are built on the Microsoft® .Net™ .Net framework platform. These products are web-delivered applications utilizing a Service Oriented Architecture built on Internet standards and protocols such as HTTP, XML and SOAP. This architecture is designed to support flexible deployment scenarios including both on-premise, as well as hosted by Blackbaud in a SaaScloud-based model. The applications expose web service application programming interfaces so that functionality and business logic can be accessed programmatically from outside the context of an interactive user application. This allows our customers to extend and modify the functionality of our applications without requiring them to make any source code or data modifications themselves. This is important for customers who want to customize our applications by incorporating their own business logic into key areas of the applications. The end result is a robust customization platform through which the application can be modified and extended without requiring source code alteration.
Our version 7.x generation products utilize a three-tier client server architecture built on the Microsoft® Component Object Model, (COM).or COM. The architecture of both our .Net and COM-based development models ensure our applications are:
| • | Flexible.Our component-based architecture is programmable and easily customized by our customers without requiring modification of the source code, ensuring that the technology can be extended to accommodate changing demands of our clients and the market. |
| • | Adaptable.The architecture of our applications allows us to easily add features and functionality or to integrate with third-party applications in order to adapt to our customers’ needs or market demands. |
| • | Scalable.We combine a scalable architecture with the performance, capacity and load balancing of industry-standard web servers and databases used by our customers to ensure that the applications can scale to the needs of larger organizations. |
We have and intend to continue to license technologies from third parties that are integrated into our products. We believe that the loss of any third-party technologies currently integrated into our products would not have a material adverse effect on our business, but this might change in the future. In addition, if we are unable to obtain licenses for third-party technology for future products, our product development could be delayed, which in turn could harm our business and operating results.
Intellectual Property and Other Proprietary Rights
To protect our intellectual property, we rely on a combination of patent, trademark, copyright, and trade secret laws in various jurisdictions, as well as employee and third-party nondisclosure agreements and confidentiality procedures. We have a number of registered trademarks, including “Blackbaud”,“Blackbaud,” “The Raiser’s Edge” and “Blackbaud Enterprise CRM”.CRM.” We have applied for additional trademarks. We currently have sixthree active patents pending on our technology, including functionality in The Financial Edge, The Information Edge, and ProspectPoint.technology.
Employees
As of December 31, 2009,2011, we had 1,9562,256 employees, consisting of 436479 in sales and marketing, 377368 in research and development, 508597 in consulting and professional services, 249296 in customer support, 166302 in subscriptions and 220214 general and administrative personnel. None of our employees are represented by unions or are covered by collective bargaining agreements. We are not involved in any material disputes with any of our employees, and we believe that relations with our employees are satisfactory.
Available Information
Our website address iswww.blackbaud.com. We make available, free of charge through our website, our annual report on Form 10-K, quarterly reports on Form 10-Q, current reports on Form 8-K and all amendments to those reports as soon as is reasonably practicable after such material is electronically filed with or furnished to the SEC.SEC, but other information on our website is not incorporated into this report. The SEC maintains an Internet site that contains these reports atwww.sec.gov.
Executive Officers
The following table sets forth certain information concerning our executive officers as of February 25, 2010:December 31, 2011:
Name | Age | |||
Marc E. Chardon | President and Chief Executive Officer | |||
Anthony W. Boor | 49 | Senior Vice President and Chief Financial Officer | ||
Charles T. Cumbaa | President, Enterprise Customer Business Unit | |||
Kevin Mooney | President, General Markets Business Unit | |||
| President, International Business Unit | |||
| 43 | Senior Vice President, | ||
|
| |||
|
| |||
Charles L. Longfield | Senior Vice President, Chief Scientist | |||
John J. Mistretta | Senior Vice President of Human Resources | |||
Heidi H. Strenck | Senior Vice President, Controller, Assistant Treasurer and Assistant Secretary | |||
|
|
Marc E. Chardonjoined us as President and Chief Executive Officer in November 2005. Previously, Mr. Chardon served as Chief Financial Officer for the $11 billion Information Worker business group at Microsoft, where he was responsible for the core functions of long-term strategic financial planning and business performance management. He joined Microsoft in August 1998 as General Manager of Microsoft France. During his three-year leadership, the subsidiary remained one of the three most admired companies by French professionals and achieved increased customer satisfaction. Prior to joining Microsoft, Mr. Chardon was General Manager of Digital France. He joined Digital in 1984, and held a variety of international marketing and business roles within the company. In 1994, Mr. Chardon was named Director, Office of the President, with responsibility for Digital’s corporate strategy development. Mr. Chardon is an American/French dual national. He is an economics honors graduate from Harvard University.
Anthony W. Boor joined us as Senior Vice President and Chief Financial Officer in November 2011. Prior to joining us, he served as an executive with Brightpoint, Inc. beginning in 1999, most recently as its Executive Vice President, Chief Financial Officer and Treasurer. He also served as the interim President of Europe, Middle East and Africa during Brightpoint’s significant restructuring of that region. Mr. Boor served as Director of Business Operations for Brightpoint North America from August 1998 to July 1999. Prior to joining Brightpoint, Mr. Boor was employed in various financial positions with Macmillan Computer Publishing, Inc., Day Dream Publishing, Inc., Ernst & Young LLP, Expo New Mexico, KPMG LLP and Ernst & Whinney LLP. He holds a BS in accounting from New Mexico State University.
Charles T. Cumbaa has served as our President, Enterprise Customer Business Unit since January 2010. From May 2001 to December 2009, he served as Senior Vice President of Products and Services. Prior to joining us, Mr. Cumbaa was an Executive Vice President with Intertech Information Management from December 1998 until October 2000. From 1992 until 1998, he was President and Chief Executive Officer of Cognitech, Inc., a software company he founded. From 1984 to 1992 he was Executive Vice President of Sales and Services at Sales Technologies. Prior to that, he was employed by McKinsey & Company. Mr. Cumbaa holds a BA from Mississippi State University and an MBA from Harvard Business School.
Kevin Mooney has served as our President, General Markets Business Unit since January 2010. He joined us in July 2008 as our Senior Vice President of Sales & Marketing and Chief Commercial Officer. Before joining Blackbaud, Mr. Mooney was a senior executive at Travelport GDS from August 2007 to May 2008. As Chief Commercial Officer of Travelport GDS, one of the world’s largest providers of information services and transaction processing to the travel industry, Mr. Mooney was responsible for global sales, marketing, training, service and support activities. Prior to that he was Chief Financial Officer for Worldspan from March 2005 until it was acquired by Travelport in August 2007. Mr. Mooney has also held key executive positions in the telecommunications industry.industry and he is a member of the Board of Directors of tw telecom, a publicly traded company. Mr. Mooney graduated from Seton Hall University and holds an MBA in Finance from Georgia State University.
Timothy V. WilliamsBrad J. Holmanhas, President of the International Business Unit, joined us in November 2010. Prior to joining Blackbaud, Mr. Holman served as ourPartner and Chief FinancialCommercial Officer since January 2001. Mr. Williams is responsible for all of our financial reportingat ATI Business Group, a Jakarta-based company that provides outsourcing and controls, as well as human resources and legal. From January 1994 to January 2001 he served as Executive Vice President and CFO of Mynd, Inc. (now a subsidiary of Computer Sciences Corporation), a provider of software andtechnical services to the insurance industry.aviation and travel sectors, from February 2010 to October 2010. Prior to that, from June 2006 to February 2010, Mr. Williams worked at Holiday Inn Worldwide, most recently as Executive Vice President and Chief Financial Officer. Mr. Williams serves on the Board of Directors of PROS Holdings, Inc., a publicly traded software development company. Mr. Williams holds a BA from the University of Northern Iowa.
Louis J. AttanasihasHolman served as ourPresident of Travelport’s Asia Pacific operations, which provides information services and transaction processing to the travel industry. From July 2001 to May 2006, Mr. Holman held various senior management roles at Travelport, including Senior Vice President of Product Development since January 2010. From January 2007 to January 2010, he served asairline services in Asia Pacific and Managing Director of operations in Europe, Middle East and Africa. Mr. Holman holds a BC from University of Western Australia.
Jana B. Eggers, our Senior Vice President of Products initially servingand Marketing, joined us in the capacity of Vice President of Products in 1996. From May 1986 to 1996, he served as a Software Engineer, Product Architect, and Product Development Manager.November 2010. Prior to joining us, he taught mathematicsBlackbaud, Ms. Eggers served as Chief Executive Officer of Germany-based Spreadshirt from October 2006 to November 2010. Prior to that, Ms. Eggers served as Director for Intuit from April 2002 to October 2006, where she founded and led the company’s corporate Innovation Lab, which researched and designed new offerings. From March 2003 to October 2006, Ms. Eggers also served as General Manager for Intuit’s QuickBase business, serving the Fortune 100, where it became Intuit’s fastest-growing business unit. Ms. Eggers has also held executive and technology leadership positions at the State University of New York at Stony Brookinternationalization firm Basis Technology, American Airline’s Sabre, Los Alamos National Laboratory and worked as a Software Engineer at Environmental Energy Corporation. Mr. Attanasiseveral acquired start-ups. Ms. Eggers holds a BS in Mathematics and Computer Science from State University of New York at Stony Brook and an MS in Mathematics from the University of Charleston.
Lee W. Gartleyjoined us in January 2007 as a Senior Vice President as part of our acquisition of the Target Companies. Mr. Gartley remains President of, and responsible for the day-to-day operations of, Target Analytics. Prior to joining the Target Companies in 1998, Mr. Gartley was a senior marketer with Art Technology Group from 1996 until 1998 where he helped to launch an online commerce platform. From 1992 to 1996 he was a management consultant with Boston Consulting Group working with clients in a variety of industries to develop and implement sound strategy. Mr. Gartley holds a BA in Physics from Bowdoin College and an MBA from the Kellogg Graduate School of Management.Hendrix College.
Charles L. Longfieldhas served as our Senior Vice President, Chief Scientist since January 2010. He joined us in January 2007 as our Chief Scientist as part of our acquisition of the Target Companies, both of which he founded and then led as Chief Executive Officer since the early 1990s. Mr. Longfield has extensive experience designing and implementing national as well as international constituency databases that address the fundraising information needs at many of the world’s largest nonprofit organizations. Mr. Longfield holds a BA in Mathematics and a M.Ed. from Harvard University and has over 30 years of experience helping nonprofits automate their fundraising operations.
John J. Mistretta, our Senior Vice President of Human Resources, joined us in August 2005. Prior to joining us, Mr. Mistretta was an Executive Vice President of Human Resources and Alternative Businesses at National Commerce Financial Corporation from 1998 to 2005. Earlier in his career, Mr. Mistretta held various senior Human Resources positions over a thirteen year period at Citicorp. Mr. Mistretta holds a MastersMaster’s of Science in Counseling and a BA in Psychology from the State University of New York at Oswego.
Heidi H. Strenckhas served as our Senior Vice President and Controller since January 2007. From October 2002 until January 2007, Ms. Strenck served as our Vice President and Controller. Ms. Strenck joined us in September 1996 and held key management roles as Accounting Manager from 1996 until 1997 and as Controller until 2002. Prior to joining us, she served as a Senior Associate with Coopers & Lybrand and as Internal Auditor for The Raymond Corporation. Ms. Strenck holds a BA from Hartwick College.
Gerard J. Zinkhas served as our Senior Vice President of General Markets Business Unit Customer Support since January 2010. From January 2007 until January 2010, Mr. Zink served as our Senior Vice President of Customer Support. From June 1996 until January 2007 he served as our Vice President of Customer Support. Mr. Zink is responsible for overall customer satisfaction, information technology and administrative services. He joined us in November 1987 and served as a Customer Support Analyst and Manager of Customer Support before assuming his current position.
Our business operations face a number of risks. These risks should be read and considered with other information provided in this report.
Risks Related to the Proposed Acquisition of Convio
The proposed acquisition of Convio might not be completed within the expected timeframe, or at all, and the failure to complete such acquisition could adversely affect our stock price and our future business and financial results.
On January 16, 2012, we entered into an Agreement and Plan of Merger with Convio. The Agreement is an executory contract subject to numerous closing conditions beyond our control including, but not limited to, approval by the United States Federal Trade Commission and Department of Justice, whose review of the transaction has required us to extend our tender offer and delay closing. There is no guarantee that these
conditions will be satisfied in a timely manner or at all. If any of the conditions to our proposed acquisition of Convio are not satisfied (or waived by Convio), we may not complete the proposed acquisition or realize the anticipated benefits thereof. Disputes regarding interpretations of the Agreement could also delay or prevent the closing. In addition, the market price of our common stock may reflect various market assumptions as to whether and when the proposed acquisition will occur. Consequently, the failure to complete the proposed acquisition within the expected timeframe, or at all, could result in a significant change in the market price of our common stock.
The announcement and pendency of the proposed acquisition might cause disruptions in our business, which could have an adverse effect on our business, financial condition or results of operations following completion of the acquisition.
The announcement and pendency of the proposed acquisition could cause disruptions in our business and/or the business of Convio. Specifically:
Current and prospective employees might experience uncertainty about their future roles, which might adversely affect our ability to retain key Blackbaud and Convio personnel and attract new personnel;
Current and prospective customers might experience uncertainty about our ability to meet their needs, which might cause customers to seek other suppliers for the products and services; and
Management’s attention might be focused on the proposed acquisition, which would divert management’s attention from the core business and other opportunities that could have been beneficial to our stockholders.
This could have an adverse effect on the business, financial condition or results of operations of Blackbaud and/or Convio prior to the completion of the proposed acquisition and on us following the completion of the proposed acquisition. These disruptions could be exacerbated by further delay in the completion of the proposed acquisition.
Convio might have liabilities that are not known, probable or estimable at this time.
As a result of the acquisition, Convio will become our subsidiary, and we will effectively assume all of its liabilities, whether or not asserted. There could be unasserted claims or assessments that we failed or were unable to discover or identify in the course of performing due diligence investigations of Convio. In addition, there might be liabilities that are neither probable nor estimable at this time which become probable and estimable in the future. Any such liabilities, individually or in the aggregate, could have a material adverse effect on our business. We might learn additional information about Convio that adversely affects us, such as unknown, unasserted or contingent liabilities and issues relating to compliance with applicable laws.
The proposed acquisition might not be accretive and might cause dilution to the combined company’s earnings per share, which could negatively impact the price of our common stock following the completion of the proposed acquisition.
We currently anticipate that the proposed acquisition will be accretive to the non-GAAP earnings per share (“EPS”) of the combined company during the first full calendar year after the acquisition is completed. This expectation is based on preliminary estimates of certain synergies expected to be realized by the combined company during such time, including the elimination of Convio’s expenses related to operating as a publicly traded company and excluding the impact of merger-related expenses. Such estimates and assumptions could materially change due to the failure to realize any or all of the benefits expected in the acquisition or other factors beyond our control or the control of Convio. All of these factors could delay, decrease or eliminate the expected accretive effect of the acquisition and cause resulting dilution to our non-GAAP EPS or to the price of our common stock.
We significantly increased our leverage in connection with the financing of the proposed acquisition of Convio.
We amended and restated our credit agreement in February 2012 to increase our borrowing capacity to $325.0 million. We expect to incur a substantial amount of indebtedness in connection with our acquisition of Convio. As a result of this indebtedness, our interest payment obligations will increase. The degree to which we are leveraged could have adverse effects on our business, including the following:
Making it difficult for us to satisfy our obligations under our credit facility and contractual and commercial commitments;
Requiring us to dedicate a substantial portion of our cash flow from operations to payments on our indebtedness, thereby reducing the availability of our cash flow to fund working capital, capital expenditures, dividends and other general corporate purposes;
Limiting our flexibility in planning for, or reacting to, changes in our business and the industries in which we operate;
Restricting us from making additional strategic acquisitions or exploiting business opportunities;
Placing us at a competitive disadvantage compared to our competitors that have less debt;
Limiting our ability to borrow additional funds; and
Decreasing our ability to compete effectively or operate successfully under adverse economic and industry conditions.
If we incur additional debt, these risks will intensify. Our ability to meet our debt service obligations will depend upon our future performance, which will be subject to the financial, business and other factors affecting our operations, many of which are beyond our control.
We might experience difficulties in integrating Convio’s business and realizing the expected benefits of the proposed acquisition.
Our ability to achieve the benefits we anticipate from the proposed acquisition will depend in large part on whether we are able to integrate Convio’s business into our business in an efficient and effective manner. We might not be able to integrate Convio’s business smoothly or successfully, and the process might take longer than expected. The integration of operations and the differences in operational culture following the proposed acquisition will require the dedication of significant management resources, which might distract management’s attention from day-to-day business operations. If we are unable to successfully integrate the operations of Convio’s business into our business, we will not realize the revenue growth, synergies and other anticipated benefits we expect to achieve as a result of the proposed acquisition and our business and results of operations could be adversely affected.
Risks Related to Our Business Currently
General economic factors, both domestically and internationally, might adversely affect our financial performance.
General economic conditions, globally or in one or more of the markets we serve, might adversely affect our financial performance. Weakness in the financial and housing markets, inflation, higher levels of unemployment, unavailability of consumer credit, higher consumer debt levels, volatility in credit, equity and foreign exchange markets, higher tax rates and other changes in tax laws, overall economic slowdown and other economic factors could adversely affect donations to non-profits, reducing their revenue and therefore possibly their demand for the products and services we sell and lengthen our sales and payment cycles. During 2009, we experienced a decrease in demand for our products and services as difficult and uncertain economic conditions put pressure on the spending of many organizations in the nonprofit industry. Higher interest rates, inflation, higher costs of labor, insurance and healthcare, higher tax rates and other changes in tax laws, changes in other laws and regulations and other economic factors in the United States could increase our cost of sales and
operating, selling, general and administrative expenses, and otherwise adversely affect our operations and operating results. These factors affect not only our operations, but also the operations of suppliers from whom we purchase or license products and services, a factor that could result in an increase in the cost to us of our products and services, reducing our margins.
A substantial portion of our revenue is currently derived from The Raiser’s Edge and Blackbaud Enterprise CRM, and a decline in sales or renewals of thisthese or similar products and related services could harm our business.
We derive a substantial portion of our revenue from the sale of The Raiser’s Edge and Blackbaud Enterprise CRM, and other products that help customers manage constituent relationships and related services, and revenue from these products and related services is expected to continue to account for a substantial portion of our total revenue for the foreseeable future. For example, revenue from the sale of The Raiser’s Edge and related services represented approximately 38%35%, 45%,38% and 50%38% of our total revenue in 2009, 20082011, 2010 and 2007,2009, respectively. Revenue from the sale of Blackbaud Enterprise CRM and related services represented approximately 9%, 6% and 4%, 2%, and 1% of our total revenue in 2009, 20082011, 2010 and 2007,2009, respectively. Because we generally sell licenses to our products on a perpetual basis and deliver new versions and enhancements to customers who purchase annual maintenance and support, our future license, services and maintenance revenue are substantially dependent on sales to new customers. In addition, we frequently sell The Raiser’s Edge or similar products to new customers and then attempt to generate incremental revenue from the sale of additional products and services. If demand for The Raiser’s Edge, Blackbaud Enterprise CRM or similar products declines significantly, our business would suffer.
We encounter lengthy sales cycles which could have an adverse effect on the amount, timing and predictability of our revenue and sales.
Potential customers, particularly our larger enterprise-wide clients, generally commit significant resources to an evaluation of available software and require us to expend substantial time, effort and money educating them as to the value of our software and services. Sales of our software products to these larger customers often require an
extensive education and marketing effort. We could expend significant funds and management resources during the sales cycle and ultimately fail to close the sale. Historically, our software product sales cycle averages approximately two months for sales to existing customers and from six to nine months for sales to new customers and large enterprise-wide sales. Recently, we have experienced longer sales cycle times, delays and postponements of purchasing decisions by our current and prospective customers as a result of challenges posed upon nonprofit organizations by the weak economic environment. Our sales cycle for all of our products and services is subject to significant risks and delays over which we have little or no control, including:
ourOur customers’ budgetary constraints;
theThe timing of our clients’ budget cycles and approval processes;
theThe impact of the macro economicmacroeconomic environment on our customers;
ourOur clients’ willingness to replace their current methods or software solutions;
ourOur need to educate potential customers about the uses and benefits of our products and services; and
theThe timing and expiration of our clients’ current license agreements or outsourcing agreements for similar services.
If we are unsuccessful in closing sales after expending significant funds and management resources or if we experience delays as discussed above, it could have a material adverse effect on the amount, timing and predictability of our revenue.
We encounter long and complex implementation cycles, particularly for our largest customers, which could have an adverse effect on our profitability and the timing and predictability of our revenue.
Our implementation cycle for large enterprise-wide sales can extend for a year or more, which can negatively impact the timing and predictability of our revenue. The implementation of our products and services, particularly in our large Enterprise CRM engagements, involvefrequently involves complex configuration, business process reengineering and system interfaces.interfaces and can extend for a year
or more. Our EnterpriseBlackbaud CRM product offering is relatively new, and we may not have historical experience with unanticipated implementation challenges or complexities that could arise in these engagements. Further, these projects typically are heavily dependent on customer participation, communication and timely responsiveness throughout the implementation cycle. As the complexity of these engagements increase, our revenues and profitability could suffer from delays in project completion and having to perform unplanned incremental services at rates substantially below our normal hourly rates and from delaysor make investments in project completion.the form of non-billable service hours. If we are unsuccessful in implementing our products or if we experience delays, it could have a material adverse effect on our profitability and the timing and predictability of our revenue.
If our customers do not renew their annual maintenance and support agreements or subscriptions for our products or if they do not renew them on terms that are favorable to us, our business might suffer.
Most of our maintenance agreements and subscriptions are for a one year term. As the end of the annual period approaches, we pursue the renewal of the agreement with the customer. Historically, maintenance and subscriptions renewals have represented a significant portion of our total revenue. Because of this characteristic of our business, if our customers choose not to renew their maintenance and support agreements or subscriptions with us on beneficial terms, our business, operating results and financial condition could be harmed. Our customers’ renewal rates may decline or fluctuate as a result of a number of factors, including their level of satisfaction with our services and their ability to continue their operations and spending levels.
We might not generate increased business from our current customers, which could limit our revenue in the future.
Our business model is highly dependent on the success of our efforts to increase salessell additional products and services to our existing customers. Many of our customers initially make a purchase of only one or a limited number of our products or only for a single department within their organization. These customers might choose not to expand their use of or make
additional purchases of our products and services. If we fail to generate additional business from our current customers, our revenue could grow at a slower rate or even decrease. In addition, as we deploy new applications and features for our existing products or introduce new products and services, our current customers could choose not to purchase these new offerings.
The Software-as-a-Service (SaaS) pricing modeloffering of our products on a subscription basis is evolving and demand by our customers for this modelthese offerings is increasing. Our failure to manage itsthis evolution and demand could lead to lower than expected revenues and profits.
In recent years, much of our revenue growth has beenwas derived from increased subscription offerings, including SaaS. This business model depends heavily on achieving economies of scale because the initial upfront investment is costly and the associated revenue is recognized on a ratable basis. If we fail to achieve appropriate economies of scale or if we fail to manage or anticipate the evolution and demand offor the subscription software pricing models, then our business and operating results could be adversely affected. The additional investments required to meet customer demand will increase our cost base, which will make it more difficult for us to offset any future revenue shortfalls by reducing expenses in the short term.
Defects, delays or interruptions in our SaaS and hosting services could diminish demand for these services and subject us to substantial liability.
We currently utilize data center hosting facilities to provide SaaS and hosting services to our customers. Any damage to, or failure of, our data center systems generally could result in interruptions in service to our customers, notwithstanding any disaster recovery arrangements that may currently be in place at these facilities. Because our SaaS, Internet-based and hosting service offerings are complex, and we have incorporated a variety of new computer hardware and software at the data centers, our services might have errors or defects that users identify after they begin using our services. This could result in unanticipated downtime for our customers and harm our reputation and our business. Internet-based services frequently contain undetected errors when first
introduced or when new versions or enhancements are released. We have from time to time found defects in our Internet-based services and new errors might again be detected in the future. In addition, our customers might use our Internet-based offerings in unanticipated ways that cause a disruption in service for other customers attempting to access their data.
Because our customers use these services for important aspects of their business, any defects, delays or disruptions in service or other performance problems with our services could hurt our reputation and damage our customers’ businesses. If that occurs, customers could elect to cancel their service, or delay or withhold payment to us, we could lose future sales or customers might make claims against us, which could result in an increase in our provision for doubtful accounts, an increase in collection cycles for accounts receivable or the expense and risk of litigation. Any of these could harm our business and our reputation.
The market for software and services for nonprofit organizations might not grow and nonprofit organizations might not continue to adopt our products and services.
Many nonprofit organizations have not traditionally used integrated and comprehensive software and services for their nonprofit-specific needs. We cannot be certain that the market for such products and services will continue to develop and grow or that nonprofit organizations will elect to adopt our products and services rather than continue to use traditional, less automated methods, attempt to develop software internally, rely upon legacy software systems, or use generalized software solutions not specifically designed for the nonprofit market. Nonprofit organizations that have already invested substantial resources in other fundraising methods or other non-integrated software solutions might be reluctant to adopt our products and services to supplement or replace their existing systems or methods. In addition, the implementation of one or more of our core software products can involve significant time and capital commitments by our customers, which they may be unwilling or unable to make. If demand for and market acceptance of our products and services does not increase, we might not grow our business as we expect.
Because a significant portion of our revenue is recognized ratably over the terms of the contract, downturns in sales may not be immediately reflected in our revenue.
We recognize our maintenance and subscriptions revenue monthly over the term of the customer agreement. The term of the customer agreement is typically 12 months, although it can extend up to threefive years. As a result, much of the revenue we report in each quarter is attributable to agreements entered into during previous quarters. Consequently, a decline in sales to new customers, renewals by existing customers or market acceptance of our products in any one quarter will not necessarily be fully reflected in the revenues in that quarter and will negatively affect our revenues and profitability in future quarters.
If the security of our software is breached, we fail to securely collect, store and transmit customer information, or we fail to safeguard confidential donor data our businessproducts and services might be perceived as not being secure and our reputation and business could suffer.
Fundamental to the use of our products is the secure collection, storage and transmission of confidential donor and end user information. Third partiesAlthough we have commercially available network and application security, internal control measures, and physical security procedures to safeguard our systems, there can be no assurance that a security breach, intrusion, loss or theft of personal information will not occur, which may attempt to breach our security or that of our customers and their databases. We might be liable to our customers for any breach in such security and any breach could harm our customers, our business, and our reputation. Any imposition of liability, particularly liability that is not covered by insurance or is in excess of insurance coverage, could harm ourcustomer reputation and our businessfuture financial results and operating results. Also, computers, including those that utilize our software, are vulnerable to computer viruses, physical or electronic break-ins and similar disruptions, which could lead to interruptions, delays or loss of data. We might be requiredmay require us to expend significant capital and other resources to protect further against security breaches or to rectifyaddress these problems, caused by any security breach.including notification under data privacy regulations.
A compromise of our software or other problemproblems that results in customer or donor personal information being obtained by unauthorized persons could adversely affect our reputation with our customers and others, as well as our operations, results of operations, financial condition and liquidity and could result in litigation against us or the imposition of penalties. In addition, a security breach could require that we expend significant additional
resources related to our information security systems and could result in a disruption of our operations, particularly our online sales operations. The existence of vulnerabilities, even if they do not result in a security breach, may harm customer confidence and require substantial resources to address, and we may not be able to discover or remedy such security vulnerabilities before they are exploited. Also, computers, including those that use our software, are vulnerable to computer viruses, physical or electronic break-ins and similar disruptions, which could lead to interruptions, delays or loss of data. We might be required to expend significant capital and other resources to protect further against security breaches or to rectify problems caused by any security breach.
Privacy and security concerns, including evolving government regulation in the area of consumer data privacy, could adversely affect our business and operating results.
The effectiveness of our software products relies on our customers’ storage and use of data concerning their customers, including financial, personally identifying and other sensitive data. Our customers’ collection and use of thesethis data for donor profiling might raise privacy and security concerns and negatively impact the demand for our products and services. For example, our custom modeling and analytical services, including ProspectPoint, WealthPoint and donorCentrics, rely heavily on securing and making use of data we gather from various sources and privacy laws could jeopardize our ability to market and profit from those services. If a breach of customer data security were to occur, our products may be perceived as less desirable, which would negatively affect our business and operating results.
In 2009, data security and privacy have remained material concerns for both our customers and state legislatures. Governments in some jurisdictions have enacted or are considering enacting consumer data privacy legislation, including laws and regulations applying to the solicitation, collection, processing and use of consumer data. This legislation could reduce the demand for our software products if we fail to design or enhance our products to enable our customers to comply with the privacy and security measures required by the legislation. Moreover, we may be exposed to liability under existing or new consumer data privacy legislation. For example, we might be subject to the privacy provisions of the Health Insurance Portability and Accountability Act of 1996, or HIPAA, and the Gramm-Leach-Bliley Act and related regulations. Even technical violations of these laws can result in penalties that are assessed for each non-compliant transaction. As part of the American Recovery and Reinvestment Act of 2009, Congress passed the Health Information Technology for Economic and Clinical Health Act, or HI-TECH Act. The HI-TECH Act expands the reach of data privacy and security requirements of HIPAA to service providers. HIPAA and associated United States Department of Health and Human Services regulations permit our customers in the healthcare industry to use certain demographic protected health information (such as name, email or physical address and dates of service) for fundraising purposes and to disclose that subset of protected health information to their service providers for fundraising. We may be included in this service provider group under the revised HIPAA regulations by virtue of our service provider relationship with our customers in the healthcare industry. In general, we are seeking to prohibit contractually our healthcare industry customers from uploading other types of health information of their clients into our systems because HIPAA does not permit this information to be used for fundraising without certain permissions, but we believe monitoring our healthcare customers’ compliance with such prohibitions is not legally required of service providers and would be cost prohibitive. The law and regulations under HI-TECH are new and still subject to change or interpretation by legal authorities who could cause additional compliance burdens. If we or our customers were found to be subject to and in violation of any of these laws or other data privacy laws or regulations, our business would suffer and we and/or our customers would likely have to change our business practices. In addition, these laws and regulations could impose significant costs on us and our customers and make it more difficult for donors to make online donations.
If we are unable, or customers believe we are unable, to detect and prevent unauthorized use of credit cards and safeguard confidential donor data, we could be subject to financial liability, our reputation could be harmed and customers may be reluctant to use our products and services.
Advances in computer capabilities, new discoveries in the field of cryptography or other events or developments could result in a compromise or breach of the technology we use to protect sensitive transaction data. If any such compromise of our security, or the security of our customers, were to occur, it could result in misappropriation of
proprietary information or interruptions in operations and have an adverse impact on our reputation or the reputation of our customers. All of our products are currently certified as Payment Application Data Security Standard compliant. Currently some of our products are not fully compliant with Payment Card Industry Data Security Standard, or PCI DSS. This or other factors could make customers believe we are unable to detect and prevent unauthorized use of credit cards or confidential donor data, which could harm our business. Additionally, these factors could make issuing banks believe the transactions of our customers are compromised and refuse to process those transactions, which could harm the reputation of our products and our business.
Additional PCI DSS standards go into effect next year. Conforming our products and services to PCI DSS is expensive and time-consuming. Our failure to maintain compliance with PCI DSS could make customers believe we are unable to detect and prevent unauthorized use of credit cards and bank account numbers or protect confidential donor data and our reputation and business might be harmed.
Our servicessubscriptions and subscriptionservices revenue produces substantially lower gross margins than our license revenue, and changes in the relative mix of these and other sources of revenue could negatively affect our overall gross margins.
Our subscriptions revenue, which includes fees for providing access to hosted applications, application hosting services and access to certain data services and our online subscription training offerings, has experienced the largest percentage revenue growth over the last three years. Subscriptions revenue was approximately 28%, 26% and 24% of our revenue for 2011, 2010 and 2009, respectively. Our subscriptions revenue has substantially lower gross margins than our product license revenue. For the years ended December 31, 2011, 2010 and 2009, our subscriptions margin was 59%, 63% and 61%. A continued increase in the percentage of total revenue represented by subscriptions revenue could adversely affect our overall gross margins and operating results if we are unable to achieve economies of scale in our subscription based offerings. Additionally, if nonprofits in general, and specifically our customers and prospects, desire to adopt our subscription offerings much more rapidly than we currently anticipate and we are unable to respond in a timely fashion, we could encounter significant effects to our business, including substantial capital expenditures, reduction in profitability, decrease in revenue growth and/or we could become potentially less competitive, resulting in a loss of market share.
Our services revenue, which includes fees for consulting, implementation, training, data and technical services and analytics, was approximately 28%29%, 33%27% and 36%28% of our revenue for 2009, 20082011, 2010 and 2007,2009, respectively. Our services revenue has substantially lower gross margins than our product license revenue. For the years ended December 31, 2011, 2010 and 2009, our services margin was 27%, 24% and 29%, respectively. An increase in the percentage of total revenue represented by services revenue wouldwithout an improvement in services margin could adversely affect our overall gross margins.operating results.
Certain of our services are contracted under fixed fee arrangements, which we base on estimates. If our estimated fees are less than our actual costs, our operating results would be adversely affected. Services revenue as a percentage of total revenue has varied significantly from quarter to quarter due to fluctuations in licensing revenue, economic changes, changes in the average selling prices for our products and services, our customers’ acceptance of our products and our sales force execution. In addition, the volume and profitability of services can depend in large part upon:
competitiveCompetitive pricing pressure on the rates that we can charge for our services;
theThe complexity of the customers’ information technology environment and the existence of multiple non-integrated legacy databases;
theThe resources directed by customers to their implementation projects; and
theThe extent to which outside consulting organizations provide services directly to customers.
For example, revenue from our training services, which represented 17%, 22% and 23% of our total services revenue during 2009, 2008 and 2007, respectively, has recently experienced a decrease in demand because existing and prospective customers have been experiencing budgetary constraints resulting from the challenges posed by the overall economic environment. The training services revenue typically has a higher gross margin than other services revenue. A continued decrease in the demand for training services could adversely affect our profitability and operating results.
Our subscription revenue, which includes fees for providing access to hosted applications, application hosting services and access to certain data services and our online subscription training offerings, has experienced the largest percentage revenue growth over the last three years. Subscription revenue was approximately 24%, 16% and 10% of our revenue for 2009, 2008 and 2007, respectively. Our subscription revenue has substantially lower gross margins than our product license revenue. An increase in the percentage of total revenue represented by subscription revenue could adversely affect our overall gross margins. If nonprofits in general, and specifically our customers and prospects, desire to adopt our subscription offerings much more rapidly than we currently anticipate and we are unable to respond in a timely fashion, we could encounter significant effects to our business, including substantial capital expenditures, reduction in profitability, decrease in revenue growth and/or we could become potentially less competitive, resulting in a loss of market share.
Any erosion of our margins for our services and/or subscription revenue or any adverse changes in the mix of our license versus service and subscription revenue could adversely affect our operating results.
Our quarterly financial results fluctuate and might be difficult to forecast and, if our future results are below either any guidance we might issue or the expectations of public market analysts and investors, the price of our common stock might decline.
Our quarterly revenue and results of operations are difficult to forecast. We have experienced, and expect to continue to experience, fluctuations in revenue and operating results from quarter to quarter. As a result, we believe that quarter-to-quarter comparisons of our revenue and operating results are not necessarily meaningful and that such comparisons might not be accurate indicators of future performance. The reasons for these fluctuations include but are not limited to:
theThe size and timing of sales of our software, including the relatively long sales cycles associated with many of our larger software sales;
budgetBudget and spending decisions by our customers;
marketThe degree of judgment required to estimate large consulting service engagements;
Scheduling considerations by our customers as they impact the delivery of purchased services;
Utilization of our professional services personnel;
Market acceptance of new products we release;
marketMarket acceptance of products we acquire;
theThe amount and timing of operating costs related to the expansion of our business, operations and infrastructure;
changesChanges in our pricing policies or our competitors’ pricing policies;
seasonalitySeasonality in our revenue;
generalGeneral economic conditions; and
costsCosts related to acquisitions of technologies or businesses.
Our operating expenses, which include sales and marketing, research and development and general and administrative expenses, are based on our expectations of future revenue and are, to a large extent, fixed in the short term. If revenue falls below our expectations in a quarter and we are not able to quickly reduce our operating expenses in response, our operating results for that quarter could be adversely affected. It is possible that in some future quarter our operating results may be below either any guidance we might issue or the expectations of public market analysts and investors and, as a result, the price of our common stock might fall.
Our failure to compete successfully could cause our revenue or market share to decline.
Our market is fragmented, highly competitive and rapidly evolving and there are limited barriers to entry for some aspects of this market. We mainly face competition from four sources:
softwareSoftware developers offering integrated specialized products designed to address specific needs of nonprofit organizations;organizations, some of which are sold with subscription pricing;
providersProviders of traditional, less automated fundraising services such as services that support traditional direct mail campaigns, special events fundraising, telemarketing and personal solicitations;
custom-developedCustom-developed products created either internally or outsourced to custom service providers; and
softwareSoftware developers offering general products not designed to address specific needs of nonprofit organizations.
The companies we compete with and other potential competitors may have greater financial, technical and marketing resources and generate greater revenue and better name recognition than we do. IfCompanies such as Microsoft, Salesforce.com and Oracle offer some products that are designed specifically for nonprofit organizations, in addition to some of their products which have a degree of functionality for nonprofit organizations that could be considered competitive. Also, if one or more of our competitors or potential competitors were to merge or partner with one of our competitors, the change in the competitive landscape could adversely affect our ability to compete effectively. For example, a large diversified software enterprise, such as Microsoft, Oracle or Salesforce.com, could decide to enter the market directly, including through acquisitions. Competitive pressures can adversely impact our business by limiting the prices we can charge our customers and making the adoption and renewal of our solutions more difficult.
Our competitors might also establish or strengthen cooperative relationships with resellers and third-party consulting firms or other parties with whom we have had relationships, thereby limiting our ability to promote our products. These competitive pressures could cause our revenue and market share to decline.
If we fail to respond to technological changes to be competitive, our business could suffer.
The software industry is characterized by technological change, evolving industry standards in hardware and software technology, changes in customer requirements and frequent new product introductions and enhancements. The introduction of products encompassing new technologies can render existing products obsolete and unmarketable. As a result, our future success will depend, in part, upon our ability to continue to enhance existing products and develop and introduce in a timely manner or acquire new products that keep pace with technological developments, satisfy increasingly sophisticated customer requirements and achieve market acceptance. We cannot assure youThere is no assurance that we will successfully identify new product opportunities and develop and bring new products to market in a timely and cost-effective manner. Further, there can be no assurance that the products, capabilities or technologies developed by others will not render our products or technologies obsolete or noncompetitive. In addition, because our service is designed to operate on a variety of network hardware and software platforms using a standard browser, we will need to continuously modify and enhance our service to keep pace with changes in Internet-related hardware, software, communication, browser and database technologies. We have made and continue to make significant working capital investments in accordance with evolving industry and customer requirements. These concentrations of working capital increase our risk of loss due to product or technology obsolescence. If we are unable to develop or acquire on a timely and cost-effective basis new software products or enhancements to existing products or if such new products or enhancements do not achieve market acceptance, our business, results of operations and financial condition may be materially adversely affected.
If we were found subject to or in violation of any laws or regulations governing privacy or electronic fund transfers, we could be subject to liability or forced to change our business practices.
It is possible that the payment processing component of our web-based software is subject to various governmental regulations. Any further legislation at the state and federal levels could also restrict further our information gathering and disclosure practices. Existing and potential future privacy laws might limit our ability to develop new products and services that make use of data we gather from various sources. For example, our custom modeling and analytical services, including ProspectPoint, WealthPoint, P!N and donorCentrics, rely heavily on securing and making use of data we gather from various sources and privacy laws could jeopardize our ability to market and profit from those services. The provisions of these laws and related regulations are complicated, and we do not have extensive experience with these laws and related regulations. Even technical violations of these laws can result in penalties that are assessed for each non-compliant transaction. In addition, we might be subject to the privacy provisions of the Health Insurance Portability and Accountability Act of 1996 and the Gramm-Leach-Bliley Act and related regulations. If we or our customers were found to be subject to and in violation of any of these laws or other privacy laws or regulations, our business would suffer and we and/or our customers would likely have to change our business practices. In addition, these laws and regulations could impose significant costs on us and our customers and make it more difficult for donors to make online donations.
Because competition for highly qualified personnel is intense, we might not be able to attract and retain the employees we need to support our planned growth.
To execute our continuing growth plans, we need to increase the size and maintain the quality of our sales force, software development staff and our professional services organization. To meet our objectives successfully, we must attract and retain highly qualified personnel with specialized skill sets focused on the nonprofit industry. Competition for qualified personnel can be intense, and we might not be successful in attracting and retaining them. The pool of qualified personnel with experience working with or selling to nonprofit organizations is limited overall and specifically in Charleston, South Carolina, where our principal office is located. Our ability to maintain and expand our sales, product development and professional services teams will depend on our ability to recruit, train and retain top quality people with advanced skills who understand sales to, and the specific needs of, nonprofit organizations. For these reasons, we have from time to time in the past experienced, and we expect to continue to experience in the future, difficulty in hiring and retaining highly skilled employees with appropriate qualifications for our business. In addition, it takes time for our new sales and services personnel to become productive, particularly with respect to obtaining and supporting major customer accounts. In particular,
we plan to continue to increase the number of services personnel to attempt to meet the needs of our customers and potential new customers. In addition to hiring services personnel to meet our needs, we might also engage
additional third-party consultants as contractors, which could have a negative impact on our earnings. If we are
unable to hire or retain qualified personnel, or if newly hired personnel fail to develop the necessary skills or reach productivity slower than anticipated, it would be more difficult for us to sell our products and services, we could experience a shortfall in revenue or earnings and not achieve our planned growth.
Further, in the past, we have used equity incentive programs as part of our overall employee compensation arrangements to both attract and retain personnel. A decline in our stock price could negatively impact the value of these equity incentive and related compensation programs as retention and recruiting tools. We may need to create new or additional equity incentive programs and/or compensation packages to remain competitive, which could be dilutive to our existing stockholders and/or adversely affect our results of operations.
If we do not successfully address the risks inherent in the expansion of our international operations, our business could suffer.
We currently have operations in Canada, United Kingdom, Netherlands, Australia and Asia, and we intend to expand further into international markets. We have limited experience in international operations and might not be able to compete effectively in international markets. Our international offices generated revenues of approximately $53.6 million, $44.1 million and $39.8 million for the years ended December 31, 2011, 2010 and 2009, respectively. Accordingly, international revenue increased 21.5% and 10.8% in 2011 and 2010, respectively. Expansion of our international operations will require a significant amount of attention from our management and substantial financial resources and might require us to add qualified management in these markets. Our direct sales model requires us to attract, retain and manage qualified sales personnel capable of selling into markets outside the United States. In some cases, our costs of sales might increase if our customers require us to sell through local distributors.
If we are unable to grow our international operations in a cost effective and timely manner, our business and operating results could be harmed. Doing business internationally involves additional risks that could harm our operating results, including:
Difficulties associated with and costs of staffing and managing international operations;
Differing technology standards;
Difficulties in collecting accounts receivable and longer collection periods;
Political and economic instability;
Imposition of currency exchange controls;
Potentially adverse tax consequences;
Reduced protection for intellectual property rights in certain countries;
Dependence on local vendors;
Protectionist laws and business practices that favor local competition;
Compliance with multiple conflicting and changing governmental laws and regulations;
Seasonal reductions in business activity specific to certain markets;
Longer sales cycles;
Restrictions on repatriation of earnings or new taxation thereon;
Differing labor regulations;
Restrictive privacy regulations in different countries, particularly in the European Union;
Restrictions on the export of technologies such as data security and encryption;
Compliance with U.S. laws such as the Foreign Corrupt Practices Act, and local laws prohibiting corrupt payments to government officials; and
Import and export restrictions and tariffs.
We expect that an increasing portion of our international software license, consulting services and maintenance services revenues will be denominated in foreign currencies, subjecting us to fluctuations in foreign currency exchange rates. If we expand our international operations, exposures to gains and losses on foreign currency transactions may increase.
If our products fail to perform properly due to undetected errors or similar problems, our business could suffer.
Complex software such as ours often contains undetected errors or bugs. Such errors are frequently found after introduction of new software or enhancements to existing software. We continually introduce or acquire the rights to new products and release new versions of our products. If we detect any errors before we ship a product, we might have to delay product shipment for an extended period of time while we address the problem. We might not discover software errors that affect our new or current products or enhancements until after they are deployed, and we may need to provide enhancements to correct such errors. Therefore, it is possible that, despite testing by us, errors may occur in our software. These errors could result in:
harmHarm to our reputation;
lostLost sales;
delaysDelays in commercial release;
productProduct liability claims;
delaysDelays in or loss of market acceptance of our products;
licenseLicense terminations or renegotiations; and
unexpectedUnexpected expenses and diversion of resources to remedy errors.
Furthermore, our customers may use our software together with products from other companies. As a result, when problems occur, it might be difficult to identify the source of the problem. Even when our software does not cause these problems, the existence of these errors might cause us to incur significant costs, divert the attention of our technical personnel from our product development efforts, impact our reputation and cause significant customer relations problems.
Our failure to obtain licenses for third-party technologies could harm our business.
We expect to continue licensing technologies from third parties, including applications used in our research and development activities, technologies which are integrated into our products and products that we resell. Although we believe that the loss of any third-party technologies currently integrated into our products would not have a material adverse effect on our business, this might change in the future. Our inability in the future to obtain any third-party licenses on commercially reasonable terms, or at all, could delay future product development until equivalent technology can be identified, licensed or developed and integrated. This inability in turn would harm our business and operating results. Our use of third-party technologies exposes us to increased risks including, but not limited to, risks associated with the integration of new technology into our products, the diversion of our resources from development of our own proprietary technology and our inability to generate revenue from licensed technology sufficient to offset associated acquisition and maintenance costs.
We rely upon trademark, copyright, patent and trade secret laws to protect our proprietary rights, which might not provide us with adequate protection.
Our success and ability to compete dependdepends to a significant degree upon the protection of our software and other proprietary technology rights. We might not be successful in protecting our proprietary technology and our proprietary rights might not provide us with a meaningful competitive advantage. To protect our core proprietary technology, we rely on a combination of patent, trademark, copyright and trade secret laws, as well as nondisclosure agreements, each of which affords only limited protection. We currently do not have patents issued for any of our proprietary technology and we only recently filed patent applications relating to a number of such products. Moreover, we have no patent protection for The Raiser’s Edge, which is one of our core products and responsible for a significant portion of our revenue. Any inability to protect our intellectual property rights could seriously harm our business, operating results and financial condition. It is possible that:
our pending patent applications may not result in the issuance of patents;
anyAny patents issued to us may not be timely or broad enough to protect our proprietary rights;
anyAny issued patent could be successfully challenged by one or more third parties, which could result in our loss of the right to prevent others from exploiting the inventions claimed in those patents; and
currentCurrent and future competitors may independently develop similar technologies, duplicate our products or design around any of our patents.
In addition, the laws of some foreign countries do not protect our proprietary rights in our products to the same extent as do the laws of the United States. Despite the measures taken by us, it may be possible for a third party to copy or otherwise obtain and use our proprietary technology and information without authorization. Policing unauthorized use of our products is difficult, and litigation could become necessary in the future to enforce our intellectual property rights. Any litigation could be time consuming and expensive to prosecute or resolve, and could result in substantial diversion of management attention and resources, and materially harm our business, financial condition and results of operations.
If we do not successfully address the risks inherent in the expansion of our international operations, our business could suffer.
We currently have operations in Canada, United Kingdom, Netherlands and Australia, and we intend to expand further into international markets. We have limited experience in international operations and may not be able to compete effectively in international markets. Our international offices generated revenues of approximately $39.7 million, $40.3 million and $36.2 million for the years ended December 31, 2009, 2008 and 2007, respectively. Accordingly, international revenue decreased 1.5% in 2009 and increased 11.3% in 2008. Expansion of our international operations will require a significant amount of attention from our management and substantial financial resources and may require us to add qualified management in these markets. Our direct sales model requires us to attract, retain and manage qualified sales personnel capable of selling into markets outside the United States. In some cases, our costs of sales might increase if our customers require us to sell through local distributors.
If we are unable to grow our international operations in a cost effective and timely manner, our business and operating results could be harmed. Doing business internationally involves additional risks that could harm our operating results, including:
difficulties associated with and costs of staffing and managing international operations;
differing technology standards;
difficulties in collecting accounts receivable and longer collection periods;
political and economic instability;
fluctuations in currency exchange rates;
imposition of currency exchange controls;
potentially adverse tax consequences;
reduced protection for intellectual property rights in certain countries;
dependence on local vendors;
protectionist laws and business practices that favor local competition;
compliance with multiple conflicting and changing governmental laws and regulations;
seasonal reductions in business activity specific to certain markets;
longer sales cycles;
restrictions on repatriation of earnings;
differing labor regulations;
restrictive privacy regulations in different countries, particularly in the European Union;
restrictions on the export of technologies such as data security and encryption; and
import and export restrictions and tariffs.
Restrictions in our revolving credit facility may limit our activities, including dividend payments, share repurchases and acquisitions.
At December 31, 20092011, we had no borrowings under our credit facility with Wells Fargo Bank, N.A. dated June 17, 2011. On February 9, 2012, we amended and restated this credit facility with a syndicate of financial institutions, and JPMorgan Chase Bank, N.A., as administrative agent. At February 29, 2012, we had no borrowings under the revolving credit facility, however,but we mayexpect to draw on our revolving credita significant portion of the facility from time to time to help us meet our short-term financial needs. Our revolvingclose the Convio acquisition. The credit facility contains restrictions, including covenants limiting our ability to incur additional debt, grant liens, make acquisitions and other investments, prepay specified debt, consolidate, merge or acquire other businesses, sell assets, pay dividends and other distributions, repurchase stock and enter into transactions with affiliates. There can be no assurance that we will be able to remain in compliance with the covenants to which we are subject in the future and, if we fail to do so, that we will be able to obtain waivers from our lenders or amend the covenants.
In the event of a default under our credit facility, we could be required to immediately repay all outstanding borrowings, which we might not be able to do. In addition, certain of our material domestic subsidiaries have guaranteedwill be required to guarantee amounts borrowed under the credit facility, and we have pledged the shares of certain of our subsidiaries as collateral for our obligations under the credit facility. Any such default could have a material adverse effect on our ability to operate, including allowing lenders under the credit facility to enforce the guarantees of our subsidiaries, if any, or exercise their rights with respect to the shares pledged as collateral.
We have recorded a significant deferred tax asset, and we might never realize the full value of our deferred tax asset, which would result in a charge against our earnings.
In connection with the initial acquisition of our common stock as part of our recapitalization in 1999, we recorded approximately $107.0 million as a deferred tax asset. Our deferred tax asset balance of $61.3$30.9 million, of which $35.9$20.9 million relates to our 1999 recapitalization, was approximately 20%8% of our total assets as of December 31, 2009.2011.
Realization of our deferred tax asset is dependent upon our generating sufficient taxable income in future years to realize the tax benefit from that asset. Deferred tax assets are reviewed at least annually for realizability. A charge against our earnings would result if, based on the available evidence, it is more likely than not that some portion of the deferred tax asset will not be realized. This could be caused by, among other things, deterioration
in performance, loss of key contracts, adverse market conditions, adverse changes in applicable laws or regulations, including changes that restrict the activities of or affect the products sold by our business and a variety of other factors. If a deferred tax asset was determined to be not realizable in a future period, the charge to earnings would be recognized as an expense in our results of operations in the period the determination is made.
Depending on future circumstances, it is possible that we might never realize the full value of our deferred tax asset. Any future determination of impairment of a significant portion of our deferred tax asset would have an adverse effect on our financial condition and results of operations.
Our ability to utilize our net operating loss carryforwards may be limited.
Included in our deferred tax asset balance is $17.3$14.4 million related to federal net operating loss carryforwards, which is approximately 6%47% of our total deferred tax assets at December 31, 2009.2011. Our federal net operating loss carryforwards are subject to limitations on how much may be utilized on an annual basis. The use of the net operating loss carryforwards may have additional limitations resulting from certain future ownership changes or other factors under Section 382 of the Internal Revenue Code. If our net operating loss carryforwards are further limited, and we have taxable income which exceeds the available net operating loss carryforwards for that period, we would incur an income tax liability even though net operating loss carryforwards may be available in future years prior to their expiration, which would have an adverse affect our future cash flow, financial condition and results of operations.
We might not be able to implement our operating unit reorganization successfully.
Effective January 1, 2010, we reorganized our business into three operating units to better align our organization around key customer groups. The three operating units are the General Markets Business Unit, the Enterprise Customer Business Unit and the International Business Unit. The successful reorganization of these operating units will require, among other things, coordination of direct revenue-generating activities, including sales, professional services and customer support within each unit. The diversion of management’s attention and any difficulties encountered in this process might negatively impact our ability to implement the reorganization and our goal to better align our operating structure with the different needs of the diverse types and sizes of organizations we serve and, ultimately, our ability to improve our competitive and financial performance in the future.
We might face challenges in integrating our recentcompleted acquisitions and, as a result, might not realize the expected benefits of these acquisitions.
In April 2009, we acquired RLC. During 2008, we acquired KinteraWe have completed significant acquisitions over the past five years and during 2007 we acquiredare in the Target Companies and eTapestry.process of acquiring Convio. Managing and integrating the operations and personnel of an acquired company can be a complex process. The integration might not be completed rapidly or achieve the anticipated benefits of the acquisition. The successful integration of the acquired companies will require, among other things, coordination of various departments, including product development, engineering, sales and marketing and finance. Further, a successful integration of the acquired companies internal control structure will be required. The diversion of the attention of management and any difficulties encountered in this process could cause the disruption of, or a loss of momentum in, sales or product development. The inability to successfully integrate the operations and personnel of our recently acquired companies, or any significant delay in achieving integration, could have a material adverse effect on our business and on the market price of our common stock.
Future acquisitions could prove difficult to integrate, disrupt our business, dilute stockholder value and strain our resources.
As part of our business strategy, we have made acquisitions in the past, and, in addition to the proposed acquisition of Convio, we might acquire additional companies, services and technologies that we feel could complement or expand our business, augment our market coverage, enhance our technical capabilities, provide us with important customer contacts or otherwise offer growth opportunities. Acquisitions and investments involve numerous risks, including:
difficultiesDifficulties in integrating operations, technologies, services, accounting and personnel;
difficultiesDifficulties in supporting and transitioning customers of our acquired companies;
diversionDiversion of financial and management resources from existing operations;
risksRisks of entering new sectors of the nonprofit industry;
potentialPotential loss of key employees; and
inabilityInability to generate sufficient revenue to offset acquisition or investment costs.
Acquisitions also frequently result in recording of goodwill and other intangible assets, which are subject to potential impairments in the future that could harm our operating results. In addition, if we finance acquisitions by issuing equity securities or securities convertible into equity securities, our existing stockholders would be diluted which, in turn, could affect the market price of our stock. Moreover, we could finance any acquisition with debt, resulting in higher leverage and interest costs. As a result, if we fail to evaluate and execute acquisitions or investments properly, we might not achieve the anticipated benefits of any such acquisition and we may incur costs in excess of what we anticipate. Furthermore, if we incur debt to fund acquisitions and are unable to service our debt obligation we may have a greater risk of default under our credit facility.
If we are not able to manage our anticipated growth effectively, our operating costs may increase and our operating margins may decrease.
We will need to grow our infrastructure to address the proposed acquisition of Convio and other potential market opportunities. Our growth will continue to place, to the extent that we are able to sustain such growth, a strain on our management, administrative, operational and financial infrastructure. If we continue to grow our operations, by way of additional business combinations or otherwise, we may not be effective in enlarging our physical facilities and our systems and our procedures or controls may not be adequate to support such expansion or our business generally. If we are unable to manage our growth, our operating costs may increase and our operating margins may decrease.
Increasing government regulation could affect our business.
We are subject, not only to regulations applicable to businesses generally, but also to laws and regulations directly applicable to electronic commerce and other regulations. Although there are currently few such laws and regulations, state, federal and foreign governments may adopt laws and regulations applicable to our business. Any such legislation or regulation could dampen the growth of the Internet and decrease its acceptance. If such a decline occurs, companies may decide in the future not to use our products and services. Any new laws or regulations in the following areas could affect our business:
userUser privacy;
theThe pricing and taxation of goods and services offered over the Internet;
theTaxation of foreign earnings;
The content of websites;
copyrights;Copyrights;
consumerConsumer protection, including the potential application of “do not call” registry requirements on our customers and consumer backlash in general to direct marketing efforts of our customers;
theThe online distribution of specific material or content over the Internet; and
theThe characteristics and quality of products and services offered over the Internet.
Pending and enacted legislation at the state and federal levels, including those related to fundraising activities, may also restrict further our information gathering and disclosure practices, for example, by requiring us to comply with extensive and costly registration, reporting or disclosure requirements.
Our operations might be affected by the occurrence of a natural disaster or other catastrophic event.
We depend on our principal executive offices and other facilities for the continued operation of our business. Although we have contingency plans in effect for natural disasters or other catastrophic events, these events, including terrorist attacks and natural disasters such as earthquakes, which our San Diego operations in particular might experience, and hurricanes, which have been known to threaten Charleston, where our headquarters are, could disrupt our operations. Even though we carry business interruption insurance policies and typically have provisions in our contracts that protect us in certain events, we might suffer losses as a result of business interruptions that exceed the coverage available under our insurance policies or for which we do not have coverage. Any natural disaster or catastrophic event affecting us could have a significant negative impact on our operations.
Item 1B. UNRESOLVED STAFF COMMENTS
None.
We lease our headquarters in Charleston, South Carolina which consists of approximately 230,000 square feet. The lease on our Charleston headquarters expires in October 2024, and we have the option for two 5-year renewal periods. We also lease facilities near Indianapolis, Indiana and in San Diego, California; Cambridge, Massachusetts; Washington D.C.; Denver, Colorado; Alexandria, Virginia; Miami, Florida; Almere, Netherlands; Glasgow, Scotland; London, England; East Brisbane, Australia; and Sydney, Australia. We believe that our properties are in good operating condition and adequately serve our current business operations for all of our business segments. We also anticipate that suitable additional or alternative space, including those under lease options, will be available at commercially reasonable terms for future expansion.
From time to time we may become involved in litigation relating to claims arising from our ordinary course of business. We do not believe that there are any claims or actions pending or threatened against us, the ultimate disposition of which would have a material adverse affect on us.
Item 4. SUBMISSION OF MATTERS TO A VOTE OF SECURITY HOLDERSMINE SAFETY DISCLOSURES
No matter was submitted to a vote of our stockholders during the fourth quarter of the year ended December 31, 2009.Not applicable.
PART II
Item 5. MARKET FOR REGISTRANT’S COMMON EQUITY, RELATED STOCKHOLDER MATTERS AND ISSUER PURCHASES OF EQUITY SECURITIES
Our common stock began trading on the NASDAQ National Market under the symbol “BLKB” on July 26, 2004. On July 1, 2006, our common stock began trading on NASDAQ’s newest market tier, the NASDAQ Global Select Market. The following table sets forth the high and low prices for shares of our common stock, as reported by NASDAQ for the periods indicated. The prices are based on quotations between dealers, which do not reflect retail markup, mark-down or commissions.
Blackbaud quarterly high and low stock prices
| High | Low | High | Low | |||||||||||
Fiscal year ended December 31, 2009 | ||||||||||||||
Fiscal year ended December 31, 2011 | ||||||||||||||
First quarter | $ | 13.43 | $ | 9.15 | $ | 27.24 | $ | 24.87 | ||||||
Second quarter | 15.77 | 12.35 | 30.00 | 25.62 | ||||||||||
Third quarter | 24.40 | 13.52 | 28.86 | 22.27 | ||||||||||
Fourth quarter | 24.43 | 21.18 | 30.15 | 21.02 | ||||||||||
Fiscal year ended December 31, 2008 | ||||||||||||||
Fiscal year ended December 31, 2010 | ||||||||||||||
First quarter | $ | 27.75 | $ | 23.23 | $ | 26.33 | $ | 21.17 | ||||||
Second quarter | 25.72 | 20.68 | 26.87 | 21.39 | ||||||||||
Third quarter | 22.69 | 17.86 | 24.61 | 20.82 | ||||||||||
Fourth quarter | 18.70 | 10.77 | 28.31 | 23.81 | ||||||||||
As of February 12, 2010,10, 2012, there were 237200 stockholders of record and approximately 15,000 beneficial owners of our common stock. On February 12, 2010,10, 2012, the closing price of our common stock was $22.17.$31.69.
Stock performance graph
The following performance graph compares the performance of our common stock to the Center for Research in Security Prices (CRSP) Total Market ReturnNASDAQ Composite Index forand the NASDAQ Stock MarketComputer and to a peer group industry index based on the standard industrial code for computer programming, data processing and other computer-related services.Data Processing Index. The graph covers the most recent five-year period ending December 31, 2009.2011. The graph assumes that the value of the investment in our common stock and each index was $100 at December 31, 2004,2006, and that all dividends are reinvested. We paid quarterly dividends at an annual rate of $0.40, $0.40, $0.34 and $0.28 per share for the years ending December 31, 2009, 2008, 2007 and 2006, respectively.
| 12/31/2004 | 12/30/2005 | 12/29/2006 | 12/31/2007 | 12/31/2008 | 12/31/2009 | |||||||||||||
Blackbaud Common Stock | $ | 100.00 | $ | 116.92 | $ | 177.93 | $ | 191.93 | $ | 92.42 | $ | 161.78 | ||||||
CRSP Total Market Return Index | $ | 100.00 | $ | 102.13 | $ | 112.20 | $ | 121.67 | $ | 58.68 | $ | 84.28 | ||||||
Peer Group | $ | 100.00 | $ | 103.39 | $ | 116.09 | $ | 141.85 | $ | 81.65 | $ | 133.45 | ||||||
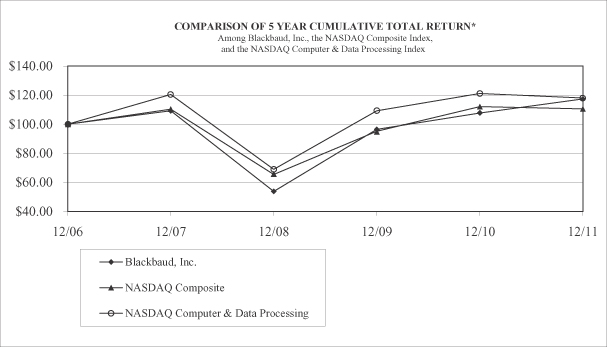
| 12/31/2006 | 12/31/2007 | 12/31/2008 | 12/31/2009 | 12/31/2010 | 12/31/2011 | |||||||||||||||||||
Blackbaud, Inc. | 100.00 | 109.35 | 53.78 | 96.60 | 107.91 | 117.59 | ||||||||||||||||||
NASDAQ Composite | 100.00 | 110.38 | 65.58 | 95.27 | 112.22 | 110.58 | ||||||||||||||||||
NASDAQ Computer & Data Processing | 100.00 | 120.57 | 69.03 | 109.41 | 121.30 | 118.07 | ||||||||||||||||||
Issuer purchases of issuer securities
| Period | Total number of shares purchased(1) | Average price paid per share | Total number of shares purchased as part of publicly announced plans or programs | Approximate (in thousands) | ||||||
Beginning balance, October 1, 2009 | $ | 30,770 | ||||||||
October 1, 2009 through October 31, 2009 | 26,197 | $ | 22.22 | — | $ | 30,770 | ||||
November 1, 2009 through November 30, 2009 | 114,697 | $ | 22.07 | — | $ | 30,770 | ||||
December 1, 2009 through December 31, 2009 | 110 | $ | 23.63 | — | $ | 30,770 | ||||
Total | 141,004 | $ | 22.10 | — | $ | 30,770 | ||||
| Period | Total number of shares purchased (1) | Average price paid per share | Total number of shares purchased as part of publicly announced plans or programs | Approximate (in thousands) | ||||||||||||
Beginning balance, October 1, 2011 | $ | 50,000 | ||||||||||||||
October 1, 2011 through October 31, 2011 | 1,870 | $ | 28.65 | — | $ | 50,000 | ||||||||||
November 1, 2011 through November 30, 2011 | 140,958 | $ | 28.93 | — | $ | 50,000 | ||||||||||
December 1, 2011 through December 31, 2011 | 4,308 | $ | 29.98 | — | $ | 50,000 | ||||||||||
Total | 147,136 | $ | 28.95 | — | $ | 50,000 | ||||||||||
| (1) | During the period of October 1, 2011 through December 31, 2011, there were no shares repurchased. The shares in the table represent shares withheld by us to satisfy the tax obligations of employees due upon vesting of restricted stock and exercise of stock appreciation rights during the period. |
Dividend policy and restrictions
Our Board of Directors has adopted a dividend policy which reflects an intention to distribute to our stockholders a portion of the cash generated by our business that exceeds our operating needs and capital expenditures as regular quarterly dividends. This policy reflects our judgment that we can provide greater value to our stockholders by distributing to them a portion of the cash generated by our business.
In accordance with this dividend policy, we paid quarterly dividends at an annual rate of $0.40$0.48 and $0.44 per share in 20092011 and 2008,2010, respectively, resulting in an aggregate dividend payment to stockholders of $17.7$21.4 million and $17.5$19.5 million in 20092011 and 2008,2010, respectively. In February 2010,2012, our Board of Directors approved an annual dividend rate of $0.44$0.48 per share for 2010.2012. We declared a first quarter dividend of $0.11$0.12 per share payable on March 15, 20102012, to stockholders of record on February 26, 2010,March 5, 2012, and currently intend to pay quarterly dividends at an annual rate of $0.44$0.48 per share of common stock for each of the remaining fiscal quarters in 2010.2012. Dividends at this rate would total approximately $19.4$21.1 million in the aggregate on the common stock in 20102012 (assuming 44.0 million shares of common stock are outstanding, net of treasury stock).
Dividends on our common stock will not be cumulative. Consequently, if dividends on our common stock are not declared and/or paid at the targeted level, our stockholders will not be entitled to receive such payments in the future. We are not obligated to pay dividends, and as described more fully below, our stockholders might not receive any dividends as a result of the following factors:
ourOur credit facility limits the amount of dividends we are permitted to pay;
ourOur Board of Directors could decide to reduce dividends or not to pay dividends at all, at any time and for any reason;
theThe amount of dividends distributed is subject to state law restrictions; and
weWe might not have enough cash to pay dividends due to changes to our operating earnings, working capital requirements and anticipated cash needs.
Assumptions and considerations
We estimate that the cash necessary to fund dividends on our common stock for 20102012 at an annual rate of $0.44$0.48 per share is approximately $19.4$21.1 million (assuming 44.0 million shares of common stock are outstanding, net of treasury stock).
In May 2008, our Board of Directors approvedWe have a new stock repurchase program that authorizedauthorizes us to purchase up to $40$50.0 million of our outstanding shares of common stock. The prior program was terminated at that date and the remaining balance that was authorized but not used under the prior stock repurchase program was included in the amount authorized under the new program. The new program does not have an expiration date. The shares could be purchased in conjunction with a public offering of our stock, from time to time on the open market or in privately negotiated transactions depending upon market conditions and other factors, all in accordance with the requirements of applicable law. As of February 12, 2010, we had purchased 520,423 shares of common stock for $9.2 million pursuant to this program. Any open market purchases under the repurchase program will be made in compliance with Rule 10b-18 of the Securities Exchange Act of 1934 and all other applicable securities regulations. We might not purchase any additional shares of common stock and our Board of Directors may decide, in its absolute discretion, at any time and for any reason, to cancel the stock repurchase program.
We believe that our cash on hand and the cash flows we expect to generate from operations will be sufficient to meet our liquidity requirements through 2010,2012, including dividends and purchases under our stock repurchase program. See “Management’s discussion and analysis of financial conditions and results of operations—operations — Liquidity and capital resources” in this report.
If our assumptions as to operating expenses, working capital requirements and capital expenditures are too low or if unexpected cash needs arise that we are not able to fund with cash on hand or with borrowings under our credit facility, we would need to either reduce or eliminate dividends. If we were to use working capital or permanent
borrowings to fund dividends, we would have less cash available for future dividends and other purposes, which could negatively impact our stock price, financial condition, results of operations and ability to maintain or expand our business.
We have estimated our dividend only for 2010,2012, and we cannot assure our stockholders that during or following such periods that we will pay dividends at the estimated levels, or at all. We are not required to pay dividends and our Board of Directors may modify or revoke our dividend policy at any time. Dividend payments are within the absolute discretion of our Board of Directors and will be dependent upon many factors and future developments that could differ materially from our current expectations. Indeed, over time our capital and other cash needs, including unexpected cash needs, will invariably change and remain subject to uncertainties, which could impact the level of any dividends we pay in the future.
We believe that our dividend policy could limit, but not preclude, our ability to pursue growth as we intend to retain sufficient cash after the distribution of dividends to permit the pursuit of growth opportunities that do not require material capital investments. In order to pay dividends at the level currently anticipated under our dividend policy and to fund any substantial portion of our stock repurchase program, we expect that we could require financing or borrowings to fund any significant acquisitions or to pursue growth opportunities requiring capital expenditures significantly beyond our anticipated capital expenditure levels. Management will evaluate potential growth opportunities as they arise and, if our Board of Directors determines that it is in our best interest to use cash that would otherwise be available for distribution as dividends to pursue an acquisition opportunity, to materially increase capital spending or for some other purpose, the Board would be free to depart from or change our dividend policy at any time.
Restrictions on payment of dividends
Under Delaware law, we can only pay dividends either out of “surplus” (which is defined as total assets at fair market value minus total liabilities, minus statutory capital) or out of current or the immediately preceding year’s earnings. As of December 31, 2009,2011, we had approximately $22.8$52.5 million in cash and cash equivalents. In addition, we anticipate that we will have sufficient earnings in 20102012 to pay dividends at the level described above. Although we believe we will have sufficient surplus and earnings to pay dividends at the anticipated levels for 2010,2012, our Board of Directors will seek periodically to assure itself of this sufficiency before actually declaring any dividends.
OurWe entered into an amended and restated credit facility with Wachovia Bank, N.A. dated July 25, 2007on February 9, 2012. The amended credit facility restricts our ability to declare and pay dividends on our common stock as follows:
stock. In order to pay any cash dividends and/or repurchase shares of stock: (1) no default or event of default shall have occurred and be continuing under the credit facility;facility, and (2) we must be in compliance with a leverage ratio set forth in the credit agreement and (3) we must have cash on hand (which includes any unused amounts under the credit facility) of at least $10.0 million; each after giving effect to the payment of dividends and/or the repurchase of shares.agreement.
Item 6. SELECTED CONSOLIDATED FINANCIAL DATA
The selected consolidated financial data set forth below should be read in conjunction with “Management’s discussion and analysis of financial condition and results of operations” and our financial statements and the related notes included elsewhere in this report.
The selected consolidated financial data below has been revised to reflect the corrections of immaterial errors in previously reported financial results. See Note 1 of the consolidated financial statements included in this annual report for a detailed discussion. The net income impact of the revisions was a decrease in net income of $0.6 million, $0.9 million, $1.5 million and $2.2 million for the year ended December 31, 2010, 2009, 2007 and 2006, respectively, and an increase in net income of $0.9 million for the year ended December 31, 2008.
The following data, insofar as it relates to each of the years ended December 31, 2009, 2008,2011, 2010 and 2007,2009, has been derived from the audited annual financial statements, including the consolidated balance sheets at December 31, 20092011 and 20082010, and the related consolidated statements of operations, cash flows and stockholders’ equity and comprehensive income for the three years ended December 31, 2009, 20082011, 2010 and 20072009 and notes thereto appearing elsewhere herein. The following data, insofar as it relates to each of the years ended December 31, 20062008 and 20052007, and the consolidated balance sheet as of December 31, 2007, 20062009, 2008 and 20052007 are derived from audited financial statements not included in this report.
As described in Note 23 of the consolidated financial statements included in this annual report, we made business acquisitions in 2008, 2007 and 2006, which could affect the comparability of the information presented.
| Years ended December 31, | ||||||||||||||||||||
| (in thousands, except per share data) | 2009 | 2008 | 2007 | 2006 | 2005 | |||||||||||||||
Consolidated statements of operations data: | ||||||||||||||||||||
Revenue | ||||||||||||||||||||
License fees | $ | 25,392 | $ | 35,932 | $ | 37,569 | $ | 32,500 | $ | 29,978 | ||||||||||
Services | 87,834 | 100,824 | 91,376 | 61,242 | 52,606 | |||||||||||||||
Maintenance | 116,476 | 107,304 | 94,602 | 80,893 | 71,163 | |||||||||||||||
Subscriptions | 72,898 | 49,705 | 25,389 | 10,605 | 6,965 | |||||||||||||||
Other revenue | 6,738 | 8,730 | 8,102 | 6,140 | 5,237 | |||||||||||||||
Total revenue | 309,338 | 302,495 | 257,038 | 191,380 | 165,949 | |||||||||||||||
Cost of revenue | ||||||||||||||||||||
Cost of license fees | 3,582 | 3,316 | 2,870 | 2,260 | 4,380 | |||||||||||||||
Cost of services(1) | 61,713 | 63,960 | 54,908 | 33,717 | 28,409 | |||||||||||||||
Cost of maintenance(1) | 21,364 | 20,185 | 17,119 | 13,225 | 10,926 | |||||||||||||||
Cost of subscriptions(1) | 28,183 | 20,587 | 10,306 | 2,360 | 1,472 | |||||||||||||||
Cost of other revenue | 6,098 | 8,368 | 7,274 | 5,709 | 4,943 | |||||||||||||||
Total cost of revenue | 120,940 | 116,416 | 92,477 | 57,271 | 50,130 | |||||||||||||||
Gross profit | 188,398 | 186,079 | 164,561 | 134,109 | 115,819 | |||||||||||||||
Operating expenses | ||||||||||||||||||||
Sales and marketing(1) | 62,796 | 65,185 | 56,994 | 41,405 | 33,491 | |||||||||||||||
Research and development(1) | 45,662 | 38,708 | 28,525 | 23,118 | 21,138 | |||||||||||||||
General and administrative(1) | 33,380 | 34,072 | 26,144 | 21,757 | 15,795 | |||||||||||||||
Amortization | 768 | 713 | 491 | 699 | 18 | |||||||||||||||
Total operating expenses | 142,606 | 138,678 | 112,154 | 86,979 | 70,442 | |||||||||||||||
Income from operations | 45,792 | 47,401 | 52,407 | 47,130 | 45,377 | |||||||||||||||
Interest income | 637 | 526 | 813 | 1,584 | 964 | |||||||||||||||
Interest expense | (962 | ) | (1,526 | ) | (1,164 | ) | (48 | ) | (49 | ) | ||||||||||
Other income (expense), net | 220 | (194 | ) | (503 | ) | (238 | ) | 6 | ||||||||||||
Income before provision for income taxes | 45,687 | 46,207 | 51,553 | 48,428 | 46,298 | |||||||||||||||
Income tax provision | 17,240 | 16,329 | 19,829 | 18,275 | 13,211 | |||||||||||||||
Net income | $ | 28,447 | $ | 29,878 | $ | 31,724 | $ | 30,153 | $ | 33,087 | ||||||||||
Earnings per share | ||||||||||||||||||||
Basic | $ | 0.67 | $ | 0.70 | $ | 0.73 | $ | 0.70 | $ | 0.78 | ||||||||||
Diluted | $ | 0.65 | $ | 0.68 | $ | 0.71 | $ | 0.68 | $ | 0.72 | ||||||||||
Common shares and equivalents outstanding | ||||||||||||||||||||
Basic weighted average shares | 42,771 | 42,959 | 43,619 | 43,320 | 42,559 | |||||||||||||||
Diluted weighted average shares | 43,600 | 43,959 | 44,595 | 44,668 | 46,210 | |||||||||||||||
Dividends per share | $ | 0.40 | $ | 0.40 | $ | 0.34 | $ | 0.28 | $ | 0.20 | ||||||||||
| Years ended December 31, | Years ended December 31, | |||||||||||||||||||||||||||||||||||
| (in thousands) | 2009 | 2008 | 2007 | 2006 | 2005 | |||||||||||||||||||||||||||||||
Summary of stock-based compensation (benefit): | ||||||||||||||||||||||||||||||||||||
|
| |||||||||||||||||||||||||||||||||||
| (in thousands, except per share data) | 2011 | 2010 | 2009 | 2008 | 2007 | |||||||||||||||||||||||||||||||
Consolidated statements of operations data: | ||||||||||||||||||||||||||||||||||||
Revenue | ||||||||||||||||||||||||||||||||||||
License fees | $ | 19,475 | $ | 23,719 | $ | 25,656 | $ | 35,484 | $ | 37,569 | ||||||||||||||||||||||||||
Subscriptions | 103,544 | 83,912 | 73,194 | 49,773 | 25,389 | |||||||||||||||||||||||||||||||
Services | 108,781 | 87,663 | 87,239 | 101,015 | 89,944 | |||||||||||||||||||||||||||||||
Maintenance | 130,604 | 124,559 | 116,413 | 107,308 | 94,602 | |||||||||||||||||||||||||||||||
Other revenue | 8,464 | 6,712 | 6,968 | 8,730 | 8,102 | |||||||||||||||||||||||||||||||
|
| |||||||||||||||||||||||||||||||||||
Total revenue | 370,868 | 326,565 | 309,470 | 302,310 | 255,606 | |||||||||||||||||||||||||||||||
|
| |||||||||||||||||||||||||||||||||||
Cost of revenue | ||||||||||||||||||||||||||||||||||||
Cost of license fees | 3,345 | 3,003 | 3,697 | 3,388 | 2,919 | |||||||||||||||||||||||||||||||
Cost of subscriptions(1) | 42,536 | 31,155 | 28,158 | 20,564 | 10,306 | |||||||||||||||||||||||||||||||
Cost of services(1) | 79,086 | 66,755 | 61,585 | 63,810 | 54,798 | |||||||||||||||||||||||||||||||
Cost of maintenance(1) | 25,178 | 24,123 | 21,594 | 20,175 | 17,119 | |||||||||||||||||||||||||||||||
Cost of other revenue | 7,049 | 7,103 | 6,098 | 8,368 | 7,274 | |||||||||||||||||||||||||||||||
|
| |||||||||||||||||||||||||||||||||||
Total cost of revenue | 157,194 | 132,139 | 121,132 | 116,305 | 92,416 | |||||||||||||||||||||||||||||||
|
| |||||||||||||||||||||||||||||||||||
Gross profit | 213,674 | 194,426 | 188,338 | 186,005 | 163,190 | |||||||||||||||||||||||||||||||
Operating expenses | ||||||||||||||||||||||||||||||||||||
Sales and marketing(1) | 75,361 | 69,469 | 63,495 | 65,573 | 56,761 | |||||||||||||||||||||||||||||||
Research and development(1) | 47,672 | 45,499 | 45,520 | 38,497 | 28,378 | |||||||||||||||||||||||||||||||
General and administrative(1) | 36,933 | 32,636 | 33,383 | 33,904 | 26,144 | |||||||||||||||||||||||||||||||
Impairment of cost method investment | 1,800 | — | — | — | — | |||||||||||||||||||||||||||||||
Amortization | 980 | 798 | 768 | 713 | 491 | |||||||||||||||||||||||||||||||
|
| |||||||||||||||||||||||||||||||||||
Total operating expenses | 162,746 | 148,402 | 143,166 | 138,687 | 111,774 | |||||||||||||||||||||||||||||||
|
| |||||||||||||||||||||||||||||||||||
Income from operations | 50,928 | 46,024 | 45,172 | 47,318 | 51,416 | |||||||||||||||||||||||||||||||
Interest income | 183 | 84 | 637 | 526 | 813 | |||||||||||||||||||||||||||||||
Interest expense | (200 | ) | (74 | ) | (962 | ) | (1,526 | ) | (1,164 | ) | ||||||||||||||||||||||||||
Other income (expense), net | 346 | (98 | ) | 220 | (194 | ) | (503 | ) | ||||||||||||||||||||||||||||
|
| |||||||||||||||||||||||||||||||||||
Income before provision for income taxes | 51,257 | 45,936 | 45,067 | 46,124 | 50,562 | |||||||||||||||||||||||||||||||
Income tax provision | 18,037 | 16,749 | 17,547 | 17,185 | 20,389 | |||||||||||||||||||||||||||||||
|
| |||||||||||||||||||||||||||||||||||
Net income | $ | 33,220 | $ | 29,187 | $ | 27,520 | $ | 28,939 | $ | 30,173 | ||||||||||||||||||||||||||
|
| |||||||||||||||||||||||||||||||||||
Earnings per share | ||||||||||||||||||||||||||||||||||||
Basic | $ | 0.76 | $ | 0.68 | $ | 0.64 | $ | 0.67 | $ | 0.69 | ||||||||||||||||||||||||||
Diluted | $ | 0.75 | $ | 0.67 | $ | 0.63 | $ | 0.66 | $ | 0.68 | ||||||||||||||||||||||||||
Common shares and equivalents outstanding | ||||||||||||||||||||||||||||||||||||
Basic weighted average shares | 43,523 | 43,145 | 42,771 | 42,959 | 43,619 | |||||||||||||||||||||||||||||||
Diluted weighted average shares | 44,149 | 43,876 | 43,600 | 43,959 | 44,595 | |||||||||||||||||||||||||||||||
Dividends per share | $ | 0.48 | $ | 0.44 | $ | 0.40 | $ | 0.40 | $ | 0.34 | ||||||||||||||||||||||||||
Summary of stock-based compensation: | ||||||||||||||||||||||||||||||||||||
Cost of subscriptions | $ | 571 | $ | 392 | $ | 387 | $ | 283 | $ | 274 | ||||||||||||||||||||||||||
Cost of services | $ | 1,433 | $ | 1,442 | $ | 627 | $ | 531 | $ | 269 | 1,966 | 1,742 | 1,433 | 1,442 | 627 | |||||||||||||||||||||
Cost of maintenance | 750 | 534 | 234 | 117 | 33 | 741 | 814 | 750 | 534 | 234 | ||||||||||||||||||||||||||
Cost of subscriptions | 387 | 283 | 274 | 19 | — | |||||||||||||||||||||||||||||||
|
| |||||||||||||||||||||||||||||||||||
Total included in cost of revenue | 2,570 | 2,259 | 1,135 | 667 | 302 | 3,278 | 2,948 | 2,570 | 2,259 | 1,135 | ||||||||||||||||||||||||||
|
| |||||||||||||||||||||||||||||||||||
Sales and marketing | 1,605 | 1,607 | 831 | 813 | 217 | 1,325 | 1,366 | 1,605 | 1,607 | 831 | ||||||||||||||||||||||||||
Research and development | 2,944 | 2,396 | 1,219 | 746 | 139 | 3,039 | 2,844 | 2,944 | 2,396 | 1,219 | ||||||||||||||||||||||||||
General and administrative | 5,168 | 5,823 | 3,749 | 5,174 | (343 | ) | 7,242 | 5,901 | 5,291 | 5,700 | 3,749 | |||||||||||||||||||||||||
|
| |||||||||||||||||||||||||||||||||||
Total included in operating expenses | 9,717 | 9,826 | 5,799 | 6,733 | 13 | 11,606 | 10,111 | 9,840 | 9,703 | 5,799 | ||||||||||||||||||||||||||
|
| |||||||||||||||||||||||||||||||||||
Total stock-based compensation | $ | 12,287 | $ | 12,085 | $ | 6,934 | $ | 7,400 | $ | 315 | $ | 14,884 | $ | 13,059 | $ | 12,410 | $ | 11,962 | $ | 6,934 | ||||||||||||||||
|
| |||||||||||||||||||||||||||||||||||
| (1) | Includes stock-based compensation as set forth in tabular summary of stock-based compensation |
| December 31, | |||||||||||||||||||||||||||||||||||||||
| December 31, |
|
| |||||||||||||||||||||||||||||||||||||
| (in thousands) | 2009 | 2008 | 2007 | 2006 | 2005 | 2011 | 2010 | 2009 | 2008 | 2007 | |||||||||||||||||||||||||||||
Consolidated balance sheet data: | |||||||||||||||||||||||||||||||||||||||
Consolidated balance sheet data | |||||||||||||||||||||||||||||||||||||||
Cash and cash equivalents | $ | 22,769 | $ | 16,361 | $ | 14,775 | $ | 67,783 | $ | 22,683 | $ | 52,520 | $ | 28,004 | $ | 22,769 | $ | 16,361 | $ | 14,775 | |||||||||||||||||||
Deferred tax asset, including current portion | 61,298 | 71,620 | 53,972 | 67,620 | 80,052 | 30,927 | 47,478 | 59,284 | 70,100 | 52,174 | |||||||||||||||||||||||||||||
Working capital (deficit) | (70,485 | ) | (109,962 | ) | (46,977 | ) | 14,125 | (16,866 | ) | ||||||||||||||||||||||||||||||
Working (deficit) capital | (52,093 | ) | (57,056 | ) | (74,458 | ) | (113,464 | ) | (49,113 | ) | |||||||||||||||||||||||||||||
Total assets | 304,229 | 313,886 | 237,694 | 195,009 | 148,463 | 392,590 | 323,806 | 299,927 | 311,087 | 235,210 | |||||||||||||||||||||||||||||
Deferred revenue | 135,584 | 119,640 | 96,100 | 76,952 | 63,222 | 163,437 | 150,661 | 137,950 | 122,023 | 97,506 | |||||||||||||||||||||||||||||
Total liabilities | 188,123 | 223,378 | 124,591 | 99,651 | 83,711 | 252,588 | 207,337 | 189,634 | 225,354 | 125,887 | |||||||||||||||||||||||||||||
Common stock | 52 | 51 | 50 | 49 | 48 | 54 | 53 | 52 | 51 | 50 | |||||||||||||||||||||||||||||
Additional paid-in capital | 134,726 | 116,846 | 105,687 | 88,409 | 73,583 | 175,401 | 158,372 | 134,643 | 116,688 | 105,579 | |||||||||||||||||||||||||||||
Total stockholders’ equity | $ | 116,106 | $ | 90,508 | $ | 113,103 | $ | 95,358 | $ | 64,752 | $ | 140,002 | $ | 116,469 | $ | 110,293 | $ | 85,733 | $ | 109,323 | |||||||||||||||||||
Item 7. MANAGEMENT’S DISCUSSION AND ANALYSIS OF FINANCIAL CONDITION AND RESULTS OF OPERATIONS
The following discussion and analysis of our financial condition and results of operations should be read in conjunction with Item 1.A Risk Factors and our consolidated financial statements and related notes included elsewhere in this Annual Report on Form 10-K. This report contains forward-looking statements within the meaning of Section 21E of the Securities Act of 1933 and Section 21E of the Securities Exchange Act of 1934. These forward-looking statements reflect our current view with respect to future events and financial performance and are subject to risks and uncertainties, including those set forth under “Item 1A. Risk factors”, under “Cautionary statement” included in this “Management’s discussion and analysis of financial condition and results of operations” and elsewhere in this report, that could cause actual results to differ materially from historical or anticipated results.
Executive summary
We are the leading global provider ofprovide on-premise and cloud-based software solutions and related services designed specifically for nonprofit organizations. Ourorganizations, and provide products and services that enable nonprofit organizations to increase donations, reduce fundraising costs, improve communications with constituents, manage their finances and optimize internal operations. We have focused solely on the nonprofit market since our incorporation in 1982 and have developed our suite of products and services based upon our extensive knowledge of the operating challenges facing nonprofit organizations. At the end of 2009,2011, we had approximately 22,00026,000 active customers. Our customers operate indistributed across multiple verticals within the nonprofit market including education, foundations, health and human services, religion, arts and cultural, public and societal benefits, environment and animal welfare and international foreign affairs.
We derive revenue from selling perpetual licenses or charging for the use of our software products in a hosted environment and providing a broad offering of services, including consulting, training, installation and implementation, as well as ongoing customer support and maintenance. Consulting, training and implementation are generally not essential to the functionality of our software products and are sold separately. Furthermore, we derive revenue from providing hosting services, performing donor prospect research engagements, selling lists of potential donors, and providing benchmarking studies and data modeling services.
Revenue for 2009Overall, revenue in 2011 increased 2%14% compared to 2008. The inclusion of Kintera, which we acquired in July 2008, resulted in an increase in revenue of $16.1 million for 2009. Excluding the impact of Kintera, revenue decreased by 3% for 2009 when compared to 2008.2010. When removing the impact of foreign currency translation, revenue increased by 4%13% when comparing 20092011 to 2008. Further, when removing2010. This increase was principally the impactresult of foreign currency translationcontinued growth in our services and the impact from Kintera,subscriptions revenue. The increase in services revenue decreased by 2% when comparing 2009 to 2008.
Our selling environment remained challenging during 2009 as difficult and uncertain economic conditions continued to put pressure on the spending of many organizations in the nonprofit industry. Revenues associated with our perpetual license offerings and related services decreased compared to 2008was primarily as a result of these economic conditions and reduced marketan increase in demand for these offerings. However,our consulting services associated with our Blackbaud CRM offering. Additionally, our recurring revenue, which is comprised of maintenance services and subscription offerings continued to experience growth during 2009. Revenue fromand maintenance services and subscription offerings, which represented approximately 61%63% of our 2011 revenue on a combined basis, grew 21%contributed to the growth in 2009revenue. The growth in subscriptions revenue is principally attributable to increased demand for our hosting services, online fundraising and data management offerings and the shift in our business towards hosted solutions. The growth in maintenance revenue is principally driven by maintaining high renewal rates, new maintenance contracts associated with new license arrangements and existing client increases. Revenue associated with our core perpetual license offerings decreased in 2011 when compared to 2008. Approximately half2010 as a result of this revenue growth is attributablethe continuing decreases in sales of our perpetual license offerings to Kintera and the remaining growthmid-market customer base, which is principally the result of customers opting to purchase our business increasingly evolving towards product sales on a subscription basis.solutions under alternative packaging with more flexible subscription-based pricing. We believe this trend will continue, and may accelerate, in the future.
In 2009, we focused on closely managing our operating expenses and achieving our targeted level of profitability. Income from operations for 2009 decreased2011 increased by $1.611%, or $4.9 million, compared to 2008. During 2009, the decrease2010. The increase in income from operations is primarily attributable to anthe increase in stock based compensation expense, amortization expense associatedservices and subscriptions gross profit which is driven by the continued strong retention rate of our solutions that are offered under recurring revenue arrangements and the scalability of our infrastructure that supports these services. The increase in income from operations of 11% was less than the increase in revenue of 14% during 2011 primarily due to the investment in the infrastructure that supports our subscription-based offerings.
We ended 2011 with intangible assetscash and cash equivalents totaling $52.5 million and no outstanding borrowings on our credit facility. During 2011, we generated $85.5 million in cash flow from our recent acquisitionsoperations, which we used to purchase $23.4 million of acquired companies, pay $21.4 million in dividends and research and development expense to support our continuing product investment.purchase $18.2 million of equipment.
Blackbaud, Inc.
Item 7. Management’s discussion and analysis of financial condition and results of operations—(Continued)
We ended 2009 with cashDuring 2011, we experienced overall growth in revenue and cash equivalents totaling $22.8 millionhave begun to see increases in charitable giving levels. However, we continue to believe the pace and no outstanding borrowingsimpact of economic recovery on our credit facility. During 2009, we generated $86.8 million in cash flow from operations out of which we paid $59.0 million on our credit facility and $17.7 million in dividends. Additionally, cash flow from operations allowed us to fund the purchase of $5.5 million of property and equipment, and increase our cash and cash equivalents by $6.4 million.
nonprofit market remains uncertain. We expect that our operating environment will remaincontinue to be challenging in 20102012 as existing and prospective customers continue to exercise cautionremain cautious in their expenditure decisions. Notwithstanding these conditions, we plan to continue to focusremain focused on expanding market share, selectively investing inexecution of our key growth initiatives and strengthening our leadership position. As we have throughout 2009, we will also focus on controlling and, as necessary, reducing the costs and expenses of our operations to achieveposition, while achieving our targeted level of profitability. We also plan to continue to invest in our back office processes and the infrastructure that supports our subscription-based offerings to achieve optimal scalability of our operations as we execute on our key growth initiatives.
Consolidated statementsRecent developments
Convio acquisition
On January 16, 2012, we entered into an Agreement and Plan of operations, percentMerger with Convio, Inc. (“Convio”), a leading provider of revenueon-demand constituent engagement solutions that enable nonprofit organizations to more effectively raise funds, advocate for change and cultivate relationships. Under the terms of the agreement, we will acquire all of the outstanding shares of common stock of Convio for $16.00 per share, representing a premium of 49% compared to Convio’s closing price prior to the announcement of the proposed acquisition and an enterprise value of approximately $275.0 million (based on dilutive shares). We will finance the deal through a combination of cash on hand and debt.
Amended and restated credit facility
| Years ended December 31, | |||||||||
| 2009 | 2008 | 2007 | |||||||
Revenue | |||||||||
License fees | 8.2 | % | 11.9 | % | 14.6% | ||||
Services | 28.4 | 33.3 | 35.5 | ||||||
Maintenance | 37.7 | 35.5 | 36.8 | ||||||
Subscriptions | 23.5 | 16.4 | 9.9 | ||||||
Other revenue | 2.2 | 2.9 | 3.2 | ||||||
Total revenue | 100.0 | % | 100.0 | % | 100.0% | ||||
Cost of revenue | |||||||||
Cost of license fees | 1.1 | 1.1 | 1.1 | ||||||
Cost of services | 20.0 | 21.1 | 21.4 | ||||||
Cost of maintenance | 6.9 | 6.7 | 6.7 | ||||||
Cost of subscriptions | 9.1 | 6.8 | 4.0 | ||||||
Cost of other revenue | 2.0 | 2.8 | 2.8 | ||||||
Total cost of revenue | 39.1 | 38.5 | 36.0 | ||||||
Gross profit | 60.9 | 61.5 | 64.0 | ||||||
Operating expenses | |||||||||
Sales and marketing | 20.3 | 21.5 | 22.2 | ||||||
Research and development | 14.8 | 12.8 | 11.1 | ||||||
General and administrative | 10.8 | 11.3 | 10.2 | ||||||
Amortization | 0.2 | 0.2 | 0.2 | ||||||
Total operating expenses | 46.1 | 45.8 | 43.6 | ||||||
Income from operations | 14.8 | 15.7 | 20.4 | ||||||
Interest income | 0.2 | 0.2 | 0.3 | ||||||
Interest expense | (0.3 | ) | (0.5 | ) | (0.5) | ||||
Other income (expense), net | 0.1 | (0.1 | ) | (0.2) | |||||
Income before provision for income taxes | 14.8 | 15.3 | 20.1 | ||||||
Income tax provision | 5.6 | 5.4 | 7.7 | ||||||
Net income | 9.2 | % | 9.9 | % | 12.3% | ||||
Blackbaud, Inc.
Item 7. Management’s discussion and analysis of financial condition and results of operations—(Continued)
Consolidated statements of operations, percent of revenue
| Years ended December 31, | ||||||||||||
| 2011 | 2010 | 2009 | ||||||||||
Revenue | ||||||||||||
License fees | 5.3 | % | 7.3 | % | 8.3 | % | ||||||
Subscriptions | 27.9 | 25.7 | 23.7 | |||||||||
Services | 29.3 | 26.8 | 28.2 | |||||||||
Maintenance | 35.2 | 38.1 | 37.6 | |||||||||
Other revenue | 2.3 | 2.1 | 2.2 | |||||||||
|
| |||||||||||
Total revenue | 100.0 | % | 100.0 | % | 100.0 | % | ||||||
|
| |||||||||||
Cost of revenue | ||||||||||||
Cost of license fees | 0.9 | 0.9 | 1.2 | |||||||||
Cost of subscriptions | 11.5 | 9.5 | 9.1 | |||||||||
Cost of services | 21.3 | 20.4 | 19.9 | |||||||||
Cost of maintenance | 6.8 | 7.4 | 7.0 | |||||||||
Cost of other revenue | 1.9 | 2.2 | 2.0 | |||||||||
|
| |||||||||||
Total cost of revenue | 42.4 | 40.5 | 39.2 | |||||||||
|
| |||||||||||
Gross profit | 57.6 | 59.5 | 60.8 | |||||||||
Operating expenses | ||||||||||||
Sales and marketing | 20.3 | 21.3 | 20.5 | |||||||||
Research and development | 12.9 | 14.0 | 14.7 | |||||||||
General and administrative | 10.0 | 10.0 | 10.8 | |||||||||
Impairment of cost method investment | 0.5 | — | — | |||||||||
Amortization | 0.2 | 0.2 | 0.2 | |||||||||
|
| |||||||||||
Total operating expenses | 43.9 | 45.5 | 46.2 | |||||||||
|
| |||||||||||
Income from operations | 13.6 | 14.0 | 14.6 | |||||||||
Interest income | 1.0 | — | 0.2 | |||||||||
Interest expense | (0.1 | ) | — | (0.3 | ) | |||||||
Other income, net | 0.1 | — | 0.1 | |||||||||
|
| |||||||||||
Income before provision for income taxes | 13.8 | 14.1 | 14.6 | |||||||||
Income tax provision | 4.8 | 5.1 | 5.7 | |||||||||
|
| |||||||||||
Net income | 9.0 | % | 8.9 | % | 8.9 | % | ||||||
| ||||||||||||
Blackbaud, Inc.
Item 7. Management’s discussion and analysis of financial condition and results of operations—(Continued)
Results of operations
ComparisonDuring the fourth quarter of 2011, we revised previously issued financial statements to correct errors identified principally related to revenue recognition, accounting for income taxes and the capitalization of software development costs. None of the years ended December 31, 2009, 2008 and 2007
On April 29, 2009, we acquired RLC Customer Centric Technology B.V. (RLC), a privately held limited company basedrevisions were considered material to the periods impacted, as disclosed in Note 1 of the Netherlands. The acquisitionconsolidated financial statements included in this annual report. All amounts in Item 7 of RLC provides us with a foundation to expand into the Netherlands and other Western European markets.this filing are provided as revised.
During 20082011, 2010 and 2007,2009, we acquired companies that provided us with a strategic opportunityopportunities to expand our share of the nonprofit market with SaaS and subscription offerings, and through the integration of complimentary products and services to serve the changing needs of our customers. Following are the companies we acquired during 2008 and 2007 and their respective acquisition date:
Target Software, Inc. and Target Analysis Group, Inc. (together referred to as the Target Companies)—January 16, 2007;RLC Customer Centric Technology B.V. – April 29, 2009;
eTapestry.com,Target America, Inc. (referred to as eTapestry)—August– May 12, 2010;
NOZA, Inc. – October 1, 2007;2010;
Public Interest Data, LLC, or PIDI – February 1, 2011; and
Kintera, Inc. (referred to as Kintera)—July 8, 2008.Everyday Hero Pty. Ltd., or EDH – October 6, 2011.
The results of operations of the acquired companies are included in our consolidated results of operations from the datesdate of their respective acquisition as noted above, which impacts the comparability of our results of operations when comparing 20092011 to 20082010 and 20082010 to 2007.2009. We have noted in the discussion below, to the extent meaningful, the impact on the comparability of our results of operations due to the inclusion of the acquired companies for only a partial year in the year of acquisitionacquisition.
Comparison of the years ended December 31, 2011 and a full year in the subsequent year.2010
Revenue
The table below compares revenue from our statement of operations for the years ended December 31, 2009, 2008,2011 and 2007.2010.
| Years ended December 31, | 2009 versus 2008 | 2008 versus 2007 | Years ended December 31, | ||||||||||||||||||||||||||||||||||||||||||
| (in millions) | 2009 | 2008 | 2007 | Change | % Change | Change | % Change | 2011 | 2010 | Change | % Change | ||||||||||||||||||||||||||||||||||
|
|
| |||||||||||||||||||||||||||||||||||||||||||
License fees | $ | 25.4 | $ | 35.9 | $ | 37.5 | $ | (10.5 | ) | (29 | )% | $ | (1.6 | ) | (4 | )% | $ | 19.5 | $ | 23.7 | $ | (4.2 | ) | (18 | )% | ||||||||||||||||||||
Subscriptions | 103.5 | 83.9 | 19.6 | 23 | % | ||||||||||||||||||||||||||||||||||||||||
Services | 87.8 | 100.8 | 91.4 | (13.0 | ) | (13 | )% | 9.4 | 10 | % | 108.8 | 87.7 | 21.1 | 24 | % | ||||||||||||||||||||||||||||||
Maintenance | 116.5 | 107.3 | 94.6 | 9.2 | 9 | % | 12.7 | 13 | % | 130.6 | 124.6 | 6.0 | 5 | % | |||||||||||||||||||||||||||||||
Subscriptions | 72.9 | 49.7 | 25.4 | 23.2 | 47 | % | 24.3 | 96 | % | ||||||||||||||||||||||||||||||||||||
Other | 6.7 | 8.8 | 8.1 | (2.1 | ) | (24 | )% | 0.7 | 9 | % | 8.5 | 6.7 | 1.8 | 27 | % | ||||||||||||||||||||||||||||||
|
|
|
| ||||||||||||||||||||||||||||||||||||||||||
Total revenue | $ | 309.3 | $ | 302.5 | $ | 257.0 | $ | 6.8 | 2 | % | $ | 45.5 | 18 | % | $ | 370.9 | $ | 326.6 | $ | 44.3 | 14 | % | |||||||||||||||||||||||
|
|
|
| ||||||||||||||||||||||||||||||||||||||||||
Total revenue increased $6.8$44.3 million, or 2%14%, in 20092011 compared to 2008. The2010. This increase in revenue is primarily dueattributable to growth in subscriptionour subscriptions and services revenue. The increase in subscriptions revenue as a result of the acquisition of Kintera andis primarily attributable to an increase in demand for our hosted offerings, hosting services, online fundraising and online data services. The growth in revenue from our subscription offerings is also a result ofmanagement offerings. This increase has been driven by the ongoing evolution of our product offerings from a license-based to subscription-based offerings. Maintenancebusiness model. Services revenue also increasedgrowth is primarily due to additional revenue from new maintenance contractsan increase in demand for consulting services associated with new license agreementsour Blackbaud CRM offering and existing client increases. The increase in subscriptions and maintenance revenue was partially offset by decreases in license fees and services revenue. The decreases in license fees and services revenue are principally attributable to the delays and postponements of purchasing decisions by our existing and prospective customers resulting from the weak economic environment.
Blackbaud, Inc.
Item 7. Management’s discussion and analysis of financial condition and results of operations—(Continued)
Total revenue increased $45.5 million, or 18%, in 2008 compared to 2007. Approximately half, or $22.0 million, of the increase in total revenue was attributable to the inclusion of eTapestry and Kintera in our consolidated results of operations. The remaining increase in revenue for 2008, totaling $23.5 million and representing a 9% increase over 2007, was primarily attributable to growth in revenue from subscriptions and maintenance services. The increase in maintenance revenue is principally fromattributable to new maintenance contracts with associated with new license agreements sold over the last twelve months and increases in contracts with existing client increases. Subscription revenue increased 35%, excluding the impact of our acquisitions, due to an increasecustomers. These increases are offset by a decrease in demand for our hosting and other online data services.
Segment results
Through December 31, 2009, we analyzed our business according to our six operating segments as identified in Note 14 of our consolidated financial statements, which are license fees consulting and education services, analytic services, maintenance, subscriptions and other. The analyses provided below are presented onwhich is principally attributable to a non-GAAP basis before the inclusion of various allocable corporate costs such as depreciation, facilities and information technology (IT) support costs, stock-based compensation and amortization of intangibles arisingsmaller contribution in 2011 from business combinations because,Blackbaud CRM perpetual license arrangements with upfront revenue recognition than in managing2010. Additionally, we continue to experience a shift in our operations, we believe that the exclusion of these costs allows us to better understand and manage our operating expenses and cash needs. These excluded costs are analyzed separately following the segmentcustomers’ buying preference away from perpetual licenses towards hosted solutions.
Operating results analysis.
License fees
| Years ended December 31, | 2009 versus 2008 | 2008 versus 2007 | ||||||||||||||||||||||||||||
| (in millions) | 2009 | 2008 | 2007 | Change | % Change | Change | % Change | |||||||||||||||||||||||
License fee revenue | $ | 25.4 | $ | 35.9 | $ | 37.5 | $ | (10.5 | ) | (29 | )% | $ | (1.6 | ) | (4 | )% | ||||||||||||||
Direct controllable cost of license fees | 3.2 | 3.1 | 2.7 | 0.1 | 3 | % | 0.4 | 15 | % | |||||||||||||||||||||
Segment income | $ | 22.2 | $ | 32.8 | $ | 34.8 | $ | (10.6 | ) | (32 | )% | $ | (2.0 | ) | (6 | )% | ||||||||||||||
Segment margin % | 87 | % | 91 | % | 93 | % | ||||||||||||||||||||||||
| Years ended December 31, | ||||||||||||||||||
| (in millions) | 2011 | 2010 | Change | % Change | ||||||||||||||
|
|
| ||||||||||||||||
License fees revenue | $ | 19.5 | $ | 23.7 | $ | (4.2 | ) | (18 | )% | |||||||||
Cost of license fees | 3.3 | 3.0 | 0.3 | 10 | % | |||||||||||||
|
|
|
| |||||||||||||||
License fees gross profit | $ | 16.2 | $ | 20.7 | $ | (4.5 | ) | (22 | )% | |||||||||
|
|
|
| |||||||||||||||
License fees gross margin | 83 | % | 87 | % | ||||||||||||||
Revenue from license fees is derived from the sale of our software products, under a perpetual license agreement. The decreaseWe are increasingly experiencing a shift in our customers’ buying preference away from solutions offered under perpetual license fee revenue during 2009 when comparedarrangements towards subscription-based hosted applications. In addition, we continue to 2008 and during 2008 when compared to 2007 is principally attributable toexperience longer sales cycle times, delays and postponementpostponements of purchasing decisions and overall caution exercised by existing and prospective customers as a result of continued challenges posed by the weak economic environment. In addition, we are increasingly experiencing a shift in our customers’ buying preference away from perpetual license agreements towards subscription-based hosted applications.
During 2009, license fee2011, revenue decreased by $10.5 million when compared to 2008. Sales from license fees to newexisting customers decreased $4.2by $0.9 million and sales to existing clients decreased by $6.3 million. Additionally, during 2009, revenue related to our Enterprise CRM offering grew by $3.7 million, which was offset by decreases in our other perpetual license product offerings of $14.2 million.
During 2008, sales from license fees to new customers decreased by $2.9 million$3.3 million. The decrease in license fees is largely the result of a smaller contribution in 2011 from Blackbaud CRM sales with upfront revenue recognition when compared to 2007, offset by an increase2010 due to existing customers of $1.3 million.credits provided to certain Blackbaud CRM early adopters.
Direct controllable costCost of license fees is principally comprised of third-party software royalties, and variable reseller commissions.commissions, amortization of software development costs and amortization of intangibles from business combinations. The increase in cost of license fees for 2009in 2011 compared to 2010 is principally attributable to an increase in reseller commissions. A greater portion of our software license sales in 2011 were completed through our reseller channels when compared to 2008 and 2008 when2010.
The decrease in license fees gross margin in 2011 compared to 20072010 is primarily attributable to a shiftthe result of an increase in the mixsale of license feeproducts that are sold through our reseller channels.
Subscriptions
| Years ended December 31, | ||||||||||||||||||
| (in millions) | 2011 | 2010 | Change | % Change | ||||||||||||||
|
|
| ||||||||||||||||
Subscriptions revenue | $ | 103.5 | $ | 83.9 | $ | 19.6 | 23 | % | ||||||||||
Cost of subscriptions | 42.5 | 31.2 | 11.3 | 36 | % | |||||||||||||
|
|
|
| |||||||||||||||
Subscriptions gross profit | $ | 61.0 | $ | 52.7 | $ | 8.3 | 16 | % | ||||||||||
|
|
|
| |||||||||||||||
Subscriptions gross margin | 59 | % | 63 | % | ||||||||||||||
Revenue from subscriptions is principally comprised of revenue toward products with higher third-party software royalty costs.
Blackbaud, Inc.
Item 7. Management’s discussion and analysis of financial condition and results of operations—(Continued)
transaction fees associated with the use of our products to fundraise online. Revenue from acquired companies contributed $6.2 million to the growth in subscriptions revenue during 2011. The remaining increase in subscriptions revenue during 2011 is principally attributable to the increase in demand for online fundraising offerings, data management offerings and hosting services. Additionally, revenue from our hosting services continues to increase as the demand for these services continues to grow from both our existing and new perpetual license customers. We continue to experience growth in our hosted applications business and are increasingly experiencing a shift in our customers’ buying preference away from perpetual licenses towards subscription based-offerings.
Cost of subscriptions is primarily comprised of human resource costs, stock-based compensation expense, third-party royalty and data expenses, hosting expenses, an allocation of depreciation, facilities and IT support costs, amortization of intangibles from business combinations and other costs incurred in providing support and services to our customers. The increase in cost of subscriptions in 2011 when compared to 2010 is principally attributable to an increase in headcount. The increase in headcount is due to both the inclusion of acquired companies and the investments we are making in our infrastructure to support the growth in our subscription offerings. Human resource costs increased $6.9 million as a result of an increase in headcount, of which $3.6 million relates to our acquisition of PIDI in February 2011. Hosting costs also increased by $2.8 million due to the increase in required hosting capacity as a result of the increase in demand for hosting and other online services.
The decrease in subscriptions gross margin 2011 compared to 2010 is due to an increase in the investments we are making in the infrastructure to support the growth in our subscription offerings.
Consulting and education servicesServices
| Years ended December 31, | 2009 versus 2008 | 2008 versus 2007 | ||||||||||||||||||||||||||||
| (in millions) | 2009 | 2008 | 2007 | Change | % Change | Change | % Change | |||||||||||||||||||||||
Consulting and education services revenue | $ | 65.3 | $ | 77.7 | $ | 73.2 | $ | (12.4 | ) | (16 | )% | $ | 4.5 | 6 | % | |||||||||||||||
Direct controllable cost of consulting and education services | 41.8 | 44.4 | 38.8 | (2.6 | ) | (6 | )% | 5.6 | 14 | % | ||||||||||||||||||||
Segment income | $ | 23.5 | $ | 33.3 | $ | 34.4 | $ | (9.8 | ) | (29 | )% | $ | (1.1 | ) | (3 | )% | ||||||||||||||
Segment margin % | 36 | % | 43 | % | 47 | % | ||||||||||||||||||||||||
| Years ended December 31, | ||||||||||||||||||
| (in millions) | 2011 | 2010 | Change | % Change | ||||||||||||||
|
|
| ||||||||||||||||
Services revenue | $ | 108.8 | $ | 87.7 | $ | 21.1 | 24 | % | ||||||||||
Cost of services | 79.1 | 66.8 | 12.3 | 18 | % | |||||||||||||
|
|
|
| |||||||||||||||
Services gross profit | $ | 29.7 | $ | 20.9 | $ | 8.8 | 42 | % | ||||||||||
|
|
|
| |||||||||||||||
Services gross margin | 27 | % | 24 | % | ||||||||||||||
Consulting and education servicesServices revenue consists of consulting, installation, implementation, education and educationanalytic services. Consulting, installation and implementation services involve converting data from a customer’s existing system, assistance in file set up and system configuration, and/or process re-engineering. Education services involve customer training activities.
During 2009, consulting and education services revenue decreased $12.4 million when compared to 2008. The inclusion of Kintera for a full year in 2009 compared to a partial year in 2008 accounted for $0.6 million of an increase in consulting and education services revenue. Included in consulting and education services revenue in 2009 is $0.7 million of revenue attributable to RLC. The decrease in revenue is principally the result of decreased volume of consulting, installation and implementation services delivered for our core software products and decreased demand for training services as existing and prospective customers continue to experience budgetary constraints associated with the challenges posed by the overall economic environment. To a lesser extent, the decrease in revenue is attributable to a reduction in the rates we charge as a result of a higher level of discounts offered on our service offerings during 2009 compared to 2008. During 2009, these decreases of $17.0 million were partially offset by an increase of $4.6 million in consulting services associated with our Enterprise CRM product offering and our internet-based products.
During 2008, consulting and education services revenue increased by $4.5 million when compared to 2007, of which $1.9 million is attributable to Kintera and eTapestry. The rates charged for our service offerings remained relatively constant year over year and, as such, the increase in revenue in 2008 is principally the result of increased volume of services provided. The increase in volume of services provided is principally due to an increase in the demand in consulting services associated with our new Enterprise CRM product offerings and our internet based products.
Cost of consulting and education services is principally comprised of human resource costs, third-party contractor expenses, classroom rentals and other costs incurred in providing consulting, installation and implementation services and customer training.
During 2009, cost of consulting and education services decreased by $2.6 million. Human resource costs related to additional headcount attributable to Kintera and RLC increased cost of consulting and education services by $2.4 million. Excluding the impact of acquisitions, the remaining decrease in cost of consulting and education services of $5.0 million during 2009 is primarily due to a reduction in travel-related expenses, recruiting and other costs.
During 2008, cost of consulting and education services increased by $5.6 million, of which $2.2 million is attributable to the inclusion of human resource costs associated with Kintera and eTapestry. Excluding the impact of acquisitions, the remaining increase of $3.4 million is primarily attributable to human resource cost increases as a result of increased skills and competencies in our service professionals.
Blackbaud, Inc.
Item 7. Management’s discussion and analysis of financial condition and results of operations—(Continued)
The decrease in segment margin from 2008 to 2009 is principally due to the decrease in demand for consulting and education services while the cost of consulting and education services decreased to a lesser extent. Cost of consulting and education services decreased at a lower rate than the associated revenue principally due to maintaining resource capacity for the increase in services associated with our Enterprise CRM product offerings and the expected increase in services when the economic environment improves.
The decrease in segment margin from 2007 to 2008 is primarily attributable to average billing rates for our consultants remaining relatively constant while consultant’s salaries and related human resource costs increased, and a change in the mix of the consulting and education services provided.
Analytic services
| Years ended December 31, | 2009 versus 2008 | 2008 versus 2007 | |||||||||||||||||||||||||||
| (in millions) | 2009 | 2008 | 2007 | Change | % Change | Change | % Change | ||||||||||||||||||||||
Analytic services revenue | $ | 22.5 | $ | 23.1 | $ | 18.2 | $ | (0.6 | ) | (3 | )% | $ | 4.9 | 27 | % | ||||||||||||||
Direct controllable cost of analytic services | 10.0 | 9.8 | 8.0 | 0.2 | 2 | % | 1.8 | 23 | % | ||||||||||||||||||||
Segment income | $ | 12.5 | $ | 13.3 | $ | 10.2 | $ | (0.8 | ) | (6 | )% | $ | 3.1 | 30 | % | ||||||||||||||
Segment margin % | 56 | % | 58 | % | 56 | % | |||||||||||||||||||||||
Analytic services are comprised of donor prospect research, selling lists of potential donors, benchmarking studies and data modeling services. These services involve the assessment of current and prospective donor information of nonprofit organizationsthe customer and are performed using our proprietary analytical tools. The end product enables organizations to more effectively target itstheir fundraising activities.
During 2009, analytic We recognize services revenue decreased by $0.6 millionattributable to consulting services for implementation of our hosted applications and subscription offerings ratably over the period the customer benefits from those services. We also recognize the direct and incremental costs associated with consulting services revenue ratably over the same period. However, we continue to expense indirect costs in the period the implementation services are provided.
The increase in services revenue during 2011 when compared to 2008. The inclusion of Kintera for a full year in 2009 compared to a partial year in 2008 accounted for $0.8 million of an increase in analytic services revenue. Excluding the impact of the acquisition of Kintera, analytic services revenue decreased $1.4 million in 2009 when compared to 2008. The rates charged for our analytic services have remained relatively constant year over year and, as such, the remaining decrease in analytic services revenue2010 is principally the result of the decreased volume of services provided.
Revenue from analytic services increased $4.9 million in 2008 when compared to 2007. The rates charged for our analytic services have remained relatively constant year over year and, as such, the increase in revenue is principally the result of increased volume of services provided.
Cost of analytic services is primarily comprised of human resource costs and data expense incurred to perform analytic services. The increase in cost of analytic services for 2009 when compared to 2008 is primarily attributable to $0.8 million of human resource and other costs attributable to the inclusion of Kintera for a full year in 2009 compared to a partial year in 2008. Excluding the impact of the acquisition of Kintera, cost of analytic services for 2009 decreased by $0.6 million primarily due to a decrease in data expense.
During 2008, cost of analytic services increased when compared to 2007. The increase is attributable to additional human resources costs due to an increase in headcount. Headcount increased when comparing 2008consulting services revenue of $14.4 million, analytic services of $3.8 million and education services of $2.9 million. Revenue from acquired companies represented $0.8 million of consulting services and $1.9 million of analytic services revenue growth during 2011 compared to 2007 to meet the2010. The increase in customer demand for our analytic services.consulting services revenue
The decrease in analytic services margin in 2009 when compared to 2008 is primarily due to additional costs associated with the acquisition of Kintera.
Blackbaud, Inc.
Item 7. Management’s discussion and analysis of financial condition and results of operations—(Continued)
is primarily due to an increase in the demand for consulting, installation and implementation services associated with our Blackbaud CRM offering and our internet based fundraising offerings. This increase in consulting services revenue resulting from an increase in volume was partially offset by an increase in our investment, in the form of non-billable implementation hours, in early adopters of our Blackbaud CRM offering and a reduction in the rates we charge as a result of a higher level of discounts on the consulting services provided during 2011 compared to 2010. The rates we charge for our education and analytic service offerings have remained relatively constant year over year and, as such, the change in revenue is principally the result of an increase in the volume of services provided.
Cost of services is principally comprised of human resource costs, stock-based compensation expense, third-party contractor expenses, classroom rentals, other costs incurred in providing consulting, installation and implementation services and customer training, data expense incurred to perform analytic services, marginan allocation of depreciation, facilities and IT support costs and amortization of intangibles from business combinations.
The increase in 2008cost of services in 2011 when compared to 20072010 is primarily attributable to includingan increase in human resource costs and integratingthird-party contractor costs. The increase in human resource costs and third-party contractor costs is principally attributable to the analyticneed for additional resource capacity to meet the increasing consulting services segmentdemands of our customers and the Target Companies, which hasadditional headcount from acquired companies.
The services gross margin increased in 2011 compared to 2010 primarily as a different cost structureresult of an increase in demand for consulting services associated with our Blackbaud CRM offering and a shift in the mix of consulting engagements to higher margin than the historical Blackbaud-only analytic services segment.projects.
Maintenance
| Years ended December 31, | 2009 versus 2008 | 2008 versus 2007 | ||||||||||||||||||||||||||
| (in millions) | 2009 | 2008 | 2007 | Change | % Change | Change | % Change | |||||||||||||||||||||
Maintenance revenue | $ | 116.5 | $ | 107.3 | $ | 94.6 | $ | 9.2 | 9 | % | $ | 12.7 | 13 | % | ||||||||||||||
Direct controllable cost of maintenance | 15.8 | 15.3 | 13.4 | 0.5 | 3 | % | 1.9 | 14 | % | |||||||||||||||||||
Segment income | $ | 100.7 | $ | 92.0 | $ | 81.2 | $ | 8.7 | 9 | % | $ | 10.8 | 13 | % | ||||||||||||||
Segment margin % | 86 | % | 86 | % | 86 | % | ||||||||||||||||||||||
| Years ended December 31, | ||||||||||||||||||
| (in millions) | 2011 | 2010 | Change | % Change | ||||||||||||||
|
|
| ||||||||||||||||
Maintenance revenue | $ | 130.6 | $ | 124.6 | $ | 6.0 | 5 | % | ||||||||||
Cost of maintenance | 25.2 | 24.1 | 1.1 | 5 | % | |||||||||||||
|
|
|
| |||||||||||||||
Maintenance gross profit | $ | 105.4 | $ | 100.5 | $ | 4.9 | 5 | % | ||||||||||
|
|
|
| |||||||||||||||
Maintenance gross margin | 81 | % | 81 | % | ||||||||||||||
Revenue from maintenance is comprised of annual fees derived from maintenance contracts associated with new software licenses and annual renewals of existing maintenance contracts. These contracts provide customers with updates, enhancements and upgrades to our software products and online, telephone and email support.
During 2009, maintenance revenue increased $9.2 million when compared to 2008. The inclusion of Kintera for a full year in 2009 compared to a partial year in 2008 accounted for $2.8 million of2011, the increase in maintenance revenue. Included in maintenance revenue in 2009 is $0.6 million of revenue attributable to RLC. Excluding the impact of the acquisitions of Kintera and RLC, maintenance revenue increased $5.8 million in 2009 when compared to 2008. The increase is principally comprised of $7.3$11.3 million of maintenance withfrom new customers associated with new license agreements and increases in contracts with existing customers and $4.0$3.8 million from maintenance contract inflationary rate adjustments, offset by $5.5$9.1 million from maintenance contracts that were not renewed.
During 2008, the increase in maintenance revenue includes $2.8 million of revenue attributable to Kintera. Excluding the impact of the acquisition of Kintera, maintenance revenue increased $9.9 million in 2008 when compared to 2007. The remaining increase is principally comprised of $11.0 million of maintenance with new customers associated with new license agreements and increases in contracts with existing customers and $2.8 million from maintenance contract inflationary rate adjustments, offset by $3.9 million of maintenance contracts that were not renewed.
Direct controllable costCost of maintenance is primarily comprised of human resource costs, stock-based compensation expense, third-party contractor expenses, third-party royalty costs, an allocation of depreciation, facilities and data expenses,IT support costs, amortization of intangibles from business combinations and other costs incurred in providing support and services to our customers. The increase in cost of maintenance in 20092011 when compared to 20082010 is the result of an increase in human resources costs primarilyprincipally attributable to headcount associated with Kintera.
During 2008, the increase in cost of maintenance is principally the result of increases in human resources costs. Thean increase in human resource costs includesof $1.5 million partially offset by a $0.2 million of costs attributable to Kintera. Additionally,decrease in third-party royalty costs and $0.2 million decrease in amortization of intangibles from business combinations. Human resource costs increased by $0.4 million, primarily relateddue to our ticketing solution The Patron’s Edge.salary merit increases and an increase in headcount associated with the
The maintenance segment margin remained unchanged during 2009, 2008 and 2007.
Blackbaud, Inc.
Item 7. Management’s discussion and analysis of financial condition and results of operations—(Continued)
Subscriptions
| Years ended December 31, | 2009 versus 2008 | 2008 versus 2007 | ||||||||||||||||||||||||||
| (in millions) | 2009 | 2008 | 2007 | Change | % Change | Change | % Change | |||||||||||||||||||||
Subscriptions revenue | $ | 72.9 | $ | 49.7 | $ | 25.4 | $ | 23.2 | 47 | % | $ | 24.3 | 96 | % | ||||||||||||||
Direct controllable cost of subscriptions | 22.3 | 15.7 | 7.8 | 6.6 | 42 | % | 7.9 | 101 | % | |||||||||||||||||||
Segment income | $ | 50.6 | $ | 34.0 | $ | 17.6 | $ | 16.6 | 49 | % | $ | 16.4 | 93 | % | ||||||||||||||
Segment margin % | 69 | % | 68 | % | 69 | % | ||||||||||||||||||||||
Revenue from subscriptions is principally comprised of revenue from providing access to hosted applications and hosting services, access to certain data services and our online subscription training offerings. In general, we are experiencingcontinued growth in our hosted applications business ascustomer support function commensurate with maintenance revenue growth. Additionally, we continue to experience a result ofshift to higher skilled support resources that carry a higher cost to meet the eTapestry and Kintera acquisitions, which added experience in on-demand solutions and expanded our set of subscription services. Additionally, the growth in revenue in our subscription offerings is the result of the ongoing evolutionneeds of our product offerings from license-based to subscription-based offerings.
Subscriptions revenue increased $23.2 million during 2009 when compared to 2008. The inclusion of Kintera for a full year in 2009 compared to a partial year in 2008 accounted for $11.7 million of the increase in subscriptions revenue. Excluding the impact of the acquisition of Kintera, growth in subscriptions revenue is primarily due to the continued increase in demand for hosted applications, hosting services and other online data services and we are experiencing a shift in our customers’ buying preference away from perpetual license agreements towards subscription-based hosted applications.
Subscriptions revenue increased $24.3 million during 2008 when compared to 2007. During 2008, included in subscription revenue is $11.3 million of revenue attributable to Kintera. The inclusion of eTapestry for a full year in 2008 compared to a partial year in 2007 accounted for $5.1 million of the increase in subscriptions revenue. The remaining $7.9 million increase is attributable to organic growth from increased demand for hosting services and other online data services.
Direct controllable cost of subscriptions is primarily comprised of human resource costs, third-party royalty and data expenses, hosting expenses, and other costs incurred in providing support and services to ourenterprise customers. During 2009, cost of subscriptions increased by $6.6 million when compared to 2008. Additional headcount and increases in data expense, hosting and other costs attributable to Kintera represented $4.0 million of the increase in cost of subscriptions. Excluding the impact of the acquisition of Kintera, cost of subscriptions increased by $2.6 million in 2009 when compared to 2008. The remaining increase is principally due to an increase in data expense, hosting and human resource costs.
The increase in the cost of subscriptions in 2008 when compared to 2007 is principally due to an increase in data expense, hosting and other costs of $5.1 million, of which $2.1 million is attributable to Kintera. Additionally, human resource costs increased $2.8 million, of which $1.5 million is attributable to Kintera and eTapestry.
The subscriptions segment margin remained substantially unchanged during 2009, 2008 and 2007.
Blackbaud, Inc.
Item 7. Management’s discussion and analysis of financial condition and results of operations—(Continued)
Other revenue
| Years ended December 31, | 2009 versus 2008 | 2008 versus 2007 | ||||||||||||||||||||||||||||
| (in millions) | 2009 | 2008 | 2007 | Change | % Change | Change | % Change | |||||||||||||||||||||||
Other revenue | $ | 6.7 | $ | 8.8 | $ | 8.1 | $ | (2.1 | ) | (24 | )% | $ | 0.7 | 9 | % | |||||||||||||||
Direct controllable cost of other revenue | 6.0 | 8.3 | 7.2 | (2.3 | ) | (28 | )% | 1.1 | 15 | % | ||||||||||||||||||||
Segment income | $ | 0.7 | $ | 0.5 | $ | 0.9 | $ | 0.2 | 40 | % | $ | (0.4 | ) | (44 | )% | |||||||||||||||
Segment margin % | 10 | % | 6 | % | 11 | % | ||||||||||||||||||||||||
| Years ended December 31, | ||||||||||||||||||
| (in millions) | 2011 | 2010 | Change | % Change | ||||||||||||||
|
|
| ||||||||||||||||
Other revenue | $ | 8.5 | $ | 6.7 | $ | 1.8 | 27 | % | ||||||||||
Cost of other revenue | 7.0 | 7.1 | (0.1 | ) | (1 | )% | ||||||||||||
|
|
|
| |||||||||||||||
Other gross profit | $ | 1.5 | $ | (0.4 | ) | $ | 1.9 | (475 | )% | |||||||||
|
|
|
| |||||||||||||||
Other gross margin | 18 | % | (6 | )% | ||||||||||||||
Other revenue includes the sale of business forms that are used in conjunction with our software products;products, reimbursement of travel-related expenses, primarily incurred in connection withduring the performance of services at customer locations; fees from user conferences; and sale of hardware in conjunction with The Patron Edge.
Other revenue decreased in 2009 when compared to 2008 primarily due to (i) a decrease in reimbursable travel-related costs from our services businesses as a result of reduced service engagements and (ii) a decrease inlocations, fees from user conferences as a result of fewer participants, both of which are attributable to the challenging economic environment. The increaseand third-party software referral fees. Other revenue increased in other revenue in 20082011 when compared to 2007 is2010 primarily due to attributable increasesan increase in reimbursable travelrevenue from third-party software referral fees and related expenses.in reimbursement of travel-related expenses associated with the growth in services revenue.
Direct controllable costCost of other revenue includes human resource costs, costs of business forms, costs of user conferences, and reimbursable expenses relating to the performance of services at customer locations.
The decrease in the cost of other revenue in 2009 when compared to 2008 is due to a decrease in reimbursable expenses related to providing services at customer locations, and a decrease in the costs of user conferences. The increase in the cost of other revenue in 2008 when compared to 2007 is due to an increase in reimbursable travel expenses related to providing services at customer locations and costs associated with user conferences. Reimbursable expenses related to providing services at customer locations increased in 2008 compared to 2007 by $0.5 million and conference costs increased $0.6 million.
Blackbaud, Inc.
Item 7. Management’s discussion and analysis of financial condition and results of operations—(Continued)
U.S. GAAP gross profit
Segment income does not include an allocation of corporate costs, stock-based compensation expense and amortization expense. The following schedule reconciles total segment income to gross profit as stated on the statement of operations:
| Years ended December 31, | 2009 versus 2008 | 2008 versus 2007 | ||||||||||||||||||||||||||||
| (in millions) | 2009 | 2008 | 2007 | Change | % Change | Change | % Change | |||||||||||||||||||||||
License fees | $ | 22.2 | $ | 32.8 | $ | 34.8 | $ | (10.6 | ) | (32 | )% | $ | (2.0 | ) | (6 | )% | ||||||||||||||
Consulting and education services | 23.5 | 33.3 | 34.4 | (9.8 | ) | (29 | )% | (1.1 | ) | (3 | )% | |||||||||||||||||||
Analytic services | 12.5 | 13.3 | 10.2 | (0.8 | ) | (6 | )% | 3.1 | 30 | % | ||||||||||||||||||||
Maintenance | 100.7 | 92.0 | 81.2 | 8.7 | 9 | % | 10.8 | 13 | % | |||||||||||||||||||||
Subscriptions | 50.6 | 34.0 | 17.6 | 16.6 | 49 | % | 16.4 | 93 | % | |||||||||||||||||||||
Other | 0.7 | 0.5 | 0.9 | 0.2 | 40 | % | (0.4 | ) | (44 | )% | ||||||||||||||||||||
Total segment income | $ | 210.2 | $ | 205.9 | $ | 179.1 | $ | 4.3 | 2 | % | $ | 26.8 | 15 | % | ||||||||||||||||
Less corporate costs not allocated to segment expenses: | ||||||||||||||||||||||||||||||
Stock-based compensation | 2.6 | 2.3 | 1.1 | 0.3 | 13 | % | 1.2 | 109 | % | |||||||||||||||||||||
Amortization of intangible assets acquired in business combinations | 6.3 | 5.3 | 2.9 | 1.0 | 19 | % | 2.4 | 83 | % | |||||||||||||||||||||
Corporate overhead costs | 12.9 | 12.2 | 10.5 | 0.7 | 6 | % | 1.7 | 16 | % | |||||||||||||||||||||
Gross profit as stated in statements of operations | $ | 188.4 | $ | 186.1 | $ | 164.6 | $ | 2.3 | 1 | % | $ | 21.5 | 13 | % | ||||||||||||||||
Gross margin % | 61 | % | 62 | % | 64 | % | ||||||||||||||||||||||||
Stock-based compensation expense and amortization expense are analyzed separately following the operating expenses section.
Corporate overhead costs
Allocated corporate overhead costs are comprised of depreciation, facilities and IT support costs. Corporate overhead costs included in gross profit were $12.9 million, $12.2 million and $10.5 million for 2009, 2008 and 2007, respectively. The increase in corporate overhead costs allocated toamortization of intangibles from business combinations. In total, cost of other revenue in 20092011 when compared to 2008 is primarily attributable2010 decreased by $0.1 million due to thea reduction in user conference expenses offset by an increase in depreciation expense of $0.3 million as a result of property and equipment purchases and $0.4 million ofreimbursable expenses.
Other gross margin increased IT support costs.
The increase in corporate overhead costs in 20082011 when compared to 2007 is primarily the result of2010 due to an increase in depreciationrevenue from third-party software referral fees and a reduction in the cost of $0.7 million as a result of property and equipment purchases. Additionally, facilities expense increased $1.7 million primarily as a result of locations added in connection with the Kintera and eTapestry acquisitions and additional office space leased. IT support costs decreased $0.7 million due to reduced maintenance cost on internally used software.user conferences.
Operating expenses
The operating expenses analyzed below are presented on a non-U.S. GAAP basis as they exclude stock-based compensation expense. We believe that the exclusion of these costs allows us to better understand and manage other operating expenses and cash needs. Stock-based compensation expense is analyzed, in total, in the section following the operating expense analysis.
Blackbaud, Inc.
Item 7. Management’s discussion and analysis of financial condition and results of operations—(Continued)
Sales and marketing
| Years ended December 31, | 2009 versus 2008 | 2008 versus 2007 | |||||||||||||||||||||
| (in millions) | 2009 | 2008 | 2007 | Change | % Change | Change | % Change | ||||||||||||||||
Sales and marketing expense excluding stock-based compensation | $ | 61.2 | $ | 63.6 | $ | 56.2 | $ | (2.4) | (4)% | $ | 7.4 | 13% | |||||||||||
Add: Stock-based compensation expense | 1.6 | 1.6 | 0.8 | — | 0 % | 0.8 | 100% | ||||||||||||||||
Sales and marketing expense | $ | 62.8 | $ | 65.2 | $ | 57.0 | $ | (2.4) | (4)% | $ | 8.2 | 14% | |||||||||||
% of revenue (excluding stock-based compensation) | 20% | 21% | 22% | ||||||||||||||||||||
| Years ended December 31, | ||||||||||||||||||
| (in millions) | 2011 | 2010 | Change | % Change | ||||||||||||||
|
|
| ||||||||||||||||
Sales and marketing expense | $ | 75.4 | $ | 69.5 | $ | 5.9 | 8 | % | ||||||||||
|
|
|
| |||||||||||||||
% of revenue | 20 | % | 21 | % | ||||||||||||||
Sales and marketing expense includes salaries and related human resource costs, stock-based compensation expense, travel-related expenses, sales commissions, advertising and marketing materials, public relations and an allocation of depreciation, facilities and IT support costs.
During 2009,2011, sales and marketing expense decreased $2.4increased by $5.9 million when compared to 2008. The inclusion2010 primarily due to an increase of $3.6 million in human resource costs and other$2.0 million in commission expense. The increase in human resource costs is a result of additional headcount to support the increase in selling and marketing efforts of our growing operations. The increase in commission expense is principally attributable to Kintera for a full year in 2009 compared to a partial year in 2008 accounted for $2.8 million of an increase in sales and marketing expense. Excluding the sales and marketing expense increase attributable to Kintera, sales and marketing expense decreased $5.2 million. The decrease is primarily attributable to a reduction in travel-related expenses, corporate allocated costs and other sales and marketing related costs of $2.1 million. Additionally, commission expense decreased by $2.4 million due to lower commissionable revenue in 2011. Additionally, marketing programs increased by $0.3 million relating to the launch of our new corporate branding and human resource costs decreased by $0.7 million due to a reduction in headcount.
Thean increase in sales and marketing expense in 2008 compared to 2007 is principally due to increases in our sales force and the inclusion of sales and marketing costs of acquired companies. During 2008, human resource costs increased $5.9 million, of which $3.2 million is due to the inclusion of human resources associated with Kintera and eTapestry. Other increases include higher travel costs, allocated costs and other marketing related costs of $1.5 million.our new packaged offerings.
As a percentage of revenue, sales and marketing expense in 2009 decreased when compared to 2008 principally due to the decrease in commission expense resulting from lower commissionable revenue during 2009. As a percentage of revenue, sales and marketing costs in 2008 decreased by one percentage point compared with 2007, principally due to a decrease in commission expense associated with the decline in license fees and our services.
Research and development
| Years ended December 31, | 2009 versus 2008 | 2008 versus 2007 | ||||||||||||||||||||||||
| (in millions) | 2009 | 2008 | 2007 | Change | % Change | Change | % Change | |||||||||||||||||||
Research and development expense excluding stock-based compensation | $ | 42.7 | $ | 36.3 | $ | 27.3 | $ | 6.4 | 18% | $ | 9.0 | 33% | ||||||||||||||
Add: Stock-based compensation expense | 2.9 | 2.4 | 1.2 | 0.5 | 21% | 1.2 | 100% | |||||||||||||||||||
Research and development expense | $ | 45.6 | $ | 38.7 | $ | 28.5 | $ | 6.9 | 18% | $ | 10.2 | 36% | ||||||||||||||
% of revenue (excluding stock-based compensation) | 14 | % | 12 | % | 11 | % | ||||||||||||||||||||
Blackbaud, Inc.
Item 7. Management’s discussion and analysis of financial condition and results of operations—(Continued)
As a percentage of revenue, sales and marketing expense in 2011 when compared to 2010 decreased principally as a result of our ability to leverage our sales support and marketing resources as we standardize and simplify our packaged offerings.
Research and development
| Years ended December 31, | ||||||||||||||||||
| (in millions) | 2011 | 2010 | Change | % Change | ||||||||||||||
|
|
| ||||||||||||||||
Research and development expense | $ | 47.7 | $ | 45.5 | $ | 2.2 | 5 | % | ||||||||||
|
|
|
| |||||||||||||||
% of revenue | 13 | % | 14 | % | ||||||||||||||
Research and development expenses includeexpense includes human resource costs, stock-based compensation expense, third-party contractor expenses, software development tools and other expenses related to developing new products, upgrading and enhancing existing products, and an allocation of depreciation, facilities and IT support costs. During 2011, human resource and third-party costs increased by $3.0 million partially offset by an increase in the amount of software development costs that were capitalized of $0.8 million. Human resource and third-party contractor costs have increased as we continue to invest in our product development efforts. The increase in amount of costs that are capitalized is primarily due to development efforts with our events management solution.
Research and development costs increased in 2009 when compared to 2008 principally due to an increase in headcount associated with increased investment in our products. During 2009, the increase in research and development costs is principally the result of an increase in human resource costs of $5.8 million, $3.2 million of which is attributable to inclusion of Kintera for a full year in 2009 compared to a partial year in 2008. Further increases of $0.6 million are attributable to higher allocated costs, partially offset by decreased travel and recruiting costs.
During 2008 when compared to 2007, the increase in research and development costs is primarily due to a $7.6 million increase in human resource costs resulting from an increase in headcount and increased investment in our products, of which $3.4 million is due to the inclusion of Kintera and eTapestry. Further increases of $1.1 million are attributable to higher allocated costs and $0.3 million higher travel and other costs.
Research and development expense as a percentage of revenue increaseddecreased in 20092011 when compared to 2008 and 2008 when2010 principally due to the increase in the amount of development costs that were capitalized in 2011 as compared to 2007 primarily due to an increased investment in our product initiatives.2010.
General and administrative
| Years ended December 31, | 2009 versus 2008 | 2008 versus 2007 | ||||||||||||||||||||||||
| (in millions) | 2009 | 2008 | 2007 | Change | % Change | Change | % Change | |||||||||||||||||||
General and administrative expense excluding stock-based compensation | $ | 28.2 | $ | 28.3 | $ | 22.4 | $ | (0.1) | (0)% | $ | 5.9 | 26% | ||||||||||||||
Add: Stock-based compensation expense | 5.2 | 5.8 | 3.8 | (0.6) | (10)% | 2.0 | 53% | |||||||||||||||||||
General and administrative expense | $ | 33.4 | $ | 34.1 | $ | 26.2 | $ | (0.7) | (2)% | $ | 7.9 | 30% | ||||||||||||||
% of revenue (excluding stock-based compensation) | 9 | % | 9 | % | 9 | % | ||||||||||||||||||||
| Years ended December 31, | ||||||||||||||||||
| (in millions) | 2011 | 2010 | Change | % Change | ||||||||||||||
|
|
| ||||||||||||||||
General and administrative expense | $ | 36.9 | $ | 32.6 | $ | 4.3 | 13 | % | ||||||||||
|
|
|
|
|
|
|
| |||||||||||
% of revenue | 10 | % | 10 | % | ||||||||||||||
General and administrative expense consists primarily of human resource costs for general corporate functions, including senior management, finance, accounting, legal, human resources, corporate development, stock-based compensation expense, third-party professional fees, insurance, an allocation of depreciation, facilities and IT support costs, acquisition related expense and other administrative expenses.
During 2009, the decrease in2011, general and administrative expense when comparedincreased primarily due to 2008 was primarily the result of closely managing our operating costs during 2009. Included$1.3 million and $1.1 million increases in generalstock-based compensation expense and administrative expense during 2009 is an increase of $1.8 million in human resource costs, respectively, a $0.8 million increase in acquisition-related expenses, $0.5 million in third-party professional consulting fees and $0.3 million of otherin recruiting costs attributableassociated with hiring key executives in 2011. Acquisition-related costs related primarily to the inclusionacquisition of Kintera for a full year in 2009 comparedPIDI, EDH and the pending acquisition of Convio. Stock-based compensation increased due to a partial yearchange in 2008. Excluding these costs attributablethe type of equity awards granted to Kintera, general and administrativecertain executives to be performance-based, for which expense decreased by $2.2 millionis recognized on an accelerated basis.
Non-GAAP income from operations
The operating results analyzed below are presented on a non-GAAP basis in 2009 when compared to 2008 primarily due to decreased travel-related costs, bad debtthat the results exclude the impact of stock-based compensation expense, and professional fees.amortization expense, acquisition-related expenses, impairment of cost
During 2008, the increase in general and administrative expenses when compared to 2007 includes $3.7 million of additional human resource and other costs attributed to the inclusion of Kintera and eTapestry. The remaining increase was primarily driven by an increase in human resource costs of $1.2 million due to an increase in headcount and $1.0 million increase in bad debt expense and allocated costs.
As a percentage of revenue, general and administrative costs remained unchanged during 2009, 2008 and 2007.
Blackbaud, Inc.
Item 7. Management’s discussion and analysis of financial condition and results of operations—(Continued)
method investment and gain on sale of assets. We believe that the exclusion of these costs allows us and investors to better understand our operating expenses and cash needs, particularily when evaluating current performance against prior periods.
| Years ended December 31, | ||||||||||||||||||
| (in millions) | 2011 | 2010 | Change | % Change | ||||||||||||||
GAAP income from operations | $ | 50.9 | $ | 46.0 | $ | 4.9 | 11 | % | ||||||||||
Non-GAAP adjustments: | ||||||||||||||||||
Add: Stock-based compensation expense | 14.9 | 13.1 | 1.8 | 14 | % | |||||||||||||
Add: Amortization of intangibles from business combinations | 7.6 | 7.1 | 0.5 | 7 | % | |||||||||||||
Add: Acquisition-related expenses | 1.8 | 1.0 | 0.8 | 80 | % | |||||||||||||
Add: Impairment of cost method investment | 1.8 | — | 1.8 | 0 | % | |||||||||||||
Less: Gain on sale of assets | (0.5 | ) | — | (0.5 | ) | 0 | % | |||||||||||
|
|
|
| |||||||||||||||
Total Non-GAAP adjustments | 25.6 | 21.2 | 4.4 | 21 | % | |||||||||||||
|
|
|
| |||||||||||||||
Non-GAAP income from operations | $ | 76.5 | $ | 67.2 | $ | 9.3 | 14 | % | ||||||||||
|
|
|
| |||||||||||||||
Non-GAAP operating margin | 21 | % | 21 | % | ||||||||||||||
The increase in non-GAAP income from operations is consistent with the overall increase in revenue of 14% and is principally attributable to the growth in gross profit in our subscriptions and services operations as discussed above, partially offset by investments, in the form of non-billable implementation hours, we made during 2011 in early adopters of our Blackbaud CRM offering.
Comparison of the years ended December 31, 2010 and 2009
Stock-based compensationRevenue
We recognize compensation expense related to stock-based awards granted to employees. We measure stock-based compensation cost at the grant date based on the fair value of the award and recognize it as expense over the requisite service period, which is the vesting period.
Our consolidated statementsThe table below compares revenue from our statement of operations for 2009, 2008,the years ended December 31, 2010 and 2007 include the amounts of stock-based compensation illustrated below:2009.
| Years ended December 31, | 2009 versus 2008 | 2008 versus 2007 | |||||||||||||||||||||
| (in millions) | 2009 | 2008 | 2007 | Change | % Change | Change | % Change | ||||||||||||||||
Included in cost of revenue: | |||||||||||||||||||||||
Cost of services | $ | 1.4 | $ | 1.4 | $ | 0.6 | $ | — | 0% | $ | 0.8 | 133% | |||||||||||
Cost of maintenance | 0.8 | 0.6 | 0.2 | 0.2 | 33% | 0.4 | 200% | ||||||||||||||||
Cost of subscriptions | 0.4 | 0.3 | 0.3 | 0.1 | 33% | — | 0% | ||||||||||||||||
Total included in cost of revenue | 2.6 | 2.3 | 1.1 | 0.3 | 13% | 1.2 | 109% | ||||||||||||||||
Included in operating expenses: | |||||||||||||||||||||||
Sales and marketing | 1.6 | 1.6 | 0.8 | — | 0% | 0.8 | 100% | ||||||||||||||||
Research and development | 2.9 | 2.4 | 1.2 | 0.5 | 21% | 1.2 | 100% | ||||||||||||||||
General and administrative | 5.2 | 5.8 | 3.8 | (0.6) | (10)% | 2.0 | 53% | ||||||||||||||||
Total included in operating expenses | 9.7 | 9.8 | 5.8 | (0.1) | (1)% | 4.0 | 69% | ||||||||||||||||
Total | $ | 12.3 | $ | 12.1 | $ | 6.9 | $ | 0.2 | 2% | $ | 5.2 | 75% | |||||||||||
| Years ended December 31, | ||||||||||||||||||
| (in millions) | 2010 | 2009 | Change | % Change | ||||||||||||||
License fees | $ | 23.7 | $ | 25.7 | $ | (2.0 | ) | (8 | )% | |||||||||
Subscriptions | 83.9 | 73.2 | 10.7 | 15 | % | |||||||||||||
Services | 87.7 | 87.2 | 0.5 | 1 | % | |||||||||||||
Maintenance | 124.6 | 116.4 | 8.2 | 7 | % | |||||||||||||
Other | 6.7 | 7.0 | (0.3 | ) | (4 | )% | ||||||||||||
|
|
|
| |||||||||||||||
Total revenue | $ | 326.6 | $ | 309.5 | $ | 17.1 | 6 | % | ||||||||||
|
|
|
| |||||||||||||||
Stock-based compensationThe total revenue increased $17.1 million, or 6% in 2010 compared to 2009. The increase in revenue is comprisedprimarily attributable to growth in our subscriptions and maintenance revenue. The increase in subscriptions revenue is primarily attributable to an increase in demand for our hosted offerings, hosting services, online fundraising and data management offerings. This increase has been driven, in part, by the ongoing evolution of expenseour product offerings from common stock awards, stock options, restricted stock awards and stock appreciation rights.a license-based to subscription-based business model. The table below summarizes the stock-based compensation by award type for 2009, 2008 and 2007.
| Years ended December 31, | 2009 versus 2008 | 2008 versus 2007 | |||||||||||||||||||||||||
| (in millions) | 2009 | 2008 | 2007 | Change | % Change | Change | % Change | ||||||||||||||||||||
Stock-based compensation from: | |||||||||||||||||||||||||||
Common stock | $ | 0.8 | $ | 1.4 | $ | — | $ | (0.6 | ) | (43 | )% | $ | 1.4 | — | % | ||||||||||||
Stock options | 0.3 | 1.5 | 2.4 | (1.2 | ) | (80 | )% | $ | (0.9 | ) | (38 | )% | |||||||||||||||
Restricted stock awards | 8.8 | 7.2 | 3.8 | 1.6 | 22 | % | $ | 3.4 | 89 | % | |||||||||||||||||
Stock appreciation rights | 2.4 | 2.0 | 0.7 | 0.4 | 20 | % | $ | 1.3 | 186 | % | |||||||||||||||||
Total stock-based compensation | $ | 12.3 | $ | 12.1 | $ | 6.9 | $ | 0.2 | 2 | % | $ | 5.2 | 75 | % | |||||||||||||
During 2009 and 2008, we expensed $0.8 million and $1.4 million, respectively, relatedincrease in maintenance revenue is attributable to compensation and incentive arrangements payable in common stock andnew maintenance contracts associated with business acquisitions completednew license agreements sold over the last twelve months and increases in 2008 and 2007. There were no similar arrangements payable in common stock in 2007. Thecontracts with existing customers. These increases are offset by a decrease in compensation expenselicense fees which is principally attributable to a smaller contribution in 2010 from stock optionsBlackbaud CRM perpetual license arrangements with upfront revenue recognition. Additionally, we continue to experience a shift in 2009 compared to 2008 and 2008 compared to 2007 is the result of using the accelerated method for recognizing stock-based compensation expense associated with stock options, which results in the recognition of more expense in the earlier periods of vesting when compared with the straight-line method. We have not granted stock options since 2005 and all historical awards will be fully vested in 2010.our customers’ buying preference away from perpetual licenses towards hosted solutions.
Stock-based compensation expense from restricted stock awards and stock appreciation rights increased in 2009 compared to 2008 and 2008 compared to 2007 due to the issuance of additional grants and rights in 2009 and 2008, offset by the partial vesting of grants issued in prior years.
Blackbaud, Inc.
Item 7. Management’s discussion and analysis of financial condition and results of operations—(Continued)
The total amount of compensation costs related to non-vested awards not yet recognized was $29.3 million as of December 31, 2009. The compensation cost for unvested awards at December 31, 2009 will be recognized over a weighted average period of 1.9 years.Operating results
AmortizationLicense fees
We allocate amortization expense
| Years ended December 31, | ||||||||||||||||||
| (in millions) | 2010 | 2009 | Change | % Change | ||||||||||||||
License fees revenue | $ | 23.7 | $ | 25.7 | $ | (2.0 | ) | (8 | )% | |||||||||
Cost of license fees | 3.0 | 3.7 | (0.7 | ) | (19 | )% | ||||||||||||
|
|
|
| |||||||||||||||
License fees gross profit | $ | 20.7 | $ | 22.0 | $ | (1.3 | ) | (6 | )% | |||||||||
|
|
|
| |||||||||||||||
License fees gross margin | 87 | % | 86 | % | ||||||||||||||
During 2010, revenue from license fees to existing customers increased $0.8 million and sales to new customers decreased by $2.8 million. The decrease in license fees is largely the result of a smaller contribution in 2010 from Blackbaud CRM sales with upfront revenue recognition when compared with 2009 and the continued shift in our customers’ buying preference away from solutions offered under perpetual license arrangements towards subscription-based hosted applications.
The decrease in cost of revenue based onlicense fees in 2010 compared to 2009 is primarily attributable to lower third-party software royalty costs, which is directly the natureresult of the respective identifiable intangible asset and whetherreduction in sales of perpetual licenses in 2010 when compared with 2009.
The increase in license fee gross margin in 2010 compared to 2009 is the asset is directlyresult of a change in the mix of products sold. During 2010, we sold fewer products with associated with a specific component of revenue. Amortization expense included in our consolidated statements of operations for the years ended December 31, 2009, 2008 and 2007 is illustrated below:third-party software royalty costs.
Subscriptions
| Years ended December 31, | 2009 versus 2008 | 2008 versus 2007 | ||||||||||||||||||||||||
| (in millions) | 2009 | 2008 | 2007 | Change | % Change | Change | % Change | |||||||||||||||||||
Included in cost of revenue: | ||||||||||||||||||||||||||
Cost of license fees | $ | 0.4 | $ | 0.2 | $ | 0.1 | $ | 0.2 | 100 | % | $ | 0.1 | 100 | % | ||||||||||||
Cost of services | 1.3 | 1.4 | 1.2 | (0.1 | ) | (7 | )% | 0.2 | 17 | % | ||||||||||||||||
Cost of maintenance | 1.3 | 0.9 | 0.4 | 0.4 | 44 | % | 0.5 | 125 | % | |||||||||||||||||
Cost of subscriptions | 3.2 | 2.7 | 1.1 | 0.5 | 19 | % | 1.6 | 145 | % | |||||||||||||||||
Cost of other revenue | 0.1 | 0.1 | 0.1 | — | 0 | % | — | — | % | |||||||||||||||||
Total included in cost of revenue | 6.3 | 5.3 | 2.9 | 1.0 | 19 | % | 2.4 | 83 | % | |||||||||||||||||
Included in operating expenses | 0.8 | 0.7 | 0.5 | 0.1 | 14 | % | 0.2 | 40 | % | |||||||||||||||||
Total | $ | 7.1 | $ | 6.0 | $ | 3.4 | $ | 1.1 | 18 | % | $ | 2.6 | 76 | % | ||||||||||||
| Years ended December 31, | ||||||||||||||||||
| (in millions) | 2010 | 2009 | Change | % Change | ||||||||||||||
Subscriptions revenue | $ | 83.9 | $ | 73.2 | $ | 10.7 | 15 | % | ||||||||||
Cost of subscriptions | 31.2 | 28.2 | 3.0 | 11 | % | |||||||||||||
|
|
|
| |||||||||||||||
Subscriptions gross profit | $ | 52.7 | $ | 45.0 | $ | 7.7 | 17 | % | ||||||||||
|
|
|
| |||||||||||||||
Subscriptions gross margin | 63 | % | 61 | % | ||||||||||||||
The increasesincrease in amortization expense for 2009 compared to 2008 and 2008 compared to 2007 are directlysubscriptions revenue during 2010 is principally attributable to the acquisitions of the Target Companies, eTapestryincrease in demand for online fundraising offerings, data management offerings and Kintera. Identifiable intangible assets of $16.9 million and $32.8 million were recorded during 2008 and 2007, respectively, relatedhosting services. We continue to the acquisition of these companies.
Interest expense
Interest expense decreased $0.6 million in 2009 when compared to 2008. The decrease is primarily related to the timing of payments and the duration of borrowings under our credit facility. Additionally, a decreaseexperience growth in our effective interest rate contributedhosted applications business and are increasingly experiencing a shift in our customers’ buying preference away from perpetual licenses towards subscription based-offerings. Additionally, revenue from our hosting services continues to the decrease in interest expense.increase as demand for these services continues to grow from both our existing and new perpetual license customers.
Interest expense increased $0.4 million in 2008 when compared to 2007. The increase is primarily related to the timing and amountin cost of borrowings under our credit facility, offset by a decreasesubscriptions in our effective interest rate. During 2008 and 2007, we utilized borrowings under our credit facility for short-term financial needs such as funding business acquisitions and share repurchases. However, in 2008 we carried outstanding debt for a longer period, as compared to 2007.
Income tax provision
We record income tax expense in our consolidated financial statements based on an estimated annual effective income tax rate. We had an effective tax rate of 37.7%, 35.3%, and 38.5% in 2009, 2008 and 2007, respectively. The effective tax rate in 2008 was lower2010 when compared to 2009 because we generatedis principally due to an increase in human resource costs of $2.1 million as a greater amountresult of federalan increase in headcount. Data expense and state income tax creditshosting costs also increased resulting from an increase in 2008 that servedthe demand for hosting and other online services.
The subscriptions gross margin increased during 2010 due to lowerthe increase in demand of our effective tax rate for 2008. While we generated federalsubscription-based offerings and state income tax creditsour ability to support the growth in 2009, the amounts realized in 2008 were significantly higher.
Blackbaud, Inc.
Item 7. Management’s discussion and analysis of financial condition and results of operations—(Continued)
Services
| Years ended December 31, | ||||||||||||||||||
| (in millions) | 2010 | 2009 | Change | % Change | ||||||||||||||
Services revenue | $ | 87.7 | $ | 87.2 | $ | 0.5 | 1 | % | ||||||||||
Cost of services | 66.8 | 61.6 | 5.2 | 8 | % | |||||||||||||
|
|
|
| |||||||||||||||
Services gross profit | $ | 20.9 | $ | 25.6 | $ | (4.7 | ) | (18 | )% | |||||||||
|
|
|
| |||||||||||||||
Services gross margin | 24 | % | 29 | % | ||||||||||||||
The increase in services revenue during 2010 when compared to 2009 is principally attributable to an increase in consulting services revenue of $2.1 million and analytic services of $0.4 million, partially offset by a decrease in education services revenue of $2.0 million. The increase in consulting services revenue is largely due to an increase in the demand for consulting services associated with our Blackbaud CRM offering and our internet- based fundraising offerings. The increase in consulting services revenue resulting from an increase in volume was partially offset by an increase in our investment, in the form of non-billable implementation hours, in early adopters of our Blackbaud CRM offering and a reduction in the rates we charge as a result of a higher level of discounts on the consulting services provided during 2010 compared to 2009. The rates we charge for our education and analytic service offerings have remained relatively constant year over year and, as such, the change in revenue is principally the result of a change in the volume of services provided.
The increase in cost of services in 2010 is primarily attributable to an increase in human resource costs of $3.8 million, third-party contractor costs of $1.8 million and stock-based compensation expense of $0.3 million, partially offset by a decrease in training-related costs and data expense of $0.8 million. The increase in costs is principally attributable to the need for additional resource capacity to meet the increasing consulting services demands of our customers.
The services gross margin decreased in 2010 compared to 2009 primarily as a result of investments made in the form of non-billable implementation hours for the benefit of early adopters of our Blackbaud CRM offering and additional headcount to meet the increasing consulting services demands of our customers.
Maintenance
| Years ended December 31, | ||||||||||||||||||
| (in millions) | 2010 | 2009 | Change | % Change | ||||||||||||||
Maintenance revenue | $ | 124.6 | $ | 116.4 | $ | 8.2 | 7 | % | ||||||||||
Cost of maintenance | 24.1 | 21.6 | 2.5 | 12 | % | |||||||||||||
|
|
|
| |||||||||||||||
Maintenance gross profit | $ | 100.5 | $ | 94.8 | $ | 5.7 | 6 | % | ||||||||||
|
|
|
| |||||||||||||||
Maintenance gross margin | 81 | % | 81 | % | ||||||||||||||
During 2010, the increase in maintenance revenue is principally comprised of $8.9 million of maintenance from new customers associated with new license agreements and increases in contracts with existing customers and $3.3 million from maintenance contract inflationary rate adjustments, offset by $4.1 million from maintenance contracts that were not renewed.
The increase in cost of maintenance in 2010 when compared to 2009 is principally attributable to an increase in human resource costs of $1.4 million and third-party royalty costs of $1.2 million. Human resource costs increased due to salary merit increases and an increase in headcount associated with the continued growth in our
Blackbaud, Inc.
Item 7. Management’s discussion and analysis of financial condition and results of operations—(Continued)
customer support function commensurate with maintenance revenue growth. The increase in third-party royalty costs is attributable to increases in maintenance contracts with new and existing customers for software products which include third-party software arrangements.
Other revenue
| Years ended December 31, | ||||||||||||||||||
| (in millions) | 2010 | 2009 | Change | % Change | ||||||||||||||
Other revenue | $ | 6.7 | $ | 7.0 | $ | (0.3 | ) | (4 | )% | |||||||||
Cost of other revenue | 7.1 | 6.1 | 1.0 | 16 | % | |||||||||||||
|
|
|
| |||||||||||||||
Other gross profit | $ | (0.4 | ) | $ | 0.9 | $ | (1.3 | ) | (144 | )% | ||||||||
|
|
|
| |||||||||||||||
Other gross margin | (6 | )% | 13 | % | ||||||||||||||
The decrease in other revenue in 2010 when compared to 2009 is principally due to a decrease in reimbursable travel revenue related to providing services at customer locations.
The increase in the cost of other revenue in 2010 when compared to 2009 is principally attributable to an increase in the cost of our principal user conference resulting from a shift in venue that would allow us to host more customers and prospects.
Other gross margin decreased in 2010 when compared to 2009. While we had fewer user conferences in 2010 as compared to 2009, we made greater investments in the 2010 user conferences when compared to 2009, which is driving the decrease in other gross margin.
Operating expenses
Sales and marketing
| Years ended December 31, | ||||||||||||||||||
| (in millions) | 2010 | 2009 | Change | % Change | ||||||||||||||
Sales and marketing expense | $ | 69.5 | $ | 63.5 | $ | 6.0 | 9 | % | ||||||||||
|
|
|
| |||||||||||||||
% of revenue | 21 | % | 21 | % | ||||||||||||||
During 2010, sales and marketing expense increased when compared to 2009 primarily due to an increase of $2.8 million in commission expense. The increase in commission expense is principally attributable to higher commission rates due to under-achievement of plans in 2009, and an increase in commissionable revenue in 2010. Additionally, human resource costs increased by $1.4 million as a result of additional headcount and salary merit increases. The remaining increase is primarily due to an increase of $1.9 million in travel and other marketing expenses as a result of increased investment in selling and marketing programs to support both our new and newly packaged offerings.
Research and development
| Years ended December 31, | ||||||||||||||||||
| (in millions) | 2010 | 2009 | Change | % Change | ||||||||||||||
Research and development expense | $ | 45.5 | $ | 45.5 | $ | — | 0 | % | ||||||||||
|
|
|
| |||||||||||||||
% of revenue | 14 | % | 15 | % | ||||||||||||||
Blackbaud, Inc.
Item 7. Management’s discussion and analysis of financial condition and results of operations—(Continued)
During 2010, human resource and third party costs increased by $0.9 million, all of which was offset by an increase in costs allocated to cost of services commensurate with the development efforts supporting product customizations under revenue generating arrangements. Human resource and third-party contractor costs have increased as we continue to invest in our product development efforts.
The decrease in research and development expense as a percentage of revenue during 2010 compared to the same period in 2009 is principally attributable to an increase in costs allocated to cost of services commensurate with the development efforts supporting product customizations under revenue generating arrangements.
General and administrative
| Years ended December 31, | ||||||||||||||||||
| (in millions) | 2010 | 2009 | Change | % Change | ||||||||||||||
General and administrative expense | $ | 32.6 | $ | 33.4 | $ | (0.8 | ) | (2 | )% | |||||||||
|
|
|
| |||||||||||||||
% of revenue | 10 | % | 11 | % | ||||||||||||||
During 2010, the decrease in general and administrative expense and general and administrative expense as a percentage of revenue was principally due to a decrease in human resource costs of $1.8 million and bad debt expense of $0.3 million partially offset by $1.0 million in acquisition expenses relating to NOZA. The decrease in human resource costs is primarily due to a decrease in headcount resulting from consolidation and centralization efforts in the second half of 2009 and first quarter of 2010 of our accounting function from acquisitions in prior years.
Non-GAAP income from operations
The operating results analyzed below are presented on a non-GAAP basis in that the results exclude the impact of stock-based compensation expense, amortization expense, acquisition-related expenses, impairment of cost method investment and gain on sale of assets. We believe that the exclusion of these costs allows us and investors to better understand our operating expenses and cash needs, particularly when evaluating current performance against prior periods.
| Years ended December 31, | ||||||||||||||||||
| (in millions) | 2010 | 2009 | Change | % Change | ||||||||||||||
GAAP income from operations | $ | 46.0 | $ | 45.2 | $ | 0.8 | 2 | % | ||||||||||
Non-GAAP adjustments: | ||||||||||||||||||
Add: Kintera deferred revenue writedown | — | 3.4 | (3.4 | ) | (100 | )% | ||||||||||||
Add: Stock-based compensation expense | 13.1 | 12.4 | 0.7 | 6 | % | |||||||||||||
Add: Amortization of intangibles from business combinations | 7.1 | 7.2 | (0.1 | ) | (1 | )% | ||||||||||||
Add: Acquisition-related expenses | 1.0 | — | 1.0 | 0 | % | |||||||||||||
|
|
|
| |||||||||||||||
Total Non-GAAP adjustments | 21.2 | 23.0 | (1.8 | ) | (8 | )% | ||||||||||||
|
|
|
| |||||||||||||||
Non-GAAP income from operations | $ | 67.2 | $ | 68.2 | $ | (1.0 | ) | (1 | )% | |||||||||
|
|
|
| |||||||||||||||
Non-GAAP operating margin | 21 | % | 22 | % | ||||||||||||||
The decrease in non-GAAP income from operations and operating margin is principally attributable to the investments, in the form of non-billable implementation hours, we made during 2010 in early adopters of our Blackbaud CRM offering, partially offset by the decrease in general and administrative expenses resulting from consolidation and centralization efforts of our accounting function.
Blackbaud, Inc.
Item 7. Management’s discussion and analysis of financial condition and results of operations—(Continued)
Income tax provision
Following is our effective tax rate for the years ended December 31:
|
| |||||||||||
| 2011 | 2010 | 2009 | ||||||||||
Effective tax rate | 35.2 | % | 36.5 | % | 38.9 | % | ||||||
The effective tax rate in 2011 decreased due to the change in our valuation allowance. In 2011, we reversed $1.0 million of valuation allowance for certain state net operating loss carryforwards in connection with the completion of certain state tax planning strategies. The effective tax rate in 2010 decreased when compared to 2009 because we received a greater amount of federal and state tax credits in 2010.
We record our deferred tax assets and liabilities at an amount based upon a U.S. federal income tax rate of 35.0% and appropriate statutory tax rates of various foreign, state and local jurisdictions in which we operate. If our tax rates change in the future, we maywould adjust our deferred tax assets and liabilities to an amount reflecting those income tax rates. Any change will affect the provision for income taxes during the period that the determination is made.
The following table reconciles the amounts of unrecognized tax benefits for the years ended December 31:
|
| |||||||||||||||||||||||
| (in thousands) | 2009 | 2008 | 2007 | |||||||||||||||||||||
| (in millions) | 2011 | 2010 | 2009 | |||||||||||||||||||||
Balance at beginning of year | $ | 346 | $ | 629 | $ | 642 | $ | 1.4 | $ | 1.2 | $ | 0.3 | ||||||||||||
Increases from prior period positions | 427 | — | 13 | 0.1 | 0.1 | 0.4 | ||||||||||||||||||
Decreases from prior period positions | — | — | (12 | ) | ||||||||||||||||||||
Increases from current period positions | 485 | 23 | 8 | 0.3 | 0.3 | 0.5 | ||||||||||||||||||
Lapse of statute of limitations | (27 | ) | (306 | ) | — | — | (0.2 | ) | — | |||||||||||||||
Decreases relating to settlements with taxing authorities | — | — | (22 | ) | ||||||||||||||||||||
|
| |||||||||||||||||||||||
Balance at end of year | $ | 1,231 | $ | 346 | $ | 629 | $ | 1.8 | $ | 1.4 | $ | 1.2 | ||||||||||||
The amount of unrecognized tax benefits that, if recognized, would favorably affect our effective tax rate was $1.1$1.8 million at December 31, 2009. Tax expense for 2009 increased by $0.9 million for changes in liabilities, penalties and accrued interest related to uncertain tax positions.2011. The total amount of accrued interest and penalties included in the consolidated balance sheet as of December 31, 20092011 and 20082010 was $0.2 million.million and $0.1 million, respectively. The total amount of interest and penalties included in the consolidated statement of operations for 20082011 and 2010 was $0.1 million;million and $0.2 million, respectively, of an increase in income tax expense for 2011 and a decrease in income tax expense for 2010. The total amount of interest and penalties were immaterialincluded in 2009.the consolidated statement of operations for 2009 was immaterial.
We have taken positions in certain taxing jurisdictions related to state nexus issues for which it is reasonably possible that the total amountsamount of unrecognized tax benefits may significantly decrease within the next twelve months. The possible decrease could result from the finalization of state income tax reviews and the expiration of statutes of limitations. The reasonably possible decrease is $0.3 million.not material at December 31, 2011.
We file income tax returns in the U.S. for federal and various state jurisdictions andas well as in foreign jurisdictions including Canada, United Kingdom, Australia and Netherlands. We are generally subject to U.S. federal income tax examination for calendar tax years ending 20052008 through 2008.2010 as well as state and foreign income tax examinations for various years depending on statute of limitations of those jurisdictions.
Liquidity and capital resources
At December 31, 2009,2011, cash and cash equivalents totaled $22.8$52.5 million, compared to $16.4$28.0 million at December 31, 2008.2010. The $6.4$24.5 million increase in cash and cash equivalents during 20092011 is principally the result
Blackbaud, Inc.
Item 7. Management’s discussion and analysis of financial condition and results of operations—(Continued)
of generating $86.8$85.5 million of cash from operations, reduced by $59.0of which we used $23.4 million in debt repayments on our credit facility, $17.7to acquire companies, $21.4 million into pay dividends paid to stockholders and $7.8$18.2 million used to purchase property, equipment and RLC.equipment.
Our principal source of liquidity ishas historically been our operating cash flow, which depends on continued customer renewal of our maintenance, support and subscription agreements and market acceptance of our products and services. Based on current estimates of revenue and expenses, we believe that the currently available sources of fundscash and anticipated cash flows from operations will be adequate for at least the next twelve months to finance our operations, fund anticipated capital expenditures and pay dividends. Dividend payments are not guaranteed and our Board of Directors may decide, in its absolute discretion, at any time and for any reason, not to declare or pay further dividends and/ordividends. Our stock repurchase program authorizes us to purchase up to $50.0 million of our outstanding shares of common stock.
Blackbaud, Inc.
Item 7. Management’s discussionStock. Repurchases of common stock are not guaranteed and analysiscan be limited at the discretion of financial condition and resultsour Board of operations—(Continued)
Directors.
At December 31, 20092011, we had no outstanding borrowings under our former credit facility.facility and were in compliance with the covenants thereunder. We have drawndrew on our credit facility from time to time to help us meet short-term financial needs, such as business acquisitions and purchase of common stock under our repurchase program. Under this five-yearIn February 2012, we amended and restated our credit facility which matures in July 2012, we may elect not more than twice over the term of the agreement to increase the aggregateavailable borrowing capacity to $325.0 million. The amended credit facility matures in February 2017. We expect to incur a substantial amount available of $75.0 million by up to $50.0 million. We exercised onedebt in connection with the proposed acquisition of these options for an additional $15.0 million in June 2008.Convio. We believe our $90.0 millionamended credit facility provides us liquidity to acquire Convio, and also with sufficient flexibility to meet our other anticipated financial needs.
At December 31, 2011, our total cash and cash equivalent balance includes $11.3 million of cash held by operations outside of the U.S. If these funds are needed for our operations in the U.S., we would be required to accrue and pay U.S. taxes to repatriate these funds. Our current plans do not demonstrate a need to repatriate them to fund our U.S. operations.
Operating cash flow
Net cash provided by operating activities of $86.8 million increased $26.5 million when compared to 2008 primarily due to a decrease in income tax payments of $13.6 million principally attributable to fluctuations in the timing of payments. Throughout both years, our cash flows from operations were derived principally from: (i) our earnings from on-going operations prior to non-cash expenses such as depreciation, amortization and stock-based compensation and adjustments to our provision for sales returns and allowances; (ii) the tax benefit associated with our deferred tax asset, which reduces our cash outlay for income tax expense; and (iii) changes in our working capital.
Working capital changes as they impact the statementare comprised of cash flows are composed ofchanges in accounts receivable, prepaid expenses and other current assets, accounts payable, accrued expenses, accrued liabilities and deferred revenue. Net collections of accounts receivable and increases in deferred revenue represent a net increase in cashCash flow provided by operations that was associated with working capital changes of $14.6 million and $9.2increased $15.6 million in 2009 and 2008, respectively.2011 when compared to 2010. The year-over-yearnet increase is principally due to the reduced billings related to slower sales growth when comparing 2009 to 2008. Changes in our balances of accounts payable, prepaid expenses, accrued liabilities and other current assets represent a netto:
An increase in cash associated with working capital changesflow from accounts receivable of $2.4$4.1 million, primarily due to an improvement in 2009, compared toour collection of accounts receivable as a net decreaseresult of $12.9 million in 2008. The primary driver of this change is (i) a reduction in prepaid expenses principally attributable to the receipt of $4.5 million in income tax refunds and (ii) an increase in income taxes payablethe use of auto-pay programs by our customers; and other accrued liabilities principally attributable
A year-over-year increase in cash flow of $14.1 million due to fluctuations in the timing of payments.
Investing cash flow
Net cash used in 2009paid for investing activities was $7.8 million compared to $56.0 million of net cash used in 2008. Theincome taxes; partially offset by
A decrease in cash used in investing activitiesflow of $2.6 million primarily due to the timing of payments of prepaid costs.
The provision for doubtful accounts and sales returns increased $2.9 million during 2011 when compared to 2010. The increase is principally due to a decrease in net cash used for acquisitions. We invested $5.5 million in property and equipment in 2009 compared to $7.7 million in 2008. Vendor payments for $3.7 million of property and equipment purchases received in 2009 had not been made as of December 31, 2009 and, accordingly, have been reflected as non-cash activity in our consolidated statement of cash flow for 2009.
Financing cash flow
Net cash used in financing activities for 2009 was $73.2 million compared to $1.0 million in 2008. Thean increase in cash usedcredits related to consulting services associated with early adopters of Blackbaud CRM and other customer credits provided in financing activities is primarily due to the larger amountordinary course of repayment of borrowings underbusiness that have increased commensurate with our credit facilitygrowth in 2009 compared to 2008. Additionally, in 2008, we borrowed funds, principally to acquire Kintera and repurchase our stock. We did not borrow any funds nor repurchase stock in 2009 and amounts used for acquisition was substantially less in 2009 compared to 2008.
Blackbaud, Inc.
Item 7. Management’s discussion and analysis of financial condition and results of operations—(Continued)
Investing cash flow
Net cash used in 2011 for investing activities was $41.7 million compared to $18.4 million in 2010. This increase is due to the purchase of PIDI and EDH. Additionally, we increased the amount spent on software and computer equipment associated with the infrastructure that supports our subscription-based offerings from $10.8 million in 2010 to $18.2 million in 2011.
Financing cash flow
During 2011, cash used for financing activities was principally attributable to $21.4 million of dividend payments to stockholders. We did not have any borrowings or repayments under our former credit facility and we did not repurchase any treasury shares during 2011. During 2010, cash used for financing activities was principally attributable to $22.6 million of treasury share repurchases and $19.5 million of dividend payments to stockholders.
Commitments and contingencies
As of December 31, 2009,2011, we had $1.3 million of outstanding debt and future minimum lease commitments of $66.6$63.9 million as follows:
| Payments due by period | |||||||||||||||
| (in millions) | Total | Less than 1 year | 1-2 years | 3-5 years | More than 5 years | ||||||||||
Operating leases | $ | 66.4 | $ | 7.0 | $ | 12.3 | $ | 8.8 | $ | 38.3 | |||||
Capital leases | 0.2 | 0.2 | — | — | — | ||||||||||
Debt and interest | 1.3 | 1.3 | — | — | — | ||||||||||
Total | $ | 67.9 | $ | 8.5 | $ | 12.3 | $ | 8.8 | $ | 38.3 | |||||
| Payments due by period | ||||||||||||||||||||
| (in millions) | Total | Less than 1 year | 1-2 years | 3-5 years | More than 5 years | |||||||||||||||
Operating leases | $ | 63.9 | $ | 7.2 | $ | 6.1 | $ | 15.5 | $ | 35.1 | ||||||||||
Our commitments related to operating leases have not been reduced by the future minimum lease commitments under sublease agreements that expire in 2010 and 2011, incentive payments from the state of South Carolina resulting from the relocation of our headquarters,2014 and reimbursement of leasehold improvements totaling $4.7$3.8 million.
Included in the table above is interest expense of $0.1 million. The actual interest expense recognized in our consolidated statements of operations will depend on the amount of debt and length of time the debt is outstanding, which could be different from our assumptions used in the table above.
As of December 31, 2009,2011, we had accrued an estimate of $0.2 million related to contingent consideration in connection with the acquisition of RLC. Please refer to Note 2 in our notes to the consolidated financial statements for further information. We are unable to determine the actual amount, if any, for which this liability will be settled, and accordingly, we have not included this amount in the table above.
As of December 31, 2009, we have accrued $0.9$1.6 million of federal taxes, $0.3$0.2 million of state taxes and $0.2$0.1 million of interest and penalties related to uncertain tax positions taken in current and prior years. Please refer to Note 1011 in our notes to the consolidated financial statements for further information. We are unable to determine the period in which these liabilities will be settled, and accordingly, we have not included these amounts in the table above.
We utilize third-party relationships in conjunction with our products. The contractual arrangements vary in length from one to three years. In certain cases, these arrangements require a minimum annual purchase commitment. The total minimum annual purchase commitments under these arrangements at December 31, 20092011, are approximately $3.4$8.1 million through 2012,2013, which is not included in the table above. We incurred expense under these arrangements of $2.4$6.8 million, $1.6$4.1 million and $0.8$2.5 million for the years ended December 31, 2009, 20082011, 2010 and 2007,2009, respectively.
In February 2010,2012, our Board of Directors approved our annual dividend of $0.44$0.48 per share for 20102012 and declared a first quarter dividend of $0.11$0.12 per share payable on March 15, 20102012, to stockholders of record on February 26, 2010.March 5, 2012. Dividends at the annual rate would aggregate to $19.4$21.1 million, assuming 44.0 million shares of common stock are outstanding, net of treasury stock. Our ability to continue to declare and pay dividends may be restricted by, among other things, the terms of our credit facility, general economic conditions and our ability to generate operating cash flow.
Off-balance sheet arrangements
Blackbaud, Inc.
Item 7. Management’s discussion and analysis of financial condition and results of operations—(Continued)
Off-balance sheet arrangements
We do not believe we currently have any off-balance sheet arrangements, financings or other relationships with unconsolidated entities or other persons.
Foreign currency exchange rates
Approximately 12.8%14% of our total net revenue for the year ended December 31, 20092011, was derived from operations outside the United States. We do not have significant operations in countries in which the economy is considered to be highly inflationary. Our consolidated financial statements are denominated in U.S. dollars and, accordingly, changes in the exchange raterates between foreign currencies and the U.S. dollar will affect the translation of our subsidiaries’ financial results into U.S. dollars for purposes of reporting our consolidated financial results. The accumulated currency translation adjustment, recorded as a separate component of stockholders’ equity, was $0.7a loss of $1.1 million and $1.0$0.8 million at December 31, 20092011 and 2008,2010, respectively.
The vast majority of our contracts are entered into by our U.S., Canadian or U.K. entities. The contracts entered into by the U.S. entityentities are almost always denominated in U.S. dollars, contracts entered into by our Canadian subsidiary are generally denominated in Canadian dollars, and contracts entered into by our U.K., Australian and Netherlands subsidiaries are generally denominated in pounds sterling, Australian dollars and euros,Euros, respectively. Historically, as the U.S. dollar weakened, foreign currency translation resulted in an increase in our revenues and expenses denominated in non-U.S. currencies. During 2009, the foreign currency translation has resulted in a decrease in our reported revenues and expenses denominated in non-U.S. currencies when compared to 2008. Though weWe do not believe our increased exposure to currency exchange rates has had a material impact on our results of operations or financial position and therefore we do not hedge any foreign currency risk; however, we intend to continue to monitor our foreign currency exchange rate exposure and take action as appropriate.
Critical accounting policies and estimates
Our discussion and analysis of financial condition and results of operations are based upon our consolidated financial statements, which have been prepared in accordance with accounting principles generally accepted in the United States of America. The preparation of these financial statements requires us to make estimates and assumptions that affect the reported amounts of assets, liabilities, revenue and expenses and related disclosures of contingent assets and liabilities. On an ongoing basis, we reconsider and evaluate our estimates and assumptions, including those that impact revenue recognition, our allowance for sales returns and doubtful accounts, valuation of long-lived and intangible assets and goodwill, stock-based compensation and provision for income taxes, valuation of deferred tax assets and liabilities and contingencies.
We base our estimates on historical experience and on various other assumptions that we believe to be reasonable under the circumstances, the results of which form the basis for making judgments about the carrying values of assets and liabilities that are not readily apparent from other sources. Actual results could differ from any of our estimates under different assumptions or conditions. We believe the critical accounting policies listed below affect significant judgments and estimates used in the preparation of our consolidated financial statements.
Revenue recognition
Our revenue is primarily generated from the following sources: (1) selling perpetual licenses of our software products; (2) providing professional services including implementation, training, consulting, hosting and other services; (3) providing software maintenance and support services; and (4) charging for the use of our software products in a hosted environment.
Blackbaud, Inc.
Item 7. Management’s discussionenvironment; (3) providing professional services including implementation, training, consulting, analytic, hosting and analysis of financial conditionother services; and results of operations—(Continued)
(4) providing software maintenance and support services.
License fees
We recognize revenue from the sale of perpetual software license rights when all of the following conditions are met:
persuasivePersuasive evidence of an arrangement exists;
theThe product has been delivered;
Blackbaud, Inc.
Item 7. Management’s discussion and analysis of financial condition and results of operations—(Continued)
theThe fee is fixed or determinable; and
collectionCollection of the resulting receivable is probable.
We deem acceptance of an agreement to be evidence of an arrangement. Delivery occurs when the product is shipped or transmitted, and title and risk of loss have transferred to the customers. Our typical license agreement does not include customer acceptance provisions; however, if acceptance provisions are provided, delivery is deemed to occur upon acceptance. We consider the fee to be fixed or determinable unless the fee is subject to refund or adjustment or is not payable within our standard payment terms. Payment terms greater than 90 days are considered to be beyond our customary payment terms. Collection is deemed probable if we expect that the customer will be able to pay amounts under the arrangement as they become due. If we determine that collection is not probable, we defer revenue recognition until collection.
We sell software licenses with maintenance, varying levels of professional services and, in certain instances, with hosting services. We allocate revenue to delivered components, normally the license component of the arrangement, using the residual value method based on objective evidence of the fair value of the undelivered elements, which is specific to us. Fair value for maintenance services associated with software licenses is based upon renewal rates stated in the agreements with customers, which vary according to the level of support service provided under the maintenance program. Fair value of professional services and other products and services is based on sales of these products and services to other customers when sold on a stand-alone basis. When a software license is sold with software customization services, generally the services are to provide customer support for assistance in creating special reports and other enhancements that will assist with efforts to improve operational efficiency and/or to support business process improvements. These services are not essential to the functionality of the software. However, when software customization services are considered essential to the functionality of the software, we recognize revenue for both the software license and the services on a percent-complete basis.
Subscriptions
We provide hosting services to customers who have purchased perpetual rights to certain of our software products (hosting services). Revenue from hosting services, as well as data enrichment services, data management services and online training programs is recognized ratably over the service period of the contract, which generally ranges from one to three years, upon deployment and use of the service. Any related set-up fees are recognized ratably over the estimated period that the customer benefits from the related fees.
We make certain of our software products available for use in hosted application arrangements without licensing perpetual rights to the software (hosted applications). Revenue from hosted applications is recognized over the subscription service period, which generally ranges from one to three years, upon deployment and use of the hosted application. Any related upfront activation, set-up or implementation fees are recognized ratably over the estimated period that the customer benefits from the related fees. Direct and incremental costs relating to activation, set-up and implementation for hosted applications are capitalized until the hosted application is deployed and in use, and then expensed over the estimated period that the customer benefits from the related fees.
For arrangements that have multiple elements and do not include software licenses, we allocate arrangement consideration at the inception of the arrangement to those elements that qualify as separate units of accounting. The arrangement consideration is allocated to the separate units of accounting based on relative selling price
Blackbaud, Inc.
Item 7. Management’s discussion and analysis of financial condition and results of operations—(Continued)
method in accordance with the selling price hierarchy, which includes: (i) vendor specific objective evidence (VSOE) if available; (ii) third party evidence (TPE) if VSOE is not available; and (iii) best estimate of selling price if neither VSOE nor TPE is available. In general, we use VSOE to allocate the selling price to subscription and service deliverables.
Revenue from transaction processing fees is recognized when received. Credit card fees directly associated with processing donations for customers are included in subscriptions revenue, net of related transaction costs.
Services
We generally bill consulting, installation and implementation services based on hourly rates plus reimbursable travel-related expenses. Revenue is recognized for these services over the period the services are performed. For service engagements of less than $10,000, we frequently contract for and bill based on a fixed fee plus reimbursable travel-related expenses. We recognize this revenue upon completion of the work performed.
We recognize analytic services revenue from donor prospect research engagements, the sale of lists of potential donors, benchmarking studies and data modeling service engagements upon delivery.
We sell training at a fixed rate for each specific class, at a per attendee price or at a packaged price for several attendees, and revenue is recognized only upon the customer attending and completing training. Additionally, we sell a fixed-rate program,programs, which permitspermit customers to attend unlimited training over a specified contract period, typically one year, subject to certain restrictions, and revenue is recognized ratably over this contract period.
Blackbaud, Inc.
Item 7. Management’s discussion and analysis of financial condition and results of operations—(Continued)
Maintenance
We recognize revenue from maintenance services ratably over the contract term, which is typically one year. Maintenance contracts are at rates that vary according to the level of the maintenance program and are generally renewable annually. Maintenance contracts also include the right to unspecified product upgrades on an if-and-when available basis. Certain support services are sold in prepaid units of time and recognized as revenue upon their usage.
Subscriptions
We provide hosting services to customers who have purchased perpetual rights to certain of our software products (hosting services). Revenue from hosting services, as well as data enrichment services, data management services and online training programs is recognized ratably over the service period of the contract. Any related set-up fees are also recognized ratably over the service period of the contract.
We are increasingly making certain of our software products available for use in hosted application arrangements without licensing perpetual rights to the software (hosted applications). Revenue from hosted applications is recognized over the subscription agreement, which generally ranges from one to three years. For contractual arrangements covering the use of hosted applications the stand alone value of the delivered items or the fair value of undelivered items in the arrangement have not been established. Such items include upfront activation, implementation and hosting of the solution. For these arrangements we treat the transaction as a single element and the revenue is deferred until the hosted application is deployed and in use, at which time revenue is recognized over the remaining term of the arrangement. Direct and incremental costs relating to activation and implementation are capitalized until the hosted application is deployed and in use, and then expensed over the remaining term of the arrangement.
Revenue from transaction processing fees is recognized when received. Credit card fees directly associated with processing donations for customers are included in subscription revenue, net of related transaction costs.
Deferred revenue
To the extent that the our customers are billed or pay for the above described services in advance of delivery, we record such amounts are recorded in deferred revenue.
Sales returns and allowance for doubtful accounts
We provide customers a 30-day right of return and under certain circumstances we provide service related credits to our customers. We maintain a reserve for returns. We estimatereturns and credits which is estimated based on several factors including historical experience, known credits yet to be issued and the nature of service level commitments. A considerable amount of this reserve based on historical experience.judgment is required in assessing these factors. Provisions for sales returns are charged against the related revenue items.
We maintain an allowance for doubtful accounts at an amount we estimate to be sufficient to provide adequate protection against losses resulting from extending credit to our customers. In judging the adequacy of the allowance for doubtful accounts, we consider multiple factors including historical bad debt experience, the general economic environment, the need for specific customer reserves and the aging of our receivables. Any necessary provision is reflected in general and administrative expense. A considerable amount of judgment is required in assessing these factors and if any receivables were to deteriorate, an additional provision for doubtful accounts could be required.
Blackbaud, Inc.
Item 7. Management’s discussion and analysis of financial condition and results of operations—(Continued)
Valuation of long-lived and intangible assets and goodwill
We review identifiable intangible and other long-lived assets for impairment when events change or circumstances indicate the carrying amount may not be recoverable. Events or changes in circumstances that indicate the carrying amount may not be recoverable include, but are not limited to, a significant decrease in the market value of the business or asset acquired, a significant adverse change in the extent or manner in which the business or asset acquired is used or significant adverse change in the business climate. If such events or changes in circumstances occur, we use the undiscounted cash flow method to determine whether the asset is impaired. Cash flows would include the estimated terminal value of the asset and exclude any interest charges. To the extent that the carrying value of the asset exceeds the undiscounted cash flows over the estimated remaining life of the asset, we measure the impairment using discounted cash flows. The discount rate utilized would be based on our best estimate of our risks and required investment returns at the time the impairment assessment is made.
Goodwill is assigned to our five reporting units, which are defined as the License Fees, Consultingour four operating segments (see Note 15 to our consolidated financial statements), and Education Services, Analytic Services, Maintenance and Subscriptions operating segments.Blackbaud Payment Processing Services. We test goodwill for impairment annually, or more frequently if events or changes in circumstances indicate that the asset might be impaired. The impairment test comparesWe first assess qualitative factors to determine whether it is more likely than not that the fair value of a reporting unit is less than its carrying amount. To the extent the qualitative factors indicate that the fair value is more likely than not less than the carrying amount, we then compare the fair value of the reporting unit with its carrying amount. If the carrying amount exceeds its fair value, impairment is indicated. If an impairment is indicated, the impairment is measured as the excess of the recorded goodwill over its fair value, which could materially adversely impact our consolidated financial position and results of operations. Significant judgment is required in the assessment of qualitative factors.
We estimate fair value for each reporting unit based on projected future cash flows discounted using our weighted average cost of capital. A number of significant assumptions and estimates are involved in estimating the fair value of each reporting unit, including revenue growth rates, operating margins, capital spending, discount rate, and working capital changes. Additionally, we make certain judgments and assumptions in allocating assets and liabilities to determine the carrying values for each of our reporting units. We believe the assumptions we use in estimating fair value of our reporting units are reasonable, but are also unpredictable and inherently uncertain. Even if our estimated fair value of the reporting units significantly declined, no impairment would be indicated. Actual future results may differ from those estimates. The 2011 annual impairment test of our goodwill indicated there was no impairment.
Stock-based compensation
Stock-basedWe measure stock-based compensation cost is measured at the grant date based on the fair value of the award and is recognized as expense over the requisite service period, which is the vesting period. We determine the fair value of the stock options, and stock appreciation rights and certain performance-based restricted stock units using an option pricing model,models, which requires us to use significant judgment to make estimates regarding the life of the award, volatility of our stock price, the risk-free interest rate and the dividend yield of our stock over the life of the award. Changes to these estimates would result in different fair values of awards.
We estimate the number of awards that will be forfeited and recognize expense only for those awards that ultimately vest. Significant judgment is required in determining the adjustment to compensation expense for estimated forfeitures. Compensation expense in a period could be impacted, favorably or unfavorably, by differences between forfeiture estimates and actual forfeitures.
Blackbaud, Inc.
Item 7. Management’s discussion and analysis of financial condition and results of operations—(Continued)
Provision for income tax and valuation of deferred tax assets
We account for income taxes using the asset and liability approach to recognize deferred tax assets and liabilities for the expected future tax consequences of events that have been included in the consolidated financial statements or income tax returns. Using the enacted tax rates in effect for the year in which we expect the
Blackbaud, Inc.
Item 7. Management’s discussion and analysis of financial condition and results of operations—(Continued)
differences to reverse, we determine deferred tax assets and liabilities based on the differences between the financial reporting and the tax basis of an asset or liability. We record a valuation allowance when it is more likely than not that the deferred tax asset will not be realized.
Significant judgment is required in determining income taxes in each of the jurisdictions in which we operate. This process involves estimating our actual current tax exposure together with assessing temporary differences resulting from differing treatment of items, such as deferred revenue, for tax and accounting purposes. These differences result in a net deferred tax asset or liability that is included in our consolidated balance sheets. The final outcome of these matters for tax reporting purposes might be different than that which is reflected in our historical income tax provisions, benefits and accruals. Any difference could have a material effect on our income tax provision and net income in the period in which such a determination is made.
Prior to October 13, 1999, we were organized as an S corporation under the Internal Revenue Code and, therefore, were not subject to federal income taxes. In addition, we were not subject to income tax in many of the states in which we operated as a result of our S corporation status. We historically made distributions to our stockholders to cover the stockholders’ anticipated tax liability. In connection with our 1999 recapitalization, we converted our U.S. taxable status from an S corporation to a C corporation. Accordingly, since October 14, 1999 we have been subject to federal and state income taxes. Upon the conversion and in connection with the recapitalization, we recorded a one-time benefit of $107.0 million to establish a deferred tax asset.
We assess the likelihood that our deferred tax assets will be recovered from future taxable income. To the extent we believe that recovery is not likely, we establish a valuation allowance. To the extent we establish a valuation allowance, we include an expense within the income tax provision in the consolidated statement of operations. Our valuation allowance of $8.0$10.1 million at December 31, 20092011 is primarily associated with deferred tax assets for certain state income tax credits, and net operating loss carryforwards and capital loss carryforwards that we have determined are not more-likely-than-not to be realized. The ability to utilize our net deferred tax asset is dependent on our ability to generate future taxable income. Based on current estimates of revenue and expenses, we expect future taxable income will be sufficient to realize the remaining deferred tax assets. Even if actual results are significantly below our current estimates, the recovery still remains likely and, except for the state tax credits and net operating loss carryforwards discussed above, no valuation allowance would be necessary.
Significant judgment is required in determining the provision for income taxes. To the extent that final results differ from estimated amounts that were initially recorded, such differences will impact the income tax provision in the period in which such determination is made and could have an impact on the deferred tax asset. Our deferred tax assets and liabilities are recorded at an amount based upon a U.S. federal income tax rate of 35.0% and appropriate statutory rates of various foreign, state and local jurisdictions in which we operate. If our tax rates change, we will adjust our deferred tax assets and liabilities to an amount reflecting those income tax rates. If such change is determined to be appropriate, it will affect the provision for income taxes during the period that the determination is made.
We recognize the tax impact from an uncertain tax position only if it is more-likely-than-not that the tax position will be sustained on examination by taxing authorities, based on the technical merits of the position. Such tax impact recognized in the consolidated financial statements from such a position is measured based on the largest benefit that has a greater than 50% likelihood of being realized upon ultimate resolution. Significant judgment is required in the identification and measurement of uncertain tax positions.
Blackbaud, Inc.
Item 7. Management’s discussion and analysis of financial condition and results of operations—(Continued)
Contingencies
We are subject to the possibility of various loss contingencies in the normal course of business. We record an accrual for a contingency when it is both probable that a liability has been incurred and the amount of the loss can be reasonably estimated. Often these issues are subject to substantial uncertainties and, therefore, the probability of loss and the estimation of damages are difficult to ascertain. These assessments can involve a series of complex judgments about future events and can rely heavily on estimates and assumptions that have been deemed reasonable by us. Although we believe we have substantial defenses in these matters, we could incur judgments or enter into settlements of claims that could have a material adverse effect on our consolidated financial position, results of operations or cash flows in any particular period.
Recently issuedadopted accounting pronouncements
In October 2009, the FASB releasedEffective January 1, 2011, we adopted Accounting Standards Update (ASU) 2009-13, which amends the existing criteria for separating consideration in multiple-deliverable arrangements. ArrangementArrangements that include perpetual software licenses are excluded from the scope of this ASU. ASU 2009-13 establishes a hierarchy for determining the selling price of a deliverable and requires the use of best estimate of the selling price when VSOE or third party evidence (TPE)TPE of the selling price cannot be determined. As a result of the requirement to use the best estimate of the selling price when VSOE or TPE of the selling price cannot be determined, the residual method will no longer be permitted. ASU 2009-13 is applicable prospectively for revenue arrangements entered into or materially modified after the adoption datedate. The adoption of ASU 2009-13 did not have a material impact on our consolidated financial statements.
Effective December 31, 2011, we adopted ASU 2011-08, which simplifies how entities test goodwill for impairment. ASU 2011-08 permits an entity to first assess qualitative factors to determine whether it is more likely than not that the fair value of a reporting unit is less than its carrying amount as a basis for determining whether it is necessary to perform the two-step goodwill impairment test. The adoption of ASU 2011-08 did not have a material impact on our consolidated financial statements.
Recently issued accounting pronouncements
In June 2011, the FASB issued ASU 2011-05, which (1) eliminates the option to present components of other comprehensive income, or retrospectively for all periods presented.OCI, as part of the statement of changes in stockholders’ equity, (2) requires the presentation of each component of net income and each component of OCI either in a single continuous statement or in two separate but consecutive statements and (3) also requires presentation of reclassification adjustments on the face of the financial statements. We are required to adopt ASU 2009-132011-05 on January 1, 2011. Early2012. We do not believe the adoption is permitted. We are currently evaluating the impact of ASU 2009-132011-05 will have a material effect on our consolidated financial statements.
Cautionary statement
We operate in a highly competitive environment that involves a number of risks, some of which are beyond our control. The following statement highlights some of these risks.
Statements contained in this Form 10-K that are not historical facts, are or might constitute forward-looking statements under the safe harbor provisions of the Private Securities Litigation Reform Act of 1995. Although we believe the expectations reflected in such forward-looking statements are based on reasonable assumptions, we can give no assurance that our expectations will be attained. Forward-looking statements involve known and unknown risks that could cause actual results to differ materially from expected results. Factors that could cause
Blackbaud, Inc.
Item 7. Management’s discussion and analysis of financial condition and results of operations—(Continued)
actual results to differ materially from our expectations expressed in the report include: risks related to the proposed Convio acquisition; general economic risk; uncertainty regarding increased business and renewals from existing customers; continued success in sales growth; lengthy sales and implementation cycles, particularly in larger organizations; risk associated with successful implementation of multiple integrated software products; technological changes that make our products and services less competitive; the ability to attract and retain key personnel; risks related to our dividend policy and stock repurchase program, including potential limitations on our ability to grow and the possibility that we might discontinue payment of dividends; risks relating to increased borrowing and restrictions imposed by the credit facility; management of integration of recently acquired companies and other risks associated with acquisitions; risks associated with management of growth; and the other risk factors set forth from time to time in our SEC filings.
Item 7A. QUANTITATIVE AND QUALITATIVE DISCLOSURES ABOUT MARKET RISK
Due to the nature of our short-term investments and the lack of material debt, we have concluded at December 31, 20092011, that we currently dodid not face material market risk exposure. Therefore, no quantitative tabular disclosures are required. For a discussion of our exposure to foreign currency exchange rate fluctuations, see the “Foreign currency exchange rates” section of Management’s discussion and analysis of financial condition and results of operations in this report.
Item 8. FINANCIAL STATEMENTS AND SUPPLEMENTARY DATA
The information required by this Item is set forth in the consolidated financial statements and notes thereto beginning at page F-1 of this report.
Item 9. CHANGES IN AND DISAGREEMENTS WITH ACCOUNTANTS ON ACCOUNTING AND FINANCIAL DISCLOSURE
None.
Item 9A. CONTROLS AND PROCEDURES
Evaluation of disclosure controls and procedures
Disclosure controls and procedures (as defined in Exchange Act Rule 13a-15(e) and 15d-15(e)) are designed only to provide reasonable assurance that they will meet their objectives. As of the end of the period covered by this report, we carried out an evaluation, under the supervision and with the participation of our management, including our Chief Executive Officer and Chief Financial Officer, of the effectiveness of our disclosure controls and procedures pursuant to Exchange Act Rule 13a-15. Based upon that evaluation, our Chief Executive Officer and Chief Financial Officer have concluded that our disclosure controls and procedures are effective to provide the reasonable assurance discussed above.
Changes in internal control over financial reporting
No change in internal control over financial reporting occurred during the most recent fiscal quarter with respect to our operations, which has materially affected, or is reasonably likely to materially affect, internal control over financial reporting.
Management’s report on internal control over financial reporting
Our management is responsible for establishing and maintaining adequate internal control over financial reporting (as defined in Rules 13a-15(f) and 15d-15(f) under the Exchange Act). Internal control over financial reporting is a process designed to provide reasonable assurance regarding the reliability of financial reporting and the preparation of financial statements for external purposes in accordance with U.S. GAAP. Our internal control over financial reporting includes those policies and procedures that: (i) pertain to the maintenance of records that, in reasonable detail, accurately and fairly reflect the transactions and dispositions of our assets; (ii) provide reasonable assurance that transactions are recorded as necessary to permit preparation of financial statements in accordance with U.S. GAAP, and that our receipts and expenditures are being made only in accordance with authorizations of our management and directors; and (iii) provide reasonable assurance regarding prevention or timely detection of unauthorized acquisition, use, or disposition of our assets that could have a material effect on the financial statements.
Our management conducted an evaluation of the effectiveness of our internal control over financial reporting as of December 31, 2009,2011, based on the framework inInternal Control—Control — Integrated Frameworkissued by the Committee of Sponsoring Organizations of the Treadway Commission. Based on this evaluation, management concluded that our internal control over financial reporting was effective as of December 31, 2009.2011.
The effectiveness of our internal control over financial reporting as of December 31, 20092011, has been audited by our independent registered public accounting firm, as stated in their attestation report, which is included herein.
None.
PART III
Item 10. DIRECTORS, EXECUTIVE OFFICERS AND CORPORATE GOVERNANCE
The information required by Item 10 with respect to Directors and Executive Officers is incorporated by reference from the information under the captions “Election of Directors,” “Information Regarding Matters of the Board and Committees,” “Section 16(a) Beneficial Ownership Reporting Compliance,” and “Code of Business Conduct and Ethics and Code of Ethics,” contained in Blackbaud’s Proxy Statement for the 20102012 Annual Meeting of Stockholders expected to be held on June 23, 2010,20, 2012, except for the identification of executive officers of the Registrant which is set forth in Part I of this report.
Item 11. EXECUTIVE COMPENSATION
The information required by Item 11 is incorporated by reference from the information under the caption “Executive Compensation and Other Matters,” “Compensation Discussion and Analysis” and “Summary Compensation Table” contained in Blackbaud’s Proxy Statement for the 20102012 Annual Meeting of Stockholders expected to be held on June 23, 2010.20, 2012.
Item 12. SECURITY OWNERSHIP OF CERTAIN BENEFICIAL OWNERS AND MANAGEMENT AND RELATED STOCKHOLDER MATTERS
The information required by Item 12 is incorporated by reference from information under the captions “Security Ownership of Certain Beneficial Owners and Management” and “Equity Compensation Plan Information” contained in Blackbaud’s Proxy Statement for the 20102012 Annual Meeting of Stockholders expected to be held on June 23, 2010.20, 2012.
Item 13. CERTAIN RELATIONSHIPS, RELATED TRANSACTIONS AND DIRECTOR INDEPENDENCE
The information required by Item 13 is incorporated by reference from the information under the caption “Transactions with Related Persons,” and “Independence of Directors” contained in Blackbaud’s Proxy Statement for the 20102012 Annual Meeting of Stockholders expected to be held on June 23, 2010.20, 2012.
Item 14. PRINCIPAL ACCOUNTANT FEES AND SERVICES
The information required by Item 14 is incorporated by reference from the information under the caption “Audit Committee Report,” contained in Blackbaud’s Proxy Statement for the 20102012 Annual Meeting of Stockholders expected to be held on June 23, 2010.20, 2012.
PART IV
Item 15. EXHIBITS AND FINANCIAL STATEMENT SCHEDULES
(a)Financial statements
The following statements are filed as part of this report:
Page | ||||
| F-2 | ||||
Consolidated balance sheets as of December 31, | F-3 | |||
| F-4 | ||||
| F-5 | ||||
| F-6 | ||||
| F-7 | ||||
Schedules not listed above have been omitted because the information required to be set forth therein is not applicable or is shown in the financial statements thereto.
(b)Exhibits
| Filed In | ||||||||||
| Exhibit number | Description of Document | Registrant’s Form | Dated | Exhibit Number | Filed Herewith | |||||
2.1 | Agreement and Plan of Merger and Reincorporation dated April 6, 2004 | S-1 | 04/06/04 | 2.1 | ||||||
2.2 | Stock Purchase Agreement among Target Software, Inc., Target Analysis Group, Inc., all of the Stockholders of Target Software Inc. and Target Analysis Group, Inc. and Blackbaud, Inc. | 8-K | 01/18/07 | 2.2 | ||||||
3.1 | Certificate of Incorporation of Blackbaud, Inc. | S-1 | 04/06/04 | 3.1 | ||||||
3.3 | Amended and Restated By-laws of Blackbaud, Inc. | 8-K | 12/23/08 | 3.3 | ||||||
10.5 | Trademark License and Promotional Agreement dated as of October 13, 1999 between Blackbaud, Inc. and Charleston Battery, Inc. | S-1 | 02/20/04 | 10.5 | ||||||
10.6 | Blackbaud, Inc. 1999 Stock Option Plan, as amended | S-1 | 04/06/04 | 10.6 | ||||||
10.8 | Blackbaud, Inc. 2001 Stock Option Plan, as amended | S-1 | 04/06/04 | 10.8 | ||||||
10.20 | Blackbaud, Inc. 2004 Stock Plan, as amended, together with Form of Notice of Stock Option Grant and Stock Option Agreement | 8-K | 06/20/06 | 10.20 | ||||||
10.26 | Form of Notice of Restricted Stock Grant and Restricted Stock Agreement under the Blackbaud, Inc. 2004 Stock Plan | 10-K | 02/28/07 | 10.26 | ||||||
10.27 | Form of Notice of Stock Appreciation Rights Grant and Stock Appreciation Rights Agreement under the Blackbaud, Inc. 2004 Stock Plan | 10-K | 02/28/07 | 10.27 | ||||||
| Filed In | ||||||||||||||||||
| Exhibit Number | Description of Document | Registrant’s Form | Dated | Exhibit Number | Filed Herewith | |||||||||||||
| 2.1 | Agreement and Plan of Merger and Reincorporation dated April 6, 2004 | S-1/A | 04/06/04 | 2.1 | ||||||||||||||
| 2.2 | Stock Purchase Agreement dated January 16, 2007 by and among Target Software, Inc., Target Analysis Group, Inc., all of the stockholders of Target Software, Inc. and Target Analysis Group, Inc., Charles Longfield, as stockholder representative, and Blackbaud, Inc. | 8-K | 01/18/07 | 2.2 | ||||||||||||||
| 2.3 | Agreement and Plan of Merger dated as of May 29, 2008 by and among Blackbaud, Inc., Eucalyptus Acquisition Corporation and Kintera, Inc. | 8-K | 05/30/08 | 2.3 | ||||||||||||||
| 2.4 | Share Purchase Agreement dated as of April 29, 2009 between RLC Group B.V., as the Seller, and Blackbaud, Inc., as the Purchaser | 10-Q | 08/07/09 | 10.42 | * | |||||||||||||
| 2.5 | Stock Purchase Agreement dated as of February 1, 2011 by and among Public Interest Data, Inc., all for the stockholders of Public Interest Data, Inc., Stephen W. Zautke, as stockholder representative and Blackbaud, Inc. | 10-Q | 05/10/11 | 2.3 | * | |||||||||||||
| 2.6 | Agreement and Plan of Merger dated as of January 16, 2012 by and among Blackbaud, Inc., Caribou Acquisition Corporation and Convio, Inc. | 8-K | 01/17/12 | 2.4 | ||||||||||||||
| 2.7 | Stock Purchase Agreement dated as of October 6, 2011 by and among Everyday Hero Pty. Ltd., all of the stockholders of Everyday Hero Pty. Ltd., Nathan Betteridge as stockholder representative and Blackbaud Pacific Pty. Ltd. | 10-K | 02/29/12 | 2.7 | X | |||||||||||||
| 3.4 | Amended and Restated Certificate of Incorporation of Blackbaud, Inc. | DEF 14A | 04/30/09 | |||||||||||||||
| Filed In | ||||||||||
| Exhibit number | Description of Document | Registrant’s Form | Dated | Exhibit Number | Filed Herewith | |||||
| 10.28 | Amended and Restated Credit Agreement dated as of July 25, 2007 by and among Blackbaud, as Borrower, the Lenders, and Wachovia Bank, National Association, as Administrative Agent, Swingline Lender and Issuing Lender, and Wachovia Capital Markets, LLC as Sole Lead Arranger and Sole Book Manager. | 8-K | 07/31/07 | 10.28 | ||||||
| 10.29 | Amended and Restated Guaranty Agreement dated as of July 25, 2007 by and among certain subsidiaries of Blackbaud, as Guarantors, in favor of Wachovia Bank, National Association, as Administrative Agent. | 8-K | 07/31/07 | 10.29 | ||||||
| 10.30 | Pledge Agreement dated as of July 25, 2007 by and among Blackbaud, its subsidiaries in favor of Wachovia Bank, National Association, as Administrative Agent for the ratable benefit of itself and the Lenders. | 8-K | 07/31/07 | 10.30 | ||||||
| 10.31 | Form of Tender and Support Agreement by and between Blackbaud, Inc. and certain stockholders of Kintera, Inc. | 8-K | 05/30/08 | 10.31 | ||||||
| 10.32 | First Amendment to Credit Agreement and Lender Addition and Acknowledgement Agreement dated as of June 23, 2008 | 8-K | 06/26/08 | 10.32 | ||||||
| 10.33 | Blackbaud, Inc. 2008 Equity Incentive Plan | DEF 14A | 04/29/08 | |||||||
| 10.34 | Form of Notice of Grant and Stock Option Agreement under Blackbaud, Inc. 2008 Equity Incentive Plan | S-8 | 08/04/08 | 10.34 | ||||||
| 10.35 | Form of Notice of Grant and Restricted Stock Agreement under Blackbaud, Inc. 2008 Equity Incentive Plan | S-8 | 08/04/08 | 10.35 | ||||||
| 10.36 | Form of Notice of Grant and Stock Appreciation Rights Agreement under Blackbaud, Inc. 2008 Equity Incentive Plan | S-8 | 08/04/08 | 10.36 | ||||||
| 10.37 | Kintera, Inc. 2000 Stock Option Plan, as amended, and form of Stock Option Agreement thereunder | 10-K/A* | 03/26/08 | 10.2 | ||||||
| 10.38 | Kintera, Inc. Amended and Restated 2003 Equity Incentive Plan, as amended, and form of Stock Option Agreement thereunder | 10-K/A* | 03/26/08 | 10.3 | ||||||
| 10.39 | Form of Retention Agreement | 10-Q | 11/05/08 | 10.37 | ||||||
| 10.40 | Triple Net Lease Agreement dated as of October 1, 2008 between Blackbaud, Inc. and Duck Pond Creek-SPE, LLC | 8-K | 12/11/08 | 10.37 | ||||||
| Filed In | ||||||||||||||||
| Exhibit Number | Description of Document | Registrant’s Form | Dated | Exhibit Number | Filed Herewith | |||||||||||
| 3.5 | Amended and Restated Bylaws of Blackbaud, Inc. | 8-K | 03/22/11 | 3.4 | ||||||||||||
| 10.5 | Trademark License and Promotional Agreement dated as of October 13, 1999 between Blackbaud, Inc. and Charleston Battery, Inc. | S-1 | 02/20/04 | 10.5 | ||||||||||||
| 10.6 | Blackbaud, Inc. 1999 Stock Option Plan, as amended | S-1/A | 04/06/04 | 10.6 | ||||||||||||
| 10.8 | Blackbaud, Inc. 2001 Stock Option Plan, as amended | S-1/A | 04/06/04 | 10.8 | ||||||||||||
| 10.20 | Blackbaud, Inc. 2004 Stock Plan, as amended, together with Form of Notice of Stock Option Grant and Stock Option Agreement | 8-K | 06/20/06 | 10.20 | ||||||||||||
| 10.26 | Form of Notice of Restricted Stock Grant and Restricted Stock Agreement under the Blackbaud, Inc. 2004 Stock Plan | 10-K | 02/28/07 | 10.26 | ||||||||||||
| 10.27 | Form of Notice of Stock Appreciation Rights Grant and Stock Appreciation Rights Agreement under the Blackbaud, Inc. 2004 Stock Plan | 10-K | 02/28/07 | 10.27 | ||||||||||||
| 10.33 | Blackbaud, Inc. 2008 Equity Incentive Plan | DEF 14A | 04/29/08 | |||||||||||||
| 10.34 | Form of Notice of Grant and Stock Option Agreement under Blackbaud, Inc. 2008 Equity Incentive Plan | S-8 | 08/04/08 | 10.34 | ||||||||||||
| 10.35 | Form of Notice of Grant and Restricted Stock Agreement under Blackbaud, Inc. 2008 Equity Incentive Plan | S-8 | 08/04/08 | 10.35 | ||||||||||||
| 10.36 | Form of Notice of Grant and Stock Appreciation Rights Agreement under Blackbaud, Inc. 2008 Equity Incentive Plan | S-8 | 08/04/08 | 10.36 | ||||||||||||
| 10.37 | ** | Kintera, Inc. 2000 Stock Option Plan, as amended, and form of Stock Option Agreement thereunder | 10-K/A | 03/26/08 | 10.2 | |||||||||||
| 10.38 | ** | Kintera, Inc. Amended and Restated 2003 Equity Incentive Plan, as amended, and form of Stock Option Agreement thereunder | 10-K/A | 03/26/08 | 10.3 | |||||||||||
| 10.39 | Form of Retention Agreement | 10-Q | 11/10/08 | 10.37 | ||||||||||||
| 10.40 | Triple Net Lease Agreement dated as of October 1, 2008 between Blackbaud, Inc. and Duck Pond Creek-SPE, LLC | 8-K | 12/11/08 | 10.37 | ||||||||||||
| 10.41 | Blackbaud, Inc. 2009 Equity Compensation Plan for Employees from Acquired Companies | S-8 | 07/02/09 | 10.41 | ||||||||||||
| 10.43 | Amended and Restated Employment and Noncompetition Agreement dated January 28, 2010 between Blackbaud, Inc. and Marc Chardon | 8-K | 02/01/10 | 10.43 | ||||||||||||
| 10.44 | Credit Agreement dated as of June 17, 2011 by and among Blackbaud, Inc., as Borrower, the lenders referred to therein, and Wells Fargo Bank, National Association, as Administrative Agent, Swingline Lender and Issuing Lender, with Wells Fargo Securities, LLC, J.P. Morgan Securities LLC, and SunTrust Robinson Humphrey, Inc. as Joint Lead Arrangers and Joint Book Managers | 8-K | 06/23/11 | 10.44 | ||||||||||||
| Filed In | ||||||||||
| Exhibit number | Description of Document | Registrant’s Form | Dated | Exhibit Number | Filed Herewith | |||||
| 10.41 | Blackbaud, Inc. 2009 Equity Compensation Plan for Employees from Acquired Companies | S-8 | 07/02/09 | 10.41 | ||||||
| 10.42 | Share Purchase Agreement between RLC Group B.V., as the Seller, and Blackbaud, Inc., as the Purchaser | 10-Q | 08/07/09 | 10.42 | ||||||
| 10.43 | Amended and Restated Employment and Noncompetition Agreement dated January 28, 2010 between Blackbaud, Inc. and Marc Chardon | 8-K** | 02/01/10 | 10.43 | ||||||
| 21.1 | Subsidiaries of Blackbaud, Inc | X | ||||||||
| 23.1 | Consent of Independent Registered Public Accounting Firm | X | ||||||||
| 31.1 | Certification by the Chief Executive Officer pursuant to Section 302 of the Sarbanes-Oxley Act of 2002 | X | ||||||||
| 31.2 | Certification by the Chief Financial Officer pursuant to Section 302 of the Sarbanes-Oxley Act of 2002 | X | ||||||||
| 32.1 | Certification by the Chief Executive Officer pursuant to 18 U.S.C. 1350 as adopted pursuant to Section 906 of the Sarbanes-Oxley Act of 2002 | X | ||||||||
| 32.2 | Certification by the Chief Financial Officer pursuant to 18 U.S.C. 1350 as adopted pursuant to Section 906 of the Sarbanes-Oxley Act of 2002 | X | ||||||||
| Filed In | ||||||||||||||||||
| Exhibit Number | Description of Document | Registrant’s Form | Dated | Exhibit Number | Filed Herewith | |||||||||||||
| 10.45 | Guaranty Agreement dated as of June 17, 2011, by certain subsidiaries of Blackbaud, Inc., as Guarantors, in favor of Wells Fargo Bank, National Association, as Administrative Agent | 8-K | 06/23/11 | 10.45 | ||||||||||||||
| 10.46 | Pledge Agreement dated as of June 17, 2011 by Blackbaud, Inc. and certain subsidiaries of Blackbaud, Inc. in favor of Wells Fargo Bank, National Association, as Administrative Agent for the ratable benefit of itself and the lenders referred to therein | 8-K | 06/23/11 | 10.46 | ||||||||||||||
| 10.47 | Employment Agreement dated November 7, 2008 between Blackbaud, Inc. and Tim Williams | 10-Q | 11/08/11 | 10.47 | ||||||||||||||
| 10.48 | Employment Agreement dated November 7, 2008 between Blackbaud, Inc. and Louis Attanasi | 10-Q | 11/08/11 | 10.48 | ||||||||||||||
| 10.49 | Employment Agreement dated November 7, 2008 between Blackbaud, Inc. and Charlie Cumbaa | 10-Q | 11/08/11 | 10.49 | ||||||||||||||
| 10.50 | Employment Agreement dated June 25, 2008 between Blackbaud, Inc. and Kevin Mooney | 10-Q | 11/08/11 | 10.50 | ||||||||||||||
| 10.51 | Amendment No. 1 to the Amended and Restated Employment and Noncompetition Agreement dated December 13, 2011 between Blackbaud, Inc. and Marc Chardon | 8-K | 12/16/11 | 10.51 | ||||||||||||||
| 10.52 | Form of Tender and Support Agreement by and among Blackbaud, Inc. and certain stockholders of Convio, Inc. | 8-K | 01/17/12 | 10.52 | ||||||||||||||
| 10.53 | Amended and Restated Credit Agreement dated as of February 9, 2012 by and among Blackbaud, Inc., as Borrower, the lenders referred to therein, JPMorgan Chase Bank, N.A., as Administrative Agent, Swingline Lender and an Issuing Lender, SunTrust Bank, as Syndication Agent, and Bank of America, N.A. and Regions Bank, as Co-Documentation Agents, with J.P. Morgan Securities LLC and SunTrust Robinson Humphrey, Inc., as Joint Lead Arrangers and Joint Bookrunners | 8-K | 02/15/12 | 10.53 | ||||||||||||||
| 10.54 | Amended and Restated Pledge Agreement dated as of February 9, 2012 by Blackbaud, Inc. in favor of JPMorgan Chase Bank, N.A., as Administrative Agent for the ratable benefit of itself and the lenders referred to therein | 8-K | 02/15/12 | 10.54 | ||||||||||||||
| 10.55 | Employment Agreement dated November 14, 2011 between Blackbaud, Inc. and Anthony W. Boor | 10-K | 02/29/12 | 10.55 | X | |||||||||||||
| 10.56 | Services Agreement dated November 11, 2011 between Blackbaud, Inc. and Timothy V. Williams | 10-K | 02/29/12 | 10.56 | X | |||||||||||||
| 10.57 | Employment Agreement dated November 16, 2010 between Blackbaud, Inc. and Jana B. Eggers | 10-K | 02/29/12 | 10.57 | X | |||||||||||||
| 21.1 | Subsidiaries of Blackbaud, Inc | X | ||||||||||||||||
| 23.1 | Consent of Independent Registered Public Accounting Firm | X | ||||||||||||||||
| Filed In | ||||||||||||||
| Exhibit Number | Description of Document | Registrant’s Form | Dated | Exhibit Number | Filed Herewith | |||||||||
| 31.1 | Certification by the Chief Executive Officer pursuant to Section 302 of the Sarbanes-Oxley Act of 2002 | X | ||||||||||||
| 31.2 | Certification by the Chief Financial Officer pursuant to Section 302 of the Sarbanes-Oxley Act of 2002 | X | ||||||||||||
| 32.1 | Certification by the Chief Executive Officer pursuant to 18 U.S.C. 1350 as adopted pursuant to Section 906 of the Sarbanes-Oxley Act of 2002 | X | ||||||||||||
| 32.2 | Certification by the Chief Financial Officer pursuant to 18 U.S.C. 1350 as adopted pursuant to Section 906 of the Sarbanes-Oxley Act of 2002 | X | ||||||||||||
| 101.INS | *** | XBRL Instance Document. | X | |||||||||||
| 101.SCH | *** | XBRL Taxonomy Extension Schema Document. | X | |||||||||||
| 101.CAL | *** | XBRL Taxonomy Extension Calculation Linkbase Document. | X | |||||||||||
| 101.DEF | *** | XBRL Taxonomy Extension Definition Linkbase Document. | X | |||||||||||
| 101.LAB | *** | XBRL Taxonomy Extension Label Linkbase Document. | X | |||||||||||
| 101.PRE | *** | XBRL Taxonomy Extension Presentation Linkbase Document. | X | |||||||||||
| * | The registrant has received confidential treatment with respect to portions of this exhibit. Those portions have been omitted from the exhibit and filed separately with the U.S. Securities and Exchange Commission. |
| ** | The Kintera, Inc. 2000 Stock Option Plan, as amended, and form of Stock Option Agreement thereunder |
| *** |
SIGNATURES
Pursuant to the requirements of Section 13 or 15(d) of the Securities Exchange Act of 1934, the Registrant has duly caused this Form 10-K to be signed on its behalf by the undersigned, thereunto duly authorized.
| BLACKBAUD, INC | ||||
| Signed: February | /S/ MARC E. CHARDON | |||
| President and Chief Executive Officer | ||||
Pursuant to the requirements of the Securities Exchange Act of 1934, this Form 10-K has been signed below by the following persons on behalf of the Registrant and on the dates indicated.
/S/ MARC E. CHARDON Marc E. Chardon | President, Chief Executive Officer | Date: February | ||
/S/
| Senior Vice President and Chief Financial Officer (Principal | Date: February | ||
/S/ ANDREW M. LEITCH Andrew M. Leitch | Chairman of the Board | Date: February | ||
/S/ TIMOTHY CHOU Timothy Chou | Director | Date: February | ||
/S/ GEORGE H. ELLIS George H. Ellis | Director | Date: February | ||
/S/ DAVID G. GOLDEN David G. Golden | Director | Date: February 29, 2012 | ||
/S/ JOHN P. MCCONNELL John P. McConnell | Director | Date: February | ||
/S/ CAROLYN MILES Carolyn Miles | Director | Date: February | ||
/S/ SARAH E. NASH Sarah E. Nash | Director | Date: February 29, 2012 | ||
BLACKBAUD, INC.
Index to consolidated financial statements
| Page | ||||
| F-2 | ||||
Consolidated balance sheets as of December 31, | F-3 | |||
| F-4 | ||||
| F-5 | ||||
| F-6 | ||||
| F-7 | ||||
REPORT OF INDEPENDENT REGISTERED PUBLIC ACCOUNTING FIRM
To the Board of Directors and Stockholders of
Blackbaud, Inc.
In our opinion, the accompanying consolidated balance sheets and the related consolidated statements of operations, of cash flows and of stockholders’ equity and comprehensive income present fairly, in all material respects, the financial position of Blackbaud, Inc. and its subsidiaries at December 31, 20092011 and 2008,2010, and the results of their operations and their cash flows for each of the three years in the period ended December 31, 20092011 in conformity with accounting principles generally accepted in the United States of America. Also in our opinion, the Company maintained, in all material respects, effective internal control over financial reporting as of December 31, 2009,2011, based on criteria established inInternal Control—Integrated Framework issued by the Committee of Sponsoring Organizations of the Treadway Commission (COSO). The Company’s management is responsible for these financial statements, for maintaining effective internal control over financial reporting and for its assessment of the effectiveness of internal control over financial reporting, included in Management’s Report on Internal Control over Financial Reporting. Our responsibility is to express opinions on these financial statements and on the Company’s internal control over financial reporting based on our integrated audits. We conducted our audits in accordance with the standards of the Public Company Accounting Oversight Board (United States). Those standards require that we plan and perform the audits to obtain reasonable assurance about whether the financial statements are free of material misstatement and whether effective internal control over financial reporting was maintained in all material respects. Our audits of the financial statements included examining, on a test basis, evidence supporting the amounts and disclosures in the financial statements, assessing the accounting principles used and significant estimates made by management, and evaluating the overall financial statement presentation. Our audit of internal control over financial reporting included obtaining an understanding of internal control over financial reporting, assessing the risk that a material weakness exists, and testing and evaluating the design and operating effectiveness of internal control based on the assessed risk. Our audits also included performing such other procedures as we considered necessary in the circumstances. We believe that our audits provide a reasonable basis for our opinions.
As discussed in Note 1 to the consolidated financial statements, the Company changed the manner in which it accounts for uncertain tax positions in 2007.
A company’s internal control over financial reporting is a process designed to provide reasonable assurance regarding the reliability of financial reporting and the preparation of financial statements for external purposes in accordance with generally accepted accounting principles. A company’s internal control over financial reporting includes those policies and procedures that (i) pertain to the maintenance of records that, in reasonable detail, accurately and fairly reflect the transactions and dispositions of the assets of the company; (ii) provide reasonable assurance that transactions are recorded as necessary to permit preparation of financial statements in accordance with generally accepted accounting principles, and that receipts and expenditures of the company are being made only in accordance with authorizations of management and directors of the company; and (iii) provide reasonable assurance regarding prevention or timely detection of unauthorized acquisition, use, or disposition of the company’s assets that could have a material effect on the financial statements.
Because of its inherent limitations, internal control over financial reporting may not prevent or detect misstatements. Also, projections of any evaluation of effectiveness to future periods are subject to the risk that controls may become inadequate because of changes in conditions, or that the degree of compliance with the policies or procedures may deteriorate.
/s/S/ PRICEWATERHOUSECOOPERS LLP
Raleigh, North Carolina
February 25, 201029, 2012
Blackbaud, Inc.
Consolidated balance sheets
| December 31, | ||||||||||||||||
(in thousands, except share amounts) | December 31, 2011 | December 31, 2010 | ||||||||||||||
| 2009 | 2008 | |||||||||||||||
Assets | ||||||||||||||||
Current assets: | ||||||||||||||||
Cash and cash equivalents | $ | 22,769 | $ | 16,361 | $ | 52,520 | $ | 28,004 | ||||||||
Donor restricted cash | 12,874 | 12,363 | 40,205 | 16,359 | ||||||||||||
Accounts receivable, net of allowance of $3,559 and $2,777 at December 31, 2009 and December 31, 2008, respectively | 50,220 | 52,554 | ||||||||||||||
Accounts receivable, net of allowance of $3,913 and $2,687 at December 31, 2011 and 2010, respectively | 62,656 | 59,296 | ||||||||||||||
Prepaid expenses and other current assets | 18,155 | 17,281 | 31,016 | 32,139 | ||||||||||||
Deferred tax asset, current portion | 5,728 | 6,858 | 1,551 | 5,164 | ||||||||||||
|
| |||||||||||||||
Total current assets | 109,746 | 105,417 | 187,948 | 140,962 | ||||||||||||
Property and equipment, net | 22,507 | 21,384 | 34,397 | 22,963 | ||||||||||||
Deferred tax asset | 55,570 | 64,762 | 29,376 | 42,314 | ||||||||||||
Goodwill | 73,919 | 73,615 | 90,122 | 76,247 | ||||||||||||
Intangible assets, net | 42,019 | 48,171 | 44,660 | 38,515 | ||||||||||||
Other assets | 468 | 537 | 6,087 | 2,805 | ||||||||||||
|
| |||||||||||||||
Total assets | $ | 304,229 | $ | 313,886 | $ | 392,590 | $ | 323,806 | ||||||||
|
| |||||||||||||||
Liabilities and stockholders’ equity | ||||||||||||||||
Current liabilities: | ||||||||||||||||
Trade accounts payable | $ | 10,683 | $ | 7,023 | $ | 13,464 | $ | 9,620 | ||||||||
Accrued expenses and other current liabilities | 25,974 | 22,142 | 32,707 | 28,278 | ||||||||||||
Donations payable | 12,874 | 12,363 | 40,205 | 16,359 | ||||||||||||
Debt, current portion | 1,288 | 60,049 | ||||||||||||||
Deferred revenue | 129,412 | 113,802 | 153,665 | 143,761 | ||||||||||||
|
| |||||||||||||||
Total current liabilities | 180,231 | 215,379 | 240,041 | 198,018 | ||||||||||||
Long-term debt, net of current portion | — | 1,288 | ||||||||||||||
Deferred revenue, noncurrent | 6,172 | 5,838 | 9,772 | 6,900 | ||||||||||||
Other noncurrent liabilities | 1,720 | 873 | 2,775 | 2,419 | ||||||||||||
|
| |||||||||||||||
Total liabilities | 188,123 | 223,378 | 252,588 | 207,337 | ||||||||||||
|
| |||||||||||||||
Commitments and contingencies (see Note 9) | ||||||||||||||||
Commitments and contingencies (see Note 10) | ||||||||||||||||
Stockholders’ equity: | ||||||||||||||||
Preferred stock; 20,000,000 shares authorized, none outstanding | — | — | — | — | ||||||||||||
Common stock, $0.001 par value; 180,000,000 shares authorized, 52,214,606 and 51,269,081 shares issued at December 31, 2009 and December 31, 2008, respectively | 52 | 51 | ||||||||||||||
Common stock, $0.001 par value; 180,000,000 shares authorized, 53,959,532 and 53,316,280 shares issued at December 31, 2011 and 2010, respectively | 54 | 53 | ||||||||||||||
Additional paid-in capital | 134,726 | 116,846 | 175,401 | 158,372 | ||||||||||||
Treasury stock, at cost; 7,677,341 and 7,494,466 shares at December 31, 2009 and December 31, 2008, respectively | (134,382 | ) | (130,594 | ) | ||||||||||||
Treasury stock, at cost; 9,019,824 and 8,842,882 shares at December 31, 2011 and 2010, respectively | (166,226 | ) | (161,186 | ) | ||||||||||||
Accumulated other comprehensive loss | (201 | ) | (899 | ) | (1,148 | ) | (812 | ) | ||||||||
Retained earnings | 115,911 | 105,104 | 131,921 | 120,042 | ||||||||||||
|
| |||||||||||||||
Total stockholders’ equity | 116,106 | 90,508 | 140,002 | 116,469 | ||||||||||||
|
| |||||||||||||||
Total liabilities and stockholders’ equity | $ | 304,229 | $ | 313,886 | $ | 392,590 | $ | 323,806 | ||||||||
|
| |||||||||||||||
The accompanying notes are an integral part of these consolidated financial statements.
Blackbaud, Inc.
Consolidated statements of operations
| Years ended December 31, | Years ended December 31, | |||||||||||||||||||||||
| (in thousands, except share and per share amounts) | 2009 | 2008 | 2007 | 2011 | 2010 | 2009 | ||||||||||||||||||
Revenue | ||||||||||||||||||||||||
License fees | $ | 25,392 | $ | 35,932 | $ | 37,569 | $ | 19,475 | $ | 23,719 | $ | 25,656 | ||||||||||||
Subscriptions | 103,544 | 83,912 | 73,194 | |||||||||||||||||||||
Services | 87,834 | 100,824 | 91,376 | 108,781 | 87,663 | 87,239 | ||||||||||||||||||
Maintenance | 116,476 | 107,304 | 94,602 | 130,604 | 124,559 | 116,413 | ||||||||||||||||||
Subscriptions | 72,898 | 49,705 | 25,389 | |||||||||||||||||||||
Other revenue | 6,738 | 8,730 | 8,102 | 8,464 | 6,712 | 6,968 | ||||||||||||||||||
|
| |||||||||||||||||||||||
Total revenue | 309,338 | 302,495 | 257,038 | 370,868 | 326,565 | 309,470 | ||||||||||||||||||
|
| |||||||||||||||||||||||
Cost of revenue | ||||||||||||||||||||||||
Cost of license fees | 3,582 | 3,316 | 2,870 | 3,345 | 3,003 | 3,697 | ||||||||||||||||||
Cost of subscriptions | 42,536 | 31,155 | 28,158 | |||||||||||||||||||||
Cost of services | 61,713 | 63,960 | 54,908 | 79,086 | 66,755 | 61,585 | ||||||||||||||||||
Cost of maintenance | 21,364 | 20,185 | 17,119 | 25,178 | 24,123 | 21,594 | ||||||||||||||||||
Cost of subscriptions | 28,183 | 20,587 | 10,306 | |||||||||||||||||||||
Cost of other revenue | 6,098 | 8,368 | 7,274 | 7,049 | 7,103 | 6,098 | ||||||||||||||||||
|
| |||||||||||||||||||||||
Total cost of revenue | 120,940 | 116,416 | 92,477 | 157,194 | 132,139 | 121,132 | ||||||||||||||||||
|
| |||||||||||||||||||||||
Gross profit | 188,398 | 186,079 | 164,561 | 213,674 | 194,426 | 188,338 | ||||||||||||||||||
|
| |||||||||||||||||||||||
Operating expenses | ||||||||||||||||||||||||
Sales and marketing | 62,796 | 65,185 | 56,994 | 75,361 | 69,469 | 63,495 | ||||||||||||||||||
Research and development | 45,662 | 38,708 | 28,525 | 47,672 | 45,499 | 45,520 | ||||||||||||||||||
General and administrative | 33,380 | 34,072 | 26,144 | 36,933 | 32,636 | 33,383 | ||||||||||||||||||
Impairment of cost method investment | 1,800 | — | — | |||||||||||||||||||||
Amortization | 768 | 713 | 491 | 980 | 798 | 768 | ||||||||||||||||||
|
| |||||||||||||||||||||||
Total operating expenses | 142,606 | 138,678 | 112,154 | 162,746 | 148,402 | 143,166 | ||||||||||||||||||
|
| |||||||||||||||||||||||
Income from operations | 45,792 | 47,401 | 52,407 | 50,928 | 46,024 | 45,172 | ||||||||||||||||||
Interest income | 637 | 526 | 813 | 183 | 84 | 637 | ||||||||||||||||||
Interest expense | (962 | ) | (1,526 | ) | (1,164 | ) | (200 | ) | (74 | ) | (962 | ) | ||||||||||||
Other income (expense), net | 220 | (194 | ) | (503 | ) | 346 | (98 | ) | 220 | |||||||||||||||
|
| |||||||||||||||||||||||
Income before provision for income taxes | 45,687 | 46,207 | 51,553 | 51,257 | 45,936 | 45,067 | ||||||||||||||||||
Income tax provision | 17,240 | 16,329 | 19,829 | 18,037 | 16,749 | 17,547 | ||||||||||||||||||
|
| |||||||||||||||||||||||
Net income | $ | 28,447 | $ | 29,878 | $ | 31,724 | $ | 33,220 | $ | 29,187 | $ | 27,520 | ||||||||||||
|
| |||||||||||||||||||||||
Earnings per share | ||||||||||||||||||||||||
Basic | $ | 0.67 | $ | 0.70 | $ | 0.73 | $ | 0.76 | $ | 0.68 | $ | 0.64 | ||||||||||||
Diluted | $ | 0.65 | $ | 0.68 | $ | 0.71 | $ | 0.75 | $ | 0.67 | $ | 0.63 | ||||||||||||
Common shares and equivalents outstanding | ||||||||||||||||||||||||
Basic weighted average shares | 42,771,173 | 42,958,947 | 43,619,158 | 43,522,563 | 43,145,189 | 42,771,173 | ||||||||||||||||||
Diluted weighted average shares | 43,600,048 | 43,958,557 | 44,595,483 | 44,149,054 | 43,876,155 | 43,600,048 | ||||||||||||||||||
Dividends per share | $ | 0.40 | $ | 0.40 | $ | 0.34 | $ | 0.48 | $ | 0.44 | $ | 0.40 | ||||||||||||
The accompanying notes are an integral part of these consolidated financial statements.
Blackbaud, Inc.
Consolidated statements of cash flows
| Years ended December 31, | Years ended December 31, | |||||||||||||||||||||||
| (in thousands) | 2009 | 2008 | 2007 | 2011 | 2010 | 2009 | ||||||||||||||||||
Cash flows from operating activities | ||||||||||||||||||||||||
Net income | $ | 28,447 | $ | 29,878 | $ | 31,724 | $ | 33,220 | $ | 29,187 | $ | 27,520 | ||||||||||||
Adjustments to reconcile net income to net cash provided by operating activities: | ||||||||||||||||||||||||
Depreciation and amortization | 15,509 | 12,865 | 8,149 | 16,995 | 16,189 | 15,624 | ||||||||||||||||||
Provision for doubtful accounts and sales returns | 3,458 | 4,179 | 2,661 | 5,646 | 2,773 | 3,458 | ||||||||||||||||||
Stock-based compensation expense | 12,287 | 12,085 | 6,934 | 14,884 | 13,059 | 12,410 | ||||||||||||||||||
Excess tax benefit on exercise of stock options | (2,405 | ) | (1,497 | ) | (4,931 | ) | ||||||||||||||||||
Excess tax benefits from stock-based compensation | (932 | ) | (2,665 | ) | (2,356 | ) | ||||||||||||||||||
Deferred taxes | 12,351 | 6,407 | 12,491 | 13,533 | 11,313 | 12,464 | ||||||||||||||||||
Impairment of cost method investment | 1,800 | — | — | |||||||||||||||||||||
Gain on sale of assets | (549 | ) | — | — | ||||||||||||||||||||
Other non-cash adjustments | 116 | 110 | 65 | (878 | ) | (22 | ) | 116 | ||||||||||||||||
Changes in assets and liabilities, net of acquisition of businesses: | ||||||||||||||||||||||||
Accounts receivable | 1,375 | (10,193 | ) | (10,367 | ) | (8,692 | ) | (12,778 | ) | 1,531 | ||||||||||||||
Prepaid expenses and other assets | 2,122 | (5,635 | ) | (2,005 | ) | (2,915 | ) | (10,109 | ) | 3,054 | ||||||||||||||
Trade accounts payable | (312 | ) | 614 | (830 | ) | 1,714 | 228 | (368 | ) | |||||||||||||||
Accrued expenses and other current liabilities | 612 | (7,907 | ) | 6,079 | ||||||||||||||||||||
Accrued expenses and other liabilities | (1,056 | ) | (4,248 | ) | 221 | |||||||||||||||||||
Donor restricted cash | (511 | ) | (3,763 | ) | — | (22,862 | ) | (3,446 | ) | (511 | ) | |||||||||||||
Donations payable | 511 | 3,763 | — | 22,862 | 3,446 | 511 | ||||||||||||||||||
Deferred revenue | 13,237 | 19,404 | 12,897 | 12,757 | 13,121 | 13,213 | ||||||||||||||||||
|
| |||||||||||||||||||||||
Net cash provided by operating activities | 86,797 | 60,310 | 62,867 | 85,527 | 56,048 | 86,887 | ||||||||||||||||||
|
| |||||||||||||||||||||||
Cash flows from investing activities | ||||||||||||||||||||||||
Purchase of property and equipment | (5,534 | ) | (7,692 | ) | (8,123 | ) | (18,215 | ) | (10,760 | ) | (5,534 | ) | ||||||||||||
Purchase of net assets of acquired companies, net of cash acquired | (2,258 | ) | (49,916 | ) | (84,405 | ) | (23,385 | ) | (5,334 | ) | (2,258 | ) | ||||||||||||
Proceeds from sale and maturity of marketable securities | — | 1,575 | — | |||||||||||||||||||||
Purchase of investment | — | (2,000 | ) | — | ||||||||||||||||||||
Capitalized software development costs | (1,012 | ) | (175 | ) | (41 | ) | ||||||||||||||||||
Purchase of intangible assets | — | (130 | ) | — | ||||||||||||||||||||
Proceeds from sale of assets | 874 | — | — | |||||||||||||||||||||
|
| |||||||||||||||||||||||
Net cash used in investing activities | (7,792 | ) | (56,033 | ) | (92,528 | ) | (41,738 | ) | (18,399 | ) | (7,833 | ) | ||||||||||||
|
| |||||||||||||||||||||||
Cash flows from financing activities | ||||||||||||||||||||||||
Dividend payments to stockholders | (21,429 | ) | (19,490 | ) | (17,673 | )�� | ||||||||||||||||||
Proceeds from exercise of stock options | 2,041 | 8,065 | 2,509 | |||||||||||||||||||||
Excess tax benefits from stock-based compensation | 932 | 2,665 | 2,356 | |||||||||||||||||||||
Purchase of treasury stock | — | (22,613 | ) | — | ||||||||||||||||||||
Proceeds from issuance of debt | — | 86,000 | 48,000 | — | 4,000 | — | ||||||||||||||||||
Proceeds from exercise of stock options | 2,509 | 883 | 5,451 | |||||||||||||||||||||
Excess tax benefit on exercise of stock options | 2,405 | 1,497 | 4,931 | |||||||||||||||||||||
Payments on debt | (60,049 | ) | (27,527 | ) | (49,934 | ) | — | (5,175 | ) | (60,049 | ) | |||||||||||||
Payments of deferred financing fees | — | (47 | ) | (418 | ) | |||||||||||||||||||
Payments on deferred financing costs | (767 | ) | — | — | ||||||||||||||||||||
Payments on capital lease obligations | (384 | ) | (540 | ) | (477 | ) | (40 | ) | (164 | ) | (384 | ) | ||||||||||||
Purchase of treasury stock | — | (43,727 | ) | (15,857 | ) | |||||||||||||||||||
Dividend payments to stockholders | (17,673 | ) | (17,497 | ) | (15,074 | ) | ||||||||||||||||||
|
| |||||||||||||||||||||||
Net cash used in financing activities | (73,192 | ) | (958 | ) | (23,378 | ) | (19,263 | ) | (32,712 | ) | (73,241 | ) | ||||||||||||
|
| |||||||||||||||||||||||
Effect of exchange rate on cash and cash equivalents | 595 | (1,733 | ) | 31 | (10 | ) | 298 | 595 | ||||||||||||||||
|
| |||||||||||||||||||||||
Net increase (decrease) in cash and cash equivalents | 6,408 | 1,586 | (53,008 | ) | ||||||||||||||||||||
Net increase in cash and cash equivalents | 24,516 | 5,235 | 6,408 | |||||||||||||||||||||
Cash and cash equivalents, beginning of year | 16,361 | 14,775 | 67,783 | 28,004 | 22,769 | 16,361 | ||||||||||||||||||
|
| |||||||||||||||||||||||
Cash and cash equivalents, end of year | $ | 22,769 | $ | 16,361 | $ | 14,775 | $ | 52,520 | $ | 28,004 | $ | 22,769 | ||||||||||||
|
| |||||||||||||||||||||||
Supplemental disclosure of cash flow information | ||||||||||||||||||||||||
Cash paid during the year for: | ||||||||||||||||||||||||
Interest | $ | 615 | $ | 1,375 | $ | 1,126 | $ | 2 | $ | 87 | $ | 615 | ||||||||||||
Taxes, net of refunds | $ | (2,584 | ) | $ | 11,041 | $ | 5,607 | $ | (4,601 | ) | $ | 9,527 | $ | (2,584 | ) | |||||||||
Purchase of equipment included in accounts payable | $ | 3,699 | $ | — | $ | — | $ | 4,760 | $ | 2,630 | $ | 3,699 | ||||||||||||
The accompanying notes are an integral part of these consolidated financial statements.
Blackbaud, Inc.
Consolidated statements of stockholders’ equity and comprehensive income
| Comprehensive income | Common stock | Additional capital | Treasury stock | Accumulated income (loss) | Retained earnings | Total equity | Comprehensive income | Common stock | Additional paid-in capital | Treasury stock | Accumulated other comprehensive income (loss) | Retained earnings | Total stockholders’ equity | |||||||||||||||||||||||||||||||||||||||||||||||||
| (in thousands, except share amounts) | Shares | Amount | Shares | Amount | ||||||||||||||||||||||||||||||||||||||||||||||||||||||||||
Balance at December 31, 2006 | 49,205,522 | $ | 49 | $ | 88,409 | $ | (69,630 | ) | $ | 232 | $ | 76,298 | $ | 95,358 | ||||||||||||||||||||||||||||||||||||||||||||||||
Balance at December 31, 2008 | 51,269,081 | $ | 51 | $ | 116,688 | $ | (130,594 | ) | $ | (818 | ) | $ | 100,406 | $ | 85,733 | |||||||||||||||||||||||||||||||||||||||||||||||
|
| |||||||||||||||||||||||||||||||||||||||||||||||||||||||||||||
Net income | $ | 31,724 | — | — | — | — | — | 31,724 | 31,724 | $ | 27,520 | — | — | — | — | — | 27,520 | 27,520 | ||||||||||||||||||||||||||||||||||||||||||||
Payment of dividends | — | — | — | — | — | — | (15,074 | ) | (15,074 | ) | — | — | — | — | — | — | (17,673 | ) | (17,673 | ) | ||||||||||||||||||||||||||||||||||||||||||
Purchase of 633,878 treasury shares under stock repurchase program and surrender of 54,079 shares upon restricted stock vesting | — | — | — | — | (15,857 | ) | — | — | (15,857 | ) | ||||||||||||||||||||||||||||||||||||||||||||||||||||
Exercise of stock options | — | 776,125 | 1 | 5,450 | — | — | — | 5,451 | ||||||||||||||||||||||||||||||||||||||||||||||||||||||
Tax impact of exercise of nonqualified stock options | — | — | — | 4,931 | — | — | — | 4,931 | ||||||||||||||||||||||||||||||||||||||||||||||||||||||
Cumulative effect of the adoption of a new income tax standard | — | — | — | — | — | — | (269 | ) | (269 | ) | ||||||||||||||||||||||||||||||||||||||||||||||||||||
Issuance of common stock | — | 55,661 | 1,215 | 1,215 | ||||||||||||||||||||||||||||||||||||||||||||||||||||||||||
Exercise of stock options and stock appreciation rights | — | 451,580 | 1 | 2,509 | — | — | — | 2,510 | ||||||||||||||||||||||||||||||||||||||||||||||||||||||
Surrender of 182,875 shares upon restricted stock vesting and exercise of stock appreciation rights | — | — | — | — | (3,788 | ) | — | — | (3,788 | ) | ||||||||||||||||||||||||||||||||||||||||||||||||||||
Tax impact of exercise of equity based compensation | — | — | — | 2,241 | — | — | — | 2,241 | ||||||||||||||||||||||||||||||||||||||||||||||||||||||
Stock-based compensation | — | — | 6,897 | — | — | 37 | 6,934 | — | — | — | 11,541 | — | — | 33 | 11,574 | |||||||||||||||||||||||||||||||||||||||||||||||
Restricted stock grants | — | 549,320 | — | — | — | — | — | — | — | 492,964 | — | 449 | — | — | — | 449 | ||||||||||||||||||||||||||||||||||||||||||||||
Restricted stock cancellations | — | (80,292 | ) | — | — | — | — | — | — | — | (54,680 | ) | — | — | — | — | — | — | ||||||||||||||||||||||||||||||||||||||||||||
Translation adjustment, net of tax | (95 | ) | — | — | — | — | (95 | ) | — | (95 | ) | |||||||||||||||||||||||||||||||||||||||||||||||||||
Translation adjustment | 512 | — | — | — | — | 512 | — | 512 | ||||||||||||||||||||||||||||||||||||||||||||||||||||||
|
| |||||||||||||||||||||||||||||||||||||||||||||||||||||||||||||
Comprehensive income | $ | 31,629 | $ | 28,032 | ||||||||||||||||||||||||||||||||||||||||||||||||||||||||||
Balance at December 31, 2007 | 50,450,675 | $ | 50 | $ | 105,687 | $ | (85,487 | ) | $ | 137 | $ | 92,716 | $ | 113,103 | ||||||||||||||||||||||||||||||||||||||||||||||||
Balance at December 31, 2009 | 52,214,606 | $ | 52 | $ | 134,643 | $ | (134,382 | ) | $ | (306 | ) | $ | 110,286 | $ | 110,293 | |||||||||||||||||||||||||||||||||||||||||||||||
Net income | $ | 29,878 | — | — | — | — | — | 29,878 | 29,878 | $ | 29,187 | — | — | — | — | — | 29,187 | 29,187 | ||||||||||||||||||||||||||||||||||||||||||||
Payment of dividends | — | — | — | — | — | — | (17,497 | ) | (17,497 | ) | — | — | — | — | — | — | (19,490 | ) | (19,490 | ) | ||||||||||||||||||||||||||||||||||||||||||
Purchase of 1,956,168 treasury shares under stock repurchase program and surrender of 106,446 shares upon restricted stock vesting | — | — | — | — | (45,107 | ) | — | — | (45,107 | ) | ||||||||||||||||||||||||||||||||||||||||||||||||||||
Exercise of stock options | — | 126,206 | 1 | 882 | — | — | — | 883 | ||||||||||||||||||||||||||||||||||||||||||||||||||||||
Tax impact of exercise of nonqualified stock options and restricted stock vesting | — | — | — | (1,126 | ) | — | — | — | (1,126 | ) | ||||||||||||||||||||||||||||||||||||||||||||||||||||
Stock options assumed in acquisition | — | — | — | 172 | — | — | — | 172 | ||||||||||||||||||||||||||||||||||||||||||||||||||||||
Purchase of 1,007,082 treasury shares under stock repurchase program | — | — | — | — | (22,613 | ) | — | — | (22,613 | ) | ||||||||||||||||||||||||||||||||||||||||||||||||||||
Exercise of stock options and stock appreciation rights | — | 729,295 | 1 | 8,064 | — | — | — | 8,065 | ||||||||||||||||||||||||||||||||||||||||||||||||||||||
Surrender of 158,459 shares upon restricted stock vesting and exercise of stock appreciation rights | — | — | — | — | (4,191 | ) | — | — | (4,191 | ) | ||||||||||||||||||||||||||||||||||||||||||||||||||||
Tax impact of exercise of equity based compensation | — | — | — | 2,665 | — | — | — | 2,665 | ||||||||||||||||||||||||||||||||||||||||||||||||||||||
Stock-based compensation | — | — | 11,231 | — | — | 7 | 11,238 | — | — | — | 13,000 | — | — | 59 | 13,059 | |||||||||||||||||||||||||||||||||||||||||||||||
Restricted stock grants | — | 727,237 | — | — | — | — | — | — | — | 460,659 | — | — | — | — | — | — | ||||||||||||||||||||||||||||||||||||||||||||||
Restricted stock cancellations | — | (35,037 | ) | — | — | — | — | — | — | — | (88,280 | ) | — | — | — | — | — | |||||||||||||||||||||||||||||||||||||||||||||
Translation adjustment, net of tax | (1,036 | ) | — | — | — | — | (1,036 | ) | — | (1,036 | ) | |||||||||||||||||||||||||||||||||||||||||||||||||||
Translation adjustment | (506 | ) | — | — | — | — | (506 | ) | — | (506 | ) | |||||||||||||||||||||||||||||||||||||||||||||||||||
|
| |||||||||||||||||||||||||||||||||||||||||||||||||||||||||||||
Comprehensive income | $ | 28,842 | $ | 28,681 | ||||||||||||||||||||||||||||||||||||||||||||||||||||||||||
Balance at December 31, 2008 | 51,269,081 | $ | 51 | $ | 116,846 | $ | (130,594 | ) | $ | (899 | ) | $ | 105,104 | $ | 90,508 | |||||||||||||||||||||||||||||||||||||||||||||||
Balance at December 31, 2010 | 53,316,280 | $ | 53 | $ | 158,372 | $ | (161,186 | ) | $ | (812 | ) | $ | 120,042 | $ | 116,469 | |||||||||||||||||||||||||||||||||||||||||||||||
Net income | $ | 28,447 | — | — | — | — | — | 28,447 | 28,447 | $ | 33,220 | — | — | — | — | — | 33,220 | 33,220 | ||||||||||||||||||||||||||||||||||||||||||||
Payment of dividends | — | — | — | — | — | — | (17,673 | ) | (17,673 | ) | — | — | — | — | — | — | (21,429 | ) | (21,429 | ) | ||||||||||||||||||||||||||||||||||||||||||
Surrender of 182,875 shares upon restricted stock vesting and stock appreciation right exercise | — | — | — | — | (3,788 | ) | — | — | (3,788 | ) | ||||||||||||||||||||||||||||||||||||||||||||||||||||
Issuance of common stock | — | 55,661 | — | 1,215 | — | — | — | 1,215 | ||||||||||||||||||||||||||||||||||||||||||||||||||||||
Exercise of stock options and stock appreciation rights | — | 451,580 | 1 | 2,509 | — | — | — | 2,510 | ||||||||||||||||||||||||||||||||||||||||||||||||||||||
Tax impact of exercise of nonqualified stock options and restricted stock vesting | — | — | — | 2,290 | — | — | — | 2,290 | ||||||||||||||||||||||||||||||||||||||||||||||||||||||
Exercise of stock options, stock appreciation rights and restricted stock units | — | 262,428 | 1 | 2,040 | — | — | — | 2,041 | ||||||||||||||||||||||||||||||||||||||||||||||||||||||
Surrender of 176,942 shares upon restricted stock vesting and exercise of stock appreciation rights | — | — | — | — | (5,040 | ) | — | — | (5,040 | ) | ||||||||||||||||||||||||||||||||||||||||||||||||||||
Tax impact of exercise of equity based compensation | — | — | — | 193 | — | — | — | 193 | ||||||||||||||||||||||||||||||||||||||||||||||||||||||
Stock-based compensation | — | — | — | 11,417 | — | — | 33 | 11,450 | — | — | — | 14,796 | — | — | 88 | 14,884 | ||||||||||||||||||||||||||||||||||||||||||||||
Restricted stock grants | — | 492,964 | — | 449 | — | — | — | 449 | — | 502,426 | — | — | — | — | — | — | ||||||||||||||||||||||||||||||||||||||||||||||
Restricted stock cancellations | — | (54,680 | ) | — | — | — | — | — | — | — | (121,602 | ) | — | — | — | — | — | — | ||||||||||||||||||||||||||||||||||||||||||||
Translation adjustment, net of tax | 698 | — | — | — | — | 698 | — | 698 | ||||||||||||||||||||||||||||||||||||||||||||||||||||||
Translation adjustment | (336 | ) | — | — | — | — | (336 | ) | — | (336 | ) | |||||||||||||||||||||||||||||||||||||||||||||||||||
|
| |||||||||||||||||||||||||||||||||||||||||||||||||||||||||||||
Comprehensive income | $ | 29,145 | $ | 32,884 | ||||||||||||||||||||||||||||||||||||||||||||||||||||||||||
Balance at December 31, 2009 | 52,214,606 | $ | 52 | $ | 134,726 | $ | (134,382 | ) | $ | (201 | ) | $ | 115,911 | $ | 116,106 | |||||||||||||||||||||||||||||||||||||||||||||||
Balance at December 31, 2011 | 53,959,532 | $ | 54 | $ | 175,401 | $ | (166,226 | ) | $ | (1,148 | ) | $ | 131,921 | $ | 140,002 | |||||||||||||||||||||||||||||||||||||||||||||||
The accompanying notes are an integral part of these consolidated financial statements.
Blackbaud, Inc.
Notes to consolidated financial statements
| 1. | Organization and |
Blackbaud, Inc. (the Company) is the leading global provider ofprovides on-premise and cloud-based software solutions and related services designed specifically for nonprofit organizations, and provides products and services that enable nonprofit organizations to increase donations, reduce fundraising costs, improve communications with constituents, manage their finances and optimize internal operations. As of the end of 2009,December 31, 2011, the Company had approximately 22,00026,000 active customers distributed across multiple verticals within the nonprofit market including religion, education, foundations, health and human services, religion, arts and cultural, public and societal benefits, environment and animal welfare and international foreign affairs.
Basis of presentation
The consolidated financial statements have been prepared in accordance with accounting principles generally accepted in the United States of America (U.S. GAAP).
Basis of consolidation
The consolidated financial statements include the accounts of the Company and its wholly owned subsidiaries. All significant intercompany balances and transactions have been eliminated in consolidation.
Revision of prior period financial statements
During the three months ended December 31, 2011, the Company identified prior period errors related principally to revenue recognition, accounting for income taxes and the capitalization of software development costs. These errors impacted reporting periods beginning in the year ended December 31, 2006 and subsequent periods through September 30, 2011. Following is a description of the errors identified:
| • | Revenue recognition and related costs – The errors resulted from incorrect processing of deferred revenue transactions and incorrect application of the Company’s revenue recognition policy to certain subscription, consulting and analytic service arrangements. These errors resulted in a cumulative overstatement of revenue and related costs. |
Income taxes – These errors resulted from improperly recording an income tax benefit for compensation that was limited under Internal Revenue Code Section 162(m), resulting in a cumulative understatement of income tax expense.
Software development costs – The Company evaluates subsequent events throughdetermined that certain software development costs had been improperly expensed and should have been capitalized in prior periods. This error resulted in a cumulative overstatement of research and development expense.
In evaluating whether the dateCompany’s previously issued consolidated financial statements were materially misstated, the Company considered the guidance in Accounting Standard Codification (ASC) Topic 250,Accounting Changes and Error Corrections, ASC Topic 250-10-S99-1,Assessing Materiality, and ASC Topic 250-10-S99-2,Considering the Effects of Prior Year Misstatements when Quantifying Misstatements in Current Year Financial Statements. The Company concluded these errors were not material individually or in the aggregate to any of the prior reporting periods, and therefore, amendments of previously filed reports were not required. However, the cumulative error would be material in the year ended December 31, 2011, if the entire correction was recorded in the fourth quarter of 2011, and would have impacted comparisons to prior periods. As such, the revisions for these corrections to the applicable prior periods are reflected in the financial information herein and will be reflected in future filings containing such financial information. In addition to recording these correcting adjustments, the Company recorded other adjustments to prior period amounts to correct other
Blackbaud, Inc.
Notes to consolidated financial statements—(Continued)
immaterial out-of-period adjustments, including those that had been previously disclosed. The consolidated statement of stockholders equity was revised to reflect the cumulative effect of these adjustments resulting in a decrease to additional paid-in capital of $0.2 million, an increase to accumulated other comprehensive income of $0.1 million and a decrease to retained earnings of $4.7 million as of December 31, 2008.
The prior period financial statements are issued.included in this filing have been revised to reflect the corrections of these errors, the effects of which have been provided in summarized format below.
Revised consolidated balance sheet amounts
| As of December 31, 2010 | ||||||||||||
| (in millions) | As previously reported | Adjustment | As revised | |||||||||
Accounts receivable, net of allowance | $ | 59.8 | $ | (0.5 | ) | $ | 59.3 | |||||
Prepaid expenses and other current assets | 33.8 | (1.7 | ) | 32.1 | ||||||||
Total current assets | 143.1 | (2.1 | ) | 141.0 | ||||||||
Deferred tax asset | 44.6 | (2.3 | ) | 42.3 | ||||||||
Other assets | 2.6 | 0.2 | 2.8 | |||||||||
Total assets | 328.1 | (4.3 | ) | 323.8 | ||||||||
Trade accounts payable | 9.9 | (0.3 | ) | 9.6 | ||||||||
Deferred revenue | 141.1 | 2.7 | 143.8 | |||||||||
Total current liabilities | 195.7 | 2.3 | 198.0 | |||||||||
Total liabilities | 205.0 | 2.3 | 207.3 | |||||||||
Accumulated other comprehensive loss | (0.5 | ) | (0.3 | ) | (0.8 | ) | ||||||
Retained earnings | 126.3 | (6.3 | ) | 120.0 | ||||||||
Total stockholders’ equity | 123.1 | (6.6 | ) | 116.5 | ||||||||
Total liabilities and stockholders’ equity | 328.1 | (4.3 | ) | 323.8 | ||||||||
Blackbaud, Inc.
Notes to consolidated financial statements—(Continued)
Revised consolidated statements of operations amounts
| Year ended December 31, 2010 | Year ended December 31, 2009 | |||||||||||||||||||||||
| (in millions, except per share amounts) | As previously reported | Adjustment | As revised | As previously reported | Adjustment | As revised | ||||||||||||||||||
Revenue | ||||||||||||||||||||||||
License fees | $ | 23.7 | $ | — | $ | 23.7 | $ | 25.4 | $ | 0.3 | $ | 25.7 | ||||||||||||
Subscriptions | 82.5 | 1.4 | 83.9 | 72.9 | 0.3 | 73.2 | ||||||||||||||||||
Services | 89.6 | (1.9 | ) | 87.7 | 87.8 | (0.6 | ) | 87.2 | ||||||||||||||||
Maintenance | 124.6 | — | 124.6 | 116.5 | (0.1 | ) | 116.4 | |||||||||||||||||
Other revenue | 6.7 | — | 6.7 | 6.7 | 0.3 | 7.0 | ||||||||||||||||||
Total revenue | 327.1 | (0.5 | ) | 326.6 | 309.3 | 0.2 | 309.5 | |||||||||||||||||
Cost of revenue | ||||||||||||||||||||||||
Cost of license fees | 2.9 | 0.1 | 3.0 | 3.6 | 0.1 | 3.7 | ||||||||||||||||||
Cost of subscriptions | 31.1 | 0.1 | 31.2 | 28.2 | — | 28.2 | ||||||||||||||||||
Cost of services | 66.6 | 0.2 | 66.8 | 61.7 | (0.1 | ) | 61.6 | |||||||||||||||||
Cost of maintenance | 24.1 | — | 24.1 | 21.4 | 0.2 | 21.6 | ||||||||||||||||||
Total cost of revenue | 131.8 | 0.4 | 132.2 | 120.9 | 0.2 | 121.1 | ||||||||||||||||||
Gross profit | 195.3 | (0.9 | ) | 194.4 | 188.4 | — | 188.4 | |||||||||||||||||
Operating expenses | ||||||||||||||||||||||||
Sales and marketing | 70.2 | (0.7 | ) | 69.5 | 62.8 | 0.7 | 63.5 | |||||||||||||||||
Research and development | 45.5 | — | 45.5 | 45.7 | (0.2 | ) | 45.5 | |||||||||||||||||
General and administrative | 32.5 | 0.1 | 32.6 | 33.4 | — | 33.4 | ||||||||||||||||||
Total operating expenses | 149.0 | (0.6 | ) | 148.4 | 142.6 | 0.6 | 143.2 | |||||||||||||||||
Income from operations | 46.3 | (0.3 | ) | 46.0 | 45.8 | (0.6 | ) | 45.2 | ||||||||||||||||
Income before provision for income taxes | 46.2 | (0.3 | ) | 45.9 | 45.7 | (0.6 | ) | 45.1 | ||||||||||||||||
Income tax provision | 16.4 | 0.3 | 16.7 | 17.2 | 0.4 | 17.6 | ||||||||||||||||||
Net income | 29.8 | (0.6 | ) | 29.2 | 28.5 | (1.0 | ) | 27.5 | ||||||||||||||||
Earnings per share | ||||||||||||||||||||||||
Basic | $ | 0.69 | $ | (0.01 | ) | $ | 0.68 | $ | 0.67 | $ | (0.03 | ) | $ | 0.64 | ||||||||||
Diluted | $ | 0.68 | $ | (0.01 | ) | $ | 0.67 | $ | 0.65 | $ | (0.02 | ) | $ | 0.63 | ||||||||||
Blackbaud, Inc.
Notes to consolidated financial statements—(Continued)
Revised consolidated statements of cash flow amounts
| Year ended December 31, 2010 | Year ended December 31, 2009 | |||||||||||||||||||||||
| (in millions) | As previously reported | Adjustment | As revised | As previously reported | Adjustment | As revised | ||||||||||||||||||
Net income | $ | 29.8 | $ | (0.6 | ) | $ | 29.2 | $ | 28.5 | $ | (1.0 | ) | $ | 27.5 | ||||||||||
Adjustments to reconcile net income to net cash provided by operating activities: | ||||||||||||||||||||||||
Depreciation and amortization | 16.1 | 0.1 | 16.2 | 15.5 | 0.1 | 15.6 | ||||||||||||||||||
Stock-based compensation expense | 13.1 | — | 13.1 | 12.3 | 0.1 | 12.4 | ||||||||||||||||||
Excess tax benefits from stock-based compensation | (2.6 | ) | (0.1 | ) | (2.7 | ) | (2.4 | ) | — | (2.4 | ) | |||||||||||||
Deferred taxes | 11.2 | 0.1 | 11.3 | 12.4 | 0.1 | 12.5 | ||||||||||||||||||
Changes in assets and liabilities, net of acquisition of businesses: | ||||||||||||||||||||||||
Accounts receivable | (13.1 | ) | 0.3 | (12.8 | ) | 1.4 | 0.1 | 1.5 | ||||||||||||||||
Prepaid expenses and other assets | (9.6 | ) | (0.5 | ) | (10.1 | ) | 2.1 | 1.0 | 3.1 | |||||||||||||||
Trade accounts payable | 0.2 | — | 0.2 | (0.3 | ) | (0.1 | ) | (0.4 | ) | |||||||||||||||
Accrued expenses and other current liabilities | (4.8 | ) | 0.6 | (4.2 | ) | 0.6 | (0.4 | ) | 0.2 | |||||||||||||||
Deferred revenue | 12.9 | 0.2 | 13.1 | 13.2 | — | 13.2 | ||||||||||||||||||
Net cash provided by operating activities | 55.9 | 0.1 | 56.0 | 86.8 | 0.1 | 86.9 | ||||||||||||||||||
Capitalized software development costs | — | (0.2 | ) | (0.2 | ) | — | — | — | ||||||||||||||||
Net cash used in investing activities | (18.2 | ) | (0.2 | ) | (18.4 | ) | (7.8 | ) | — | (7.8 | ) | |||||||||||||
Excess tax benefits from stock-based compensation | 2.6 | 0.1 | 2.7 | 2.4 | — | 2.4 | ||||||||||||||||||
Net cash used in financing activities | (32.7 | ) | — | (32.7 | ) | (73.2 | ) | — | (73.2 | ) | ||||||||||||||
| 2. | Significant accounting policies |
Use of estimates
The preparation of financial statements in conformity with U.S. GAAP requires management to make estimates and assumptions. These estimates and assumptions affect the reported amounts of assets and liabilities and disclosure of contingent assets and liabilities at the date of the financial statements, as well as the reported amounts of revenues and expenses during the reporting periods. Areas of the financial statements where estimates may have the most significant effect include revenue recognition, the allowance for sales returns and doubtful accounts, valuation of long-lived and intangible assets and goodwill, stock-based compensation, andthe provision for income taxes and valuation ofrequired on deferred tax assets. Changes in the facts or circumstances underlying these estimates could result in material changes and actual results could materially differ from these estimates.
Blackbaud, Inc.
Notes to consolidated financial statements—(Continued)
Revenue recognition
The Company’s revenue is primarily generated from the following sources: (1) selling perpetual licenses of its software products; (2) providing professional services including implementation, training, consulting, hosting and other services; (3) providing software maintenance and support services; and (4) charging for the use of its software products in a hosted environment.environment; (3) providing professional services including implementation, training, consulting, analytic, hosting and other services; and (4) providing software maintenance and support services.
License fees
The Company recognizes revenue from the sale of perpetual software license rights when all of the following conditions are met:
persuasivePersuasive evidence of an arrangement exists;
theThe product has been delivered;
theThe fee is fixed or determinable; and
collectionCollection of the resulting receivable is probable.
Blackbaud, Inc.
Notes to consolidated financial statements—(Continued)
The Company deems acceptance of an agreement to be evidence of an arrangement. Delivery occurs when the product is shipped or transmitted, and title and risk of loss have transferred to the customers. The Company’s typical license agreement does not include customer acceptance provisions; however, if acceptance provisions are provided, delivery is deemed to occur upon acceptance. The Company considers the fee to be fixed or determinable unless the fee is subject to refund or adjustment or is not payable within the Company’s standard payment terms. Payment terms greater than 90 days are considered to be beyond the Company’s customary payment terms. Collection is deemed probable if the Company expects that the customer will be able to pay amounts under the arrangement as they become due. If the Company determines that collection is not probable, it defers revenue recognition until collection.
The Company sells software licenses with maintenance, varying levels of professional services and, in certain instances, with hosting services. The Company allocates revenue to delivered components, normally the license component of the arrangement, using the residual value method based on objective evidence of the fair value of the undelivered elements, which is specific to the Company. Fair value for maintenance services associated with software licenses is based upon renewal rates stated in the agreements with customers, which vary according to the level of support service provided under the maintenance program. Fair value of professional services and other products and services is based on sales of these products and services to other customers when sold on a stand-alone basis. When a software license is sold with software customization services, generally the services are to provide customer support for assistance in creating special reports and other enhancements that will assist with efforts to improve operational efficiency and/or to support business process improvements. These services are not essential to the functionality of the software. However, when software customization services are considered essential to the functionality of the software, the Company recognizes revenue for both the software license and the services on a percent-complete basis.
Subscriptions
The Company provides hosting services to customers who have purchased perpetual rights to certain of its software products (hosting services). Revenue from hosting services, as well as data enrichment services, data management services and online training programs is recognized ratably over the service period of the contract, which generally ranges from one to three years, upon deployment and use of the service. Any related set-up fees are recognized ratably over the estimated period that the customer benefits from the related fees.
Blackbaud, Inc.
Notes to consolidated financial statements—(Continued)
The Company makes certain of its software products available for use in hosted application arrangements without licensing perpetual rights to the software (hosted applications). Revenue from hosted applications is recognized over the subscription service period, which generally ranges from one to three years, upon deployment and use of the hosted application. Any related upfront activation, set-up or implementation fees are recognized ratably over the estimated period that the customer benefits from the related fees. Direct and incremental costs relating to activation, set-up and implementation for hosted applications are capitalized until the hosted application is deployed and in use, and then expensed over the estimated period that the customer benefits from the related fees.
For arrangements that have multiple elements and do not include software licenses, the Company allocates arrangement consideration at the inception of the arrangement to those elements that qualify as separate units of accounting. The arrangement consideration is allocated to the separate units of accounting based on relative selling price method in accordance with the selling price hierarchy, which includes: (i) vendor specific objective evidence (VSOE) if available; (ii) third party evidence (TPE) if VSOE is not available; and (iii) best estimate of selling price if neither VSOE nor TPE is available. In general, the Company uses VSOE to allocate the selling price to subscription and service deliverables.
Revenue from transaction processing fees is recognized when received. Credit card fees directly associated with processing donations for customers are included in subscriptions revenue, net of related transaction costs.
Services
The Company generally bills consulting, installation and implementation services based on hourly rates plus reimbursable travel-related expenses. Revenue is recognized for these services over the period the services are performed. For service engagements of less than $10,000, the Company frequently contracts for and bills based on a fixed fee plus reimbursable travel-related expenses. The Company recognizes this revenue upon completion of the work performed.
The Company recognizes analytic services revenue from donor prospect research engagements, the sale of lists of potential donors, benchmarking studies and data modeling service engagements upon delivery.
The Company sells training at a fixed rate for each specific class, at a per attendee price or at a packaged price for several attendees, and revenue is recognized only upon the customer attending and completing training. Additionally, the Company sells a fixed-rate program,programs, which permitspermit customers to attend unlimited training over a specified contract period, typically one year, subject to certain restrictions, and revenue is recognized ratably over this contract period.
Maintenance
The Company recognizes revenue from maintenance services ratably over the contract term, which is typically one year. Maintenance contracts are at rates that vary according to the level of the maintenance program and are generally renewable annually. Maintenance contracts also include the right to unspecified product upgrades on an if-and-when available basis. Certain support services are sold in prepaid units of time and recognized as revenue upon their usage.
Blackbaud, Inc.
Notes to consolidated financial statements—(Continued)
Subscriptions
The Company provides hosting services to customers who have purchased perpetual rights to certain of its software products (hosting services). Revenue from hosting services, as well as data enrichment services, data management services and online training programs is recognized ratably over the service period of the contract. Any related set-up fees are also recognized ratably over the service period of the contract.
The Company is increasingly making certain of its software products available for use in hosted application arrangements without licensing perpetual rights to the software (hosted applications). Revenue from hosted applications is recognized over the subscription agreement, which generally ranges from one to three years. For contractual arrangements covering the use of hosted applications the stand alone value of the delivered items or the fair value of undelivered items in the arrangement have not been established. Such items include upfront activation, implementation and hosting of the solution. For these arrangements the Company treats the transaction as a single element and the revenue is deferred until the hosted application is deployed and in use, at which time revenue is recognized over the remaining term of the arrangement. Direct and incremental costs relating to activation and implementation are capitalized until the hosted application is deployed and in use, and then expensed over the remaining term of the arrangement.
Revenue from transaction processing fees is recognized when received. Credit card fees directly associated with processing donations for customers are included in subscription revenue, net of related transaction costs.
Deferred revenue
To the extent that the Company’s customers are billed or pay for the above described services in advance of delivery, the Company records such amounts in deferred revenue.
Blackbaud, Inc.
Notes to consolidated financial statements—(Continued)
Reimbursable travel expense
The Company expenses reimbursable travel costs as incurred and includes them in cost of other revenue. The reimbursement of these costs by the Company’s customers is included in other revenue.
Sales taxes
The Company presents sales taxes and other taxes collected from customers and remitted to governmental authorities on a net basis and, as such, excludes them from revenues.
Shipping and handling
The Company expenses shipping and handling costs as incurred and includes them in cost of other revenue. The reimbursement of these costs by the Company’s customers is included in other revenue.
Cash and cash equivalents
The Company considers all highly liquid investments purchased with a maturity of three months or less to be cash equivalents.
Donor restricted cash and donations payable
Restricted cash consists of donations collected by the Company and payable to its customers, net of the associated transaction fees earned. Monies associated with donations payable are segregated in a separate bank account and used exclusively for the payment of donations payable. This usage restriction is either legally or internally imposed and reflects the Company’s intention with regard to such deposits.
Concentration of Credit Risk
Financial instruments that potentially subject the Company to concentrations of credit risk consist of cash and cash equivalents, donor restricted cash and accounts receivable. The Company’s cash and cash equivalents and donor restricted cash are placed with high credit-quality financial institutions. The Company’s accounts receivable are derived from sales to its customers who primarily operate in the nonprofit sector. With respect to accounts receivable, the Company performs ongoing evaluations of its customers and maintains an allowance for doubtful accounts based on historical experience and the Company’s expectations of future losses. As of and for the years ended December 31, 2011, 2010 and 2009, there were no significant concentrations with respect to the Company’s consolidated revenues or accounts receivable.
Property and equipment
The Company records property and equipment at cost and depreciates them over their estimated useful lives using the straight-line method. Property and equipment subject to capital leases are depreciated over the lesser of the term of the lease or the estimated useful life of the asset. Upon retirement or sale, the cost of assets disposed of and the related accumulated depreciation are removed from the accounts and any resulting gain or loss is credited or charged to income. Repair and maintenance costs are expensed as incurred.
Blackbaud, Inc.
Notes to consolidated financial statements—(Continued)
Construction-in-progress represents purchases of computer software and hardware associated with new internal system implementation projects which had not been placed in service at the respective balance sheet dates. TheseThe Company transferred these assets are transferred to the applicable property category on the date they are placed in service. There was no capitalized interest applicable to construction-in-progress for the years ended December 31, 20092011 and 2008.2010.
Blackbaud, Inc.
Notes to consolidated financial statements—(Continued)
The Company capitalizes certain costs related to the development or purchase of software for use in the Company’s internal operations. Any amounts capitalized are included in computer software costs and amortized over the expected useful life. Costs incurred for upgrades and enhancements, which will not result in additional functionality, are expensed as incurred.
Goodwill
Goodwill represents the purchase price in excess of the net amount assigned to assets acquired and liabilities assumed by the Company primarily asin a result of the acquisition of Target Software, Inc. and Target Analysis Group, Inc. (together referred to as the Target Companies), eTapestry.com (referred to as eTapestry) and Kintera, Inc. (referred to as Kintera).business combination. Goodwill is allocated to reporting units which are defined as the Company’s operating segments, and tested annually for impairment. The Company’s reporting units are its four reportable segments and its payment processing operations. The Company will also test goodwill for impairment between annual impairment tests if indicators of potential impairment exist. The Company first assesses qualitative factors to determine whether it is more likely than not that the fair value of a reporting unit is less than its carrying amount. To the extent the qualitative factors indicate that the fair value is more likely than not less than the carrying amount, the Company compares the fair value of the reporting unit with its carrying amount. If the carrying amount exceeds its fair value, impairment is indicated. The 2011 annual impairment test indicated the estimated fair value of the reporting units significantly exceeded the carrying value. There was no impairment of goodwill during 2009, 20082011, 2010 or 2007.2009.
Intangible assets
The Company amortizes finite-lived intangible assets over their estimated useful lives as follows.
| Basis of amortization | Amortization (in years) | |||||||
Customer relationships | Straight-line and | (1) | 4-15 | |||||
Marketing assets | Straight-line | 2-8 | ||||||
Acquired software | Straight-line | 2-10 | ||||||
Non-compete agreements | Straight-line | 2-5 | ||||||
Database | Straight-line | 8 | ||||||
| (1) | Certain of the customer relationships |
Indefinite-lived intangible assets consist of tradenames. The Company evaluates the recoverabilitypotential for impairment of finite and indefinite-lived intangible assets periodically and takes into account events or circumstances that warrantindicate revised estimates of useful lives or that indicate anthe carrying amount may not be recoverable. If the carrying amount is no longer recoverable based upon the undiscounted cash flows of the asset, the amount of impairment may exist. A substantial portionis the difference between the carrying amount and the fair value of the asset. Substantially all of the Company’s intangible assets waswere acquired in business combinations. There was no impairment of intangible assets during 2009, 20082011, 2010 or 2007.2009.
Cost method investments
Cost method investments included in other assets consist of investments in privately held companies where the Company does not have the ability to exercise significant influence or have control over the investee. The Company records these investments at cost and periodically tests them for other-than-temporary impairment. During the year ended December 31, 2011, the Company determined that its cost method investment had other-than-temporary impairment based the projected liquidity of the investment. The impairment of $1.8 million was recorded in income from operations. The Company used the income approach to determine the fair value of the investment in determining the impairment.
Blackbaud, Inc.
Notes to consolidated financial statements—(Continued)
Fair value of financial instruments
The fair value of a financial instrument is the amount at which the instrument could be exchanged between willing parties other than in a forced sale or liquidation. The financial instruments of the Company consist primarily of cash and cash equivalents, accounts receivable and accounts payable and debt at December 31, 20092011 and 2008.2010. The Company believes that the carrying amounts of these financial instruments approximate their fair values at December 31, 20092011 and 2008,2010, due to the immediate or short-term maturity of these financial instruments.
Blackbaud, Inc.
Notes to consolidated financial statements—(Continued)
Deferred financing costs
Deferred financing costs included in other assets represent the direct costs of entering into the Company’s revolving credit facility in July 2007 and increasing the available funds under the credit facility in June 2008.2011. These costs are amortized as interest expense using the effective interest method. The deferred financing fees are being amortized over the term of the credit facility.
Stock-based compensation
Stock-based compensation cost is measured at the grant date based on the fair value of the award and is recognized as expense over the requisite service period, which is the vesting period. Stock-based compensation cost arising from stock option grants isand awards with performance or market conditions are recognized using the accelerated method. Costs arising from restricted stock and stock appreciation right grants are recognized on a straight-line basis.
Income taxes
Prior to October 13, 1999, the Company was organized as an S corporation under the Internal Revenue Code and, therefore, was not subject to federal income taxes. The Company historically made distributions to its stockholders to cover the stockholders’ anticipated tax liability. In connection with its 1999 recapitalization, the Company converted its U.S. taxable status from an S corporation to a C corporation and, accordingly, since October 14, 1999, has been subject to federal and state income taxes. Upon this conversion and as a result of the recapitalization, the Company recorded a one-time benefit of $107.0 million to establish a deferred tax asset. This amount was recorded as a direct increase to equity in the statements of stockholders’ equity. The Company has not recorded a valuation allowance against this deferred tax asset as of December 31, 20092011 or 2008,2010, as the Company believes it is more-likely-than-not that it will be able to utilize this benefit, which is dependent upon the Company’s ability to generate future taxable income. The amount of deferred tax asset related to this matter at December 31, 20092011, was $35.9$20.9 million.
The Company adopted a new incomerecognizes tax standard forbenefits arising from uncertain tax positions on January 1, 2007 under which a tax benefit from an uncertain tax position is recognized only if it is more-likely-than-not that the tax position will be sustained on examination by the taxing authorities, based on the technical merits of the position. The tax benefits recognized in the financial statements from such positions are measured based on the largest benefit that has a greater than 50% likelihood of being realized upon ultimate resolution. Penalties and interest accrued related to unrecognized tax benefits are recognized in the provision for income taxes.
Significant judgment is required in determining the provision for income taxes. The Company records its tax provision at the anticipated tax rates based on estimates of annual pretax income. To the extent that the final results differ from these estimated amounts that were initially recorded, such differences will impact the income tax provision in the period in which such determination is made and could have an impact on the deferred tax asset. The Company’s deferred tax assets and liabilities are recorded at an amount based upon a U.S. federal income tax rate of 35.0% and appropriate statutory rates of various foreign, state and local jurisdictions in which
Blackbaud, Inc.
Notes to consolidated financial statements—(Continued)
the Company operates. If the Company’s tax rates change, the deferred tax assets and liabilities will be adjusted to an amount reflecting those income tax rates. If such change is determined to be appropriate, it will affect the provision for income taxes during the period that the determination is made.
The Company assesses the likelihood that its deferred tax assets will be recovered from future taxable income. To the extent recovery is not likely, a valuation allowance is established. To the extent a valuation allowance is established, the Company includes an expense within the income tax provision. The Company’s valuation allowance of $8.0$10.1 million at December 31, 20092011, was primarily associated with deferred tax assets for certain
Blackbaud, Inc.
Notes to consolidated financial statements—(Continued)
state income tax credits, and net operating loss carryforwards and capital loss carryforwards that it has determined are not more-likely-than-not to be realized. The Company will continue to evaluate the realizability of the remaining deferred tax assets, and any further adjustment to the valuation allowance will be made in the period the Company determines it is more-likely-than-not that any of the remaining amounts will not be utilized.
Foreign currency
Net assets recorded in a foreign currency are translated at the exchange rate on the balance sheet date. Revenue and expense items are translated at the average exchange rate for the year. The resulting translation adjustments are recorded in accumulated other comprehensive income net of tax.income.
Gains and losses resulting from foreign currency transactions denominated in currency other than the functional currency are recorded at the approximate rate of exchange at the transaction date. For the years ended December 31, 2009, 20082011, 2010 and 2007,2009, the Company recorded net foreign currency gain of $0.2$0.3 million, loss of $0.2$0.1 million and loss of $0.5$0.2 million, respectively, and these amounts are included in other expense, net.
Research and development
Research and development costs are expensed as incurred. These costs include salaries and related human resource costs, third-party contractor expenses, software development tools, an allocation of facilities and depreciation expenses and other expenses in developing new products and upgrading and enhancing existing products.
Software development costs
Capitalization of software development costs begins upon the establishment of technological feasibility, subject to net realizable value considerations. To date, the point in time of achieving technological feasibility and the general availability of such software has substantially coincided; therefore,Capitalized software development costs qualifying for capitalization have been immaterial. Accordingly,are reported at the Company has not capitalized anylower of unamortized cost or estimated net realizable value. At December 31, 2011 and 2010, software development costs, net of accumulated amortization, were $1.1 million and $0.2 million, respectively, and are included in other assets on the consolidated balance sheet. Capitalized software development costs are amortized over the estimated product life (typically three years) on a straight line-basis. Amortization expense related to software development costs of approximately $0.1 million was recorded in each of the years ended December 31, 2011, 2010 and 2009, and was included in cost of license fees in the consolidated statement of operations. The Company analyzes the net realizable value of capitalized software development costs on an annual basis and has charged all such costs to research and development expense.determined there is no indication of impairment.
Sales returns and allowance for doubtful accounts
The Company provides customers a 30-day right of return and under certain circumstances provides service related credits to its customers. The Company maintains a reserve for returns and credits which is estimated
Blackbaud, Inc.
Notes to consolidated financial statements—(Continued)
based on several factors including historical experience, known credits yet to be issued and existing economic conditions.the nature of service level commitments. Provisions for sales returns and credits are charged against the related revenue items.
In addition, the Company records an allowance for doubtful accounts that reflects estimates of probable credit losses. This assessment is based on several factors including aging of customer accounts, known customer specific risks, historical experience and existing economic conditions. Accounts are charged against the allowance after all means of collection are exhausted and recovery is considered remote. Provisions for doubtful accounts are recorded in general and administrative expense.
Blackbaud, Inc.
Notes to consolidated financial statements—(Continued)
Below is a summary of the changes in the Company’s allowance for doubtful accounts.
Years ended December 31, (in thousands) | Balance at beginning of year | Acquired through business combinations | Provision/ adjustment | Write-off | Balance at end of year | Balance at beginning of year | Provision/ adjustment | Write-off | Balance at end of year | ||||||||||||||||||||||||
2011 | $ | 424 | $ | 27 | $ | (190 | ) | $ | 261 | ||||||||||||||||||||||||
2010 | 760 | (227 | ) | (109 | ) | 424 | |||||||||||||||||||||||||||
2009 | $ | 1,013 | $ | — | $ | (47 | ) | $ | (206 | ) | $ | 760 | 1,013 | (47 | ) | (206 | ) | 760 | |||||||||||||||
2008 | 308 | 268 | 560 | (123 | ) | 1,013 | |||||||||||||||||||||||||||
2007 | 335 | 57 | (14 | ) | (70 | ) | 308 | ||||||||||||||||||||||||||
Below is a summary of the changes in the Company’s allowance for sales returns.
Years ended December 31, (in thousands) | Balance at beginning of year | Acquired through business combinations | Provision/ adjustment | Write-off | Balance at end of year | Balance at beginning of year | Provision/ adjustment | Write-off | Balance at end of year | |||||||||||||||||||||||
2011 | $ | 2,263 | $ | 5,619 | $ | (4,230 | ) | $ | 3,652 | |||||||||||||||||||||||
2010 | 2,799 | 3,000 | (3,536 | ) | 2,263 | |||||||||||||||||||||||||||
2009 | $ | 1,764 | $ | — | $ | 3,505 | $ | (2,470 | ) | $ | 2,799 | 1,764 | 3,505 | (2,470 | ) | 2,799 | ||||||||||||||||
2008 | 1,627 | 61 | 3,619 | (3,543 | ) | 1,764 | ||||||||||||||||||||||||||
2007 | 933 | 95 | 2,675 | (2,076 | ) | 1,627 | ||||||||||||||||||||||||||
Sales commissions
The Company pays sales commissions at the time contracts with customers are signed or shortly thereafter, depending on the size and duration of the sales contract. To the extent that these commissions relate to revenue not yet recognized, the amounts are recorded as deferred sales commission costs. Subsequently, the commissions are recognized as expense as the revenue is recognized.
Below is a summary of the changes in the Company’s deferred sales commission costs included in prepaid expenses and other current assets.
Years ended December 31, (in thousands) | Balance at beginning of year | Additions | Expense | Balance at end of year | Balance at beginning of year | Additions | Expense | Balance at end of year | |||||||||||||||||||||
2011 | $ | 11,548 | $ | 18,415 | $ | (13,511 | ) | $ | 16,452 | ||||||||||||||||||||
2010 | 5,108 | 12,985 | (6,545 | ) | 11,548 | ||||||||||||||||||||||||
2009 | $ | 3,047 | $ | 6,994 | $ | (4,028 | ) | $ | 6,013 | 2,879 | 6,994 | (4,765 | ) | 5,108 | |||||||||||||||
2008 | 1,903 | 5,699 | (4,555 | ) | 3,047 | ||||||||||||||||||||||||
2007 | 588 | 5,335 | (4,020 | ) | 1,903 | ||||||||||||||||||||||||
Advertising costs
The Company expenses advertising costs as incurred, which werewas $1.1 million, $1.3 million, and $0.7 million for the years ended December 31, 2009, 20082011, 2010 and 2007, respectively.2009.
Blackbaud, Inc.
Notes to consolidated financial statements—(Continued)
Impairment of long-lived assets
The Company reviews long-lived assets for impairment when events change or circumstances indicate the carrying amount may not be recoverable. If such events or changes in circumstances are present, the undiscounted cash flow method is used to determine whether the asset is impaired. No impairment of long-lived assets resulted in 2009, 20082011, 2010 or 2007.
Blackbaud, Inc.
Notes to consolidated financial statements—(Continued)
Shipping and handling
The Company expenses shipping and handling costs as incurred and includes them in cost of other revenue. The reimbursement of these costs by the Company’s customers is included in other revenue.2009.
Earnings per share
The Company computes basic earnings per share by dividing net income available to common stockholders by the weighted average number of common shares outstanding. Diluted earnings per share is computed by dividing net income available to common stockholders by the weighted average number of common shares and dilutive potential common shares then outstanding. Diluted earnings per share reflect the assumed conversion of all dilutive securities using the treasury stock method. Dilutive potential common shares consist of shares issuable upon the exercise of stock options, shares of non-vested restricted stock and settlement of stock appreciation rights and certain contingent liabilities that will be paid in sharesvesting of common stock.
Diluted earnings per share for the years ended December 31, 2009restricted stock awards and 2008 do not include the effect of 488,282 and 496,945 potential common share equivalents, respectively, as they are anti-dilutive. There were no anti-dilutive common share equivalents for the year ended December 31, 2007.units.
The following table sets forth the computation of basic and diluted earnings per share:
| Years ended December 31, | Years ended December 31, | ||||||||||||||||||||
| (in thousands, except share and per share amounts) | 2009 | 2008 | 2007 | 2011 | 2010 | 2009 | |||||||||||||||
Numerator: | |||||||||||||||||||||
Net income | $ | 28,447 | $ | 29,878 | $ | 31,724 | $ | 33,220 | $ | 29,187 | $ | 27,520 | |||||||||
Denominator: | |||||||||||||||||||||
Weighted average common shares | 42,771,173 | 42,958,947 | 43,619,158 | 43,522,563 | 43,145,189 | 42,771,173 | |||||||||||||||
Add effect of dilutive securities: | |||||||||||||||||||||
Employee stock-based compensation | 828,875 | 999,610 | 976,325 | 626,491 | 730,966 | 828,875 | |||||||||||||||
|
| ||||||||||||||||||||
Weighted average common shares assuming dilution | 43,600,048 | 43,958,557 | 44,595,483 | 44,149,054 | 43,876,155 | 43,600,048 | |||||||||||||||
|
| ||||||||||||||||||||
Earnings per share: | |||||||||||||||||||||
Basic | $ | 0.67 | $ | 0.70 | $ | 0.73 | $ | 0.76 | $ | 0.68 | $ | 0.64 | |||||||||
Diluted | $ | 0.65 | $ | 0.68 | $ | 0.71 | $ | 0.75 | $ | 0.67 | $ | 0.63 | |||||||||
The following shares underlying stock-based awards were not included in diluted earnings per share because their inclusion would have been anti-dilutive:
| Years ended December 31, | ||||||||||||
| 2011 | 2010 | 2009 | ||||||||||
Shares excluded from calculations of diluted EPS | 422,418 | 221,742 | 488,282 | |||||||||
Recently adopted accounting pronouncements
In June 2009, the FASB issued theFASB Accounting Standards CodificationTM and the Hierarchy of Generally Accepted Accounting Principles, which establishes the FASB Accounting Standards Codification (ASC) as the source of authoritative accounting principles recognized by the FASB to be applied in the preparation of financial statements in conformity with generally accepted accounting principles. The ASC is not intended to change U.S. GAAP, but significantly changes the way in which the accounting literature is organized and the way U.S. GAAP is referenced by companies in their financial statements and accounting policies. The ASC became effective in the third quarter of 2009. The adoption of the ASC did not have an impact on the Company’s consolidated financial statements.
Effective January 1, 2009,2011, the Company adopted ASC 805 (formerly SFAS No. 141 (revised 2007)), “Business Combinations” (ASC 805). ASC 805 establishes principles and requirements for how an acquirer recognizes and measures in its financial statements the identifiable assets acquired, the liabilities assumed, any noncontrolling
Blackbaud, Inc.
Notes to consolidated financial statements—(Continued)
interest in the acquiree and the goodwill acquired. ASC 805 also established disclosure requirements to enable the evaluation of the nature and financial effects of the business combination. ASC 805 applies to business combinations for which the acquisition date is on or after January 1, 2009. The extent of the impact of ASC 805 on future acquisitions depends on the size and nature of the acquisitions. At the time of adoption on January 1, 2009, ASC 805 did not have a material impact on the Company’s consolidated financial statements. During the year ended December 31, 2009, the Company expensed acquisition related costs of $0.2 million that prior to the adoption of ASC 805 would have been included in the cost of the acquisition.
Recently issued accounting pronouncements
In October 2009, the FASB released Accounting Standards Update (ASU) 2009-13, which amends the existing criteria for separating consideration in multiple-deliverable arrangements. Arrangements that include perpetual software licenses are excluded from the scope of this ASU. ASU 2009-13 establishes a hierarchy for determining the selling price of a deliverable and requires the use of best estimate of the selling price when VSOE or third party evidence (TPE)TPE of the selling price cannot be determined. As a result of the requirement to use the best estimate of the selling price when vendor specific objective evidenceVSOE or third party evidenceTPE of the selling price cannot be determined, the residual method willis no longer be
Blackbaud, Inc.
Notes to consolidated financial statements—(Continued)
permitted. ASU 2009-13 is applicable prospectively for revenue arrangements entered into or materially modified after the adoption datedate. The adoption of ASU 2009-13 did not have a material impact on the Company’s consolidated financial statements.
Effective December 31, 2011, the Company adopted ASU 2011-08, which simplifies how entities test goodwill for impairment. ASU 2011-08 permits an entity to first assess qualitative factors to determine whether it is more likely than not that the fair value of a reporting unit is less than its carrying amount as a basis for determining whether it is necessary to perform the two-step goodwill impairment test. The adoption of ASU 2011-08 did not have a material impact on the Company’s consolidated financial statements.
Recently issued accounting pronouncements
In June 2011, the FASB issued ASU 2011-05,Comprehensive Income (Topic 220): Presentation of Comprehensive Income, which (1) eliminates the option to present components of other comprehensive income, or retrospectively for all periods presented.OCI, as part of the statement of changes in stockholders’ equity, (2) requires the presentation of each component of net income and each component of OCI either in a single continuous statement or in two separate but consecutive statements and (3) also requires presentation of reclassification adjustments on the face of the financial statements. The Company is required to adopt ASU 2009-132011-05 on January 1, 2011.2012. Early adoption is permitted. The Company is currently evaluatingdoes not believe the impactadoption of ASU 2009-132011-05 will have a material effect on its consolidated financial statements.
| Business combinations |
RLC
On April 29, 2009, the Company acquired all of the outstanding stock of RLC Customer Centric Technology B.V. (RLC), a privately held limited liability company based in the Netherlands, for €1.8 million in cash, or the equivalent of $2.4 million based on the foreign exchange rate at the time of the acquisition. The Company will also pay a maximum of €400,000, orcompleted the equivalent of $0.5 million based onbusiness acquisitions described below during the foreign exchange rate at the time of the acquisition, in earn-out payments if RLC meets revenue and EBITDA margin targets, as defined in the agreement, over the two years subsequent to the acquisition. RLC is a leading provider of software and services to nonprofits in the Netherlands. The acquisition of RLC provides the Company with a foundation to expand into the Netherlands and other Western European markets.year ended December 31, 2011. The results of operations for each of RLCthem are included in the consolidated financial statements of the Company from the date of acquisition. The fair values assigned to the identifiable intangible assets acquired were based on estimates and assumptions determined by management.
Everyday Hero
On October 6, 2011, the Company acquired all of the outstanding capital stock of Everyday Hero Pty. Ltd. (EDH), a privately-owned company based in Brisbane, Australia, for $7.6 million in cash. The acquisition of EDH provided the Company additional capabilities in the area of online event fundraising software solutions for nonprofit organizations including donation processing. During 2009,2011, total revenue from EDH operations included in the RLCCompany’s results of operations was $1.7$0.8 million and cost of revenue was $0.9$0.3 million.
Blackbaud, Inc.
Notes to consolidated financial statements—(Continued)
the tangible and identifiable intangible assets acquired and liabilities assumed based on their estimated fair values on the date of acquisition. The Company recorded the purchase price allocation based onexcess of consideration over the estimatedaggregate fair valuevalues as goodwill. Using information available at the time the acquisition closed, the Company allocated $0.5 million of the consideration to net tangible assets acquired and liabilities assumed. The following table summarizes the allocation$6.2 million of the purchase price:
| (in thousands) | ||||
Cash and cash equivalents | $ | 110 | ||
Accounts receivable | 374 | |||
Other assets, current and noncurrent | 165 | |||
Property and equipment | 188 | |||
Intangibles | 840 | |||
Goodwill | 1,610 | |||
Trade accounts payable | (118 | ) | ||
Accrued expenses and other current liabilities | (179 | ) | ||
Deferred revenue, current and noncurrent | (200 | ) | ||
Deferred tax liability, current and noncurrent | (214 | ) | ||
Contingent consideration liability | (208 | ) | ||
| $ | 2,368 | |||
Noneconsideration to identified intangible assets. The identified intangible assets are being amortized over a weighted average life of 10 years. The Company recorded the excess consideration of $0.9 million as goodwill, arising in the acquisitionnone of which is deductible for income tax purposes. Goodwill was assigned to the license fees, consulting and education services, subscriptions and maintenance reportable segments. The recognition of goodwill was principally attributable to a trained workforce and the integration of the Company’s technology and products with RLC’sEDH’s operations which were considered in the purchase price. All of the goodwill is assigned to the IBU reporting segment.
Blackbaud, Inc.
Notes to consolidated financial statements—(Continued)
Pro forma results of operations for EDH have not been presented because the results of EDH are not material to the Company’s consolidated financial results.
Public Interest Data
On February 1, 2011, the Company acquired all of the outstanding stock of Public Interest Data, LLC (PIDI), a privately held limited liability company based in Virginia, for $16.6 million in cash. The acquisition resultedof PIDI provided the Company additional capabilities in the identificationarea of $0.8donor acquisition list analytics and should enhance the Company’s database management services offerings. The additional capabilities include the established process for delivering list analytic and data management services as well as the associated experienced workforce and technology. During the year ended December 31, 2011, total revenue from PIDI of $7.5 million and cost of intangible assets, allrevenue of $4.8 million was included in the Company’s results of operations. Acquisition-related costs of $1.0 million, which are subjectprimarily consisted of legal and financial advisory services, were expensed as incurred in general and administrative expense during the year ended December 31, 2011.
In addition to amortization onthe consideration paid at closing, the Company might be required to pay up to a straight-line basis.maximum of $2.5 million in additional cash consideration if PIDI meets revenue targets over the two years subsequent to the acquisition. A liability of $0.2$1.4 million was initially recognized for the estimated contingent consideration that will be paid based on a probability-weighted discounted cash flow valuation technique. AnyDuring the year ended December 31, 2011, the Company recognized $0.8 million of income, as a result of the change in the estimated fair value or any change upon final settlement, of the contingent consideration liability will beliability. This amount was recorded as a reduction of general and administrative expense.
The following table summarizes the allocation of the purchase price based on the estimated fair value of the assets acquired and liabilities assumed:
| (in thousands) | ||||
Cash and cash equivalents | $ | 91 | ||
Accounts receivable | 686 | |||
Other assets, current and noncurrent | 291 | |||
Property and equipment | 459 | |||
Intangibles | 7,390 | |||
Goodwill | 13,060 | |||
Trade accounts payable | (478 | ) | ||
Accrued expenses and other liabilities | (1,814 | ) | ||
Deferred tax liabilities, current and noncurrent | (3,099 | ) | ||
|
| |||
| $ | 16,586 | |||
Blackbaud, Inc.
Notes to consolidated financial statements—(Continued)
The estimated fair value of accounts receivable approximates contractual value. The goodwill recognized is attributable primarily to the assembled workforce of PIDI and the opportunities for expected synergies. None of the goodwill arising in the acquisition is deductible for income from operations.tax purposes. Goodwill of $12.3 million and $0.8 million was assigned to the Target Analytics and ECBU reporting segments, respectively. The acquisition resulted in the identification of the following finite-lived intangible assets:
| Intangible assets acquired (in thousands) | Weighted (in years) | |||||||
Customer relationships | $ | 5,150 | 15 | |||||
Marketing assets | 140 | 2 | ||||||
Acquired software | 1,550 | 8 | ||||||
Non-compete agreements | 550 | 4 | ||||||
|
| |||||||
| $ | 7,390 | |||||||
The fair value of the intangible assets was based on the income approach, which included both the relief of royalty and multi-period excess earnings methods. Customer relationships are amortized on an accelerated basis. Marketing assets, acquired software and non-compete agreements are amortized on a straight-line basis.
Pro forma results of operations for PIDI have not been presented because the results of PIDI are not material to the Company’s consolidated financial results.
Kintera2010 Acquisitions
On July 8, 2008,During the year ended December 31, 2010, the Company acquired Kintera, a publicly-traded company based in San Diego, California. Kintera is a leader in providing web-based, software-as-a-service solutions to the nonprofit market. The acquisitiontwo entities for total consideration of Kintera provides the Company with additional expertise in developing and delivering on-demand solutions and expands the Company’s online offerings. The Company acquired$5.3 million, all of the outstanding capital stock of Kintera through a tender offer, paying $1.12 per share for a total of $45.7 million. The Company financed this acquisition with cash on hand and borrowings under the Company’s revolving credit facility. The total purchase price of $50.2 million includes $2.4 millionwhich was paid in payments to Kintera management under change of control provisions, $1.9 million of direct acquisition-related costs and $0.2 million related to Kintera employee stock options assumed.cash. The results of operations of Kintera areacquired entities have been included in the consolidated financial statements of the Company from the date of acquisition.
Blackbaud, Inc.
Notes tothe consolidated financial statements—(Continued)
results of operations of the Company. The Company recorded the purchase price allocation is based on a valuation of the estimated fair value of the assets acquired and liabilities assumed in the acquisition of Kintera. The following table summarizes the final allocation of the purchase price:
| (in thousands) | ||||
Cash and cash equivalents | $ | 2,980 | ||
Accounts receivable | 4,479 | |||
Marketable securities | 1,575 | |||
Other assets, current and noncurrent | 9,428 | |||
Deferred tax assets, current and noncurrent | 26,420 | |||
Property and equipment | 3,834 | |||
Intangible assets | 16,950 | |||
Goodwill | 11,506 | |||
Trade accounts payable | (1,061 | ) | ||
Accrued expenses and other current liabilities | (15,095 | ) | ||
Deferred revenue, current and noncurrent | (7,871 | ) | ||
Debt, current and noncurrent | (2,973 | ) | ||
Total purchase price | $ | 50,172 | ||
assumed. None of the goodwill arising from the acquisitions completed in the acquisition2010 is deductible for income tax purposes. All segments were allocated a portion
2009 Acquisitions
During the year ended December 31, 2009, the Company acquired one entity for total consideration of the goodwill. The acquisition resulted in the identification of $16.9$2.4 million, of intangible assets, all of which are subject to amortization. The following table presents the amounts assigned to each intangible asset class:
Intangible assets (in thousands) | Weighted average amortization period (in years) | ||||
Marketing assets | $ | 740 | 8.0 | ||
Customer relationships | 12,100 | 10.8 | |||
Software | 4,110 | 7.4 | |||
Total | $ | 16,950 | 9.8 | ||
Customer relationships are amortized on an accelerated basis. Marketing assets and software are amortized on a straight-line basis.
In connection with the acquisition, the Company entered into employment agreements with certain members of Kintera’s management team that provided for the payment of bonuses totaling $449,000, payablewas paid in shares of the Company’s common stock based on continued employment. In February 2009, the Company issued 39,140 shares of common stock at a fair market value of $11.47 per share in connection with these employment agreements. In addition, the Company entered into an employment agreement with the former CEO of Kintera that included a targeted bonus payable in shares of the Company’s common stock conditioned upon his continued employment and achievement of certain performance targets. In August 2009, the Company issued 10,898 shares of common stock at a fair market value of $19.73 per share in connection with this bonus arrangement.
Blackbaud, Inc.
Notes to consolidated financial statements—(Continued)
eTapestry
On August 1, 2007, the Company acquired eTapestry, a privately-owned company based near Indianapolis, Indiana. eTapestry is a provider of an on-demand donor management and fundraising solution. The acquisition of eTapestry allows the Company to address a broader market opportunity by providing an on-demand solution that is suited for smaller organizations interested in a relatively low-cost offering and mid-sized nonprofits interested in a stand-alone fundraising solution deployed in an on-demand model. The Company acquired all of the outstanding capital stock of eTapestry for approximately $25.4 million in a cash transaction financed by a combination of cash on hand and borrowings under the Company’s revolving credit facility.cash. The results of operations of eTapestry areacquired entities have been included in the consolidated financial statements of the Company from the date of acquisition.
Pro forma results of operations have not been presented because the effects of these business combinations, individually and in the aggregate, were not material to the consolidated results of operations of the Company. The allocation ofCompany recorded the purchase price isallocation based on a valuation of the estimated fair value of the assets acquired and liabilities assumed in the acquisition of eTapestry. The following table summarizes the allocation of the purchase price:
| (in thousands) | ||||
Cash and cash equivalents | $ | 308 | ||
Accounts receivable | 1,095 | |||
Other current assets | 21 | |||
Property and equipment | 720 | |||
Intangible assets | 10,450 | |||
Goodwill | 18,428 | |||
Trade accounts payable | (137 | ) | ||
Accrued expenses and other current liabilities | (304 | ) | ||
Deferred revenue, current and noncurrent | (3,087 | ) | ||
Other liabilities, noncurrent | (39 | ) | ||
Net deferred tax liabilities, noncurrent | (2,026 | ) | ||
Total purchase price | $25,429 | |||
assumed. None of the goodwill arising from the acquisitions completed in the acquisition2009 is deductible for income tax purposes. The goodwill was principally allocated to the subscriptions and consulting and education services reportable segments. The acquisition resulted in the identification of $10.5 million of intangible assets, all of which are subject to amortization. The following table presents the amounts assigned to each intangible asset class:
| Intangible assets acquired (in thousands) | Weighted average amortization period (in years) | ||||
Customer relationships | $ | 6,100 | 10.0 | ||
Acquired software | 2,790 | 7.0 | |||
Marketing assets | 560 | 7.0 | |||
Non-compete agreements | 1,000 | 5.0 | |||
Total | $ | 10,450 | 8.6 | ||
In connection with the acquisition, the Company entered into employment agreements with certain members of eTapestry’s management team. Under these arrangements, an additional amount of up to $1.5 million was payable based upon performance of the acquired business for the two twelve-month periods ending September 30, 2009. Based on actual performance, the Company issued 44,763 shares of common stock at a fair
Blackbaud, Inc.
Notes to consolidated financial statements—(Continued)
market value of $22.34 and 42,262 shares of common stock at a fair market value of $11.83 during 2009 and 2008, respectively, under these employment agreements.
Target Companies
On January 16, 2007, the Company acquired the Target Companies, privately-owned affiliated companies based in Cambridge, Massachusetts. The acquired companies provide solutions that help organizations analyze, plan, forecast, execute, and manage high-volume fundraising campaigns while simultaneously helping them maintain long-term constituent relationships. The acquisition of the Target Companies significantly advances the Company’s strategic goal of providing a more complete set of solutions that meet both the fundraising and direct marketing needs of the nonprofit market. The Company acquired all of the outstanding capital stock of the Target Companies for approximately $58.7 million, including direct acquisition-related costs, in an all cash transaction that was financed by a combination of cash on hand and borrowings under the Company’s revolving credit facility. The results of operations of the Target Companies are included in the consolidated financial statements of the Company from the date of acquisition.
At the acquisition date, an additional amount of up to $2.4 million was contingently payable to the sellers under an earn-out arrangement based upon performance of the acquired businesses over the year subsequent to the acquisition. In 2008, the Company paid $2.3 million of contingent consideration in cash, which was recorded as an additional acquisition cost and increased the balance of goodwill. There is no further obligation in connection with the Target acquisition.
The allocation of the purchase price is based on a valuation of the fair value of the assets acquired and liabilities assumed in the acquisition of the Target Companies. The following table summarizes the allocation of the purchase price:
| (in thousands) | ||||
Cash and cash equivalents | $ | 507 | ||
Accounts receivable | 5,067 | |||
Other current assets | 278 | |||
Property and equipment | 2,291 | |||
Deferred tax assets | 738 | |||
Intangible assets | 22,323 | |||
Goodwill | 36,453 | |||
Trade accounts payable | (445 | ) | ||
Accrued expenses and other current liabilities | (3,243 | ) | ||
Deferred revenue, current and noncurrent | (1,807 | ) | ||
Loans from shareholders, current | (1,919 | ) | ||
Capital lease obligations, current and noncurrent | (1,510 | ) | ||
Total purchase price | $ | 58,733 | ||
Blackbaud, Inc.
Notes to consolidated financial statements—(Continued)
Of the total amount of goodwill arising in the acquisition, $35.8 million is expected to be deductible for income tax purposes. All reportable segments were allocated a portion of the goodwill. The acquisition resulted in the identification of $22.3 million of intangible assets, all of which are subject to amortization. The following table presents the amounts assigned to each intangible asset class:
| Intangible assets acquired (in thousands) | Weighted average amortization period (in years) | ||||
Customer relationships | $ | 13,627 | 12.7 | ||
Acquired software | 3,655 | 10.0 | |||
Database | 3,441 | 8.0 | |||
Marketing assets | 800 | 5.0 | |||
Non-compete agreements | 800 | 5.0 | |||
Total | $ | 22,323 | 11.0 | ||
Pro forma information (unaudited)
The following unaudited pro forma information presents the consolidated results of operations of the Company as if the acquisition of Kintera, eTapestry and the Target Companies had taken place at January 1, 2007. The pro forma information includes the historical operating results of the acquired companies and adjustments for the business combination effect of the amortization charges from acquired intangible assets, interest expense, interest income and related tax effects. The pro forma information does not necessarily reflect the actual results that would have occurred, nor is it necessarily indicative of future results of operations. The results of operations of RLC were not material to the Company’s consolidated results of operations, and thus pro-forma financial information is not presented.
| Years ended December 31, | ||||||
| (in thousands, except per share amounts) | 2008 | 2007 | ||||
Revenue | $ | 322,073 | $ | 307,902 | ||
Net income | $ | 22,728 | $ | 18,942 | ||
Earnings per share, basic | $ | 0.55 | $ | 0.43 | ||
Earnings per share, diluted | $ | 0.53 | $ | 0.42 | ||
3. Property and equipment
| 4. | Property and equipment |
Property and equipment as of December 31, 20092011 and 20082010 consisted of the following:
| Estimated useful life (years) | December 31, | |||||||||
| (in thousands) | 2009 | 2008 | ||||||||
Equipment | 3 - 5 | $ | 5,323 | $ | 5,824 | |||||
Computer hardware | 3 - 5 | 25,850 | 29,448 | |||||||
Computer software | 3 - 5 | 11,166 | 11,903 | |||||||
Construction in progress | — | 5,960 | 357 | |||||||
Furniture and fixtures | 5 - 7 | 4,891 | 5,229 | |||||||
Leasehold improvements | term of lease | 2,641 | 2,419 | |||||||
Total property and equipment | 55,831 | 55,180 | ||||||||
Less: accumulated depreciation | (33,324 | ) | (33,796 | ) | ||||||
Property and equipment, net of depreciation | $ | 22,507 | $ | 21,384 | ||||||
Blackbaud, Inc.
Notes to consolidated financial statements—(Continued)
Estimated (years) | December 31, | |||||||||||
| (in thousands) | 2011 | 2010 | ||||||||||
Equipment | 3 - 5 | $ | 2,809 | $ | 3,660 | |||||||
Computer hardware | 3 - 5 | 39,665 | 30,616 | |||||||||
Computer software | 3 - 5 | 9,660 | 10,982 | |||||||||
Construction in progress | — | 3,836 | 1,332 | |||||||||
Furniture and fixtures | 5 - 7 | 5,028 | 4,961 | |||||||||
Leasehold improvements | term of lease | 3,394 | 2,923 | |||||||||
|
| |||||||||||
Total property and equipment | 64,392 | 54,474 | ||||||||||
Less: accumulated depreciation | (29,995 | ) | (31,511 | ) | ||||||||
|
| |||||||||||
Property and equipment, net of depreciation | $ | 34,397 | $ | 22,963 | ||||||||
Depreciation expense was $9.4 million, $9.1 million and $8.4 million $6.9 million and $4.7 million for the years ended December 31, 2009, 20082011, 2010 and 2007,2009, respectively.
Property and equipment, net of depreciation, under capital leases at December 31, 20092011 and 2008 included the following amounts for assets under capital leases:2010 was not material.
| December 31, | ||||||||
| (in thousands) | 2009 | 2008 | ||||||
Equipment | $ | 50 | $ | 50 | ||||
Computer hardware | 1,185 | 1,185 | ||||||
Computer software | 255 | 255 | ||||||
Total property and equipment under capital leases | 1,490 | 1,490 | ||||||
Less: accumulated depreciation | (1,407 | ) | (1,054 | ) | ||||
Property and equipment under capital leases, net of depreciation | $ | 83 | $ | 436 | ||||
| Goodwill and other intangible assets |
As discussed in Note 15, the Company’s reportable segments changed during the year ended December 31, 2011. Goodwill has been reallocated among the new reportable segments as of December 31, 2010. The change in goodwill for each reportable segment during the yearsyear ended December 31, 2009 and 20082011, consisted of the following:
| (in thousands) | License fees | Consulting and education services | Analytic services | Maintenance | Subscriptions | Total | ||||||||||||||||||
Balance at December 31, 2007 | $ | 1,350 | $ | 13,405 | $ | 13,721 | $ | 6,009 | $ | 23,790 | $ | 58,275 | ||||||||||||
Additions related to business combinations | 86 | 567 | 182 | 2,497 | 9,816 | 13,148 | ||||||||||||||||||
Payment of contingent consideration | 137 | 634 | 879 | 511 | 734 | 2,895 | ||||||||||||||||||
Effect of foreign currency translation | (144 | ) | (174 | ) | (16 | ) | (363 | ) | (6 | ) | (703 | ) | ||||||||||||
Balance at December 31, 2008 | 1,429 | 14,432 | 14,766 | 8,654 | 34,334 | 73,615 | ||||||||||||||||||
Additions related to business combinations | 23 | 627 | — | 587 | 373 | 1,610 | ||||||||||||||||||
Adjustments related to prior year businsess combinations | 3 | 10 | 11 | 42 | 182 | 248 | ||||||||||||||||||
Subsequent recognition of deferred tax assets | (20 | ) | (78 | ) | (87 | ) | (323 | ) | (1,382 | ) | (1,890 | ) | ||||||||||||
Effect of foreign currency translation | 32 | 138 | 4 | 125 | 37 | 336 | ||||||||||||||||||
Balance at December 31, 2009 | $ | 1,467 | $ | 15,129 | $ | 14,694 | $ | 9,085 | $ | 33,544 | $ | 73,919 | ||||||||||||
| (in thousands) | ECBU | Target Analytics | GMBU | IBU | Other | Total | ||||||||||||||||||
Balance at December 31, 2010 | $ | 22,233 | $ | 20,919 | $ | 26,472 | $ | 4,514 | $ | 2,109 | $ | 76,247 | ||||||||||||
Additions related to business combinations | 802 | 12,258 | — | 863 | — | 13,923 | ||||||||||||||||||
Disposition related to sale of assets | (12 | ) | — | (35 | ) | (14 | ) | (13 | ) | (74 | ) | |||||||||||||
Effect of foreign currency translation | — | — | — | 26 | — | 26 | ||||||||||||||||||
|
|
|
| |||||||||||||||||||||
Balance at December 31, 2011 | $ | 23,023 | $ | 33,177 | $ | 26,437 | $ | 5,389 | $ | 2,096 | $ | 90,122 | ||||||||||||
The Company has no accumulated impairment losses as of December 31, 20092011 and 2008.2010. Additions to goodwill during the year ended December 31, 20092011, related to the acquisition of RLCacquisitions as described in Note 23 of these consolidated financial statements. The Company finalized the purchase price allocation for Kintera during 2009, which resulted in a net decrease to goodwill of $1.6 million. The adjustments to the purchase price allocation primarily related to (i) the recognition of $1.9 million of additional deferred tax assets, (ii) the recognition of a current tax benefit of $0.8 million and (iii) an increase in contingent tax liabilities, royalties and other preacquisition accruals of $1.1 million.
Blackbaud, Inc.
Notes to consolidated financial statements—(Continued)
The Company has recorded intangible assets acquired in various business combinations based on their fair values at the date of acquisition. The table below sets forth the balances of each class of intangible asset all of which are subject toand related amortization, as of December 31, 20092011 and 2008.2010.
| December 31, | December 31, | |||||||||||||||
| (in thousands) | 2009 | 2008 | 2011 | 2010 | ||||||||||||
Gross carrying amount | ||||||||||||||||
Finite-lived gross carrying amount | ||||||||||||||||
Customer relationships | $ | 39,975 | $ | 39,607 | $ | 48,725 | $ | 41,441 | ||||||||
Marketing assets | 2,232 | 2,124 | 2,502 | 2,365 | ||||||||||||
Acquired software | 11,489 | 11,045 | 16,087 | 12,406 | ||||||||||||
Non-compete agreements | 2,111 | 2,100 | 2,539 | 2,268 | ||||||||||||
Database | 3,441 | 3,441 | 4,275 | 4,275 | ||||||||||||
|
| |||||||||||||||
Total gross carrying amount | 59,248 | 58,317 | ||||||||||||||
Total finite-lived gross carrying amount | 74,128 | 62,755 | ||||||||||||||
|
| |||||||||||||||
Accumulated amortization | ||||||||||||||||
Customer relationships | (10,465 | ) | (5,984 | ) | (18,891 | ) | (14,741 | ) | ||||||||
Marketing assets | (843 | ) | (496 | ) | (1,627 | ) | (1,202 | ) | ||||||||
Acquired software | (3,454 | ) | (2,052 | ) | (6,171 | ) | (4,935 | ) | ||||||||
Non-compete agreements | (1,195 | ) | (772 | ) | (1,856 | ) | (1,633 | ) | ||||||||
Database | (1,272 | ) | (842 | ) | (2,263 | ) | (1,729 | ) | ||||||||
|
| |||||||||||||||
Total accumulated amortization | (17,229 | ) | (10,146 | ) | (30,808 | ) | (24,240 | ) | ||||||||
Indefinite-lived gross carrying amount | ||||||||||||||||
Marketing assets | 1,340 | — | ||||||||||||||
|
| |||||||||||||||
Total intangible assets, net | $ | 42,019 | $ | 48,171 | $ | 44,660 | $ | 38,515 | ||||||||
Additions to intangible assets subject to amortization during 20092011 are related to the acquisition of RLC asacquisitions described in Note 23 of these consolidated financial statements.
Amortization expense related to finite-lived intangible assets acquired in business combinations is allocated to cost of revenue on the statements of operations based on the revenue stream to which the asset contributes. The following table summarizes amortization expense for the years ended December 31, 2009, 20082011, 2010 and 2007.2009.
| Years ended December 31, | |||||||||
| (in thousands) | 2009 | 2008 | 2007 | ||||||
Included in cost of revenue: | |||||||||
Cost of license fees | $ | 362 | $ | 246 | $ | 153 | |||
Cost of services | 1,344 | 1,338 | 1,178 | ||||||
Cost of maintenance | 1,302 | 895 | 406 | ||||||
Cost of subscriptions | 3,239 | 2,694 | 1,112 | ||||||
Cost of other revenue | 75 | 75 | 96 | ||||||
Total included in cost of revenue | 6,322 | 5,248 | 2,945 | ||||||
Included in operating expenses | 768 | 713 | 491 | ||||||
Total | $ | 7,090 | $ | 5,961 | $ | 3,436 | |||
| Years ended December 31, | ||||||||||||
| (in thousands) | 2011 | 2010 | 2009 | |||||||||
Included in cost of revenue: | ||||||||||||
Cost of license fees | $ | 635 | $ | 588 | $ | 476 | ||||||
Cost of subscriptions | 3,341 | 3,058 | 3,239 | |||||||||
Cost of services | 1,572 | 1,390 | 1,344 | |||||||||
Cost of maintenance | 975 | 1,223 | 1,302 | |||||||||
Cost of other revenue | 75 | 75 | 75 | |||||||||
|
| |||||||||||
Total included in cost of revenue | 6,598 | 6,334 | 6,436 | |||||||||
Included in operating expenses | 980 | 798 | 768 | |||||||||
|
| |||||||||||
Total | $ | 7,578 | $ | 7,132 | $ | 7,204 | ||||||
Blackbaud, Inc.
Notes to consolidated financial statements—(Continued)
The following table outlines the estimated future amortization expense for each of the next five years for acquisition-relatedfinite-lived intangible assets as of December 31, 2009:2011:
Amortization expense | |||||||
| Years ended December 31, | (in thousands) | Amortization (in thousands) | |||||
2010 | $ | 6,787 | |||||
2011 | 6,348 | ||||||
2012 | 5,477 | $ | 7,359 | ||||
2013 | 4,883 | 6,947 | |||||
2014 | 4,572 | 6,397 | |||||
2015 | 5,496 | ||||||
2016 | 4,910 | ||||||
| |||||||
Total | $ | 28,067 | $ | 31,109 | |||
| Prepaid expenses and other current assets |
Prepaid expenses and other current assets consisted of the following as of December 31, 20092011 and 2008:2010:
| December 31, | December 31, | |||||||||||||
| (in thousands) | 2009 | 2008 | 2011 | 2010 | ||||||||||
Deferred sales commissions | $ | 6,013 | $ | 3,047 | $ | 16,452 | $ | 11,548 | ||||||
Prepaid software maintenance and royalties | 4,694 | 3,904 | 7,007 | 4,352 | ||||||||||
Deferred professional service costs | 3,098 | 3,447 | ||||||||||||
Taxes, prepaid and receivable | 3,736 | 6,385 | 343 | 9,253 | ||||||||||
Other | 3,712 | 3,945 | 4,116 | 3,539 | ||||||||||
|
| |||||||||||||
Total prepaid expenses and other current assets | $ | 18,155 | $ | 17,281 | $ | 31,016 | $ | 32,139 | ||||||
| Accrued expenses and other current liabilities |
Accrued expenses and other current liabilities consisted of the following as of December 31, 20092011 and 2008:2010:
| December 31, | ||||||
| (in thousands) | 2009 | 2008 | ||||
Accrued bonuses | $ | 8,699 | $ | 6,905 | ||
Accrued commissions and salaries | 3,800 | 3,703 | ||||
Customer credit balances | 3,536 | 3,028 | ||||
Taxes payable | 3,196 | 2,033 | ||||
Accrued health care costs | 1,394 | 758 | ||||
Accrued accounting and legal fees | 1,124 | 1,283 | ||||
Other | 4,225 | 4,432 | ||||
Total accrued expenses and other current liabilities | $ | 25,974 | $ | 22,142 | ||
| December 31, | ||||||||
| (in thousands) | 2011 | 2010 | ||||||
Accrued bonuses | $ | 9,832 | $ | 8,952 | ||||
Accrued commissions and salaries | 6,475 | 5,922 | ||||||
Taxes payable | 4,384 | 3,683 | ||||||
Customer credit balances | 3,762 | 3,335 | ||||||
Accrued accounting and legal fees | 1,490 | 1,083 | ||||||
Accrued royalties | 1,418 | 1,273 | ||||||
Accrued health care costs | 996 | 862 | ||||||
Other | 4,350 | 3,168 | ||||||
|
| |||||||
Total accrued expenses and other current liabilities | $ | 32,707 | $ | 28,278 | ||||
Blackbaud, Inc.
Notes to consolidated financial statements—(Continued)
| Deferred revenue |
Deferred revenue consisted of the following as of December 31, 20092011 and 2008:2010:
| December 31, | December 31, | |||||||||||||||
| (in thousands) | 2009 | 2008 | 2011 | 2010 | ||||||||||||
Maintenance | $ | 76,651 | $ | 70,616 | $ | 81,913 | $ | 78,382 | ||||||||
Subscriptions | 31,130 | 23,588 | 50,849 | 39,532 | ||||||||||||
Services | 26,019 | 24,291 | 29,675 | 32,379 | ||||||||||||
License fees and other | 1,784 | 1,145 | 1,000 | 368 | ||||||||||||
|
| |||||||||||||||
Total deferred revenue | 135,584 | 119,640 | 163,437 | 150,661 | ||||||||||||
Less: Long-term portion of deferred revenue | (6,172 | ) | (5,838 | ) | (9,772 | ) | (6,900 | ) | ||||||||
|
| |||||||||||||||
Current portion of deferred revenue | $ | 129,412 | $ | 113,802 | $ | 153,665 | $ | 143,761 | ||||||||
| Debt |
Revolving credit facility
TheIn June 2011, the Company hasentered into a five-year $75.0$125.0 million revolving credit facility, which expires July 2012. Under the terms of the credit agreement, the Company may elect not more than twice over the term of the agreement to increase the amount available under the facility for an aggregate amount of up to $50.0 million, subject to certain terms and conditions. In June 2008, the Company exercised one of its options and increased the credit facility by $15.0 million to an aggregate available amount of $90.0 million.facility. The revolving credit facility is guaranteed by the Company’s material domestic subsidiaries, as defined, and is collateralized with the stock of all of the Company’s subsidiaries.subsidiaries, as defined. At December 31, 2009,2011 and 2010, there were no outstanding borrowings under the credit facility.
Amounts borrowed under the revolving credit facility bear interest, at the Company’s option, at a variable rate based on (a) the higherhighest of (i) the prime rate plus a margin of up to 0.5% or(ii) federal funds rate plus 0.5% or (iii) one month LIBOR plus 1%, in addition to a margin of 0.5%0.375% to 1.0% (Base Rate Loans) or (b) LIBOR plus a margin of 1.0%1.375% to 1.5%2.0% (LIBOR Loans). The exact amount of any margin depends on the nature of the loan and the Company’s leverage ratio at the time of the borrowing. The Company also pays a quarterly commitment fee on the unused portion of the revolving credit facility equal to 0.2%0.25%, 0.25%0.275%, 0.3% or 0.3%0.35% per annum, depending on the Company’s leverage ratio. At December 31, 2011, the commitment fee was 0.25%.
Under the credit facility, the Company has the ability to choose either Base Rate Loans or LIBOR Loans. Base rate borrowings mature in July 2012.June 2016. LIBOR Loans can be one, two, three or six month maturities (or, if agreed to by all applicable lenders, nine or twelve months), and the Company has the ability to extend the maturity of these loans by rolling them at their maturity into new loans with the same or longer maturities. The Company evaluates the classification of its debt based on the maturity of individual borrowings and any roll-over of borrowings subsequent to the balance sheet date, but prior to issuance of the consolidated financial statements.
Deferred financing costs
Amortization expense for deferred financing costs was $0.1 million for each of the years ended December 31, 2009, 2008 and 2007. A portion of the deferred financing costs amortized in 2007 was associatedIn connection with the previous credit facility. The amortization of deferred financing cost recognized in 2009, 2008 and 2007 includes the amortization of cost related to the revolvingCompany’s credit facility entered into in 2007 and additional feesJune 2011, the Company paid in June 2008 to exercise$0.8 million of financing costs, which is amortized over the Company’s option to increaseterm of the available borrowings under the creditnew facility. As of December 31, 20092011 and 2008,2010, deferred financing costs totaling $0.2$0.8 million and $0.3$0.1 million, respectively, are included in other assets on the consolidated balance sheet.
Blackbaud, Inc.
Notes to consolidated financial statements—(Continued)
Note payable
As a result of the acquisition of Kintera, the Company assumed a note payable that Kintera had executed on December 1, 2007 in the amount of $3.2 million for the purchase of computer equipment. The note is collateralized by the underlying computer equipment, bears interest at a rate of 11.34% and has a maturity date of November 30, 2010. The Company recorded the note at its fair value as of the acquisition date, which resulted in an increase of $113,000 in the carrying value. Payments of principal and interest totaling $1.2 million are due in 2010. As of December 31, 2009, the note payable balance is classified as current. Based on the short-term nature of the note payable at December 31, 2009, the Company has determined that the fair value of this note payable approximates its carrying value.
| Commitments and contingencies |
Leases and related party transactions
The Company leases its headquarters facility from Duck Pond Creek, LLC. Two current executive officers of the Company each haveunder a 4% ownership interest in Duck Pond Creek, LLC. The15 year lease agreement which was entered into in October 2008, and has a term of 15 years with two five-year renewal options by the Company.options. The annual base rent of the lease is $3.6 million payable in equal monthly installments. The base rent escalates annually at a rate equal to the change in the consumer price index, as defined in the agreement, but not to exceed 5.5% in any year. In addition, under the terms of the lease, the lessor will reimburse the Company an aggregate amount of $4.0 million for leasehold improvements, which will be recorded as a reduction to rent expense ratably over the term of the lease. During each of the years ended December 31, 20092011, 2010 and 2008,2009, rent expense was reduced by $0.3 million and $0.1 million, respectively, related to this lease provision. There were no such amounts recorded during the year ended December 31, 2007 since this lease provision became effective under renegotiated lease terms in October 2008. The $4.0 million leasehold improvement allowance has been included in the table of operating lease commitments below as a reduction in the Company’s lease commitments ratably over the then remaining life of the lease from October 2008. The timing of the reimbursements for the actual leasehold improvements may vary from the amount reflected in the table below.
Additionally, the Company has subleased a portion of its headquarters facilityfacilities under various agreements extending through 2011.2014. Under these agreements, rent expense was reduced by $0.2 million, $0.4 million and $0.4 million forin each of the years ended December 31, 2009, 20082011, 2010 and 2007,2009, respectively. The operating lease commitments in the table below have been reduced by minimum aggregate sublease commitments of $0.2 million and $0.1$0.3 million during 20102012 and 2011, respectively.2013; the amount in 2014 is immaterial. No minimum aggregate sublease commitments exist after 2011.2014. The Company has also received, and expects to receive through 2012,2016, quarterly South Carolina state incentive payments as a result of locating its headquarters facility in Berkeley County, South Carolina. These amounts are recorded as a reduction of rent expense and were $1.7$2.3 million, $1.8$2.0 million and $1.9$1.7 million for the years ended December 31, 2011, 2010 and 2009, 2008respectively. Total rent expense was $4.7 million, $5.4 million and 2007,$5.3 million for the years ended December 31, 2011, 2010 and 2009, respectively.
Additionally, the Company leases various office space and equipment under operating leases. The Company also has various non-cancelable capital leases for computer equipment and furniture.
Blackbaud, Inc.
Notes to consolidated financial statements—(Continued)
furniture that are not significant.
As of December 31, 2009,2011, the future minimum lease commitments related to lease agreements, net of related sublease commitments and lease incentives, were as follows:
Years ending December 31, (in thousands) | Operating leases | Capital leases | ||||
2010 | $ | 6,278 | $ | 174 | ||
2011 | 5,860 | 40 | ||||
2012 | 5,337 | 2 | ||||
2013 | 4,309 | — | ||||
2014 and thereafter | 39,931 | — | ||||
Total minimum lease payments | $ | 61,715 | 216 | |||
Less: portion representing interest | 13 | |||||
Present value of net minimum lease payments | 203 | |||||
Less: current maturities | 163 | |||||
Long-term maturities | $ | 40 | ||||
Years ending December 31, (in thousands) | Operating leases | |||
2012 | $ | 6,658 | ||
2013 | 5,491 | |||
2014 | 5,452 | |||
2015 | 5,015 | |||
2016 | 4,236 | |||
Thereafter | 33,277 | |||
|
| |||
Total minimum lease payments | $ | 60,129 | ||
Other commitments
The Company utilizes third-party relationships in conjunction with its products, with contractual arrangements varying in length from one to three years. In somecertain cases, these arrangements require a minimum annual purchase commitment. TheAs of December 31, 2011, the remaining aggregate minimum purchase commitment
Blackbaud, Inc.
Notes to consolidated financial statements—(Continued)
under these arrangements is approximately $3.4$8.1 million through 2012.2013. The Company incurred expense under these arrangements of $2.4$6.8 million, $1.6$4.1 million and $0.8$2.5 million for the years ended December 31, 2009, 20082011, 2010 and 2007,2009, respectively.
Legal contingencies
The Company is subject to legal proceedings and claims that arisehave arisen in the ordinary course of business. The Company records an accrual for a contingency when it is both probable that a liability has been incurred and the amount of the loss can be reasonably estimated. The Company does not believe the amount of potential liability with respect to these actionslegal proceedings and/or claims in the ordinary course of business will have a material adverse effect upon the Company’s consolidated financial position, results of operations or cash flows.
Guarantees and indemnification obligations
The Company enters into agreements in the ordinary course of business with, among others, customers, vendors and service providers. Pursuant to certain of these agreements the Company has agreed to indemnify the other party for certain matters, such as property damage, personal injury, acts or omissions of the Company, or its employees, agents or representatives, or third-party claims alleging that the activities of its contractual partner pursuant to the contract infringe a patent, trademark or copyright of such third party.
The Company assesses the fair value of its liability on the above indemnities to be immaterial based on historical experience and information known at December 31, 2009.2011.
| Income taxes |
The Company files income tax returns in the U.S. for federal and various state jurisdictions andas well as in foreign jurisdictions including Canada, United Kingdom, Australia and Netherlands. The Company is generally subject to U.S. federal income tax examination for calendar tax years 20052008 through 2008 and2010 as well as state and foreign income tax examinationexaminations for various years depending on statutes of limitations of those jurisdictions.
Blackbaud, Inc.
Notes to consolidated financial statements—(Continued)
The following summarizes the components of income tax expense:
| Years ended December 31, | Years ended December 31, | ||||||||||||||||||||
| (in thousands) | 2009 | 2008 | 2007 | 2011 | 2010 | 2009 | |||||||||||||||
Current taxes: | |||||||||||||||||||||
U.S. Federal | $ | 3,139 | $ | 6,862 | $ | 5,517 | $ | 3,434 | $ | 4,130 | $ | 3,394 | |||||||||
U.S. State and local | 1,359 | 1,758 | 525 | 1,030 | 1,228 | 1,391 | |||||||||||||||
International | 391 | 359 | 448 | 40 | 78 | 298 | |||||||||||||||
|
| ||||||||||||||||||||
Total current taxes | 4,889 | 8,979 | 6,490 | 4,504 | 5,436 | 5,083 | |||||||||||||||
Deferred taxes: | |||||||||||||||||||||
U.S. Federal | 11,167 | 6,391 | 11,120 | 11,943 | 10,077 | 11,268 | |||||||||||||||
U.S. State and local | 1,184 | 959 | 2,219 | 1,536 | 1,262 | 1,196 | |||||||||||||||
International | 54 | (26 | ) | — | |||||||||||||||||
|
| ||||||||||||||||||||
Total deferred taxes | 12,351 | 7,350 | 13,339 | 13,533 | 11,313 | 12,464 | |||||||||||||||
|
| ||||||||||||||||||||
Total income tax provision | $ | 17,240 | $ | 16,329 | $ | 19,829 | $ | 18,037 | $ | 16,749 | $ | 17,547 | |||||||||
Blackbaud, Inc.
Notes to consolidated financial statements—(Continued)
The following summarizes the components of income before provision for income taxes:
| Years ended December 31, | Years ended December 31, | ||||||||||||||||||||
| (in thousands) | 2009 | 2008 | 2007 | 2011 | 2010 | 2009 | |||||||||||||||
U.S. | $ | 43,991 | $ | 44,828 | $ | 50,169 | $ | 50,946 | $ | 45,700 | $ | 43,755 | |||||||||
International | 1,696 | 1,379 | 1,384 | 311 | 236 | 1,312 | |||||||||||||||
|
| ||||||||||||||||||||
Income before provision for income taxes | $ | 45,687 | $ | 46,207 | $ | 51,553 | $ | 51,257 | $ | 45,936 | $ | 45,067 | |||||||||
A reconciliation between the effect of applying the federal statutory rate and the effective income tax rate used to calculate the Company’s income tax provision is as follows:
| Years ended December 31, | Years ended December 31, | ||||||||||||||||||||
| 2009 | 2008 | 2007 | 2011 | 2010 | 2009 | ||||||||||||||||
Federal statutory rate | 35.0 | % | 35.0 | % | 35.0 | % | 35.0 | % | 35.0 | % | 35.0 | % | |||||||||
Effect of: | |||||||||||||||||||||
State income taxes, net of federal benefit | 4.2 | 4.2 | 3.9 | 4.2 | 4.3 | 4.2 | |||||||||||||||
Change in state income tax rate applied to deferred tax asset | — | (0.8 | ) | — | 0.6 | — | — | ||||||||||||||
Disqualifying dispositions of incentive stock options | (0.2 | ) | (0.8 | ) | (0.3 | ) | (0.2 | ) | (0.3 | ) | (0.2 | ) | |||||||||
Non-deductible compensation expense | (0.4 | ) | 1.0 | 1.2 | |||||||||||||||||
State credits, net of federal benefit | (2.1 | ) | (2.8 | ) | (1.4 | ) | (2.2 | ) | (2.4 | ) | (2.1 | ) | |||||||||
Change in valuation reserve | 3.4 | 2.7 | 1.6 | 0.7 | 2.4 | 3.4 | |||||||||||||||
Federal credits generated | (3.0 | ) | (0.9 | ) | — | (2.7 | ) | (3.2 | ) | (3.0 | ) | ||||||||||
Other | 0.4 | (1.3 | ) | (0.3 | ) | 0.2 | (0.3 | ) | 0.4 | ||||||||||||
|
| ||||||||||||||||||||
Income tax provision effective rate | 37.7 | % | 35.3 | % | 38.5 | % | 35.2 | % | 36.5 | % | 38.9 | % | |||||||||
IncomeThe Company recorded net excess tax benefit of $2.3 million, expense of $1.1 million and benefit of $4.9 million that werebenefits attributable to employee stock option transactionsand stock appreciation right exercises and restricted stock vesting were recordedof $0.2 million, $2.7 million and $2.2 million in stockholders’ equity in 2009, 2008 and 2007, respectively.
The amount of tax allocated to the translation adjustment recorded in accumulated other comprehensive income was a benefit of $0.4 million, an expense of $0.2 million and a benefit of $0.1 million forduring the years ended December 31, 2011, 2010 and 2009, 2008 and 2007, respectively.
Blackbaud, Inc.
Notes to consolidated financial statements—(Continued)
The significant components of the Company’s deferred tax asset were as follows:
| December 31, | December 31, | |||||||||||||||
| (in thousands) | 2009 | 2008 | 2011 | 2010 | ||||||||||||
Deferred tax assets relating to: | ||||||||||||||||
Research and other tax credits | $ | 10,391 | $ | 9,859 | ||||||||||||
State and foreign tax credits | $ | 11,148 | $ | 11,236 | ||||||||||||
Federal and state net operating loss carryforwards | 19,804 | 23,007 | 16,842 | 18,894 | ||||||||||||
Allowance for doubtful accounts | 1,294 | 1,080 | 1,456 | 1,014 | ||||||||||||
Deferred revenue | 5,911 | 5,892 | 3,343 | 6,146 | ||||||||||||
Intangible assets | 35,985 | 42,596 | 20,969 | 28,466 | ||||||||||||
Effect of expensing nonqualified stock options and restricted stock | 8,113 | 7,474 | 8,142 | 5,929 | ||||||||||||
Other | 2,594 | 2,092 | 5,595 | 3,687 | ||||||||||||
|
| |||||||||||||||
Total deferred tax assets | 84,092 | 92,000 | 67,495 | 75,372 | ||||||||||||
Deferred tax liabilities relating to: | ||||||||||||||||
Intangible assets | (8,345 | ) | (8,608 | ) | (8,407 | ) | (8,995 | ) | ||||||||
Fixed assets | (3,090 | ) | (2,000 | ) | (9,132 | ) | (4,994 | ) | ||||||||
Other | (3,365 | ) | (1,907 | ) | (8,950 | ) | (4,291 | ) | ||||||||
|
| |||||||||||||||
Total deferred tax liabilities | (14,800 | ) | (12,515 | ) | (26,489 | ) | (18,280 | ) | ||||||||
Valuation allowance | (7,994 | ) | (7,865 | ) | (10,079 | ) | (9,614 | ) | ||||||||
|
| |||||||||||||||
Net deferred tax asset | $ | 61,298 | $ | 71,620 | $ | 30,927 | $ | 47,478 | ||||||||
As of December 31, 2009, the Company had a federal foreign tax credit carryover of approximately $1.6 million, which will expire between 2014 and 2018. As of December 31, 20092011, the Company had state tax creditscredit carryovers of approximately $8.8$11.1 million, net of federal tax, which will expire between 20102012 and 2024,2026, if unused. These state tax credits had a valuation reserve of approximately $6.4$8.9 million, net of federal tax, as of December 31, 2009.2011.
The Company acquired all of its federal and state net operating loss carryforwards in business acquisitions. At December 31, 2009,2011, the Company had deferred tax assets of $17.3$14.4 million for federal net operating loss carryforwards and $2.5$2.4 million for state net operating loss carryforwards. These deferred assets pertain to net operating loss carryforwards of approximately $49.6$41.2 million and $47.9$50.4 million for federal and state purposes, respectively, at December 31, 2009.2011. These net operating lossesloss carryforwards expire during various tax years through 2029.2030. As a result of the Kintera acquisition, Kintera underwent a change in ownership under Section 382 of the Internal Revenue Code (IRC Sec. 382) on July 8, 2008. On August 1, 2007, as a result2008, the date of the eTapestry acquisition, eTapestry also underwent a change in ownership under IRC Sec. 382.Company’s acquisition. In general, IRC Sec. 382 places annual limitations on the use of certain tax attributes such as net operating losses and tax credit carryovers in existence at the ownership change date. These limitations restrict the amount of the aforementioned net operating loss carryforwards that are available to offset taxable income each year. A portion of the state net operating loss carryforward has a valuation reserve due to management’s uncertainty regarding the future ability to use such carryforwards.
Blackbaud, Inc.
Notes to consolidated financial statements—(Continued)
The following table illustrates the change in the Company’s deferred tax asset valuation allowance.allowance:
| (in thousands) | Balance at beginning of year | Acquisition related change | Charges to expense | Balance at end of year | Balance at beginning of year | Acquisition related change | Charges to expense | Balance at year | |||||||||||||||||||||
Years ended December 31, | |||||||||||||||||||||||||||||
2011 | $ | 9,614 | $ | — | $ | 465 | $ | 10,079 | |||||||||||||||||||||
2010 | 7,994 | 75 | 1,545 | 9,614 | |||||||||||||||||||||||||
2009 | $ | 7,865 | $ | (1,378 | ) | $ | 1,507 | $ | 7,994 | 7,865 | (1,378 | ) | 1,507 | 7,994 | |||||||||||||||
2008 | 3,891 | 2,741 | 1,233 | 7,865 | |||||||||||||||||||||||||
2007 | 3,147 | — | 744 | 3,891 | |||||||||||||||||||||||||
Blackbaud, Inc.
Notes to consolidated financial statements—(Continued)
The following table sets forth the change to the Company’s unrecognized tax benefit for the year ended December 31, 2009, 20082011, 2010 and 2007:2009:
| December 31, | December 31, | |||||||||||||||||||||||
| (in thousands) | 2009 | 2008 | 2007 | 2011 | 2010 | 2009 | ||||||||||||||||||
Balance at beginning of year | $ | 346 | $ | 629 | $ | 642 | $ | 1,414 | $ | 1,231 | $ | 346 | ||||||||||||
Increases from prior period positions | 427 | — | 13 | 87 | 126 | 427 | ||||||||||||||||||
Decreases from prior period positions | — | — | (12 | ) | ||||||||||||||||||||
Decreases in prior year position | (9 | ) | — | — | ||||||||||||||||||||
Increases from current period positions | 485 | 23 | 8 | 285 | 297 | 485 | ||||||||||||||||||
Lapse of statute of limitations | (27 | ) | (306 | ) | — | — | (240 | ) | (27 | ) | ||||||||||||||
Decreases relating to settlements with taxing authorities | — | — | (22 | ) | ||||||||||||||||||||
|
| |||||||||||||||||||||||
Balance at end of year | $ | 1,231 | $ | 346 | $ | 629 | $ | 1,777 | $ | 1,414 | $ | 1,231 | ||||||||||||
The total amount of unrecognized tax benefit that, if recognized, would favorably affect the effective tax rate was $1.1$1.8 million at December 31, 2009.2011. The Company recognizes accrued interest and penalties, if any, related to unrecognized tax benefits as a component of income tax expense. Tax expense for 2009 was increased by $0.9 million for changes in liabilities, penalties and accrued interest related to uncertain tax positions. Tax expense for 2008 was decreased by $0.3 million and for 2007 was increased by $25,000, for changes in liabilities, penalties and accrued interest related to uncertain tax positions. The total amount of accrued interest and penalties included in the consolidated balance sheet as of December 31, 20092011 and 20082010 was $0.2 million and $0.1 million, respectively. The total amount of interest and penalties included in the consolidated statement of operations as an increase in income tax expense for 2011 was $0.1 million. The total amount of interest and penalties included in the consolidated statement of operations for 20082010 was $0.1 million;$0.2 million of a decrease in income tax expense; interest and penalties were immaterial in 2009.
The Company has taken positions in certain taxing jurisdictions related to state nexus issues for which it is reasonably possible that the total amounts of unrecognized tax benefits might significantly decrease within the next twelve months. TheThis possible decrease could result from the finalization of state income tax reviews and the expiration of statutes of limitations. These positions relate to state nexus issues. The reasonably possible decrease is $0.3 million.not material at December 31, 2011.
It continues to be the Company’s intention to indefinitely reinvest undistributed foreign earnings. Accordingly, no deferred tax liability has been recorded in connection with the undistributed foreign earnings.earnings of approximately $1.4 million. It is not practicable for the Company to determine the amount of the unrecognized deferred tax liability for temporary differences related to investments in foreign subsidiaries.
Blackbaud, Inc.
Notes to consolidated financial statements—(Continued)
| Stock-based compensation |
Employee stock-based compensation plans
Under the Blackbaud, Inc. 2008 Equity Incentive Plan (2008 Equity Plan), the Company may grant incentive stock options, non-statutory stock options, restricted stock awards, restricted stock unit awards, stock appreciation rights, performance stock awards and other stock awards to eligible employees, directors and consultants. The Company maintains other stock based compensation plans including the 2004 Stock Plan and the 2001 Stock Option Plan, under which no additional grants may be made, and the 2009 Equity Compensation Plan for Employees from Acquired Companies, under which the Company may grant shares of its common stock to employees pursuant to employment contracts or other arrangements entered into in connection with past and future acquisitions. In connection with the acquisition of Kintera on July 8, 2008, the Company also maintains the Kintera, Inc. 2000 Stock Option Plan, as amended (Kintera 2000 Plan) and Kintera, Inc. Amended and Restated 2003 Equity Incentive Plan, as amended (Kintera 2003 Plan), that it assumed upon the acquisition of Kintera. The Company’s Compensation Committee of the Board of Directors administers the plans and the stock-based awards are granted under terms determined by them. The total number of authorized stock-based awards
Blackbaud, Inc.
Notes to consolidated financial statements—(Continued)
available under the Company’s plans was 3,888,8811,105,980 as of December 31, 2009.2011. The Company issues common stock from its pool of authorized stock upon exercise of stock options, settlement of stock appreciation rights or upon granting of restricted stock.
The Company has issued threefour types of awards under these plans: stock options, restricted stock awards, performance-based restricted stock unit awards and stock appreciation rights. The following table sets forth the number of awards outstanding for each award type as of December 31, 20092011 and 2008.2010.
| Outstanding at December 31, | Outstanding at December 31, | |||||||||||
| Award type | 2009 | 2008 | 2011 | 2010 | ||||||||
Stock options | 1,091,241 | 1,526,855 | 216,848 | 406,425 | ||||||||
Restricted stock | 1,206,371 | 1,259,909 | ||||||||||
Restricted stock awards | 1,079,930 | 1,151,775 | ||||||||||
Performance-based restricted stock unit awards | 147,912 | 61,891 | ||||||||||
Stock appreciation rights | 1,764,603 | 1,285,626 | 2,305,049 | 2,417,658 | ||||||||
The majority of the stock-based awards granted under these plans have a 10-year contractual term. The option to purchase 800,000 shares of common stock granted on November 28, 2005, to the current Chief Executive Officer (CEO), has a 7-year contractual term. Additionally, stock appreciation rights (SARs), have contractual lives of 5 or 7 years.
Blackbaud, Inc.
Notes to consolidated financial statements—(Continued)
The Company recognizes compensation expense associated with options and restricted stock unit awards with performance or market based vesting conditions on an accelerated basis over the requisite service period of the individual grantees, which generally equals the vesting period. The Company recognizes compensation expense associated with restricted stock awards and SARs on a straight-line basis over the requisite service period of the individual grantees, which generally equals the vesting period.
Stock-based compensation expense is allocated to expense categories on the statements of operations based on the employees’ departmental cost center. The following table summarizes stock-based compensation expense for the year ended December 31, 2009, 20082011, 2010 and 2007.2009.
| Years ended December 31, | Years ended December 31, | ||||||||||||||||||||
| (in thousands) | 2009 | 2008 | 2007 | 2011 | 2010 | 2009 | |||||||||||||||
Included in cost of revenue: | |||||||||||||||||||||
Cost of subscriptions | $ | 571 | $ | 392 | $ | 387 | |||||||||||||||
Cost of services | $ | 1,433 | $ | 1,442 | $ | 627 | 1,966 | 1,742 | 1,433 | ||||||||||||
Cost of maintenance | 750 | 534 | 234 | 741 | 814 | 750 | |||||||||||||||
Cost of subscriptions | 387 | 283 | 274 | ||||||||||||||||||
|
| ||||||||||||||||||||
Total included in cost of revenue | 2,570 | 2,259 | 1,135 | 3,278 | 2,948 | 2,570 | |||||||||||||||
|
| ||||||||||||||||||||
Included in operating expenses: | |||||||||||||||||||||
Sales and marketing | 1,605 | 1,607 | 831 | 1,325 | 1,366 | 1,605 | |||||||||||||||
Research and development | 2,944 | 2,396 | 1,219 | 3,039 | 2,844 | 2,944 | |||||||||||||||
General and administrative | 5,168 | 5,823 | 3,749 | 7,242 | 5,901 | 5,291 | |||||||||||||||
|
| ||||||||||||||||||||
Total included in operating expenses | 9,717 | 9,826 | 5,799 | 11,606 | 10,111 | 9,840 | |||||||||||||||
|
| ||||||||||||||||||||
Total | $ | 12,287 | $ | 12,085 | $ | 6,934 | $ | 14,884 | $ | 13,059 | $ | 12,410 | |||||||||
Blackbaud, Inc.
Notes to consolidated financial statements—(Continued)
The total amount of compensation cost related to non-vested awards not recognized was $29.3$37.1 million at December 31, 2009.2011. This amount will be recognized over a weighted average period of 1.92.0 years.
Stock options
The following table summarizes the options outstanding vested and unvested under each of the Company’s stock-based compensation plans as of December 31, 2009.2011. All options are fully vested at December 31, 2011.
| Plan | Date of adoption | Options outstanding | Options vested | Options unvested | Range of exercise prices | Date of adoption | Options outstanding | Range of exercise prices | ||||||||||||||||
2001 Stock Option Plan | July 1, 2001 | 303,081 | 303,081 | — | $ | 5.40-$9.04 | July 1, 2001 | 1,875 | $ | 4.80 | ||||||||||||||
2004 Stock Plan | March 23, 2004 | 758,289 | 758,289 | — | $ | 8.00-$16.10 | March 23, 2004 | 207,244 | $ | 8.60-$16.10 | ||||||||||||||
Kintera 2000 Plan | July 8, 2008 | (1) | 6,820 | 6,820 | — | $ | 1.16-$19.26 | July 8, 2008 | (1) | 395 | $ | 19.26 | ||||||||||||
Kintera 2003 Plan | July 8, 2008 | (1) | 23,051 | 18,209 | 4,842 | $ | 10.59-$21.38 | July 8, 2008 | (1) | 7,334 | $ | 10.59-$19.26 | ||||||||||||
|
| |||||||||||||||||||||||
Total | 1,091,241 | 1,086,399 | 4,842 | 216,848 | ||||||||||||||||||||
| (1) | In connection with the acquisition of Kintera, the Company assumed certain stock options issued and outstanding at the date of acquisition. |
Blackbaud, Inc.
Notes to consolidated financial statements—(Continued)
A summary of outstanding options as of December 31, 2009,2011, and changes during the year then ended, is as follows:
| Options | Share options | Weighted average exercise price | Weighted (in years) | Aggregate intrinsic value (in thousands) | |||||||
Outstanding at January 1, 2009 | 1,526,855 | $ | 10.46 | ||||||||
Exercised | (434,463 | ) | 5.77 | ||||||||
Forfeited | (1,151 | ) | 12.19 | ||||||||
Outstanding at December 31, 2009 | 1,091,241 | $ | 12.32 | 2.9 | $ | 12,338 | |||||
Unvested and expected to vest at December 31, 2009 | 4,659 | $ | 11.56 | 8.3 | $ | 56 | |||||
Vested and exercisable at December 31, 2009 | 1,086,399 | $ | 12.33 | 2.9 | $ | 12,279 | |||||
| Options | Share options | Weighted average exercise price | Weighted (in years) | Aggregate (in thousands) | ||||||||||||
Outstanding at January 1, 2011 | 406,425 | $ | 13.22 | |||||||||||||
Exercised | (180,816 | ) | 11.29 | |||||||||||||
Expired | (8,761 | ) | 5.01 | |||||||||||||
|
| |||||||||||||||
Outstanding, vested and exercisable at December 31, 2011 | 216,848 | $ | 15.16 | 1.3 | $ | 2,720 | ||||||||||
The total intrinsic value of options exercised during the years ended December 31, 2011, 2010 and 2009 2008was $3.1 million, $9.1 million and 2007 was $5.9 million, $1.8 millionrespectively. The total fair value of options that vested during the years ended December 31, 2011 and $14.8 million, respectively.2010 was not material. The total fair value of options that vested during the year ended December 31, 2009, 2008 and 2007 was $2.3 million, $2.8 million and $3.3 million, respectively.million. All outstanding options granted by the Company had a fair market value assigned at grant date based on the use of the Black-Scholes option pricing model. The assumptions used in the valuation of options are the same as described in the stock appreciation rights section below.
There have been no new stock option awards granted since 2005.
Restricted stock awards
The Company has also granted shares of common stock subject to certain restrictions under the 2008 Equity Plan and the 2004 Stock Plan. Restricted stock awards granted to employees vest in equal annual installments over four years from the grant date. Restricted stock awards granted to non-employee directors vestsvest after one year from the date of grant or, if earlier, immediately prior to the next annual election of directors, provided the non-employee director is serving as a director at that time. Restricted stock awards granted to the Company’s executive officers and certain members of management are subject to accelerated vesting upon a change in
Blackbaud, Inc.
Notes to consolidated financial statements—(Continued)
control of the Company as defined in the employees’ retention agreement. The fair market value of the stock at the time of the grant is amortized on a straight-line basis to expense over the period of vesting. Recipients of restricted stock awards have the right to vote such shares and receive dividends. Income tax benefits resulting from the vesting of restricted stock awards are recognized in the period the restrictions lapse to the extent expense has been recognized. Tax benefits associated with stock-based compensation in excess of the related book expense recorded are credited to additional paid-in capital within stockholders’ equity.
A summary of unvested restricted stock awards as of December 31, 2011, and changes during the year then ended, is as follows:
| Unvested restricted stock awards | Restricted stock awards | Weighted average grant-date fair value | ||||||
Unvested at January 1, 2011 | 1,151,775 | $ | 22.45 | |||||
Granted | 502,426 | 27.98 | ||||||
Vested | (453,734 | ) | 21.89 | |||||
Forfeited | (120,537 | ) | 22.73 | |||||
|
| |||||||
Unvested at December 31, 2011 | 1,079,930 | $ | 25.22 | |||||
As of December 31, 2011, the number and intrinsic value of restricted stock awards expected to vest was 1,025,842 and $28.4 million, respectively. The total fair value of restricted stock awards that vested during the years ended December 31, 2011, 2010 and 2009 was $9.9 million, $9.0 million and $9.3 million, respectively. The weighted average grant-date fair value of restricted stock awards granted during the years ended December 31, 2011, 2010 and 2009 was $27.98, $26.61 and $21.36, respectively.
Performance-based restricted stock unit awards
The Company has also granted restricted stock units subject to certain restrictions under the 2008 Equity Plan. Restricted stock units granted to employees vest in equal annual installments over three years from the grant date subject to meeting certain performance conditions that are based on company and/or market conditions. Restricted stock units granted to the Company’s executive officers and certain members of management are subject to accelerated vesting upon a change in control of the Company as defined in the employees’ retention agreement. The fair market value of the stock at the time of the grant is amortized on a straight-linean accelerated basis to expense over the period of vesting. Recipients of restricted stock have the right to vote such shares and receive dividends. Income tax benefits resulting from the vesting of restricted stock units are recognized in the period the restrictions lapseunit is exercised to the extent expense has been recognized. Tax benefits associated with stock-based compensation in excess of the related book expense recorded are credited to additional paid-in capital within stockholders’ equity. During 2009 and 2008, the Company purchased 170,729 and 106,446 shares, respectively, from
A summary of unvested restricted stockholders upon lapsingstock unit awards as of stock restrictions in order for the holders to satisfy personal tax liabilities.
| Unvested restricted stock unit awards | Restricted stock unit awards | Weighted average grant-date fair value | ||||||
Unvested at January 1, 2011 | 61,891 | $ | 22.79 | |||||
Granted | 101,025 | 26.68 | ||||||
Forfeited | (10,193 | ) | 22.79 | |||||
Vested | (4,811 | ) | 22.79 | |||||
|
| |||||||
Unvested at December 31, 2011 | 147,912 | $ | 25.44 | |||||
Blackbaud, Inc.
Notes to consolidated financial statements—(Continued)
A summary of unvested restricted stock as of December 31, 2009, and changes during the year then ended, is as follows:
| Unvested restricted stock | Restricted stock | Weighted average grant-date fair value | ||||
Unvested at January 1, 2009 | 1,259,909 | $ | 19.16 | |||
Granted | 492,964 | 21.36 | ||||
Vested | (492,432 | ) | 18.81 | |||
Forfeited | (54,070 | ) | 20.63 | |||
Unvested at December 31, 2009 | 1,206,371 | $ | 20.20 | |||
As of December 31, 2009,2011, the number and intrinsic value of restricted awardsstock units expected to vest was 1,147,662145,797 and $27.1$4.0 million, respectively. The total fair value of restricted stock that vested during the years ended December 31, 2009, 2008 and 2007 was $9.3 million, $6.9 million and $4.4 million, respectively. The weighted average grant-date fair value of restricted stock granted during the years ended December 31, 2009, 2008 and 2007 was $21.36, $14.89 and $25.80, respectively.
Stock appreciation rights
The Company has granted SARs under the 2008 Equity Plan and the 2004 Stock Plan to certain members of management. The SARs will be settled in stock at the time of exercise and vest three and four years from the date of grant subject to the recipient’s continued employment with the Company. SARs granted to the Company’s executive officers and certain members of management are subject to accelerated vesting upon a change in control of the Company as defined in the employees’ retention agreement. The number of shares issued upon the exercise of the SARs is calculated as the difference between the share price of the Company’s stock on the date of exercise and the date of grant multiplied by the number of SARs divided by the share price on the exercise date. During 2009, the Company purchased 12,146 shares from SAR holders upon the exercise of SARs in order for the holders to satisfy personal tax liabilities.
A summary of SARs as of December 31, 2009,2011, and changes during the year then ended, is as follows:
| Stock appreciation rights | Stock appreciation rights | Weighted average exercise price | Weighted (in years) | Aggregate (in thousands) | |||||||
Outstanding at January 1, 2009 | 1,285,626 | $ | 21.40 | ||||||||
Granted | 569,064 | 22.34 | |||||||||
Exercised | (17,116 | ) | 12.40 | ||||||||
Forfeited | (72,971 | ) | 21.42 | ||||||||
Outstanding at December 31, 2009 | 1,764,603 | $ | 21.79 | 5.4 | $ | 5,090 | |||||
Unvested and expected to vest at December 31, 2009 | 1,221,112 | $ | 20.94 | 5.9 | $ | 4,004 | |||||
Vested and exercisable at December 31, 2009 | 507,136 | $ | 23.94 | 4.1 | $ | 961 | |||||
Blackbaud, Inc.
Notes to consolidated financial statements—(Continued)
| Stock appreciation rights | Stock appreciation rights | Weighted average exercise price | Weighted average remaining contractual term (in years) | Aggregate (in thousands) | ||||||||||||
Outstanding at January 1, 2011 | 2,417,658 | $ | 23.53 | |||||||||||||
Granted | 559,549 | 28.10 | ||||||||||||||
Exercised | (482,366 | ) | 24.37 | |||||||||||||
Forfeited | (189,792 | ) | 23.39 | |||||||||||||
|
| |||||||||||||||
Outstanding at December 31, 2011 | 2,305,049 | $ | 24.47 | 5.25 | $ | 7,678 | ||||||||||
|
| |||||||||||||||
Unvested and expected to vest at December 31, 2011 | 1,324,707 | $ | 25.67 | 5.91 | $ | 3,028 | ||||||||||
|
| |||||||||||||||
Vested and exercisable at December 31, 2011 | 933,927 | $ | 22.72 | 4.27 | $ | 4,650 | ||||||||||
The total intrinsic value of SARs exercised during the year ended December 31, 20092011 and 2010 was $0.2 million.$2.2 million and $1.4 million, respectively. There were no SARSARs exercises prior to 2009. The total fair value of SARs that vested during the year ended December 31, 2011, 2010 and 2009 was $3.6 million, $3.6 million and 2008 was $3.1 million, and $1.1 million, respectively. Prior to 2008, there were no vested SARs. The weighted average grant date fair value of SARs granted for the years ended December 31, 2011, 2010 and 2009 2008was $8.10, $7.17 and 2007 was $7.38, $5.02 and $9.17, respectively. All outstanding SARs granted by the Company had a fair market value assigned at the grant date based on the use of the Black-Scholes option pricing model. Significant assumptions used in the Black-Scholes option pricing model for SARs granted in 2009, 2008,2011, 2010 and 20072009 are as follows:
| Years ended December 31, | Years ended December 31, | |||||||||||||||||||
| 2009 | 2008 | 2007 | 2011 | 2010 | 2009 | |||||||||||||||
Volatility | 45 | % | 39% to 44 | % | 42% to 46% | 41% to 42% | 40% to 42% | 45% | ||||||||||||
Dividend yield | 1.7 | % | 1.5% to 1.7 | % | 1.3% to 1.4% | 1.7% to 1.8% | 1.6% to 1.8% | 1.7% | ||||||||||||
Risk-free interest rate | 1.8 | % | 2.10% to 3.21 | % | 3.89% to 4.80% | 0.6% to 1.9% | 0.9% to 1.9% | 1.8% | ||||||||||||
Expected SAR life in years | 4 | 4 | 3 to 4 | 4 | 4 | 4 | ||||||||||||||
Blackbaud, Inc.
Notes to consolidated financial statements—(Continued)
The expected volatility assumption is determined by calculatingbased on the historical volatility for a number of comparable companiesthe Company’s stock and calculating the average expected volatility over the expected life of the SAR. The dividend yield is based on the adopted dividend policy in effect at the time of grant.grant and the expectation of future dividends. The risk-free interest rate is based on United States Treasury rate for a term consistent with the expected life of the SAR at the time of grant. The expected life of the SAR represents the length of time from grant until the SAR is exercised based on experience.
| Stockholders’ equity |
Preferred stock
The Company’s Board of Directors may fix the relative rights and preferences of each series of preferred stock in a resolution of the Board of Directors.
Dividends
The Company’s Board of Directors has adopted a dividend policy which provides for the distribution to stockholders a portion of cash generated by the Company that is in excess of operational needs and capital expenditures. The Company’s credit facility limits the amount of dividends payable and certain state laws restrict the amount of dividends distributed.
The following table provides information with respect to quarterly dividends paid on common stock during the year ended December 31, 2009:2011:
| Declaration Date | Dividend per Share | Record Date | Payable Date | ||||
February 2009 | $ | 0.10 | February 27 | March 13 | |||
April 2009 | $ | 0.10 | May 28 | June 15 | |||
July 2009 | $ | 0.10 | August 28 | September 15 | |||
October 2009 | $ | 0.10 | November 27 | December 15 | |||
| Declaration Date | Dividend per Share | Record Date | Payable Date | |||
February 2011 | $0.12 | February 28 | March 15 | |||
May 2011 | $0.12 | May 27 | June 15 | |||
August 2011 | $0.12 | August 26 | September 15 | |||
November 2011 | $0.12 | November 28 | December 15 |
On February 4, 2010,22, 2012, the Company’s Board of Directors declared a first quarter dividend of $0.11$0.12 per share payable on March 15, 20092012 to stockholders of record on February 26, 2010.
Blackbaud, Inc.
Notes to consolidated financial statements—(Continued)
March 5, 2012.
Stock repurchase program
In May 2008, the Company’s Board of Directors approvedThe Company has a new stock repurchase program that authorizes the Company to purchase up to $40.0$50.0 million of its outstanding shares of common stock. The prior program was terminated at that date and the remaining balance that was authorized but not used was included in the amount authorized under the new program. The new program does not have an expiration date. The shares can be purchased from time to time on the open market or in privately negotiated transactions depending upon market conditions and other factors.
The Company accounts for purchases of treasury stock under the cost method. There were no shares purchased during the year ended December 31, 2009. The remaining amount available to purchase stock under the stock repurchase program was $30.8$50.0 million as of December 31, 2009.2011.
Stock surrenders
During the year ended December 31, 2009 and 2008, restricted stock and stock appreciation right holders surrendered 182,875 and 106,446 shares of common stock, totaling $3.8 million and $1.4 million, respectively, to satisfy their tax obligations due upon vesting of restricted stock and exercise of stock appreciation rights.
Treasury stock
The following table sets forth the changes in treasury stock for the years ended December 31, 2009 and 2008:
| (in thousands, except shares) | Plan date | Shares | Amount | ||||
Balance as of December 31, 2007 | 5,431,852 | $ | 85,487 | ||||
Stock purchased in connection with stock repurchase program | June 13, 2007 | 1,435,745 | 34,498 | ||||
Stock purchased in connection with stock repurchase program | May 7, 2008 | 520,423 | 9,229 | ||||
Stock acquired via surrender of shares of restricted stock to the Company upon vesting for settlement of taxes | 106,446 | 1,380 | |||||
Balance as of December 31, 2008 | 7,494,466 | 130,594 | |||||
Stock acquired via surrender of shares to the Company upon vesting of restricted stock or exercise of stock appreciation rights for settlement of taxes | 182,875 | 3,788 | |||||
Balance as of December 31, 2009 | 7,677,341 | $ | 134,382 | ||||
| Employee profit-sharing plan |
The Company has a 401(k) profit-sharing plan (401K(the 401K Plan) covering substantially all employees. Employees can contribute between 1% and 30% of their salaries in 2009, 20082011, 2010 and 20072009, and the Company matches 50% of
Blackbaud, Inc.
Notes to consolidated financial statements—(Continued)
qualified employees’ contributions up to 6% of their salary. The 401K Plan also provides for additional employer contributions to be made at the Company’s discretion. Total matching contributions to the 401K Plan for the years ended December 31, 2011, 2010 and 2009 2008 and 2007 were $3.4$4.0 million, $2.2$3.5 million and $2.4$3.4 million, respectively. There was no discretionary contribution by the Company to the 401K Plan in 2009, 20082011, 2010 and 2007.2009.
| Segment information |
The Company has determined that throughAs of December 31, 2009 it had six2011, the Company’s reportable segments based onwere as follows: the way that management organized operating results to make operating decisionsECBU, the GMBU, the IBU, and to assess financial performance. Internal financial reports disaggregated certain operating information into these sixTarget Analytics. Following is a description of each reportable segments. The
Blackbaud, Inc.
Notes to consolidated financial statements—(Continued)segment:
The ECBU is focused on marketing, sales, delivery and support to large and/or strategic customers, named prospects and customers in North America.
The GMBU is focused on marketing, sales, delivery and support to all emerging and mid-sized prospects and customers in North America.
The IBU is focused on marketing, sales, delivery and support to all prospects and customers outside of North America.
Target Analytics is focused on marketing, sales and delivery of analytics services to all prospects and customers in North America.
The Company’s chief operating decision maker is its chief executive officer, or CEO. The CEO used thereviews financial information presented in these reports to makeon an operating segment basis for the purposes of making certain operating decisions.decisions and assessing financial performance. The CEO diduses internal financial reports that provide segment revenues and operating income, excluding stock-based compensation expense, amortization expense, depreciation expense, research and development expense and certain corporate sales, marketing, general and administrative expenses. The CEO believes that the exclusion of these costs allows for a better understanding of the operating performance of the operating units and management of other operating expenses and cash needs. The CEO does not review any report presenting segment balance sheet information. The segment revenues and direct controllable costs, which include salaries, related benefits, third-party contractors, data expense and classroom rentals, for the years ended December 31, 2009, 2008 and 2007 were as follows:
| (in thousands) | License fees | Consulting and education services(1) | Analytic services(2) | Maintenance | Subscriptions | Other | Total | |||||||||||||||
Year ended December 31, 2009 | ||||||||||||||||||||||
Revenue | $ | 25,392 | $ | 65,342 | $ | 22,492 | $ | 116,476 | $ | 72,898 | $ | 6,738 | $ | 309,338 | ||||||||
Direct controllable costs | 3,221 | 41,845 | 10,046 | 15,769 | 22,252 | 6,009 | 99,142 | |||||||||||||||
Segment income | 22,171 | 23,497 | 12,446 | 100,707 | 50,646 | 729 | 210,196 | |||||||||||||||
Corporate costs not allocated(3) | 21,798 | |||||||||||||||||||||
Operating expenses | 142,606 | |||||||||||||||||||||
Interest expense, net | 325 | |||||||||||||||||||||
Other income, net | (220 | ) | ||||||||||||||||||||
Income before provision for income taxes | $ | 45,687 | ||||||||||||||||||||
Year ended December 31, 2008 | ||||||||||||||||||||||
Revenue | $ | 35,932 | $ | 77,687 | $ | 23,137 | $ | 107,304 | $ | 49,705 | $ | 8,730 | $ | 302,495 | ||||||||
Direct controllable costs | 3,070 | 44,392 | 9,881 | 15,334 | 15,677 | 8,279 | 96,633 | |||||||||||||||
Segment income | 32,862 | 33,295 | 13,256 | 91,970 | 34,028 | 451 | 205,862 | |||||||||||||||
Corporate costs not allocated(3) | 19,783 | |||||||||||||||||||||
Operating expenses | 138,678 | |||||||||||||||||||||
Interest expense, net | 1,000 | |||||||||||||||||||||
Other expense, net | 194 | |||||||||||||||||||||
Income before provision for income taxes | $ | 46,207 | ||||||||||||||||||||
Year ended December 31, 2007 | ||||||||||||||||||||||
Revenue | $ | 37,569 | $ | 73,174 | $ | 18,202 | $ | 94,602 | $ | 25,389 | $ | 8,102 | $ | 257,038 | ||||||||
Direct controllable costs | 2,717 | 38,778 | 8,009 | 13,382 | 7,837 | 7,164 | 77,887 | |||||||||||||||
Segment income | 34,852 | 34,396 | 10,193 | 81,220 | 17,552 | 938 | 179,151 | |||||||||||||||
Corporate costs not allocated(3) | 14,590 | |||||||||||||||||||||
Operating expenses | 112,154 | |||||||||||||||||||||
Interest expense, net | 351 | |||||||||||||||||||||
Other expense, net | 503 | |||||||||||||||||||||
Income before provision for income taxes | $ | 51,553 | ||||||||||||||||||||
Blackbaud, Inc.
Notes to consolidated financial statements—(Continued)
The Company has recast its segment disclosures for 2010 and 2009 to present the reportable segments on a consistent basis with the current year. Summarized reportable segment financial results for the year ended December 31, 2011, 2010 and 2009 were as follows:
| Years ended December 31, | ||||||||||||
| (in thousands) | 2011 | 2010 | 2009 | |||||||||
Revenue by segment: | ||||||||||||
ECBU | $ | 119,025 | $ | 98,800 | $ | 89,180 | ||||||
GMBU | 171,965 | 159,839 | 155,412 | |||||||||
IBU | 33,298 | 27,147 | 27,014 | |||||||||
Target Analytics | 37,262 | 33,306 | 31,542 | |||||||||
Other(1) | 9,318 | 7,473 | 6,322 | |||||||||
|
| |||||||||||
Total revenue | $ | 370,868 | $ | 326,565 | $ | 309,470 | ||||||
|
| |||||||||||
Segment operating income(2): | ||||||||||||
ECBU | 45,786 | 43,267 | 38,706 | |||||||||
GMBU | 102,239 | 93,177 | 93,264 | |||||||||
IBU | 5,956 | 6,039 | 7,242 | |||||||||
Target Analytics | 18,375 | 16,465 | 15,146 | |||||||||
Other(1) | 6,642 | 4,002 | 3,263 | |||||||||
|
| |||||||||||
| 178,998 | 162,950 | 157,621 | ||||||||||
Less: | ||||||||||||
Corporate unallocated costs(3) | 105,608 | 96,735 | 92,835 | |||||||||
Stock-based compensation costs | 14,884 | 13,059 | 12,410 | |||||||||
Amortization expense | 7,578 | 7,132 | 7,204 | |||||||||
Interest expense (income), net | 17 | (10 | ) | 325 | ||||||||
Other (income) expense, net | (346 | ) | 98 | (220 | ) | |||||||
|
| |||||||||||
Income before provision for income taxes | $ | 51,257 | $ | 45,936 | $ | 45,067 | ||||||
| (1) | Other includes revenue and the related costs from the sale of products and services not directly attributable to an operating segment. |
| (2) | Segment operating income includes direct, controllable costs related to the sale of products and services by the reportable segment, except for IBU, which includes operating costs from our foreign locations such as sales, marketing, general, administrative, depreciation, facilities and IT support costs. |
| (3) | Corporate costs include research and development, data center operating costs, depreciation expense, and certain corporate sales, marketing, general and administrative expenses. |
The Company also derives a portion of its revenue from its foreign operations. The following table presents revenue by geographic region based on country of invoice origin and identifiable, and long-lived assets by geographic region based on the location of the assets.
| (in thousands) | United States | Canada | Europe | Pacific | Total | United States | Canada | Europe | Pacific | Total | |||||||||||||||||||||||||
Revenue from external customers: | |||||||||||||||||||||||||||||||||||
2011 | $ | 317,305 | $ | 21,725 | $ | 21,162 | $ | 10,676 | $ | 370,868 | |||||||||||||||||||||||||
2010 | 282,450 | 17,862 | 19,251 | 7,002 | 326,565 | ||||||||||||||||||||||||||||||
2009 | $ | 269,604 | $ | 13,793 | $ | 20,490 | $ | 5,451 | $ | 309,338 | 269,720 | 13,793 | 20,506 | 5,451 | 309,470 | ||||||||||||||||||||
2008 | 262,170 | 13,951 | 20,401 | 5,973 | 302,495 | ||||||||||||||||||||||||||||||
2007 | 220,851 | 13,978 | 17,927 | 4,282 | 257,038 | ||||||||||||||||||||||||||||||
Property and equipment: | |||||||||||||||||||||||||||||||||||
December 31, 2009 | $ | 21,570 | $ | 83 | $ | 662 | $ | 192 | $ | 22,507 | |||||||||||||||||||||||||
December 31, 2008 | 20,738 | 50 | 419 | 177 | 21,384 | ||||||||||||||||||||||||||||||
December 31, 2011 | $ | 33,255 | $ | 106 | $ | 772 | $ | 264 | $ | 34,397 | |||||||||||||||||||||||||
December 31, 2010 | 22,138 | 49 | 581 | 195 | 22,963 | ||||||||||||||||||||||||||||||
Blackbaud, Inc.
Notes to consolidated financial statements—(Continued)
It is impractical for the Company to identify its revenues by product category.
Effective January 1, 2010, the Company reorganized its business into three operating units to better align its organization around key customer groups. The three operating units are the General Markets Business Unit, the Enterprise Customer Business Unit and the International Business Unit. The Company will reflect this reorganization in the Form 10-Q for the period during which management organizes operating results to make operating decisions and to assess financial performance based on the new operating unit structure.
| Quarterly results (unaudited) |
| March 31, 2011 | June 30, 2011 | |||||||||||||||||||||||||||||||||||||
| (in thousands, except per share data) | March 31, 2009 | June 30, 2009 | September 30, 2009 | December 31, 2009 | As reported (1) | Adjustment | As revised | As reported (1) | Adjustment | As revised | ||||||||||||||||||||||||||||
Total revenue | $ | 74,741 | $ | 76,415 | $ | 79,205 | $ | 78,977 | $ | 87,274 | $ | (646 | ) | $ | 86,628 | $ | 93,402 | $ | 380 | $ | 93,782 | |||||||||||||||||
Gross profit | 44,463 | 45,919 | 48,664 | 49,352 | 51,034 | (547 | ) | 50,487 | 54,276 | 218 | 54,494 | |||||||||||||||||||||||||||
Income from operations | 7,762 | 10,841 | 13,883 | 13,306 | 10,288 | (480 | ) | 9,808 | 13,774 | 713 | 14,487 | |||||||||||||||||||||||||||
Income before provision for income taxes | 7,238 | 10,639 | 13,960 | 13,850 | 10,366 | (480 | ) | 9,886 | 13,975 | 713 | 14,688 | |||||||||||||||||||||||||||
Net income | 4,072 | 6,588 | 9,828 | 7,959 | 7,584 | (291 | ) | 7,293 | 8,928 | 434 | 9,362 | |||||||||||||||||||||||||||
Earnings per share | ||||||||||||||||||||||||||||||||||||||
Basic | $ | 0.10 | $ | 0.15 | $ | 0.23 | $ | 0.18 | $ | 0.17 | $ | 0.00 | $ | 0.17 | $ | 0.21 | $ | 0.01 | $ | 0.22 | ||||||||||||||||||
Diluted | $ | 0.09 | $ | 0.15 | $ | 0.22 | $ | 0.18 | $ | 0.17 | $ | 0.00 | $ | 0.17 | $ | 0.20 | $ | 0.01 | $ | 0.21 | ||||||||||||||||||
| September 30, 2011 | December 31, 2011 | |||||||||||||||||||||||||||||||||||||
| (in thousands, except per share data) | March 31, 2008 | June 30, 2008 | September 30, 2008 | December 31, 2008 | As reported (1) | Adjustment | As revised | As reported | ||||||||||||||||||||||||||||||
Total revenue | $ | 69,436 | $ | 72,502 | $ | 80,098 | $ | 80,459 | $ | 95,531 | $ | (118 | ) | $ | 95,413 | $ | 95,045 | |||||||||||||||||||||
Gross profit | 42,693 | 46,348 | 48,792 | 48,246 | 55,862 | (140 | ) | 55,722 | 52,971 | |||||||||||||||||||||||||||||
Income from operations | 11,254 | 14,594 | 11,500 | 10,053 | 15,683 | 351 | 16,034 | 10,599 | ||||||||||||||||||||||||||||||
Income before provision for income taxes | 11,260 | 14,529 | 10,964 | 9,454 | 15,572 | 351 | 15,923 | 10,760 | ||||||||||||||||||||||||||||||
Net income | 7,043 | 8,987 | 7,316 | 6,532 | 9,761 | 453 | 10,214 | 6,351 | ||||||||||||||||||||||||||||||
Earnings per share | ||||||||||||||||||||||||||||||||||||||
Basic | $ | 0.16 | $ | 0.21 | $ | 0.17 | $ | 0.15 | $ | 0.22 | $ | 0.01 | $ | 0.23 | $ | 0.15 | ||||||||||||||||||||||
Diluted | $ | 0.16 | $ | 0.21 | $ | 0.17 | $ | 0.15 | $ | 0.22 | $ | 0.01 | $ | 0.23 | $ | 0.14 | ||||||||||||||||||||||
| March 31, 2010 | June 30, 2010 | |||||||||||||||||||||||||||||||||||||
| (in thousands, except per share data) | As reported (1) | Adjustment | As revised | As reported (1) | Adjustment | As revised | ||||||||||||||||||||||||||||||||
Total revenue | $ | 76,239 | $ | 298 | $ | 76,537 | $ | 80,671 | $ | 139 | $ | 80,810 | ||||||||||||||||||||||||||
Gross profit | 45,593 | 111 | 45,704 | 48,985 | 135 | 49,120 | ||||||||||||||||||||||||||||||||
Income from operations | 9,668 | (124 | ) | 9,544 | 11,155 | 983 | 12,138 | |||||||||||||||||||||||||||||||
Income before provision for income taxes | 9,645 | (124 | ) | 9,521 | 10,914 | 983 | 11,897 | |||||||||||||||||||||||||||||||
Net income | 5,952 | (67 | ) | 5,885 | 6,790 | 587 | 7,377 | |||||||||||||||||||||||||||||||
Earnings per share | ||||||||||||||||||||||||||||||||||||||
Basic | $ | 0.14 | $ | 0.00 | $ | 0.14 | $ | 0.16 | $ | 0.01 | $ | 0.17 | ||||||||||||||||||||||||||
Diluted | $ | 0.13 | $ | 0.00 | $ | 0.13 | $ | 0.15 | $ | 0.02 | $ | 0.17 | ||||||||||||||||||||||||||
Blackbaud, Inc.
Notes to consolidated financial statements—(Continued)
| September 30, 2010 | December 31, 2010 | |||||||||||||||||||||||||
| (in thousands, except per share data) | As previously reported (1) | Adjustment | As revised | As previously reported (1) | Adjustment | As revised | ||||||||||||||||||||
Total revenue | $ | 83,226 | $ | 224 | $ | 83,450 | $ | 86,958 | $ | (1,190 | ) | $ | 85,768 | |||||||||||||
Gross profit | 49,951 | 281 | 50,232 | 50,750 | (1,380 | ) | 49,370 | |||||||||||||||||||
Income from operations | 13,126 | 294 | 13,420 | 12,348 | (1,426 | ) | 10,922 | |||||||||||||||||||
Income before provision for income taxes | 13,155 | 294 | 13,449 | 12,466 | (1,397 | ) | 11,069 | |||||||||||||||||||
Net income | 8,519 | 165 | 8,684 | 8,544 | (1,303 | ) | 7,241 | |||||||||||||||||||
Earnings per share | ||||||||||||||||||||||||||
Basic | $ | 0.20 | $ | 0.00 | $ | 0.20 | $ | 0.20 | ($ | 0.03 | ) | $ | 0.17 | |||||||||||||
Diluted | $ | 0.20 | $ | 0.00 | $ | 0.20 | $ | 0.20 | ($ | 0.03 | ) | $ | 0.17 | |||||||||||||
| (1) | SeeRevision of prior period financial statements discussed in Note 1. |
Earnings per common share are computed independently for each of the periods presented and, therefore, may not add up to the total for the year. The results of operations of acquired companies are included in the consolidated results of operations from the date of their respective acquisition as described in Note 2.3.
| 17. | Subsequent events |
Proposed Convio acquisition
On January 16, 2012, the Company entered into an Agreement and Plan of Merger with Convio, Inc. (Convio), a leading provider of on-demand constituent engagement solutions that enable nonprofit organizations to more effectively raise funds, advocate for change and cultivate relationships. Under the terms of the agreement, the Company will acquire all of the outstanding shares of common stock of Convio for $16.00 per share, representing a premium of 49% compared to Convio’s closing price prior to the announcement of the proposed acquisition and an enterprise value of approximately $275.0 million (based on dilutive shares). The Company will finance the deal through a combination of cash and debt.
Amended and restated credit facility
The Company amended and restated its credit facility to a $325.0 million five-year credit facility on February 9, 2012. The credit facility includes the following facilities: a dollar and a designated currency revolving credit facility with sublimits for letters of credit and swingline loans, and a delayed draw term loan. The credit facility is secured by the stock and limited liability company interests of certain subsidiaries that were pledged as part of the closing. Amounts outstanding under the credit facility will be guaranteed by material domestic subsidiaries of the Company, if any. In connection with the amended credit facility, the Company incurred $2.4 million of financing costs.
F-37F-39