SECURITIES AND EXCHANGE COMMISSION
| [X] | ANNUAL REPORT PURSUANT TO SECTION 13 OR 15(d) OF THESECURITIES EXCHANGE ACT OF 1934 |
For the Fiscal Year ended December 31, 2009
or
| For the Fiscal Year ended December 31, 2012 | |
| or | |
| [ ] | TRANSITION REPORT PURSUANT TO SECTION 13 OR 15(d) OF THESECURITIES EXCHANGE ACT OF 1934 |
| For the transition period from ___________________ to ___________________. |
For the transition period from to .
| Delaware | 11-2617163 | |
(State or other jurisdiction of | (I.R.S. Employer Identification No.) | |
| incorporation or organization) |
| |
Securities Registered Pursuant to Section 12(b) of the Act:
Securities Registered Pursuant to Section 12(b) of the Act: | ||
| Title of Each Class |
| |
| Common Stock, $0.001 Par Value |
| |
| Securities Registered Pursuant to Section 12(g) of the Act: None | ||
Securities Registered Pursuant to Section 12(g) of the Act: None
YES x[ X ] NO ¨
[ ]
YES ¨[ ] NO x
[X ]
[ ]
[ ]
[ ]
YES ¨[ ] NO [X]
The aggregate market value of the registrant’sregistrant's common stock held by non-affiliates of the registrant on June 30, 20092012 (based on the closing sale price of $15.55$25.67 on that date), was approximately $588,267,650.$870,484,845. Common stock held by each officer and director and by each person known to the registrant who owned 10% or more of the outstanding common stock have been excluded in that such persons may be deemed to be affiliates. This determination of affiliate status is not necessarily a conclusive determination for other purposes.
Index to Financial Statements
Item 1. Item 1A. Item 1B. Item 2. Item 3. Item 5. Item 6. Item 7. Item 7A. Item 8. Item 9. Item 9A. Item 9B. Item 10. Item 11. Item 12. Item 13. Item 14. Item 15. Business Customers are at the heart of everything we do. We must be good stewards of our resources. Innovation drives success. Our actions are guided by honesty and integrity. Service to others makes the world a better place. organizations in the Garner small cash contributions from numerous contributors; Manage and develop complex relationships with large numbers of constituents; Communicate their accomplishments and the importance of their mission online and offline; Solicit cash and in-kind contributions from businesses to help raise money or deliver Provide a wide array of programs and services to individual constituents; and Improve the data collection and information sharing capabilities of their employees, volunteers and donors by creating and providing distributed access to centralized databases. Our comprehensive suite of software, services and analytical tools help nonprofit organizations manage the key aspects of their operations. By automating business processes, our products streamline operations for our customers and help to reduce the overall costs of operating their organizations. We provide solutions that address many of the technological and business process needs of our customers, including: Constituent relationship management; Financial management and reporting; Cost accounting information for projects and grants; Integration of financial data and donor information in a centralized system; Peer-to-peer fundraising; Student information systems for independent schools and small colleges; Ticketing management;Table of Contents PagePART I Page No. Item 1. 152727Item 4. 27PART IIItem 4.27PART II28333558585858 59PART IIIPART III60606060 60PART IVPART IV61Index to Financial Statements certain statements that may be deemed to be “forward-looking statements” that anticipate results based on our estimates, assumptions and plans that are subject to uncertainty. These statements are made subject to the safe-harbor provisions of the Private Securities Litigation Reform Act of 1995, Section 27A of the Securities Act of 1933 and Section 21E of the Securities Exchange Act of 1934. All statements in this report not dealing with historical results or current facts are forward-looking and are based on estimates, assumptions and projections. Statements which include the words “believes,” “seeks,” “expects,” “may,” “might,” “should,” “intends,” “likely,” “targets,” “plans,” “anticipates,” “estimates” or the negative version of those words and similar statements of a future or forward-looking nature identify forward-looking statements. it is possible that future circumstances might differ from the assumptions on which such statements are based. In addition, other important factors that could cause results to differ materially include those set forth under “Item 1A. Risk factors” and elsewhere in this report and in our other SEC filings. We undertake no obligation to update or revise publicly any forward-looking statements, whether as a result of new information, future events or otherwise.BUSINESSmissionstated company purpose is to makepower the world a better placebusiness of philanthropy from fundraising to outcomes. We strive to help our customers accomplish their missions and are guided by working with the nonprofit community to improve lives. We support our mission statement through the following corporate values: build online communities and improve communications with constituents, manage their finances and optimize operations. We have focused solely on the nonprofit market since our incorporation in 1982. At the end of 2009,2012, we had approximately 22,000more than 27,000 customers spread over 5561 countries. Our customers come from nearly every segment of the nonprofit sector, including education, foundations, health and human services, faith-based, arts and cultural, public and societal benefits, environment and animal welfare, andas well as international and foreign affairs.more than 1.7nearly 1.6 million U.S. nonprofit organizations registered with the Internal Revenue Service in 2008,2011, including 1.21.1 million charitable 501(c)(3) organizations, and we estimate there are approximately another 2.03 million nonprofit organizationscharities internationally. According to Giving USA 2009,2012, donations to nonprofitIndex to Financial StatementsU.S.United States in 20082011 were $307.7$298.4 billion, amounting to 2.2%2.0% of U.S. GDP.GDP, which increased from donations in 2010 of $286.9 billion. The compound annual growth rate of donations over the 40 year40-year period from 19681971 to 20082011 was 7.2%6.6%, not adjusted for inflation. The compound annual growth rate of U.S. GDP over the same 40-year period was 6.7%, not adjusted for inflation. These nonprofit organizations also receive fees for services they provide, which are estimated at approximately $850 billionmore than $1 trillion annually.Johns Hopkins University’s 2006 Nonprofit Employment Data Project, the most recent survey on nonprofit employment data, indicated that nonprofits employ nearly 10% of the work force in the United States and more if volunteers are included. Also according to this study, worldwide, nonprofit organizations accounted for $1.3 trillion in total annual expenditures.issuesrequirements that differ from those for traditional businesses;products/products and services;as a result of the negative impact the recent challenging economic environment has had a negative impact on donations, and we believe the nonprofit industrysector has an even greater need for operational efficiencies to maximize the services they can deliver. Because of these challenges, we believe nonprofit organizations can benefit from software applications specifically designed to serve their particular needs.The organizations by providing themorganizations. We provide our customers with software and services that help them increase donations, reduce the overall costs of managing their businesses and build a strong sense of community while effectively managing communications with their constituents. We provide our solutions to nonprofit organizations in several ways. Today, weWe offer our products principally on a perpetual license basis. However, an increasing number of our products are offered onbasis, a software-as-a-service (SaaS)(“SaaS”), or as a “hosted” software offering and we expect this trend to continue in the future.offerings. We also offer a suite of analytical tools and related services that enable nonprofit organizations to extract, aggregate and analyze vast quantities of data to make better-informed operational decisions. In addition, we help our customers increase the returns on their technology investments by providing a broad range of consulting, training and professional services, maintenance and technical support as well as maintenancepayment processing services.technical support.Indexextend our position as the leading provider of software and related services designed specifically for nonprofit organizations, supporting their missions from fundraising to Financial StatementsNonprofitoutcomes. Our key strategies for achieving this objective are to:increase donationsManagingpurchase, engage with customer support and utilized product enhancements. We continue to evolve the fundraising process is a critical business function for nonprofits. Our fundraisingmanner in which we package and constituent relationship management solutions allow nonprofit organizationssell our offerings to establish, maintain, and develop their relationshipsprovide higher value combined with currentflexibility to meet the different needs of our existing and prospective donorscustomers. For example, we are increasing the number of our offerings sold under a subscription pricing model, which can make it easier for customers to purchase our solutions. We will continue to focus on providing the highest level of product support while continuing to enhance our existing products and other constituents. Our fundraisingdeveloping new products and services enable themdesigned to use a centralized database,help allow our customers to more effectively achieve their missions.Internetpast five years both in the United States and internationally, including the acquisition of Convio, Inc. (Convio) in May 2012. The acquisition of Convio provided us with expanded subscription and online offerings and we expect it to accelerate our evolution to a subscription-based revenue model.arrayattractive acquirer or partner for others in the industry.analytical tools,nonprofits can vary greatly according to facilitatetheir size and expand their fundraising efforts. In addition,function. To better serve the wide variety of nonprofits in the market, we organize our operating structure into four operating units: the Enterprise Customer Business Unit, or ECBU, the General Markets Business Unit, or GMBU, the International Business Unit, or IBU, and Target Analytics.help nonprofit organizations increase donations by enabling them to:Solicit large numbersto our customers. During 2012, we generated revenue in four reportable segments and in four geographic regions, as described in more detail in Note 16 of potential donors;Deliver personalized messages that drive constituent action;Provide an easy-to-use system for sharing and using critical fundraising information;Utilize our Internet-based offerings to receive online donations and support online volunteer and events management; andSimplify and automate business processes.Nonprofit organizations use Blackbaud software, services and tools to improve operational effectivenessInternet basedOnline fundraising;Data analysisGeneral admissions management;reporting toolsprospect research;Online interactive communities for social networking and relationship management;Management of complex volunteer networks; andResults tracking for multiple campaigns.Our StrategyOur objective is to maintain and extend our position as the leading provider of softwarePayment processing and related services designed specifically for nonprofit organizations. Key elements for achieving this objective are to:Grow our customer baseWe intend to expand our industry-leading customer base and enhance our market position. We have established a strong market presence with approximately 22,000 customers. However, in a 2007 nonprofit market survey by Addison Whitney, only 30% of respondents were familiar with Blackbaud. We believe that the fragmented natureIndex to Financial Statementsof the industry presents an opportunity for us to continue to increase our market penetration. We plan to achieve this by making use of our experience, the depth of our product capabilities, and our strong brand recognition. We also intend to expand our overall sales efforts, especially national accounts and enterprise-focused sales teams.Maintain and expand existing customer relationshipsWe have historically had success selling maintenance renewals and additional products and services to existing customers. In each of the past five years, approximately 95% of our customers renewed their maintenance and support plans. We will continue to pursue opportunities to expand our existing customer base by increasing both the number of our products and services they use and the frequency with which they use them. To this end, we have dedicated sales teams that focus exclusively on selling products and services to existing customers.Enable customers to effectively utilize the Internet as a comprehensive business toolWe will enhance our existing products and develop new products and services that will allow our customers to more fully utilize the Internet to effectively achieve their missions. Although online fundraising comprises a small percentage of all charitable contributions, our research indicates that online donations are growing as a percentage of total contributions. A study we conducted together with the ePhilanthropy Foundation found that online donations increased by 44% in 2008. We offer a variety of Internet applications and consulting services that allow nonprofits to use the Internet for online fundraising, e-marketing, alumni and membership directories, newsletters, event management and volunteer coordination.Introduce additional products and servicesWe intend to use our expertise and experience in developing leading products for the nonprofit industry to introduce additional products and related services. We plan to build stronger relationships with existing customers and attract new customers. We believe that our existing proprietary software can form the foundation for an even wider range of products and services for nonprofit organizations. Our current products share over half of our proprietary software code and were developed using common standards and practices. We believe this shared code allows us to more cost effectively expedite the development and rollout of product offerings and updates. In addition, we are building our future product offerings on a common platform, which we anticipate will improve our ability to create new offerings efficiently and expeditiously.Pursue strategic acquisitions and alliancesWe intend to selectively pursue acquisitions and alliances in the future with companies that provide us with complementary technology, customers and personnel with significant relevant experience, as well as to increase our access to additional geographic and vertical markets. We have completed significant acquisitions over the past five years, including the acquisition of Target Software, Inc. and Target Analysis Group, Inc., or the Target Companies, in January 2007, eTapestry.com, or eTapestry, in August 2007, Kintera Inc., or Kintera, in July 2008 and RLC Customer Centric Technology B.V., or RLC, in April 2009. We are also currently involved in a number of strategic relationships. We believe that our size and our history of leadership in the nonprofit sector make us an attractive acquirer or partner for others in the industry.Expand international presenceWe believe the United Kingdom, Canada, and Australia as well as other international markets represent growing market opportunities for our products and services. As further discussed below, we recently established a separate business unit to serve the needs of our operations in international markets and expand our presence in these markets. The acquisition of RLC in April 2009 provided us a foundation to expand into the Netherlands and other Western European markets. We currently have offices in Almere, Netherlands; Glasgow, Scotland; London, England; Sydney, Australia; and Toronto, Canada. We believe the overall market of international nonprofit organizations is changing. Donations to nonprofit organizations are increasing in response to reductions
Index to Financial Statements
in governmental funding of certain activities. U.S.-based nonprofit organizations are growing their international activities and opening overseas locations. We believe the international marketplace is currently underserved and we intend to increase our international presence by expanding our sales and marketing efforts. We plan to make use of our installed base of customers to sell complementary products and services, and we plan to develop and offer new products tailored to international markets.
Products and Services
We license software and provide various services to our customers. During 2009, we generated revenue in six reportable segments and in four geographic regions, as described in more detail in Note 14 of our consolidated financial statements. These revenue segments are license fees, maintenance fees, and subscription fees for our software products, consulting and education services, analytic services and others. Effective January 1, 2010, we reorganized our business into three operating units, which we believe will better align our organization around key customer groups. The three operating units are the General Markets Business Unit, the Enterprise Customer Business Unit and the International Business Unit.
regulation compliance. help nonprofits with online fundraising, email marketing, advocacy, and events management. Luminate was one of the main products offered by Convio, which we acquired in May 2012. eTapestry was built to operate in a hosted environment and to be accessed via the Internet. This technology provides a system that is simple to maintain, efficient to operate and is intuitively easy to learn without extensive training. nonprofit organizations with the means to help manage fiscal and fiduciary responsibility, enabling them to be more accountable to their constituents. In addition, The Financial Edge is designed specifically to meet governmental accounting and financial reporting requirements prescribed by the Financial Accounting Standards Board, GASB. communications and fundraising. System implementation, including all aspects of installation and configuration, to ensure a smooth transition from the Management of the data conversion process to ensure data is a reliable and powerful source of information for an organization; Business process analysis and application customization to ensure that the Removal of duplicate records, database merging and enrichment, information cleansing and consolidation, and secure credit card transaction processing; Database production activities, including direct marketing, business intelligence, cultivation and stewardship processes; and Website design services, Internet strategy consulting and specialized services, such as email marketing and search engine optimization. - Target Analytics Data Enrichment Services assess marketing and operational effectiveness and also to influence operational planning. Most of our customers enroll in one of our maintenance and support programs. In each of the past five years, more than 95% of our customers have renewed their maintenance plans. Customers enrolled in the benefits such as call support priority and dedicated support resources. PCI compliant process and streamlined bank reconciliation. We have customers in every principal vertical market within the nonprofit industry. At the end of We generally begin a customer relationship with the sale of one of our primary products or services, such as The Software developers offering specialized products designed to address specific needs of nonprofit Providers of traditional, less automated fundraising Custom-developed products created either internally or outsourced to custom service providers; and SalesForce.com environment. 2012. As of December 31, Name President and Chief Executive Officer Anthony W. Boor Senior Vice President, New Business Development Kevin Mooney President, General Markets Business Unit Senior Vice President, Chief Scientist John J. Mistretta Senior Vice President of Human Resources October 2012 where he led the company's expansion in the U.S. public sector marketplace. From October 2006 to September 2009, he was Vice President of Capgemini Group. From January 2000 to September 2005, he was President and Chief Executive Officer of Gazelle Consulting, Inc., a branded leader in business intelligence professional services. Gazelle was acquired by Adjoined Consulting in 2005 and Mr. Moye integrated his team, led the combined business intelligence practice of Adjoined and, ultimately Kanbay's practice after its acquisition of Adjoined, prior to Capgemini acquiring Kanbay. Before founding Gazelle Consulting, Mr. Moye held multiple leadership positions with Sequent Computer Systems and Unisys where he was responsible for leading business units and channels both domestically and internationally. Mr. Moye holds a BS in Business Administration from Florida State University. Charles L. Longfieldhas served as our Senior Vice President, Chief Scientist since January 2010. He joined us in January 2007 as our Chief Scientist as part of our acquisition of the Target Companies, both of which he founded and then led as Chief Executive Officer since the early 1990s. Mr. Longfield has extensive experience designing and implementing national as well as international constituency databases that address the fundraising information needs at many of the Risk Factors extensive education and marketing effort. We could expend significant funds and management resources during the sales cycle and ultimately fail to close the sale. Historically, our software product sales cycle averages approximately two months for sales to existing customers and from six to nine months for sales to new Our customers' renewal rates may decline or fluctuate as a result of a number of factors, including their level of satisfaction with our products and services and their ability to continue their operations and spending levels. additional purchases of our products and services. If we fail to generate additional business from our current customers, our revenue could The additional investments required to meet customer demand will increase our cost base, which will make it more difficult for us to offset any future revenue shortfalls by reducing expenses in the short term. including notification under data privacy regulations. The existence of vulnerabilities, even if they do not result in a security breach, may harm customer confidence and require substantial resources to address, and we may not be able to discover or remedy such security vulnerabilities before they are exploited. Also, computers, including those that use our software, are vulnerable to computer viruses, physical or electronic break-ins and similar disruptions, which could lead to interruptions, delays or loss of data. We might be required to expend significant capital and other resources to protect further against security breaches or to rectify problems caused by any security breach. perform engagement implementation services are less than our actual hours, our operating results would be adversely affected. Services revenue as a percentage of total revenue has varied significantly from quarter to quarter due to fluctuations in licensing revenue, economic changes, varying accounting treatments, changes in the average selling prices for our products and services, our customers' acceptance of our products and our sales force execution. In addition, the volume and profitability of services can depend in large part upon: Competitive pressures can adversely impact our business by limiting the prices we can charge our customers and making the adoption and renewal of our solutions more difficult. Restrictions in our revolving credit facility may limit our activities, including dividend payments, share repurchases and acquisitions. recapitalization. in performance, loss of key contracts, adverse market conditions, adverse changes in applicable laws or regulations, including changes that restrict the activities of or affect the products sold by our business and a variety of other factors. If a deferred tax asset was determined to be not realizable in a future period, the charge to earnings would be recognized as an expense in our results of operations in the period the determination is made. Additionally, if we are unable to utilize our deferred tax assets, our cash flow available to fund operations could be adversely effected. common stock. retain their engineering, sales, marketing, development and other personnel. It is possible that these employees might decide to terminate their employment. If key employees terminate their employment, the sales, marketing or development activities of acquired companies might be adversely affected, our management's attention might be diverted from successfully integrating the acquired operations and to hiring suitable replacements and, as a result, our business might suffer. Furthermore, if we incur additional debt to fund acquisitions and are unable to service our debt obligation we may have a greater risk of default under our credit facility. Unresolved staff comments Properties Legal proceedings Market for registration's common equity, related stockholder matters and issuer purchases of equity securities Fiscal year ended December 31, 2009 First quarter Second quarter Third quarter Fourth quarter Fiscal year ended December 31, 2008 First quarter Second quarter Third quarter Fourth quarter Blackbaud Common Stock CRSP Total Market Return Index Peer Group Approximate (in thousands) Beginning balance, October 1, 2009 October 1, 2009 through October 31, 2009 November 1, 2009 through November 30, 2009 December 1, 2009 through December 31, 2009 Total December 31, 2012. All of these shares were common stock withheld by us to satisfy tax obligations of employees due upon vesting of restricted stock. stock. In order to pay any cash dividends and/or repurchase shares of stock: (1) no default or event of default shall have occurred and be continuing under the credit Selected financial data Consolidated statements of operations data: Revenue License fees Services Maintenance Subscriptions Other revenue Total revenue Cost of revenue Cost of license fees Cost of services(1) Cost of maintenance(1) Cost of subscriptions(1) Cost of other revenue Total cost of revenue Gross profit Operating expenses Sales and marketing(1) Research and development(1) General and administrative(1) Amortization Total operating expenses Income from operations Interest income Interest expense Other income (expense), net Income before provision for income taxes Income tax provision Net income Earnings per share Basic Diluted Common shares and equivalents outstanding Basic weighted average shares Diluted weighted average shares Dividends per share Summary of stock-based compensation (benefit): Cost of services Cost of maintenance Cost of subscriptions Total included in cost of revenue Sales and marketing Research and development General and administrative Total included in operating expenses Total stock-based compensation Consolidated balance sheet data: Cash and cash equivalents Deferred tax asset, including current portion Working capital (deficit) Total assets Deferred revenue Total liabilities Common stock Additional paid-in capital Total stockholders’ equity Management’s discussion and analysis of financial condition and results of operations Except as required by law, we do not intend, and undertake no obligation to revise or update these forward-looking statements, or to update the reasons actual results could differ materially from those anticipated in these forward-looking statements, even if new information becomes available in the future. operations (continued) our existing and prospective customers in their expenditure decisions. We expect that our operating environment will Revenue License fees Services Maintenance Subscriptions Other revenue Total revenue Cost of revenue Cost of license fees Cost of services Cost of maintenance Cost of subscriptions Cost of other revenue Total cost of revenue Gross profit Operating expenses Sales and marketing Research and development General and administrative Amortization Total operating expenses Income from operations Interest income Interest expense Other income (expense), net Income before provision for income taxes Income tax provision Net income operations (continued) 2011 The table below compares revenue from our License fees Services Maintenance Subscriptions Other Total revenue License fee revenue Direct controllable cost of license fees Segment income Segment margin % Consulting and education services revenue Direct controllable cost of consulting and education services Segment income Segment margin % Analytic services revenue Direct controllable cost of analytic services Segment income Segment margin % Analytic services are comprised of donor prospect research, selling lists of potential donors, benchmarking studies and data modeling services. These services involve the assessment of current and prospective donor information of allocated costs discussed above. Maintenance revenue Direct controllable cost of maintenance Segment income Segment margin % Revenue from maintenance is comprised of annual fees derived from maintenance contracts associated with new software licenses and annual renewals of existing maintenance contracts. These contracts provide customers with updates, enhancements and upgrades to our software products and online, telephone and email support. 2012. Subscriptions revenue Direct controllable cost of subscriptions Segment income Segment margin % operations (continued) Other revenue Direct controllable cost of other revenue Segment income Segment margin % License fees Consulting and education services Analytic services Maintenance Subscriptions Other Total segment income Less corporate costs not allocated to segment expenses: Stock-based compensation Amortization of intangible assets acquired in business combinations Corporate overhead costs Gross profit as stated in statements of operations Gross margin % user conferences. Sales and marketing expense excluding stock-based compensation Add: Stock-based compensation expense Sales and marketing expense % of revenue (excluding stock-based compensation) During our new packaged offerings. Research and development expense excluding stock-based compensation Add: Stock-based compensation expense Research and development expense % of revenue (excluding stock-based compensation) operations (continued) During 2011, human resource and third-party costs increased by $3.0 million partially offset by an increase in the amount of software development costs that were capitalized of $0.8 million. Human resource and third-party contractor costs increased as we continued to invest in our product development efforts. The increase in amount of costs that are capitalized was primarily due to development efforts with our events management solution. 2010. General and administrative expense excluding stock-based compensation Add: Stock-based compensation expense General and administrative expense % of revenue (excluding stock-based compensation) During Included in cost of revenue: Cost of services Cost of maintenance Cost of subscriptions Total included in cost of revenue Included in operating expenses: Sales and marketing Research and development General and administrative Total included in operating expenses Total Stock-based compensation from: Common stock Stock options Restricted stock awards Stock appreciation rights Total stock-based compensation Included in cost of revenue: Cost of license fees Cost of services Cost of maintenance Cost of subscriptions Cost of other revenue Total included in cost of revenue Included in operating expenses Total 31: planning strategies. Balance at beginning of year Increases from prior period positions Decreases from prior period positions Increases from current period positions Lapse of statute of limitations Decreases relating to settlements with taxing authorities Balance at end of year those jurisdictions. approximates $0.9 million at December 31, 2012. 2012. At December 31, 2012, we had $215.5 million of outstanding borrowings under our credit facility. Our average daily borrowings were $244.9 million during the period we had debt outstanding during 2012. vendor payments, partially offset by a decrease in the amount of deferred commissions and other deferred costs. Operating leases Capital leases Debt and interest Total improvements. operations (continued) estimates. We deem acceptance of an agreement to be evidence of an arrangement. Delivery for our products occurs when the product is shipped or transmitted, and title and risk of loss have transferred to the customers. Our typical Revenue is recognized net of sales returns and allowances. using the percentage-of-completion method. In arrangements where we provide customers the right to updates to the lists during the contract period, revenue is recognized ratably over the contract period. We recognize revenue from maintenance services ratably over the contract term, operations (continued) We Quantitative and qualitative disclosures about market risk Financial statements and supplementary data Changes in and disagreements with accountants on accounting and financial disclosure Controls and procedures Other information Directors, executive officers and corporate governance Executive compensation Security ownership of certain beneficial owners and management and related stockholder matters Certain relationships, related transactions and director independence Principal accountant fees and services Exhibits and financial statement schedules Page 2.1 Agreement and Plan of Merger and Reincorporation dated April 6, 2004 2.2 Stock Purchase Agreement among Target Software, Inc., Target Analysis Group, Inc., all of the Stockholders of Target Software Inc. and Target Analysis Group, Inc. and Blackbaud, Inc. 3.1 Certificate of Incorporation of Blackbaud, Inc. 3.3 Amended and Restated By-laws of Blackbaud, Inc. 10.5 Trademark License and Promotional Agreement dated as of October 13, 1999 between Blackbaud, Inc. and Charleston Battery, Inc. 10.6 Blackbaud, Inc. 1999 Stock Option Plan, as amended 10.8 Blackbaud, Inc. 2001 Stock Option Plan, as amended 10.20 Blackbaud, Inc. 2004 Stock Plan, as amended, together with Form of Notice of Stock Option Grant and Stock Option Agreement 10.26 Form of Notice of Restricted Stock Grant and Restricted Stock Agreement under the Blackbaud, Inc. 2004 Stock Plan 10.27 Form of Notice of Stock Appreciation Rights Grant and Stock Appreciation Rights Agreement under the Blackbaud, Inc. 2004 Stock Plan Amended and Restated Credit Agreement dated as of July 25, 2007 by and among Blackbaud, as Borrower, the Lenders, and Wachovia Bank, National Association, as Administrative Agent, Swingline Lender and Issuing Lender, and Wachovia Capital Markets, LLC as Sole Lead Arranger and Sole Book Manager. Amended and Restated Guaranty Agreement dated as of July 25, 2007 by and among certain subsidiaries of Blackbaud, as Guarantors, in favor of Wachovia Bank, National Association, as Administrative Agent. Pledge Agreement dated as of July 25, 2007 by and among Blackbaud, its subsidiaries in favor of Wachovia Bank, National Association, as Administrative Agent for the ratable benefit of itself and the Lenders. Form of Tender and Support Agreement by and between Blackbaud, Inc. and certain stockholders of Kintera, Inc. First Amendment to Credit Agreement and Lender Addition and Acknowledgement Agreement dated as of June 23, 2008 Blackbaud, Inc. 2008 Equity Incentive Plan Form of Notice of Grant and Stock Option Agreement under Blackbaud, Inc. 2008 Equity Incentive Plan Form of Notice of Grant and Restricted Stock Agreement under Blackbaud, Inc. 2008 Equity Incentive Plan Form of Notice of Grant and Stock Appreciation Rights Agreement under Blackbaud, Inc. 2008 Equity Incentive Plan Kintera, Inc. 2000 Stock Option Plan, as amended, and form of Stock Option Agreement thereunder Kintera, Inc. Amended and Restated 2003 Equity Incentive Plan, as amended, and form of Stock Option Agreement thereunder Form of Retention Agreement Triple Net Lease Agreement dated as of October 1, 2008 between Blackbaud, Inc. and Duck Pond Creek-SPE, LLC Blackbaud, Inc. 2009 Equity Compensation Plan for Employees from Acquired Companies Share Purchase Agreement between RLC Group B.V., as the Seller, and Blackbaud, Inc., as the Purchaser Amended and Restated Employment and Noncompetition Agreement dated January 28, 2010 between Blackbaud, Inc. and Marc Chardon Subsidiaries of Blackbaud, Inc Consent of Independent Registered Public Accounting Firm Certification by the Chief Executive Officer pursuant to Section 302 of the Sarbanes-Oxley Act of 2002 Certification by the Chief Financial Officer pursuant to Section 302 of the Sarbanes-Oxley Act of 2002 Certification by the Chief Executive Officer pursuant to 18 U.S.C. 1350 as adopted pursuant to Section 906 of the Sarbanes-Oxley Act of 2002 Certification by the Chief Financial Officer pursuant to 18 U.S.C. 1350 as adopted pursuant to Section 906 of the Sarbanes-Oxley Act of 2002 Blackbaud, Inc. Assets Current assets: Cash and cash equivalents Donor restricted cash Accounts receivable, net of allowance of $3,559 and $2,777 at December 31, 2009 and December 31, 2008, respectively Prepaid expenses and other current assets Deferred tax asset, current portion Total current assets Property and equipment, net Deferred tax asset Goodwill Intangible assets, net Other assets Total assets Liabilities and stockholders’ equity Current liabilities: Trade accounts payable Accrued expenses and other current liabilities Donations payable Debt, current portion Deferred revenue Total current liabilities Long-term debt, net of current portion Deferred revenue, noncurrent Other noncurrent liabilities Total liabilities Commitments and contingencies (see Note 9) Stockholders’ equity: Preferred stock; 20,000,000 shares authorized, none outstanding Common stock, $0.001 par value; 180,000,000 shares authorized, 52,214,606 and 51,269,081 shares issued at December 31, 2009 and December 31, 2008, respectively Additional paid-in capital Treasury stock, at cost; 7,677,341 and 7,494,466 shares at December 31, 2009 and December 31, 2008, respectively Accumulated other comprehensive loss Retained earnings Total stockholders’ equity Total liabilities and stockholders’ equity Revenue License fees Services Maintenance Subscriptions Other revenue Total revenue Cost of revenue Cost of license fees Cost of services Cost of maintenance Cost of subscriptions Cost of other revenue Total cost of revenue Gross profit Operating expenses Sales and marketing Research and development General and administrative Amortization Total operating expenses Income from operations Interest income Interest expense Other income (expense), net Income before provision for income taxes Income tax provision Net income Earnings per share Basic Diluted Common shares and equivalents outstanding Basic weighted average shares Diluted weighted average shares Dividends per share comprehensive income Cash flows from operating activities Net income Adjustments to reconcile net income to net cash provided by operating activities: Depreciation and amortization Provision for doubtful accounts and sales returns Stock-based compensation expense Excess tax benefit on exercise of stock options Deferred taxes Other non-cash adjustments Changes in assets and liabilities, net of acquisition of businesses: Accounts receivable Prepaid expenses and other assets Trade accounts payable Accrued expenses and other current liabilities Donor restricted cash Donations payable Deferred revenue Net cash provided by operating activities Cash flows from investing activities Purchase of property and equipment Purchase of net assets of acquired companies, net of cash acquired Proceeds from sale and maturity of marketable securities Net cash used in investing activities Cash flows from financing activities Proceeds from issuance of debt Proceeds from exercise of stock options Excess tax benefit on exercise of stock options Payments on debt Payments of deferred financing fees Payments on capital lease obligations Purchase of treasury stock Dividend payments to stockholders Net cash used in financing activities Effect of exchange rate on cash and cash equivalents Net increase (decrease) in cash and cash equivalents Cash and cash equivalents, beginning of year Cash and cash equivalents, end of year Supplemental disclosure of cash flow information Cash paid during the year for: Interest Taxes, net of refunds Purchase of equipment included in accounts payable Additional capital Treasury stock Accumulated income (loss) Retained earnings Total equity Balance at December 31, 2006 Net income Payment of dividends Purchase of 633,878 treasury shares under stock repurchase program and surrender of 54,079 shares upon restricted stock vesting Exercise of stock options Tax impact of exercise of nonqualified stock options Cumulative effect of the adoption of a new income tax standard Stock-based compensation Restricted stock grants Restricted stock cancellations Translation adjustment, net of tax Comprehensive income Balance at December 31, 2007 Net income Payment of dividends Purchase of 1,956,168 treasury shares under stock repurchase program and surrender of 106,446 shares upon restricted stock vesting Exercise of stock options Tax impact of exercise of nonqualified stock options and restricted stock vesting Stock options assumed in acquisition Stock-based compensation Restricted stock grants Restricted stock cancellations Translation adjustment, net of tax Comprehensive income Balance at December 31, 2008 Net income Payment of dividends Surrender of 182,875 shares upon restricted stock vesting and stock appreciation right exercise Issuance of common stock Exercise of stock options and stock appreciation rights Tax impact of exercise of nonqualified stock options and restricted stock vesting Stock-based compensation Restricted stock grants Restricted stock cancellations Translation adjustment, net of tax Comprehensive income Balance at December 31, 2009 Revenue is recognized net of sales returns and allowances. using the percentage-of-completion method. Construction-in-progress represents purchases of computer software and hardware associated with new internal system implementation projects which had not been placed in service at the respective balance sheet dates. 2011. Customer relationships Marketing assets Acquired software Non-compete agreements Database identification and measurement of uncertain tax positions. income. Years ended December 31, (in thousands) 2009 2008 2007 Years ended December 31, (in thousands) 2009 2008 2007 Years ended December 31, (in thousands) 2009 2008 2007 units. Numerator: Net income Denominator: Weighted average common shares Add effect of dilutive securities: Employee stock-based compensation Weighted average common shares assuming dilution Earnings per share: Basic Diluted ASU 2013-02. In statements (continued) Cash and cash equivalents Accounts receivable Other assets, current and noncurrent Property and equipment Intangibles Goodwill Trade accounts payable Accrued expenses and other current liabilities Deferred revenue, current and noncurrent Deferred tax liability, current and noncurrent Contingent consideration liability None of the goodwill arising from the acquisitions completed in Cash and cash equivalents Accounts receivable Marketable securities Other assets, current and noncurrent Deferred tax assets, current and noncurrent Property and equipment Intangible assets Goodwill Trade accounts payable Accrued expenses and other current liabilities Deferred revenue, current and noncurrent Debt, current and noncurrent Total purchase price Intangible assets (in thousands) Weighted average amortization period (in years) Marketing assets Customer relationships Software Total Cash and cash equivalents Accounts receivable Other current assets Property and equipment Intangible assets Goodwill Trade accounts payable Accrued expenses and other current liabilities Deferred revenue, current and noncurrent Other liabilities, noncurrent Net deferred tax liabilities, noncurrent Total purchase price assumed. None of the goodwill arising from the acquisitions completed in Customer relationships Acquired software Marketing assets Non-compete agreements Total Cash and cash equivalents Accounts receivable Other current assets Property and equipment Deferred tax assets Intangible assets Goodwill Trade accounts payable Accrued expenses and other current liabilities Deferred revenue, current and noncurrent Loans from shareholders, current Capital lease obligations, current and noncurrent Total purchase price Customer relationships Acquired software Database Marketing assets Non-compete agreements Total Revenue Net income Earnings per share, basic Earnings per share, diluted Equipment Computer hardware Computer software Construction in progress Furniture and fixtures Leasehold improvements Total property and equipment Less: accumulated depreciation Property and equipment, net of depreciation Equipment Computer hardware Computer software Total property and equipment under capital leases Less: accumulated depreciation Property and equipment under capital leases, net of depreciation The change in goodwill for each reportable segment during the Balance at December 31, 2007 Additions related to business combinations Payment of contingent consideration Effect of foreign currency translation Balance at December 31, 2008 Additions related to business combinations Adjustments related to prior year businsess combinations Subsequent recognition of deferred tax assets Effect of foreign currency translation Balance at December 31, 2009 year ended December 31, 2011. Gross carrying amount Customer relationships Marketing assets Acquired software Non-compete agreements Database Total gross carrying amount Accumulated amortization Customer relationships Marketing assets Acquired software Non-compete agreements Database Total accumulated amortization Total intangible assets, net 2011. Included in cost of revenue: Cost of license fees Cost of services Cost of maintenance Cost of subscriptions Cost of other revenue Total included in cost of revenue Included in operating expenses Total Amortization expense 2010 2011 2012 2013 2014 Total Prepaid expenses and other current assets consisted of the following as of Deferred sales commissions Prepaid software maintenance and royalties Taxes, prepaid and receivable Other Total prepaid expenses and other current assets Accrued expenses and other current liabilities consisted of the following as of Accrued bonuses Accrued commissions and salaries Customer credit balances Taxes payable Accrued health care costs Accrued accounting and legal fees Other Total accrued expenses and other current liabilities Deferred revenue consisted of the following as of December 31, Maintenance Subscriptions Services License fees and other Total deferred revenue Less: Long-term portion of deferred revenue Current portion of deferred revenue $325.0 million five-year credit facility. The As a material domestic subsidiary, Convio guarantees amounts outstanding under the credit facility and pledges certain stock of its subsidiaries. At statements (continued) furniture that are not significant. As of December 31, Years ending December 31, (in thousands) 2010 2011 2012 2013 2014 and thereafter Total minimum lease payments Less: portion representing interest Present value of net minimum lease payments Less: current maturities Long-term maturities statements (continued) Current taxes: U.S. Federal U.S. State and local International Total current taxes Deferred taxes: U.S. Federal U.S. State and local Total deferred taxes Total income tax provision U.S. International Income before provision for income taxes Federal statutory rate Effect of: State income taxes, net of federal benefit Change in state income tax rate applied to deferred tax asset Disqualifying dispositions of incentive stock options State credits, net of federal benefit Change in valuation reserve Federal credits generated Other Income tax provision effective rate Deferred tax assets relating to: Research and other tax credits Federal and state net operating loss carryforwards Allowance for doubtful accounts Deferred revenue Intangible assets Effect of expensing nonqualified stock options and restricted stock Other Total deferred tax assets Deferred tax liabilities relating to: Intangible assets Fixed assets Other Total deferred tax liabilities Valuation allowance Net deferred tax asset 2012. The following table illustrates the change in Charges to expense Years ended December 31, 2009 2008 2007 allowance: Balance at beginning of year Increases from prior period positions Decreases from prior period positions Increases from current period positions Lapse of statute of limitations Decreases relating to settlements with taxing authorities Balance at end of year Stock options Restricted stock Stock appreciation rights Included in cost of revenue: Cost of services Cost of maintenance Cost of subscriptions Total included in cost of revenue Included in operating expenses: Sales and marketing Research and development General and administrative Total included in operating expenses Total years 2001 Stock Option Plan 2004 Stock Plan Kintera 2000 Plan Kintera 2003 Plan Total A summary of outstanding stock options as of December 31, Weighted (in years) Outstanding at January 1, 2009 Exercised Forfeited Outstanding at December 31, 2009 Unvested and expected to vest at December 31, 2009 Vested and exercisable at December 31, 2009 A summary of unvested restricted stock units as of December 31, Unvested at January 1, 2009 Granted Vested Forfeited Unvested at December 31, 2009 Weighted (in years) Aggregate (in thousands) Outstanding at January 1, 2009 Granted Exercised Forfeited Outstanding at December 31, 2009 Unvested and expected to vest at December 31, 2009 Vested and exercisable at December 31, 2009 The total intrinsic value of SARs exercised during the year ended December 31, Volatility Dividend yield Risk-free interest rate Expected SAR life in years February 2009 April 2009 July 2009 October 2009 28, 2013 2012 Balance as of December 31, 2007 Stock purchased in connection with stock repurchase program Stock purchased in connection with stock repurchase program Stock acquired via surrender of shares of restricted stock to the Company upon vesting for settlement of taxes Balance as of December 31, 2008 Stock acquired via surrender of shares to the Company upon vesting of restricted stock or exercise of stock appreciation rights for settlement of taxes Balance as of December 31, 2009 Year ended December 31, 2009 Revenue Direct controllable costs Segment income Corporate costs not allocated(3) Operating expenses Interest expense, net Other income, net Income before provision for income taxes Year ended December 31, 2008 Revenue Direct controllable costs Segment income Corporate costs not allocated(3) Operating expenses Interest expense, net Other expense, net Income before provision for income taxes Year ended December 31, 2007 Revenue Direct controllable costs Segment income Corporate costs not allocated(3) Operating expenses Interest expense, net Other expense, net Income before provision for income taxes Revenue from external customers: 2009 2008 2007 Property and equipment: December 31, 2009 December 31, 2008 March 31, 2009 June 30, 2009 Total revenue Gross profit Income from operations Income before provision for income taxes Net income Earnings per share Basic Diluted March 31, 2008 June 30, 2008 Total revenue Gross profit Income from operations Income before provision for income taxes Net income Earnings per share Basic Diluted (unaudited) Raiser’sRaiser's EdgeRaiser’sRaiser's Edge is the leading software application specificallysolution designed to manage a nonprofit organizations’organization's constituent relationship management and fundraising activity. It is used by more than 13,000 organizations worldwide and has won four consecutive Campbell Awards for User Satisfaction from 2009 through 2012. The Raiser’sRaiser's Edge enables nonprofit organizations to communicatecultivate lifelong relationships with their constituents, managesupporters, and diversify fundraising activities, expand their development effortsmethods. Constituent relationship management, online fundraising and make better informed decisions through powerful segmentation, analysisemail marketing are coupled with analytics, data enrichment tools and reporting capabilities. The Raiser’s Edge is highly configurable, allowingbest practices, in a nonprofit organization to create numerous custom views of constituent records and automate a variety of business processes. Among other things, The Raiser’s Edge allows an organization to access extensive biographical and demographic information about donors and prospects, process gifts, monitor solicitation activity, analyze data and publish reports. The Raiser’s Edge improves operational efficiency and effectiveness by reducing overall mailing costs, offering faster data entry and gift processing, supporting major donor cultivation and using the Internet to send email appeals and accept online donations. The Raiser’s Edge also integrates with Microsoft®single solution. Office® to enable users to take advantage of additional functionality.In addition to the standard functionality of The Raiser’s Edge, we have built a number of extended applications to address the specific needs of various market segments.Enterprise CRMEnterprise CRM (Enterprise CRM) is a flexible, customizable, scalable and secure Constituent Relationship Management (CRM)web-based CRM solution that addresses the unique needs of largermid-size, large, federated and chapter based nonprofit organizations. EnterpriseBlackbaud CRM helps large institutionsorganizations build their brands, develop deeper and more personalized relationships with constituents, build their constituenciesbrand through online engagement and gain organizational efficiencies. Enterprise CRM brings together disparate information, such as annualmulti-channel communication tools, and capital giving, gift planning, major giving, and alumni and parent systems, across multiple locations and within the departments and programs of a large organization.become more efficient. With a single system of record that can be securely and efficiently shared, larger organizations are able to turn their data into timely, actionable information that maximizes their multi-channel fundraisingIndexFinancial Statements It tracks donors, prospects or alumni while managing gifts, pledges, and payments. eTapestry has been built to be operated in a hosted environment and be accessed via the Internet. This technology provides a system that is simple to maintain, costs little to operate and is intuitively easy to learn without extensive training. It offers nonprofit organizations a cost-effective way to manage donors, process gifts, create reports, accept online donations and communicate with constituents.Raiser’sRaiser's Edge software to build interactive websites and manage email marketing campaigns. With Blackbaud NetCommunity, organizations can, among other things, establish online communities for social networking among constituents and also provide a platform for online giving, membership purchases and event registration, and more.registration. Because Blackbaud NetCommunity requires the Raiser’sRaiser's Edge database to operate, it can only be sold with Raiser’sRaiser's Edge or to existing Raiser’sRaiser's Edge customers. However, Blackbaud NetCommunity, in concert with The Raiser’sRaiser's Edge, does provides a single source of up-to-date constituent information across an entire organization, regardless of how individual constituents interact and communicate with the organization.software-as-a-service,SaaS, provides organizations with an integrated system of applications to manage e-marketing, communications, programs, services and online fundraising. Sphere eMarketing enables an organization’sorganization's volunteers, members, donors and staff to share real-time data and information in an online community in order to better manage constituent relationships. Sphere eMarketing is designed to help organizations manage sophisticated and targeted e-mail campaigns with efficiency and control. Comprehensive real-time reports are available to help organizations make strategic data-driven decisions for future marketing campaigns.Additionally, Sphere Connect,Sphere open platform technology, provides organizationsUK. The Everyday Hero solution is focused on meeting the peer-to-peer fundraising needs of nonprofits internationally. It is a developer-friendly interfaceleading donor acquisition tool, and helps nonprofits in Asia-Pacific and the UK connect with well documented and supported APIs, and a cost-effective approach to custom application development and integration to meet unique technology and business needs.BlackbaudNowBlackbaudNow offers small organizationsyounger, more online-focused generation of donors, a fast and simple way tofirst step in helping nonprofits develop an online presence and begin accepting online donations. It allows organizations,long-term relationships with no upfront cost, to publish a simple website, accept donations, manage constituent relationships, run reports and send emails totheir supporters. A PayPal® Donate button is built into the product.applicationsolution designed to address the specific accounting, analytical and financial reporting needs of nonprofit organizations. It integrates with The Raiser’sRaiser's Edge to simplify gift entry processing and relate information from both systems in an informative manner to eliminate redundant tasks. The Financial Edge improves the transparency and accountability of organizations by allowing them to track and report from multiple views, measure the effectiveness of programs and other initiatives, use budgets as monitoring and strategic planning tools and supervise cash flow. As a result, The Financial Edge providesIndex to Financial Statements(FASB)or FASB, and Governmental Accounting Standards Board, (GASB).As with The Raiser’s Edge, we have built extended applications to address the specific functional needs of our customers such as Purchase Orders, WebPurchasing, Electronic Funds Transfer, Cash Management, Cash Receipts, Payroll, Fixed Assets, Student Billing, School Store Manager and Accounting Forms.FundWareFundWare is a fund accounting solution designed to provide nonprofit and/or government organizations with improved operational efficiencies, reporting flexibility and the ability to manage sophisticated fund allocations. It uses a configurable set of modules designed to provide functionality that meets an organization’s specific needs. FundWare unites accounting, budgeting and reporting tools with a built-in audit trail and easy-to-prepare audit schedules. Users are able to easily produce GASB and FASB financial reports including indirect costs or complex revenue allocations. Further, users have the ability to conduct real-time budget monitoring, maintain budget modification histories, including comparisons between actual and revised budgets and prepare cross-fiscal year budgets. FundWare utilizes an Excel-based reporting tool that enables the use of current Excel spreadsheets and skills while linking to FundWare’s financial database, providing real-time information without the extra step of importing or exporting.school’sschool's admissions and registrar processes, including capturing detailed student information, creating class schedules, managing attendance records and performance/grades records, producing demographic, statistic, and analytical reports and printing report cards and transcripts. With The Education Edge an organization can keep biographical and address information for students, parents, and constituents consistent across all of its Blackbaud software products. This integrated system allows an independent school to reduce data-entry time and ensure that information is current and accurate throughout the school.Blackbaud’sBlackbaud’sregistrar’sregistrar's processes. In addition, Blackbaud’sBlackbaud's Student Information System can be combined with other applications to offer integration across back-office functions, providing one-time entry for biographical information, financial reliability, and audit trail functionality. This helps significantly reduce time spent on data maintenance and creation of class schedules and allows institutions to communicate efficiently with prospects, students and alumni.boostincrease attendance and increase revenue. The Patron Edge can be integrated with The Raiser’sRaiser's Edge to allow for a complete profile view of patrons, donors or visitors. The Patron Edge offers a variety of ticketing methods and allows customers to save time and costs by streamlining ticketing, staffing, scheduling, event and membership management and other administrative tasks.IndexFinancial StatementsDirect MarketingBlackbaud Direct MarketingBlackbaud Direct Marketing allows nonprofitour customers as a SaaS offering. Altru helps general admissions arts and cultural organizations to achieve integrated campaign planning by managing direct marketing campaigns with multiple types of media and channels. It delivers campaign management capabilities including planning and budgeting, predictive analysis and list segmentation, campaign execution and performance measurement, and reporting. The result is that nonprofit organizations can more easily manage their marketing campaigns while maximizing the return on investmentgain a clear, 360-degree view of their directorganization, operate more efficiently, engage and cultivate patrons and supporters, streamline external and internal communication efforts, and reduce IT costs. It contains tools for constituent and membership management, program sales, retail sales and ticketing, volunteer management, and events management. It also has sophisticated reporting functionality and tools to manage marketing, efforts. Nonprofit organizations can integrate Blackbaud Direct Marketing with Blackbaud Enterprise CRM or The Raiser’s Edge to combine fundraising functions with direct marketing campaigns.Sphere EventsThe software productimplementationcustomization services for each of our software products. These services include:customer’scustomer's legacy system and to create a more streamlined business workflow;organization’sorganization's system is properly aligned with an organization’sorganization's processes and objectives;organization’sorganization's needs and provideconsult on how to improve a business process improvement consulting.process. This work is performed by staff consultants who have extensive and relevant domain experience in all aspects of nonprofit management, accounting, project management and IT services. This experience and knowledge allows us to make recommendations and implement best practices to help our customers reach their goals. In addition, we offer software customization services to organizations that do not have the time or in-house resources to create customized solutions for our core products. We believe that no other software company provides asthis broad a range of consulting and technology services and solutions dedicated to the nonprofit industry.Index to Financial StatementsBlackbaud OnDemandThe Blackbaud OnDemand hosting solution provides our customers with a convenient, affordable alternative to setting up and managing Blackbaud applications on their own. Our technical team will set up and manage on an ongoing basis the hosting of one or more Blackbaud systems on our secure servers and ensure that they are accessible and current on a 24/7 basis. All that is needed to connect is a web browser. We manage everything from initial data setup through network security configuration.Target Analyticswas formed in early 2008 by combining Blackbaud’sprovides comprehensive solutions for donor acquisition, prospect research, division with the then newly acquired Target Analysis Group. We addeddata enrichment, and performance management, enabling nonprofits to the offerings further in 2008 with the P!N wealth screening service which was added with the acquisition of Kintera.define effective campaign strategies and maximize fundraising results. Target Analytics offers a comprehensive range of productsservices, software, analytics, and services for nonprofit organizations’ analytics needs. These include donor acquisition and development tools, prospect segmentation, wealth identification and collaborative peer benchmarking.data within the following areas:offers software, solutions, and services such as:Acquisition Lists—Target Analytics’leverages unique data assets to create acquisition mailing lists are built using a proprietary cooperative database designed exclusively for nonprofit mailing listsand predictive models that identify donor populations that meet the affinity, value, and response modeling. The database was developedcriteria of our nonprofit clients. Nonprofit organizations use our prospect lists to help locate the best prospects for each organizationsolicit gifts and make acquisition efforts more productive.other support.WealthPoint—A database screening solution that delivers detailed wealth identification information on prospects. WealthPoint provides initialProspect Research - Nonprofit organizations use Target Analytics' prospect qualification, assists with prospectresearch solutions to develop major gift and personal fundraising cultivation and delivers information on financial capacity.P!N Service—A wealth profiling and screening service that enables nonprofits to more efficiently identify, profile, monitor and rank the wealth of prospects in their databases. Additionally, this service enables nonprofits to edit, analyze, prioritize and combine external data collected from a wide range of sources with its internal donor database.ProspectPoint—Astrategies. Prospect research solutions include: custom data modeling solution that delivers critical information on a prospect’s or donor’sprospect's likelihood to make a gift to an organization. It analyzes currentorganization; wealth screenings that deliver detailed wealth information and historicalgiving capacity data from external sourceson prospects; and behavioral trends to identify an organization’s best potential annual, planned and major giving prospects, as well as recommends appropriate “ask” amounts and gift types.ResearchPoint—Combinesweb-based prospect management software that combines public data with donor information from a nonprofit’snonprofit's database of records to build a complete view of prospects enabling it to better targetfor targeting and securesecuring gifts. It also enables organizations to help uncover major and planned giving prospects within a nonprofit’s database.donorCentrics—A set of strategic analytic and benchmarking tools designed to drive fundraising at nonprofit organizations. These reports uncover strengths and weaknesses in fundraising programs, highlight opportunities for growth and facilitate strategy-sharing across organizations.Data Enrichment—Services that enrich enhance the quality of the data in our customers’customers' databases. These include a service that findsServices include: identifying outdated address files in the database and makesmaking corrections based on the requirements and certifications of the United States Postal Service, and a service that usesas well as appending data by using known fields in an organization’sorganization's constituent records to search and find lost donorsidentify key demographic and prospects.contact information.IndexFinancial StatementsMaintenanceplansprograms enjoy fast, reliable customer support, receive regular software updates, stay up-to-date with support newsletters and have unlimited, around-the-clock access to support resources, including our extensive knowledgebase and forums. Customers who enroll in upgraded maintenance plans receive enhanced benefits.ThroughBlackbaud Merchant Services is a value-added service integrated with our Sphere products, we provide paymentsolutions that makes credit card processing services in which we collect funds on behalf of oursimple and secure. Customers are charged one rate for transactions, with no extra fees, making Blackbaud Merchant Services a competitive option. The service also provides customers forwith a processing fee.Customers2009,2012, we had approximately 22,000more than 27,000 active customers that rangeranging from small, local charities, to healthcare and higher education organizations, to the largest national health and human services organizations. No onesingle customer accountsaccounted for more than 2% of our annual2012 revenue.forces.force. Our direct sales force is complemented by a team of account development representatives responsible for sales lead generation and qualification. These sales and marketing professionals are located in Charleston, South Carolina, Cambridge, Massachusetts, near Indianapolis, Indiana and in San Diego, California. We also employ remote sales staff in metropolitan areas throughout the United States, the United Kingdom, the Netherlands, Canada, Australia and Australia.New Zealand. As of December 31, 2009,2012, we had approximately 233250 direct sales employees. We plan to continue expanding our direct sales force in the Americas, Europe, Australia and Asia as our operations grow internationally and market demand recoverscontinues to recover from the current economic environment. During 2009, our sales force was divided into two main areas of responsibility:Selling products and services to existing customers; andAcquiring new customers.In addition, a dedicated portion of our sales team is focused exclusively on large, enterprise-wide accounts. We have a group of sales engineers who support both new and existing customers in this market segment. In general, sales representatives are responsible for handling one product line in a designated geographic area. However, sales representatives for the K-12 independent schools market, small college market and the arts and cultural market are responsible for selling all of our software products.Raiser’sRaiser's Edge, Blackbaud CRM or Blackbaud Enterprise CRM,Luminate, and then selloffer additional products and services to the customer as the organization’sorganization's needs increase.Index to Financial Statementsemployee-focusedemployee-volunteer programs. In addition to having employees select grant recipients for our endowment fund, we celebrate individual acts of service through a competitive grant program that honors excellent examples of volunteerism and benefits the organizations they serve.although the competition is highlyand fragmented. For certain areas of the market, entry barriers are low. However, we believe our experience and product depth makes us a formidablestrong competitor. We expect to continue to see new competitors as the market matures and as nonprofit organizations become more aware of the advantages and efficiencies attainable through the use of specialized software. A number of diversified software enterprises have made acquisitions or developed products for the market, including Ellucian, Sage and SunGard.Campus Management. Other companies that compete with us, such as Microsoft, Salesforce.com and Oracle, have greater marketing resources, revenue andfewsome products that are designed specifically for nonprofits, in addition to some of their products which have a degree of functionality for nonprofits that could be considered competitive. These larger companies could decide to enterfocus more on the marketnonprofit sector with new, directly competitive products or through acquisitions of our current competitors.organizations;Custom-developed solutions;services;services such as services that support traditional direct mail campaigns, special events fundraising, telemarketing andthe nonprofit organizationorganizations or outside by custom service providers. We believe that we compete successfully, against these companies, asbecause building aefficient, highly functional custom solutionsolutions equal to ours requires extensive financial and technical resources that mayare beyond the capabilities of custom solution providers or require resources that might not be available or cost-effective for thewithin nonprofit organization.organizations. In addition, the nonprofit organization’sorganization's legacy database and software system may not have been designed to support the increasingly complex and advanced needs of today’stoday's growing community of nonprofit organizations.market’smarket's needs. We believe we compete successfully against these traditional fundraising services, primarily because our products and services are more automated, more robust, more tailored to the needs of non-profits and more efficient.Index to Financial Statements2009,2012, we had approximately 377484 employees working on research and development. Our research and development expenses for the years ending on December 31, 2009, 2008,2012, 2011 and 20072010 were $45.7$64.7 million $38.7, $47.7 million and $28.5$45.5 million, respectively.Enterprises CRM, and Blackbaud Direct Marketing that are built on the Microsoft® .Net™ .Net framework platform. These products are web-delivered applications utilizing a Service Oriented Architecture built on Internet standards and protocols such as HTTP, XML and SOAP. This architecture is designed to support flexible deployment scenarios including both on-premise, as well as hosted by Blackbaud in a SaaS model.applications, and SaaS. The applications expose web service application programming interfaces so that functionality and business logic can be accessed programmatically from outside the context of an interactive user application. This allows our customers to extend and modify the functionalitywithoutthat use a single code base and employ a multi-tenant architecture requiring them to make any source code or data modifications themselves. Thisonly a web browser for client access. The Luminate Online platform is important for customers who want to customize our applications by incorporating their own business logic into key areas ofopen and extensible and is built on the applications.Java runtime environment. The end resultLuminate CRM platform is a robust customization platform through whichbuilt on the application can be modified and extended without requiring source code alteration.® Component Object Model, (COM).or COM.both our .Net and COM-based development models ensure our applications are:allows us to easily add features and functionality or to integrate with third-party applications in order to adapt to our customers' needs or market demands.•Flexible.Our component-based architecture is programmable and easily customized by our customers without requiring modification of the source code, ensuring that the technology can be extended to accommodate changing demands of our clients and the market.•Adaptable.The architecture of our applications allows us to easily add features and functionality or to integrate with third-party applications in order to adapt to our customers’ needs or market demands.•Scalable.We combine a scalable architecture with the performance, capacity and load balancing of industry-standard web servers and databases used by our customers to ensure that the applications can scale to the needs of larger organizations.havecombine a scalable architecture with the performance, capacity and load balancing of industry-standard web servers and databases used by our customers to ensure that the applications can scale to the needs of larger organizations. In addition, if we are unable to obtain licenses for third-party technology for future products, our product development could be delayed, which in turn could harm our business and operating results.“Blackbaud”“Blackbaud,” “The Raiser's Edge”, “The Raiser’s Edge”“Blackbaud CRM” and “Blackbaud Enterprise CRM”."Luminate." We have applied for additional trademarks. We currently have sixtwo active patents pending on our technology, including functionalityand have filed two provisional patent applications in The Financial Edge, The Information Edge, and ProspectPoint.Index to Financial StatementsEmployees2009,2012, we had 1,9562,705 employees, consisting of 436552 in sales and marketing, 377484 in research and development, 508740 in consulting and professional services, 249305 in customer support, 166328 in subscriptions and 220296 general and administrative personnel. None of our employees are represented by unions or are covered by collective bargaining agreements. We are not involved in any material disputes with any of our employees, and we believe that relations with our employees are satisfactory.SEC.SEC, but other information on our website is not incorporated into this report. The SEC maintains an Internet site that contains these reports atwww.sec.gov. certain information concerning our executive officers as of February 25, 2010:December 31, 2012: Age 5457 50 Senior Vice President and Chief Financial Officer Charles T. Cumbaa 5760 Joseph D. Moye 51 President, Enterprise Customer Business Unit 5154 Timothy V. Williams 6051 Chief Financial Officer, President, International Business UnitJana B. Eggers 44 Senior Vice President, TreasurerProducts and Assistant SecretaryMarketingLouis J. Attanasi 4856 Senior Vice President of Product DevelopmentLee W. Gartley45Senior Vice President, President of Target AnalyticsCharles L. Longfield53 5457 Heidi H. Strenck40Senior ViceIn January 2013, Mr. Chardon informed us that he is resigning as our President Controller, Assistant Treasurer and Assistant SecretaryGerard J. Zink46Senior Vice PresidentChief Executive Officer and director at the end of General Markets Business Unit Customer SupportDigital’sDigital's corporate strategy development. Mr. Chardon is an American/French dual national. He is an economics honors graduate from Harvard University.sincefrom January 2010. From, May 20012010 to December 2009 he served as Senior Vice President of Products and Services.April 2012. Prior to joining us, Mr. Cumbaa was an Executive Vice President with Intertech Information Management from December 1998 until October 2000. From 1992 until 1998, he was President and Chief Executive Officer of Cognitech, Inc., a software company he founded. From 1984 to 1992 he was Executive Vice President of Sales and Services at Sales Technologies. Prior to that, he was employed by McKinsey & Company. Mr. Cumbaa holds a BA from Mississippi State University and an MBA from Harvard Business School.IndexFinancial Statementsworld’sworld's largest providers of information services and transaction processing to the travel industry, Mr. Mooney was responsible for global sales, marketing, training, service and support activities. Prior to that he was Chief Financial Officer for Worldspan from March 2005 until it was acquired by Travelport in August 2007. Mr. Mooney has also held key executive positions in the telecommunications industry.industry and he is a member of the Board of Directors of tw telecom inc., a publicly traded company. Mr. Mooney graduated from Seton Hall University and holds an MBA in Finance from Georgia State University.Timothy V. WilliamshasBradley J. Holman, President of the International Business Unit, joined us in November 2010. Prior to joining Blackbaud, Mr. Holman served as ourPartner and Chief FinancialCommercial Officer since January 2001. Mr. Williams is responsible for all of our financial reportingat ATI Business Group, a Jakarta-based company that provides outsourcing and controls, as well as human resources and legal. From January 1994 to January 2001 he served as Executive Vice President and CFO of Mynd, Inc. (now a subsidiary of Computer Sciences Corporation), a provider of software andtechnical services to the insurance industry.aviation and travel sectors, from February 2010 to October 2010. Prior to that, from June 2006 to February 2010, Mr. Williams worked at Holiday Inn Worldwide, most recently as Executive Vice President and Chief Financial Officer. Mr. Williams serves on the Board of Directors of PROS Holdings, Inc., a publicly traded software development company. Mr. Williams holds a BA from the University of Northern Iowa.Louis J. AttanasihasHolman served as ourPresident of Travelport's Asia Pacific operations, which provides information services and transaction processing to the travel industry. From July 2001 to May 2006, Mr. Holman held various senior management roles at Travelport, including Senior Vice President of Product Development since January 2010. From January 2007 to January 2010, he served asairline services in Asia Pacific and Managing Director of operations in Europe, Middle East and Africa. Mr. Holman holds a BC from University of Western Australia.initially servingand Marketing, joined us in the capacity of Vice President of Products in 1996. From May 1986 to 1996, he served as a Software Engineer, Product Architect, and Product Development Manager.November 2010. Prior to joining us, he taught mathematicsBlackbaud, Ms. Eggers served as Chief Executive Officer of Germany-based Spreadshirt from October 2006 to November 2010. Prior to that, Ms. Eggers served as General Manager and Director for Intuit from April 2002 to October 2006, where she founded and led the company's corporate Innovation Lab, which researched and designed new offerings. From March 2003 to October 2006, Ms. Eggers also served as General Manager for Intuit's QuickBase business, serving the Fortune 100, where it became Intuit's fastest-growing business unit. Ms. Eggers has also held executive and technology leadership positions at the State University of New York at Stony Brookinternationalization firm Basis Technology, American Airline's Sabre, Los Alamos National Laboratory and worked as a Software Engineer at Environmental Energy Corporation. Mr. Attanasiseveral acquired start-ups. Ms. Eggers holds a BS in Mathematics and Computer Science from State University of New York at Stony Brook and an MS in Mathematics from the University of Charleston.Hendrix College.Lee W. Gartleyjoined us in January 2007 as a Senior Vice President as part of our acquisition of the Target Companies. Mr. Gartley remains President of, and responsible for the day-to-day operations of, Target Analytics. Prior to joining the Target Companies in 1998, Mr. Gartley was a senior marketer with Art Technology Group from 1996 until 1998 where he helped to launch an online commerce platform. From 1992 to 1996 he was a management consultant with Boston Consulting Group working with clients in a variety of industries to develop and implement sound strategy. Mr. Gartley holds a BA in Physics from Bowdoin College and an MBA from the Kellogg Graduate School of Management.world’sworld's largest nonprofitMasters of ScienceMS in Counseling and a BA in Psychology from the State University of New York at Oswego.Heidi H. Strenckhas served as our Senior Vice President and Controller since January 2007. From October 2002 until January 2007, Ms. Strenck served as our Vice President and Controller. Ms. Strenck joined us in September 1996 and held key management roles as Accounting Manager from 1996 until 1997 and as Controller until 2002. Prior to joining us, she served as a Senior Associate with Coopers & Lybrand and as Internal Auditor for The Raymond Corporation. Ms. Strenck holds a BA from Hartwick College.Index to Financial StatementsGerard J. Zinkhas served as our Senior Vice President of General Markets Business Unit Customer Support since January 2010. From January 2007 until January 2010, Mr. Zink served as our Senior Vice President of Customer Support. From June 1996 until January 2007 he served as our Vice President of Customer Support. Mr. Zink is responsible for overall customer satisfaction, information technology and administrative services. He joined us in November 1987 and served as a Customer Support Analyst and Manager of Customer Support before assuming his current position.RISK FACTORS During 2009, we experienced a decrease in demand for our products and services as difficult and uncertain economic conditions put pressure on the spending of many organizations in the nonprofit industry. Higher interest rates, inflation, higher costs of labor, insurance and healthcare, higher tax rates and other changes in tax laws, changes in other laws and regulations and other economic factors in the United States could increase our cost of sales and operating, selling, general and administrative expenses, and otherwise adversely affect our operations and operating results. These factors affect not only our operations, but also the operations of suppliers from whom we purchase or license products and services, a factor that could result in an increase in the cost to us of our products and services, reducing our margins.Raiser’sRaiser's Edge, Luminate Online and Blackbaud Enterprise CRM, and a decline in sales or renewals of thisthese or similar products and related services could harm our business.Raiser’sRaiser's Edge and Blackbaud Enterprise CRM, and other products that help customers manage constituent relationships and related services, and we expect revenue from these products and related services is expected to continue to account for a substantial portion of our total revenue for the foreseeable future. For example, revenue from the sale of The Raiser’sRaiser's Edge and related services represented approximately 38%30%, 45%,35% and 50%38% of our total revenue in 2009, 20082012, 2011 and 2007, respectively. Revenue from the sale of Blackbaud Enterprise CRM and related services represented approximately 4%2010, 2%, and 1% of our total revenue in 2009, 2008 and 2007, respectively. Because we generallyoften sell licenses to our products on a perpetual basis and deliver new versions and enhancements to customers who purchase annual maintenance and support, our future license, services and maintenanceThe Raiser’s Edgethese or similar products to new customers and then attempt to generate incremental revenue from the sale of additional products and services. If demand for The Raiser’sRaiser's Edge, Luminate Online, Blackbaud Enterprise CRM or similar products declines significantly, our business would suffer.enterprise-wideenterprise clients, generally commit significant resources to an evaluation of available software and require us to expend substantial time, effort and money educating them as to the value of our software and services. Sales of our software products to these larger customers often require anIndex to Financial Statementscustomers and large enterprise-wide sales.customers. Recently, we have experienced longer sales cycle times, delays and postponements of purchasing decisions by our current and prospective customers as a result of challenges posed upon nonprofit organizations by the weakuncertain economic environment. Our sales cycle for all of our products and services is subject to significant risks and delays over which we have little or no control, including:our customers’Our customers' budgetary constraints;theThe timing of our clients’clients' budget cycles and approval processes;theThe impact of the macro economicmacroeconomic environment on our customers;our clients’Our clients' willingness to replace their current methods or software solutions;ourOur need to educate potential customers about the uses and benefits of our products and services; andtheThe timing and expiration of our clients’clients' current license agreements or outsourcing agreements for similar services.Our implementation cycle for large enterprise-wide sales can extend for a year or more, which can negatively impact the timing and predictability of our revenue. Enterprise CRM engagements, involvefrequently involves complex configuration, business process reengineering and system interfaces.interfaces and can extend for a year or more. Our Enterpriseenterprise CRM product offering isofferings are relatively new, and we may not have historical experience with unanticipated implementation challenges or complexities that could arise in these engagements. Further, these projects typically are heavily dependent on customer participation, communication and timely responsiveness throughout the implementation cycle. As the complexity of these engagements increase,increases, our revenues and profitability could suffer from delays in project completion and having to perform unplanned incremental services at rates substantially below our normal hourly rates and from delaysor make investments in project completion.the form of non-billable service hours or other concessions. If we are unsuccessful in implementing our products or if we experience delays, it could have a material adverse effect on our profitability and the timing and predictability of our revenue.increase salessell additional products and services to our existing customers. Many of our customers initially make a purchase of only one or a limited number of our products or only for a single department within their organization. These customers might choose not to expand their use of or makeIndex to Financial StatementsSoftware-as-a-Service (SaaS) pricing modeloffering of our products on a subscription basis is evolving and demand by our customers for this modelthese offerings is increasing. Our failure to manage itsthis evolution and demand could lead to lower than expected revenues and profits.has beenwas derived from increased subscription offerings, including SaaS. This business model depends heavily on achieving economies of scale because the initial upfront investment is costly and the associated revenue is recognized on a ratable basis. If we fail to achieve appropriate economies of scale or if we fail to manage or anticipate the evolution and demand offor the subscription software pricing models, then our business and operating results could be adversely affected. generalized software solutions not specifically designed for the nonprofit market. Nonprofit organizations that have already invested substantial resources in other fundraising methods or other non-integrated software solutions might be reluctant to adopt our products and services to supplement or replace their existing systems or methods. In addition, the implementation of one or more of our core software products can involve significant time and capital commitments by our customers, which they may be unwilling or unable to make. If demand for and market acceptance of our products and services does not increase, we might not grow our business as we expect.termterms of the customer agreement isagreements typically 12 months, although, it can extend to threerange from 1-3 years. As a result, much of the revenue we report in each quarter is attributable to agreements entered into during previous quarters. Consequently, a decline in sales to new customers, renewals by existing customers or market acceptance of our products in any one quarter will not necessarily be fully reflected in the revenues in that quarter and will negatively affect our revenues and profitability in future quarters.businessproducts and services might be perceived as not being secure and our reputation and business could suffer.Third partiesAlthough we have commercially available network and application security, internal control measures, and physical security procedures to safeguard our systems, there can be no assurance that a security breach, intrusion, loss or theft of personal information will not occur, which may attempt to breach our security or that of our customers and their databases. We might be liable to our customers for any breach in such security and any breach could harm our customers, our business, and our reputation. Any imposition of liability, particularly liability that is not covered by insurance or is in excess of insurance coverage, could harm ourcustomer reputation and our businessfuture financial results and operating results. Also, computers, including those that utilize our software, are vulnerable to computer viruses, physical or electronic break-ins and similar disruptions, which could lead to interruptions, delays or loss of data. We might be requiredmay require us to expend significant capital and other resources to protect further against security breaches or to rectifyaddress these problems, caused by any security breach.Index to Financial Statementsproblemproblems that results in customer or donor personal information being obtained by unauthorized persons could adversely affect our reputation with our customers and others, as well as our operations, results of operations, financial condition and liquidity and could result in litigation against us or the imposition of penalties. In addition, a security breach could require that we expend significant additional resources related to our information security systems and could result in a disruption of our operations, particularly our online sales operations.customers’customers' storage and use of data concerning their customers, including financial, personally identifying and other sensitive data. Our customers’customers' collection and use of thesethis data for donor profiling might raise privacy and security concerns and negatively impact the demand for our products and services. For example, our custom modeling and analytical services, including ProspectPoint, WealthPoint and donorCentrics, rely heavily on securing and making use of data we gather from various sources and privacy laws could jeopardize our ability to market and profit from those services. If a breach of customer data security were to occur, our products may be perceived as less desirable, which would negatively affect our business and operating results.In 2009, data security and privacy have remained material concerns for both our customers and state legislatures. wouldcould suffer and we and/or our customers would likely have to change our business practices. In addition, these laws and regulations could impose significant costs on us and our customers and make it more difficult for donors to make online donations.Additional PCI DSS standards go into effect next year. Index to Financial Statementsservicessubscriptions and subscriptionservices revenue produces substantially lower gross margins than our license revenue, and changes in the relative mix of these and other sources of revenue could negatively affect our overall gross margins.services revenue, which includes fees for consulting, implementation, training, data and technical services and analytics, was approximately 28%, 33% and 36% of our revenue for 2009, 2008 and 2007, respectively. Our services revenue has substantially lower gross margins than our product license revenue. An increase in the percentage of total revenue represented by services revenue would adversely affect our overall gross margins.Certain of our services are contracted under fixed fee arrangements, which we base on estimates. If our estimated fees are less than our actual costs, our operating results would be adversely affected. Services revenue as a percentage of total revenue has varied significantly from quarter to quarter due to fluctuations in licensing revenue, economic changes, changes in the average selling prices for our products and services, our customers’ acceptance of our products and our sales force execution. In addition, the volume and profitability of services can depend in large part upon:competitive pricing pressure on the rates that we can charge for our services;the complexity of the customers’ information technology environment and the existence of multiple non-integrated legacy databases;the resources directed by customers to their implementation projects; andthe extent to which outside consulting organizations provide services directly to customers.For example, revenue from our training services, which represented 17%, 22% and 23% of our total services revenue during 2009, 2008 and 2007, respectively, has recently experienced a decrease in demand because existing and prospective customers have been experiencing budgetary constraints resulting from the challenges posed by the overall economic environment. The training services revenue typically has a higher gross margin than other services revenue. A continued decrease in the demand for training services could adversely affect our profitability and operating results.Our subscriptionsubscriptions revenue, which includes fees for providing access to hosted applications, application hosting services and access to certain data services and our online subscription training offerings, has experienced the largest percentage revenue growth over the last three years. SubscriptionSubscriptions revenue was approximately 24%16%28% and 10%26% of our revenue for 2009, 20082012, 2011 and 2007,2010, respectively. Our subscriptionsubscriptions revenue has substantially lower gross margins than our product license revenue. AnFor the years ended December 31, 2012, 2011 and 2010, our subscriptions margin was 58%, 59% and 63%. A continued increase in the percentage of total revenue represented by subscriptionsubscriptions revenue could adversely affect our overall gross margins. Ifmargins and operating results if we are unable to achieve economies of scale in our subscription based offerings. Additionally, if nonprofits in general, and specifically our customers and prospects, desire to adopt our subscription offerings much more rapidly than we currently anticipate and we are unable to respond in a timely fashion, we could encounter significant effects to our business, including substantial capital expenditures, reduction in profitability, decrease in revenue growth and/or we could become potentially less competitive, resulting in a loss of market share.Any erosionforthan our product license revenue. For the years ended December 31, 2012, 2011 and 2010, our services and/or subscription revenue or any adverse changesmargin was 19%, 27% and 24%, respectively. An increase in the mixpercentage of our license versus service and subscriptiontotal revenue represented by services revenue without an improvement in services margin could adversely affect our operating results.IndexFinancial StatementstheThe size and timing of sales of our software, including the relatively long sales cycles associated with many of our larger software sales;budgetBudget and spending decisions by our customers;marketThe degree of judgment required to estimate large consulting service engagements;marketMarket acceptance of products we acquire;theThe amount and timing of operating costs related to the expansion of our business, operations and infrastructure;changesChanges in our pricing policies or our competitors’competitors' pricing policies;seasonality in our revenue;generalGeneral economic conditions;conditions andcostsCosts related to acquisitions of technologies or businesses.softwareSoftware developers offering integrated specialized products designed to address specific needs of nonprofit organizations;providersProviders of traditional, less automated fundraising services such as services that support traditional direct mail campaigns, special events fundraising, telemarketing and personal solicitations;custom-developedCustom-developed products created either internally or outsourced to custom service providers; andsoftwareSoftware developers offering general products not designed to address specific needs of nonprofit organizations.IfCompanies such as Microsoft, Salesforce.com and Oracle offer some products that are designed specifically for nonprofit organizations, in addition to some of their products which have a degree of functionality for nonprofit organizations that could be considered competitive. Also, if one or more of our competitors or potential competitors were to merge or partner with one of our other competitors, the change in the competitive landscape could adversely affect our ability to compete effectively. For example, a large diversified software enterprise, such as Microsoft, Oracle or Salesforce.com, could decide to enter the market directly, including through acquisitions.Index to Financial StatementsWe cannot assure youThere is no assurance that we will successfully identify new product opportunities and develop and bring new products to market in a timely and cost-effective manner. Further, there can be no assurance that the products, capabilities or technologies developed by others will not render our products or technologies obsolete or noncompetitive. In addition, because our service is designed to operate on a variety of network hardware and software platforms using a standard browser, we will need to continuously modify and enhance our service to keep pace with changes in Internet-related hardware, software, communication, browser and database technologies. We have made and continue to make significant working capital investments in accordance with evolving industry and customer requirements. These concentrations of working capital increase our risk of loss due to product or technology obsolescence. If we are unable to develop or acquire on a timely and cost-effective basis new software products or enhancements to existing products or if such new products or enhancements do not achieve market acceptance, our business, results of operations and financial condition may be materially adversely affected.If we were found subject to or in violation of any laws or regulations governing privacy or electronic fund transfers, we could be subject to liability or forced to change our business practices.It is possible that the payment processing component of our web-based software is subject to various governmental regulations. Any further legislation at the state and federal levels could also restrict further our information gathering and disclosure practices. Existing and potential future privacy laws might limit our ability to develop new products and services that make use of data we gather from various sources. For example, our custom modeling and analytical services, including ProspectPoint, WealthPoint, P!N and donorCentrics, rely heavily on securing and making use of data we gather from various sources and privacy laws could jeopardize our ability to market and profit from those services. The provisions of these laws and related regulations are complicated, and we do not have extensive experience with these laws and related regulations. Even technical violations of these laws can result in penalties that are assessed for each non-compliant transaction. In addition, we might be subject to the privacy provisions of the Health Insurance Portability and Accountability Act of 1996 and the Gramm-Leach-Bliley Act and related regulations. If we or our customers were found to be subject to and in violation of any of these laws or other privacy laws or regulations, our business would suffer and we and/or our customers would likely have to change our business practices. In addition, these laws and regulations could impose significant costs on us and our customers and make it more difficult for donors to make online donations.the employeeskey personnel and personnel we need to support our planned growth. To meet our objectives successfully, we must attract and retain highly qualified personnel with specialized skill sets focused on the nonprofit industry. Competition for qualified personnel can be intense, and we might not be successful in attracting and retaining them. The pool of qualified personnel with experience working with or selling to nonprofit organizations is limited overall and specifically in Charleston, South Carolina, where our principal office is located. Our ability to maintain and expand our sales, product development and professional services teams will depend on our ability to recruit, train and retain top quality people with advanced skills who understand sales to, and the specific needs of, nonprofit organizations. For these reasons, we have from time to time in the past experienced, and we expect to continue to experience in the future, difficulty in hiring and retaining highly skilled employees with appropriate qualifications for our business. In addition, it takes time for our new sales and services personnel to become productive, particularly with respect to obtaining and supporting major customer accounts. In particular,Index to Financial Statementswe plan to continue to increase the number of services personnel to attempt to meet the needs of our customers and potential new customers. In addition to hiring services personnel to meet our needs, weWe might also engage additional third-party consultants as contractors, which could have a negative impact on our earnings. If we are unable to hire or retain qualified personnel, or if newly hired personnel fail to develop the necessary skills or reach productivity slower than anticipated, it would be more difficult for us to sell our products and services, we could experience a shortfall in revenue or earnings and not achieve our planned growth.harmHarm to our reputation;lostLost sales;delaysDelays in commercial release;productProduct liability claims;delays in or loss of market acceptance of our products;licenseLicense terminations or renegotiations; andunexpectedUnexpected expenses and diversion of resources to remedy errors.Index to Financial Statementsdependdepends to a significant degree upon the protection of our software and other proprietary technology rights. We might not be successful in protecting our proprietary technology and our proprietary rights might not provide us with a meaningful competitive advantage. To protect our core proprietary technology, we rely on a combination of patent, trademark, copyright and trade secret laws, as well as nondisclosure agreements, each of which affords only limited protection. We currently do not have patents issued for any of our proprietary technology and we only recently filed patent applications relating to a number of such products. Moreover, we have no patent protection for The Raiser’sRaiser's Edge, which is one of our core products and responsible for a significant portion of our revenue. Any inability to protect our intellectual property rights could seriously harm our business, operating results and financial condition. It is possible that:our pending patent applications may not result in the issuance of patents;anyAny patents issued to us may not be timely or broad enough to protect our proprietary rights;anyAny issued patent could be successfully challenged by one or more third parties, which could result in our loss of the right to prevent others from exploiting the inventions claimed in those patents; andcurrentCurrent and future competitors may independently develop similar technologies, duplicate our products or design around any of our patents.If we do not successfully address the risks inherent in the expansion of our international operations, our business could suffer.We currently have operations in Canada, United Kingdom, Netherlands and Australia, and we intend to expand further into international markets. We have limited experience in international operations and may not be able to compete effectively in international markets. Our international offices generated revenues of approximately $39.7 million, $40.3 million and $36.2 million for the years ended December 31, 2009, 2008 and 2007, respectively. Accordingly, international revenue decreased 1.5% in 2009 and increased 11.3% in 2008. Expansion of our international operations will require a significant amount of attention from our management and substantial financial resources and may require us to add qualified management in these markets. Our direct sales model requires us to attract, retain and manage qualified sales personnel capable of selling into markets outside the United States. In some cases, our costs of sales might increase if our customers require us to sell through local distributors.If we are unable to grow our international operations in a cost effective and timely manner, our business and operating results could be harmed. Doing business internationally involves additional risks that could harm our operating results, including:difficulties associated with and costs of staffing and managing international operations;differing technology standards;difficulties in collecting accounts receivable and longer collection periods;political and economic instability;Index to Financial Statementsfluctuations in currency exchange rates;imposition of currency exchange controls;potentially adverse tax consequences;reduced protection for intellectual property rights in certain countries;dependence on local vendors;protectionist laws and business practices that favor local competition;compliance with multiple conflicting and changing governmental laws and regulations;seasonal reductions in business activity specific to certain markets;longer sales cycles;restrictions on repatriation of earnings;differing labor regulations;restrictive privacy regulations in different countries, particularly in the European Union;restrictions on the export of technologies such as data security and encryption; andimport and export restrictions and tariffs.At December 31, 2009 we had no borrowings under our revolving credit facility, however, we may draw on our revolving credit facility from time to time to help us meet our short-term financial needs. revolving credit facility contains restrictions, including covenants limiting our ability to incur additional debt, grant liens, make acquisitions and other investments, prepay specified debt, consolidate, merge or acquire other businesses, sell assets, pay dividends and other distributions, repurchase stock and enter into transactions with affiliates. There can be no assurance that we will be able to remain in compliance with the covenants to which we are subject in the future and, if we fail to do so, that we will be able to obtain waivers from our lenders or amend the covenants.have guaranteedwill be required to guarantee amounts borrowed under the credit facility, and we have pledged the shares of certain of our subsidiaries as collateral for our obligations under the credit facility. Any such default could have a material adverse effect on our ability to operate, including allowing lenders under the credit facility to enforce the guarantees of our subsidiaries, if any, or exercise their rights with respect to the shares pledged as collateral.OurAs of December 31, 2012, we have deferred tax asset balanceassets recognized of $61.3$87.8 million, of which $35.9$13.7 million relates to our 1999 recapitalization, was approximately 20% of our total assets as of December 31, 2009.Index to Financial Statements$17.3$26.9 million related to federal net operating loss carryforwards which is approximately 6% of our total assets at December 31, 2009.2012. Our federal net operating loss carryforwards are subject to limitations on how much may be utilized on an annual basis. The use of the net operating loss carryforwards may have additional limitations resulting from certain future ownership changes or other factors under Section 382 ofset forth in the Internal Revenue Code. If our net operating loss carryforwards are further limited, and we have taxable income which exceeds the available net operating loss carryforwards for that period, we would incur an income tax liability even though net operating loss carryforwards may be available in future years prior to their expiration, which would have an adverse affecteffect on our future cash flow, financial condition and results of operations.Weableaccretive and might cause dilution to implementthe combined company's earnings per share, which could negatively impact the price of our common stock.unit reorganization successfully.Effective January 1, 2010, we reorganizedas a publicly traded company and excluding the impact of merger-related expenses. Such estimates and assumptions could materially change due to the failure to realize any or all of the benefits expected in the acquisition or other factors beyond our business into three operating units to better align our organization around key customer groups. The three operating units arecontrol or the General Markets Business Unit, the Enterprise Customer Business Unit and the International Business Unit. The successful reorganizationcontrol of Convio. All of these operating units will require, among other things, coordination of direct revenue-generating activities, including sales, professional services and customer support within each unit. The diversion of management’s attention and any difficulties encountered in this process might negatively impact our ability to implementfactors could delay, decrease or eliminate the reorganization and our goal to better align our operating structure with the different needsexpected accretive effect of the diverse typesacquisition and sizescause resulting dilution to our non-GAAP EPS or to the price of organizations we serve and, ultimately, our ability to improve our competitive and financial performance in the future.recentcompleted acquisitions and, as a result, might not realize the expected benefits of these acquisitions.In April 2009, we acquired RLC. During 2008, we acquired Kintera and during 2007 we acquiredTarget Companies and eTapestry.past five years including, most recently, our acquisition of Convio. Managing and integrating the operations and personnel of an acquired company can be a complex process. The integration might not be completed rapidly or achieve the anticipated benefits of the acquisition. The successful integration of the acquired companies will require, among other things, coordination of various departments, including product development, engineering, sales and marketing and finance. Further, a successful integration of the acquired companies internal control structure will be required. The diversion of the attention of management and any difficulties encountered in this process could cause the disruption of, or a loss of momentum in, sales or product development. The inabilityIf we are unable to successfully integrate the operations and personnel of our recently acquired companies, or if there is any significant delay in achieving integration, could have a material adverse effect onwe will not realize the revenue growth, synergies and other anticipated benefits we expected and our business and on the market priceresults of operations could be adversely affected.common stock.Indexrecent acquisitions, our business may suffer.Financial StatementsdifficultiesDifficulties in integrating operations, technologies, services, accounting and personnel;difficultiesDifficulties in supporting and transitioning customers of our acquired companies;diversionDiversion of financial and management resources from existing operations;risksRisks of entering new sectors of the nonprofit industry;potentialPotential loss of key employees; andinabilityInability to generate sufficient revenue to offset acquisition or investment costs.userUser privacy;thePayment processing;theTaxation of foreign earnings;copyrights;consumerConsumer protection, including the potential application of “do not call” registry requirements on our customers and consumer backlash in general to direct marketing efforts of our customers;theThe online distribution of specific material or content over the Internet; andtheThe characteristics and quality of products and services offered over the Internet.Index to Financial StatementsOur operations might be affected by the occurrence of a natural disaster or other catastrophic event.We depend on our principal executive offices and other facilities for the continued operation of our business. Although we have contingency plans in effect for natural disasters or other catastrophic events, these events, including terrorist attacks and natural disasters such as earthquakes and hurricanes, could disrupt our operations. Even though we carry business interruption insurance policies and typically have provisions in our contracts that protect us in certain events, we might suffer losses as a result of business interruptions that exceed the coverage available under our insurance policies or for which we do not have coverage. Any natural disaster or catastrophic event affecting us could have a significant negative impact on our operations.UNRESOLVED STAFF COMMENTSPROPERTIESLEGAL PROCEEDINGSaffecteffect on us.SUBMISSION OF MATTERS TO A VOTE OF SECURITY HOLDERSNo matter was submitted to a vote of our stockholders during the fourth quarter of the year ended December 31, 2009.Mine safety disclosures
Index to Financial StatementsMARKET FOR REGISTRANT’S COMMON EQUITY, RELATED STOCKHOLDER MATTERS AND ISSUER PURCHASES OF EQUITY SECURITIES High Low $ 13.43 $ 9.15 15.77 12.35 24.40 13.52 24.43 21.18 $ 27.75 $ 23.23 25.72 20.68 22.69 17.86 18.70 10.77 High Low Fiscal year ended December 31, 2012 First quarter $ 34.00 $ 22.63 Second quarter $ 33.93 $ 24.02 Third quarter $ 28.34 $ 22.98 Fourth quarter $ 24.88 $ 20.99 Fiscal year ended December 31, 2011 First quarter $ 27.44 $ 24.42 Second quarter $ 30.39 $ 24.91 Third quarter $ 29.10 $ 21.84 Fourth quarter $ 30.36 $ 20.81 2010,2013, there were 237179 stockholders of record and approximately 15,000 beneficial owners of our common stock. Because many of our shares of common stock are held by brokers and other institutions on behalf of stockholders, this number is not representative of the total number of stockholders represented by these stockholders of record. On February 12, 2010,2013, the closing price of our common stock was $22.17.
$25.48.Index to Financial StatementsCenter for Research in Security Prices (CRSP) Total Market ReturnNASDAQ Composite Index forand the NASDAQ Stock MarketComputer and to a peer group industry index based on the standard industrial code for computer programming, data processing and other computer-related services.Data Processing Index. The graph covers the most recent five-year period ending December 31, 2009.2012. The graph assumes that the value of the investment in our common stock and each index was $100 at December 31, 2004,2007, and that all dividends are reinvested. We paid quarterly dividends at an annual rate of $0.40, $0.40, $0.34 and $0.28 per share for the years ending December 31, 2009, 2008, 2007 and 2006, respectively.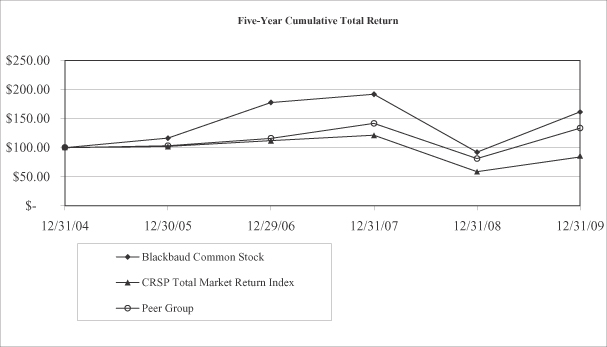
12/31/2004 12/30/2005 12/29/2006 12/31/2007 12/31/2008 12/31/2009 $ 100.00 $ 116.92 $ 177.93 $ 191.93 $ 92.42 $ 161.78 $ 100.00 $ 102.13 $ 112.20 $ 121.67 $ 58.68 $ 84.28 $ 100.00 $ 103.39 $ 116.09 $ 141.85 $ 81.65 $ 133.45 Index to Financial Statements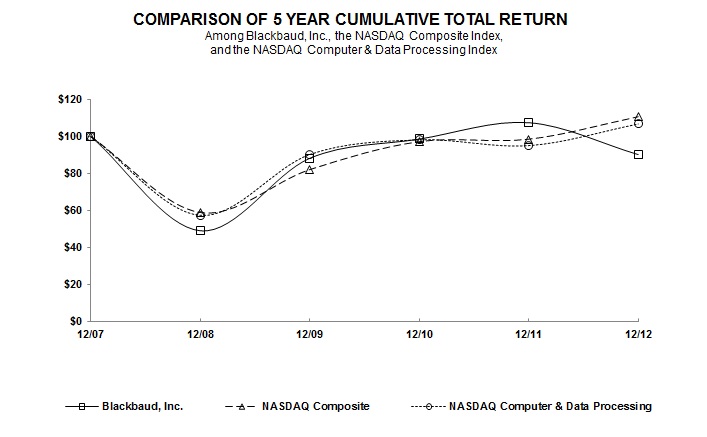
12/31/2007 12/31/2008 12/31/2009 12/31/2010 12/31/2011 12/31/2012 Blackbaud, Inc. $ 100.00 $ 49.18 $ 88.34 $ 98.68 $ 107.54 $ 90.30 NASDAQ Composite $ 100.00 $ 59.03 $ 82.25 $ 97.32 $ 98.63 $ 110.78 NASDAQ Computer & Data Processing $ 100.00 $ 57.50 $ 90.39 $ 98.29 $ 95.15 $ 106.83 Period Total
number of
shares
purchased(1) Average
price paid
per share Total number
of shares
purchased as
part of publicly
announced
plans or
programs
dollar value of
shares that may
yet be purchased
under the plan
or programs $ 30,770 26,197 $ 22.22 — $ 30,770 114,697 $ 22.07 — $ 30,770 110 $ 23.63 — $ 30,770 141,004 $ 22.10 — $ 30,770 (1)During the period, there were no shares repurchased. The shares in the table represent shares withheld by us to satisfy the tax obligations of employees due upon vesting of restricted stock and exercise of stock appreciation rights during the period.Period Beginning balance, October 1, 2012 — $ 50,000 October 1, 2012 through October 31, 2012 401 $ 23.95 — $ 50,000 November 1, 2012 through November 30, 2012 119,692 $ 22.11 — $ 50,000 December 1, 2012 through December 31, 2012 168 $ 22.83 — $ 50,000 Total 120,261 $ 22.11 — $ 50,000 $0.40$0.48 per share in 20092012 and 2008,2011, resulting in an aggregate dividend payment to stockholders of $17.7$21.7 million and $17.5$21.4 million in 20092012 and 2008,2011, respectively. In February 2010,2013, our Board of Directors approved an annual dividend rate of $0.44$0.48 per share for 2010.2013. We declared a first quarter dividend of $0.11$0.12 per share payable on March 15, 20102013, to stockholders of record on February 26, 2010,28, 2013, and currently intend to pay quarterly dividends at an annual rate of $0.44$0.48 per share of common stock for each of the remaining fiscal quarters in 2010.2013. Dividends at this rate would total approximately $19.4$22.1 million in the aggregate on the common stock in 20102013 (assuming 44.046.0 million shares of common stock are outstanding, net of treasury stock).ourOur credit facility limits the amount of dividends we are permitted to pay;ourOur Board of Directors could decide to reduce dividends or not to pay dividends at all, at any time and for any reason;theThe amount of dividends distributed is subject to state law restrictions; andweWe might not have enough cash to pay dividends due to changes to our operating earnings, working capital requirements and anticipated cash needs.20102013 at an annual rate of $0.44$0.48 per share is approximately $19.4$22.1 million (assuming 44.046.0 million shares of common stock are outstanding, net of treasury stock).Index to Financial StatementsIn May 2008, our Board of Directors approved new stock repurchase program that authorizedauthorizes us to purchase up to $40$50.0 million of our outstanding shares of common stock. The prior program was terminated at that date and the remaining balance that was authorized but not used under the prior stock repurchase program was included in the amount authorized under the new program. The new program does not have an expiration date. The shares could be purchased in conjunction with a public offering offor our stock, from time to time on the open market or in privately negotiated transactions depending upon market conditions and other factors, all in accordance with the requirements of applicable law. As of February 12, 2010, we had purchased 520,423 shares of common stock for $9.2 million pursuant to this program. Any open market purchases under the repurchase program will be made in compliance with Rule 10b-18 of the Securities Exchange Act of 1934 and all other applicable securities regulations. We might not purchase any additional shares of common stock and our Board of Directors may decide, in its absolute discretion, at any time and for any reason, to cancel the stock repurchase program.2010,2013, including dividends and purchases under our stock repurchase program. See “Management’s discussion and analysis of financial conditions and results of operations—operations — Liquidity and capital resources” in this report.2010,2013, and we cannot assure our stockholders that during or following such periods that we will pay dividends at the estimated levels, or at all. We are not required to pay dividends and our Board of Directors may modify or revoke our dividend policy at any time. Dividend payments are within the absolute discretion of our Board of Directors and will be dependent upon many factors and future developments that could differ materially from our current expectations. Indeed, over time our capital and other cash needs, including unexpected cash needs, will invariably change and remain subject to uncertainties, which could impact the level of any dividends we pay in the future.2009,2012, we had approximately $22.8$13.5 million in cash and cash equivalents. In addition, we anticipate that we will have sufficient earnings in 20102013 to pay dividends at the level described above. Although we believe we will have sufficient surplus and earnings to pay dividends at the anticipated levels for 2010,2013, our Board of Directors will seek periodically to assure itself of this sufficiency before actually declaring any dividends.Index to Financial StatementsOurwith Wachovia Bank, N.A. dated July 25, 2007in February 2012. The amended credit facility restricts our ability to declare and pay dividends on our common stock as follows:facility;facility, and (2) we must be in compliance with a leverage ratio set forth in the credit agreement and (3) we must have cash on hand (which includes any unused amounts under the credit facility) of at least $10.0 million; each after giving effect to the payment of dividends and/or the repurchase of shares.Index to Financial StatementsSELECTED CONSOLIDATED FINANCIAL DATA consolidated financial data set forth below should be read in conjunction with “Management’s discussion and analysis of financial condition and results of operations” and our financial statements and the related notes included elsewhere in this report.2009, 2008,2012, 2011 and 2007,2010, has been derived from the audited annual financial statements, including the consolidated balance sheets at December 31, 20092012 and 20082011, and the related consolidated statements of operations,comprehensive income, cash flows and stockholders’ equity and comprehensive income for the three years ended December 31, 2009, 20082012, 2011 and 20072010 and notes thereto appearing elsewhere herein. The following data, insofar as it relates to each of the years ended December 31, 20062009 and 20052008, and the consolidated balance sheet as of December 31, 2007, 20062010, 2009 and 20052008 are derived from audited financial statements not included in this report.23 of the consolidated financial statements included in this annual report, we made business acquisitions in 2008, 2007 and 2006, which could affect the comparability of the information presented. Years ended December 31, (in thousands, except per share data) 2009 2008 2007 2006 2005 $ 25,392 $ 35,932 $ 37,569 $ 32,500 $ 29,978 87,834 100,824 91,376 61,242 52,606 116,476 107,304 94,602 80,893 71,163 72,898 49,705 25,389 10,605 6,965 6,738 8,730 8,102 6,140 5,237 309,338 302,495 257,038 191,380 165,949 3,582 3,316 2,870 2,260 4,380 61,713 63,960 54,908 33,717 28,409 21,364 20,185 17,119 13,225 10,926 28,183 20,587 10,306 2,360 1,472 6,098 8,368 7,274 5,709 4,943 120,940 116,416 92,477 57,271 50,130 188,398 186,079 164,561 134,109 115,819 62,796 65,185 56,994 41,405 33,491 45,662 38,708 28,525 23,118 21,138 33,380 34,072 26,144 21,757 15,795 768 713 491 699 18 142,606 138,678 112,154 86,979 70,442 45,792 47,401 52,407 47,130 45,377 637 526 813 1,584 964 (962 ) (1,526 ) (1,164 ) (48 ) (49 ) 220 (194 ) (503 ) (238 ) 6 45,687 46,207 51,553 48,428 46,298 17,240 16,329 19,829 18,275 13,211 $ 28,447 $ 29,878 $ 31,724 $ 30,153 $ 33,087 $ 0.67 $ 0.70 $ 0.73 $ 0.70 $ 0.78 $ 0.65 $ 0.68 $ 0.71 $ 0.68 $ 0.72 42,771 42,959 43,619 43,320 42,559 43,600 43,959 44,595 44,668 46,210 $ 0.40 $ 0.40 $ 0.34 $ 0.28 $ 0.20 Index to Financial Statements Years ended December 31, (in thousands) 2009 2008 2007 2006 2005 $ 1,433 $ 1,442 $ 627 $ 531 $ 269 750 534 234 117 33 387 283 274 19 — 2,570 2,259 1,135 667 302 1,605 1,607 831 813 217 2,944 2,396 1,219 746 139 5,168 5,823 3,749 5,174 (343 ) 9,717 9,826 5,799 6,733 13 $ 12,287 $ 12,085 $ 6,934 $ 7,400 $ 315 Year ended December 31, (in thousands, except per share data) 2012 2011 2010 2009 2008 Consolidated statements of comprehensive income data: Revenue License fees $ 20,551 $ 19,475 $ 23,719 $ 25,656 $ 35,484 Subscriptions 162,102 103,544 83,912 73,194 49,773 Services 119,626 108,781 87,663 87,239 101,015 Maintenance 136,101 130,604 124,559 116,413 107,308 Other revenue 9,039 8,464 6,712 6,968 8,730 Total revenue 447,419 370,868 326,565 309,470 302,310 Cost of revenue Cost of license fees 2,993 3,345 3,003 3,697 3,388 Cost of subscriptions(1) 68,773 42,536 31,155 28,158 20,564 Cost of services(1) 97,208 79,086 66,755 61,585 63,810 Cost of maintenance(1) 26,001 25,178 24,123 21,594 20,175 Cost of other revenue 7,485 7,049 7,103 6,098 8,368 Total cost of revenue 202,460 157,194 132,139 121,132 116,305 Gross profit 244,959 213,674 194,426 188,338 186,005 Operating expenses Sales and marketing(1) 95,218 75,361 69,469 63,495 65,573 Research and development(1) 64,692 47,672 45,499 45,520 38,497 General and administrative(1) 63,308 36,933 32,636 33,383 33,904 Impairment of cost method investment 200 1,800 — — — Amortization 2,106 980 798 768 713 Total operating expenses 225,524 162,746 148,402 143,166 138,687 Income from operations 19,435 50,928 46,024 45,172 47,318 Interest income 146 183 84 637 526 Interest expense (5,864 ) (200 ) (74 ) (962 ) (1,526 ) Other income (expense), net (392 ) 346 (98 ) 220 (194 ) Income before provision for income taxes 13,325 51,257 45,936 45,067 46,124 Income tax provision 6,742 18,037 16,749 17,547 17,185 Net income $ 6,583 $ 33,220 $ 29,187 $ 27,520 $ 28,939 Earnings per share Basic $ 0.15 $ 0.76 $ 0.68 $ 0.64 $ 0.67 Diluted $ 0.15 $ 0.75 $ 0.67 $ 0.63 $ 0.66 Common shares and equivalents outstanding Basic weighted average shares 44,146 43,523 43,145 42,771 42,959 Diluted weighted average shares 44,692 44,149 43,876 43,600 43,959 Dividends per share $ 0.48 $ 0.48 $ 0.44 $ 0.40 $ 0.40 Summary of stock-based compensation: Cost of subscriptions $ 860 $ 571 $ 392 $ 387 $ 283 Cost of services 2,786 1,966 1,742 1,433 1,442 Cost of maintenance 538 741 814 750 534 Total included in cost of revenue 4,184 3,278 2,948 2,570 2,259 Sales and marketing 2,527 1,325 1,366 1,605 1,607 Research and development 3,556 3,039 2,844 2,944 2,396 General and administrative 8,973 7,242 5,901 5,291 5,700 Total included in operating expenses 15,056 11,606 10,111 9,840 9,703 Total stock-based compensation $ 19,240 $ 14,884 $ 13,059 $ 12,410 $ 11,962 (1) Includes stock-based compensation as set forth in tabular summary of stock-based compensation (benefit) for all periods presented. We adopted SFAS 123(R) on January 1, 2006. December 31, (in thousands) 2009 2008 2007 2006 2005 $ 22,769 $ 16,361 $ 14,775 $ 67,783 $ 22,683 61,298 71,620 53,972 67,620 80,052 (70,485 ) (109,962 ) (46,977 ) 14,125 (16,866 ) 304,229 313,886 237,694 195,009 148,463 135,584 119,640 96,100 76,952 63,222 188,123 223,378 124,591 99,651 83,711 52 51 50 49 48 134,726 116,846 105,687 88,409 73,583 $ 116,106 $ 90,508 $ 113,103 $ 95,358 $ 64,752 Index to Financial Statements December 31, (in thousands) 2012 2011 2010 2009 2008 Consolidated balance sheet data Cash and cash equivalents $ 13,491 $ 52,520 $ 28,004 $ 22,769 $ 16,361 Deferred tax asset, including current portion 15,799 30,927 47,478 59,284 70,100 Working (deficit) capital (97,947 ) (52,093 ) (57,056 ) (74,458 ) (113,464 ) Total assets 705,747 392,590 323,806 299,927 311,087 Deferred revenue, including current portion 185,018 163,437 150,661 137,950 122,023 Total long-term liabilities 246,368 12,547 9,319 7,891 7,999 Common stock 55 54 53 52 51 Additional paid-in capital 203,638 175,401 158,372 134,643 116,688 Total stockholders’ equity $ 147,684 $ 140,002 $ 116,469 $ 110,293 $ 85,733 MANAGEMENT’S DISCUSSION AND ANALYSIS OF FINANCIAL CONDITION AND RESULTS OF OPERATIONS21E27A of the Securities Act of 1933, as amended and Section 21E of the Securities Exchange Act of 1934.1934, as amended. These forward-looking statements reflect our current view with respect to future events and financial performance and are subject to risks and uncertainties, including those set forth under “Cautionary statement” included in this “Management’s discussion and analysis of financial condition and results of operations”“Item 1.A. Risk Factors” and elsewhere in this report, that could cause actual results to differ materially from historical or anticipated results.are the leading global provider ofprovide on-premise and cloud-based software solutions and related services designed specifically for nonprofit organizations. Our products and services enable nonprofit organizations to increase donations, reduce fundraising costs, improve communications with constituents, manage their finances and optimize internal operations. We have focused solely on the nonprofit market since our incorporation in 1982 and have developed our suiteAs of products and services based upon our extensive knowledge of the operating challenges facing nonprofit organizations. At the end of 2009,December 31, 2012, we had approximately 22,000more than 27,000 active customers. Our customers operate indistributed across multiple verticals within the nonprofit market including education, foundations, health and human services, religion, arts and cultural, public and societal benefits, environment and animal welfare andas well as international foreign affairs.Revenue2009$335.7 million in consideration. We funded the acquisition through both cash on hand and borrowings under our amended credit facility. During 2012, we remained focused on:2%21% compared to 2008. The inclusion of Kintera, which we acquired in July 2008, resulted in an increase in revenue of $16.1 million for 2009. Excluding the impact of Kintera, revenue decreased by 3% for 2009 when compared to 2008.2011. When removing the impact of foreign currency translation,revenue from acquired companies, revenue increased by 4% when comparing 2009 to 2008. Further, when removing6% during 2012. This increase was principally the impactresult of foreign currency translation and the impact from Kintera,continued growth in our subscriptions revenue decreased by 2% when comparing 2009 to 2008.Our selling environment remained challenging during 2009 as difficult and uncertain economic conditions continued to put pressure on the spending of many organizations in the nonprofit industry. Revenues associated with our perpetual license offerings and related services decreased compared to 2008 as a result of these economic conditions and reduced marketan increase in demand for these offerings. However, our recurring revenue, which is comprised of maintenance services and subscriptionsubscription-based offerings continued to experience growth during 2009. Revenue from maintenance services and subscription offerings, which represented approximately 61% of our revenue on a combined basis, grew 21% in 2009 compared to 2008. Approximately half of this revenue growth is attributable to Kintera and the remaining growth is principally the result ofas our business increasingly evolvingshifts towards product sales on a subscription basis. We believe this trend will continuehosted solutions as well as an increase in transaction fees associated with our payment processing services. Maintenance revenue also contributed to the future.In 2009, we focused on closely managing our operating expensesincrease in revenue from maintaining high renewal rates, new maintenance contracts associated with new license arrangements and achieving our targeted level of profitability. existing client increases.20092012 decreased by $1.6$31.5 million when compared to 2008. During 2009,2011. The decrease was attributable to: (i) a $23.1 million increase in costs associated with our acquisition of Convio related to transaction costs, integration and restructuring costs, amortization of acquired intangibles from business combinations and stock-based compensation expense; (ii) a $4.3 million increase in costs related to strategic investments we have made in our business optimization efforts and the re-engineering of our accounting processes; and (iii) an increase of $8.3 million in hosting costs due to incremental investments to improve our hosting services and additional hosting capacity required as a result of the growth in demand for our hosted applications and other online services. Also contributing to the decrease in income from operations is primarily attributablewas our continued shift from a license-based model with upfront revenue recognition to a subscription-based model, which recognizes revenue ratably over the agreement term. These decreases were partially offset by an increase in stock based compensation expense, amortization expense associated with intangible assetsgross margin from our recent acquisitions and research and development expense to support our continuing product investment.payment processing operations.
operations—(Continued)20092012 with cash and cash equivalents totaling $22.8$13.5 million and no$215.5 million in outstanding borrowings on our credit facility. During 2009,2012, we used $20.8 million of cash on hand and net borrowings of $259.6 million towards acquiring Convio. Additionally, we generated $86.8$68.7 million in cash flow from operations, out of which we paid $59.0$21.7 million on our credit facility in dividends and $17.7used $20.6 million in dividends. Additionally, cash flow from operations allowed us to fund the purchase of $5.5 million of property andcomputer equipment and increasesoftware.cashsubscription-based offerings. However, we continue to believe the pace and cash equivalentsimpact of economic recovery on the nonprofit market remains uncertain. Additionally, we continue to experience a greater level of caution by $6.4 million.remaincontinue to be challenging in 2010 as existing and prospective customers continue to exercise caution in expenditure decisions.the near term. Notwithstanding these conditions, we plan to continue tofurther increase our focus on expanding market share, selectively investing insubscription-based offerings as we execute on our key growth initiatives and strengtheningstrengthen our leadership position. As we have throughout 2009, we will also focus on controlling and, as necessary, reducing the costs and expenses of our operations to achieveposition, while achieving our targeted level of profitability.Consolidated statements In the near term, we expect there will continue to be a dilutive impact on our profitability as we shift from a license-based model with upfront revenue recognition to a subscription-based model, which recognizes revenue ratably over the agreement term.percentas we execute on our key growth initiatives.revenue Years ended December 31, 2009 2008 2007 8.2 % 11.9 % 14.6% 28.4 33.3 35.5 37.7 35.5 36.8 23.5 16.4 9.9 2.2 2.9 3.2 100.0 % 100.0 % 100.0% 1.1 1.1 1.1 20.0 21.1 21.4 6.9 6.7 6.7 9.1 6.8 4.0 2.0 2.8 2.8 39.1 38.5 36.0 60.9 61.5 64.0 20.3 21.5 22.2 14.8 12.8 11.1 10.8 11.3 10.2 0.2 0.2 0.2 46.1 45.8 43.6 14.8 15.7 20.4 0.2 0.2 0.3 (0.3 ) (0.5 ) (0.5) 0.1 (0.1 ) (0.2) 14.8 15.3 20.1 5.6 5.4 7.7 9.2 % 9.9 % 12.3% Index to Financial StatementsContentsoperations—(Continued)Comparison of the years ended December 31, 2009, 20082012, 2011 and 2007On April 29, 2009, we acquired RLC Customer Centric Technology B.V. (RLC)2010, a privately held limited company based in the Netherlands. The acquisition of RLC provides us with a foundation to expand into the Netherlands and other Western European markets.During 2008 and 2007, we acquired companies that provided us with a strategic opportunityopportunities to expand our share of the nonprofit market with SaaS and subscription offerings, and through the integration of complimentarycomplementary products and services to serve the changing needs of our customers. FollowingThe following are the companies we acquired during 2008 and 2007 and their respective acquisition date:Target Software,NOZA, Inc. and Target Analysis Group, Inc. (together referred to as the Target Companies)—January 16, 2007;eTapestry.com, Inc. (referred to as eTapestry)—August– October 1, 2007;2010;Kintera,Convio, Inc. (referred to as Kintera)—July 8, 2008.Thethe acquired companies are included in our consolidated results of operations from the datesdate of their respective acquisition, as noted above, which impacts the comparability of our results of operations when comparing 20092012 to 20082011 and 20082011 to 2007.2010. We have noted in the discussion below, to the extent meaningful, the impact on the comparability of our consolidated results of operations due to the inclusion of the acquired companies for only a partial year in the year of acquisition.a full year in the subsequent year.Revenuestatementconsolidated statements of operationscomprehensive income for the years ended December 31, 2009, 2008,2012 and 2007. Years ended December 31, 2009 versus 2008 2008 versus 2007 (in millions) 2009 2008 2007 Change % Change Change % Change $ 25.4 $ 35.9 $ 37.5 $ (10.5 ) (29 )% $ (1.6 ) (4 )% 87.8 100.8 91.4 (13.0 ) (13 )% 9.4 10 % 116.5 107.3 94.6 9.2 9 % 12.7 13 % 72.9 49.7 25.4 23.2 47 % 24.3 96 % 6.7 8.8 8.1 (2.1 ) (24 )% 0.7 9 % $ 309.3 $ 302.5 $ 257.0 $ 6.8 2 % $ 45.5 18 % Total2011. Year ended December 31, (in millions) 2012 2011 Change % Change License fees $ 20.6 $ 19.5 $ 1.1 6 % Subscriptions 162.1 103.5 58.6 57 % Services 119.6 108.8 10.8 10 % Maintenance 136.1 130.6 5.5 4 % Other 9.0 8.5 0.5 6 % Total revenue $ 447.4 $ 370.9 $ 76.5 21 % $6.8by $21.9 million, or 2%,6% in 2009 compared to 2008. The2012. This increase in revenue iswas primarily dueattributable to growth in subscriptionour subscriptions revenue as a result of the acquisition of Kintera andboth an increase in demand for an our hosting services and online datafundraising offerings as well as an increase in transaction fees associated with our payment processing services. The growthincrease in revenue fromdemand for our subscription offerings is also a result ofwas primarily driven by the ongoing evolution of our product offerings from a license-based to subscription-based offerings. Maintenancemodel. Although we continue to experience a shift in our emerging (first-time users) and mid-sized customers’ buying preference away from perpetual licenses towards hosted solutions, license revenue also increased duein 2012 when compared to additional2011 as a result of an increase in sales of our Blackbaud CRM offering to large and/or strategic customers. The increase in maintenance revenue fromis attributable to maintaining high renewal rates, new maintenance contracts associated with new license agreements and increases in contracts with existing client increases. The increasecustomers during 2012 when compared to 2011. Services revenue grew in subscriptions and maintenance revenue was partially offset by decreases in license fees and services revenue. The decreases in license fees and services revenue are2012 principally attributable to the delays and postponementsas a result of purchasing decisions byincreased demand for our existing and prospective customers resulting from the weak economic environment.education services.
Index to Financial Statementsoperations—(Continued)operations (continued)Total revenue increased $45.5 million, or 18%, in 2008 compared to 2007. Approximately half, or $22.0 million, of the increase in total revenue was attributable to the inclusion of eTapestry and Kintera in our consolidated results of operations. The remaining increase in revenue for 2008, totaling $23.5 million and representing a 9% increase over 2007, was primarily attributable to growth in Year ended December 31, (in millions) 2012 2011 Change % Change License fees revenue $ 20.6 $ 19.5 $ 1.1 6 % Cost of license fees 3.0 3.3 (0.3 ) (9 )% License fees gross profit $ 17.6 $ 16.2 $ 1.4 9 % License fees gross margin 85 % 83 % subscriptions and maintenance services. The increase in maintenance revenue is principally from new maintenance contracts with associated with new license agreements and existing client increases. Subscription revenue increased 35%, excluding the impact of our acquisitions, due to an increase in demand for our hosting and other online data services.Segment resultsThrough December 31, 2009, we analyzed our business according to our six operating segments as identified in Note 14 of our consolidated financial statements, which are license fees consulting and education services, analytic services, maintenance, subscriptions and other. The analyses provided below are presented on a non-GAAP basis before the inclusion of various allocable corporate costs such as depreciation, facilities and information technology (IT) support costs, stock-based compensation and amortization of intangibles arising from business combinations because, in managing our operations, we believe that the exclusion of these costs allows us to better understand and manage our operating expenses and cash needs. These excluded costs are analyzed separately following the segment results analysis.License fees Years ended December 31, 2009 versus 2008 2008 versus 2007 (in millions) 2009 2008 2007 Change % Change Change % Change $ 25.4 $ 35.9 $ 37.5 $ (10.5 ) (29 )% $ (1.6 ) (4 )% 3.2 3.1 2.7 0.1 3 % 0.4 15 % $ 22.2 $ 32.8 $ 34.8 $ (10.6 ) (32 )% $ (2.0 ) (6 )% 87 % 91 % 93 % Revenue from license fees is derived from the sale of our software products, under a perpetual license agreement. The decrease in license fee revenue during 2009 when compared to 2008 and during 2008 when compared to 2007 is principally attributable to longer sales cycle times, delays and postponement of purchasing decisions and overall caution exercised by existing and prospective customers as a result of continued challenges posed by the weak economic environment. In addition, weWe are increasingly experiencing a shift in our customers’emerging and mid-sized customers' buying preference away from solutions offered under perpetual license agreementsarrangements towards subscription-based hosted applications.During 2009,applications, while our large and/or strategic customers continue to be an area of growth, particularly as it relates to our Blackbaud CRM offering. Our larger perpetual license feetransactions have long sales cycles, and their timing can result in significant period-to-period variations. Revenue from license fees increased in 2012 primarily due to a greater contribution of revenue decreased by $10.5 millionfrom larger Blackbaud CRM arrangements when compared to 2008. Sales from license fees to new customers decreased $4.2 million and sales to existing clients decreased by $6.3 million. Additionally, during 2009, revenue related to our Enterprise CRM offering grew by $3.7 million, which was offset by decreases in our other perpetual license product offerings of $14.2 million.During 2008, sales from license fees to new customers decreased by $2.9 million when compared to 2007, offset by an increase to existing customers of $1.3 million.Direct controllable costand variable reseller commissions.commissions, amortization of software development costs and amortization of intangibles from business combinations. The increasedecrease in cost of license fees for 2009in 2012 when compared to 2008 and 2008 when compared to 20072011 is primarilyprincipally attributable to a decrease in third-party software royalties. Third-party software royalties associated with our license-based products have decreased as the demand for our perpetual license arrangements has decreased and subscription-based offerings has increased. Year ended December 31, (in millions) 2012 2011 Change % Change Subscriptions revenue $ 162.1 $ 103.5 $ 58.6 57 % Cost of subscriptions 68.8 42.5 26.3 62 % Subscriptions gross profit $ 93.3 $ 61.0 $ 32.3 53 % Subscriptions gross margin 58 % 59 % mixagreement term.license fee revenue toward productsattributable to acquired companies, respectively. Excluding the revenue from acquired companies, the increase in subscriptions revenue of $13.7 million, or 13%, is principally attributable to an increase in demand for our online fundraising and data management offerings as well as an increase in transaction fees associated with higherour payment processing services.software royalty costs.and data expenses, hosting expenses, allocated depreciation, facilities and IT support costs, amortization of intangibles from
Index to Financial Statementsoperations—(Continued)Consultingoperations (continued)educationother costs incurred in providing support and services Years ended December 31, 2009 versus 2008 2008 versus 2007 (in millions) 2009 2008 2007 Change % Change Change % Change $ 65.3 $ 77.7 $ 73.2 $ (12.4 ) (16 )% $ 4.5 6 % 41.8 44.4 38.8 (2.6 ) (6 )% 5.6 14 % $ 23.5 $ 33.3 $ 34.4 $ (9.8 ) (29 )% $ (1.1 ) (3 )% 36 % 43 % 47 % Consulting to our customers. The increase in cost of subscriptions in 2012 is principally attributable to increases in hosting costs, human resource costs and educationamortization of intangibles from business combinations. Year ended December 31, (in millions) 2012 2011 Change % Change Services revenue $ 119.6 $ 108.8 $ 10.8 10 % Cost of services 97.2 79.1 18.1 23 % Services gross profit $ 22.4 $ 29.7 $ (7.3 ) (25 )% Services gross margin 19 % 27 % consists offrom consulting, installation, implementation, education and educationanalytic services. Consulting, installation and implementation services involve converting data from a customer’s existing system, assistance in file set up and system configuration, and/or process re-engineering. Education services involve customer training activities.During 2009, consulting and education services revenue decreased $12.4 million when compared to 2008. The inclusion of Kintera for a full year in 2009 compared to a partial year in 2008 accounted for $0.6 million of an increase in consulting and education services revenue. Included in consulting and education services revenue in 2009 is $0.7 million of revenue attributable to RLC. The decrease in revenue is principally the result of decreased volume of consulting, installation and implementation services delivered for our core software products and decreased demand for training services as existing and prospective customers continue to experience budgetary constraints associated with the challenges posed by the overall economic environment. To a lesser extent, the decrease in revenue is attributable to a reduction in the rates we charge as a result of a higher level of discounts offered on our service offerings during 2009 compared to 2008. During 2009, these decreases of $17.0 million were partially offset by an increase of $4.6 million in consulting services associated with our Enterprise CRM product offering and our internet-based products.During 2008, consulting and education services revenue increased by $4.5 million when compared to 2007, of which $1.9 million is attributable to Kintera and eTapestry. The rates charged for our service offerings remained relatively constant year over year and, as such, the increase in revenue in 2008 is principally the result of increased volume of services provided. The increase in volume of services provided is principally due to an increase in the demand in consulting services associated with our new Enterprise CRM product offerings and our internet based products.Cost of consulting and education services is principally comprised of human resource costs, third-party contractor expenses, classroom rentals and other costs incurred in providing consulting, installation and implementation services and customer training.During 2009, cost of consulting and education services decreased by $2.6 million. Human resource costs related to additional headcount attributable to Kintera and RLC increased cost of consulting and education services by $2.4 million. Excluding the impact of acquisitions, the remaining decrease in cost of consulting and education services of $5.0 million during 2009 is primarily due to a reduction in travel-related expenses, recruiting and other costs.During 2008, cost of consulting and education services increased by $5.6 million, of which $2.2 million is attributable to the inclusion of human resource costs associated with Kintera and eTapestry. Excluding the impact of acquisitions, the remaining increase of $3.4 million is primarily attributable to human resource cost increases as a result of increased skills and competencies in our service professionals.Index to Financial StatementsBlackbaud, Inc.Item 7. Management’s discussion and analysis of financial condition and results of operations—(Continued)The decrease in segment margin from 2008 to 2009 is principally due to the decrease in demand for consulting and education services while the cost of consulting and education services decreased to a lesser extent. Cost of consulting and education services decreased at a lower rate than the associated revenue principally due to maintaining resource capacity for the increase in services associated with our Enterprise CRM product offerings and the expected increase in services when the economic environment improves.The decrease in segment margin from 2007 to 2008 is primarily attributable to average billing rates for our consultants remaining relatively constant while consultant’s salaries and related human resource costs increased, and a change in the mix of the consulting and education services provided.Analytic services Years ended December 31, 2009 versus 2008 2008 versus 2007 (in millions) 2009 2008 2007 Change % Change Change % Change $ 22.5 $ 23.1 $ 18.2 $ (0.6 ) (3 )% $ 4.9 27 % 10.0 9.8 8.0 0.2 2 % 1.8 23 % $ 12.5 $ 13.3 $ 10.2 $ (0.8 ) (6 )% $ 3.1 30 % 56 % 58 % 56 % nonprofit organizationsthe customer and are performed using our proprietary analytical tools. The end product enables organizations to more effectively target itstheir fundraising activities.During 2009, analytic We recognize services revenue decreased by $0.6attributable to consulting services for implementation of our hosted applications and subscription offerings ratably over the period the customer benefits from those services. We also recognize the direct and incremental costs associated with consulting services revenue ratably over the same period. However, we continue to expense indirect costs in the period the implementation services are provided.when comparedand $0.1 million of revenue attributable to 2008. The inclusionacquired companies, respectively. Excluding the revenue from acquired companies, the increase in services revenue of Kintera for a full year in 2009 compared$1.1 million, or 1%, is principally due to a partial year in 2008 accounted for $0.8 million of an increase in analytic services revenue. Excluding the impact of the acquisition of Kintera, analyticeducation services revenue decreasedof $1.4 million, in 2009 when compared to 2008. The rates charged for our analytic services have remained relatively constant year over year and, as such, the remainingpartially offset by a decrease in analytic services revenue is principally the result of the decreased volume of services provided.Revenue from analytic services increased $4.9 million in 2008 when compared to 2007.$0.6 million. The rates chargedwe charge for our analytic serviceseducation service offerings have remained relatively constant year over year and, as such, the increase in revenue is principally the result of increased volumea change in volume. The increase in revenue from education services is the result of higher demand for subscription-based training. Consulting services revenue remained relatively unchanged in 2012 compared to 2011 primarily due to a greater portion of our service engagements being with larger enterprise customers as our mid-market moves to subscription-based offerings. These larger enterprise engagements can experience volatility in utilization due to the complex nature of these engagements.provided.Cost of analytic services is primarilyprincipally comprised of human resource costs, andstock-based compensation expense, third-party contractor expenses, classroom rentals, costs incurred in providing customer training, data expense incurred to perform analytic services.services, allocated depreciation, facilities and IT support costs and amortization of intangibles from business combinations. The increase in cost of analytic services for 2009 when compared to 2008in $0.8 million ofan increase in human resource and othercosts. Human resource costs increased $12.7 million in 2012 as a result of an increase in headcount. The increase in headcount was attributable to the inclusion of Kintera for a full year in 2009 compared to a partial year in 2008. Excluding the impactadditional resources from acquired companies.the acquisition of Kintera, cost of analytic services for 2009 decreased by $0.6 million primarily due to a decrease in data expense.During 2008, cost of analytic services increased when compared to 2007. The increase is attributable to additional human resources costs due to an increase in headcount. Headcount increased when comparing 2008 to 2007 to meet the increase in customer demand for our analytic services.The decrease in analytic services margin in 2009 when compared to 2008 is primarily due to additional costs associated with the acquisition of Kintera.Index to Financial StatementsContentsoperations—(Continued)The analytic services marginoperations (continued)2008allocated depreciation, facilities and IT support costs also contributed to the increase in cost of services in 2012 when compared to 2007 is attributable2011 due to including and integrating the analyticinclusion of allocable costs from the Convio operations.segmentgross margin decreased in 2012 primarily as a result of the Target Companies, which has a different cost structureincreases in headcount and a higher margin than the historical Blackbaud-only analytic services segment. Year ended December 31, (in millions) 2012 2011 Change % Change Maintenance revenue $ 136.1 $ 130.6 $ 5.5 4 % Cost of maintenance 26.0 25.2 0.8 3 % Maintenance gross profit $ 110.1 $ 105.4 $ 4.7 4 % Maintenance gross margin 81 % 81 % Maintenance Years ended December 31, 2009 versus 2008 2008 versus 2007 (in millions) 2009 2008 2007 Change % Change Change % Change $ 116.5 $ 107.3 $ 94.6 $ 9.2 9 % $ 12.7 13 % 15.8 15.3 13.4 0.5 3 % 1.9 14 % $ 100.7 $ 92.0 $ 81.2 $ 8.7 9 % $ 10.8 13 % 86 % 86 % 86 % During 2009, maintenance revenue increased $9.2 million when compared to 2008. The inclusion of Kintera for a full year in 2009 compared to a partial year in 2008 accounted for $2.8 million of the increase in maintenance revenue. Included in maintenance revenue in 2009 is $0.6 million of revenue attributable to RLC. Excluding the impact of the acquisitions of Kintera and RLC, maintenance revenue increased $5.8 million in 2009 when2012 compared to 2008. The increase2011 is principally comprised of $7.3(i) $12.7 million of maintenance withfrom new customers associated with new license agreements and increases in contracts with existing customers and $4.0(ii) $4.1 million from maintenance contract inflationary rate adjustments, partially offset by $5.5(iii) $11.3 million from maintenance contracts that were not renewed.During 2008, the increase in maintenance revenue includes $2.8 million of revenue attributable to Kintera. Excluding the impact of the acquisition of Kintera, maintenance revenue increased $9.9 million in 2008 when compared to 2007. The remaining increase is principally comprised of $11.0 million of maintenance with new customers associated with new license agreementsrenewed and increasesreductions in contracts with existing customers and $2.8 million from maintenance contract inflationary rate adjustments, offset by $3.9 million of maintenance contracts that were not renewed.Direct controllable costcustomers.data expenses,IT support costs, amortization of intangibles from business combinations and other costs incurred in providing support and services to our customers. The increase in costCost of maintenance in 2009increased during 2012 when compared to 2008 is the result of an increase in human resources costs2011 primarily attributable to headcount associated with Kintera.During 2008, the increase in cost of maintenance is principally theas a result of increases in human resourcesallocated costs and proprietary software costs. The increase in proprietary software costs is attributable to increases in maintenance contracts with existing customers for software products which include third-party royalty costs associated with the maintenance revenue. Maintenance gross margin in Year ended December 31, (in millions) 2012 2011 Change % Change Other revenue $ 9.0 $ 8.5 $ 0.5 6 % Cost of other revenue 7.5 7.0 0.5 7 % Other gross profit $ 1.5 $ 1.5 $ — — % Other gross margin 17 % 18 % includes $0.2 millioncosts of business forms, costs attributableof user conferences, reimbursable expenses relating to Kintera. Additionally, third-party royaltythe performance of services at customer locations, allocated depreciation, facilities and IT support costs and amortization of intangibles from business combinations. Cost of other revenue increased by $0.4 million,in 2012 primarily due to increases in reimbursable expenses related to our ticketing solution The Patron’s Edge.The maintenance segmentservices provided at customer locations. Other gross margin in during 2009, 2008 and 2007.
2011.Indexwhen compared to Financial Statementsoperations—(Continued)operations (continued) Year ended December 31, (in millions) 2012 2011 Change % Change Sales and marketing expense $ 95.2 $ 75.4 $ 19.8 26 % % of revenue 21 % 20 % Year ended December 31, (in millions) 2012 2011 Change % Change Research and development expense $ 64.7 $ 47.7 $ 17.0 36 % % of revenue 14 % 13 % Year ended December 31, (in millions) 2012 2011 Change % Change General and administrative expense $ 63.3 $ 36.9 $ 26.4 72 % % of revenue 14 % 10 % Year ended December 31, (in millions) 2012 2011 Change % Change GAAP income from operations $ 19.4 $ 50.9 $ (31.5 ) (62 )% Non-GAAP adjustments: Add: Convio deferred revenue writedown 5.6 — 5.6 100 % Add: Stock-based compensation expense 19.2 14.9 4.3 29 % Add: Amortization of intangibles from business combinations 17.4 7.6 9.8 129 % Add: Acquisition-related expenses 6.4 1.8 4.6 256 % Add: Acquisition integration and restructuring costs 6.9 — 6.9 100 % Add: Write-off of prepaid proprietary software licenses 0.4 — 0.4 100 % Add: Impairment of cost method investment 0.2 1.8 (1.6 ) (89 )% Less: Gain on sale of assets — (0.5 ) 0.5 (100 )% Total Non-GAAP adjustments 56.1 25.6 30.5 119 % Non-GAAP income from operations $ 75.5 $ 76.5 $ (1.0 ) (1 )% Non-GAAP operating margin 17 % 21 % Year ended December 31, (in millions) 2011 2010 Change % Change License fees $ 19.5 $ 23.7 $ (4.2 ) (18 )% Subscriptions 103.5 83.9 19.6 23 % Services 108.8 87.7 21.1 24 % Maintenance 130.6 124.6 6.0 5 % Other 8.5 6.7 1.8 27 % Total revenue $ 370.9 $ 326.6 $ 44.3 14 % Year ended December 31, (in millions) 2011 2010 Change % Change License fees revenue $ 19.5 $ 23.7 $ (4.2 ) (18 )% Cost of license fees 3.3 3.0 0.3 10 % License fees gross profit $ 16.2 $ 20.7 $ (4.5 ) (22 )% License fees gross margin 83 % 87 % Years ended December 31, 2009 versus 2008 2008 versus 2007 (in millions) 2009 2008 2007 Change % Change Change % Change $ 72.9 $ 49.7 $ 25.4 $ 23.2 47 % $ 24.3 96 % 22.3 15.7 7.8 6.6 42 % 7.9 101 % $ 50.6 $ 34.0 $ 17.6 $ 16.6 49 % $ 16.4 93 % 69 % 68 % 69 % Year ended December 31, (in millions) 2011 2010 Change % Change Subscriptions revenue $ 103.5 $ 83.9 $ 19.6 23 % Cost of subscriptions 42.5 31.2 11.3 36 % Subscriptions gross profit $ 61.0 $ 52.7 $ 8.3 16 % Subscriptions gross margin 59 % 63 % isfor 2011 and 2010 was principally comprised of revenue from providing access to hosted applications and hosting services, access to certain data services and our online subscription training offerings. In general, we are experiencingofferings, and variable transaction fees associated with the use of our products to fundraise online. Revenue from acquired companies contributed $6.2 million to the growth in subscriptions revenue during 2011. The remaining increase in subscriptions revenue during 2011 was principally attributable to the increase in demand for online fundraising offerings, data management offerings and hosting services. Additionally, revenue from our hosting services continued to increase as the demand for these services continued to grow from both our existing and new perpetual license customers. We continued to experience growth in our hosted applications business as a result of the eTapestry and Kintera acquisitions, which added experience in on-demand solutions and expanded our set of subscription services. Additionally, the growth in revenue in our subscription offerings is the result of the ongoing evolution of our product offerings from license-based to subscription-based offerings.Subscriptions revenue increased $23.2 million during 2009 when compared to 2008. The inclusion of Kintera for a full year in 2009 compared to a partial year in 2008 accounted for $11.7 million of the increase in subscriptions revenue. Excluding the impact of the acquisition of Kintera, growth in subscriptions revenue is primarily due to the continued increase in demand for hosted applications, hosting services and other online data services and we are experiencingincreasingly experienced a shift in our customers’ buying preference away from perpetual license agreementslicenses towards subscription-based hosted applications.Subscriptions revenue increased $24.3 million during 2008 when compared to 2007. During 2008, included in subscription revenue is $11.3 million of revenue attributable to Kintera. The inclusion of eTapestry for a full year in 2008 compared to a partial year in 2007 accounted for $5.1 million of the increase in subscriptions revenue. The remaining $7.9 million increase is attributable to organic growth from increased demand for hosting services and other online data services.Direct controllable costbased-offerings.isfor 2011 and 2010 was primarily comprised of human resource costs, stock-based compensation expense, third-party royalty and data expenses, hosting expenses, an allocation of depreciation, facilities and IT support costs, amortization of intangibles from business combinations and other costs incurred in providing support and services to our customers. During 2009,The increase in cost of subscriptions increased by $6.6 millionin 2011 when compared to 2008. Additional headcount and increases in data expense, hosting and other costs2010 was principally attributable to Kintera represented $4.0an increase in headcount. The increase in headcount was due to both the inclusion of acquired companies and the investments we were making in our infrastructure to support the growth in our subscription offerings. Human resource costs increased $6.9 million as a result of an increase in headcount, of which $3.6 million related to our acquisition of PIDI in February 2011. Hosting costs also increased by $2.8 million due to the increase in required hosting capacity as a result of the increase in cost of subscriptions. Excluding the impact of the acquisition of Kintera, cost ofdemand for hosting and other online services.increased by $2.6 million in 2009 whengross margin 2011 compared to 2008. The remaining increase is principally2010 was due to an increase in data expense, hosting and human resource costs.The increasethe investments we made in the costinfrastructure to support the growth in our subscription offerings. Year ended December 31, (in millions) 2011 2010 Change % Change Services revenue $ 108.8 $ 87.7 $ 21.1 24 % Cost of services 79.1 66.8 12.3 18 % Services gross profit $ 29.7 $ 20.9 $ 8.8 42 % Services gross margin 27 % 24 % subscriptionsconsulting, installation, implementation, education and analytic services. Consulting, installation and implementation services involve converting data from a customer’s existing system, assistance in 2008 when comparedfile set up and system configuration, and/or process re-engineering. Education services involve customer training activities. Analytic services are comprised of donor prospect research, selling lists of potential donors, benchmarking studies and data modeling services. These services involve the assessment of current and prospective donor information of the customer and are performed using our proprietary analytical tools. The end product enables organizations to 2007 is principally due to an increase in data expense, hosting and other costs of $5.1 million, of which $2.1 million ismore effectively target their fundraising activities. We recognize services revenue attributable to Kintera. Additionally, human resource costs increased $2.8 million,consulting services for implementation of which $1.5 million is attributable to Kinteraour hosted applications and eTapestry.The subscriptions segment margin remained substantially unchanged during 2009, 2008 and 2007.subscription offerings ratably over the period the customer benefits from those services. We also recognize the
Index to Financial Statementsoperations—(Continued) Year ended December 31, (in millions) 2011 2010 Change % Change Maintenance revenue $ 130.6 $ 124.6 $ 6.0 5 % Cost of maintenance 25.2 24.1 1.1 5 % Maintenance gross profit $ 105.4 $ 100.5 $ 4.9 5 % Maintenance gross margin 81 % 81 % Years ended December 31, 2009 versus 2008 2008 versus 2007 (in millions) 2009 2008 2007 Change % Change Change % Change $ 6.7 $ 8.8 $ 8.1 $ (2.1 ) (24 )% $ 0.7 9 % 6.0 8.3 7.2 (2.3 ) (28 )% 1.1 15 % $ 0.7 $ 0.5 $ 0.9 $ 0.2 40 % $ (0.4 ) (44 )% 10 % 6 % 11 % Year ended December 31, (in millions) 2011 2010 Change % Change Other revenue $ 8.5 $ 6.7 $ 1.8 27 % Cost of other revenue 7.0 7.1 (0.1 ) (1 )% Other gross profit $ 1.5 $ (0.4 ) $ 1.9 (475 )% Other gross margin 18 % (6 )% includesfor 2011 and 2010 included the sale of business forms that are used in conjunction with our software products;products, reimbursement of travel-related expenses, primarily incurred in connection withduring the performance of services at customer locations; fees from user conferences; and sale of hardware in conjunction with The Patron Edge.Other revenue decreased in 2009 when compared to 2008 primarily due to (i) a decrease in reimbursable travel-related costs from our services businesses as a result of reduced service engagements and (ii) a decrease inlocations, fees from user conferences as a result of fewer participants, both of which are attributable to the challenging economic environment. The increaseand third-party software referral fees. Other revenue increased in other revenue in 20082011 when compared to 2007 is2010 primarily due to attributable increasesan increase in reimbursable travelrevenue from third-party software referral fees and related expenses.Direct controllable costin reimbursement of travel-related expenses associated with the growth in services revenue.includesfor 2011 and 2010 included human resource costs, costs of business forms, costs of user conferences, and reimbursable expenses relating to the performance of services at customer locations.The decrease in the cost of other revenue in 2009 when compared to 2008 is due to a decrease in reimbursable expenses related to providing services at customer locations, and a decrease in the costs of user conferences. The increase in the cost of other revenue in 2008 when compared to 2007 is due to an increase in reimbursable travel expenses related to providing services at customer locations and costs associated with user conferences. Reimbursable expenses related to providing services at customer locations increased in 2008 compared to 2007 by $0.5 million and conference costs increased $0.6 million.Index to Financial StatementsBlackbaud, Inc.Item 7. Management’s discussion and analysis of financial condition and results of operations—(Continued)U.S. GAAP gross profitSegment income does not include an allocation of corporate costs, stock-based compensation expense and amortization expense. The following schedule reconciles total segment income to gross profit as stated on the statement of operations: Years ended December 31, 2009 versus 2008 2008 versus 2007 (in millions) 2009 2008 2007 Change % Change Change % Change $ 22.2 $ 32.8 $ 34.8 $ (10.6 ) (32 )% $ (2.0 ) (6 )% 23.5 33.3 34.4 (9.8 ) (29 )% (1.1 ) (3 )% 12.5 13.3 10.2 (0.8 ) (6 )% 3.1 30 % 100.7 92.0 81.2 8.7 9 % 10.8 13 % 50.6 34.0 17.6 16.6 49 % 16.4 93 % 0.7 0.5 0.9 0.2 40 % (0.4 ) (44 )% $ 210.2 $ 205.9 $ 179.1 $ 4.3 2 % $ 26.8 15 % 2.6 2.3 1.1 0.3 13 % 1.2 109 % 6.3 5.3 2.9 1.0 19 % 2.4 83 % 12.9 12.2 10.5 0.7 6 % 1.7 16 % $ 188.4 $ 186.1 $ 164.6 $ 2.3 1 % $ 21.5 13 % 61 % 62 % 64 % Stock-based compensation expense and amortization expense are analyzed separately following the operating expenses section.Corporate overhead costsAllocated corporate overhead costs are comprised of depreciation, facilities and IT support costs. Corporate overhead costs included in gross profit were $12.9 million, $12.2 million and $10.5 million for 2009, 2008 and 2007, respectively. The increase in corporate overhead costs allocated toamortization of intangibles from business combinations. In total, cost of other revenue in 20092011 when compared to 2008 is primarily attributable2010 decreased by $0.1 million due to thea reduction in user conference expenses offset by an increase in depreciation expense of $0.3 million as a result of property and equipment purchases and $0.4 million ofreimbursable expenses.IT support costs.The increase in corporate overhead costs in 20082011 when compared to 2007 is primarily the result of2010 due to an increase in depreciation of $0.7 million asrevenue from third-party software referral fees and a result of property and equipment purchases. Additionally, facilities expense increased $1.7 million primarily as a result of locations added in connection with the Kintera and eTapestry acquisitions and additional office space leased. IT support costs decreased $0.7 million due to reduced maintenance cost on internally used software.Operating expensesThe operating expenses analyzed below are presented on a non-U.S. GAAP basis as they exclude stock-based compensation expense. We believe that the exclusion of these costs allows us to better understand and manage other operating expenses and cash needs. Stock-based compensation expense is analyzed, in total,reduction in the section following the operating expense analysis.Index to Financial StatementsBlackbaud, Inc.Item 7. Management’s discussion and analysiscost of financial condition and results of operations—(Continued) Years ended December 31, 2009 versus 2008 2008 versus 2007 (in millions) 2009 2008 2007 Change % Change Change % Change $ 61.2 $ 63.6 $ 56.2 $ (2.4) (4)% $ 7.4 13% 1.6 1.6 0.8 — 0 % 0.8 100% $ 62.8 $ 65.2 $ 57.0 $ (2.4) (4)% $ 8.2 14% 20% 21% 22% Year ended December 31, (in millions) 2011 2010 Change % Change Sales and marketing expense $ 75.4 $ 69.5 $ 5.9 8 % % of revenue 20 % 21 % includesfor 2011 and 2010 included salaries and related human resource costs, stock-based compensation expense, travel-related expenses, sales commissions, advertising and marketing materials, public relations and an allocation of depreciation, facilities and IT support costs.2009,2011, sales and marketing expense decreased $2.4increased by $5.9 million when compared to 2008. The inclusion2010 primarily due to an increase of $3.6 million in human resource costs and other$2.0 million in commission expense. The increase in human resource costs was a result of additional headcount to support the increase in selling and marketing efforts of our growing operations. The increase in commission expense was principally attributable to Kintera for a full year in 2009 compared to a partial year in 2008 accounted for $2.8 million of an increase in sales and marketing expense. Excluding the sales and marketing expense increase attributable to Kintera, sales and marketing expense decreased $5.2 million. The decrease is primarily attributable to a reduction in travel-related expenses, corporate allocated costs and other sales and marketing related costs of $2.1 million. Additionally, commission expense decreased by $2.4 million due to lower commissionable revenue in 2011. Additionally, marketing programs increased by $0.3 million relating to the launch of our new corporate branding and human resource costs decreased by $0.7 million due to a reduction in headcount.Thean increase in sales and marketing expense in 2008 compared to 2007 is principally due to increases in our sales force and the inclusion of sales and marketing costs of acquired companies. During 2008, human resource costs increased $5.9 million, of which $3.2 million is due to the inclusion of human resources associated with Kintera and eTapestry. Other increases include higher travel costs, allocated costs and other marketing related costs of $1.5 million.2009 decreased2011 when compared to 20082010 decreased principally dueas a result of our ability to the decrease in commission expense resulting from lower commissionable revenue during 2009. As a percentage of revenue,leverage our sales support and marketing costs in 2008 decreased by one percentage point compared with 2007, principally due to a decrease in commission expense associated with the decline in license feesresources as we standardized and simplified our services.Research and development Years ended December 31, 2009 versus 2008 2008 versus 2007 (in millions) 2009 2008 2007 Change % Change Change % Change $ 42.7 $ 36.3 $ 27.3 $ 6.4 18% $ 9.0 33% 2.9 2.4 1.2 0.5 21% 1.2 100% $ 45.6 $ 38.7 $ 28.5 $ 6.9 18% $ 10.2 36% 14 % 12 % 11 % packaged offerings.
Index to Financial Statementsoperations—(Continued) Year ended December 31, (in millions) 2011 2010 Change % Change Research and development expense $ 47.7 $ 45.5 $ 2.2 5 % % of revenue 13 % 14 % expenses includeexpense for 2011 and 2010 included human resource costs, stock-based compensation expense, third-party contractor expenses, software development tools and other expenses related to developing new products, upgrading and enhancing existing products, and an allocation of depreciation, facilities and IT support costs. increased in 2009 when compared to 2008 principally due to an increase in headcount associated with increased investment in our products. During 2009, the increase in research and development costs is principally the result of an increase in human resource costs of $5.8 million, $3.2 million of which is attributable to inclusion of Kintera for a full year in 2009 compared to a partial year in 2008. Further increases of $0.6 million are attributable to higher allocated costs, partially offset by decreased travel and recruiting costs.During 2008 when compared to 2007, the increase in research and development costs is primarily due to a $7.6 million increase in human resource costs resulting from an increase in headcount and increased investment in our products, of which $3.4 million is due to the inclusion of Kintera and eTapestry. Further increases of $1.1 million are attributable to higher allocated costs and $0.3 million higher travel and other costs.Research and development expense as a percentage of revenue increaseddecreased in 20092011 when compared to 2008 and 2008 when2010 principally due to the increase in the amount of development costs that were capitalized in 2011 as compared to 2007 primarily due to an increased investment in our product initiatives. Years ended December 31, 2009 versus 2008 2008 versus 2007 (in millions) 2009 2008 2007 Change % Change Change % Change $ 28.2 $ 28.3 $ 22.4 $ (0.1) (0)% $ 5.9 26% 5.2 5.8 3.8 (0.6) (10)% 2.0 53% $ 33.4 $ 34.1 $ 26.2 $ (0.7) (2)% $ 7.9 30% 9 % 9 % 9 % Year ended December 31, (in millions) 2011 2010 Change % Change General and administrative expense $ 36.9 $ 32.6 $ 4.3 13 % % of revenue 10 % 10 % consistsfor 2011 and 2010 consisted primarily of human resource costs for general corporate functions, including senior management, finance, accounting, legal, human resources, corporate development, stock-based compensation expense, third-party professional fees, insurance, an allocation of depreciation, facilities and IT support costs, acquisition related expense and other administrative expenses.2009, the decrease in2011, general and administrative expense when comparedincreased primarily due to 2008 was primarily the result of closely managing our operating costs during 2009. Included$1.3 million and $1.1 million increases in generalstock-based compensation expense and administrative expense during 2009 is an increase of $1.8 million in human resource costs, respectively, a $0.8 million increase in acquisition-related expenses, $0.5 million in third-party professional consulting fees and $0.3 million of otherin recruiting costs attributableassociated with hiring key executives in 2011. Acquisition-related costs related primarily to the inclusionacquisition of Kintera for a full year in 2009 comparedPIDI, EDH and the pending acquisition of Convio. Stock-based compensation increased due to a partial yearchange in 2008. Excluding these costs attributablethe type of equity awards granted to Kintera, general and administrativecertain executives to be performance-based, for which expense decreased by $2.2 million in 2009 when compared to 2008 primarily due to decreased travel-related costs, bad debt expense and professional fees.During 2008, the increase in general and administrative expenses when compared to 2007 includes $3.7 millionis recognized on an accelerated basis.additional human resource and other costs attributed to the inclusion of Kintera and eTapestry. The remaining increase was primarily driven by an increase in human resource costs of $1.2 million due to an increase in headcount and $1.0 million increase in bad debt expense and allocated costs.As a percentage of revenue, general and administrative costs remained unchanged during 2009, 2008 and 2007.Index to Financial StatementsContentsoperations—(Continued)Stock-based compensationWe recognize compensation expense related to stock-based awards granted to employees. We measure stock-based compensation cost atoperations (continued)grant date based onresults exclude the fair value of the award and recognize it as expense over the requisite service period, which is the vesting period.Our consolidated statements of operations for 2009, 2008, and 2007 include the amountsimpact of stock-based compensation illustrated below: Years ended December 31, 2009 versus 2008 2008 versus 2007 (in millions) 2009 2008 2007 Change % Change Change % Change $ 1.4 $ 1.4 $ 0.6 $ — 0% $ 0.8 133% 0.8 0.6 0.2 0.2 33% 0.4 200% 0.4 0.3 0.3 0.1 33% — 0% 2.6 2.3 1.1 0.3 13% 1.2 109% 1.6 1.6 0.8 — 0% 0.8 100% 2.9 2.4 1.2 0.5 21% 1.2 100% 5.2 5.8 3.8 (0.6) (10)% 2.0 53% 9.7 9.8 5.8 (0.1) (1)% 4.0 69% $ 12.3 $ 12.1 $ 6.9 $ 0.2 2% $ 5.2 75% Stock-based compensationexpense, amortization expense, acquisition-related expenses, impairment of cost method investment and gain on sale of assets. We believe that the exclusion of these costs allows us and investors to better understand our operating expenses and cash needs, particularly when evaluating current performance against prior periods. Year ended December 31, (in millions) 2011 2010 Change % Change GAAP income from operations $ 50.9 $ 46.0 $ 4.9 11 % Non-GAAP adjustments: Add: Stock-based compensation expense 14.9 13.1 1.8 14 % Add: Amortization of intangibles from business combinations 7.6 7.1 0.5 7 % Add: Acquisition-related expenses 1.8 1.0 0.8 80 % Add: Impairment of cost method investment 1.8 — 1.8 100 % Less: Gain on sale of assets (0.5 ) — (0.5 ) 100 % Total Non-GAAP adjustments 25.6 21.2 4.4 21 % Non-GAAP income from operations $ 76.5 $ 67.2 $ 9.3 14 % Non-GAAP operating margin 21 % 21 % comprised of expense from common stock awards, stock options, restricted stock awards and stock appreciation rights. The table below summarizes the stock-based compensation by award type for 2009, 2008 and 2007. Years ended December 31, 2009 versus 2008 2008 versus 2007 (in millions) 2009 2008 2007 Change % Change Change % Change $ 0.8 $ 1.4 $ — $ (0.6 ) (43 )% $ 1.4 — % 0.3 1.5 2.4 (1.2 ) (80 )% $ (0.9 ) (38 )% 8.8 7.2 3.8 1.6 22 % $ 3.4 89 % 2.4 2.0 0.7 0.4 20 % $ 1.3 186 % $ 12.3 $ 12.1 $ 6.9 $ 0.2 2 % $ 5.2 75 % During 2009 and 2008, we expensed $0.8 million and $1.4 million, respectively,directly related to compensation and incentive arrangements payablethe borrowings we incurred to fund our acquisition of Convio in common stock and associated with business acquisitions completed in 2008 and 2007. There were no similar arrangements payable in common stock in 2007. May 2012.decrease in compensation expense from stock options in 2009 compared to 2008 and 2008 compared to 2007following is the result of using the accelerated method for recognizing stock-based compensation expense associated with stock options, which results in the recognition of more expense in the earlier periods of vesting when compared with the straight-line method. We have not granted stock options since 2005 and all historical awards will be fully vested in 2010.Stock-based compensation expense from restricted stock awards and stock appreciation rights increased in 2009 compared to 2008 and 2008 compared to 2007 due to the issuance of additional grants and rights in 2009 and 2008, offset by the partial vesting of grants issued in prior years.Index to Financial StatementsBlackbaud, Inc.Item 7. Management’s discussion and analysis of financial condition and results of operations—(Continued)The total amount of compensation costs related to non-vested awards not yet recognized was $29.3 million as of December 31, 2009. The compensation cost for unvested awards at December 31, 2009 will be recognized over a weighted average period of 1.9 years.AmortizationWe allocate amortization expense to cost of revenue based on the nature of the respective identifiable intangible asset and whether the asset is directly associated with a specific component of revenue. Amortization expense included in our consolidated statements of operationseffective tax rate for the years ended December 31, 2009, 2008 and 2007 is illustrated below: Years ended December 31, 2009 versus 2008 2008 versus 2007 (in millions) 2009 2008 2007 Change % Change Change % Change $ 0.4 $ 0.2 $ 0.1 $ 0.2 100 % $ 0.1 100 % 1.3 1.4 1.2 (0.1 ) (7 )% 0.2 17 % 1.3 0.9 0.4 0.4 44 % 0.5 125 % 3.2 2.7 1.1 0.5 19 % 1.6 145 % 0.1 0.1 0.1 — 0 % — — % 6.3 5.3 2.9 1.0 19 % 2.4 83 % 0.8 0.7 0.5 0.1 14 % 0.2 40 % $ 7.1 $ 6.0 $ 3.4 $ 1.1 18 % $ 2.6 76 % 2012 2011 2010 Effective tax rate 50.6 % 35.2 % 36.5 % increaseseffective rate in amortization expense for 2009 compared to 2008 and 2008 compared to 2007 are directly attributable to the acquisitions of the Target Companies, eTapestry and Kintera. Identifiable intangible assets of $16.9 million and $32.8 million were recorded during 2008 and 2007, respectively, related to the acquisition of these companies.Interest expenseInterest expense decreased $0.6 million in 20092012 increased when compared to 2008. The decrease is2011 primarily relateddue to the timing of payments and the duration of borrowings under our credit facility. Additionally, a decrease in our effective interest rate contributedpre-tax income, reduction in federal research and development credits and nondeductible transaction costs associated with the Convio acquisition. In January 2013, the federal research and development credit was reinstated with retrospective application to the decrease2012 tax year. Our estimated 2012 tax credit will be recorded as a discrete benefit in interest expense.Interest expense increased $0.4 million in 2008 when compared to 2007. The increase is primarily related to the timing and amountfirst quarter of borrowings under our credit facility, offset by a decrease in our effective interest rate. During 2008 and 2007, we utilized borrowings under our credit facility for short-term financial needs such as funding business acquisitions and share repurchases. However, in 2008 we carried outstanding debt for a longer period, as compared to 2007.Income tax provisionWe record income tax expense in our consolidated financial statements based on an estimated annual effective income tax rate. We had an effective tax rate of 37.7%, 35.3%, and 38.5% in 2009, 2008 and 2007, respectively.2013. The effective tax rate in 2008 was lower2011 decreased when compared to 2009 because2010 due to the change in our valuation allowances. In 2011, we generated a greater amountreversed $1.0 million of federal andvaluation allowance for certain state incomenet operating loss carryforwards in connection with the completion of certain state tax credits in 2008 that served to lower our effective tax rate for 2008. While we generated federal and state income tax credits in 2009, the amounts realized in 2008 were significantly higher.Index to Financial StatementsBlackbaud, Inc.Item 7. Management’s discussion and analysis of financial condition and results of operations—(Continued)maywould adjust our deferred tax assets and liabilities to an amount reflecting those income tax rates. Any change will affect the provision for income taxes during the period that the determination is made.The following table reconciles the amountsbenefits for the years ended December 31: (in thousands) 2009 2008 2007 $ 346 $ 629 $ 642 427 — 13 — — (12 ) 485 23 8 (27 ) (306 ) — — — (22 ) $ 1,231 $ 346 $ 629 The amount of unrecognized tax benefits that, if recognized, would favorably affect our effective tax rate was $1.1 million at December 31, 2009. Tax expense for 2009 increased by $0.9 million for changes in liabilities, penalties and accrued interest related to uncertain tax positions. The total amount of interest and penalties includedreturns in the consolidated balance sheetU.S. for federal and various state jurisdictions as well as in foreign jurisdictions including Canada, United Kingdom, Australia and the Netherlands. We are generally subject to U.S. federal income tax examination for calendar tax years ending 2009 through 2011 as well as state and foreign income tax examinations for various years depending on statute of December 31, 2009 and 2008 was $0.2 million. The total amountlimitations of interest and penalties included in the consolidated statement of operations for 2008 was $0.1 million; interest and penalties were immaterial in 2009.amountsamount of unrecognized tax benefits may significantly decrease within the next twelve months. The possible decrease could result from the finalization of state income tax reviews and the expiration of statutes of limitations. The reasonably possible decrease is $0.3 million.We file income tax returns in the U.S. federal and various state jurisdictions and foreign jurisdictions including Canada, United Kingdom, Australia and Netherlands. We are subject to U.S. federal income tax examination for calendar tax years ending 2005 through 2008.2009,2012, cash and cash equivalents totaled $22.8$13.5 million, compared to $16.4$52.5 million at December 31, 2008. The $6.42011. During 2012, we generated $68.7 million increase in of cash flow from operations and borrowed $315.0 million under our credit facility. We used our cash flow from operations, borrowings under the credit facility and cash equivalentson hand to fund the $280.4 million acquisition of Convio, pay dividends of $21.7 million and purchase $20.6 million of computer software and equipment. Additionally, we repaid $99.5 million of borrowings during 2009 is principally the result of generating $86.8 million of cash from operations reduced by $59.0 million in debt repayments on our credit facility, $17.7 million in dividends paid to stockholders and $7.8 million used to purchase property, equipment and RLC.twelve12 months to finance our operations, fund anticipated capital expenditures, meet our debt obligations and pay dividends. Dividend payments are not guaranteed and our Board of Directors may decide, in its absolute discretion, at any time and for any reason, not to declare or pay further dividends and/or repurchase our common stock.Index to Financial StatementsBlackbaud, Inc.Item 7. Management’s discussion and analysis of financial condition and results of operations—(Continued)At December 31, 2009 we had no outstanding borrowings under our credit facility. We have drawn on our credit facility from time to time to help us meet short-term financial needs, such as business acquisitions and purchasepurchases of common stock under our repurchase program. Under this five-yearIn February 2012, we amended and restated our credit facility which matures in July 2012, we may elect not more than twice over the term of the agreement to increase the aggregate amount available of $75.0 million by upborrowing capacity to $50.0$325.0 million. We exercised one of these options for an additional $15.0 millionThe amended credit facility matures in June 2008.February 2017. We believe our $90.0 million credit facility provideswill provide us with sufficient flexibility to meet our future financial needs.Financial Covenant Requirement Ratio as of December 31, 2012 Leverage Ratio < 3.00 to 1.00 2.31 to 1.00 Interest Coverage Ratio > 3.50 to 1.00 16.61 to 1.00 Maximum Capital Expenditures $40.0 million for the fiscal year ended December 31, 2012 $22.6 million $86.8$68.7 million increased $26.5 decreased by $16.8 million when compared to 2008 primarily due to a decrease in income tax payments of $13.6 million principally attributable to fluctuations in the timing of payments. during 2012. Throughout both years,2012 and 2011, our cash flows from operations were derived principally from: (i) our earnings from on-going operations prior to non-cash expenses such as depreciation, amortization and stock-based compensation and adjustments to our provision for sales current assets, accounts payable, accrued expenses accruedand other liabilities and deferred revenue. Net collections of accounts receivable and increases in deferred revenue represent a net increase in cashCash flow from operations associated with working capital changes of $14.6decreased $8.9 million and $9.2 million in 2009 and 2008, respectively. The year-over-year increase2012 when compared to 2011. This net decrease is principally due to the reduced billings related to slower sales growth when comparing 2009 to 2008. Changes in our balances of accounts payable, prepaid expenses, accrued liabilities and other current assets represent a net increase in cash associated with working capital changes of $2.4 million in 2009, compared to a net decrease of $12.9 million in 2008. The primary driver of this change is (i) a reduction in prepaid expenses principally attributable to the receipt of $4.5 million in income tax refunds and (ii) an increase in the amount of cash paid for income taxes, payable and other accrued liabilities principally attributable to fluctuations in the timing of payments.20092012 for investing activities was $7.8$302.5 million compared to $56.0$41.7 million of net cash used in 2008. The decrease in cash used in investing activities is principally due to a decrease in net cash used for acquisitions. We invested $5.5 million in property and equipment in 2009 compared to $7.7 million in 2008. Vendor payments for $3.7 million of property and equipment purchases received in 2009 had not been made as of December 31, 2009 and, accordingly, have been reflected as non-cash activity in our consolidated statement of cash flow for 2009.Financing cash flowNet cash used in financing activities for 2009 was $73.2 million compared to $1.0 million in 2008.2011. The increase in cash used in financing activities is primarily due to the largeracquisition of Convio in May 2012. Additionally, we increased the amount spent on computer equipment and software associated with the infrastructure that supports our subscription-based offerings from repayment of borrowings$315.0 million under our credit facility to fund the acquisition of Convio and made debt repayments of $99.5 million. We paid dividends of $21.7 million which was relatively consistent with the amount paid in 2009 compared to 2008. Additionally, in 2008, we borrowed funds, principally to acquire Kintera and repurchase our stock. We did not borrow any funds nor repurchase stock in 2009 and amounts used for acquisition was substantially less in 2009 compared to 2008.Index to Financial StatementsBlackbaud, Inc.2011.Item 7. Management’s discussion and analysis of financial condition and results of operations—(Continued)2009,2012, we had $1.3 million of outstanding debt and future minimum lease commitments of $66.6 million as follows: Payments due by period (in millions) Total Less than 1
year 1-2 years 3-5 years More than 5
years $ 66.4 $ 7.0 $ 12.3 $ 8.8 $ 38.3 0.2 0.2 — — — 1.3 1.3 — — — $ 67.9 $ 8.5 $ 12.3 $ 8.8 $ 38.3 Payments due by period (in millions) Total Less than 1 year 1-2 years 3-5 years More than 5 years Operating leases $ 83.8 $ 10.3 $ 17.9 $ 14.7 $ 40.9 237.2 16.0 39.4 181.8 — Total $ 321.0 $ 26.3 $ 57.3 $ 196.5 $ 40.9 (1) Included in the table above is $21.7 million of interest. The actual interest expense recognized in our consolidated statements of comprehensive income will depend on the amount of debt, the length of time the debt is outstanding and the interest rate, which could be different from our assumptions used in the above table. that expire in 2010 and 2011, incentive payments from the state of South Carolina resulting from the relocation of our headquarters, and reimbursement of leasehold improvements totaling $4.7 million.Included in the table above is interest expense of $0.1 million. The actual interest expense recognized in our consolidated statements of operations will depend on the amount of debt and length of time the debt is outstanding, which could be different from our assumptions used in the table above.As of December 31, 2009, we had accrued an estimate of $0.2 million related to contingent consideration in connection with the acquisition of RLC. Please refer to Note 2 in our notes to the consolidated financial statements for further information. We are unable to determine the actual amount, if any, for which this liability will be settled, and accordingly, we have not included this amount in the table above.As of December 31, 2009, we have accrued $0.9 million of federal taxes, $0.3 million of state taxes and $0.2 million of interest and penalties related to uncertain tax positions taken in current and prior years. Please refer to Note 10 in our notes to the consolidated financial statements for further information. We are unable to determine the period in which these liabilities will be settled, and accordingly, we have not included these amounts in the table above. annual purchase commitments under these arrangements at December 31, 2009 are2012, were approximately $3.4$4.5 million through 2012, which is not included in the table above.2015. We incurred expense under these arrangements of $2.4$1.3 million $1.6, $3.2 million and $0.8$1.7 million for the years ended December 31, 2009, 20082012, 2011 and 2007,2010, respectively.2010,2013, our Board of Directors approved our annual dividend rate of $0.44$0.48 per share for 2010 and declared a first quarter dividend of $0.11 per share payable on March 15, 2010 to stockholders of record on February 26, 2010.2013. Dividends at the annual rate would aggregate to $19.4$22.1 million assuming 44.046.0 million shares of common stock are outstanding, net of treasury stock.outstanding. Our ability to continue to declare and pay dividends mayquarterly this year and beyond might be restricted by, among other things, the terms of our credit facility, general economic conditions and our ability to generate adequate operating cash flow.Index to Financial StatementsBlackbaud, Inc.Item 7. Management’s discussion and analysis of financial condition and results of operations—(Continued) believe we currently have any off-balance sheet arrangements, financings or other relationships with unconsolidated entities or other persons.12.8%14% of our total net revenue for the year ended December 31, 20092012 was derived from operations outside the United States. We do not have significant operations in countries in which the economy is considered to be highly inflationary. Our consolidated financial statements are denominated in U.S. dollars and, accordingly, changes in the exchange rate between foreign currencies and the U.S. dollar will affect the translation of our subsidiaries’ financial results into U.S. dollars for purposes of reporting our consolidated financial results. The accumulated currency translation adjustment, recorded within other comprehensive loss as a separate component of stockholders’ equity, was $0.7a loss of $1.2 million and $1.0$1.1 million at December 31, 20092012 and 2008,December 31, 2011, respectively.euros,Euros, respectively. Historically, as the U.S. dollar weakened, foreign currency translation resulted in an increase in our revenues and expenses denominated in non-U.S. currencies. During 2009, the2012, foreign currency translation has resulted in a decrease in our reported revenues and expenses denominated in non-U.S. currencies when compared to 2008.currencies. Though we do not believe our increased exposure to currency exchange rates has had a material impact on our consolidated results of operations or financial position, we intend to continue to monitor our foreign currency exchange ratesuch exposure and take action as appropriate.revenue and expenses and related disclosuresdisclosure of contingent assets and liabilities.liabilities at the date of the financial statements, as well as the reported amounts of revenues and expenses during the reporting periods. On an ongoing basis, we reconsider and evaluate our estimates and assumptions, including those that impact revenue recognition, long-lived and intangible assets and goodwill, stock-based compensation, the provision for income taxes, capitalization of software development costs, our allowance for sales returns and doubtful accounts, valuation of long-liveddeferred sales commissions, accounting for business combinations and intangible assets and goodwill, stock-based compensation and provision for income taxes, valuation of deferred tax assets and liabilities andloss contingencies.(1) selling perpetual licenses of our software products; (2) providing professional services including implementation, training, consulting, hosting and other services; (3) providing software maintenance and support services; and (4)(i) charging for the use of our software products in a hosted environment.environment; (ii) selling perpetual licenses of our software products; (iii) providing professional services including implementation, training, consulting, analytic, hosting and other services; and (iv) providing software maintenance and support services.
operations—(Continued)License feesWe recognize revenue from the sale of perpetual software license rightsDetermining whether and when all of the following conditions are met:persuasive evidence of an arrangement exists;the product hasthese criteria have been delivered;the fee is fixed or determinable;met can require significant judgment andcollection of the resulting receivable is probable.license agreement doesagreements do not include customer acceptance provisions; however, if acceptance provisions are provided, delivery is deemed to occur upon acceptance. We consider the fee to be fixed or determinable unless the fee is subject to refund or adjustment or is not payable within our standard payment terms. Payment terms greater than 90 days are considered to be beyond our customary payment terms. Collection is deemed probable if we expect that the customer will be able to pay amounts under the arrangement as they become due. If we determine that collection is not probable, we defer revenue recognition until collection.delivered components, normally the license componenteach of the arrangement,elements in these arrangements using the residual value method under which we first allocate revenue to the undelivered elements, typically the non-software license components, based on objective evidence of the fair value of the undeliveredvarious elements. We determine the fair value of the various elements which is specific to us.using different methods. Fair value for maintenance services associated with software licenses is based upon renewal rates stated in the agreements with customers, which vary according to the level of support service provided under the maintenance program. Fair value of professional services and other products and services is based on sales of these products and services to other customers when sold on a stand-alone basis. Any remaining revenue is allocated to the delivered elements which is normally the software license in the arrangement.on a percent-complete basis. For service engagements of less than $10,000, we frequently contract for and bill based on a fixed fee plus reimbursable travel-related expenses. We recognize this revenue upon completion of the work performed. is recognized only upon the customer attending and completing training. Additionally, we sell a fixed-rate program,programs, which permitspermit customers to attend unlimited training over a specified contract period, typically one year, subject to certain restrictions, and revenue is recognized ratably over this contract period.Index to Financial StatementsBlackbaud, Inc.Item 7. Management’s discussion and analysis of financial condition and results of operations—(Continued)Maintenancewhich is typically one year. Maintenance contracts are at rates that vary according to the level of the maintenance program and are generally renewable annually. Maintenance contracts also include the right to unspecified product upgrades on an if-and-when available basis. Certain support services are sold in prepaid units of time and recognized as revenue upon their usage.SubscriptionsWe provide hosting services to customers who have purchased perpetual rights to certain of our software products (hosting services). Revenue from hosting services, as well as data enrichment services, data management services and online training programs is recognized ratably over the service period of the contract. Any related set-up fees are also recognized ratably over the service period of the contract.We are increasingly making certain of our software products available for use in hosted application arrangements without licensing perpetual rights to the software (hosted applications). Revenue from hosted applications is recognized over the subscription agreement, which generally ranges from one to three years. For contractual arrangements covering the use of hosted applications the stand alone value of the delivered items or the fair value of undelivered items in the arrangement have not been established. Such items include upfront activation, implementation and hosting of the solution. For these arrangements we treat the transaction as a single element and the revenue is deferred until the hosted application is deployed and in use, at which time revenue is recognized over the remaining term of the arrangement. Direct and incremental costs relating to activation and implementation are capitalized until the hosted application is deployed and in use, and then expensed over the remaining term of the arrangement.Revenue from transaction processing fees is recognized when received. Credit card fees directly associated with processing donations for customers are included in subscription revenue, net of related transaction costs. or pay for the above described services in advance of delivery, we record such amounts are recorded in deferred revenue.Sales returns and allowance for doubtful accountsWe provide customers a 30-day right of return and maintain a reserve for returns. We estimate the amount of this reserve based on historical experience. Provisions for sales returns are charged against the related revenue items.We maintain an allowance for doubtful accounts at an amount we estimate to be sufficient to provide adequate protection against losses resulting from extending credit to our customers. In judging the adequacy of the allowance for doubtful accounts, we consider multiple factors including historical bad debt experience, the general economic environment, the need for specific customer reserves and the aging of our receivables. Any necessary provision is reflected in general and administrative expense. A considerable amount of judgment is required in assessing these factors and if any receivables were to deteriorate, an additional provision for doubtful accounts could be required.Index to Financial StatementsBlackbaud, Inc.Item 7. Management’s discussion and analysis of financial condition and results of operations—(Continued)the License Fees, Consultingour four operating segments (see Note 16 to our consolidated financial statements), and Education Services, Analytic Services, Maintenance and Subscriptions operating segments.Blackbaud Payment Services. We test goodwill for impairment annually, or more frequently if events or changes in circumstances indicate that the asset might be impaired. The impairment test comparesWe first assess qualitative factors to determine whether it is more likely than not that the fair value of a reporting unit is less than its carrying amount. Significant judgment is required in the assessment of qualitative factors. To the extent the qualitative factors indicate that the fair value is likely less than the carrying amount, we compare the fair value of the reporting unit with its carrying amount. If the carrying amount exceeds its fair value, impairment is indicated. If an impairment is indicated, the impairment is measured as the excess of the recorded goodwill over its fair value, which could materially adversely impact our consolidated financial position and results of operations.Even if our estimated fair value of the reporting units significantly declined, no impairment would be indicated. Actual future results may differ from those estimates.Stock-based is measured at the grant date based on the fair value of the award and is recognizedrecognize it as expense over the requisite service period, which is the vesting period. We determine the fair value of the stock options and stock appreciation rights using ana Black-Scholes option pricing model, which requires us to use significant judgment to make estimates regarding the life of the award, volatility of our stock price, the risk-free interest rate and the dividend yield of our stock over the life of the award. We determine the fair value of awards that contain market conditions using a Monte Carlo simulation model. Changes to these estimates would result in different fair values of awards.forfeitureestimated and actual forfeitures.actual forfeitures.Provisionjudgments in accounting for income tax and valuationtaxes. The calculation of deferred tax assetsWe account for income taxes using the asset and liability approach to recognize deferred tax assets and liabilities for the expected future tax consequences of events that have been included in the consolidated financial statements or income tax returns. Using the enacted tax rates in effect for the year in which we expect theIndex to Financial StatementsBlackbaud, Inc.Item 7. Management’s discussion and analysis of financial condition and results of operations—(Continued)differences to reverse, we determine deferred tax assets and liabilities based on the differences between the financial reporting and the tax basis of an asset or liability. We record a valuation allowance when it is more likely than not that the deferred tax asset will not be realized.Significant judgment is required in determining income taxes in each of the jurisdictions in which we operate. This process involves estimating our actual current tax exposure together with assessing temporary differences resulting from differing treatment of items, such as deferred revenue, for tax and accounting purposes. These differences result in a net deferred tax asset or liability that is included in our consolidated balance sheets. The final outcome of these matters for tax reporting purposes might be different than that which is reflected in our historical income tax provisions, benefits and accruals. Any difference could have a material effect on our income tax provision requires estimates due to transactions, credits and net income incalculations where the period in which such aultimate tax determination is made.Prior to October 13, 1999, we were organizeduncertain. Uncertainties arise as an S corporation under the Internal Revenue Code and, therefore, were not subject to federal income taxes. In addition, we were not subject to income tax in manya consequence of the states in which we operated as a resultactual source of our S corporation status. We historically made distributions to our stockholders to covertaxable income between domestic and foreign locations, the stockholders’ anticipatedoutcome of tax liability. In connection with our 1999 recapitalization, we converted our U.S. taxable status from an S corporation to a C corporation. Accordingly, since October 14, 1999 we have been subject to federalaudits and state income taxes. Upon the conversion and in connection with the recapitalization, we recorded a one-time benefitultimate utilization of $107.0 million to establish a deferred tax asset.We assess the likelihood that our deferred tax assets will be recovered from future taxable income.credits. To the extent we believe that recovery is not likely, we establish a valuation allowance. To the extent we establish a valuation allowance, we include an expense within the income tax provision in the consolidated statement of operations. Our valuation allowance of $8.0 million at December 31, 2009 is primarily associated with deferred tax assets for certain state income tax credits and net operating loss carryforwards that we have determined are not more-likely-than-not to be realized. The ability to utilize our net deferred tax asset is dependent on our ability to generate future taxable income. Based on current estimates of revenue and expenses, we expect future taxable income will be sufficient to realize the remaining deferred tax assets. Even if actual results are significantly below our current estimates, the recovery still remains likely and, except for the state tax credits and net operating loss carryforwards discussed above, no valuation allowance would be necessary.Significant judgment is required in determining the provision for income taxes. To the extent that final results differ from estimated amounts that were initially recorded, such differences will impact the income tax provision in the period in which suchthe determination is made and could have an impact on the deferred tax asset. Our deferredmade.are recorded at an amount based upon a U.S. federal incomewhich arise from differences in the timing of recognition of revenue and expense for tax rate of 35.0% and appropriate statutory rates of various foreign, state and local jurisdictions in which we operate. If our tax rates change, we will adjustfinancial statement purposes. We record valuation allowances to reduce our deferred tax assets to the amount expected to be realized. In assessing the adequacy of a recorded valuation allowance significant judgment is required. We consider all positive and negative evidence and a variety of factors including the scheduled reversal of deferred tax liabilities, historical and projected future taxable income, and prudent and feasible tax planning strategies. If we determine there is less than a 50% likelihood that we will be able to use a deferred tax asset in the future in excess of its net carrying value, then an amount reflecting thoseadjustment to the deferred tax asset valuation allowance is made to reduce income tax rates. If such change is determined to be appropriate, it will affect the provision forexpense, thereby increasing net income taxes duringin the period that thesuch determination iswas made. the tax impact from an uncertain tax position onlypositions. To recognize such positions we must first determine if it is more-likely-than-notmore likely than not that the tax position will be sustained on examination by taxing authorities, based onaudit. We must then measure the technical merits of the position. Such tax impact recognized in the consolidated financial statements from such a position is measured based onbenefit as the largest benefitamount that has a greateris more than 50% likelihoodlikely of being realized upon ultimate resolution.settlement. Significant judgment is required in the identification and measurement of uncertain tax positions.IndexFinancial Statementsspecific upgrades and enhancements when it is probable the expenditures will result in additional functionality. Capitalized costs are recorded as part of computer software costs. Internal use software is amortized on a straight line basis over its estimated useful life, generally three years.operations—(Continued)issuedadopted accounting pronouncementsIn October 2009,Presentation of Comprehensive Income, which (i) eliminates the FASB released Accounting Standards Update (ASU) 2009-13, which amendsoption to present components of other comprehensive income, or OCI, as part of the existing criteria for separating considerationstatement of changes in multiple-deliverable arrangements. Arrangement that include perpetual software licenses are excluded from the scope of this ASU. ASU 2009-13 establishes a hierarchy for determining the selling price of a deliverablestockholders’ equity and (ii) requires the usepresentation of best estimateeach component of the selling price when VSOEnet income and each component of OCI either in a single continuous statement or third party evidence (TPE) of the selling price cannot be determined. As a result of the requirement to use the best estimate of the selling price when VSOE or TPE of the selling price cannot be determined, the residual method will no longer be permitted. ASU 2009-13 is applicable prospectively for revenue arrangements entered into or materially modified after thein two separate but consecutive statements. The adoption date or retrospectively for all periods presented. We are required to adopt ASU 2009-13 on January 1, 2011. Early adoption is permitted. We are currently evaluating the impact of ASU 2009-132011-05 did not have a material impact on our consolidated financial statements.Cautionary statementoperatehave presented each component of net income and OCI in a highly competitive environment that involvessingle continuous statement.numbermaterial impact on our consolidated financial statements.risks, someAmounts Reclassified Out of Accumulated Other Comprehensive Income, which are beyond our control. The followingrequires an entity to provide information about the amounts reclassified out of accumulated other comprehensive income by component. In addition, an entity is required to present, either on the face of the statement highlights somewhere net income is presented or in the notes, significant amounts reclassified out of these risks.Statements containedaccumulated other comprehensive income by the respective line items of net income but only if the amount reclassified is required under U.S. GAAP to be reclassified to net income in this Form 10-Kits entirety in the same reporting period. For other amounts that are not historical facts, are or might constitute forward-looking statementsrequired under U.S. GAAP to be reclassified in their entirety to net income, an entity is required to cross-reference to other disclosures required under U.S. GAAP that provide additional detail about those amounts. ASU 2013-02 is effective prospectively for reporting periods beginning after December 15, 2012. We do not anticipate any material impact from the safe harbor provisionsadoption of ASU 2013-02.Private Securities Litigation Reform ActFASB issued ASU 2012-02, Intangibles - Goodwill and Other (Topic 350) Testing Indefinite-Lived Intangible Assets for Impairment, which simplifies how entities test indefinite-lived intangible assets for impairment. ASU 2012-02 permits an entity to first assess qualitative factors to determine whether it is more likely than not that an indefinite-lived intangible asset is impaired as a basis for determining whether it is necessary to perform the quantitative impairment test currently required by ASC Topic 350-30 on general intangibles other than goodwill. ASU 2012-02 is effective for annual and interim impairment tests performed for fiscal years beginning after September 15, 2012. Early adoption is permitted, provided that the entity has not yet issued its financial statements. We do not anticipate any material impact from the adoption of 1995. Although we believe the expectations reflected in such forward-looking statements are based on reasonable assumptions, we can give no assurance that our expectations will be attained. Forward-looking statements involve known and unknown risks that could cause actual results to differ materially from expected results. Factors that could cause actual results to differ materially from our expectations expressed in the report include: general economic risk; uncertainty regarding increased business and renewals from existing customers; continued success in sales growth; lengthy sales and implementation cycles, particularly in larger organizations; risk associated with successful implementation of multiple integrated software products; technological changes that make our products and services less competitive; the ability to attract and retain key personnel; risks related to our dividend policy and stock repurchase program, including potential limitations on our ability to grow and the possibility that we might discontinue payment of dividends; risks relating to restrictions imposed by the credit facility; management of integration of recently acquired companies and other risks associated with acquisitions; risks associated with management of growth; and the other risk factors set forth from time to time in our SEC filings.ASU 2012-02.
Index to Financial StatementsQUANTITATIVE AND QUALITATIVE DISCLOSURES ABOUT MARKET RISKshort-term investments and the lack of material debt, we have concluded at December 31, 2009 that we currently do not face no material market risk exposure. Therefore, no quantitative tabular disclosures are required.exposure as of December 31, 2012. For a discussion of our exposure to foreign currency exchange rate fluctuations, see the “Foreign currency exchange rates” section of Management’s"Management’s discussion and analysis of financial condition and results of operationsoperations" in this report.FINANCIAL STATEMENTS AND SUPPLEMENTARY DATACHANGES IN AND DISAGREEMENTS WITH ACCOUNTANTS ON ACCOUNTING AND FINANCIAL DISCLOSURECONTROLS AND PROCEDURES and 15d-15(e)) are designed only to provide reasonable assurance that they will meet their objectives. As of the end of the period covered by this report, we carried out an evaluation, under the supervision and with the participation of our management, including our Chief Executive Officer and Chief Financial Officer, of the effectiveness of our disclosure controls and procedures (as defined in Rule 13a-15(e)) pursuant to Exchange Act Rule 13a-15.13a-15(b). Based upon that evaluation, our Chief Executive Officer and Chief Financial Officer have concluded that our disclosure controls and procedures are effective to provide the reasonable assurance discussed above.internal control over financial reporting.Management’s report on internal control over financial reportingOur management is responsible for establishing and maintaining adequate internal control over financial reporting (as defined in Rules 13a-15(f) and 15d-15(f) under the Exchange Act). Internal control over financial reporting is a process designed to provide reasonable assurance regarding the reliability of financial reporting and the preparation of financial statements for external purposes in accordance with U.S. GAAP. Our internal control over financial reporting includes those policies and procedures that: (i) pertain to the maintenance of records that, in reasonable detail, accurately and fairly reflect the transactions and dispositions of our assets; (ii) provide reasonable assurance that transactions are recorded as necessary to permit preparation of financial statements in accordance with U.S. GAAP, and that our receipts and expenditures are being made only in accordance with authorizations of our management and directors; and (iii) provide reasonable assurance regarding prevention or timely detection of unauthorized acquisition, use, or disposition of our assets that could have a material effect on the financial statements.Our management conducted an evaluation of the effectiveness of our internal control over financial reporting as of December 31, 2009, based on the framework inInternal Control—Integrated Frameworkissued by the Committee of Sponsoring Organizations of the Treadway Commission. Based on this evaluation, management concluded that our internal control over financial reporting was effective as of December 31, 2009.reporting.
Index to Financial StatementsThe effectiveness of our internal control over financial reporting as of December 31, 2009 has been audited by our independent registered public accounting firm, as stated in their attestation report, which is included herein.OTHER INFORMATIONIndex to Financial StatementsDIRECTORS, EXECUTIVE OFFICERS AND CORPORATE GOVERNANCE20102013 Annual Meeting of Stockholders expected to be held on June 23, 2010,19, 2013, except for the identification of executive officers of the Registrant which is set forth in Part I of this report.EXECUTIVE COMPENSATION20102013 Annual Meeting of Stockholders expected to be held on June 23, 2010.19, 2013.SECURITY OWNERSHIP OF CERTAIN BENEFICIAL OWNERS AND MANAGEMENT AND RELATED STOCKHOLDER MATTERS20102013 Annual Meeting of Stockholders expected to be held on June 23, 2010.19, 2013.CERTAIN RELATIONSHIPS, RELATED TRANSACTIONS AND DIRECTOR INDEPENDENCE20102013 Annual Meeting of Stockholders expected to be held on June 23, 2010.19, 2013.PRINCIPAL ACCOUNTANT FEES AND SERVICES20102013 Annual Meeting of Stockholders expected to be held on June 23, 2010.19, 2013
.Index to Financial StatementsEXHIBITS AND FINANCIAL STATEMENT SCHEDULES F-2 F-3 F-4 F-5 F-6 Filed In Exhibit number Description of Document Registrant’s
Form Dated Exhibit
Number Filed
Herewith S-1 04/06/04 2.1 8-K 01/18/07 2.2 S-1 04/06/04 3.1 8-K 12/23/08 3.3 S-1 02/20/04 10.5 S-1 04/06/04 10.6 S-1 04/06/04 10.8 8-K 06/20/06 10.20 10-K 02/28/07 10.26 10-K 02/28/07 10.27 Index to Financial Statements Filed In Exhibit number Description of Document Registrant’s
Form Dated Exhibit
Number Filed
Herewith10.28 8-K 07/31/07 10.28 10.29 8-K 07/31/07 10.29 10.30 8-K 07/31/07 10.30 10.31 8-K 05/30/08 10.31 10.32 8-K 06/26/08 10.32 10.33 DEF 14A 04/29/08 10.34 S-8 08/04/08 10.34 10.35 S-8 08/04/08 10.35 10.36 S-8 08/04/08 10.36 10.37 10-K/A* 03/26/08 10.2 10.38 10-K/A* 03/26/08 10.3 10.39 10-Q 11/05/08 10.37 10.40 8-K 12/11/08 10.37 Index to Financial Statements Filed In Exhibit number Description of Document Registrant’s
Form Dated Exhibit
Number Filed
Herewith10.41 S-8 07/02/09 10.41 10.42 10-Q 08/07/09 10.42 10.43 8-K** 02/01/10 10.43 21.1 X 23.1 X 31.1 X 31.2 X 32.1 X 32.2 X Filed In Exhibit Number Description of Document Dated 2.1 Agreement and Plan of Merger and Reincorporation dated April 6, 2004 S-1/A 4/6/2004 2.1 2.2 Stock Purchase Agreement dated January 16, 2007 by and among Target Software, Inc., Target Analysis Group, Inc., all of the stockholders of Target Software, Inc. and Target Analysis Group, Inc., Charles Longfield, as stockholder representative, and Blackbaud, Inc. 8-K 1/18/2007 2.2 2.3 Agreement and Plan of Merger dated as of May 29, 2008 by and among Blackbaud, Inc., Eucalyptus Acquisition Corporation and Kintera, Inc. 8-K 5/30/2008 2.3 2.4 Share Purchase Agreement dated as of April 29, 2009 between RLC Group B.V., as the Seller, and Blackbaud, Inc., as the Purchaser 10-Q 8/7/2009 10.42 2.5 * Stock Purchase Agreement dated as of February 1, 2011 by and among Public Interest Data, Inc., all for the stockholders of Public Interest Data, Inc., Stephen W. Zautke, as stockholder representative and Blackbaud, Inc. 10-Q 5/10/2011 2.3 2.6 Agreement and Plan of Merger dated as of January 16, 2012 by and among Blackbaud, Inc., Caribou Acquisition Corporation and Convio, Inc. 8-K 1/17/2012 2.4 2.7 Stock Purchase Agreement dated as of October 6, 2011 by and among Everyday Hero Pty. Ltd., all of the stockholders of Everyday Hero Pty. Ltd., Nathan Betteridge as stockholder representative and Blackbaud Pacific Pty. Ltd. 10-K 2/29/2012 2.7 3.4 Amended and Restated Certificate of Incorporation of Blackbaud, Inc. DEF 14A 4/30/2009 3.5 Amended and Restated Bylaws of Blackbaud, Inc. 8-K 3/22/2011 3.4 Filed In Exhibit Number Description of Document Dated 10.5 Trademark License and Promotional Agreement dated as of October 13, 1999 between Blackbaud, Inc. and Charleston Battery, Inc. S-1 2/20/2004 10.5 10.6 Blackbaud, Inc. 1999 Stock Option Plan, as amended S-1/A 4/6/2004 10.6 10.8 Blackbaud, Inc. 2001 Stock Option Plan, as amended S-1/A 4/6/2004 10.8 10.20 Blackbaud, Inc. 2004 Stock Plan, as amended, together with Form of Notice of Stock Option Grant and Stock Option Agreement 8-K 6/20/2006 10.20 10.26 Form of Notice of Restricted Stock Grant and Restricted Stock Agreement under the Blackbaud, Inc. 2004 Stock Plan 10-K 2/28/2007 10.26 10.27 Form of Notice of Stock Appreciation Rights Grant and Stock Appreciation Rights Agreement under the Blackbaud, Inc. 2004 Stock Plan 10-K 2/28/2007 10.27 10.33 Blackbaud, Inc. 2008 Equity Incentive Plan DEF 14A 4/29/2008 10.34 Form of Notice of Grant and Stock Option Agreement under Blackbaud, Inc. 2008 Equity Incentive Plan S-8 8/4/2008 10.34 10.35 Form of Notice of Grant and Restricted Stock Agreement under Blackbaud, Inc. 2008 Equity Incentive Plan S-8 8/4/2008 10.35 10.36 Form of Notice of Grant and Stock Appreciation Rights Agreement under Blackbaud, Inc. 2008 Equity Incentive Plan S-8 8/4/2008 10.36 10.37 ** Kintera, Inc. 2000 Stock Option Plan, as amended, and form of Stock Option Agreement thereunder 10-K/A 3/26/2008 10.2 10.38 ** Kintera, Inc. Amended and Restated 2003 Equity Incentive Plan, as amended, and form of Stock Option Agreement thereunder 10-K/A 3/26/2008 10.3 10.39 Form of Retention Agreement 10-Q 11/10/2008 10.37 10.40 Triple Net Lease Agreement dated as of October 1, 2008 between Blackbaud, Inc. and Duck Pond Creek-SPE, LLC 8-K 12/11/2008 10.37 10.41 Blackbaud, Inc. 2009 Equity Compensation Plan for Employees from Acquired Companies S-8 7/2/2009 10.41 10.43 Amended and Restated Employment and Noncompetition Agreement dated January 28, 2010 between Blackbaud, Inc. and Marc Chardon 8-K 2/1/2010 10.43 10.44 Credit Agreement dated as of June 17, 2011 by and among Blackbaud, Inc., as Borrower, the lenders referred to therein, and Wells Fargo Bank, National Association, as Administrative Agent, Swingline Lender and Issuing Lender, with Wells Fargo Securities, LLC, J.P. Morgan Securities LLC, and SunTrust Robinson Humphrey, Inc. as Joint Lead Arrangers and Joint Book Managers 8-K 6/23/2011 10.44 10.45 Guaranty Agreement dated as of June 17, 2011, by certain subsidiaries of Blackbaud, Inc., as Guarantors, in favor of Wells Fargo Bank, National Association, as Administrative Agent 8-K 6/23/2011 10.45 Filed In Exhibit Number Description of Document Dated �� 10.46 Pledge Agreement dated as of June 17, 2011 by Blackbaud, Inc. and certain subsidiaries of Blackbaud, Inc. in favor of Wells Fargo Bank, National Association, as Administrative Agent for the ratable benefit of itself and the lenders referred to therein 8-K 6/23/2011 10.46 10.47 Employment Agreement dated November 7, 2008 between Blackbaud, Inc. and Tim Williams 10-Q 11/8/2011 10.47 10.48 Employment Agreement dated November 7, 2008 between Blackbaud, Inc. and Louis Attanasi 10-Q 11/8/2011 10.48 10.49 Employment Agreement dated November 7, 2008 between Blackbaud, Inc. and Charlie Cumbaa 10-Q 11/8/2011 10.49 10.50 Employment Agreement dated June 25, 2008 between Blackbaud, Inc. and Kevin Mooney 10-Q 11/8/2011 10.50 10.51 Amendment No. 1 to the Amended and Restated Employment and Noncompetition Agreement dated December 13, 2011 between Blackbaud, Inc. and Marc Chardon 8-K 12/16/2011 10.51 10.52 Form of Tender and Support Agreement by and among Blackbaud, Inc. and certain stockholders of Convio, Inc. 8-K 1/17/2012 10.52 10.53 Amended and Restated Credit Agreement dated as of February 9, 2012 by and among Blackbaud, Inc., as Borrower, the lenders referred to therein, JPMorgan Chase Bank, N.A., as Administrative Agent, Swingline Lender and an Issuing Lender, SunTrust Bank, as Syndication Agent, and Bank of America, N.A. and Regions Bank, as Co-Documentation Agents, with J.P. Morgan Securities LLC and SunTrust Robinson Humphrey, Inc., as Joint Lead Arrangers and Joint Bookrunners 8-K 2/15/2012 10.53 10.54 Amended and Restated Pledge Agreement dated as of February 9, 2012 by Blackbaud, Inc. in favor of JPMorgan Chase Bank, N.A., as Administrative Agent for the ratable benefit of itself and the lenders referred to therein 8-K 2/15/2012 10.54 10.55 Employment Agreement dated November 14, 2011 between Blackbaud, Inc. and Anthony W. Boor 10-K 2/29/2012 10.55 10.56 Services Agreement dated November 11, 2011 between Blackbaud, Inc. and Timothy V. Williams 10-K 2/29/2012 10.56 10.57 Employment Agreement dated November 16, 2010 between Blackbaud, Inc. and Jana B. Eggers 10-K 2/29/2012 10.57 10.58 8-K 5/7/2012 10.58 10.59 *** S-1/A 3/19/2010 10.1 10.60 *** 8-K 2/28/2011 10.1 10.61 *** Convio, Inc. Form of Restricted Stock Unit Notice (Double Trigger) and Agreement 8-K 2/28/2011 10.2 10.62 *** Convio, Inc. 1999 Stock Option/Stock Issuance Plan, as amended, and forms of stock option agreements S-1 1/22/2010 10.2 Filed In Exhibit Number Description of Document Dated 10.63 Blackbaud, Inc. 2008 Equity Incentive Plan, as amended 8-K 6/26/2012 10.59 10.64 Amendment to the Blackbaud, Inc. 2008 Equity Incentive Plan 8-K 6/26/2012 10.60 10.65 10-K 2/26/2013 10.65 X 21.1 Subsidiaries of Blackbaud, Inc X 23.1 Consent of Independent Registered Public Accounting Firm X 31.1 Certification by the Chief Executive Officer pursuant to Section 302 of the Sarbanes-Oxley Act of 2002 X 31.2 Certification by the Chief Financial Officer pursuant to Section 302 of the Sarbanes-Oxley Act of 2002 X 32.1 Certification by the Chief Executive Officer pursuant to 18 U.S.C. 1350 as adopted pursuant to Section 906 of the Sarbanes-Oxley Act of 2002 X 32.2 Certification by the Chief Financial Officer pursuant to 18 U.S.C. 1350 as adopted pursuant to Section 906 of the Sarbanes-Oxley Act of 2002 X 101.INS **** XBRL Instance Document X 101.SCH **** XBRL Taxonomy Extension Schema Document X 101.CAL **** XBRL Taxonomy Extension Calculation Linkbase Document X 101.DEF **** XBRL Taxonomy Extension Definition Linkbase Document X 101.LAB **** XBRL Taxonomy Extension Label Linkbase Document X 101.PRE **** XBRL Taxonomy Extension Presentation Linkbase Document X * The registrant has applied for an extension of the confidential treatment it was previously granted with respect to portions of this exhibit. Those portions have been omitted from the exhibit and filed separately with the U.S. Securities and Exchange Commission. ** The Kintera, Inc. 2000 Stock Option Plan, as amended, and form of Stock Option Agreement thereunder (Kintera(“Kintera 2000 Plan Documents)Documents”) and the Kintera, Inc. Amended and Restated 2003 Equity Incentive Plan, as amended, and form of Stock Option Agreement thereunder (Kintera(“Kintera 2003 Plan Documents)Documents”) were filed by Kintera in its Form 10-K/A on March 26, 2008 as Exhibits 10.2 and 10.3, respectively. We assumed the Kintera 2000 Plan Documents and Kintera 2003 Plan Documents when we acquired Kintera in July 2008. We filed the Kintera 2000 Plan Documents and Kintera 2003 Plan Documents by incorporation by reference as exhibits 10.37 and 10.38, respectively, in our Form S-8 on August 4, 2008.*** The registrant has received confidential treatment with respect to portionsConvio, Inc. 2009 Amended and Restated Stock Incentive Plan, as amended, and forms of this exhibit. Those portions have been omitted fromstock option agreements thereunder (“Convio 2009 Original Plan Documents”) and the exhibitConvio, Inc. 1999 Stock Option/Stock Issuance Plan, as amended, and forms of stock option agreements thereunder (“Convio 1999 Plan Documents”) were filed separatelyby Convio in its Forms S-1/A and S-1, filed March 19, 2010 and January 22, 2010 as exhibits 10.1 and 10.2, respectively. The Convio, Inc. Form of Nonstatutory Stock Option Notice (Double Trigger) and Convio, Inc. Form of Restricted Stock Unit Notice (Double Trigger) and Agreement were filed by Convio in its Form 8-K on February 28, 2011 as exhibits 10.1 and 10.2 (together with the U.S.Convio 2009 Original Plan Documents, the “Convio 2009 Plan Documents”). We assumed the Convio 2009 Plan Documents and Convio 1999 Plan Documents when we acquired Convio in May 2012. We filed the Convio 2009 Plan Documents and Convio 1999 Plan Documents by incorporation by reference as exhibits 10.59, 10.60, 10.61 and 10.62 in our Form S-8 on May 7, 2012.**** Pursuant to Rule 406T of Regulation S-T, the XBRL related information in Exhibit 101 to this Annual Report on Form 10-K shall not be deemed “filed” for purposes of Section 18 of the Securities Exchange Act of 1934 or otherwise subject to liability of that Section, and shall not be part of any registration statement or other document filed under the Securities Act of the Exchange Commission.Act, except as shall be expressly set forth by specific reference in such filing.Index to Financial StatementsBLACKBAUD, INCSigned: February 26, 2010 /S/ MARC E. CHARDON Signed: February 27, 2013 President and Chief Executive Officer /S/ MARC E. CHARDON Marc E. Chardon President, Chief Executive Officer
and Director (Principal Executive Officer) Date: February 26, 201027, 2013/S/ TIMOTHY V. WILLIAMS Timothy V. Williams Senior Vice President and Chief Financial Officer (Principal
Financial and Accounting Officer) Date: February 26, 201027, 2013/S/ ANDREW M. LEITCH Andrew M. Leitch Chairman of the Board Date: February 26, 201027, 2013/S/ TIMOTHY CHOU Timothy Chou Director Date: February 26, 201027, 2013/S/ GEORGE H. ELLIS George H. Ellis Director Date: February 26, 201027, 2013/S/ JOHN P. MCCONNELL John P. McConnell Director Date: February 26, 201027, 2013/S/ CAROLYN MILES Carolyn Miles Director Date: February 26, 201027, 2013 Sarah E. Nash Director Date: February 27, 2013 Joyce M. Nelson Index to Financial Statementsoperations,comprehensive income, of cash flows and of stockholders’stockholders' equity and comprehensive income present fairly, in all material respects, the financial position of Blackbaud, Inc. and its subsidiaries at December 31, 20092012 and 2008,2011, and the results of their operations and their cash flows for each of the three years in the period ended December 31, 20092012 in conformity with accounting principles generally accepted in the United States of America. Also in our opinion, the Company maintained, in all material respects, effective internal control over financial reporting as of December 31, 2009,2012, based on criteria established inInternal Control—Control - Integrated Framework issued by the Committee of Sponsoring Organizations of the Treadway Commission (COSO). The Company’sCompany's management is responsible for these financial statements, for maintaining effective internal control over financial reporting and for its assessment of the effectiveness of internal control over financial reporting, included in Management’sManagement's Report on Internal Control over Financial Reporting. Our responsibility is to express opinions on these financial statements and on the Company’sCompany's internal control over financial reporting based on our integrated audits. We conducted our audits in accordance with the standards of the Public Company Accounting Oversight Board (United States). Those standards require that we plan and perform the audits to obtain reasonable assurance about whether the financial statements are free of material misstatement and whether effective internal control over financial reporting was maintained in all material respects. Our audits of the financial statements included examining, on a test basis, evidence supporting the amounts and disclosures in the financial statements, assessing the accounting principles used and significant estimates made by management, and evaluating the overall financial statement presentation. Our audit of internal control over financial reporting included obtaining an understanding of internal control over financial reporting, assessing the risk that a material weakness exists, and testing and evaluating the design and operating effectiveness of internal control based on the assessed risk. Our audits also included performing such other procedures as we considered necessary in the circumstances. We believe that our audits provide a reasonable basis for our opinions.As discussed in Note 1 to the consolidated financial statements, the Company changed the manner in which it accounts for uncertain tax positions in 2007.company’scompany's internal control over financial reporting is a process designed to provide reasonable assurance regarding the reliability of financial reporting and the preparation of financial statements for external purposes in accordance with generally accepted accounting principles. A company’scompany's internal control over financial reporting includes those policies and procedures that (i) pertain to the maintenance of records that, in reasonable detail, accurately and fairly reflect the transactions and dispositions of the assets of the company; (ii) provide reasonable assurance that transactions are recorded as necessary to permit preparation of financial statements in accordance with generally accepted accounting principles, and that receipts and expenditures of the company are being made only in accordance with authorizations of management and directors of the company; and (iii) provide reasonable assurance regarding prevention or timely detection of unauthorized acquisition, use, or disposition of the company’scompany's assets that could have a material effect on the financial statements.s/S/ PRICEWATERHOUSECOOPERS LLPRaleigh, December 31, (in thousands, except share amounts) 2009 2008 $ 22,769 $ 16,361 12,874 12,363 50,220 52,554 18,155 17,281 5,728 6,858 109,746 105,417 22,507 21,384 55,570 64,762 73,919 73,615 42,019 48,171 468 537 $ 304,229 $ 313,886 $ 10,683 $ 7,023 25,974 22,142 12,874 12,363 1,288 60,049 129,412 113,802 180,231 215,379 — 1,288 6,172 5,838 1,720 873 188,123 223,378 — — 52 51 134,726 116,846 (134,382 ) (130,594 ) (201 ) (899 ) 115,911 105,104 116,106 90,508 $ 304,229 $ 313,886 (in thousands, except share amounts) December 31, 2012 December 31, 2011 Assets Current assets: Cash and cash equivalents $ 13,491 $ 52,520 Donor restricted cash 68,177 40,205 Accounts receivable, net of allowance of $8,546 and $3,913 at December 31, 2012 and 2011, respectively 75,692 62,656 Prepaid expenses and other current assets 40,589 31,016 Deferred tax asset, current portion 15,799 1,551 Total current assets 213,748 187,948 Property and equipment, net 49,063 34,397 Deferred tax asset — 29,376 Goodwill 265,055 90,122 Intangible assets, net 168,037 44,660 Other assets 9,844 6,087 Total assets $ 705,747 $ 392,590 Liabilities and stockholders’ equity Current liabilities: Trade accounts payable $ 13,623 $ 13,464 Accrued expenses and other current liabilities 45,996 32,707 Donations payable 68,177 40,205 Debt, current portion 10,000 — Deferred revenue, current portion 173,899 153,665 Total current liabilities 311,695 240,041 Debt, net of current portion 205,500 — Deferred tax liability 24,468 — Deferred revenue, net of current portion 11,119 9,772 Other liabilities 5,281 2,775 Total liabilities 558,063 252,588 Commitments and contingencies (see Note 11) Stockholders’ equity: Preferred stock; 20,000,000 shares authorized, none outstanding — — Common stock, $0.001 par value; 180,000,000 shares authorized, 54,859,604 and 53,959,532 shares issued at December 31, 2012 and 2011, respectively 55 54 Additional paid-in capital 203,638 175,401 Treasury stock, at cost; 9,209,371 and 9,019,824 shares at December 31, 2012 and 2011, respectively (170,898 ) (166,226 ) Accumulated other comprehensive loss (1,973 ) (1,148 ) Retained earnings 116,862 131,921 Total stockholders’ equity 147,684 140,002 Total liabilities and stockholders’ equity $ 705,747 $ 392,590 Index to Financial Statementsoperations Years ended December 31, (in thousands, except share and per share amounts) 2009 2008 2007 $ 25,392 $ 35,932 $ 37,569 87,834 100,824 91,376 116,476 107,304 94,602 72,898 49,705 25,389 6,738 8,730 8,102 309,338 302,495 257,038 3,582 3,316 2,870 61,713 63,960 54,908 21,364 20,185 17,119 28,183 20,587 10,306 6,098 8,368 7,274 120,940 116,416 92,477 188,398 186,079 164,561 62,796 65,185 56,994 45,662 38,708 28,525 33,380 34,072 26,144 768 713 491 142,606 138,678 112,154 45,792 47,401 52,407 637 526 813 (962 ) (1,526 ) (1,164 ) 220 (194 ) (503 ) 45,687 46,207 51,553 17,240 16,329 19,829 $ 28,447 $ 29,878 $ 31,724 $ 0.67 $ 0.70 $ 0.73 $ 0.65 $ 0.68 $ 0.71 42,771,173 42,958,947 43,619,158 43,600,048 43,958,557 44,595,483 $ 0.40 $ 0.40 $ 0.34 (in thousands, except share and per share amounts) Year ended December 31, 2012 2011 2010 Revenue License fees $ 20,551 $ 19,475 $ 23,719 Subscriptions 162,102 103,544 83,912 Services 119,626 108,781 87,663 Maintenance 136,101 130,604 124,559 Other revenue 9,039 8,464 6,712 Total revenue 447,419 370,868 326,565 Cost of revenue Cost of license fees 2,993 3,345 3,003 Cost of subscriptions 68,773 42,536 31,155 Cost of services 97,208 79,086 66,755 Cost of maintenance 26,001 25,178 24,123 Cost of other revenue 7,485 7,049 7,103 Total cost of revenue 202,460 157,194 132,139 Gross profit 244,959 213,674 194,426 Operating expenses Sales and marketing 95,218 75,361 69,469 Research and development 64,692 47,672 45,499 General and administrative 63,308 36,933 32,636 Impairment of cost method investment 200 1,800 — Amortization 2,106 980 798 Total operating expenses 225,524 162,746 148,402 Income from operations 19,435 50,928 46,024 Interest income 146 183 84 Interest expense (5,864 ) (200 ) (74 ) Other income (expense), net (392 ) 346 (98 ) Income before provision for income taxes 13,325 51,257 45,936 Income tax provision 6,742 18,037 16,749 Net income $ 6,583 $ 33,220 $ 29,187 Earnings per share Basic $ 0.15 $ 0.76 $ 0.68 Diluted $ 0.15 $ 0.75 $ 0.67 Common shares and equivalents outstanding Basic weighted average shares 44,145,535 43,522,563 43,145,189 Diluted weighted average shares 44,691,845 44,149,054 43,876,155 Dividends per share $ 0.48 $ 0.48 $ 0.44 Other comprehensive loss Foreign currency translation adjustment (34 ) (336 ) (506 ) Unrealized loss on derivative instruments, net of tax (791 ) — — Total other comprehensive loss (825 ) (336 ) (506 ) Comprehensive income $ 5,758 $ 32,884 $ 28,681 Index to Financial Statements Years ended December 31, (in thousands) 2009 2008 2007 $ 28,447 $ 29,878 $ 31,724 15,509 12,865 8,149 3,458 4,179 2,661 12,287 12,085 6,934 (2,405 ) (1,497 ) (4,931 ) 12,351 6,407 12,491 116 110 65 1,375 (10,193 ) (10,367 ) 2,122 (5,635 ) (2,005 ) (312 ) 614 (830 ) 612 (7,907 ) 6,079 (511 ) (3,763 ) — 511 3,763 — 13,237 19,404 12,897 86,797 60,310 62,867 (5,534 ) (7,692 ) (8,123 ) (2,258 ) (49,916 ) (84,405 ) — 1,575 — (7,792 ) (56,033 ) (92,528 ) — 86,000 48,000 2,509 883 5,451 2,405 1,497 4,931 (60,049 ) (27,527 ) (49,934 ) — (47 ) (418 ) (384 ) (540 ) (477 ) — (43,727 ) (15,857 ) (17,673 ) (17,497 ) (15,074 ) (73,192 ) (958 ) (23,378 ) 595 (1,733 ) 31 6,408 1,586 (53,008 ) 16,361 14,775 67,783 $ 22,769 $ 16,361 $ 14,775 $ 615 $ 1,375 $ 1,126 $ (2,584 ) $ 11,041 $ 5,607 $ 3,699 $ — $ — Year ended December 31, (in thousands) 2012 2011 2010 Cash flows from operating activities Net income $ 6,583 $ 33,220 $ 29,187 Adjustments to reconcile net income to net cash provided by operating activities: Depreciation and amortization 31,879 16,995 16,189 Provision for doubtful accounts and sales returns 9,591 5,646 2,773 Stock-based compensation expense 19,240 14,884 13,059 Excess tax benefits from stock-based compensation (81 ) (932 ) (2,665 ) Deferred taxes 7,585 13,533 11,313 Impairment of cost method investment 200 1,800 — Gain on sale of assets — (549 ) — Other non-cash adjustments 747 (878 ) (22 ) Changes in operating assets and liabilities, net of acquisition of businesses: Accounts receivable (9,397 ) (8,692 ) (12,778 ) Prepaid expenses and other assets (8,817 ) (2,915 ) (10,109 ) Trade accounts payable (1,363 ) 1,714 228 Accrued expenses and other liabilities (388 ) (1,056 ) (4,248 ) Donor restricted cash (27,990 ) (22,862 ) (3,446 ) Donations payable 27,990 22,862 3,446 Deferred revenue 12,912 12,757 13,121 Net cash provided by operating activities 68,691 85,527 56,048 Cash flows from investing activities Purchase of property and equipment (20,557 ) (18,215 ) (10,760 ) Purchase of net assets of acquired companies, net of cash acquired (280,687 ) (23,385 ) (5,334 ) Purchase of investment — — (2,000 ) Capitalized software development costs (1,245 ) (1,012 ) (175 ) Purchase of intangible assets — — (130 ) Proceeds from sale of assets — 874 — Net cash used in investing activities (302,489 ) (41,738 ) (18,399 ) Cash flows from financing activities Proceeds from issuance of debt 315,000 — 4,000 Payments on debt (99,500 ) — (5,175 ) Payments of deferred financing costs (2,440 ) (767 ) — Proceeds from exercise of stock options 3,146 2,041 8,065 Excess tax benefits from stock-based compensation 81 932 2,665 Purchase of treasury stock — — (22,613 ) Dividend payments to stockholders (21,731 ) (21,429 ) (19,490 ) Payments on capital lease obligations — (40 ) (164 ) Net cash provided by (used in) financing activities 194,556 (19,263 ) (32,712 ) Effect of exchange rate on cash and cash equivalents 213 (10 ) 298 Net increase (decrease) in cash and cash equivalents (39,029 ) 24,516 5,235 Cash and cash equivalents, beginning of year 52,520 28,004 22,769 Cash and cash equivalents, end of year $ 13,491 $ 52,520 $ 28,004 Supplemental disclosure of cash flow information Cash paid during the year for: Interest $ (5,098 ) $ 2 $ 87 Taxes, net of refunds $ (3,456 ) $ (4,601 ) $ 9,527 Purchase of equipment included in accounts payable $ 4,641 $ 4,760 $ 2,630 Index to Financial Statementsstockholders’stockholders' equity and comprehensive income Comprehensive
income Common stock
paid-in
other
comprehensive
stockholders’ (in thousands, except share amounts) Shares Amount 49,205,522 $ 49 $ 88,409 $ (69,630 ) $ 232 $ 76,298 $ 95,358 $ 31,724 — — — — — 31,724 31,724 — — — — — — (15,074 ) (15,074 ) — — — — (15,857 ) — — (15,857 ) — 776,125 1 5,450 — — — 5,451 — — — 4,931 — — — 4,931 — — — — — — (269 ) (269 ) — — 6,897 — — 37 6,934 — 549,320 — — — — — — — (80,292 ) — — — — — — (95 ) — — — — (95 ) — (95 ) $ 31,629 50,450,675 $ 50 $ 105,687 $ (85,487 ) $ 137 $ 92,716 $ 113,103 $ 29,878 — — — — — 29,878 29,878 — — — — — — (17,497 ) (17,497 ) — — — — (45,107 ) — — (45,107 ) — 126,206 1 882 — — — 883 — — — (1,126 ) — — — (1,126 ) — — — 172 — — — 172 — — 11,231 — — 7 11,238 — 727,237 — — — — — — — (35,037 ) — — — — — — (1,036 ) — — — — (1,036 ) — (1,036 ) $ 28,842 51,269,081 $ 51 $ 116,846 $ (130,594 ) $ (899 ) $ 105,104 $ 90,508 $ 28,447 — — — — — 28,447 28,447 — — — — — — (17,673 ) (17,673 ) — — — — (3,788 ) — — (3,788 ) — 55,661 — 1,215 — — — 1,215 — 451,580 1 2,509 — — — 2,510 — — — 2,290 — — — 2,290 — — — 11,417 — — 33 11,450 — 492,964 — 449 — — — 449 — (54,680 ) — — — — — — 698 — — — — 698 — 698 $ 29,145 52,214,606 $ 52 $ 134,726 $ (134,382 ) $ (201 ) $ 115,911 $ 116,106 (in thousands, except share amounts) Common stock Total stockholders' equity Shares Amount Balance at December 31, 2009 52,214,606 $ 52 $ 134,643 $ (134,382 ) $ (306 ) $ 110,286 $ 110,293 Net income — — — — — 29,187 29,187 Payment of dividends — — — — — (19,490 ) (19,490 ) Purchase of 1,007,082 treasury shares under stock repurchase program — — — (22,613 ) — — (22,613 ) Exercise of stock options and stock appreciation rights 729,295 1 8,064 — — — 8,065 Surrender of 158,459 shares upon restricted stock vesting and exercise of stock appreciation rights — — — (4,191 ) — — (4,191 ) Tax impact of exercise of equity-based compensation — — 2,665 — — — 2,665 Stock-based compensation — — 13,000 — — 59 13,059 Restricted stock grants 460,659 — — — — — — Restricted stock cancellations (88,280 ) — — — — — Comprehensive income — — — — (506 ) — (506 ) Balance at December 31, 2010 53,316,280 $ 53 $ 158,372 $ (161,186 ) $ (812 ) $ 120,042 $ 116,469 Net income — — — — — 33,220 33,220 Payment of dividends — — — — — (21,429 ) (21,429 ) Exercise of stock options, stock appreciation rights and restricted stock units 262,428 1 2,040 — — — 2,041 Surrender of 176,942 shares upon restricted stock vesting and exercise of stock appreciation rights — — — (5,040 ) — — (5,040 ) Tax impact of exercise of equity-based compensation — — 193 — — — 193 Stock-based compensation — — 14,796 — — 88 14,884 Restricted stock grants 502,426 — — — — — — Restricted stock cancellations (121,602 ) — — — — — — Other comprehensive loss — — — — (336 ) — (336 ) Balance at December 31, 2011 53,959,532 $ 54 $ 175,401 $ (166,226 ) $ (1,148 ) $ 131,921 $ 140,002 Net income — — — — — 6,583 6,583 Payment of dividends — — — — — (21,731 ) (21,731 ) Exercise of stock options, stock appreciation rights and restricted stock units 355,180 — 3,146 — — — 3,146 Surrender of 189,547 shares upon restricted stock vesting and exercise of stock appreciation rights — — — (4,672 ) — — (4,672 ) Tax impact of exercise of equity-based compensation — — 81 — — — 81 Stock-based compensation — — 19,151 — — 89 19,240 Equity-based awards assumed in business combination — — 5,859 — — . 5,859 Restricted stock grants 687,652 1 — — — — 1 Restricted stock cancellations (142,760 ) — — — — — — Other comprehensive loss — — — — (825 ) — (825 ) Balance at December 31, 2012 54,859,604 $ 55 $ 203,638 $ (170,898 ) $ (1,973 ) $ 116,862 $ 147,684 Index to Financial Statements1.Organization and significant accounting policiesBlackbaud, Inc. (the Company) is the leading global provider oforganizations, and providesorganizations. Our products and services that enable nonprofit organizations to increase donations, reduce fundraising costs, improve communications with constituents, manage their finances and optimize internal operations. As of the end of 2009, the CompanyDecember 31, 2012, we had approximately 22,000more than 27,000 active customers distributed across multiple verticals within the nonprofit market including religion, education, foundations, health and human services, religion, arts and cultural, public and societal benefits, environment and animal welfare andas well as international foreign affairs.of America (U.S. GAAP).CompanyBlackbaud, Inc. and its wholly ownedwholly-owned subsidiaries. All significant intercompany balances and transactions have been eliminated in consolidation. The Company evaluates subsequent events through the date the financial statements are issued.taxes and valuation of deferred tax assets.taxes. Changes in the facts or circumstances underlying these estimates could result in material changes and actual results could materially differ from these estimates.The Company’s(1)(i) charging for the use of our software products in a hosted environment; (ii) selling perpetual licenses of itsour software products; (2)(iii) providing professional services including implementation, training, consulting, analytic, hosting and other services; (3)and (iv) providing software maintenance and support services; and (4) charging for the use of its software products in a hosted environment.License feesThe Company recognizesservices.persuasive•Persuasive evidence of an arrangement exists;the•The product or service has been delivered;the•The fee is fixed or determinable; andcollection•Collection of the resulting receivable is probable.Index to Financial StatementsBlackbaud, Inc.Notes to consolidated financial statements—(Continued)The Company deemsDetermining whether and when these criteria have been met can require significant judgment and estimates. We deem acceptance of an agreement to be evidence of an arrangement. Delivery occurs when the product is shipped or transmitted, and title and risk of loss have transferred to the customers. The Company’sOur typical license agreement doesagreements do not include customer acceptance provisions; however, if acceptance provisions are provided, delivery is deemed to occur upon acceptance. The Company considersWe consider the fee to be fixed or determinable unless the fee is subject to refund or adjustment or is not payable within the Company’sour standard payment terms. Payment terms greater than 90 days are considered to be beyond the Company’sour customary payment terms. Collection is deemed probable if the Company expectswe expect that the customer will be able to pay amounts under the arrangement as they become due. If the Company determineswe determine that collection is not probable, it deferswe defer revenue recognition until collection.Company sellsarrangement consideration is allocated to the separate units of accounting based on relative selling price method in accordance with the selling price hierarchy, which includes: (i) vendor specific objective evidence (VSOE) if available; (ii) third-party evidence (TPE) if VSOE is not available; and (iii) best estimate of selling price if neither VSOE nor TPE is available. In general, we use VSOE to allocate the selling price to subscription and service deliverables.The Company allocatesWe allocate revenue to delivered components, normally the license componenteach of the arrangement,elements in these arrangements using the residual value method under which we first allocate revenue to the undelivered elements, typically the non-software license components, based on objective evidence of the fair value of the undeliveredvarious elements. We determine the fair value of the various elements which is specific to the Company.using different methods. Fair value for maintenance services associated with software licenses is based upon renewal rates stated in the agreements with customers, which vary according to the level of support service provided under the maintenance program. Fair value of professional services and other products and services is based on sales of these products and services to other customers when sold on a stand-alone basis. Any remaining revenue is allocated to the delivered elements which is normally the software license in the arrangement.the Company recognizeswe recognize revenue for both the software license and the services on a percent-complete basis.The Companybillsbill consulting, installation and implementation services based on hourly rates plus reimbursable travel-related expenses. Revenue is recognized for these services over the period the services are performed. For service engagements of less than $10,000, the Company frequently contracts for and bills based on a fixed fee plus reimbursable travel-related expenses. The Company recognizes this revenue upon completion of the work performed.The Company recognizesThe Company sells In arrangements where we provide customers the right to updates to the lists during the contract period, revenue is recognized ratably over the contract period. is recognized only upon the customer attending and completing training. Additionally, the Company sells awe sell fixed-rate program,programs, which permitspermit customers to attend unlimited training over a specified contract period, typically one year, subject to certain restrictions, and revenue is recognized ratably over this contract period.MaintenanceThe Company recognizesWe recognize revenue from maintenance services ratably over the contract term, which is typically one year. Maintenance contracts are at rates that vary according to the level of the maintenance program and are generally renewable annually. Maintenance contracts also include the right to unspecified product upgrades on an if-and-when available basis. Certain support services are sold in prepaid units of time and recognized as revenue upon their usage.Index to Financial StatementsBlackbaud, Inc.Notes to consolidated financial statements—(Continued)SubscriptionsThe Company provides hosting services to customers who have purchased perpetual rights to certain of its software products (hosting services). Revenue from hosting services, as well as data enrichment services, data management services and online training programs is recognized ratably over the service period of the contract. Any related set-up fees are also recognized ratably over the service period of the contract.The Company is increasingly making certain of its software products available for use in hosted application arrangements without licensing perpetual rights to the software (hosted applications). Revenue from hosted applications is recognized over the subscription agreement, which generally ranges from one to three years. For contractual arrangements covering the use of hosted applications the stand alone value of the delivered items or the fair value of undelivered items in the arrangement have not been established. Such items include upfront activation, implementation and hosting of the solution. For these arrangements the Company treats the transaction as a single element and the revenue is deferred until the hosted application is deployed and in use, at which time revenue is recognized over the remaining term of the arrangement. Direct and incremental costs relating to activation and implementation are capitalized until the hosted application is deployed and in use, and then expensed over the remaining term of the arrangement.Revenue from transaction processing fees is recognized when received. Credit card fees directly associated with processing donations for customers are included in subscription revenue, net of related transaction costs.the Company’sour customers are billed or pay for the above described services in advance of delivery, the Company recordswe record such amounts in deferred revenue.The Company presentsexcludesexclude them from revenues.The Company considersthe Companyus and payable to itsour customers, net of the associated transaction fees earned. Monies associated with donations payable are segregated in a separate bank account and used exclusively for the payment of donations payable. This usage restriction is either legally or internally imposed and reflects the Company’sour intention with regard to such deposits.The Company recordsdepreciatesdepreciate them over their estimated useful lives using the straight-line method. Property and equipment subject to capital leases are depreciated over the lesser of the term of the lease or the estimated useful life of the asset. Upon retirement or sale, the cost of assets disposed of and the related accumulated depreciation are removed from the accounts and any resulting gain or loss is credited or charged to income. Repair and maintenance costs are expensed as incurred.Index to Financial StatementsBlackbaud, Inc.Notes to consolidated financial statements—(Continued)TheseWe transferred these assets are transferred to the applicable property category on the date they are placed in service. There was no capitalized interest applicable to construction-in-progress for the years ended December 31, 20092012 and 2008.The Company capitalizes certain costs related to the development or purchase of software for use in the Company’s internal operations. Any amounts capitalized are included in computer software costs and amortized over the expected useful life. Costs incurred for upgrades and enhancements, which will not result in additional functionality, are expensed as incurred.the Company primarily asus in a result of the acquisition of Target Software, Inc. and Target Analysis Group, Inc. (together referred to as the Target Companies), eTapestry.com (referred to as eTapestry) and Kintera, Inc. (referred to as Kintera).business combination. Goodwill is allocated to reporting units which are defined as the Company’s operating segments, and tested annually for impairment. The CompanyOur reporting units are our four reportable segments and our payment processing operations. We will also test goodwill for impairment between annual impairment tests if indicators of potential impairment exist. We first assess qualitative factors to determine whether it is more likely than not that the fair value of a reporting unit is less than its carrying amount. To the extent the qualitative factors indicate that there is more than 50% likelihood that the fair value is less than the carrying amount, we compare the fair value of the reporting unit with its carrying amount. If the carrying amount exceeds its fair value, impairment is indicated. The 2012 annual impairment test indicated the estimated fair value of the reporting units significantly exceeded the carrying value. There was no impairment of goodwill during 2009, 20082012, 2011 or 2007.2010.The Company amortizes Basis of amortization Straight-line and accelerated(1)accelerated (1) 4-15 Straight-line 5-81-8 Straight-line 4-101-10 Straight-line 1-5 Straight-line 8 (1) Certain of the customer relationships acquired as part of the Kintera acquisition are amortized on an accelerated basis.The Company evaluatesrecoverabilitypotential for impairment of finite and indefinite-lived intangible assets periodically and takestake into account events or circumstances that warrantindicate revised estimates of useful lives or that indicate an impairmentthe carrying amount may exist. A substantial portionnot be recoverable. If the carrying amount is no longer recoverable based upon the undiscounted cash flows of the Company’sasset, the amount of impairment is the difference between the carrying amount and the fair value of the asset. Substantially all of our intangible assets waswere acquired in business combinations. There was no impairment of intangible assets during 2009, 20082012, 2011 or 2007.Fair value2010.financial instrumentsinvestments in privately held companies where we do not have the ability to exercise significant influence or have control over the investee. We record these investments at cost and periodically test them for other-than-temporary impairment. During the years ended TheDecember 31, 2012 and 2011, we determined that our cost method investment had other-than-temporary impairment based on the projected liquidity of the investment. We used the income approach to determine the fair value of a financial instrument is the investment in determining the impairment. An impairment loss of $0.2 million and $1.8 million was recorded in income from operations for the years ended December 31, 2012 and 2011, respectively. The aggregate carrying amount of our cost method investment at which the instrument could be exchanged between willing parties other than in a forced sale or liquidation. The financial instruments of the Company consist primarily of cash and cash equivalents, accounts receivable, accounts payable and debtDecember 31, 2011 was $0.2 million. There were no remaining cost method investments at December 31, 2009 and 2008. The Company believes that the carrying amounts of these financial instruments approximate their fair values at December 31, 2009 and 2008, due to the immediate or short-term maturity of these financial instruments.Index to Financial StatementsBlackbaud, Inc.2012.Notes to consolidated financial statements—(Continued)the Company’sboth our revolving credit facility in July 2007June 2011 and increasing the available funds under theour amended and restated credit facility in June 2008.February 2012. These costs are amortized as interest expense using the effective interest method. The deferred financing fees are being amortized over the term of the credit facility.isand awards with performance or market conditions are recognized using the accelerated method. Costs arising from restricted stock and stock appreciation right grants are recognized on a straight-line basis.Prior to October 13, 1999, the Company was organized as an S corporation under the Internal Revenue Codetherefore, was not subject to federal income taxes. The Company historically made distributions to its stockholders to cover the stockholders’ anticipated tax liability. In connection with its 1999 recapitalization, the Company converted its U.S. taxable status from an S corporation to a C corporation and, accordingly, since October 14, 1999 has been subject to federal and state income taxes. Upon this conversion and as a result of the recapitalization, the Company recorded a one-time benefit of $107.0 million to establish a deferred tax asset. This amount was recorded as a direct increase to equityjudgments in the statements of stockholders’ equity. The Company has not recorded a valuation allowance against this deferred tax asset as of December 31, 2009 or 2008, as the Company believes it is more-likely-than-not that it will be able to utilize this benefit, which is dependent upon the Company’s ability to generate future taxable income. The amount of deferred tax asset related to this matter at December 31, 2009 was $35.9 million.The Company adopted a new income tax standard for uncertain tax positions on January 1, 2007 under which a tax benefit from an uncertain tax position is recognized only if it is more-likely-than-not that the tax position will be sustained on examination by the taxing authorities, based on the technical merits of the position. The tax benefits recognized in the financial statements from such positions are measured based on the largest benefit that has a greater than 50% likelihood of being realized upon ultimate resolution. Penalties and interest accrued related to unrecognized tax benefits are recognized in the provision for income taxes.Significant judgment is required in determining the provisionaccounting for income taxes. The Company records itscalculation of income tax provision atrequires estimates due to transactions, credits and calculations where the anticipatedultimate tax rates based on estimatesdetermination is uncertain. Uncertainties arise as a consequence of annual pretax income.the actual source of taxable income between domestic and foreign locations, the outcome of tax audits and the ultimate utilization of tax credits. To the extent that the finalactual results differ from these estimated amounts that were initially recorded, such differences will impact the income tax provision in the period in which suchthe determination is made and could have an impact on the deferred tax asset. The Company’s deferredmade.are recorded at an amount based upon a U.S. federal incomewhich arise from differences in the timing of recognition of revenue and expense for tax rate of 35.0% and appropriate statutory rates of various foreign, state and local jurisdictions in which the Company operates. If the Company’s tax rates change, thefinancial statement purposes. We record valuation allowances to reduce our deferred tax assets and liabilities will be adjusted to anthe amount reflecting those income tax rates. If such change is determinedexpected to be appropriate, it will affectrealized. In assessing the provision for income taxes duringadequacy of a recorded valuation allowance significant judgment is required. We consider all positive and negative evidence and a variety of factors including the period that the determination is made.The Company assesses the likelihood that itsscheduled reversal of deferred tax assets will be recovered fromliabilities, historical and projected future taxable income. To the extent recovery is not likely, a valuation allowance is established. To the extent a valuation allowance is established, the Company includes an expense within the income, and prudent and feasible tax provision. The Company’s valuation allowanceplanning strategies. If we determine there$8.0 million at December 31, 2009 was primarily associated with deferred tax assets for certainIndex to Financial StatementsContentsstatements—(Continued)state income tax credits and net operating loss carryforwardsstatements (continued)it has determined are not more-likely-than-notwe will be able to be realized. The Company will continue to evaluate the realizability of the remaininguse a deferred tax assets, and any furtherasset in the future in excess of its net carrying value, then an adjustment to the deferred tax asset valuation allowance will beis made to reduce income tax expense, thereby increasing net income in the period the Company determinessuch determination was made.more-likely-than-notmore likely than not that anythe position will be sustained on audit. We must then measure the benefit as the largest amount that is more than 50% likely of being realized upon ultimate settlement. Significant judgment is required in the remaining amounts will not be utilized.income net of tax.date.date in other expense, net. For the year ended December 31, 2012, we recorded net foreign currency loss of $0.4 million. For the years ended December 31, 2009, 20082011 and 2007, the Company2010, we recorded net foreign currency gain of $0.2$0.3 million loss of $0.2 and $0.1 million and loss of $0.5 million, respectively, and these amounts are included in other expense, net., respectively.begins upon the establishment ofinclude direct labor costs and fringe benefit costs attributed to programmers, software engineers and quality control teams working on products after they reach technological feasibility subjectbut before they are generally available to net realizable value considerations. To date, the point in time of achieving technological feasibility and the general availability of such software has substantially coincided; therefore,customers for sale. Capitalized software development costs qualifyingare typically amortized over the estimated product life of generally three years, on a straight-line basis.capitalization have been immaterial. Accordingly,impairment whenever events or changes in circumstances occur that could impact the Company has not capitalized anyrecoverability of these assets. There were no impairments during the years ended December 31, 2012, 2011 or 2010. At December 31, 2012 and 2011, software development costs, net of accumulated amortization, were $2.0 millionand has charged all such$1.1 million, respectively, and are included in other assets on the consolidated balance sheet. Amortization expense related to software development costs to researchwas $0.4 million, $0.1 million, $0.1 million for the years ended December 31, 2012, 2011 and development expense.2010, respectively, and is included in both cost of license fees and cost of subscriptions.The Company provides30-day30-day right of return and maintainsunder certain circumstances provide service related credits to our customers. We maintain a reserve for returns and credits which is estimated based on several factors including historical experience, known credits yet to be issued, the aging of customer accounts and existing economic conditions.the nature of service level commitments. Provisions for sales returns and credits are charged against the related revenue items.the Company recordswe record an allowance for doubtful accounts that reflects estimates of probable credit losses. This assessment is based on several factors including aging of customer accounts, known customer specific risks, historical experience andIndex to Financial StatementsBlackbaud, Inc.Notes to consolidated financial statements—(Continued)the Company’sour allowance for doubtful accounts. Balance at
beginning of
year Acquired
through
business
combinations Provision/
adjustment Write-off Balance
at end
of year $ 1,013 $ — $ (47 ) $ (206 ) $ 760 308 268 560 (123 ) 1,013 335 57 (14 ) (70 ) 308 Write-off 2012 $ 261 $ 976 $ (421 ) $ 816 2011 424 27 (190 ) 261 2010 760 (227 ) (109 ) 424 the Company’sour allowance for sales returns. Balance at
beginning of
year Acquired
through
business
combinations Provision/
adjustment Write-off Balance
at end
of year $ 1,764 $ — $ 3,505 $ (2,470 ) $ 2,799 1,627 61 3,619 (3,543 ) 1,764 933 95 2,675 (2,076 ) 1,627 Write-off 2012 $ 3,652 $ 8,914 $ (4,836 ) $ 7,730 2011 2,263 5,619 (4,230 ) 3,652 2010 2,799 3,000 (3,536 ) 2,263 The Company paysthe Company’sour deferred sales commission costs included in prepaid expenses and other current assets. Balance at
beginning of
year Additions Expense Balance
at end
of year $ 3,047 $ 6,994 $ (4,028 ) $ 6,013 1,903 5,699 (4,555 ) 3,047 588 5,335 (4,020 ) 1,903 Additions Expense 2012 $ 16,452 $ 19,693 $ (18,003 ) $ 18,142 2011 11,548 18,415 (13,511 ) 16,452 2010 5,108 12,985 (6,545 ) 11,548 The Company expenseswere $1.1was $1.2 million $1.3 for the year ended December 31, 2012, and $1.1 million and $0.7 million for both the years ended December 31, 2009, 20082011 and 2007, respectively.2010.The Company reviews2009, 20082012, 2011 or 2007.Index to Financial StatementsBlackbaud, Inc.2010Notes to consolidated financial statements—(Continued).Shipping and handlingThe Company expenses shipping and handling costs as incurred and includes them in cost of other revenue. The reimbursement of these costs by the Company’s customers is included in other revenue.The Company computesshares of non-vested restricted stock and settlement of stock appreciation rights and certain contingent liabilities that will be paid in sharesvesting of common stock.Diluted earnings per share for the years ended December 31, 2009restricted stock awards and 2008 do not include the effect of 488,282 and 496,945 potential common share equivalents, respectively, as they are anti-dilutive. There were no anti-dilutive common share equivalents for the year ended December 31, 2007. Years ended December 31, (in thousands, except share and per share amounts) 2009 2008 2007 $ 28,447 $ 29,878 $ 31,724 42,771,173 42,958,947 43,619,158 828,875 999,610 976,325 43,600,048 43,958,557 44,595,483 $ 0.67 $ 0.70 $ 0.73 $ 0.65 $ 0.68 $ 0.71 Year ended December 31, (in thousands, except share and per share amounts) 2012 2011 2010 Numerator: Net income $ 6,583 $ 33,220 $ 29,187 Denominator: Weighted average common shares 44,145,535 43,522,563 43,145,189 Add effect of dilutive securities: Employee stock-based compensation 546,310 626,491 730,966 Weighted average common shares assuming dilution 44,691,845 44,149,054 43,876,155 Earnings per share: Basic $ 0.15 $ 0.76 $ 0.68 Diluted $ 0.15 $ 0.75 $ 0.67 Year ended December 31, 2012 2011 2010 Shares excluded from calculations of diluted EPS 434,050 422,418 221,742 In June 2009,Presentation of Comprehensive Income, which (i) eliminates the FASB issuedoption to present components of other comprehensive income, or OCI, as part of theFASB Accounting Standards CodificationTM statement of changes in stockholders’ equity and (ii) requires the Hierarchypresentation of Generally Accepted Accounting Principles, which establishes the FASB Accounting Standards Codification (ASC) as the sourceeach component of authoritative accounting principles recognized by the FASB to be appliednet income and each component of OCI either in the preparation of financial statementsa single continuous statement or in conformity with generally accepted accounting principles. The ASC is not intended to change U.S. GAAP,two separate but significantly changes the way in which the accounting literature is organized and the way U.S. GAAP is referenced by companies in their financial statements and accounting policies. The ASC became effective in the third quarter of 2009.consecutive statements. The adoption of the ASC did not have an impact on the Company’s consolidated financial statements.Effective January 1, 2009, the Company adopted ASC 805 (formerly SFAS No. 141 (revised 2007)), “Business Combinations” (ASC 805). ASC 805 establishes principles and requirements for how an acquirer recognizes and measures in its financial statements the identifiable assets acquired, the liabilities assumed, any noncontrollingIndex to Financial StatementsBlackbaud, Inc.Notes to consolidated financial statements—(Continued)interest in the acquiree and the goodwill acquired. ASC 805 also established disclosure requirements to enable the evaluation of the nature and financial effects of the business combination. ASC 805 applies to business combinations for which the acquisition date is on or after January 1, 2009. The extent of the impact of ASC 805 on future acquisitions depends on the size and nature of the acquisitions. At the time of adoption on January 1, 2009, ASC 805ASU 2011-05 did not have a material impact on the Company’sour consolidated financial statements. DuringWe have presented each component of net income and OCI in a single continuous statement.year endedcomparability of fair value measurements presented and disclosed in financial statements prepared in accordance with U.S. GAAP and IFRS. ASU 2011-04 is effective for entities prospectively for interim and annual periods beginning after December 31, 2009,15, 2011. The adoption of ASU 2011-04 did not have a material impact on our consolidated financial statements.Company expensed acquisition related costsFASB issued ASU 2013-02, Comprehensive Income (Topic 220) Reporting of $0.2 millionAmounts Reclassified Out of Accumulated Other Comprehensive Income, which requires an entity to provide information about the amounts reclassified out of accumulated other comprehensive income by component. In addition, an entity is required to present, either on the face of the statement where net income is presented or in the notes, significant amounts reclassified out of accumulated other comprehensive income by the respective line items of net income but only if the amount reclassified is required under U.S. GAAP to be reclassified to net income in its entirety in the same reporting period. For other amounts that priorare not required under U.S. GAAP to be reclassified in their entirety to net income, an entity is required to cross-reference to other disclosures required under U.S. GAAP that provide additional detail about those amounts. ASU 2013-02 is effective prospectively for reporting periods beginning after December 15, 2012. We do not anticipate any material impact from the adoption of ASC 805 would have been included in the cost of the acquisition.Recently issued accounting pronouncementsOctober 2009,July 2012, the FASB released Accounting Standards Update (ASU) 2009-13,issued ASU 2012-02, Intangibles - Goodwill and Other (Topic 350) Testing Indefinite-Lived Intangible Assets for Impairment, which amendssimplifies how entities test indefinite-lived intangible assets for impairment. ASU 2012-02 permits an entity to first assess qualitative factors to determine whether it is more likely than not that an indefinite-lived intangible asset is impaired as a basis for determining whether it is necessary to perform the existing criteriaquantitative impairment test currently required by ASC Topic 350-30 on general intangibles other than goodwill. ASU 2012-02 is effective for separating consideration in multiple-deliverable arrangements. Arrangementsannual and interim impairment tests performed for fiscal years beginning after September 15, 2012. Early adoption is permitted, provided that include perpetual software licenses are excludedthe entity has not yet issued its financial statements. We do not anticipate any material impact from the scopeadoption of this ASU. ASU 2009-13 establishes2012-02.hierarchytotal of $335.7 million. Convio was a leading provider of on-demand constituent engagement solutions that enabled nonprofit organizations to more effectively raise funds, advocate for determining the selling pricechange and cultivate relationships. The acquisition of Convio expands our subscription and online offerings and accelerates our evolution to a deliverable and requires the use of best estimate of the selling price when VSOE or third party evidence (TPE) of the selling price cannot be determined.subscription-based revenue model. As a result of the requirement to use the best estimateacquisition, Convio has become a wholly-owned subsidiary of the selling price when vendor specific objective evidence or third party evidence of the selling price cannot be determined, the residual method will no longer be permitted. ASU 2009-13 is applicable prospectively for revenue arrangements entered into or materially modified after the adoption date or retrospectively for all periods presented. The Company is required to adopt ASU 2009-13 on January 1, 2011. Early adoption is permitted. The Company is currently evaluating the impact of ASU 2009-13 on its consolidated financial statements.2.Business combinationsRLCOn April 29, 2009, the Company acquired all of the outstanding stock of RLC Customer Centric Technology B.V. (RLC), a privately held limited liability company based in the Netherlands, for €1.8 million in cash, or the equivalent of $2.4 million based on the foreign exchange rate at the time of the acquisition. The Company will also pay a maximum of €400,000, or the equivalent of $0.5 million based on the foreign exchange rate at the time of the acquisition, in earn-out payments if RLC meets revenue and EBITDA margin targets, as defined in the agreement, over the two years subsequent to the acquisition. RLC is a leading provider of software and services to nonprofits in the Netherlands. The acquisition of RLC provides the Company with a foundation to expand into the Netherlands and other Western European markets.ours. The results of operations of RLCConvio are included in theour consolidated financial statements of the Company from the date of acquisition. During 2009,Since the date of acquisition through RLCConvio operations, was $1.7it is impracticable to determine the operating costs attributable solely to the acquired business. During the year ended December 31, 2012, we incurred $6.4 million of acquisition-related costs associated with the acquisition of Convio, which were recorded in general and costadministrative expense.revenue was $0.9 million.Convio through cash on hand and borrowings of
$312.0 million under our amended credit facility. In connection with closing the Convio acquisition, we designated Convio as a material domestic subsidiary under our credit facility. As a material domestic subsidiary, Convio guarantees amounts outstanding under the credit facility and pledges certain stock of its subsidiaries.statements—(Continued)Companyfollowing table summarizes the allocation of the purchase price based on the estimated fair value of the assets acquired and the liabilities assumed:(in thousands) Net working capital, excluding deferred revenue $ 54,912 Property and equipment 6,591 Other long term assets 75 Deferred revenue (7,917 ) Deferred tax liability (31,648 ) Intangible assets and liabilities 139,650 Goodwill 174,011 $ 335,674 Intangible assets acquired Weighted average amortization period (in thousands) (in years) Customer relationships $ 53,000 15 Marketing assets 7,800 7 Acquired technology 69,000 8 In-process research and development 9,100 7 Non-compete agreements 1,440 2 Unfavorable leasehold interests (690 ) 7 $ 139,650 Year ended December 31, (in thousands, except per share amounts) 2012 2011 Revenue $ 476,887 $ 451,221 Net income (loss) $ 116 $ 27,697 Basic earnings (loss) per share $ — $ 0.64 Diluted earnings (loss) per share $ — $ 0.63 The following table summarizes the allocation of the purchase price:(in thousands) $ 110 374 165 188 840 1,610 (118 ) (179 ) (200 ) (214 ) (208 ) $ 2,368 the acquisition Goodwill was assigned tolicense fees, consulting and education services, subscriptions and maintenance reportable segments. The recognitionyear ended December 31, 2010, we acquired two entities for total consideration of goodwill was principally attributable to a trained workforce and the integration of the Company’s technology and products with RLC’s operations which were considered in the purchase price. The acquisition resulted in the identification of $0.8$5.3 million of intangible assets,, all of which are subject to amortization on a straight-line basis. A liability of $0.2 million was recognized for contingent consideration based on a probability-weighted discounted cash flow valuation technique. Any changepaid in the fair value, or any change upon final settlement, of the contingent consideration liability will be recognized in income from operations.KinteraOn July 8, 2008, the Company acquired Kintera, a publicly-traded company based in San Diego, California. Kintera is a leader in providing web-based, software-as-a-service solutions to the nonprofit market. The acquisition of Kintera provides the Company with additional expertise in developing and delivering on-demand solutions and expands the Company’s online offerings. The Company acquired all of the outstanding capital stock of Kintera through a tender offer, paying $1.12 per share for a total of $45.7 million. The Company financed this acquisition with cash on hand and borrowings under the Company’s revolving credit facility. The total purchase price of $50.2 million includes $2.4 million in payments to Kintera management under change of control provisions, $1.9 million of direct acquisition-related costs and $0.2 million related to Kintera employee stock options assumed.cash. The results of operations of Kintera areacquired entities have been included in theour consolidated financial statements of the Company from the date of acquisition.Index Pro forma results of operations have not been presented because the effects of these business combinations, individually and in the aggregate, were not material to Financial StatementsBlackbaud, Inc.Notes toour consolidated financial statements—(Continued)Theresults of operations. We recorded the purchase price allocation is based on a valuation of the fair value of assets acquired and liabilities assumed in the acquisition of Kintera. The following table summarizes the final allocation of the purchase price:(in thousands) $ 2,980 4,479 1,575 9,428 26,420 3,834 16,950 11,506 (1,061 ) (15,095 ) (7,871 ) (2,973 ) $ 50,172 None of the goodwill arising in the acquisition is deductible for income tax purposes. All segments were allocated a portion of the goodwill. The acquisition resulted in the identification of $16.9 million of intangible assets, all of which are subject to amortization. The following table presents the amounts assigned to each intangible asset class:
acquired $ 740 8.0 12,100 10.8 4,110 7.4 $ 16,950 9.8 Customer relationships are amortized on an accelerated basis. Marketing assets and software are amortized on a straight-line basis.In connection with the acquisition, the Company entered into employment agreements with certain members of Kintera’s management team that provided for the payment of bonuses totaling $449,000, payable in shares of the Company’s common stock based on continued employment. In February 2009, the Company issued 39,140 shares of common stock at a fair market value of $11.47 per share in connection with these employment agreements. In addition, the Company entered into an employment agreement with the former CEO of Kintera that included a targeted bonus payable in shares of the Company’s common stock conditioned upon his continued employment and achievement of certain performance targets. In August 2009, the Company issued 10,898 shares of common stock at a fair market value of $19.73 per share in connection with this bonus arrangement.Index to Financial StatementsBlackbaud, Inc.Notes to consolidated financial statements—(Continued)eTapestryOn August 1, 2007, the Company acquired eTapestry, a privately-owned company based near Indianapolis, Indiana. eTapestry is a provider of an on-demand donor management and fundraising solution. The acquisition of eTapestry allows the Company to address a broader market opportunity by providing an on-demand solution that is suited for smaller organizations interested in a relatively low-cost offering and mid-sized nonprofits interested in a stand-alone fundraising solution deployed in an on-demand model. The Company acquired all of the outstanding capital stock of eTapestry for approximately $25.4 million in a cash transaction financed by a combination of cash on hand and borrowings under the Company’s revolving credit facility. The results of operations of eTapestry are included in the consolidated financial statements of the Company from the date of acquisition.The allocation of the purchase price is based on a valuation of theestimated fair value of the assets acquired and liabilities assumed in the acquisition of eTapestry. The following table summarizes the allocation of the purchase price:(in thousands) $ 308 1,095 21 720 10,450 18,428 (137 ) (304 ) (3,087 ) (39 ) (2,026 ) $25,429 the acquisition The goodwill was principally allocated to the subscriptions and consulting and education services reportable segments. The acquisition resulted in the identification of $10.5 million of intangible assets, all of which are subject to amortization. The following table presents the amounts assigned to each intangible asset class: Intangible
assets
acquired
(in thousands) Weighted
average
amortization
period
(in years) $ 6,100 10.0 2,790 7.0 560 7.0 1,000 5.0 $ 10,450 8.6 In connection with the acquisition, the Company entered into employment agreements with certain members of eTapestry’s management team. Under these arrangements, an additional amount of up to $1.5 million was payable based upon performance of the acquired business for the two twelve-month periods ending September 30, 2009. Based on actual performance, the Company issued 44,763 shares of common stock at a fairIndex to Financial StatementsBlackbaud, Inc.Notes to consolidated financial statements—(Continued)market value of $22.34 and 42,262 shares of common stock at a fair market value of $11.83 during 2009 and 2008, respectively, under these employment agreements.Target CompaniesOn January 16, 2007, the Company acquired the Target Companies, privately-owned affiliated companies based in Cambridge, Massachusetts. The acquired companies provide solutions that help organizations analyze, plan, forecast, execute, and manage high-volume fundraising campaigns while simultaneously helping them maintain long-term constituent relationships. The acquisition of the Target Companies significantly advances the Company’s strategic goal of providing a more complete set of solutions that meet both the fundraising and direct marketing needs of the nonprofit market. The Company acquired all of the outstanding capital stock of the Target Companies for approximately $58.7 million, including direct acquisition-related costs, in an all cash transaction that was financed by a combination of cash on hand and borrowings under the Company’s revolving credit facility. The results of operations of the Target Companies are included in the consolidated financial statements of the Company from the date of acquisition.At the acquisition date, an additional amount of up to $2.4 million was contingently payable to the sellers under an earn-out arrangement based upon performance of the acquired businesses over the year subsequent to the acquisition. In 2008, the Company paid $2.3 million of contingent consideration in cash, which was recorded as an additional acquisition cost and increased the balance of goodwill. There is no further obligation in connection with the Target acquisition.The allocation of the purchase price is based on a valuation of the fair value of the assets acquired and liabilities assumed in the acquisition of the Target Companies. The following table summarizes the allocation of the purchase price:(in thousands) $ 507 5,067 278 2,291 738 22,323 36,453 (445 ) (3,243 ) (1,807 ) (1,919 ) (1,510 ) $ 58,733 Index to Financial StatementsBlackbaud, Inc.Notes to consolidated financial statements—(Continued)Of the total amount of goodwill arising in the acquisition, $35.8 million is expected to be deductible for income tax purposes. All reportable segments were allocated a portion of the goodwill. The acquisition resulted in the identification of $22.3 million of intangible assets, all of which are subject to amortization. The following table presents the amounts assigned to each intangible asset class: Intangible
assets
acquired
(in thousands) Weighted
average
amortization
period
(in years) $ 13,627 12.7 3,655 10.0 3,441 8.0 800 5.0 800 5.0 $ 22,323 11.0 Pro forma information (unaudited)The following unaudited pro forma information presents the consolidated results of operations of the Company as if the acquisition of Kintera, eTapestry and the Target Companies had taken place at January 1, 2007. The pro forma information includes the historical operating results of the acquired companies and adjustments for the business combination effect of the amortization charges from acquired intangible assets, interest expense, interest income and related tax effects. The pro forma information does not necessarily reflect the actual results that would have occurred, nor is it necessarily indicative of future results of operations. The results of operations of RLC were not material to the Company’s consolidated results of operations, and thus pro-forma financial information is not presented. Years ended December 31, (in thousands, except per share amounts) 2008 2007 $ 322,073 $ 307,902 $ 22,728 $ 18,942 $ 0.55 $ 0.43 $ 0.53 $ 0.42 3.20092012 and 20082011 consisted of the following: Estimated
useful life
(years) December 31, (in thousands) 2009 2008 3 - 5 $ 5,323 $ 5,824 3 - 5 25,850 29,448 3 - 5 11,166 11,903 — 5,960 357 5 - 7 4,891 5,229 term of lease 2,641 2,419 55,831 55,180 (33,324 ) (33,796 ) $ 22,507 $ 21,384 December 31, (in thousands) 2012 2011 Equipment 3 - 5 $ 2,430 $ 2,809 Computer hardware 3 - 5 56,969 39,665 Computer software 3 - 5 17,540 9,660 Construction in progress — 1,854 3,836 Furniture and fixtures 5 - 7 5,486 5,028 Leasehold improvements term of lease 5,104 3,394 Total property and equipment 89,383 64,392 Less: accumulated depreciation (40,320 ) (29,995 ) Property and equipment, net of depreciation $ 49,063 $ 34,397 Index to Financial Statementsstatements—(Continued)Depreciation expense was $8.4 million, $6.9 millionstatements (continued)$4.7 million for December 31, 2009, 2008 and 2007, respectively.Property and equipment at December 31, 2009 and 2008 included the following amounts forother intangible assets under capital leases: December 31, (in thousands) 2009 2008 $ 50 $ 50 1,185 1,185 255 255 1,490 1,490 (1,407 ) (1,054 ) $ 83 $ 436 4.Goodwill and other intangible assetsyearsyear ended December 31, 2009 and 20082012, consisted of the following:(in thousands) License
fees Consulting
and education
services Analytic
services Maintenance Subscriptions Total $ 1,350 $ 13,405 $ 13,721 $ 6,009 $ 23,790 $ 58,275 86 567 182 2,497 9,816 13,148 137 634 879 511 734 2,895 (144 ) (174 ) (16 ) (363 ) (6 ) (703 ) 1,429 14,432 14,766 8,654 34,334 73,615 23 627 — 587 373 1,610 3 10 11 42 182 248 (20 ) (78 ) (87 ) (323 ) (1,382 ) (1,890 ) 32 138 4 125 37 336 $ 1,467 $ 15,129 $ 14,694 $ 9,085 $ 33,544 $ 73,919 The Company has(in thousands) ECBU GMBU IBU Target Analytics Other Total Balance at December 31, 2011 $ 23,023 $ 26,437 $ 5,389 $ 33,177 $ 2,096 $ 90,122 Additions related to business combinations 125,299 48,712 — — — 174,011 Additions related to prior year business combinations — — 793 — — 793 Effect of foreign currency translation — — 129 — — 129 Balance at December 31, 2012 $ 148,322 $ 75,149 $ 6,311 $ 33,177 $ 2,096 $ 265,055 20092012 and 2008.2011. Additions to goodwill during the year ended December 31, 20092012, related primarily to the acquisition of RLCacquisitions as described in Note 23 of these consolidated financial statements. The Company finalizedremaining additions were the result of an adjustment to the allocation of the purchase price allocation for Kinteraone the entities we acquired during 2009, which resulted in a net decrease to goodwill of $1.6 million. The adjustments to the purchase price allocation primarily related to (i) the recognition of $1.9 million of additional deferred tax assets, (ii) the recognition of a current tax benefit of $0.8 million and (iii) an increase in contingent tax liabilities, royalties and other preacquisition accruals of $1.1 million.Index to Financial StatementsBlackbaud, Inc.Notes to consolidated financial statements—(Continued)The Company hasWe have recorded intangible assets acquired in various business combinations based on their fair values at the date of acquisition. The table below sets forth the balances of each class of intangible asset all of which are subject toand related amortization, as of December 31, 20092012 and 2008. December 31, (in thousands) 2009 2008 $ 39,975 $ 39,607 2,232 2,124 11,489 11,045 2,111 2,100 3,441 3,441 59,248 58,317 (10,465 ) (5,984 ) (843 ) (496 ) (3,454 ) (2,052 ) (1,195 ) (772 ) (1,272 ) (842 ) (17,229 ) (10,146 ) $ 42,019 $ 48,171 December 31, (in thousands) 2012 2011 Finite-lived gross carrying amount Customer relationships $ 101,878 $ 48,725 Marketing assets 10,296 2,502 Acquired software and technology 94,378 16,087 Non-compete agreements 3,979 2,539 Database 4,275 4,275 Total finite-lived gross carrying amount 214,806 74,128 Accumulated amortization Customer relationships (24,994 ) (18,891 ) Marketing assets (2,852 ) (1,627 ) Acquired software and technology (14,787 ) (6,171 ) Non-compete agreements (2,727 ) (1,856 ) Database (2,798 ) (2,263 ) Total accumulated amortization (48,158 ) (30,808 ) Indefinite-lived gross carrying amount Marketing assets 1,389 1,340 Total intangible assets, net $ 168,037 $ 44,660 subject to amortization during 20092012 are related to the acquisition of RLC asacquisitions described in Note 23 of these consolidated financial statements.operationscomprehensive income based on the revenue stream to which the asset contributes.contributes and the nature of the intangible asset. The following table summarizes amortization expense for the years ended December 31, 2009, 20082012, 2011 and 2007. Years ended December 31, (in thousands) 2009 2008 2007 $ 362 $ 246 $ 153 1,344 1,338 1,178 1,302 895 406 3,239 2,694 1,112 75 75 96 6,322 5,248 2,945 768 713 491 $ 7,090 $ 5,961 $ 3,436 Index to Financial StatementsBlackbaud, Inc.2010Notes to consolidated financial statements—(Continued). Year ended December 31, (in thousands) 2012 2011 2010 Included in cost of revenue: Cost of license fees $ 485 $ 635 $ 588 Cost of subscriptions 11,969 3,341 3,058 Cost of services 1,992 1,572 1,390 Cost of maintenance 722 975 1,223 Cost of other revenue 75 75 75 Total included in cost of revenue 15,243 6,598 6,334 Included in operating expenses 2,106 980 798 Total $ 17,349 $ 7,578 $ 7,132 acquisition-relatedour finite-lived intangible assets as of December 31, 2009: Years ended December 31, (in thousands) $ 6,787 6,348 5,477 4,883 4,572 $ 28,067 20092012 and 2008: December 31, (in thousands) 2009 2008 $ 6,013 $ 3,047 4,694 3,904 3,736 6,385 3,712 3,945 $ 18,155 $ 17,281 2011: (in thousands) December 31, 2012 December 31, 2011 Deferred sales commissions $ 18,142 $ 16,452 Prepaid software maintenance 5,530 4,676 Taxes, prepaid and receivable 7,398 343 Deferred professional services costs 3,233 3,098 Prepaid royalties 2,813 2,331 Other 3,473 4,116 Total prepaid expenses and other current assets $ 40,589 $ 31,016 6.Accrued expenses and other current liabilities20092012 and 2008: December 31, (in thousands) 2009 2008 $ 8,699 $ 6,905 3,800 3,703 3,536 3,028 3,196 2,033 1,394 758 1,124 1,283 4,225 4,432 $ 25,974 $ 22,142 (in thousands) December 31, 2012 December 31, 2011 Taxes payable $ 7,607 $ 3,355 Accrued commissions and salaries 5,905 6,475 Accrued bonuses 11,966 9,832 Customer credit balances 4,577 3,762 Accrued software and maintenance 3,831 174 Accrued royalties 1,750 1,418 Other 10,360 7,691 Total accrued expenses and other current liabilities $ 45,996 $ 32,707 Index to Financial StatementsBlackbaud, Inc.Notes to consolidated financial statements—(Continued)7.Deferred revenue20092012 and 2008: December 31, (in thousands) 2009 2008 $ 76,651 $ 70,616 31,130 23,588 26,019 24,291 1,784 1,145 135,584 119,640 (6,172 ) (5,838 ) $ 129,412 $ 113,802 8.DebtRevolving2011:(in thousands) December 31, 2012 December 31, 2011 Maintenance $ 81,741 $ 81,913 Subscriptions 65,850 50,849 Services 36,904 29,675 License fees and other 523 1,000 Total deferred revenue 185,018 163,437 Less: Deferred revenue, net of current portion (11,119 ) (9,772 ) Deferred revenue, current portion $ 173,899 $ 153,665 Company hascredit facility includes the following facilities: (i) a five-year $75.0 milliondollar and a designated currency revolving credit facility which expires July 2012. Underwith sublimits for letters of credit and swingline loans, and (ii) a delayed draw term loan. The credit facility is secured by the termsstock and limited liability company interests of certain subsidiaries that were pledged as part of the credit agreement, the Company may elect not more than twice over the term of the agreement to increase the amount availableclosing. Amounts outstanding under the facility for an aggregate amount of up to $50.0 million, subject to certain terms and conditions. In June 2008, the Company exercised one of its options and increased the credit facility by $15.0 million to an aggregate available amount of $90.0 million. The revolving credit facility iswill be guaranteed by theour material domestic subsidiaries, and is collateralizedif any. In connection with closing the stock of all of the Company’s subsidiaries. At December 31, 2009, there were no outstanding borrowingsConvio acquisition, we designated Convio as a material domestic subsidiary under the credit facility.Company’s option, at a variable rate based on (a) the higherhighest of (i) the prime rate, (ii) federal funds rate plus 0.50% and (iii) one month LIBOR plus 1% (Base Rate), in addition to a margin of 0.25% to 1.25% (Base Rate Loans), or (b) the LIBOR rate plus a margin of up1.25% to 0.5%2.25% (LIBOR Loans). Swingline loans bear interest at a rate per annum equal to the Base Rate plus a margin of 0.25% to 1.25% or federal fundssuch other rate agreed to between the Swingline lender and us. Designated currency tranche revolving credit loans bear interest at a rate per annum equal to the LIBOR rate plus a margin of 0.5%1.25% to 1.0% (Base Rate Loans) or (b) LIBOR plus a margin of 1.0% to 1.5% (LIBOR Loans)2.25%. The exact amount of any margin depends on the nature of the loan and theour leverage ratio at the time of the borrowing. The Companyratio.payspay a quarterly commitment fee on the unused portion of the revolving credit facility equalfrom 0.20% to 0.2%, 0.25% or 0.3%0.35% per annum, depending on the Company’sour leverage ratio.the Company haswe have the ability to choose either Base Rate Loans or LIBOR Loans. Base rateRate borrowings mature in July 2012.February 2017. LIBOR Loans can be one, two, three or six month maturities (or, if agreed to by the applicable lenders, nine or twelve months), and the Company has the ability to extend the maturity of these loans by rolling them at their maturityrollover automatically, if we take no other action, into new loans with the same or longer maturities. The Company evaluatesBase Rate Loans. We evaluate the classification of itsour debt based on the maturityrequired annual maturities of individual borrowings and any roll-over of borrowings subsequent to the balance sheet date, but prior to issuance of theour credit facility.statements.Deferred financing costsAmortization expense for deferred financing costs was $0.1 million for each of the years ended December 31, 2009, 2008 and 2007. A portion of the deferred financing costs amortized in 2007 was associated with the previous credit facility. The amortization of deferred financing cost recognized in 2009, 2008 and 2007 includes the amortization of costcovenants related to the revolvingconsolidated leverage ratio and consolidated interest coverage ratio, as well as restrictions on the maximum amount of annual capital expenditures, our ability to declare and pay dividends and our ability to repurchase shares of our common stock. At Debt balance at Effective interest rate at (in thousands, except percentages) December 31, 2012 December 31, 2012 Credit facility: Revolving credit loans $ 123,000 2.68 % Term loans 92,500 3.14 % Total debt 215,500 2.88 % Less: Debt, current portion 10,000 3.14 % Debt, net of current portion $ 205,500 2.86 % Annual maturities 2013 $ 10,000 2014 13,750 2015 15,000 2016 15,000 2017 161,750 Thereafter — Total required maturities $ 215,500 2007 and additional feesFebruary 2012, we paid in June 2008 to exercise$2.4 million of financing costs, which is being amortized over the Company’s option to increaseterm of the available borrowings under the creditnew facility. As of December 31, 20092012 and 2008,December 31, 2011, deferred financing costs totaling $0.2$2.5 million and $0.3$0.8 million, respectively, are included in other assets on the consolidated balance sheet.IndexFinancial Statementsmanage interest rate risk. In May 2012, we entered into two interest rate swap agreements which effectively convert portions of our variable rate debt under our credit facility to a fixed rate for the terms of the swap agreements. The aggregate notional value of the swap agreements was $150.0 million with effective dates beginning in May 2012 through January 2017. We designated the swap agreements as cash flow hedges at the inception of the contracts.statements—(Continued)Note payableAs a resultThe fair values of the acquisitionour derivative instruments as of Kintera, the Company assumed a note payable that Kintera had executed on December 1, 2007 in the amount31, 2012, were as follows: December 31, 2012 Liabilities (in thousands) Balance Sheet Location Fair Value Derivative instruments designated as hedging instruments: Interest rate swaps Other liabilities $ 1,296 Total derivative instruments designated as hedging instruments $ 1,296 $3.2 million for the purchase of computer equipment.December 31, 2011. The note is collateralized by the underlying computer equipment, bears interest at a rate of 11.34% and has a maturity date of November 30, 2010. The Company recorded the note at its fair value as of the acquisition date,our interest rate swaps was based on model-driven valuations using LIBOR rates, which resulted in an increaseare observable at commonly quoted intervals. Accordingly, our interest rate swaps are classified within Level 2 of $113,000 in the carrying value. Payments of principal and interest totaling $1.2 million are due in 2010. As of December 31, 2009, the note payable balance is classified as current. Based on the short-term nature of the note payable at December 31, 2009, the Company has determined that the fair value hierarchy.this note payable approximates its carrying value.9.derivative instruments in cash flow hedging relationships for the year ended December 31, 2012, were as follows: Loss recognized in accumulated other comprehensive loss Location of loss reclassified from accumulated other comprehensive loss into income Loss reclassified from accumulated other comprehensive loss into income December 31, Year ended December 31, (in thousands) 2012 2012 Interest rate swaps $ (1,296 ) Interest expense $ (466 ) and contingenciesLeases and related party transactionsThe Company leases itscontingenciesfrom Duck Pond Creek, LLC. Two current executive officers of the Company each haveunder a 4% ownership interest in Duck Pond Creek, LLC. The15-year lease agreement which was entered into in October 2008, and has a term of 15 years with two five-year renewal options by the Company.options. The current annual base rent of the lease is $3.6$3.9 million payable in equal monthly installments. The base rent escalates annually at a rate equal to the change in the consumer price index, as defined in the agreement, but not to exceed 5.5% in any year. In addition, under the terms of the lease, the lessor will reimburse the Companyus an aggregate amount of $4.0$4.0 million for leasehold improvements, which will be recorded as a reduction to rent expense ratably over the term of the lease. During each of the years ended December 31, 20092012, 2011, and 2008,2010, rent expense was reduced by $0.3$0.3 million and $0.1 million, respectively, related to this lease provision. There were no such amounts recorded during the year ended December 31, 2007 since this lease provision became effective under renegotiated lease terms in October 2008. The $4.0$4.0 million leasehold improvement allowance has been included in the table of operating lease commitments below as a reduction in the Company’sour lease commitments ratably over the then remaining life of the lease from October 2008. The timing of the reimbursements for the actual leasehold improvements may vary from the amount reflected in the table below.the Company haswe have subleased a portion of its headquarters facilityour facilities under various agreements extending through 2011.2014. Under these agreements, rent expense was reduced by $0.2$0.3 million $0.4 in the year ended December 31, 2012 and by $0.4 million and $0.4 million for in each the years ended December 31, 2009, 20082011 and 2007,2010, respectively. The operating lease commitments in the table belowWe have been reduced by minimum aggregate sublease commitments of $0.2 million and $0.1 million during 2010 and 2011, respectively. No minimum aggregate sublease commitments exist after 2011. The Company has also received, and expectsexpect to receive through 2012,2023, quarterly South Carolina state incentive payments as a result of locating itsour headquarters facility in Berkeley County, South Carolina. These amounts are recorded as a reduction of rent expense and were $1.7$2.2 million $1.8, $2.3 million and $1.9$2.0 million for the years2009, 20082012, 2011 and 2007,2010, respectively.the Company leaseswe lease various office space and equipment under operating leases. The CompanyWe also hashave various non-cancelable capital leases for computer equipment and furniture.Index to Financial StatementsBlackbaud, Inc.Notes to consolidated financial statements—(Continued)2009,2012, the future minimum lease commitments related to lease agreements, net of related sublease commitments and lease incentives, were as follows: Operating
leases Capital
leases $ 6,278 $ 174 5,860 40 5,337 2 4,309 — 39,931 — $ 61,715 216 13 203 163 $ 40 Year ended December 31, Operating (in thousands) leases 2013 $ 10,278 2014 9,518 2015 8,339 2016 7,322 2017 7,336 Thereafter 40,925 Total minimum lease payments $ 83,718 The Company utilizesitsour products and services, with contractual arrangements varying in length from one to three years. In somecertain cases, these arrangements require a minimum annual purchase commitment. TheAs of December 31, 2012, the remaining aggregate minimum purchase commitment under these arrangements is approximately $3.4$4.5 million through 2012. The Company2015. We incurred expense under these arrangements of $2.4$1.3 million $1.6, $3.2 million and $0.8$1.7 million for the years ended December 31, 2009, 20082012, 2011 and 2007,2010, respectively.The Company isThe Company recordsWe record an accrual for a contingency when it is both probable that a liability has been incurred and the amount of the loss can be reasonably estimated. The Company doesWe do not believe the amount of potential liability with respect to these actions will have a material adverse effect upon the Company’sour consolidated financial position, results of operations or cash flows.The Company entersthe Company haswe have agreed to indemnify the other party for certain matters, such as property damage, personal injury, acts or omissions of the Company,ours, or itsour employees, agents or representatives, or third-party claims alleging that the activities of its contractual partner pursuant to the contract infringe a patent, trademark or copyright of such third party.The Company assessesitsour liability on the above indemnities to be immaterial based on historical experience and information known at December 31, 2009.10.Income taxesThe Company files2012andas well as in foreign jurisdictions including Canada, United Kingdom, Australia and the Netherlands. The Company isWe are generally subject to U.S. federal income tax examination for calendar tax years 20052009 through 2008 and2011 as well as state and foreign income tax examinationexaminations for various years depending on statutes of limitations of those jurisdictions.statements—(Continued) Years ended December 31, (in thousands) 2009 2008 2007 $ 3,139 $ 6,862 $ 5,517 1,359 1,758 525 391 359 448 4,889 8,979 6,490 11,167 6,391 11,120 1,184 959 2,219 12,351 7,350 13,339 $ 17,240 $ 16,329 $ 19,829 Year ended December 31, (in thousands) 2012 2011 2010 Current taxes: U.S. Federal $ (1,764 ) $ 3,434 $ 4,130 U.S. State and local 410 1,030 1,228 International 511 40 78 Total current taxes (843 ) 4,504 5,436 Deferred taxes: U.S. Federal 8,943 11,943 10,077 U.S. State and local (796 ) 1,536 1,262 International (562 ) 54 (26 ) Total deferred taxes 7,585 13,533 11,313 Total income tax provision $ 6,742 $ 18,037 $ 16,749 Years ended December 31, (in thousands) 2009 2008 2007 $ 43,991 $ 44,828 $ 50,169 1,696 1,379 1,384 $ 45,687 $ 46,207 $ 51,553 Year ended December 31, (in thousands) 2012 2011 2010 U.S. $ 16,793 $ 50,946 $ 45,700 International (3,468 ) 311 236 Income before provision for income taxes $ 13,325 $ 51,257 $ 45,936 the Company’sour income tax provision is as follows: Years ended December 31, 2009 2008 2007 35.0 % 35.0 % 35.0 % 4.2 4.2 3.9 — (0.8 ) — (0.2 ) (0.8 ) (0.3 ) (2.1 ) (2.8 ) (1.4 ) 3.4 2.7 1.6 (3.0 ) (0.9 ) — 0.4 (1.3 ) (0.3 ) 37.7 % 35.3 % 38.5 % Income Year ended December 31, 2012 2011 2010 Federal statutory rate 35.0 % 35.0 % 35.0 % Effect of: State income taxes, net of federal benefit 8.3 4.2 4.3 Change in state income tax rate applied to deferred tax asset (2.2 ) 0.6 — Fixed assets (7.6 ) — — Unrecognized tax benefit 2.9 (0.3 ) 0.4 State credits, net of federal benefit (1.7 ) (2.2 ) (2.4 ) Change in valuation reserve 4.1 0.7 2.4 Federal credits generated — (2.7 ) (3.2 ) Foreign tax rate 2.3 — — Acquisition costs 10.8 0.6 1.0 Foreign tax credits (3.0 ) — — Other 1.7 (0.7 ) (1.0 ) Income tax provision effective rate 50.6 % 35.2 % 36.5 % benefit of $2.3 million, expense of $1.1 million and benefit of $4.9 million that werebenefits attributable to employee stock option transactionsand stock appreciation right exercises and restricted stock vesting were recordedof $0.1 million, $0.2 million and $2.7 million in stockholders’ equity in 2009, 2008 and 2007, respectively.The amount of tax allocated to the translation adjustment recorded in accumulated other comprehensive income was a benefit of $0.4 million, an expense of $0.2 million and a benefit of $0.1 million forduring the years ended 2009, 20082012, 2011 and 2007,2010, respectively.Index We were unable to Financial StatementsBlackbaud, Inc.Notesrecognize additional excess tax benefits of stock-based compensation deductions generated during 2012 because the deductions did not reduce income tax payable after considering our net operating loss carryforwards. Although not recognized for financial reporting purposes, this unrecognized tax benefit is available to consolidated financial statements—(Continued)reduce future taxable income.the Company’sour deferred tax assetassets and liabilities were as follows: December 31, (in thousands) 2009 2008 $ 10,391 $ 9,859 19,804 23,007 1,294 1,080 5,911 5,892 35,985 42,596 8,113 7,474 2,594 2,092 84,092 92,000 (8,345 ) (8,608 ) (3,090 ) (2,000 ) (3,365 ) (1,907 ) (14,800 ) (12,515 ) (7,994 ) (7,865 ) $ 61,298 $ 71,620 December 31, (in thousands) 2012 2011 Deferred tax assets relating to: Federal and state net operating loss carryforwards $ 30,839 $ 16,842 State and foreign tax credits 15,438 11,148 Intangible assets 13,706 20,969 Effect of expensing nonqualified stock options and restricted stock 7,634 8,142 Accrued bonuses 4,361 3,084 Deferred revenue 4,342 3,343 Allowance for doubtful accounts 3,161 1,456 Other 8,321 2,511 Total deferred tax assets 87,802 67,495 Deferred tax liabilities relating to: Intangible assets (65,882 ) (8,407 ) Fixed assets (12,643 ) (9,132 ) Other (7,318 ) (8,950 ) Total deferred tax liabilities (85,843 ) (26,489 ) Valuation allowance (10,651 ) (10,079 ) Net deferred tax asset (liabilities) $ (8,692 ) $ 30,927 2009, the Company had a2012, our federal, foreign and state net operating loss carryforwards for income tax purposes were approximately $77.3 million, $3.6 million and $57.1 million, respectively. The federal and state net operating loss carryforwards are subject to various Internal Revenue Code limitations and applicable state tax laws. If not utilized, the federal net operating loss carryforwards will begin to expire in 2033 and the state net operating loss carryforwards will expire over various periods beginning in 2017. A portion of the foreign and state net operating loss carryforwards have a valuation reserve due to management's uncertainty regarding the future ability to use such carryforwards. Our federal and state tax credit carryover ofcarryforwards for income tax purposes were approximately $1.6$3.6 million which will expire between 2014 and 2018. As of December 31, 2009 the Company had state tax credits of approximately $8.8$11.6 million, net of federal tax, whichrespectively. If not utilized, the federal tax credit carryforwards will begin to expire between 2010in 2033 and 2024, if unused. Thesethe state tax credit carryforwards will begin to expire in 2013. The state tax credits had a valuation reserve of approximately $6.4$8.5 million, net of federal tax, as of December 31, 2009.The Company acquired all of its federal and state net operating loss carryforwards in business acquisitions. At December 31, 2009, the Company had deferred tax assets of $17.3 million for federal net operating loss carryforwards and $2.5 million for state net operating loss carryforwards. These deferred assets pertain to net operating loss carryforwards of approximately $49.6 million and $47.9 million for federal and state purposes, respectively, at December 31, 2009. These net operating losses carryforwards expire during various tax years through 2029. As a result of the Kintera acquisition, Kintera underwent a change in ownership under Section 382 of the Internal Revenue Code (IRC Sec. 382) on July 8, 2008. On August 1, 2007, as a result of the eTapestry acquisition, eTapestry also underwent a change in ownership under IRC Sec. 382. In general, IRC Sec. 382 places annual limitations on the use of certain tax attributes such net operating losses and tax credit carryovers in existence at the ownership change date. These limitations restrict the amount of the aforementioned net operating loss carryforwards that are available to offset taxable income each year. A portion of the state net operating loss carryforward has a valuation reserve due to management’s uncertainty regarding the future ability to use such carryforwards.Index to Financial StatementsBlackbaud, Inc.Notes to consolidated financial statements—(Continued)the Company’sour deferred tax asset valuation allowance.(in thousands) Balance at
beginning
of year Acquisition
related
change Balance at
end of
year $ 7,865 $ (1,378 ) $ 1,507 $ 7,994 3,891 2,741 1,233 7,865 3,147 — 744 3,891 (in thousands) Years ended December 31, 2012 $ 10,079 $ 286 $ 286 $ 10,651 2011 9,614 — 465 10,079 2010 7,994 75 1,545 9,614 the Company’sour unrecognized tax benefit for the year ended December 31, 2009, 20082012, 2011 and 2007: December 31, (in thousands) 2009 2008 2007 $ 346 $ 629 $ 642 427 — 13 — — (12 ) 485 23 8 (27 ) (306 ) — — — (22 ) $ 1,231 $ 346 $ 629 December 31, (in thousands) 2012 2011 2010 Balance at beginning of year $ 1,777 $ 1,414 $ 1,231 Increases from prior period positions 2,766 87 126 Decreases in prior year position (93 ) (9 ) — Increases from current period positions — 285 297 Lapse of statute of limitations (604 ) — (240 ) Balance at end of year $ 3,846 $ 1,777 $ 1,414 $1.1$3.8 million at December 31, 2009. The Company recognizes2012. We recognize accrued interest and penalties, if any, related to unrecognized tax benefits as a component of income tax expense. Tax expense for 2009 was increased by $0.9 million for changes in liabilities, penalties and accrued interest related to uncertain tax positions. Tax expense for 2008 was decreased by $0.3 million and for 2007 was increased by $25,000, for changes in liabilities, penalties and accrued interest related to uncertain tax positions. The total amount of accrued interest and penalties included in the consolidated balance sheet as of December 31, 20092012 and 20082011 was $0.2 million.$0.7 million and $0.2 million, respectively. The total amount of interest and penalties included in the consolidated statementstatements of operationscomprehensive income as a decrease in income tax expense for 20082012 and 2010 was $0.1 million;$0.3 million and $0.2 million, respectively. The total amount of interest and penalties were immaterialincluded in 2009.The Company hasthe consolidated statements of comprehensive income as an increase in income tax expense for 2011 was in certain taxing jurisdictions for which it is reasonably possible that the total amounts of unrecognized tax benefits might significantly decrease within the next twelve months. TheThis possible decrease could result from the finalization of state income tax reviews and the expiration of statutes of limitations. These positions relate to state nexus issues. The reasonably possible decrease is $0.3 million.It continuesapproximates beCanada, are not permanently reinvested and as a result we recorded a tax liability and applicable foreign tax credits for the Company’s intention to indefinitely reinvest undistributedeffect of repatriating those foreign earnings. For the remaining undistributed earnings, we concluded that these earnings would be permanently reinvested in the local jurisdictions and not repatriated to the United States. Accordingly, no deferred tax liability has been recorded in connection with thewe have not provided for U.S. federal and foreign withholding taxes on those undistributed earnings of our foreign earnings.subsidiaries. It is not practicable for the Company to determineestimate the amount that might be payable if some or all of the unrecognized deferred tax liability for temporary differences relatedsuch earnings were to investments in foreign subsidiaries.be remitted.
Index to Financial StatementsBlackbaud, Inc.Notes to consolidated financial statements—(Continued)11.Stock-based compensationthe Companywe may grant incentive stock options, non-statutory stock options, restricted stock awards, restricted stock unit awards, stock appreciation rights, performance stock awards and other stock awards to eligible employees, directors and consultants. The Company maintainsWe maintain other stock based compensation plans including the 2004 Stock Plan and the 2001 Stock Option Plan, under which no additional grants may be made, and the 2009 Equity Compensation Plan for Employees from Acquired Companies, under which the Companywe may grant shares of its common stock to employees pursuant to employment contracts or other arrangements entered into in connection with past and future acquisitions.onin July 8, 2008, the Company also maintainswe maintain the Kintera, Inc. 2000 Stock Option Plan, as amended (Kintera 2000 Plan) and Kintera, Inc. Amended and Restated 2003 Equity Incentive Plan, as amended (Kintera 2003 Plan), that itwhich we assumed upon the acquisition of Kintera. The Company’sIn connection with the acquisition of Convio in May 2012, we maintain the Convio, Inc. 1999 Stock Option/Stock Issuance Plan, as amended (Convio 1999 Plan) and Convio, Inc. 2009 Stock Incentive Plan, as amended (Convio 2009 Plan), which we assumed upon the acquisition of Convio. Our Compensation Committee of the Board of Directors administers theall of these plans and the stock-based awards are granted under terms determined by them.the Company’sour plans was 3,888,8815,993,220 as of December 31, 2009. The Company issues2012. We issue common stock from itsour pool of authorized stock upon exercise of stock options, settlement of stock appreciation rights and performance-based restricted stock units or upon granting of restricted stock.The Company hasthreefour types of awards under these plans: stock options, restricted stock awards, performance-based restricted stock units and stock appreciation rights. The following table sets forth the number of awards outstanding for each award type as of December 31, 20092012 and 2008. Outstanding at
December 31,Award type 2009 2008 1,091,241 1,526,855 1,206,371 1,259,909 1,764,603 1,285,626 Outstanding at December 31, Award type 2012 2011 Stock options 60,775 216,848 Restricted stock awards 1,203,186 1,079,930 Restricted stock units 389,913 159,462 Stock appreciation rights 2,786,828 2,305,049 7-year7-year contractual term. Additionally, stock appreciation rights (SARs), have contractual lives of 5 or 7 years.Index Awards granted to Financial StatementsBlackbaud, Inc.Notesour executive officers and certain members of management are subject to consolidated financial statements—(Continued)accelerated vesting upon a change in control as defined in the employees’ retention agreement.The Company recognizesThe Company recognizesWe recognize compensation expense associated with restricted stock awards and SARs on a straight-line basis over the requisite service period of the individual grantees, which generally equals the vesting period.operationscomprehensive income based on where the employees’ departmental cost center.associated employee’s compensation is recorded. The following table summarizes stock-based compensation expense for the yearyears ended December 31, 2009, 20082012, 2011 and 2007. Years ended December 31, (in thousands) 2009 2008 2007 $ 1,433 $ 1,442 $ 627 750 534 234 387 283 274 2,570 2,259 1,135 1,605 1,607 831 2,944 2,396 1,219 5,168 5,823 3,749 9,717 9,826 5,799 $ 12,287 $ 12,085 $ 6,934 Year ended December 31, (in thousands) 2012 2011 2010 Included in cost of revenue: Cost of subscriptions $ 860 $ 571 $ 392 Cost of services 2,786 1,966 1,742 Cost of maintenance 538 741 814 Total included in cost of revenue 4,184 3,278 2,948 Included in operating expenses: Sales and marketing 2,527 1,325 1,366 Research and development 3,556 3,039 2,844 General and administrative 8,973 7,242 5,901 Total included in operating expenses 15,056 11,606 10,111 Total $ 19,240 $ 14,884 $ 13,059 $29.3$43.0 million at December 31, 2009.2012. This amount will be recognized over a weighted average period of 1.9 years.vested and unvested under each of the Company’sour stock-based compensation plans as of December 31, 2009.Plan Date of adoption Options
outstanding Options
vested Options
unvested Range of
exercise prices July 1, 2001 303,081 303,081 — $ 5.40-$9.04 March 23, 2004 758,289 758,289 — $ 8.00-$16.10 July 8, 2008 (1) 6,820 6,820 — $ 1.16-$19.26 July 8, 2008 (1) 23,051 18,209 4,842 $ 10.59-$21.38 1,091,241 1,086,399 4,842 Plan Date of adoption 2004 Stock Plan March 23, 2004 21,383 $8.60-$13.05 Kintera 2003 Plan July 8, 2008 (1) 6,086 $10.59-$19.26 Convio 1999 Plan May 5, 2012 (1) 28,977 $9.10-$15.54 Convio 2009 Plan May 5, 2012 (1) 4,329 $15.62-$18.20 Total 60,775 (1) In connection with the acquisitionacquisitions of Kintera the Companyand Convio, we assumed certain stock options issued and outstanding at the date of acquisition.Index to Financial StatementsBlackbaud, Inc.Notes to consolidated financial statements—(Continued)2009,2012, and changes during the year then ended, is as follows:Options Share
options Weighted
average
exercise
price
average
remaining
contractual
term Aggregate
intrinsic value
(in thousands) 1,526,855 $ 10.46 (434,463 ) 5.77 (1,151 ) 12.19 1,091,241 $ 12.32 2.9 $ 12,338 4,659 $ 11.56 8.3 $ 56 1,086,399 $ 12.33 2.9 $ 12,279 Options Outstanding at January 1, 2012 216,848 $ 15.16 63,439 13.24 Exercised (200,082 ) 15.73 Forfeited (19,205 ) 15.79 Expired (225 ) 10.92 Outstanding at December 31, 2012 60,775 $ 11.09 4.7 $ 713 Unvested and expected to vest at December 31, 2012 9,996 $ 12.54 6.6 $ 103 Vested and exercisable at December 31, 2012 49,986 $ 10.78 4.3 $ 602 (1) Stock options assumed in connection with the acquisition of Convio. 2009, 20082012, 2011 and 20072010 was $5.9$3.2 million $1.8, $3.1 million and $14.8and $9.1 million, respectively. The total fair value of options that vested during the year ended December 31, 2009, 20082012, was $0.6 million. The total fair value of options that vested during 2011 and 20072010 was $2.3 million, $2.8 million and $3.3 million, respectively.not material. All outstanding options granted by the Company had a fair market value assigned at the grant date based on the use of the Black-Scholes option pricing model. TheSignificant assumptions used in the valuation ofBlack-Scholes option pricing model for options are the sameassumed from Convio in May 2012 were as described in thefollows:May 2012 Volatility 32% to 39% Dividend yield 1.8% Risk-free interest rate 0.0% to 0.4% Expected option life in years 0.04 to 3.26 appreciation rights section below.Thereawards been no new stock option awards granted since 2005.Restricted stockThe Company has also granted shares of common stock subject to certain restrictions under the 2008 Equity Plan and the 2004 Stock Plan. Restricted stock awards granted to employees vest in equal annual installments over four years from the grant date. Restricted stock awards granted to non-employee directors vestsvest after one year from the date of grant or, if earlier, immediately prior to the next annual election of directors, provided the non-employee director is serving as a director at that time. Restricted stock grantedThe fairthe Company’s executive officers and certain members of management are subject to accelerated vesting upon a change in control of the Company as defined in the employees’ retention agreement. The fair consolidated financial statements (continued)Unvested restricted stock awards Unvested at January 1, 2012 1,079,930 $ 25.22 Granted 687,652 22.77 Vested (421,636 ) 22.82 Forfeited (142,760 ) 26.00 Unvested at December 31, 2012 1,203,186 $ 24.58 restrictions lapseunit is exercised to the extent expense has been recognized. Tax benefits associated with stock-based compensation in excess of the related book expense recorded are credited to additional paid-in capital within stockholders’ equity. During 2009 and 2008, the Company purchased 170,729 and 106,446 shares, respectively, from restricted stockholders upon lapsing of stock restrictions in order for the holders to satisfy personal tax liabilities.Index to Financial StatementsBlackbaud, Inc.Notes to consolidated financial statements—(Continued)2009, and changes during the year then ended,2012 is as follows:Unvested restricted stock Restricted
stock Weighted
average
grant-date
fair value 1,259,909 $ 19.16 492,964 21.36 (492,432 ) 18.81 (54,070 ) 20.63 1,206,371 $ 20.20 Unvested restricted stock units Unvested at January 1, 2012 159,462 $ 25.60 Granted 30,738 21.41 331,196 28.84 Forfeited (53,976 ) 27.84 Vested (77,507 ) 27.59 Unvested at December 31, 2012 389,913 $ 27.55 (1) Restricted stock units assumed in connection with the acquisition of Convio. 2009,2012, the number and intrinsic value of restricted awardsstock units expected to vest was 1,147,662376,306 and $27.1$8.6 million, respectively. The totalweighted average grant date fair value of restricted stock that vested duringunits granted for the years ended December 31, 2009, 20082011 and 20072010 was $9.3 million, $6.9 million$26.68 and $4.4 million,$22.79, respectively. The weighted average grant-date fair value of restricted stock granted during the years ended December 31, 2009, 2008 and 2007 was $21.36, $14.89 and $25.80, respectively.The Company hasthree and four years from the date of grant subject to the recipient’s continued employment with the Company. SARs granted to the Company’s executive officers and certain members of management are subject to accelerated vesting upon a change in control of the Company as defined in the employees’ retention agreement.us. The number of shares issued upon the exercise of the SARs is calculated as the difference between thethe Company’sour stock on the date of exercise and the date of grant multiplied by the number of SARs divided by the share price on the exercise date. During 2009, the Company purchased 12,146 shares from SAR holders upon the exercise of SARs in order for the holders to satisfy personal tax liabilities.2009,2012, and changes during the year then ended, is as follows:Stock appreciation rights Stock
appreciation
rights Weighted
average
exercise
price
average
remaining
contractual
term
intrinsic value 1,285,626 $ 21.40 569,064 22.34 (17,116 ) 12.40 (72,971 ) 21.42 1,764,603 $ 21.79 5.4 $ 5,090 1,221,112 $ 20.94 5.9 $ 4,004 507,136 $ 23.94 4.1 $ 961 Index to Financial StatementsStock appreciation rights Outstanding at January 1, 2012 2,305,049 $ 24.47 Granted 990,007 22.66 Exercised (246,383 ) 21.42 Forfeited (213,100 ) 26.91 Expired (48,745 ) $ 27.00 Outstanding at December 31, 2012 2,786,828 $ 23.87 5.2 $ 2,160 Unvested and expected to vest at December 31, 2012 1,545,181 $ 24.21 6.2 $ 565 Vested and exercisable at December 31, 2012 1,194,294 $ 23.39 3.8 $ 1,581 Blackbaud, Inc.Notes to consolidated financial statements—(Continued)20092012, 2011 and 2010 was $0.2 million. There were no SAR exercises prior to 2009.$2.4 million, $2.2 million and $1.4 million, respectively. The total fair value of SARs that vested during the year ended December 31, 20092012, 2011 and 20082010 was $3.1$3.9 million, $3.6 million and $1.1$3.6 million, respectively. Prior to 2008, there were no vested SARs. The weighted average grant date fair value of SARs granted for the years ended December 31, 2009, 20082012, 2011 and 20072010 was $7.38, $5.02$6.36, $8.10 and $9.17,$7.17, respectively. All outstanding SARs granted by the Company had a fair market value assigned at the grant date based on the use of the Black-Scholes option pricing model. All SARs granted with a market condition had a fair market value assigned at the grant date based on the use of a Monte Carlo simulation model. Significant assumptions used in the Black-Scholes option pricing model for SARs granted in 2009, 2008,2012, 2011 and 2007 are2010 were as follows: Years ended December 31, 2009 2008 2007 45 % 39% to 44 % 42% to 46% 1.7 % 1.5% to 1.7 % 1.3% to 1.4% 1.8 % 2.10% to 3.21 % 3.89% to 4.80% 4 4 3 to 4 Years ended December 31, 2012 2011 2010 Volatility 35% to 41% 41% to 42% 40% to 42% Dividend yield 1.7% 1.7% to 1.8% 1.6% to 1.8% Risk-free interest rate 0.5% to 0.6% 0.6% to 1.9% 0.9% to 1.9% Expected SAR life in years 4 4 4 determined by calculatingbased on the historical volatility for a number of comparable companiesour stock and calculating the average expected volatility over the expected life of the SAR. The dividend yield is based on the adopted dividend policy in effect at the time of grant.grant and the expectation of future dividends. The risk-free interest rate is based on United States Treasury rate for a term consistent with the expected life of the SAR at the time of grant. The expected life of the SAR represents the length of time from grant until the SAR is exercised based on experience.12.Stockholders’ equityThe Company’sThe Company’sthe Companyus that is in excess of operational needs and capital expenditures. The Company’sOur credit facility limits the amount of dividends payable and certain state laws restrict the amount of dividends distributed.2009:Declaration Date Dividend per Share Record Date Payable Date $ 0.10 February 27 March 13 $ 0.10 May 28 June 15 $ 0.10 August 28 September 15 $ 0.10 November 27 December 15 On 2012Declaration Date Dividend per Share Record Date Payable Date February 2012 $ 0.12 March 5 March 15 May 2012 $ 0.12 May 25 June 15 August 2012 $ 0.12 August 28 September 14 October 2012 $ 0.12 November 28 December 14 4, 2010, the Company’s2013, our Board of Directors declared a first quarter dividend of $0.11$0.12 per share payable on March 15, 20092013 to stockholders of record on February 26, 2010.Index to Financial StatementsBlackbaud, Inc..Notes to consolidated financial statements—(Continued)In May 2008, the Company’s Board of Directors approved new stock repurchase program that authorizes the Companyus to purchase up to $40.0$50.0 million of itsour outstanding shares of common stock. The prior program was terminated at that date and the remaining balance that was authorized but not used was included in the amount authorized under the new program. The new program does not have an expiration date. The shares can be purchased from time to time on the open market or in privately negotiated transactions depending upon market conditions and other factors.The Company accounts There were no shares purchased during the year ended December 31, 2009. The remaining amount available to purchase stock under the stock repurchase program was $30.8$50.0 million as of December 31, 2009.Stock surrenders.During the year ended December 31, 2009 and 2008, restricted stock and stock appreciation right holders surrendered 182,875 and 106,446 shares of common stock, totaling $3.8 million and $1.4 million, respectively, to satisfy their tax obligations due upon vesting of restricted stock and exercise of stock appreciation rights.Treasury stockThe following table sets forth the changes in treasury stock for the years ended December 31, 2009 and 2008:(in thousands, except shares) Plan date Shares Amount 5,431,852 $ 85,487 June 13, 2007 1,435,745 34,498 May 7, 2008 520,423 9,229 106,446 1,380 7,494,466 130,594 182,875 3,788 7,677,341 $ 134,382 13.Employee profit-sharing planThe Company hasWe have a 401(k) profit-sharing plan (401K(the 401K Plan) covering substantially all employees. Employees can contribute between 1% and 30% of their salaries in 2009, 20082012, 2011 and 20072010, and the Company matches we match 50% of qualified employees’ contributions up to 6% of their salary. The 401K Plan also provides for additional employer contributions to be made at the Company’sour discretion. Total matching contributions to the 401K Plan for the years ended December 31, 2009, 20082012, 2011 and 20072010 were $3.4$4.6 million $2.2, $4.0 million and $2.4$3.5 million, respectively. There was no discretionary contribution by the Companyus to the 401K Plan in 2009, 20082012, 2011 and 2007.2010. 14.Segment informationThe Company has determined that through December 31, 2009 it had six2012, our reportable segments basedwere as follows: the ECBU, the GMBU, the International Business Unit, or IBU, and Target Analytics. Following is a description of each reportable segment:the way that management organized operating resultsmarketing, sales, delivery and support to make operating decisionslarge and/or strategic, specifically identified prospects and customers in North America;assess financial performance. Internal financial reports disaggregated certain operating information into these six reportable segments. all emerging and mid-sized prospects and customers in North America;Index IBU is focused on marketing, sales, delivery and support to Financial StatementsBlackbaud, Inc.Notesall prospects and customers outside of North America; andconsolidated financial statements—(Continued)Company’sall prospects and customers in North America.itsour chief executive officer, or CEO. The CEO used thereviews financial information presented in these reports to makeon an operating segment basis for the purposes of making certain operating decisions.decisions and assessing financial performance. The CEO diduses internal financial reports that provide segment revenues and operating income, excluding stock-based compensation expense, amortization expense, depreciation expense, research and development expense and certain corporate sales, marketing, general and administrative expenses. Currently, the CEO believes that the exclusion of these costs allows for a better understanding of the operating performance of the operating units and management of other operating expenses and cash needs. The CEO does not review any report presenting segment balance sheet information. Therevenuesdisclosures for 2011 and direct controllable costs, which include salaries, related benefits, third-party contractors, data expense and classroom rentals,2010 to present the reportable segments on a consistent basis with the current year. Summarized reportable segment financial results for the years ended December 31, 2009, 20082012, 2011 and 20072010 were as follows:(in thousands) License
fees Consulting
and
education
services(1) Analytic
services(2) Maintenance Subscriptions Other Total $ 25,392 $ 65,342 $ 22,492 $ 116,476 $ 72,898 $ 6,738 $ 309,338 3,221 41,845 10,046 15,769 22,252 6,009 99,142 22,171 23,497 12,446 100,707 50,646 729 210,196 21,798 142,606 325 (220 ) $ 45,687 $ 35,932 $ 77,687 $ 23,137 $ 107,304 $ 49,705 $ 8,730 $ 302,495 3,070 44,392 9,881 15,334 15,677 8,279 96,633 32,862 33,295 13,256 91,970 34,028 451 205,862 19,783 138,678 1,000 194 $ 46,207 $ 37,569 $ 73,174 $ 18,202 $ 94,602 $ 25,389 $ 8,102 $ 257,038 2,717 38,778 8,009 13,382 7,837 7,164 77,887 34,852 34,396 10,193 81,220 17,552 938 179,151 14,590 112,154 351 503 $ 51,553 Year ended December 31, (in thousands) 2012 2011 2010 Revenue by segment: ECBU $ 165,161 $ 127,945 $ 104,764 GMBU 203,177 171,999 159,336 IBU 40,068 33,841 27,322 Target Analytics 37,453 35,769 33,313 1,560 1,314 1,830 Total revenue $ 447,419 $ 370,868 $ 326,565 ECBU $ 74,134 $ 53,141 $ 48,825 GMBU 121,120 101,572 91,827 IBU 5,755 6,922 7,883 Target Analytics 17,451 16,882 16,472 600 1,203 794 219,060 179,720 165,801 Less: 163,036 106,330 99,586 Stock-based compensation costs 19,240 14,884 13,059 Amortization expense 17,349 7,578 7,132 Interest expense (income), net 5,718 17 (10 ) Other expense (income), net 392 (346 ) 98 Income before provision for income taxes $ 13,325 $ 51,257 $ 45,936 (1) This segment consistsOther includes revenue and the related costs from the sale of consulting, installationproducts and implementation, document imaging, customer training and other educational services.services not directly attributable to an operating segment.(2) ThisSegment operating income includes direct, controllable costs related to the sale of products and services by the reportable segment, consists of donor prospect researchexcept for IBU, which includes operating costs from our foreign locations such as sales, marketing, general, administrative, depreciation and data modeling services.facilities costs.(3) VariousCorporate unallocated costs include research and development, depreciation expense, and certain corporate costs such as depreciation, facilitiessales, marketing, general and IT support costs, stock-based compensation and amortization of intangibles arising from business combinations are not allocated to the segment income as management believes that the exclusion of these costs allows the Company to better understand and manage other operating expenses and cash needs.administrative expenses.Index to Financial StatementsBlackbaud, Inc.Notes to consolidated financial statements—(Continued)The Companyderivesderive a portion of itsour revenue from itsour foreign operations. The following table presents revenue by geographic region based on country of invoice origin and identifiable, and long-lived assets by geographic region based on the location of the assets.(in thousands) United States Canada Europe Pacific Total $ 269,604 $ 13,793 $ 20,490 $ 5,451 $ 309,338 262,170 13,951 20,401 5,973 302,495 220,851 13,978 17,927 4,282 257,038 $ 21,570 $ 83 $ 662 $ 192 $ 22,507 20,738 50 419 177 21,384 (in thousands) United States Canada Europe Pacific Total Foreign Total Revenue from external customers: 2012 $ 386,376 $ 22,770 $ 23,022 $ 15,251 $ 61,043 $ 447,419 2011 317,305 21,725 21,162 10,676 53,563 370,868 2010 282,450 17,862 19,251 7,002 44,115 326,565 Property and equipment: December 31, 2012 $ 47,826 $ 188 $ 810 $ 239 $ 1,237 $ 49,063 December 31, 2011 33,255 106 772 264 1,142 34,397 the Companyus to identify itsour revenues by product category.Effective January 1, 2010, the Company reorganized its business into three operating units to better align its organization around key customer groups. The three operating units are the General Markets Business Unit, the Enterprise Customer Business Unitcategory and the International Business Unit. The Company will reflect this reorganization in the Form 10-Q for the period during which management organizes operatingtotal assets by segment.to make operating decisions and to assess financial performance based on the new operating unit structure.15.Quarterly results (unaudited)(in thousands, except per share data) September 30,
2009 December 31,
2009 $ 74,741 $ 76,415 $ 79,205 $ 78,977 44,463 45,919 48,664 49,352 7,762 10,841 13,883 13,306 7,238 10,639 13,960 13,850 4,072 6,588 9,828 7,959 $ 0.10 $ 0.15 $ 0.23 $ 0.18 $ 0.09 $ 0.15 $ 0.22 $ 0.18 (in thousands, except per share data) September 30,
2008 December 31,
2008 $ 69,436 $ 72,502 $ 80,098 $ 80,459 42,693 46,348 48,792 48,246 11,254 14,594 11,500 10,053 11,260 14,529 10,964 9,454 7,043 8,987 7,316 6,532 $ 0.16 $ 0.21 $ 0.17 $ 0.15 $ 0.16 $ 0.21 $ 0.17 $ 0.15 (in thousands, except per share data) December 31, 2012 September 30, 2012 June 30, 2012 March 31, 2012 Total revenue $ 120,051 $ 122,472 $ 110,190 $ 94,706 Gross profit 64,299 67,344 59,685 53,631 Income from operations 9,875 6,185 (1,877 ) 5,252 Income before provision for income taxes 7,342 4,629 (3,446 ) 4,800 Net income 3,270 2,825 (2,271 ) 2,759 Earnings per share Basic $ 0.07 $ 0.06 $ (0.05 ) $ 0.06 Diluted $ 0.07 $ 0.06 $ (0.05 ) $ 0.06 (in thousands, except per share data) December 31, 2011 September 30, 2011 June 30, 2011 March 31, 2011 Total revenue $ 95,045 $ 95,413 $ 93,782 $ 86,628 Gross profit 52,971 55,722 54,494 50,487 Income from operations 10,599 16,034 14,487 9,808 Income before provision for income taxes 10,760 15,923 14,688 9,886 Net income 6,351 10,214 9,362 7,293 Earnings per share Basic $ 0.15 $ 0.23 $ 0.22 $ 0.17 Diluted $ 0.14 $ 0.23 $ 0.21 $ 0.17 2.F-37 Total amount expected to be incurred Included in accrued expenses and other current liabilities at (in thousands) December 31, 2012 Employee severance costs $ 546 $ 137 Employee relocation costs 589 — Employee retention costs 152 38 $ 1,287 $ 175