UNITED STATES
SECURITIES AND EXCHANGE COMMISSION
WASHINGTON, D.C. 20549
FORM 10-K
| x | ANNUAL REPORT PURSUANT TO SECTION 13 OR 15(d) OF THE SECURITIES EXCHANGE ACT OF 1934 |
For the fiscal year ended December 31, 20092011
OR
| ¨ | TRANSITION REPORT PURSUANT TO SECTION 13 OR 15(d) OF THE SECURITIES EXCHANGE ACT OF 1934 |
For the transition period from to
Commission file number: 000-30110
SBA COMMUNICATIONS CORPORATION
(Exact name of Registrant as specified in its charter)
| Florida | 65-0716501 | |
(State or other jurisdiction of incorporation or organization) | (I.R.S. Employer Identification No.) |
5900 Broken Sound Parkway NW Boca Raton, Florida | 33487 | ||
| (Address of principal executive offices) | (Zip Code) | ||
Registrant’s telephone number, including area code (561) 995-7670
Securities registered pursuant to Section 12(b) of the Act:
Title of Each Class | Name of Each Exchange on Which Registered | |
| Class A Common Stock, $0.01 par value per share | The NASDAQ Stock Market LLC | |
| (NASDAQ Global Select Market) |
Securities registered pursuant to Section 12(g) of the Act:
None
Indicate by check mark if the registrant is a well-known seasoned issuer, as defined in Rule 405 of the Securities Act. Yes x No ¨
Indicate by check mark if the registrant is not required to file reports pursuant to Section 13 or Section 15(d) of the Exchange Act. Yes ¨ No x
Indicate by check mark whether the Registrant (1) has filed all reports required to be filed by Section 13 or 15(d) of the Securities Exchange Act of 1934 during the preceding 12 months (or for such shorter period that the Registrant was required to file such reports), and (2) has been subject to such filing requirements for the past 90 days. Yes x No ¨
Indicate by check mark whether the registrant has submitted electronically and posted on its corporate Web site, if any, every Interactive Data File required to be submitted and posted pursuant to Rule 405 of Regulation S-T during the preceding 12 months (or for such shorter period that the registrant was required to submit and post such files). Yes ¨x No ¨
Indicate by check mark if disclosure of delinquent filers pursuant to Item 405 of Regulation S-K is not contained herein, and will not be contained, to the best of Registrant’s knowledge, in definitive proxy or information statements incorporated by reference in Part III of this Form 10-K or any amendment to this Form 10-K. ¨
Indicate by check mark whether the Registrant is a large accelerated filer, an accelerated filer, a non-accelerated filer, or a smaller reporting company. See the definitions of “large accelerated filer,” “accelerated filer,” and “smaller reporting company” in Rule 12b-2 of the Exchange Act.
Large accelerated filer x Accelerated filer ¨ Non-Accelerated filer ¨ Smaller reporting company ¨
| Large accelerated filer | x | Accelerated filer | ¨ | |||
| Non-Accelerated filer | ¨ | Smaller reporting company | ¨ | |||
Indicate by check mark whether the registrant is a shell company (as defined in Rule 12b-2 of the Exchange Act) Yes ¨ No x
The aggregate market value of the voting stock held by non-affiliates of the Registrant was approximately $2.8$4.2 billion as of June 30, 2009.2011.
The number of shares outstanding of the Registrant’s common stock (as of February 24, 2010)16, 2012): Class A common stock —117,719,254– 109,734,800 shares
Documents Incorporated By Reference
Portions of the Registrant’s definitive proxy statement for its 20102012 annual meeting of shareholders, which proxy statement will be filed no later than 120 days after the close of the Registrant’s fiscal year ended December 31, 2009,2011, are hereby incorporated by reference in Part III of this Annual Report on Form 10-K.
| Page | ||||||||
PART I | ||||||||
ITEM 1. | 1 | |||||||
ITEM 1A. | ||||||||
| 10 | |||||||
ITEM 2. | 22 | |||||||
ITEM 3. | 22 | |||||||
ITEM 4. | MINE SAFETY DISCLOSURES | 22 | ||||||
ITEM 5. | 23 | |||||||
ITEM 6. | 25 | |||||||
ITEM 7. | MANAGEMENT’S DISCUSSION AND ANALYSIS OF FINANCIAL CONDITION AND RESULTS OF OPERATIONS | 27 | ||||||
ITEM 7A. | 51 | |||||||
ITEM 8. | 54 | |||||||
ITEM 9. | CHANGES IN AND DISAGREEMENTS WITH ACCOUNTANTS ON ACCOUNTING AND FINANCIAL DISCLOSURE | 54 | ||||||
ITEM 9A. | 54 | |||||||
ITEM 9B. | 57 | |||||||
ITEM 10. | 57 | |||||||
ITEM 11. | 57 | |||||||
ITEM 12. | SECURITY OWNERSHIP OF CERTAIN BENEFICIAL OWNERS AND MANAGEMENT AND RELATED STOCKHOLDER MATTERS | 57 | ||||||
ITEM 13. | CERTAIN RELATIONSHIPS AND RELATED TRANSACTIONS, AND DIRECTOR INDEPENDENCE | 57 | ||||||
ITEM 14. | 57 | |||||||
ITEM 15. | 58 | |||||||
| 62 | ||||||||
General
We are a leading independent owner and operator of wireless communications towers. Our principal operations are in the continental United States.States and its territories. In addition, we haveown and operate towers in Canada, Puerto RicoCosta Rica, El Salvador, Guatemala, Nicaragua and the U.S. Virgin Islands.Panama. Our principalprimary business line is our site leasing business, which contributed 97.4%97.8% of our total segment operating profit for the year ended December 31, 2009.2011. In our site leasing business, we lease antenna space primarily to wireless service providers on towers and other structures that we own, manage or lease from others. The towers that we own have been constructed by us at the request of a wireless service provider, built or constructed based on our own initiative or acquired. As of December 31, 2009,2011, we owned 8,32410,524 tower sites, the substantial majority of which have been built by us or built by other tower owners or operators who, like us, have built such towers to lease space to multiple wireless service providers. We also managemanaged or leaseleased approximately 5,1004,800 actual or potential communications sites, approximately 550500 of which were revenue producing as of December 31, 2009.2011. Our other business line is our site development business, through which we assist wireless service providers in developing and maintaining their own wireless service networks.
Site Leasing Services
Our primary focus is the leasing of antenna space on our multi-tenant towers to a variety of wireless service providers under long-term lease contracts.contracts in the United States, Canada and Central America. Site leasing revenues are received primarily from wireless service provider tenants, including AT&T, Sprint, Verizon Wireless, T-Mobile, Digicel, Claro, and Verizon Wireless.Telefonica. Wireless service providers enter into numerous different tenant leases with us, each of which relates to the lease or use of space at an individual tower site. TenantIn the United States and Canada our tenant leases are generally for an initial term of five years with five 5-year renewal periods at the option of the tenant. These tenant leases typically contain specific rent escalators, which average 3%–4%3-4% per year, including the renewal option periods. Tenant leases in our Central America markets typically have an initial term of 10 years with 5-year renewal periods, and similar rent escalators to that of leases in the United States and Canada.
We expand our tower portfolio, both domestically and internationally, through the construction of new towers, or new builds, and through the acquisition of towers from third parties. In our new build program, we construct towers in locations that were strategically chosen by us or under build-to-suit arrangements. Under build-to-suit arrangements, we build towers for wireless service providers at locations that they have identified. We retain ownership of the tower and the exclusive right to co-locate additional tenants on the tower. When we construct towers in locations chosen by us, we utilize our knowledge of our customers’ network requirements to identify locations where we believe multiple wireless service providers need, or will need, to locate antennas to meet capacity or service demands. We seek to identify attractive locations for new towers and complete pre-construction procedures necessary to secure the site concurrently with our leasing efforts. We intend togenerally will have at least one signed tenant lease onfor each new build tower on the day that it is completed and expect that some will have multiple tenants. WeDuring 2012, we intend to build at least 120 - 140between 415 and 435 new towers, during 2010.domestically and internationally.
In our tower acquisition program, we pursue towers that meet or exceed our internal guidelines regarding current and future potential returns. For each acquisition, we prepare various analyses that include projections of a five-year unlevered internal rate of return, review of available capacity, future lease up projections and a summary of current and future tenant/technology mix.
The table below provides information regarding the development and status of our tower sites portfolio over the past three years.
| For the year ended December 31, | |||||||||||||||||||||
| For the year ended December 31, | 2009 | 2010 | 2011 | ||||||||||||||||||
| 2007 | 2008 | 2009 | |||||||||||||||||||
Towers owned at beginning of period | 5,551 | 6,220 | 7,854 | 7,854 | 8,324 | 9,111 | |||||||||||||||
Towers acquired(1) | 612 | 1,560 | 376 | ||||||||||||||||||
Towers acquired | 376 | 712 | 1,085 | ||||||||||||||||||
Towers constructed | 61 | 85 | 101 | 101 | 124 | 388 | |||||||||||||||
Towers reclassified/disposed of(2) | (4 | ) | (11 | ) | (7 | ) | |||||||||||||||
Towers reclassified/disposed of(1) | (7 | ) | (49 | ) | (60 | ) | |||||||||||||||
|
|
| |||||||||||||||||||
Towers owned at end of period | 6,220 | 7,854 | 8,324 | 8,324 | 9,111 | 10,524 | |||||||||||||||
|
|
| |||||||||||||||||||
| (1) |
| Reclassifications reflect the combination for reporting purposes of multiple tower structures on a single parcel of real estate, which we market and customers view as a single location, into a single owned tower site. Dispositions reflect the decommissioning, sale, conveyance or other legal transfer of owned tower sites. |
As of December 31, 2009,2011, we had an average of 2.52.3 tenants per tower.
Our site leasing business generates substantially all of our total segment operating profit. Our site leasing business generated 85.9%88.3% of our total revenues during the past year ended December 31, 2011 and has represented 95.5%97.4% or more of our total segment operating profit for the past three years. For the year ended December 31, 2011, site leasing revenues generated outside the U.S. and its territories were less than 4% of total revenue.
International Operations
We believe that we can create substantial value by expanding our site leasing services into select international markets which we believe have a high-growth wireless industry and relatively stable political and regulatory environment. We currently own 1,330 towers in Canada, Costa Rica, El Salvador, Guatemala, Nicaragua and Panama, and intend to continue expanding in these and other international markets. These international markets typically have less mature wireless networks with limited wireline infrastructure and wireless data penetration. Accordingly, our expansion in these markets is primarily driven by (i) wireless service providers seeking to increase the quality and coverage of their networks in developing countries, (ii) consumers’ increased use of high data applications, such as email, internet access and video, and (iii) recent spectrum auctions, which have resulted in new market entrants, as well as initial data network deployments. For example, we expect a meaningful build-out of our new towers and communication sites in Costa Rica as a result of recent spectrum auctions in that country. We expect to continue expanding internationally through buying or building towers, managing communication sites and leasing space to wireless service providers on assets we control.
We consider various factors when identifying a market for our international expansion, including:
| • | Country analysis – We consider the country’s political stability, and whether the country’s general business, legal and regulatory environment is conducive to the sustainability and growth of our business. |
| • | Market potential – We analyze the expected demand for wireless services, and whether a country has multiple wireless service providers who are actively seeking to invest in deploying voice and data networks, as well as spectrum auctions that have occurred or that are anticipated to occur. |
| • | Risk adjusted return criteria – We consider whether buying or building towers in a country, and providing our management and leasing services, will meet our return criteria. As part of this analysis, we consider the risk of entering into an international market, and how our expansion meets our long-term strategic objectives for the region and our business generally. |
Site Development Services
Our site development business is complementary to our site leasing business and provides us the ability to keep in close contact with the wireless service providers who generate substantially all of our site leasing revenue and to capture ancillary revenues that are generated by our site leasing activities, such as antenna and equipment installation at our tower locations. Our site development business is conducted in the United States only and consists of two segments, site development consulting and site development construction. Site development services revenues are received primarily from providing a full range of end to end services to wireless service providers or companies providing development or project management services to wireless service providers. We principally perform services for third parties in our core historical areas of wireless expertise, specifically, site acquisition, zoning, technical services and construction.
In the consulting segment of our site development business, we offer clients the following range of services: (1) network pre-design; (2) site audits; (3) identification of potential locations for towers and antennas; (4) support in buying or leasing of the location; and (5) assistance in obtaining zoning approvals and permits. In the construction segment of our site development business we provide a number of services, including, but not limited to the following: (1) tower and related site construction; (2) antenna installation; and (3) radio equipment installation, commissioning and maintenance. Personnel in our site development business also supportidentify new business opportunities and provide market intelligence for our leasing and new tower build functions through an integrated plan across the divisions.functions.
We provide our site development consulting and construction services on a local basis, through regional offices, territory offices and project offices. The regional offices are responsible for all site development operations, including hiring employees and opening or closing project offices, and a substantial portion of the sales in such area.
For financial information about our operating segments, please see Note 2322 of our Consolidated Financial Statements included in this Form 10-K.
Industry Overview
We believe that growing wireless traffic the(particularly data and video), successful recent spectrum auctions and technology developments will require wireless service providers to improve their network infrastructure and increase their network capacity resulting in an increase in the number of communication sites that they use or the number of antennas at existing communication sites. First, consumersThe following is a discussion of certain growth trends in the wireless communications industry:
We believe that our customers’ introduction and continued deployment of next generation wireless technologies including (i) 3G wireless services and (ii) 4G wireless services, such as long-term evolution, or LTE, and WiMAX, will require our customers to add a large number of additional cell sites and increase the amount of their equipment at current cell sites.
The Federal Communications Commission’s (the “FCC”) successful spectrum auction 73 during 2008 relating to the auction of the 700 MHz band, have provided existing carriers the opportunity to deploy spectrum for 4G wireless service which has and will continue to drive the demand for communication sites. Our largest customers, AT&T, Verizon and Sprint, are in the midst of nation-wide upgrades of their wireless networks to these next generation technologies. In addition, Congress has recently been discussing granting the FCC additional incentive auction authority as well as reallocating the D-block of 700 MHz spectrum to public safety for the development of a nation-wide public safety network. We believe that all of these factors will drive additional demand for communication sites.
Consumer demand for high quality, wireless services continues to increase minutes of use, whether throughdue to data application expansion, continued strong voice demand, and continued wireline to wireless migration, increasing usemigration. The constant increase in quantity and type of broadband services, new data products or simply talking more.applications including social networking and gaming, among other categories, is a major factor in these increases. Consumers are demanding quality wireless networks, and list network coverage and quality as two of the greatest contributors to their dissatisfaction when terminating or changing service. To decrease subscriber churn rate and drive revenue growth, wireless carriers have made substantial capital expenditures on wireless networks to improve service quality and expand coverage. Second, we expect that the roll-out of 3G and 4G wireless services by existing carriers will require our customers to add a large number of additional cell sites and increase the amount of their equipment at current cell sites. The Federal Communications Commission’s (the “FCC”) successful advanced wireless service spectrum auction 66 for advanced broadband services and the more recent FCC spectrum auction 73, relating to the auction of the 700 MHz band, have provided existing carriers the opportunity to deploy spectrum for 3G and 4G wireless service which will further drive the demand for communication sites. Finally, the third area of growth in the U.S. market comes from new market launches for emerging carriers in traditional wireless services or new technologies like WiMAX. For example, Leap Wireless and Metro PCS acquired spectrum in auction 66 in new coverage areas that have led and continue to lead to the launch of brand new networks while Clearwire is in the process of building out new markets as well.
Despite the currentrecent recessionary conditions affecting the global marketplace, based on these factors, we believe that the U.S. wireless industry will continue to grow and is well-capitalized, highly competitive and focused on quality and advanced services. Therefore, we expect that we will see a multi-year trend of strong additional cell site demand from our customers, which we believe will translate into strong leasing growth for us.
Business Strategy
Our primary strategy is to capture the maximum benefits from our position as a leading owner and operator of wireless communications towers. Key elements of our strategy include:
Focusing on our Site Leasing Business with Stable, Recurring Revenues.We intend to continue to focus on expanding our site leasing business due to its attractive characteristics such as long-term contracts, built-in rent escalators, high operating margins and low customer churn. The long-term nature of the revenue stream of our site leasing business makes it less volatile than our site development business, which is more cyclical. By focusing on our site leasing business, we believe that we can maintain a stable, recurring cash flow stream and reduce our exposure to cyclical changes in customer spending. Key elements of our strategy include:
Maximizing Use of Tower Capacity. We generally have constructed or acquired towers that accommodate multiple tenants and a substantial majority of our towers are high capacity lattice or guyed towers. Most of our towers have significant capacity available for additional antennas and we believe that increased use of our towers can be achieved at a low incremental cost. We actively market space on our towers through our internal sales force.
Disciplined Growth of our Tower Portfolio.During 2010,2012, we intend to grow our tower portfolio, domestically and internationally, by 5%through the consummation of the Mobilitie transaction, additional tower acquisitions and the construction of between 415 to 10%. We435 new towers. In connection with our international expansion, we have targeted select international markets that we believe have relatively stable political environments and a growing wireless communication industry.We intend to use our available cash from operating activities and available liquidity, including borrowings, to build and/or acquire new towers at prices that we believe will be
accretive to our shareholders both short and long term and which allow us to maintain our long-term target leverage ratios. Furthermore, we believe that our tower operations are highly scalable. Consequently, we believe that we are able to materially increase our tower portfolio without proportionately increasing selling, general and administrative expenses.
Capitalizing on our Scale and Management Experience.We are a large owner, operator and developer of tower and other communication sites, with substantial capital, human and operating resources. We have been developing communication sites for wireless service providers in the U.S. since 1989 and owned and operated tower sites for ourselves since 1997. We believe our size, experience, capabilities and resources make us a preferred partner for wireless service providers both in the U.S. and internationally. Our management team has extensive experience in site leasing and site development, with some of the longest tenures in the tower and site development industries. Management believes that its industry expertise and strong relationships with wireless service providers will allow us to expand our position as a leading provider of site leasing and site development services.
Controlling our Underlying Land Positions. We have purchased and intend to continue to purchase and/or enter into long-term leases for the land that underlies our towers, to the extent available at commercially reasonable prices. We believe that these purchases and/or long-term leases will increase our margins, improve our
cash flow from operations and minimize our exposure to increases in ground lease rents in the future. As ofFor the quarter ended December 31, 2009,2011, approximately 70.0% of our tower sites were located on land that we own or control for a minimum period of fifty years, landmore than 20 years. The average remaining life under 27.6% of our communication sites.ground leases, including renewal options under our control, has been extended to 33 years.
Using our Local Presence to Build Strong Relationships with Major Wireless Service Providers. Given the nature of towers as location specific communications facilities, we believe that substantially all of what we do is done best locally. Consequently, we have a broad field organization that allows us to develop and capitalize on our experience, expertise and relationships in each of our local markets which in turn enhances our customer relationships. We are seeking to replicate this expertise internationally. Due to our presence in local markets, we believe we are well positioned to capture additional site leasing business and new tower build opportunities in our markets and identify and participate in site development projects across our markets.
Capitalizing on our Management Experience. Our management team has extensive experience in site leasing and site development. Management believes that its industry expertise and strong relationships with wireless service providers will allow us to expand our position as a leading provider of site leasing and site development services.
Customers
Since commencing operations, we have performed site leasing and site development services for all of the large U.S. wireless service providers. In both our site development and site leasing businesses, we work with large national providers and smaller regional, local or private operators.
We depend on a relatively small number of customers for our site leasing and site development revenues. The following customers represented at least 10% of our total revenues during at least one of the last three years:
| Percentage of Total Revenues | |||||||||
| for the year ended December 31, | |||||||||
| 2007 | 2008 | 2009 | |||||||
AT&T(1) | 22.9 | % | 23.1 | % | 23.8 | % | |||
Sprint(2) | 32.6 | % | 25.0 | % | 21.9 | % | |||
Verizon Wireless(3) | 13.6 | % | 15.6 | % | 15.4 | % | |||
T-Mobile | 7.5 | % | 11.2 | % | 13.7 | % | |||
| Percentage of Total Revenues For the year ended December 31, | ||||||||||||
| 2009 | 2010 | 2011 | ||||||||||
AT&T | 23.8 | % | 23.9 | % | 23.8 | % | ||||||
Sprint | 21.9 | % | 20.4 | % | 19.8 | % | ||||||
Verizon Wireless | 15.4 | % | 14.8 | % | 14.8 | % | ||||||
T-Mobile | 13.7 | % | 11.6 | % | 10.7 | % | ||||||
During the past two years, we provided services for a number of customers, including:
| Leap Wireless | |||||
| AT&T | M/A-COM | |||||
| Barrett Xplore | Metro PCS | |||||
| Bechtel Corporation | Nokia-Siemens | |||||
| Bell Canada | Nortel | ||||
| Cellular South | Nsoro Mastec, LLC | |||||
| Claro | Ntelos | |||||
| ||||||
| ||||||
| ||||||
| ||||||
| Sprint | |||||
| Cox Communications | Telus | ||||
| Digicel | Telefonica | |||||
| Ericsson | T-Mobile | |||||
| General Dynamics | U.S. Cellular | ||||
| ITT Corporation | Verizon Wireless | ||||
|
Sales and Marketing
Our sales and marketing goals are to:
use existing relationships and develop new relationships with wireless service providers to lease antenna space on and sell related services with respect to our owned or managed towers, enabling us to grow our site leasing business; and
successfully bid and win those site development services contracts that will contribute to our operating margins and/or provide a financial or strategic benefit to our site leasing business.
We approach sales on a company-wide basis, involving many of our employees. We have a dedicated sales force that is supplemented by members of our executive management team. Our dedicated salespeople are based regionally as well as in the corporate office. We also rely on our regional vice presidents, general managers and other operations personnel to sell our services and cultivate customers. Our strategy is to delegate sales efforts to those employees of ours who have the best relationships with our customers. Most wireless service providers have national corporate headquarters with regional and local offices. We believe that wireless service providers make most decisions for site development and site leasing services at the regional and local levels with input from their
corporate headquarters. Our sales representatives work with wireless service provider representatives at the regional and local levels and at the national level when appropriate. Our sales staff compensation is heavily weighted to incentive-based goals and measurements.
Our primary marketing and sales support is centralized and directed from our headquarters office in Boca Raton, Florida and is supplemented by our regional and territory offices. We have a full-time staff dedicated to our marketing and sales efforts. The marketing and sales support staff is charged with implementing our marketing strategies, prospecting and producing sales presentation materials and proposals. In addition to our marketing and sales staff, we rely upon our executive and operations personnel at the regional and local office levels to identify sales opportunities within existing customer accounts.
Competition
Site Leasing – Our primary competitors for our site leasing activities are (1) the national independent tower companies including American Tower Corporation, Crown Castle International and Global Tower Partners, (2) a large number of regional independent tower owners, (3) wireless service providers that own and operate their own towers and lease, or may in the future decide to lease, antenna space to other providers, and (4) alternative facilities such as rooftops, outdoor and indoor distributed antenna system (“DAS”) networks, billboards and electric transmission towers. There has been significant consolidation among the large independent tower companies in the past five years. Specifically, American Tower completed its merger with SpectraSite, Inc. in 2005, we completed our acquisition of AAT Communications Corporation in 2006 and Crown Castle completed its merger with Global Signal, Inc. in 2007. As a result of these consolidations,several large mergers and acquisitions, American Tower and Crown Castle have substantially more towers and greater financial resources than we do. Wireless service providers that own and operate their own tower networks are also generally larger and have greater financial resources than we do. We believe that tower location and capacity, quality of service to our tenants, and, to a lesser extent, price have been and will continue to be the most significant competitive factors affecting the site leasing business. Internationally, to date, the competition we have encountered has been from both independent tower companies and wireless service providers that own and operate their own tower networks. In our markets outside the U.S. and its territories, the majority of existing towers are owned by wireless service providers.
Site Development – The site development business is extremely competitive and price sensitive. We believe that the majority of our competitors in the U.S. site development business operate within local market areas exclusively, while some firms appear to offer their services nationally, including Bechtel Corporation, Black & Veatch Corporation, Goodman Networks, General Dynamics Corporation, Nsoro, and Wireless Facilities, Inc.Nsoro. The market includes participants from a variety of market segments offering individual, or combinations of, competing services. The field of competitors includes site development consultants, zoning consultants, real estate firms, right-of-way
consulting firms, construction companies, tower owners/managers, radio frequency engineering consultants, telecommunications equipment vendors, which provide end-to-end site development services through multiple subcontractors, and wireless service providers’ internal staff. We believe that providers base their decisions for site development services on a number of criteria, including: company experience, price, track record, local reputation, geographic reach and time for completion of a project.
Employees
Our executive, corporate development, accounting, finance, human resources, legal and regulatory, information technology and site administration personnel, and our network operations center, are located in our headquarters in Boca Raton, Florida. Certain sales, new tower build support and tower maintenance personnel are also located in our Boca Raton office. Our remaining employees are based in our regional and local offices.
As of December 31, 2009,2011, we had 617814 employees, none of whom are represented by a collective bargaining agreement. Of these 814 employees, 87 were based outside of the U.S. and its territories. We consider our employee relations to be good.
Regulatory and Environmental Matters
Federal Regulations.Both the FCC and the Federal Aviation Administration (the “FAA”) regulate antenna towers and structures that support wireless communications and radio or television antennas. Many FAA requirements are implemented in FCC regulations. These regulations govern the construction, lighting and painting or other marking of towers and structures and may, depending on the characteristics of particular towers or structures, require prior approval and registration of towers or structures before they may be constructed, altered or used. Wireless communications equipment and radio or television stations operating on towers or structures are separately regulated and may require independent customer licensing depending upon the particular frequency or frequency band used. In addition, any applicant for an FCC antenna tower or structure registration must certify that, consistent with the Anti-Drug Abuse Act of 1988, neither the applicant nor its principals are subject to a denial of Federal benefits because of a conviction for the possession or distribution of a controlled substance.
Pursuant to the requirements of the Communications Act of 1934, as amended, the FCC, in conjunction with the FAA, has developed standards to consider proposals involving new or modified antenna towers or structures. These standards mandate that the FCC and the FAA consider the height of the proposed tower or structure, the relationship of the tower or structure to existing natural or man-made obstructions and the proximity of the tower or structure to runways and airports. Proposals to construct or to modify existing towers or structures above certain heights must be reviewed by the FAA to ensure the structure will not present a hazard to air navigation. The FAA may condition its issuance of a no-hazard determination upon compliance with specified lighting and/or painting requirements. Antenna towers that meet certain height and location criteria must also be registered with the FCC. A tower or structure that requires FAA clearance will not be registered by the FCC until it is cleared by the FAA. Upon registration, the FCC may also require special lighting and/or painting. Owners of wireless communications antenna towers and structures may have an obligation to maintain painting and lighting or other marking in conformance with FAA and FCC regulations. Antenna tower and structure owners and licensees that operate on those towers or structures also bear the responsibility of monitoring any lighting systems and notifying the FAA of any lighting outage or malfunction.
Owners and operators of antenna towers and structures may be subject to, and therefore must comply with, environmental laws. Any licensed radio facility on an antenna tower or structure is subject to environmental review pursuant to the National Environmental Policy Act of 1969, among other statutes, which requires federal agencies to evaluate the environmental impact of their decisions under certain circumstances. The FCC has issued regulations implementing the National Environmental Policy Act. These regulations place responsibility on
applicants to investigate potential environmental effects of their operations and to disclose any potential significant effects on the environment in an environmental assessment prior to constructing or modifying an antenna tower or structure and prior to commencing certain operations of wireless communications or radio or television stations from the tower or structure. In the event the FCC determines the proposed structure or operation would have a significant environmental impact based on the standards the FCC has developed, the FCC would be required to prepare an environmental impact statement, which will be subject to public comment. This process could significantly delay the registration of a particular tower or structure.
We generally indemnify our customers against any failure to comply with applicable regulatory standards relating to the construction, modification, or placement of antenna towers or structures. Failure to comply with the applicable requirements may lead to civil penalties.
The Telecommunications Act of 1996 amended the Communications Act of 1934 by preserving state and local zoning authorities’ jurisdiction over the construction, modification and placement of towers. The law, however, limits local zoning authority by prohibiting any action that would discriminate among different providers of personal wireless services or ban altogether the construction, modification or placement of radio communication towers. Finally, the Telecommunications Act of 1996 requires the federal government to help licensees for wireless communications services gain access to preferred sites for their facilities. This may require
that federal agencies and departments work directly with licensees to make federal property available for tower facilities.
As an owner and operator of real property, we are subject to certain environmental laws that impose strict, joint and several liability for the cleanup of on-site or off-site contamination and related personal or property damage. We are also subject to certain environmental laws that govern tower or structure placement, including pre-construction environmental studies. Operators of towers or structures must also take into consideration certain radio frequency (“RF”) emissions regulations that impose a variety of procedural and operating requirements. Certain proposals to operate wireless communications and radio or television stations from antenna towers and structures are also reviewed by the FCC to ensure compliance with requirements relating to human exposure to RF emissions. Exposure to high levels of RF energy can produce negative health effects. The potential connection between low-level RF energy and certain negative health effects, including some forms of cancer, has been the subject of substantial study by the scientific community in recent years. We believe that we are in substantial compliance with and we have no material liability under any applicable environmental laws. These costs of compliance with existing or future environmental laws and liability related thereto may have a material adverse effect on our prospects, financial condition or results of operations.
State and Local Regulations.Most states regulate certain aspects of real estate acquisition, leasing activities and construction activities. Where required, we conduct the site acquisition portions of our site development services business through licensed real estate brokers’ agents, who may be our employees or hired as independent contractors, and conduct the construction portions of our site development services through licensed contractors, who may be our employees or independent contractors. Local regulations include city and other local ordinances, zoning restrictions and restrictive covenants imposed by community developers. These regulations vary greatly from jurisdiction to jurisdiction, but typically require tower and structure owners to obtain approval from local officials or community standards organizations, or certain other entities prior to tower or structure construction and establish regulations regarding maintenance and removal of towers or structures. In addition, many local zoning authorities require tower and structure owners to post bonds or cash collateral to secure their removal obligations. Local zoning authorities generally have been unreceptive to construction of new antenna towers and structures in their communities because of the height and visibility of the towers or structures, and have, in some instances, instituted moratoria.
International. Regulatory regimes outside of the U.S. and its territories vary by country and locality, however these regulations typically require tower owners and/or licensees to obtain approval from local officials or
government agencies prior to tower construction or the addition of a new antenna to an existing tower. Based on our experience to date, these regimes have been similar to, but not more rigorous, burdensome or comprehensive than, those in the U.S. Our international operations are also subject to various regulations and guidelines regarding employee relations and other occupational health and safety matters. As we expand our operations into additional international geographic areas, we will be subject to regulations in these jurisdictions.
Backlog
Backlog related to our site leasing business consists of lease agreements and amendments, which have been signed, but have not yet commenced. As of December 31, 2009,2011, we had 344251 new leases which had been executed with customers but which had not begun generating revenue. These leases will contractually provide for approximately $7.6$5.1 million of annual revenue. By comparison, atas of December 31, 20082010, we had 338253 new leases which had been executed with customers but which had not begun generating revenue. These leases contractually provided for approximately $6.7$4.9 million of annual revenue.
Our backlog for site development services consists of the value of work that has not yet been completed on executed contracts. As of December 31, 2009,2011, we had approximately $13.9$14.5 million of contractually committed revenue as compared to approximately $17.4$17.8 million as of December 31, 2008.2010.
Availability of Reports and Other Information
SBA Communications Corporation was incorporated in the State of Florida in March 1997. Our corporate website iswww.sbasite.com. We make available, free of charge, access to our Annual Report on Form 10-K, Quarterly Reports on Form 10-Q, Current Reports on Form 8-K, Proxy Statement on Schedule 14A and amendments to those materials filed or furnished pursuant to Section 13(a) or 15(d) of the Securities and Exchange Act of 1934, as amended, on our website under “Investor Relations—Relations – SEC Filings,” as soon as reasonably practicable after we file electronically such material with, or furnish it to, the United States Securities and Exchange Commission (the “Commission”). In addition, the Commission’s website iswww.sec.gov. The Commission makes available on this website, free of charge, reports, proxy and information statements, and other information
regarding issuers, such as us, that file electronically with the Commission. Additionally, our reports, proxy and information statements may be read and copied at the Commission’s public reference room at 100 F Street, NE, Washington, DC 20549 during the hours of 10 a.m. to 3 p.m. on official business days. Information regarding the operation of the public reference room may be obtained by calling the Commission at 1-800-SEC-0330. Information on our website or the Commission’s website is not part of this document.
Risks Related to Our Business
If our wireless service provider customers combine their operations to a significant degree, our future operating results and our ability to service our indebtedness could be adversely affected.
Significant consolidation among our wireless service provider customers may result in our customers failing to renew existing leases for tower space or reducing future capital expenditures in the aggregate because their existing networks and expansion plans may overlap or be very similar. For example, inIn connection with the combinations of Verizon Wireless and ALLTEL (to form Verizon Wireless), Cingular and AT&T Wireless (to form AT&T Mobility) and Sprint PCS and Nextel (to form Sprint Nextel), the combined companies have or are considering rationalizingrationalized and may continue to rationalize duplicative parts of their networks, which has led and may continue to lead to the non-renewal of certain leases on our towers. Furthermore, to the extent that otherIf our wireless service providersprovider customers continue to consolidate as a result of, among other factors, limited wireless spectrum for commercial use in the future, they may not renew any duplicative leases that they have on our towers and/or may not lease as much space on our towers in the future. If these consolidationsU.S., this consolidation could significantly impact the number of tower leases that are not renewed or the number of new leases that theour wireless service providersprovider customers require to expand their network,networks, which could materially and adversely affect our future operating resultsresults.
A slowdown in demand for wireless communications services or for tower space could materially and adversely affect our ability to service our indebtedness could be adversely affected.future growth and revenues
Similar consequences may occur ifIf wireless service providers engagesubscribers significantly reduce their minutes of use, or fail to widely adopt and use wireless data applications, our wireless service provider customers would experience a decrease in extensivedemand for their services. Regardless of consumer demand, each wireless service customer must have substantial capital resources and capabilities to build out their wireless networks. Certain wireless carriers that currently own nationwide spectrum positions have announced the intention to build nationwide networks, but have also announced that they do not have all of the necessary financing in place to complete such networks. In addition, our wireless service customers have engaged in increased use of network sharing, or roaming or resale arrangements as an alternative to leasingarrangements. As a result of all of the above, wireless carriers may scale back their business plans or otherwise reduce their spending, which could materially and adversely affect demand for our antenna space. Wireless voice service providers frequently enter into roaming agreements with competitors allowing them to use another’stower space and our wireless communications facilities to accommodate customers who are out of range of their home provider’s services. Wireless voice service providers may view these roaming agreements as a superior alternative to leasing antenna space on communication sites owned or controlled by us or others. The proliferation of these roaming agreementsservices business, which could have a material adverse effect on our business, results of operations and financial condition.
We have a substantial level of indebtedness which may have an adverse effect on our business or limit our ability to take advantage of business, strategic or financing opportunities.
As indicated below, we have and will continue to have a significant amount of indebtedness relative to our equity. The following table sets forth our total principal amount of debt and shareholders’ equity as of December 31, 2010 and 2011.
| As of December 31, | ||||||||
| 2010 | 2011 | |||||||
| (in thousands) | ||||||||
Total principal amount of indebtedness | $ | 3,050,000 | $ | 3,512,500 | ||||
Shareholders’ (deficit) equity | $ | 317,110 | $ | (11,313 | ) | |||
Our substantial level of indebtedness increases the possibility that we may be unable to generate cash sufficient to pay the principal, interest or other amounts when due. Subject to certain restrictions under our existing indebtedness, we and our subsidiaries may also incur significant additional indebtedness in the future, revenue.some of which may be secured debt. This may have the effect of increasing our total leverage.
As a consequence of our indebtedness, (1) demands on our cash resources may increase, (2) we are subject to restrictive covenants that further limit our financial and operating flexibility and (3) we may choose to institute self-imposed limits on our indebtedness based on certain considerations including market interest rates, our relative leverage and our strategic plans. For example, as a result of our substantial level of indebtedness and the uncertainties arising in the credit markets and the U.S. economy:
If we are unable to refinance our debt, we cannot guarantee that we will generate enough cash flow from operations or that we will be able to obtain enough capital to service our debt obligations and fund our planned capital expenditures. In such event, we might need to sell certain assets or lines of business, issue common stock or securities convertible into common stock to fulfill our debt obligations. If implemented , these actions could negatively impact our business or dilute our existing shareholders.
we may be more vulnerable to general adverse economic and industry conditions;
we may find it more difficult to obtain additional financing to fund future working capital, capital expenditures and other general corporate requirements that would be in our best long-term interests;
we may be required to dedicate a substantial portion of our cash flow from operations to the payment of principal and interest on our debt, reducing the available cash flow to fund other investments, including tower acquisition and new build capital expenditures;
we may have limited flexibility in planning for, or reacting to, changes in our business or in the industry;
we may have a competitive disadvantage relative to other companies in our industry that are less leveraged; and
we may be required to sell debt or equity securities or sell some of our core assets, possibly on unfavorable terms, in order to meet payment obligations.
These restrictions could have a material adverse effect on our business by limiting our ability to take advantage of financing, new tower development, mergers and acquisitions or other opportunities.
In addition, fluctuations in market interest rates may increase interest expense relating to our floating rate indebtedness, which we expect to incur under our Revolving Credit Facility and Term Loan, and may make it difficult to refinance our existing indebtedness at a commercially reasonable rate or at all. There is no guarantee that the future refinancing of our indebtedness will have fixed interest rates or that interest rates on such indebtedness will be equal to or lower than the rates on our current indebtedness.
We depend on a relatively small number of customers for most of our revenue, therefore ifand the loss, consolidation or financial instability of any of our significant customers reduced their demand for tower space or became financially unstable it may materially decrease our revenues.
We derive a significant portion of our revenue from a small number of customers. The loss of any one of our significant customers, as a result of bankruptcy, merger with other customers of ours or otherwise, could materially decrease our revenue and have an adverse effect on our growth.
The following is a list of significant customers (representing at least 10% of revenue in any of the last three years) and the percentage of our total revenues for the specified time periods derived from these customers:
| Percentage of Total Revenues | |||||||||
| for the year ended December 31, | |||||||||
| 2007 | 2008 | 2009 | |||||||
AT&T(1) | 22.9 | % | 23.1 | % | 23.8 | % | |||
Sprint(2) | 32.6 | % | 25.0 | % | 21.9 | % | |||
Verizon Wireless(3) | 13.6 | % | 15.6 | % | 15.4 | % | |||
T-Mobile | 7.5 | % | 11.2 | % | 13.7 | % | |||
AT&T Sprint Verizon Wireless T-Mobile Percentage of Total Revenues For the year ended December 31, 2009 2010 2011 23.8 % 23.9 % 23.8 % 21.9 % 20.4 % 19.8 % 15.4 % 14.8 % 14.8 % 13.7 % 11.6 % 10.7 %
We also have client concentrations with respect to revenues in each of our financial reporting segments:
| Percentage of Site Leasing Revenues | |||||||||
| for the year ended December 31, | |||||||||
| 2007 | 2008 | 2009 | |||||||
AT&T(1) | 28.0 | % | 27.6 | % | 27.7 | % | |||
Sprint(2) | 29.1 | % | 27.3 | % | 25.3 | % | |||
Verizon Wireless (3) | 14.4 | % | 15.7 | % | 16.0 | % | |||
T-Mobile | 8.4 | % | 10.7 | % | 11.8 | % | |||
| Percentage of Site Development | |||||||||
| Consulting Revenues | |||||||||
| for the year ended December 31, | |||||||||
| 2007 | 2008 | 2009 | |||||||
Verizon Wireless(3) | 17.5 | % | 24.2 | % | 23.6 | % | |||
T-Mobile | 0.4 | % | 7.6 | % | 13.9 | % | |||
Metro PCS | 3.9 | % | 13.3 | % | 5.8 | % | |||
Sprint(2) | 59.9 | % | 22.9 | % | 0.5 | % | |||
| Percentage of Site Development | |||||||||
| Construction Revenues | |||||||||
| for the year ended December 31, | |||||||||
| 2007 | 2008 | 2009 | |||||||
T-Mobile | 5.8 | % | 15.8 | % | 28.2 | % | |||
Nsoro Mastec, LLC | 0.3 | % | 2.4 | % | 24.9 | % | |||
Metro PCS | 1.1 | % | 11.9 | % | 9.0 | % | |||
Verizon(3) | 7.4 | % | 12.3 | % | 8.3 | % | |||
Sprint(2) | 40.1 | % | 10.8 | % | 1.8 | % | |||
| Percentage of Site Leasing Revenues | ||||||||||||
| For the year ended December 31, | ||||||||||||
| 2009 | 2010 | 2011 | ||||||||||
AT&T | 27.7 | % | 28.0 | % | 26.8 | % | ||||||
Sprint | 25.3 | % | 23.6 | % | 22.3 | % | ||||||
Verizon Wireless | 16.0 | % | 15.4 | % | 15.5 | % | ||||||
T-Mobile | 11.8 | % | 11.7 | % | 11.2 | % | ||||||
| Percentage of Site Development | ||||||||||||
| Consulting Revenues | ||||||||||||
| For the year ended December 31, | ||||||||||||
| 2009 | 2010 | 2011 | ||||||||||
Verizon Wireless | 23.6 | % | 15.1 | % | 17.5 | % | ||||||
Nsoro Mastec, LLC | 9.3 | % | 13.4 | % | 9.1 | % | ||||||
T-Mobile | 13.9 | % | 6.0 | % | 8.5 | % | ||||||
| Percentage of Site Development | ||||||||||||
| Construction Revenues | ||||||||||||
| For the year ended December 31, | ||||||||||||
| 2009 | 2010 | 2011 | ||||||||||
Nsoro Mastec, LLC | 24.9 | % | 36.0 | % | 42.7 | % | ||||||
Ericsson, Inc. | 0.3 | % | 3.0 | % | 10.1 | % | ||||||
Verizon Wireless | 8.3 | % | 10.2 | % | 7.3 | % | ||||||
T-Mobile | 28.2 | % | 11.8 | % | 6.6 | % | ||||||
Revenue from these clients is derived from numerous different site leasing contracts and site development contracts. Each site leasing contract relates to the lease of space at an individual tower site and is generally for an initial term of five years renewable for five 5-year periods at the option of the tenant. However, if any of our significant site leasing clients were to experience financial difficulty, substantially reduce their capital expenditures or reduce their dependence on leased tower space and fail to renew their leases with us, our revenues, future revenue growth and results of operations would be adversely affected.
Our site development customers engage us on a project-by-project basis, and a customer can generally terminate an assignment at any time without penalty. In addition, a customer’s need for site development services can decrease, and we may not be successful in establishing relationships with new customers. Furthermore, our existing customers may not continue to engage us for additional projects.
If we are unable to protect our rights to the land under our towers, it could adversely affect our business and operating results.
Our real property interests relating to our towers consist primarily of leasehold and sub-leasehold interests, fee interests, easements, licenses and rights-of-way. From time to time, we experience disputes with landowners regarding the terms of ground agreements for the land under our towers, which can affect our ability to access and operate such towers. Further, landowners may not want to renew their ground agreements with us, they may lose their rights to the land, or they may transfer their land interests to third parties, including ground lease aggregators and our competitors, which could affect our ability to renew ground agreements on commercially viable terms or at all. Our inability to protect our rights to the land under our towers may have a future material adverse effect on our business, results of operations or financial condition.
In addition, we may not always have the ability to analyze and verify all information regarding title, access and other issues regarding the land underlying acquired towers. To the extent that we do not have complete access to, or use of, the land underlying the acquired towers, it could require us to incur additional expenses before we can operate and generate revenue from such tower.
Our international operations are subject to economic, political and other risks, including risks associated with foreign currency exchange rates, that could materially and adversely affect our revenues or financial position.
Our current business operations in Canada, Costa Rica, El Salvador, Guatemala, Nicaragua and Panama and our expansion into any other international markets in the future, could result in adverse financial consequences and operational problems not typically experienced in the United States. Although the consolidated revenues generated by our international operations were less than 4% during the year ended December 31, 2011, we anticipate that our revenues from our international operations will grow in the future. Accordingly, our business is and will in the future be subject to risks associated with doing business internationally, including:
changes in a specific country’s or region’s political or economic conditions;
laws and regulations that tax or otherwise restrict repatriation of earnings or other funds or otherwise limit distributions of capital;
laws and regulations that dictate how we operate our communications sites and conduct business, including zoning and environmental matters;
changes to existing or new domestic or international tax laws directed specifically at the ownership and operation of tower sites, which may be applied and enforced retroactively;
expropriation and governmental regulation restricting foreign ownership;
our ability to comply with, and the costs of compliance with, anti-bribery laws such as the Foreign Corrupt Practices Act and similar local anti-bribery laws;
our ability to compete with owners and operators of wireless communications towers that have been in the international market for a longer period of time than we have;
uncertainties regarding legal or judicial systems, including inconsistencies between and within laws, regulations and decrees, and judicial application thereof;
health or similar issues, such as a pandemic or epidemic;
difficulty in recruiting and retaining trained personnel; and
language and cultural differences.
The majority of our international operations are denominated in United States dollars. However, for some of our international operations, we face risks associated with changes in foreign currency exchange rates, including those arising from our operations, investments and financing transactions related to our international business. Volatility in foreign currency exchange rates can also affect our ability to plan, forecast and budget for our international operations and expansion efforts.
Our convertible note hedge transactions may not cover all of the potential dilution or additional cash outlay, if we settled the notes in cash, to which we may be subject upon conversion of the notes.
Concurrently with the pricing of our 1.875% Convertible Senior Notes due 2013 (the “1.875% Notes”) and our 4.0% Convertible Senior Notes due 2014 (the “4.0% Notes”) we entered into convertible note hedge transactions and warrant transactions with affiliates of certain of the initial purchasers of the convertible note offerings. The initial strike price of the convertible note hedge transactions relating to our 1.875% Notes is $41.46 per share of our Class A common stock (the same as the initial conversion price of our 1.875% convertible notes) and the upper strike price of the warrants is $67.37 per share. The initial strike price of the convertible note hedge transactions relating to our 4.0% convertible Notes is $30.38 per share of our Class A common stock (the same as the initial conversion price of the 4.0% Notes) and the upper strike price of the warrant transactions is $44.64 per share. Pursuant to the terms of the warrant transaction, we are responsible for the dilution or costs, to the extent that we settle in cash or stock, arising from the conversion of the notes to the extent that the market price of our Class A common stock exceeds the strike price of the warrants. During 2011, we purchased an aggregate of $15.0 million in principal amount of the 1.875% Notes, and $535.0 million remained outstanding. If the market price of our Class A common stock significantly exceeded either of these strike prices on their respective conversion dates we would be subject to material dilution or, to the extent we elected to settle in cash, material additional costs.
Initially we entered into convertible note hedge and warrant transactions to cover the full amount of the shares that were issuable upon conversion of the 1.875% Notes and the 4.0% Notes. However, as a result of the bankruptcy of Lehman Brothers OTC Derivatives Inc. (“Lehman Derivatives”), we terminated the convertible note hedge transaction that we had entered into with Lehman Derivatives. The terminated convertible note hedge transaction had originally covered 55% of the 13,265,780 shares of our Class A common stock potentially issuable upon conversion of our 1.875% Notes. Consequently, we do not currently have a hedge with respect to that percentage of the shares issuable upon conversion of the 1.875% Notes To the extent that the market price of our Class A common stock exceeds $41.46 per share upon conversion of the notes, we will be subject to dilution or if we settle in cash, additional costs, upon conversion of that portion of the 1.875% Notes. If any of the other counterparties to our convertible hedge transactions were to default in their obligations, then our potential dilution or costs upon conversion of the respective notes would be materially increased.
New technologies and their use by carriers may have a material adverse effect on our growth rate and results of operations.
The emergence of new technologies could reduce the demand for space on our towers. For example, the increased use by wireless service providers of signal combining and related technologies and products that allow two or more wireless service providers to provide services on different transmission frequencies using the same communications antenna and other facilities normally used by only one wireless service provider could reduce the demand for our tower space. Additionally, the use of technologies that enhance spectral capacity, such as beam
forming or “smart antennae,” that can increase the range and capacity of an antenna could reduce the number of additional sites a wireless service provider needs to adequately serve a certain subscriber base and therefore reduce demand for our tower space. The development and growth of communications and other new technologies that do not require ground-based sites, such as the growth in delivery of video, voice and data services by satellites or other technologies, could also adversely affect the demand for our tower space. Any increase in the amount of wireless traffic moved by carriers away from macro antenna sites to small cell architecture, distributed antenna systems, Wi-Fi, or other alternate distribution methods could adversely affect the demand for our tower space. If any of these or other new technologies are widely adopted in the future it could have a material adverse effect on our growth and results of operations.
Increasing competition to acquire existing towers may negatively impact our ability to grow our tower portfolio long-term.long term.
We currently intend to grow our tower portfolio, 5% to10% annuallydomestically and internationally, through the consummation of the Mobilitie transaction, additional tower acquisitions and the construction of new builds.towers. Our ability to meet these growth targets significantly depends on our ability to acquire existing towers that meet our investment requirements. Traditionally, our acquisition strategy has focused on acquiring towers from smaller tower companies, independent tower developers and wireless service providers. However, as a result of consolidation in the tower industry there are fewer of these mid-sized tower transactions available and there is more competition to acquire existing towers. Increased competition for acquisitions may result in fewer acquisition opportunities for us, higher acquisition prices, reduced willingness of sellers to accept equity as consideration for their towers and increased difficulty in negotiating and consummating agreements to acquire such towers. Furthermore, to the extent that the tower acquisition opportunities are for significant tower portfolios, many of our competitors are significantly larger and have greater financial resources than us. If we are not able to successfully address these challenges, we may not be able to materially increase our tower portfolio in the long-term.
We have a substantial levelDue to these risks, it may take longer to complete our new tower builds than anticipated, the costs of indebtedness, a large portion of whichconstructing or acquiring these towers may be higher than we will need to refinance in the next two years. In the event we are not able to refinanceexpect or repay such indebtedness, we may not be able to access the cash flow from all of ouradd as many towers and we may need to take certain actions to service our debt obligations.
As of December 31, 2009,as we had $2.8 billion aggregate principal amount of debt outstanding, of which $0.9 billion is scheduledplanned in any given year. If we are not able to be repaid in 2011. The amount scheduled to be repaid in 2011 consists solely of the 2006 CMBS Certificates which have anincrease our tower portfolio as anticipated, repayment date in November 2011.
We do not currently expect to have sufficient cash flow from operations to repay the full principal amount of the 2006 CMBS Certificates. Consequently, we expect to refinance a significant portion of this debt. The global credit and capital markets are undergoing a period of substantial volatility and disruption, and the global economy is experiencing weakness and uncertainty. Although the credit markets have improved during 2009, we believe that this volatile credit environment has generally resulted in increased interest rates and/or interest rate spread as compared to periods immediately prior to 2007. Any renewed financial turmoil, worsening credit environment, economic weakness and uncertaintyit could negatively impact our ability and the cost of refinancing our 2006 CMBS Certificates.
If we are unable to refinance the 2006 CMBS Certificates by November 2011, the cash flow from the 3,746 tower sites pledged to secure such mortgage loan underlying the 2006 CMBS Certificates, representing 45% of our total tower portfolio as of December 31, 2009, will be trapped and unavailable to service our other outstanding debt. If these cash flows become trapped, they would be applied first to repay the interest, at the original interest rate, on the mortgage loan components underlying the 2006 CMBS Certificates, second to fund all reserve accounts and operating expenses associated with the pledged towers, third to pay the management fees, fourth to repay the principal of the 2006 CMBS Certificates in the order of their investment grade, and fifth to repay the additional interest discussed below. As a result of this cash trap, we would only have access to the cash flow generated by the remaining approximately 4,578 tower sites (approximately 55% of our total tower portfolio as of December 31, 2009) and the annual management fee (equal to 7.5% of the operating revenues of the borrowers under the CMBS Certificates for the immediately preceding calendar month) to service our other indebtedness and pay all other corporate expenses. Furthermore, if we are unable to repay the mortgage loan components relating to the 2006 CMBS Certificates by November 2011, then the interest rate on the mortgage loan underlying each subclass of the 2006 CMBS Certificates would increase by the greater of (i) 5% or (ii) the amount, if any, by which the sum of (x) the ten year U.S. treasury rate plus (y) the credit-based spread for the mortgage loan component underlying the referenced subclass of the 2006 CMBS Certificates (as set forth in the mortgage loan agreement) plus (z) 5%, exceeds the original interest rate for such component. Such additional interest will be payable once the principal of the 2006 CMBS Certificates is repaid. The sole remedy of the lenders if we do not refinance or repay the 2006 CMBS Certificates by November 2011 is the cash trap and the increased interest rates
discussed above, but it is not an event of default under the mortgage loan, the indenture governing any of our outstanding notes or the Senior Credit Agreement.
If we are unable to refinance the 2006 CMBS Certificates and therefore unable to access the cash flow from pledged towers, it may have an adverse impact on our ability to (i) repay our other indebtedness, or (ii) fund our planned capital expenditures, which would adversely affectachieve our financial health and/or anticipated growth.
Recent developments in the global economy could result in a slowdown in demand for wireless communications services or for tower space, which could adversely affect our future growth and revenues.
Due to the recent economic downturn and the resulting unemployment rates in the U.S. and internationally, consumer discretionary income has been, and may continue to be, adversely impacted. If wireless service subscribers significantly reduce their minutes of use, or fail to widely adopt and use wireless data applications, our wireless service provider customers would experience a decrease in demand for their services. As a result, they may scale back their business plans or otherwise reduce their spending, which could materially and adversely affect demand for our tower space and our wireless communications services business, which could have a material adverse effect on our business, results of operations and financial condition.
In addition, the recent volatility and disruption of the global credit and capital markets may adversely affect:
the financial condition of wireless service providers;
the ability and willingness of wireless service providers to maintain or increase capital expenditures; and
interest rates and the overall availability and cost of capital.
As a result of these factors, wireless service providers may delay or abandon implementation of new systems and technologies, including 3G, 4G or other wireless services or, worse, elect not to renew existing antenna leases in order to reduce operating expenses.
We have a substantial level of indebtedness which may have an adverse effect on our business or limit our ability to take advantage of business, strategic or financing opportunities.
As indicated below, we have and will continue to have a significant amount of indebtedness relative to our equity. The following table sets forth our total principal amount of debt and shareholders’ equity as of December 31, 2008 and 2009.
| As of December 31, | ||||||
| 2008 | 2009 | |||||
| (as adjusted) | ||||||
| (in thousands) | ||||||
Total principal amount of indebtedness | $ | 2,557,248 | $ | 2,771,012 | ||
Shareholders’ equity | $ | 650,510 | $ | 599,949 | ||
Our substantial level of indebtedness increases the possibility that we may be unable to generate cash sufficient to pay the principal, interest or other amounts when due. Subject to certain restrictions under our existing indebtedness, we and our subsidiaries may also incur significant additional indebtedness in the future, some of which may be secured debt. This may have the effect of increasing our total leverage.
As a consequence of our indebtedness, (1) demands on our cash resources may increase, (2) we are subject to restrictive covenants that further limit our financial and operating flexibility and (3) we may choose to institute self-imposed limits on our indebtedness based on certain considerations including market interest rates, our
relative leverage and our strategic plans. For example, as a result of our substantial level of indebtedness and the uncertainties arising in the credit markets and the U.S. economy:
we may be more vulnerable to general adverse economic and industry conditions;
we may find it more difficult to obtain additional financing to fund future working capital, capital expenditures and other general corporate requirements that would be in our best long-term interests;
we may be required to dedicate a substantial portion of our cash flow from operations to the payment of principal and interest on our debt, reducing the available cash flow to fund other investments, including capital expenditures;
we may, in the future, be required to reduce our annual tower acquisition and new build goals;
we may have limited flexibility in planning for, or reacting to, changes in our business or in the industry;
we may have a competitive disadvantage relative to other companies in our industry that are less leveraged; and
we may be required to sell debt or equity securities or sell some of our core assets, possibly on unfavorable terms, in order to meet payment obligations.
These restrictions could have an adverse effect on our business by limiting our ability to take advantage of financing, new tower development, mergers and acquisitions or other opportunities.
In addition, fluctuations in market interest rates may increase interest expense relating to our floating rate indebtedness, which we expect to incur under our 2010 Credit Facility and may make it difficult to refinance our existing indebtedness, including our 2006 CMBS Certificates at a commercially reasonable rate or at all. There is no guarantee that the future refinancing of our indebtedness will have fixed interest rates or that interest rates on such indebtedness will be equal to or lower than the rates on our current indebtedness.
We may not secure as many site leasing tenants as planned or our lease rates for new tenant leases may decline.
If tenant demand for tower space or our lease rates on new leases decrease, we may not be able to successfully grow our site leasing business as expected. This may have a material adverse effect on our strategy, revenue growth and our ability to satisfy our financial and other contractual obligations. Our plan for the growth of our site leasing business largely depends on our management’s expectations and assumptions concerning future tenant demand and potential lease rates for our towers.goals.
Delays or changes in the deployment or adoption of new technologies or slowing consumer adoption rates may have a material adverse effect on our growth rate.
There can be no assurances that 3G, 4G or other new wireless technologies will be deployed or adopted as rapidly as projected or that these new technologies will be implemented in the manner anticipated. The deployment of 3G experienced delays from the original projected timelines of the wireless and broadcast industries, and deployment of 4G has been limited to date. Additionally, the demand by consumers and the adoption rate of consumers for these new technologies once deployed may be lower or slower than anticipated. These factors could have a material adverse effect on our growth rate since growth opportunities and demand for our tower space as a result of such new technologies may not be realized at the times or to the extent anticipated.
We may not secure as many site leasing tenants as planned or our lease rates for new tenant leases may decline.
If wireless service provider demand for tower space or our lease rates on new leases decrease, we may not be able to successfully grow our site leasing business as expected. This may have a material adverse effect on our strategy, revenue growth and our ability to satisfy our financial and other contractual obligations. Our plan for the growth of our site leasing business largely depends on our management’s expectations and assumptions concerning future tenant demand and potential lease rates for our towers.
Our acquisition initiatives may disrupt our operations or expose us to additional risk.
During 2012, we expect to grow our tower portfolio, domestically and internationally, through the consummation of the Mobilitie transaction, additional tower acquisitions and the construction of new towers. Our ability to grow through acquisitions will depend, in part, on the availability of suitable acquisitions at an acceptable price, our ability to compete effectively for towers and the availability of capital and personnel to complete such acquisitions and effectively integrate acquired towers into our business. These risks could be heightened if we complete a large acquisition, such as our pending Mobilitie acquisition, or several smaller acquisitions within a relatively short period of time. Furthermore, large acquisitions may raise additional risks as we are required to place enhanced reliance on the financial and operational representations and warranties of sellers. Our acquisition strategy subjects us to a number of risks and uncertainties, including an adverse impact on our overall profitability if the acquired towers do not achieve the financial results projected in our valuation models, unanticipated costs associated with the acquisitions, undisclosed and assumed liabilities that we may be unable to recover, an adverse impact on our existing customer relationships and the diversion of managerial attention due to an acquisition. If we are not able to successfully execute on our acquisition strategy, our future tower portfolio growth, and therefore our future financial results, could be adversely impacted.
Our international expansion initiatives are subject to additional risks such as complex laws, regulations and business practices that may require additional resources and personnel, as well as those risks described above in “—Our international operations are subject to economic, political and other risks that could materially and adversely affect our revenues or financial position, including risks associated with foreign currency exchange rates.” Furthermore, the success of our international operations is subject to a number of uncertainties, including our ability to compete internationally with tower companies or wireless service providers that own and operate their own tower networks, and that, in some cases, have been in the international market for a longer period of time. Although we generally focus our international efforts in countries with relatively stable political and macroeconomic environments, growing, competitive wireless communications industries and multiple wireless carriers that are likely to outsource their communications site infrastructure needs to us, we are subject to several factors outside of our control, and no assurance can be given that our expansion initiatives will succeed and not materially and adversely affect our business, results of operations and financial condition.
Increasing competition in the tower industry may create pricing pressures that may materially and adversely affect us.
Our industry is highly competitive, and our customers sometimes have numerous alternatives for leasing antenna space. Some of our competitors, such as (1) nationalU.S. and international wireless carriers that allow collocation on their towers and (2) large independent tower companies, are substantially larger and have greater financial resources than us. This could provide them with advantages with respect to establishing favorable leasing terms with wireless service providers or in their ability to acquire available towers.
In the site leasing business, we compete with:
wireless service providers that own and operate their own towers and lease, or may in the future decide to lease, antenna space to other providers;
national and regional tower companies; and
alternative facilities such as rooftops, outdoor and indoor DAS networks, billboards and electric transmission towers.
We believe that tower location and capacity, quality of service, density within a geographic market and, to a lesser extent, price historically have been and will continue to be the most significant competitive factors affecting the site leasing business. However, competitive pricing pressures for tenants on towers from these competitors could materially and adversely affect our lease rates. In addition, we may not be able to renew existing customer leases or enter into new customer leases, resulting in a material adverse impact on our results of operations and growth rate. Increasing competition could also make the acquisition of high quality tower assets more costly.costly, or limit the acquisition opportunities altogether. Any of these factors could materially and adversely affect our business, results of operations or financial condition.
The site development segment of our industry is also extremely competitive. There are numerous large and small companies that offer one or more of the services offered by our site development business. As a result of this competition, margins in this segment continue to be under pressure. Many of our competitors have lower overhead expenses and therefore may be able to provide services at prices that we consider unprofitable. If margins in this segment were to further decrease, our consolidated revenues and our site development segment operating profit could be adversely affected.
If we are unable to protect our rights to the land under our towers, it could adversely affect our business and operating results.
Our real property interests relating to our towers consist primarily of leasehold and sub-leasehold interests, fee interests, easements, licenses and rights-of-way. A loss of these interests at a particular tower site may interfere with our ability to operate a tower and generate revenues. For various reasons, we may not always have the ability to access, analyze and verify all information regarding title and other issues prior to completing an acquisition of communications sites, which can affect our rights to access and operate a site. From time to time we also experience disputes with landowners regarding the terms of ground agreements for land under a tower, which can affect our ability to access and operate a tower site. Further, for various reasons, landowners may not want to renew their ground agreements with us, they may lose their rights to the land, or they may transfer their land interests to third parties, including ground lease aggregators, which could affect our ability to renew ground agreements on commercially viable terms. Our inability to protect our rights to the land under our towers may have a future material adverse effect on our business, results of operations or financial condition.
Our foreign operations are subject to economic, political and other risks that could materially and adversely affect our revenues or financial position, including risks associated with foreign currency exchange rates.
Our current business operations in Canada and our expansion into any other international markets in the future, could result in adverse financial consequences and operational problems not experienced in the United States. Although the consolidated revenues generated by our international operations were immaterial during the year ended December 31, 2009, we anticipate that our revenues from our international operations may grow in the future. Accordingly, our business is subject to risks associated with doing business internationally, including:
changes in a specific country’s or region’s political or economic conditions;
laws and regulations that tax or otherwise restrict repatriation of earnings or other funds or otherwise limit distributions of capital;
changes to existing or new tax laws directed specifically at the ownership and operation of tower sites;
expropriation and governmental regulation restricting foreign ownership;
uncertainties regarding legal or judicial systems, including inconsistencies between and within laws, regulations and decrees, and judicial application thereof;
health or similar issues, such as a pandemic or epidemic;
difficulty in recruiting and retaining trained personnel; and
language and cultural differences.
In addition, we face risks associated with changes in foreign currency exchange rates, including those arising from our operations, investments and financing transactions related to our international business. Volatility in foreign currency exchange rates can also affect our ability to plan, forecast and budget for our international operations and expansion efforts.
The market price of our Class A common stock could be affected by significant volatility, which could adversely impact our ability to use equity to fund our growth plan.
The market price of our Class A common stock has historically experienced significant fluctuations. Since the fall of 2008, the U.S. stock market has been undergoing a period of very high volatility where changes in the market prices of equity securities have often been abrupt and profound over short periods of time. The market price of our Class A common stock is likely to continue to be volatile and subject to significant price and volume fluctuations in response to market and other factors, including the other factors discussed elsewhere in “Risk Factors” and in “Forward-Looking Statements.” Volatility or depressed market prices of our Class A common stock could make it difficult for shareholders to resell their shares of Class A common stock, when they want or at attractive prices. Consequently, volatility of the market price of our Class A common stock may make it less likely that sellers will accept our equity as consideration in connection with our tower acquisitions and may make it more difficult for us to use our equity to fund our future growth plans. If we were unable to use equity to fund the growth of our tower portfolio, we may be required to either use debt to increase our tower portfolio or reduce our anticipated growth.
Counterparties to our convertible note hedge transactions may be unable to fulfill their obligations and such failure could subject us to significant costs to replace any such portion of our convertible note hedge transactions or subject us to potential dilution or additional cost, if settled in cash, upon conversion of our convertible notes.
Concurrently with the pricing of our 0.375% Convertible Senior Notes due 2010 (the “0.375% Notes”), our 1.875% Convertible Senior Notes due 2013 (the “1.875% Notes”), and our 4.0% Convertible Senior Notes due 2014 (the “4.0% Notes”), we entered into convertible note hedge transactions with affiliates of certain of the initial purchasers of the convertible note offerings. The initial strike price of the convertible note hedge transactions relating to our 0.375% Notes is $33.56 per share of our Class A common stock (the same as the initial conversion price of the 0.375% Notes) and cover 10,429,720 shares of our Class A common stock. As of December 31, 2009, the convertible note hedge transactions cover 2,559,185 shares of our Class A common stock, as a result of repurchases and termination of $264.1million in principal of 0.375% Notes and convertible note hedges. The initial strike price of the convertible note hedge transactions relating to our 1.875% Notes is $41.46 per share of our Class A common stock (the same as the initial conversion price of our 1.875% convertible notes) and cover 13,265,780 shares of our Class A common stock. The initial strike price of the convertible note hedge transactions relating to our 4.0% convertible Notes is $30.38 per share of our Class A common stock (the same as the initial conversion price of the 4.0% Notes) and cover 16,458,196 shares of our Class A common stock.
Since the fall of 2008, global economic conditions and the financial markets have been and continue to be volatile. Certain financial institutions have filed for bankruptcy, have sold some or all of their assets, or may be looking to enter into a merger or other transaction with another financial institution. As a result of these conditions, some of the counterparties to our convertible note hedge transactions may be unable to perform their obligations under such instruments. One of the convertible note hedge transactions entered into in connection with our 1.875% Notes was with Lehman Brothers OTC Derivatives Inc. (“Lehman Derivatives”) which covers 55% of the 13,265,780 shares of our Class A common stock potentially issuable upon conversion of our 1.875% convertible notes. In October 2008, Lehman Derivatives filed a voluntary petition for protection under Chapter 11 of the United States Bankruptcy Code which constituted an “event of default” under the convertible note hedge transaction with Lehman Derivatives. As a result, on November 7, 2008 we terminated the convertible note hedge transaction with Lehman Derivatives. Based on information available to us, we have no indication, as of the date of filing this Form 10-K, that any party other than Lehman Derivatives would be unable to fulfill their obligations to us under the convertible note hedge transactions.
If we were to elect to replace the convertible note hedge transaction with Lehman Derivatives or any other counterparty, we would incur significant costs to replace such hedge transactions. Additionally, if we do not elect to replace our convertible note hedge transactions that were previously with Lehman Derivatives or any other counterparty fails to perform its obligations under our outstanding convertible note hedge transactions, we would be subject to potential dilution or additional cost, if settled in cash, upon conversion of the applicable 0.375% Notes, 1.875% Notes and 4.0% Notes.
We may not be able to build as many towers as we anticipate.
We currently intend to build at least 120 to 140 new towers during 2010. However, our ability to build these new towers is dependent upon the availability of sufficient capital to fund construction, our ability to locate, and acquire at commercially reasonable prices, attractive locations for such towers and our ability to obtain the necessary zoning and permits.
Due to these risks, it may take longer to complete our new tower builds than anticipated, the costs of constructing or acquiring these towers may be higher than we expect or we may not be able to add as many towers as we had planned in 2010. If we are not able to increase our tower portfolio as anticipated, it could negatively impact our ability to achieve our financial goals.
Our debt instruments contain restrictive covenants that could adversely affect our business by limiting our flexibility.
Our 2010 Credit FacilityAgreement contains certain restrictive covenants. Among other things, these covenants limit our ability to:
incur additional indebtedness;indebtedness above a certain level;
sell assets;
make certain investments;
engage in mergers or consolidations;
incur liens; and
enter into affiliate transactions.
These covenants could place us at a disadvantage compared to some of our competitors which may have fewer restrictive covenants and may not be required to operate under these restrictions. Further, these covenants could have an adverse effect on our business by limiting our ability to take advantage of financing, new tower development, merger and acquisitions or other opportunities. If we fail to comply with these covenants, it could result in an event of default under the 2010 Credit Facility.Agreement. In addition, if we default in the payment of our other indebtedness, including under our 2006 CMBS Certificates2010 Tower Securities and our notes, then such default could cause a cross-default under our 2010 Credit Facility.Agreement.
The mortgage loan relating to our 2006 CMBS Certificates2010 Tower Securities also contains financial covenants that require that the mortgage loan borrowers maintain, on a consolidated basis, a minimum debt service coverage ratio. To the extent that the debt service coverage ratio, as of the end of any calendar quarter, (1) is less than 1.30 times,falls to 1.30x or lower, then all cash flow generated byin excess of amounts required to make debt service payments, to fund required reserves, to pay management fees and budgeted operating expenses and to make other payments required under the pledged towers mustloan documents, referred to as “excess cash flow,” will be deposited into a reserve account and (2) is less than 1.15 times,instead of being released to the Borrowers. The funds in the reserve account will not be released to the Borrowers unless the debt service coverage ratio exceeds 1.30x for two consecutive calendar quarters. If the debt service coverage ratio falls below 1.15x as of the end of any calendar quarter, then an “amortization period” will commence and all funds on deposit in the reserve account will be applied to prepay the mortgage loan until such time asthat the debt service coverage ratio exceeds 1.15 times1.15x for a calendar quarter. As lease payments from 3,7463,670 tower sites of our total tower portfolio are pledged as collateral under the mortgage loan, if this cash flow was not available to us it could adversely impact our ability to pay our indebtedness, other than the mortgage loan, and to operate our business.
New technologies and their use by carriers may have a material adverse effect on our growth rate and results of operations.
The emergence of new technologies could reduce the demand for space on our towers. For example, the increased use by wireless service providers of signal combining and related technologies and products that allow two or more wireless service providers to provide services on different transmission frequencies using the same communications antenna and other facilities normally used by only one wireless service provider could reduce the demand for our tower space. Additionally, the use of technologies that enhance spectral capacity, such as beam forming or “smart antennae,” that can increase the range and capacity of an antenna could reduce the number of additional sites a wireless service provider needs to adequately serve a certain subscriber base and therefore reduce demand for our tower space. The development and growth of communications and other new technologies that do not require ground-based sites, such as the growth in delivery of video, voice and data services by satellites or other technologies, could also adversely affect the demand for our tower space.
Our dependence on our subsidiaries for cash flow may negatively affect our business.
We are a holding company with no business operations of our own. Our only significant asset is, and is expected to be, the outstanding capital stock and membership interests of our subsidiaries. We conduct, and expect to continue conducting, all of our business operations through our subsidiaries. Accordingly, our ability to pay our obligations is dependent upon dividends and other distributions from our subsidiaries to us. Most of our indebtedness is owed directly by our subsidiaries, including the mortgage loan underlying the 2006 CMBS Notes,2010 Tower Securities, the 2016 Notes, the 2019 Notes, the Term Loan and any amounts that we may borrow under the 2010Revolving Credit Facility. Consequently, the first use of any cash flow from operations generated by such subsidiaries will be payments of interest and principal, if any, under their respective indebtedness. Other than the
cash required to repay amounts due under our outstanding convertible notes, we currently expect that substantially all the earnings and cash flow of our subsidiaries will be retained and used by them in their operations, including servicing their respective debt obligations. The ability of our operating subsidiaries to pay dividends or transfer assets to us is restricted by applicable state law and contractual restrictions, including the terms of their outstanding debt instruments.
Our quarterly operating results for our site development services fluctuate and therefore we may not be able to adjust our cost structure on a timely basis with regard to such fluctuations.
The demand for our site development services fluctuates from quarter to quarter and should not be considered indicative of long-term results. Numerous factors cause these fluctuations, including:
the timing and amount of our customers’ capital expenditures;
the size and scope of our projects;
the business practices of customers, such as deferring commitments on new projects until after the end of the calendar year or the customers’ fiscal year;
delays relating to a project or tenant installation of equipment;
seasonal factors, such as weather, vacation days and total business days in a quarter;
the use of third party providers by our customers;
the rate and volume of wireless service providers’ network development; and
general economic conditions.
Although the demand for our site development services fluctuates, we incur significant fixed costs, such as maintaining a staff and office space in anticipation of future contracts. In addition, the timing of revenues is difficult to forecast because our sales cycle may be relatively long. Therefore, we may not be able to adjust our cost structure on a timely basis to respond to the fluctuations in demand for our site development services.
We are not profitable and expect to continue to incur losses.
We are not profitable. The following chart shows the net losses we incurred for the periods indicated:
| For the year ended December 31, | ||||||||||||
| 2007 | 2008 | 2009 | ||||||||||
| (as adjusted) | (as adjusted) | |||||||||||
| (in thousands) | ||||||||||||
Net loss | $ | (91,474 | ) | $ | (67,164 | ) | $ | (141,119 | ) | |||
| For the year ended December 31, | ||||||||||||
| 2009 | 2010 | 2011 | ||||||||||
| (in thousands) | ||||||||||||
Net loss | $ | (141,119 | ) | $ | (194,421 | ) | $ | (126,892 | ) | |||
Our losses are principally due to depreciation, amortization and accretion expenses, interest expense (including non-cash interest expense and amortization of deferred financing fees), and losses from the extinguishment of debt as well as impairment charges on our towers and auction rate securities in the periods presented above. We expect to continue to incur significant losses, which may affect our ability to service our indebtedness.
The loss of the services of certain of our key personnel or a significant number of our employees may negatively affect our business.
Our success depends to a significant extent upon performance and active participation of our key personnel. We cannot guarantee that we will be successful in retaining the services of these key personnel. We have employment agreements with Jeffrey A. Stoops, our President and Chief Executive Officer, Kurt L. Bagwell, our Senior Vice President and Chief Operating Officer,– International, Thomas P. Hunt, our Senior Vice President, Chief Administrative Officer and General Counsel, and Brendan T. Cavanagh, our Senior Vice President and Chief Financial Officer. We do not have employment agreements with any of our other key personnel. If we were to lose any key personnel, we may not be able to find an appropriate replacement on a timely basis and our results of operations could be negatively affected. Further, the loss of a significant number of employees or our inability to hire a sufficient number of qualified employees could have a material adverse effect on our business.
Our costs could increase and our revenues could decrease due to perceived health risks from radio frequency (“RF”) energy.
The government imposes requirements and other guidelines relating to exposure to RF energy. Exposure to high levels of RF energy can cause negative health effects. The potential connection between exposure to low levels of RF energy and certain negative health effects, including some forms of cancer, has been the subject of substantial study by the scientific community in recent years. According to the Federal Communications Commission (the “FCC”), the results of these studies to date have been inconclusive. However, public perception of possible health risks associated with cellular and other wireless communications media could slow the growth of wireless companies, which could in turn slow our growth. In particular, negative public perception of, and regulations regarding, health risks could cause a decrease in the demand for wireless communications services. Moreover, if a connection between exposure to low levels of RF energy and possible negative health effects, including cancer, were demonstrated, we could be subject to numerous claims. If we were subject to claims relating to exposure to RF energy, even if such claims were not ultimately found to have merit, our financial condition could be materially and adversely affected.
Our business is subject to government regulations and changes in current or future regulations could harm our business.
We are subject to federal, state and local regulation of our business.business, both in the U.S. and internationally. In particular,the U.S., both the Federal Aviation Administration (“FAA”) and the FCC regulate the construction, modification and maintenance of antenna towers and structures that support wireless communications and radio and television antennas. In addition, the FCC separately licenses and regulates wireless communications equipment and television and radio stations operating from such towers and structures. FAA and FCC regulations govern construction, lighting, painting and marking of
towers and structures and may, depending on the characteristics of the tower or structure, require registration of the tower or structure. Certain proposals to construct new towers or structures or to modify existing towers or structures are reviewed by the FAA to ensure that the tower or structure will not present a hazard to air navigation.
Antenna tower owners and antenna structure owners may have an obligation to mark or paint towers or structures or install lighting to conform to FAA and FCC regulations and to maintain such marking, painting and lighting. Antenna tower owners and antenna structure owners may also bear the responsibility of notifying the FAA of any lighting outages. Certain proposals to operate wireless communications and radio or television stations from antenna towers and structures are also reviewed by the FCC to ensure compliance with environmental impact requirements. Failure to comply with existing or future applicable requirements may lead to civil penalties or other liabilities and may subject us to significant indemnification liability to our customers against any such failure to comply. In addition, new regulations may impose additional costly burdens on us, which may affect our revenues and cause delays in our growth.
Local regulations, including municipal or local ordinances, zoning restrictions and restrictive covenants imposed by community developers, vary greatly, but typically require antenna tower and structure owners to obtain approval from local officials or community standards organizations prior to tower or structure construction or modification. Local regulations can delay, prevent, or increase the cost of new construction, co-locations, or site upgrades, thereby limiting our ability to respond to customer demand. In addition, new regulations may be adopted that increase delays or result in additional costs to us. Furthermore, with respect to our international new builds, our tower construction may be delayed or halted as a result of local zoning restrictions, inconsistencies between laws or other barriers to construction in international markets. These factors could have a material adverse effect on our future growth and operations.
Our towers are subject to damage from natural disasters.
Our towers are subject to risks associated with natural disasters such as tornadoes, hurricanes and earthquakes. We maintain insurance to cover the estimated cost of replacing damaged towers, but these insurance policies are subject to loss limits and deductibles. We also maintain third party liability insurance, subject to loss limits and deductibles, to protect us in the event of an accident involving a tower. A tower accident for which we are uninsured or underinsured, or damage to a significant number of our towers, could require us to incur significant expenditures and may have a material adverse effect on our operations or financial condition.
To the extent that we are not able to meet our contractual obligations to our customers, due to a natural disaster or other catastrophic circumstances, our customers may not be obligated or willing to pay their lease expenses; however, we would be required to continue paying our fixed expenses related to the affected tower, including ground lease expenses. If we are unable to meet our contractual obligations to our customers for a material portion of our towers, our operations could be materially and adversely affected.
Our quarterly operating results for our site development services fluctuate and therefore we may not be able to adjust our cost structure on a timely basis with regard to such fluctuations.
The demand for our site development services fluctuates from quarter to quarter and should not be considered indicative of long-term results. Numerous factors cause these fluctuations, including:
the timing and amount of our customers’ capital expenditures;
the size and scope of our projects;
the business practices of customers, such as deferring commitments on new projects until after the end of the calendar year or the customers’ fiscal year;
delays relating to a project or tenant installation of equipment;
seasonal factors, such as weather, vacation days and total business days in a quarter;
the use of third party providers by our customers;
the rate and volume of wireless service providers’ network development; and
general economic conditions.
Although the demand for our site development services fluctuates, we incur significant fixed costs, such as maintaining a staff and office space, in anticipation of future contracts. In addition, the timing of revenues is difficult to forecast because our sales cycle may be relatively long. Therefore, we may not be able to adjust our cost structure on a timely basis to respond to the fluctuations in demand for our site development services.
We could have liability under environmental laws that could have a material adverse effect on our business, financial condition and results of operations.
Our operations, like those of other companies engaged in similar businesses, are subject to the requirements of various federal, state, local and foreign environmental and occupational safety and health laws and regulations, including those relating to the management, use, storage, disposal, emission and remediation of, and exposure to, hazardous and non-hazardous substances, materials, and wastes. As owner, lessee or operator of numerous tower sites, we may be liable for substantial costs of remediating soil and groundwater contaminated by hazardous materials, without regard to whether we, as the owner, lessee or operator, knew of or were responsible for the contamination. We may be subject to potentially significant fines or penalties if we fail to comply with any of these requirements. The current cost of complying with these laws is not material to our financial condition or results of operations. However, the requirements of these laws and regulations are complex, change frequently, and could become more stringent in the future. It is possible that these requirements will change or that liabilities will arise in the future in a manner that could have a material adverse effect on our business, financial condition and results of operations.
We have adoptedOur articles of incorporation, our bylaws and Florida law provide for anti-takeover provisions that could make it more difficult for a third party to acquire us.
Provisions of our articles of incorporation, our bylaws and Florida law could make it more difficult for a third party to acquire us, even if doing so would be beneficial to our shareholders. We adopted a shareholder rights agreement, which could make it considerably more difficult or costly for a person or group to acquire control of us in a transaction that our board of directors opposes. These provisions, alone or in combination with each other,
may discourage transactions involving actual or potential changes of control, including transactions that otherwise could involve payment of a premium over prevailing market prices to holders of our Class A common stock, or could limit the ability of our shareholders to approve transactions that they may deem to be in their best interests.
Our issuance of equity securities and other associated transactions may trigger a future ownership change which may negatively impact our ability to utilize net operating loss deferred tax assets in the future.
The issuance of equity securities and other associated transactions may increase the chance that we will have a future ownership change under Section 382 of the Internal Revenue Code of 1986. We may also have a future ownership change, outside of our control, caused by future equity transactions by our current shareholders. Depending on our market value at the time of such future ownership change, an ownership change under Section 382 could negatively impact our ability to utilize our net operating loss deferred tax assets in the event we generate future taxable income. Currently, we have recorded a full valuation allowance against our net operating loss deferred tax asset because we have concluded that our loss history indicates that it is not “more likely than not” that such deferred tax assets will be realized.
We could suffer adverse tax and other financial consequences if taxing authorities do not agree with our tax positions, or we are unable to utilize our net operating losses.
We are periodically subject to a number of tax examinations by taxing authorities in the states and countries where we do business. We also have significant deferred tax assets related to our net operating losses (“NOLs”) in U.S. federal and state taxing jurisdictions. Generally, for U.S. federal and state tax purposes, NOLs can be carried forward and used for up to twenty years, and all of our tax years will remain subject to examination until three years after our NOLs are used or expire. We expect that we will continue to be subject to tax examinations in the future. In addition, U.S. federal, state and local, as well as international, tax laws and regulations are extremely complex and subject to varying interpretations. We recognize tax benefits of uncertain tax positions when we believe the positions are more likely than not of being sustained upon a challenge by the relevant tax authority. We believe our judgments in this area are reasonable and correct, but there is no guarantee that we will be successful if challenged by a tax authority. If there are tax benefits, including from our use of NOLs or other tax attributes, that are challenged successfully by a taxing authority, we may be required to pay additional taxes or we may seek to enter into settlements with the taxing authorities, which could require significant payments or otherwise have a material adverse effect on our business, results of operations and financial condition.
In addition, we may be limited in our ability to utilize our NOLs to offset future taxable income and thereby reduce our otherwise payable income taxes. We have substantial federal and state NOLs, including significant portions obtained through acquisitions and dispositions, as well as those generated through our historic business operations. In addition, we have disposed of some entities and restructured other entities in conjunction with financing transactions and other business activities.
To the extent we believe that a position with respect to an NOL is not more likely than not to be sustained, we do not record the related deferred tax asset. In addition, for NOLs that meet the recognition threshold, we assess the recoverability of the NOL and establish a valuation allowance against the deferred tax asset related to the NOL if recoverability is questionable. Given the uncertainty surrounding the recoverability of certain of our NOLs, we have established a valuation allowance to offset the related deferred tax asset so as to reflect what we believe to be the recoverable portion of our NOLs.
Our ability to utilize our NOLs is also dependent, in part, upon us having sufficient future earnings to utilize our NOLs before they expire. If market conditions change materially and we determine that we will be unable to generate sufficient taxable income in the future to utilize our NOLs, we could be required to record an additional valuation allowance. We review our uncertain tax position and the valuation allowance for our NOLs periodically and make adjustments from time to time, which can result in an increase or decrease to the net deferred tax asset related to our NOLs. Our NOLs are also subject to review and potential disallowance upon audit by the taxing authorities of the jurisdictions where the NOLs were incurred, and future changes in tax laws or interpretations of such tax laws could limit materially our ability to utilize our NOLs. If we are unable to use our NOLs or use of our NOLs is limited, we may have to make significant payments or otherwise record charges or reduce our
deferred tax assets, which could have a material adverse effect on our business, results of operations and financial condition.
Our issuance of equity securities and other associated transactions may trigger a future ownership change which may negatively impact our ability to utilize net operating loss deferred tax assets in the future.
The issuance of equity securities and other associated transactions may increase the chance that we will have a future ownership change under Section 382 of the Internal Revenue Code of 1986. We may also have a future ownership change, outside of our control, caused by future equity transactions by our current shareholders. Depending on our market value at the time of such future ownership change, an ownership change under Section 382 could negatively impact our ability to utilize our net operating loss deferred tax assets in the event we generate future taxable income. Currently, we have recorded a full valuation allowance against our net operating loss deferred tax asset because we have concluded that our loss history indicates that it is not “more likely than not” that such deferred tax assets will be realized.
Future sales of our Class A common stock in the public market or the issuance of other equity may cause dilution or adversely affect the market price of our Class A common stock and our ability to raise funds in new equity or equity-related offerings.
Sales of a substantial number of shares of our Class A common stock or other equity-related securities in the public market, including sales by any selling shareholder or conversion of the Notes, could depress the market price of our Class A common stock and impair our ability to raise capital through the sale of additional equity securities. We cannot predict
Our costs could increase and our revenues could decrease due to perceived health risks from RF energy.
The U.S. government imposes requirements and other guidelines relating to exposure to RF energy. Exposure to high levels of RF energy can cause negative health effects. The potential connection between exposure to low levels of RF energy and certain negative health effects, including some forms of cancer, has been the effect that future salessubject of
substantial study by the scientific community in recent years. According to the FCC, the results of these studies to date have been inconclusive. However, public perception of possible health risks associated with cellular and other wireless communications media could slow the growth of wireless companies, which could in turn slow our Class A common stock or other equity-related securities wouldgrowth. In particular, negative public perception of, and regulations regarding, health risks could cause a decrease in the demand for wireless communications services. Moreover, if a connection between exposure to low levels of RF energy and possible negative health effects, including cancer, were demonstrated, we could be subject to numerous claims. If we were subject to claims relating to exposure to RF energy, even if such claims were not ultimately found to have on the market price ofmerit, our Class A common stock.financial condition could be materially and adversely affected.
None.
We are headquartered in Boca Raton, Florida, where we currently lease approximately 73,000 square feet of office space. This lease expires February 28, 2022. We have entered into long-term leases for regional and certain site development office locations where we expect our activities to be longer-term. We open and close project offices from time to time in connection with our site development business. We believe our existing facilities are adequate for our current and planned levels of operations and that additional office space suited for our needs is reasonably available in the markets within which we operate.
Our interests in towers are comprised of a variety of fee interests, leasehold interests created by long-term lease agreements, perpetual easements, easements and licenses or rights-of-way granted by government entities. OfFor the 8,324quarter ended December 31, 2011, approximately 70.0% of our tower sites in our portfolio, approximately 27.6% arewere located on parcels of land that we own, land subject to perpetual easements, or parcels of land that have a leasehold interest that extends beyond 5020 years. The average remaining life under our ground leases, including renewal options under our control, has been extended to 33 years. In rural areas, a wireless communications site typically consists of up to a 10,000 square foot tract, which supports towers, equipment shelters and related equipment. Less than 2,500 square feet is required for a monopole or self-supporting tower structure of the kind typically used in metropolitan areas for wireless communications tower sites. Land leases generally have an initial term of five years with five or more additional automatic renewal periods of five years, for a total of thirty years or more.
We are involved in various legal proceedings relating to claims arising in the ordinary course of business. We do not believe that the ultimate resolution of these matters will have a material adverse effect on our business, financial condition, results of operations or liquidity.
ITEM 4. MINE SAFETY DISCLOSURES
Not applicable.
ITEM 5. MARKET FOR REGISTRANT’S COMMON EQUITY, RELATED STOCKHOLDER MATTERS AND ISSUER PURCHASES OF EQUITY SECURITIES
Market for our Class A common stockCommon Stock
Our Class A common stock commenced trading under the symbol “SBAC” on The NASDAQ National Market System on June 16, 1999. We now trade on the NASDAQ Global Select Market, a segment of the NASDAQ Global Market, formally known as the NASDAQ National Market System.
The following table presents the high and low sales price for our Class A common stock for the periods indicated:
| High | Low | |||||
Quarter ended December 31, 2009 | $ | 35.88 | $ | 25.83 | ||
Quarter ended September 30, 2009 | $ | 28.14 | $ | 22.25 | ||
Quarter ended June 30, 2009 | $ | 27.54 | $ | 21.87 | ||
Quarter ended March 31, 2009 | $ | 24.43 | $ | 15.85 | ||
Quarter ended December 31, 2008 | $ | 25.68 | $ | 9.49 | ||
Quarter ended September 30, 2008 | $ | 38.50 | $ | 23.10 | ||
Quarter ended June 30, 2008 | $ | 38.04 | $ | 29.02 | ||
Quarter ended March 31, 2008 | $ | 34.04 | $ | 23.93 | ||
| High | Low | |||||||
Quarter ended December 31, 2011 | $ | 43.12 | $ | 32.36 | ||||
Quarter ended September 30, 2011 | $ | 40.13 | $ | 32.76 | ||||
Quarter ended June 30, 2011 | $ | 40.35 | $ | 36.10 | ||||
Quarter ended March 31, 2011 | $ | 44.44 | $ | 36.36 | ||||
Quarter ended December 31, 2010 | $ | 41.29 | $ | 36.38 | ||||
Quarter ended September 30, 2010 | $ | 40.60 | $ | 33.06 | ||||
Quarter ended June 30, 2010 | $ | 37.03 | $ | 30.47 | ||||
Quarter ended March 31, 2010 | $ | 37.12 | $ | 30.64 | ||||
As of February 24, 2010,16, 2012, there were 147118 record holders of our Class A common stock.
Dividends
We have never paid a dividend on any class of common stock and anticipate that we will retain future earnings, if any, to fund the development and growth of our business. Consequently, we do not anticipate paying cash dividends on our Class A common stock in the foreseeable future.
Equity Compensation Plan Information
The following table gives information about our Class A common stock that may be issued upon the exercise of options, warrants, and rights under all existing equity compensation plans as of December 31, 2009:
| Equity Compensation Plan Information | |||||||
| (in thousands except exercise price) | |||||||
| Number of Securities to be Issued Upon Exercise of Outstanding Options, Warrants and Rights | Weighted Average Exercise Price of Outstanding Options, Warrants and Rights | Number of Securities Remaining Available for Future Issuance Under Equity Compensation Plans (excluding securities reflected in first column)(1) | |||||
Equity compensation plans approved by security holders | |||||||
1999 Plan | 10 | $ | 40.83 | — | |||
2001 Plan | 4,182 | 21.71 | 7,084 | ||||
Equity compensation plans not approved by security holders | — | — | — | ||||
Total | 4,192 | $ | 21.76 | 7,084 | |||
| Equity Compensation Plan Information | ||||||||||||
| (in thousands except exercise price) | ||||||||||||
| Number of Securities Remaining | ||||||||||||
| Number of Securities to be | Weighted Average Exercise | Available for Future Issuance | ||||||||||
| Issued Upon Exercise of | Price of Outstanding | Under Equity Compensation | ||||||||||
| Outstanding Options, | Options, Warrants and | Plans (Excluding Securities | ||||||||||
| Warrants and Rights | Rights | Reflected in first column (a)) | ||||||||||
| (a) | (b) | (c) | ||||||||||
Equity compensation plans approved by security holders | ||||||||||||
2001 Plan | 3,119 | (1) | $ | 24.74 | (1) | — | (3) | |||||
2010 Plan | 714 | (2) | $ | 33.72 | (2) | 14,284 | ||||||
Equity compensation plans not approved by security holders | — | — | ||||||||||
Total | 3,833 | $ | 26.41 | 14,284 | ||||||||
| (1) | Included in the number of |
| (2) | Included in the number of securities in column (a) is approximately 139,000 restricted stock units, which have no exercise price. The weighted average exercise price of outstanding options, warrants and rights (excluding restricted stock units) is $41.87 |
| (3) | This plan has been terminated and we are no longer eligible to issue shares pursuant to |
Issuer repurchases of equity securitiesplan.
The following table presents information related to our repurchases of Class A common stock during the fourth quarter of 2009:
Period | Total Number of Shares Purchased | Average Price Paid per Share | Total Number of Shares Purchased as Part of Publicly Announced Plans or Programs(1) | Maximum Number (or Approximate Dollar Value) of Shares that May Yet Be Purchased Under the Plans or Programs | ||||||
10/1/2009 - 10/31/2009 | — | $ | — | — | $ | — | ||||
11/1/2009 - 11/30/2009 | — | — | — | — | ||||||
12/1/2009 - 12/31/2009 | 52,360 | 32.84 | 52,360 | 248,280,295 | ||||||
Total | 52,360 | $ | 32.84 | 52,360 | $ | 248,280,295 | ||||
Effective January 1, 2009, we retrospectively adopted new convertible debt accounting rules which require the issuer of certain convertible debt instruments that may be settled in cash (including partial cash settlement) on conversion to separately account for the liability (debt) and equity (conversion option) components of the instrument in a manner that reflects the issuer’s non-convertible debt borrowing rate. Our 0.375% Notes and 1.875% Notes are subject to the retrospective restatement requirements required by the new convertible debt accounting. Our consolidated statements of operations and our consolidated statements of cash flows for the years ended December 31, 2008 and 2007 and consolidated balance sheets as of December 31, 2008 and 2007 have been retrospectively adjusted to reflect the impact of adopting the new convertible debt accounting. No periods prior to 2007 were affected by the adoption of the new convertible debt accounting. See Note 2 and Note 13 to the consolidated financial statements for a summary of the effects on our consolidated statements of operations for the years ended December 31, 2008 and 2007 and consolidated balance sheet as of December 31, 2008. The accompanying selected financial data and Management’s Discussion and Analysis reflects the changes due to the implementation.
The following table sets forth selected historical financial data as of and for each of the five years ended December 31, 2009.2011. The financial data for the fiscal years ended 2005, 2006, 2007, 2008, 2009, 2010, and 20092011 have been derived from our audited consolidated financial statements. You should read the information set forth below in conjunction with our “Management’s Discussion and Analysis of Financial Condition and Results of Operations” and our consolidated financial statements and the related notes to those consolidated financial statements included in this Form 10-K.
| For the year ended December 31, | ||||||||||||||||||||
| 2007 | 2008 | 2009 | 2010 | 2011 | ||||||||||||||||
| (audited) | (audited) | (audited) | (audited) | (audited) | ||||||||||||||||
| (in thousands, except for per share data) | ||||||||||||||||||||
Operating data: | ||||||||||||||||||||
Revenues: | ||||||||||||||||||||
Site leasing | $ | 321,818 | $ | 395,541 | $ | 477,007 | $ | 535,444 | $ | 616,294 | ||||||||||
Site development | 86,383 | 79,413 | 78,506 | 91,175 | 81,876 | |||||||||||||||
|
|
|
|
|
|
|
|
|
| |||||||||||
Total revenues | 408,201 | 474,954 | 555,513 | 626,619 | 698,170 | |||||||||||||||
|
|
|
|
|
|
|
|
|
| |||||||||||
Operating expenses: | ||||||||||||||||||||
Cost of revenues (exclusive of depreciation, accretion and amortization shown below): | ||||||||||||||||||||
Cost of site leasing | 88,006 | 96,175 | 111,842 | 119,141 | 131,916 | |||||||||||||||
Cost of site development | 75,347 | 71,990 | 68,701 | 80,301 | 71,005 | |||||||||||||||
Selling, general and administrative | 45,564 | 48,721 | 52,785 | 58,209 | 62,828 | |||||||||||||||
Acquisition related expenses | 5 | 120 | 4,810 | 10,106 | 7,144 | |||||||||||||||
Asset impairment | — | 921 | 3,884 | 5,862 | 5,472 | |||||||||||||||
Depreciation, accretion and amortization | 169,232 | 211,445 | 258,537 | 278,727 | 309,146 | |||||||||||||||
|
|
|
|
|
|
|
|
|
| |||||||||||
Total operating expenses | 378,154 | 429,372 | 500,559 | 552,346 | 587,511 | |||||||||||||||
|
|
|
|
|
|
|
|
|
| |||||||||||
Operating income | 30,047 | 45,582 | 54,954 | 74,273 | 110,659 | |||||||||||||||
|
|
|
|
|
|
|
|
|
| |||||||||||
Other income (expense): | ||||||||||||||||||||
Interest income | 10,182 | 6,883 | 1,123 | 432 | 136 | |||||||||||||||
Interest expense | (93,063 | ) | (105,328 | ) | (130,853 | ) | (149,921 | ) | (160,896 | ) | ||||||||||
Non-cash interest expense | (13,402 | ) | (33,309 | ) | (49,897 | ) | (60,070 | ) | (63,629 | ) | ||||||||||
Amortization of deferred financing fees | (8,162 | ) | (10,746 | ) | (10,456 | ) | (9,099 | ) | (9,188 | ) | ||||||||||
(Loss) gain from extinguishment of debt, net | (431 | ) | 44,269 | (5,661 | ) | (49,060 | ) | (1,696 | ) | |||||||||||
Other income (expense) | (15,777 | ) | (13,478 | ) | 163 | 29 | (165 | ) | ||||||||||||
|
|
|
|
|
|
|
|
|
| |||||||||||
Total other expense | (120,653 | ) | (111,709 | ) | (195,581 | ) | (267,689 | ) | (235,438 | ) | ||||||||||
|
|
|
|
|
|
|
|
|
| |||||||||||
Loss before provision for income taxes | (90,606 | ) | (66,127 | ) | (140,627 | ) | (193,416 | ) | (124,779 | ) | ||||||||||
Provision for income taxes | (868 | ) | (1,037 | ) | (492 | ) | (1,005 | ) | (2,113 | ) | ||||||||||
|
|
|
|
|
|
|
|
|
| |||||||||||
Net loss | (91,474 | ) | (67,164 | ) | (141,119 | ) | (194,421 | ) | (126,892 | ) | ||||||||||
Net loss (income) attributable to the noncontrolling interest | — | — | 248 | (253 | ) | 436 | ||||||||||||||
|
|
|
|
|
|
|
|
|
| |||||||||||
Net loss attributable to SBA Communications Corporation | $ | (91,474 | ) | $ | (67,164 | ) | $ | (140,871 | ) | $ | (194,674 | ) | $ | (126,456 | ) | |||||
|
|
|
|
|
|
|
|
|
| |||||||||||
Net loss per common share attributable to SBA Communications Corporation: | ||||||||||||||||||||
Basic and diluted | $ | (0.87 | ) | $ | (0.61 | ) | $ | (1.20 | ) | $ | (1.68 | ) | $ | (1.13 | ) | |||||
|
|
|
|
|
|
|
|
|
| |||||||||||
Basic and diluted weighted average number of common shares | 104,743 | 109,882 | 117,165 | 115,591 | 111,595 | |||||||||||||||
|
|
|
|
|
|
|
|
|
| |||||||||||
Operating data: Revenues: Site leasing Site development Total revenues Operating expenses: Cost of revenues (exclusive of depreciation, accretion and amortization shown below): Cost of site leasing Cost of site development Selling, general and administrative Acquisition related expenses Restructuring and other charges (credits) Asset impairment Depreciation, accretion and amortization Total operating expenses Operating income Other income (expense): Interest income Interest expense Non-cash interest expense Amortization of deferred financing fees (Loss) gain from extinguishment of debt, net Other income (expense) Total other expense Loss from continuing operations before income taxes Provision for income taxes Loss from continuing operations Loss from discontinued operations, net of income taxes Net loss Less: Net loss attributable to the noncontrolling interest Net loss attributable to SBA Communications Corporation Basic and diluted loss per common share amounts: Loss from continuing operations Loss from discontinued operations Net loss per common share Basic and diluted weighted average shares outstanding For the year ended December 31, 2005 2006 2007 2008 2009 (audited) (audited) (audited) (audited) (audited) (as adjusted) (as adjusted) (in thousands, except for per share data) $ 161,277 $ 256,170 $ 321,818 $ 395,541 $ 477,007 98,714 94,932 86,383 79,413 78,506 259,991 351,102 408,201 474,954 555,513 47,259 70,663 88,006 96,175 111,842 92,693 85,923 75,347 71,990 68,701 28,178 42,277 45,564 48,721 52,785 — — 5 120 4,810 50 (357 ) — — — 398 — — 921 3,884 87,218 133,088 169,232 211,445 258,537 255,796 331,594 378,154 429,372 500,559 4,195 19,508 30,047 45,582 54,954 2,096 3,814 10,182 6,883 1,123 (40,511 ) (81,283 ) (93,063 ) (105,328 ) (130,853 ) (26,234 ) (6,845 ) (13,402 ) (33,309 ) (49,897 ) (2,850 ) (11,584 ) (8,162 ) (10,746 ) (10,456 ) (29,271 ) (57,233 ) (431 ) 44,269 (5,661 ) 31 692 (15,777 ) (13,478 ) 163 (96,739 ) (152,439 ) (120,653 ) (111,709 ) (195,581 ) (92,544 ) (132,931 ) (90,606 ) (66,127 ) (140,627 ) (2,104 ) (517 ) (868 ) (1,037 ) (492 ) (94,648 ) (133,448 ) (91,474 ) (67,164 ) (141,119 ) (61 ) — — — — (94,709 ) (133,448 ) (91,474 ) (67,164 ) (141,119 ) — — — — 248 $ (94,709 ) $ (133,448 ) $ (91,474 ) $ (67,164 ) $ (140,871 ) $ (1.28 ) $ (1.36 ) $ (0.87 ) $ (0.61 ) $ (1.20 ) — — — — — $ (1.28 ) $ (1.36 ) $ (0.87 ) $ (0.61 ) $ (1.20 ) 73,823 98,193 104,743 109,882 117,165
| 0,000,000 | 0,000,000 | 0,000,000 | 0,000,000 | 0,000,000 | ||||||||||||||||
| As of December 31, | ||||||||||||||||||||
| 2007 | 2008 | 2009 | 2010 | 2011 | ||||||||||||||||
| (audited) | (audited) | (audited) | (audited) | (audited) | ||||||||||||||||
| (in thousands) | ||||||||||||||||||||
Balance Sheet Data: | ||||||||||||||||||||
Cash and cash equivalents | $ | 70,272 | $ | 78,856 | $ | 161,317 | $ | 64,254 | $ | 47,316 | ||||||||||
Short-term investments | 55,142 | 162 | 5,352 | 4,016 | 5,773 | |||||||||||||||
Restricted cash – current(1) | 37,601 | 38,599 | 30,285 | 29,456 | 22,266 | |||||||||||||||
Property and equipment, net | 1,191,969 | 1,502,672 | 1,496,938 | 1,534,318 | 1,583,393 | |||||||||||||||
Intangibles, net | 868,999 | 1,425,132 | 1,435,591 | 1,500,012 | 1,639,784 | |||||||||||||||
Total assets | 2,382,863 | 3,207,829 | 3,313,646 | 3,400,175 | 3,606,399 | |||||||||||||||
Total debt | 1,844,573 | 2,392,230 | 2,489,050 | 2,827,450 | 3,354,485 | |||||||||||||||
Total shareholders’ equity (deficit)(2) | 396,357 | 650,510 | 599,949 | 317,110 | (11,313 | ) | ||||||||||||||
Balance Sheet Data: Cash and cash equivalents Short-term investments Restricted cash(1) Property and equipment, net Intangibles, net Total assets Total debt Total shareholders’ equity(2) Other Data: Cash provided by (used in): Operating activities Investing activities Financing activities As of December 31, 2005 2006 2007 2008 2009 (audited) (audited) (audited) (audited) (audited) (as adjusted) (as adjusted) (in thousands) $ 45,934 $ 46,148 $ 70,272 $ 78,856 $ 161,317 19,777 — 55,142 162 5,352 19,512 34,403 37,601 38,599 30,285 728,333 1,105,942 1,191,969 1,502,672 1,496,938 31,491 724,872 868,999 1,425,132 1,435,591 952,536 2,046,292 2,382,863 3,207,829 3,313,646 784,392 1,555,000 1,844,573 2,392,230 2,489,050 81,431 385,921 396,357 650,510 599,949 For the year ended December 31, 2005 2006 2007 2008 2009 (audited) (audited) (audited) (audited) (audited) (as adjusted) (as adjusted) (in thousands) $ 49,767 $ 73,730 $ 122,934 $ 173,696 $ 219,558 (99,283 ) (738,353 ) (301,884 ) (580,549 ) (226,075 ) 25,823 664,837 203,074 415,437 88,978
| 0,000,000 | 0,000,000 | 0,000,000 | 0,000,000 | 0,000,000 | ||||||||||||||||
| For the year ended December 31, | ||||||||||||||||||||
| 2007 | 2008 | 2009 | 2010 | 2011 | ||||||||||||||||
| (audited) | (audited) | (audited) | (audited) | (audited) | ||||||||||||||||
| (in thousands) | ||||||||||||||||||||
Other Data: | ||||||||||||||||||||
Cash provided by (used in): | ||||||||||||||||||||
Operating activities | $ | 122,934 | $ | 173,696 | $ | 222,572 | $ | 201,140 | $ | 249,058 | ||||||||||
Investing activities | (301,884 | ) | (580,549 | ) | (229,075 | ) | (425,039 | ) | (507,888 | ) | ||||||||||
Financing activities | 203,074 | 415,437 | 88,978 | 126,821 | 242,047 | |||||||||||||||
| (1) | Restricted cash of $22.3 million as of December 31, 2011 consisted of $21.4 million related to 2010 Tower Securities loan requirements and $0.9 million related to surety bonds issued for our benefit. Restricted cash of $29.5 million as of December 31, 2010 consisted of $28.6 million related to 2010 Tower Securities loan requirements and $0.9 million related to surety bonds issued for our benefit. Restricted cash of $30.3 million as of December 31, 2009 consisted of $29.1 million related to CMBS Mortgage loan requirements and $1.2 million related to surety bonds issued for our benefit. Restricted cash of $38.6 million as of December 31, 2008 consisted of $36.2 million related to CMBS Mortgage loan requirements and $2.4 million related to surety bonds issued for our benefit. Restricted cash of $37.6 million as of December 31, 2007 consisted of $35.3 million related to CMBS Mortgage loan requirements and $2.3 million related to surety bonds issued for our benefit. |
| (2) | Includes deferred loss from the termination of nine interest rate swap agreements of $4.3 million as of December 31, 2009, $7.4 million as of December 31, 2008 and $10.2 million as of December 31, |
ITEM 7. MANAGEMENT’S DISCUSSION AND ANALYSIS OF FINANCIAL CONDITION AND RESULTS OF OPERATIONS
The following discussion of our financial condition and results of operations should be read in conjunction with the information contained in our consolidated financial statements and the notes thereto. The following discussion includes forward-looking statements that involve certain risks and uncertainties, including, but not limited to, those described in Item 1A. Risk Factors. Our actual results may differ materially from those discussed below. See “Special Note Regarding Forward-Looking Statements” and Item 1A. Risk Factors.
We are a leading independent owner and operator of wireless communications towers. Our principal operations are in the Continental United States.States and its territories. In addition, we haveown towers in Canada, Puerto RicoCosta Rica, El Salvador, Guatemala, Nicaragua and the U.S. Virgin Islands.Panama. Our primary business line is our site leasing business, which contributed approximately 97.4%97.8% of our total segment operating profit for the year ended December 31, 2009.2011. In our site leasing business, we lease antenna space to wireless service providers on towers and other structures that we own, manage or lease from others. The towers that we own have been constructed by us at the request of a wireless service provider, built or constructed based on our own initiative or acquired. As of December 31, 2009,2011, we owned 8,32410,524 tower sites, the substantial majority of which have been built by us or built by other tower owners or operators who, like us, have built such towers to lease space to multiple wireless service providers. As of December 31, 2009,2011, we also managed or leased approximately 5,1004,800 actual or potential communications sites, approximately 550500 of which were revenue producing as of December 31, 2009.2011. Our other business line is our site development business, through which we assist wireless service providers in developing and maintaining their own wireless service networks.
Site Leasing Services
Our primary focus is the leasing of antenna space on our multi-tenant towers to a variety of wireless service providers under long-term lease contracts. Site leasing revenues are received primarily from wireless service provider tenants, including AT&T, Sprint, T-MobileVerizon Wireless and Verizon Wireless.T-Mobile. Wireless service providers enter into numerous different tenant leases with us, each of which relates to the lease or use of space at an individual tower site. Tenant leases are generally for an initial term of five years with five 5-year renewal periods at the option of the tenant. These tenant leases typically contain specific rent escalators, which average 3% - 4%3-4% per year, including the renewal option periods. Tenant leases are generally paid on a monthly basis and revenue from site leasing is recorded monthly on a straight-line basis over the current term of the related lease agreements. Rental amounts received in advance are recorded in deferred revenue.
Cost of site leasing revenue primarily consists of:
Rental payments on ground and other underlying property leases;
Straight-line rent adjustment for the difference between rental payments made and the expense recorded as if the payments had been made evenly throughout the minimum lease term (which may include renewal terms) of the underlying property leases;
Property taxes;
Site maintenance and monitoring costs (exclusive of employee related costs);
Utilities;
Property insurance; and
Deferred lease origination cost amortization.
For any given tower, such costs are relatively fixed over a monthly or an annual time period. As such, operating costs for owned towers do not generally increase significantly as a result of adding additional customers to the tower. The amount of other direct costs associated with operating a tower varies from site to site depending on the taxing jurisdiction and the height and age of the tower but typically do not make up a large percentage of total operating costs. The ongoing maintenance requirements are typically minimal and include replacing lighting systems, painting a tower or upgrading or repairing an access road or fencing. Lastly, groundGround leases are generally for an initial term of five years or more with multiple renewal terms of five year periods at our option and provide for rent escalators which typically average 3% - 4%3-4% annually or provide for term escalators of approximately 15%. For the quarter ended December 31, 2011, approximately 70.0% of our tower sites were located on parcels of land that we own, land subject to perpetual easement, or parcels of land in which we have a leasehold interest that extends beyond 20 years. For any given tower, costs are relatively fixed over a monthly or an annual time period. As such, operating costs for owned towers do not generally increase as a result of adding additional customers to the tower. The amount of direct costs associated with operating a tower varies from site to site depending on the tax jurisdiction and the height and age of the tower. The ongoing maintenance requirements are typically minimal and include replacing lighting systems, painting a tower or repairing an access road or fencing.
OurAs indicated in the table below, our site leasing business generates substantially all of our segment operating profit. The table below details the percentage of total company revenues and total segment operating profit contributed by the site leasing business over the last three years.profit. For information regarding our operating segments, see Note 2322 of our Notes to Consolidated Financial Statements included in this annual report.
| Revenues | ||||||||||||||||||||||||
| Revenues | For the year ended December 31, | |||||||||||||||||||||||
| For the year ended December 31, | 2009 | 2010 | 2011 | |||||||||||||||||||||
| 2009 | 2008 | 2007 | (in thousands) | |||||||||||||||||||||
| (in thousands) | ||||||||||||||||||||||||
Site leasing revenue | $ | 477,007 | $ | 395,541 | $ | 321,818 | $ | 477,007 | $ | 535,444 | $ | 616,294 | ||||||||||||
Total revenues | $ | 555,513 | $ | 474,954 | $ | 408,201 | $ | 555,513 | $ | 626,619 | $ | 698,170 | ||||||||||||
Site leasing revenue percentage of total revenues | 85.9 | % | 83.3 | % | 78.8 | % | 85.9 | % | 85.4 | % | 88.3 | % | ||||||||||||
| Segment Operating Profit | ||||||||||||||||||||||||
| Segment Operating Profit | For the year ended December 31, | |||||||||||||||||||||||
| For the year ended December 31, | 2009 | 2010 | 2011 | |||||||||||||||||||||
| 2009 | 2008 | 2007 | (in thousands) | |||||||||||||||||||||
| (in thousands) | ||||||||||||||||||||||||
Site leasing segment operating profit(1) | $ | 365,165 | $ | 299,366 | $ | 233,812 | $ | 365,165 | $ | 416,303 | $ | 484,378 | ||||||||||||
Total segment operating profit(1) | $ | 374,970 | $ | 306,789 | $ | 244,848 | $ | 374,970 | $ | 427,177 | $ | 495,248 | ||||||||||||
Site leasing segment operating profit percentage of total segment operating profit(1) | 97.4 | % | 97.6 | % | 95.5 | % | 97.4 | % | 97.5 | % | 97.8 | % | ||||||||||||
| (1) | Site leasing segment operating profit and total segment operating profit are non-GAAP financial measures. We reconcile these measures and other Regulation G disclosures in this annual report in the section entitled |
We believe that over the long-term, site leasing revenues will continue to grow as wireless service providers lease additional antenna space on our towers due to increasing minutes of network use and data transfer, network expansion and network coverage requirements. We believe our site leasing business is characterized by stable and long-term recurring revenues, predictable operating costs and minimal non-discretionary capital expenditures. Due to the relatively young age and mix of our tower portfolio, we expect future expenditures required to maintain these towers to be minimal. Consequently, we expect to grow our cash flows by adding tenants to our towers at minimal incremental costs by using existing tower capacity or requiring wireless service providers to bear all or a portion of the cost of tower modifications. Furthermore, because our towers are strategically positioned and our customers typically do not re-locate,relocate, we have historically experienced low customer churntenant lease terminations as a percentage of revenue.
Site Development Services
Our site development business is complementary to our site leasing business and provides us the ability to keep in close contact with the wireless service providers who generate substantially all of our site leasing revenue and to capture ancillary revenues that are generated by our site leasing activities, such as antenna and equipment installation at our tower locations. Our site development business consists of two segments, site development consulting and site development construction. Site development services revenues are received primarily from providing a full range of end to end services to wireless service providers or companies providing development or
project management services to wireless service providers. We principally perform services for third parties in our core, historical areas of wireless expertise, specifically, site acquisition, zoning, technical services and construction. Our site development business consists of two segments, site development consulting and site development construction.
Our site development customers engage us on a project-by-project basis and a customer can generally terminate an assignment at any time without penalty. Site development projects, both consulting and construction, include contracts on a time and materials basis or a fixed price basis. The majority of our site development services are billed on a fixed price basis. Time and materials based site development contracts are billed and revenue is recognized at contractual rates as the services are rendered. Our site development projects generally take from three to twelve months to complete. For those site development consulting contracts in which we perform work on a fixed price basis, we recognize revenue based on the completion of agreed upon phases of the project on a per site basis.
Our revenue from site development construction contracts is recognized on the percentage-of-completion method of accounting, determined by the percentage of cost incurred to date compared to management’s estimated total cost for each contract. This method is used because management considers total cost to be the best available measure of progress on the contracts. These amounts are based on estimates, and the uncertainty inherent in the estimates initially is reduced as work on the contracts nears completion. Revenue from our site development construction business may fluctuate from period to period depending on construction activities, which are a function of the timing and amount of our clients’ capital expenditures, the number and significance of active customer engagements during a period, weather and other factors.
Cost of site development consulting revenue and construction revenue includes all costs of materials, salaries and labor costs, including payroll taxes, subcontract labor, vehicle expense and other costs directly and indirectly related to the projects. All costs related to site development consulting contracts and construction contracts are recognized as incurred.
The table below provides the percentage of total company revenues contributed by site development services over the last three years. For information regarding our operating segments, see Note 2322 of our Notes to Consolidated Financial Statements included in this annual report.
| Percentage of Revenues | ||||||||||||||||||||||||
| Percentage of Revenues | For the year ended December 31, | |||||||||||||||||||||||
| For the year ended December 31, | 2009 | 2010 | 2011 | |||||||||||||||||||||
| 2009 | 2008 | 2007 | (in thousands) | |||||||||||||||||||||
| (in thousands) | ||||||||||||||||||||||||
Site development consulting | $ | 17,408 | $ | 18,754 | $ | 24,349 | $ | 17,408 | $ | 19,210 | $ | 17,272 | ||||||||||||
Site development construction | $ | 61,098 | $ | 60,659 | $ | 62,034 | $ | 61,098 | $ | 71,965 | $ | 64,604 | ||||||||||||
Total revenues | $ | 555,513 | $ | 474,954 | $ | 408,201 | $ | 555,513 | $ | 626,619 | $ | 698,170 | ||||||||||||
Site development consulting | 3.1 | % | 3.9 | % | 6.0 | % | ||||||||||||||||||
Site development construction | 11.0 | % | 12.8 | % | 15.2 | % | ||||||||||||||||||
Site development consulting revenue percentage of total | 3.1 | % | 3.1 | % | 2.5 | % | ||||||||||||||||||
Site development construction revenue percentage of total | 11.0 | % | 11.5 | % | 9.3 | % | ||||||||||||||||||
International Operations
As of December 31, 2011, we had operations in Canada, Costa Rica, El Salvador, Nicaragua, Guatemala and Panama. Our operations in these countries are solely in the site leasing business, and we expect to expand operations through new builds and acquisitions. Tenant leases in the Canadian market typically have similar terms and conditions as those in the United States, with an initial term of five years, and specific rent escalators. Tenant leases in Central America typically have a ten year initial term with similar renewal terms and rent escalators as those in the United States and Canada.
In our Central American markets, significantly all of our revenue, expenses, and capital expenditures arising from our new build activities are denominated in U.S. dollars. Specifically, our ground leases, our tenant leases and most of our tower related expenses are due, and paid, in U.S. dollars. In our Central American markets, our local currency obligations are principally limited to (1) permitting and other local fees, (2) utilities and (3) taxes. In our Canadian operations, significantly all of our revenue, expenses and capital expenditures, including tenant leases, ground leases and other tower-related expenses, are denominated in Canadian dollars.
Critical Accounting Policies and Estimates
We have identified the policies and significant estimation processes below as critical to our business operations and the understanding of our results of operations. The listing is not intended to be a comprehensive list. In many cases, the accounting treatment of a particular transaction is specifically dictated by accounting principles generally accepted in the United States, with no need for management’s judgment in their application. In other cases, management is required to exercise judgment in the application of accounting principles with respect to particular transactions. The impact and any associated risks related to these policies on our business operations is discussed throughout “Management’s Discussion and Analysis of Financial Condition and Results of Operations” where such policies affect reported and expected financial results. For a detailed discussion on the
application of these and other accounting policies, see Note 3 in the Notes to2 of our Consolidated Financial Statements for the year ended December 31, 2009,2011, included herein. Our preparation of our financial statements requires us to make estimates and assumptions that affect the reported amount of assets and liabilities, disclosure of contingent assets and liabilities at the date of our financial statements, and the reported amounts of revenue and expenses during the reporting periods. Management bases its estimates on historical experience and on various other assumptions that are believed to be reasonable under the circumstances. There can be no assurance that actual results will not differ from those estimates and such differences could be significant.
Construction Revenue Recognition and Accounts Receivable
Revenue from site leasing is recorded monthly and recognized on a straight-line basis over the current term of the related lease agreements, which are generally five years. Receivables recorded related to the straight-lining of site leases are reflected in other assets on the Consolidated Balance Sheets. Rental amounts received in advance are recorded as deferred revenue on the Consolidated Balance Sheets.
Site development projects in which we perform consulting services include contracts on a time and materials basis or a fixed price basis. Time and materials based contracts are billed at contractual rates as the services are rendered. For those site development contracts in which we perform work on a fixed price basis, site development billing (and revenue recognition) is based on the completion of agreed upon phases of the project on a per site basis. Upon the completion of each phase on a per site basis, we recognize the revenue related to that phase. Site development projects generally take from 3 to 12 months to complete.
Revenue from construction projects is recognized usingon the percentage-of-completion method of accounting, determined by the percentage of cost incurred to date compared to management’s estimated total cost for each contract. This method is used because we considermanagement considers total cost to be the best available measure of
progress on each contract.the contracts. These amounts are based on estimates, and the uncertainty inherent in the estimates initially is reduced as work on each contractthe contracts nears completion. The asset “Costs“costs and estimated earnings in excess of billings on uncompleted contracts” represents expensescosts incurred and revenues recognized in excess of amounts billed. The liability “Billings“billings in excess of costs and estimated earnings on uncompleted contracts”contracts,” included within other current liabilities on our Consolidated Balance Sheets, represents billings in excess of costs incurred and revenues recognized. Provisions for estimated losses on uncompleted contracts are made in the period in which such losses are determined to be probable.
AllowanceOn October 31, 2011, we entered into a Master Amendment with one of our wireless service provider customers. The Master Amendment serves as a separate amendment to each individual existing tenant lease agreement that we are currently a party to with that customer. Among other items, the Master Amendment (1) extends the current term of the individual leases, (2) permits the customer limited early termination rights which will be exercisable over a multi-year period, commencing in the second half of 2013, on a specific number of the existing leases, (3) allows the customer to make certain specific equipment changes at the tower sites, and (4) requires increases to the monthly lease rates to be paid by the customer. The customer’s early termination rights are limited with respect to the aggregate number of leases that may be terminated and the number that may be terminated in any quarter. The specific leases to be terminated early and the timing of such terminations has not been determined as of the date of this filing. As a result, for Doubtful Accountsaccounting and financial statement purposes, we have made assumptions with regard to the leases to be terminated and the timing of the terminations. We have assumed that the customer will terminate the maximum number of leases allowable in each quarter, selecting the highest rental rate leases at the earliest allowable dates. We believe that these assumptions will ensure that only the minimum known revenue for the pool of leases covered by the Master Agreement will be accrued on a straight-line basis. Our balance sheet and statement of operations reflect these assumptions. The actual leases that the customer terminates and the timing and number of terminations may or may not be those that we have identified in our assumptions. We will monitor actual results and elections under the Master Amendment and record any differences from previously made assumptions on a quarterly basis. To the extent that the actual results materially differ from the assumptions made, we will disclose the impact of these adjustments.
We perform periodic credit evaluations of our customers. We continuously monitor collections and payments from our customers and maintain an allowance for estimated credit losses based upon our historical experience and any specific customer collection issues that we have identified. Establishing reserves against specific accounts receivable and the overall adequacy of our allowance is a matter of judgment.
Asset Impairment
We evaluate the potential impairment of individual long-lived assets, principally the tower sites. We record an impairment charge when we believe an investment in towers or intangible assets, or construction-in-process, has been impaired, such that future undiscounted cash flows would not recover the then current carrying value of the investment in the tower site. We consider many factors and make certain assumptions when making this assessment, including but not limited to: general market and economic conditions, historical operating results, geographic location, lease-up potential and expected timing of lease-up. In addition, we make certain assumptions in determining an asset’s fair value for purposes of calculating the amount of an impairment charge. Changes in those assumptions or market conditions may result in a fair value which is different from management’s estimates. Future adverse changes in market conditions could result in losses or an inability to recover the carrying value, thereby possibly requiring an impairment charge in the future. In addition, if our assumptions regarding future undiscounted cash flows and related assumptions are incorrect, a future impairment charge may be required.
Property Tax Expense
We typically receive notifications and invoices in arrears for property taxes associated with the tangible personal property and real property used in our site leasing business. As a result, we recognize property tax expense, which is reflected as a component of site leasing cost of revenue, based on our best estimate of anticipated property tax payments related to the current period. We consider several factors in establishing this estimate, including our historical level of incurred property taxes, the location of the property, our awareness of jurisdictional property value assessment methods and industry related property tax information. If our estimates regarding anticipated property tax expenses are incorrect, a future increase or decrease in site leasing cost of revenue may be required.
KEY PERFORMANCE INDICATORS
Non-GAAP Financial Measures
This report contains certain non-GAAP measures, including Segment Operating Profit and Adjusted EBITDA information. We have provided below a description of such non-GAAP measures, a reconciliation of such non-GAAP measures to their most directly comparable GAAP measures and an explanation as to why management utilizes these measures.
Segment Operating Profit:
We believe that Segment Operating Profit is an indicator of the operating performance of our site leasing and site development segments and is used to provide management with the ability to monitor the operating results and margin of each segment, while excluding the impact of depreciation, accretion and amortization, which is largely fixed and non-cash in nature. Segment Operating Profit is not intended to be an alternative measure of revenue or segment gross profit as determined in accordance with GAAP.
| For the year ended December 31, | Dollar Change | Percentage Change | For the year ended December 31, | Dollar Change | Percentage Change | ||||||||||||||||||||||||||||||||||||||||||||||||||||
| 2009 | 2008 | 2008 | 2007 | For the year ended | For the year ended | ||||||||||||||||||||||||||||||||||||||||||||||||||||
| (in thousands) | (in thousands) | December 31, | Dollar | Percentage | December 31, | Dollar | Percentage | ||||||||||||||||||||||||||||||||||||||||||||||||||
Segment Operating Profit | 2011 | 2010 | Change | Change | 2010 | 2009 | Change | Change | |||||||||||||||||||||||||||||||||||||||||||||||||
| (in thousands) | (in thousands) | ||||||||||||||||||||||||||||||||||||||||||||||||||||||||
Site leasing | $ | 365,165 | $ | 299,366 | $ | 65,799 | 22.0 | % | $ | 299,366 | $ | 233,812 | $ | 65,554 | 28.0 | % | $ | 484,378 | $ | 416,303 | $ | 68,075 | 16.4 | % | $ | 416,303 | $ | 365,165 | $ | 51,138 | 14.0 | % | |||||||||||||||||||||||||
Site development consulting | 4,174 | 3,542 | 632 | 17.8 | % | 3,542 | 5,054 | (1,512 | ) | (29.9 | )% | 4,289 | 4,235 | 54 | 1.3 | % | 4,235 | 4,174 | 61 | 1.5 | % | ||||||||||||||||||||||||||||||||||||
Site development construction | 5,631 | 3,881 | 1,750 | 45.1 | % | 3,881 | 5,982 | (2,101 | ) | (35.1 | )% | 6,582 | 6,639 | (57 | ) | (0.9 | %) | 6,639 | 5,631 | 1,008 | 17.9 | % | |||||||||||||||||||||||||||||||||||
|
|
|
|
|
| ||||||||||||||||||||||||||||||||||||||||||||||||||||
Total | $ | 374,970 | $ | 306,789 | $ | 68,181 | 22.2 | % | $ | 306,789 | $ | 244,848 | $ | 61,941 | 25.3 | % | $ | 495,249 | $ | 427,177 | $ | 68,072 | 15.9 | % | $ | 427,177 | $ | 374,970 | $ | 52,207 | 13.9 | % | |||||||||||||||||||||||||
|
|
|
|
|
| ||||||||||||||||||||||||||||||||||||||||||||||||||||
The increase in site leasing segment operating profit of $65.8$68.1 million in 20092011 is primarily due to additional profit generated by the towers that we acquired or constructed in the latter half of 2010 and subsequent to December 31, 2010, organic site leasing growth from new leases and contractual rent escalators and lease amendments with current tenants which increased the related rent to reflect additional equipment added to our towers, control of our site leasing cost of revenue and the positive impact of our ground lease purchase program.
The increase in site leasing segment operating profit of $51.1 million in 2010 is primarily related to additional profit generated by the revenues from the towers that we acquired or constructed in the 2008 acquisitionslatter half of Optasite, Light Tower2009 and Tower Co and the other towers that we acquired or constructed subsequent to December 31, 2008,2009, organic site leasing growth from new leases and contractual rent escalators and lease amendments with current tenants which increased the related rent to reflect additional equipment added to our towers in the year ended December 31, 2009,2010, control of our site leasing cost of revenue and the positive impact of our ground lease purchase program.
The increase in site leasing segment operating profit of $65.6 million in 2008 compared to 2007 is primarily related to additional profit generated by the number of towers acquired and constructed for the year ended December 31, 2008, as well as additional revenue from the increased number of tenants and tenant equipment on our sites for the year ended December 31, 2008 compared to the same period of 2007 without a commensurate increase in site leasing cost of revenue.
Each respective Segment Operating Profit is defined as segment revenues less segment cost of revenues (excluding depreciation, accretion and amortization). Total Segment Operating Profit is the total of the operating profits of the three segments. The reconciliation of Segment Operating Profit is as follows:
| Site leasing segment | Site leasing segment | |||||||||||||||||||||||
| For the year ended December 31, | For the year ended December 31, | |||||||||||||||||||||||
| 2009 | 2008 | 2007 | 2011 | 2010 | 2009 | |||||||||||||||||||
| (in thousands) | (in thousands) | |||||||||||||||||||||||
Segment revenue | $ | 477,007 | $ | 395,541 | $ | 321,818 | $ | 616,294 | $ | 535,444 | $ | 477,007 | ||||||||||||
Segment cost of revenues (excluding depreciation, accretion and amortization) | (111,842 | ) | (96,175 | ) | (88,006 | ) | (131,916 | ) | (119,141 | ) | (111,842 | ) | ||||||||||||
|
|
| ||||||||||||||||||||||
Segment operating profit | $ | 365,165 | $ | 299,366 | $ | 233,812 | $ | 484,378 | $ | 416,303 | $ | 365,165 | ||||||||||||
|
|
| ||||||||||||||||||||||
Segment revenue Segment cost of revenues (excluding depreciation, accretion and amortization) Segment operating profit Segment revenue Segment cost of revenues (excluding depreciation, accretion and amortization) Segment operating profit Site development consulting segment For the year ended December 31, 2009 2008 2007 (in thousands) $ 17,408 $ 18,754 $ 24,349 (13,234 ) (15,212 ) (19,295 ) $ 4,174 $ 3,542 $ 5,054 Site development construction segment For the year ended December 31, 2009 2008 2007 (in thousands) $ 61,098 $ 60,659 $ 62,034 (55,467 ) (56,778 ) (56,052 ) $ 5,631 $ 3,881 $ 5,982
| Site development consulting segment | ||||||||||||
| For the year ended December 31, | ||||||||||||
| 2011 | 2010 | 2009 | ||||||||||
| (in thousands) | ||||||||||||
Segment revenue | $ | 17,272 | $ | 19,210 | $ | 17,408 | ||||||
Segment cost of revenues (excluding depreciation, accretion and amortization) | (12,984 | ) | (14,975 | ) | (13,234 | ) | ||||||
|
|
|
|
|
| |||||||
Segment operating profit | $ | 4,288 | $ | 4,235 | $ | 4,174 | ||||||
|
|
|
|
|
| |||||||
| Site development construction segment | ||||||||||||
| For the year ended December 31, | ||||||||||||
| 2011 | 2010 | 2009 | ||||||||||
| (in thousands) | ||||||||||||
Segment revenue | $ | 64,604 | $ | 71,965 | $ | 61,098 | ||||||
Segment cost of revenues (excluding depreciation, accretion and amortization) | (58,022 | ) | (65,326 | ) | (55,467 | ) | ||||||
|
|
|
|
|
| |||||||
Segment operating profit | $ | 6,582 | $ | 6,639 | $ | 5,631 | ||||||
|
|
|
|
|
| |||||||
Adjusted EBITDA
We define Adjusted EBITDA as net loss excluding the impact of net interest expenses, provision for taxes, depreciation, accretion and amortization, asset impairment and other charges, non-cash compensation, net loss from extinguishment of debt, other income and expenses, acquisition related expenses, non-cash straight-line leasing revenue and non-cash straight-line ground lease expense.
We believe that Adjusted EBITDA is an indicator of the financial performance of our core operations and reflects the changes in our operating results.businesses. Adjusted EBITDA is a component of the calculation that has been used by our lenders to determine compliance with certain covenants under our Senior Credit FacilityAgreement and Senior Notes. Adjusted EBITDA is not intended to be an alternative measure of operating income or gross profit margin as determined in accordance with GAAP.
The reconciliation of Adjusted EBITDA is as follows:
| For the year ended December 31, | ||||||||||||
| 2011 | 2010 | 2009 | ||||||||||
| (in thousands) | ||||||||||||
Net loss | $ | (126,892 | ) | $ | (194,421 | ) | $ | (141,119 | ) | |||
Interest income | (136 | ) | (432 | ) | (1,123 | ) | ||||||
Interest expense(1) | 233,713 | 219,090 | 191,206 | |||||||||
Depreciation, accretion and amortization | 309,146 | 278,727 | 258,537 | |||||||||
Asset impairment | 5,472 | 5,862 | �� | 3,884 | ||||||||
Provision for taxes(2) | 4,091 | 2,904 | 2,204 | |||||||||
Loss from extinguishment of debt, net | 1,696 | 49,060 | 5,661 | |||||||||
Acquisition related expenses | 7,144 | 10,106 | 4,810 | |||||||||
Non-cash compensation | 11,469 | 10,501 | 8,200 | |||||||||
Non-cash straight-line leasing revenue | (12,762 | ) | (5,289 | ) | (6,176 | ) | ||||||
Non-cash straight-line ground lease expense | 11,811 | 11,300 | 12,543 | |||||||||
Other expense (income) | 165 | (29 | ) | (163 | ) | |||||||
|
|
|
|
|
| |||||||
Adjusted EBITDA | $ | 444,917 | $ | 387,379 | $ | 338,464 | ||||||
|
|
|
|
|
| |||||||
| (1) | Interest expense includes cash interest expense, non-cash interest expense and amortization of deferred financing fees. |
| (2) | Includes $1,978, $1,899 and $1,712 of franchise taxes reflected on the Statement of Operations in selling, general and administrative expenses for the year ended 2011, 2010 and 2009, respectively. |
Adjusted EBITDA was $338.5$444.9 million for the year ended December 31, 20092011 as compared to $269.2$387.4 million for the year ended December 31, 2008.2010. The increase of $69.3$57.5 million is primarily the result of increased segment operating profit from our site leasing segment.
Adjusted EBITDA was $269.2$387.4 million for the year ended December 31, 20082010 as compared to $209.4$338.5 million for the year ended December 31, 2007.2009. The increase of $59.8$48.9 million is primarily the result of increased segment operating profit from our site leasing segment.
We define Adjusted EBITDA as net loss excluding the impact of net interest expenses (including amortization of deferred financing fees), provision for taxes, depreciation, accretion and amortization, asset impairment and other charges, non-cash compensation, loss (gain) from extinguishment of debt, net, other income and expenses, acquisition related expenses, non-cash straight-line leasing revenue and non-cash straight-line ground lease expense. Adjusted EBITDA excludes acquisition related costs which were previously capitalized but, commencing January 1, 2009, were required to be expensed and included within operating expenses pursuant to the adoption of new business combination accounting guidance. The reconciliation of Adjusted EBITDA is as follows:
Net loss Interest income Interest expense Depreciation, accretion and amortization Asset impairment Provision for taxes(1) Loss (gain) from extinguishment of debt, net Acquisition related costs(2) Non-cash compensation Non-cash leasing revenue Non-cash ground lease expense Other (income) expense Adjusted EBITDA For the year ended December 31, 2009 2008 2007 (as adjusted) (as adjusted) (in thousands) $ (141,119 ) $ (67,164 ) $ (91,474 ) (1,123 ) (6,883 ) (10,182 ) 191,206 149,383 114,627 258,537 211,445 169,232 3,884 921 — 2,204 2,371 1,993 5,661 (44,269 ) 431 4,810 120 5 8,200 7,207 6,612 (6,176 ) (7,810 ) (8,870 ) 12,543 10,387 11,248 (163 ) 13,478 15,777 $ 338,464 $ 269,186 $ 209,399
RESULTS OF OPERATIONS
Year Ended 20092011 Compared to Year Ended 20082010
| For the year ended December 31, | |||||||||||||||||||||||||||||||
| 2009 | 2008 | Dollar Change | Percentage Change | For the year ended December 31, | Dollar | Percentage | |||||||||||||||||||||||||
| (as adjusted) | 2011 | 2010 | Change | Change | |||||||||||||||||||||||||||
| (in thousands, except for percentages) | (in thousands, except for percentages) | ||||||||||||||||||||||||||||||
Revenues: | |||||||||||||||||||||||||||||||
Site leasing | $ | 477,007 | $ | 395,541 | $ | 81,466 | 20.6 | % | $ | 616,294 | $ | 535,444 | $ | 80,850 | 15.1 | % | |||||||||||||||
Site development consulting | 17,408 | 18,754 | (1,346 | ) | (7.2 | )% | 17,272 | 19,210 | (1,938 | ) | (10.1 | %) | |||||||||||||||||||
Site development construction | 61,098 | 60,659 | 439 | 0.7 | % | 64,604 | 71,965 | (7,361 | ) | (10.2 | %) | ||||||||||||||||||||
|
|
| |||||||||||||||||||||||||||||
Total revenues | 555,513 | 474,954 | 80,559 | 17.0 | % | 698,170 | 626,619 | 71,551 | 11.4 | % | |||||||||||||||||||||
|
|
| |||||||||||||||||||||||||||||
Operating expenses: | |||||||||||||||||||||||||||||||
Cost of revenues (exclusive of depreciation, accretion and amortization shown below): | |||||||||||||||||||||||||||||||
Cost of site leasing | 111,842 | 96,175 | 15,667 | 16.3 | % | 131,916 | 119,141 | 12,775 | 10.7 | % | |||||||||||||||||||||
Cost of site development consulting | 13,234 | 15,212 | (1,978 | ) | (13.0 | )% | 12,984 | 14,975 | (1,991 | ) | (13.3 | %) | |||||||||||||||||||
Cost of site development construction | 55,467 | 56,778 | (1,311 | ) | (2.3 | )% | 58,021 | 65,326 | (7,305 | ) | (11.2 | %) | |||||||||||||||||||
Selling, general and administrative | 52,785 | 48,721 | 4,064 | 8.3 | % | 62,828 | 58,209 | 4,619 | 7.9 | % | |||||||||||||||||||||
Asset impairment | 3,884 | 921 | 2,963 | 100.0 | % | 5,472 | 5,862 | (390 | ) | (6.7 | %) | ||||||||||||||||||||
Acquisition related expenses | 4,810 | 120 | 4,690 | 100.0 | % | 7,144 | 10,106 | (2,962 | ) | (29.3 | %) | ||||||||||||||||||||
Depreciation, accretion and amortization | 258,537 | 211,445 | 47,092 | 22.3 | % | 309,146 | 278,727 | 30,419 | 10.9 | % | |||||||||||||||||||||
|
|
| |||||||||||||||||||||||||||||
Total operating expenses | 500,559 | 429,372 | 71,187 | 16.6 | % | 587,511 | 552,346 | 35,165 | 6.4 | % | |||||||||||||||||||||
|
|
| �� | ||||||||||||||||||||||||||||
Operating income | 54,954 | 45,582 | 9,372 | 20.6 | % | 110,659 | 74,273 | 36,386 | 49.0 | % | |||||||||||||||||||||
|
|
| |||||||||||||||||||||||||||||
Other income (expense): | |||||||||||||||||||||||||||||||
Interest income | 1,123 | 6,883 | (5,760 | ) | (83.7 | )% | 136 | 432 | (296 | ) | (68.5 | %) | |||||||||||||||||||
Interest expense | (130,853 | ) | (105,328 | ) | (25,525 | ) | 24.2 | % | (160,896 | ) | (149,921 | ) | (10,975 | ) | 7.3 | % | |||||||||||||||
Non-cash interest expense | (49,897 | ) | (33,309 | ) | (16,588 | ) | 49.8 | % | (63,629 | ) | (60,070 | ) | (3,559 | ) | 5.9 | % | |||||||||||||||
Amortization of deferred financing fees | (10,456 | ) | (10,746 | ) | 290 | (2.7 | )% | (9,188 | ) | (9,099 | ) | (89 | ) | 1.0 | % | ||||||||||||||||
(Loss) gain from extinguishment of debt, net | (5,661 | ) | 44,269 | (49,930 | ) | (100.0 | )% | ||||||||||||||||||||||||
Other income (expense) | 163 | (13,478 | ) | 13,641 | 100.0 | % | |||||||||||||||||||||||||
Loss from extinguishment of debt, net | (1,696 | ) | (49,060 | ) | 47,364 | (96.5 | %) | ||||||||||||||||||||||||
Other (expense) income | (165 | ) | 29 | (194 | ) | (669.0 | %) | ||||||||||||||||||||||||
|
|
| |||||||||||||||||||||||||||||
Total other expense | (195,581 | ) | (111,709 | ) | (83,872 | ) | 75.1 | % | (235,438 | ) | (267,689 | ) | 32,251 | (12.0 | %) | ||||||||||||||||
|
|
| |||||||||||||||||||||||||||||
Loss before provision for income taxes | (140,627 | ) | (66,127 | ) | (74,500 | ) | 100.0 | % | (124,779 | ) | (193,416 | ) | 68,637 | (35.5 | %) | ||||||||||||||||
Provision for income taxes | (492 | ) | (1,037 | ) | 545 | (52.6 | )% | (2,113 | ) | (1,005 | ) | (1,108 | ) | 110.2 | % | ||||||||||||||||
|
|
| |||||||||||||||||||||||||||||
Net loss | (141,119 | ) | (67,164 | ) | (73,955 | ) | 100.0 | % | (126,892 | ) | (194,421 | ) | 67,529 | (34.7 | %) | ||||||||||||||||
Less: Net loss attributable to the noncontrolling interest | 248 | — | 248 | 100.0 | % | ||||||||||||||||||||||||||
Net loss (income) attributable to the noncontrolling interest | 436 | (253 | ) | 689 | (272.3 | %) | |||||||||||||||||||||||||
|
|
| |||||||||||||||||||||||||||||
Net loss attributable to SBA Communications Corporation | $ | (140,871 | ) | $ | (67,164 | ) | $ | (73,707 | ) | 100.0 | % | $ | (126,456 | ) | $ | (194,674 | ) | $ | 68,218 | (35.0 | %) | ||||||||||
|
|
| |||||||||||||||||||||||||||||
Revenues:
Site leasing revenue increased $81.5$80.9 million for the year ended December 31, 20092011 largely due to (i) revenues from the towers that we acquired in the 2008 acquisitions of Optasite, Light Tower and Tower Co and the other towers that we acquired or constructed subsequent to December 31, 2008 and (ii) organic site leasing growth from new leases and contractual rent escalators with current tenants and lease amendments with current tenants which increased the related rent to reflect additional equipment added to our towers. Average rents per tenant increasedtowers and (ii) revenues from the towers that we acquired or constructed in the year endedlatter half of 2010 and subsequent to December 31, 2009 due primarily to rent escalators, lease amendments and higher rents associated with new leases.2010.
Site development consulting revenue decreased $1.3$1.9 million and site development construction revenues decreased $7.4 million for the year ended December 31, 20092011, as compared to the same period in the prior year ended December 31, 2010, as a result of a lower volume of work. Site development construction revenues remained relatively stable for the year ended December 31, 2009 aswork performed compared to the year ended December 31, 2008.prior year.
Operating Expenses:
Site leasing cost of revenues increased $15.7$12.8 million primarily as a result of the growth in the number of tower sites owned by us, which was 8,32410,524 at December 31, 20092011 up from 7,8549,111 at December 31, 20082010 offset by the positive impact of our ground lease purchase program.
Site development consulting cost of revenues decreased $2.0 million and site development construction cost of revenues decreased by $2.0$7.3 million and $1.3 million, respectively, for the year ended December 31, 20092011, as compared to the same period in the prior year, as a result of a lower volume of work and continued effortperformed during 2011 as compared to manage and reduce fixed overhead costs.2010.
Selling, general, and administrative expenses increased $4.1$4.6 million primarily as a result of an increase in salaries, benefits and other employee related expenses resulting primarily from a higher number of employees, and increased non-cash compensation expense that we recognized for the year ended December 31, 2009 compared to the year ended December 31, 2008.as well as costs incurred in connection with our international expansion.
Acquisition related expenses of $4.8 million are associated with acquisitions which effective January 1, 2009, are required to be expensed and included within operating expenses. We had historically capitalized the majority of these expenses.
Asset impairment of $3.9decreased $3.0 million for the year ended December 31, 2009 is2011, as compared to the prior year, primarily as a result of the timing of due diligence and other acquisition related costs for towers acquired or under contract in 2011 compared to 2010.
We recognized an asset impairment charge of $5.5 million for the year ended December 31, 2011 and $5.9 million for the year ended December 31, 2010. These asset impairment charges resulted from a reevaluation of future cash flow expectations, using a discounted cash flow analysis, for 21those towers that have not achieved expected lease-up results, as determined using a discounted cash flow analysis compared to the related net book value of the tower assetsthose towers.
Depreciation, accretion and an impairment charge on our six DAS networks based on the estimated fair value of the DAS networks at December 31, 2009. Asset impairment of $0.9amortization expense increased $30.4 million to $309.1 million for the year ended December 31, 2008 is a result of a reevaluation of future cash flow expectations for eight towers that have not achieved expected lease-up results as determined using a discounted cash flow analysis compared to the related net book value of the tower asset and related intangibles.
Depreciation, accretion and amortization expense increased $47.1 million to $258.52011 from $278.7 million for the year ended December 31, 2009 from $211.4 million for the year ended December 31, 20082010 due to an increase in the number of towers and associated intangible assets we owned for the year ended December 31, 20092011 compared to those owned at December 31, 2008.2010.
Operating Income:
Operating income increased $9.4$36.4 million for year ended December 31, 20092011 to $55.0$110.7 million compared to $45.6$74.3 million for the year ended December 31, 20082010 primarily due to the result of higher segment operating profit in the site leasing segment offset by increases in depreciation, accretion and amortization expense, and selling, general and administrative expenses.
Other Income (Expense):
Interest income decreased $0.3 million for the year ended December 31, 2011 compared to the year ended December 31, 2010 primarily as a result of a lower amount of investments held during 2011 compared to 2010.
Interest expense for the year ended December 31, 2011 increased $11.0 million from the year ended December 31, 2010 primarily due to the higher weighted average amount of cash-interest bearing debt outstanding driven by an issuance of a new $500.0 million Term Loan in June 30, 2011. This increase was offset by a lower weighted average interest rate on borrowings for the year ended December 31, 2011 as compared to the year ended December 31, 2010.
Non-cash interest expense for the year ended December 31, 2011 increased $3.6 million from the year ended December 31, 2010 primarily as a result of accretion of debt discounts using the effective interest method on the 1.875% Notes, the 4.0% Notes, and the Senior Notes, offset by a reduction of accretion due to final payoff of the 0.375% Notes in December of 2010.
The loss from extinguishment of debt of $1.7 million for the year ended December 31, 2011 is associated with the repurchase of $15.0 million of the 1.875% Notes in the first quarter of 2011. The net loss from extinguishment of debt of $49.1 million for the year ended December 31, 2010 is associated with the repayment of the outstanding balance of $938.6 million in principal of our 2006 CMBS Certificates.
Net Loss:
Net loss was $126.9 million for the year ended December 31, 2011 as compared to $194.4 million for the year ended December 31, 2010. The net loss decreased in 2011 primarily due to an increase in site leasing segment operating profit and a decrease in loss from the extinguishment of debt, offset by increases in interest expense, non-cash interest expense, and depreciation, accretion and amortization expense.
Year Ended 2010 Compared to Year Ended 2009
| For the year ended December 31, | Dollar | Percentage | ||||||||||||||
| 2010 | 2009 | Change | Change | |||||||||||||
| (in thousands, except for percentages) | ||||||||||||||||
Revenues: | ||||||||||||||||
Site leasing | $ | 535,444 | $ | 477,007 | $ | 58,437 | 12.3 | % | ||||||||
Site development consulting | 19,210 | 17,408 | 1,802 | 10.4 | % | |||||||||||
Site development construction | 71,965 | 61,098 | 10,867 | 17.8 | % | |||||||||||
|
|
|
|
|
| |||||||||||
Total revenues | 626,619 | 555,513 | 71,106 | 12.8 | % | |||||||||||
|
|
|
|
|
| |||||||||||
Operating expenses: | ||||||||||||||||
Cost of revenues (exclusive of depreciation, accretion and amortization shown below): | ||||||||||||||||
Cost of site leasing | 119,141 | 111,842 | 7,299 | 6.5 | % | |||||||||||
Cost of site development consulting | 14,975 | 13,234 | 1,741 | 13.2 | % | |||||||||||
Cost of site development construction | 65,326 | 55,467 | 9,859 | 17.8 | % | |||||||||||
Selling, general and administrative | 58,209 | 52,785 | 5,424 | 10.3 | % | |||||||||||
Asset impairment | 5,862 | 3,884 | 1,978 | 50.9 | % | |||||||||||
Acquisition related expenses | 10,106 | 4,810 | 5,296 | 110.1 | % | |||||||||||
Depreciation, accretion and amortization | 278,727 | 258,537 | 20,190 | 7.8 | % | |||||||||||
|
|
|
|
|
| |||||||||||
Total operating expenses | 552,346 | 500,559 | 51,787 | 10.3 | % | |||||||||||
|
|
|
|
|
| |||||||||||
Operating income | 74,273 | 54,954 | 19,319 | 35.2 | % | |||||||||||
|
|
|
|
|
| |||||||||||
Other income (expense): | ||||||||||||||||
Interest income | 432 | 1,123 | (691 | ) | (61.5 | %) | ||||||||||
Interest expense | (149,921 | ) | (130,853 | ) | (19,068 | ) | 14.6 | % | ||||||||
Non-cash interest expense | (60,070 | ) | (49,897 | ) | (10,173 | ) | 20.4 | % | ||||||||
Amortization of deferred financing fees | (9,099 | ) | (10,456 | ) | 1,357 | (13.0 | %) | |||||||||
Loss from extinguishment of debt, net | (49,060 | ) | (5,661 | ) | (43,399 | ) | 766.6 | % | ||||||||
Other income | 29 | 163 | (134 | ) | (82.2 | %) | ||||||||||
|
|
|
|
|
| |||||||||||
Total other expense | (267,689 | ) | (195,581 | ) | (72,108 | ) | 36.9 | % | ||||||||
|
|
|
|
|
| |||||||||||
Loss before provision for income taxes | (193,416 | ) | (140,627 | ) | (52,789 | ) | 37.5 | % | ||||||||
Provision for income taxes | (1,005 | ) | (492 | ) | (513 | ) | 104.3 | % | ||||||||
|
|
|
|
|
| |||||||||||
Net loss | (194,421 | ) | (141,119 | ) | (53,302 | ) | 37.8 | % | ||||||||
Net (gain) loss attributable to the noncontrolling interest | (253 | ) | 248 | (501 | ) | (202.0 | %) | |||||||||
|
|
|
|
|
| |||||||||||
Net loss attributable to SBA Communications Corporation | $ | (194,674 | ) | $ | (140,871 | ) | $ | (53,803 | ) | 38.2 | % | |||||
|
|
|
|
|
| |||||||||||
Revenues:
Site leasing revenue increased $58.4 million for the year ended December 31, 2010 largely due to (i) revenues from the towers that we acquired or constructed in the latter half of 2009 or subsequent to December 31, 2009 and (ii) organic site leasing growth from new leases and contractual rent escalators with current tenants and lease amendments with current tenants which increased the related rent in connection with additional equipment added to our towers.
Site development consulting revenue increased $1.8 million and site development construction revenues increased $10.9 million for the year ended December 31, 2010, as compared to the year ended December 31, 2009, as a result of a higher volume of work associated with continued network expansion of the wireless carriers.
Operating Expenses:
Site leasing cost of revenues increased $7.3 million primarily as a result of the growth in the number of tower sites owned by us, which was 9,111 at December 31, 2010 up from 8,324 at December 31, 2009 offset by the positive impact of our ground lease purchase program.
Site development consulting cost of revenues increased $1.7 million and site development construction cost of revenues increased $9.9 million for the year ended December 31, 2010, as compared to the prior year, as a result of a higher volume of work performed during 2010 as compared to 2009.
Selling, general, and administrative expenses increased $5.4 million primarily as a result of an increase in salaries, benefits and other employee related expenses resulting primarily from a higher number of employees, increased non-cash compensation expense as well as costs incurred in connection with our international expansion.
Acquisition related expenses increased $5.3 million for the year ended December 31, 2010, as compared to the prior year, primarily as a result of an increase in the number of towers acquired as well as under contract for acquisition during 2010 as compared to 2009.
We recognized an asset impairment charge of $5.9 million for the year ended December 31, 2010 and $3.9 million for the year ended December 31, 2009. These asset impairment charges resulted from a reevaluation of (i) future cash flow expectations, using a discounted cash flow analysis, for those towers (59 towers in 2010 and 21 towers in 2009) that have not achieved expected lease-up results, compared to (ii) the related net book value of those towers. In addition, the asset impairment charge for 2009 included an impairment charge on our six DAS networks based on their estimated fair value at December 31, 2009.
Depreciation, accretion and amortization expense increased $20.2 million to $278.7 million for the year ended December 31, 2010 from $258.5 million for the year ended December 31, 2009 due to an increase in the number of towers and associated intangible assets owned for the year ended December 31, 2010 compared to those owned at December 31, 2009.
Operating Income:
Operating income increased $19.3 million for the year ended December 31, 2010 to $74.3 million compared to $55.0 million for the year ended December 31, 2009 primarily due to the result of higher segment operating profit in the site leasing segment partially offset by increases in depreciation, accretion and amortization expense, acquisition related expenses and selling, general and administrative expenses.
Other Income (Expense):
Interest income decreased $5.8$0.7 million for the year ended December 31, 20092010 compared to the year ended December 31, 2008. This decrease was2009 primarily theas a result of the lower weighted average interest rates offset by higher average invested funds during 20092010 compared to 2008.2009.
Interest expense for the year ended December 31, 20092010 increased $25.5$19.1 million from the year ended December 31, 2008. This increase is2009 primarily due to the higher interest rates on the mix of our outstanding debt and the higher weighted average amount of cash interestcash-interest bearing debt outstanding offset by the lower weighted average interest rate for the year ended December 31, 20092010 as compared to the year ended December 31, 2008.2009.
Non-cash interest expense for the year ended December 31, 20092010 increased $16.6$10.2 million from the year ended December 31, 2008. This increase2009 primarily reflects theas a result of accretion of debt discounts using the effective interest method on the 1.875% Notes, the 4.0% Notes, and the Senior Notes, which were issued in July 2009 and the 4.0% Notes which were issued in April 2009 and the Optasite Credit Facility
acquired in September 2008, offset by the impact of the repurchase of an aggregate of $319.6$107.7 million in principal of the 0.375% Notes during 2009 and repayment of the Optasite Credit Facility in the fourth quarterJuly 2009.
The loss from extinguishment of 2008 anddebt of $49.1 million for the year ended December 31, 2009.
2010 is primarily associated with the repayment of the outstanding balance of $938.6 million in principal of our 2006 CMBS Certificates. The net loss from extinguishment of debt of $5.7 million for the year ended December 31, 2009 includes a loss of $7.2 million related to the repurchases and subsequent payoff of our 2005 CMBS Certificates in July 2009, $2.7 million associated with the repurchase of $150.1 million in principal of our 2006 CMBS Certificates and $1.9 million related to the payoff of our Optasite Credit Facility in July 2009, offset slightly by a gain of $6.1 million associated with the repurchases of an aggregate of $107.7 million in principal of our 0.375% Notes. The net gain from extinguishment of debt of $44.3
Net Loss:
Net loss was $194.4 million for the year ended December 31, 2008 included $25.7 million related2010 as compared to the repurchase of $211.9 million in principal amount of our 0.375% Notes and $18.9 million related to the repurchases of $65.5 million of our CMBS Certificates offset by the write-off of deferred financing fees related to the portion of the debt extinguished and the reduction in the aggregate commitment of the lenders under the Senior Credit Facility as a result of Lehman Commercial Paper Inc.’s default of its funding obligations. See discussion in Note 13 to the Notes to the Consolidated Financial Statements for more information.
Other income (expense) for the year ended December 31, 2009 decreased $13.6 million from the year ended December 31, 2008. This decrease primarily reflects an other-than-temporary impairment charge on our investments in auction rate securities during 2008. See Note 5 to the Consolidated Financial Statements for more information on our investments in auction rate securities and this other-than-temporary impairment charge.
Net Loss:
Net loss was $141.1 million for the year ended December 31, 2009 as compared2009. The net loss increased in 2010 primarily due to $67.2 million for the year ended December 31, 2008. The increase in 2009 is primarily the result of: the 2009 net losses from the earlyloss on extinguishment of debt as opposed to net gains from the early extinguishment of debt in 2008,$49.1 million, increases in interest expense, non-cash interest expense, and depreciation, accretion and amortization expense partially offset by an increase in site leasing segment operating profit.
Year Ended 2008 Compared to Year Ended 2007
| For the year ended December 31, | Dollar Change | Percentage Change | |||||||||||||
| 2008 | 2007 | ||||||||||||||
| (as adjusted) | (as adjusted) | ||||||||||||||
| (in thousands, except for percentages) | |||||||||||||||
Revenues: | |||||||||||||||
Site leasing | $ | 395,541 | $ | 321,818 | $ | 73,723 | 22.9 | % | |||||||
Site development consulting | 18,754 | 24,349 | (5,595 | ) | (23.0 | )% | |||||||||
Site development construction | 60,659 | 62,034 | (1,375 | ) | (2.2 | )% | |||||||||
Total revenues | 474,954 | 408,201 | 66,753 | 16.4 | % | ||||||||||
Operating expenses: | |||||||||||||||
Cost of revenues (exclusive of depreciation, accretion and amortization shown below): | |||||||||||||||
Cost of site leasing | 96,175 | 88,006 | 8,169 | 9.3 | % | ||||||||||
Cost of site development consulting | 15,212 | 19,295 | (4,083 | ) | (21.2 | )% | |||||||||
Cost of site development construction | 56,778 | 56,052 | 726 | 1.3 | % | ||||||||||
Selling, general and administrative | 48,721 | 45,564 | 3,157 | 6.9 | % | ||||||||||
Asset impairment | 921 | — | 921 | 100.0 | % | ||||||||||
Acquisition related expenses | 120 | 5 | 115 | 100.0 | % | ||||||||||
Depreciation, accretion and amortization | 211,445 | 169,232 | 42,213 | 24.9 | % | ||||||||||
Total operating expenses | 429,372 | 378,154 | 51,218 | 13.5 | % | ||||||||||
Operating income | 45,582 | 30,047 | 15,535 | 51.7 | % | ||||||||||
Other income (expense): | |||||||||||||||
Interest income | 6,883 | 10,182 | (3,299 | ) | (32.4 | )% | |||||||||
Interest expense | (105,328 | ) | (93,063 | ) | (12,265 | ) | 13.2 | % | |||||||
Non-cash interest expense | (33,309 | ) | (13,402 | ) | (19,907 | ) | 100.0 | % | |||||||
Amortization of deferred financing fees | (10,746 | ) | (8,162 | ) | (2,584 | ) | 31.7 | % | |||||||
Gain (loss) from extinguishment of debt, net | 44,269 | (431 | ) | 44,700 | 100.0 | % | |||||||||
Other expense | (13,478 | ) | (15,777 | ) | 2,299 | (14.6 | )% | ||||||||
Total other expense | (111,709 | ) | (120,653 | ) | 8,944 | (7.4 | )% | ||||||||
Loss before provision for income taxes | (66,127 | ) | (90,606 | ) | 24,479 | (27.0 | )% | ||||||||
Provision for income taxes | (1,037 | ) | (868 | ) | (169 | ) | 19.5 | % | |||||||
Net loss | (67,164 | ) | (91,474 | ) | 24,310 | (26.6 | )% | ||||||||
Less: Net loss attributable to the noncontrolling interest | — | — | — | ||||||||||||
Net loss attributable to SBA Communications Corporation | $ | (67,164 | ) | $ | (91,474 | ) | $ | 24,310 | (26.6 | )% | |||||
Revenues:
Site leasing revenue increased $73.7 million for the year ended December 31, 2008 due to an increase in the number of tenants and the amount of equipment added to our historical towers and from revenue generated by the towers that we acquired or constructed subsequent to December 31, 2007. Additionally, we have experienced, on average higher rents per tenant due to higher rents from new tenants, higher annual rents upon renewal by existing tenants and higher rents from additional equipment added by existing tenants.
Site development consulting and construction revenue for the year ended December 31, 2008 compared to the same period of 2007 decreased $7.0 million as a result of a lower volume of work and a wind down of certain of our prior contracts with Sprint offset by additional contracts with T-Mobile and Metro PCS.
Operating Expenses:
Site leasing cost of revenues increased $8.2 million primarily as a result of the growth in the number of tower sites owned by us, which was 7,854 at December 31, 2008 up from 6,220 at December 31, 2007 offset by the positive impact of our ground lease purchase program.
Site development consulting cost of revenues and site development construction cost of revenues for the year ended December 31, 2008 decreased $3.4 million compared to the same period of 2007 as a result of a decline in the volume of work performed for Sprint offset by additional contracts with T-Mobile and Metro PCS.
Selling, general, and administrative expenses increased $3.2 million primarily as a result of a $0.9 million one-time severance expense related to the departure of our former Chief Financial Officer, a $0.6 million one-time settlement expense associated with the termination of the pension plan we acquired as part of our acquisition of AAT Communications Corporation in 2006 and an increase in salaries, benefits and other employee related expenses resulting primarily from a higher number of employees, and increased non-cash compensation expense that we recognized for the year ended December 31, 2008 compared to the same period of 2007.
Asset impairment of $0.9 million for the year ended December 31, 2008 is the result of a reevaluation of future cash flow expectations for eight towers that have not achieved expected lease-up results as determined using a discounted cash flow analysis compared to the related net book value of the tower asset and related intangibles.
Depreciation, accretion and amortization expense increased $42.2 million to $211.4 million for the year ended December 31, 2008 from $169.2 million for the year ended December 31, 2007 due to an increase in the number of towers and associated intangible assets we owned for the year ended December 31, 2008 compared to the same period of 2007.
Operating Income:
Operating income was $45.6 million for the year ended December 31, 2008 as compared to $30.0 million for the year ended December 31, 2007. The increase is primarily the result of higher site leasing segment operating profit, offset by an increase in selling, general and administrative expenses and depreciation, accretion and amortization expense.
Other Income (Expense):
Interest income decreased $3.3 million for the year ended December 31, 2008 when compared to the year ended December 31, 2007. The decrease is primarily the result of lower interest rates coupled with a decrease in the average cash balances for the year ended December 31, 2008 compared to the same period of 2007.
Interest expense for the year ended December 31, 2008 increased $12.3 million from the year ended December 31, 2007. This increase is primarily due to the higher weighted average amount of cash-interest bearing debt outstanding for the year ended December 31, 2008 as compared to the year ended December 31, 2007, which is partially offset by a reduction in our weighted average cash interest rate for the same periods. Specifically, we issued $550.0 million of 1.875% Notes in May 2008, borrowed $465.6 million and paid fees and interest on borrowings under our Senior Credit Facility, which we entered into in January 2008, and assumed as part of the Optasite acquisition its $150 million fully-drawn credit facility in September 2008.
Non-cash interest expense for the year ended December 31, 2008 increased $19.9 million from the year ended December 31, 2007. This increase primarily reflects the accretion of interest for the debt discount on the 1.875% Notes issued in May 2008 and the discount on the credit facility which was assumed as part of the Optasite acquisition in September 2008.
Amortization of deferred financing fees increased by $2.6 million for the year ended December 31, 2008, as compared to the year ended December 31, 2007. This increase was primarily a result of the amortization of fees relating to the Senior Credit Facility entered into during the first quarter of 2008 and the $550.0 million principal amount of 1.875% Notes issued in May 2008.
The net gain from extinguishment of debt was $44.3 million for the year ended December 31, 2008. The net gain includes the extinguishment of $138.1 million in principal amount of our 0.375% Notes and $65.5 million of our CMBS Certificates for $147.8 million in cash and the issuance of 3,407,914 shares of our Class A common stock for $73.8 million in principal amount of 0.375% Notes offset by the write-off of deferred financing fees related to the portion of the debt extinguished and the reduction in the aggregate commitment of the lenders under the Senior Credit Facility as a result of Lehman Commercial Paper Inc.’s default of its funding obligations. See discussion in Note 13 to the Notes to the Consolidated Financial Statements for more information. The loss from write-off of deferred financing fees and extinguishment of debt was $0.4 million for the year ended December 31, 2007 associated with the termination of the senior revolving credit facility in April 2007.
Other expense of $13.5 million and $15.8 million for the years ended December 31, 2008 and December 31, 2007, respectively, includes an other-than-temporary impairment loss on investments, associated with our investments in auction rate securities. See Note 5 to the Consolidated Financial Statements for more information on our investments in auction rate securities and this other-than-temporary impairment charge.
Net Loss:
Net loss was $67.2 million for the year ended December 31, 2008 as compared to $91.5 million for the year ended December 31, 2007. The decrease of $24.3 million is primarily the result of the net gains from the early extinguishment of debt and an increase in site leasing segment operating profit partially offset by an increase in depreciation, accretion and amortization expense, interest expense, amortization of deferred financing fees and other expense.
LIQUIDITY AND CAPITAL RESOURCES
SBA Communications Corporation is a holding company with no business operations of its own. SBA Communications’ only significant asset is the outstanding capital stock of SBA Telecommunications, Inc. (“Telecommunications”) which is also a holding company that owns equity interests in (1) SBA Infrastructure Holdings I, Inc. (the entityentities that directly or indirectly owns all of the towers and other assets acquired in the Optasite acquisition), (2) SBA Senior Finance, Inc. (the entity that indirectly ownsown all of our other domestic and international towers and assets) and (3) our international entities.assets. We conduct all of our business operations through Telecommunications’ subsidiaries. Accordingly, our only source of cash to pay our obligations, other than financings, is distributions with respect to our ownership interest in our subsidiaries from the net earnings and cash flow generated by these subsidiaries.
A summary of our cash flows is as follows:
| For the year ended December 31, 2009 | ||||
| (in thousands) | ||||
Summary cash flow information: | ||||
Cash provided by operating activities | $ | 219,558 | ||
Cash used in investing activities | (226,075 | ) | ||
Cash provided by financing activities | 88,978 | |||
Increase in cash and cash equivalents | 82,461 | |||
Cash and cash equivalents, December 31, 2008 | 78,856 | |||
Cash and cash equivalents, December 31, 2009 | $ | 161,317 | ||
Summary cash flow information: Cash provided by operating activities Cash used in investing activities Cash provided by financing activities Decrease in cash and cash equivalents Effect of exchange rate changes on cash and cash equivalents Cash and cash equivalents, beginning of year Cash and cash equivalents, end of year For the year ended December 31, 2011 2010 (in thousands) $ 249,058 $ 201,140 (507,888 ) (425,039 ) 242,047 126,821 (16,783 ) (97,078 ) (155 ) 15 64,254 161,317 $ 47,316 $ 64,254
Sources of Liquidity
We fund our growth, including our tower portfolio growth, through cash flows from operations, long-term indebtedness and equity issuances. With respect to our debt financing, we have utilized secured and unsecured financings and issuances at various levels of our organizational structure to minimize our financing costs while maximizing our operational flexibility.
Cash provided by operating activities was $219.6$249.1 million for the year ended December 31, 20092011 as compared to $173.7$201.1 million for the year ended December 31, 2008.2010. This increase was primarily the result ofdue to an increase in segment operating profit from the site leasing segment.
On July 24, 2009, Telecommunications issued $750 millionsegment partially offset by increased cash interest payments relating to the higher average amount of unsecured Senior Notes, which we refer to as the Senior Notes, $375 million of which are due 2016 (the “2016 Notes”) and $375 million of which are due 2019 (the “2019 Notes”). The 2016 Notes have an interest rate of 8.00% and were issued at a price of 99.330% of their face value. The 2019 Notes have an interest rate of 8.25% and were issued at a price of 99.152% of their face value. Net proceeds of this offering were $727.9 million after deducting expenses and original issue discount. Telecommunications used the net proceeds to repay the 2005 CMBS Certificates issued by its subsidiary and the related prepayment consideration and repay the principal amountscash-interest bearing debt outstanding under the Optasite Credit Facility and the Senior Credit Facility. Telecommunications also intends to use the net proceeds from this offering to repurchase prior to maturity or repay at maturity our outstanding 0.375% Notes. The remaining net proceeds are being used for general corporate purposes.
On April 24, 2009, SBA Communications issued $500.0 million of 4.0% Notes in a private placement transaction. The net proceeds of this offering were approximately $488.2 million after deducting discounts, commissions and expenses. Contemporaneously with the closing of the sale of the 4.0% Notes, a portion of the net proceeds from the sale of the 4.0% Notes was used to repurchase and subsequently retire 2.0 million shares of our Class A common stock, valued at approximately $50.0 million based on the closing stock price of $24.80 on April 20, 2009. Concurrently with the pricing of the 4.0% Notes, we entered into convertible note hedge and warrant transactions. A portion of the net proceeds from the sale of the 4.0% Notes and the warrants were used to pay for the cost of the convertible note hedge transactions. The remaining net proceeds of $376.6 million were used for general corporate purposes, including repurchases or repayments of our outstanding debt.
Effective April 14, 2009, SBA Senior Finance entered into a New Lender Supplementyear ended December 31, 2011, compared to the Senior Credit Agreement with Barclays Bank PLC. The New Lender Supplement added Barclays as a lender undersame period in the Senior Credit Facility and increasedprior year.
During the aggregate commitment under the Senior Credit Facility from $285.0 million to $320.0 million, availabilityfirst six months of which was based on compliance with certain financial ratios. Availability under the Senior Credit Facility was $319.9 million as of December 31, 2009. During 2009, SBA Senior Finance borrowed $8.5 million and repaid $239.1 million under its Senior Credit Facility, which is presented within “Cash flows from financing activities” on our Consolidated Statements of Cash Flows. We used or designated such proceeds for construction and acquisition of towers and for ground lease buyouts. On February 11, 2010, SBA Senior Finance terminated the Senior Credit Facility.
On February 11, 2010,2011 SBA Senior Finance II, LLC (“SBA Senior Finance II”), our indirect wholly-owned subsidiary, entered into a credit agreement for a $500.0borrowed $250.0 million senior secured revolving credit facility (the “2010 Credit Facility”) with several banks and other financial institutions or entities from time to time parties to the credit agreement (the “Credit Agreement”). Amounts borrowed under the 2010Revolving Credit Facility will be secured by a first lien on the capital stock of SBA Telecommunications, Inc., SBA Senior Finance, Inc. andFacility. On June 30, 2011, SBA Senior Finance II entered into an amended and substantially allrestated credit agreement which extended the maturity of the assets, other than leasehold, easement or fee interests in real property, of SBA Senior Finance II and the Subsidiary Guarantors (as defined in the Credit Agreement). The 2010Revolving Credit Facility maturesand included a new $500.0 million Term Loan. The proceeds from the Term Loan were used to repay the existing $270.0 million balance on February 11, 2015the Revolving Credit Facility and may befor general corporate purposes. Since the repayment we have not borrowed repaid and redrawn, subject to compliance withany amount under the financial and other covenants in theRevolving Credit Agreement.Facility. As of December 31, 2011, the date of this filing, availability under the 2010
Revolving Credit Facility was approximately $500.0 million. The material terms of the 2010 Credit Facility are described below under “Debt Instruments and Debt Service Requirements – 2010 Credit Facility.”
Equity IssuancesRegistration Statements
We have on file with the Commission a shelf registration statement on Form S-4 registering shares of Class A common stock that we may issue in connection with the acquisition of wireless communication towers or antenna sites and related assets or companies who own wireless communication towers, antenna sites or related assets. During the year ended December 31, 2009,2011, we issued approximately 0.9 milliondid not issue any shares of Class A common stock under this registration statement. As of December 31, 2009,2011, we had approximately 1.7 million shares of Class A common stock remaining under this shelf registration statement.
On March 3, 2009, we filedWe also have on file with the Commission an automatic shelf registration statement for well-known seasoned issuers on Form S-3ASR. This registration statement enables us to issue shares of our Class A common stock, preferred stock or debt securities either separately or represented by warrants, or depositary shares as well as units that include any of these securities. Under the rules governing automatic shelf registration statements, we will file a prospectus supplement and advise the Commission of the amount and type of securities each time we issue securities under this registration statement. For the year ended December 31, 2009,2011, we did not issue any securities under this automatic shelf registration statement.
Uses of Liquidity
Traditionally, our principal use of liquidity has been cash capital expenditures associated with the growth of our tower portfolio. During the recent market disruptions that occurred from October 2008 through 2009, we utilized our liquidity to take advantage of certain market opportunities and repurchase our outstanding debt. However, based on the normalization of the capital markets and our recent financing activity, we currentlyWe believe that our principal use of liquidity will be to fund tower portfolio growth and, secondarily, to fund our stock repurchase program. However, inIn the future, we may continue to repurchase, for cash or equity, our outstanding indebtedness in privately-negotiated or open market transactions in order to optimize our liquidity and leverage and take advantage of market opportunities. During the year ended December 31, 2011, our wholly owned subsidiary repurchased an aggregate of $15.0 million in principal amount of the 1.875% Notes for $17.0 million in cash.
Our cash capital expenditures, including cash used for acquisitions, for the year ended December 31, 20092011 were $227.5$506.3 million. The $227.5$506.3 million includes cash capital expenditures of $169.2$353.6 million that we incurred primarily in connection with the acquisition of 3761,085 completed towers, net of related working capital adjustments and net of related prorated rental receipts and payments and earnouts associated with previous acquisitions. The $227.5$506.3 million also includes $30.2 million related to new tower construction, $6.6$93.1 million for construction and related costs associated with the completion of 388 new towers during the year ended December 31, 2011 and for the sites in process at December 31, 2011, $11.7 million for tower maintenance tower capital expenditures, $8.3$17.4 million for augmentations and tower upgrades, $1.6$4.7 million for general corporate expenditures, and $11.6$25.8 million for ground lease purchases. The $30.2purchases (not including $9.7 million of new tower construction includes costs associated with the completion of 101 new towers for the year ended December 31, 2009 and costs incurred on sites currently in process. In addition, we paid $4.2 million in cashspent to amend and extend existing ground leases.
Subsequent to December 31, 2009, we acquired 14 towers from third party sellers and an equity interest in DAS provider Extenet Systems, inc. in exchange for $42.9 million in cash and a contribution of our six DAS networks.
During the year ended December 31, 2009, we repurchased, in privately negotiated or open market transactions an aggregate of $107.7 million of our 0.375% Notes and $150.1 million in principal of our 2006 CMBS Certificates for aggregate consideration of 618,000 shares of our Class A common stock and $241.1 million in cash. In addition, in July 2009 we used the proceeds from the issuance of our Senior Notes to repay the remaining outstanding balances of our 2005 CMBS Certificates and our Senior Credit Facility and repay and terminate the Optasite Credit Facility.lease terms).
Subsequent to December 31, 2009,2011, we repurchasedacquired 64 towers and the rights to manage two additional communication sites of an aggregate consideration of $2.0 million of our 2006 CMBS Certificates for $2.1approximately $34.7 million in cash.
TheOur Company’s Board of Directors authorized a stock repurchase program effective November 3, 2009. This program authorized us to purchase, from time to time, up to $250.0 million of our outstanding common stock through open market repurchases in compliance with Rule 10b-18 of the Securities Act of 1934, as amended, and/or in privately negotiated transactions at management’s discretion based on market and business conditions, applicable legal requirements and other factors.
On April 27, 2011, our Board of Directors (1) terminated the existing $250.0 million stock repurchase program (under which $65.9 million of repurchase authorization remained available at the termination date), and (2) approved a new $300.0 million stock repurchase program. This new program authorizes us to purchase, from time to time, up to $250.0$300.0 million of our outstanding Class A common stock through open market repurchases in compliance with Rule 10b-18 of the Securities Exchange Act of 1933,1934, as amended, and/or in privately negotiated transactions at management’s discretion based on market and business conditions, applicable legal requirements and other factors. This program became effective on April 28, 2011 and will continue until otherwise modified or terminated by our Board of Directors at any time in ourtheir sole discretion. In
During the year ended December 31, 2011, in connection with the stock repurchase program, in December 2009, we repurchased and retired approximately 52,0005,917,940 shares for an aggregate of $1.7$225.1 million including commissions and fees.
Subsequent to As of December 31, 2009,2011, we have repurchased 207,000 shares forhad a remaining authorization to repurchase an aggregateadditional $150.0 million of $6.7our common stock under our current $300.0 million including commissions and fees.stock repurchase program.
In order to manage our leverage position and/or toand liquidity positions, take advantage of market opportunities and ensure continued compliance with our financial covenants, we may decide to pursue a variety of other financial transactions. These transactions may include the issuance of additional indebtedness, the repurchase of our outstanding indebtedness for cash or equity, selling certain assets or lines of business, issuing common stock or securities convertible into shares of common stock, or pursuing other financing alternatives, including securitization transactions. If either our debt repurchases or exchanges or any of the other financial transactions are implemented, these actions could materially impact the amount and composition of indebtedness outstanding, increase our interest expense and/or dilute our existing shareholders. We cannot assure you that we will not implement any of these strategies or that, if implemented, these strategies could be implemented on terms favorable to us and our shareholders.
During 2010,2012, we expect to incur non-discretionary cash capital expenditures associated with tower maintenance and general corporate expenditures of $7$12.0 million to $11$16.0 million, andincluding, we believe, less than $1,000 per tower per year for non-discretionary maintenance capital improvements. In connection with our previously announced acquisition of Mobilitie we expect to incur approximately $850 million of discretionary cash capital expenditures basedwhich we expect to fund from cash on current obligations, of $120hand, existing credit facilities and $500 million in new financing commitments. In addition to $140 millionthe Mobilitie transaction, we expect to have discretionary cash capital expenditures during 2012 primarily associated with the towers we intend to build in 2010,new tower construction, additional tower acquisitions, currently under contract, tower augmentations and ground lease purchases. We intendexpect to spendfund these additional capital in 2010 on acquiring revenue producing assets not yet identified and under contract.
We estimate we will incur approximately $1,000 per tower per year for capital improvements or modifications to our towers. All of these planned cash capital expenditures are expected to be funded byfrom cash on hand, cash flow from operations and borrowings under the 2010Revolving Credit Facility. The exact amount of our future cash capital expenditures will depend on a number of factors including amounts necessary to support our tower portfolio, our new tower build and tower acquisition programs, and our ground lease purchase program.
We estimate we will incur less than $1,000 per tower per year for non-discretionary maintenance capital improvements related to our towers. We expect to fund cash capital expenditures from cash on hand, cash flow from operations and borrowings under the Revolving Credit Facility. The exact amount of our future capital expenditures will depend on a number of factors including amounts necessary to support our tower portfolio, our new tower build and tower acquisition program,programs, and our ground lease purchase program.
Debt Instruments and Debt Service Requirements
As of December 31, 2009,2011, we believe that our cash on hand and cash flows from operations for the next twelve months will be sufficient to service our outstanding debt during the next twelve months.
CMBS CertificatesCredit Agreement
On February 11, 2010, SBA Senior Finance II entered into a credit agreement for a $500.0 million senior secured revolving credit facility (the “Revolving Credit Facility,” formerly referred to as the 2010 Credit Facility) with several banks and other financial institutions or entities from time to time parties to the credit agreement.
On June 30, 2011, SBA Senior Finance II entered into an Amended and Restated Credit Agreement (the “Credit Agreement”) with several banks and other financial institutions or entities from time to time parties to the Credit Agreement, to extend the maturity of the Revolving Credit Facility, to obtain a new $500.0 million senior secured term loan (the “Term Loan”), and to amend certain terms of the existing credit agreement. We incurred financing fees of $6.2 million associated with the closing of this transaction. In November 2005,addition, at the time of entering into the Credit Agreement, the remaining deferred financing fees balance of approximately $4.3 million related to the existing Credit Agreement prior to the amendment was transferred to the Revolving Credit Facility in accordance with accounting guidance for revolving credit facilities.
Revolving Credit Facility
The Revolving Credit Facility consists of a revolving loan under which up to $500.0 million aggregate principal amount may be borrowed, repaid and redrawn, subject to compliance with specific financial ratios and the satisfaction of other customary conditions to borrowing. Amounts borrowed under the Revolving Credit Facility accrue interest at the Eurodollar Rate plus a margin that ranges from 187.5 basis points to 237.5 basis points or at a Base Rate plus a margin that ranges from 87.5 basis points to 137.5 basis points, in each case based on the ratio of Consolidated Total Debt to Annualized Borrower EBITDA (calculated in accordance with the Credit Agreement). If not earlier terminated by SBA Senior Finance II, the Revolving Credit Facility will terminate on, and SBA Senior Finance II will repay all amounts outstanding on or before, June 30, 2016. The proceeds available under the Revolving Credit Facility may be used for general corporate purposes. A 0.375% to 0.5% per annum fee is charged on the amount of unused commitments under the Revolving Credit Facility based on the ratio of Consolidated Total Debt to Annualized Borrower EBITDA (calculated in accordance with the Credit Agreement). SBA Senior Finance II may, from time to time, borrow from and repay the Revolving Credit Facility. Consequently, the amount outstanding under the Revolving Credit Facility at the end of a period may not be reflective of the total amounts outstanding during such period.
During the year ended December 31, 2011, SBA Senior Finance II borrowed $250.0 million under the Revolving Credit Facility. The total balance of $270.0 million was repaid on June 30, 2011.
Based on the outstanding amounts as of December 31, 2011, debt service for the next twelve months under the Revolving Credit Facility will be $1.9 million. As of December 31, 2011, the availability under the Revolving Credit Facility was approximately $500.0 million.
Term Loan
The Term Loan consists of a senior secured term loan in an indirect subsidiaryaggregate principal amount of $500.0 million and will mature on June 30, 2018. It will bear interest, at SBA Senior Finance II’s election, at either the Base Rate plus a margin of 175 basis points (with a Base Rate floor of 2%) or Eurodollar Rate plus a margin of 275 basis points (with a Eurodollar Rate floor of 1%). The proceeds from the Term Loan were used to pay down existing balances on the Revolving Credit Facility and may be used for general corporate purposes. Principal on the Term Loan will be repaid in quarterly installments of $1.25 million on the last day of each March, June, September and December, commencing on September 30, 2011. The remaining principal balance of the Term Loan will be due
and payable on the maturity date. SBA Senior Finance II has the ability to prepay any or all amounts under the Term Loan. However, to the extent the Term Loan is prepaid prior to June 30, 2012 from the proceeds of a substantially concurrent issuance of certain other syndicated loans, a prepayment fee equal to 1.0% of the aggregate principal amount of such prepayment will apply. The Term Loan was issued at 99.75% of par value. Based on the amount outstanding at December 31, 2011, debt service for the next twelve months on the term loan will be $23.9 million.
As of December 31, 2011, the Term Loan had a principal balance of $ 497.5 million.
Terms of the Credit Agreement
The Credit Agreement, as amended, requires SBA Senior Finance II and SBA Communications Corporation (“SBAC”) to maintain specific financial ratios, including, at the SBA Senior Finance II level, (1) a ratio of Consolidated Total Debt to Annualized Borrower EBITDA not to exceed 6.0 times for any fiscal quarter, (2) a ratio of Consolidated Total Debt and Net Hedge Exposure (calculated in accordance with the Credit Agreement) to Annualized Borrower EBITDA for the most recently ended fiscal quarter not to exceed 6.0 times for 30 consecutive days and (3) a ratio of Annualized Borrower EBITDA to Annualized Cash Interest Expense (calculated in accordance with the Credit Agreement) of not less than 2.0 times for any fiscal quarter. In addition, SBAC’s ratio of Consolidated Total Net Debt to Consolidated Adjusted EBITDA (calculated in accordance with the Credit Agreement) for any fiscal quarter on an annualized basis cannot exceed 9.5 times. The Credit Agreement contains customary affirmative and negative covenants that, among other things, limit the ability of SBA Senior Finance II and its subsidiaries to incur indebtedness, grant certain liens, make certain investments, enter into sale leaseback transactions, merge or consolidate, make certain restricted payments, enter into transactions with affiliates, and engage in certain asset dispositions, including a sale of all or substantially all of their property. As of December 31, 2011, SBA Senior Finance II and SBAC were in full compliance with the financial covenants contained in the Credit Agreement. The Credit Agreement is also subject to customary events of default. Pursuant to an Amended and Restated Guarantee and Collateral Agreement, amounts borrowed under the Revolving Credit Facility, the Term Loan and certain hedging transactions that may be entered into by SBA Senior Finance II or the Subsidiary Guarantors (as defined in the Credit Agreement) with lenders or their affiliates are secured by a first lien on the capital stock of SBA Telecommunications, Inc., SBA Senior Finance, LLC (formerly known as SBA Senior Finance, Inc.) and SBA Senior Finance II and on substantially all of the assets (other than leasehold, easement and fee interests in real property) of SBA Senior Finance II and the Subsidiary Guarantors.
The Credit Agreement permits SBA Senior Finance II to request that one or more lenders (1) increase their proportionate share of the Revolving Credit Facility commitment, up to an additional $200.0 million in the aggregate, and/or (2) provide SBA Senior Finance II with additional term loans in an aggregate principal amount of up to $500.0 million, in each case without requesting the consent of the other lenders. SBA Senior Finance II’s ability to request such increases in the Revolving Credit Facility or additional term loans is subject to its compliance with customary conditions set forth in the Credit Agreement including, with respect to any additional term loan, compliance, on a pro forma basis, with the financial covenants and ratios set forth therein and an increase in the margin on existing term loans, to the extent required by the terms of the Credit Agreement. Upon SBA Senior Finance II’s request, each lender may decide, in its sole discretion, whether to increase all or a portion of its Revolving Credit Facility commitment or whether to provide SBA Senior Finance II with additional term loans and, if so, upon what terms.
Secured Tower Revenue Securities Series 2010
On April 16, 2010, a New York common law trust (the “Trust”), initially formed by our indirect subsidiary, issued $405$680.0 million of CMBS Certificatesour Secured Tower Revenue Securities Series 2010-1 (the “2005 CMBS Certificates”“2010-1 Tower Securities”). In November 2006, the Trust subsequently issued $1.15 billion, and $550.0 million of CMBS CertificatesSecured Tower Revenue Securities Series 2010-2 (the “2006 CMBS Certificates”“2010-2 Tower Securities” and collectively
together with the 2005 CMBS Certificates,2010-1 Tower Securities, the “CMBS Certificates”“2010 Tower Securities”).
The 2005 CMBS Certificates consisted of five classes with annual pass-through interest rates ranging from 5.369% to 6.706%. The 2005 CMBS Certificates had2010-1 Tower Securities have an anticipated repayment dateannual interest rate of November 2010 with a final repayment date in 2035. During 2009 we repurchased, in privately negotiated4.254% and open market transactions,
the 2010-2 Tower Securities have an aggregateannual interest rate of $18.6 million, in principal amount of the 2005 CMBS Certificates for cash consideration of $16.6 million. On July 28, 2009, we repaid the remaining outstanding balance of the 2005 CMBS Certificates for $390.3 million in cash (including $10.1 million in prepayment consideration). In addition, during 2008 we repurchased, in privately negotiated and open market transactions, an aggregate of $6.2 million, in principal amount of the 2005 CMBS Certificates for cash consideration of $5.5 million.
The 2006 CMBS Certificates consist of nine classes with annual pass-through interest rates ranging from 5.314% to 7.825%5.101%. The weighted average annual fixed coupon interest rate of the 2010 Tower Securities is 4.7%, including borrowers’ fees, payable monthly. The anticipated repayment date and the final maturity date for the 2010-1 Tower Securities is April 16, 2015 and April 16, 2040, respectively. The anticipated repayment date and the final maturity date for the 2010-2 Tower Securities is April 16, 2017 and April 16, 2042, respectively. Net proceeds from the 2010 Tower Securities were used to repay in full the outstanding 2006 CMBS Certificates in the amount of $938.6 million and pay the related prepayment consideration plus accrued interest and fees. The remaining net proceeds were used for general corporate purposes.
The sole asset of the Trust consists of a non-recourse mortgage loan made in favor of SBA Properties, Inc., SBA Sites, Inc., and SBA Structures, Inc., indirect wholly-owned operating subsidiaries of the Company (the “Borrowers”). The Borrowers are special purpose vehicles which exist solely to hold the towers which are subject to the securitization. In connection with the issuance of the 2010 Tower Securities and the repayment of the 2006 CMBS Certificates, as of December 31, 2009 is 5.9%, payable monthly, and the effective weighted average annual fixed interest rate is 6.2% after giving effect to the settlement of the nine interest rate swap agreements entered into in contemplation of the transaction. The 2006 CMBS Certificates have an anticipated repayment date of November 2011 with a final repayment date in 2036. However, to the extent that the full amount of the mortgage loan component correspondingcomponents relating to the 2006 CMBS Certificates were repaid and the mortgage loan was amended to create two new loan components, each with terms that are identical to the series of 2010 Tower Securities to which it relates. The Borrowers are jointly and severally liable for all obligations under the mortgage loan.
The mortgage loan underlying the 2010 Tower Securities will be paid from the operating cash flows from the aggregate 3,670 tower sites owned by the Borrowers. The mortgage loan is secured by (i) mortgages, deeds of trust and deeds to secure debt on a substantial portion of the tower sites, (ii) a security interest in substantially all of the Borrowers’ personal property and fixtures, (iii) the Borrowers’ rights under certain tenant leases, and (iv) all of the proceeds of the foregoing. For each calendar month, SBA Network Management, Inc., our indirect subsidiary, is entitled to receive a management fee equal to 7.5% of the Borrowers’ operating revenues for the immediately preceding calendar month.
The Borrowers may prepay either of the mortgage loan components, in whole or in part, with no prepayment consideration, (i) within nine months of the anticipated repayment date of such mortgage loan component, (ii) with proceeds received as a result of any condemnation or casualty of any tower site owned by the Borrowers or (iii) during an amortization period. In all other circumstances, the Borrowers may prepay the mortgage loan, in whole or in part, upon payment of the applicable prepayment consideration. The prepayment consideration is determined based on the class of 2010 Tower Securities to which the prepaid mortgage loan component corresponds and consists of an amount equal to the excess, if any, of (1) the present value associated with the portion of the principal balance being prepaid, calculated in accordance with the formula set forth in the mortgage loan agreement, on the date of prepayment of all future installments of principal and interest required to be paid from the date of prepayment to and including the first due date that is nine months prior to the anticipated repayment date over (2) that portion of the principal balance of such class prepaid on the date of such prepayment.
To the extent that the mortgage loan components corresponding to the 2010 Tower Securities are not fully repaid by their respective anticipated repayment dates, the interest rate of each such component wouldwill increase by the greater of (i) 5% orand (ii) the amount, if any, by which the sum of (x) the ten-year U.S. treasury rate plus (y) the credit-based spread for such component (as set forth in the mortgage loan agreement) plus (z) 5%, exceeds the original interest rate for such component.
DuringPursuant to the year ended December 31, 2009, we repurchased an aggregate of $150.1 million in principal amount of 2006 CMBS Certificates for $150.5 million in cash. At December 31, 2009, we had $940.6 million outstanding of 2006 CMBS Certificates. Based on the amounts outstanding at December 31, 2009, debt service for the next twelve months on the 2006 CMBS Certificates will be approximately $55.5 million.
Subsequent to December 31, 2009, we repurchased an aggregate of $2.0 million in principal amount of 2006 CMBS Certificates for $2.1 million in cash. Our outstanding balance on the 2006 CMBS Certificates was $938.6 million asterms of the date of this filing.
The CMBS Certificates are repayable with the proceeds of a non-recourse mortgage loan, the sole asset2010 Tower Securities, all rents and other sums due on any of the Trust, made in favor of certain operating subsidiaries of SBA Senior Finance (the “CMBS Borrowers”). The CMBS Borrowers are special purpose vehicles which exist solely to hold the towers that are subject to the securitization (the “CMBS Towers”). Each of the CMBS Borrowers, who are jointly and severally liable under the mortgage loan, have pledged the cash flows from the CMBS Towerstower sites owned by the entity as security under the mortgage loan. As of December 31, 2009, the CMBS Borrowers owned an aggregate 3,746 tower sites.
If the CMBS Borrowers are in compliance with the required debt service coverage ratio set forth in the mortgage loan underlying the 2006 CMBS Certificates, and the anticipated repayment date has not yet occurred, then the cash flow generateddirectly deposited by the CMBS Towerslessees into a controlled deposit account and are held by the indenture trustee. The monies held by the indenture trustee after (1) payment of the interestrelease date are classified as restricted cash on the mortgage loan, (2) funding of all reserve accounts and operating expenses associated with the CMBS Towers, and (3) payment of the management fees due to SBA Network Management, Inc. (equal to 7.5% of the CMBS Borrowers’ operating revenues for the immediately preceding calendar month), will be distributed to the CMBS Borrowers.
our Consolidated Balance Sheets. However, if the debt service coverage ratio (“Net Cash Flow”Debt Service Coverage Ratio, defined as the net cash flow (as defined in the mortgage loan agreement) divided by the sumamount of the interest on the mortgage loan, servicing fees and trustee fees that the CMBS Borrowers will beare required to pay over the succeeding twelve months)months, as of the end of
any calendar quarter, falls to 1.30x or lower, as of the end of any calendar quarter, then all operating cash flow from the CMBS Towers in excess of amounts required to (i)make debt service payments, to fund required reserves, to pay interest, at the original interest rate, on the mortgage loan underlying the 2006 CMBS Certificates, (ii) fund all reserve accountsmanagement fees and budgeted operating expenses associated withand to make other payments required under the pledged towers, and (iii) pay the SBA Network management fees,loan documents, referred to as “excess cash flow,” will be deposited into a reserve account instead of being released to the CMBS Borrowers. The funds in the reserve account will not be released to the CMBS Borrowers unless the debt service coverage ratioDebt Service Coverage Ratio exceeds 1.30x for two consecutive calendar quarters. If the debt service coverage ratioDebt Service Coverage Ratio falls below 1.15x as of the end of any calendar quarter, then an “amortization period” will commence and all funds on deposit in the reserve account and all excess cash flow generated thereafter will be applied to prepay the components of the mortgage loan in the order of their investment grade until such time asthat the debt service coverage ratioDebt Service Coverage Ratio exceeds 1.15x for a calendar quarter. In addition, if the 2006 CMBS Certificates are not fully repaid by their repayment date, the cash
flow from the CMBS Towers will be trapped by the trustee for the 2006 CMBS Certificates and applied first to repay the interest on theThe mortgage loan calculated atagreement, as amended, also includes covenants customary for mortgage loans subject to rated securitizations. Among other things, the original interest rate, second to fund all reserve accounts and operating expenses associated with the CMBS Towers, third to pay the SBA Network management fees, fourth to repay principal of the 2006 CMBS Certificates in the order ofBorrowers are prohibited from incurring other indebtedness for borrowed money or further encumbering their investment grade and fifth to repay the additional interest discussed above.assets. As of December 31, 2009, we were in compliance with2011, the Borrowers met the required Debt Service Coverage Ratio. Based on the amounts outstanding at December 31, 2011, debt service coverage ratio as defined by the mortgage loan agreement.
At any time prior to November 2011, the CMBS Borrowers may prepay the mortgage loan in whole or in part for the components of the mortgage loan corresponding to the 2006 CMBS Certificates upon payment of the applicable prepayment consideration. The prepayment consideration is determined per class and consists of an amount equal to the excess, if any, of (1) the present valuenext twelve months on the date of prepayment of all future installments of principal and interest required to2010 Tower Securities would be paid from the date of prepayment to and including the first due date that is nine months prior to the anticipated repayment date, assuming the entire unpaid principal amount of such class is required to be paid, over (2) that portion of the principal balance of such class prepaid on the date of such prepayment. If the prepayment occurs (i) within nine months of the anticipated repayment date, (ii) with proceeds received as a result of any condemnation or casualty of the CMBS Borrowers’ sites or (iii) during an amortization period, no prepayment consideration is due. The entire unpaid principal balance of the mortgage loan components corresponding to the 2006 CMBS Certificates will be due in November 2036. The mortgage loan may be defeased in whole at any time prior to the anticipated repayment date.
The mortgage loan is secured by (1) mortgages, deeds of trust and deeds to secure debt on substantially all of the tower sites and their operating cash flows, (2) a security interest in substantially all of the CMBS Borrowers’ personal property and fixtures, (3) the CMBS Borrowers’ rights under the management agreement they entered into with SBA Network Management, Inc. (“SBA Network Management”) relating to the management of the CMBS Borrowers’ tower sites by SBA Network Management pursuant to which SBA Network Management arranges for the payment of all operating expenses and the funding of all capital expenditures out of amounts on deposit in one or more operating accounts maintained on the CMBS Borrowers’ behalf, (4) the CMBS Borrowers’ right under certain site management agreements, (5) the CMBS Borrowers’ rights under certain tenant leases, (6) the pledge by SBA CMBS-1 Guarantor, LLC and SBA CMBS-1 Holdings, LLC of equity interest of the initial borrower and SBA CMBS-1 Guarantor, LLC, (7) the various deposit accounts and collection accounts of the CMBS Borrowers and (8) all proceeds of the foregoing.$57.4 million.
Convertible Senior Notes
0.375% Convertible Senior Notes - On March 26, 2007, we issued $350.0 million of our 0.375% Notes. Interest is payable semi-annually on June 1 and December 1. The 0.375% Notes have a maturity date of December 1, 2010. The 0.375% Notes are convertible, at the holder’s option, into shares of our Class A common stock, at an initial conversion rate of 29.7992 shares of Class A common stock per $1,000 principal amount of 0.375% Notes (subject to certain customary adjustments), which is equivalent to an initial conversion price of approximately $33.56 per share or a 19% conversion premium based on the last reported sale price of $28.20 per share of Class A common stock on the Nasdaq Global Select Market on March 20, 2007, the purchase agreement date.
Concurrently with the pricing of the 0.375% Notes, we entered into convertible note hedge transactions whereby we purchased from affiliates of two of the initial purchasers of the 0.375% Notes, an option covering 10,429,720 shares of our Class A common stock at an initial price of $33.56 per share. Separately and concurrently with the pricing of the 0.375% Notes, we entered into warrant transactions whereby we sold to affiliates of two of the initial purchasers of the 0.375% Notes warrants to acquire 10,429,720 shares of our Class A common stock at an initial exercise price of $55.00 per share. The convertible note hedge transactions and the warrant transactions, taken as a whole, effectively increase the conversion price of the 0.375% Notes from $33.56 per share to $55.00 per share. As we cannot determine when, or whether, the 0.375% Notes will be converted, the convertible note hedge transactions and the warrant transactions, taken as a whole, minimize the
dilution risk associated with early conversion of the 0.375% Notes until such time that our Class A common stock is trading at a price above $55.00 per share (the upper strike of the warrants).
During the year ended December 31, 2009, we consummated privately negotiated exchanges of the 0.375% Notes for Class A common stock in reliance on Section 3(a)(9) of the Securities Act of 1933, as amended. Pursuant to these exchanges, we issued approximately 618,000 shares of our Class A common stock in exchange for $12.5 million in principal amount of 0.375% Notes. In addition, we also repurchased an aggregate of $95.2 million in principal amount of 0.375% Notes for $90.6 million in cash.
In April 2009, we also terminated the portion of the convertible note hedge and warrant transactions that we entered into in March 2007 with respect to our 0.375% Notes which related to the $264.1 million principal amount of 0.375% Notes that we previously repurchased for cash or stock. We received a net settlement of approximately 546,000 shares from the counterparties of the hedge and warrant transactions which is reflected in the Consolidated Statements of Shareholders’ Equity. As of December 31, 2009, 2,559,185 shares of our Class A common stock remain under convertible note hedge transactions.
At December 31, 2009, we had $30.4 million outstanding of 0.375% Notes. Based on the maturity date of December 1, 2010 of the 0.375% Notes, debt service for 2010 will be $30.4 million in principal and approximately $0.1 million in interest. We intend to use a portion of the net proceeds from the Senior Notes issued in July 2009 to repurchase prior to maturity or repay at maturity our remaining 0.375% Notes outstanding.
1.875% Convertible Senior Notes - –On May 16, 2008 we issued $550.0 million of our 1.875% Notes. Interest is payable semi-annually on May 1 and November 1. The maturity date of the 1.875% Notes is May 1, 2013. The 1.875% Notes are convertible, at the holder’s option, into shares of our Class A common stock, at an initial conversion rate of 24.1196 shares of Class A common stock per $1,000 principal amount of 1.875% Notes (subject to certain customary adjustments), which is equivalent to an initial conversion price of approximately $41.46 per share or a 20% conversion premium based on the last reported sale price of $34.55 per share of Class A common stock on the Nasdaq Global Select Market on May 12, 2008, the purchase agreement date.
Concurrently with the pricing of the 1.875% Notes, we entered into convertible note hedge transactions originally covering 13,265,780 shares of our Class A common stock at an initial price of $41.46 per share.share (the same as the initial conversion price of the 1.875% Notes). Separately and concurrently with the pricing of the 1.875% Notes, we entered into warrant transactions whereby we sold warrants to each of the hedge counterparties to acquire 13,265,780 shares of our Class A common stock at an initial exercise price of $67.37 per share. The convertible note hedge transactions and the warrant transactions, taken as a whole, effectively increase the conversion price of the 1.875% Notes from $41.46 per share to $67.37 per share. As we cannot determine when, or whether, the 1.875% Notes will be converted, the convertible note hedge transactions and the warrant transactions, taken as a whole, minimize the dilution risk associated with early conversion of the 1.875% Notes until such time that our Class A common stock is trading at a price above $67.37 per share (the upper strike of the warrants).
One of the convertible note hedge transactions entered into in connection with the 1.875% Notes was with Lehman Brothers OTC Derivatives Inc. (“Lehman Derivatives”). The convertible note hedge transaction with Lehman Derivatives coverscovered 55% of the 13,265,780 shares of our Class A common stock potentially issuable upon conversion of the 1.875% Notes. In October 2008, Lehman Derivatives filed a voluntary petition for protection under Chapter 11 of the United States Bankruptcy Code. The filing by Lehman Derivatives of a voluntary Chapter 11 bankruptcy petition constituted an “event of default” under the convertible note hedge transaction with Lehman Derivatives. As a result, on November 7, 2008 we terminated the convertible note hedge transaction with Lehman Derivatives. Based on information available to us, we have no indication, as of the date of filing this Form 10-K, that any party other than Lehman Derivatives would be unable to fulfill their obligations to us under the convertible note hedge transactions.
The net cost of the convertible note hedge transaction with Lehman Derivatives was recorded as an adjustment to Additional Paid in Capital and therefore the termination of the convertible note hedge did not have any impact on our consolidated balance sheet. However, we could incur significant costs to replace this hedge transaction if we elect to do so. If we do not elect
to replace the convertible note hedge transaction, then we will be subject to potential dilution upon conversion of the 1.875% Notes, if on the date of conversion the per share market price of our Class A common stock exceeds the conversion price of $41.46.
At December 31, 2009,2011, we had $550.0$ 535.0 million outstanding of 1.875% Notes.Notes which were recorded at a carrying value of $ 485.0 million. Based on the amounts outstanding at December 31, 2009,2011, debt service for the next twelve months on the 1.875% Notes will be approximately $10.3$10.0 million.
4.0% Convertible Senior Notes- – On April 24, 2009, we issued $500.0 million of our 4.0% Notes in a private placement transaction. Interest on the 4.0% Notes is payable semi-annually on April 1 and October 1. The maturity date of the 4.0% Notes is October 1, 2014. The 4.0% Notes are convertible, at the holder’s option, into shares of our Class A common stock, at an initial conversion rate of 32.9164 shares of our Class A common stock per $1,000 principal amount of 4.0% Notes (subject to certain customary adjustments), which is equivalent to an initial conversion price of approximately $30.38 per share or a 22.5% conversion premium based on the last reported sale price of $24.80 per share of our Class A common stock on the Nasdaq Global Select Market on April 20, 2009, the purchase agreement date.
Concurrently with the pricing of the 4.0% Notes, we entered into convertible note hedge transactions whereby we purchased from affiliates of the initial purchasers of the 4.0% Notes an option covering 16,458,196 shares of our Class A common stock at an initial price of $30.38 per share (the same as the initial conversion price of the notes). Separately and concurrently with the pricing of the 4.0% Notes, we entered into warrant transactions whereby we sold to affiliates of the initial purchasers of the 4.0% Notes warrants to acquire 16,458,196 shares of our Class A common stock at an initial exercise price of $44.64 per share. We used approximately $61.6 million of the net proceeds from the 4.0% Notes offering plus the proceeds from the warrant transactions to fund the cost of the convertible note hedge transactions. The convertible note hedge transactions and the warrant transactions, taken as a whole, effectively increase the conversion price of the 4.0% Notes from $30.38 per share to $44.64 per share, reflecting a premium of 80% based on the closing stock price of $24.80 per share of our Class A common stock on April 20, 2009. If the market price of our Class A common stock exceeded the upper strike price of $44.64 per share on the conversion date of the 4.0% Notes, then we will be subject to dilution or cost upon conversion of the 4.0% Notes. The remaining net proceeds of $376.6 million were used for general corporate purposes, including repurchases or repayments of our outstanding debt.
As of December 31, 2009,2011, we had outstanding $500.0$ 500.0 million of our 4.0% Notes.Notes with a carrying value of $ 397.6 million. Based on the amounts outstanding at December 31, 2009,2011, debt service for the next twelve months on the 4.0% Notes would be approximately $20.0 million.
Convertible Senior Notes conversion options –- The 0.375% Notes, 1.875% Notes and 4.0% Notes (collectively “the Notes”) are convertible only under the following circumstances:
during any calendar quarter, if the last reported sale price of our Class A common stock for at least 20 trading days in the 30 consecutive trading day period ending on the last trading day of the preceding calendar quarter is more than 130% of the applicable conversion price per share of Class A common stock on the last day of such preceding calendar quarter,
during the five business day period after any ten consecutive trading day period in which the trading price per $1,000 principal amount of the Notes for each day in the measurement period was less than 95% of the product of the last reported sale price of Class A common stock and the applicable conversion rate,
if specified distributions to holders of Class A common stock are made or specified corporate transactions occur, and
at any time on or after October 12, 2010 for the 0.375% Notes, February 19, 2013 for the 1.875% Notes and July 22, 2014 for the 4.0% Notes.
Upon conversion, we have the right to settle our conversion obligation in cash, shares of Class A common stock or a combination of cash and shares of our Class A common stock. From time to time, upon notice to the holders of the Notes, we may change our election regarding the form of consideration that we will use to settle our conversion obligation; provided, however, that we are not permitted to change our settlement election after October 11, 2010 for the 0.375% Notes, February 18, 20102013 for the 1.875% Notes and July 21, 2014 for the 4.0% Notes.
Senior Credit Facility
On July 24, 2009, SBA Senior Finance, Inc. entered into an Amendment and Restatement, dated as of July 24, 2009, of the Credit Agreement, dated as of January 18, 2008 (the “Restated Credit Agreement”) for the $320.0 million revolving credit facility (the “Senior Credit facility”). The Senior Credit Facility was scheduled to mature on January 18, 2011. As of December 31, 2009, the availability under the Senior Credit Facility was $319.9 million. As of December 31, 2009, we did not have any amounts outstanding under this facility and had approximately $0.1 million in letters of credit posted against the availability of this Senior Credit Facility. On February 11, 2010 the Senior Credit Facility was terminated.
Amounts borrowed under the Senior Credit Facility accrued interest at the Eurodollar rate plus a margin that ranges from 150 basis points to 300 basis points or at a Base Rate (as defined in the Restated Credit Agreement) plus a margin that ranges from 50 basis points to 200 basis points, based upon the leverage ratio. The weighted average interest rate for amounts borrowed under the Senior Credit Facility for the year ended December 31, 2009 was 2.46%.
The Restated Credit Agreement required SBA Senior Finance and SBA Communications to maintain specific financial ratios, including, at the SBA Senior Finance level, a Consolidated Total Debt to Annualized Borrower EBITDA ratio (as defined in the Restated Credit Agreement) that did not exceed 5.0x for any fiscal quarter and an Annualized Borrower EBITDA to Annualized Cash Interest Expense ratio (as defined in the Restated Credit Agreement) of not less than 2.0x for any fiscal quarter. In addition, our ratio of Consolidated Total Net Debt to Consolidated Adjusted EBITDA ratio (as defined in the Restated Credit Agreement) for any fiscal quarter could not exceed 9.9x. The Restated Credit Agreement also contained customary affirmative and negative covenants. As of December 31, 2009, SBA Senior Finance was in full compliance with the terms of the Senior Credit Facility.
Upon the occurrence of certain bankruptcy and insolvency events with respect to SBA or certain of our subsidiaries, the revolving credit loans automatically would terminate and all amounts due under the Restated Credit Agreement and other loan documents would have become immediately due and payable. If certain other events of default occur, including failure to pay the principal and interest when due, then, with the permission of a majority of the lenders, the revolving credit commitments would have terminated and all amounts due under the Restated Credit Agreement and other loan documents would have become immediately due and payable.
Amounts borrowed under the Senior Credit Facility were secured by a first lien on substantially all of SBA Senior Finance’s assets not pledged under the CMBS Certificates and substantially all of the assets, other than leasehold, easement or fee interests in real property, of SBA Senior Finance’s subsidiaries.
On February 11, 2010 the Senior Credit Facility was terminated.
2010 Credit Facility
On February 11, 2010, SBA Senior Finance II, LLC (“SBA Senior Finance II”), our indirect wholly-owned subsidiary, entered into a credit agreement for a $500.0 million senior secured revolving credit facility (the “2010 Credit Facility”) with several banks and other financial institutions or entities from time to time parties to the credit agreement (the “Credit Agreement”). Amounts borrowed under the 2010 Credit Facility will be secured by a first lien on the capital stock of SBA Telecommunications, Inc., SBA Senior Finance, Inc. and SBA Senior Finance II (which now includes SBA Infrastructure Holdings I, Inc.), and substantially all of the assets, other than leasehold, easement or fee interests in real property, of SBA Senior Finance II and the Subsidiary Guarantors (as defined in the Credit Agreement). As of February 26, 2010, availability under the 2010 Credit Facility was $500.0 million.
The 2010 Credit Facility consists of a revolving loan under which up to $500 million may be borrowed, repaid and redrawn, subject to compliance with specific financial ratios and the satisfaction of other customary conditions to borrowing as set forth in the Credit Agreement. Amounts borrowed under the 2010 Credit Facility accrue interest at the Eurodollar rate plus a margin that ranges from 187.5 basis points to 237.5 basis points or at a Base Rate (as defined in the Credit Agreement) plus a margin that ranges from 87.5 basis points to 137.5 basis points, in each case based on the ratio of Consolidated Total Debt to Annualized Borrower EBITDA (as defined in the Credit Agreement). A 0.375% to 0.5% per annum fee is charged on the amount of unused commitment. If it is not terminated earlier by SBA Senior Finance II, the 2010 Credit Facility will terminate on, and SBA Senior Finance II will repay all amounts outstanding on or before, February 11, 2015. Proceeds available under the 2010 Credit Facility may be used for general corporate purposes.
The Credit Agreement requires SBA Senior Finance II and SBA Communications to maintain specific financial ratios, including, at the SBA Senior Finance II level, a ratio of Consolidated Total Debt to Annualized Borrower EBITDA (as defined in the Credit Agreement) that does not exceed 5.0x for any fiscal quarter, a ratio of Consolidated Total Debt and Net Hedge Exposure (as defined in the Credit Agreement) to Annualized Borrower EBITDA for the most recently ended fiscal quarter not to exceed 5.0x for 30 consecutive days and a ratio of Annualized Borrower EBITDA to Annualized Cash Interest Expense (as defined in the Credit Agreement) of not less than 2.0x for any fiscal quarter. In addition, our ratio of Consolidated Total Net Debt to Consolidated Adjusted EBITDA (as defined in the Credit Agreement) for any fiscal quarter on an annualized basis cannot exceed 8.9x. The Credit Agreement also contains customary affirmative and negative covenants that, among other things, limit SBA Senior Finance II’s ability to incur indebtedness, grant certain liens, make certain investments, enter into sale leaseback transactions or engage in certain asset dispositions, including a sale of all or substantially all of our assets.
The 2010 Credit Facility also permits us to request that one or more lenders (1) increase their proportionate share of the 2010 Credit Facility commitment, up to an additional $200 million in the aggregate and (2) provide SBA Senior Finance II term loans for an aggregate amount up to $800 million, without requesting consent of the other lenders. SBA Senior Finance II’s ability to request such increase of the 2010 Credit Facility or term loans is subject to its compliance with the conditions set forth in the Credit Agreement including, with respect to any term loan, compliance, on a pro forma basis, with the financial covenants and ratios set forth therein. Upon SBA Senior Finance II’s request, each lender may decide, in its sole discretion, whether to increase all or a portion of its revolving credit facility commitment or whether to provide SBA Senior Finance II term loans and if so upon what terms. As of December 31, 2009, SBA Senior Finance II would have had the ability to request term loans up to an aggregate principal amount of $325.0 million upon compliance with the terms of the Credit Agreement.
Optasite Credit Facility
On September 16, 2008, in connection with the acquisition of Optasite, we assumed Optasite’s fully drawn $150 million senior credit facility (the “Optasite Credit Facility”). We recorded the Optasite Credit Facility at its fair value of $147.0 million on the date of acquisition. Interest on the Optasite Credit Facility accrued at the one month Eurodollar Rate plus 165 basis points and interest payments were due monthly. Commencing November 1, 2008, we began paying the required installment payments on the Optasite Credit Facility. On July 31, 2009, we paid off the facility in full and the facility was subsequently terminated.
Senior Notes
On July 24, 2009, our wholly-owned subsidiary, Telecommunications issued $750$750.0 million of unsecured Senior Notes, $375senior notes (the “Senior Notes”), $375.0 million of which are due August 15, 2016 (the “2016 Notes”) and $375$375.0 million of which are due August 15, 2019. The2019 (the “2019 Notes”). At December 31, 2011, we had $375.0 million of 2016 Notes outstanding, which were recorded at a carrying value of $373.2 million, and the$375.0 million of 2019 Notes are guaranteed by SBA.outstanding, which were recorded at a carrying value of $372.4 million.
The 2016 Notes have an interest rate of 8.00% and were issued at a price of 99.330% of their face value. The 2019 Notes have an interest rate of 8.25% and were issued at a price of 99.152% of their face value. Interest on the 2016 Notes and 2019 Notes is due semi-annually on February 15 and August 15 of each year beginning on February 15, 2010. Based on the amounts outstanding at December 31, 2011, debt service for the next twelve months on the 2016 Senior Notes and the 2019 Senior Notes would be $30.0 million and $30.9 million, respectively. The 2016 Notes and the 2019 Notes are fully and unconditionally guaranteed by SBA Communications.
The 2016 Notes and the 2019 Notes are subject to redemption in whole or in part on or after August 15, 2012 and on or after August 15, 2014, respectively, at the redemption prices set forth in the indenture agreement plus accrued and unpaid interest. Prior to August 15, 2012 for the 2016 Notes and August 15, 2014 for the 2019 Notes, we may at our option redeem all or a portion of the 2016 Notes or 2019 Notes at a redemption price equal to 100% of the principal amount thereof plus a “make whole” premium plus accrued and unpaid interest. In addition, we may redeem up to 35% of the originally issued aggregate principal amount of each of the 2016 Notes and 2019 Notes with the net proceeds of certain equity offerings at a redemption price of 108.000%108.00% and 108.250%108.25%, respectively, of the principal amount of the redeemed notes plus accrued and unpaid interest.
The Indenture governing the 2016 Notes and the 2019Senior Notes contains customary covenants, subject to a number of exceptions and qualifications, including restrictions on Telecommunications’ ability to (1) incur additional indebtedness unless its Consolidated Indebtedness to Annualized Consolidated Adjusted EBITDA Ratio (as defined in the Indenture), pro forma for the additional indebtedness, does not exceed 7.0 times7.0x for the fiscal quarter, (2) merge, consolidate or sell assets, (3) make restricted payments, including dividends or other distributions, (4) enter into transactions with affiliates, and (5) enter into sale and leaseback transactions and restrictions on the ability of Telecommunications’ Restricted Subsidiaries (as defined in the Indenture) to incur liens securing indebtedness.
At December 31, 2009, we hadOn May 19, 2010, SBA Communications and Telecommunications filed a registration statement on Form S-4 with the Commission pursuant to which Telecommunications offered to (1) exchange all of its outstanding $375unregistered $375.0 million 20168.00% Senior Notes and $375due 2016 for registered $375.0 million 2019 Senior Notes. Based on the amounts outstanding at December 31, 2009, debt service for the next twelve months on the
20168.00% Senior Notes due 2016, and the 2019(2) exchange all of its outstanding unregistered $375.0 million 8.25% Senior Notes will be approximately $30.0due 2019 for registered $375.0 million and $30.9 million, respectively.8.25% Senior Notes due 2019. On July 15, 2010, the exchange offer was consummated.
Inflation
The impact of inflation on our operations has not been significant to date. However, we cannot assure you that a high rate of inflation in the future will not adversely affect our operating results particularly in light of the fact that our site leasing revenues are governed by long-term contracts with pre-determined pricing that we will not be able to increase in response to increases in inflation.
Recent Accounting Pronouncements
For a description of accounting changes and recent accounting pronouncements, including the expected dates of adoption and estimated effects, if any, on our Consolidated Financial Statements, see “Note 2: Restatement for Adoption of New Accounting Pronouncement” and “Note 4:3: Current Accounting Pronouncements” in the Notes to Consolidated Financial Statements of this Form 10-K.
Commitments and Contractual Obligations
The following table summarizes our scheduled contractual commitments as of December 31, 2009:2011:
Contractual Obligations | 2010 | 2011 | 2012 | 2013 | 2014 | Thereafter | Total | 2012 | 2013 | 2014 | 2015 | 2016 | Thereafter | Total | |||||||||||||||||||||||||||||||||||
| (in thousands) | |||||||||||||||||||||||||||||||||||||||||||||||||
| (in thousands) | |||||||||||||||||||||||||||||||||||||||||||||||||
Long-term debt | $ | 30,403 | $ | 940,609 | $ | — | $ | 550,000 | $ | 500,000 | $ | 750,000 | $ | 2,771,012 | $ | 5,000 | $ | 540,000 | $ | 505,000 | $ | 685,000 | $ | 380,000 | $ | 1,397,500 | $ | 3,512,500 | |||||||||||||||||||||
Interest payments (1) | 149,033 | 140,134 | 91,250 | 84,469 | 76,006 | 191,815 | 732,707 | 169,112 | 162,211 | 153,705 | 117,897 | 96,988 | 116,170 | 816,083 | |||||||||||||||||||||||||||||||||||
Operating leases | 59,157 | 58,602 | 57,255 | 56,857 | 57,543 | 1,079,547 | 1,368,961 | 70,052 | 69,917 | 70,588 | 70,866 | 70,371 | 1,319,419 | 1,671,213 | |||||||||||||||||||||||||||||||||||
Capital leases | 496 | 344 | 136 | 43 | — | — | 1,019 | 1,124 | 989 | 808 | 440 | — | — | 3,361 | |||||||||||||||||||||||||||||||||||
Employment agreements | 1,732 | 1,393 | 875 | — | — | — | 4,000 | 1,682 | 647 | 647 | 2,976 | ||||||||||||||||||||||||||||||||||||||
|
|
|
|
|
|
| |||||||||||||||||||||||||||||||||||||||||||
| $ | 240,821 | $ | 1,141,082 | $ | 149,516 | $ | 691,369 | $ | 633,549 | $ | 2,021,362 | $ | 4,877,699 | $ | 246,970 | $ | 773,764 | $ | 730,748 | $ | 874,203 | $ | 547,359 | $ | 2,833,089 | $ | 6,006,133 | ||||||||||||||||||||||
|
|
|
|
|
|
| |||||||||||||||||||||||||||||||||||||||||||
| (1) | Represents interest payments based on the |
Off-Balance Sheet Arrangements
We are not involved in any off-balance sheet arrangements.
ITEM 7A. QUANTITATIVE AND QUALITATIVE DISCLOSURES ABOUT MARKET RISK
We are exposed to certain market risks that are inherent in our financial instruments. These instruments arise from transactions entered into in the normal course of business.
The following table presents the future principal payment obligations and fair values associated with our long-term debt instruments assuming our actual level of long-term indebtedness as of December 31, 2009:2011:
| 2010 | 2011 | 2012 | 2013 | 2014 | Thereafter | Total | Fair Value | |||||||||||||||||
| (in thousands) | ||||||||||||||||||||||||
Debt: | ||||||||||||||||||||||||
Fixed rate 2006 CMBS Certificates(1) | $ | — | $ | 940,609 | $ | — | $ | — | $ | — | $ | — | $ | 940,609 | $ | 961,486 | ||||||||
0.375% Convertible Senior Notes | $ | 30,403 | $ | — | $ | — | $ | — | $ | — | $ | — | $ | 30,403 | $ | 34,203 | ||||||||
1.875% Convertible Senior Notes | $ | — | $ | — | $ | — | $ | 550,000 | $ | — | $ | — | $ | 550,000 | $ | 564,438 | ||||||||
4.00% Convertible Senior Notes | $ | — | $ | — | $ | — | $ | — | $ | 500,000 | $ | — | $ | 500,000 | $ | 652,500 | ||||||||
2016 Senior Notes | $ | — | $ | — | $ | — | $ | — | $ | — | $ | 375,000 | $ | 375,000 | $ | 388,125 | ||||||||
2019 Senior Notes | $ | — | $ | — | $ | — | $ | — | $ | — | $ | 375,000 | $ | 375,000 | $ | 393,750 | ||||||||
| Fair Value | ||||||||||||||||||||||||||||||||
| 2012 | 2013 | 2014 | 2015 | 2016 | Thereafter | Total | ||||||||||||||||||||||||||
| (in thousands) | ||||||||||||||||||||||||||||||||
Debt: | ||||||||||||||||||||||||||||||||
1.875% Convertible Senior Notes due 2013 | $ | — | $ | 535,000 | $ | — | $ | — | $ | — | $ | — | $ | 535,000 | $ | 605,246 | ||||||||||||||||
4.0% Convertible Senior Notes due 2014 | $ | — | $ | — | $ | 500,000 | $ | — | $ | — | $ | — | $ | 500,000 | $ | 761,588 | ||||||||||||||||
8.0% Senior Notes due 2016 | $ | — | $ | — | $ | — | $ | — | $ | 375,000 | $ | — | $ | 375,000 | $ | 405,000 | ||||||||||||||||
8.25% Senior Notes due 2019 | $ | — | $ | — | $ | — | $ | — | $ | — | $ | 375,000 | $ | 375,000 | $ | 407,813 | ||||||||||||||||
4.254% 2010-1 Tower Securities(1) | $ | — | $ | — | $ | — | $ | 680,000 | $ | — | $ | — | $ | 680,000 | $ | 699,006 | ||||||||||||||||
5.101% 2010-2 Tower Securities(2) | $ | — | $ | — | $ | — | $ | — | $ | — | $ | 550,000 | $ | 550,000 | $ | 579,018 | ||||||||||||||||
Term Loan | $ | 5,000 | $ | 5,000 | $ | 5,000 | $ | 5,000 | $ | 5,000 | $ | 472,500 | $ | 497,500 | $ | 494,391 | ||||||||||||||||
|
|
|
|
|
|
|
|
|
|
|
|
|
|
|
| |||||||||||||||||
Total debt obligation | $ | 5,000 | $ | 540,000 | $ | 505,000 | $ | 685,000 | $ | 380,000 | $ | 1,397,500 | $ | 3,512,500 | $ | 3,952,062 | ||||||||||||||||
|
|
|
|
|
|
|
|
|
|
|
|
|
|
|
| |||||||||||||||||
| (1) | The anticipated repayment date |
| (2) | The anticipated repayment date and the final maturity date for the 2010-2 Tower Securities is April 16, 2017 and April 16, 2042, respectively. |
Our current primary market risk exposure is interest rate risk relating to (1) our ability to meet financial covenants and (2) the impact of interest rate movements on our ability to refinance the 2006 CMBS Certificates on its anticipated repayment date or at maturity at market rates, (2) our ability to meet financial covenantsTerm Loan and (3) the impact of interest rate movements on any borrowings that we may incur under our 2010Revolving Credit Facility, which are allat floating rate.rates. We manage the interest rate risk on our outstanding debt through our large percentage of fixed rate debt. While we cannot predict our ability to refinance existing debt or the impact interest rate movements will have on our existing debt, we continue to evaluate our financial position on an ongoing basis. In addition, in connection with our convertible notes, we are subject to market risk associated with the market price of our common stock.
Special Note Regarding Forward-Looking Statements
This annual report contains “forward-looking statements” within the meaning of Section 27A of the Securities Act of 1933 and Section 21E of the Securities Exchange Act of 1934. These statements concern expectations, beliefs, projections, plans and strategies, anticipated events or trends and similar expressions concerning matters that are not historical facts. Specifically, this annual report contains forward-looking statements regarding:
our expectation that we will continueexpectations on the future growth and financial health of the wireless industry and the industry participants, and the drivers of such growth;
our beliefs regarding our ability to incur losses;capture and capitalize on industry growth and the impact of such growth on our financial and operational results;
our expectations that site leasing revenues will continue to grow asregarding the opportunities in the international wireless service providers lease additional spacemarkets in which we currently operate or have targeted for growth, and our beliefs regarding how we can capitalize on our towers due to increasing minutes of use, network expansion and network coverage requirements;such opportunities;
our belief that our site leasing business is characterized by stable and long-term recurring revenues, predictable operating costs and minimal maintenance and non-discretionary capital expenditures;
our expectations regarding the growth of our cash flows by adding tenants to our towers at minimal incremental costs by using existing tower capacity or requiring wireless service providers to bear all or a portion of the cost of tower modifications;
our intent to grow our tower portfolio, domestically and internationally, by 5% to 10% through opportunities that meet our investment criteria and are available at prices which we believe will be accretive to our shareholders and allow us to maintain our long-term target leverage ratios;
our expectation that revenues from our international operations may grow in the future;
our intent to build at least 120 to 140 new towers in 2010 and our intent to have at least one signed tenant lease on each new tower on the day it is completed;
our expectations regarding the amount of future cash capital expenditures, both discretionary and non-discretionary, including expenditures required to maintain, improve and modify our towers;
our belief that our towers have significant capacity to accommodate additional tenants, that our tower operations are highly scalable, and that we can add tenants to our towers at minimal incremental costs;costs, and the impact of these economies of scale on our cash flow and financial results;
our belief regardingintent to grow our position to capturetower portfolio, domestically and internationally, through the consummation of the Mobilitie transaction, additional site leasing business in our marketstower acquisitions and identify and participate in site development projects across our markets;the construction of new towers;
our ability to capture 3Gexpectation that we will continue our ground lease purchase program and 4G network build-out work;
actions we may pursue to manage our leverage position and ensure continued compliance withthe estimates of the impact of such program on our financial covenants;results;
our intentionsexpectation that we will continue to incur losses;
our expectations regarding the share repurchase program;our future cash capital expenditures, both discretionary and non-discretionary, including expenditures required to maintain, improve and modify our towers and general corporate expenditures;
our estimates regarding our liquidity our sources and principal uses of liquidityposition in 2012 and our ability to fund operations, and refinance or repayintended use of our obligations as they become due;liquidity;
our estimates regarding our annual debt service in 2010 and thereafter, and our beliefexpectation that our cash flowsrevenues from our international operations forwill grow in the next twelve months will be sufficient to service our outstanding debt during the next twelve months;future;
our expectations regarding the impacteffectiveness of our convertible note hedge transactions to minimize the dilution and the termination of such transactions,costs associated with Lehman Derivatives;
our intentoutstanding convertible notes; and ability to continue to purchase and/or enter into long-term leases for the land that underlies our towers and the effect of such ground lease purchases on our margins and long-term financial condition;
our estimates regarding certain accounting and tax matters, including the adoption of certain accounting pronouncements and the availability of sufficient net operating losses to offset future taxable income; and
our use of the net proceeds from the our recent debt offerings.matters.
These forward-looking statements reflect our current views about future events and are subject to risks, uncertainties and assumptions. We wish to caution readers that certain important factors may have affected and could in the future affect our actual results and could cause actual results to differ significantly from those expressed in any forward-looking statement. The most important factors that could prevent us from achieving our goals, and cause the assumptions underlying forward-looking statements and the actual results to differ materially from those expressed in or implied by those forward-looking statements include, but are not limited to, the following:
the impact of consolidation among wireless service providers on our leasing revenue;
developments in the wireless communications industry in general, and for wireless communications infrastructure providers in particular, that may slow growth or affect the willingness or ability of the wireless service providers to expend capital to fund network expansion or enhancements;
our ability to secure as many site leasing tenants as anticipated, recognize our expected economies of scale with respect to new tenants on our towers, and retain current leases on towers;
our ability to secure and deliver anticipated services business at contemplated margins;
factors that would adversely impact our ability to build the anticipated number of new towers, including our ability to identify and acquire land that would be attractive for our clients and to successfully and timely address zoning, permitting and other issues that arise in connection with the building of new towers;
competition for the acquisition of towers and other factors that may adversely affect our ability to purchase towers that meet our investment criteria and are available at prices which we believe will be accretive to our shareholders and allow us to maintain our long-term target leverage ratios;
our ability to effectively integrate acquired towers into our business and to achieve the financial results projected in our valuation models for the acquired towers;
our ability to successfully refinance manage the risks associated with international operations, including foreign exchange risk, currency restrictions and foreign regulatory and legal risks;
our indebtedness aheadintent and ability to continue our ground lease purchase program and the effect of their maturity dates or anticipated repayment dates,such ground lease purchases on favorableour margins and long-term financial condition;
our ability to continue to comply with covenants and the terms or at all;of our credit instruments;
our ability to obtain additional financing to acquire towers;
our ability to sufficiently increase our revenues and maintain expenses and cash capital expenditures at appropriate levels to permit us to meet our anticipated uses of liquidity for operations, debt service and estimated portfolio growth;
the ability of our clients to access sufficient capital or their willingness to expend capital to fund network expansion or enhancements;
our ability to continue to comply with covenants and the terms of our credit instruments;
our ability to secure as many site leasing tenants as planned, including our ability to retain current leases on towers and deal with the impact, if any, of recent consolidation among wireless service providers;
our ability to identify towers and land underneath towers that would be attractive to our clients and accretive to our financial results; and to negotiate and consummate agreements to acquire such towers and land;
our ability to identify, acquire at acceptable prices and terms and integrate into our leasing business towers and tower assets, domestically and internationally, that meet our investment criteria and, to the extent that any such towers are located internationally, our ability to successfully manage the risks associated with international operations, including foreign exchange risk, currency restrictions and foreign regulatory and legal risks;
our ability to build at least 120 to 140 new towers in 2010;
our ability to secure and deliver anticipated services business at contemplated margins;
our ability to successfully and timely address zoning issues, permitting and other issues that arise in connection with the building of new towers;
our ability to realize economies of scale from our tower portfolio;
the business climate for the wireless communications industry in general and the wireless communications infrastructure providers in particular;
the state of the credit markets and capital markets, including the level of volatility, illiquidity and interest rates that may affect our ability to pursue actions to manage our leverage position;
the continued use of towers and dependence on outsourced site development services by the wireless communications industry; and
our ability to successfully estimate the impact of certain accounting and tax matters, including the effect on our company of adopting certain accounting pronouncements and the availability of sufficient net operating losses to offset future taxable income.income; and
natural disasters and other unforeseen damage for which our insurance may not provide adequate coverage.
ITEM 8. FINANCIAL STATEMENTS AND SUPPLEMENTARY DATA
Financial statements and supplementary data are on pages F-1 through F-54.F-47.
ITEM 9. CHANGES IN AND DISAGREEMENTS WITH ACCOUNTANTS ON ACCOUNTING AND FINANCIAL DISCLOSURE
None.
ITEM 9A. CONTROLS AND PROCEDURES
Disclosure Controls and Procedures -– We maintain disclosure controls and procedures that are designed to ensure that information required to be disclosed in our reports under the Securities Exchange Act of 1934, as amended (the “Exchange Act”), is recorded, processed, summarized and reported within the time periods specified in the SEC’s rules and forms, and that such information is accumulated and communicated to management, including our Chief Executive Officer (“CEO”) and Chief Financial Officer (“CFO”), as appropriate, to allow timely decisions regarding required disclosure. In designing and evaluating the disclosure controls and procedures, management recognized that any controls and procedures, no matter how well designed and operated, can provide only reasonable assurance of achieving the desired control objectives, as ours are designed to do, and management necessarily was required to apply its judgment in evaluating the cost-benefit relationship of possible controls and procedures.
In connection with the preparation of this Annual Report on Form 10-K, as of December 31, 2009,2011, an evaluation was performed under the supervision and with the participation of our management, including the CEO and CFO, of the effectiveness of our disclosure controls and procedures (as defined in Rule 13a-15(e) under the Exchange Act). Based on such evaluation, our CEO and CFO concluded that, as of December 31, 2009,2011, our disclosure controls and procedures were effective.
There has been no change in our internal control over financial reporting during the quarter ended December 31, 20092011 that has materially affected, or is reasonably likely to materially affect, our internal control over financial reporting.
Management’s Annual Report on Internal Control over Financial Reporting -–Management is responsible for establishing and maintaining adequate internal control over financial reporting, and for performing an assessment of the effectiveness of internal control over financial reporting as of December 31, 2009.2011. Internal control over financial reporting is a process designed to provide reasonable assurance regarding the reliability of financial reporting and the preparation of financial statements for external purposes in accordance with generally accepted accounting principles. Our system of internal control over financial reporting includes those policies and procedures that (i) pertain to the maintenance of records that, in reasonable detail, accurately and fairly reflect the transactions and dispositions of the assets of SBA; (ii) provide reasonable assurance that transactions are recorded as necessary to permit preparation of financial statements in accordance with generally accepted accounting principles, and that receipts and expenditures of SBA are being made only in accordance with authorizations of management and directors of SBA; and (iii) provide reasonable assurance regarding prevention or timely detection of unauthorized acquisition, use or disposition of SBA’s assets that could have a material effect on the financial statements.
Management performed an assessment of the effectiveness of SBA’s internal control over financial reporting as of December 31, 20092011 based upon criteria inInternal Control – Integrated Framework issued by the Committee of Sponsoring Organizations of the Treadway Commission (COSO). Based on our assessment, management determined that SBA’s internal control over financial reporting was effective as of December 31, 20092011 based on the criteria inInternal Control-IntegratedControl – Integrated Framework issued by COSO.
Because of its inherent limitations, internal control over financial reporting may not prevent or detect misstatements. Also, projections of any evaluation of effectiveness to future periods are subject to the risk that controls may become inadequate because of changes in conditions, or that the degree of compliance with the policies or procedures may deteriorate.
Ernst & Young LLP, the independent registered certified public accounting firm that audited the financial statements included in this Annual Report on Form 10-K, has issued an attestation report on SBA’s internal control over financial reporting.
Report of Independent Registered Certified Public Accounting Firm
The Board of Directors and Shareholders of SBA Communications Corporation and Subsidiaries
We have audited SBA Communications Corporation and Subsidiaries’ internal control over financial reporting as of December 31, 2009,2011, based on criteria established in Internal Control—Control – Integrated Framework issued by the Committee of Sponsoring Organizations of the Treadway Commission (the COSO criteria). SBA Communications Corporation and Subsidiaries’ management is responsible for maintaining effective internal control over financial reporting, and for its assessment of the effectiveness of internal control over financial reporting included in the accompanying Management’s Annual Report on Internal Control over Financial Reporting. Our responsibility is to express an opinion on the company’s internal control over financial reporting based on our audit.
We conducted our audit in accordance with the standards of the Public Company Accounting Oversight Board (United States). Those standards require that we plan and perform the audit to obtain reasonable assurance about whether effective internal control over financial reporting was maintained in all material respects. Our audit included obtaining an understanding of internal control over financial reporting, assessing the risk that a material weakness exists, testing and evaluating the design and operating effectiveness of internal control based on the assessed risk, and performing such other procedures as we considered necessary in the circumstances. We believe that our audit provides a reasonable basis for our opinion.
A company’s internal control over financial reporting is a process designed to provide reasonable assurance regarding the reliability of financial reporting and the preparation of financial statements for external purposes in accordance with generally accepted accounting principles. A company’s internal control over financial reporting includes those policies and procedures that (1) pertain to the maintenance of records that, in reasonable detail, accurately and fairly reflect the transactions and dispositions of the assets of the company; (2) provide reasonable assurance that transactions are recorded as necessary to permit preparation of financial statements in accordance with generally accepted accounting principles, and that receipts and expenditures of the company are being made only in accordance with authorizations of management and directors of the company; and (3) provide reasonable assurance regarding prevention or timely detection of unauthorized acquisition, use, or disposition of the company’s assets that could have a material effect on the financial statements.
Because of its inherent limitations, internal control over financial reporting may not prevent or detect misstatements. Also, projections of any evaluation of effectiveness to future periods are subject to the risk that controls may become inadequate because of changes in conditions, or that the degree of compliance with the policies or procedures may deteriorate.
In our opinion, SBA Communications Corporation and Subsidiaries maintained, in all material respects, effective internal control over financial reporting as of December 31, 2009,2011, based on the COSO criteria.
We also have audited, in accordance with the standards of the Public Company Accounting Oversight Board (United States), the consolidated balance sheets of SBA Communications Corporation and Subsidiaries as of December 31, 20092011 and 2008,2010, and the related consolidated statements of operations, comprehensive loss, shareholders’ (deficit) equity and cash flows for each of the three years in the period ended December 31, 20092011 of SBA Communications Corporation and Subsidiaries and our report dated February 26, 201027, 2012 expressed an unqualified opinion thereon.
/s/ Ernst & Young LLP
West Palm Beach,Certified Public Accountants
Boca Raton, Florida
February 26, 201027, 2012
ITEMItem 9B. OTHER INFORMATIONOther Information
None.
ITEM 10. DIRECTORS, EXECUTIVE OFFICERS AND CORPORATE GOVERNANCE
We have adopted a Code of Ethics that applies to our Chief Executive Officer, Chief Financial Officer and Chief Accounting Officer. The Code of Ethics is located on our internet web site atwww.sbasite.com under “Investor Relations-Corporate Governance – Other Documents.” We intend to provide disclosure of any amendments or waivers of our Code of Ethics on our website within four business days following the date of the amendment or waiver.
The remaining items required by Part III, Item 10 are incorporated herein by reference from the Registrant’s Proxy Statement for its 20102012 Annual Meeting of Shareholders to be filed on or before April 30, 2010.2012.
ITEM 11. EXECUTIVE COMPENSATION
The items required by Part III, Item 11 are incorporated herein by reference from the Registrant’s Proxy Statement for its 20102012 Annual Meeting of Shareholders to be filed on or before April 30, 2010.2012.
ITEM 12. SECURITY OWNERSHIP OF CERTAIN BENEFICIAL OWNERS AND MANAGEMENT AND RELATED STOCKHOLDER MATTERS
The items required by Part III, Item 12 are incorporated herein by reference from the Registrant’s Proxy Statement for its 20102012 Annual Meeting of Shareholders to be filed on or before April 30, 2010.2012.
ITEM 13. CERTAIN RELATIONSHIPS AND RELATED TRANSACTIONS, AND DIRECTOR INDEPENDENCE
The items required by Part III, Item 13 are incorporated herein by reference from the Registrant’s Proxy Statement for its 20102012 Annual Meeting of Shareholders to be filed on or before April 30, 2010.2012.
ITEM 14. PRINCIPAL ACCOUNTING FEES AND SERVICES
The items required by Part III, Item 14 are incorporated herein by reference from the Registrant’s Proxy Statement for its 20102012 Annual Meeting of Shareholders to be filed on or before April 30, 2010.2012.
PART IV
PART IVITEM 15. EXHIBITS, FINANCIAL STATEMENT SCHEDULES
(a) Documents filed as part of this report:
(1) Financial Statements
See Item 8 for Financial Statements included with this Annual Report on Form 10-K.
(2) Financial Statement Schedules
None.
(3) Exhibits
Exhibit No. | Description of Exhibits | |
| 3.4 | Fourth Amended and Restated Articles of Incorporation, as Amended, of SBA Communications Corporation. | |
| 3.5A | Amended and Restated Bylaws of SBA Communications Corporation, effective as of | |
| 4.13 | Indenture, dated May 16, 2008, between SBA Communications Corporation and U.S. Bank National Association. | |
| 4.14 | Form of 1.875% Convertible Senior Notes due 2013 (included in Exhibit 4.13). | |
| 4.15 | Indenture, dated April 24, 2009, between SBA Communications Corporation and U.S. Bank National Association. | |
| 4.16 | Form of 4.0% Convertible Senior Note due 2014 (included in Exhibit 4.15). | |
| 4.17 | Indenture, dated July 24, 2009, between SBA Communications Corporation and U.S. Bank National Association. | |
| 4.18 | Form of 8.000% Senior Notes due 2016 (included in Exhibit 4.17). | |
| 4.19 | Form of 8.250% Senior Notes due 2019 (included in Exhibit 4.17). | |
| 10.1 | SBA Communications Corporation Registration Rights Agreement dated as of March 5, 1997, among the Company, Steven E. Bernstein, Ronald G. Bizick, II and Robert Grobstein. (2) | |
| 10.24 | 1999 Equity Participation Plan. (1)+ | |
| 10.33 | 2001 Equity Participation Plan as Amended and Restated on May 16, 2002. | |
| 10.35C | Amended and Restated Employment Agreement, made and entered into as of January 1, 2008, between SBA Communications Corporation and Jeffrey A. Stoops. | |
| 10.35D | Amendment No. 1 to Amended and Restated Employment Agreement made and entered into as of September 18, 2008, between SBA Communications Corporation and Jeffrey A. Stoops. | |
| 10.35E | Employment Agreement, dated July 1, 2011, between SBA Communications Corporation and Jeffrey A. Stoops. (20) + | |
| 10.49 | Amended and Restated Loan and Security Agreement, dated as of November 18, 2005, by and between SBA Properties, Inc. and the Additional Borrower or Borrowers that may become a party thereto and SBA CMBS 1 Depositor LLC. | |
| 10.50 | Management Agreement, dated as of November 18, 2005, by and among SBA Properties, Inc., SBA Network Management, Inc. and SBA Senior Finance, Inc. | |
| 10.57B | Amended and Restated Employment Agreement, made and entered into as of January 1, 2010, between SBA Communications Corporation and Kurt L. Bagwell. (14) + | |
| 10.58B | Amended and Restated Employment Agreement, made and entered into as of January 1, 2010, between SBA Communications Corporation and Thomas P. Hunt. (14) + | |
| 10.60 | Joinder and Amendment to Management Agreement, dated November 6, 2006, by and among SBA Properties, Inc., SBA Towers, Inc., SBA Puerto Rico, Inc., SBA Sites, Inc., SBA Towers USVI, Inc., and SBA Structures, Inc., and SBA Network Management, Inc., and SBA Senior Finance, Inc. | |
| 10.61 | Second Loan and Security Agreement Supplement and Amendment, dated as of November 6, 2006, by and among SBA Properties, Inc., and SBA Towers, Inc., SBA Puerto Rico, Inc., SBA Sites, Inc., SBA Towers USVI, Inc., and SBA Structures, Inc. and Midland Loan Services, Inc., as Servicer on behalf of LaSalle Bank National Association, as Trustee. | |
| 10.70 | Registration Rights Agreement, dated May 16, 2008, among SBA Communications Corporation and Deutsche Bank Securities Inc., Citigroup Global Markets Inc. and Lehman Brothers Inc., as representatives of the several initial purchasers listed on Schedule 1 of the Purchase Agreement. | |
| 10.71 | Form of Convertible Bond Hedge Transaction Agreement entered into by SBA Communications Corporation with each of Lehman Brothers OTC Derivatives Inc., Citibank, N.A., Deutsche Bank AG London Branch, and Wachovia Capital Markets, LLC and Wachovia Bank, National Association. | |
| 10.72 | Form of Issuer Warrant Transaction Letter Agreement entered into by SBA Communications Corporation with each of Lehman Brothers OTC Derivatives Inc., Citibank, N.A., Deutsche Bank AG London Branch, and Wachovia Capital Markets, LLC and Wachovia Bank, National Association. | |
| SBA Communications Corporation 2008 Employee Stock Purchase | ||
| 10.76 | Form of Indemnification Agreement dated January 15, 2009 between SBA Communications Corporation and its directors and certain officers. (10) | |
| 10.79 | Form of Convertible Bond Hedge Transaction Agreement entered into by SBA Communications Corporation with each of Citibank, N.A., Barclays Bank PLC, Deutsche Bank AG, London Branch, JP Morgan Chase Bank, National Association and Wachovia Capital Markets, LLC. | |
| 10.80 | Form of Issuer Warrant Transaction Letter Agreement entered into by SBA Communications Corporation with each of Citibank, N.A., Barclays Bank PLC, Deutsche Bank AG, London Branch, JP Morgan Chase Bank, National Association and Wachovia Capital Markets, LLC. | |
| 10.82 | Registration Rights Agreement, dated July 24, 2009, among SBA Communications Corporation, SBA Telecommunications, Inc. and Barclays Capital Inc., Deutsche Bank Securities Inc. and J.P. Morgan Securities Inc., as representatives of the several initial purchasers listed on Schedule 2 of the Registration Rights Agreement. | |
| 10.85 | Employment Agreement, made and entered into as of October 28, 2009, between SBA Communications Corporation and Brendan T. Cavanagh. | |
| 10.86 | $500,000,000 Credit Agreement, dated as of February 11, 2010, among SBA Senior Finance II, LLC, as borrower, the several banks and other financial institutions or entities from time to time parties thereto, RBS Securities Inc., as syndication agent, Wells Fargo Bank, National Association, as co-syndication agent, Citibank, N.A. and JPMorgan Chase Bank, N.A., as co-documentation agents, and Toronto Dominion (Texas) LLC, as administrative agent. | |
| 10.86A | Amended and Restated Credit Agreement, dated as of June 30, 2011, among SBA Senior Finance II, as borrower, the several lenders from time to time parties thereto, Toronto Dominion (Texas) LLC, as administrative agent, JPMorgan Chase Bank, N.A., as term loan syndication agent, Barclays Capital, as co-term loan syndication agent, The Royal Bank of Scotland plc and Wells Fargo Bank, National Association, as co-term loan documentation agents, Citibank, N.A. and JPMorgan Chase Bank, N.A., as co-revolving facility documentation agents, and the other agents thereto. (19) | |
| 10.87 | Guarantee and Collateral Agreement, dated as of February 11, 2010, by SBA Communications Corporation, SBA Telecommunications, Inc., SBA Senior Finance, Inc., SBA Senior Finance II, LLC and certain of its subsidiaries in favor of Toronto Dominion (Texas) LLC, as administrative agent. | |
| Purchase Agreement, dated April 8, 2010, among SBA Senior Finance, Inc. and the several initial purchasers listed on Schedule I of the Purchase Agreement. (15) | ||
| 10.89 | SBA Communications Corporation 2010 Performance and Equity Incentive Plan. (17) + | |
| 10.90 | Third Loan and Security Agreement Supplement and Amendment, dated as of April 16, 2010, by and among SBA Properties, Inc., SBA Sites, Inc. and SBA Structures, Inc., as Borrowers, and Midland Loan Services, Inc., as Servicer on behalf of Deutsche Bank Trust Company Americas, as Trustee (18). | |
| 10.91 | Fourth Loan and Security Agreement Supplement and Amendment, dated as of April 16, 2010, by and among SBA Properties, Inc., SBA Sites, Inc. and SBA Structures, Inc., as Borrowers, and Midland Loan Services, Inc., as Servicer on behalf of Deutsche Bank Trust Company Americas, as Trustee (18). | |
| *21 | Subsidiaries. | |
| *23.1 | Consent of Ernst & Young LLP. | |
| Certification by Jeffrey A. Stoops, Chief Executive Officer, pursuant to Section 302 of the Sarbanes-Oxley Act of 2002. | ||
| Certification by Brendan T. Cavanagh, Chief Financial Officer, pursuant to Section 302 of the Sarbanes-Oxley Act of 2002. | ||
| Certification by Jeffrey A. Stoops, Chief Executive Officer, pursuant to Section 906 of the Sarbanes-Oxley Act of 2002. | ||
| Certification by Brendan T. Cavanagh, Chief Financial Officer, pursuant to Section 906 of the Sarbanes-Oxley Act of 2002. | ||
| **101.INS | XBRL Instance Document. | |
| **101.SCH | XBRL Taxonomy Extension Schema Document. | |
| **101.DEF | XBRL Taxonomy Extension Definition Linkbase Document. | |
| **101.CAL | XBRL Taxonomy Extension Calculation Linkbase Document. | |
| **101.LAB | XBRL Taxonomy Extension Label Linkbase Document. | |
| **101.PRE | XBRL Taxonomy Extension Presentation Linkbase Document. | |
| + | Management contract or compensatory plan or arrangement. |
| * | Filed herewith |
| ** | Furnished herewith. |
| (1) | Incorporated by reference to the Registration Statement on Form S-1/A, previously filed by the Registrant (Registration No. 333-76547). |
| (2) | Incorporated by reference to the |
| Incorporated by reference to the Form 10-K for the year ended December 31, 2005, previously filed by the Registrant. |
| Incorporated by reference to the Form 10-K for the year ended December 31, 2006, previously filed by the Registrant. |
| Incorporated by reference to the Form 10-Q for the quarter ended March 31, 2008, previously filed by the Registrant. |
| (6) | Incorporated by reference to the Form 8-K dated |
| (7) | Incorporated by reference to the Form 10-Q for the quarter ended June 30, 2008, previously filed by the Registrant. |
| (8) | Incorporated by reference to the Form 10-Q for the quarter ended September 30, 2008, previously filed by the Registrant. |
| (9) | Incorporated by reference to the Form 10-Q for the quarter ended June 30, 2011, previously filed by the Registrant. |
| (10) | Incorporated by reference to the Form 10-K for the year ended December 31, 2008, previously filed by the Registrant. |
| (11) | Incorporated by reference to the Form 10-Q for the quarter ended March 31, |
| (12) | Incorporated by reference to the Form 8-K dated January |
| Incorporated by reference to the Form 10-Q for the quarter ended June 30, 2009, previously filed by the Registrant. |
| (14) | Incorporated by reference to the Form 10-K for the year ended December 31, 2009, previously filed by the Registrant. |
| (15) | Incorporated by reference to the Form 8-K dated April 14, 2010, previously filed by the Registrant. |
| (16) | Incorporated by reference to the Form S-4 dated May 19, 2010, previously filed by the Registrant. |
| (17) | Incorporated by reference to the Form S-8 dated May 19, 2010, previously filed by the Registrant. |
| (18) | Incorporated by reference to the Form 10-Q for the quarter ended June 30, 2010, previously filed by the Registrant. |
| (19) | Incorporated by reference to the Form 8-K dated July 7, 2011, previously filed by the Registrant. |
| (20) | Incorporated by reference to the Form 10-Q for the quarter ended September 30, 2011, previously filed by the Registrant. |
Pursuant to the requirements of Section 13 or 15(d) of the Securities Exchange Act of 1934, the Registrant has duly caused this report to be signed on its behalf by the undersigned, thereunto duly authorized.
| SBA COMMUNICATIONS CORPORATION | ||||
| By: | /s/ Jeffrey A. Stoops | |||
Jeffrey A. Stoops Chief Executive Officer and President | ||||
| Date: | February | |||
Pursuant to the requirements of the Securities Exchange Act of 1934, this report has been signed below by the following persons on behalf of the registrant and in the capacities and on the dates indicated.
Signature | Title | Date | ||
/s/ Steven E. Bernstein | Chairman of the Board of Directors | February | ||
| Steven E. Bernstein | ||||
/s/ Jeffrey A. Stoops | Chief Executive Officer and President | February | ||
| Jeffrey A. Stoops | (Principal Executive Officer) | |||
/s/ Brendan T. Cavanagh | Chief Financial Officer | February | ||
| Brendan T. Cavanagh | (Principal Financial Officer) | |||
/s/ Brian D. Lazarus | Chief Accounting Officer | February | ||
| Brian D. Lazarus | (Principal Accounting Officer) | |||
/s/ Brian C. Carr | Director | February | ||
| Brian C. Carr | ||||
/s/ Duncan H. Cocroft | Director | February | ||
| Duncan H. Cocroft | ||||
/s/ George R. Krouse Jr | Director | February | ||
| George R. Krouse Jr. | ||||
/s/ Jack Langer | Director | February | ||
| Jack Langer | ||||
/s/ Kevin L. Beebe | Director | February | ||
| Kevin L. Beebe | ||||
SBA COMMUNICATIONS CORPORATION AND SUBSIDIARIES
CONSOLIDATED FINANCIAL STATEMENTS
REPORT OF INDEPENDENT REGISTERED CERTIFIED PUBLIC ACCOUNTING FIRM
The Board of Directors and Shareholders of SBA Communications Corporation and Subsidiaries
We have audited the accompanying consolidated balance sheets of SBA Communications Corporation and Subsidiaries as of December 31, 20092011 and 2008,2010, and the related consolidated statements of operations, comprehensive loss, shareholders’ (deficit) equity and cash flows for each of the three years in the period ended December 31, 2009.2011. These financial statements are the responsibility of the Company’s management. Our responsibility is to express an opinion on these financial statements based on our audits.
We conducted our audits in accordance with the standards of the Public Company Accounting Oversight Board (United States). Those standards require that we plan and perform the audit to obtain reasonable assurance about whether the financial statements are free of material misstatement. An audit includes examining, on a test basis, evidence supporting the amounts and disclosures in the financial statements. An audit also includes assessing the accounting principles used and significant estimates made by management, as well as evaluating the overall financial statement presentation. We believe that our audits provide a reasonable basis for our opinion.
In our opinion, the financial statements referred to above present fairly, in all material respects, the consolidated financial position of SBA Communications Corporation and Subsidiaries at December 31, 20092011 and 2008,2010, and the consolidated results of their operations and their cash flows for each of the three years in the period ended December 31, 2009,2011, in conformity with U.S. generally accepted accounting principles.
As discussed in Note 2 to the consolidated financial statements, the Company adopted Financial Accounting Standards Board Staff Position No. APB 14-1, Accounting for Convertible Debt Instruments That May Be Settled in Cash Upon Conversion (Including Partial Cash Settlement) (codified in FASB ASC Topic 470, Debt with Conversions and Other Options) effective as of January 1, 2009.
We also have audited, in accordance with the standards of the Public Company Accounting Oversight Board (United States), SBA Communications Corporation and Subsidiaries’ internal control over financial reporting as of December 31, 2009,2011, based on criteria established in Internal Control—Control – Integrated Framework issued by the Committee of Sponsoring Organizations of the Treadway Commission, and our report dated February 26, 201027, 2012 expressed an unqualified opinion thereon.
/s/ Ernst & Young LLP
West Palm Beach,Certified Public Accountants
Boca Raton, Florida
February 26, 201027, 2012
SBA COMMUNICATIONS CORPORATION AND SUBSIDIARIES
CONSOLIDATED BALANCE SHEETS
(in thousands, except per share amounts)
| December 31, 2009 | December 31, 2008 | December 31, 2011 | December 31, 2010 | |||||||||||||
| (as adjusted) | ||||||||||||||||
ASSETS | ||||||||||||||||
Current assets: | ||||||||||||||||
Cash and cash equivalents | $ | 161,317 | $ | 78,856 | $ | 47,316 | $ | 64,254 | ||||||||
Restricted cash | 22,266 | 29,456 | ||||||||||||||
Short-term investments | 5,352 | 162 | 5,773 | 4,016 | ||||||||||||
Restricted cash | 30,285 | 38,599 | ||||||||||||||
Accounts receivable, net of allowance of $350 and $852 in 2009 and 2008, respectively | 19,644 | 16,351 | ||||||||||||||
Accounts receivable, net of allowance of $135 and $263 at December 31, 2011 and 2010, respectively | 22,100 | 18,784 | ||||||||||||||
Costs and estimated earnings in excess of billings on uncompleted contracts | 10,392 | 10,658 | 17,655 | 17,775 | ||||||||||||
Prepaid and other current assets | 9,848 | 9,689 | 14,246 | 12,442 | ||||||||||||
|
| |||||||||||||||
Total current assets | 236,838 | 154,315 | 129,356 | 146,727 | ||||||||||||
Property and equipment, net | 1,496,938 | 1,502,672 | 1,583,393 | 1,534,318 | ||||||||||||
Intangible assets, net | 1,435,591 | 1,425,132 | 1,639,784 | 1,500,012 | ||||||||||||
Deferred financing fees, net | 37,902 | 29,705 | 42,064 | 45,110 | ||||||||||||
Other assets | 106,377 | 96,005 | 211,802 | 174,008 | ||||||||||||
|
| |||||||||||||||
Total assets | $ | 3,313,646 | $ | 3,207,829 | $ | 3,606,399 | $ | 3,400,175 | ||||||||
|
| |||||||||||||||
LIABILITIES AND SHAREHOLDERS’ EQUITY | ||||||||||||||||
Current liabilities: | ||||||||||||||||
Current maturities of long-term debt | $ | 28,648 | $ | 6,000 | ||||||||||||
Accounts payable | 9,219 | 8,963 | $ | 12,755 | $ | 11,847 | ||||||||||
Accrued expenses | 28,110 | 21,529 | 23,746 | 21,429 | ||||||||||||
Current maturities of long-term debt | 5,000 | — | ||||||||||||||
Deferred revenue | 54,013 | 45,306 | 49,779 | 61,138 | ||||||||||||
Accrued interest | 35,551 | 5,946 | 32,351 | 32,293 | ||||||||||||
Other current liabilities | 3,184 | 2,850 | 3,250 | 3,877 | ||||||||||||
|
| |||||||||||||||
Total current liabilities | 158,725 | 90,594 | 126,881 | 130,584 | ||||||||||||
|
| |||||||||||||||
Long-term liabilities: | ||||||||||||||||
Long-term debt | 2,460,402 | 2,386,230 | 3,349,485 | 2,827,450 | ||||||||||||
Other long-term liabilities | 94,570 | 80,495 | 129,282 | 112,008 | ||||||||||||
|
| |||||||||||||||
Total long-term liabilities | 2,554,972 | 2,466,725 | 3,478,767 | 2,939,458 | ||||||||||||
|
| |||||||||||||||
Commitments and contingencies | ||||||||||||||||
Redeemable noncontrolling interests | 12,064 | 13,023 | ||||||||||||||
|
| |||||||||||||||
Shareholders’ equity: | ||||||||||||||||
Preferred stock - par value $.01, 30,000 shares authorized, none issued or outstanding | — | — | ||||||||||||||
Common stock - Class A, par value $.01, 200,000 shares authorized, 117,082 and 117,525 shares issued and outstanding at December 31, 2009 and 2008, respectively | 1,171 | 1,175 | ||||||||||||||
Preferred stock – par value $.01, 30,000 shares authorized, no shares issued or outstanding | — | — | ||||||||||||||
Common stock – Class A, par value $.01, 400,000 shares authorized 109,675 and 114,832 shares issued and outstanding at December 31, 2011 and 2010, respectively | 1,097 | 1,148 | ||||||||||||||
Additional paid-in capital | 2,228,268 | 2,085,915 | 2,268,244 | 2,243,457 | ||||||||||||
Accumulated deficit | (1,627,602 | ) | (1,435,031 | ) | (2,281,139 | ) | (1,929,670 | ) | ||||||||
Accumulated other comprehensive loss, net | (2,803 | ) | (1,549 | ) | ||||||||||||
Noncontrolling interests | 915 | — | ||||||||||||||
Accumulated other comprehensive income, net | 485 | 2,175 | ||||||||||||||
|
| |||||||||||||||
Total shareholders’ equity | 599,949 | 650,510 | ||||||||||||||
Total shareholders’ (deficit) equity | (11,313 | ) | 317,110 | |||||||||||||
|
| |||||||||||||||
Total liabilities and shareholders’ equity | $ | 3,313,646 | $ | 3,207,829 | $ | 3,606,399 | $ | 3,400,175 | ||||||||
|
| |||||||||||||||
The accompanying notes are an integral part of these consolidated financial statements.
SBA COMMUNICATIONS CORPORATION AND SUBSIDIARIES
CONSOLIDATED STATEMENTS OF OPERATIONS
(in thousands, except per share amounts)
| For the year ended December 31, | ||||||||||||||||||||||||
| 2009 | 2008 | 2007 | For the year ended December 31, | |||||||||||||||||||||
| (as adjusted) | (as adjusted) | 2011 | 2010 | 2009 | ||||||||||||||||||||
Revenues: | ||||||||||||||||||||||||
Site leasing | $ | 477,007 | $ | 395,541 | $ | 321,818 | $ | 616,294 | $ | 535,444 | $ | 477,007 | ||||||||||||
Site development | 78,506 | 79,413 | 86,383 | 81,876 | 91,175 | 78,506 | ||||||||||||||||||
|
|
| ||||||||||||||||||||||
Total revenues | 555,513 | 474,954 | 408,201 | 698,170 | 626,619 | 555,513 | ||||||||||||||||||
|
|
| ||||||||||||||||||||||
Operating expenses: | ||||||||||||||||||||||||
Cost of revenues (exclusive of depreciation, accretion and amortization shown below): | ||||||||||||||||||||||||
Cost of site leasing | 111,842 | 96,175 | 88,006 | 131,916 | 119,141 | 111,842 | ||||||||||||||||||
Cost of site development | 68,701 | 71,990 | 75,347 | 71,005 | 80,301 | 68,701 | ||||||||||||||||||
Selling, general and administrative | 52,785 | 48,721 | 45,564 | 62,828 | 58,209 | 52,785 | ||||||||||||||||||
Acquisition related expenses | 4,810 | 120 | 5 | 7,144 | 10,106 | 4,810 | ||||||||||||||||||
Asset impairment | 3,884 | 921 | — | 5,472 | 5,862 | 3,884 | ||||||||||||||||||
Depreciation, accretion and amortization | 258,537 | 211,445 | 169,232 | 309,146 | 278,727 | 258,537 | ||||||||||||||||||
|
|
| ||||||||||||||||||||||
Total operating expenses | 500,559 | 429,372 | 378,154 | 587,511 | 552,346 | 500,559 | ||||||||||||||||||
|
|
| ||||||||||||||||||||||
Operating income | 54,954 | 45,582 | 30,047 | 110,659 | 74,273 | 54,954 | ||||||||||||||||||
|
|
| ||||||||||||||||||||||
Other income (expense): | ||||||||||||||||||||||||
Interest income | 1,123 | 6,883 | 10,182 | 136 | 432 | 1,123 | ||||||||||||||||||
Interest expense | (130,853 | ) | (105,328 | ) | (93,063 | ) | (160,896 | ) | (149,921 | ) | (130,853 | ) | ||||||||||||
Non-cash interest expense | (49,897 | ) | (33,309 | ) | (13,402 | ) | (63,629 | ) | (60,070 | ) | (49,897 | ) | ||||||||||||
Amortization of deferred financing fees | (10,456 | ) | (10,746 | ) | (8,162 | ) | (9,188 | ) | (9,099 | ) | (10,456 | ) | ||||||||||||
(Loss) gain from extinguishment of debt, net | (5,661 | ) | 44,269 | (431 | ) | |||||||||||||||||||
Other income (expense) | 163 | (13,478 | ) | (15,777 | ) | |||||||||||||||||||
Loss from extinguishment of debt, net | (1,696 | ) | (49,060 | ) | (5,661 | ) | ||||||||||||||||||
Other (expense) income | (165 | ) | 29 | 163 | ||||||||||||||||||||
|
|
| ||||||||||||||||||||||
Total other expense | (195,581 | ) | (111,709 | ) | (120,653 | ) | (235,438 | ) | (267,689 | ) | (195,581 | ) | ||||||||||||
|
|
| ||||||||||||||||||||||
Loss before provision for income taxes | (140,627 | ) | (66,127 | ) | (90,606 | ) | (124,779 | ) | (193,416 | ) | (140,627 | ) | ||||||||||||
Provision for income taxes | (492 | ) | (1,037 | ) | (868 | ) | (2,113 | ) | (1,005 | ) | (492 | ) | ||||||||||||
|
|
| ||||||||||||||||||||||
Net loss | (141,119 | ) | (67,164 | ) | (91,474 | ) | (126,892 | ) | (194,421 | ) | (141,119 | ) | ||||||||||||
Less: Net loss attributable to the noncontrolling interest | 248 | — | — | |||||||||||||||||||||
Net loss (income) attributable to the noncontrolling interest | 436 | (253 | ) | 248 | ||||||||||||||||||||
|
|
| ||||||||||||||||||||||
Net loss attributable to SBA Communications Corporation | $ | (140,871 | ) | $ | (67,164 | ) | $ | (91,474 | ) | $ | (126,456 | ) | $ | (194,674 | ) | $ | (140,871 | ) | ||||||
|
|
| ||||||||||||||||||||||
Basic and diluted loss per common share amounts attributable to SBA Communications Corporation | $ | (1.20 | ) | $ | (0.61 | ) | $ | (0.87 | ) | |||||||||||||||
Net loss per common share attributable to SBA Communications Corporation: | ||||||||||||||||||||||||
Basic and diluted | $ | (1.13 | ) | $ | (1.68 | ) | $ | (1.20 | ) | |||||||||||||||
|
|
| ||||||||||||||||||||||
Basic and diluted weighted average number of common shares | 117,165 | 109,882 | 104,743 | 111,595 | 115,591 | 117,165 | ||||||||||||||||||
|
|
| ||||||||||||||||||||||
The accompanying notes are an integral part of these consolidated financial statements.
SBA COMMUNICATIONS CORPORATION AND SUBSIDIARIES
CONSOLIDATED STATEMENTS OF COMPREHENSIVE LOSS
FOR THE YEARS ENDED DECEMBER 31, 2011, 2010 AND 2009
(in thousands)
| For the year ended December 31, | ||||||||||||
| 2011 | 2010 | 2009 | ||||||||||
Net loss | $ | (126,892 | ) | $ | (194,421 | ) | $ | (141,119 | ) | |||
Other comprehensive loss associated with derivative instruments: | ||||||||||||
Amortization of net deferred loss from settlement of derivative financial instruments, net of tax | — | 632 | 622 | |||||||||
Write-off of net deferred loss (gain) from derivative instruments related to repurchase of debt, net of tax | — | 3,645 | (3,350 | ) | ||||||||
Foreign currency translation adjustments | (1,728 | ) | 701 | 1,474 | ||||||||
|
|
|
|
|
| |||||||
Comprehensive loss | (128,620 | ) | (189,443 | ) | (142,373 | ) | ||||||
Other comprehensive (gain) loss attributable to noncontrolling interest | 436 | (298 | ) | 114 | ||||||||
|
|
|
|
|
| |||||||
Comprehensive loss attributable to SBA Communications Corporation | $ | (128,184 | ) | $ | (189,741 | ) | $ | (142,259 | ) | |||
|
|
|
|
|
| |||||||
The accompanying condensed notes are an integral part of these consolidated financial statements.
SBA COMMUNICATIONS CORPORATION AND SUBSIDIARIES
CONSOLIDATED STATEMENTS OF SHAREHOLDERS’ EQUITY
FOR THE YEARS ENDED DECEMBER 31, 2009, 20082011, 2010 AND 20072009
(in thousands)
| Class A Common Stock | Additional Paid-In Capital | Accumulated Deficit | Accumulated Other Comprehensive Loss | Noncontrolling Interest | Total | Comprehensive Loss | ||||||||||||||||||||||||
| Shares | Amount | |||||||||||||||||||||||||||||
BALANCE, December 31, 2006 | 105,672 | $ | 1,057 | $ | 1,450,754 | $ | (1,065,224 | ) | $ | (666 | ) | $ | — | $ | 385,921 | |||||||||||||||
Net loss (as adjusted) | — | — | — | (91,474 | ) | — | — | (91,474 | ) | $ | (91,474 | ) | ||||||||||||||||||
Change in unfunded projected benefit obligation | — | — | — | — | (49 | ) | — | (49 | ) | (49 | ) | |||||||||||||||||||
Amortization of net deferred gain from settlement of derivative financial instruments | — | — | — | — | (565 | ) | — | (565 | ) | (565 | ) | |||||||||||||||||||
Total comprehensive loss | (92,088 | ) | ||||||||||||||||||||||||||||
Less: Comprehensive loss attributable to the noncontrolling interest | — | — | — | — | — | — | — | — | ||||||||||||||||||||||
Comprehensive loss attributable to SBA Communications Corporation | — | — | — | — | — | — | — | $ | (92,088 | ) | ||||||||||||||||||||
Stock issued in connection with acquisitions and earn-outs | 4,707 | 47 | 155,499 | — | — | — | 155,546 | |||||||||||||||||||||||
Non-cash compensation | — | — | 7,842 | — | — | — | 7,842 | |||||||||||||||||||||||
Stock issued in connection with stock purchase/option plans | 1,236 | 12 | 7,738 | — | — | — | 7,750 | |||||||||||||||||||||||
Equity component related to 0.375% convertible debt issuance | — | — | 72,561 | — | — | — | 72,561 | |||||||||||||||||||||||
Purchase of convertible note hedges | — | — | (77,200 | ) | — | — | — | (77,200 | ) | |||||||||||||||||||||
Proceeds from issuance of common stock warrants | — | — | 27,261 | — | — | — | 27,261 | |||||||||||||||||||||||
Repurchase and retirement of common stock | (3,235 | ) | (32 | ) | — | (91,204 | ) | — | — | (91,236 | ) | |||||||||||||||||||
BALANCE, December 31, 2007 (as adjusted) | 108,380 | 1,084 | 1,644,455 | (1,247,902 | ) | (1,280 | ) | — | 396,357 | |||||||||||||||||||||
Net loss (as adjusted) | — | — | — | (67,164 | ) | — | — | (67,164 | ) | $ | (67,164 | ) | ||||||||||||||||||
Change in unfunded projected benefit obligation | — | — | — | — | (31 | ) | — | (31 | ) | (31 | ) | |||||||||||||||||||
Amortization of net deferred gain from settlement of derivative financial instruments | — | — | — | — | (557 | ) | — | (557 | ) | (557 | ) | |||||||||||||||||||
Write-off of net deferred loss from derivative instruments related to repurchase of debt | — | — | — | — | 319 | — | 319 | 319 | ||||||||||||||||||||||
Total comprehensive loss | (67,433 | ) | ||||||||||||||||||||||||||||
Less: Comprehensive loss attributable to the noncontrolling interest | — | — | — | — | — | — | — | — | ||||||||||||||||||||||
Comprehensive loss attributable to SBA Communications Corporation | — | — | — | — | — | — | — | $ | (67,433 | ) | ||||||||||||||||||||
Stock issued in connection with acquisitions and earn-outs | 8,514 | 85 | 295,546 | — | — | — | 295,631 | |||||||||||||||||||||||
Non-cash compensation | — | — | 7,415 | — | — | — | 7,415 | |||||||||||||||||||||||
Stock issued in connection with stock purchase/option plans | 696 | 7 | 6,496 | — | — | — | 6,503 | |||||||||||||||||||||||
Purchase of convertible note hedges | — | — | (137,698 | ) | — | — | — | (137,698 | ) | |||||||||||||||||||||
Equity component related to 1.875% convertible debt issuance | — | — | 159,168 | — | — | — | 159,168 | |||||||||||||||||||||||
Proceeds from issuance of common stock warrants | — | — | 56,183 | — | — | — | 56,183 | |||||||||||||||||||||||
Stock issued in connection with repurchases of the 0.375% convertible debt | 3,408 | 34 | 54,997 | — | — | — | 55,031 | |||||||||||||||||||||||
Equity component related to repurchases of the 0.375% convertible debt | — | — | (647 | ) | — | — | — | (647 | ) | |||||||||||||||||||||
Repurchase and retirement of common stock | (3,473 | ) | (35 | ) | — | (119,965 | ) | — | — | (120,000 | ) | |||||||||||||||||||
BALANCE, December 31, 2008 (as adjusted) | 117,525 | $ | 1,175 | $ | 2,085,915 | $ | (1,435,031 | ) | $ | (1,549 | ) | $ | — | $ | 650,510 | |||||||||||||||
| Class A Common Stock | Additional Paid-In | Accumulated | Accumulated Other Comprehensive | Noncontrolling | ||||||||||||||||||||||||
| Shares | Amount | Capital | Deficit | (Loss) Income | Interests | Total | ||||||||||||||||||||||
BALANCE, December 31, 2008 (as adjusted) | 117,525 | $ | 1,175 | $ | 2,085,915 | $ | (1,435,031 | ) | $ | (1,549 | ) | $ | — | $ | 650,510 | |||||||||||||
Net loss | — | — | — | (140,871 | ) | — | (248 | ) | (141,119 | ) | ||||||||||||||||||
Amortization of net deferred loss from settlement of derivative financial instruments | — | — | — | — | 622 | — | 622 | |||||||||||||||||||||
Write-off of net deferred loss from derivative instruments related to repurchase of debt | — | — | — | — | (3,350 | ) | — | (3,350 | ) | |||||||||||||||||||
Foreign currency translation adjustments | — | — | — | — | 1,474 | — | 1,474 | |||||||||||||||||||||
Common stock issued in connection with acquisitions and earn-outs | 864 | 9 | 20,303 | — | — | — | 20,312 | |||||||||||||||||||||
Purchase of non-wholly owned entity | — | — | — | — | — | 1,222 | 1,222 | |||||||||||||||||||||
Non-cash compensation | — | — | 8,260 | — | — | — | 8,260 | |||||||||||||||||||||
Common stock issued in connection with stock purchase/option plans | 689 | 7 | 7,038 | — | — | — | 7,045 | |||||||||||||||||||||
Equity component related to 4.0% convertible debt issuance | — | — | 168,933 | — | — | — | 168,933 | |||||||||||||||||||||
Purchase of convertible note hedges | — | — | (160,100 | ) | — | — | — | (160,100 | ) | |||||||||||||||||||
Proceeds from issuance of common stock warrants | — | — | 98,491 | — | — | — | 98,491 | |||||||||||||||||||||
Stock issued in connection with repurchases of the 0.375% convertible debt | 618 | 6 | 11,193 | — | — | — | 11,199 | |||||||||||||||||||||
Equity component related to repurchases of the 0.375% convertible debt | — | — | (11,830 | ) | — | — | — | (11,830 | ) | |||||||||||||||||||
Stock received related to the termination of a portion of the 0.375% convertible note hedge | (874 | ) | (9 | ) | 9 | — | — | — | — | |||||||||||||||||||
Stock issued related to the termination of a portion of the 0.375% convertible debt common stock warrants | 328 | 3 | (3 | ) | — | — | — | — | ||||||||||||||||||||
Preferred return on capital contributions | — | — | 59 | — | — | (59 | ) | — | ||||||||||||||||||||
Repurchase and retirement of common stock | (2,068 | ) | (20 | ) | — | (51,700 | ) | — | — | (51,720 | ) | |||||||||||||||||
|
|
|
|
|
|
|
|
|
|
|
|
|
| |||||||||||||||
BALANCE, December 31, 2009 | 117,082 | $ | 1,171 | $ | 2,228,268 | $ | (1,627,602 | ) | $ | (2,803 | ) | $ | 915 | $ | 599,949 | |||||||||||||
Net loss | — | — | — | (194,674 | ) | — | 253 | (194,421 | ) | |||||||||||||||||||
Amortization of deferred loss from settlement of derivative financial instruments | — | — | — | — | 632 | — | 632 | |||||||||||||||||||||
Write-off of deferred loss from derivative instruments related to repurchase of debt | — | — | — | — | 3,645 | — | 3,645 | |||||||||||||||||||||
Foreign currency translation adjustments | — | — | — | — | 701 | — | 701 | |||||||||||||||||||||
Non-cash compensation | — | — | 10,560 | — | — | — | 10,560 | |||||||||||||||||||||
Common stock issued in connection with stock purchase/option plans | 924 | 9 | 16,124 | — | — | — | 16,133 | |||||||||||||||||||||
Proceeds from the settlement of convertible note hedges | — | — | 8,497 | — | — | — | 8,497 | |||||||||||||||||||||
Purchase of redeemable noncontrolling interests | — | — | (7,500 | ) | — | — | (703 | ) | (8,203 | ) | ||||||||||||||||||
Exchange of redeemable noncontrolling interests | — | — | (12,492 | ) | — | — | (465 | ) | (12,957 | ) | ||||||||||||||||||
Repurchase and retirement of common stock | (3,174 | ) | (32 | ) | — | (107,394 | ) | — | — | (107,426 | ) | |||||||||||||||||
|
|
|
|
|
|
|
|
|
|
|
|
|
| |||||||||||||||
BALANCE, December 31, 2010 | 114,832 | $ | 1,148 | $ | 2,243,457 | $ | (1,929,670 | ) | $ | 2,175 | $ | — | $ | 317,110 | ||||||||||||||
(continued)
F-5
SBA COMMUNICATIONS CORPORATION AND SUBSIDIARIES
CONSOLIDATED STATEMENTS OF SHAREHOLDERS’ EQUITY
FOR THE YEARS ENDED DECEMBER 31, 2009, 20082011, 2010 AND 20072009
(in thousands)
| Class A Common Stock | Additional Paid-In Capital | Accumulated Deficit | Accumulated Other Comprehensive Loss | Noncontrolling Interest | Total | Comprehensive Loss | |||||||||||||||||||||||||
| Shares | Amount | ||||||||||||||||||||||||||||||
BALANCE, December 31, 2008 (as adjusted) | 117,525 | $ | 1,175 | $ | 2,085,915 | $ | (1,435,031 | ) | $ | (1,549 | ) | $ | — | $ | 650,510 | ||||||||||||||||
Net loss | — | — | — | (140,871 | ) | — | (248 | ) | (141,119 | ) | $ | (141,119 | ) | ||||||||||||||||||
Amortization of net deferred loss from settlement of derivative financial instruments | — | — | — | — | 622 | — | 622 | 622 | |||||||||||||||||||||||
Write-off of net deferred gain from derivative instruments related to repurchase of debt | — | — | — | — | (3,350 | ) | — | (3,350 | ) | (3,350 | ) | ||||||||||||||||||||
Foreign currency translation adjustments | — | — | — | — | 1,474 | — | 1,474 | 1,474 | |||||||||||||||||||||||
Total comprehensive loss | — | — | — | — | — | — | — | (142,373 | ) | ||||||||||||||||||||||
Less: Comprehensive loss attributable to the noncontrolling interest | — | — | — | — | — | — | — | 114 | |||||||||||||||||||||||
Comprehensive loss attributable to SBA Communications Corporation | — | — | — | — | — | — | — | $ | (142,259 | ) | |||||||||||||||||||||
Common stock issued in connection with acquisitions and earn-outs | 864 | 9 | 20,303 | — | — | — | 20,312 | ||||||||||||||||||||||||
Purchase of non-wholly owned entity | — | — | — | — | — | 1,222 | 1,222 | ||||||||||||||||||||||||
Non-cash compensation | — | — | 8,260 | — | — | — | 8,260 | ||||||||||||||||||||||||
Common stock issued in connection with stock purchase/option plans | 689 | 7 | 7,038 | — | — | — | 7,045 | ||||||||||||||||||||||||
Equity component related to 4.0% convertible debt issuance | — | — | 168,933 | — | — | — | 168,933 | ||||||||||||||||||||||||
Purchase of convertible note hedges | — | — | (160,100 | ) | — | — | — | (160,100 | ) | ||||||||||||||||||||||
Proceeds from issuance of common stock warrants | — | — | 98,491 | — | — | — | 98,491 | ||||||||||||||||||||||||
Stock issued in connection with repurchases of the 0.375% convertible debt | 618 | 6 | 11,193 | — | — | — | 11,199 | ||||||||||||||||||||||||
Equity component related to repurchases of the 0.375% convertible debt | — | — | (11,830 | ) | — | — | — | (11,830 | ) | ||||||||||||||||||||||
Stock received related to the termination of a portion of the 0.375% convertible note hedge | (874 | ) | (9 | ) | 9 | — | — | — | — | ||||||||||||||||||||||
Stock issued related to the termination of a portion of the 0.375% convertible debt common stock warrants | 328 | 3 | (3 | ) | — | — | — | — | |||||||||||||||||||||||
Preferred return on capital contributions | — | — | 59 | — | — | (59 | ) | — | |||||||||||||||||||||||
Repurchase and retirement of common stock | (2,068 | ) | (20 | ) | — | (51,700 | ) | — | — | (51,720 | ) | ||||||||||||||||||||
BALANCE, December 31, 2009 | 117,082 | $ | 1,171 | $ | 2,228,268 | $ | (1,627,602 | ) | $ | (2,803 | ) | $ | 915 | $ | 599,949 | ||||||||||||||||
| Class A Common Stock | Additional Paid-In | Accumulated | Accumulated Other Comprehensive | Noncontrolling | ||||||||||||||||||||||||
| Shares | Amount | Capital | Deficit | (Loss) Income | Interests | Total | ||||||||||||||||||||||
BALANCE, December 31, 2010 | 114,832 | $ | 1,148 | $ | 2,243,457 | $ | (1,929,670 | ) | $ | 2,175 | $ | — | $ | 317,110 | ||||||||||||||
Net loss attributable to SBA Communications Corporation | — | — | — | (126,456 | ) | — | — | (126,456 | ) | |||||||||||||||||||
Foreign currency translation adjustments | — | — | (38 | ) | — | (1,690 | ) | — | (1,728 | ) | ||||||||||||||||||
Equity component related to repurchases of the 1.875% convertible debt | — | — | (2,607 | ) | — | — | — | (2,607 | ) | |||||||||||||||||||
Non-cash compensation | — | — | 11,639 | — | — | — | 11,639 | |||||||||||||||||||||
Common stock issued in connection with stock purchase/option plans | 761 | 8 | 15,793 | — | — | — | 15,801 | |||||||||||||||||||||
Repurchase and retirement of common stock | (5,918 | ) | (59 | ) | — | (225,013 | ) | — | — | (225,072 | ) | |||||||||||||||||
|
|
|
|
|
|
|
|
|
|
|
|
|
| |||||||||||||||
BALANCE, December 31, 2011 | 109,675 | $ | 1,097 | $ | 2,268,244 | $ | (2,281,139 | ) | $ | 485 | $ | — | $ | (11,313 | ) | |||||||||||||
|
|
|
|
|
|
|
|
|
|
|
|
|
| |||||||||||||||
The accompanying notes are an integral part of these consolidated financial statements.
SBA COMMUNICATIONS CORPORATION AND SUBSIDIARIES
CONSOLIDATED STATEMENTS OF CASH FLOWS
(in thousands)
| For the year ended December 31, | ||||||||||||||||||||||||
| 2009 | 2008 | 2007 | For the year ended December 31, | |||||||||||||||||||||
| (as adjusted) | (as adjusted) | 2011 | 2010 | 2009 | ||||||||||||||||||||
CASH FLOWS FROM OPERATING ACTIVITIES: | ||||||||||||||||||||||||
Net loss | $ | (141,119 | ) | $ | (67,164 | ) | $ | (91,474 | ) | $ | (126,892 | ) | $ | (194,421 | ) | $ | (141,119 | ) | ||||||
Adjustments to reconcile net loss to net cash provided by operating activities: | ||||||||||||||||||||||||
Depreciation, accretion, and amortization | 258,537 | 211,445 | 169,232 | 309,146 | 278,727 | 258,537 | ||||||||||||||||||
Non-cash interest expense | 49,897 | 33,309 | 13,402 | 63,629 | 60,070 | 49,897 | ||||||||||||||||||
Deferred income tax (benefit) provision | (265 | ) | 159 | 201 | ||||||||||||||||||||
Deferred income tax benefit | (1,686 | ) | (737 | ) | (265 | ) | ||||||||||||||||||
Asset impairment | 3,884 | 921 | — | 5,472 | 5,862 | 3,884 | ||||||||||||||||||
Write-down of investments | — | 13,256 | 15,558 | |||||||||||||||||||||
Gain on sale of assets | 85 | 341 | 397 | |||||||||||||||||||||
Non-cash compensation expense | 8,200 | 7,207 | 6,612 | 11,469 | 10,501 | 8,200 | ||||||||||||||||||
Provision (credit) for doubtful accounts | 465 | (81 | ) | 150 | ||||||||||||||||||||
Provision for doubtful accounts | 70 | 630 | 465 | |||||||||||||||||||||
Amortization of deferred financing fees | 10,456 | 10,746 | 8,162 | 9,188 | 9,099 | 10,456 | ||||||||||||||||||
Loss (gain) from extinguishment of debt, net | 5,661 | (44,269 | ) | 431 | ||||||||||||||||||||
Changes in operating assets and liabilities: | ||||||||||||||||||||||||
Accounts receivable and costs and estimated earnings in excess of billings on uncompleted contracts, net | (3,497 | ) | 14,408 | (1,183 | ) | |||||||||||||||||||
Loss from extinguishment of debt, net | 1,696 | 49,060 | 5,661 | |||||||||||||||||||||
Other non-cash items reflected in the Statements of Operations | 698 | (467 | ) | 85 | ||||||||||||||||||||
Changes in operating assets and liabilities, net of acquisitions: | ||||||||||||||||||||||||
Accounts receivable and costs and estimated earnings in excess of billings on uncompleted contracts | (3,709 | ) | (5,919 | ) | (3,497 | ) | ||||||||||||||||||
Prepaid and other assets | (8,546 | ) | (10,906 | ) | (18,319 | ) | (27,425 | ) | (15,023 | ) | (8,546 | ) | ||||||||||||
Accounts payable and accrued expenses | (4,008 | ) | (6,189 | ) | 3,645 | 3,814 | (3,313 | ) | (4,008 | ) | ||||||||||||||
Accrued interest | 29,605 | 2,423 | (558 | ) | 58 | (3,300 | ) | 29,605 | ||||||||||||||||
Other liabilities | 13,203 | 8,090 | 16,678 | 3,530 | 10,371 | 13,217 | ||||||||||||||||||
|
|
| ||||||||||||||||||||||
Net cash provided by operating activities | 222,558 | 173,696 | 122,934 | 249,058 | 201,140 | 222,572 | ||||||||||||||||||
|
|
| ||||||||||||||||||||||
CASH FLOWS FROM INVESTING ACTIVITIES: | ||||||||||||||||||||||||
Acquisitions and related earn-outs | (180,798 | ) | (584,498 | ) | (201,466 | ) | (379,320 | ) | (328,045 | ) | (180,798 | ) | ||||||||||||
Capital expenditures | (46,743 | ) | (36,166 | ) | (27,771 | ) | (126,938 | ) | (66,618 | ) | (46,743 | ) | ||||||||||||
Purchase of investments | (9,164 | ) | — | (208,251 | ) | (6,330 | ) | (4,566 | ) | (9,164 | ) | |||||||||||||
Proceeds from sales/maturities of investments | 980 | 41,044 | 137,551 | 4,581 | 7,107 | 980 | ||||||||||||||||||
Purchase of cost method investments | — | (32,300 | ) | — | ||||||||||||||||||||
Proceeds from disposition of fixed assets | 608 | 51 | 131 | 119 | 50 | 608 | ||||||||||||||||||
Proceeds (payment) of restricted cash relating to tower removal obligations | 6,042 | (980 | ) | (2,078 | ) | |||||||||||||||||||
(Payment) proceeds of restricted cash relating to tower removal obligations | — | (667 | ) | 6,042 | ||||||||||||||||||||
|
|
| ||||||||||||||||||||||
Net cash used in investing activities | (229,075 | ) | (580,549 | ) | (301,884 | ) | (507,888 | ) | (425,039 | ) | (229,075 | ) | ||||||||||||
|
|
| ||||||||||||||||||||||
CASH FLOWS FROM FINANCING ACTIVITIES: | ||||||||||||||||||||||||
Proceeds from issuance of Term Loan, net of original issue discount and fees paid | 492,560 | — | — | |||||||||||||||||||||
Proceeds from issuance of 2010 Tower Securities, net of fees paid | — | 1,212,194 | — | |||||||||||||||||||||
Repurchase and retirement of common stock | (225,072 | ) | (107,426 | ) | (51,720 | ) | ||||||||||||||||||
Payment on extinguishment of CMBS Certificates | — | (979,368 | ) | (557,316 | ) | |||||||||||||||||||
Principal payments under capital lease obligations | (896 | ) | — | — | ||||||||||||||||||||
Payments on early extinguishment of convertible debt | (17,038 | ) | (30,409 | ) | (90,554 | ) | ||||||||||||||||||
Borrowings under Revolving Credit Facility | 250,000 | 20,000 | 8,507 | |||||||||||||||||||||
Repayment of Revolving Credit Facility | (270,000 | ) | — | (239,060 | ) | |||||||||||||||||||
Proceeds from issuance of senior notes, net of original issue discount and fees paid | 727,918 | — | — | — | — | 727,918 | ||||||||||||||||||
Proceeds from issuance of convertible senior notes, net of fees paid | 488,195 | 536,815 | 341,452 | — | — | 488,195 | ||||||||||||||||||
Repurchase and retirement of common stock | (51,720 | ) | (120,000 | ) | (91,236 | ) | ||||||||||||||||||
Payment on early extinguishment of CMBS Certificates | (557,316 | ) | (45,353 | ) | — | |||||||||||||||||||
Payments on early extinguishment of convertible debt | (90,554 | ) | (102,486 | ) | — | |||||||||||||||||||
Borrowings under Senior Credit Facility | 8,507 | 465,552 | — | |||||||||||||||||||||
Repayment of Senior Credit Facility | (239,060 | ) | (235,000 | ) | — | |||||||||||||||||||
Proceeds from employee stock purchase/stock option plans | 15,801 | 16,133 | 7,045 | |||||||||||||||||||||
Release of restricted cash relating to CMBS Certificates | — | 526 | 7,073 | |||||||||||||||||||||
Payment of deferred financing fees | (91 | ) | (5,123 | ) | (384 | ) | ||||||||||||||||||
Proceeds from convertible note hedges | — | 8,497 | — | |||||||||||||||||||||
Purchase of noncontrolling interests | (717 | ) | (8,203 | ) | — | |||||||||||||||||||
Repayment of Optasite Credit Facility | (149,117 | ) | (1,000 | ) | — | — | — | (149,117 | ) | |||||||||||||||
Repayment of Term Loan | (2,500 | ) | — | — | ||||||||||||||||||||
Proceeds from issuance of common stock warrants | 98,491 | 56,183 | 27,261 | — | — | 98,491 | ||||||||||||||||||
Purchase of convertible note hedges | (160,100 | ) | (137,698 | ) | (77,200 | ) | — | — | (160,100 | ) | ||||||||||||||
Payment related to termination of derivative instruments | — | (3,890 | ) | — | ||||||||||||||||||||
Proceeds from employee stock purchase/stock option plans | 7,045 | 6,503 | 7,750 | |||||||||||||||||||||
Release (payment) of restricted cash relating to CMBS Certificates | 7,073 | (928 | ) | (4,564 | ) | |||||||||||||||||||
Payment of deferred financing fees | (384 | ) | (3,261 | ) | (389 | ) | ||||||||||||||||||
|
|
| ||||||||||||||||||||||
Net cash provided by financing activities | 88,978 | 415,437 | 203,074 | 242,047 | 126,821 | 88,978 | ||||||||||||||||||
|
|
| ||||||||||||||||||||||
NET INCREASE IN CASH AND CASH EQUIVALENTS | 82,461 | 8,584 | 24,124 | |||||||||||||||||||||
Effect of exchange rate changes on cash and cash equivalents | (155 | ) | 15 | (14 | ) | |||||||||||||||||||
NET (DECREASE) INCREASE IN CASH AND CASH EQUIVALENTS | (16,938 | ) | (97,063 | ) | 82,461 | |||||||||||||||||||
CASH AND CASH EQUIVALENTS: | ||||||||||||||||||||||||
Beginning of year | 78,856 | 70,272 | 46,148 | 64,254 | 161,317 | 78,856 | ||||||||||||||||||
| �� |
|
| |||||||||||||||||||||
End of year | $ | 161,317 | $ | 78,856 | $ | 70,272 | $ | 47,316 | $ | 64,254 | $ | 161,317 | ||||||||||||
|
|
| ||||||||||||||||||||||
(continued)
F-7
SBA COMMUNICATIONS CORPORATION AND SUBSIDIARIES
CONSOLIDATED STATEMENTS OF CASH FLOWS
(in thousands)
| For the year ended December 31, | |||||||||
| 2009 | 2008 | 2007 | |||||||
SUPPLEMENTAL DISCLOSURE OF CASH FLOW INFORMATION: | |||||||||
Cash paid during the period for: | |||||||||
Interest | $ | 101,409 | $ | 103,085 | $ | 93,868 | |||
Income taxes | $ | 684 | $ | 359 | $ | 860 | |||
SUPPLEMENTAL CASH FLOW INFORMATION OF NON-CASH ACTIVITIES: | |||||||||
Assets acquired through capital leases | $ | 239 | $ | 781 | $ | 960 | |||
Class A common stock issued relating to acquisitions and earnouts | $ | 20,312 | $ | 295,631 | $ | 155,546 | |||
Fair value of debt assumed through acquisition | $ | — | $ | 147,000 | $ | — | |||
Stock issued in connection with early extinguishment of debt | $ | 11,199 | $ | 55,031 | $ | — | |||
| For the year ended December 31, | ||||||||||||
| 2011 | 2010 | 2009 | ||||||||||
SUPPLEMENTAL DISCLOSURE OF CASH FLOW INFORMATION: | ||||||||||||
Cash paid during the year for: | ||||||||||||
Interest | $ | 161,257 | $ | 153,607 | $ | 101,409 | ||||||
|
|
|
|
|
| |||||||
Income taxes | $ | 4,218 | $ | 1,545 | $ | 684 | ||||||
|
|
|
|
|
| |||||||
SUPPLEMENTAL CASH FLOW INFORMATION OF NON-CASH ACTIVITIES: | ||||||||||||
Assets acquired through capital leases | $ | 2,570 | $ | 1,130 | $ | 239 | ||||||
|
|
|
|
|
| |||||||
Class A common stock issued relating to acquisitions and earnouts | — | — | 20,312 | |||||||||
|
|
|
|
|
| |||||||
Class A common stock issued in connection with early extinguishment of debt | $ | — | $ | — | $ | 11,199 | ||||||
|
|
|
|
|
| |||||||
Contribution of DAS Networks in exchange for equity investment | $ | — | $ | 11,000 | $ | — | ||||||
|
|
|
|
|
| |||||||
Exchange of redeemable noncontrolling interests | $ | — | $ | 12,500 | $ | — | ||||||
|
|
|
|
|
| |||||||
The accompanying condensed notes are an integral part of these consolidated financial statements.
SBA COMMUNICATIONS CORPORATION AND SUBSIDIARIES
NOTES TO CONSOLIDATED FINANCIAL STATEMENTS
1. GENERAL
| 1. | GENERAL |
SBA Communications Corporation (the “Company” or “SBA”) was incorporated in the State of Florida in March 1997. The Company is a holding company that holds all of the outstanding capital stock of SBA Telecommunications, Inc. (“Telecommunications”). Telecommunications is a holding company that holds the outstanding capital stock of the International Subsidiaries, SBA Infrastructure Holdings I, Inc. (“Infrastructure” formerly known as Optasite) and SBA Senior Finance, Inc. (“SBA Senior Finance”). and SBA Towers III, an operating subsidiary that is not a party to any loan agreement. SBA Senior Finance is a holding company that holds, directly andor indirectly, the equity interest in certain subsidiaries that issued the Commercial Mortgage-Backed Pass Through Certificates,Secured Tower Revenue Securities Series 2005-12010-1 (the “2005 CMBS Certificates”“2010-1 Tower Securities”) and the Commercial Mortgage-Backed Pass Through Certificates,Secured Tower Revenue Securities Series 2006-12010-2 (the “2006 CMBS Certificates”) (collectively,“2010-2 Tower Securities” and together with the “CMBS Certificates”2010-1 Tower Securities, the “2010 Tower Securities”) and certain subsidiaries that were not involved in the issuance of the CMBS Certificates.2010 Tower Securities. With respect to the subsidiaries involved in the issuance of the CMBS Certificates,2010 Tower Securities, SBA Senior Finance is the sole member of SBA CMBS-1 Holdings, LLC and SBA CMBS-1 Depositor, LLC. SBA CMBS-1 Holdings, LLC is the sole member of SBA CMBS-1 Guarantor, LLC. SBA CMBS-1 Guarantor, LLC holds all of the capital stock of the companies included in the CMBS certificates2010 Tower Securities referred to as the “Borrowers” (see Note 13). With respect to the subsidiaries not involved in the issuance of the CMBS Certificates,2010 Tower Securities, SBA Senior Finance holds all of the membership interests ofin SBA Senior Finance II, LLC (“SBA Senior Finance II”) and certain non-operationalnon-operating subsidiaries. SBA Senior Finance II holds, directly andor indirectly, all the capital stock and/or membership interests of the International subsidiaries and certain other tower companies (“Other Tower Companies”) (collectively with the Borrowers known(known as “Tower Companies”). SBA Senior Finance II also holds, directly or indirectly, all the capital stock and/or membership interests of certain other subsidiaries involved in providing services, including SBA Network Services, Inc. (“Network Services”). SBA Senior Finance II also holds all the capital stock of as well as SBA Network Management, Inc. (“Network Management”) which manages and administers the operations of the Borrowers.
The table below outlines the legal structure of the Company at December 31, 2009:2011:
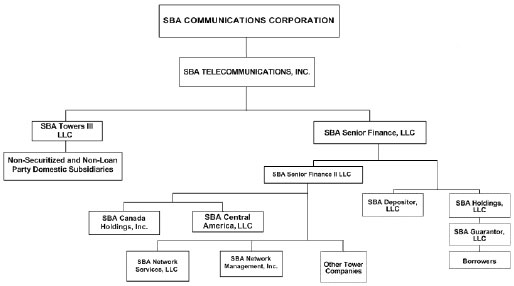
SBA COMMUNICATIONS CORPORATION AND SUBSIDIARIES
NOTES TO CONSOLIDATED FINANCIAL STATEMENTS
As of December 31, 2009,2011, the Tower CompaniesCompany owned and operated wireless communications towers in the Continental United States Puerto Rico,and its territories. In addition, the Company owned towers in Canada, Costa Rica, El Salvador, Nicaragua, Guatemala and the U.S. Virgin Islands.Panama. Space on these towers is leased primarily to wireless service providers. As of December 31, 2009,2011, the Company owned 8,32410,524 tower sites.
Network Services provides comprehensive turnkey services for the telecommunications industry in the areas of site development services for wireless carriers and the construction and repair of transmission towers. Site development consulting services include (1) network pre-design; (2) site audits; (3) identification of potential locations for towers and antennas; (4) support in buying or leasing of the location; and (5) assistance in obtaining zoning approvals and permits. Site construction services of the Company’s site development business providesincludes a number of services, including, but not limited to the following: (1) tower and related site construction; (2) antenna installation; and (3) radio equipment installation, commissioning and maintenance.
2. RESTATEMENT FOR ADOPTION OF NEW ACCOUNTING PRONOUNCEMENT
Effective January 1, 2009, the Company retrospectively adopted new convertible debt accounting which requires the issuer of certain convertible debt instruments that may be settled in cash (including partial cash settlement) on conversion to separately account for the liability (debt) and equity (conversion option) components of the instrument in a manner that reflects the issuer’s non-convertible debt borrowing rate. The Company’s 0.375% Convertible Senior Notes due 2010 (“0.375% Notes”) and 1.875% Convertible Senior Notes due 2013 (“1.875% Notes” and collectively with the 0.375% Notes, the “Notes”) are subject to the retroactive restatement required by the new convertible debt accounting. As a result of the adoption of the new convertible debt accounting, the Company recorded a debt discount and corresponding increase to additional paid-in capital of approximately $74.4 million for the 0.375% Notes and approximately $163.0 million for the 1.875% Notes as of their dates of issuance (March 26, 2007 for the 0.375% Notes and May 16, 2008 for the 1.875% Notes). The Company’s consolidated balance sheet as of December 31, 2008 has been retrospectively adjusted to reduce the carrying value of the 0.375% Notes and 1.875% Notes and reflect the conversion option as a reduction in shareholders’ equity. In addition, as of their respective issuance dates, the Company reclassified, as a reduction to equity, deferred financing fees of $1.8 million and $3.8 million for the 0.375% Notes and 1.875% Notes, respectively, relating to debt issuance costs of the equity component of the Notes. The Company’s consolidated statements of operations and consolidated statements of cash flows for the years ended December 31, 2008 and December 31, 2007 have been retrospectively adjusted to reflect the non-cash interest expense related to the accretion of the reduced carrying value of the Notes back to their full principal balance over the term of the Notes. In addition, the amortization of deferred financing fees has been restated to reflect the amortization of the fees related only to the liability component of the Notes. See Note 13 for further information on the Notes.
SBA COMMUNICATIONS CORPORATION AND SUBSIDIARIES
NOTES TO CONSOLIDATED FINANCIAL STATEMENTS
The following is a summary of the effects of these changes on the Company’s consolidated balance sheet as of December 31, 2008 and consolidated statements of operations for the years ended December 31, 2008 and December 31, 2007:
CONSOLIDATED BALANCE SHEET
| As of December 31, 2008 | ||||||
| As previously reported | As adjusted | |||||
| (audited) | ||||||
| (in thousands) | ||||||
Current assets | $ | 154,315 | $ | 154,315 | ||
Property and equipment, net | 1,502,672 | 1,502,672 | ||||
Intangible assets, net | 1,425,132 | 1,425,132 | ||||
Deferred financing fees, net | 33,384 | 29,705 | ||||
Other assets | 96,005 | 96,005 | ||||
Total assets | $ | 3,211,508 | $ | 3,207,829 | ||
Current liabilities | $ | 90,594 | $ | 90,594 | ||
Long-term debt, net of current maturities | 2,548,660 | 2,386,230 | ||||
Other long-term liabilities | 80,495 | 80,495 | ||||
Total liabilities | 2,719,749 | 2,557,319 | ||||
Total shareholders’ equity | 491,759 | 650,510 | ||||
Total liabilities and shareholders’ equity | $ | 3,211,508 | $ | 3,207,829 | ||
CONSOLIDATED STATEMENTS OF OPERATIONS
| For the year ended December 31, | ||||||||||||||||
| 2008 | 2007 | |||||||||||||||
| As previously reported | As adjusted | As previously reported | As adjusted | |||||||||||||
| (audited) | (audited) | |||||||||||||||
| (in thousands, except per share amounts) | ||||||||||||||||
Revenues | $ | 474,954 | $ | 474,954 | $ | 408,201 | $ | 408,201 | ||||||||
Operating expenses | 429,372 | 429,372 | 378,154 | 378,154 | ||||||||||||
Operating income | 45,582 | 45,582 | 30,047 | 30,047 | ||||||||||||
Other income (expense): | ||||||||||||||||
Interest income | 6,883 | 6,883 | 10,182 | 10,182 | ||||||||||||
Interest expense(1) | (104,253 | ) | (105,328 | ) | (92,498 | ) | (93,063 | ) | ||||||||
Non-cash interest expense | (412 | ) | (33,309 | ) | — | (13,402 | ) | |||||||||
Amortization of deferred financing fees | (11,671 | ) | (10,746 | ) | (8,534 | ) | (8,162 | ) | ||||||||
Gain (loss) from extinguishment of debt, net | 31,623 | 44,269 | (431 | ) | (431 | ) | ||||||||||
Other expense | (13,478 | ) | (13,478 | ) | (15,777 | ) | (15,777 | ) | ||||||||
Total other expense | (91,308 | ) | (111,709 | ) | (107,058 | ) | (120,653 | ) | ||||||||
Loss before provision for income taxes | (45,726 | ) | (66,127 | ) | (77,011 | ) | (90,606 | ) | ||||||||
Provision for income taxes | (1,037 | ) | (1,037 | ) | (868 | ) | (868 | ) | ||||||||
Net loss | $ | (46,763 | ) | $ | (67,164 | ) | $ | (77,879 | ) | $ | (91,474 | ) | ||||
Basic and diluted loss per common share amounts: | ||||||||||||||||
Net loss per common share | $ | (0.43 | ) | $ | (0.61 | ) | $ | (0.74 | ) | $ | (0.87 | ) | ||||
Basic and diluted weighted average number of common shares | 109,882 | 109,882 | 104,743 | 104,743 | ||||||||||||
SBA COMMUNICATIONS CORPORATION AND SUBSIDIARIES
NOTES TO CONSOLIDATED FINANCIAL STATEMENTS
3. SUMMARY OF SIGNIFICANT ACCOUNTING POLICIES
A summary of the significant accounting policies applied in the preparation of the accompanying consolidated financial statements is as follows:
a.Principles of Consolidation
The consolidated financial statements have been prepared in accordance with accounting principles generally accepted in the United States of America (“U.S. GAAP”) and include the Company and its majority and wholly-owned subsidiaries. All significant intercompany accounts and transactions have been eliminated in consolidation.
b.Use of Estimates
The preparation of the consolidated financial statements in conformity with U.S. GAAP requires management to make estimates and assumptions that affect the amounts reported in the consolidated financial statements and accompanying notes. The significant estimates made by management relate to the allowance for doubtful accounts, the costs and revenue relating to the Company’s construction contracts, stock-based compensation, valuation allowance related to deferred tax assets, fair value of long-lived assets, the useful lives of towers and intangible assets, anticipated property tax assessments, fair value of investments and asset retirement obligations. Management develops estimates based on historical experience and on various assumptions about the future that are believed to be reasonable based on the information available. These estimates ultimately may differ from actual results and such differences could be material.
c.Cash and Cash Equivalents
Cash and cash equivalents consist primarily of cash in banks, money market funds, commercial paper and other marketable securities with an original maturity of three months or less at the time of purchase. These investments are carried at cost, which approximates fair value.
d.Investments
Investment securities with original maturities of more than three months but less than one year at time of purchase are considered short-term investments. The Company’s short-term investments primarily consist of certificates of deposit with maturities of less than a year. Investment securities with maturities of more than a year are considered long-term investments and are classified in other assets on the accompanying Consolidated Balance Sheets. Long-term investments primarily consist of U.S. Treasuries, corporate bonds and auction ratepreferred securities. The auction rate securities have a fair value of approximately $1.0 million and a par value of $29.8 million at December 31, 2009 and 2008 and consist of 98 shares of FGIC Series C Perpetual Preferred Stock, which were received in April 2009, and 800 shares of Ambac Preferred Stock, which were received in October 2008, as a result of both FGIC and Ambac exercising their put rights associated with the original auction rate security investment (see Note 5 for fair value disclosures). Gross purchases and sales of the Company’s investments are presented within “Cash flows from investing activities” on the Company’s Consolidated Statements of Cash Flows.
e.SBA COMMUNICATIONS CORPORATION AND SUBSIDIARIES
NOTES TO CONSOLIDATED FINANCIAL STATEMENTS
Restricted Cash
The Company classifies all cash pledged as collateral to secure certain obligations and all cash whose use is limited as restricted cash. This includes cash held in escrow to fund certain reserve accounts relating to the 2010 Tower Securities and 2006 CMBS Certificates, for payment and performance bonds, and surety bonds issued for the benefit of the Company in the ordinary course of business (see Note 6)5).
SBA COMMUNICATIONS CORPORATION AND SUBSIDIARIES
NOTES TO CONSOLIDATED FINANCIAL STATEMENTS
In connection with the issuance of the CMBS Certificates (as defined in Note 13), the Company is required to fund a restricted cash amount, which represents the cash held in escrow pursuant to the mortgage loan agreement governing the CMBS Certificates. This restricted cash amount is used to fund certain reserve accounts for the payment of debt service costs, ground rents, real estate and personal property taxes, insurance premiums related to tower sites, trustee and servicing expenses, management fees and to reserve a portion of advance rents from tenants. Pursuant to the terms of the mortgage loan agreement, all rents and other sums due on the towers that secure the CMBS Certificates are directly deposited into a controlled deposit account by the lessees and are held by the indenture trustee. The restricted cash held by the indenture trustee in excess of required reserve balances is subsequently released to the Borrowers (as defined in Note 13) on or before the 15 th calendar day of the following month providing that the Company is in compliance with its debt service coverage ratio and that no Event of Default has occurred. All monies held by the indenture trustee are classified as restricted cash in current assets on the Company’s Consolidated Balance Sheets.
f.Property and Equipment
Property and equipment are recorded at cost or at estimated fair value (in case of acquired properties), adjusted for asset impairment and estimated asset retirement obligations. Costs associated with the development and construction of towers are capitalized as a cost of the towers. Costs for self-constructed towers include direct materials and labor, indirect costs and capitalized interest. Approximately $0.4 million, $0.4 million, and $0.2 million of interest cost was capitalized in both2011, 2010 and 2009, and 2008, respectively.
Depreciation on towers and related components is provided using the straight-line method over the estimated useful lives, not to exceed the minimum lease term of the underlying ground lease. The Company defines the minimum lease term as the shorter of the period from lease inception through the end of the term of all tenant lease obligations in existence at ground lease inception, including renewal periods, or the ground lease term, including renewal periods. If no tenant lease obligation exists at the date of ground lease inception, the initial term of the ground lease is considered the minimum lease term. Leasehold improvements are amortized on a straight-line basis over the shorter of the useful life of the improvement or the minimum lease term of the lease. For all other property and equipment, depreciation is provided using the straight-line method over the estimated useful lives.
The Company performs ongoing evaluations of the estimated useful lives of its property and equipment for depreciation purposes. The estimated useful lives are determined and continually evaluated based on the period over which services are expected to be rendered by the asset. If the useful lives of assets are reduced, depreciation may be accelerated in future years. Property and equipment under capital leases are amortized on a straight-line basis over the term of the lease or the remaining estimated life of the leased property, whichever is shorter, and the related amortization is included in depreciation expense. Expenditures for maintenance and repair are expensed as incurred.
Asset classes and related estimated useful lives are as follows:
Towers and related components | 3 - 15 years | |||
Furniture, equipment and vehicles | 2 - 7 years | |||
Buildings and improvements | 5 - 10 years | |||
Betterments, improvements and extraordinary repairs, which increase the value or extend the life of an asset, are capitalized and depreciated over the remaining estimated useful life of the respective asset. Changes in an
SBA COMMUNICATIONS CORPORATION AND SUBSIDIARIES
NOTES TO CONSOLIDATED FINANCIAL STATEMENTS
asset’s estimated useful life are accounted for prospectively, with the book value of the asset at the time of the change being depreciated over the revised remaining useful life. There has been no material impact for changes in estimated useful lives for any years presented.
g.SBA COMMUNICATIONS CORPORATION AND SUBSIDIARIES
NOTES TO CONSOLIDATED FINANCIAL STATEMENTS
Deferred Financing Fees
Financing fees related to the issuance of debt have been deferred and are being amortized using the effective interest rate method over the expected length of related indebtedness.indebtedness (see Note 13).
h.Deferred Lease Costs
The Company defers certain initial direct costs associated with the origination of tenant leases and lease amendments and amortizes these costs over the initial lease term, generally five years, or over the lease term remaining if related to a lease amendment. Such deferred costs were approximately $5.1 million, $4.7 million, and $4.0 million $3.8 million,in 2011, 2010, and $3.6 million in 2009, 2008, and 2007, respectively. Amortization expense was $3.3$4.6 million, $2.7$3.6 million, and $2.5$3.3 million for the years ended December 31, 2009, 20082011, 2010 and 2007,2009, respectively, and is included in cost of site leasing on the accompanying Consolidated Statements of Operations. As of December 31, 20092011 and 2008,2010, unamortized deferred lease costs were $8.3$9.9 million and $7.6$9.4 million, respectively, and are included in other assets on the accompanying Consolidated Balance Sheets.
i.Intangible Assets
The Company classifies as intangible assets the fair value of current leases in place at the acquisition date of towers and related assets (referred to as the “current“Current contract intangibles”), and the fair value of future tenant leases anticipated to be added to the acquired towers (referred to as the “network“Network location intangibles”). These intangibles are estimated to have an economic useful life consistent with the economic useful life of the related tower assets, which is typically 15 years. For all intangible assets, amortization is provided using the straight-line method over the estimated useful lives as the benefit associated with these intangible assets is anticipated to be derived evenly over the life of the asset.
j.Impairment of Long-Lived Assets
The Company records an impairment charge when the Company believes an investment in towers or related assets has been impaired, such that future undiscounted cash flows would not recover the then current carrying value of the investment in the tower site and related intangible. Estimates and assumptions inherent in the impairment evaluation include, but are not limited to, general market and economic conditions, historical operating results, geographic location, lease-up potential and expected timing of lease-up. In addition, the Company makes certain assumptions in determining an asset’s fair value for the purpose of calculating the amount of an impairment charge. The Company recorded an impairment charge of $3.9$5.5 million, $5.9 million and $0.9$3.9 million for the twelve monthsyears ended December 31, 20092011, 2010 and 2008,2009, respectively (see Note 17)18).
k.Fair Value of Financial InstrumentsMeasurements
The Company determines the fair market values of its financial instruments based on the fair value hierarchy, established by the Fair Value Measurements and Disclosures accounting guidance, which requires an entity to maximize the use of observable inputs and minimize the use of unobservable inputs when measuring fair value. The following three levels of inputs that may be used to measure fair value:
| Level 1 | Quoted prices in active markets for identical assets or liabilities that the Company has the ability to access at the measurement date. | |||
| Level 2 | Observable inputs other than Level 1 prices, such as quoted prices for similar assets or liabilities; quoted prices in markets that are not active; or other inputs that are observable or can be corroborated by observable market data for substantially the full term of the assets or liabilities. | |||
| Level 3 | Unobservable inputs that are supported by little or no market activity and that are significant to the fair value of the assets or liabilities. | |||
SBA COMMUNICATIONS CORPORATION AND SUBSIDIARIES
NOTES TO CONSOLIDATED FINANCIAL STATEMENTS
l.Revenue Recognition and Accounts Receivable
Revenue from site leasing is recorded monthly and recognized on a straight-line basis over the current term of the related lease agreements, which are generally five years. Receivables recorded related to the straight-lining of site leases are reflected in other assets on the Consolidated Balance Sheets. Rental amounts received in advance are recorded as deferred revenue on the Consolidated Balance Sheets.
Site development projects in which the Company performs consulting services include contracts on a time and materials basis or a fixed price basis. Time and materials based contracts are billed at contractual rates as the services are rendered. For those site development contracts in which the Company performs work on a fixed price basis, site development billing (and revenue recognition) is based on the completion of agreed upon phases of the project on a per site basis. Upon the completion of each phase on a per site basis, the Company recognizes the revenue related to that phase. Site development projects generally take from 3 to 12 months to complete.
Revenue from construction projects is recognized on the percentage-of-completion method of accounting, determined by the percentage of cost incurred to date compared to management’s estimated total cost for each contract. This method is used because management considers total cost to be the best available measure of progress on the contracts. These amounts are based on estimates, and the uncertainty inherent in the estimates initially is reduced as work on the contracts nears completion. The asset “costs and estimated earnings in excess of billings on uncompleted contracts” represents expensescosts incurred and revenues recognized in excess of amounts billed. The liability “billings in excess of costs and estimated earnings on uncompleted contracts”contracts,” included within other current liabilities on the Company’s Consolidated Balance Sheets, represents billings in excess of costs incurred and revenues recognized. Provisions for estimated losses on uncompleted contracts are made in the period in which such losses are determined to be probable.
On October 31, 2011, the Company entered into a Master Amendment with one of its wireless service provider customers. The Master Amendment serves as a separate amendment to each individual existing tenant lease agreement that the Company is currently a party to with that customer. Among other items, the Master Amendment (1) extends the current term of the individual leases, (2) permits the customer limited early termination rights which will be exercisable over a multi-year period, commencing in the second half of 2013, on a specific number of the existing leases, (3) allows the customer to make certain specific equipment changes at the tower sites, and (4) requires increases to the existing monthly lease rates. The customer’s early termination rights are limited with respect to the aggregate number of leases that may be terminated and the number that may be terminated in any quarter. The specific leases to be terminated early and the timing of such terminations has not been determined as of the date of this filing. As a result, for accounting and financial statement purposes, the Company has made assumptions with regard to the leases to be terminated and the timing of the terminations. The Company has assumed that the customer will terminate the maximum number of leases allowable in each quarter, selecting the highest rental rate leases at the earliest allowable dates. The Company believes that these assumptions will ensure that only the minimum known revenue for the pool of leases covered by the Master Agreement will be accrued on a straight-line basis. The Company’s balance sheet and statement of operations reflect these assumptions. The actual leases that the customer terminates and the timing and number of terminations may or may not be those that we have identified in our assumptions. The Company will monitor actual results and elections under the Master Amendment and record any differences from previously made assumptions on a quarterly basis. To the extent that the actual results materially differ from the assumptions made, the Company will disclose the impact of these adjustments.
Allowance for Doubtful accounts
The Company performs periodic credit evaluations of its customers. The Company monitors collections and payments from its customers and maintains a provision for estimated credit losses based upon historical experience, specific customer collection issues
SBA COMMUNICATIONS CORPORATION AND SUBSIDIARIES
NOTES TO CONSOLIDATED FINANCIAL STATEMENTS
identified and past due balances as determined based on contractual terms. Interest is charged on outstanding receivables from customers on a case by case basis in accordance with the terms of the respective contracts or agreements with those customers. Amounts determined to be uncollectible are written off against the allowance for doubtful accounts in the period in which uncollectabilityuncollectibility is determined to be probable.
The following is a rollforward of the allowance for doubtful accounts for the years ended December 31, 2009, 2008,2011, 2010, and 2007:2009;
| For the year ended December 31, | For the year ended December 31, | |||||||||||||||||||||||
| 2009 | 2008 | 2007 | 2011 | 2010 | 2009 | |||||||||||||||||||
| (in thousands) | (in thousands) | |||||||||||||||||||||||
Beginning balance | $ | 852 | $ | 1,186 | $ | 1,316 | $ | 263 | $ | 350 | $ | 852 | ||||||||||||
Allowance recorded relating to acquisitions | 10 | — | (280 | ) | — | — | 10 | |||||||||||||||||
Provision (credits) for doubtful accounts | 465 | (81 | ) | 150 | ||||||||||||||||||||
Provision for doubtful accounts | 70 | 630 | 465 | |||||||||||||||||||||
Write-offs, net of recoveries | (977 | ) | (253 | ) | — | (198 | ) | (717 | ) | (977 | ) | |||||||||||||
|
|
| ||||||||||||||||||||||
Ending balance | $ | 350 | $ | 852 | $ | 1,186 | $ | 135 | $ | 263 | $ | 350 | ||||||||||||
|
|
| ||||||||||||||||||||||
m.Cost of Revenue
Cost of site leasing revenue includes ground lease rent, property taxes, maintenance (exclusive of employee related costs) and other tower operating expenses. All ground lease rental obligations due to be paid out over the lease term, including fixed escalations, are recorded on a straight-line basis over the lease term. Liabilities recorded related to the straight-lining of ground leases are reflected in other long-term liabilities on the Consolidated Balance Sheets. Cost of site development revenue includes the cost of materials, salaries and labor costs, including payroll taxes, subcontract labor, vehicle
SBA COMMUNICATIONS CORPORATION AND SUBSIDIARIES
NOTES TO CONSOLIDATED FINANCIAL STATEMENTS
expense and other costs directly and indirectly related to the projects. All costs related to site development projects are recognized as incurred. All rental obligations due to be paid out over the minimum lease term, including fixed escalations, are recorded on a straight-line basis over the minimum lease term.
n.Income Taxes
The Company had taxable losses during the years ended December 31, 2009, 20082011, 2010 and 2007,2009, and as a result, net operating loss carry-forwards have been generated. TheseThe majority of these net operating loss carry-forwards are fully reserved as management believes it is not “more-likely-than-not” that the Company will generate sufficient taxable income in future periods to recognize the losses. The tax years 1997 through 2010 remain open to examination by the major jurisdictions in which the Company operates.
The Company determines whether it is “more-likely-than-not” that a tax position taken in an income tax return will be sustained upon examination, including resolution of any related appeals or litigation processes, based on the technical merits of the position. Once it is determined that a position meets the more-likely-than-not recognition threshold, the position is measured to determine the amount of benefit to recognize in the financial statements. The Company has not identified any tax exposures that require adjustment.a reserve. In the future, to the extent that the Company records unrecognized tax exposures, any related interest and penalties will be recognized as interest expense in the Company’s Consolidated Statements of Operations.
The Company does not calculate U.S. taxes on undistributed earnings of foreign subsidiaries because substantially all such earnings are expected to be reinvested indefinitely.
o.SBA COMMUNICATIONS CORPORATION AND SUBSIDIARIES
NOTES TO CONSOLIDATED FINANCIAL STATEMENTS
Stock-Based Compensation
The Company measures and recognizes compensation expense for all share-based payment awards made to employees and directors, including stock options, restricted stock units and employee stock purchases under employee stock purchase plans. The Company records compensation expense, net of estimated forfeitures, for stock options and restricted stock units on a straight-line basis over the vesting periodperiod. Compensation expense for employee stock options is based on the estimated fair value of the options on the date of the grant using the Black-Scholes option-pricing model. TheCompensation expense for restricted stock options granted to non-employees are valued using the Black-Scholes option-pricing modelunits is based on the fair market pricevalue of the underlying common stock onunits awarded at the “valuation date” which for options to non-employees is the vesting date. Expense related to the options granted to non-employees is recognized on a straight-line basis over the shorter of the period over which services are to be received or the vesting period.grant.
p.Asset Retirement Obligations
The Company recognizes asset retirement obligations in the period in which they are incurred, if a reasonable estimate of a fair value can be made, and accretes such liability through the obligation’s estimated settlement date. The associated asset retirement costs are capitalized as part of the carrying amount of the related tower fixed assets, and over time, the liability is accreted to its present value each period and the capitalized cost is depreciated over the estimated useful life of the tower.
The Company has entered into ground leases for the land underlying the majority of the Company’s towers. A majority of these leases require the Company to restore leaseholds to their original condition upon termination of the ground lease. The asset retirement obligation at December 31, 20092011 and December 31, 20082010 was $4.6$5.4 million and $4.2$5.2 million, respectively, and is included in other long-term liabilities on the Consolidated Balance Sheets. Upon settlement of the obligations, any difference between the cost to retire an asset and the recorded liability is recorded in the Consolidated Statements of Operations as a gain or loss. In determining the impact of the asset retirement obligations, the Company considered the nature and scope of the contractual restoration obligations contained in the Company’s third party ground leases, the historical retirement experience as an indicator of
SBA COMMUNICATIONS CORPORATION AND SUBSIDIARIES
NOTES TO CONSOLIDATED FINANCIAL STATEMENTS
future restoration probabilities, intent in renewing existing ground leases through lease termination dates, current and future value and timing of estimated restoration costs and the credit adjusted risk-free rate used to discount future obligations.
The following summarizes the activity of the asset retirement obligation liability:
| For the year ended December 31, | For the year ended December 31, | |||||||||||||||
| 2009 | 2008 | 2011 | 2010 | |||||||||||||
| (in thousands) | (in thousands) | |||||||||||||||
Asset retirement obligation at January 1 | $ | 4,198 | $ | 2,869 | $ | 5,214 | $ | 4,641 | ||||||||
Fair value of liability recorded for the Optasite, Light Tower and Tower Co acquisitions | — | 723 | ||||||||||||||
Additional liabilities accrued | 160 | 348 | 9 | 320 | ||||||||||||
Currency translation adjustment | (2 | ) | — | |||||||||||||
Accretion expense | 314 | 316 | 250 | 323 | ||||||||||||
Revision in estimates | (31 | ) | (58 | ) | (85 | ) | (70 | ) | ||||||||
|
| |||||||||||||||
Ending balance | $ | 4,641 | $ | 4,198 | $ | 5,386 | $ | 5,214 | ||||||||
|
| |||||||||||||||
q.Loss Per Share
The Company has potential common stock equivalents related to its outstanding stock options and convertible senior notes. These potential common stock equivalents were not included in diluted loss per share because the
SBA COMMUNICATIONS CORPORATION AND SUBSIDIARIES
NOTES TO CONSOLIDATED FINANCIAL STATEMENTS
effect would have been anti-dilutive in calculating the full year earnings per share. Accordingly, basic and diluted loss per common share and the weighted average number of shares used in the computations are the same for all periods presented in the Consolidated Statements of Operations.
r.Comprehensive LossIncome (Loss)
Comprehensive lossincome (loss) is defined as the change in equity (net assets) of a business enterprise during a period from transactions and other events and circumstances from non-owner sources, and is comprised of net lossincome (loss) and “other comprehensive loss.income (loss).” Comprehensive loss is presented in the Consolidated Statements of Shareholders’ Equity.
s.Foreign Currency Translation
All assets and liabilities of foreign subsidiaries that do not utilize the United States dollar as its functional currency are translated at period-end rates of exchange, while revenues and expenses are translated at monthly weighted average rates of exchange for the year. Unrealized translation gains and losses are reported as foreign currency translation adjustments through other comprehensive loss in shareholders’ equity.
t.Reclassifications
Certain reclassifications have been made to prior year amounts or balances to conform to the presentation adopted in the current year.
4. CURRENT ACCOUNTING PRONOUNCEMENTSAcquisitions
The Financial Accounting Standards BoardCompany accounts for acquisitions under the acquisition method of accounting. The assets and liabilities are recorded at fair market value at the date of each acquisition and the results of operations of the acquired assets are included with those of the Company from the dates of the respective acquisitions. The Company continues to evaluate all acquisitions for a period not to exceed one year after the applicable closing date of each transaction to determine whether any additional adjustments are needed to the allocation of the purchase price paid for the assets acquired and liabilities. The intangible assets represent the value associated with the current leases at the acquisition date (“FASB”Current Contract Intangibles”) issued Accounting Standards Updateand future tenant leases anticipated to be added to the towers (“ASU”Network Location Intangibles”) No. 2009-01, Amendments Based on Statementand were calculated using the discounted values of Financial Accounting Standards No. 168 –the current or future expected cash flows. The FASB Accountingintangible assets are estimated to have an economic useful life consistent with the economic useful life of the related tower assets, which is typically 15 years.
The acquisitions consummated during fiscal years ended December 31, 2011, 2010 and 2009 were not significant to the Company, and accordingly pro forma financial information has not been presented.
In connection with certain acquisitions, the Company may agree to pay additional consideration (or earnouts) if the towers or businesses that are acquired meet or exceed certain performance targets over a period of one to three years after they have been acquired. The Company records contingent consideration for acquisitions that occurred prior to January 1, 2009 when the contingent consideration is paid. Effective January 1, 2009, the Company accrues for contingent consideration in connection with acquisitions at fair value as of the date of the acquisition. All subsequent changes in fair value of contingent consideration are recorded through Consolidated Statements of Operations. In certain acquisitions, the additional consideration may be paid in cash or shares of Class A common stock at the Company’s option.
SBA COMMUNICATIONS CORPORATION AND SUBSIDIARIES
NOTES TO CONSOLIDATED FINANCIAL STATEMENTS
| 3. | CURRENT ACCOUNTING PRONOUNCEMENTS |
Standards Codification and the Hierarchy of Generally Accepted Accounting Principles (“ASU 2009-01”), which states thatIn May 2011, the FASB issued Accounting Standards CodificationUpdate (“Codification”ASU”) will become the sourceNo. 2011-04, Amendments to Achieve Common Fair Value Measurement and Disclosure Requirements in U.S. GAAP and International Financial Reporting Standards (Topic 820) – Fair Value Measurement, to provide a consistent definition of authoritativefair value and sure that fair value measurements and disclosure requirements are similar between U.S. generally accepted accountingGAAP and International Financial Reporting Standards. ASU 2011-04 changes certain fair value measurement principles (“GAAP”) recognized by the FASB. The codification does not change existing GAAP but insteadand enhances disclosure requirements particularly for Level 3 fair value measurements (as defined in Note 2). ASU 2011-04 is a major restructuring of accounting and reporting standards designed to simplify user access to all authoritative GAAP by providing the authoritative literature in a topically organized structure. On the effective date the Codification supersedes all then-existing non-SEC accounting and reporting standards. The FASB will no longer issue new standards in the formfirst quarter of statements, instead it will issue accounting standard updates.fiscal 2012 and should be applied prospectively. The Company is currently evaluating the impact of ASU 2009-01 became effective for2011-04 on its financial statements issued for interim and annual reporting periods ending after September 15, 2009 and the adoption did not have any impact on the Company’s financial condition,position, results of operations, cash flows and cash flows.disclosures.
TheIn June 2011, the FASB issued business combination accounting guidance which amendsASU No. 2011-05 – Comprehensive Income (Topic 220): Presentation of Comprehensive Income, to increase the prominence of other comprehensive income in financial statements. Under the provisions of ASU No. 2011-05, an entity has the option to present the total of comprehensive income, the components of net income, and clarifies the accounting for assets acquired and liabilities assumedcomponents of other comprehensive income either in a business combination that arise from contingencies. Thissingle continuous statement of comprehensive income or in two separate but consecutive statements. The statement of other comprehensive income should immediately follow the statement of net income and include the components of other comprehensive income and a total for other comprehensive income, along with a total for comprehensive income. The accounting guidance ischanges summarized in ASU No. 2011-05 are effective for assets or liabilities arising from contingencies in business combinations for which the acquisition date is on or after the beginning of the first annual reporting periodfiscal years beginning on or after December 15, 2008. The2011, with early adoption of this accounting guidance did not have a material impact on the Company’s consolidated financial position, results of operations or cash flows.
The FASB also issued business combinations accounting guidance which requires the acquiring entity in a business combination to record all assets acquired and liabilities assumed at their respective acquisition-date fair values and changes other practices some of which could have a material impact on how the Company accounts for business combinations. These changes include, among other things, expensing acquisition costs as incurred as a component of operating expense. Effective January 1, 2009, these costs are reflected as acquisition related expenses in the Company’s consolidated statement of operations. The Company historically capitalized these acquisition costs as part of the purchase price and then amortized these costs using the straight-line method over the life of the acquired intangible assets. This accounting guidance also requires additional disclosure of information surrounding a business combination, such that users of the entity’s financial statements can fully understand the nature and financial impact of a business combination. This accounting guidance is effective for fiscal years beginning after December 15, 2008 and interim periods within those fiscal years.permitted. The Company adopted this accounting guidance effective January 1, 2009.ASU No. 2011-05 during the second quarter of fiscal 2011.
| 4. | FAIR VALUE MEASUREMENTS |
Items Measured at Fair Value on a RecurringBasis – The FASB issued accounting guidance for intangibles other than goodwill which amendsCompany’s earnouts related to acquisitions are measured at fair value on a recurring basis using Level 3 inputs. The fair value of the factors that should be considered in developing renewal or extension assumptions used to determine the useful life of a recognized intangible asset. This accounting guidanceearnouts is effective for fiscal years beginning after December 15, 2008 and the adoption did not have a material impactbased on the Company’s consolidated financial position, results of operations or cash flows.
anticipated future earnout obligations. The FASB issued ASU No. 2010-06, Improving Disclosures about Fair Value Measurements (“ASU 2010-06”) which will require new disclosures about recurring or nonrecurring fair-value measurements including significant transfers into and out of Level 1 and Level 2 fair value measurementsof the earnouts is reviewed quarterly and informationis based on purchases, sales, issuances, and settlementsthe payments the Company expects to make based on a gross basis in the reconciliationanticipated performance of Level 3 fair value measurements.the underlying assets. The FASB also clarified existing fair value measurement disclosure guidance about the levelCompany’s estimate of disaggregation, inputs, and valuation techniques. ASU 2010-06 is effective for fiscal years beginning after December 15, 2009. The Company will incorporate the disclosure requirements of ASU No. 2010-06 in the first quarter of 2010.
The FASB issued ASU No. 2009-05, Measuring Liabilities at Fair Value (“ASU 2009-05”). ASU 2009-05 amends fair value accounting by providing additional guidance clarifying the measurement of liabilities at fair value. ASU 2009-05 addresses several key issues with respect to estimating the fair value of liabilitiesits obligation if the performance targets contained in various acquisition agreements were met was $5.5 million and clarifies how the price$3.3 million as of a traded debt security should be considered in estimating the fair value of the issuer’s liability. ASU 2009-05 became effective for financial statements issued for interimDecember 31, 2011 and annual reporting periods
SBA COMMUNICATIONS CORPORATION AND SUBSIDIARIES
NOTES TO CONSOLIDATED FINANCIAL STATEMENTS
ending after its issuance (August 2009). The adoption of ASU 2009-05 did not have a material impact on the Company’s consolidated financial position, results of operations or cash flows.
The FASB issued fair value accounting guidanceDecember 31, 2010, respectively, which requires disclosures about fair value of financial instruments for interim reporting periods of publicly traded companies as well as in annual financial statements. This accounting guidance is effective for interim reporting periods ending after June 15, 2009 and does not require disclosures for earlier periods presented for comparative purposes at initial adoption. The Company adopted this accounting guidance and have incorporated all applicable disclosures.
The FASB issued fair value accounting guidance which provides additional guidance for estimating fair value when the volume and level of activity for the asset or liability have significantly decreased. This accounting guidance is effective for interim and annual reporting periods ending after June 15, 2009, and is applied prospectively. The adoption of this accounting guidance did not have any impact on the Company’s consolidated financial position, results of operations or cash flows.
The FASB issued fair value accounting guidance which defines fair value, establishes guidelines for measuring fair value and expands disclosures regarding fair value measurements. This accounting guidance was effective for fiscal years beginning after November 15, 2007. In February 2008, FASB issued additional guidance which excluded leases and other accounting pronouncements that address fair value measurements for purposes of lease classification or measurement. In addition the additional guidance delayed the effective date to fiscal years beginning after November 15, 2008, or in fiscal 2009 for the Company and interim periods within those fiscal years for fair value measurements for all nonfinancial assets and nonfinancial liabilities, except those that are recognized or disclosed at fair valuerecorded in the financial statements on a recurring basis (at least annually). In October 2008, the FASB issued additional accounting guidance which clarifies the application of fair value measurements in an inactive market by providing an illustrative example to demonstrate how the fair value of a financial asset is determined when the market for the financial asset is inactive. Effective January 1, 2008, the guidelines of fair value measurement were applied in recording the Company’s investments. Effective January 1, 2009, the guidelines of fair value measurements were applied to non-financial assets and non-financial liabilitiesaccrued expenses (see Note 5)12).
The FASB issued subsequent events accounting guidance which established principles and requirements for disclosing subsequent events. This accounting guidance is effective for interim or annual financial periods ending after June 15, 2009, and is applied prospectively. The Company adopted this accounting guidance.
The FASB issued accounting guidance on investment in debt and equity securities which changed the existing accounting requirements for other-than-temporary impairments. This accounting guidance is effective for interim and annual reporting periods ending after June 15, 2009 and the adoption did not have any impact on the Company’s consolidated financial position, results of operations or cash flows.
The FASB issued derivative and hedging accounting guidance which addresses the determination of whether an instrument (or an embedded feature) is indexed to an entity’s own stock. This accounting guidance is effective for fiscal years beginning after December 15, 2008 and interim periods within those fiscal years and the adoption did not have a material impact on the Company’s consolidated financial position, results of operations or cash flows.
The FASB issued derivative and hedging accounting guidance which expands the disclosure requirements for derivative instruments and hedging activities. This accounting guidance is effective for financial statements issued
SBA COMMUNICATIONS CORPORATION AND SUBSIDIARIES
NOTES TO CONSOLIDATED FINANCIAL STATEMENTS
for fiscal years and interim periods beginning after November 15, 2008 and the adoption did not have any impact on the Company’s consolidated financial position, results of operations or cash flows.
The FASB issued consolidation accounting guidance which requires entities to report non-controlling (minority) interests in subsidiaries as equity in the consolidated financial statements. This accounting guidance is effective for fiscal years beginning after December 15, 2008. The Company adopted this accounting guidance effective January 1, 2009 and the noncontrolling interests are reflected in the Company’s consolidated balance sheet, consolidated statements of operations and consolidated statement of shareholders’ equity.
5. FAIR VALUE OF FINANCIAL INSTRUMENTS
Items Measured at Fair Value on a RecurringNonrecurring Basis— – The carrying values of the Company’s financial instruments that approximateintangibles, certain long-lived assets, and asset retirement obligations are measured at fair value due to the short maturity of those instruments primarily includes cash and cash equivalents, short-term investments, restricted cash, accounts receivable, and accounts payable. These financial instruments are valuedon a nonrecurring basis using Level 13 inputs. Level 1 valuations rely on quoted prices in active markets for identical assets or liabilities that the Company has the ability to access at the measurement date. Long-term investments which are included in other assets on the Company’s Consolidated Balance Sheet consist of U.S. treasuries, corporate bonds and auction rate securities (see Note 3 for additional information).
During the year ended December 31, 2009, there were no changes in the fair value of the auction rate securities. The Company recorded $13.3 million of other–than–temporary impairment charges in other income (expense) on its Consolidated Statements of Operations for the year ended December 31, 2008. The Company determined the other-than-temporary impairment charge for the year ended December 31, 2008 based on a variety of factors, including the significant decline in fair value indicated for the individual investments, the adverse market conditions impacting auction rate securities and the exercise of the put rights that resulted in the Company owning shares of FGIC Preferred Stock and shares of Ambac Preferred Stock.
The Company has estimated the fair value of these auction rate securities based on values provided by a third party valuation firm utilizing a Level 3 valuation methodology. Level 3 valuations rely on unobservable inputs for the asset or liability, and include situations where there is little, if any, market activity for the asset or liability. Management validated the assumptions used in the valuation including the ultimate time horizon over which dividends are anticipated to be paid on the preferred stock, the coupon rate for these securities, and the appropriate discount margins. The Company continues to monitorconsiders many factors and makes certain assumptions when making this assessment, including but not limited to: general market and othereconomic conditions, in assessing whether further changes in the fair valuehistorical operating results, geographic location, lease-up potential and expected timing of these securities are warranted. Due to the lack of a market for Ambac Preferred Stock and FGIC Preferred Stock, the established fair value of these securities is a matter of judgment. These estimated fair values could change based on future market conditions and as such, the Company may be required to record additional unrealized losses for impairment if the Company determines there are further declines in their fair value.
SBA COMMUNICATIONS CORPORATION AND SUBSIDIARIES
NOTES TO CONSOLIDATED FINANCIAL STATEMENTS
A reconciliation of the beginning and ending balances for the auction rate investments that use significant unobservable inputs (Level 3) as of December 31, 2009 and 2008 is as follows (in thousands):
| Auction Rate Securities | ||||
| (in thousands) | ||||
Beginning balance, December 31, 2007 | $ | 55,142 | ||
Sales | (40,900 | ) | ||
Other-than-temporary impairment charge | (13,256 | ) | ||
Ending balance, December 31, 2008 | 986 | |||
Sales | — | |||
Realized/unrealized gains and losses | — | |||
Ending balance, December 31, 2009 | $ | 986 | ||
Items Measured at Fair Value on a Nonrecurring Basis—The Company’s long-lived assets (see Note 3), intangibles, asset retirement obligations (see Note 3) and earnouts related to acquisitions (see Note 7) are measured at fair value on a nonrecurring basis using level 3 inputs.lease-up. The fair value of the long-lived assets, intangibles and asset retirement obligations areis calculated using a discountdiscounted cash flow model. The fairCompany recorded an impairment charge of $5.5 million, $5.9 million and $3.9 million for the years ended December 31, 2011, 2010 and 2009, respectively, related to its long-lived assets resulting from the Company’s analysis that the future cash flows from certain tower sites would not recover the carrying value of the earnouts is based on the estimated earnout payments. During the year ended December 31, 2009 the Company recorded a $3.9 million impairment on its long-lived and intangible assetsinvestment in those tower sites (see Note 17)18).
Fair Value of Financial Instruments— – The carrying valuevalues of the Company’s financial instruments, with the exceptioncash and cash equivalents, accounts receivable, restricted cash, accounts payable, and short-term investments, which consist of long-term debt including current portion, reasonably estimate the related fair values$5.6 million and $4.0 million in certificate of deposits, as of December 31, 20092011 and 2010, respectively, approximate their related estimated fair values due to the short maturity of those instruments. The Company’s estimate of the fair value of its held-to-maturity investments in treasury and corporate bonds, including current portion, are based primarily upon reported market values. As of December 31, 2008.
The following table reflects2011, the carrying value and fair values, principal values and carrying valuesvalue of the Company’s debt instruments. held-to-maturity investments, including current portion, was $1.4 million and $1.6 million, respectively. As of December 31, 2010, the carrying value and fair value of the held-to-maturity investments, including current portion, was $1.5 million and $1.7 million, respectively.
The Company determines fair value of its debt securitiesinstruments utilizing various sources including quoted prices and indicative quotes (that is non-binding quotes) from brokers that require judgment to interpret market information including implied credit spreads for similar borrowings on recent trades or bid/ask prices. The following table reflects fair values, principal values and carrying values of the Company’s debt instruments (see Note 13).
| At December 31, 2009 | At December 31, 2008 | |||||||||||||||||
| Fair Value | Principal Value | Accreted Carrying Value | Fair Value | Principal Value | Accreted Carrying Value | |||||||||||||
| (in millions) | ||||||||||||||||||
8.0% Senior Notes due 2016 | $ | 388.1 | $ | 375.0 | $ | 372.6 | $ | — | $ | — | $ | — | ||||||
8.25% Senior Notes due 2019 | $ | 393.8 | $ | 375.0 | $ | 371.9 | $ | — | $ | — | $ | — | ||||||
0.375% Convertible Senior Notes | $ | 34.2 | $ | 30.4 | $ | 28.6 | $ | 112.5 | $ | 138.1 | $ | 122.0 | ||||||
1.875% Convertible Senior Notes | $ | 564.4 | $ | 550.0 | $ | 432.5 | $ | 314.5 | $ | 550.0 | $ | 403.7 | ||||||
4.0% Convertible Senior Notes | $ | 652.5 | $ | 500.0 | $ | 342.8 | $ | — | $ | — | $ | — | ||||||
2006 CMBS Certificates | $ | 961.5 | $ | 940.6 | $ | 940.6 | $ | 839.0 | $ | 1,090.7 | $ | 1,090.7 | ||||||
2005 CMBS Certificates | $ | — | $ | — | $ | — | $ | 334.8 | $ | 398.8 | $ | 398.8 | ||||||
Senior Secured Revolving Credit Facility | $ | — | $ | — | $ | — | $ | 205.9 | $ | 230.6 | $ | 230.6 | ||||||
Optasite Credit Facility | $ | — | $ | — | $ | — | $ | 135.7 | $ | 149.0 | $ | 146.4 | ||||||
| As of December 31, 2011 | As of December 31, 2010 | |||||||||||||||||||||||
| Fair Value | Principal Value | Carrying Value | Fair Value | Principal Value | Carrying Value | |||||||||||||||||||
| (in millions) | ||||||||||||||||||||||||
1.875% Convertible Senior Notes due 2013 | $ | 605.2 | $ | 535.0 | $ | 485.0 | $ | 617.4 | $ | 550.0 | $ | 464.0 | ||||||||||||
4.0% Convertible Senior Notes due 2014 | $ | 761.6 | $ | 500.0 | $ | 397.6 | $ | 744.4 | $ | 500.0 | $ | 368.5 | ||||||||||||
8.0% Senior Notes due 2016 | $ | 405.0 | $ | 375.0 | $ | 373.2 | $ | 405.9 | $ | 375.0 | $ | 372.9 | ||||||||||||
8.25% Senior Notes due 2019 | $ | 407.8 | $ | 375.0 | $ | 372.4 | $ | 409.7 | $ | 375.0 | $ | 372.1 | ||||||||||||
4.254% 2010-1 Tower Securities | $ | 699.0 | $ | 680.0 | $ | 680.0 | $ | 691.9 | $ | 680.0 | $ | 680.0 | ||||||||||||
5.101% 2010-2 Tower Securities | $ | 579.0 | $ | 550.0 | $ | 550.0 | $ | 556.9 | $ | 550.0 | $ | 550.0 | ||||||||||||
Revolving Credit Facility | $ | — | $ | — | $ | — | $ | 20.0 | $ | 20.0 | $ | 20.0 | ||||||||||||
Term Loan | $ | 494.4 | $ | 497.5 | $ | 496.3 | $ | — | $ | — | $ | — | ||||||||||||
SBA COMMUNICATIONS CORPORATION AND SUBSIDIARIES
NOTES TO CONSOLIDATED FINANCIAL STATEMENTS
6. RESTRICTED CASH
| 5. | RESTRICTED CASH |
Restricted cash consists of the following:
| As of December 31, 2009 | As of December 31, 2008 | Included on Balance Sheet | As of December 31, 2011 | As of December 31, 2010 | Included on Balance Sheet | |||||||||||||
| (in thousands) | (in thousands) | |||||||||||||||||
CMBS Certificates | $ | 29,108 | $ | 36,182 | Restricted cash - current asset | |||||||||||||
Securitization escrow accounts | $ | 21,378 | $ | 28,583 | Restricted cash – current asset | |||||||||||||
Payment and performance bonds | 1,177 | 2,417 | Restricted cash - current asset | 888 | 873 | Restricted cash – current asset | ||||||||||||
Surety bonds and workers compensation | 11,097 | 16,660 | Other assets - noncurrent | 11,495 | 11,392 | Other assets – noncurrent | ||||||||||||
|
| |||||||||||||||||
Total restricted cash | $ | 41,382 | $ | 55,259 | $ | 33,761 | $ | 40,848 | ||||||||||
|
| |||||||||||||||||
Pursuant to the terms of the Mortgage Pass-Through Certificates Series 2006-1 (the “2006 CMBS Certificates”) and, upon their refinancing, pursuant to the terms of the Secured Tower Revenue Securities Series 2010-1 (the “2010-1 Tower Securities”) and the Secured Tower Revenue Securities Series 2010-2 (the “2010-2 Tower Securities” and together with the 2010-1 Tower Securities, the “2010 Tower Securities”) (see Note 13), the Company is required to establish a controlled deposit account, held by the indenture trustee, into which all rents and other sums due on the towers that secured the 2006 CMBS Certificates relate toand those that currently secure the 2010 Tower Securities are directly deposited by the lessees. These restricted cash held in escrowamounts are used to fund certain reserve accounts relatingfor the payment of (1) debt service costs, (2) ground rents, real estate and personal property taxes and insurance premiums related to tower sites, (3) trustee and servicing expenses, (4) management fees, and (5) to reserve a portion of advance rents from tenants. The restricted cash in the controlled deposit account in excess of required reserve balances is subsequently released to the CMBS Certificates (seeBorrowers (as defined in Note 3). 13) monthly, provided that the Borrowers are in compliance with their debt service coverage ratio and that no Event of Default has occurred. All monies held by the indenture trustee are classified as restricted cash on the Company’s Consolidated Balance Sheets.
Payment and performance bonds relate primarily to collateral requirements for tower construction currently in process by the Company. Cash is pledged as collateral related to surety bonds issued for the benefit of the Company or its affiliates in the ordinary course of business and primarily related to the Company’s tower removal obligations. As of December 31, 2009,2011, the Company had $18.3$20.6 million in surety, payment and performance bonds for which it is only required to post $9.2$10.1 million in collateral. In addition, asThe Company periodically evaluates the collateral posted for its bonds to ensure that it meets the minimum requirements. As of December 31, 20092011 and December 31, 2008,2010, the Company had pledged $2.4$2.3 million and $2.0$2.2 million, respectively, as collateral related to its workers compensation policy. These amountsRestricted cash for surety bonds and workers compensation are included in other assets on the Company’s Consolidated Balance Sheets.
7. ACQUISITIONS
During the year ended December 31, 2009, the Company acquired 376 completed towers and related assets and liabilities from various sellers and an interest in a Canadian entity whose holdings consisted of 52 towers and related assets and liabilities. The aggregate consideration paid for these towers and the equity interest and related assets was approximately $187.0 million, consisting of $171.4 million of cash and approximately 642,000 shares of Class A common stock (excluding any working capital adjustments). The Company accounted for the above tower acquisitions under the acquisition method of accounting. The acquisitions are recorded at fair market value at the date of each acquisition. The results of operations of the acquired assets are included with those of the Company from the dates of the respective acquisitions. In addition, in 2009 as part of the ground lease purchase program, the Company paid $4.2 million in cash for long-term lease extensions and $15.0 million for land and perpetual easement purchases, consisting of $11.6 million paid in cash and $3.4 million paid through the issuance of approximately 143,000 shares of the Company’s Class A common stock.
On September 16, 2008, a wholly-owned subsidiary of the Company merged with Optasite Holding Company Inc. (“Optasite”) and Optasite became a wholly-owned subsidiary of the Company. As of the closing, Optasite owned 528 tower sites, located in 31 states, Puerto Rico and the U.S. Virgin Islands and had approximately 38 managed site locations. Pursuant to the terms of the merger agreement, the Company issued 7.25 million shares of SBA Class A common stock to the Optasite security holders, assumed Optasite’s fully-drawn $150 million senior credit facility (see Note 13) and assumed approximately $26.9 million of additional liabilities. The aggregate consideration paid for Optasite was approximately $433.3 million (excluding any working capital adjustments). The results of operations of Optasite are included with those of the Company from the date of the acquisition.
On October 20, 2008, a wholly-owned subsidiary of the Company acquired Light Tower Wireless, LLC (“Light Tower”), the wireless infrastructure subsidiary of Light Tower, LLC. Light Tower became a wholly-owned subsidiary of the Company. As of the closing, Light Tower owned 340 wireless communications towers, five managed sites and five distributed antenna system (“DAS”) networks. The aggregate purchase price paid for
SBA COMMUNICATIONS CORPORATION AND SUBSIDIARIES
NOTES TO CONSOLIDATED FINANCIAL STATEMENTS
| 6. | OTHER ASSETS |
these towers and relatedThe Company’s other assets was approximately $224.0 million (excluding any working capital adjustments) which was paid in cash. The results of operations of Light Tower are included with thosecomprised of the following:
| As of December 31, 2011 | As of December 31, 2010 | |||||||
| (in thousands) | ||||||||
Restricted cash-LT | $ | 11,495 | $ | 11,392 | ||||
Long-term investments | 49,529 | 49,639 | ||||||
Prepaid land rent | 57,510 | 43,697 | ||||||
Straight-line revenue | 64,357 | 51,600 | ||||||
Other | 28,911 | 17,680 | ||||||
|
|
|
| |||||
Total Other Assets: | $ | 211,802 | $ | 174,008 | ||||
|
|
|
| |||||
| 7. | ACQUISITIONS |
The following table summarizes the Company’s acquisition activity:
| For the year ended December 31, | ||||||||||||
| 2011 | 2010 | 2009 | ||||||||||
Tower Acquisitions (number of towers) | 1,085 | 712 | 376 | |||||||||
|
|
|
|
|
| |||||||
The following table summarizes the Company’s acquisition capital expenditures:
| For the year ended December 31, | ||||||||||||
| 2011 | 2010 | 2009 | ||||||||||
| (in thousands) | ||||||||||||
Towers and related intangible assets | $ | 348,950 | $ | 294,426 | $ | 165,844 | ||||||
Ground lease land purchases | 25,755 | 24,950 | 11,577 | |||||||||
Earnouts | 4,615 | 8,669 | 3,377 | |||||||||
|
|
|
|
|
| |||||||
Total Acquisition Capital Expenditures | $ | 379,320 | $ | 328,045 | $ | 180,798 | ||||||
|
|
|
|
|
| |||||||
The Company from the datepaid, as part of the acquisition.
In addition to the Optasiteground lease purchase program, $9.8 million, $9.0 million, and Light Tower acquisitions, during the year ended December 31, 2008, the Company acquired 587 completed towers (including 423 towers from the TowerCo, LLC acquisition) and related assets and liabilities from various sellers as well as the equity interest of six entities, whose holdings consisted of 114 towers and related assets and liabilities. The aggregate consideration paid for these towers and related assets was $479.6 million, consisting of $441.1 million in cash and approximately 1.2 million shares of Class A common stock valued at $38.5 million (excluding any working capital adjustments). The Company accounted for all of the above tower acquisitions at fair market value at the date of each acquisition. The results of operations of the acquired assets are included with those of the Company from the dates of the respective acquisitions. Also, during 2008, the Company paid in cash $19.9 million for land and easement purchases and $3.3$4.2 million for long-term lease extensions related toduring the land underneath the Company’s towers.years ending 2011, 2010, and 2009, respectively.
During the year ended December 31, 2007,2010, the Company acquired 529 completed towers, related assets and liabilities from various sellers as well as the equityan interest of three entities, whose assets consisted ofin distributed antenna systems (“DAS”) provider Extenet Systems, Inc. for approximately 83 towers and related assets and liabilities. The aggregate net consideration paid for these additional assets was $330.0 million, consisting of $166.3$32.3 million in cash and the contribution of its existing DAS business valued at $11.0 million. The investment in Extenet Systems, Inc. is accounted for under the cost method of accounting.
During the year ended December 31, 2009, the Company issued approximately 4.7 million785,000 shares of Class A common stock valued at $163.7 million (excluding any working capital adjustments). The Company accounted for all of the above tower acquisitions at fair market value at the date of each acquisition. The results of operations of the acquired assets are included with those of the Company from the dates of their respective acquisitions. Also, during 2007, the Company paid in cash $23.4 million for land and easement purchases in addition to $10.9 million spent for long-term lease extensions related to the land underneath the Company’s towers.
The acquisitions consummated were not significant to the Company and accordingly, pro forma financial information has not been presented. The Company continues to evaluate all acquisitions within one year after the applicable closing date of each transaction to determine whether any additional adjustments are needed to the allocation of the purchase price paid for the assets acquired and liabilities assumed by major balance sheet caption, as well as the separate recognition of intangible assets from goodwill if certain criteria are met. These intangible assets represent the value associated with current leases in place at the acquisition date (“Current Contract Intangibles”) and future tenant leases anticipated to be added to the acquired towers (“Network Location Intangible”) and were calculated using the discounted values of the current or future expected cash flows. The intangible assets are estimated to have an economic useful life consistent with the economic useful life of the related tower assets, which is typically 15 years.
From time to time, the Company agrees to pay additional consideration in connection with itstower acquisitions if the towers or businesses that are acquired meet or exceed certain performance targets in the one to three years after they have been acquired. In certain acquisitions, the additional consideration may be paid in cash or shares of Class A common stock at the Company’s option (see Note 20). The Company accrues for contingent consideration at fair value based on the expected contingent payments. Prior to January 1, 2009, the Company recorded such obligations as additional consideration when it became probable that the targets would be met.
Subsequent to December 31, 2009, the Company acquired 14 towers from third party sellers and an equity interest in DAS provider Extenet Systems, inc. in exchange for $42.9 million in cash and a contribution of the Company’s six DAS networks.
SBA COMMUNICATIONS CORPORATION AND SUBSIDIARIES
NOTES TO CONSOLIDATED FINANCIAL STATEMENTS
8. INTANGIBLE ASSETS, NETEarnouts
The Company recorded $0.7 million of income, net related to contingent consideration adjustments in the year ended December 31, 2011. Adjustments recorded to contingent consideration in the years ended December 31, 2010 and 2009 were not material.
As of December 31, 2011 the Company’s estimate of its potential obligation if the performance targets contained in various acquisition agreements were met was $5.5 million which the Company recorded in accrued expenses, compared to the probable obligation of $3.3 million at December 31, 2010.
For the year ended December 31, 2009, the Company issued approximately 78,000 shares of Class A common stock as a result of acquired towers exceeding certain performance targets.
| 8. | INTANGIBLE ASSETS, NET |
The following table provides the gross and net carrying amounts for each major class of intangible assets:
| As of December 31, 2009 | As of December 31, 2008 | |||||||||||||||||||
| Gross carrying amount | Accumulated amortization | Net book value | Gross carrying amount | Accumulated amortization | Net book value | |||||||||||||||
| (in thousands) | ||||||||||||||||||||
Current Contract Intangibles | $ | 1,099,164 | $ | (173,351 | ) | $ | 925,813 | $ | 1,022,022 | $ | (103,837 | ) | $ | 918,185 | ||||||
Network Location Intangibles | 610,222 | (100,444 | ) | 509,778 | 569,301 | (62,354 | ) | 506,947 | ||||||||||||
Intangible assets, net | $ | 1,709,386 | $ | (273,795 | ) | $ | 1,435,591 | $ | 1,591,323 | $ | (166,191 | ) | $ | 1,425,132 | ||||||
| As of December 31, 2011 | As of December 31, 2010 | |||||||||||||||||||||||
| Gross carrying | Accumulated | Net book | Gross carrying | Accumulated | Net book | |||||||||||||||||||
| amount | amortization | value | amount | amortization | value | |||||||||||||||||||
| (in thousands) | ||||||||||||||||||||||||
Current contract intangibles | $ | 1,391,001 | $ | (333,522 | ) | $ | 1,057,479 | $ | 1,206,114 | $ | (248,308 | ) | $ | 957,806 | ||||||||||
Network location intangibles | 772,467 | (190,162 | ) | 582,305 | 684,497 | (142,291 | ) | 542,206 | ||||||||||||||||
|
|
|
|
|
|
|
|
|
|
|
| |||||||||||||
Intangible assets | $ | 2,163,468 | $ | (523,684 | ) | $ | 1,639,784 | $ | 1,890,611 | $ | (390,599 | ) | $ | 1,500,012 | ||||||||||
|
|
|
|
|
|
|
|
|
|
|
| |||||||||||||
All intangibles noted above are contained in the Company’s site leasing segment. The Company amortizes its intangibles using the straight line method over fifteen years. Amortization expense relating to the intangible assets above was $107.6$133.1 million, $77.5$117.0 million and $54.3$107.6 million for the years ended December 31, 2009, 20082011, 2010 and 2007,2009, respectively. These amounts are subject to changes in estimates until the preliminary allocation of the purchase price is finalized for each acquisition.
Estimated amortization expense on the Company’s current contract and network location intangibles is as follows:
For the year ended December 31, | (in thousands) | (in thousands) | |||||
2010 | $ | 113,959 | |||||
2011 | 113,959 | ||||||
2012 | 113,959 | $ | 144,231 | ||||
2013 | 113,959 | 144,231 | |||||
2014 | 113,959 | 144,231 | |||||
2015 | 144,231 | ||||||
2016 | 144,231 | ||||||
Thereafter | 865,796 | 918,629 | |||||
| |||||||
Total | $ | 1,435,591 | $ | 1,639,784 | |||
| |||||||
9. PROPERTYSBA COMMUNICATIONS CORPORATION AND EQUIPMENT, NETSUBSIDIARIES
NOTES TO CONSOLIDATED FINANCIAL STATEMENTS
| 9. | PROPERTY AND EQUIPMENT, NET |
Property and Equipment, net (including assets held under capital leases) consists of the following:
| As of December 31, 2009 | As of December 31, 2008 | |||||||
| (in thousands) | ||||||||
Towers and related components | $ | 2,259,405 | $ | 2,136,179 | ||||
Construction-in-process | 11,477 | 10,295 | ||||||
Furniture, equipment and vehicles | 22,804 | 29,563 | ||||||
Land, buildings and improvements | 117,926 | 102,898 | ||||||
| 2,411,612 | 2,278,935 | |||||||
Less: accumulated depreciation | (914,674 | ) | (776,263 | ) | ||||
Property and equipment, net | $ | 1,496,938 | $ | 1,502,672 | ||||
SBA COMMUNICATIONS CORPORATION AND SUBSIDIARIES
NOTES TO CONSOLIDATED FINANCIAL STATEMENTS
| As of | As of | |||||||
| December 31, 2011 | December 31, 2010 | |||||||
| (in thousands) | ||||||||
Towers and related components | $ | 2,587,897 | $ | 2,407,322 | ||||
Construction-in-process | 23,076 | 24,984 | ||||||
Furniture, equipment and vehicles | 29,711 | 24,045 | ||||||
Land, buildings and improvements | 168,988 | 143,445 | ||||||
|
|
|
| |||||
| 2,809,672 | 2,599,796 | |||||||
Less: accumulated depreciation | (1,226,279 | ) | (1,065,478 | ) | ||||
|
|
|
| |||||
Property and equipment, net | $ | 1,583,393 | $ | 1,534,318 | ||||
|
|
|
| |||||
Construction-in-process represents costs incurred related to towers that are under development and will be used in the Company’s operations.
Depreciation expense was $150.6$175.8 million, $133.7$161.4 million, and $114.8$150.6 million for the years ended December 31, 2009, 2008,2011, 2010, and 2007,2009, respectively. At December 31, 20092011 and 2008,2010, non-cash capital expenditures that are included in accounts payable and accrued expenses were $1.9$7.2 million and $2.7$4.7 million, respectively.
10. COSTS AND ESTIMATED EARNINGS IN EXCESS OF BILLINGS ON UNCOMPLETED CONTRACTS
| 10. | COSTS AND ESTIMATED EARNINGS IN EXCESS OF BILLINGS ON UNCOMPLETED CONTRACTS |
Costs and estimated earnings in excess of billings on uncompleted contracts consist of the following:
| As of | As of | |||||||||||||||
| As of December 31, 2009 | As of December 31, 2008 | December 31, 2011 | December 31, 2010 | |||||||||||||
| (in thousands) | (in thousands) | |||||||||||||||
Costs incurred on uncompleted contracts | $ | 32,567 | $ | 43,945 | $ | 37,790 | $ | 43,686 | ||||||||
Estimated earnings | 11,282 | 13,486 | 14,268 | 14,809 | ||||||||||||
Billings to date | (33,800 | ) | (47,132 | ) | (34,706 | ) | (41,728 | ) | ||||||||
|
| |||||||||||||||
| $ | 10,049 | $ | 10,299 | $ | 17,352 | $ | 16,767 | |||||||||
|
| |||||||||||||||
These amounts are included in the accompanying consolidated balance sheetsConsolidated Balance Sheets under the following captions:
| As of December 31, 2009 | As of December 31, 2008 | As of December 31, 2011 | As of December 31, 2010 | |||||||||||||
| (in thousands) | (in thousands) | |||||||||||||||
Costs and estimated earnings in excess of billings on uncompleted contracts | $ | 10,392 | $ | 10,658 | $ | 17,655 | $ | 17,775 | ||||||||
Billings in excess of costs and estimated earnings on uncompleted contracts | (343 | ) | (359 | ) | ||||||||||||
Other current liabilities (Billings in excess of costs and estimated earnings on uncompleted contracts) | (303 | ) | (1,008 | ) | ||||||||||||
|
| |||||||||||||||
| $ | 10,049 | $ | 10,299 | $ | 17,352 | $ | 16,767 | |||||||||
|
| |||||||||||||||
At December 31, 2009,2011, five significant customers comprised 83.2%91.4% of the costs and estimated earnings in excess of billings on uncompleted contracts, net of billings in excess of costs and estimated earnings, while at December 31, 2008,2010, five significant customers comprised 66.7%81.4% of the costs and estimated earnings in excess of billings on uncompleted contracts, net of billings in excess of costs and estimated earnings.
11. CONCENTRATION OF CREDIT RISKSBA COMMUNICATIONS CORPORATION AND SUBSIDIARIES
NOTES TO CONSOLIDATED FINANCIAL STATEMENTS
| 11. | CONCENTRATION OF CREDIT RISK |
The Company’s credit risks consist primarily of accounts receivable with national, regional and local wireless service providers and federal and state government agencies. The Company performs periodic credit evaluations of its customers’ financial condition and provides allowances for doubtful accounts, as required, based upon factors surrounding the credit risk of specific customers, historical trends and other information. The Company generally does not require collateral. The following is a list of significant customers (representing at least 10% of revenue for all periods reported) and the percentage of total revenue for the specified time periods derived from such customers:
| Percentage of Total Revenues For the year ended December 31, | ||||||||||||
| 2011 | 2010 | 2009 | ||||||||||
AT&T | 23.8 | % | 23.9 | % | 23.8 | % | ||||||
Sprint | 19.8 | % | 20.4 | % | 21.9 | % | ||||||
Verizon Wireless | 14.8 | % | 14.8 | % | 15.4 | % | ||||||
T-Mobile | 10.7 | % | 11.6 | % | 13.7 | % | ||||||
The Company’s site leasing, site development consulting and site development construction segments derive revenue from these customers. Client percentages of total revenue in each of the segments are as follows:
| 00.00 | 00.00 | 00.00 | ||||||||||
| Percentage of Site Leasing Revenues For the year ended December 31, | ||||||||||||
| 2011 | 2010 | 2009 | ||||||||||
AT&T | 26.8 | % | 28.0 | % | 27.7 | % | ||||||
Sprint | 22.3 | % | 23.6 | % | 25.3 | % | ||||||
Verizon Wireless | 15.5 | % | 15.4 | % | 16.0 | % | ||||||
T-Mobile | 11.2 | % | 11.7 | % | 11.8 | % | ||||||
| 00.00 | 00.00 | 00.00 | ||||||||||
| Percentage of Site Development Consulting Revenues For the year ended December 31, | ||||||||||||
| 2011 | 2010 | 2009 | ||||||||||
Verizon Wireless | 17.5 | % | 15.1 | % | 23.6 | % | ||||||
Nsoro Mastec, LLC | 9.1 | % | 13.4 | % | 9.3 | % | ||||||
T-Mobile | 8.5 | % | 6.0 | % | 13.9 | % | ||||||
SBA COMMUNICATIONS CORPORATION AND SUBSIDIARIES
NOTES TO CONSOLIDATED FINANCIAL STATEMENTS
| Percentage of Site Development Construction Revenues For the year ended December 31, | ||||||||||||
| 2011 | 2010 | 2009 | ||||||||||
Nsoro Mastec, LLC | 42.7 | % | 36.0 | % | 24.9 | % | ||||||
Ericsson, Inc. | 10.1 | % | 3.0 | % | 0.3 | % | ||||||
Verizon Wireless | 7.3 | % | 10.2 | % | 8.3 | % | ||||||
T-Mobile | 6.6 | % | 11.8 | % | 28.2 | % | ||||||
Five significant customers comprised 50.4% of total gross accounts receivable at December 31, 2011 compared to five significant customers which comprised 50.5% of total gross accounts receivable at December 31, 2010.
| 12. | ACCRUED EXPENSES |
The Company’s accrued expenses are comprised of the following:
| As of December 31, 2011 | As of December 31, 2010 | |||||||
| (in thousands) | ||||||||
Accrued earnouts | $ | 5,534 | $ | 3,263 | ||||
Salaries and benefits | 5,432 | 5,087 | ||||||
Real estate and property taxes | 5,557 | 6,001 | ||||||
Other | 7,223 | 7,078 | ||||||
|
|
|
| |||||
| $ | 23,746 | $ | 21,429 | |||||
|
|
|
| |||||
SBA COMMUNICATIONS CORPORATION AND SUBSIDIARIES
NOTES TO CONSOLIDATED FINANCIAL STATEMENTS
| 13. | DEBT |
The carrying value of debt consists of the following:
| As of December 31, 2011 | As of December 31, 2010 | |||||||
| (in thousands) | ||||||||
1.875% Convertible Senior Notes due 2013; principal balance of $535.0 million and $550.0 million as of December 31, 2011 and 2010, respectively | $ | 484,970 | $ | 463,970 | ||||
4.0% Convertible Senior Notes due 2014; principal balance of $500.0 million as of December 31, 2011 and December 31, 2010 | 397,612 | 368,463 | ||||||
8.0% Senior Notes due 2016; principal balance of $375.0 million as of December 31, 2011 and December 31, 2010 | 373,198 | 372,889 | ||||||
8.25% Senior Notes due 2019; principal balance of $375.0 million as of December 31, 2011 and December 31, 2010 | 372,365 | 372,128 | ||||||
4.254% Secured Tower Revenue Securities Series 2010-1 | 680,000 | 680,000 | ||||||
5.101% Secured Tower Revenue Securities Series 2010-2 | 550,000 | 550,000 | ||||||
2010 Senior Finance II Revolving Credit Facility | — | 20,000 | ||||||
Term Loan; principal balance of $497.5 million | 496,340 | — | ||||||
|
|
|
| |||||
Total debt | 3,354,485 | 2,827,450 | ||||||
Less: current maturities of long-term debt | (5,000 | ) | — | |||||
|
|
|
| |||||
Total long-term debt, net of current maturities | $ | 3,349,485 | $ | 2,827,450 | ||||
|
|
|
| |||||
The Company’s future principal payment obligations (based on the outstanding debt as of December 31, 2011 and assuming the 2010 Tower Securities are repaid at their respective ARD rates) are as follows:
| Principal | ||||
| (in thousands) | ||||
2012 | $ | 5,000 | ||
2013 | 540,000 | |||
2014 | 505,000 | |||
2015 | 685,000 | |||
2016 | 380,000 | |||
Therafter | 1,397,500 | |||
|
| |||
Total | $ | 3,512,500 | ||
|
| |||
The table below reflects cash and non-cash interest expense amounts recognized by debt instrument for the years ended December 31, 2011, 2010, and 2009:
| For the year ended December 31, | ||||||||||||||||||||||||
| 2011 | 2010 | 2009 | ||||||||||||||||||||||
| Cash Interest | Non-Cash Interest | Cash Interest | Non-Cash Interest | Cash Interest | Non-Cash Interest | |||||||||||||||||||
| (in thousands) | ||||||||||||||||||||||||
0.375% Convertible Senior Notes | $ | — | $ | — | $ | 46 | $ | 1,755 | $ | 195 | $ | 3,695 | ||||||||||||
1.875% Convertible Senior Notes | 10,090 | 33,844 | 10,313 | 31,511 | 10,313 | 28,704 | ||||||||||||||||||
4.0% Convertible Senior Notes | 20,000 | 29,149 | 20,000 | 25,643 | 13,767 | 15,838 | ||||||||||||||||||
8.0% Senior Notes | 30,000 | 309 | 30,000 | 285 | 13,083 | 117 | ||||||||||||||||||
8.25% Senior Notes | 30,938 | 237 | 30,938 | 218 | 13,492 | 90 | ||||||||||||||||||
2005 and 2006 CMBS Certificates | — | — | 16,430 | — | 74,641 | — | ||||||||||||||||||
2010 Tower Securities | 57,371 | — | 40,682 | — | — | — | ||||||||||||||||||
Term Loan | 9,705 | 90 | — | — | — | — | ||||||||||||||||||
Revolving Credit Facility | 3,209 | — | 1,903 | — | 3,756 | — | ||||||||||||||||||
Optasite Credit Facility | — | — | — | — | 1,831 | 824 | ||||||||||||||||||
Gain/Loss on Swap | — | — | — | 658 | — | 629 | ||||||||||||||||||
Capitalized Interest | (417 | ) | — | (391 | ) | — | (225 | ) | — | |||||||||||||||
|
|
|
|
|
|
|
|
|
|
|
| |||||||||||||
Total | $ | 160,896 | $ | 63,629 | $ | 149,921 | $ | 60,070 | $ | 130,853 | $ | 49,897 | ||||||||||||
|
|
|
|
|
|
|
|
|
|
|
| |||||||||||||
Credit Agreement
On February 11, 2010, SBA Senior Finance II, LLC (“SBA Senior Finance II”), an indirect wholly-owned subsidiary of the Company, entered into a credit agreement for a $500.0 million senior secured revolving credit facility (the “Revolving Credit Facility,” formerly referred to as the 2010 Credit Facility) with several banks and other financial institutions or entities from time to time parties to the credit agreement.
On June 30, 2011, SBA Senior Finance II entered into an Amended and Restated Credit Agreement (the “Credit Agreement”) with several banks and other financial institutions or entities from time to time parties to the Credit Agreement, to extend the maturity of the Revolving Credit Facility, to obtain a new $500.0 million senior secured term loan (the “Term Loan”), and to amend certain terms of the existing credit agreement. The Company incurred financing fees of $6.2 million in relation to this transaction. In addition, at the time of entering into the Credit Agreement, the remaining deferred financing fees balance of approximately $4.3 million related to the existing Credit Agreement prior to the amendment was transferred to the Revolving Credit Facility in accordance with accounting guidance for revolving credit facilities.
Revolving Credit Facility
The Revolving Credit Facility consists of a revolving loan under which up to $500.0 million aggregate principal amount may be borrowed, repaid and redrawn, subject to compliance with specific financial ratios and the satisfaction of other customary conditions to borrowing. Amounts borrowed under the Revolving Credit Facility accrue interest at the Eurodollar Rate plus a margin that ranges from 187.5 basis points to 237.5 basis points or at a Base Rate plus a margin that ranges from 87.5 basis points to 137.5 basis points, in each case based on the ratio of Consolidated Total Debt to Annualized Borrower EBITDA (calculated in accordance with the Credit Agreement). If not earlier terminated by SBA Senior Finance II, the Revolving Credit Facility will terminate on, and SBA Senior Finance II will repay all amounts outstanding on or before, June 30, 2016. The
SBA COMMUNICATIONS CORPORATION AND SUBSIDIARIES
NOTES TO CONSOLIDATED FINANCIAL STATEMENTS
| Percentage of Total Revenues for the year ended December 31, | |||||||||
| 2009 | 2008 | 2007 | |||||||
AT&T(1) | 23.8 | % | 23.1 | % | 22.9 | % | |||
Sprint(2) | 21.9 | % | 25.0 | % | 32.6 | % | |||
Verizon Wireless(3) | 15.4 | % | 15.6 | % | 13.6 | % | |||
T-Mobile | 13.7 | % | 11.2 | % | 7.5 | % | |||
The Company’s site leasing, site development consulting and site development construction segments derive revenue from these customers. Client percentages of total revenue in each of the segments are as follows: |
| ||||||||
| Percentage of Site Leasing Revenues for the year ended December 31, | |||||||||
| 2009 | 2008 | 2007 | |||||||
AT&T(1) | 27.7 | % | 27.6 | % | 28.0 | % | |||
Sprint(2) | 25.3 | % | 27.3 | % | 29.1 | % | |||
Verizon Wireless (3) | 16.0 | % | 15.7 | % | 14.4 | % | |||
T-Mobile | 11.8 | % | 10.7 | % | 8.4 | % | |||
| Percentage of Site Development Consulting Revenues for the year ended December 31, | |||||||||
| 2009 | 2008 | 2007 | |||||||
Verizon Wireless(3) | 23.6 | % | 24.2 | % | 17.5 | % | |||
T-Mobile | 13.9 | % | 7.6 | % | 0.4 | % | |||
Metro PCS | 5.8 | % | 13.3 | % | 3.9 | % | |||
Sprint(2) | 0.5 | % | 22.9 | % | 59.9 | % | |||
proceeds available under the Revolving Credit Facility may be used for general corporate purposes. A per annum commitment fee of 0.375% to 0.5% of the unused commitments under the Revolving Credit Facility is charged based on the ratio of Consolidated Total Debt to Annualized Borrower EBITDA (calculated in accordance with the Credit Agreement). SBA Senior Finance II may, from time to time, borrow from and repay the Revolving Credit Facility. Consequently, the amount outstanding under the Revolving Credit Facility at the end of a period may not be reflective of the total amounts outstanding during such period.
During the year ended December 31, 2011, SBA Senior Finance II borrowed $250.0 million under the Revolving Credit Facility. During the year ended December 31, 2010, SBA Senior Finance II borrowed $20.0 million under the Revolving Credit Facility. On June 30, 2011, the proceeds from the Term Loan were used to repay the existing $270.0 million balance on the Revolving Credit Facility and for general corporate purposes. Since the repayment the Company has not borrowed any amount under the Revolving Credit Facility.
As of December 31, 2011, the availability under the Revolving Credit Facility was approximately $500.0 million.
Term Loan
The Term Loan consists of a senior secured term loan in an aggregate principal amount of $500.0 million and matures on June 30, 2018. The Term Loan accrues interest, at SBA Senior Finance II’s election, at either the Base Rate plus a margin of 175 basis points (with a Base Rate floor of 2%) or Eurodollar Rate plus a margin of 275 basis points (with a Eurodollar Rate floor of 1%). The proceeds from the Term Loan were used to pay down the $270.0 million existing balance on the Revolving Credit Facility and may be used for general corporate purposes. Principal on the Term Loan will be repaid in quarterly installments of $1.25 million on the last day of each March, June, September and December, commencing on September 30, 2011. The remaining principal balance of the Term Loan will be due and payable on the maturity date. SBA Senior Finance II has the ability to prepay any or all amounts under the Term Loan. However, to the extent the Term Loan is prepaid prior to June 30, 2012 from the proceeds of a substantially concurrent issuance of certain other syndicated loans, a prepayment fee equal to 1.0% of the aggregate principal amount of such prepayment will apply. The Term Loan was issued at 99.75% of par value.
During the year ended December 31, 2011, SBA Senior Finance II made a repayment of $ 2.5 million on the Term Loan. As of December 31, 2011, the Term Loan had a principal balance of $ 497.5 million.
Terms of the Credit Agreement
The Credit Agreement, as amended, requires SBA Senior Finance II and SBA Communications Corporation (“SBAC”) to maintain specific financial ratios, including, at the SBA Senior Finance II level, (1) a ratio of Consolidated Total Debt to Annualized Borrower EBITDA not to exceed 6.0 times for any fiscal quarter, (2) a ratio of Consolidated Total Debt and Net Hedge Exposure (calculated in accordance with the Credit Agreement) to Annualized Borrower EBITDA for the most recently ended fiscal quarter not to exceed 6.0 times for 30 consecutive days and (3) a ratio of Annualized Borrower EBITDA to Annualized Cash Interest Expense (calculated in accordance with the Credit Agreement) of not less than 2.0 times for any fiscal quarter. In addition, SBAC’s ratio of Consolidated Total Net Debt to Consolidated Adjusted EBITDA (calculated in accordance with the Credit Agreement) for any fiscal quarter on an annualized basis cannot exceed 9.5 times. The Credit Agreement contains customary affirmative and negative covenants that, among other things, limit the ability of SBA Senior Finance II and its subsidiaries to incur indebtedness, grant certain liens, make certain investments, enter into sale leaseback transactions, merge or consolidate, make certain restricted payments, enter into transactions with affiliates, and engage in certain asset dispositions, including a sale of all or substantially all of their property. As of December 31, 2011, SBA Senior Finance II and SBAC were in compliance with the financial covenants contained in the Credit Agreement. The Credit Agreement is also subject to customary events of
SBA COMMUNICATIONS CORPORATION AND SUBSIDIARIES
NOTES TO CONSOLIDATED FINANCIAL STATEMENTS
| Percentage of Site Development Construction Revenues for the year ended December 31, | |||||||||
| 2009 | 2008 | 2007 | |||||||
T-Mobile | 28.2 | % | 15.8 | % | 5.8 | % | |||
Nsoro Mastec, LLC | 24.9 | % | 2.4 | % | 0.3 | % | |||
Metro PCS | 9.0 | % | 11.9 | % | 1.1 | % | |||
Verizon(3) | 8.3 | % | 12.3 | % | 7.4 | % | |||
Sprint(2) | 1.8 | % | 10.8 | % | 40.1 | % | |||
Five significant customers comprised 48.3% of total gross accounts receivable at December 31, 2009 compared to five significant customers which comprised 41.7% of total gross accounts receivable at December 31, 2008.
12. ACCRUED EXPENSES
The Company’s accrued expenses are comprised of the following:
| As of December 31, 2009 | As of December 31, 2008 | |||||
| (in thousands) | ||||||
Accrued earnouts | $ | 8,039 | $ | — | ||
Salaries and benefits | 4,819 | 3,956 | ||||
Real estate and property taxes | 5,674 | 7,734 | ||||
Other | 9,578 | 9,839 | ||||
| $ | 28,110 | $ | 21,529 | |||
SBA COMMUNICATIONS CORPORATION AND SUBSIDIARIES
NOTES TO CONSOLIDATED FINANCIAL STATEMENTS
13. DEBT
Debt consistsdefault. Pursuant to an Amended and Restated Guarantee and Collateral Agreement, amounts borrowed under the Revolving Credit Facility, the Term Loan and certain hedging transactions that may be entered into by SBA Senior Finance II or the Subsidiary Guarantors (as defined in the Credit Agreement) with lenders or their affiliates are secured by a first lien on the capital stock of SBA Telecommunications, Inc., SBA Senior Finance, LLC (formerly known as SBA Senior Finance, Inc.) and SBA Senior Finance II and on substantially all of the following:assets (other than leasehold, easement and fee interests in real property) of SBA Senior Finance II and the Subsidiary Guarantors.
| As of December 31, 2009 | As of December 31, 2008 | |||||||
| (as adjusted) | ||||||||
| (in thousands) | ||||||||
Commercial mortgage pass-through certificates, series 2005-1, secured. | ||||||||
Interest at fixed rates ranging from 5.369% to 6.706%. Paid off in July 2009. | $ | — | $ | 398,800 | ||||
Commercial mortgage pass-through certificates, series 2006-1, secured. | ||||||||
Interest at fixed rates ranging from 5.314% to 7.825%. Anticipated repayment date of November 9, 2011. | 940,609 | 1,090,747 | ||||||
0.375% Convertible Senior Notes due 2010. Principal balance of $30.4 million and $138.1 million as of December 31, 2009 and December 31, 2008, respectively. | 28,648 | 121,965 | ||||||
1.875% Convertible Senior Notes due 2013. Principal balance of $550.0 million as of December 31, 2009 and December 31, 2008. | 432,459 | 403,754 | ||||||
4.0% Convertible Senior Notes due 2014. Principal balance of $500.0 million as of December 31, 2009. | 342,820 | — | ||||||
8.0% Senior Notes due 2016. Principal balance of $375.0 million as of December 31, 2009. | 372,604 | — | ||||||
8.25% Senior Notes due 2019. Principal balance of $375.0 million as of December 31, 2009. | 371,910 | — | ||||||
Senior Credit Facility originated in January 2008. Maturity date of January 18, 2011. | — | 230,552 | ||||||
Optasite Credit Facility paid off and terminated in July 2009. Principal balance of $149.0 million as of December 31, 2008. | — | 146,412 | ||||||
Total debt | 2,489,050 | 2,392,230 | ||||||
Less: current maturities of long-term debt | (28,648 | ) | (6,000 | ) | ||||
Total long-term debt, net of current maturities | $ | 2,460,402 | $ | 2,386,230 | ||||
The Credit Agreement permits SBA Senior Finance II to request that one or more lenders (1) increase their proportionate share of the Revolving Credit Facility commitment up to an additional $200.0 million in the aggregate, and/or (2) provide SBA Senior Finance II with additional term loans in an aggregate principal amount of long-term debt maturing in each of the next five years is $30.4 million in 2010, $940.6 million in 2011, $0 in 2012, $550.0 million in 2013,up to $500.0 million, in 2014each case without requesting the consent of the other lenders. SBA Senior Finance II’s ability to request such increases in the Revolving Credit Facility or additional term loans is subject to its compliance with customary conditions set forth in the Credit Agreement including, with respect to any additional term loan, compliance, on a pro forma basis, with the financial covenants and $750.0 million thereafter.ratios set forth therein and an increase in the margin on existing term loans, to the extent required by the terms of the Credit Agreement. Upon SBA Senior Finance II’s request, each lender may decide, in its sole discretion, whether to increase all or a portion of its Revolving Credit Facility commitment or whether to provide SBA Senior Finance II with additional term loans and, if so, upon what terms.
The CMBS Certificates
Commercial Mortgage Pass-Through Certificates, Series 2005-1
On November 18, 2005, an indirect subsidiary of SBA Communications established a trust (the “Trust”), which sold in a private transaction, $405.0 million of 2005 CMBS Certificates, Series 2005-1 (the “2005 CMBS Certificates”).
The 2005 CMBS Certificates consisted of five classes with annual pass-through interest rates ranging from 5.369% to 6.706%. The weighted average annual fixed coupon interest rate of the 2005 CMBS Certificates was 5.6%, payable monthly, and the effective weighted average annual fixed interest rate was 4.8%, after giving effect to the settlement of two interest rate swap agreements entered into in contemplation of the transaction (see Note 14).
On July 28, 2009, the Company repaid the remaining principal balance of $380.2 million of the 2005 CMBS Certificates and paid $10.1 million for related prepayment consideration plus accrued interest and fees. During the year ended December 31, 2009, but prior to the payoff of the principal balance, the Company repurchased an
SBA COMMUNICATIONS CORPORATION AND SUBSIDIARIES
NOTES TO CONSOLIDATED FINANCIAL STATEMENTS
aggregate of $18.6 million, in principal amount of 2005 CMBS Certificates for $16.6 million in cash. The Company recorded in its Consolidated Statements of Operations for the year ended December 31, 2009 a $7.2 million net loss on the early extinguishment of debt. During 2008, the Company repurchased an aggregate of $6.2 million in principal amount of the 2005 CMBS Certificates for $5.5 million in cash. The Company recorded in its Consolidated Statements of Operations for the year ended December 31, 2008 a $0.7 million gain on early extinguishment of debt.
Commercial Mortgage Pass-Through Certificates Series 2006-1
On November 6, 2006, the Trusteea New York common law trust (the “Trust”), issued in a private transaction $1.15 billion of 2006 CMBS Certificates, Series 2006-1 (the “2006 CMBS Certificates” and collectively with the 2005 CMBS Certificates referred to as the “CMBS Certificates”).
Certificates. The 2006 CMBS Certificates consistconsisted of nine classessubclasses with annual pass-through interest rates ranging from 5.314% to 7.825%. The weighted average annual fixed coupon interest rate of the 2006 CMBS Certificates at December 31, 2009 was 5.9%, payable monthly, and the effective weighted average annual fixed interest rate was 6.2% after giving effect to the settlement of the nine interest rate swap agreements entered into in contemplation of the transaction (see Note 14). The
On April 16, 2010, the Company repaid the remaining principal balance of $938.6 million of the 2006 CMBS Certificates haveand paid $38.5 million for prepayment consideration plus accrued interest and fees. During the year-to-date period ended December 31, 2010, but prior to the payoff of the principal balance, the Company repurchased an anticipated repayment dateaggregate of $2.0 million in November 2011 withprincipal amount of 2006 CMBS Certificates for $2.1 million in cash. The Company recorded on the Company’s Consolidated Statements of Operations a final repayment date in 2036.$49.0 million loss on extinguishment of debt related to the repurchases and prepayment during the year ended December 31, 2010.
During the year ended 2009, the Company repurchased an aggregate of $150.1 million in principal amount of 2006 CMBS Certificates for $150.5 million in cash. The Company recorded in its Consolidated Statements of Operations for the year ended December 31, 2009 a $2.7 million loss on the early extinguishment of debt. During 2008, the Company repurchased an aggregate of $59.3 million in principal amount of 2006 CMBS Certificates for $39.8 million in cash and recorded in its Consolidated Statements of Operationsdebt for the year ended December 31, 2008 a $18.22009.
Secured Tower Revenue Securities Series 2010
On April 16, 2010, the Trust issued $680.0 million gain on early extinguishment of debt.
Subsequent to December 31, 2009,2010-1 Tower Securities and $550.0 million of 2010-2 Tower Securities. The 2010-1 Tower Securities have an annual interest rate of 4.254% and the 2010-2 Tower Securities have an annual interest rate of 5.101%. The weighted average annual fixed coupon interest rate of the 2010 Tower Securities is 4.7%, including borrowers’ fees, payable monthly. The anticipated repayment date and the final maturity date for the 2010-1 Tower Securities is April 16, 2015 and April 16, 2040, respectively. The anticipated repayment date and the final maturity date for the 2010-2 Tower Securities is April 16, 2017 and April 16, 2042, respectively. The Company repurchased an aggregateincurred deferred financing fees of $2.0approximately $17.9 million in principal amountrelation to this transaction
SBA COMMUNICATIONS CORPORATION AND SUBSIDIARIES
NOTES TO CONSOLIDATED FINANCIAL STATEMENTS
which are being amortized through the anticipated repayment date of each of the 2010 Tower Securities. Net proceeds from the 2010 Tower Securities were used to repay in full the outstanding 2006 CMBS Certificates in the amount of $938.6 million and pay the related prepayment consideration plus accrued interest and fees. The remaining net proceeds were used for $2.1 million in cash.general corporate purposes.
The assetssole asset of the Trust which issued both the 2005 CMBS Certificates and the 2006 CMBS Certificates, consistconsists of a non-recourse mortgage loan initially made in favor of SBA Properties as the initial borrower. In connection with the issuance of the 2006 CMBS Certificates, each of SBA Sites, Inc., SBA Structures, Inc., SBA Towers, Inc., SBA Puerto Rico, Inc. and SBA Towers USVI, Inc. were added as additional borrowers under the mortgage loan and the principal amount of the mortgage loan was increased by $1.15 billion to an aggregate of $1.56 billion.
On July 28, 2009, in connection with the repayment of the 2005 CMBS Certificates, SBA Towers, Inc., SBA Puerto Rico, Inc. and SBA Towers USVI, Inc. were released from their obligations under the mortgage loan underlying the CMBS Certificates. Effective July 28, 2009, SBA Properties, Inc., SBA Sites, Inc., and SBA Structures, Inc., indirect wholly-owned operating subsidiaries of the Company (the “Borrowers”) were the remaining borrowers under the mortgage loan and the mortgage loan is to be paid from the operating cash flows from the aggregate 3,746 tower sites owned by the Borrowers (the “CMBS Towers”). Subject to certain limited exceptions described below, no payments of principal will be required to be made in relation to the components of the mortgage loan corresponding to the 2006 CMBS Certificates prior to November 2011, which is the anticipated repayment date for the remaining components of the mortgage loan. The Borrowers are special purpose vehicles which exist solely to hold the towers which are subject to the securitization. In connection with the issuance of the 2010 Tower Securities and the repayment of the 2006 CMBS Certificates, the mortgage loan components relating to the 2006 CMBS Certificates were repaid and the mortgage loan was amended to create two new loan components, each with terms that are identical to the series of 2010 Tower Securities to which it relates. The Borrowers are jointly and severally liable for all obligations under the mortgage loan.
SBA COMMUNICATIONS CORPORATION AND SUBSIDIARIES
NOTES TO CONSOLIDATED FINANCIAL STATEMENTS
The mortgage loan consistsunderlying the 2010 Tower Securities will be paid from the operating cash flows from the aggregate 3,670 tower sites owned by the Borrowers. The mortgage loan is secured by (i) mortgages, deeds of multiple tranches,trust and deeds to secure debt on a substantial portion of the tower sites, (ii) a security interest in substantially all of the Borrowers’ personal property and fixtures, (iii) the Borrowers’ rights under certain tenant leases, and (iv) all of the proceeds of the foregoing. For each calendar month, SBA Network Management, Inc., the Company’s indirect subsidiary, is entitled to receive a management fee equal to 7.5% of the Borrowers’ operating revenues for the immediately preceding calendar month.
The Borrowers may prepay either of the mortgage loan components, in whole or components, eachin part, with no prepayment consideration, (i) within nine months of which has terms that are identical to the subclassanticipated repayment date of CMBS Certificates to which it relates. Any time prior to November 2011,such mortgage loan component, (ii) with proceeds received as a result of any condemnation or casualty of any tower site owned by the Borrowers or (iii) during an amortization period. In all other circumstances, the Borrowers may prepay the mortgage loan, in whole or in part, for the components of the mortgage loan corresponding to the 2006 CMBS Certificates upon payment of the applicable prepayment consideration. The prepayment consideration is determined perbased on the class of 2010 Tower Securities to which the prepaid mortgage loan component corresponds and consists of an amount equal to the excess, if any, of (1) the present value associated with the portion of the principal balance being prepaid, calculated in accordance with the formula set forth in the mortgage loan agreement, on the date of prepayment of all future installments of principal and interest required to be paid from the date of prepayment to and including the first due date that is nine months prior to the anticipated repayment date assuming the entire unpaid principal amount of such class is required to be paid, over (2) that portion of the principal balance of such class prepaid on the date of such prepayment. If
To the prepayment occurs (i) within nine months of the anticipated repayment date, (ii) with proceeds received as a result of any condemnation or casualty of the Borrowers’ sites or (iii) during an amortization period, no prepayment consideration is due. The entire unpaid principal balance ofextent that the mortgage loan components corresponding to the 2006 CMBS Certificates will be due in November 2036. However, to the extent that the full amount of the mortgage loan component corresponding to the 2006 CMBS Certificates2010 Tower Securities are not fully repaid by their respective anticipated repayment dates, the interest rate of each such component wouldwill increase by the greater of (i) 5% orand (ii) the amount, if any, by which the sum of (x) the ten-year U.S. treasury rate plus (y) the credit-based spread for such component (as set forth in the mortgage loan agreement) plus (z) 5%, exceeds the original interest rate for such component.
The mortgage loan is secured by (1) mortgages, deeds of trust and deedsPursuant to secure debt on substantially allthe terms of the CMBS tower sites and their operating cash flows, (2) a security interest in substantially all of the Borrowers’ personal property and fixtures, (3) the Borrowers’ rights under the management agreement they entered into with SBA Network Management, Inc. (“SBA Network Management”), relating to the management of the Borrowers’ tower sites by SBA Network Management pursuant to which SBA Network Management arranges for the payment of all operating expenses and the funding of all capital expenditures out of amounts on deposit in one or more operating accounts maintained on the Borrowers’ behalf, (4) the Borrowers’ rights under certain site management agreements, (5) the Borrowers’ rights under certain tenant leases, (6) the pledge by SBA CMBS-1 Guarantor, LLC and SBA CMBS-1 Holdings, LLC of equity interests of the initial borrower and SBA CMBS-1 Guarantor, LLC, (7) the various deposit accounts and collection accounts of the Borrowers and (8) all proceeds of the foregoing. For each calendar month, SBA Network Management is entitled to receive a management fee equal to 7.5% of the Borrowers’ operating revenues for the immediately preceding calendar month.
In connection with the issuance of the CMBS Certificates, the Company established a deposit account into which2010 Tower Securities, all rents and other sums due on any of the CMBS Towerstower sites owned by the Borrowers are directly deposited by the lessees into a controlled deposit account and are held by the indenture trustee. The monies held by the indenture trustee after the release date areis classified as restricted cash on the Company’s Consolidated Balance Sheets (see Note 6)5). However, if the debt service coverage ratio,Debt Service Coverage Ratio, defined as the net cash flow (as defined in the Mortgage Loan Agreement)mortgage loan agreement) divided by the amount of interest on the mortgage loan, servicing fees and trustee fees that the Borrowers will beare required to pay over the succeeding twelve months, as of the end of any calendar quarter, falls to 1.30 times1.30x or lower, then all cash flow in excess of amounts required to make debt service payments, to fund required reserves, to pay management fees and budgeted operating expenses and to make other payments required under the loan documents, referred to as “excess cash flow,” will be deposited into a reserve account instead of being released to the Borrowers. The funds in the reserve account will not be released to the Borrowers unless the debt service coverage ratioDebt Service Coverage Ratio exceeds 1.30 times1.30x for
SBA COMMUNICATIONS CORPORATION AND SUBSIDIARIES
NOTES TO CONSOLIDATED FINANCIAL STATEMENTS
two consecutive calendar quarters. If the debt service coverage ratioDebt Service Coverage Ratio falls below 1.15 times1.15x as of the end of any calendar quarter, then an “amortization period” will commence and all funds on deposit in the reserve account will be applied to prepay the mortgage loan until such time that the debt service coverage ratioDebt Service Coverage Ratio exceeds 1.15 times1.15x for a calendar quarter. The mortgage loan agreement, as amended, also includes covenants customary for mortgage loans subject to rated securitizations. Among other things, the Borrowers are prohibited from incurring other indebtedness for borrowed money or further encumbering their assets. As of December 31, 2009,2011, the Borrowers met the required debt service coverage ratio as defined by the mortgage loan agreement.
SBA COMMUNICATIONS CORPORATION AND SUBSIDIARIESDebt Service Coverage Ratio and were in compliance with all other covenants.
NOTES TO CONSOLIDATED FINANCIAL STATEMENTS
0.375% Convertible Senior Notes due 2010
On March 26, 2007, the Company issued $350.0 million of its 0.375% Convertible Senior Notes (the “0.375% Notes”). Interest is payable semi-annually on June 1 and December 1. The 0.375% Notes have a maturity date of December 1, 2010. The Company incurred fees of $8.6 million with the issuance of the 0.375% Notes of which $6.8 million was recorded as deferred financing fees and $1.8 million was recorded as a reduction of shareholders’ equity.
The 0.375% Notes are convertible, at the holder’s option, into shares of the Company’s Class A common stock, at an initial conversion rate of 29.7992 shares of Class A common stock per $1,000 principal amount of 0.375% Notes (subject to certain customary adjustments), which is equivalent to an initial conversion price of approximately $33.56 per share or a 19% conversion premium based on the last reported sale price of $28.20 per share of Class A common stock on the Nasdaq Global Select Market on March 20, 2007, the purchase agreement date. The 0.375% Notes are convertible only under the following certain circumstances: (1) during any calendar quarter commencing at any time after June 30, 2007 and only during such calendar quarter, if the last reported sale price of the Company’s Class A common stock for at least 20 trading days in the 30 consecutive trading day period ending on the last trading day of the preceding calendar quarter is more than 130% of the applicable conversion price per share of Class A common stock on the last day of such preceding calendar quarter, (2) during the five business day period after any ten consecutive trading day period in which the trading price of a 0.375% Note for each day in the measurement period was less than 95% of the product of the last reported sale price of Class A common stock and the applicable conversion rate, (3) if specified distributions to holders of Class A common stock are made or specified corporate transactions occur, and (4) at any time on or after October 12, 2010.
Upon conversion, the Company has the right to settle the conversion of each $1,000 principal amount of 0.375% Notes with any of the three following alternatives, at its option, delivery of (1) 29.7992 shares of the Company’s Class A common stock, (2) cash equal to the value of 29.7992 shares of the Company’s Class A common stock calculated at the market price per share of the Company’s Class A common stock at the time of conversion or (3) a combination of cash and shares of our Class A common stock.
The net proceeds from this offering were approximately $341.4 million after deducting discounts, commissions and expenses. A portion of the net proceeds from the sale of the 0.375% Notes was used to repurchase approximately 3.24 million shares of Class A common stock, valued at approximately $91.2 million based on the closing stock price of $28.20 on March 20, 2007. These repurchased shares were immediately retired by the Company. The repurchased shares were recorded as a reduction to Class A common stock for the par value of the Class A common stock as well as an increase to accumulated deficit on the Company’s Consolidated Balance Sheet.
Concurrently with the sale of the 0.375% Notes, the Company entered into convertible note hedge transactions with affiliates of two of the initial purchasers of the 0.375% Notes. The initial strike price of the convertible note hedge transactions is $33.56 per share of the Company’s Class A common stock (the same as the initial conversion price of the 0.375% Notes) and is similarly subject to certain customary adjustments. The convertible note hedge transactions cover 10,429,720 shares of Class A common stock. The cost of the convertible note hedge transactions was $77.2 million. A portion of the net proceeds from the sale of the 0.375% Notes and the warrants discussed below were used to pay for the cost of the convertible note hedge transactions. The cost of the convertible note hedge transactions was recorded as a reduction to additional paid-in capital on the Company’s Consolidated Balance Sheet.
Separately and concurrently with entering into the convertible note hedge transactions, the Company entered into warrant transactions whereby the Company sold warrants to each of the hedge counterparties to acquire 10,429,720 shares of Class A common stock at an initial exercise price of $55.00 per share. The aggregate
SBA COMMUNICATIONS CORPORATION AND SUBSIDIARIES
NOTES TO CONSOLIDATED FINANCIAL STATEMENTS
proceeds from the issuance of the warrants were $27.3 million. The proceeds for the issuance of the warrants were recorded as an increase to additional paid-in capital on the Company’s Consolidated Balance Sheet.
During the year ended December 31, 2009, the Company consummated privately negotiated exchanges of the 0.375% Notes for Class A common stock in reliance on Section 3(a)(9) of the Securities Act of 1933, as amended. Pursuant to these exchanges, the Company issued approximately 618,000 shares of the Company’s Class A common stock in exchange for $12.5 million in principal amount of 0.375% Notes. In addition, the Company also repurchased an aggregate of $95.2 million in principal amount of 0.375% Notes for $90.6 million in cash. The Company recorded a gain on the early extinguishment of debt of $6.1 million and a net reduction to additional paid in capital of $0.6 million related to these transactions.
During the year ended December 31, 2008, the Company consummated privately negotiated exchanges of the 0.375% Notes for Class A common stock in reliance on Section 3(a)(9) of the Securities Act of 1933, as amended. During the fourth quarter of 2008, the Company issued approximately 3,407,914 shares of the Company’s Class A common stock in exchange for $73.8 million in principal amount of 0.375% Notes. In addition, the Company also repurchased an aggregate of $138.1 million in principal amount of 0.375% Notes for $102.5 million in cash. The Company recorded a gain on the early extinguishment of debt of $25.7 million and a net increase to additional paid in capital of $54.3 million related to these transactions.
In April 2009, the Company also terminated the portion of the convertible note hedge and warrant transactions that it entered into in March 2007 with respect to its 0.375% Notes which related to the $264.1 million principal amount of 0.375% Notes that the Company previously repurchased for cash or stock. The Company received a net settlement of approximately 546,000 shares from the counterparties of the hedge and warrant transactions.
The Company is amortizing the debt discount on the 0.375% Notes utilizing the effective interest method over the life of the 0.375% Notes which increases the effective interest rate of the 0.375% Notes from its coupon rate of 0.375% to 6.9%. The Company incurred cash interest expense of $0.2 million, $1.2 million and $1.0 million for the years ended December 31, 2009, 2008 and 2007, respectively. The Company recorded non-cash interest expense of $3.7 million, $17.2 million and $14.0 million for the years ended December 31, 2009, 2008 and 2007, respectively. As of December 31, 2009, the carrying amount of the equity component related to the 0.375% Notes was $60.1 million.
The maturity date of the 0.375% Notes is December 1, 2010, as such, the Notes are reflected in current maturities of long-term debt in the Company’s Consolidated Balance Sheets at carrying value. The following table summarizes the balances for the 0.375% Notes:
| As of December 31, 2009 | As of December 31, 2008 | |||||||
| (as adjusted) | ||||||||
| (in thousands) | ||||||||
Principal balance | $ | 30,403 | $ | 138,149 | ||||
Debt discount | (1,755 | ) | (16,184 | ) | ||||
Carrying value | $ | 28,648 | $ | 121,965 | ||||
SBA COMMUNICATIONS CORPORATION AND SUBSIDIARIES
NOTES TO CONSOLIDATED FINANCIAL STATEMENTS
1.875% Convertible Senior Notes due 2013
On May 16, 2008, the Company issued $550.0 million of its 1.875% Convertible Senior Notes (the “1.875% Notes”). Interest is payable semi-annually on May 1 and November 1. The 1.875% Notes have a maturity date of May 1, 2013. The Company incurred fees of $12.9 million with the issuance of the 1.875% Notes of which $9.1 million was recorded as deferred financing fees and $3.8 million was recorded as a reduction of shareholders’ equity.
The 1.875% Notes are convertible, at the holder’s option, into shares of the Company’sour Class A common stock, at an initial conversion rate of 24.1196 shares of Class A common stock per $1,000 principal amount of 1.875% Notes (subject to certain customary adjustments), which is equivalent to an initial conversion price of approximately $41.46 per share or a 20% conversion premium based on the last reported sale price of $34.55 per share of Class A common stock on the Nasdaq Global Select Market on May 12, 2008, the purchase agreement date. The 1.875% Notes are convertible only under the following certain circumstances: (1) during any calendar quarter commencing at any time after June 30, 2008 and only during such calendar quarter, if the last reported sale price of the Company’s Class A common stock for at least 20 trading days during the 30 consecutive trading days ending on the last trading day of the preceding calendar quarter is more than 130% of the applicable conversion price per share of the Company’s Class A common stock on the last trading day of such preceding calendar quarter, (2) during the five business day period after any ten consecutive trading day period in which the trading price per $1,000 principal amount of 1.875% Notes for each day in the measurement period was less than 95% of the product of the last reported sale price of the Company’s Class A common stock and the applicable conversion rate, (3) if specified distributions to holders of the Company’s Class A common stock are made or specified corporate transactions occur, and (4) at any time on or after February 19, 2013.
Upon conversion, the Company has the right to settle the conversion of each $1,000 principal amount of 1.875% Notes with any of the three following alternatives, at its option: delivery of (1) 24.1196 shares of the Company’s Class A common stock, (2) cash equal to the value of 24.1196 shares of the Company’s Class A common stock calculated at the market price per share of the Company’s Class A common stock at the time of conversion or (3) a combination of cash and shares of the Company’s Class A common stock.
The net proceeds from this offering were approximately $536.8 million after deducting discounts, commissions and expenses. A portion of the net proceeds from the sale of the 1.875% Notes was used to repurchase and retire approximately 3.47 million shares of Class A common stock, valued at $120.0 million based on the closing stock price of $34.55 on May 12, 2008. The repurchased shares were recorded as a reduction to Class A common stock for the par value of the Class A common stock as well as an increase to accumulated deficit on the Company’s Consolidated Balance Sheets.
Concurrently with the pricing of the 1.875% Notes, the Company entered into convertible note hedge transactions and warrant transactions with affiliates of fourcertain of the initial purchasers of the 1.875% Notes.convertible notes. The initial strike price of the convertible note hedge transactions relating to the 1.875% Notes is $41.46 per share of the Company’s Class A common stock (the same as the initial conversion price of the 1.875% Notes)convertible notes) and the initial exercise price of the warrants is similarly subject to certain customary adjustments. The$67.37 per share. Although the Company initially entered into convertible note hedge and warrant transactions originally covered 13,265,780 shares of Class A common stock. The costto cover the full amount of the convertible note hedge transactions was $137.7 million. A portion of the net proceeds from the saleshares that were issuable upon conversion of the 1.875% Notes, and the warrant transactions discussed below were used to pay for the costas a result of the convertible note hedge transactions. The costbankruptcy of the convertible note hedge transactions was recorded as a reduction to additional paid-in capital on the Company’s Consolidated Balance Sheets.
Separately and concurrently with entering into the convertible note hedge transactions, the Company entered into warrant transactions whereby the Company sold warrants to each of the hedge counterparties to acquire an aggregate of 13,265,780 shares of Class A common stock at an initial exercise price of $67.37 per share. The
SBA COMMUNICATIONS CORPORATION AND SUBSIDIARIES
NOTES TO CONSOLIDATED FINANCIAL STATEMENTS
aggregate proceeds from the warrant transactions were $56.2 million. The proceeds from issuance of the warrants were recorded as an increase to additional paid-in capital on the Company’s Consolidated Balance Sheets.
One of the convertible note hedge transactions entered into in connection with the 1.875% Notes was with Lehman Brothers OTC Derivatives Inc. (“Lehman Derivatives”). The, on November 7, 2008, the Company terminated the convertible note hedge transaction with Lehman Derivatives coverswhich covered 55% of the 13,265,780 shares of the Company’s Class A common stock potentially issuable upon conversion of the 1.875% Notes. In October 2008, Lehman Derivatives filed a motion for protection under Chapter 11 of the United States Bankruptcy Code. The filing by Lehman Derivatives of a voluntary Chapter 11 bankruptcy petition constituted an “event of default” under the convertible note hedge transaction with Lehman Derivatives. As a result, on November 7, 2008 the Company terminated the convertible note hedge transaction with Lehman Derivatives. Based on information available to the Company, there is no indication, as of the date of filing this Form 10-K, that any party other than Lehman Derivatives would be unable to fulfill their obligations under the convertible note hedge transactions.
The net cost of the convertible note hedge transaction with Lehman Derivatives was recorded as an adjustment to additional paid in capital and therefore the “event of default” did not have any impact on the Company’s financial position or results of operations. However, the Company could incur significant costs to replace this hedge transaction if it elects to do so. IfConsequently, the Company does not electcurrently have a hedge with respect to replacethose shares and, to the convertible note hedge transaction, thenextent that the Company would be subject to potential dilution or additional cost (depending on if the note is settled with shares or cash) upon conversion of the 1.875% Notes, if on the date of conversion the per share market price of the Company’s Class A common stock exceededexceeds $41.46 per share upon conversion of the notes, the Company will be subject to dilution or if the Company settles in cash, additional costs, upon conversion price of $41.46.that portion of the 1.875% Notes.
During the year ended December 31, 2011, a wholly owned subsidiary of the Company purchased an aggregate of $15.0 million in principal amount of the 1.875% Notes for $17.0 million in cash. As of December 31, 2011, the Company had $535.0 million of 1.875% Notes outstanding.
The 1.875% Notes are reflected in long-term debt in the Company’s Consolidated Balance Sheets at carrying value. The following table summarizes the balances for the 1.875% Notes:
| As of December 31, 2011 | As of December 31, 2010 | |||||||
| (in thousands) | ||||||||
Principal balance | $ | 535,000 | $ | 550,000 | ||||
Debt discount | (50,030 | ) | (86,030 | ) | ||||
|
|
|
| |||||
Carrying value | $ | 484,970 | $ | 463,970 | ||||
|
|
|
| |||||
The Company is amortizing the debt discount on the 1.875% Notes utilizing the effective interest method over the life of the 1.875% Notes which increases the effective interest rate of the 1.875% Notes from its coupon rate of 1.875% to 9.4%. The Company incurred cash interest expense of $10.3 million and $6.5 million for each of the years ended December 31, 2009 and 2008, respectively and non-cash interest expense of $28.7 million and $16.8 million for the years ended December 31, 2009 and 2008, respectively. As of December 31, 2009,2011, the carrying amount of the equity component related to the 1.875% Notes was $159.2$156.6 million.
The 1.875% Notes are reflected in long-term debt in the Company’s Consolidated Balance Sheets at carrying value. The following table summarizes the balances for the 1.875% Notes:
SBA COMMUNICATIONS CORPORATION AND SUBSIDIARIES
NOTES TO CONSOLIDATED FINANCIAL STATEMENTS
| As of December 31, 2009 | As of December 31, 2008 | |||||||
| (as adjusted) | ||||||||
| (in thousands) | ||||||||
Principal balance | $ | 550,000 | $ | 550,000 | ||||
Debt discount | (117,541 | ) | (146,246 | ) | ||||
Carrying value | $ | 432,459 | $ | 403,754 | ||||
4.0% Convertible Senior Notes due 2014
On April 24, 2009, the Company issued $500.0 million of its 4.0% Convertible Senior Notes (“4.0% Notes”) in a private placement transaction. Interest on the 4.0% Notes is payable semi-annually on April 1 and October 1. The maturity date of the 4.0% Notes is October 1, 2014. The Company incurred fees of $11.7 million with the issuance of the 4.0% Notes of which $7.7 million was recorded as deferred financing fees and $4.0 million was recorded as a reduction to shareholders’ equity.
Concurrently with the pricing of the 4.0% Notes, the Company entered into convertible note hedge transactions and warrant transactions with affiliates of certain of the initial purchasers of the convertible notes. The initial strike price of the convertible note hedge transactions relating to the 4.0% Notes is $30.38 per share of the Company’s Class A common stock (the same as the initial conversion price of the 4.0% Notes) and the upper strike price of the warrant transactions is $44.64 per share.
SBA COMMUNICATIONS CORPORATION AND SUBSIDIARIES
NOTES TO CONSOLIDATED FINANCIAL STATEMENTS
The 4.0 % Notes are reflected in long-term debt in the Company’s Consolidated Balance Sheets at carrying value. The following table summarizes the balances for the 4.0% Notes:
| As of December 31, 2011 | As of December 31, 2010 | |||||||
| (in thousands) | ||||||||
Principal balance | $ | 500,000 | $ | 500,000 | ||||
Debt discount | (102,388 | ) | (131,537 | ) | ||||
|
|
|
| |||||
Carrying value | $ | 397,612 | $ | 368,463 | ||||
|
|
|
| |||||
The Company is amortizing the debt discount on the 4.0% Notes are convertible, atutilizing the holder’s option, into shareseffective interest method over the life of the Company’s Class A common stock, at an initial conversion4.0% Notes which increases the effective interest rate of 32.9164 sharesthe 4.0% Notes from its coupon rate of Class A common stock per $1,000 principal4.0% to 13.0%. As of December 31, 2011, the carrying amount of the equity component related to the 4.0% Notes (subject to certain customary adjustments), which is equivalent to an initialwas $169.0 million.
Convertible Senior Notes conversion price of approximately $30.38 per share or a 22.5% conversion premium based on the last reported sale price of $24.80 per share of the Company’s Class A common stock on the Nasdaq Global Select Market on April 20, 2009, the purchase agreement date. options
The 1.875% Notes and 4.0% Notes (collectively “the Notes”) are convertible only under the following circumstances: (1)
during any calendar quarter commencing at any time after June 30, 2009 and only during such calendar quarter, if the last reported sale price of the Company’sour Class A common stock for at least 20 trading days in the 30 consecutive trading day period ending on the last trading day of the preceding calendar quarter is more than 130% of the applicable conversion price per share of Class A common stock on the last day of such preceding calendar quarter; (2) quarter,
during the five business day period after any 10ten consecutive trading day period (the “measurement period”) in which the trading price per $1,000 principal amount of notesthe Notes for each day in the measurement period was less than 95% of the product of the last reported sale price of the Company’s Class A common stock and the applicable conversion rate; (3) rate,
if specified distributions to holders of the Company’s Class A common stock are made or specified corporate transactions occur; or (4) occur, and
at any time on or after February 19, 2013 for the 1.875% Notes and July 22, 2014. 2014 for the 4.0% Notes.
Upon conversion, the Company has the right to settle its conversion obligation in cash, shares of Class A common stock or a combination of cash and shares of its Class A common stock. From time to time, upon notice to the holders of the 4.0% Notes, the Company may change its election regarding the form of consideration that the Companyit will use to settle its conversion obligation; provided, however, that the Company is not permitted to change its settlement election after February 18, 2013 for the 1.875% Notes and July 21, 2014.
The net proceeds of this offering were approximately $488.2 million after deducting discounts, commissions and expenses. Contemporaneously with the closing of the sale of the 4.0% Notes, a portion of the net proceeds from the sale of the 4.0% Notes was used to repurchase 2.0 million shares of the Company’s Class A common stock, valued at $50.0 million based on the closing stock price of $24.80 on April 20, 2009. These repurchased shares were immediately retired by the Company. The repurchased shares will be recorded as a reduction to Class A common stock for the par value of the Class A common stock as well as an increase to accumulated deficit.
Concurrently with the pricing of the 4.0% Notes, the Company entered into convertible note hedge transactions whereby the Company purchased from affiliates of certain of the initial purchasers of the 4.0% Notes an option covering 16,458,196 shares of its Class A common stock at an initial strike price of $30.38 per share (the same as the initial conversion price of the notes). Separately and concurrently with the pricing of the 4.0% Notes, the Company entered into warrant transactions whereby it sold to affiliates of certain of the initial purchasers of the 4.0% Notes warrants to acquire 16,458,196 shares of its Class A common stock at an initial price of $44.64 per share. The Company used approximately $61.6 million of the net proceeds from the 4.0% Notes offering plus the proceeds from the warrant transactions to fund the cost of the convertible note hedge transactions. The convertible note hedge transactions and the warrant transactions, taken as a whole, effectively increase the conversion price of the 4.0% Notes from $30.38 per share to $44.64 per share, reflecting a premium of 80% based on the closing stock price of $24.80 per share of the Company’s Class A common stock on April 20, 2009. The remaining net proceeds of $376.6 million were used for general corporate purposes, including repurchases or repayments of the Company’s outstanding debt.
The Company is amortizing the debt discount on the 4.0% Notes utilizing the effective interest method over the life of the 4.0% Notes which increases the effective interest rate of the 4.0% Notes from its coupon rate of 4.0% to 13.0%. The Company incurred cash interest expense of $13.8 million for the year ended December 31, 2009 and non-cash interest expense of $15.8 million for the year ended December 31, 2009. As of December 31, 2009, the carrying amount of the equity component related to the 4.0% Notes was $169.0 million.
SBA COMMUNICATIONS CORPORATION AND SUBSIDIARIES
NOTES TO CONSOLIDATED FINANCIAL STATEMENTS
The 4.0% Notes are reflected in long-term debt in the Company’s Consolidated Balance Sheets at carrying value. The following table summarizes the balances2014 for the 4.0% Notes:Notes.
| As of December 31, 2009 | ||||
| (in thousands) | ||||
Principal balance | $ | 500,000 | ||
Debt discount | (157,180 | ) | ||
Carrying value | $ | 342,820 | ||
Senior Notes
On July 24, 2009, the Company’s wholly-owned subsidiary, SBA Telecommunications, Inc. (“Telecommunications”), issued $750$750.0 million of unsecured senior notes (“Senior(the “Senior Notes”), $375$375.0 million of which are due August 15, 2016 (“2016(the “2016 Notes”) and $375$375.0 million of which are due August 15, 2019 (“2019(the “2019 Notes”). The 2016 Notes have an interest rate of 8.00% and were issued at a price of 99.330% of their face value. The 2019 Notes have an interest rate of 8.25% and were issued at a price of 99.152% of their face value. Interest on the 2016 Notes and 2019 Notes is due semi-annually on February 15 and August 15 of each year beginning on February 15, 2010. The Company incurred deferred financing fees of approximately $16.5 million in relation to this transaction which are being amortized through the anticipated repayment date of each of the Senior Notes. Net proceeds of this offering were $727.9$727.8 million after deducting expenses and the original issue discount.
Telecommunications used the net proceeds from this offering to repay the 2005 CMBS Certificates issued by its subsidiary and the related prepayment consideration, repay and terminate the Optasite Credit Facility and repay the outstanding balance under the Senior Credit Facility and repay and terminate the Optasite Credit Facility. Telecommunications also intends to repurchase prior to maturity or repay at maturity SBA’s outstanding 0.375% Notes. The remaining net proceeds are beingwere used for general corporate purposes.
The 2016 Notes and the 2019 Notes are subject to redemption in whole or in part on or after August 15, 2012 and on or after August 15, 2014, respectively, at the redemption prices set forth in the indenture agreement plus accrued and unpaid interest. Prior to August 15, 2012 for the 2016 Notes and August 15, 2014 for the 2019 Notes, Telecommunications may at its option redeem all or a portion of the 2016 Notes or 2019 Notes at a redemption price equal to 100% of the principal amount thereof plus a “make whole” premium plus accrued and unpaid interest. In addition, Telecommunications may redeem up to 35% of the originally issued aggregate principal amount of each of the 2016 Notes and 2019 Notes with the net proceeds of certain equity offerings at a redemption price of 108.000%108.00% and 108.250%108.25%, respectively, of the principal amount of the redeemed notes plus accrued and unpaid interest.
The Company is amortizing the debt discount on the 2016 Notes and the 2019 Notes utilizing the effective interest method over the life of the 2016 Notes and 2019 Notes, respectively. The Company incurred cash interest expense of $13.1 million and non-cash interest expense of $0.1 million for the year ended December 31, 2009, related to the 2016 Notes. The Company incurred cash interest expense of $13.5 million and non-cash interest expense of $0.1 million for the year ended December 31, 2009, related to the 2019 Notes.
The Indenture governing the Senior Notes contains customary covenants, subject to a number of exceptions and qualifications, including restrictions on Telecommunications’ ability to (1) incur additional indebtedness unless its Consolidated Indebtedness to Annualized Consolidated Adjusted EBITDA Ratio (as defined in the Indenture), pro forma for the additional indebtedness does not exceed 7.0 times7.0x for the fiscal quarter, (2) merge,
SBA COMMUNICATIONS CORPORATION AND SUBSIDIARIES
NOTES TO CONSOLIDATED FINANCIAL STATEMENTS
consolidate or sell assets, (3) make restricted payments, including dividends or other distributions, (4) enter into transactions with affiliates, and (5) enter into sale and leaseback transactions and restrictions on the ability of Telecommunications’ Restricted Subsidiaries (as defined in the Indenture) to incur liens securing indebtedness.
SBA Communications Corporation is a holding company with no business operations of its own and its only significant asset is the outstanding capital stock of Telecommunications. Telecommunications is 100% owned by SBA Communications Corporation. The Company has fully and unconditionally guaranteed the Senior Notes issued by Telecommunications.
On July 15, 2010, Telecommunications and the Company consummated an exchange offer pursuant to which outstanding unregistered notes of each series of the Senior Notes were exchanged for registered notes of the respective series.
SBA COMMUNICATIONS CORPORATION AND SUBSIDIARIES
NOTES TO CONSOLIDATED FINANCIAL STATEMENTS
The Company is a holding company with no business operations of its own. The Company’s only significant asset is the outstanding capital stock of Telecommunications. The Company has fully and unconditionally guaranteed the Senior Notes issued by Telecommunications. The Company and Telecommunications have agreed to file a registration statement with the Securities and Exchange Commission (“SEC”) pursuant to which Telecommunications will either offer to exchange each series of notes for substantially similar registered notes of the respective series or register the resale of the respective series of notes. The Company intends to consummate the exchange offer by July 19, 2010. To the extent that the exchange offer has not been consummated by July 19, 2010, the interest rate on the 2016 Notes and the 2019 Notes will increase 0.25% per annum for each 90-day period that the exchange offer has not been consummated following such date up to a maximum of 1.00% per annum.
Senior Credit Facility
On January 18, 2008, SBA Senior Finance, Inc. (“SBA Senior Finance”), an indirect wholly-owned subsidiary of the Company, entered into a $285.0 million Senior Credit Facility (the “Senior Credit Facility”) with several banks and other financial institutions or entities from time to time parties to the credit agreement. On March 5, 2008, SBA Senior Finance entered into a new lender supplement with The Royal Bank of Scotland Group in connection with the Senior Credit Facility, which increased the aggregate commitment of the lenders to $335.0 million. The Company incurred deferred financing fees of $2.8 million associated with the closing of this transaction.
In September 2008, the Company made a drawing request under the Senior Credit Facility and Lehman Commercial Paper, Inc. (“LCPI”), who was a lender under the Senior Credit Facility, did not fund its share of such request. As a result of such failure to fund, SBA delivered a letter to LCPI declaring that LCPI was in default of its obligations under the Senior Credit Facility agreement. In October 2008, LCPI filed a voluntary petition for protection under Chapter 11 of the United States Bankruptcy Code. LCPI, a subsidiary of Lehman Brothers Holding Inc. had committed $50.0 million of the original aggregate of $335.0 million in commitments under the Senior Credit Facility. As a result, the aggregate commitment of the Senior Credit Facility was reduced to $285.0 million. As a result of the bankruptcy filing of LCPI, the Company has written off unamortized deferred financing fees of $0.4 million in its Consolidated Statement of Operations for the year ended December 31, 2008.
Effective April 14, 2009, SBA Senior Finance entered into a New Lender Supplement with Barclays Bank PLC (“Barclays”). The New Lender Supplement added Barclays as a lender under the Senior Credit Facility and increased the aggregate commitment under the Senior Credit Facility from $285.0 million to $320.0 million, the availability of which is based on compliance with certain financial ratios. All other terms of the Senior Credit Facility remained the same.
Effective July 31, 2009, SBA Senior Finance entered into an Amendment and Restatement of the Credit Agreement (the “Restated Credit Agreement”). The Restated Credit Agreement primarily mirrors the material terms of the Senior Credit Facility and clarifies that the credit facility was scheduled to terminate on January 18, 2011. All other changes to the Senior Credit Facility have been incorporated within this disclosure.
The Senior Credit Facility may be borrowed, repaid and redrawn, subject to compliance with the financial and other covenants in the Restated Credit Agreement. Proceeds available under the facility may be used for the construction or acquisition of towers and for ground lease buyouts, and general corporate purposes including distributions to Telecommunications. Amounts borrowed under the facility accrue interest at the Eurodollar rate plus a margin that ranges from 150 basis points to 300 basis points or at a Base Rate (as defined in the Restated Credit Agreement) plus a margin that ranges from 50 basis points to 200 basis points, in each case based on the Consolidated Total Debt to Annualized Borrower EBITDA ratio (as defined in the Restated Credit Agreement and discussed below). A 0.5% per annum fee is charged on the amount of unused commitment.
SBA COMMUNICATIONS CORPORATION AND SUBSIDIARIES
NOTES TO CONSOLIDATED FINANCIAL STATEMENTS
The Restated Credit Agreement requires SBA Senior Finance and SBA Communications to maintain specific financial ratios, including, at the SBA Senior Finance level, a Consolidated Total Debt to Annualized Borrower EBITDA ratio (as defined in the Restated Credit Agreement) that does not exceed 5.0x for any fiscal quarter and an Annualized Borrower EBITDA to Annualized Cash Interest Expense ratio (as defined in the Restated Credit Agreement) of not less than 2.0x for any fiscal quarter. In addition, the Company’s ratio of Consolidated Total Net Debt to Consolidated Adjusted EBITDA ratio (as defined in the Restated Credit Agreement) for any fiscal quarter cannot exceed 9.9x. The Restated Credit Agreement also contains customary affirmative and negative covenants that, among other things, limit SBA Senior Finance’s ability to incur indebtedness, grant certain liens, make certain investments, enter into sale leaseback transactions or merge or consolidate, or engage in certain asset dispositions, including a sale of all or substantially all of our assets. As of December 31, 2009, SBA Senior Finance was in full compliance with the terms of the Senior Credit Facility.
Upon the occurrence of certain bankruptcy and insolvency events with respect to the Company or certain of our subsidiaries, the revolving credit loans automatically terminate and all amounts due under the Restated Credit Agreement and other loan documents become immediately due and payable. If certain other events of default occur, including failure to pay the principal and interest when due, a breach of the Company’s negative covenants, or failure to perform any other requirement in the Restated Credit Agreement, the Restated Guarantee and Collateral Agreement (as described below) and/or certain other debt instruments, including the Notes and the CMBS Certificates, then, with the permission of a majority of the lenders, the revolving credit commitments will terminate and all amounts due under the Restated Credit Agreement and other loan documents become immediately due and payable.
Amounts borrowed under the Senior Credit Facility will be secured by a first lien on substantially all of SBA Senior Finance’s assets not pledged under the CMBS Certificates and substantially all of the assets, other than leasehold, easement or fee interests in real property, of the guarantors. In connection with the Restated Credit Agreement, on July 28, 2009, SBA Communications, Telecommunications, SBA Senior Finance and certain of SBA Senior Finance’s subsidiaries, entered into an Amendment and Restatement of the Guarantee and Collateral Agreement in favor of Toronto Dominion (Texas) LLC, as administrative agent (the “Restated Guarantee and Collateral Agreement”). The Restated Guarantee and Collateral Agreement clarifies that only subsidiaries of SBA Senior Finance, rather than of SBA Communications (other than Telecommunications), are required to guarantee SBA Senior Finance’s obligations under the credit facility and added SBA Towers, Inc., SBA Puerto Rico, Inc. and SBA Towers USVI, Inc. as guarantors, as each of these entities had been released from its obligations under the mortgage loan underlying the CMBS Certificates.
During 2009, SBA Senior Finance borrowed $8.5 million and repaid $239.1 million under its senior credit facility, which is presented within “Cash flows from financing activities” on the Company’s Consolidated Statements of Cash Flows. The Company used or designated such proceeds for construction and acquisition of towers and for ground lease buyouts. As of December 31, 2009, the Company did not have any amounts outstanding under this facility. The Company had approximately $0.1 million of letters of credit posted against the availability of this credit facility outstanding. The weighted average interest rate for amounts borrowed under the Senior Credit Facility during the year ended December 31, 2009 and 2008 was 2.46% and 4.3%, respectively. As of December 31, 2009, availability under the credit facility was approximately $319.9 million.
On February 11, 2010, the Company terminated the Senior Credit Facility.
| 14. | DERIVATIVE FINANCIAL INSTRUMENTS |
2010 Credit Facility
On February 11, 2010, SBA Senior Finance II, LLC (“SBA Senior Finance II”), an indirect wholly-owned subsidiary of the Company, entered into a credit agreement for a $500.0 million senior secured revolving credit facility (the “2010 Credit Facility”) with several banks and other financial institutions or entities from time to time
SBA COMMUNICATIONS CORPORATION AND SUBSIDIARIES
NOTES TO CONSOLIDATED FINANCIAL STATEMENTS
parties to the credit agreement (the “Credit Agreement”). Amounts borrowed under the 2010 Credit Facility will be secured by a first lien on the capital stock of SBA Telecommunications, Inc., SBA Senior Finance, Inc. and SBA Senior Finance II, and substantially all of the assets, other than leasehold, easement or fee interests in real property, of SBA Senior Finance II and the Subsidiary Guarantors (as defined in the Credit Agreement). The Company incurred deferred financing fees of $4.8 million associated with the closing of this transaction. As of February 26, 2010, availability under the 2010 Credit Facility was $500.0 million.
The 2010 Credit Facility consists of a revolving loan under which up to $500 million may be borrowed, repaid and redrawn, subject to compliance with specific financial ratios and the satisfaction of other customary conditions to borrowing as set forth in the Credit Agreement. Amounts borrowed under the 2010 Credit Facility accrue interest at the Eurodollar rate plus a margin that ranges from 187.5 basis points to 237.5 basis points or at a Base Rate (as defined in the Credit Agreement) plus a margin that ranges from 87.5 basis points to 137.5 basis points, in each case based on the ratio of Consolidated Total Debt to Annualized Borrower EBITDA (as defined in the Credit Agreement). A 0.375% to 0.5% per annum fee is charged on the amount of unused commitment. If it is not earlier terminated by SBA Senior Finance II, the 2010 Credit Facility will terminate on, and SBA Senior Finance II will repay all amounts outstanding on or before, February 11, 2015. Proceeds available under the 2010 Credit Facility may be used for general corporate purposes.
The Credit Agreement requires SBA Senior Finance II and SBA Communications to maintain specific financial ratios, including, at the SBA Senior Finance II level, a ratio of Consolidated Total Debt to Annualized Borrower EBITDA (as defined in the Credit Agreement) that does not exceed 5.0x for any fiscal quarter, a ratio of Consolidated Total Debt and Net Hedge Exposure (as defined in the Credit Agreement) to Annualized Borrower EBITDA for the most recently ended fiscal quarter not to exceed 5.0x for 30 consecutive days and a ratio of Annualized Borrower EBITDA to Annualized Cash Interest Expense (as defined in the Credit Agreement) of not less than 2.0x for any fiscal quarter. In addition, the Company’s ratio of Consolidated Total Net Debt to Consolidated Adjusted EBITDA (as defined in the Credit Agreement) for any fiscal quarter on an annualized basis cannot exceed 8.9x. The Credit Agreement also contains customary affirmative and negative covenants that, among other things, limit SBA Senior Finance II’s ability to incur indebtedness, grant certain liens, make certain investments, enter into sale leaseback transactions or engage in certain asset dispositions, including a sale of all or substantially all of its assets.
The 2010 Credit Facility also permits the Company to request that one or more lenders (1) increase their proportionate share of the 2010 Credit Facility commitment, up to an additional $200 million in the aggregate and (2) provide SBA Senior Finance II term loans for an aggregate amount up to $800 million, without requesting consent of the other lenders. SBA Senior Finance II’s ability to request such increase of the 2010 Credit Facility or term loans is subject to its compliance with the conditions set forth in the Credit Agreement including, with respect to any term loan, compliance, on a pro forma basis, with the financial covenants and ratios set forth therein. Upon SBA Senior Finance II’s request, each lender may decide, in its sole discretion, whether to increase all or a portion of its revolving credit facility commitment or whether to provide SBA Senior Finance II term loans and if so upon what terms. As of December 31, 2009, had the 2010 Credit Facility been in place, SBA Senior Finance II would have had the ability to request term loans up to an aggregate principal amount of $325.0 million upon compliance with the terms of the Credit Agreement.
Optasite Credit Facility
On September 16, 2008, in connection with the acquisition of Optasite, the Company assumed Optasite’s fully drawn $150 million senior credit facility (the “Optasite Credit Facility”). The Company recorded the Optasite Credit Facility at its fair value of $147.0 million on the date of acquisition. Interest on the Optasite Credit Facility accrued at the one month Eurodollar Rate plus 165 basis points and interest payments were due monthly. Commencing November 1, 2008, the Company began paying the required installment payments on the Optasite
SBA COMMUNICATIONS CORPORATION AND SUBSIDIARIES
NOTES TO CONSOLIDATED FINANCIAL STATEMENTS
Credit Facility. On July 31, 2009, the Company paid off the facility in full and the facility was subsequently terminated. The Company recorded a loss on the early extinguishment of debt of $1.9 million.
The Company incurred cash interest expense of $1.8 million and $1.9 million for the years ended December 31, 2009 and 2008, respectively. The Company incurred non-cash interest expense of $0.8 million and $0.4 million for the years ended December 31, 2009 and 2008, respectively.
14. DERIVATIVE FINANCIAL INSTRUMENT
Optasite Derivative Instruments
The Company acquired various derivative instruments as part of the Optasite acquisition on September 16, 2008 which were valued at $4.4 million. The derivative instruments did not qualify for hedge accounting. The Company terminated the majority of the derivative instruments on October 3, 2008 for $3.9 million. For the year ended December 31, 2008, the Company recognized a net gain of $0.5 million on these derivatives, which is included in interest expense on the Company’s Consolidated Statements of Operations.
2006 CMBS Certificate Swaps
During 2006, an indirect wholly-owned subsidiary of the Company entered into nine forward-starting swap agreements (the “2006 CMBS Certificate Swaps”) in anticipation of the 2006 CMBS Transaction. In October 2006, the Company terminated the 2006 CMBS Certificate Swaps in connection with entering into the purchase and sale agreement for the 2006 CMBS Certificates (see Note 13). The Company determined a portion of the swaps to be an effective cash flow hedge and as a result, recorded a deferred loss of $12.8 million in accumulated other comprehensive loss, net of applicable income taxes on the Company’s Consolidated Balance Sheets. The deferred loss is beingwas amortized utilizing the effective interest method over the anticipated five year life of the 2006 CMBS Certificates and increasesincreased the effective interest rate on these certificates by 0.3%. On April 16, 2010, the Company wrote-off the remaining unamortized deferred loss of $3.6 million in connection with the repayment of the 2006 CMBS Certificates (see Note 13).
The Company recorded amortization of $2.3 million, $2.4$0.6 million and $2.3 million as non-cash interest expense on the Company’s Consolidated Statements of Operations for yearthe years ended December 31, 2009, 20082010 and 2007,2009, respectively.
2005 CMBS Certificate Swaps
On June 22, 2005, an indirect wholly-owned subsidiary of the Company entered into two forward-starting interest rate swap agreements (the “2005 CMBS Certificate Swaps”) in anticipation of the 2005 CMBS Transaction. On November 4, 2005, the Company entered into a purchase agreement regarding the purchase and sale of 2005 CMBS Certificates (see Note 13). In connection with this agreement, the Company terminated the 2005 CMBS Certificate Swaps. The Company determined the swaps to be an effective cash flow hedge and as a result, recorded a deferred gain of $14.8 million in accumulated other comprehensive loss, net of applicable income taxes on the Company’s Consolidated Balance Sheets. The deferred gain was being amortized utilizing the effective interest method over the anticipated five year life of the 2005 CMBS Certificates and reduced the effective interest rate on these certificates by 0.8%. On July 28, 2009, the Company recognizedwrote-off the remaining unamortized net deferred gain of $3.9 million in connection with the repayment of the 2005 CMBS Certificates.
The Company recorded amortization of $1.7 million $3.0 million and $2.8 million as an offset to non-cash interest expense on the Company’s Consolidated Statements of Operations for the year ended December 31, 2009, 20082009.
| 15. | REDEEMABLE NONCONTROLLING INTERESTS |
In connection with the Company’s business operations in Canada and 2007, respectively.
SBA COMMUNICATIONS CORPORATION AND SUBSIDIARIES
NOTES TO CONSOLIDATED FINANCIAL STATEMENTS
15. SHAREHOLDERS’ EQUITYAmount”) based on a formula defined in the respective joint venture agreements. During 2011 the Company paid approximately $0.7 million in exchange for the outstanding 4.6% noncontrolling interest in the Canadian joint venture increasing the Company’s interest in that joint venture to 100%. Neither the put or the call options for the Central American joint venture are currently exercisable by either the Company or its partners. The noncontrolling interest is classified as a redeemable equity interest in mezzanine (or temporary equity) on the Company’s Consolidated Balance Sheets.
The Company allocates income and losses to the noncontrolling interest holder based on the applicable membership interest percentage. After applying those provisions, the Company calculates the redemption amount at each reporting period and records the amount, if any, by which the redemption amount exceeds the book value as a charge against income (loss) available to common shareholders. As of December 31, 2011 the redeemable noncontrolling interest presented on the Company’s Consolidated Balance Sheet represents the estimated fair value of the amount the Company could be required to pay to redeem the noncontrolling interest at the date of the exercise of either the put or the call option.
In December 2010, the Company acquired an additional 10% interest in the Central American joint venture for consideration of $7.5 million. This acquisition increased the Company’s ownership to 90% of the joint venture. As of December 2010, the 10% noncontrolling interest was valued at $12.5 million. The acquisition of the noncontrolling interest has been reflected as a reduction of additional-paid-in capital in accordance with ASC 810.
| 16. | SHAREHOLDERS’ EQUITY |
Common Stock equivalents
The Company has potential common stock equivalents related to its outstanding stock options (see Note 16)17), restricted stock units, the 1.875% Notes and Convertible Seniorthe 4.0% Notes (see Note 13). These potential common stock equivalents were not included in diluted loss per share because the effect would have been anti-dilutive for the years ended December 31, 2011, 2010 and 2009, 2008 and 2007.respectively. Accordingly, basic and diluted loss per common share and the weighted average number of shares used in the computation are the same for the years presented.
Stock Repurchases
The Company’s Board of Directors authorized a stock repurchase program effective November 3, 2009. This program authorizesauthorized the Company to purchase, from time to time, up to $250.0 million of the Company’s outstanding common stock through open market repurchases in compliance with Rule 10b-18 of the Securities Act of 1933,1934, as amended, and/or in privately negotiated transactions at management’s discretion based on market and business conditions, applicable legal requirements and other factors.
On April 27, 2011, the Company’s Board of Directors (1) terminated the existing $250.0 million stock repurchase program (under which $65.9 million of repurchase authorization remained available at the termination date), and (2) approved a new $300.0 million stock repurchase program. This new program authorizes the Company to purchase, from time to time, up to $300.0 million of the Company’s outstanding Class A common stock through open market repurchases in compliance with Rule 10b-18 of the Securities Exchange Act of 1934, as amended, and/or in privately negotiated transactions at management’s discretion based on market and business conditions, applicable legal requirements and other factors. This program became effective on April 28, 2011 and will continue until otherwise modified or terminated by the Company’s Board of Directors at any time in the Company’s sole discretion. In
During the year ended December 31, 2011, in connection with the stock repurchase program, inthe Company repurchased and retired 5,917,940 shares for an aggregate of $225.1 million including commissions and fees. During the year ended December 31, 2010, the Company repurchased and retired approximately 3,174,385 shares for an aggregate of $107.4 million including
SBA COMMUNICATIONS CORPORATION AND SUBSIDIARIES
NOTES TO CONSOLIDATED FINANCIAL STATEMENTS
commissions and fees. During the year ended December 31, 2009, the Company repurchased and retired approximately 52,000 shares for an aggregate of $1.7 million including commissions and fees. As of December 31, 2011, the Company had a remaining authorization to repurchase an additional $150.0 million of its common stock under its current $300.0 million stock repurchase program.
In April 2009, the Company repurchased and retired approximately 2.0 million shares, valued at approximately $50.0 million based on the closing stock price of $24.80 on April 20, 2009, in connection with the issuance of the 4.0% Notes (See Note 13).
In May 2008, the Company repurchased and retired approximately 3.47 million shares, valued at approximately $120.0 million based on the closing stock price of $34.55 on May 12, 2008, in connection with the issuance of the 1.875% Notes (See Note 13).
In March 2007, the Company repurchased and retired approximately 3.24 million shares valued at approximately $91.2 million based on the closing price of $28.20 on March 20, 2007, in connection with the issuance of the 0.375% Notes (see Note 13).
Subsequent to December 31, 2009, the Company repurchased 207,000 shares for an aggregate of $6.7 million including commissions and fees.
Registration of Additional Shares
On May 20, 2010, the Company filed a registration statement on Form S-8 with the Securities and Exchange Commission registering 15.0 million shares of the Company’s Class A common stock issuable under the 2010 Performance and Equity Incentive Plan.
The Company filed shelf registration statements on Form S-4 with the Securities and Exchange Commission registering 4.0 million 4.0 million, 5.0 million and 3.0 million of its Class A common stock in 2007, 2006, 2001 and 2000, respectively.2007. These shares may be issued in connection with acquisitions of wireless communication towers or antenna sites and related assets or companies that own wireless communication towers, antenna sites or related assets. During the years ended December 31, 2009, 20082011 and 2007,2010, the Company issued approximately 0.9 milliondid not issue any shares 1.3 million shares and 4.7 million shares, respectively, of its Class A common stock pursuant to thesethis registration statementsstatement in connection with acquisitions. During the year ended December 31, 2009, the Company issued approximately 0.9 million shares of its Class A common stock pursuant to this registration statement in connection with acquisitions. At December 31, 2009,2011, approximately 1.7 million shares remain available for issuance under this shelf registration statement.
On November 12, 2008, the Company filed a registration statement on Form S-8 with the Securities and Exchange Commission registering 500,000 shares of its Class A common stock issuable under the 2008 Employee Stock Purchase Plan.
SBA COMMUNICATIONS CORPORATION AND SUBSIDIARIES
NOTES TO CONSOLIDATED FINANCIAL STATEMENTS
On November 27, 2006, the Company filed a registration statement on Form S-8 with the Securities and Exchange Commission registering an additional 2.5 million shares of its Class A common stock issuable under the 2001 Equity Participation Plan.
On March 3, 2009, the Company filed with the Commission an automatic shelf registration statement for well-known seasoned issuers on Form S-3ASR. This registration statement enables the Company to issue shares of the Company’s Class A common stock, preferred stock or debt securities either separately or represented by warrants, or depositary shares as well as units that include any of these securities. Under the rules governing automatic shelf registration statements, the Company will file a prospectus supplement and advise the Commission of the amount and type of securities each time the Company issueissues securities under this registration statement. For the year ended December 31, 2009,2011, the Company did not issue any securities under this automatic shelf registration statement.
On May 17, 2007, the Company filed with the Commission an automatic shelf registration statement on Form S-3 registering the resale by selling security holders of our 0.375% Notes and shares of our Class A Common Stock which are issuable upon conversion of the 0.375% Notes. The 0.375% Notes were originally issued in a private placement on March 26, 2007 (see Note 13).
Other Common Stock Transactions
During 2008, in connection with the Optasite acquisition, the Company issued 7.25 million shares of its Class A common stock.
Shareholder Rights Plan and Preferred Stock
During January 2002, the Company’s Board of Directors adopted a shareholder rights plan and declared a dividend of one preferred stock purchase right for each outstanding share of the Company’s common stock. Each of these rights which are currently not exercisable will entitle the holder to purchase one one-thousandth (1/1000) of a share of the Company’s newly designated Series E Junior Participating Preferred Stock. In the event that any person or group acquires beneficial ownership of 15% or more of the outstanding shares of the Company’s common stock or commences or announces an intention to commence a tender offer that would result in such person or group owning 15% or more of the Company’s common stock, each holder of a right (other than the acquirer) will be entitled to receive, upon payment of the exercise price, a number of shares of common stock having a market value equal to two times the exercise price of the right. In order to retain flexibility and the ability to maximize shareholder value in the event of transactions that may arise in the future, the Board retains the power to redeem the rights for a set amount. The rights were distributed on January 25, 2002 and expireexpired on January 10, 2012, unless earlier redeemed or exchanged or terminated in accordance with the Rights Agreement.
16. STOCK-BASED COMPENSATION
Stock Options
The Company has two equity participation plans (the 1999 Equity Participation Plan and the 2001 Equity Participation Plan) whereby options (both non-qualified and incentive stock options), stock appreciation rights and restricted stock may be granted to directors, employees and consultants. Upon adoption of the 2001 Equity Participation Plan, no further grants are permitted under the 1999 Equity Participation Plan. The 2001 Equity Participation Plan provides for a maximum issuance of shares, together with all outstanding options and unvested shares of restricted stock under all three of the plans, equal to 15% of the Company’s Class A common stock outstanding, adjusted for shares issued and the exercise of
SBA COMMUNICATIONS CORPORATION AND SUBSIDIARIES
NOTES TO CONSOLIDATED FINANCIAL STATEMENTS
| 17. | STOCK-BASED COMPENSATION |
certain options. TheseThe Company has three equity participation plans (the 1999 Equity Participation Plan, the 2001 Equity Participation Plan and the 2010 Performance and Equity Incentive Plan (the “2010 Plan”), whereby options (both non-qualified and incentive stock options), restricted stock units, stock appreciation rights and other equity and performance based instruments may be granted to directors, employees and consultants. The options and restricted stock units generally vest between three to five years from the date of grant on a straight-line basis over the vesting term and generally have a seven-year or a ten-year contractual life.
Upon the adoption of the 2010 Plan by the Company’s shareholders on May 6, 2010, no further grants were permitted under the 2001 Equity Participation Plan. Upon adoption of the 2001 Equity Participation Plan, no further grants were permitted under the 1999 Equity Participation Plan. The 2010 Plan provides for the issuance of a maximum of 15.0 million shares of our Class A common stock, however, the aggregate number of shares that may be issued pursuant to restricted stock awards, restricted stock unit awards, stock bonus awards, performance awards, other stock-based awards or other awards granted under the 2010 Plan will not exceed 7.5 million. As of December 31, 2011, the Company had 14,284,311 shares remaining available for future issuance under the 2010 Plan.
From time to time, restricted shares of Class A common stock or options to purchase Class A common stock have been granted under the Company’s equity participation plans at prices below market value at the time of grant. The Company did not have any non-cash compensation expense during the years ended December 31, 2009, 20082011, 2010 and 2007,2009, respectively, relating to the issuance of restricted shares or options to purchase Class A common stock.stock at below market value at the time of grant.
Stock Options
The Company records compensation expense for employee stock options based on the estimated fair value of the options on the date of grant using the Black-Scholes option-pricing model with the assumptions included in the table below. The Company uses a combination of historical data and impliedhistorical volatility to establish the expected volatility. Historical data is used to estimate the expected option life and the expected forfeiture rate. The risk-free rate is based on the U.S. Treasury yield curve in effect at the time of grant for the estimated life of the option. The following assumptions were used to estimate the fair value of options granted using the Black-Scholes option-pricing model:
| For the year ended December 31, | ||||||
| 2009 | 2008 | 2007 | ||||
Risk free interest rate | 1.30% - 1.92% | 2.10% - 2.97% | 4.60% - 5.12% | |||
Dividend yield | 0.0% | 0.0% | 0.0% | |||
Expected volatility | 55.7% | 41.6% | 42.7% | |||
Expected lives | 3.21 - 4.08 years | 3.35 - 3.73 years | 3.28 - 4.13 years | |||
A summary of shares reserved for future issuance under these plans as of December 31, 2009 is as follows:
| ||
| ||
| For the year ended December 31, | ||||||
| 2011 | 2010 | 2009 | ||||
Risk free interest rate | 0.66% - 2.17% | 1.35% - 1.83% | 1.30% - 1.92% | |||
Dividend yield | 0.0% | 0.0% | 0.0% | |||
Expected volatility | 53.9% | 55.2% | 55.7% | |||
Expected lives | 3.5 - 4.5 years | 3.6 - 4.3 years | 3.2 - 4.1 years | |||
SBA COMMUNICATIONS CORPORATION AND SUBSIDIARIES
NOTES TO CONSOLIDATED FINANCIAL STATEMENTS
The following table summarizes the Company’s activities with respect to its stock option plans for the years ended 2009, 20082011, 2010 and 20072009 as follows (dollars and number of shares in thousands, except for per share data):
Options | Number of Shares | Weighted- Average Exercise Price Per Share | Weighted- Average Remaining Contractual Life (in years) | Aggregate Intrinsic Value (in thousands) | |||||||||||||||||||||||
Outstanding at December 31, 2006 | 4,158 | $ | 9.87 | ||||||||||||||||||||||||
Granted | 1,028 | $ | 28.90 | ||||||||||||||||||||||||
Exercised | (1,196 | ) | $ | 5.63 | |||||||||||||||||||||||
Canceled | (193 | ) | $ | 22.67 | |||||||||||||||||||||||
Outstanding at December 31, 2007 | 3,797 | $ | 15.71 | ||||||||||||||||||||||||
Granted | 917 | $ | 32.55 | ||||||||||||||||||||||||
Exercised | (655 | ) | $ | 8.45 | |||||||||||||||||||||||
Canceled | (271 | ) | $ | 25.84 | |||||||||||||||||||||||
| Number of Shares | Weighted- Average Exercise Price Per Share | Weighted- Average Remaining Contractual Life (in years) | Aggregate Intrinsic Value (in thousands) | ||||||||||||||||||||||||
Outstanding at December 31, 2008 | 3,788 | $ | 20.31 | 3,786 | $ | 20.33 | |||||||||||||||||||||
Granted | 1,151 | $ | 20.26 | 1,157 | $ | 20.26 | |||||||||||||||||||||
Exercised | (659 | ) | $ | 9.69 | (659 | ) | $ | 9.69 | |||||||||||||||||||
Canceled | (88 | ) | $ | 30.43 | (88 | ) | $ | 30.43 | |||||||||||||||||||
| |||||||||||||||||||||||||||
Outstanding at December 31, 2009 | 4,192 | $ | 21.76 | 5.3 | $ | 52,087 | 4,196 | $ | 21.77 | ||||||||||||||||||
Granted | 539 | $ | 35.64 | ||||||||||||||||||||||||
Exercised | (889 | ) | $ | 17.01 | |||||||||||||||||||||||
Canceled | (60 | ) | $ | 26.71 | |||||||||||||||||||||||
| |||||||||||||||||||||||||||
Exercisable at December 31, 2009 | 1,847 | $ | 17.99 | 4.8 | $ | 29,940 | |||||||||||||||||||||
Outstanding at December 31, 2010 | 3,786 | $ | 24.78 | ||||||||||||||||||||||||
Granted | 578 | $ | 41.91 | ||||||||||||||||||||||||
Exercised | (704 | ) | $ | 21.53 | |||||||||||||||||||||||
Canceled | (52 | ) | $ | 32.07 | |||||||||||||||||||||||
| |||||||||||||||||||||||||||
Unvested at December 31, 2009 | 2,345 | $ | 24.72 | 5.7 | $ | 22,147 | |||||||||||||||||||||
Outstanding at December 31, 2011 | 3,608 | $ | 28.06 | 4.1 | $ | 53,772 | |||||||||||||||||||||
|
| ||||||||||||||||||||||||||
Exercisable at December 31, 2011 | 1,968 | $ | 24.32 | 3.4 | $ | 36,682 | |||||||||||||||||||||
|
| ||||||||||||||||||||||||||
Unvested at December 31, 2011 | 1,640 | $ | 32.54 | 5.1 | $ | 17,090 | |||||||||||||||||||||
|
| ||||||||||||||||||||||||||
The weighted-average per share fair value of options granted during the years ended December 31, 2011, 2010 and 2009 2008was $18.53, $15.88 and 2007 was $8.79, $10.96 and $11.04, respectively.
The total intrinsic value for options exercised during the years ended December 31, 2011, 2010 and 2009 2008 and 2007 was $12.2$12.7 million, $14.6$17.8 million and $30.6$12.2 million, respectively. Cash received from option exercises under all plans for the years ended December 31, 2009, 20082011, 2010 and 20072009 was approximately $6.4$15.2 million, $5.5$15.1 million and $6.7$6.4 million, respectively. No tax benefit was realized for the tax deductions from option exercises under all plans for the years ended December 31, 2011, 2010 and 2009, 2008respectively.
Additional information regarding options outstanding and 2007, respectively.exercisable at December 31, 2011 is as follows:
| Options Outstanding | Options Exercisable | |||||||||||||||||||
Range | Outstanding (in thousands) | Weighted Average Contractual Life (in years) | Weighted Average Exercise Price | Exercisable (in thousands) | Weighted Average Exercise Price | |||||||||||||||
$ 0.00 - $ 5.25 | 102 | 1.9 | $ | 3.61 | 102 | $ | 3.61 | |||||||||||||
$ 5.26 - $10.50 | 125 | 3.0 | $ | 8.54 | 125 | $ | 8.54 | |||||||||||||
$10.51 - $21.00 | 1,107 | 4.1 | $ | 19.44 | 625 | $ | 19.25 | |||||||||||||
$21.01 - $31.50 | 592 | 3.0 | $ | 28.25 | 543 | $ | 28.32 | |||||||||||||
$31.51 - $47.25 | 1,682 | 4.8 | $ | 36.61 | 573 | $ | 33.20 | |||||||||||||
|
|
|
| |||||||||||||||||
| 3,608 | 1,968 | |||||||||||||||||||
|
|
|
| |||||||||||||||||
SBA COMMUNICATIONS CORPORATION AND SUBSIDIARIES
NOTES TO CONSOLIDATED FINANCIAL STATEMENTS
Additional information regarding options outstanding and exercisable at December 31, 2009 is as follows:
| Options Outstanding | Options Exercisable | |||||||||||
Range | Outstanding (in thousands) | Weighted Average Contractual Life (in years) | Weighted Average Exercise Price | Exercisable (in thousands) | Weighted Average Exercise Price | |||||||
$0.00 - $5.25 | 288 | 3.9 | $ | 3.61 | 288 | $ | 3.61 | |||||
$5.26 - $10.50 | 416 | 4.6 | $ | 8.48 | 416 | $ | 8.48 | |||||
$10.51 - $21.00 | 1,738 | 6.1 | $ | 19.30 | 486 | $ | 18.56 | |||||
$21.01 - $31.50 | 931 | 4.8 | $ | 28.27 | 437 | $ | 28.32 | |||||
$31.51 - $52.50 | 819 | 5.1 | $ | 32.69 | 220 | $ | 33.04 | |||||
| 4,192 | 1,847 | |||||||||||
The following table summarizes the activity of options outstanding that had not yet vested:
| Number of Shares | Weighted- Average Fair Value Per Share | |||||
| (in thousands, except for per share amounts) | ||||||
Unvested as of December 31, 2008 | 2,188 | $ | 8.91 | |||
Shares granted | 1,151 | $ | 8.79 | |||
Vesting during period | (963 | ) | $ | 7.59 | ||
Forfeited or cancelled | (31 | ) | $ | 10.08 | ||
Unvested as of December 31, 2009 | 2,345 | $ | 9.54 | |||
| Number of Shares | Weighted- Average Fair Value Per Share | |||||||
Unvested as of December 31, 2010 | 1,924 | $ | 11.35 | |||||
Shares granted | 578 | $ | 18.53 | |||||
Vesting during period | (819 | ) | $ | 11.03 | ||||
Forfeited or canceled | (43 | ) | $ | 12.95 | ||||
|
| |||||||
Unvested as of December 31, 2011 | 1,640 | $ | 14.00 | |||||
|
| |||||||
The aggregate intrinsic value for stock options in the preceding tables represents the total intrinsic value, based on the Company’s closing stock price of $34.16$42.96 as of December 31, 2009.2011. The amount represents the total intrinsic value that would have been received by the holders of the stock-based awards had these awards been exercised and sold as of that date.
As of December 31, 2009,2011, the total unrecognized compensation cost related to unvested stock options outstanding under the Plans is $12.8$17.2 million. That cost is expected to be recognized over a weighted average period of 2.62.3 years.
The total fair value of shares vested during 2011, 2010, and 2009 2008, and 2007 was $7.2$9.0 million, $6.2$8.7 million, and $4.7$7.2 million, respectively.
Restricted Stock Units
The following table summarizes the Company’s restricted stock unit activity for the year ended December 31, 2011:
| Number of Units | Weighted- Average Grant Date Fair Value per share | |||||||
| (in thousands) | ||||||||
Outstanding at December 31, 2010 | 130 | $ | 35.58 | |||||
Granted | 136 | $ | 41.66 | |||||
Vested | (35 | ) | $ | 35.52 | ||||
Forfeited/canceled | (5 | ) | $ | 37.38 | ||||
|
| |||||||
Outstanding at December 31, 2011 | 226 | $ | 39.22 | |||||
|
| |||||||
As of December 31, 2011, total unrecognized compensation expense related to unvested restricted stock units granted under the 2010 Plan was $4.2 million and is expected to be recognized over a weighted-average period of 3.2 years.
SBA COMMUNICATIONS CORPORATION AND SUBSIDIARIES
NOTES TO CONSOLIDATED FINANCIAL STATEMENTS
Employee Stock Purchase Plan
In 1999, the Board of Directors of the Company adopted the 1999 Stock Purchase Plan (the “1999 Purchase Plan”). A total of 500,000 shares of Class A common stock were reserved for purchase under the 1999 Purchase Plan. During 2003, an amendment to the 1999 Purchase Plan was adopted which increased the number of shares reserved for purchase from 500,000 to 1,500,000 shares. In April 2009, the 1999 Plan expired and no shares were issued under the 1999 Plan during 2009. During 2008, the Company adopted the 2008 Employee Stock Purchase Plan (“2008 Purchase Plan”) which reserved 500,000 shares of Class A common stock for purchase. The 2008 Purchase Plan permits eligible employee participants to purchase Class A common stock at a price per share which is equal to 85% of the fair market value of Class A common stock on the last day of an offering period.
SBA COMMUNICATIONS CORPORATION AND SUBSIDIARIES
NOTES TO CONSOLIDATED FINANCIAL STATEMENTS
For the year ended December 31, 2009, 30,6922011, 30,942 shares of Class A common stock were issued under the 2008 Purchase Plan, which resulted in cash proceeds to the Company of approximately $0.7$1.0 million compared to the year ended December 31, 20082010 when approximately 41,00034,597 shares of Class A common stock were issued under the 19992008 Purchase Plan, which resulted in cash proceeds to the Company of $1.0$1.1 million. At December 31, 2009, 469,3082011, 403,769 shares remained available for issuance under the 2008 Purchase Plan. In addition, the Company recorded $0.1$0.2 million, $0.2 million and $0.2$0.1 million of non-cash compensation expense relating to the shares issued under the 2008 and 1999 Purchase PlansPlan for each of the years ended December 31, 2009, 2008,2011, 2010, and 2007,2009, respectively.
Non-Cash Compensation Expense
The table below reflects a break out by category of the non-cash compensation expense amounts recognized on the Company’s Statements of Operations for the years ended December 31, 2011, 2010, and 2009, 2008 and 2007, respectively (in thousands, except per share data):respectively:
| For the year ended December 31, | ||||||||||||||||||||||||
| 2011 | 2010 | 2009 | ||||||||||||||||||||||
| For the year ended December 31, | (in thousands, except per share amounts) | |||||||||||||||||||||||
| 2009 | 2008 | 2007 | ||||||||||||||||||||||
Cost of revenues | $ | 192 | $ | 295 | $ | 286 | $ | 187 | $ | 189 | $ | 192 | ||||||||||||
Selling, general and administrative | 8,008 | 6,912 | 6,326 | 11,282 | 10,312 | 8,008 | ||||||||||||||||||
|
|
| ||||||||||||||||||||||
Total cost of non-cash compensation included in loss before provision for income taxes | 8,200 | 7,207 | 6,612 | 11,469 | 10,501 | 8,200 | ||||||||||||||||||
Amount of income tax recognized in earnings | — | — | — | — | — | — | ||||||||||||||||||
|
|
| ||||||||||||||||||||||
Amount charged against loss | $ | 8,200 | $ | 7,207 | $ | 6,612 | $ | 11,469 | $ | 10,501 | $ | 8,200 | ||||||||||||
|
|
| ||||||||||||||||||||||
Impact on net loss per common share: | ||||||||||||||||||||||||
Basic and diluted | $ | (0.07 | ) | $ | (0.07 | ) | $ | (0.06 | ) | |||||||||||||||
In addition, the Company capitalized $0.2 million, $0.1 million $0.2and $0.1 million and $1.2 million relating toof non-cash compensation for the years ended December 31, 2009, 20082011, 2010 and 2007,2009, respectively, to fixed and intangible assets.
17. ASSET IMPAIRMENT
| 18. | ASSET IMPAIRMENT |
The Company evaluates its individual long-lived and related assets with finite lives for indicators of impairment to determine when an impairment analysis should be performed. The Company evaluates its tower assets and Current contract intangibles at the tower level, which is the lowest level for which identifiable cash flows exists. The Company evaluates its Network location intangibles for impairment at the tower leasing business level whenever indicators of impairment are present. The Company has established a policy to at least annually evaluate its tower assets and Current contract intangibles for impairment. In 2009,as a result of the annual impairment evaluation,2011 the Company recorded a $2.0$5.5 million impairment charge on 21completed and construction-in-process towers and related intangible assets that are not expected to achieve previously anticipated lease-up results. The amount of impairment was determined by using a discounted cash flow analysis.analysis which included estimates and assumptions such as general market and economic conditions, historical operating results, geographic location, lease-up potential and expected timing of lease-up. In addition,2010 the Company recorded a $1.9$5.9 million impairment charge on its six DAS networks based on the estimated fair value of the DAS networks.towers and related assets that were not expected to achieve previously anticipated lease-up results. In 2008, as a result of the annual impairment evaluation,2009 the Company recorded a $0.9$3.9 million impairment charge on eight towers and related assets that hadwere not achieved expected to achieve previously anticipated lease-up results as determined by using a discounted cash flow analysis.
18. ACCUMULATED OTHER COMPREHENSIVE LOSS, NET
Accumulated other comprehensive loss, net has no impact on the Company’s net loss but is reflected in the Consolidated Balance Sheet through adjustments to shareholders’ equity. Accumulated other comprehensive loss, net derives from the amortization of deferred (gain) loss from settlement of derivative financial instruments relating to the CMBS Certificates issuance (see Note 13), the unfunded projected benefit obligation relating to the Company’s pension plan (see Note 22) and the Company’s foreign currency translation adjustment. A
SBA COMMUNICATIONS CORPORATION AND SUBSIDIARIES
NOTES TO CONSOLIDATED FINANCIAL STATEMENTS
rollforward of accumulated other comprehensive loss, net for the years ended December 31, 2009, 2008 and 2007 is as follows:
| Deferred (Gain) Loss from Settlement of Swaps | Change in Unfunded Projected Benefit Obligation | Foreign Currency Translation Adjustment | Total | ||||||||||||
| (in thousands) | |||||||||||||||
Balance, December 31, 2006 | $ | (746 | ) | $ | 80 | $ | — | $ | (666 | ) | |||||
Amortization of net deferred gain from settlement of derivative financial instruments | (565 | ) | — | — | (565 | ) | |||||||||
Change in unfunded projected benefit obligation | — | (49 | ) | (49 | ) | ||||||||||
Balance, December 31, 2007 | (1,311 | ) | 31 | — | (1,280 | ) | |||||||||
Amortization of net deferred gain from settlement of derivative financial instruments | (557 | ) | — | — | (557 | ) | |||||||||
Write-off of net deferred loss from derivative instruments related to repurchase of debt | 319 | — | — | 319 | |||||||||||
Change in unfunded projected benefit obligation as a result of plan termination | — | (31 | ) | — | (31 | ) | |||||||||
Balance, December 31, 2008 | (1,549 | ) | — | — | (1,549 | ) | |||||||||
Amortization of net deferred loss from settlement of derivative financial instruments | 622 | — | — | 622 | |||||||||||
Write-off of net deferred gain from derivative instruments related to repurchase of debt | (3,350 | ) | — | — | (3,350 | ) | |||||||||
Foreign currency translation adjustments | — | — | 1,474 | 1,474 | |||||||||||
Balance, December 31, 2009 | $ | (4,277 | ) | $ | — | $ | 1,474 | $ | (2,803 | ) | |||||
There is no net tax impact for the components of other comprehensive income (loss) due to the full valuation allowance on the Company’s deferred tax assets.
19. INCOME TAXES
| 19. | INCOME TAXES |
Loss before provision for income taxes by geographic area is as follows:
| For the year ended December 31, | ||||||||||||
| 2009 | 2008 | 2007 | ||||||||||
| (as adjusted) | (as adjusted) | |||||||||||
| (in thousands) | ||||||||||||
Domestic | $ | (140,425 | ) | $ | (65,950 | ) | $ | (90,552 | ) | |||
Foreign | (202 | ) | (177 | ) | (54 | ) | ||||||
Total | $ | (140,627 | ) | $ | (66,127 | ) | $ | (90,606 | ) | |||
SBA COMMUNICATIONS CORPORATION AND SUBSIDIARIES
NOTES TO CONSOLIDATED FINANCIAL STATEMENTS
| For the year ended December 31, | ||||||||||||
| 2011 | 2010 | 2009 | ||||||||||
| (in thousands) | ||||||||||||
Domestic | $ | (118,671 | ) | $ | (193,048 | ) | $ | (140,425 | ) | |||
Foreign | (6,108 | ) | (368 | ) | (202 | ) | ||||||
|
|
|
|
|
| |||||||
Total | $ | (124,779 | ) | $ | (193,416 | ) | $ | (140,627 | ) | |||
|
|
|
|
|
| |||||||
The provision for income taxes consists of the following components:
| For the year ended December 31, | For the year ended December 31, | |||||||||||||||||||||||
| 2009 | 2008 | 2007 | 2011 | 2010 | 2009 | |||||||||||||||||||
| (in thousands) | (in thousands) | |||||||||||||||||||||||
Current provision for taxes: | ||||||||||||||||||||||||
Federal | $ | (127 | ) | $ | 127 | $ | — | $ | — | $ | — | $ | (127 | ) | ||||||||||
Foreign | 69 | 4 | — | 1,608 | 897 | 69 | ||||||||||||||||||
State | 730 | 747 | 667 | 2,191 | 845 | 730 | ||||||||||||||||||
|
|
| ||||||||||||||||||||||
Total current | 672 | 878 | 667 | 3,799 | 1,742 | 672 | ||||||||||||||||||
|
|
| ||||||||||||||||||||||
Deferred (benefit) provision for taxes: | ||||||||||||||||||||||||
Federal income tax | (46,835 | ) | (17,854 | ) | (25,406 | ) | ||||||||||||||||||
Federal income taxes | (38,303 | ) | (59,363 | ) | (46,835 | ) | ||||||||||||||||||
State and local taxes | (5,314 | ) | (3,987 | ) | (3,693 | ) | (5,111 | ) | (6,083 | ) | (5,314 | ) | ||||||||||||
Foreign tax | 220 | (2 | ) | (4 | ) | (1,104 | ) | (388 | ) | 220 | ||||||||||||||
Increase in valuation allowance | 51,749 | 22,002 | 29,304 | 42,832 | 65,097 | 51,749 | ||||||||||||||||||
|
|
| ||||||||||||||||||||||
Total deferred | (180 | ) | 159 | 201 | (1,686 | ) | (737 | ) | (180 | ) | ||||||||||||||
|
|
| ||||||||||||||||||||||
Total provision for income taxes | $ | 492 | $ | 1,037 | $ | 868 | $ | 2,113 | $ | 1,005 | $ | 492 | ||||||||||||
|
|
| ||||||||||||||||||||||
A reconciliation of the provision for income taxes at the statutory U.S. Federal tax rate (35%) and the effective income tax rate is as follows:
| For the year ended December 31, | ||||||||||||
| 2009 | 2008 | 2007 | ||||||||||
| (in thousands) | ||||||||||||
Statutory Federal benefit | $ | (48,586 | ) | $ | (16,004 | ) | $ | (26,954 | ) | |||
Foreign tax | 158 | (4 | ) | (4 | ) | |||||||
State and local taxes | (2,980 | ) | (2,106 | ) | (1,966 | ) | ||||||
Convertible debt interest expense and COD income | (1,029 | ) | (3,514 | ) | — | |||||||
Other | 1,180 | 663 | 488 | |||||||||
Valuation allowance | 51,749 | 22,002 | 29,304 | |||||||||
Provision for income taxes | $ | 492 | $ | 1,037 | $ | 868 | ||||||
| For the year ended December 31, | ||||||||||||
| 2011 | 2010 | 2009 | ||||||||||
| (in thousands) | ||||||||||||
Statutory Federal benefit | $ | (43,673 | ) | $ | (67,696 | ) | $ | (48,586 | ) | |||
Foreign tax expense | 1,576 | 1,065 | 158 | |||||||||
State and local tax benefit | (1,898 | ) | (3,405 | ) | (2,980 | ) | ||||||
Convertible debt interest expense and COD income | 1,333 | 4,364 | (1,029 | ) | ||||||||
Other | 1,943 | 1,580 | 1,180 | |||||||||
Valuation allowance | 42,832 | 65,097 | 51,749 | |||||||||
|
|
|
|
|
| |||||||
Provision for income taxes | $ | 2,113 | $ | 1,005 | $ | 492 | ||||||
|
|
|
|
|
| |||||||
SBA COMMUNICATIONS CORPORATION AND SUBSIDIARIES
NOTES TO CONSOLIDATED FINANCIAL STATEMENTS
The components of the net deferred income tax asset (liability) accounts are as follows:
| As of December 31, | As of December 31, | |||||||||||||||
| 2009 | 2008 | 2011 | 2010 | |||||||||||||
| (in thousands) | (in thousands) | |||||||||||||||
Current deferred tax assets: | ||||||||||||||||
Allowance for doubtful accounts | $ | 70 | $ | 327 | $ | 9 | $ | 70 | ||||||||
Deferred revenue | 21,190 | 17,289 | 18,207 | 23,522 | ||||||||||||
Accrued liabilities | 839 | 1,210 | 2,885 | 720 | ||||||||||||
Valuation allowance | (22,099 | ) | (18,826 | ) | (20,962 | ) | (24,268 | ) | ||||||||
|
| |||||||||||||||
Total current deferred tax assets, net | $ | — | $ | — | $ | 139 | $ | 44 | ||||||||
|
| |||||||||||||||
Noncurrent deferred tax assets: | ||||||||||||||||
Net operating losses | $ | 362,752 | $ | 344,958 | $ | 402,392 | $ | 385,516 | ||||||||
Property, equipment & intangible basis differences | 32,022 | 31,894 | 27,849 | 29,463 | ||||||||||||
Accrued liabilities | 8,912 | 11,823 | 10,166 | 8,640 | ||||||||||||
Straight-line rents | 8,723 | 6,430 | 8,090 | 9,100 | ||||||||||||
Non-cash Compensation | 4,644 | 3,505 | ||||||||||||||
Non-cash compensation | 7,437 | 6,162 | ||||||||||||||
Other | 517 | 617 | 2,741 | 2,877 | ||||||||||||
|
| |||||||||||||||
Total noncurrent deferred tax assets | 417,570 | 399,227 | 458,675 | 441,758 | ||||||||||||
Noncurrent deferred tax liabilities: | ||||||||||||||||
Property, equipment & intangible basis differences | (335,230 | ) | (372,813 | ) | (300,432 | ) | (327,339 | ) | ||||||||
Convertible Debt Instruments | (7,163 | ) | — | |||||||||||||
Convertible debt instruments | (3,823 | ) | (5,117 | ) | ||||||||||||
Early extinguishment of debt | (1,587 | ) | (606 | ) | (610 | ) | — | |||||||||
Other | (1,503 | ) | — | (4,887 | ) | (3,403 | ) | |||||||||
Valuation allowance | (74,592 | ) | (25,808 | ) | (154,886 | ) | (113,490 | ) | ||||||||
|
| |||||||||||||||
Total noncurrent deferred tax liabilities, net | $ | (2,505 | ) | $ | — | $ | (5,963 | ) | $ | (7,591 | ) | |||||
|
| |||||||||||||||
The Company has recorded a valuation allowance forValuation allowances of $175.8 million and $137.8 million were recognized to offset net deferred income tax assets as management believes that it is not “more likely than not” that the Company will be able to generate sufficient taxable income in future periods to recognize the assets.of December 31, 2011 and 2010, respectively. The net changeincrease in the valuation allowance for the years ended December 31, 20092011 and 20082010 was $52.1$38.1 million and $(47.4)$41.1 million, respectively. Additionally, atDuring the year ended December 31, 20092011 the Company recorded areleased valuation allowances of $1.0 million related to state deferred tax assets since it is more likely than not that these state deferred tax assets will be realized. At December 31, 2011 the valuation allowance relatingrelated to federal and state tax credit carryovers ofwas approximately $0.2$2.2 million and $0.4 million, respectively. These tax credits expire beginning 2017. At December 31, 2010 the valuation allowance related to federal and state tax credit carryovers was approximately $1.0 million and $0.4 million, respectively.
The Company has available at December 31, 2009,2011, a net federal operating tax loss carry-forward of approximately $1.0$1.1 billion and an additional $97.3$116.7 million of net operating tax loss carry forward from stock options which will benefit additional paid-in capital when the loss is utilized. These net operating tax loss carry-forwards will expire between 2019 and 2029.2031. The Internal Revenue Code places limitations upon the future availability of net operating losses based upon changes in the equity of the Company. If these occur, the ability of the Company to offset future income with existing net operating losses may be limited. In addition, the Company has available at December 31, 2009,2011, a foreign net operating loss carry-forward of $9.8 million and a net state operating tax loss carry-forward of approximately $601.1$563.7 million. These net operating tax loss carry-forwards will expire between 2012 and 2031. At December 31, 2010, the Company had available a foreign net operating loss carry-foward of $6.0 million and 2029.a net state operating tax loss carry-forward of approximately $555.6 million.
In accordance with the Company’s methodology for determining when stock option deductions are deemed realized, the Company utilizes a “with-and-without” approach that will result in a benefit not being recorded in
SBA COMMUNICATIONS CORPORATION AND SUBSIDIARIES
NOTES TO CONSOLIDATED FINANCIAL STATEMENTS
APIC if the amount of available net operating loss carry-forwards generated from operations is sufficient to offset the current year taxable income.
20. COMMITMENTSSBA COMMUNICATIONS CORPORATION AND CONTINGENCIESSUBSIDIARIES
a.NOTES TO CONSOLIDATED FINANCIAL STATEMENTS
| 20. | COMMITMENTS AND CONTINGENCIES |
Operating Leases and Capital Leases
The Company is obligated under various non-cancelable operating leases for land, office space, equipment and site leases that expire at various times through December 2109.August 2111. In addition, the Company is obligated under various non-cancelable capital leases for vehicles that expire at various times through December 2013.2015. The amounts applicable to capital leases for vehicles included in property and equipment, net was:were:
| As of December 31, 2009 | As of December 31, 2008 | As of December 31, 2011 | As of December 31, 2010 | |||||||||||||
| (in thousands) | (in thousands) | |||||||||||||||
Vehicles | $ | 1,980 | $ | 1,741 | $ | 5,546 | $ | 3,110 | ||||||||
Less: accumulated depreciation | (758 | ) | (397 | ) | (1,932 | ) | (1,241 | ) | ||||||||
|
| |||||||||||||||
Vehicles, net | $ | 1,222 | $ | 1,344 | $ | 3,614 | $ | 1,869 | ||||||||
|
| |||||||||||||||
The annual minimum lease payments under non-cancelable operating and capital leases in effect as of December 31, 20092011 are as follows (in thousands):
For the year ended December 31, | Capital Leases | Operating Leases | Capital Leases | Operating Leases | |||||||||||
2010 | $ | 496 | $ | 59,157 | |||||||||||
2011 | 344 | 58,602 | |||||||||||||
2012 | 136 | 57,255 | $ | 1,124 | $ | 70,052 | |||||||||
2013 | 43 | 56,857 | 989 | 69,917 | |||||||||||
2014 | — | 57,543 | 808 | 70,588 | |||||||||||
2015 | 440 | 70,866 | |||||||||||||
2016 | — | 70,371 | |||||||||||||
Thereafter | — | 1,079,547 | — | 1,319,419 | |||||||||||
|
| ||||||||||||||
Total minimum lease payments | 1,019 | $ | 1,368,961 | 3,361 | $ | 1,671,213 | |||||||||
| |||||||||||||||
Less: amount representing interest | (50 | ) | (252 | ) | |||||||||||
| |||||||||||||||
Present value of future payments | 969 | 3,109 | |||||||||||||
Less: current obligations | (469 | ) | (994 | ) | |||||||||||
| |||||||||||||||
Long-term obligations | $ | 500 | $ | 2,115 | |||||||||||
| |||||||||||||||
Future minimum rental payments under noncancelable ground leases include payments for certain renewal periods at the Company’s option because failure to renew could result in a loss of the applicable tower site and related revenue from tenant leases, thereby making it reasonably assured that the Company will renew the lease. The majority of operating leases provide for renewal at varying escalations. Fixed rate escalations have been included in the table disclosed above.
Rent expense for operating leases was $72.6$82.8 million, $63.3$75.4 million and $57.9$72.6 million for the years ended December 31, 2009, 20082011, 2010 and 2007,2009, respectively. In addition, certain of the Company’s leases include contingent rent provisions which provide for the lessor to receive additional rent upon the attainment of certain tower operating results and or lease-up. Contingent rent expense for the years ended December 31, 2011, 2010 and 2009 2008was $13.7 million, $12.5 million and 2007 was $9.9 million, $8.1respectively.
Capital Lease Obligations
The Company’s capital lease obligations outstanding were $3.1 million as of December 31, 2011 and $7.2$1.5 million respectively.
SBA COMMUNICATIONS CORPORATION AND SUBSIDIARIES
NOTES TO CONSOLIDATED FINANCIAL STATEMENTS
b.Tenant Leases
The annual minimum tower lease income to be received for tower space and antenna rental under non-cancelable operating leases in effect as of December 31, 20092011 is as follows:
For the year ended December 31, | (in thousands) | (in thousands) | |||||
2010 | $ | 436,846 | |||||
2011 | 343,982 | ||||||
2012 | 270,018 | $ | 601,623 | ||||
2013 | 197,113 | 533,969 | |||||
2014 | 112,651 | 466,340 | |||||
2015 | 379,738 | ||||||
2016 | 281,718 | ||||||
Thereafter | 180,199 | 1,205,482 | |||||
| |||||||
Total | $ | 1,540,809 | $ | 3,468,870 | |||
| |||||||
Principally, all of theThe Company’s tenant leases provide for annual escalations and multiple renewal generallyperiods, at the tenant’s option, at varying escalations. Fixedoption. The tenant rental payments disclosed in the table above do not assume exercise of tenant renewal options, however, fixed rate escalations have been included in the table disclosed above.included.
c.Litigation
The Company is involved in various claims, lawsuits and proceedings arising in the ordinary course of business. While there are uncertainties inherent in the ultimate outcome of such matters and it is impossible to presently determine the ultimate costs that may be incurred, management believes the resolution of such uncertainties and the incurrence of such costs will not have a material adverse effect on the Company’s consolidated financial position, results of operations or liquidity.
d.Capital Lease Obligations
The Company’s capital lease obligations outstanding were $1.0 million as of December 31, 2009 and $1.2 million as of December 31, 2008. These obligations bear interest rates ranging from 0.9% to 4.9% and mature in periods ranging from approximately one to five years.
e.Contingent Purchase Obligations
FromAs discussed in Note 7, from time to time, the Company agrees to pay additional consideration (or earnouts) for acquisitions if the towers or businesses that are acquired meet or exceed certain performance targets in the one to three years after they have been acquired. As of December 31, 2009, the Company has an obligation to pay up to an additional $11.5 million in consideration if the targets contained in various acquisition agreements are met. These obligations are associated with new build and tower acquisition programs within the Company’s site leasing segment. On certain acquisitions, at the Company’s option, additional consideration may be paid in cash or shares of Class A common stock. For the years ended December 31, 20092011 and 2008,2010, certain earnings targets associated with the acquired towers were achieved, and therefore, the Company paid in cash $3.4$4.6 million and $3.5$8.7 million, respectively. For the years endedAs of December 31, 2009 and 2008,2011, the Company’s estimate of its potential obligation if the performance targets contained in various acquisition agreements were met was $5.5 million which the Company issued approximately 78,000 shares and 67,000 shares, respectively,recorded in accrued expenses. The maximum potential obligation related to the performance targets was $11.0 million as of Class A common stock as a result of acquired towers exceeding certain performance targets.
SBA COMMUNICATIONS CORPORATION AND SUBSIDIARIES
NOTES TO CONSOLIDATED FINANCIAL STATEMENTS
21. DEFINED CONTRIBUTION PLAN
| 21. | DEFINED CONTRIBUTION PLAN |
The Company has a defined contribution profit sharing plan under Section 401(k) of the Internal Revenue Code that provides for voluntary employee contributions up to the limitations set forth in Section 402(g) of the Internal Revenue Code. Employees have the opportunity to participate following completion of three months of employment and must be 21 years of age. Employer matching begins immediately upon the employee’s participation in the plan. For the years ended December 31, 2009, 20082011, 2010 and 2007,2009, the Company made a discretionary matching contribution of 50% of an employee’s contributions up to a maximum of $3,000. Company matching contributions were approximately $0.7$0.9 million, $0.7 million and $0.7 million for years ended December 31, 2011, 2010 and 2009, 2008 and 2007, respectively.
22. PENSION PLANS
The Company had a defined benefit pension plan (the “Pension Plan”) which was included in the acquisition of AAT Communications in 2006. The Pension Plan was for all employees of AAT Communications hired on or before January 1, 1996. AAT ceased all benefit accruals for active participants on December 31, 1996. The Pension Plan provided for defined benefits based on the number of years of service and average salary.
During 2008, the Company began the process of terminating the Pension Plan. During the fourth quarter of 2008, the Company received a favorable determination letter from the Internal Revenue Service on the termination of the Pension Plan. As a result of terminating the plan, the Company recorded a settlement expense of $0.6 million in connection with the projected final benefit settlement which is included in selling, general and administrative expenses in the Consolidated Statement of Operations for the year ended December 31, 2008. In addition, in 2008 due to the termination of the plan, the Company recognized as a component of net periodic pension cost all amounts in accumulated other comprehensive income. As of December 31, 2009, the Company has made all benefit payments related to the termination of the Pension Plan.
SBA COMMUNICATIONS CORPORATION AND SUBSIDIARIES
NOTES TO CONSOLIDATED FINANCIAL STATEMENTS
The following table includes the components of pension costs, the fair value of plan assets, and the funded status of the Pension Plan for the year ended December 31, 2008:
| As of December 31, 2008 | ||||
| (in thousands) | ||||
Change in benefit obligation | ||||
Obligation at beginning of year | $ | 1,883 | ||
Interest Cost | 95 | |||
Actuarial gain (loss) | 271 | |||
Benefit payments | (139 | ) | ||
Settlement | (2,110 | ) | ||
Obligation at end of year | $ | — | ||
Change in fair value of plan assets | ||||
Fair value of plan assets at beginning of year | $ | 1,863 | ||
Actual return on plan assets | (260 | ) | ||
Employer contributions | 646 | |||
Benefits payments and plan expenses | (139 | ) | ||
Settlements | (2,110 | ) | ||
Fair value of plan assets at end of year | $ | — | ||
Funded status at the end of the year | $ | — | ||
As of December 31, 2009 and 2008, accumulated benefit obligation for the Pension Plan, the projected benefit obligation and fair value of plan assets were zero due to the termination of the Pension Plan.
The following table summarizes the components of net periodic pension costs:
| As of December 31, 2008 | ||||
| (in thousands) | ||||
Interest cost | $ | 95 | ||
Expected return on plan assets | (109 | ) | ||
Net periodic pension (income) / cost | (14 | ) | ||
Settlement loss | 609 | |||
Net periodic pension cost after settlements | $ | 595 | ||
Assumptions used to develop the net periodic pension cost were:
| 22. | |||
| |||
|
23. SEGMENT DATA
The Company operates principally in three business segments: site leasing, site development consulting, and site development construction. The Company’s reportable segments are strategic business units that offer different services. They are managed separately based on the fundamental differences in their operations. The site leasing
SBA COMMUNICATIONS CORPORATION AND SUBSIDIARIES
NOTES TO CONSOLIDATED FINANCIAL STATEMENTS
segment includes results of the managed sublease and DASsublease businesses. The Company’s net sales originating and long-lived assets held outside of the United States during each of the last three fiscal years were not material.
Revenues, cost of revenues (exclusive of depreciation, accretion and amortization), capital expenditures (including assets acquired through the issuance of shares of the Company’s Class A common stock) and identifiable assets pertaining to the segments in which the Company continues to operate are presented below:
| Site Leasing | Site Development Consulting | Site Development Construction | Not Identified by Segment(1) | Total | Site Leasing | Site Development Consulting | Site Development Construction | Not Identified by Segment(1) | Total | ||||||||||||||||||||||||||||
| (in thousands) | (in thousands) | ||||||||||||||||||||||||||||||||||||
For the year ended December 31, 2011 | |||||||||||||||||||||||||||||||||||||
Revenues | $ | 616,294 | $ | 17,272 | $ | 64,604 | $ | — | $ | 698,170 | |||||||||||||||||||||||||||
Cost of revenues(2) | $ | 131,916 | $ | 12,984 | $ | 58,022 | $ | — | $ | 202,922 | |||||||||||||||||||||||||||
Depreciation, amortization and accretion | $ | 306,399 | $ | 195 | $ | 1,375 | $ | 1,177 | $ | 309,146 | |||||||||||||||||||||||||||
Operating income (loss) | $ | 116,668 | $ | 2,573 | $ | (483 | ) | $ | (8,099 | ) | $ | 110,659 | |||||||||||||||||||||||||
Capital expenditures(3) | $ | 502,222 | $ | 535 | $ | 3,401 | $ | 2,670 | $ | 508,828 | |||||||||||||||||||||||||||
For the year ended December 31, 2010 | |||||||||||||||||||||||||||||||||||||
Revenues | $ | 535,444 | $ | 19,210 | $ | 71,965 | $ | — | $ | 626,619 | |||||||||||||||||||||||||||
Cost of revenues(2) | $ | 119,141 | $ | 14,975 | $ | 65,326 | $ | — | $ | 199,442 | |||||||||||||||||||||||||||
Depreciation, amortization and accretion | $ | 276,598 | $ | 185 | $ | 1,056 | $ | 888 | $ | 278,727 | |||||||||||||||||||||||||||
Operating income (loss) | $ | 78,422 | $ | 2,552 | $ | (25 | ) | $ | (6,676 | ) | $ | 74,273 | |||||||||||||||||||||||||
Capital expenditures(3) | $ | 393,133 | $ | 234 | $ | 1,501 | $ | 925 | $ | 395,793 | |||||||||||||||||||||||||||
For the year ended December 31, 2009 | |||||||||||||||||||||||||||||||||||||
Revenues | $ | 477,007 | $ | 17,408 | $ | 61,098 | $ | — | $ | 555,513 | $ | 477,007 | $ | 17,408 | $ | 61,098 | $ | — | $ | 555,513 | |||||||||||||||||
Cost of revenues | $ | 111,842 | $ | 13,234 | $ | 55,467 | $ | — | $ | 180,543 | |||||||||||||||||||||||||||
Cost of revenues(2) | $ | 111,842 | $ | 13,234 | $ | 55,467 | $ | — | $ | 180,543 | |||||||||||||||||||||||||||
Depreciation, amortization and accretion | $ | 256,703 | $ | 183 | $ | 811 | $ | 840 | $ | 258,537 | $ | 256,703 | $ | 183 | $ | 811 | $ | 840 | $ | 258,537 | |||||||||||||||||
Operating income (loss) | $ | 60,542 | $ | 2,366 | $ | (887 | ) | $ | (7,067 | ) | $ | 54,954 | $ | 60,542 | $ | 2,366 | $ | (887 | ) | $ | (7,067 | ) | $ | 54,954 | |||||||||||||
Capital expenditures (2) | $ | 246,569 | $ | 104 | $ | 794 | $ | 625 | $ | 248,092 | |||||||||||||||||||||||||||
For the year ended December 31, 2008 | |||||||||||||||||||||||||||||||||||||
Revenues | $ | 395,541 | $ | 18,754 | $ | 60,659 | $ | — | $ | 474,954 | |||||||||||||||||||||||||||
Cost of revenues | $ | 96,175 | $ | 15,212 | $ | 56,778 | $ | — | $ | 168,165 | |||||||||||||||||||||||||||
Depreciation, amortization and accretion | $ | 209,298 | $ | 181 | $ | 759 | $ | 1,207 | $ | 211,445 | |||||||||||||||||||||||||||
Operating income (loss) | $ | 50,290 | $ | 1,747 | $ | (2,100 | ) | $ | (4,355 | ) | $ | 45,582 | |||||||||||||||||||||||||
Capital expenditures (2) | $ | 915,452 | $ | 188 | $ | 688 | $ | 748 | $ | 917,076 | |||||||||||||||||||||||||||
For the year ended December 31, 2007 | |||||||||||||||||||||||||||||||||||||
Revenues | $ | 321,818 | $ | 24,349 | $ | 62,034 | $ | — | $ | 408,201 | |||||||||||||||||||||||||||
Cost of revenues | $ | 88,006 | $ | 19,295 | $ | 56,052 | $ | — | $ | 163,353 | |||||||||||||||||||||||||||
Depreciation, amortization and accretion | $ | 166,785 | $ | 177 | $ | 749 | $ | 1,521 | $ | 169,232 | |||||||||||||||||||||||||||
Operating income (loss) | $ | 39,878 | $ | 2,468 | $ | (906 | ) | $ | (11,393 | ) | $ | 30,047 | |||||||||||||||||||||||||
Capital expenditures (2) | $ | 384,430 | $ | 138 | $ | 408 | $ | 682 | $ | 385,658 | |||||||||||||||||||||||||||
Capital expenditures(3) | $ | 246,569 | $ | 104 | $ | 794 | $ | 625 | $ | 248,092 | |||||||||||||||||||||||||||
Assets | |||||||||||||||||||||||||||||||||||||
As of December 31, 2009 | $ | 3,093,379 | $ | 4,651 | $ | 27,587 | $ | 188,029 | $ | 3,313,646 | |||||||||||||||||||||||||||
As of December 31, 2008 (as adjusted) | $ | 3,092,965 | $ | 4,375 | $ | 25,413 | $ | 85,076 | $ | 3,207,829 | |||||||||||||||||||||||||||
|
| ||||||||||||||||||||||||||||||||||||
As of December 31, 2011 | $ | 3,439,401 | $ | 4,787 | $ | 37,377 | $ | 124,834 | $ | 3,606,399 | |||||||||||||||||||||||||||
As of December 31, 2010 | $ | 3,218,892 | $ | 4,458 | $ | 35,567 | $ | 141,258 | $ | 3,400,175 | |||||||||||||||||||||||||||
| (1) | Assets not identified by segment consist primarily of general corporate assets. |
| (2) | Excludes depreciation, amortization and accretion. |
| (3) | Includes acquisitions and related earn-outs and vehicle capital lease additions. |
For the year ended December 31, 2011, 2010, and 2009, the Company’s leasing revenues generated outside of the United States were 3.4%, 1.0%, and 0.2%, respectively, of total consolidated leasing revenues. As of December 31, 2011 and 2010, the Company’s total assets outside of the United States were 8.7% and 3.2%, respectively, of total consolidated assets.
SBA COMMUNICATIONS CORPORATION AND SUBSIDIARIES
NOTES TO CONSOLIDATED FINANCIAL STATEMENTS
24. QUARTERLY FINANCIAL DATA (unaudited)
| Quarter Ended | ||||||||||||||||
| December 31, 2009 | September 30, 2009 | June 30, 2009 | March 31, 2009 | |||||||||||||
| (in thousands, except per share amounts) | ||||||||||||||||
Revenues | $ | 144,979 | $ | 139,289 | $ | 136,195 | $ | 135,050 | ||||||||
Operating income | 12,054 | 14,952 | 13,598 | 14,350 | ||||||||||||
Depreciation, accretion and amortization | (65,687 | ) | (64,946 | ) | (64,251 | ) | (63,653 | ) | ||||||||
(Loss) gain from extinguishment of debt, net | (1,472 | ) | (12,518 | ) | 2,381 | 5,948 | ||||||||||
Net loss attributable to SBA Communications Corporation | $ | (43,512 | ) | $ | (50,109 | ) | $ | (29,360 | ) | $ | (17,890 | ) | ||||
Net loss per share - basic and diluted | $ | (0.37 | ) | $ | (0.43 | ) | $ | (0.25 | ) | $ | (0.15 | ) | ||||
| Quarter Ended | ||||||||||||||||
| December 31, 2008 | September 30, 2008 | June 30, 2008 | March 31, 2008 | |||||||||||||
| (as adjusted) | (as adjusted) | (as adjusted) | (as adjusted) | |||||||||||||
| (in thousands, except per share amounts) | ||||||||||||||||
Revenues | $ | 134,429 | $ | 118,656 | $ | 111,952 | $ | 109,917 | ||||||||
Operating income | 11,527 | 11,427 | 10,790 | 11,838 | ||||||||||||
Depreciation, accretion, and amortization | (62,114 | ) | (52,725 | ) | (49,253 | ) | (47,353 | ) | ||||||||
Gain (loss) from extinguishment of debt, net | 44,683 | (414 | ) | — | — | |||||||||||
Net income (loss) attributable to SBA Communications Corporation | $ | 5,953 | $ | (27,648 | ) | $ | (26,243 | ) | $ | (19,226 | ) | |||||
Net income (loss) per share - basic | $ | 0.05 | $ | (0.26 | ) | $ | (0.24 | ) | $ | (0.18 | ) | |||||
Net income (loss) per share - diluted | $ | 0.05 | $ | (0.26 | ) | $ | (0.24 | ) | $ | (0.18 | ) | |||||
| 23. | QUARTERLY FINANCIAL DATA (unaudited) |
| Quarter Ended | ||||||||||||||||
| December 31, | September 30, | June 30, | March 31, | |||||||||||||
| 2011 | 2011 | 2011 | 2011 | |||||||||||||
| (in thousands, except per share amounts) | ||||||||||||||||
Revenues | $ | 183,819 | $ | 175,549 | $ | 171,053 | $ | 167,749 | ||||||||
Depreciation, accretion and amortization | $ | (79,441 | ) | $ | (78,136 | ) | $ | (76,691 | ) | $ | (74,878 | ) | ||||
Operating income | $ | 31,980 | $ | 27,571 | $ | 27,209 | $ | 23,899 | ||||||||
Loss from extinguishment of debt, net | $ | — | $ | — | $ | — | $ | (1,696 | ) | |||||||
Net loss attributable to SBA Communications Corporation | $ | (29,081 | ) | $ | (33,305 | ) | $ | (29,819 | ) | $ | (34,251 | ) | ||||
Net loss per share – basic and diluted | $ | (0.27 | ) | $ | (0.30 | ) | $ | (0.27 | ) | $ | (0.30 | ) | ||||
| Quarter Ended | ||||||||||||||||
| December 31, 2010 | September 30, 2010 | June 30, 2010 | March 31, 2010 | |||||||||||||
| (in thousands, except per share amounts) | ||||||||||||||||
Revenues | $ | 165,497 | $ | 158,642 | $ | 154,515 | $ | 147,965 | ||||||||
Depreciation, accretion and amortization | $ | (72,723 | ) | $ | (69,727 | ) | $ | (68,831 | ) | $ | (67,446 | ) | ||||
Operating income | $ | 16,695 | $ | 20,668 | $ | 20,024 | $ | 16,886 | ||||||||
Loss from extinguishment of debt, net | $ | (6 | ) | $ | (10 | ) | $ | (48,932 | ) | $ | (112 | ) | ||||
Net loss attributable to SBA Communications Corporation | $ | (39,161 | ) | $ | (34,488 | ) | $ | (83,699 | ) | $ | (37,326 | ) | ||||
Net loss per share – basic and diluted | $ | (0.34 | ) | $ | (0.30 | ) | $ | (0.72 | ) | $ | (0.32 | ) | ||||
Basic and diluted net income (loss)loss per share is computed by dividing net income by the weighted average number of shares for the period. Diluted net income per share for the quarter ended December 31, 2008 is computed by dividing net income by the weighted average number of common shares outstanding during the period plus potentially dilutive common shares arising from the assumed exercise of stock options and convertible debt, if dilutive. The dilutive impact of potentially dilutive stock options is determined by applying the treasury stock method and the dilutive impact of the convertible debt is determined by applying the “if converted” method. Potentially dilutive shares for the periods prior to the quarter ended December 31, 2008 and subsequent quarters have been excluded from the computation of diluted loss per share as their impact would have been anti-dilutive.
Because loss per share amounts are calculated using the weighted average number of common and dilutive common shares outstanding during each quarter, the sum of the per share amounts for the four quarters may not equal the total loss per share amounts for the year.
| 24. | SUBSEQUENT EVENTS |
F-54On February 18, 2012 the Company entered into a purchase and sale agreement with certain affiliates of Mobilitie, LLC, under which the Company will purchase certain entities owning approximately 2,300 tower sites in the US and Central America and nine distributed antenna system (DAS) networks in the US for $1.093 billion. The consideration to be paid will be $850 million cash and the issuance of 5.25 million shares of the Company’s Class A common stock. The cash consideration will be paid from a combination of cash on hand, existing credit facilities and $500 million of new financing commitments. The closing of the transactions is scheduled to be completed in the second quarter of fiscal 2012.
Additionally, subsequent to December 31, 2012, the Company acquired an additional 64 towers and the rights to manage two additional communication sites for an aggregate consideration of approximately $34.7 million in cash.
F-44