| | | | | Title of Each Class | | Name of Each Exchange on Which Registered | Common Stock, $1.00 | | The NASDAQ Stock Market, Inc. |
Securities registered pursuant to Section 12(g) of the Act: None. Indicate by check mark if the registrant is a well-known seasoned issuer, as defined in Rule 405 of the Securities Act. Yes ¨ No x Indicate by check mark if the registrant is not required to file reports pursuant to Section 13 or Section 15(d) of the Act. Yes ¨ No x Indicate by check mark whether the registrant: (1) has filed all reports required to be filed by Section 13 or 15(d) of the Securities Exchange Act of 1934 during the preceding 12 months (or for such shorter period that the registrant was required to file such reports), and (2) has been subject to such filing requirements for the past 90 days. Yes x No ¨ Indicate by check mark if disclosure of delinquent filers pursuant to Item 405 of Regulation S-K is not contained herein, and will not be contained, to the best of registrant’s knowledge, in definitive proxy or information statements incorporated by reference in Part III of this Form 10-K or any amendment to this Form 10-K. x Indicate by check mark whether the registrant has submitted electronically and posted on its corporate Web site, if any, every Interactive Data File required to be submitted and posted pursuant to Rule 405 of Regulation S-T (§(§232.405 of this chapter) during the preceding 12 months (or for such shorter period that the registrant was required to submit and post such files). Yes ¨ No ¨ Indicate by check mark whether the registrant is a large accelerated filer, an accelerated filer, a non-accelerated filer or a smaller reporting company. See definition of “large accelerated filer”, “accelerated filer”, and “smaller reporting company” in Rule 12b-2 of the Exchange Act. (Check One). Large accelerated filer Accelerated Filer Non-accelerated Filer Smaller Reporting Company | | | | | | | Large accelerated filer | | ¨ | | Accelerated Filer | | x | | | | | Non-accelerated Filer | | ¨ | | Smaller Reporting Company | | ¨ |
Indicated by check mark whether the registrant is a shell company (as defined in Rule 12b-2 of the Act). Yes ¨ No x The aggregate market value of the registrant’s voting and non-voting common equity held by non-affiliates computed by reference to the closing price of the common equity of $15.80$10.95 per share, as reported by NASDAQ, on June 30, 2009,29, 2012, the last business day of the registrant’s most recently completed second fiscal quarter was approximately $54,980,524.$38,184,074. As of February 1, 2010,15, 2013, the registrant had 3,479,7803,489,684 shares of common stock outstanding. DOCUMENTS INCORPORATED BY REFERENCE Portions of the registrant’s definitive proxy statement to be used in connection with the 20102013 Annual Meeting of Shareholders is incorporated herein by reference in partial response to Part III, hereof.
FORM 10-K TABLE OF CONTENTS
PART I PART IITEM 1.BUSINESS
ITEM 1.BUSINESS
The disclosures set forth in this Item are qualified by the section captioned “Special Cautionary Notice Regarding Forward-Looking Statements” contained in Part II, Item 7. Management’s Discussion and Analysis of Financial Condition and Results of Operations of this report and other cautionary statements set forth elsewhere in this report. Mid Penn Bancorp, Inc., Inc.
Mid Penn Bancorp, Inc., Mid Penn Bancorp, Inc. is a one-bank holding company, incorporated in the Commonwealth of Pennsylvania in August 1991. Mid Penn Bancorp, Inc., Inc. and its wholly owned subsidiaries are collectively referred to herein as “Mid Penn” or the “Corporation.” On December 31, 1991, Mid Penn acquired, as part of the holding company formation, all of the outstanding common stock of Mid Penn Bank, and the Bank became a wholly owned subsidiary of Mid Penn. Mid Penn’s other wholly owned subsidiaries are Mid Penn Insurance Services, LLC which provides a range of personal and investment insurance products and Mid Penn Investment Corporation, which is engaged in investing activities.Corporation. Mid Penn’s primary business is to supervise and coordinate the business of its subsidiaries and to provide them with capital and resources. Mid Penn Investment Corporation engaged in investing activities. A decision was made to close the Mid Penn Investment Corporation, effective August 31, 2010 due to lack of activity within the subsidiary. In August of 2010, Mid Penn Insurance Services, LLC was revived as a wholly-owned subsidiary of Mid Penn Bank to provide a wide range of personal and commercial insurance products. Mid Penn’s consolidated financial condition and results of operations consist almost entirely of that of Mid Penn Bank, which is managed as a single business segment. At December 31, 2009,2012, Mid Penn had total consolidated assets of $606,010,000,$705,200,000, total deposits of $500,015,000,$625,461,000, and total shareholders’ equity of $46,704,000.$52,220,000. As of December 31, 2009,2012, Mid Penn Bancorp, Inc., Inc. did not own or lease any properties. Mid Penn Bank owns or leases the banking offices as identified in Part I, Item 2. All Mid Penn employees are employed by Mid Penn Bank. At December 31, 2009,2012, the Bank had 155185 full-time and 3319 part-time employees. The Bank and its employees are not subject to a collective bargaining agreement, and the Bank believes it enjoys good relations with its personnel. Mid Penn Bank Millersburg Bank, the predecessor to Mid Penn Bank (the “Bank”), was organized in 1868, and became a state chartered bank in 1931, obtaining trust powers in 1935, at which time its name was changed to Millersburg Trust Company. In 1962, the Lykens Valley Bank merged with and into Millersburg Trust Company. In 1971, Farmer’s State Bank of Dalmatia merged with Millersburg Trust Company and the resulting entity adopted the name “Mid Penn Bank.” In 1985, the Bank acquired Tower City National Bank. In 1998, Mid Penn acquired Miners Bank of Lykens, which was merged into Mid Penn Bank. The Pennsylvania Department of Banking and the Federal Deposit Insurance Corporation supervise the Bank. Mid Penn’s and the Bank’s legal headquarters are located at 349 Union Street, Millersburg, Pennsylvania 17061. The Bank presently has 14 offices located in Dauphin, Northumberland, Schuylkill, and Cumberland Counties, Pennsylvania. Mid Penn’s primary business consists of attracting deposits and loans from its network of community banking offices operated by the Bank. The Bank engages in full-service commercial banking and trust business, making available to the community a wide range of financial services, including, but not limited to, installment loans, personal loans, mortgage and home equity loans, secured and unsecured commercial and consumer loans, lines of credit, construction financing, farm loans, community development and local government loans and various types of time and demand deposits. Deposits of the Bank are insured by the Bank Insurance Fund of the FDIC to the maximum extent provided by law. In addition, the Bank provides a full range of trust services through its Trust Department.and retail investment services. The Bank also offers other services such as Internet banking, telephone banking, cash management services, automated teller services and safe deposit boxes.
In addition, the Bank has a wholly-owned subsidiary, Mid Penn Insurance Services, LLC, which provides a wide range of personal and commercial insurance products. Business Strategy The Bank provides an arrayengages in a full-service commercial banking and trust business, making available to the community a wide range of sophisticated products typically found only in major regional banks.financial services. These services are provided to small and middle marketmiddle-market businesses, high net worth individuals, and retail consumers through 14 full service banking facilities. Several banking locations have seasoned management with significant lending experience who are responsible for credit and pricing decisions, subject to loan committee approval for larger credits. This decentralized relationship management approach, coupled with the continuity of service by its banking officers, enables theThe Bank seeks to develop long-term customer relationships, maintain high quality service and provide quick responses to customer needs. Mid Penn believes that itsan emphasis on local relationship building together withand its conservative approach to lending are important factors in the success and the growth of Mid Penn.
The Bank seeks credit opportunities of good quality within its target market that exhibit positive historical trends, stable cash flows and secondary sources of repayment from tangible collateral. The Bank extends credit for the purpose of obtaining and continuing long-term relationships. Lenders are provided with detailed underwriting policies for all types of credit risks accepted by the Bank and must obtain appropriate approvals for credit extensions in excess of conservatively assigned lending limits. The Bank also maintains strict documentation requirements and extensive credit quality assurance practices in order to identify credit portfolio weaknesses as early as possible so any exposures that are discovered might be reduced. 1
MID PENN BANCORP, INC.Lending Activities
Lending Activities
The Bank offers a variety of loan products to its customers, including loans secured by real estate, commercial and consumer loans. The Bank’s lending objectives are as follows: · | to establish a diversified commercial loan portfolio; and |
· | to provide a satisfactory return to Mid Penn’s shareholders by properly pricing loans to include the cost of funds, administrative costs, bad debts, local economic conditions, competition, customer relationships, the term of the loan, credit risk, collateral quality and a reasonable profit margin. |
to provide a satisfactory return to Mid Penn’s shareholders by properly pricing loans to include the cost of funds, administrative costs, bad debts, local economic conditions, competition, customer relationships, the term of the loan, credit risk, collateral quality and a reasonable profit margin.
Credit risk is managed through portfolio diversification, underwriting policies and procedures and loan monitoring practices. The Bank generally secures its loans with real estate with such collateral values dependent and subject to change based on real estate market conditions within its market area. As of December 31, 2009,2012, the Bank’s highest concentrationsconcentration of credit wereis in Commercial Real Estate, Hotel/Motel, Commercial Construction and Land Development, and Restaurant financings.Estate. Most of the Bank’s business activity with customers was located in Central Pennsylvania, specifically in Dauphin, lower Northumberland, western Schuylkill, and eastern Cumberland Counties. Investment Activities Mid Penn’s investment portfolio is used to improve earnings through investments of funds in higher-yielding assets than overnight funding alternatives, while maintaining asset quality, which provides the necessary balance sheet liquidity for Mid Penn. Mid Penn does not have any significant concentrations within investment securities. Mid Penn’s entire portfolio of investment securities is considered available for sale. As such, the investments are recorded on the balance sheet at fair value. Mid Penn’s investments include US Treasury, agency and municipal securities that are given a market price relative to investments of the same type with similar maturity dates. As the interest rate environment changes, Mid Penn’s fair value of existing securities will change. This difference in value, or unrealized gain, amounted to $1,238,000,$3,685,000, as of December 31, 2009.2012. A majority of the investments are high quality United States and municipal securities that, if held to maturity, are expected to result in no loss to the Bank. For additional information with respect to Mid Penn’s business activities, see Part II, Item 7 of this report, which is incorporated herein by reference. Sources of Funds The Bank primarily uses deposits and borrowings to finance lending and investment activities. Borrowing sources include advances from the Federal Home Loan Bank of Pittsburgh reverse repurchase agreements with investment banks and overnight borrowings from the Bank’s customers and correspondent bank.banks. All borrowings, except for the linelines of credit with the Bank’s correspondent bank,banks, require collateral in the form of loans or securities. Collateral levels, therefore, limit borrowings and the available lines of credit extended by the Bank’s creditors. As a result, deposits remain keycritical to the future funding and growth of the business. Deposit growth within the banking industry has been subject to strong competition from a variety of financial services companies. This competition may require financial institutions to adjust their product offerings and pricing to adequately grow deposits. Competition The banking business is highly competitive, and the profitability of Mid Penn depends principally upon the Bank’s ability to compete in its market area. The Bank actively competes with other financial services companies for deposit, loan, and loantrust business. Competitors include other commercial banks, credit unions, savings banks, savings and loan associations, insurance companies, securities brokerage firms, credit unions, finance companies, mutual funds, and money market funds.service alternatives via the Internet. Financial institutions compete primarily on the quality of services rendered, interest rates on loans and deposits, service charges, the convenience of banking facilities, location and hours of operation and, in the case of loans to larger commercial borrowers, relative lending limits. Many competitors are significantly larger than the Bank and have significantly greater financial resources, personnel and locations from which to conduct business. In addition, the Bank is subject to banking regulations while certain competitors may not be. There are relatively few barriers for companies wanting to enter into the financial services industry. For more information, see the “Supervision and Regulation” section below. 2
Mid Penn has been able to compete effectively with other financial institutions by emphasizing technology andcustomer service. Mid Penn’s customer service includingmodel is based on convenient hours, efficient and friendly employees, local decision making, on loans, establishing long-term customer relationships and building customer loyalty, and providing products and services designed to address the specific needs of its customers.quality products. The Gramm-Leach-Bliley Act (see discussion below), which breaks down many barriers between the banking, securities and insurance industries, may significantly affect the competitive environment in which Mid Penn operates. The growth of mutual funds over the past decade has made it increasingly difficult for financial institutions to attract deposits. The continued flow of cash into mutual funds, much of which is made through tax deferred investment vehicles such as 401(k) plans, and a generally strong economy, have, until recently, fueled high returns for these investments, in particular, certain equity funds. The recent economic turmoil has negatively impacted the returns on many of these investments and impacted the manner in which investors distribute their funds across investment alternatives. The safety of traditional bank products has recentlyagain become an attractive option during this period of market volatility. Mid Penn’s ability to attract funds in the future will be impacted by the public’s appetite for the safety of insured or local investments versus the returns offered by alternative choices as part of their personal investment mix. Mid Penn’s success is dependent to a significant degree on economic conditions in Central Pennsylvania, especially in Dauphin, lower Northumberland, western Schuylkill and eastern Cumberland Counties, which Mid Penn defines as our primary market. The banking industry is affected by general economic conditions including the effects of inflation, recession, unemployment, real estate values, trends in the national and global economics, and other factors beyond our control. An economic recession or a delayed recovery over a prolonged period of time in the Central Pennsylvania area could cause an increase in the level of the Bank’s non-performing assets and loan and lease losses, thereby causing operating losses, impairing liquidity and eroding capital. Mid Penn cannot assure you that adverse changes in the local economy would not have a material adverse effect on Mid Penn’s consolidated financial condition, results of operations, and cash flows.
Supervision and Regulation
General Bank holding companies and banks are extensively regulated under both Federal and state laws. The regulation and supervision of Mid Penn and the Bank are designed primarily for the protection of depositors, the Deposit Insurance Fund, and the monetary system, and not Mid Penn or its shareholders. Enforcement actions may include the imposition of a conservator or receiver, cease-and-desist orders and written agreements, the termination of insurance on deposits, the imposition of civil money penalties, and removal and prohibition orders. If a banking regulator takes any enforcement action, the value of an equity investment in Mid Penn could be substantially reduced or eliminated. Federal and state banking laws contain numerous provisions affecting various aspects of the business and operations of Mid Penn and the Bank. Mid Penn is subject to, among others, the regulations of the Securities and Exchange Commission and the Federal Reserve Board, and the Bank is subject to, among others, the regulations of the Pennsylvania Department of Banking and Securities and the Federal Deposit Insurance Corporation.Corporation (“FDIC”). The following descriptions of and references to applicable statutes and regulations are not intended to be complete descriptions of these provisions or their effects on Mid Penn or the Bank. They are summaries only and are qualified in their entirety by reference to such statutes and regulations.
Holding Company Regulation Mid Penn is a registered bank holding company subject to supervision and regulation by the Board of Governors of the Federal Reserve System (the “Federal Reserve”). As such, it is subject to the Bank Holding Company Act of 1956 (“BHCA”) and many of the Federal Reserve’s regulations promulgated thereunder. The Federal Reserve has broad enforcement powers over bank holding companies, including the power to impose substantial fines and civil penalties. The BHCA requires Mid Penn to file an annual report with the Federal Reserve regarding the holding company and its subsidiary bank. The Federal Reserve Board also makes examinations of the holding company. The Bank is not a member of the Federal Reserve System; however, the Federal Reserve possesses cease-and-desist powers over bank holding companies and their subsidiaries where their actions would constitute an unsafe or unsound practice or violation of law. The Federal Reserve Board also makes policy that guides the declaration and distribution of dividends by bank holding companies. The BHCA restricts a bank holding company’s ability to acquire control of additional banks. In addition, the BHCA restricts the activities in which bank holding companies may engage directly or through non-bank subsidiaries.
Gramm-Leach-Bliley Financial Modernization Act The Gramm-Leach-Bliley Act (“GLB”) became effective on March 11, 2000. The primary purpose of GLB was to eliminate barriers between investment banking and commercial banking and to permit, within certain limitations, the affiliation of financial service providers. Generally, GLB: · | repealed the historical restrictions against, and eliminated many federal and state law barriers to affiliations among banks, securities firms, insurance companies and other financial service providers; |
· | provided a uniform framework for the activities of banks, savings institutions and their holding companies; |
3
MID PENN BANCORP, INC.
· | broadened the activities that may be conducted by and through national banks and other banking subsidiaries of bank holding companies; |
· | provided an enhanced framework for protecting the privacy of consumers’ information; |
· | adopted a number of provisions related to the capitalization, membership, corporate governance and other measures designed to modernize the Federal Home Loan Bank System; |
· | modified the laws governing the implementation of the Community Reinvestment Act; and |
· | addressed a variety of other legal and regulatory issues affecting both day-to-day operations and long-term activities of financial institutions. |
More specifically, under GLB, bank holding companies, such as Mid Penn, that meet certain management, capital, and Community Reinvestment Act standards, are permitted to become financial holding companies and, by doing so, to affiliate with securities firms and insurance companies and to engage in other activities that are financial in nature, incidental to such financial activities, or complementary to such activities. A bank holding company may become a financial holding company if each of its subsidiary banks is well capitalized under the FDIC Improvement Act’s prompt corrective action provisions, is well managed and has at least a satisfactory rating under the Community Reinvestment Act. The required filing is a declaration that the bank holding company wishes to become a financial holding company and meets all applicable requirements. Mid Penn has not elected to become a financial holding company at this time. No prior regulatory approval will be required for a financial holding company to acquire a company, other than a bank or savings association, engaged in activities permitted under GLB. Activities cited by GLB as being financial in nature include: · | securities underwriting, dealing and market making; |
· | sponsoring mutual funds and investment companies; |
· | insurance underwriting and agency; |
· | merchant banking activities; and |
· | activities that the Federal Reserve has determined to be closely related to banking. |
sponsoring mutual funds and investment companies;
insurance underwriting and agency;
merchant banking activities; and
activities that the Federal Reserve has determined to be closely related to banking.
In addition to permitting financial services providers to enter into new lines of business, the law allows firms the freedom to streamline existing operations and to potentially reduce costs. The Act may increase both opportunity as well as competition. Many community banks are less able to devote the capital and management resources needed to facilitate broad expansion of financial services including insurance and brokerage services.
Corporate Governance On July 30, 2002, the Sarbanes-Oxley Act of 2002 was enacted. The Sarbanes-Oxley Act represents a comprehensive revision of laws affecting corporate governance, auditor independence and accounting standards, executive compensation, insider loans, whistleblower protection, and enhanced and timely disclosure of corporate information. The Sarbanes-Oxley Act is applicable to all companies with equity securities registered or that file reports under the Securities Exchange Act of 1934. In particular, the Sarbanes-Oxley Act established: · | new requirements for audit committees, including independence, expertise and responsibilities; |
· | additional responsibilities regarding financial statements for the Chief Executive Officer and Chief Financial Officer of the reporting company; |
· | new standards for auditors and regulation of audits; |
· | increased disclosure and reporting obligations for the reporting company and its directors and executive officers; and |
· | new and increased civil and criminal penalties for violations of the securities laws. |
additional responsibilities regarding financial statements for the Chief Executive Officer and Chief Financial Officer of the reporting company;
new standards for auditors and regulation of audits;
increased disclosure and reporting obligations for the reporting company and its directors and executive officers; and
new and increased civil and criminal penalties for violations of the securities laws.
The SEC and NASDAQ have adopted numerous rules implementing the provisions of the Sarbanes-Oxley Act that affect Mid Penn. The changes are intended to allow shareholders to monitor more effectively the performance of companies and management.
Bank Regulation The Bank, a Pennsylvania-chartered institution, is subject to supervision, regulation and examination by the Pennsylvania Department of Banking and Securities and the FDIC. The deposits of the Bank are insured by the FDIC to the extent provided by law. The FDIC assesses deposit insurance premiums the amount of which may, in the future, depend in part on the condition of the Bank. Moreover, the FDIC may terminate deposit insurance of the Bank under certain circumstances. The Bank regulatory agencies have broad enforcement powers over depository institutions under their jurisdiction, including the power to terminate deposit insurance, to impose fines and other civil and criminal penalties, and to appoint a conservator or receiver if any of a number of conditions is met. In addition, the Bank is subject to a variety of local, state and federal laws that affect its operations. Banking regulations include, but are not limited to, permissible types and amounts of loans, investments and other activities, capital adequacy, branching, interest rates on loans and the safety and soundness of banking practices. 4
MID PENN BANCORP, INC.Capital Requirements
Capital Requirements
Under risk-based capital requirements for bank holding companies, Mid Penn is required to maintain a minimum ratio of total capital to risk-weighted assets (including certain off-balance-sheet activities, such as standby letters of credit) of eight percent. At least half of the total capital is to be composed of common equity, retained earnings and qualifying perpetual preferred stock, less goodwill (“Tier 1 Capital” and together with Tier 2 Capital, Total Capital”). The remainder may consist of subordinated debt, non-qualifying preferred stock and a limited amount of the loan loss allowance (“Tier 2 Capital”).
In addition, the Federal Reserve Board has established minimum leverage ratio requirements for bank holding companies. These requirements provide for a minimum leverage ratio of Tier 1 Capital to adjusted average quarterly assets (“leverage ratio”) equal to 3% for bank holding companies that meet certain specified criteria, including having the highest regulatory rating. All other bank holding companies will generally be required to maintain a leverage ratio of at least 4-5%. The requirements also provide that bank holding companies experiencing internal growth or making acquisitions will be expected to maintain strong capital positions substantially above the minimum supervisory levels without significant reliance on intangible assets. Furthermore, the requirements indicate that the Federal Reserve Board will continue to consider a “Tangible Tier 1 Leverage Ratio” (deducting all intangibles) in evaluating proposals for expansion or new activity. The Federal Reserve Board has not advised Mid Penn of any specific minimum Tier 1 leverage ratio. The Bank is subject to similar capital requirements adopted by the FDIC. The FDIC has not advised the Bank of any specific minimum leverage ratios. The capital ratios of Mid Penn and the Bank are described in Note 1817 to Mid Penn’s Consolidated Financial Statements, which are incorporated herein by reference. Banking regulators continue to indicate their desire to further develop capital requirements applicable to banking organizations. Changes to capital requirements could materially affect the profitability of Mid Penn or the fair value of Mid Penn stock.
FDIC Improvement Act As a result of the FDIC Improvement Act of 1991, banks are subject to increased reporting requirements and more frequent examinations by the bank regulatory agencies. The agencies also have the authority to dictate certain key decisions that formerly were left to management, including compensation standards, loan underwriting standards, asset growth, and payment of dividends. Failure to comply with these standards, or failure to maintain capital above specified levels set by the regulators, could lead to the imposition of penalties or the forced resignation of management. If a bank becomes critically undercapitalized, the banking agencies have the authority to place an institution into receivership.
Safety and Soundness Standards Pursuant to FDICIA, the federal banking regulatory agencies have adopted a set of guidelines prescribing safety and soundness standards for depository institutions such as the Bank. The guidelines establish general standards relating to internal controls and information systems, internal audit systems, loan documentation, credit underwriting, interest rate exposure, asset growth, asset quality, earnings and compensation, fees and benefits. In general, the guidelines require, among other things, appropriate systems and practices to identify and manage the risks and exposures specified in the guidelines. The guidelines prohibit excessive compensation as an unsafe and unsound practice and describe compensation as excessive when the amounts paid are unreasonable or disproportionate to the services performed by an executive officer, employee, director or principal shareholder. In addition, the agencies adopted regulations that authorize an agency to order an institution that has been given notice by an agency that it is not satisfying any of such safety and soundness standards to submit a compliance plan. If the institution fails to submit an acceptable compliance plan or fails to implement an accepted plan, the agency must issue an order directing action to correct the deficiency and may issue an order directing other actions be taken, including restricting asset growth, restricting interest rates paid on deposits, and requiring an increase in the institution’s ratio of tangible equity to assets.
Payment of Dividends and Other Restrictions Mid Penn is a legal entity separate and distinct from its subsidiary, the Bank. There are various legal and regulatory limitations on the extent to which the Bank can, among other things, finance, or otherwise supply funds to, Mid Penn. Specifically, dividends from the Bank are the principal source of Mid Penn’s cash funds and there are certain legal restrictions under Pennsylvania law and Pennsylvania banking regulations on the payment of dividends by state-chartered banks. The relevant regulatory agencies also have authority to prohibit Mid Penn and the Bank from engaging in what, in the opinion of such regulatory body, constitutes an unsafe or unsound banking practice. The payment of dividends could, depending upon the financial condition of Mid Penn and the Bank, be deemed to constitute such an unsafe or unsound practice. Further, under the terms of the Capital Purchase Program (“CPP”), Mid Penn is restricted from increasing its dividends on its common stock above the last per share quarterly dividend declared prior to October 14, 2008 ($0.20 per share) without permission as long as the CPP preferred stock is outstanding. 5
MID PENN BANCORP, INC.
Prompt Corrective Action In addition to the required minimum capital levels described above, federal law establishes a system of “prompt corrective actions” which Federal banking agencies are required to take, and certain actions which they have discretion to take, based upon the capital category into which a federally regulated depository institution falls. Regulations set forth detailed procedures and criteria for implementing prompt corrective action in the case of any institution, which is not adequately capitalized. Under the rules, an institution will be deemed to be “adequately capitalized” if it exceeds the minimum Federal regulatory capital requirements. However, it will be deemed “undercapitalized” if it fails to meet the minimum capital requirements, “significantly undercapitalized” if it has a total risk-based capital ratio that is less than 6.0%, a Tier 1 risk-based capital ratio that is less than 3.0%, or a leverage ratio that is less than 3.0%, and “critically undercapitalized” if the institution has a ratio of tangible equity to total assets that is equal to or less than 2.0%. The prompt corrective action rules require an undercapitalized institution to file a written capital restoration plan, along with a performance guaranty by its holding company or a third party. In addition, an undercapitalized institution becomes subject to certain automatic restrictions
including a prohibition on payment of dividends, a limitation on asset growth and expansion, in certain cases, a limitation on the payment of bonuses or raises to senior executive officers, and a prohibition on the payment of certain “management fees” to any “controlling person”. Institutions that are classified as undercapitalized are also subject to certain additional supervisory actions, including increased reporting burdens and regulatory monitoring, a limitation on the institution’s ability to make acquisitions, open new branch offices, or engage in new lines of business, obligations to raise additional capital, restrictions on transactions with affiliates, and restrictions on interest rates paid by the institution on deposits. In certain cases, bank regulatory agencies may require replacement of senior executive officers or directors, or sale of the institution to a willing purchaser. If an institution is deemed “critically undercapitalized” and continues in that category for four quarters, the statute requires, with certain narrowly limited exceptions, that the institution be placed in receivership.
Deposit Insurance The FDIC insures deposits of the Bank through the Deposit Insurance Fund (“DIF”). The FDIC maintains the DIF by assessing depository institutions an insurance premium. The amount each institution is assessed is based upon a variety of factors that include the balance of insured deposits as well as the degree of risk the institution poses to the insurance fund. The FDIC recently increased the amount ofinsures deposits it insures from $100,000up to $250,000. This increase is temporary and will continue through December 31, 2013. The Bank pays an insurance premium into the DIF based on the quarterly average daily deposit liabilities net of certain exclusions. The FDIC uses a risk-based premium system that assesses higher rates on those institutions that pose greater risks to the DIF. The FDIC places each institution in one of four risk categories using a two-step process based first on capital ratios (the capital group assignment) and then on other relevant information (the supervisory group assignment). Subsequently, the rate for each institution within a risk category may be adjusted depending upon different factors that either enhance or reduce the risk the institution poses to the DIF, including the unsecured debt, secured liabilities and brokered deposits related to each institution. Finally, certain risk multipliers may be applied to the adjusted assessment. In 2009, the FDIC increased the amount assessed from financial institutions by increasing its risk-based deposit insurance assessment scale. The quarterly annualized assessment scale for 2009 ranged from twelve basis points of assessable deposits for the strongest institutions to 77.5 basis points for the weakest. In 2009, the FDIC also adopted a uniform special assessment rate for all institutions not to exceed 10 basis points on the individual bank’s assessment base. The total amount paid by the Bank for FDIC insurance for the year ended December 31, 2009 under these provisions was $1,163,000. On November 12, 2009, the FDIC approved a rule to require insured institutions to prepay their estimated quarterly risk-based assessments for the fourth quarter of 2009, and for all of 2010, 2011, and 2012. An insured institution’s risk-based deposit insurance assessments will continue to be calculated on a quarterly basis, but will be paid from the amount the institution prepaid until the later of the date that amount is exhausted or June 30, 2013, at which point any remaining funds would be returned to the insured institution. Consequently, Mid Penn’s prepayment of DIF premiums made in December 2009 resulted in a prepaid asset of $2,719,000.$2,719,000 at December 31, 2009. At December 31, 2010, 2011, and 2012 the prepaid asset was $1,878,000, $871,000, and $12,000, respectively.
Beginning with the second quarter of 2011, as mandated by the recently enacted Dodd-Frank Wall Street Reform and Consumer Protection Act (the “Dodd-Frank Act”), the assessment base that the FDIC will use to calculate assessment premiums will be a bank’s average assets minus average tangible equity. As the asset base of the banking industry is larger than the deposit base, the range of assessment rates will change to a low of 2.5 basis points through a high of 45 basis points, per $100 of assets; however, the dollar amount of total actual premiums is expected to be roughly the same. The FDIC is required under the Dodd-Frank Act to establish assessment rates that will allow the Deposit Insurance Fund to achieve a reserve ratio of 1.35% of Insurance Fund insured deposits by September 2020. In addition, the FDIC has established a “designated reserve ratio” of 2.0%, a target ratio that, until it is achieved, will not likely result in the FDIC reducing assessment rates. In attempting to achieve the mandated 1.35% ratio, the FDIC is required to implement assessment formulas that charge banks over $10 billion in asset size more than banks under that size. Those new formulas began in the second quarter of 2011, but did not affect the Bank. Under the Dodd-Frank Act, the FDIC is authorized to make reimbursements from the insurance fund to banks if the reserve ratio exceeds 1.50%, but the FDIC has adopted the “designated reserve ratio” of 2.0% and has announced that any reimbursements from the fund are indefinitely suspended. Proposed Regulatory Capital Changes In June 2012, the Federal Reserve Bank, the FDIC and the OCC issued proposed rules that would revise bank regulatory capital requirements and the risk-weighted asset rules. These rules represent the most extensive changes to bank capital requirements in the recent past. The rules will extend large parts of a regulatory capital administration to all U.S. banks and their holding companies, other than the smallest bank holding companies (generally, those with under $500 million in consolidated assets). The implementation of the rules has been delayed several times and it is uncertain when they will go into effect at this time. Below is a summary: Summary of proposed rules for capital · | Revise the definition of regulatory capital components and related calculations, which would include conservative guidelines for determining whether an instrument could qualify as regulatory capital; |
· | Add common equity tier 1 capital as a new regulatory capital component; |
· | Increase the minimum tier 1 capital ratio requirement; |
· | Create a capital conservation buffer that would limit payment of capital distributions and certain discretionary bonus payments to executive officers if the institution does not hold enough common equity tier 1 capital; |
· | Provide for a transition period for several aspects of the rule; and |
· | Incorporate the new and revised regulatory capital requirements into the Prompt Corrective Action rules. |
Summary of proposed rules for risk-weighted assets The proposal would expand the number of risk-weighted categories and increase the required capital for certain categories of assets, including higher-risk residential mortgages and higher-risk construction real estate loans. In addition, the rule would: · | revise risk weights for residential mortgages based on LTV ratios and certain loan characteristics, assigning risk weights between 35% and 200%; |
· | increase capital requirements for past-due loans from 100% to 150% and set the risk weight for high volatility commercial real estate loans at 150%; and |
· | revise the risk-weighted percentage for unused commitments with an original maturity of one year or less from 0% to 20% unless the commitment is unconditionally cancelable by the bank. |
The risk-weighted asset rule will apply to all U.S. banks and savings banks and almost all of their holding companies, although smaller, “non-complex” banking organizations will not need to comply with some of the rule’s requirements. The Corporation is in the process of assessing the impact of these proposed changes on the regulatory ratios of the Corporation and the Bank on the capital, operations, liquidity and earnings of the Corporation and Bank. Environmental Laws Management does not anticipate that compliance with environmental laws and regulations will have any material effect on Mid Penn’s capital, expenditures, earnings, or competitive position. However, environmentally related hazards have become a source of high risk and potentially unlimited liability for financial institutions. In 1995, the Pennsylvania General Assembly enacted the Economic Development Agency, Fiduciary and Lender Environmental Liability Protection Act, which among other things, provides protection to lenders from environmental liability and remediation costs under the environmental laws for releases and contamination caused by others. A lender who engages in activities involved in the routine practices of commercial lending, including, but not limited to, the providing of financial services, holding of security interests, workout practices, foreclosure or the recovery of funds from the sale of property shall not be liable under the environmental acts or common law equivalents to the Pennsylvania Department of Environmental Resources or to any other person by virtue of the fact that the lender engages in such commercial lending practice. A lender, however, will be liable if it, its employees or agents, directly cause an immediate release or directly exacerbate a release of regulated substance on or from the property, or known and willfully compelled the borrower to commit an action which caused such release or violate an environmental act. The Economic Development Agency, Fiduciary and Lender Environmental Liability Protection Act does not limit federal liability which still exists under certain circumstances. 6
MID PENN BANCORP, INC.
Consumer Protection Laws A number of laws govern the relationship between the Bank and its customers. For example, the Community Reinvestment Act is designed to encourage lending by banks to persons in low and moderate income areas. The Home Mortgage Disclosure Act and the Equal Credit Opportunity Act attempt to minimize lending decisions based on impermissible criteria, such as race or gender. The Truth-in-Lending Act and the Truth-in-Savings Act require banks to provide certain disclosure of relevant terms related to loans and savings accounts, respectively. Anti-tying restrictions (which prohibit conditioning the availability or terms of credit on the purchase of another banking product) further restrict the Bank’s relationships with its customers.
Privacy Laws In 2000, the federal banking regulators issued final regulations implementing certain provisions of GLB governing the privacy of consumer financial information. The regulations limit the disclosure by financial institutions, such as Mid Penn and the Bank, of nonpublic personal information about individuals who obtain financial products or services for personal, family, or household purposes. Subject to certain exceptions allowed by law, the regulations cover information sharing between financial institutions and nonaffiliated third parties. More specifically, the regulations require financial institutions to: · | provide initial notices to customers about their privacy policies, describing the conditions under which they may disclose nonpublic personal financial information to nonaffiliated third parties and affiliates; |
· | provide annual notices of their privacy policies to their current customers; and |
· | provide a reasonable method for consumers to “opt out” of disclosures to nonaffiliated third parties. |
provide annual notices of their privacy policies to their current customers; andMID PENN BANCORP, INC.
provide a reasonable method for consumers to “opt out” of disclosures to nonaffiliated third parties.
Protection of Customer Information In 2001, the federal banking regulators issued final regulations implementing the provisions of GLB relating to the protection of customer information. The regulations, applicable to Mid Penn and the Bank, relate to administrative, technical, and physical safeguards for customer records and information. These safeguards are intended to: · | insure the security and confidentiality of customer records and information; |
· | protect against any anticipated threats or hazards to the security or integrity of such records; and |
· | protect against unauthorized access to or use of such records or information that could result in substantial harm or inconvenience to any customer. |
protect against any anticipated threats or hazards to the security or integrity of such records; and
protect against unauthorized access to or use of such records or information that could result in substantial harm or inconvenience to any customer.
Affiliate Transactions Transactions between Mid Penn and the Bank and its affiliates are governed by Sections 23A and 23B of the Federal Reserve Act. An “affiliate” of a bank or savings institution is any company or entity that controls, is controlled by, or is under common control with the bank or savings institution. Generally, a subsidiary of a depository institution that is not also a depository institution is not treated as an affiliate of the bank for purposes of Sections 23A and 23B. Sections 23A and 23B are intended to protect insured depository institutions from suffering losses arising from transactions with non-insured affiliates, by limiting the extent to which a bank or its subsidiaries may engage in covered transactions with any one affiliate and with all affiliates of the bank in the aggregate, and requiring that such transactions be on terms that are consistent with safe and sound banking practices. Effective April 1, 2003, Regulation W of the Federal Reserve comprehensively amended Sections 23A and 23B. The regulation unifies and updates staff interpretations issued over the years, incorporates several new interpretative proposals (such as to clarify when transactions with an unrelated third party will be attributed to an affiliate), and addresses new issues arising as a result of the expanded scope of non-banking activities engaged in by bank and bank holding companies in recent years and authorized for financial holding companies under the GLB.
The USA Patriot Act In 2001, the Uniting and Strengthening America by Providing Appropriate Tools Required to Intercept and Obstruct Terrorism Act of 2001 (USA Patriot Act) was signed into law. The USA Patriot Act broadened the application of anti-money laundering regulations to apply to additional types of financial institutions, such as broker-dealers, and strengthened the ability of the U.S. government to detect and prosecute international money laundering and the financing of terrorism. The principal provisions of Title III of the USA Patriot Act require that regulated financial institutions, including state-chartered banks: · | establish an anti-money laundering program that includes training and audit components; |
· | comply with regulations regarding the verification of the identity of any person seeking to open an account; |
· | take additional required precautions with non-U.S. owned accounts; and |
· | perform certain verification and certification of money laundering risk for their foreign correspondent banking relationships. |
comply with regulations regarding the verification of the identity of any person seeking to open an account;
take additional required precautions with non-U.S. owned accounts; and
perform certain verification and certification of money laundering risk for their foreign correspondent banking relationships.
The USA Patriot Act also expanded the conditions under which funds in a U.S. interbank account may be subject to forfeiture and increased the penalties for violation of anti-money laundering regulations. Failure of a financial institution to comply with the USA Patriot ActsAct’s requirements could have serious legal and reputational consequences for the institution. The Bank has adopted policies, procedures and controls to address compliance with the requirements of the USA Patriot Act under the existing regulations and will continue to revise and update its policies, procedures and controls to reflect changes required by the USA Patriot Act and implementing regulations. 7
MID PENN BANCORP, INC.
Anti-Money Laundering and Anti-Terrorism Financing Under Title III of the USA PATRIOT Act, also known as the International Money Laundering Abatement and Anti-Terrorism Financing Act of 2001, all financial institutions, including Mid Penn and the Bank, are required in general to identify their customers, adopt formal and comprehensive anti-money laundering programs, scrutinize or prohibit altogether certain transactions of special concern, and be prepared to respond to inquiries from U.S. law enforcement agencies concerning their customers and their transactions. Additional information-sharing among financial institutions, regulators, and law enforcement authorities is encouraged by the presence of an exemption from the privacy provisions of the GLB Act for financial institutions that comply with this provision and the authorization of the Secretary of the Treasury to adopt rules to further encourage cooperation and information-sharing. The effectiveness of a financial institution in combating money-laundering activities is a factor to be considered in any application submitted by the financial institution under the Bank Merger Act, which applies to the Bank. Emergency Economic StabilizationJOBS ACT
On April 5, 2012, President Obama signed the Jumpstart Our Business Startups Act (the “JOBS Act”) into law. The JOBS Act is aimed at facilitating capital raising by smaller companies and banks and bank holding companies by implementing the following changes:
· | raising the threshold requiring registration under the Securities Exchange Act of 1934 (the "Exchange Act") for banks and bank holdings companies from 500 to 2,000 holders of record; |
· | raising the threshold for triggering deregistration under the Exchange Act for banks and bank holding companies from 300 to 1,200 holders of record; |
· | raising the limit for Regulation A offerings from $5 million to $50 million per year and exempting some Regulation A offerings from state blue sky laws; |
· | permitting advertising and general solicitation in Rule 506 and Rule 144A offerings; |
· | allowing private companies to use "crowdfunding" to raise up to $1 million in any 12-month period, subject to certain conditions; and |
· | creating a new category of issuer, called an "Emerging Growth Company," for companies with less than $1 billion in annual gross revenue, which will benefit from certain changes that reduce the cost and burden of carrying out an equity IPO and complying with public company reporting obligations for up to five years. |
While the JOBS Act is not expected to have any immediate application to the Corporation, management will continue to monitor the implementation rules for potential effects which might benefit the Corporation. Dodd-Frank Act The Dodd-Frank Act, which became law in July 2010, significantly changes regulation of 2008financial institutions and Related Programs the financial services industry, including: creating a Financial Services Oversight Council to identify emerging systemic risks and improve interagency cooperation; centralizing responsibility for consumer financial protection by creating a new agency, the Consumer Financial Protection Bureau, which will be responsible for implementing, examining and enforcing compliance with federal consumer financial laws; permanently raising the current standard maximum deposit insurance amount to $250,000; establishing strengthened capital standards for banks, and disallowing certain trust preferred securities from qualifying as Tier 1 capital (subject to certain grandfather provisions for existing trust preferred securities); establishing new minimum mortgage underwriting standards; granting the Federal Reserve Board the power to regulate debit card interchange fees; and implementing corporate governance changes. Many aspects of the Dodd-Frank Act are subject to rulemaking that will take effect over several years, thus making it difficult to assess the impact of the statute on the financial industry, including Mid Penn, at this time. It is subjectdifficult to predict at this time the specific impact the Dodd-Frank Act and the yet to be written implementing rules and regulations promulgated underwill have on community banks. Given the Emergency Economic Stabilization Act of 2008 (“EESA”) and related legislation as a result of its sale of preferred stock touncertainty associated with the U.S. Treasury under the U.S. Treasury’s Capital Purchase Program (“CPP”). Additional information relating to the CPP, including restrictions on dividends and redemptions of common stock, is includedmanner in the information set forth in Item 7 of this report under the caption, “Capital Purchase Program Participation.” Furthermore, under rules and regulations of EESA to which the Mid Penn is subject, no dividends may be declared or paid on Mid Penn’s common stock and Mid Penn may not repurchase or redeem any common stock unless dividends then due and payable with respect to Treasury’s preferred stock have been paid in full. Moreover, the consent of Treasury would be required for any increase in the per share dividend amount on the common stock beyond the per share dividend declared immediately prior to October 14, 2008 ($0.20 per share per quarter) until the third anniversaryprovisions of the dateDodd-Frank Act will be implemented by the various regulatory agencies and through regulations, the full extent of Treasury’s investment, unless prior to the third anniversary, Treasury’s preferred stockimpact such requirements will have on financial institutions’ operations is redeemed in whole or Treasury has transferred allpresently unclear. The changes resulting from the Dodd-Frank Act may impact the profitability of its preferred shares to third parties. Because of Mid Penn’s participation in the CPP, Mid Penn is subjectour business activities, require changes to certain restrictions on its executive compensationof our business practices, which are discussedimpose upon us more stringent capital, liquidity and leverage ratio requirements or otherwise adversely affect our business. These changes may also require us to invest significant management attention and resources to evaluate and make necessary changes in Item 7 of this report under the caption, “Capital Purchase Program Participation.”order to comply with new statutory and regulatory requirements. In November 2008, the FDIC created the Temporary Liquidity Guaranty Program to strengthen confidence and encourage liquidity in the banking system by guaranteeing newly issued senior unsecured debt of banks, thrifts, and certain holding companies via its Debt Guaranty Program, and by providing full coverage of noninterest bearing deposit transaction accounts and capped NOW accounts, regardless of dollar amount via its Temporary Account Guaranty Program. As of October 31, 2009, banks were no longer eligible to issue additional debt under the Temporary Liquidity Guaranty Program and Mid Penn has opted not to participate in the Temporary Account Guaranty Program beyond December 31, 2009.
Effects of Government Policy and Potential Changes in Regulation Changes in regulations applicable to Mid Penn or the Bank, or shifts in monetary or other government policies, could have a material affecteffect on our business. Mid Penn’s and the Bank’s business is also affected by the state of the financial services industry in general. As a result of legal and industry changes, management believes that the industry will continue to experience an increased rate of change as the financial services industry strives for greater product offerings, market share and economies of scale. From time to time, legislation is enacted that has the effect of increasing the cost of doing business, limiting or expanding permissible activities or affecting the competitive balance between banks and other financial institutions. Proposals to change the laws and regulations governing the operations and taxation of banks, bank holding companies and other financial institutions are frequently made in Congress, and before various bank regulatory agencies. Mid Penn cannot predict the likelihood of any major changes or the impact such changes might have on Mid Penn and/or the Bank. Various congressional bills and other proposals have proposed a sweeping overhaul of the banking system, including provisions for: limitations on deposit insurance coverage; changing the timing and method financial institutions use to pay for deposit insurance; expanding the power of banks by removing the restrictions on bank underwriting activities; and tightening the regulation of bank derivatives activities; and allowing commercial enterprises to own banks. Mid Penn’s earnings are, and will be affected by domestic economic conditions and the monetary and fiscal policies of the United States government and its agencies. The monetary policies of the Federal Reserve have had, and will likely continue to have, an impact on the operating results of commercial banks because of the Federal Reserve’s power to implement national monetary policy to, among other things, curb inflation or combat recession. The Federal Reserve has a major impact on the levels of bank loans, investments and deposits through its open market operations in United States government securities and through its regulation of, among other things, the discount rate on borrowings of member banks and the reserve requirements against member bank deposits. It is not possible to predict the nature and impact of future changes in monetary and fiscal policies. From time to time, various types of federal and state legislation have been proposed that could result in additional regulation of, and restrictions on, the business of Mid Penn and the Bank. As a consequence of the extensive regulation of commercial banking activities in the United States,
the Bank’s business is particularly susceptible to being affected by federal legislation and regulations that may increase the costs of doing business. Congress is currently debating major legislation that may fundamentally change the regulatory oversight of banking institutions in the United States. Whether any legislation will be enacted or additional regulations will be adopted, and how they might impact Mid Penn cannot be determined at this time. Available Information Mid Penn’s common stock is registered under Section 12(b) of the Securities Exchange Act of 1934 and is traded on the NASDAQ Stock Market under the trading symbol MPB. Mid Penn is subject to the informational requirements of the Exchange Act, and, accordingly, files reports, proxy statements and other information with the Securities and Exchange Commission. The reports, proxy statements and other information filed with the SEC are available for inspection and copying at the SEC’s Public Reference Room at 100 F Street, NE, Room 1580, Washington, D.C. 20549. You may obtain information on the operation of the Public Reference Room by calling the SEC at (202) 551-8090.1-800-SEC-0330. Mid Penn is an electronic filer with the SEC. The SEC maintains an Internet site that contains reports, proxy and information statements, and other information regarding issuers that file electronically with the SEC. The SEC’s Internet site address iswww.sec.gov. www.sec.gov. Mid Penn’s headquarters are located at 349 Union Street, Millersburg, Pennsylvania 17061, and its telephone number is (717) 692-2133.1-866-642-7736. Mid Penn’s Internet address iswww.midpennbank.com. midpennbank.com. Mid Penn makes available through its website, free of charge, its annual report on Form 10-K, quarterly reports on Form 10-Q, current reports on Form 8-K, and amendments to those reports as soon as reasonably practicable after filing with the Securities and Exchange Commission. Mid Penn has adopted a Code of Ethics that applies to all employees. This document is also available on Mid Penn’s website. The information included on our website is not a part of this document. ITEM 1A.RISK FACTORS Future dividend payments and common stock repurchases are restricted by the terms of the U.S. Treasury’s equity investment in Mid Penn
Under the terms of the CPP, for so long as any preferred stock issued under the CPP remains outstanding, Mid Penn is prohibited from increasing dividends to holders of its common stock above the last per share quarterly amount in effect immediately prior to October 14, 2008 ($0.20 per share), and from making certain repurchases of equity securities, including our common stock, without the U.S. Treasury’s consent until the third anniversary of the U.S. Treasury’s investment or until the U.S. Treasury has transferred all of the preferred stock it purchased under the CPP to third parties. As long as the preferred stock issued to the U.S. Treasury is outstanding, dividend payments and repurchases or redemptions relating to certain equity securities, including Mid Penn’s common stock, are prohibited until all accrued and unpaid dividends are paid on such preferred stock, subject to certain limited exceptions.
Mid Penn is subject to interest rate risk Mid Penn’s earnings and cash flows are largely dependent upon its net interest income. Net interest income is the difference between interest income earned on interest-earning assets such as loans and securities and interest expense paid on interest-bearing liabilities such as deposits and borrowed funds. Interest rates are highly sensitive to many factors that are beyond Mid Penn’s control, including general economic conditions and policies of various governmental and regulatory agencies and, in particular, the Board of Governors of the Federal Reserve System. Changes in monetary policy, including changes in interest rates, could influence not only the interest Mid Penn receives on loans and securities and the amount of interest it pays on deposits and borrowings, but such changes could also affect (i) Mid Penn’s ability to originate loans and obtain deposits, (ii) the fair value of Mid Penn’s financial assets and liabilities, and (iii) the average duration of Mid Penn’s mortgage-backed securities portfolio. If the interest rates paid on deposits and other borrowings increase at a faster rate than the interest rates received on loans and other investments, Mid Penn’s net interest income, and therefore earnings, could be adversely affected. Earnings could also be adversely affected if the interest rates received on loans and other investments fall more quickly than the interest rates paid on deposits and other borrowings. Management believes it has implemented effective asset and liability management strategies to reduce the potential effects of changes in interest rates on Mid Penn’s results of operations. Any substantial, unexpected, prolonged change in market interest rates could have a material adverse effect on Mid Penn’s financial condition and results of operations.
Mid Penn is subject to lending risk As of December 31, 2009,2012, approximately 70.7%70.0% of Mid Penn’s loan portfolio consisted of commercial and industrial, construction and commercial real estate loans. These types of loans are generally viewed as having more risk of default than residential real estate loans or consumer loans. These types of loans are also typically larger than residential real estate loans and consumer loans. Because Mid Penn’s loan portfolio contains a significant number of commercial and industrial, construction and commercial real estate loans with relatively large balances, the deterioration of one or a few of these loans could cause a significant increase in non-performing loans. An increase in non-performing loans could result in a net loss of earnings from these loans, an increase in the provision for possible loan and lease losses and an increase in loan charge-offs, all of which could have a material adverse effect on Mid Penn’s financial condition and results of operations. 9
MID PENN BANCORP, INC.
Mid Penn’s allowance for possible loan and lease losses may be insufficient Mid Penn maintains an allowance for possible loan and lease losses, which is a reserve established through provisions for possible losses charged to expense, that represents management’s best estimate of probable losses that have been incurred within the existing portfolio of loans. The allowance, in the judgment of management, is necessary to reserve for estimated loan and lease losses and risks inherent in the loan portfolio. The level of the allowance reflects management’s continuing evaluation of industry concentrations; specific credit risks; loan loss experience; current loan portfolio quality; present economic, political and regulatory conditions and unidentified losses inherent in the current loan portfolio. The determination of the appropriate level of the allowance for possible loan and lease losses inherently involves a high degree of subjectivity and requires Mid Penn to make significant estimates of current credit risks and future trends, all of which may undergo material changes. Changes in economic conditions affecting borrowers, new information regarding existing loans, identification of additional problem
credits and other factors, both within and outside of Mid Penn’s control, may require an increase in the allowance. In addition, bank regulatory agencies periodically review Mid Penn’s allowance for possible loan and lease losses and may require an increase in the provision for possible loan and lease losses or the recognition of further loan charge-offs, based on judgments different than those of management. In addition, if charge-offs in future periods exceed the allowance, Mid Penn willmay need additional provisions to increase the allowance for possible loan and lease losses. Any increases in the allowance will result in a decrease in net income and, possibly, capital, and may have a material adverse effect on Mid Penn’s financial condition and results of operations.
Competition from other financial institutions may adversely affect Mid Penn’s profitability Mid Penn’s banking subsidiary faces substantial competition in originating both commercial and consumer loans. This competition comes principally from other banks, credit unions, savings institutions, mortgage banking companies and other lenders. Many of its competitors enjoy advantages, including greater financial resources and higher lending limits, a wider geographic presence, more accessible branch office locations, the ability to offer a wider array of services or more favorable pricing alternatives, as well as lower origination and operating costs. This competition could reduce the Corporation’s net income by decreasing the number and size of loans that its banking subsidiary originates and the interest rates it may charge on these loans. In attracting business and consumer deposits, its banking subsidiary faces substantial competition from other insured depository institutions such as banks, savings institutions and credit unions, as well as institutions offering uninsured investment alternatives, including money market funds. Many of Mid Penn’s competitors enjoy advantages, including greater financial resources, more aggressive marketing campaigns, better brand recognition, and more convenient branch locations. These competitors may offer higher interest rates than Mid Penn, which could decrease the deposits that Mid Penn attracts or require Mid Penn to increase its rates to retain existing deposits or attract new deposits. Increased deposit competition could adversely affect Mid Penn’s ability to generate the funds necessary for lending operations. As a result, Mid Penn may need to seek other sources of funds that may be more expensive to obtain and could increase its cost of funds. Mid Penn’s banking subsidiary also competes with non-bank providers of financial services, such as brokerage firms, consumer finance companies, credit unions, insurance agencies and governmental organizations, which may offer more favorable terms. Some of its non-bank competitors are not subject to the same extensive regulations that govern its banking operations. As a result, such non-bank competitors may have advantages over Mid Penn’s banking subsidiary in providing certain products and services. This competition may reduce or limit Mid Penn’s margins on banking services, reduce its market share and adversely affect its earnings and financial condition. We have 5,000 shares of Series B Preferred Stock outstanding which have preference over the common stock as to dividends and liquidation distributions, among other preferential rights As of the date hereof, we have issued and outstanding 5,000 shares of 7% Non-Cumulative, Non-Voting, Non-Convertible Perpetual Preferred Stock, Series B, par value $1.00 per share (the “Series B Preferred Stock”). The Series B Preferred Stock affords holders a preference to assets upon liquidation and an annual dividend which rights impact the outstanding shares of common stock.The Preferred Stock's right to annual dividends makes less likely the possibility that we will declare dividends on the common stock. In the event of a liquidation of the Corporation's assets, holders of Series B Preferred Stock will have a right to receive as a liquidation payment any remaining assets of the Corporation prior to any distributions to holders of the common stock and the holders of the Series B Preferred Stock may be able to block actions otherwise approved by the holders of the common stock if such action is adverse to their rights. The Basel III capital requirements may require us to maintain higher levels of capital, which could reduce our profitability If adopted as proposed, Basel III targets higher levels of base capital, certain capital buffers and a migration toward common equity as the key source of regulatory capital. Although the new capital requirements are phased in over the next decade and may change substantially before final implementation, Basel III signals a growing effort by domestic and international bank regulatory agencies to require financial institutions, including depository institutions, to maintain higher levels of capital. The direction of the Basel III implementation activities or other regulatory viewpoints could require additional capital to support our business risk profile prior to final implementation of the Basel III standards. If Mid Penn is required to maintain higher levels of capital, Mid Penn may have fewer opportunities to invest capital into interest-earning assets, which could limit the profitable business operations available to Mid Penn and adversely impact our financial condition and results of operations. Future credit downgrades of the United States Government due to issues relating to debt and the deficit may adversely affect the Mid Penn As a result of failure of the federal government to reach agreement over federal debt and the ongoing issues connected with the debt ceiling, certain rating agencies placed the United States government’s long-term sovereign debt rating on their equivalent of negative watch and announced the possibility of a rating downgrade. The rating agencies, due to constraints related to the rating of the United States, also placed government-sponsored enterprises in which Mid Penn invests and receives lines of credit on negative watch and a downgrade of the United State’s credit rating would trigger a similar downgrade in the credit rating of these government sponsored enterprises. Furthermore, the credit rating of other entities, such as state and local governments, may also be downgraded should the United States credit rating be downgraded. The impact that a credit rating downgrade may have on the national and local economy could have an adverse effect on Mid Penn’s financial condition and results of operations.
A breach of information security could negatively affect our earnings Increasingly, we depend upon data processing, communication and information exchange on a variety of computing platforms and networks, and over the Internet. While to date we have not been subject to cyber attacks or other cyber incidents, we cannot be certain all our systems are entirely free from vulnerability to attack, despite safeguards we have instituted. In addition, we rely on the services of a variety of vendors to meet our data processing and communication needs. Disruptions to our vendors’ systems may arise from events that are wholly or partially beyond our vendors’ control (including, for example, computer viruses or electrical or telecommunications outages). If information security is breached, despite the controls we and our third party vendors have instituted, information can be lost or misappropriated, resulting in financial loss or costs to us or damages to others. These costs or losses could materially exceed the amount of insurance coverage, if any, which would adversely affect our earnings. In addition, our reputation could be damaged which could result in loss of customers, greater difficulty in attracting new customers, or an adverse affect on the value of our common stock. Mid Penn’s controls and procedures may fail or be circumvented Management regularlyperiodically reviews and updates Mid Penn’s internal controls, disclosure controls and procedures, and corporate governance policies and procedures. Any system of controls, however well designed and operated, is based in part on certain assumptions and can provide only reasonable, not absolute, assurances that the objectives of the system are met. Any failure or circumvention of Mid Penn’s controls and procedures or failure to comply with regulations related to controls and procedures could have a material adverse effect on Mid Penn’s business, results of operations, and financial condition.
Mid Penn’s ability to pay dividends depends primarily on dividends from its banking subsidiary, which is subject to regulatory limits Mid Penn is a bank holding company and its operations are conducted by its subsidiaries. Its ability to pay dividends depends on its receipt of dividends from its subsidiaries. Dividend payments from its banking subsidiary are subject to legal and regulatory limitations, generally based on net profits, and retained earnings, imposed by the various banking regulatory agencies. The ability of Mid Penn’s subsidiaries to pay dividends is also subject to their profitability, financial condition, capital expenditures and other cash flow requirements. There is no assurance that Mid Penn’s subsidiaries will be able to pay dividends in the future or that Mid Penn will generate adequate cash flow to pay dividends in the future. Federal Reserve Board policy, which applies to Mid Penn as a registered bank holding company, also provides that dividends by bank holding companies should generally be paid out of current earnings looking back over a one-year period. Mid Penn’s failure to pay dividends on its common stock could have a material adverse effect on the market price of its common stock. 10
MID PENN BANCORP, INC.Mid Penn’s profitability depends significantly on economic conditions in central Pennsylvania
Mid Penn’s success is dependent to a significant degree on economic conditions in central Pennsylvania, especially in Dauphin, lower Northumberland, western Schuylkill and eastern Cumberland Counties, which Mid Penn defines as our primary market. The banking industry is affected by general economic conditions including the effects of inflation, recession, unemployment, real estate values, trends in the national and global economics, and other factors beyond our control. An economic recession or a delayed recovery over a prolonged period of time in Central Pennsylvania area could cause an increase in the level of the Bank’s non-performing assets and loan and lease losses, thereby causing operating losses, impairing liquidity, and eroding capital. Mid Penn cannot assure you that adverse changes in the local economy would not have a material adverse effect on Mid Penn’s consolidated financial condition, results of operations, and cash flows. Mid Penn may not be able to attract and retain skilled people Mid Penn’s success depends, in large part, on its ability to attract and retain key people. Competition for the best people in most activities engaged in by Mid Penn can be intense and Mid Penn may not be able to hire people or to retain them. The unexpected loss of services of one or more of Mid Penn’s key personnel could have a material adverse impact on Mid Penn’s business because of their skills, knowledge of Mid Penn’s market, years of industry experience, and the difficulty of promptly finding qualified replacement personnel.
Mid Penn is subject to claims and litigation pertaining to fiduciary responsibility From time to time, customers make claims and take legal action pertaining to Mid Penn’s performance of its fiduciary responsibilities. Whether customer claims and legal action related to Mid Penn’s performance of its fiduciary responsibilities are founded or unfounded, if such claims and legal actions are not resolved in a manner favorable to Mid Penn they may result in significant financial liability and/or adversely affect the market perception of Mid Penn and its products and services as well as impact customer demand for those products and services. Any financial liability or reputation damage could have a material adverse effect on Mid Penn’s business, which, in turn, could have a material adverse effect on Mid Penn’s financial condition and results of operations.
The trading volume in Mid Penn’s common stock is less than that of other larger financial services companies Mid Penn’s common stock is listed for trading on NASDAQ; the trading volume in its common stock, however, is less than that of other larger financial services companies. A public trading market having the desired characteristics of depth, liquidity and orderliness depends on the presence in the marketplace of willing buyers and sellers of Mid Penn’s common stock at any given time. This presence depends on the
individual decisions of investors and general economic and market conditions over which Mid Penn has no control. Given the lower trading volume of Mid Penn’s common stock, significant sales of Mid Penn’s common stock, or the expectation of these sales, could cause Mid Penn’s stock price to fall.
Mid Penn operates in a highly regulated environment and may be adversely affected by changes in federal, state and local laws and regulations Mid Penn is subject to extensive regulation, supervision and examination by federal and state banking authorities. Any change in applicable regulations or federal, state or local legislation could have a substantial impact on Mid Penn and its operations. Additional legislation and regulations that could significantly affect Mid Penn’s powers, authority and operations may be enacted or adopted in the future, which could have a material adverse effect on its financial condition and results of operations. Further, regulators have significant discretion and authority to prevent or remedy unsafe or unsound practices or violations of laws by banks and bank holding companies in the performance of their supervisory and enforcement duties. The exercise of regulatory authority may have a negative impact on Mid Penn’s results of operations and financial condition. Mid Penn must comply with significant anti-money laundering
In response to the financial crisis that commenced in 2008, Congress has taken actions that are intended to strengthen confidence and anti-terrorism laws. Under theseencourage liquidity in financial institutions, and the Federal Deposit Insurance Corporation has taken actions to increase insurance coverage on deposit accounts. The recently enacted Dodd-Frank Act provides for the creation of a consumer protection division at the Board of Governors of the Federal Reserve System that will have broad authority to issue regulations governing the services and products we provide consumers. This additional regulation could increase our compliance costs and otherwise adversely impact our operations. That legislation also contains provisions that, over time, could result in higher regulatory capital requirements and loan loss provisions for the Bank, and may increase interest expense due to the ability in July 2011 to pay interest on all demand deposits. In addition, there have been proposals made by members of Congress and others that would reduce the amount delinquent borrowers are otherwise contractually obligated to pay under their mortgage loans and limit an institution’s ability to foreclose on mortgage collateral. These proposals could result in credit losses or increased expense in pursuing our remedies as a creditor. Recent regulatory changes impose limits on our ability to charge overdraft fees, which may decrease our non-interest income as compared to more recent prior periods. The potential exists for additional federal or state laws Mid Penn is required, among other things, to enforce a customer identification program and file currency transactionregulations, or changes in policy, affecting many aspects of our operations, including capital levels, lending and suspicious activity reports withfunding practices, and liquidity standards. New laws and regulations may increase our costs of regulatory compliance and of doing business and otherwise affect our operations, and may significantly affect the federal government. Government agencies have substantial discretion to impose significant monetary penalties on institutions,markets in which fail to comply with these laws or make required reports.we do business, the markets for and value of our loans and investments, the fees we can charge and our ongoing operations, costs and profitability.
The soundness of other financial institutions may adversely affect Mid Penn Financial services institutions are interrelated as a result of trading, clearing, counterparty, or other relationships. Mid Penn has exposure to many different industries and counterparties, and routinely executes transactions with counterparties in the financial services industry, including commercial banks, brokers and dealers, investment banks, and other institutional clients. Many of these transactions expose Mid Penn to credit risk in the event of a default by a counterparty or client. In addition, Mid Penn’s credit risk may be exacerbated when the collateral held by Mid Penn cannot be realized upon or is liquidated at prices not sufficient to recover the full amount of the credit or derivative exposure due to Mid Penn. Any such losses could have a material adverse affect on the Mid Penn’s financial condition and results of operations. Current
Prior levels of market volatility arewere unprecedented and future volatility may have materially adverse effects on our liquidity and financial condition The
In the recent past, the capital and credit markets have been experiencingexperienced extreme volatility and disruption for more than two years. In some cases, the markets have exerted downward pressure on stock prices, security prices, and credit availability for certain issuers without regard to their underlying financial strength. If the currentsuch levels of market disruption and volatility continue or worsen,return, there can be no assurance that we will not experience adverse effects, which may be material, on our liquidity, financial condition, and profitability. ITEM 1B.UNRESOLVED STAFF COMMENTS
None.Mid Penn’s banking subsidiary may be required to pay higher FDIC insurance premiums or special assessments which may adversely affect its earning.
11
Poor economic conditions and the resulting bank failures have increased the costs of the FDIC and depleted its deposit insurance fund. Additional bank failures may prompt the FDIC to increase its premiums above the recently increased levels or to issue special assessments. Mid Penn generally is unable to control the amount of premiums or special assessments that its subsidiary is required to pay for FDIC insurance. Any future changes in the calculation or assessment of FDIC insurance premiums may have a material adverse effect on our results of operations, financial condition, and our ability to continue to pay dividends on our common stock at the current rate or at all.Pennsylvania Business Corporation Law and various anti-takeover provisions under our articles and bylaws could impede the takeover of Mid Penn Various Pennsylvania laws affecting business corporations may have the effect of discouraging offers to acquire Mid Penn, even if the acquisition would be advantageous to shareholders. In addition, we have various anti-takeover measures in place under our articles of
incorporation and bylaws, including a supermajority vote requirement for mergers, a staggered board of directors, and the absence of cumulative voting. Any one or more of these measures may impede the takeover of Mid Penn without the approval of our board of directors and may prevent our shareholders from taking part in a transaction in which they could realize a premium over the current market price of our common stock. Mid Penn may need to or be required to raise additional capital in the future, and capital may not be available when needed and on terms favorable to current shareholders Federal banking regulators require Mid Penn and its subsidiary bank to maintain adequate levels of capital to support their operations. These capital levels are determined and dictated by law, regulation, and banking regulatory agencies. In addition, capital levels are also determined by Mid Penn’s management and board of directors based on capital levels that they believe are necessary to support Mid Penn’s business operations. If Mid Penn raises capital through the issuance of additional shares of its common stock or other securities, it would likely dilute the ownership interests of current investors and could dilute the per share book value and earnings per share of its common stock. Furthermore, a capital raise through issuance of additional shares may have an adverse impact on Mid Penn’s stock price. New investors also may have rights, preferences and privileges senior to Mid Penn’s current shareholders, which may adversely impact its current shareholders. Mid Penn’s ability to raise additional capital will depend on conditions in the capital markets at that time, which are outside of its control, and on its financial performance. Accordingly, Mid Penn cannot be certain of its ability to raise additional capital on acceptable terms and acceptable time frames or to raise additional capital at all. If Mid Penn cannot raise additional capital in sufficient amounts when needed, its ability to comply with regulatory capital requirements could be materially impaired. Additionally, the inability to raise capital in sufficient amounts may adversely affect Mid Penn’s financial condition and results of operations. Mid Penn’s profitability depends significantly on the economic conditions in the Commonwealth of Pennsylvania and the local region in which it does business Mid Penn’s profitability depends primarily on the general economic conditions of the Commonwealth of Pennsylvania and the specific markets in which Mid Penn operates. Unlike larger national or other regional banks that are more geographically diversified, Mid Penn provides banking and financial services to customers primarily in south central Pennsylvania. The local economic conditions in this area has a significant impact on the demand for Mid Penn’s products and services, as well as the ability of Mid Penn’s customers to repay loans, the value of collateral securing loans, and the stability of Mid Penn’s deposit funding sources. A significant decline in general economic conditions caused by inflation, recession, unemployment, changes in securities markets, or other factors could impact these local economic conditions and, consequently, have a material adverse effect on Mid Penn’s financial condition and results of operation. If we conclude that the decline in the value of any of our investment securities is other than temporary, we are required to write down the value of that security through a charge to earnings We review our investment securities portfolio at each quarter-end reporting period to determine whether the fair value is below the current carrying value. When the fair value of any of our investment securities has declined below its carrying value, we are required to assess whether the decline is other than temporary. If we conclude that the decline is other than temporary, we are required to write down the value of that security through a charge to earnings. Changes in the expected cash flows of these securities and/or prolonged price declines have resulted and may result in our concluding in future periods that there is additional impairment of these securities that is other than temporary, which would require a charge to earnings to write down these securities to their fair value. Due to the complexity of the calculations and assumptions used in determining whether an asset is impaired, the impairment disclosed may not accurately reflect the actual impairment in the future. Mid Penn’s financial performance may suffer if its information technology is unable to keep pace with its growth or industry developments Effective and competitive delivery of Mid Penn’s products and services is increasingly dependent upon information technology resources and processes, both those provided internally as well as those provided through third party vendors. In addition to better serving customers, the effective use of technology increases efficiency and enables Mid Penn to reduce costs. Mid Penn’s future success will depend, in part, upon its ability to address the needs of its customers by using technology to provide products and services to enhance customer convenience, as well as to create additional efficiencies in its operations. Many of Mid Penn’s competitors have greater resources to invest in technological improvements. Additionally, as technology in the financial services industry changes and evolves, keeping pace becomes increasingly complex and expensive for Mid Penn. There can be no assurance that Mid Penn will be able to effectively implement new technology-driven products and services, which could reduce its ability to compete effectively. ITEM 1B.UNRESOLVED STAFF COMMENTS None
ITEM 2.PROPERTIES With the exception of the Market Square Office and Derry Street Loan Operations Center in Harrisburg, PA, the Bank owns its main office, branch offices and certain parking facilities related to its banking offices, all of which are free and clear of any lien. The Bank’s main office and all branch offices are located in Pennsylvania. All of these properties are in good condition and are deemed by management to be adequate for the Bank’s purposes. The table below sets forth the location of each of the Bank’s properties. | | | | | | | Property Location
| | Description of Property
| | Property Location
| | Description of Property
| MainProperty Location
| | Description of Property | | Property Location | | Description of Property | Millersburg | | | | Lykens Office | | | | Lykens Office | | | 349 Union Street | | Main Bank Office & | | 550 Main Street | | Branch Office | Millersburg, PA 17061 | | Branch Office | | Lykens, PA 17048 | | | | | | | | | | Elizabethville Office | | | | Allentown Boulevard Office | | | 4642 State Route 209 | | Branch Office | | 5500 Allentown Boulevard | | Branch Office | Elizabethville, PA 17023 | | | | Harrisburg, PA 17112 | | | | | | | | | | Dalmatia Office | | | | Market Square Office | | | 132 School House Road | | Branch Office | | 17 N. Second Street | | Branch Office | Dalmatia, PA 17017 | | | | Harrisburg, PA 17101 | | | | | | | | | | Carlisle Pike Office | | | | Steelton Office | | | 4622 Carlisle Pike | | Branch Office | | 51 South Front Street | | Branch Office | Mechanicsburg, PA 17050 | | | | Steelton, PA 17113 | | | | | | | | | | Derry Street Office | | | | Middletown Office | | | 40984509 Derry Street
| | Branch Office | | 1100 Spring Garden Drive | | Branch Office | Harrisburg, PA 17111 | | | | Middletown, PA 17057 | | | | | | | | | | Front Street Office | | | | Camp Hill Office | | | 2615 North Front Street | | Branch Office | | 2101 Market Street | | Branch Office | Harrisburg, PA 17110 | | | | Camp Hill, PA 17011 | | | | | | | | | | Tower City Office | | | | Operations Center | | | 545 East Grand Avenue | | Branch Office | | 894 N. River Road | | Operations Center | Tower City, PA 17980 | | | | Halifax, PA 17032 | | | | | | | | | | Dauphin Office | | | | | | | 1001 Peters Mountain Road | | Branch Office | | Derry Street Loan Administrative Operations | | Administrative Office | Dauphin, PA 17018 | | | | 4099 Derry Street | | | | | | | Harrisburg, PA 17111 | | |
ITEM 3.LEGAL PROCEEDINGS Management is not aware of any litigation that would have a material adverse effect on the consolidated financial position of the Corporation. Mid Penn and the Bank have no proceedings pending other than ordinary routine litigation occurring in the normal course of business. In addition, management does not know of any material proceedings contemplated by governmental authorities against Mid Penn or the Bank or any of its properties. ITEM 4. (REMOVED AND RESERVED)
12
ITEM 4.MINE SAFETY DISCLOSURES Not Applicable
PART II PART II
ITEM 5.MARKET FOR REGISTRANT’S COMMON EQUITY, RELATED SHAREHOLDER MATTERS AND ISSUER PURCHASES OF EQUITY SECURITIES The Corporation’s common stock is traded on the NASDAQ Stock Market under the symbol MPB. The following table shows the range of high and low sale prices for the Corporation’s stock and cash dividends paid for the quarters indicated. | | | | | | | | | | | | | | | | | | | High | | Low | | Cash Dividends Paid | Quarter Ended: | | | | | | | | | March 31, 2012 | $ | 11.43 | | $ | 6.09 | | $ | 0.05 | June 30, 2012 | | 11.50 | | | 9.45 | | | 0.05 | September 30, 2012 | | 10.95 | | | 8.97 | | | 0.05 | December 31, 2012 | | 11.19 | | | 9.75 | | | 0.10 | | | | | | | | | | March 31, 2011 | $ | 12.33 | | $ | 7.10 | | $ | 0.05 | June 30, 2011 | | 9.75 | | | 8.10 | | | 0.05 | September 30, 2011 | | 8.97 | | | 7.20 | | | 0.05 | December 31, 2011 | | 8.50 | | | 6.60 | | | 0.05 |
| | | | | | | | | | | | | High | | Low | | Cash
Dividends
Paid | Quarter Ended: | | | | | | | | | | March 31, 2009 | | $ | 22.00 | | $ | 17.36 | | $ | 0.20 | June 30, 2009 | | | 24.00 | | | 15.80 | | | 0.16 | September 30, 2009 | | | 17.99 | | | 14.00 | | | 0.16 | December 31, 2009 | | | 15.06 | | | 9.75 | | | — | | | | | March 31, 2008 | | $ | 26.70 | | $ | 23.00 | | $ | 0.20 | June 30, 2008 | | | 27.50 | | | 22.85 | | | 0.20 | September 30, 2008 | | | 25.85 | | | 21.60 | | | 0.20 | December 31, 2008 | | | 24.00 | | | 14.75 | | | 0.20 |
Transfer Agent: Registrar and Transfer Company, 10 Commerce Drive, Cranford, NJ 07016. Phone: 1-800-368-5948. Number of Shareholders: As of February 16, 2010,15, 2013, there were approximately 1,4761,462 shareholders of record of Mid Penn’s common stock. Dividends: Quarterly Cash dividends of $0.25 and $0.20 were paid in 2012 and 2011, respectively. There were no cash dividends of $0.52 in the aggregate were paid during 2009. Quarterly cash dividends of $0.80 in the aggregate were paid during 2008. The quarterly dividend payment was suspended during the fourth quarter of 2009 consistent with the Federal Reserve Board policy that dividend payouts should not exceed net income for the previous four quarters, net of dividends previously paid during that period. Mid Penn presently plans to resume a quarterly dividend payment to common shareholders once the provisions of the Federal Reserve policy can be satisfied.2010. Dividend Reinvestment and Stock Purchases: Shareholders of Mid Penn may acquire additional shares of common stock by reinvesting their cash dividends under the Dividend Reinvestment Plan without paying a brokerage fee. Voluntary cash contributions may also be made under the Plan. For additional information about the Plan, contact the Transfer Agent. Annual Meeting: The Annual Meeting of the Shareholders of Mid Penn will be held at 10:00 a.m. on Tuesday, May 4, 2010,7, 2013, at 349 Union Street, Millersburg, Pennsylvania. Accounting, Auditing and Internal Control Complaints: Information on how to report a complaint regarding accounting, internal accounting controls or auditing matters is available at Mid Penn’sPenn's website:www.midpennbank.com. midpennbank.com. 13
Stock Performance Graph Stock Performance Graph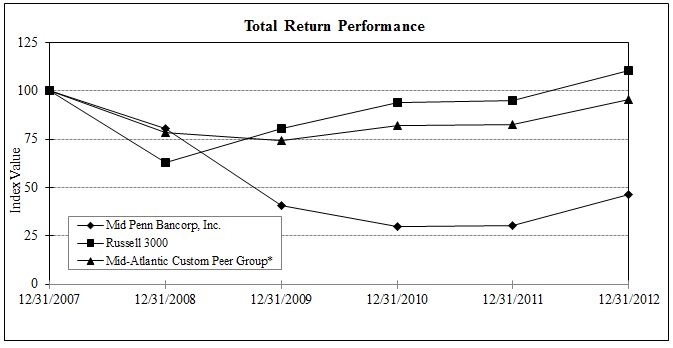
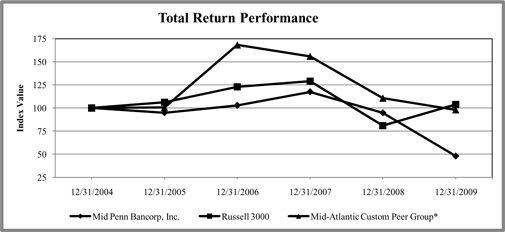
| | | | | | | | | | | | | | | | Period Ending | Index | | 12/31/2004 | | 12/31/2005 | | 12/31/2006 | | 12/31/2007 | | 12/31/2008 | | 12/31/2009 | Mid Penn Bancorp, Inc. | | 100.0 | | 94.8 | | 102.8 | | 117.5 | | 94.7 | | 47.9 | Russell 3000 | | 100.0 | | 106.1 | | 122.8 | | 129.1 | | 80.9 | | 103.9 | Mid-Atlantic Custom Peer Group* | | 100.0 | | 100.7 | | 168.2 | | 155.9 | | 110.7 | | 98.0 |
* | Mid-Atlantic Custom Peer Group consists of Mid-Atlantic commercial banks with assets less than $1B. |
Source : SNL Financial LC, Charlottesville, VA
© 2010
| | | | | | | | | Period Ending | | Index | 12/31/2007 | 12/31/2008 | 12/31/2009 | 12/31/2010 | 12/31/2011 | 12/31/2012 | Mid Penn Bancorp, Inc. | 100.00 | 80.64 | 40.79 | 29.73 | 30.61 | 46.60 | Russell 3000 | 100.00 | 62.69 | 80.46 | 94.08 | 95.05 | 110.65 | Mid-Atlantic Custom Peer Group* | 100.00 | 78.25 | 74.51 | 82.19 | 82.68 | 95.49 | | | | | | | | *Mid-Atlantic Custom Peer Group consists of Mid-Atlantic commercial banks with assets less than $1B as of 9/30/2012. | | | | | | | | | Source : SNL Financial LC, Charlottesville, VA | | | | | | © 2013 | | | | | | | www.snl.com | | | | | | |
A detailed list of the Banks comprising the Mid-Atlantic Custom Peer Group is incorporated herein by reference to Exhibit 99.1, which is attached to this Annual Report on Form 10-K. 14
ITEM 6.SELECTED FINANCIAL DATA Summary of Selected Financial Data | | | | | | | | | | | | | | | (Dollars in thousands, except per share data) | | | | | | | | | | | | | | | | | | | | | | | | | | | | | | | 2012 | | 2011 | | 2010 | | 2009 | | 2008 | INCOME: | | | | | | | | | | | | | | | Total Interest Income | $ | 30,366 | | $ | 31,545 | | $ | 30,148 | | $ | 31,336 | | $ | 31,856 | Total Interest Expense | | 7,125 | | | 9,522 | | | 10,642 | | | 13,304 | | | 14,890 | Net Interest Income | | 23,241 | | | 22,023 | | | 19,506 | | | 18,032 | | | 16,966 | Provision for Loan and Lease Losses | | 1,036 | | | 1,205 | | | 2,635 | | | 9,520 | | | 1,230 | Noninterest Income | | 3,683 | | | 2,996 | | | 3,414 | | | 3,656 | | | 3,682 | Noninterest Expense | | 19,693 | | | 18,048 | | | 17,121 | | | 16,671 | | | 14,726 | Income (Loss) Before Provision for (Benefit from) | | | | | | | | | | | | | | | Income Taxes | | 6,195 | | | 5,766 | | | 3,164 | | | (4,503) | | | 4,692 | Provision for (Benefit from) Income Taxes | | 1,244 | | | 1,223 | | | 416 | | | (2,208) | | | 1,104 | Net Income (Loss) | | 4,951 | | | 4,543 | | | 2,748 | | | (2,295) | | | 3,588 | Preferred Stock Dividends and Discount Accretion | | 514 | | | 514 | | | 514 | | | 514 | | | 16 | Net Income (Loss) Available to Common Shareholders | | 4,437 | | | 4,029 | | | 2,234 | | | (2,809) | | | 3,572 | | | | | | | | | | | | | | | | COMMON STOCK DATA PER SHARE: | | | | | | | | | | | | | | | Earnings (Loss) Per Common Share (Basic) | $ | 1.27 | | $ | 1.16 | | $ | 0.64 | | $ | (0.81) | | $ | 1.03 | Earnings (Loss) Per Common Share (Fully Diluted) | | 1.27 | | | 1.16 | | | 0.64 | | | (0.81) | | | 1.03 | Cash Dividends | | 0.25 | | | 0.20 | | | - | | | 0.52 | | | 0.80 | Book Value Per Common Share | | 13.57 | | | 12.47 | | | 10.98 | | | 10.55 | | | 11.75 | Tangible Book Value Per Common Share | | 13.19 | | | 12.10 | | | 10.58 | | | 10.15 | | | 11.34 | | | | | | | | | | | | | | | | AVERAGE SHARES OUTSTANDING (BASIC) | | 3,486,543 | | | 3,481,414 | | | 3,479,780 | | | 3,479,780 | | | 3,483,097 | AVERAGE SHARES OUTSTANDING (FULLY DILUTED) | | 3,486,543 | | | 3,481,414 | | | 3,479,780 | | | 3,479,780 | | | 3,483,153 | | | | | | | | | | | | | | | | AT YEAR-END: | | | | | | | | | | | | | | | Investments | $ | 154,295 | | $ | 159,043 | | $ | 70,702 | | $ | 47,345 | | $ | 52,739 | Loans and Leases, Net of Unearned Discount | | 484,220 | | | 482,717 | | | 467,735 | | | 480,385 | | | 434,643 | Allowance for Loan and Lease Losses | | 5,509 | | | 6,772 | | | 7,061 | | | 7,686 | | | 5,505 | Total Assets | | 705,200 | | | 715,383 | | | 637,457 | | | 606,010 | | | 572,999 | Total Deposits | | 625,461 | | | 634,055 | | | 554,982 | | | 500,015 | | | 436,824 | Short-term Borrowings | | - | | | - | | | 1,561 | | | 16,044 | | | 23,977 | Long-term Debt | | 22,510 | | | 22,701 | | | 27,883 | | | 38,057 | | | 55,223 | Shareholders' Equity | | 52,220 | | | 53,452 | | | 48,201 | | | 46,704 | | | 50,890 | | | | | | | | | | | | | | | | RATIOS: | | | | | | | | | | | | | | | Return on Average Assets | | 0.69% | | | 0.66% | | | 0.44% | | | -0.39% | | | 0.67% | Return on Average Shareholders' Equity | | 8.78% | | | 8.96% | | | 5.71% | | | -4.43% | | | 8.87% | Cash Dividend Payout Ratio | | 19.69% | | | 17.24% | | | 0.00% | | | -64.20% | | | 77.67% | Allowance for Loan and Lease Losses to | | | | | | | | | | | | | | | Loans and Leases | | 1.14% | | | 1.40% | | | 1.51% | | | 1.60% | | | 1.27% | Average Shareholders' Equity to | | | | | | | | | | | | | | | Average Assets | | 7.98% | | | 7.37% | | | 7.73% | | | 8.88% | | | 7.55% |
MID PENN BANCORP, INC.Management’s Discussion and Analysis ITEM 6.SELECTED FINANCIAL DATA
Summary of Selected Financial Data
| | | | | | | | | | | | | | | | | | | | | | (Dollars in thousands, except per share data) | | | | | | | | | | | | | | | | | | | 2009 | | | 2008 | | | 2007 | | | 2006 | | | 2005 | | INCOME: | | | | | | | | | | | | | | | | | | | | | Total Interest Income | | $ | 31,336 | | | $ | 31,856 | | | $ | 31,444 | | | $ | 28,214 | | | $ | 23,294 | | Total Interest Expense | | | 13,304 | | | | 14,890 | | | | 15,339 | | | | 12,732 | | | | 9,557 | | Net Interest Income | | | 18,032 | | | | 16,966 | | | | 16,105 | | | | 15,482 | | | | 13,737 | | Provision for Loan and Lease Losses | | | 9,520 | | | | 1,230 | | | | 925 | | | | 735 | | | | 225 | | Noninterest Income | | | 3,656 | | | | 3,682 | | | | 3,481 | | | | 3,028 | | | | 2,953 | | Noninterest Expense | | | 16,671 | | | | 14,726 | | | | 12,596 | | | | 11,263 | | | | 10,262 | | Income (Loss) Before (Benefit from) Provision for Income Taxes | | | (4,503 | ) | | | 4,692 | | | | 6,065 | | | | 6,512 | | | | 6,203 | | (Benefit from) Provision for Income Taxes | | | (2,208 | ) | | | 1,104 | | | | 1,394 | | | | 1,624 | | | | 1,600 | | Net (Loss) Income | | | (2,295 | ) | | | 3,588 | | | | 4,671 | | | | 4,888 | | | | 4,603 | | Preferred Stock Dividends and Discount Accretion | | | 514 | | | | 16 | | | | — | | | | — | | | | — | | Net (Loss) Income Available to Common Shareholders | | | (2,809 | ) | | | 3,572 | | | | 4,671 | | | | 4,888 | | | | 4,603 | | | | | | | | COMMON STOCK DATA PER SHARE: | | | | | | | | | | | | | | | | | | | | | (Loss) Earnings Per Common Share (Basic) | | $ | (0.81 | ) | | $ | 1.03 | | | $ | 1.34 | | | $ | 1.39 | | | $ | 1.31 | | (Loss) Earnings Per Common Share (Fully Diluted) | | | (0.81 | ) | | | 1.03 | | | | 1.34 | | | | 1.39 | | | | 1.31 | | Cash Dividends | | | 0.52 | | | | 0.80 | | | | 0.80 | | | | 0.80 | | | | 0.80 | | Book Value | | | 10.55 | | | | 11.75 | | | | 11.56 | | | | 11.12 | | | | 10.48 | | | | | | | | AVERAGE SHARES OUTSTANDING (BASIC) | | | 3,479,780 | | | | 3,483,097 | | | | 3,497,806 | | | | 3,514,820 | | | | 3,515,714 | | AVERAGE SHARES OUTSTANDING (FULLY DILUTED) | | | 3,479,780 | | | | 3,483,153 | | | | 3,497,806 | | | | 3,514,820 | | | | 3,515,714 | | | | | | | | AT YEAR-END: | | | | | | | | | | | | | | | | | | | | | Investments | | $ | 47,345 | | | $ | 52,739 | | | $ | 50,250 | | | $ | 57,261 | | | $ | 54,549 | | Loans and Leases, Net of Unearned Discount | | | 480,385 | | | | 434,643 | | | | 377,128 | | | | 358,612 | | | | 311,837 | | Allowance for Loan and Lease Losses | | | 7,686 | | | | 5,505 | | | | 4,790 | | | | 4,187 | | | | 3,704 | | Total Assets | | | 606,010 | | | | 572,999 | | | | 509,757 | | | | 491,694 | | | | 438,110 | | Total Deposits | | | 500,015 | | | | 436,824 | | | | 372,817 | | | | 364,226 | | | | 325,274 | | Short-term Borrowings | | | 16,044 | | | | 23,977 | | | | 37,349 | | | | 24,275 | | | | 12,342 | | Long-term Debt | | | 38,057 | | | | 55,223 | | | | 54,581 | | | | 59,713 | | | | 59,838 | | Shareholders’ Equity | | | 46,704 | | | | 50,890 | | | | 40,444 | | | | 39,085 | | | | 36,861 | | | | | | | | RATIOS: | | | | | | | | | | | | | | | | | | | | | Return on Average Assets | | | -0.39 | % | | | 0.67 | % | | | 0.94 | % | | | 1.08 | % | | | 1.10 | % | Return on Average Shareholders’ Equity | | | -4.43 | % | | | 8.87 | % | | | 11.84 | % | | | 12.93 | % | | | 12.87 | % | Cash Dividend Payout Ratio | | | -64.40 | % | | | 77.67 | % | | | 59.70 | % | | | 54.79 | % | | | 55.56 | % | Allowance for Loan and Lease Losses to Loans and Leases | | | 1.60 | % | | | 1.27 | % | | | 1.27 | % | | | 1.17 | % | | | 1.19 | % | Average Shareholders’ Equity to Average Assets | | | 8.88 | % | | | 7.55 | % | | | 7.82 | % | | | 8.34 | % | | | 8.55 | % |
15
| | | MID PENN BANCORP, INC. | | Management’s Discussion and Analysis |
ITEM 7.MANAGEMENT’S DISCUSSION AND ANALYSIS OF FINANCIAL CONDITION AND RESULTS OF OPERATIONS SPECIAL CAUTIONARY NOTICE REGARDING FORWARD-LOOKING STATEMENTS Certain of the matters discussed in this document may constitute forward-looking statements for purposes of the Securities Act of 1933, as amended, and the Securities Exchange Act of 1934, as amended, and as such may involve known and unknown risks, uncertainties and other factors which may cause the actual results, performance or achievements of Mid Penn to be materially different from future results, performance or achievements expressed or implied by such forward-looking statements. The words “expect,” “anticipate,” “intend,” “plan,” “believe,” “estimate,” and similar expressions are intended to identify such forward-looking statements. Mid Penn’s actual results may differ materially from the results anticipated in these forward-looking statements due to a variety of factors, including, without limitation: The effects of future economic conditions on Mid Penn and its customers;
· | The effects of economic deterioration on current customers, specifically the effect of the economy on loan customers’ ability to repay loans; |
· | Governmental monetary and fiscal policies, as well as legislative and regulatory changes, including the effects of the Dodd-Frank Wall Street Reform and Consumer Protection Act; |
· | The effects of the failure of the federal government to reach a deal to raise the debt ceiling or avoid sequester, and the negative results on economic or business conditions resulting therefrom; |
· | The effect of changes in accounting policies and practices, as may be adopted by the regulatory agencies, as well as the Financial Accounting Standards Board and other accounting standard setters; |
· | The risks of changes in interest rates on the level and composition of deposits, loan demand, and the values of loan collateral, securities and interest rate protection agreements, as well as interest rate risks; |
· | The effects of competition from other commercial banks, thrifts, mortgage banking firms, consumer finance companies, credit unions, securities brokerage firms, insurance companies, money market and other mutual funds and other financial institutions operating in Mid Penn’s market area and elsewhere, including institutions operating locally, regionally, nationally and internationally, together with such competitors offering banking products and services by mail, telephone, computer and the internet; |
· | The costs and effects of litigation and of unexpected or adverse outcomes in such litigation; |
· | Acquisitions and integration of acquired businesses; |
· | The failure of assumptions underlying the establishment of reserves for loan and lease losses and estimations of values of collateral and various financial assets and liabilities; |
· | Acts of war or terrorism; |
· | Volatilities in the securities markets; and |
· | Deteriorating economic conditions. |
Governmental monetary and fiscal policies, as well as legislative and regulatory changes;
The effect of changes in accounting policies and practices, as may be adopted by the regulatory agencies, as well as the Financial Accounting Standards Board and other accounting standard setters;
The risks of changes in interest rates on the level and composition of deposits, loan demand, and the values of loan collateral, securities and interest rate protection agreements, as well as interest rate risks;
The effects of economic deterioration on current customers, specifically the effect of the economy on loan customers’ ability to repay loans;
The effects of competition from other commercial banks, thrifts, mortgage banking firms, consumer finance companies, credit unions, securities brokerage firms, insurance companies, money market and other mutual funds and other financial institutions operating in Mid Penn’s market area and elsewhere, including institutions operating locally, regionally, nationally and internationally, together with such competitors offering banking products and services by mail, telephone, computer and the internet;
The costs and effects of litigation and of unexpected or adverse outcomes in such litigation;
Acquisitions and integration of acquired businesses;
The failure of assumptions underlying the establishment of reserves for loan and lease losses and estimations of values of collateral and various financial assets and liabilities;
Acts of war or terrorism;
Volatilities in the securities markets;
Deteriorating economic conditions.
All written or oral forward-looking statements attributable to Mid Penn are expressly qualified in their entirety by these cautionary statements. Management’s Discussion and Analysis of Financial Condition and Results of Operations analyzes the major elements of Mid Penn’s consolidated financial statements and should be read in conjunction with the Consolidated Financial Statements of the Corporation and Notes thereto and other detailed information appearing elsewhere in this Annual Report. Mid Penn is not aware of any known trends, events, uncertainties or of any current recommendations by the regulatory authorities which, if they were to be implemented, would have a material effect on Mid Penn’s liquidity, capital resources or operations. Financial Summary
The consolidated earnings of Mid Penn are derived primarily from the operations of its wholly owned subsidiary, Mid Penn Bank.
Mid Penn recorded a net loss available to common shareholders of ($2,809,000) for the year 2009, compared to net income available to common shareholders of $3,572,000 in 2008, which was a decrease of $6,381,000 or 178.6%. This represents a net loss in 2009 of ($0.81) per common share compared to net income of $1.03 per common share in 2008 and $1.34 per common share in 2007.
Total assets of Mid Penn continued to grow in 2009, reaching the level of $606,010,000, an increase of $33,011,000 or 5.8% over $572,999,000 at year-end 2008. The majority of growth came from increases in commercial and commercial real estate loans. These increases were funded primarily through growth in deposits.
Mid Penn’s return on average shareholders’ equity, (ROE), a widely recognized performance indicator in the financial industry, was (4.43%) in 2009, 8.87% in 2008 and 11.84% in 2007. Return on average assets (ROA), another performance indicator, was (0.39%) in 2009, 0.67% in 2008 and 0.94% in 2007.
Mid Penn’s performance during 2009 was adversely impacted by several factors. First was an increase in provision for loan and lease losses, driven by deterioration in the overall quality of the loan portfolio. The recession and problems in the commercial real estate sector of the economy negatively impacted a number of loans in the portfolio, causing a precipitous increase in non-performing loans. Mid Penn also experienced strong growth in loan volumes. Further discussion of this increase can be found in the Provision for Loan and Lease Losses section below.
16
| | | MID PENN BANCORP, INC. | | Management’s Discussion and Analysis |
Second was the dramatic increase in FDIC insurance expense. This increase of $1,047,000 or 902.6% over 2008 levels resulted primarily from an industry-wide assessment by the FDIC on all of its member banks to restore the Deposit Insurance Fund to address future bank failures should they occur. This increase is not a reflection on Mid Penn’s financial performance, but rather on the number of bank failures throughout the country which had depleted the Deposit Insurance Fund. Further discussion of this and other expense increases can be found in the Noninterest Expense section below.
Finally is the decline in interest rate environment that occurred late in 2008 and early 2009. While Mid Penn exhibited strong growth in both loans and deposits, the Federal Reserve’s program of interest rate cuts to spur a loosening of the credit markets blunted the benefit of this growth. Mid Penn’s net interest margin declined to 3.42% in 2009 from 3.50% in 2008. Mid Penn’s net interest margin was also negatively impacted by the interest lost on nonperforming loans and leases. Net interest income on a tax equivalent basis rose $1,150,000 or 6.4% over 2008 levels in spite of an 8.8% increase in average earning assets. Further discussion of net interest margin can be found in the Net Interest Income section below.
Mid Penn’s fundamental operating performance in 2009 was sound despite these issues and the general economic conditions and credit crisis issues experienced by the banking industry as a whole. Mid Penn’s ongoing investment in marketing and business development in 2009 and 2008 was rewarded with strong growth in loans and deposits in its markets.
The Bank’s tier one capital (to risk weighted assets) of $44,434,000 or 9.2% and total capital (to risk weighted assets) of $50,496,000 or 10.4% at December 31, 2009, are above the regulatory requirements, which is 4% for tier one capital and 8% for total capital. Tier one capital consists primarily of the Bank’s shareholders’ equity. Total capital includes qualifying subordinated debt, if any, and the allowance for loan and lease losses, within permitted limits. Risk-weighted assets are determined by assigning various levels of risk to different categories of assets and off-balance sheet activities.
Critical Accounting Estimates Mid Penn’s consolidated financial statements are prepared in accordance with accounting principles generally accepted in the United States of America (“GAAP”) and conform to general practices within the banking industry. Application of these principles involves significant judgments and estimates by management that have a material impact on the carrying value of certain assets and liabilities. The judgments and estimates that we used are based on historical experiences and other factors, which are believed to be reasonable under the circumstances. Because of the nature of the judgments and estimates that we have made, actual results could differ from these judgments and estimates, which could have a material impact on the carrying values of assets and liabilities and the results of our operations. Management of the Corporation considers the accounting judgments relating to the allowance for loan and lease losses, and the evaluation of the Corporation’s investment securities for other-than-temporary impairment, and the assessment of goodwill for impairment to be the accounting areas that require the most subjective and complex judgments. The allowance for loan and lease losses represents management’s estimate of probable incurred credit losses inherent in the loan and lease portfolio. Determining the amount of the allowance for loan and lease losses is considered a critical accounting estimate because it requires significant judgment and the use of estimates related to the amount and timing of expected future cash flows on impaired loans, estimated losses on pools of homogeneous loans based on historical loss experience, and consideration of current economic trends and conditions, all of which
MID PENN BANCORP, INC.Management’s Discussion and Analysis may be susceptible to significant change. The loan and lease portfolio also represents the largest asset type on the consolidated balance sheet. Throughout the remainder of this report, the terms “loan” or “loans” refers to both loans and leases. Valuations for the investment portfolio are determined using quoted market prices, where available. If quoted market prices are not available, investment valuation is based on pricing models, quotes for similar investment securities, and observable yield curves and spreads. In addition to valuation, management must assess whether there are any declines in value below the carrying value of the investments that should be considered other than temporary or otherwise require an adjustment in carrying value and recognition of the loss in the consolidated statement of income. Accounting Standards Codification (ASC) Topic 350, Intangibles-Goodwill and Other, requires that goodwill is not amortized to expense, but rather that it be tested for impairment at least annually. Impairment write-downs are charged to results of operations in the period in which the impairment is determined. The Corporation did not identify any impairment on its outstanding goodwill from its most recent testing, which was performed as of December 31, 2012. If certain events occur which might indicate goodwill has been impaired, the goodwill is tested when such events occur. Financial Summary The consolidated earnings of Mid Penn are derived primarily from the operations of its wholly owned subsidiary, Mid Penn Bank. 2012 versus 2011 Mid Penn recorded net income available to common shareholders of $4,437,000 for the year 2012, compared to $4,029,000 in 2011, which was an increase of $408,000 or 10.1%. This represents net income in 2012 of $1.27 per common share compared to $1.16 per common share in 2011. Total assets of Mid Penn contracted in 2012, falling to $705,200,000, a decrease of $10,183,000, or 1.4% from $715,383,000 at year-end 2011. The majority of asset contraction came from a decrease in investments, which fell to $154,295,000 or 3.0% from $159,043,000 at the end of 2011. Federal funds sold also decreased, falling $3,439,000 or 53.4% from $6,439,000 at the end of 2011. These asset reductions were used to offset a reduction in deposits, which decreased 1.4% to $625,461,000 from $634,055,000 at year-end 2011. This deposit decrease was the result of the maturity of a $10,000,000 brokered certificate of deposit early in 2012. The continued soft economy was the major contributor to modest loan growth during 2012. Loan balances increased 0.3% to $484,220,000 from $482,717,000 in 2011. Mid Penn experienced weak loan demand during 2012 despite a desire to sensibly lend to support creditworthy existing and new customers in the marketplace. Adding additional strain to weakened demand was the increase in unscheduled payoffs of large loans within the portfolio. The continued low interest rate environment and weak economy has increased the competitive pressure from other lending institutions to attract borrowers from other institutions as well as incenting borrowers to use surplus cash reserves to pay down debt rather than expand their operations.
Mid Penn’s return on average shareholders’ equity, (ROE), a widely recognized performance indicator in the financial industry, was 8.78% in 2012 and 8.96% in 2011. Return on average assets (ROA), another performance indicator, was 0.69% in 2012 and 0.66% in 2011. Mid Penn’s performance during 2012 was a solid improvement over the results reported in 2011. This improvement was the result of reduced provision for loan and lease losses, improving cost of funds, consistent management of controllable expenses, and growth in noninterest income sources throughout 2012. Net charge-offs increased from $1,494,000 in 2011 to $2,299,000 during 2012. Despite the increase in net charge-offs from 2011, Mid Penn was able to reduce provision for loan and lease losses from $1,205,000 in 2011 to $1,036,000 in 2012. This stemmed from the fact that $1,499,000 of the net charge-offs during 2012 had a previously recorded balance included in the allowance for loan and lease losses. As Mid Penn continues to work to resolve the elevated levels of nonperforming loans, the relationship between net charge-offs and provision for loan and lease losses may continue to have a more tenuous link. Further discussion of these issues can be found in the Provision for Loan and Lease Losses section below. Net interest margin improved to 3.63% in 2012 from 3.52% in 2011. This improvement was driven by a 48 basis point improvement in the rate on supporting liabilities from 1.68% in 2011 to 1.20% in 2012. This improvement allowed average interest spread to increase to 3.49% from 3.29% in 2011 and net interest income on a tax equivalent basis to increase from $23,094,000 in 2011 to $24,494,000 in 2012. This increase was achieved in spite of the substantial pool of nonperforming loans being carried on the balance sheet. The amount of interest income lost on this pool of troubled loans in 2012 amounted to $2,974,000. Further discussion of net interest margin can be found in the Net Interest Income section below. In addition to the interest lost on nonperforming loans, this pool of troubled assets increases Mid Penn’s costs associated with the management and collection of this pool of assets. During 2012, the expenses associated with the increased collection and management efforts on troubled
MID PENN BANCORP, INC.Management’s Discussion and Analysis assets were $369,000 as compared to $299,000 in 2011. These expenses remain at historically high levels as Mid Penn resolves problems associated with the pool of troubled assets. Mid Penn’s fundamental operating performance in 2012 was sound despite these issues and the general economic conditions experienced by the banking industry as a whole. The Bank’s tier one capital (to risk weighted assets) of $48,764,000, or 10.0%, and total capital (to risk weighted assets) of $54,363,000, or 11.1%, at December 31, 2012, are above the regulatory requirements. Tier one capital consists primarily of the Bank’s shareholders' equity and any qualifying preferred stock. Total capital also includes qualifying subordinated debt, if any, and the allowance for loan and lease losses, within permitted limits. Risk-weighted assets are determined by assigning various levels of risk to different categories of assets and off-balance sheet activities. 2011 versus 2010 Mid Penn recorded net income available to common shareholders of $4,029,000 for the year 2011, compared to $2,234,000 in 2010, which was an increase of $1,795,000 or 80.3%. This represents net income in 2011 of $1.16 per common share compared to $0.64 per common share in 2010. Total assets of Mid Penn continued to grow in 2011, reaching $715,383,000, an increase of $77,926,000, or 12.2% over $637,457,000 at year-end 2010. The majority of growth in assets came from increases in investments, which increased to $159,043,000 or 124.9% over $70,702,000 at the end of 2010. This growth was funded primarily through growth in deposits, which increased 14.2% to $634,055,000 from $554,982,000 at year-end 2010. The continued soft economy was the major contributor to modest loan growth during 2011. Loan balances increased 3.2% to $482,717,000 from $467,735,000 in 2010. The modest growth numbers were a welcome improvement over the loan balance contraction experienced in 2010 from the end of 2009. Mid Penn experienced weak loan demand during 2011 despite a desire to sensibly lend to support creditworthy existing and new customers in the marketplace. Mid Penn’s return on average shareholders’ equity, (ROE), a widely recognized performance indicator in the financial industry, was 8.96% in 2011 and 5.71% in 2010. Return on average assets (ROA), another performance indicator, was 0.66% in 2011 and 0.44% in 2010. Mid Penn’s performance during 2011 was a dramatic improvement over the results reported in 2010. This improvement was the result of reduced loan charge-offs and provision for loan and lease losses, improving cost of funds, consistent management of controllable expenses, and positive loan growth throughout 2011. Net charge-offs decreased from $3,260,000 in 2010 to $1,494,000 during 2011. The reduction from 2010 allowed for a reduced provision for loan and lease losses from $2,635,000 in 2010 to $1,205,000 in 2011. The recession and problems in the commercial real estate sector of the economy continued to negatively impact a number of loans in the portfolio, causing continued elevation in the level of nonperforming loans from those experienced prior to 2009. Further discussion of these issues can be found in the Provision for Loan and Lease Losses section below. Net interest margin improved to 3.52% in 2011 from 3.47% in 2010. This improvement was driven by a 40 basis point improvement in the rate on supporting liabilities from 2.08% in 2010 to 1.68% in 2011. This improvement allowed average interest spread to increase to 3.29% from 3.20% in 2010 and net interest income on a tax equivalent basis to increase from $20,468,000 in 2010 to $23,094,000 in 2011. This increase was achieved in spite of the substantial pool of nonperforming loans being carried on the balance sheet. The amount of interest income lost on this pool of troubled loans in 2011 amounted to $1,942,000. Further discussion of net interest margin can be found in the Net Interest Income section below. FDIC insurance premiums increased in 2011 from 2010 and this expense remains at historically high levels as the FDIC continues its efforts to restore the Deposit Insurance Fund and keep it solvent to handle future bank failures should they occur. In addition to high deposit insurance premiums, the increasing regulatory and compliance burden necessitated the hiring of a dedicated compliance officer in 2010 to ensure Mid Penn’s continued compliance with current and anticipated future regulatory changes. This hiring was followed in 2011 with the addition of three additional positions dedicated to compliance with the Bank Secrecy Act, U.S. Patriot Act, and general regulatory compliance. Mid Penn was negatively impacted by recent regulatory changes governing overdraft charges, which has resulted in a reduction in NSF revenue of $435,000 during 2011. In addition to the interest lost on nonperforming loans, this pool of troubled assets increases Mid Penn’s costs associated with the management and collection of this pool of assets. During 2011, the expenses associated with the increased collection and management efforts on troubled assets were $299,000 as compared to $307,000 in 2010. These expenses remain at historically high levels as Mid Penn resolves problems associated with the pool of troubled assets. Mid Penn’s fundamental operating performance in 2011 was sound despite these issues and the general economic conditions and credit crisis issues experienced by the banking industry as a whole.
MID PENN BANCORP, INC.Management’s Discussion and Analysis The Bank’s tier one capital (to risk weighted assets) of $50,265,000 or 10.4% and total capital (to risk weighted assets) of $56,327,000 or 11.6% at December 31, 2011, are above the regulatory requirements. Tier one capital consists primarily of the Bank’s shareholders' equity and any qualifying preferred stock. Total capital also includes qualifying subordinated debt, if any, and the allowance for loan and lease losses, within permitted limits. Risk-weighted assets are determined by assigning various levels of risk to different categories of assets and off-balance sheet activities. Net Interest Income Net interest income, Mid Penn’sPenn's primary source of revenue, represents the difference between interest income and interest expense. Net interest income is affected by changes in interest rates and changes in average balances (volume) in the various interest-sensitive assets and liabilities. 17
| | | MID PENN BANCORP, INC. | | Management’s Discussion and Analysis |
MID PENN BANCORP, INC.Management’s Discussion and Analysis TABLE 1: AVERAGE BALANCES, EFFECTIVE INTEREST DIFFERENTIAL AND INTEREST YIELDS Income and Rates on a Taxable Equivalent Basis for Years Ended
| | | | | | | | | | | | | | | | | | | | | | | | | | | | | | | | | | | | | | | | | | | | | | | | Income and Rates on a Taxable Equivalent Basis for Years Ended | | | | | | | | | | | | | | | | | | | (Dollars in thousands) | | | | | | | | | | | | | | | | | | | | | | | | | December 31, 2012 | | December 31, 2011 | | December 31, 2010 | | Average | | | | Average | | Average | | | | Average | | Average | | | | Average | | Balance | | Interest | | Rates | | Balance | | Interest | | Rates | | Balance | | Interest | | Rates | ASSETS: | | | | | | | | | | | | | | | | | | | | | | | | Interest Earning Balances | $ | 26,092 | | $ | 236 | | 0.90% | | $ | 50,458 | | $ | 520 | | 1.03% | | $ | 45,244 | | $ | 818 | | 1.81% | Investment Securities: | | | | | | | | | | | | | | | | | | | | | | | | Taxable | | 99,906 | | | 1,154 | | 1.16% | | | 81,017 | | | 1,632 | | 2.01% | | | 31,981 | | | 800 | | 2.50% | Tax-Exempt | | 55,033 | | | 2,609 | | 4.74% | | | 35,238 | | | 2,015 | | 5.72% | | | 26,254 | | | 1,679 | | 6.40% | Total Securities | | 154,939 | | | | | | | | 116,255 | | | | | | | | 58,235 | | | | | | Federal Funds Sold | | 6,197 | | | 16 | | 0.26% | | | 9,922 | | | 25 | | 0.25% | | | 9,222 | | | 25 | | 0.27% | Loans and Leases, Net | | 483,977 | | | 27,599 | | 5.70% | | | 475,677 | | | 28,424 | | 5.98% | | | 472,582 | | | 27,788 | | 5.88% | Restricted Investment | | | | | | | | | | | | | | | | | | | | | | | | in Bank Stocks | | 2,772 | | | 5 | | 0.18% | | | 3,441 | | | - | | 0.00% | | | 3,995 | | | - | | 0.00% | Total Earning Assets | | 673,977 | | | 31,619 | | 4.69% | | | 655,753 | | | 32,616 | | 4.97% | | | 589,278 | | | 31,110 | | 5.28% | Cash and Due from Banks | | 8,057 | | | | | | | | 7,941 | | | | | | | | 7,466 | | | | | | Other Assets | | 24,422 | | | | | | | | 24,756 | | | | | | | | 26,330 | | | | | | Total Assets | $ | 706,456 | | | | | | | $ | 688,450 | | | | | | | $ | 623,074 | | | | | | LIABILITIES & | | | | | | | | | | | | | | | | | | | | | | | | SHAREHOLDERS' EQUITY: | | | | | | | | | | | | | | | | | | | | | | | | Interest Bearing Deposits: | | | | | | | | | | | | | | | | | | | | | | | | NOW | $ | 126,171 | | | 458 | | 0.36% | | $ | 57,342 | | | 144 | | 0.25% | | $ | 48,024 | | | 69 | | 0.14% | Money Market | | 236,434 | | | 1,992 | | 0.84% | | | 248,615 | | | 2,992 | | 1.20% | | | 163,415 | | | 2,357 | | 1.44% | Savings | | 28,632 | | | 14 | | 0.05% | | | 27,801 | | | 15 | | 0.05% | | | 26,585 | | | 16 | | 0.06% | Time | | 180,356 | | | 3,683 | | 2.04% | | | 209,574 | | | 5,358 | | 2.56% | | | 239,761 | | | 6,877 | | 2.87% | Short-term Borrowings | | 1,044 | | | 3 | | 0.29% | | | 803 | | | 4 | | 0.50% | | | 3,798 | | | 18 | | 0.47% | Long-term Debt | | 22,605 | | | 975 | | 4.31% | | | 23,394 | | | 1,009 | | 4.31% | | | 28,860 | | | 1,305 | | 4.52% | Total Interest | | | | | | | | | | | | | | | | | | | | | | | | Bearing Liabilities | | 595,242 | | | 7,125 | | 1.20% | | | 567,529 | | | 9,522 | | 1.68% | | | 510,443 | | | 10,642 | | 2.08% | Demand Deposits | | 47,670 | | | | | | | | 63,484 | | | | | | | | 58,480 | | | | | | Other Liabilities | | 7,184 | | | | | | | | 6,722 | | | | | | | | 6,010 | | | | | | Shareholders' Equity | | 56,360 | | | | | | | | 50,715 | | | | | | | | 48,141 | | | | | | Total Liabilities and | | | | | | | | | | | | | | | | | | | | | | | | Shareholders' Equity | $ | 706,456 | | | | | | | $ | 688,450 | | | | | | | $ | 623,074 | | | | | | Net Interest Income | | | | $ | 24,494 | | | | | | | $ | 23,094 | | | | | | | $ | 20,468 | | | | | | | | | | | | | | | | | | | | | | | | | | | Net Yield on Interest Earning Assets: | | | | | | | | | | | | | | | | | | | | | | | | Total Yield on Earning Assets | | | | | | | 4.69% | | | | | | | | 4.97% | | | | | | | | 5.28% | Rate on Supporting Liabilities | | | | | | | 1.20% | | | | | | | | 1.68% | | | | | | | | 2.08% | Average Interest Spread | | | | | | | 3.49% | | | | | | | | 3.29% | | | | | | | | 3.20% | Net Interest Margin | | | | | | | 3.63% | | | | | | | | 3.52% | | | | | | | | 3.47% |
| | | | | | | | | | | | | | | | | | | | | | | | | | | | | (Dollars in thousands) | | | | | | | | | | | December 31, 2009 | | | December 31, 2008 | | | December 31, 2007 | | | | | Average
Balance | | Interest | | Average
Rates | | | Average
Balance | | Interest | | Average
Rates | | | Average
Balance | | Interest | | Average
Rates | | ASSETS: | | | | | | | | | | | | | | | | | | | | | | | | | | | | Interest Earning Balances | | $ | 41,925 | | $ | 1,460 | | 3.48 | % | | $ | 54,804 | | $ | 2,499 | | 4.56 | % | | $ | 46,900 | | $ | 2,546 | | 5.43 | % | Investment Securities: | | | | | | | | | | | | | | | | | | | | | | | | | | | | Taxable | | | 18,829 | | | 665 | | 3.53 | % | | | 19,870 | | | 831 | | 4.18 | % | | | 21,709 | | | 959 | | 4.42 | % | Tax-Exempt | | | 25,188 | | | 1,774 | | 7.04 | % | | | 27,287 | | | 1,895 | | 6.94 | % | | | 29,726 | | | 2,062 | | 6.94 | % | | | | | | | | | | | | | | | | | | | | | | | | | | | | | Total Securities | | | 44,017 | | | | | | | | | 47,157 | | | | | | | | | 51,435 | | | | | | | | | | | | | | | | | | | | | | | | | | | | | | | | | | | Federal Funds Sold | | | 279 | | | 1 | | 0.30 | % | | | — | | | — | | — | | | | 624 | | | 33 | | 5.29 | % | Loans and Leases, Net: | | | | | | | | | | | | | | | | | | | | | | | | | | | | Taxable | | | 446,649 | | | 27,370 | | 6.13 | % | | | 394,674 | | | 26,713 | | 6.77 | % | | | 361,324 | | | 26,592 | | 7.36 | % | Tax-Exempt | | | 17,504 | | | 1,013 | | 5.79 | % | | | 8,994 | | | 648 | | 7.20 | % | | | — | | | — | | — | | | | | | | | | | | | | | | | | | | | | | | | | | | | | | Total Loans and Leases, Net | | | 464,153 | | | | | | | | | 403,668 | | | | | | | | | 361,324 | | | | | | | Restricted Investment in Bank Stocks | | | 3,929 | | | 1 | | 0.03 | % | | | 3,657 | | | 134 | | 3.66 | % | | | 3,334 | | | 191 | | 5.73 | % | | | | | | | | | | | | | | | | | | | | | | | | | | | | | Total Earning Assets | | | 554,303 | | | 32,284 | | 5.82 | % | | | 509,286 | | | 32,720 | | 6.42 | % | | | 463,617 | | | 32,383 | | 6.98 | % | | | | | | | | | | | | | | | | | | | | | | | | | | | | | Cash and Due from Banks | | | 6,795 | | | | | | | | | 7,745 | | | | | | | | | 7,559 | | | | | | | Other Assets | | | 22,071 | | | | | | | | | 21,326 | | | | | | | | | 25,012 | | | | | | | | | | | | | | | | | | | | | | | | | | | | | | | | | | | Total Assets | | $ | 583,169 | | | | | | | | $ | 538,357 | | | | | | | | $ | 496,188 | | | | | | | | | | | | | | | | | | | | | | | | | | | | | | | | | | | LIABILITIES & SHAREHOLDERS’ EQUITY: | | | | | | | | | | | | | | | | | | | | | | | | | | | | Interest Bearing Deposits: | | | | | | | | | | | | | | | | | | | | | | | | | | | | NOW | | $ | 38,198 | | | 33 | | 0.09 | % | | $ | 36,551 | | | 108 | | 0.30 | % | | $ | 35,048 | | | 144 | | 0.41 | % | Money Market | | | 87,427 | | | 1,383 | | 1.58 | % | | | 69,251 | | | 1,456 | | 2.10 | % | | | 63,927 | | | 2,208 | | 3.45 | % | Savings | | | 26,241 | | | 17 | | 0.06 | % | | | 25,607 | | | 65 | | 0.25 | % | | | 25,513 | | | 72 | | 0.28 | % | Time | | | 255,123 | | | 9,293 | | 3.64 | % | | | 230,773 | | | 9,903 | | 4.29 | % | | | 203,671 | | | 9,006 | | 4.42 | % | Short-term Borrowings | | | 19,715 | | | 112 | | 0.57 | % | | | 29,144 | | | 608 | | 2.09 | % | | | 22,528 | | | 1,049 | | 4.66 | % | Long-term Debt | | | 47,241 | | | 2,466 | | 5.22 | % | | | 52,843 | | | 2,750 | | 5.20 | % | | | 56,908 | | | 2,860 | | 5.03 | % | | | | | | | | | | | | | | | | | | | | | | | | | | | | | Total Interest Bearing Liabilities | | | 473,945 | | | 13,304 | | 2.81 | % | | | 444,169 | | | 14,890 | | 3.35 | % | | | 407,595 | | | 15,339 | | 3.76 | % | | | | | | | | | | | | | | | | | | | | | | | | | | | | | Demand Deposits | | | 51,464 | | | | | | | | | 47,274 | | | | | | | | | 44,021 | | | | | | | Other Liabilities | | | 5,985 | | | | | | | | | 6,456 | | | | | | | | | 5,734 | | | | | | | Shareholders’ Equity | | | 51,775 | | | | | | | | | 40,458 | | | | | | | | | 38,838 | | | | | | | | | | | | | | | | | | | | | | | | | | | | | | | | | | | | | | | | | | | | | Total Liabilities and Shareholders’ Equity | | $ | 583,169 | | | | | | | | $ | 538,357 | | | | | | | | $ | 496,188 | | | | | | | | | | | | | | | | | | | | | | | | | | | | | | | | | | | Net Interest Income | | | | | $ | 18,980 | | | | | | | | $ | 17,830 | | | | | | | | $ | 17,044 | | | | | | | | | | | | | | | | | | | | | | | | | | | | | | | | | | | | | | | | | | Net Yield on Interest Earning Assets: | | | | | | | | | | | | | | | | | | | | | | | | | | | | Total Yield on Earning Assets | | | | | | | | 5.82 | % | | | | | | | | 6.42 | % | | | | | | | | 6.98 | % | Rate on Supporting Liabilities | | | | | | | | 2.81 | % | | | | | | | | 3.35 | % | | | | | | | | 3.76 | % | Average Interest Spread | | | | | | | | 3.01 | % | | | | | | | | 3.07 | % | | | | | | | | 3.22 | % | Net Interest Margin | | | | | | | | 3.42 | % | | | | | | | | 3.50 | % | | | | | | | | 3.68 | % |
Interest and average rates are presented on a fully taxable equivalent basis, using an effective tax rate of 34%. For purposes of calculating loan yields, average loan balances include nonaccrual loans. Loan fees of $683,000, $637,000$1,148,000, $635,000, and $604,000$710,000 are included with interest income in Table 1 for the years 2009, 20082012, 2011 and 2007,2010, respectively. 18
| | | MID PENN BANCORP, INC. | | Management’s Discussion and Analysis |
MID PENN BANCORP, INC.Management’s Discussion and Analysis TABLE 2: VOLUME ANALYSIS OF CHANGES IN NET INTEREST INCOME | | | | | | | | | | | | | | | | | | | | | | | | | | (Dollars in thousands) | | 2009 Compared to 2008
Increase (Decrease) Due to Change In: | | | 2008 Compared to 2007
Increase (Decrease) Due to Change In: | | | Taxable Equivalent Basis | | Volume | | | Rate | | | Net | | | Volume | | | Rate | | | Net | | INTEREST INCOME: | | | | | | | | | | | | | | | | | | | | | | | | | Interest Bearing Balances | | $ | (587 | ) | | $ | (452 | ) | | $ | (1,039 | ) | | $ | 429 | | | $ | (476 | ) | | $ | (47 | ) | Investment Securities: | | | | | | | | | | | | | | | | | | | | | | | | | Taxable | | | (44 | ) | | | (122 | ) | | | (166 | ) | | | (81 | ) | | | (47 | ) | | | (128 | ) | Tax-Exempt | | | (146 | ) | | | 25 | | | | (121 | ) | | | (169 | ) | | | 2 | | | | (167 | ) | | | | | | | | | | | | | | | | | | | | | | | | | | Total Investment Securities | | | (190 | ) | | | (97 | ) | | | (287 | ) | | | (250 | ) | | | (45 | ) | | | (295 | ) | | | | | | | | Federal Funds Sold | | | 1 | | | | — | | | | 1 | | | | (33 | ) | | | — | | | | (33 | ) | Loans and Leases, Net | | | 4,703 | | | | (3,681 | ) | | | 1,022 | | | | 3,116 | | | | (2,347 | ) | | | 769 | | Restricted Investment Bank Stocks | | | 10 | | | | (143 | ) | | | (133 | ) | | | 19 | | | | (76 | ) | | | (57 | ) | | | | | | | | | | | | | | | | | | | | | | | | | | Total Interest Income | | | 3,937 | | | | (4,373 | ) | | | (436 | ) | | | 3,281 | | | | (2,944 | ) | | | 337 | | | | | | | | | | | | | | | | | | | | | | | | | | | | | | | | | | INTEREST EXPENSE: | | | | | | | | | | | | | | | | | | | | | | | | | Interest Bearing Deposits: | | | | | | | | | | | | | | | | | | | | | | | | | NOW | | | 5 | | | | (80 | ) | | | (75 | ) | | | 6 | | | | (42 | ) | | | (36 | ) | Money Market | | | 382 | | | | (455 | ) | | | (73 | ) | | | 184 | | | | (936 | ) | | | (752 | ) | Savings | | | 2 | | | | (50 | ) | | | (48 | ) | | | — | | | | (7 | ) | | | (7 | ) | Time | | | 1,045 | | | | (1,655 | ) | | | (610 | ) | | | 1,198 | | | | (301 | ) | | | 897 | | | | | | | | | | | | | | | | | | | | | | | | | | | Total Interest Bearing Deposits | | | 1,434 | | | | (2,240 | ) | | | (806 | ) | | | 1,388 | | | | (1,286 | ) | | | 102 | | | | | | | | | Short-term Borrowings | | | (197 | ) | | | (299 | ) | | | (496 | ) | | | 308 | | | | (749 | ) | | | (441 | ) | Long-term Debt | | | (292 | ) | | | 8 | | | | (284 | ) | | | (204 | ) | | | 94 | | | | (110 | ) | | | | | | | | | | | | | | | | | | | | | | | | | | Total Interest Expense | | | 945 | | | | (2,531 | ) | | | (1,586 | ) | | | 1,492 | | | | (1,941 | ) | | | (449 | ) | | | | | | | | | | | | | | | | | | | | | | | | | | | | | | | | | NET INTEREST INCOME | | $ | 2,992 | | | $ | (1,842 | ) | | $ | 1,150 | | | $ | 1,789 | | | $ | (1,003 | ) | | $ | 786 | | | | | | | | | | | | | | | | | | | | | | | | | | |
| | | | | | | | | | | | | | | | | | | | | | | | | | | | | | | | | | | | (Dollars in thousands) | 2012 Compared to 2011 | | 2011 Compared to 2010 | | Increase (Decrease) Due to Change In: | | Increase (Decrease) Due to Change In: | Taxable Equivalent Basis | Volume | | Rate | | Net | | Volume | | Rate | | Net | INTEREST INCOME: | | | | | | | | | | | | | | | | | | Interest Bearing Balances | $ | (251) | | $ | (33) | | $ | (284) | | $ | 94 | | $ | (392) | | $ | (298) | Investment Securities: | | | | | | | | | | | | | | | | | | Taxable | | 380 | | | (858) | | | (478) | | | 1,227 | | | (395) | | | 832 | Tax-Exempt | | 1,132 | | | (538) | | | 594 | | | 575 | | | (239) | | | 336 | Total Investment Securities | | 1,512 | | | (1,396) | | | 116 | | | 1,801 | | | (633) | | | 1,168 | | | | | | | | | | | | | | | | | | | Federal Funds Sold | | (9) | | | - | | | (9) | | | 2 | | | (2) | | | - | Loans and Leases, Net | | 496 | | | (1,321) | | | (825) | | | 186 | | | 450 | | | 636 | Restricted Investment Bank Stocks | | - | | | 5 | | | 5 | | | - | | | - | | | - | Total Interest Income | | 1,748 | | | (2,745) | | | (997) | | | 2,083 | | | (577) | | | 1,506 | | | | | | | | | | | | | | | | | | | INTEREST EXPENSE: | | | | | | | | | | | | | | | | | | Interest Bearing Deposits: | | | | | | | | | | | | | | | | | | NOW | | 173 | | | 141 | | | 314 | | | 13 | | | 62 | | | 75 | Money Market | | (147) | | | (853) | | | (1,000) | | | 1,229 | | | (594) | | | 635 | Savings | | - | | | (1) | | | (1) | | | 1 | | | (2) | | | (1) | Time | | (747) | | | (928) | | | (1,675) | | | (866) | | | (653) | | | (1,519) | Total Interest Bearing Deposits | | (721) | | | (1,642) | | | (2,362) | | | 376 | | | (1,186) | | | (810) | | | | | | | | | | | | | | | | | | | Short-term Borrowings | | 1 | | | (2) | | | (1) | | | (14) | | | - | | | (14) | Long-term Debt | | (34) | | | - | | | (34) | | | (247) | | | (49) | | | (296) | Total Interest Expense | | (754) | | | (1,644) | | | (2,397) | | | 115 | | | (1,235) | | | (1,120) | | | | | | | | | | | | | | | | | | | NET INTEREST INCOME | $ | 2,502 | | $ | (1,102) | | $ | 1,400 | | $ | 1,968 | | $ | 658 | | $ | 2,626 |
The effect of changing volume and rate has been allocated entirely to the rate column. Tax-exempt income is shown on a tax equivalent basis assuming a federal income tax rate of 34%. During 2009,2012, net interest income increased $1,150,000$1,400,000, or 6.4%6.1%, as compared to an increase of $786,000$2,626,000, or 4.6%12.8%, in 2008.2011. The average balances, effective interest differential, and interest yields for the years ended December 31, 2009, 2008,2012, 2011, and 20072010 and the components of net interest income, are presented in Table 1. A comparative presentation of the changes in net interest income for 20092012 compared to 2008,2011, and 20082011 compared to 2007,2010, is provided in Table 2. This analysis indicates the changes in interest income and interest expense caused by the volume and rate components of interest earning assets and interest bearing liabilities. The yield on earning assets decreased to 5.82%4.69% in 20092012 from 6.42%4.97% in 2008.2011. The yield on earning assets for 20072010 was 6.98%5.28%. The change in the yield on earning assets was due primarily to changes in market interest rates and extreme rate competition within our market. The average “prime rate” for 20092012, 2011, and 2010 was 3.25% as compared to 5.21% for 2008 and 8.08% for 2007.. The yield on earning assets is also negatively impacted by the loss of interest on nonperforming loans. During 2009,2012, this loss of interest amounted to $608,000.$2,974,000. Had this interest been included in Mid Penn’s earnings, the yield on earning assets would have increased 0.11%.by 44 basis points. Interest expense decreased by $1,586,000,$2,397,000, or 10.7%25.2%, in 20092012 as compared to a decrease of $449,000,$1,120,000, or 2.9%10.5%, in 2008.2011. The cost of interest bearing liabilities decreased to 2.81%1.20% in 20092012 from 3.35%1.68% in 2008.2011. The cost of interest bearing liabilities for 20072010 was 3.76%2.08%. The reduction in cost of interest bearing liabilities was due to changes in market interest rates and Mid Penn’s ability to reduce the rates on Money Market accounts and Certificates of Deposit. The reduction in market interest rates also had a positive impact on Mid Penn’s cost for short-term borrowings. Net interest margin, on a tax equivalent basis influenced by the increasewas 3.63% in nonaccrual loans in 2009, was 3.42%2012 compared to 3.50%3.52% in 20082011 and 3.68%3.47% in 2007.2010. The interest rate impact of earning assets and funding sources due to changes in interest rates can be reasonably estimated at current interest rate levels, the options selected by customers, and the future mix of the loan, investment, and deposit products in the Bank’sBank's portfolios, may significantly change the estimates used in the simulation models. In addition, our net interest income may be impacted by further interest rate actions of the Federal Reserve Bank. Management continues to monitor the net interest margin closely. 19
| | | MID PENN BANCORP, INC. | | Management’s Discussion and Analysis |
MID PENN BANCORP, INC.Management’s Discussion and Analysis Provision for Loan and Lease Losses The provision for loan and lease losses is the expense necessary to maintain the allowance for loan and lease losses at a level adequate to absorb management’s estimate of probable losses in the loan and lease portfolio. Mid Penn’s provision for loan and lease losses is based upon management’s monthly review of the loan portfolio. The purpose of the review is to assess loan quality, identify impaired loans and leases, analyze delinquencies, ascertain loan and lease growth, evaluate potential charge-offs and recoveries, and assess general economic conditions in the markets we serve. During 2009,2012, Mid Penn continued to experience a challenging economic and operating environment. Given the economic pressures that impact some borrowers, and borrowing segments, the CorporationMid Penn has increasedmaintained the allowance for loan and lease losses in accordance with Mid Penn’s assessment process, which took into consideration the decrease inrisk characteristics of the loan and lease portfolio and shifting collateral values from December 31, 20082011 to December 31, 2009.2012. For the year ended December 31, 2012, the provision for loan and lease losses was $1,036,000, as compared to $1,205,000 for the year ended December 31, 2011. For the year ended December 31, 2012, Mid Penn had net charge-offs of $2,299,000 compared to net charge-offs of $1,494,000 during the year ended December 31, 2011. Loans charged off during 2012 were comprised of fifteen commercial real estate loans totaling $499,000. Eight of these loans totaling $218,000 were to three borrowers with the remaining loans to unrelated borrowers. In addition, there were charge-offs for ten commercial and industrial loans to unrelated borrowers totaling $834,000, six residential real estate loans to unrelated borrowers totaling $195,000, and four home equity loans to unrelated borrowers representing $268,000 of the total charged off during 2012. The remaining $592,000 was comprised of various consumer loans to unrelated borrowers with the majority belonging to one loan for $578,000. Mid Penn may need to make future adjustments to the allowance and the provision for loan and lease losses if economic conditions or loan credit quality differs substantially from the assumptions used in making Mid Penn’s evaluation of the level of the allowance for loan losses as compared to the balance of outstanding loans. Following its model for loan and lease loss allowance adequacy, management recorded a $9,520,000$1,036,000 provision in 2009,2012, as well as a provision of $1,230,000$1,205,000 in 2008,2011, and $925,000$2,635,000 in 2007.2010. The allowance for loan and lease losses as a percentage of total loans was 1.60%1.14% at December 31, 2009,2012, compared to 1.27%1.40% at December 31, 20082011 and 2007, which has been higher than that1.51% at December 31, 2010. Several factors contributed to this reduction. First, the growth in the loan portfolio was very modest. This modest growth did not have a material impact on the amount of peer financial institutions duerequired reserves within the allowance for loan and lease losses from qualitative or quantitative factors. Secondly, while total risk elements within the loan portfolio remained virtually unchanged from 2011 to Mid Penn’s higher level2012, their composition within the allowance computation model changed significantly. Loans internally classified as special mention fell from $11,029,000 at December 31, 2011 to $7,916,000 at December 31, 2012, or a reduction of $3,113,000. Loans internally classified as substandard but not impaired increased $943,000 from $9,783,000 at December 31, 2011 to $10,726,000 at December 31, 2012. Additionally during 2012, the historic loss experience within these segments of the portfolio migrated downward as high levels of activity during 2009 rolled out of the calculation and were replaced by more current experience. The combination of the shifting balances and migrating loss experience resulted in a reduction of $745,000 in required balances in the allowance for loan and lease losses. Finally, total impaired loans fell from $10,926,000 at December 31, 2011 to finance commercial real estate. $9,744,000 at December 31, 2012, a reduction of $1,182,000. Specific reserves required on these impaired loans fell from $1,846,000 at December 31, 2011 to $1,383,000 at December 31, 2012, a reduction of $463,000.
MID PENN BANCORP, INC.Management’s Discussion and Analysis A summary of charge-offs and recoveries of loans and leases are presented in Table 3. TABLE 3: ANALYSIS OF THE ALLOWANCE FOR LOAN AND LEASE LOSSES | | | | | | | | | | | | | | | | | (Dollars in thousands) | | Years ended December 31, | | | | 2009 | | 2008 | | 2007 | | 2006 | | 2005 | Balance, beginning of year | | $ | 5,505 | | $ | 4,790 | | $ | 4,187 | | $ | 3,704 | | $ | 3,643 | Loans and leases charged off: | | | | | | | | | | | | | | | | Commercial real estate, construction and land development | | | 2,841 | | | 384 | | | — | | | 17 | | | 32 | Commercial, industrial and agricultural | | | 4,158 | | | 70 | | | 100 | | | 158 | | | 29 | Real estate - residential | | | 115 | | | — | | | — | | | — | | | — | Consumer | | | 209 | | | 188 | | | 231 | | | 134 | | | 138 | Leases | | | 108 | | | 5 | | | 129 | | | — | | | — | | | | | | | | | | | | | | | | | Total loans and leases charged off | | | 7,431 | | | 647 | | | 460 | | | 309 | | | 199 | | | | | | | | | | | | | | | | | | | | | | | Recoveries on loans and leases previously charged off: | | | | | | | | | | | | | | | | Commercial real estate, construction and land development | | | — | | | 1 | | | — | | | — | | | — | Commercial, industrial and agricultural | | | 16 | | | 20 | | | 5 | | | 3 | | | 12 | Consumer | | | 76 | | | 111 | | | 49 | | | 54 | | | 23 | Leases | | | — | | | — | | | 84 | | | — | | | — | | | | | | | | | | | | | | | | | Total loans and leases recovered | | | 92 | | | 132 | | | 138 | | | 57 | | | 35 | | | | | | | | | | | | | | | | | | | | | | | Net charge-offs | | | 7,339 | | | 515 | | | 322 | | | 252 | | | 164 | | | | | | | | | | | | | | | | | Provision for loan and lease losses | | | 9,520 | | | 1,230 | | | 925 | | | 735 | | | 225 | | | | | | | | | | | | | | | | | Balance, end of year | | $ | 7,686 | | $ | 5,505 | | $ | 4,790 | | $ | 4,187 | | $ | 3,704 | | | | | | | | | | | | | | | | |
| | | | | | | | | | | | | | | | | | | | | | | | | | | | | | (Dollars in thousands) | Years ended December 31, | | 2012 | | 2011 | | 2010 | | 2009 | | 2008 | Balance, beginning of year | $ | 6,772 | | $ | 7,061 | | $ | 7,686 | | $ | 5,505 | | $ | 4,790 | Loans and leases charged off: | | | | | | | | | | | | | | | Commercial real estate, construction | | | | | | | | | | | | | | | and land development | | 499 | | | 545 | | | 1,413 | | | 2,841 | | | 384 | Commercial, industrial and agricultural | | 834 | | | 546 | | | 787 | | | 4,158 | | | 70 | Real estate - residential | | 195 | | | 310 | | | 858 | | | 115 | | | - | Consumer | | 860 | | | 142 | | | 146 | | | 209 | | | 188 | Leases | | - | | | 44 | | | 230 | | | 108 | | | 5 | Total loans and leases charged off | | 2,388 | | | 1,587 | | | 3,434 | | | 7,431 | | | 647 | | | | | | | | | | | | | | | | Recoveries on loans and leases previously | | | | | | | | | | | | | | | charged off: | | | | | | | | | | | | | | | Commercial real estate, construction | | | | | | | | | | | | | | | and land development | | 15 | | | 26 | | | 21 | | | - | | | 1 | Commercial, industrial and agricultural | | 31 | | | 10 | | | 3 | | | 16 | | | 20 | Real estate - residential | | - | | | 19 | | | 70 | | | - | | | - | Consumer | | 43 | | | 32 | | | 80 | | | 76 | | | 111 | Leases | | - | | | 6 | | | - | | | - | | | - | Total loans and leases recovered | | 89 | | | 93 | | | 174 | | | 92 | | | 132 | | | | | | | | | | | | | | | | Net charge-offs | | 2,299 | | | 1,494 | | | 3,260 | | | 7,339 | | | 515 | Provision for loan and lease losses | | 1,036 | | | 1,205 | | | 2,635 | | | 9,520 | | | 1,230 | Balance, end of year | $ | 5,509 | | $ | 6,772 | | $ | 7,061 | | $ | 7,686 | | $ | 5,505 |
20
| | | MID PENN BANCORP, INC. | | Management’s Discussion and Analysis |
| | | | | | | | | | | | | | | | | | | Years ended December 31, | | | | | 2009 | | | 2008 | | | 2007 | | | 2006 | | | 2005 | | Ratio of net charge-offs during the year to average loans and leases outstanding during the year, net of unearned discount | | 1.58 | % | | 0.13 | % | | 0.09 | % | | 0.08 | % | | 0.06 | % | | | | | | | | | | | | | | | | | | | | | | | Allowance for loan and lease losses as a percentage of total loans and leases at December 31 | | 1.60 | % | | 1.27 | % | | 1.27 | % | | 1.17 | % | | 1.18 | % | | | | | | | | | | | | | | | | | | | | | | | Allowance for loan and lease losses as a percentage of non-performing assets at December 31 | | 48.33 | % | | 96.92 | % | | 97.68 | % | | 290.97 | % | | 166.02 | % | | | | | | | | | | | | | | | | |
| | | | | | | | | | | | | | | | | | | | | Years ended December 31, | | 2012 | | 2011 | | 2010 | | 2009 | | 2008 | Ratio of net charge-offs during the year | | | | | | | | | | to average loans and leases outstanding during | | | | | | | | | | the year, net of unearned discount | 0.48% | | 0.31% | | 0.69% | | 1.58% | | 0.13% | | | | | | | | | | | Allowance for loan and lease losses as a percentage | | | | | | | | | | of total loans and leases at December 31 | 1.14% | | 1.40% | | 1.51% | | 1.60% | | 1.27% | | | | | | | | | | | Allowance for loan and lease losses as a percentage | | | | | | | | | | of non-performing assets at December 31 | 42.05% | | 50.91% | | 35.05% | | 48.33% | | 96.92% |
Noninterest Income A summary
2012 versus 2011 Income from fiduciary activities for 2012 was $575,000, a $36,000, or 6.7%, increase from $539,000 in 2011. This revenue source is comprised of fees generated by Mid Penn’s Trust department and fees from the major componentssale of noninterest income forthird-party mutual funds and annuities to the years ended December 31, 2009, 2008,Bank’s retail and 2007 is foundcommercial customers. Fees from third-party mutual fund and annuity sales were $389,000 in Table 4. During 2009, Mid Penn earned $3,656,0002012 and $354,000 in noninterest income, compared to $3,682,000 earned in 2008 and $3,481,000 earned in 2007.2011. Service charges on deposit accounts amounted to $1,479,000$565,000 for 2009,2012, a decrease of $175,000$139,000, or 10.6%19.7%, compared to $1,654,000$704,000 for 2008, which was an increase of $155,000 or 10.3% above 2007.2011. The decrease in service charges in 20092012 occurred in spite of general growth in transaction accounts during 2009. This is attributable2012. During this period of economic downturn, customers seem to have become more prudentconscientious about their account managementbalances and avoiding unnecessary charges related to insufficient funds. In addition to this behavioral change, Mid Penn was negatively impacted by customersregulatory changes contained in the face ofDodd-Frank Act governing overdraft charges, which has resulted in a challenging economic environment.reduction in NSF revenue.
MID PENN BANCORP, INC.Management’s Discussion and Analysis Mid Penn ownsrecognized gains on sale of investment securities in 2012 of $267,000 as a result of efforts to position the portfolio to provide improved earnings and cash surrender valueflow in support of life insurance policies on its directors. Thefuture loan growth. Mortgage banking income on these policies amounted to $280,000remained robust during the year 2009, $267,000ended December 31, 2012. Historically low long-term mortgage rates triggered a wave of refinancing and increasing purchase activity, generating robust fee income from this line of business. Mortgage banking income for 2012 was $675,000, an increase of $285,000, or 73.1%, over $390,000 in 2008,2011. Merchant services revenue increased to $256,000 in 2012, an increase of $91,000, or 55.2%, compared to $165,000 for 2011. During 2012, Mid Penn successfully renegotiated the revenue sharing contract with its vendor, significantly augmenting the revenue stream. Sales efforts in this area were also very positive in 2012, adding to the enhanced revenue. 2011 versus 2010 Service charges on deposit accounts amounted to $704,000 for 2011, a decrease of $435,000 or 38.2% compared to $1,139,000 for 2010. The decrease in service charges in 2011 occurred in spite of general growth in transaction accounts during 2011. During this period of economic downturn, customers seem to have become more conscientious about their account balances and $271,000 in 2007.avoiding unnecessary charges related to insufficient funds. In addition to the income on these life insurance policies,this behavioral change, Mid Penn recognizedwas negatively impacted by regulatory changes contained in the Dodd-Frank Act governing overdraft charges, which has resulted in a gain on life insurance proceedsreduction in 2009NSF revenue. Income from fiduciary activities for 2011 was $539,000, a $108,000 or 25.1% increase from $431,000 in 2010. This revenue source is comprised of $158,000fees generated by Mid Penn’s Trust department and fees from the deathsale of a retired director in February 2009. third-party mutual funds and annuities to the Bank’s retail and commercial customers. Trust department income for 20092011 was $243,000,$185,000, a $70,000$15,000 or 22.4%7.5% decrease from $313,000$200,000 in 2008, which was a $6,000 or 1.9% decrease from $319,000 in 2007.2010. Trust Department income can fluctuate from year to year, due to the number of estates settled during the year. Fees from third-party mutual fund and annuity sales were $354,000 in 2011and $231,000 in 2010. Significant revenue originated from our portfolio of ATM and debit cards. This is in the form of interchange fees generated by cardholder transactions. During 2009, Mid Penn increased the number of outstanding ATM and debit cardholders by over 36%. In spite of this increase in cardholders, the challenging economic environment, our customers reduced their transaction volumes
Mortgage banking income remained robust during the year reducing these earnings to $341,000,ended December 31, 2011. Historically low long-term mortgage rates triggered a $34,000 or 9.1% decreasewave of refinancing activity, generating robust fee income from $375,000 in 2008, which was a $44,000 increase from 2007. this line of business. During 2011, Mid Penn also earned $173,000decided to add approximately $1,960,000 in 2009, $175,000secondary market qualified loans to the loan portfolio. This resulted in 2008, and $155,000a slight decline in 2007mortgage banking income to $390,000 in fees2011 from the third-party seller of investments whose services the Bank has contracted.$423,000 in 2010. Other income amounted to $730,000 in 2009, $722,000 in 2008, and $741,000 in 2007.
TABLE 4: NONINTEREST INCOME | | | | | | | | | | | (Dollars in thousands) | | Years ended December 31, | | | | 2009 | | 2008 | | 2007 | Trust department income | | $ | 243 | | $ | 313 | | $ | 319 | Service charges on deposits | | | 1,479 | | | 1,654 | | | 1,499 | Investment securities gains, net | | | — | | | 9 | | | — | Earnings from cash surrender value of life insurance | | | 280 | | | 267 | | | 271 | Gain on life insurance proceeds | | | 158 | | | — | | | — | Mortgage banking income | | | 124 | | | 78 | | | 77 | Merchant services revenue | | | 128 | | | 89 | | | 88 | ATM debit card interchange income | | | 341 | | | 375 | | | 331 | Retail investment revenue | | | 173 | | | 175 | | | 155 | Other income | | | 730 | | | 722 | | | 741 | | | | | | | | | | | Total Noninterest Income | | $ | 3,656 | | $ | 3,682 | | $ | 3,481 | | | | | | | | | | |
| | | | | | | | | | | | | | | | | | (Dollars in thousands) | Years ended December 31, | | 2012 | | 2011 | | 2010 | Income from fiduciary activities | $ | 575 | | $ | 539 | | $ | 431 | Service charges on deposits | | 565 | | | 704 | | | 1,139 | Net gain on sales of investment securities | | 267 | | | - | | | - | Earnings from cash surrender value of life insurance | | 247 | | | 258 | | | 270 | Mortgage banking income | | 675 | | | 390 | | | 423 | Merchant services revenue | | 256 | | | 165 | | | 141 | ATM debit card interchange income | | 472 | | | 452 | | | 408 | Other income | | 626 | | | 488 | | | 602 | Total Noninterest Income | $ | 3,683 | | $ | 2,996 | | $ | 3,414 |
21Noninterest Expense
| | | MID PENN BANCORP, INC. | | Management’s Discussion and Analysis |
Noninterest Expense2012 versus 2011
A summary of the major components of noninterest expense for the years ended December 31, 2009, 2008, and 2007 is reflected in Table 5. Noninterest expense increased to $16,671,000 in 2009 from $14,726,000 in 2008 and $12,596,000 in 2007.
The major component of noninterest expense is salaries and employee benefits. The number of full-time equivalent employees increased from 152 to 170 during 2009. Increases in the 20092012 workforce primarily included additionsadding experienced team members to loanadd depth to the sales and support areas and bolster compliance functions within the Corporation, in order to provide enhanced controls over the credit process and to support future growth.of Mid Penn. Mid Penn also recognized in 20092012 a full year of salary and employee benefits expense from the 20082011 additions within the support functions throughout the Corporation to enhance controls and support future growth. Severance expenses related During 2012, medical benefits increased $184,000 from 2011 levels, primarily due to the departureincrease in actual medical claims experienced from Mid Penn’s self-funded medical insurance plan. In addition, commission-based compensation paid to mortgage originators and retail investment representatives increased $144,000 from 2011 levels and are reflective of the former CEOenhanced revenues generated from these lines of business.
Legal and professional fees increased from $444,000 in October2011 to $604,000 in 2012. Mid Penn incurred elevated legal fees in 2012 stemming from coordination with the U.S. Treasury on the repayment of 2008 were $478,000. This reflectsMid Penn’s Capital Purchase Program funds and the contractual paymentsbuyout of the related warrants. In addition, Mid Penn engaged a computer consultant to perform an evaluation of the core computer system and its ancillary programs as a resource in making future enhancement decisions.
MID PENN BANCORP, INC.Management’s Discussion and Analysis Loss on sale or write-down on foreclosed assets increased to $96,000 in 2012. During 2012, this item increased as a result of Mid Penn’s ongoing analysis of the carrying values of repossessed properties and the adjustment of their values to current market rates. Loan collection costs increased to $369,000 in 2012 from $299,000 in 2011. OREO expense increased to $253,000 in 2012 from $161,000 in 2011. These items have risen as Mid Penn continues to work through collection efforts on the pool of nonperforming assets within the loan portfolio. ATM debit card processing and internet banking expenses have both increased in recent years due underto increasing customer demand for these banking services. During 2012, Mid Penn reached the termsend of his employmenta three year contract for its insurance coverage and experienced an increase in premium costs upon renewal of its policies. Also during 2012, Mid Penn made increasing use of temporary employees to finalize the conversion of loan and credit documents from paper storage to an electronic storage mechanism, significantly reducing the need for floor space and fire protection safeguards for these documents. 2011 versus 2010 The major component of noninterest expense is salaries and employee benefits. Increases in the 2011 workforce primarily included additions to compliance and operations support functions within Mid Penn, in order to provide enhanced controls and procedures to support a more sophisticated product line and customer base. The escalating compliance and regulatory burden experienced by banks throughout the industry necessitated the hiring of dedicated compliance staff as well as dedicating resources from support areas throughout Mid Penn to complying with the expanding regulatory changes. Mid Penn.Penn also recognized in 2011 a full year of salary and employee benefits expense from the 2010 additions within the support functions throughout the Corporation to enhance controls and support future growth. During 2011, medical benefits increased $126,000 from 2010 levels. In addition, commission-based compensation paid to mortgage originators and retail investment representatives increased $107,000 from 2010 levels. Occupancy and equipment expenses also increased in 2011 primarily in connection with utility and snow removal costs from the harsh winter months early in the year. FDIC insurance expense took a dramatic leap from $116,000increased in 20082011, closing the year at $1,057,000 as compared to $1,163,000$897,000 during 2009. This increase stemmed2010. The historically high levels of FDIC insurance expense during 2009, 2010, and 2011 stem from the escalation in Deposit Insurance premiums assessed by the FDIC on all its member banks to restore the Deposit Insurance Fund and keep it solvent to handle future bank failures should they occur. IncludedMid Penn’s premium level was also negatively impacted by the increase in this expense line is the special assessment of $265,000, levied on all FDIC member banks in June of 2009 to aidassets used in the restorationcalculation of theDeposit Insurance Fund.premiums. Occupancy and equipment expenses also increased in 2009 primarily in connection with the renovation and relocation of staff to a newly acquired and refurbished Operations Center in Halifax, PA. This facility was designed to meet our operation’s needs well into the future.
Legal and professional expenses increased in 2009 to $814,000 from $769,000 in 2008. Mid Penn incurred increased legal fees associated with its loan workout efforts. The increase was also driven by ongoing projects within the technology area to implement enhanced efficiencies within the support areas and enhance Mid Penn’s ability to offer new products and services in the upcoming year.
Marketing and advertising expense increased from $525,000 in 2008 to $679,000 in 2009, which is attributed to the promotion surrounding Mid Penn’s sponsorship of the annual 4th of July fireworks celebration in Millersburg in 2009 as well as continuing promotion of loan and deposit products to enhance market share.
Computer expense increased from $319,000$578,000 in 20082010 to $435,000$697,000 in 2009.2011. Mid Penn has been making significant enhancements to technology platforms to enhance efficiencies within the support departments and enable updated products and services to customers. These charges reflect the ongoing service contracts for these enhancements. Telephone
Internet banking expense increased to $195,000 in 20092011 from $138,000 in 2010. A major focus throughout 2010 was the implementation of an enhanced website and internet banking platform. The cost of providing enhanced functionality is reflected in this line item and is part of Mid Penn’s efforts to $302,000 from $193,000 in 2008. Mid Penn incurred increased telephone expenses associated with the openingprovide a robust suite of the new Operations Center in April of 2009 as well as ongoing upgradestechnology-related products and services to the infrastructure between office locations to enhance customer service capabilities.marketplace. The final significant item was the (gain) loss on sale or write-down on foreclosed assets of $110,000($20,000) in 20092011 and $281,000$283,000 in 2008. This2010. During 2010, this item resulted fromincreased as a result of Mid Penn’s ongoing analysis of the carrying values of our repossessed properties and the adjustment of their values to current market rates in the face of the overall decline in real estate values plaguing the economy.real estate market. In 2011, the carrying values on repossessed properties have stabilized and some small gains have been realized from the ongoing liquidation of these properties.
| | | MID PENN BANCORP, INC. | | Management’s Discussion and Analysis |
MID PENN BANCORP, INC.Management’s Discussion and Analysis TABLE 5: NONINTEREST EXPENSE | | | | | | | | | | | (Dollars in thousands) | | Years ended December 31, | | | 2009 | | 2008 | | 2007 | Salaries and employee benefits | | $ | 8,173 | | $ | 7,197 | | $ | 6,554 | Severance expense | | | — | | | 478 | | | — | Occupancy expense, net | | | 844 | | | 967 | | | 868 | Equipment expense | | | 1,170 | | | 870 | | | 828 | Pennsylvania Bank Shares tax expense | | | 366 | | | 315 | | | 329 | Legal and Professional fees | | | 814 | | | 769 | | | 562 | Marketing and advertising expense | | | 679 | | | 525 | | | 403 | ATM debit card processing expense | | | 126 | | | 169 | | | 140 | Director fees and benefits expense | | | 293 | | | 354 | | | 322 | Computer expense | | | 435 | | | 319 | | | 350 | Telephone expense | | | 302 | | | 193 | | | 115 | Stationery and supplies expense | | | 151 | | | 242 | | | 263 | Postage expense | | | 156 | | | 162 | | | 152 | Meals, travel, and lodging expense | | | 200 | | | 146 | | | 109 | Contributions expense | | | 77 | | | 134 | | | 97 | Internet banking expense | | | 88 | | | 112 | | | 88 | Courier expense | | | 96 | | | 112 | | | 107 | Core deposit intangible expense | | | 65 | | | 66 | | | 131 | Correspondent service charge expense | | | 95 | | | 90 | | | 88 | FDIC Assessment | | | 1,163 | | | 116 | | | 43 | Loss / write-down on sale of foreclosed assets | | | 110 | | | 281 | | | — | Other expenses | | | 1,268 | | | 1,109 | | | 1,047 | | | | | | | | | | | Total Noninterest Expense | | $ | 16,671 | | $ | 14,726 | | $ | 12,596 | | | | | | | | | | |
| | | | | | | | | | | | | | | | | | (Dollars in thousands) | Years ended December 31, | | 2012 | | 2011 | | 2010 | Salaries and employee benefits | $ | 10,518 | | $ | 9,519 | | $ | 8,760 | Occupancy expense, net | | 1,077 | | | 1,075 | | | 916 | Equipment expense | | 1,234 | | | 1,292 | | | 1,361 | Pennsylvania Bank Shares tax expense | | 462 | | | 449 | | | 443 | FDIC Assessment | | 1,034 | | | 1,057 | | | 897 | Legal and Professional fees | | 604 | | | 444 | | | 529 | Director fees and benefits expense | | 335 | | | 304 | | | 303 | Marketing and advertising expense | | 378 | | | 354 | | | 308 | Computer expense | | 648 | | | 697 | | | 578 | Telephone expense | | 411 | | | 377 | | | 362 | Loss (gain) / write-down on sale of foreclosed assets | | 96 | | | (20) | | | 283 | Intangible amortization | | 45 | | | 65 | | | 65 | Loan collection costs | | 369 | | | 299 | | | 307 | ATM debit card processing expense | | 171 | | | 152 | | | 122 | Internet banking expense | | 240 | | | 195 | | | 138 | Meals, travel, and lodging expense | | 266 | | | 228 | | | 211 | Insurance | | 126 | | | 86 | | | 81 | OREO expense | | 253 | | | 161 | | | 110 | Investor services | | 76 | | | 72 | | | 47 | Contract labor | | 42 | | | - | | | 28 | Other expenses | | 1,308 | | | 1,242 | | | 1,272 | Total Noninterest Expense | $ | 19,693 | | $ | 18,048 | | $ | 17,121 |
Investments Mid Penn’s investment portfolio is utilized to provide liquidity and managed to maximize return within reasonable risk parameters. Mid Penn’s entire portfolio of investment securities is considered available for sale. As such, the investments are recorded at fair value. Our investments are valued at a market price relative to investments of the same type with similar maturity dates. As the interest rate environment of these securities changes, the value of securities changes accordingly. As of December 31, 2009,2012, the unrealized gain on investment securities resulted in an increase in shareholders’ equity of $817,000$2,432,000 (unrealized gain on securities of $1,238,000$3,685,000 less estimated income tax expense of $421,000)$1,253,000). At December 31, 2008,2011, the unrealized gain on investment securities resulted in an increase in shareholders’ equity of $553,000$2,044,000 (unrealized gain on securities of $837,000$3,096,000 less estimated income tax expense of $284,000)$1,052,000) compared to a December 31, 2007an increase in the unrealized gain included in other comprehensive incomeshareholders’ equity of $434,000$176,000 (unrealized gain on securities of $657,000,$266,000 less estimated income tax expense of $223,000).$90,000) at December 31, 2010. Mid Penn does not have any significant concentrations within its portfolio of investment securities. Table 6 provides a summary of our available for sale investment securities. TABLE 6: FAIR VALUE OF INVESTMENT SECURITIES | | | | | | | | | | | (Dollars in thousands) | | December 31, | | | | 2009 | | 2008 | | 2007 | U.S. Treasury and U.S. government agencies | | $ | 15,700 | | $ | 23,086 | | $ | 12,063 | Mortgage-backed U.S. government agencies | | | 4,619 | | | 4,173 | | | 6,858 | State and political subdivision obligations | | | 26,781 | | | 25,244 | | | 31,088 | Equity securities | | | 245 | | | 236 | | | 241 | | | | | | | | | | | | | $ | 47,345 | | $ | 52,739 | | $ | 50,250 | | | | | | | | | | |
| | | | | | | | | | | | | | | | | | (Dollars in thousands) | December 31, | | 2012 | | 2011 | | 2010 | U.S. Treasury and U.S. government agencies | $ | 17,740 | | $ | 27,617 | | $ | 17,394 | Mortgage-backed U.S. government agencies | | 66,686 | | | 82,668 | | | 25,387 | State and political subdivision obligations | | 69,479 | | | 48,366 | | | 27,678 | Equity securities | | 390 | | | 392 | | | 243 | | $ | 154,295 | | $ | 159,043 | | $ | 70,702 |
23
| | | MID PENN BANCORP, INC. | | Management’s Discussion and Analysis |
MID PENN BANCORP, INC.Management’s Discussion and Analysis Maturity and yield information relating to the investment portfolio is shown in Table 7. TABLE 7: INVESTMENT MATURITY AND YIELD | | | | | | | | | | | | | | | | | | | | | (Dollars in thousands) As of December 31, 2009 | | One Year
and Less | | | After One
Year thru
Five Years | | | After Five
Years thru
Ten Years | | | After Ten
Years | | | Total | | U.S. Treasury and U.S. government agencies | | $ | 502 | | | $ | 8,760 | | | $ | 6,438 | | | $ | — | | | $ | 15,700 | | Mortgage-backed U.S. government agencies | | | — | | | | 13 | | | | 19 | | | | 4,587 | | | | 4,619 | | State and political subdivision obligations | | | 524 | | | | 3,361 | | | | 11,979 | | | | 10,917 | | | | 26,781 | | Equity securities | | | — | | | | — | | | | — | | | | 245 | | | | 245 | | | | | | | | | | | | | | | | | | | | | | | | | $ | 1,026 | | | $ | 12,134 | | | $ | 18,436 | | | $ | 15,749 | | | $ | 47,345 | | | | | | | | | | | | | | | | | | | | | | | | | | | | | | | | One Year
and Less | | | After One
Year thru
Five Years | | | After Five
Years thru
Ten Years | | | After Ten
Years | | | Total | | Weighted Average Yields | | | | | | | | | | | | | | | | | | | | | U.S. Treasury and U.S. government agencies | | | 0.40 | % | | | 2.10 | % | | | 4.30 | % | | | — | | | | 2.95 | % | Mortgage-backed U.S. government agencies | | | — | | | | 6.15 | % | | | 3.07 | % | | | 4.80 | % | | | 4.80 | % | State and political subdivision obligations (FTE) | | | 6.81 | % | | | 7.12 | % | | | 6.33 | % | | | 6.21 | % | | | 6.39 | % | Equity securities | | | — | | | | — | | | | — | | | | 5.00 | % | | | 5.00 | % | | | | | | | | | | | | | | | | | | | | | | | | | 3.67 | % | | | 3.49 | % | | | 5.62 | % | | | 5.78 | % | | | 5.09 | % | | | | | | | | | | | | | | | | | | | | | |
| | | | | | | | | | | | | | | | | | | | | | | | | | | | | | (Dollars in thousands) | | | | After One | | After Five | | | | | | | As of December 31, 2012 | One Year | | Year thru | | Years thru | | After Ten | | | | | and Less | | Five Years | | Ten Years | | Years | | Total | U.S. Treasury and U.S. government agencies | $ | - | | $ | 17,740 | | $ | - | | $ | - | | $ | 17,740 | Mortgage-backed U.S. government agencies | | - | | | 895 | | | 11,063 | | | 54,728 | | | 66,686 | State and political subdivision obligations | | 326 | | | 5,609 | | | 27,282 | | | 36,262 | | | 69,479 | Equity securities | | - | | | - | | | - | | | 390 | | | 390 | | $ | 326 | | $ | 24,244 | | $ | 38,345 | | $ | 91,380 | | $ | 154,295 |
| | | | | | | | | | | | | | | | | | | | | | | After One | | After Five | | | | | | One Year | | Year thru | | Years thru | | After Ten | | | | and Less | | Five Years | | Ten Years | | Years | | Total | Weighted Average Yields | | | | | | | | | | U.S. Treasury and U.S. government agencies | - | | 1.73% | | - | | - | | 1.73% | Mortgage-backed U.S. government agencies | - | | 4.25% | | 3.82% | | 4.14% | | 4.09% | State and political subdivision obligations | 4.79% | | 6.38% | | 4.45% | | 3.83% | | 4.28% | Equity securities | - | | - | | - | | 4.10% | | 4.10% | | 4.79% | | 2.90% | | 4.27% | | 4.02% | | 3.91% |
Loans Loans
At December 31, 2009,2012, loans and leases totaled $480,385,000;$484,220,000, a $45,742,000$1,503,000 or 10.5%0.3% increase from December 31, 2008.2011. During 2009,2012, Mid Penn experienced a net increase in commercial real estate and commercial/industrial loans of approximately $33,526,000.$6,599,000. This increase was the result of an increase in business lending opportunities to credit-worthy borrowers within the markets Mid Penn serves during 2012. Mid Penn experienced a decrease in residential real estate loans of approximately $3,603,000 during 2012 as real estate values stabilized and borrowers felt more comfortable refinancing higher-priced debt. At December 31, 2009,2012, loans, net of unearned income, represented 84.8%72.1% of earning assets as compared to 80.2%71.0% on December 31, 2008,2011 and 77.9%78.3% on December 31, 2007.2010. The Bank’sBank's loan portfolio is diversified among individuals farmers, and small and medium-sized businesses generally located within the Bank’sBank's trading area of Dauphin County, lower Northumberland County, western Schuylkill County and eastern Cumberland County. Commercial real estate, construction and land development loans are collateralized mainly by mortgages on the income-producing real estate or land involved. Commercial, industrial and agricultural loans are made to business entities and may be secured by business assets, including commercial real estate, or may be unsecured. Residential real estate loans are secured by liens on the residential property. Consumer loans include installment loans, lines of credit and home equity loans. The Bank has no concentration of credit to any one borrower. The Bank’s highest concentration of credit is in Commercial Real Estate Hotel/Motel, Commercial Construction and Land Development, and Restaurant financings. 24
| | | MID PENN BANCORP, INC. | | Management’s Discussion and Analysis |
MID PENN BANCORP, INC.Management’s Discussion and Analysis A distribution of the Bank’sBank's loan portfolio according to major loan classification is shown in Table 8. TABLE 8: LOAN PORTFOLIO | | | | | | | | | | | | | | | | | | | | | | | | | | | | | | | | | | | | | | | | | | | | | | | | | | | | | | | | | | | | | | | | (Dollars in thousands) | | December 31, | December 31, | | | | 2009 | | 2008 | | 2007 | | 2006 | | 2005 | 2012 | | 2011 | 2010 | 2009 | | | 2008 | | | | | | Amount | | % | | Amount | | % | | Amount | | % | | Amount | | % | | Amount | | % | Amount | | % | | Amount | | % | | Amount | | % | | Amount | | % | | Amount | | % | Commercial real estate, construction and land development | | $ | 253,878 | | | 52.8 | | $ | 234,762 | | | 53.9 | | $ | 197,192 | | | 52.1 | | $ | 191,420 | | | 53.1 | | $ | 183,543 | | | 58.6 | | Commercial, industrial and agricultural | | | 85,795 | | | 17.8 | | | 71,385 | | | 16.4 | | | 65,421 | | | 17.3 | | | 60,566 | | | 16.8 | | | 39,820 | | | 12.7 | | Commercial real estate, | | | | | | | | | | | | | | | | | | | | | | construction and land | | | | | | | | | | | | | | | | | | | | | | development | | $ | 255,231 | | 52.7 | | $ | 249,204 | | 51.6 | | $ | 252,915 | | 54.0 | | $ | 253,878 | | 52.8 | | $ | 234,762 | | 53.9 | Commercial, industrial | | | | | | | | | | | | | | | | | | | | | | and agricultural | | | 79,228 | | 16.4 | | 78,656 | | 16.3 | | 70,295 | | 15.0 | | 85,795 | | 17.8 | | 71,385 | | 16.4 | Real estate - residential | | | 128,522 | | | 26.7 | | | 118,547 | | | 27.2 | | | 106,141 | | | 28.0 | | | 98,323 | | | 27.3 | | | 80,530 | | | 25.7 | | 143,243 | | 29.6 | | 146,846 | | 30.4 | | 136,048 | | 29.1 | | 128,522 | | 26.7 | | 118,547 | | 27.2 | Consumer | | | 12,884 | | | 2.7 | | | 11,103 | | | 2.5 | | | 9,987 | | | 2.6 | | | 10,027 | | | 2.8 | | | 9,530 | | | 3.0 | | 6,770 | | 1.4 | | | 8,327 | | 1.7 | | | 8,922 | | 1.9 | | | 12,884 | | 2.7 | | | 11,103 | | 2.5 | | | | | | | | | | | | | | | | | | | | | | | | | | | | Total Loans | | | 481,079 | | | 100.0 | | | 435,797 | | | 100.0 | | | 378,741 | | | 100.0 | | | 360,336 | | | 100.0 | | | 313,423 | | | 100.0 | | 484,472 | | 100.0 | | | 483,033 | | 100.0 | | | 468,180 | | 100.0 | | | 481,079 | | 100.0 | | | 435,797 | | 100.0 | | | | | | | | | | | | | | | | | | | | | | | | | | | | Unearned income | | | (694 | ) | | | | | (1,154 | ) | | | | | (1,613 | ) | | | | | (1,763 | ) | | | | | (1,586 | ) | | | | (252) | | | | | (316) | | | | | (445) | | | | | (694) | | | | | (1,154) | | | | | | | | | | | | | | | | | | | | | | | | | | | | | | Loans net of unearned discount | | | 480,385 | | | | | | 434,643 | | | | | | 377,128 | | | | | | 358,573 | | | | | | 311,837 | | | | | Allowance for loan and lease losses | | | (7,686 | ) | | | | | (5,505 | ) | | | | | (4,790 | ) | | | | | (4,187 | ) | | | | | (3,704 | ) | | | | | | | | | | | | | | | | | | | | | | | | | | | | | | | Loans net of unearned | | | | | | | | | | | | | | | | | | | | | | | | | | discount | | | 484,220 | | | | 482,717 | | | | 467,735 | | | | 480,385 | | | | 434,643 | | | Allowance for loan and | | | | | | | | | | | | | | | | | | | | | | lease losses | | | (5,509) | | | | | (6,772) | | | | | (7,061) | | | | | (7,686) | | | | | (5,505) | | | Net loans | | $ | 472,699 | | | | | $ | 429,138 | | | | | $ | 372,338 | | | | | $ | 354,386 | | | | | $ | 308,133 | | | | $ | 478,711 | | | | $ | 475,945 | | | | $ | 460,674 | | | | $ | 472,699 | | | | $ | 429,138 | | | | | | | | | | | | | | | | | | | | | | | | | | | | | |
Mid Penn’s maturity and rate sensitivity information related to the loan portfolio is reflected in Table 9. TABLE 9: LOAN MATURITY AND INTEREST SENSITIVITY | | | | | | | | | | | | | (Dollars in thousands) As of December 31, 2009 | | One Year
and Less | | After One
Year thru
Five Years | | After Five
Years | | Total | Commercial real estate, construction and land development | | $ | 71,105 | | $ | 163,119 | | $ | 19,654 | | $ | 253,878 | Commercial, industrial and agricultural | | | 27,298 | | | 49,589 | | | 8,908 | | | 85,795 | Real estate - residential mortgages | | | 24,971 | | | 80,742 | | | 22,809 | | | 128,522 | Consumer | | | 4,728 | | | 5,588 | | | 1,874 | | | 12,190 | | | | | | | | | | | | | | | | $ | 128,102 | | $ | 299,038 | | $ | 53,245 | | $ | 480,385 | | | | | | | | | | | | | | | | | | | Rate Sensitivity | | | | | | | | | | | | | Predetermined rate | | $ | 27,596 | | $ | 91,359 | | $ | 49,717 | | $ | 168,672 | Floating or adjustable rate | | | 100,506 | | | 207,679 | | | 3,528 | | | 311,713 | | | | | | | | | | | | | | | | $ | 128,102 | | $ | 299,038 | | $ | 53,245 | | $ | 480,385 | | | | | | | | | | | | | |
| | | | | | | | | | | | | | | | | | | | | | | | (Dollars in thousands) | | | | After One | | | | | | | As of December 31, 2012 | One Year | | Year thru | | After Five | | | | | and Less | | Five Years | | Years | | Total | Commercial real estate, construction | | | | | | | | | | | | and land development | $ | 21,236 | | $ | 31,707 | | $ | 202,288 | | $ | 255,231 | Commercial, industrial and | | | | | | | | | | | | agricultural | | 38,878 | | | 20,754 | | | 19,596 | | | 79,228 | Real estate - residential mortgages | | 16,073 | | | 17,683 | | | 109,487 | | | 143,243 | Consumer | | 596 | | | 4,588 | | | 1,334 | | | 6,518 | | $ | 76,783 | | $ | 74,732 | | $ | 332,705 | | $ | 484,220 |
25
| | | MID PENN BANCORP, INC. | | Management’s Discussion and Analysis |
| | | | | | | | | | | | | | | | | | | | | | | | Rate Sensitivity | | | | | | | | | | | | Predetermined rate | $ | 75,137 | | $ | 69,784 | | $ | 141,187 | | $ | 286,108 | Floating or adjustable rate | | 1,646 | | | 4,948 | | | 191,518 | | | 198,112 | | $ | 76,783 | | $ | 74,732 | | $ | 332,705 | | $ | 484,220 |
MID PENN BANCORP, INC.Management’s Discussion and Analysis Credit Quality, Credit Risk, and Allowance for Loan and Lease Losses Other than as described herein, we do not believe there are any trends, events or uncertainties that are reasonably expected to have a material impact on future results of operations, liquidity, or capital resources. Further, based on known information, we believe that the effects of current and past economic conditions and other unfavorable business conditions may influence certain borrowers’ abilities to comply with their repayment terms. Mid Penn continues to monitor closely the financial strength of these borrowers. Mid Penn does not engage in practices which may be used to artificially shield certain borrowers from the negative economic or business cycle effects that may compromise their ability to repay. Mid Penn does not normally structure construction loans with interest reserve components. Mid Penn has not in the past performed any commercial real estate or other type loan workouts whereby an existing loan was restructured into multiple new loans. Also, Mid Penn does not extend loans at maturity solely due to the existence of guarantees, without recognizing the credit as impaired. While the existence of a guarantee may be a mitigating factor in determining the proper level of allowance once impairment has been identified, the guarantee does not affect the impairment analysis. TABLE 10: NONPERFORMING ASSETS | | | | | | | | | | | | | | | | | | | | | | | | | | | | | | (Dollars in thousands) | December 31, | | 2012 | | 2011 | | 2010 | | 2009 | | 2008 | Nonperforming Assets: | | | | | | | | | | | | | | | Nonaccrual loans | $ | 11,831 | | $ | 11,800 | | $ | 17,228 | | $ | 14,933 | | $ | 4,113 | Accruing troubled debt restructured loans | | 426 | | | 571 | | | 2,323 | | | 308 | | | 51 | Total nonperforming loans | | 12,257 | | | 12,371 | | | 19,551 | | | 15,241 | | | 4,164 | | | | | | | | | | | | | | | | Foreclosed real estate | | 843 | | | 931 | | | 596 | | | 663 | | | 1,516 | Total nonperforming assets | | 13,100 | | | 13,302 | | | 20,147 | | | 15,904 | | | 5,680 | | | | | | | | | | | | | | | | Accruing loans 90 days or more past due | | - | | | - | | | 19 | | | 661 | | | 1,860 | Total risk elements | $ | 13,100 | | $ | 13,302 | | $ | 20,166 | | $ | 16,565 | | $ | 7,540 | | | | | | | | | | | | | | | | Nonperforming loans as a % of total | | | | | | | | | | | | | | | loans outstanding | | 2.53% | | | 2.56% | | | 4.18% | | | 3.17% | | | 0.96% | Nonperforming assets as a % of total | | | | | | | | | | | | | | | loans outstanding and other real estate | | 2.71% | | | 2.76% | | | 4.31% | | | 3.31% | | | 1.30% | Ratio of allowance for loan losses | | | | | | | | | | | | | | | to nonperforming loans | | 44.95% | | | 54.74% | | | 36.12% | | | 50.43% | | | 132.20% |
Mid Penn assesses a specific allocation for both commercial loans and commercial real estate loans prior to charging down or charging off the loan. Once the charge down is taken, the remaining balance remains a nonperforming loan with the original terms and interest rate intact and is not treated as a restructured credit. During 2012, nonperforming loans declined $114,000 from $12,371,000 at December 31, 2011. This improvement has been the result of slight improvement in some sectors of the general economy and maintaining a close relationship with troubled borrowers as they navigate their plan toward a resolution of credit issues. Mid Penn’s troubled debt restructured loans at December 31, 2012 totaled $3,394,000, of which, $426,000 are accruing residential mortgages in compliance with the terms of the modification. As a result of the evaluation, a specific allocation and, subsequently, charge offs have been taken as appropriate. Further discussion of troubled debt restructured loans can be found in Note 7 to Mid Penn’s Consolidated Financial Statements, which are incorporated herein by reference. As of December 31, 2012, there were no defaulted troubled debt restructured loans as all troubled debt restructured loans were current with respect to their associated forbearance agreements. Mid Penn entered into forbearance agreements on all loans currently classified as troubled debt restructures and all of these agreements have resulted in additional principal repayment. The allocationterms of these forbearance agreements vary whereby principal payments have been decreased, interest rates have been reduced and/or the loan will be repaid as collateral is sold. As a result of adopting the amendments in ASU No. 2011-02, Mid Penn reassessed all restructurings that occurred on or after January 1, 2011 for identification as troubled debt restructurings. Mid Penn identified no loans for which the allowance for loan losses had previously been measured under a general allowance for credit losses methodology that are now considered troubled debt restructurings in accordance with ASU No. 2011-02.
MID PENN BANCORP, INC.Management’s Discussion and lease losses among the major classifications is shown in Table 10 asAnalysis The following table provides additional analysis of December 31 of each of the past five years. TABLE 10: ALLOCATION OF THE ALLOWANCE FOR LOAN AND LEASE LOSSESpartially charged-off loans:
| | | | | | | | | | | | | | | | | (Dollars in thousands) | | December 31, | | | | 2009 | | 2008 | | 2007 | | 2006 | | 2005 | Commercial real estate, construction and land development | | $ | 3,334 | | $ | 3,326 | | $ | 2,908 | | $ | 2,462 | | $ | 2,037 | Commercial, industrial and agricultural | | | 3,545 | | | 1,860 | | | 1,607 | | | 1,515 | | | 1,481 | Real estate - residential | | | 175 | | | 87 | | | 75 | | | 54 | | | 52 | Consumer | | | 467 | | | 172 | | | 148 | | | 124 | | | 110 | General | | | 165 | | | 60 | | | 52 | | | 32 | | | 24 | | | | | | | | | | | | | | | | | | | $ | 7,686 | | $ | 5,505 | | $ | 4,790 | | $ | 4,187 | | $ | 3,704 | | | | | | | | | | | | | | | | |
The 2009 provision of $9,520,000 is an increase of $8,290,000 over the $1,230,000 provision in 2008. The larger provision is reflective of the deterioration in the overall quality of ourTABLE 11: PARTIALLY CHARGED OFF LOANS
| | | | | | (Dollars in thousands) | | | | | | | December 31, 2012 | | December 31, 2011 | Period ending total loans outstanding (net of unearned income) | $ | 484,220 | | $ | 482,717 | Allowance for loan and lease losses | | 5,509 | | | 6,772 | Total Nonperforming loans | | 12,257 | | | 12,371 | Nonperforming and impaired loans with partial charge-offs | | 3,744 | | | 4,505 | | | | | | | Ratio of nonperforming loans with partial charge-offs | | | | | | to total loans | | 0.77% | | | 0.93% | | | | | | | Ratio of nonperforming loans with partial charge-offs | | | | | | to total nonperforming loans | | 30.55% | | | 36.42% | | | | | | | Coverage ratio net of nonperforming loans with | | | | | | partial charge-offs | | 64.71% | | | 86.09% | | | | | | | Ratio of total allowance to total loans less | | | | | | nonperforming loans with partial charge-offs | | 1.15% | | | 1.42% |
Mid Penn has not experienced any additional charge-offs on loans for which a partial charge-off had originally been taken. Mid Penn considers a commercial loan portfolio caused by the recession and problems in theor commercial real estate sector as well as the robust growth in the loan portfolio during 2009. The allowance for loan and lease losses at December 31, 2009 was $7,686,000, or 1.60% of total loans less unearned discount as compared to $5,505,000, or 1.27% at December 31, 2008 and $4,790,000 or 1.27% at December 31, 2007.
Nonperforming Assets
Nonperforming assets, other than consumer loans and 1-4 family residential mortgages, include nonaccrual loans, restructured loans and other real estate (including residential property). Nonaccrual loans are loans on which we no longer recognize daily interest income. A loan is generally classified as nonaccrualbe impaired when principal or interest has consistently been in default for a period of 90 days or more, or because of deterioration in the financial condition of the borrower, payment in full of principal or interest is not expected. Restructured loans are those loans whose terms have been modified to lower interest or principal payments because of borrower financial difficulties. Foreclosed assets held for sale include those assets that have been acquired through foreclosure for debts previously contracted, in settlement of debt. Loans past due 90 days or more and still accruing interest are loans that are generally well secured and in the process of collection or repayment and comprise additional risk elements in the loan portfolio.
Consumer loans are generally recommended for charge-off when they become 90 days delinquent. All 1-4 family residential mortgagesit becomes 90 days or more past due and not in the process of collection. This methodology assumes the borrower cannot or will not continue to make additional payments. At that time the loan would be considered collateral dependent as the discounted cash flow (“DCF”) method indicates no operating income is available for evaluating the collateral position; therefore, all impaired loans are reviewed by Management, and collection decisionsdeemed to be collateral dependent.
Mid Penn evaluates loans for charge-off on a monthly basis. Policies that govern the recommendation for charge-off are unique to the type of loan being considered. Commercial loans rated as nonaccrual or lower will first have a collateral evaluation completed in accordance with the guidance on impaired loans. Once the collateral evaluation has been completed, a specific allocation of allowance is made in lightbased upon the results of the analysisevaluation. In the event the loan is unsecured, the loan would have been charged-off at the recognition of each individual loan.impairment. If the loan is secured, it will undergo a 90 day waiting period to ensure the collateral shortfall identified in the evaluation is accurate and then charged down by the specific allocation. Once the charge down is taken, the remaining balance remains a nonperforming loan with the original terms and interest rate intact (not restructured). Commercial real estate loans rated as impaired will also have an initial collateral evaluation completed in accordance with the guidance on impaired loans. An updated real estate valuation is ordered and the collateral evaluation is modified to reflect any variations in value. A specific allocation of allowance is made for any anticipated collateral shortfall and a 90-day waiting period begins to ensure the accuracy of the collateral shortfall. The amountloan is then charged down by the specific allocation. Once the charge down is taken, the remaining balance remains a nonperforming loan with the original terms and interest rate intact (not restructured). The process of consumer andcharge-off for residential mortgage loans past duebegins upon a loan becoming delinquent for 90 days or more at year-end was $250,000, $465,000 and $916,000not in 2009, 2008the process of collection. The existing appraisal is reviewed and 2007, respectively. a lien search is obtained to determine lien position and any instances of intervening liens. A presentation of nonperforming assets as of December 31 for eachnew appraisal of the past five yearsproperty will be ordered if deemed necessary by management and a collateral evaluation is givencompleted. The loan will then be charged down to the value indicated in Table 11. At December 31, 2009, there were seven parcelsthe evaluation. Consumer loans are recommended for charge-off after reaching delinquency of primarily residential90 days and the loan is not in the process of collection. The entire balance of the consumer loan is recommended for charge-off at this point. As noted above, Mid Penn assesses a specific allocation for both commercial loans and commercial real estate in Other Real Estate Owned. The foreclosed assets held for sale at December 31, 2008, consisted of ten parcels of primarily residentialloans prior to charging down or charging off the loan. Once the charge down is taken, the remaining balance remains a nonperforming loan with the original terms and interest rate intact (not restructured). In addition, Mid Penn takes a preemptive step when any commercial loan or commercial real estate loan becomes classified under its internal classification system. A preliminary collateral evaluation in Other Real Estate Owned.accordance with the guidance on impaired loans is prepared using the existing collateral information in the loan file. This process allows Mid Penn to review both the credit and documentation files to determine the status of the information needed to make a collateral evaluation. This collateral evaluation is preliminary but allows Mid Penn to determine if any potential collateral shortfalls exist. 26
| | | MID PENN BANCORP, INC. | | Management’s Discussion and Analysis |
TABLE 11: NONPERFORMING ASSETS
| | | | | | | | | | | | | | | | | | | | | | (Dollars in thousands) | | December 31, | | | | | 2009 | | | 2008 | | | 2007 | | | 2006 | | | 2005 | | Nonperforming Assets: | | | | | | | | | | | | | | | | | | | | | Nonaccrual loans | | $ | 14,933 | | | $ | 4,113 | | | $ | 4,317 | | | $ | 1,293 | | | $ | 1,773 | | Loans renegotiated with borrowers | | | 308 | | | | 51 | | | | — | | | | — | | | | — | | | | | | | | | | | | | | | | | | | | | | | Total nonperforming loans | | | 15,241 | | | | 4,164 | | | | 4,317 | | | | 1,293 | | | | 1,773 | | | | | | | | Foreclosed real estate | | | 663 | | | | 1,516 | | | | 528 | | | | 146 | | | | 458 | | Other repossessed property | | | — | | | | — | | | | 59 | | | | — | | | | — | | | | | | | | | | | | | | | | | | | | | | | Total non-performing assets | | | 15,904 | | | | 5,680 | | | | 4,904 | | | | 1,439 | | | | 2,231 | | | | | | | | Accruing loans 90 days or more past due | | | 661 | | | | 1,860 | | | | 2,439 | | | | 995 | | | | 1,086 | | | | | | | | | | | | | | | | | | | | | | | Total risk elements | | $ | 16,565 | | | $ | 7,540 | | | $ | 7,343 | | | $ | 2,434 | | | $ | 3,317 | | | | | | | | | | | | | | | | | | | | | | | | | | | | | Nonperforming loans as a % of total loans outstanding | | | 3.17 | % | | | 0.96 | % | | | 1.14 | % | | | 0.36 | % | | | 0.57 | % | Nonperforming assets as a % of total loans outstanding and other real estate | | | 3.31 | % | | | 1.30 | % | | | 1.30 | % | | | 0.40 | % | | | 0.71 | % | Ratio of allowance for loan losses to nonperforming loans | | | 50.43 | % | | | 132.20 | % | | | 110.96 | % | | | 323.82 | % | | | 208.91 | % |
Mid Penn considers a loan or lease to be impaired when, based upon current information and events, it is probable that all interest and principal payments due according to the contractual terms of the loan or lease agreement will not be collected. An insignificant delay or shortfall in the amounts of payments would not cause a loan or lease to be considered impaired. Management determines the significance of payment delays and payment shortfalls on a case-by-case basis, taking into consideration all of the circumstances surrounding the loan or lease and the borrower, including the length of the delay, the reasons for the delay, the borrower’s prior payment record and the amount of the shortfall in relation to the principal and interest owed. Larger groups of small-balance loans, such as residential mortgages and consumer installment loans are collectively evaluated for impairment. Accordingly, individual consumer and residential loans are not separately identified for impairment disclosures unless such loans are the subject of a restructuring agreement. As discussed in Note 13
MID PENN BANCORP, INC.Management’s Discussion and Analysis Mid Penn’s rating system assumes any loans classified as sub-standard non-accrual to be impaired, and all of these consolidatedloans are considered collateral dependent; therefore, all of Mid Penn’s impaired loans, whether reporting a specific allocation or not, are considered collateral dependent. It is Mid Penn’s policy to obtain updated third party valuations on all impaired loans collateralized by real estate within 30 days of the credit being classified as sub-standard non-accrual. Prior to receipt of the updated real estate valuation Mid Penn will use any existing real estate valuation to determine any potential allowance issues; however no allowance recommendation will be made until which time Mid Penn is in receipt of the updated valuation. The credit department employs an electronic tracking system to monitor the receipt of and need for updated appraisals. To date, there have been no significant time lapses noted with the above processes. In some instances Mid Penn is not holding real estate as collateral and is relying on business assets (personal property) for repayment. In these circumstances a collateral inspection is performed by Mid Penn personnel to determine an estimated value. The value is based on net book value, as provided by the financial statements, and discounted accordingly based on determinations made by management. Occasionally, Mid Penn determineswill employ an outside service to provide a fair estimate of value based on auction sales or private sales. Management reviews the fair valueestimates of these third parties and discounts them accordingly based on management’s judgment, if deemed necessary. For impaired loans with no valuation allowance required, Mid Penn’s practice of obtaining independent third party market valuations on the subject property within 30 days of being placed on non-accrual status sometimes indicates that the loan to value ratio is sufficient to obviate the need for a specific allocation in spite of significant deterioration in real estate values in Mid Penn’s primary market area. These circumstances are determined on a case-by-case basis based primarily upon the fair valuecase by case analysis of the underlyingimpaired loans. Mid Penn actively monitors the values of collateral using Level 3 inputs comprisedon impaired loans. This monitoring may require the modification of customized collateral value discounting analyses.values over time or changing circumstances by some factor, either positive or negative, from the original values. All collateral values will be assessed by management at least every 12 months for possible revaluation by an independent third party. Mid Penn does not currently, or plan in the future to, use automated valuation methodologies as a method of valuing real estate collateral. As of December 31, 2009, the Corporation2012, Mid Penn had several unrelated loan relationships, with an aggregate carrying balance of $13,726,000,$9,744,000, deemed impaired that have been placed in nonaccrual status. Specificimpaired. This pool of loans is further broken down into a group of loans with an aggregate carrying balance of $2,858,000 for which specific allocations totaling $2,561,000$1,383,000 have been included within the loan loss reserve for these loans. ThisThe remaining $6,886,000 of loans requires no specific allocation within the loan loss reserve. The $9,744,000 pool of impaired loan relationships is comprised of $8,275,000$7,564,000 in real estate secured commercial relationships and $5,451,000$2,180,000 in business relationships. The Bank hasThere are specific allocations against the real estate secured pool totaling $837,000, of which $483,000 is with one large relationship. The remaining $354,000 is$519,000, spread among ninethirteen relationships composed primarily of customers engaged in real estate investment activities. The group of impaired business relationships with specific allocations is made up of six relationships primarily engaged in various forms of manufacturing and a specific allocation of $1,724,000$864,000 has been set aside against these credits. Five small business relationships account for $165,000 of the specific allocations due to the negative effects of the economy on their businesses. One additional large commercial participation loan in this pool has shown exceptional collateral devaluation and is responsible for a specific allocation of $1,000,000$699,000 of the total pool attributable to this segment. Two other manufacturing relationships account for an additional $589,000 of the specific allocations due to the negative effects of the economy on their businesses and the subsequent collateral devaluation. Management currently believes that the specific reserve isreserves are adequate to cover potentialprobable future losses related to these relationships. $4,278,000 of the 2009 non-accrual loans are also troubled debt restructured loans. The allowance for loan losses is a reserve established in the form of a provision expense for loan and lease losses and is reduced by loan charge-offs net of recoveries. When loans are deemed to be uncollectible, they are charged off. Management has established a reserve that it believes is adequate for probable losses in the loan and lease portfolio. In conjunction with an internal loan review function that operates independently of the lending function, management monitors the loan portfolio to identify risk on a monthly basis so that an appropriate allowance is maintained. Based on an evaluation of the loan portfolio, management presents a monthly review of the allowance for loan and lease losses to the Board of Directors, indicating any changes in the allowance since the last review. In making the evaluation, management considers the results of recent regulatory examinations, which typically include a review of the allowance for loan and lease losses an integral part of the examination process. In establishing the allowance, management evaluates on a quantitative basis individual classified loans and nonaccrual loans, and determines an aggregate reserve for those loans based on that review. In addition, an allowance for the remainder of the loan and lease portfolio is determined based on historical loss experience within certain components of the portfolio. These allocations may be modified if current conditions indicate that loan and lease losses may differ from historical experience. 27
| | | MID PENN BANCORP, INC. | | Management’s Discussion and Analysis |
MID PENN BANCORP, INC.Management’s Discussion and Analysis In addition, a portion of the allowance is established for losses inherent in the loan and lease portfolio which have not been identified by the quantitative processes described above. This determination inherently involves a higher degree of subjectivity, and considers risk factors that may not have yet manifested themselves in historical loss experience. These factors include: · | Changes in local, regional, and national economic and business conditions affecting the collectability of the portfolio, the values of underlying collateral, and the condition of various market segments. |
· | Changes in the volume and severity of past due loans, the volume of nonaccrual loans, and the volume and severity of adversely classified loans. |
· | Changes in the experience, ability, and depth of lending management and other relevant staff as well as the quality of the institution’s loan review system. |
· | Changes in the nature and volume of the portfolio and the terms of loans generally offered. |
· | The existence and effect of any concentrations of credit and changes in the level of such concentrations. |
Changes in the volume and severity of past due loans, the volume of nonaccrual loans, and the volume and severity of adversely classified loans.
Changes in the experience, ability, and depth of lending management and other relevant staff as well as the quality of the institution’s loan review system.
Changes in the nature and volume of the portfolio and the terms of loans generally offered.
The existence and effect of any concentrations of credit and changes in the level of such concentrations.
While the allowance for loan and lease losses is maintained at a level believed to be adequate by management for covering estimated losses in the loan and lease portfolio, determination of the allowance is inherently subjective, as it requires estimates, all of which may be susceptible to significant change. Changes in these estimates may impact the provisions charged to expense in future periods. Management believes, based on information currently available, that the allowance for loan and lease losses of $7,686,000$5,509,000 is adequate as of December 31, 2009.2012.
The allocation of the allowance for loan and lease losses among the major classifications is shown in Table 12 as of December 31 of each of the past five years. TABLE 12: ALLOCATION OF THE ALLOWANCE FOR LOAN AND LEASE LOSSES | | | | | | | | | | | | | | | | | | | | | | | | | | | | | | (Dollars in thousands) | December 31, | | 2012 | | 2011 | | 2010 | | 2009 | | 2008 | Commercial real estate, construction | | | | | | | | | | | | | | | and land development | $ | 3,122 | | $ | 3,567 | | $ | 3,775 | | $ | 3,334 | | $ | 3,326 | Commercial, industrial and agricultural | | 1,299 | | | 2,276 | | | 2,448 | | | 3,545 | | | 1,860 | Real estate - residential | | 635 | | | 362 | | | 219 | | | 175 | | | 87 | Consumer | | 444 | | | 424 | | | 424 | | | 467 | | | 172 | Unallocated | | 9 | | | 143 | | | 195 | | | 165 | | | 60 | | $ | 5,509 | | $ | 6,772 | | $ | 7,061 | | $ | 7,686 | | $ | 5,505 |
The 2012 provision of $1,036,000 is a decrease of $169,000 from the $1,205,000 provision in 2011. The continued slowness in the economy and continuing credit quality concerns of Mid Penn’s loan portfolio during 2012 necessitated larger than pre-2009 provision levels, even though the amount was a reduction from 2011. The allowance for loan and lease losses at December 31, 2012 was $5,509,000, or 1.14% of total loans less unearned discount as compared to $6,772,000, or 1.40% at December 31, 2011 and $7,061,000, or 1.51% at December 31, 2010. Deposits and Other Funding Sources Mid Penn’sPenn's primary source of funds isare deposits. Total deposits at December 31, 2009, increased2012 decreased by $63,191,000$8,594,000, or 14.5%1.4% over December 31, 2008,2011, which increased by $64,007,000$79,073,000, or 17.2%14.2% over December 31, 2007.2010. Average balances and average interest rates applicable to the major classifications of deposits for the years ended December 31, 2009, 2008,2012, 2011, and 20072010 are presented in Table 12.13. Average short-term borrowings for 20092012 were $19,715,000$1,044,000 as compared to $29,144,000$803,000 in 2008.2011. These borrowings included customer repurchase agreements, treasury tax and loan note option borrowings and federal funds purchased. Three $5,000,000 and two $1,000,000 long-term borrowings matured in 2009, while no new long-term borrowing arrangements were entered into during the year. At December 31, 2009,2012, the Bank had $27,889,000$4,128,000 in brokered deposits. With additionalcontinued success in the local deposit environment, along with the maturity of a $10,000,000 brokered certificate of deposit, the Bank reduced its brokered deposit funding by $18,219,000 in 2009,$9,226,000, after having reduced such funding by $3,649,000$3,140,000 in 2008.2011.
MID PENN BANCORP, INC.Management’s Discussion and Analysis TABLE 12:13: DEPOSITS BY MAJOR CLASSIFICATION | | | | | | | | | | | | | | | | | | | | (Dollars in thousands) | | December 31, | | | | | 2009 | | | 2008 | | | 2007 | | | | | Average
Balance | | Average
Rate | | | Average
Balance | | Average
Rate | | | Average
Balance | | Average
Rate | | Noninterest-bearing demand deposits | | $ | 51,464 | | 0.00 | % | | $ | 47,274 | | 0.00 | % | | $ | 44,021 | | 0.00 | % | Interest-bearing demand deposits | | | 38,198 | | 0.09 | % | | | 36,551 | | 0.30 | % | | | 35,048 | | 0.41 | % | Money market | | | 87,427 | | 1.58 | % | | | 69,251 | | 2.10 | % | | | 63,927 | | 3.45 | % | Savings | | | 26,241 | | 0.06 | % | | | 25,607 | | 0.25 | % | | | 25,513 | | 0.28 | % | Time | | | 255,123 | | 3.64 | % | | | 230,773 | | 4.29 | % | | | 203,671 | | 4.42 | % | | | | | | | | | | | | | | | | | | | | | | $ | 458,453 | | 2.34 | % | | $ | 409,456 | | 2.82 | % | | $ | 372,180 | | 3.07 | % | | | | | | | | | | | | | | | | | | | |
28
| | | MID PENN BANCORP, INC. | | Management’s Discussion and Analysis |
| | | | | | | | | | | | | | | | | | | | | | | | | | | | | | (Dollars in thousands) | December 31, | | 2012 | | 2011 | | 2010 | | Average | | Average | | Average | | Average | | Average | | Average | | Balance | | Rate | | Balance | | Rate | | Balance | | Rate | Noninterest-bearing demand deposits | $ | 47,670 | | 0.00% | | $ | 63,484 | | 0.00% | | $ | 58,480 | | 0.00% | Interest-bearing demand deposits | | 126,171 | | 0.36% | | | 57,342 | | 0.25% | | | 48,024 | | 0.14% | Money market | | 236,434 | | 0.84% | | | 248,615 | | 1.20% | | | 163,415 | | 1.44% | Savings | | 28,632 | | 0.05% | | | 27,801 | | 0.05% | | | 26,585 | | 0.06% | Time | | 180,356 | | 2.04% | | | 209,574 | | 2.56% | | | 239,761 | | 2.87% | | $ | 619,263 | | 0.99% | | $ | 606,816 | | 1.40% | | $ | 536,265 | | 1.74% |
The maturity distribution of time deposits of $100,000 or more is reflected in Table 13.14. TABLE 13:14: MATURITY OF TIME DEPOSITS $100,000 OR MORE | | | | | | | | | | | (Dollars in thousands) | | December 31, | | | | 2009 | | 2008 | | 2007 | Three months or less | | $ | 22,712 | | $ | 12,446 | | $ | 8,536 | Over three months to twelve months | | | 37,443 | | | 38,264 | | | 19,952 | Over twelve months | | | 25,682 | | | 22,682 | | | 15,453 | | | | | | | | | | | | | $ | 85,837 | | $ | 73,392 | | $ | 43,941 | | | | | | | | | | |
| | | | | | | | | | | | | | | | | | (Dollars in thousands) | December 31, | | 2012 | | 2011 | | 2010 | Three months or less | $ | 7,207 | | $ | 7,824 | | $ | 7,322 | Over three months to twelve months | | 18,340 | | | 21,979 | | | 21,031 | Over twelve months | | 32,763 | | | 36,807 | | | 37,870 | | $ | 58,310 | | $ | 66,610 | | $ | 66,223 |
Capital Resources Shareholders’
Shareholders' equity, or capital, is evaluated in relation to total assets and the risk associated with those assets. The detailed computation of the Bank’s regulatory capital ratios can be found in Note 1817 of Item 8, Notes to Consolidated Financial Statements. The greater a corporation’s capital resources, the more likely it is to meet its cash obligations and absorb unforeseen losses. Too much capital, however, indicates that not enough of the corporation’s earnings have been invested in the continued growth of the business or paid to shareholders and theshareholders. The buildup makes it difficult for a corporation to offer a competitive return on the shareholders’ capital going forward. For these reasons capital adequacy has been, and will continue to be, of paramount importance. Capital growth is achieved primarily by retaining more earnings than are paid out to shareholders.
Shareholders’ equity decreased in 20092012 by $4,186,000$1,232,000, or 8.2%2.3%, following an increase in 20082011 by $10,466,000$5,251,000, or 25.8%10.9%, and an increase in 2010 of $1,359,000$1,497,000, or 3.5% in 2007.3.2%. Capital was negatively impacted in 20092012 by the repayment and redemption of the $10,000,000 in the Series A preferred stock, but the impact was softened by the net lossincome of $2,809,000$4,437,000 and the paymentissuance of cash dividends to common shareholdersthe $4,880,000 in Series B preferred stock in 2012. Subsequently, the Series B preferred stock offering of $1,809,000.$5,000,000 was completed on January 3, 2013. Capital was positively impacted in 20082011 by the additionnet income of $10,000,000$4,029,000 and the increase in other comprehensive income from the U.S. Treasury’s Capital Purchase Program. The program was designed to provide well-capitalized, secure financial institutions with additional capitalincrease in order to increasevalue of the flow of credit into the economy. The program details are discussedassets in the following section.available for sale investment portfolio. Capital was positively impacted in 2010 by the net income of $2,234,000 and the suspension of the common dividend to shareholders. Mid Penn’s normal intent for dividend payout is to provide quarterly cash returns to shareholders and earnings retention at a level sufficient to finance future growth. The dividends paid on common shares totaled $0.25 for the year ended December 31, 2012, which included two $0.05 dividends in the fourth quarter, while $0.20 in dividends were paid for the year ended December 31, 2011. Mid Penn suspended the quarterly cash dividend to shareholders throughout 2010, consistent with Federal Reserve Board policy that dividends payouts should not exceed net income for the previous four quarters, net of dividends paid during that period. The dividend payout ratio, which represents the percentage of annual net income returned to shareholders in the form of cash dividends, was 77%19.69% for 20082012 and 60%17.24% for 2007. During the fourth quarter of 2009, 2011.
MID PENN BANCORP, INC.Management’s Discussion and Analysis Mid Penn suspendedmaintained the quarterly cash dividend consistent with Federal Reserve Board policy that dividend payouts should not exceed net income for the previous four quarters, netfollowing regulatory capital levels, leverage ratios, and risk-based capital ratios as of dividends paid during that period. Mid Penn presently plans to resume a quarterly cash dividend payment to common shareholders when it is prudent to do so consistent with this Federal Reserve policy.December 31, 2012, and 2011, as follows: In December of 2008, Mid Penn retired its treasury stock.
| | | | | | | | | | | | | | | | | | | | | | | | | | | | | | (Dollars in thousands) | | | | | | Capital Adequacy | | | | | | | | | | | | | | | | | To Be Well-Capitalized | | | | | | | | | | | | Under Prompt | | | | | | | Minimum Capital | | Corrective | | Actual: | | Required: | | Action Provisions: | | Amount | Ratio | | Amount | Ratio | | Amount | Ratio | Corporation | | | | | | | | | | | | | | | As of December 31, 2012: | | | | | | | | | | | | | | | Tier 1 Capital (to Average Assets) | $ | 48,822 | | 6.8% | | $ | 28,530 | | 4.0% | | $ | N/A | | N/A | Tier 1 Capital (to Risk Weighted Assets) | | 48,822 | | 10.0% | | | 19,593 | | 4.0% | | | N/A | | N/A | Total Capital (to Risk Weighted Assets) | | 54,421 | | 11.1% | | | 39,185 | | 8.0% | | | N/A | | N/A | | | | | | | | | | | | | | | | Bank | | | | | | | | | | | | | | | As of December 31, 2012: | | | | | | | | | | | | | | | Tier 1 Capital (to Average Assets) | $ | 48,764 | | 6.9% | | $ | 28,111 | | 4.0% | | $ | 35,138 | | 5.0% | Tier 1 Capital (to Risk Weighted Assets) | | 48,764 | | 10.0% | | | 19,593 | | 4.0% | | | 29,389 | | 6.0% | Total Capital (to Risk Weighted Assets) | | 54,363 | | 11.1% | | | 39,185 | | 8.0% | | | 48,981 | | 10.0% | | | | | | | | | | | | | | | | Corporation | | | | | | | | | | | | | | | As of December 31, 2011: | | | | | | | | | | | | | | | Tier 1 Capital (to Average Assets) | $ | 50,451 | | 7.0% | | $ | 28,679 | | 4.0% | | $ | N/A | | N/A | Tier 1 Capital (to Risk Weighted Assets) | | 50,451 | | 10.3% | | | 19,566 | | 4.0% | | | N/A | | N/A | Total Capital (to Risk Weighted Assets) | | 56,513 | | 11.6% | | | 39,132 | | 8.0% | | | N/A | | N/A | | | | | | | | | | | | | | | | Bank | | | | | | | | | | | | | | | As of December 31, 2011: | | | | | | | | | | | | | | | Tier 1 Capital (to Average Assets) | $ | 50,265 | | 7.1% | | $ | 28,326 | | 4.0% | | $ | 35,408 | | 5.0% | Tier 1 Capital (to Risk Weighted Assets) | | 50,265 | | 10.4% | | | 19,367 | | 4.0% | | | 29,051 | | 6.0% | Total Capital (to Risk Weighted Assets) | | 56,327 | | 11.6% | | | 38,735 | | 8.0% | | | 48,419 | | 10.0% |
Capital Purchase Program Participation On December 19, 2008, Mid Penn Bancorp, Inc., Inc. (the “Corporation”) entered into anand closed a letter agreement (including the Securities Purchase Agreement – Standard Terms) (the “Purchase Agreement”) with the United States Department of the Treasury (the “Treasury”) pursuant to which the Treasury invested $10,000,000 in the CorporationMid Penn under the Treasury’s Capital Purchase Program (the “CPP”). Under the Purchase Agreement,letter agreement, the Treasury received (1) 10,000 shares of Series A Fixed Rate Cumulative Perpetual Preferred Stock, $1,000 liquidation preference (“Series A Preferred Stock”), and (2) Warrantswarrants to purchase up to 73,099 shares of the Corporation’sMid Penn common stock at an exercise price of $20.52 per share.share (the “Warrants”). The preferred shares pay cumulative dividends at
On December 28, 2012, Mid Penn entered into a rate of 5% per annum for the first five years and 9% per annum thereafter. The preferred shares are non-voting, other than class voting rights on certain matters that could adversely affect the preferred shares. If dividends on the preferred shares have not been paid for an aggregate of six quarterly dividend periods or more, whether consecutive or not, the Corporation’s authorized number of directors will automatically be increased by two, and holders of the preferred stock, voting togetherletter agreement with holders of any then outstanding parity stock, will have the right to elect those directors at the Corporation’s next annual meeting of shareholders or special meeting of shareholders called for that purpose. These preferred share directors would be elected annually and serve until all accrued and unpaid dividends on the preferred shares have been paid. Pursuant to the American Recovery and Reinvestment Act of 2009 (“ARRA”), the Secretary of the Treasury shall permit, subjectpursuant to consultation with the appropriate Federal banking agency, the Corporation to redeem the Series A Preferred Stock. The Corporation may do so without regard to the source of the funds to be used to redeem the Series A Preferred Stock or any minimum waiting period. If the Corporation elects to redeem the Series A Preferred Stock prior to February 15, 2012, and receives approvalwhich Mid Penn repurchased from the Treasury and the Board of Governors of the Federal Reserve System, it must redeem at least $2,500,000 of the Series A Preferred Stock. Upon redemptionall 10,000 shares of the Series A Preferred Stock issued to the SecretaryTreasury, which constitutes all of the Treasury is required to liquidateissued and outstanding shares of Series A Preferred Stock. Mid Penn repurchased the warrants associated with the Corporation’s participation in the CPP at the current market price. Any redemption is subjectSeries A Preferred Stock for a purchase price equal to the consentaggregate liquidation amount of the BoardPreferred Stock of Governors$10,000,000, plus accrued but unpaid dividends of the Federal Reserve System. Until December 19, 2011, or$59,722. All 10,000 shares of Series A Preferred Stock have subsequently been cancelled.
29
| | | MID PENN BANCORP, INC. | | Management’s Discussion and Analysis |
such earlier time as all preferred shares have been redeemed by the Corporation or transferred by Treasury to third parties that are not affiliated with Treasury, the Corporation may not, without Treasury’s consent, increase its dividend rate per share of common stock above the per share quarterly amount in effect immediately prior to October 14, 2008 ($0.20 per share) or, with certain limited exceptions, repurchase its common stock.
The warrants are immediately exercisable and have a 10-year term. The exercise price and number of shares subject to the warrants are both subject to anti-dilution adjustments. Treasury has agreed not to exercise voting power with respect to any shares of common stock issued upon exercise of the warrants; however, this agreement not to vote the shares does not apply to any person who may acquire such shares.
The preferred shares and the warrants were issued in a private placement exempt from registration pursuant to Section 4(2) of the Securities Act of 1933. The Corporation has filed a shelf registration statement covering the preferred shares, the warrants, and the common stock underlying the warrants. Treasury and other future holders of the preferred shares, the warrants, or the common stock issued pursuant to the warrants also have piggyback and demand registration rights with respect to these securities. None of the preferred shares, the warrants, or the shares issuable upon exercise of the warrants are subject to any contractual restrictions on transfer.
In the Purchase Agreement, the Corporation agreed that, until such time as the Treasury ceases to own any securities acquired fromOn January 23, 2013, Mid Penn pursuant to the Purchase Agreement, the Corporation will take all necessary action to ensure that benefit plans with respect to our senior executive officers comply with Section 111(b) of the Emergency Economic Stability Act of 2008 (the “EESA”) and applicable guidance or regulations issued by the Secretary of the Treasury. The applicable executive compensation requirements apply to the compensation of the Corporation’s Chief Executive Officer, Chief Financial Officer, and certain other highly compensated executive officers.
These requirements, the compliance of which must be annually certified by Mid Penn’s chief executive officer and chief financial officer, include:
| 1. | limits on compensation that exclude incentives for senior executive officers of Mid Penn to take unnecessary and excessive risks that threaten the value of Mid Penn during the period in which any obligation arising from financial assistance provided under the TARP remains outstanding; |
| 2. | a provision for the recovery by Mid Penn of any bonus, retention award, or incentive compensation paid to a senior executive officer and any of the next 20 most highly-compensated employees of Mid Penn based on statements of earnings, revenues, gains, or other criteria that are later found to be materially inaccurate; |
| 3. | a prohibition on Mid Penn making any golden parachute payment to a senior executive officer or any of the next five most highly-compensated employees of Mid Penn during the period in which any obligation arising from financial assistance provided under the TARP remains outstanding; |
| 4. | a prohibition on Mid Penn paying or accruing any bonus, retention award, or incentive compensation to the most highly compensated employees of Mid Penn during the period in which any obligation arising from financial assistance provided under the TARP remains outstanding, except that any prohibition shall not apply to the payment of long-term restricted stock by Mid Penn, provided that such long-term restricted stock – |
| i. | Does not fully vest during the period in which any obligation arising from financial assistance provided to Mid Penn remains outstanding; |
| ii. | Has a value in an amount that is not greater than one-third of the total amount of annual compensation of the employee receiving the stock; and |
| iii. | Is subject to such other terms and conditions as the Secretary of the Treasury may determine is in the public interest; |
| 5. | a prohibition on any compensation plan that would encourage manipulation of the reported earnings of Mid Penn to enhance the compensation of any of its employees; and |
| 6. | a requirement that Mid Penn’s compensation committee remains entirely independent and meets at least semiannually to discuss and evaluate employee compensation plans in light of an assessment of any risk posed to Mid Penn from such plans. |
In compliance with the EESA and ARRA, on February 27, 2009, Rory G. Ritrievi entered into a Capital Purchase Plan Executive Compensation Restriction Agreementletter agreement with the Treasury pursuant to which Mid Penn Bancorp, Inc., Inc. and Mid Penn Bank (the “Agreement”).repurchased from the Treasury on that date the Warrants for $58,479. The Agreement prohibits, during the period which any obligation to the Federal Government remains outstanding, any payment to Mr. Ritrievi (including bonus payments and payments upon a termination) which would violate the EESA and ARRA, despite Mr. Ritrievi having an employment agreement requiring payments upon certain terminations.Warrants have subsequently been cancelled.
In addition to these requirements, Mid Penn must have in place a company-wide policy regarding excessive or luxury expenditures and must permit a separate nonbinding shareholder vote to approve the compensation of executives as disclosed pursuant to the compensation disclosure rules
As of the Securities and Exchange Commission.date hereof, Mid Penn has adopted such a luxury and expense policy and it appears onno further financial obligations under the Corporation’s website at www.midpennbank.com.Series A Preferred Stock, the Warrants, or the Treasury’s CPP. 30Federal Income Taxes
| | | MID PENN BANCORP, INC. | | Management’s Discussion and Analysis |
Federal Income Taxes
Federal income tax benefitexpense for 20092012 was $2,208,000$1,244,000 compared to the federal income tax expenses of $1,104,000$1,223,000 in 2011 and $1,394,000$416,000 in 2008 and 2007, respectively.2010. The effective tax rate was 49% 20%for 2009, 24%2012, 21% for 20082011, and 23%13% for 2007.2010. The tax benefit was related to a loss stemmingexpense in 2012 and 2011 resulted from net income generated in the increased provision for loan losses and increased noninterest expenses during 2009 versus 2008.normal course of business. Generally, our effective tax rate is below the statutory rate due to earnings on tax-exempt loans, investments, and bank-owned life insurance, and the impact of tax credits. The
MID PENN BANCORP, INC.Management’s Discussion and Analysis realization of deferred tax assets is dependent on future earnings. As a result of Mid Penn’s adoption of ASC Topic 740,Income Taxes, no significant income tax uncertainties were identified; therefore, Mid Penn recognized no adjustment for unrealized income tax benefits for the periods ended December 31, 20092012 and December 31, 2008.2011. We currently anticipate that future earnings will be adequate to fully utilize deferred tax assets.
Liquidity Mid Penn’sPenn's asset-liability management policy addresses the management of Mid Penn’sPenn's liquidity position and its ability to raise sufficient funds to meet deposit withdrawals, fund loan growth and meet other operational needs. Mid Penn utilizes its investments as a source of liquidity, along with deposit growth and increases in repurchase agreements and borrowings. (See Deposits and Other Funding Sources which appears earlier in this discussion.) Liquidity from investments is provided primarily through investments and interest-bearing balances with maturities of one year or less. Funds are available to Mid Penn through loans from the Federal Home Loan Bank and established federal funds (overnight) lines of credit. Mid Penn’sPenn's major source of funds is its core deposit base. Major sources of cash in 20092012 came from the maturity of investment securities of $39,453,000, the sale of investment securities of $17,895,000, and the increase in demand deposit and savings accounts of $29,645,000. Major uses of cash in 2012 were the purchase of investment securities of $53,553,000, as well as the decrease in time deposits of $38,239,000. Major sources of cash in 2011 came from the net increase in deposits of $63,191,000,$79,073,000, as well as the proceeds from investment securities anddecrease in interest-bearing balances of $15,360,000 and $11,472,000, respectively.$27,564,000. The major useuses of cash in 2009 was2011 were the net purchase of investment securities of $84,744,000 and the increase in loans and leases of $53,528,000. Another major use of cash in 2009 was the repayment of $17,166,000 in long-term debt. Other significant uses of cash included the purchase of investment securities of $9,354,000, the purchase of premises and equipment of $2,647,000, and the payment of $1,809,000 in common stock cash dividends.$17,774,000. Major sources of cash in 2008 came from the net increase in deposits of $64,007,000, as well as the proceeds from investment securities and long-term borrowings of $18,420,000 and $15,795,000, respectively. Another major source of funds was the proceeds from the U.S. Treasury’s Capital Purchase Program of $10,000,000.
The major use of cash in 2008 was a net increase in loans and leases of $59,586,000. Other major uses of cash included the purchase of investment securities of $16,897,000, the increase in interest-bearing balances of $3,263,000, the payment of $2,787,000 in cash dividends, and the purchase of bank premises and equipment of $1,587,000.
Aggregate Contractual Obligations Table 1415 represents Mid Penn’s on-and-off balance sheet aggregate contractual obligations to make future payments as of December 31, 2009:2012: TABLE 14:15: AGGREGATE CONTRACTUAL OBLIGATIONS | | | | | | | | | | | | | | | | | | | (Dollars in thousands) | | | | Payments Due by Period | | | Note
Reference | | Total | | One Year or
Less | | One to
Three
Years | | Three to
Five
Years | | More
than
Five
Years | Certificates of deposit | | 10 | | $ | 268,460 | | $ | 170,957 | | $ | 79,407 | | $ | 15,503 | | $ | 2,593 | Short-term borrowings | | 11 | | | 16,044 | | | 16,044 | | | — | | | — | | | — | Long-term debt | | 12 | | | 38,057 | | | 10,000 | | | 19,258 | | | 5,000 | | | 3,799 | Operating lease obligations | | 20 | | | 427 | | | 79 | | | 163 | | | 158 | | | 27 | Payments under benefit plans | | 14 | | | 1,334 | | | 94 | | | 208 | | | 244 | | | 788 | | | | | | | | | | | | | | | | | | | | | | | $ | 324,322 | | $ | 197,174 | | $ | 99,036 | | $ | 20,905 | | $ | 7,207 | | | | | | | | | | | | | | | | | | |
| | | | | | | | | | | | | | | | | | | | | | | | | | | | | | | | | | (Dollars in thousands) | | | | | | Payments Due by Period | | Note Reference | | Total | | One Year or Less | | One to Three Years | | Three to Five Years | | More than Five Years | Certificates of deposit | 9 | | $ | 163,653 | | $ | 69,663 | | $ | 73,265 | | $ | 16,616 | | $ | 4,109 | Long-term debt | 11 | | | 22,510 | | | 14,189 | | | 5,000 | | | - | | | 3,321 | Operating lease obligations | 19 | | | 255 | | | 114 | | | 141 | | | - | | | - | Payments under benefit plans | 13 | | | 1,609 | | | 124 | | | 292 | | | 332 | | | 861 | | | | $ | 188,027 | | $ | 84,090 | | $ | 78,698 | | $ | 16,948 | | $ | 8,291 |
We are not aware of any other commitments or contingent liabilities which may have a material adverse impact on Mid Penn’s liquidity or capital resources. 31
| | | MID PENN BANCORP, INC. | | Management’s Discussion and Analysis |
Effects of Inflation A bank’sbank's asset and liability structure is substantially different from that of an industrial company in that virtually all assets and liabilities of a bank are monetary in nature. Management believes the impact of inflation on its financial results depends principally upon Mid Penn’sPenn's ability to manage the balance sheet sensitivity to changes in interest rates and, by such reaction, mitigate the inflationary impact on performance. Interest rates do not necessarily move in the same direction or at the same magnitude as the prices of other goods and services. As discussed previously, Management seeks to manage the relationship between interest sensitive assets and liabilities in order to protect against wide interest rate fluctuations, including those resulting from inflation. Information shown elsewhere in this Annual Report will assist in the understanding of how Mid Penn is positioned to react to changing interest rates and inflationary trends. In particular, the summary of net liabilities, as well as the composition of loans, investments and deposits should be considered.
MID PENN BANCORP, INC.Management’s Discussion and Analysis Off-Balance Sheet Items Mid Penn makes contractual commitments to extend credit and extends lines of credit, which are subject to Mid Penn’sPenn's credit approval and monitoring procedures. As of December 31, 2009,2012, commitments to extend credit amounted to $116,486,000$99,958,000 as compared to $98,034,000$91,619,000 as of December 31, 2008.2011. Mid Penn also issues financial standby letters of credit to its customers. The risk associated with financial standby letters of credit is essentially the same as the credit risk involved in loan extensions to customers. Financial standbyStandby letters of credit increased to $10,697,000$10,417,000 at December 31, 2009,2012, from $10,517,000$7,320,000 at December 31, 2008.2011.
MID PENN BANCORP, INC.Management’s Discussion and Analysis Comprehensive (Loss) Income
Comprehensive (Loss) Income is a measure of all changes in equity of a corporation, excluding transactions with owners in their capacity as owners (such as proceeds from issuances of stock and dividends). The difference between Net (Loss) Income and Comprehensive (Loss) Income is termed “Other Comprehensive (Loss) Income.” For Mid Penn, Other Comprehensive (Loss) Income consists primarily of unrealized gains and losses on available for sale securities, net of deferred income tax. Other Comprehensive (Loss) Income also includes a pension component in accordance with ASC Topic 715. Comprehensive (Loss) Income should not be construed to be a measure of Net (Loss) Income. The amount of unrealized gains or losses reflected in Comprehensive (Loss) Income may vary widely at statement dates depending on the markets as a whole and how interest rate movements affect the market value of the portfolio of available for sale securities. Other Comprehensive (Loss) Income for the years ended December 31, 2009, 2008 and 2007 was $369,000, $120,000, and ($33,000), respectively.
ITEM 7A.QUANTITATIVE AND QUALITATIVE DISCLOSURES ABOUT MARKET RISK As a financial institution, Mid Penn’s primary source of market risk is interest rate risk. Interest rate risk is the exposure to fluctuations in Mid Penn’s future earnings (earnings at risk) resulting from changes in interest rates. This exposure or sensitivity is a function of the repricing characteristics of Mid Penn’sPenn's portfolio of assets and liabilities. Each asset and liability reprices either at maturity or during the life of the instrument. Interest rate sensitivity is measured as the difference between the volume of assets and liabilities that are subject to repricing in a future period of time. The principal purpose of asset-liability management is to maximize current and future net interest income within acceptable levels of interest rate risk while satisfying liquidity and capital requirements. Net interest income is increased by increasing the net interest margin and by volume growth. Thus the goal of interest rate risk management is to maintain a balance between risk and reward such that net interest income is maximized while risk is maintained at an acceptable level. Mid Penn utilizes an asset-liability management model to measure the impact of interest rate movements on its interest rate sensitivity position. Mid Penn’s management also reviews the traditional maturity gap analysis regularly. Mid Penn does not always attempt to achieve an exact match between interest sensitive assets and liabilities because it believes that an actively managed amount of interest rate risk is inherent and appropriate in the management of the Corporation’s profitability. Modeling techniques and simulation analysis involve assumptions and estimates that inherently cannot be measured with complete precision. Key assumptions in the analyses include maturity and repricing characteristics of assets and liabilities, prepayments on amortizing assets, non-maturing deposit sensitivity, and loan and deposit pricing. These assumptions are inherently uncertain due to the timing, magnitude and frequency of rate changes and changes in market conditions and management strategies, among other factors. However, the analyses are useful in quantifying risk and provide a relative gauge of Mid Penn’s interest rate risk position over time. Management reviews interest rate risk on a quarterly basis. This analysis includes earnings scenarios whereby interest rates are increased and decreased by 100, 200, and 300 basis points. These scenarios, detailed in Table 15,16, indicate that thereMid Penn would not be a significant variance inexperience enhanced net 32
| | | MID PENN BANCORP, INC. | | Management’s Discussion and Analysis |
interest income over a one-year time frame due to upward interest rate changes;changes, while a reduction in interest rates would result in a less pronounced reduction in net interest income over a one-year time frame; however, actual results could vary significantly from the calculations prepared by Management. At December 31, 2009,2012, all interest rate risk levels according to the model were within the tolerance limits of Board approved policy with the exception of the up 200 basis point scenario. Because this variance is to the benefit of Mid Penn, Management is monitoring the situation but not taking any action at this time to remedy the variance to policy. In addition, the table does not take into consideration changes, which Management would make to realign its portfolio in the event of a changing rate environment. TABLE 15:16: EFFECT OF HYPOTHETICAL CHANGES IN INTEREST RATES | | | | | | | | | | | | | December 31, 2009 | | | | December 31, 2008 | Change in Basis Points | | % Change in Net Interest Income | | Risk Limit | | | | Change in Basis Points | | % Change in Net Interest Income | | Risk Limit | 300 | | 12.59% | | +/- 25% | | | | 300 | | -11.97% | | +/- 25% | 200 | | 8.42% | | +/- 15% | | | | 200 | | -7.89% | | +/- 15% | 100 | | 4.17% | | +/- 10% | | | | 100 | | -4.02% | | +/- 10% | 0 | | | | | | | | 0 | | | | | (100) | | -4.17% | | +/- 10% | | | | (100) | | 3.99% | | +/- 10% | (200) | | -8.41% | | +/- 15% | | | | (200) | | 7.76% | | +/- 15% | (300) | | -12.59% | | +/- 25% | | | | (300) | | 11.69% | | +/- 25% |
| | | | | | | | | | | | | | | | | | | | | | December 31, 2012 | | December 31, 2011 | | | % Change in | | | | | | % Change in | | | Change in | | Net Interest | | | | Change in | | Net Interest | | | Basis Points | | Income | | Risk Limit | | Basis Points | | Income | | Risk Limit | 300 | | 23.42% | | +/- 25% | | 300 | | 3.54% | | +/- 25% | 200 | | 15.49% | | +/- 15% | | 200 | | 2.36% | | +/- 15% | 100 | | 7.32% | | +/- 10% | | 100 | | 1.09% | | +/- 10% | 0 | | | | | | 0 | | | | | (100) | | -5.03% | | +/- 10% | | (100) | | -1.54% | | +/- 10% | (200) | | -9.86% | | +/- 15% | | (200) | | -2.91% | | +/- 15% | (300) | | -14.72% | | +/- 25% | | (300) | | -4.29% | | +/- 25% |
33
ITEM 8.FINANCIAL STATEMENTS AND SUPPLEMENTARY DATA The following audited financial statements are set forth in this Annual Report of Form 10-K on the following pages: Index to Financial Statements and Supplementary Data
| | | Index to Financial Statements and Supplementary Data | | | | | | Report of Independent Registered Public Accounting Firm | | 35 | | 44 |
| | | | Consolidated Balance Sheets | | 36 | | 45 |
| | | | Consolidated Statements of OperationsIncome | | 37 | | 46 |
| | | | Consolidated Statements of Comprehensive Income | 47 | | | | | Consolidated Statements of Changes in Shareholders’Shareholders' Equity | | 38 | | 48 |
| | | | Consolidated Statements of Cash Flows | | 39 | | 49 |
| | | | Notes to Consolidated Financial Statements | | 4150 |
34
Report of Independent Registered Public Accounting Firm To the Board of Directors and Shareholders Mid Penn Bancorp, Inc., Inc. We have audited the accompanying consolidated balance sheets of Mid Penn Bancorp, Inc., Inc. and subsidiaries (the “Corporation”) as of December 31, 20092012 and 2008,2011, and the related consolidated statements of operations,income, comprehensive income, changes in shareholders’ equity, and cash flows for each of the years in the three-year period ended December 31, 2009.2012. The Corporation’s management is responsible for these consolidated financial statements. Our responsibility is to express an opinion on these consolidated financial statements based on our audits. We conducted our audits in accordance with the standards of the Public Company Accounting Oversight Board (United States). Those standards require that we plan and perform the audit to obtain reasonable assurance about whether the consolidated financial statements are free of material misstatement. The Corporation is not required to have, nor were we engaged to perform, an audit of their internal control over financial reporting. Our audit included consideration of internal control over financial reporting as a basis for designing audit procedures that are appropriate in the circumstances, but not for expressing an opinion on the effectiveness of the Corporation’s internal control over financial reporting. Accordingly, we express no such opinion. An audit includes examining, on a test basis, evidence supporting the amounts and disclosures in the consolidated financial statements. An audit also includes assessing the accounting principles used and significant estimates made by management, as well as evaluating the overall financial statement presentation. We believe that our audits provide a reasonable basis for our opinion. In our opinion, the consolidated financial statements referred to above present fairly, in all material respects, the financial position of the Corporation as of December 31, 20092012 and 2008,2011, and the results of their operations and their cash flows for each of the years in the three-year period ended December 31, 20092012 in conformity with accounting principles generally accepted in the United States of America. We also have audited, in accordance with the standards of the Public Company Accounting Oversight Board (United States), the effectiveness of the Corporation’s internal control over financial reporting as of December 31, 2009, based on criteria established inInternal Control – Integrated Frameworkissued by the Committee of Sponsoring Organizations of the Treadway Commission (“COSO”), and our report dated March 16, 2010 expressed an unqualified opinion.

ParenteBeard LLC Harrisburg, Pennsylvania March 16, 201025, 2013 35
| | | MID PENN BANCORP, INC. | | Consolidated Balance Sheet |
| | | | | | | | | | (Dollars in thousands, except share data) | | December 31, | | | | | 2009 | | | 2008 | | ASSETS | | | | | | | | | Cash and due from banks | | $ | 7,526 | | | $ | 7,478 | | Interest-bearing balances with other financial institutions | | | 1,434 | | | | 970 | | | | | | | | | | | Total cash and cash equivalents | | | 8,960 | | | | 8,448 | | | | | | | | | | | Interest-bearing time deposits with other financial institutions | | | 38,604 | | | | 50,076 | | Available for sale investment securities | | | 47,345 | | | | 52,739 | | Loans and leases, net of unearned interest | | | 480,385 | | | | 434,643 | | Less: Allowance for loan and lease losses | | | (7,686 | ) | | | (5,505 | ) | | | | | | | | | | Net loans and leases | | | 472,699 | | | | 429,138 | | | | | | | | | | | Bank premises and equipment, net | | | 12,904 | | | | 11,377 | | Restricted investment in bank stocks | | | 4,029 | | | | 3,618 | | Foreclosed assets held for sale | | | 663 | | | | 1,516 | | Accrued interest receivable | | | 2,781 | | | | 2,747 | | Deferred income taxes | | | 2,257 | | | | 2,150 | | Goodwill | | | 1,016 | | | | 1,016 | | Core deposit and other intangibles, net | | | 369 | | | | 406 | | Cash surrender value of life insurance | | | 7,368 | | | | 7,437 | | Other assets | | | 7,015 | | | | 2,331 | | | | | | | | | | | Total Assets | | $ | 606,010 | | | $ | 572,999 | | | | | | | | | | | LIABILITIES & SHAREHOLDERS’ EQUITY | | | | | | | | | Deposits: | | | | | | | | | Noninterest bearing demand | | $ | 55,943 | | | $ | 48,602 | | Interest bearing demand | | | 42,148 | | | | 39,048 | | Money Market | | | 107,295 | | | | 75,750 | | Savings | | | 26,169 | | | | 25,364 | | Time | | | 268,460 | | | | 248,060 | | | | | | | | | | | Total Deposits | | | 500,015 | | | | 436,824 | | Short-term borrowings | | | 16,044 | | | | 23,977 | | Long-term debt | | | 38,057 | | | | 55,223 | | Accrued interest payable | | | 1,750 | | | | 2,411 | | Other liabilities | | | 3,440 | | | | 3,674 | | | | | | | | | | | Total Liabilities | | | 559,306 | | | | 522,109 | | Shareholders’ Equity: | | | | | | | | | Preferred stock, par value $1,000; authorized 10,000,000 shares; 5% cumulative dividend; 10,000 shares issued and outstanding at December 31, 2009 and December 31, 2008 | | | 10,000 | | | | 10,000 | | | | | Common stock, par value $1 per share; 10,000,000 shares authorized; 3,479,780 shares issued and outstanding at December 31, 2009 and December 31, 2008 | | | 3,480 | | | | 3,480 | | Additional paid-in capital | | | 29,824 | | | | 29,838 | | Retained earnings | | | 2,627 | | | | 7,168 | | Accumulated other comprehensive income | | | 773 | | | | 404 | | | | | | | | | | | Total Shareholders’ Equity | | | 46,704 | | | | 50,890 | | | | | | | | | | | Total Liabilities and Shareholders’ Equity | | $ | 606,010 | | | $ | 572,999 | | | | | | | | | | |
44
MID PENN BANCORP, INC.Consolidated Balance Sheets | | | | | | (Dollars in thousands, except per share data) | December 31, 2012 | | December 31, 2011 | ASSETS | | | | | | Cash and due from banks | $ | 11,200 | | $ | 9,847 | Interest-bearing balances with other financial institutions | | 1,273 | | | 1,555 | Federal funds sold | | 3,000 | | | 6,439 | Total cash and cash equivalents | | 15,473 | | | 17,841 | Interest-bearing time deposits with other financial institutions | | 23,563 | | | 27,477 | Available for sale investment securities | | 154,295 | | | 159,043 | Loans and leases, net of unearned interest | | 484,220 | | | 482,717 | Less: Allowance for loan and lease losses | | (5,509) | | | (6,772) | Net loans and leases | | 478,711 | | | 475,945 | Bank premises and equipment, net | | 13,123 | | | 13,324 | Restricted investment in bank stocks | | 2,503 | | | 3,120 | Foreclosed assets held for sale | | 843 | | | 931 | Accrued interest receivable | | 2,893 | | | 3,067 | Deferred income taxes | | 1,789 | | | 2,439 | Goodwill | | 1,016 | | | 1,016 | Core deposit and other intangibles, net | | 288 | | | 274 | Cash surrender value of life insurance | | 8,143 | | | 7,896 | Other assets | | 2,560 | | | 3,010 | Total Assets | $ | 705,200 | | $ | 715,383 | LIABILITIES & SHAREHOLDERS’ EQUITY | | | | | | Deposits: | | | | | | Noninterest bearing demand | $ | 57,977 | | $ | 73,261 | Interest bearing demand | | 164,837 | | | 59,403 | Money Market | | 210,588 | | | 271,521 | Savings | | 28,406 | | | 27,978 | Time | | 163,653 | | | 201,892 | Total Deposits | | 625,461 | | | 634,055 | Long-term debt | | 22,510 | | | 22,701 | Accrued interest payable | | 620 | | | 1,064 | Other liabilities | | 4,389 | | | 4,111 | Total Liabilities | | 652,980 | | | 661,931 | Shareholders' Equity: | | | | | | Series A Preferred stock, par value $1.00; authorized 10,000,000 shares; 5% cumulative | | | | | | dividend; 0 shares issued and outstanding at December 31, 2012 and 10,000 shares | | | | | | issued and outstanding at December 31, 2011 | | - | | | 10,000 | Series B Preferred stock, par value $1.00; liquidation value $1,000; authorized | | | | | | 5,000 shares; 7% cumulative dividend; 4,880 shares issued and outstanding at | | | | | | December 31, 2012 and 0 shares issued and outstanding at December 31, 2011 | | 4,880 | | | - | Common stock, par value $1.00; authorized 10,000,000 shares; 3,489,684 shares | | | | | | issued and outstanding at December 31, 2012 and 3,484,509 at December 31, 2011 | | 3,490 | | | 3,484 | Additional paid-in capital | | 29,816 | | | 29,830 | Retained earnings | | 11,741 | | | 8,222 | Accumulated other comprehensive income | | 2,293 | | | 1,916 | Total Shareholders’ Equity | | 52,220 | | | 53,452 | Total Liabilities and Shareholders' Equity | $ | 705,200 | | $ | 715,383 |
The accompanying notes are an integral part of these consolidated financial statements. 36
| | | MID PENN BANCORP, INC. | | Consolidated Statements of Operations |
| | | | | | | | | | | | (Dollars in thousands, except per share data) | | Years Ended December 31, | | | | 2009 | | | 2008 | | 2007 | INTEREST INCOME | | | | | | | | | | | Interest & fees on loans and leases | | $ | 28,039 | | | $ | 27,141 | | $ | 26,357 | Interest on interest-bearing balances | | | 1,460 | | | | 2,499 | | | 2,546 | Interest and dividends on investment securities: | | | | | | | | | | | U.S. Treasury and government agencies | | | 652 | | | | 819 | | | 944 | State and political subdivision obligations, tax-exempt | | | 1,171 | | | | 1,251 | | | 1,361 | Other securities | | | 13 | | | | 146 | | | 203 | Interest on federal funds sold and securities purchased under agreements to resell | | | 1 | | | | — | | | 33 | | | | | | | | | | | | Total Interest Income | | | 31,336 | | | | 31,856 | | | 31,444 | | | | | | | | | | | | INTEREST EXPENSE | | | | | | | | | | | Interest on deposits | | | 10,726 | | | | 11,532 | | | 11,430 | Interest on short-term borrowings | | | 112 | | | | 608 | | | 1,049 | Interest on long-term debt | | | 2,466 | | | | 2,750 | | | 2,860 | | | | | | | | | | | | Total Interest Expense | | | 13,304 | | | | 14,890 | | | 15,339 | | | | | | | | | | | | Net Interest Income | | | 18,032 | | | | 16,966 | | | 16,105 | PROVISION FOR LOAN AND LEASE LOSSES | | | 9,520 | | | | 1,230 | | | 925 | | | | | | | | | | | | Net Interest Income After Provision for Loan and Lease Losses | | | 8,512 | | | | 15,736 | | | 15,180 | | | | | | | | | | | | NONINTEREST INCOME | | | | | | | | | | | Trust department income | | | 243 | | | | 313 | | | 319 | Service charges on deposits | | | 1,479 | | | | 1,654 | | | 1,499 | Earnings from cash surrender value of life insurance | | | 280 | | | | 267 | | | 271 | Gain on life insurance proceeds | | | 158 | | | | — | | | — | Mortgage banking income | | | 124 | | | | 78 | | | 77 | Other income | | | 1,372 | | | | 1,370 | | | 1,315 | | | | | | | | | | | | Total Noninterest Income | | | 3,656 | | | | 3,682 | | | 3,481 | | | | | | | | | | | | NONINTEREST EXPENSE | | | | | | | | | | | Salaries and employee benefits | | | 8,173 | | | | 7,197 | | | 6,554 | Severance expense | | | — | | | | 478 | | | — | Occupancy expense, net | | | 844 | | | | 967 | | | 868 | Equipment expense | | | 1,170 | | | | 870 | | | 828 | Pennsylvania Bank Shares tax expense | | | 366 | | | | 315 | | | 329 | FDIC Assessment | | | 1,163 | | | | 116 | | | 43 | Legal and professional fees | | | 814 | | | | 769 | | | 562 | Director fees and benefits expense | | | 293 | | | | 354 | | | 322 | Marketing and advertising expense | | | 679 | | | | 525 | | | 403 | Computer expense | | | 435 | | | | 319 | | | 350 | Telephone expense | | | 302 | | | | 193 | | | 115 | Loss on sale/write-down of foreclosed assets | | | 110 | | | | 281 | | | — | Intangible amortization | | | 65 | | | | 66 | | | 66 | Other expenses | | | 2,257 | | | | 2,276 | | | 2,156 | | | | | | | | | | | | Total Noninterest Expense | | | 16,671 | | | | 14,726 | | | 12,596 | | | | | | | | | | | | (LOSS) INCOME BEFORE (BENEFIT FROM) PROVISION FOR | | | | | | | | | | | INCOME TAXES | | | (4,503 | ) | | | 4,692 | | | 6,065 | (Benefit from) provision for income taxes | | | (2,208 | ) | | | 1,104 | | | 1,394 | | | | | | | | | | | | NET (LOSS) INCOME | | | (2,295 | ) | | | 3,588 | | | 4,671 | Preferred stock dividends and discount accretion | | | 514 | | | | 16 | | | — | | | | | | | | | | | | NET (LOSS) INCOME AVAILABLE TO COMMON SHAREHOLDERS | | $ | (2,809 | ) | | $ | 3,572 | | $ | 4,671 | | | | | | | | | | | | | | | | PER COMMON SHARE DATA: | | | | | | | | | | | Basic (Loss) Earnings Per Common Share | | $ | (0.81 | ) | | $ | 1.03 | | $ | 1.34 | Diluted (Loss) Earnings Per Common Share | | | (0.81 | ) | | | 1.03 | | | 1.34 | Cash Dividends | | | 0.52 | | | | 0.80 | | | 0.80 |
45
MID PENN BANCORP, INC.Consolidated Statements of Income | | | | | | | | | | | | | | | | | | (Dollars in thousands, except per share data) | Years Ended December 31, | | 2012 | | 2011 | | 2010 | INTEREST INCOME | | | | | | | | | Interest & fees on loans and leases | $ | 27,233 | | $ | 28,038 | | $ | 27,397 | Interest on interest-bearing balances | | 236 | | | 520 | | | 818 | Interest and dividends on investment securities: | | | | | | | | | U.S. Treasury and government agencies | | 1,137 | | | 1,619 | | | 788 | State and political subdivision obligations, tax-exempt | | 1,722 | | | 1,329 | | | 1,108 | Other securities | | 22 | | | 14 | | | 12 | Interest on federal funds sold and securities purchased | | | | | | | | | under agreements to resell | | 16 | | | 25 | | | 25 | Total Interest Income | | 30,366 | | | 31,545 | | | 30,148 | INTEREST EXPENSE | | | | | | | | | Interest on deposits | | 6,147 | | | 8,509 | | | 9,319 | Interest on short-term borrowings | | 3 | | | 4 | | | 18 | Interest on long-term debt | | 975 | | | 1,009 | | | 1,305 | Total Interest Expense | | 7,125 | | | 9,522 | | | 10,642 | Net Interest Income | | 23,241 | | | 22,023 | | | 19,506 | PROVISION FOR LOAN AND LEASE LOSSES | | 1,036 | | | 1,205 | | | 2,635 | Net Interest Income After Provision for Loan and Lease Losses | | 22,205 | | | 20,818 | | | 16,871 | NONINTEREST INCOME | | | | | | | | | Income from fiduciary activities | | 575 | | | 539 | | | 431 | Service charges on deposits | | 565 | | | 704 | | | 1,139 | Net gain on sales of investment securities | | 267 | | | - | | | - | Earnings from cash surrender value of life insurance | | 247 | | | 258 | | | 270 | Mortgage banking income | | 675 | | | 390 | | | 423 | ATM debit card interchange income | | 472 | | | 452 | | | 408 | Other income | | 882 | | | 653 | | | 743 | Total Noninterest Income | | 3,683 | | | 2,996 | | | 3,414 | NONINTEREST EXPENSE | | | | | | | | | Salaries and employee benefits | | 10,518 | | | 9,519 | | | 8,760 | Occupancy expense, net | | 1,077 | | | 1,075 | | | 916 | Equipment expense | | 1,234 | | | 1,292 | | | 1,361 | Pennsylvania Bank Shares tax expense | | 462 | | | 449 | | | 443 | FDIC Assessment | | 1,034 | | | 1,057 | | | 897 | Legal and professional fees | | 604 | | | 444 | | | 529 | Director fees and benefits expense | | 335 | | | 304 | | | 303 | Marketing and advertising expense | | 378 | | | 354 | | | 308 | Computer expense | | 648 | | | 697 | | | 578 | Telephone expense | | 411 | | | 377 | | | 362 | Loss (gain) on sale/write-down of foreclosed assets | | 96 | | | (20) | | | 283 | Intangible amortization | | 45 | | | 65 | | | 65 | Loan collection costs | | 369 | | | 299 | | | 307 | Other expenses | | 2,482 | | | 2,136 | | | 2,009 | Total Noninterest Expense | | 19,693 | | | 18,048 | | | 17,121 | INCOME BEFORE PROVISION FOR INCOME TAXES | | 6,195 | | | 5,766 | | | 3,164 | Provision for income taxes | | 1,244 | | | 1,223 | | | 416 | NET INCOME | | 4,951 | | | 4,543 | | | 2,748 | Preferred stock dividends and discount accretion | | 514 | | | 514 | | | 514 | NET INCOME AVAILABLE TO COMMON SHAREHOLDERS | $ | 4,437 | | $ | 4,029 | | $ | 2,234 | | | | | | | | | | PER COMMON SHARE DATA: | | | | | | | | | Basic Earnings Per Common Share | $ | 1.27 | | $ | 1.16 | | $ | 0.64 | Diluted Earnings Per Common Share | | 1.27 | | | 1.16 | | | 0.64 | Cash Dividends | | 0.25 | | | 0.20 | | | - |
The accompanying notes are an integral part of these consolidated financial statements. 37
| | | MID PENN BANCORP, INC. | | Consolidated Statements of Changes in Shareholder’s Equity |
FOR YEARS ENDED DECEMBER 31, 2009, 2008 AND 2007MID PENN BANCORP, INC.Consolidated Statements of Comprehensive Income
| | | | | | | | | | | | | | | | | | | | | | | | | | | | | (Dollars in thousands, except share data) | | Preferred
Stock | | Common
Stock | | | Additional
Paid-in
Capital | | | Retained
Earnings | | | Accumulated
Other
Comprehensive
Income | | | Treasury
Stock | | | Total
Shareholder’s
Equity | | Balance, December 31, 2006 | | $ | 0 | | $ | 3,367 | | | $ | 27,452 | | | $ | 8,583 | | | $ | 317 | | | ($ | 634 | ) | | $ | 39,085 | | Comprehensive income: | | | | | | | | | | | | | | | | | | | | | | | | | | | | Net income | | | — | | | — | | | | — | | | | 4,671 | | | | — | | | | — | | | | 4,671 | | Change in net unrealized gain (loss) on securities available for sale, net of reclassification adjustment and tax effects | | | — | | | — | | | | — | | | | — | | | | 143 | | | | — | | | | 143 | | Defined benefit plans, net of tax effects | | | — | | | — | | | | — | | | | — | | | | (176 | ) | | | — | | | | (176 | ) | | | | | | | | | | | | | | | | | | | | | | | | | | | | | Total comprehensive income | | | | | | | | | | | | | | | | | | | | | | | | | | 4,638 | | | | | | | | | | | | | | | | | | | | | | | | | | | | | | Cash dividends ($0.80 per share) | | | — | | | — | | | | — | | | | (2,773 | ) | | | — | | | | — | | | | (2,773 | ) | Stock dividend 5% issued February 2007 | | | — | | | 166 | | | | 3,655 | | | | (3,821 | ) | | | — | | | | — | | | | — | | Purchase of treasury stock (20,668 shares) | | | — | | | — | | | | — | | | | — | | | | — | | | | (506 | ) | | | (506 | ) | | | | | | | | | | | | | | | | | | | | | | | | | | | | | Balance, December 31, 2007 | | | — | | | 3,533 | | | | 31,107 | | | | 6,660 | | | | 284 | | | | (1,140 | ) | | | 40,444 | | | | | | | | | | | | | | | | | | | | | | | | | | | | | | Cumulative effect adjustment of accounting principle adoption of ASC Topic 715 | | | — | | | — | | | | — | | | | (277 | ) | | | — | | | | — | | | | (277 | ) | | | | | | | | | | | | | | | | | | | | | | | | | | | | | Balance, January 1, 2008 | | | — | | | 3,533 | | | | 31,107 | | | | 6,383 | | | | 284 | | | | (1,140 | ) | | | 40,167 | | | | | | | | | | | | | | | | | | | | | | | | | | | | | | Comprehensive income: | | | | | | | | | | | | | | | | | | | | | | | | | | | | Net income | | | — | | | — | | | | — | | | | 3,588 | | | | — | | | | — | | | | 3,588 | | Change in net unrealized gain (loss) on securities available for sale, net of reclassification adjustment and tax effects | | | — | | | — | | | | — | | | | — | | | | 120 | | | | — | | | | 120 | | | | | | | | | | | | | | | | | | | | | | | | | | | | | | Total comprehensive income | | | | | | | | | | | | | | | | | | | | | | | | | | 3,708 | | | | | | | | | | | | | | | | | | | | | | | | | | | | | | Cash dividends ($0.80 per share) | | | | | | | | | | | | | | (2,787 | ) | | | | | | | | | | | (2,787 | ) | Issuance of preferred stock and warrants | | | 10,000 | | | — | | | | 70 | | | | — | | | | — | | | | — | | | | 10,070 | | Accrued preferred dividends | | | — | | | — | | | | — | | | | (16 | ) | | | — | | | | — | | | | (16 | ) | Purchase of treasury stock (9,854 shares) | | | — | | | — | | | | — | | | | — | | | | — | | | | (252 | ) | | | (252 | ) | Cancellation of treasury stock | | | — | | | (53 | ) | | | (1,339 | ) | | | — | | | | — | | | | 1,392 | | | | — | | | | | | | | | | | | | | | | | | | | | | | | | | | | | | Balance, December 31, 2008 | | | 10,000 | | | 3,480 | | | | 29,838 | | | | 7,168 | | | | 404 | | | | — | | | | 50,890 | | Comprehensive loss: | | | | | | | | | | | | | | | | | | | | | | | | | | | | Net loss | | | — | | | — | | | | — | | | | (2,295 | ) | | | — | | | | — | | | | (2,295 | ) | Change in net unrealized gain (loss) on securities available for sale, net of reclassification adjustment and tax effects | | | — | | | — | | | | — | | | | — | | | | 263 | | | | — | | | | 263 | | Defined benefit plans, net of tax effects | | | — | | | — | | | | — | | | | — | | | | 106 | | | | — | | | | 106 | | | | | | | | | | | | | | | | | | | | | | | | | | | | | | Total comprehensive loss | | | | | | | | | | | | | | | | | | | | | | | | | | (1,926 | ) | | | | | | | | | | | | | | | | | | | | | | | | | | | | | Cash dividends ($0.52 per share) | | | | | | | | | | | | | | (1,809 | ) | | | | | | | | | | | (1,809 | ) | Preferred dividends | | | — | | | — | | | | — | | | | (437 | ) | | | — | | | | — | | | | (437 | ) | Amortization of warrant cost | | | — | | | — | | | | (14 | ) | | | — | | | | — | | | | — | | | | (14 | ) | | | | | | | | | | | | | | | | | | | | | | | | | | | | | Balance, December 31, 2009 | | $ | 10,000 | | $ | 3,480 | | | $ | 29,824 | | | $ | 2,627 | | | $ | 773 | | | $ | 0 | | | $ | 46,704 | | | | | | | | | | | | | | | | | | | | | | | | | | | | | |
| | | | | | | | | | | | | | | | | | (Dollars in thousands) | December 31, | | 2012 | | 2011 | | 2010 | | | | | | | | | | Net income | $ | 4,951 | | $ | 4,543 | | $ | 2,748 | | | | | | | | | | Other comprehensive income (loss): | | | | | | | | | | | | | | | | | | Unrealized gains (losses) arising during the period | | | | | | | | | on available for sale securities, net of income taxes | | | | | | | | | of $291, $962, and $(330), respectively | | 565 | | | 1,867 | | | (641) | | | | | | | | | | Reclassification adjustment for net gain on sales of | | | | | | | | | available for sale securities included in net income, net | | | | | | | | | of income taxes of $(91), $0, and $0, respectively | | (176) | | | - | | | - | | | | | | | | | | Change in defined benefit plans, net of income taxes of | | | | | | | | | $(6), $6, and $(49), respectively | | (12) | | | 13 | | | (96) | | | | | | | | | | Total other comprehensive income (loss) | | 377 | | | 1,880 | | | (737) | | | | | | | | | | Total comprehensive income | $ | 5,328 | | $ | 6,423 | | $ | 2,011 |
The accompanying notes are an integral part of these consolidated financial statements. 38
| | | MID PENN BANCORP, INC. | | Consolidated Statements of Cash Flows |
| | | | | | | | | | | | | | (Dollars in thousands) | | Years Ended December 31, | | | | | 2009 | | | 2008 | | | 2007 | | Operating Activities: | | | | | | | | | | | | | Net (Loss) Income | | $ | (2,295 | ) | | $ | 3,588 | | | $ | 4,671 | | Adjustments to reconcile net (loss) income to net cash provided by operating activities: | | | | | | | | | | | | | Provision for loan and lease losses | | | 9,520 | | | | 1,230 | | | | 925 | | Depreciation | | | 1,115 | | | | 848 | | | | 809 | | Amortization of core deposit intangible | | | 37 | | | | 66 | | | | 56 | | Net accretion of security discounts | | | (212 | ) | | | (9 | ) | | | (25 | ) | Earnings on cash surrender value of life insurance | | | (280 | ) | | | (476 | ) | | | 193 | | Gain from life insurance proceeds | | | (158 | ) | | | — | | | | — | | Loss on disposal of property, plant, and equipment | | | 5 | | | | — | | | | — | | Loss on sale / write-down of foreclosed assets | | | 110 | | | | 281 | | | | 9 | | Deferred income tax benefit | | | (243 | ) | | | (160 | ) | | | (427 | ) | (Increase) decrease in accrued interest receivable | | | (34 | ) | | | 71 | | | | 4 | | Increase in other assets | | | (4,593 | ) | | | (828 | ) | | | (661 | ) | (Decrease) increase in accrued interest payable | | | (661 | ) | | | 421 | | | | 78 | | (Decrease) increase in other liabilities | | | (218 | ) | | | 805 | | | | (172 | ) | | | | | | | | | | | | | | Net Cash Provided By Operating Activities | | | 2,093 | | | | 5,837 | | | | 5,460 | | | | | | | | | | | | | | | Investing Activities: | | | | | | | | | | | | | Net decrease (increase) in interest-bearing balances | | | 11,472 | | | | (3,263 | ) | | | 108 | | Proceeds from the maturity of investment securities | | | 15,360 | | | | 18,420 | | | | 10,074 | | Purchases of investment securities | | | (9,354 | ) | | | (16,897 | ) | | | (6,645 | ) | Purchases of restricted investment in bank stock | | | (411 | ) | | | (3,618 | ) | | | — | | Net increase in loans and leases | | | (53,528 | ) | | | (59,546 | ) | | | (19,385 | ) | Purchases of bank premises and equipment | | | (2,647 | ) | | | (1,587 | ) | | | (1,885 | ) | Proceeds from sale of foreclosed assets | | | 1,190 | | | | 248 | | | | 137 | | Proceeds from cash surrender value of life insurance | | | 507 | | | | — | | | | — | | | | | | | | | | | | | | | Net Cash Used In Investing Activities | | | (37,411 | ) | | | (66,243 | ) | | | (17,596 | ) | | | | | | | | | | | | | | Financing Activities: | | | | | | | | | | | | | Net increase in demand deposits and savings accounts | | | 42,791 | | | | 17,962 | | | | 8,433 | | Net increase in time deposits | | | 20,400 | | | | 46,045 | | | | 158 | | Net (decrease) increase in short-term borrowings | | | (7,933 | ) | | | (13,372 | ) | | | 13,074 | | Issued senior preferred stock | | | — | | | | 10,000 | | | | — | | Preferred stock dividend paid | | | (453 | ) | | | — | | | | — | | Common stock dividend paid | | | (1,809 | ) | | | (2,787 | ) | | | (2,773 | ) | Long-term debt repayment | | | (17,166 | ) | | | (15,153 | ) | | | (5,132 | ) | Purchase of treasury stock | | | — | | | | (252 | ) | | | (506 | ) | Proceeds from long-term debt | | | — | | | | 15,795 | | | | — | | | | | | | | | | | | | | | Net Cash Provided By Financing Activities | | | 35,830 | | | | 58,238 | | | | 13,254 | | | | | | | | | | | | | | | Net increase (decrease) in cash and cash equivalents | | | 512 | | | | (2,168 | ) | | | 1,118 | | Cash and cash equivalents, beginning of period | | | 8,448 | | | | 10,616 | | | | 9,498 | | | | | | | | | | | | | | | Cash and cash equivalents, end of period | | $ | 8,960 | | | $ | 8,448 | | | $ | 10,616 | | | | | | | | | | | | | | |
39
| | | MID PENN BANCORP, INC. | | Consolidated Statements of Cash Flows |
| | | | | | | | | | | (Dollars in thousands) | | Years Ended December 31, | | | | 2009 | | 2008 | | 2007 | Supplemental Disclosures of Cash Flow Information: | | | | | | | | | | Interest paid | | $ | 13,965 | | $ | 14,469 | | $ | 15,261 | Income taxes paid | | $ | 50 | | $ | 1,720 | | $ | 1,930 | Supplemental Noncash Disclosures: | | | | | | | | | | Transfers to foreclosed assets held for sale | | $ | 447 | | $ | 1,556 | | $ | 529 | Warrants issued | | $ | — | | $ | 70 | | $ | — | Cancelled treasury stock | | $ | — | | $ | 1,392 | | $ | — | Preferred dividend accrued | | $ | — | | $ | 16 | | $ | — |
MID PENN BANCORP, INC.Consolidated Statements of Shareholders’ Equity | | | | | | | | | | | | | | | | | | | | | | | | | | | | | | | | | | | | (Dollars in thousands, except share data) | | | | | | | | | | | | | Accumulated | | | | | | | | | | | Additional | | | | | Other | | Total | | Preferred | | Common | | Paid-in | | Retained | | Comprehensive | | Shareholders' | | Stock | | Stock | | Capital | | Earnings | | Income | | Equity | Balance, December 31, 2009 | $ | 10,000 | | $ | 3,480 | | $ | 29,824 | | $ | 2,627 | | $ | 773 | | $ | 46,704 | Net income | | - | | | - | | | - | | | 2,748 | | | - | | | 2,748 | Total other comprehensive loss, net of taxes | | - | | | - | | | - | | | - | | | (737) | | | (737) | Preferred dividends | | - | | | - | | | - | | | (500) | | | - | | | (500) | Amortization of warrant cost | | - | | | - | | | (14) | | | - | | | - | | | (14) | Balance, December 31, 2010 | | 10,000 | | | 3,480 | | | 29,810 | | | 4,875 | | | 36 | | | 48,201 | Net income | | - | | | - | | | - | | | 4,543 | | | - | | | 4,543 | Total other comprehensive income, net of taxes | | - | | | - | | | - | | | - | | | 1,880 | | | 1,880 | Cash dividends | | - | | | - | | | - | | | (696) | | | - | | | (696) | Employee Stock Purchase Plan | | - | | | 4 | | | 34 | | | - | | | - | | | 38 | Preferred dividends | | - | | | - | | | - | | | (500) | | | - | | | (500) | Amortization of warrant cost | | - | | | - | | | (14) | | | - | | | - | | | (14) | Balance, December 31, 2011 | | 10,000 | | | 3,484 | | | 29,830 | | | 8,222 | | | 1,916 | | | 53,452 | Net income | | - | | | - | | | - | | | 4,951 | | | - | | | 4,951 | Total other comprehensive income, net of taxes | | - | | | - | | | - | | | - | | | 377 | | | 377 | Cash dividends | | - | | | - | | | - | | | (872) | | | - | | | (872) | Employee Stock Purchase Plan | | - | | | 6 | | | 50 | | | - | | | - | | | 56 | Series A Preferred stock redemption | | (10,000) | | | | | | | | | | | | | | | (10,000) | Series A Preferred dividends | | - | | | - | | | - | | | (560) | | | - | | | (560) | Series B Preferred stock issuance, net of costs | | 4,880 | | | | | | (50) | | | | | | | | | 4,830 | Amortization of warrant cost | | - | | | - | | | (14) | | | - | | | - | | | (14) | Balance, December 31, 2012 | $ | 4,880 | | $ | 3,490 | | $ | 29,816 | | $ | 11,741 | | $ | 2,293 | | $ | 52,220 |
The accompanying notes are an integral part of these consolidated financial statements.
MID PENN BANCORP, INC.Consolidated Statements of Cash Flows | | | | | | | | | | | | | | | | | | (Dollars in thousands) | Years Ended December 31, | | 2012 | | 2011 | | 2010 | Operating Activities: | | | | | | | | | Net Income | $ | 4,951 | | $ | 4,543 | | $ | 2,748 | Adjustments to reconcile net income to net cash | | | | | | | | | provided by operating activities: | | | | | | | | | Provision for loan and lease losses | | 1,036 | | | 1,205 | | | 2,635 | Depreciation | | 1,153 | | | 1,230 | | | 1,302 | (Accretion) amortization of intangibles | | (14) | | | 77 | | | 18 | Net amortization (accretion) of security premiums (discounts) | | 1,809 | | | (767) | | | 162 | Gain on sales of investment securities | | (267) | | | - | | | - | Earnings on cash surrender value of life insurance | | (247) | | | (258) | | | (270) | Loss on disposal of property, plant, and equipment | | 1 | | | 46 | | | 4 | Loss (gain) on sale / write-down of foreclosed assets | | 96 | | | (20) | | | 283 | Deferred income tax expense (benefit) | | 450 | | | (526) | | | (288) | Decrease (increase) in accrued interest receivable | | 174 | | | (435) | | | 149 | (Increase) decrease in other assets | | 424 | | | 3,006 | | | 887 | Decrease in accrued interest payable | | (444) | | | (47) | | | (639) | Increase in other liabilities | | 278 | | | 392 | | | 279 | Net Cash Provided By Operating Activities | | 9,400 | | | 8,446 | | | 7,270 | Investing Activities: | | | | | | | | | Net decrease (increase) in interest-bearing balances | | 3,914 | | | 27,564 | | | (16,437) | Proceeds from the maturity of investment securities | | 39,453 | | | 26,413 | | | 8,982 | Proceeds from the sale of investment securities | | 17,895 | | | - | | | - | Purchases of investment securities | | (53,553) | | | (111,157) | | | (33,472) | Redemptions of restricted investment in bank stock | | 617 | | | 708 | | | 201 | Net (increase) decrease in loans and leases | | (6,389) | | | (17,774) | | | 8,690 | Purchases of bank premises and equipment | | (995) | | | (1,415) | | | (1,587) | Proceeds from sale of bank premises and equipment | | 42 | | | - | | | - | Proceeds from sale of foreclosed assets | | 2,579 | | | 983 | | | 484 | Net Cash Provided By (Used In) Investing Activities | | 3,563 | | | (74,678) | | | (33,139) | Financing Activities: | | | | | | | | | Net increase in demand deposits and savings accounts | | 29,645 | | | 90,955 | | | 109,653 | Net decrease in time deposits | | (38,239) | | | (11,882) | | | (54,686) | Net decrease in short-term borrowings | | - | | | (1,561) | | | (14,483) | Series A preferred stock dividend paid | | (560) | | | (500) | | | (500) | Common stock dividend paid | | (872) | | | (696) | | | - | Series A preferred stock redemption | | (10,000) | | | - | | | - | Series B preferred stock issuance, net of costs | | 4,830 | | | - | | | - | Employee Stock Purchase Plan | | 56 | | | 38 | | | - | Long-term debt repayment | | (191) | | | (5,182) | | | (10,174) | Net Cash (Used In) Provided By Financing Activities | | (15,331) | | | 71,172 | | | 29,810 | Net (decrease) increase in cash and cash equivalents | | (2,368) | | | 4,940 | | | 3,941 | Cash and cash equivalents, beginning of year | | 17,841 | | | 12,901 | | | 8,960 | Cash and cash equivalents, end of year | $ | 15,473 | | $ | 17,841 | | $ | 12,901 |
| | | | | | | | | | | | | | | | | | Supplemental Disclosures of Cash Flow Information: | | | | | | | | | Interest paid | $ | 7,569 | | $ | 9,569 | | $ | 11,281 | Income taxes paid | $ | 1,700 | | $ | 940 | | $ | 510 | Supplemental Noncash Disclosures: | | | | | | | | | Loan transfers to foreclosed assets held for sale | $ | 2,587 | | $ | 1,298 | | $ | 700 |
The accompanying notes are an integral part of these consolidated financial statements.
MID PENN BANCORP, INC.Notes to Consolidated Financial Statements (1) Basis of Presentation 40
| | | MID PENN BANCORP, INC. | | Notes to Consolidated Financial Statements |
The accompanying consolidated financial statements include the accounts of Mid Penn Bancorp, Inc., Inc. and its wholly-owned subsidiaries Mid Penn Investment Corporation, Mid Penn Bank (“Bank”), Mid Penn Investment Corporation and the Bank’s wholly-owned subsidiary Mid Penn Insurance Services, LLC (collectively, “Mid Penn”). All material intercompany accounts and transactions have been eliminated in consolidation. For comparative purposes, the December 31, 20082011 and December 31, 20072010 balances have been reclassified to conform to the 20092012 presentation. Such reclassifications had no impact on net income. Mid Penn has evaluated events and transactions occurring subsequent to the balance sheet date of December 31, 2009,2012, for items that should potentially be recognized or disclosed in these consolidated financial statements. The evaluation was conducted through the date these consolidated financial statements were issued. (2) Nature of Business The Bank engages in a full-service commercial banking and trust business, making available to the community a wide range of financial services, including, but not limited to, installment loans, mortgage and home equity loans, secured and unsecured commercial and consumer loans, lines of credit, construction financing, farm loans, community development loans, loans to non-profit entities and local government loans and various types of time and demand deposits, including but not limited to, checking accounts, savings accounts, clubs, money market deposit accounts, certificates of deposit and IRAs. In addition, the Bank provides a full range of trust services through its Trust Department. Deposits are insured by the Federal Deposit Insurance Corporation (“FDIC”) to the extent provided by law. The financial services are provided to individuals, partnerships, non-profit organizations, and corporations through its fourteen offices located in Dauphin County, the southern portion of Northumberland County, the western portion of Schuylkill County and the eastern portion of Cumberland County. A decision was made to close the Mid Penn Investment Corporation, effective August 31, 2010 due to a lack of activity within the subsidiary. Mid Penn Insurance Services, LLC provides title insurance. Duewas revived in August of 2010 as a wholly-owned subsidiary of the Bank to the lackprovide a wide array of activity within this subsidiary, the decision was made to exit this line of business effective December 31, 2009. Mid Penn Investment Corporation is currently inactive.personal and commercial insurance products.
(3) | Summary of Significant Accounting Policies |
(3) Summary of Significant Accounting Policies The accounting and reporting policies of Mid Penn conform with accounting principles generally accepted in the United States of America (“GAAP”) and to general practice within the financial industry. The following is a description of the more significant accounting policies. The preparation of financial statements requires management to make estimates and assumptions that affect the reported amounts of assets and liabilities and disclosure of contingent assets and liabilities at the date of the financial statements and the reported amounts of revenues and expenses during the reporting periods. Actual results could differ from those estimates. Material estimates that are particularly susceptible to significant change relate to the determination of the allowance for loan and lease losses, the valuation of deferred tax assets, the assessment of other-than-temporary impairment of investment securities, and core deposit intangible and goodwill valuation, and the potential impairment of restricted stock.valuation. (b) | (b)Cash and Cash Equivalents |
For purposes of the consolidated statements of cash flows, cash and cash equivalents include cash on hand, balances due from banks, and federal funds sold, all of which mature within ninety days. Available for Sale Securities - includes debt and equity securities. Debt and equity securities are reported at fair value, with unrealized holding gains and losses excluded from earnings and reported, net of deferred income taxes, as a component of
MID PENN BANCORP, INC.Notes to Consolidated Financial Statements accumulated other comprehensive income (loss) within shareholders’ equity. Realized gains and losses on sales of investment securities are computed on the basis of specific identification of the cost of each security. Net gains on sales of investment securities were $267,000 in 2012, and $0 in 2011 and 2010. Mid Penn had no trading securities or held to maturity securities in 2009 or 2008.2012 and 2011. (d) | (c) | Loans and Allowance for Loan and Lease Losses |
Interest on loans is recognized on a method
Loans receivable that approximates a level yield basis overmanagement has the lifeintent and ability to hold for the foreseeable future or until maturity or payoff are stated at their outstanding unpaid principal balances, net of the loans. The accrual of interest on loans, including impaired loans, is generally discontinued when principalan allowance for loan losses and any deferred fees or interest has consistently been in default for a period of 90 days or more, or because of deterioration in the financial condition of the borrower, payment in full of principal or interest is not expected.costs. Interest income is subsequently recognized only to the extent cash payments are 41
| | | MID PENN BANCORP, INC. | | Notes to Consolidated Financial Statements |
received. The placement of a loanaccrued on the nonaccrual basis for revenue recognition does not necessarily imply a potential charge-off of loan principal.unpaid principal balance. Loan origination fees, andnet of certain direct origination costs, are capitalizeddeferred and recognized as an adjustment of the yield (interest income) of the related loans. These amounts are generally being amortized over the contractual life of the loan. Premiums and discounts on purchased loans are amortized as adjustments to interest income using the effective yield method.
The loan portfolio is segmented into commercial and consumer loans. Commercial loans consist of the following classes: commercial and industrial, commercial real estate, commercial real estate-construction and lease financing. Consumer loans consist of the following classes: residential mortgage loans, home equity loans and other consumer loans. For all classes of loans, the accrual of interest is discontinued when the contractual payment of principal or interest has become 90 days or more past due or management has serious doubts about further collectability of principal or interest, even though the loan is currently performing. A loan may remain on accrual status if it is in the process of collection and is either guaranteed or well secured. When a loan is placed on nonaccrual status, unpaid interest credited to income in the current year is reversed and unpaid interest accrued in prior years is charged against the allowance for loan and lease losses. Interest received on nonaccrual loans, including impaired loans, generally is either applied against principal or reported as interest income, according to management’s judgment as to the collectability of principal. Generally, loans are restored to accrual status when the obligation is brought current, has performed in accordance with the contractual terms for a reasonable period of time (generally six months) and the ultimate collectability of the total contractual principal and interest is no longer in doubt. The past due status of all classes of loans receivable is determined based on contractual due dates for loan payments. Commercial and industrial Mid Penn originates commercial and industrial loans. Most of the Bank’s commercial and industrial loans have been extended to finance local and regional businesses and include short-term loans to finance machinery and equipment purchases, inventory, and accounts receivable. Commercial loans also involve the extension of revolving credit for a combination of equipment acquisitions and working capital in expanding companies. The maximum term for loans extended on machinery and equipment is based on the relatedprojected useful life of such machinery and equipment. Generally, the maximum term on non-mortgage lines of credit is one year. The loan-to-value ratio on such loans and lines of credit generally may not exceed 80% of the value of the collateral securing the loan. The Bank’s commercial business lending policy includes credit file documentation and analysis of the borrower’s character, capacity to repay the loan, the adequacy of the borrower’s capital and collateral as well as an evaluation of conditions affecting the borrower. Analysis of the borrower’s past, present, and future cash flows is also an important aspect of the Bank’s current credit analysis. Nonetheless, such loans are believed to carry higher credit risk than more traditional investments. | (d) | Allowance for Loan and Lease Losses |
Commercial and industrial loans typically are made on the basis of the borrower’s ability to make repayment from the cash flow of the borrower’s business. As a result, the availability of funds for the repayment of commercial business loans may be substantially dependent on the success of the business itself, which, in turn, is likely to be dependent upon the general economic environment. Mid Penn’s commercial and industrial loans are usually, but not always, secured by business assets and personal guarantees. However, the collateral securing the loans may depreciate over time, may be difficult to appraise, and may fluctuate in value based on the success of the business. Commercial real estate and commercial real estate - construction Commercial real estate and commercial real estate construction loans generally present a higher level of risk than loans secured by one to four family residences. This greater risk is due to several factors, including the concentration of principal in a limited number of loans and borrowers, the effect of general economic conditions on income producing properties, and the increased difficulty of evaluating and monitoring these types of loans. In addition, the repayment of loans secured by commercial real estate is typically dependent upon the successful operation of the related real estate project. If the cash flow from the project is reduced, the borrower’s ability to repay the loan may be impaired.
MID PENN BANCORP, INC.Notes to Consolidated Financial Statements Lease financing Mid Penn originates leases for select commercial and state and municipal government lessees. The nature of the leased asset is often subject to rapid depreciation in salvage value over a relatively short time frame or may be of an industry specific nature, making appraisal or liquidation of the asset difficult. These factors have led the Bank to severely curtail the origination of new leases to state or municipal government agencies where default risk is extremely limited and to only the most credit-worthy commercial customers. These commercial customers are primarily leasing fleet vehicles for use in their primary line of business, mitigating some of the asset value concerns within the portfolio. Leasing has been a declining percentage of the Mid Penn’s portfolio since 2006, representing 0.27% of the portfolio at December 31, 2012. Residential mortgage Mid Penn offers a wide array of residential mortgage loans for both permanent structures and those under construction. The Bank’s methodologyresidential mortgage originations are secured primarily by properties located in its primary market and surrounding areas. Residential mortgage loans have terms up to a maximum of 30 years and with loan to value ratios up to 100% of the lesser of the appraised value of the security property or the contract price. Private mortgage insurance is generally required in an amount sufficient to reduce the Bank’s exposure to at or below the 85% loan to value level. Residential mortgage loans generally do not include prepayment penalties. In underwriting residential mortgage loans, the Bank evaluates both the borrower’s ability to make monthly payments and the value of the property securing the loan. Most properties securing real estate loans made by Mid Penn are appraised by independent fee appraisers. The Bank generally requires borrowers to obtain an attorney’s title opinion or title insurance and fire and property insurance (including flood insurance, if necessary) in an amount not less than the amount of the loan. Real estate loans originated by the Bank generally contain a “due on sale” clause allowing the Bank to declare the unpaid principal balance due and payable upon the sale of the security property. The Bank underwrites residential mortgage loans to the standards established by the secondary mortgage market, i.e., Fannie Mae, Ginnie Mae, Freddie Mac, or Pennsylvania Housing Finance Agency standards, with the intention of selling the majority of residential mortgages originated into the secondary market. In the event that the facts and circumstances surrounding a residential mortgage application do not meet all underwriting conditions of the secondary mortgage market, the Bank will evaluate the failed conditions and evaluate the potential risk of holding the residential mortgage in the Bank’s portfolio rather than rejecting the loan request. In the event that the loan is held in the Bank’s portfolio, the interest rate on the residential mortgage would be increased to compensate for determiningthe added portfolio risk. Consumer, including home equity Mid Penn offers a variety of secured consumer loans, including home equity, automobile, and deposit secured loans. In addition, the Bank offers other secured and unsecured consumer loans. Most consumer loans are originated in Mid Penn’s primary market and surrounding areas. The largest component of Mid Penn’s consumer loan portfolio consists of fixed rate home equity loans and variable rate home equity lines of credit. Substantially all home equity loans and lines of credit are secured by second mortgages on principal residences. The Bank will lend amounts, which, together with all prior leins, typically may be up to 85% of the appraised value of the property securing the loan. Home equity term loans may have maximum terms up to 20 years while home equity lines of credit generally have maximum terms of five years. Consumer loan terms vary according to the type and value of collateral, length of contract and creditworthiness of the borrower. The underwriting standards employed by the Bank for consumer loans include an application, a determination of the applicant’s payment history on other debts and an assessment of ability to meet existing obligations and payments on the proposed loan. Although creditworthiness of the applicant is a primary consideration, the underwriting process also includes a comparison of the value of the collateral, if any, in relation to the proposed loan amount. Consumer loans may entail greater credit risk than do residential mortgage loans, particularly in the case of consumer loans which are unsecured or are secured by rapidly depreciable assets, such as automobiles or recreational equipment. In such cases, any repossessed collateral for a defaulted consumer loan may not provide an adequate source of repayment of the outstanding loan balance. In addition, consumer loan collections are dependent on the borrower’s continuing financial stability, and thus are more likely to be affected by adverse personal circumstances. Furthermore, the application of various federal and state laws, including bankruptcy and insolvency laws, may limit the amount that can be recovered on such loans. The allowance for credit losses consists of the allowance for loan and lease losses employs both a quantitative and qualitative component.the reserve for unfunded lending commitments. The quantitative portion of the allowance represents the results of the evaluation on individual classified and nonaccrual loans. Potential credit problems are monitored to determine whether specific loans are impaired, with impairment normally measured by reference to borrowers’ collateral values and estimated cash flows. An allowance for the remainder of the loan and lease losses represents management’s estimate of losses inherent in the loan portfolio as of the balance sheet date and is recorded as a reduction to loans. The reserve for unfunded lending commitments
MID PENN BANCORP, INC.Notes to Consolidated Financial Statements represents management’s estimate of losses inherent in its unfunded loan commitments and is recorded in other liabilities on the consolidated balance sheet. The allowance for loan and lease losses is increased by the provision for loan and lease losses, and decreased by charge-offs, net of recoveries. Loans deemed to be uncollectible are charged against the allowance for loan and lease losses, and subsequent recoveries, if any, are credited to the allowance. All, or part, of the principal balance of loans are charged off to the allowance as soon as it is determined based on historical loss experience within certain componentsthat the repayment of all, or part, of the portfolio. These loss factors may be modifiedprincipal balance is highly unlikely. Non-residential consumer loans are generally charged off no later than 120 days past due on a contractual basis, earlier in the event of bankruptcy, or if current conditions indicate that loanthere is an amount deemed uncollectible. Because all identified losses may differ from historical experience. The qualitativeare immediately charged off, no portion of the allowance for loan and lease losses representsis restricted to any individual loan or groups of loans, and the resultsentire allowance is available to absorb any and all loan losses.
The allowance for credit losses is maintained at a level considered adequate to provide for losses that can be reasonably anticipated. Management performs a monthly evaluation of measuring potential lossesthe adequacy of the allowance. The allowance is based on Mid Penn’s past loan loss experience, known and inherent risks in the portfolio, adverse situations that may affect the borrower’s ability to repay, the estimated value of any underlying collateral, composition of the loan portfolio, current economic conditions and other relevant factors. This evaluation is inherently subjective as it requires material estimates that may be susceptible to significant revision as more information becomes available. The allowance consists of specific, general and unallocated components. The specific component relates to loans that are classified as impaired. For loans that are classified as impaired, an allowance is established when the discounted cash flows, collateral value, or observable market price of the impaired loan is lower than the carrying value of that loan. The general component covers pools of loans by loan class including commercial loans not identified in the quantitative allowance analysis. Thisconsidered impaired, as well as smaller balance homogeneous loans, such as residential real estate, home equity and other consumer loans. These pools of loans are evaluated for loss exposure based upon historical loss rates for each of these categories of loans, adjusted for qualitative portion is determined using risk factors that may not have yet manifested themselves in historical loan and lease loss experience.factors. These qualitative risk factors include changes in economic conditions, fluctuations in loan quality measures, changes in the experience of the lending staff and loan review systems, growth or changes in the mix of loans originated, and shifting industry or portfolio concentrations. Management believes
Each factor is assigned a value to reflect improving, stable or declining conditions based on management’s best judgment using relevant information available at the time of the evaluation. Adjustments to the factors are supported through documentation of changes in conditions in a narrative accompanying the allowance for loan loss calculation. Mid Penn considers a commercial loan (consisting of commercial and industrial, commercial real estate, commercial real estate-construction, and lease lossesfinancing loan classes) to be impaired when it becomes 90 days or more past due and not in the process of collection. This methodology assumes the borrower cannot or will not continue to make additional payments. At that time the loan would be considered collateral dependent as the discounted cash flow (“DCF”) method indicates no operating income is adequate. Identificationavailable for evaluating the collateral position; therefore, all impaired loans are deemed to be collateral dependent. In addition, Mid Penn’s rating system assumes any loans classified as sub-standard non-accrual to be impaired, and all of these loans are considered collateral dependent; therefore, all of Mid Penn’s impaired loans, whether reporting a specific lossesallocation or not, are considered collateral dependent. Mid Penn evaluates loans for charge-off on a monthly basis. Policies that govern the recommendation for charge-off are unique to the type of loan being considered. Commercial loans rated as nonaccrual or lower will first have a collateral evaluation completed in accordance with the guidance on impaired loans. Once the collateral evaluation has been completed, a specific allocation of allowance is made based upon the results of the evaluation. In the event the loan is unsecured, the loan would have been charged-off at the recognition of impairment. If the loan is secured, it will undergo a 90 day waiting period to ensure the collateral shortfall identified in the evaluation is accurate and then charged down by the specific allocation. Once the charge down is taken, the remaining balance remains a nonperforming loan with the original terms and interest rate intact (not restructured). Commercial loans secured by real estate rated as impaired will also have an ongoinginitial collateral evaluation completed in accordance with the guidance on impaired loans. An updated real estate valuation is ordered and the collateral evaluation is modified to reflect any variations in value. A specific allocation of allowance is made for any anticipated collateral shortfall and a 90 day waiting period begins to ensure the accuracy of the collateral shortfall. The loan is then charged down by the specific allocation. Once the charge down is taken, the remaining balance remains a nonperforming loan with the original terms and interest rate intact (not restructured). The process of charge-off for residential mortgage loans begins upon a loan becoming delinquent for 90 days and not in the process of collection. The existing appraisal is reviewed and a lien search is obtained to determine lien position and any instances of intervening liens. A new appraisal of the property will be ordered if deemed necessary by management and a collateral evaluation is completed. The loan will then be charged down to the value indicated in the evaluation. Consumer loans (including home equity loans and other consumer loans) are recommended for charge-off after reaching delinquency of 90 days and the loan is not in the process of collection. The entire balance of the consumer loan is recommended for charge-off at this point.
MID PENN BANCORP, INC.Notes to Consolidated Financial Statements As noted above, Mid Penn assesses a specific allocation for commercial loans prior to charging down or charging off the loan. Once the charge down is taken, the remaining balance remains a nonperforming loan with the original terms and interest rate intact (not restructured). In addition, Mid Penn takes a preemptive step when any commercial loan becomes classified under its internal classification system. A preliminary collateral evaluation in accordance with the guidance on impaired loans is prepared using currently available information. Specifically, monthly management meetingsthe existing collateral information in the loan file. This process allows Mid Penn to review “problem”both the credit and documentation files to determine the status of the information needed to make a collateral evaluation. This collateral evaluation is preliminary but allows Mid Penn to determine if any potential collateral shortfalls exist. It is Mid Penn’s policy to obtain updated third party valuations on all impaired loans collateralized by real estate within 30 days of the credit being classified as sub-standard non-accrual. Prior to receipt of the updated real estate valuation Mid Penn will use any existing real estate valuation to determine any potential allowance issues; however no allowance recommendation will be made until which time Mid Penn is in receipt of the updated valuation. The credit department employs an electronic tracking system to monitor the receipt of and need for updated appraisals. To date, there have been no significant time lapses noted with the above processes. In some instances Mid Penn is not holding real estate as collateral and is relying on business assets (personal property) for repayment. In these circumstances a collateral inspection is performed by Mid Penn personnel to determine an estimated value. The value is based on net book value, as provided by the financial statements, and discounted accordingly based on determinations made by management. Occasionally, Mid Penn will employ an outside service to provide a fair estimate of value based on auction sales or private sales. Management reviews the estimates of these third parties and discounts them accordingly based on management’s judgment, if deemed necessary. For impaired loans with no valuation allowance required, Mid Penn’s practice of obtaining independent third party market valuations on the subject property within 30 days of being placed on non-accrual status sometimes indicates that the loan to value ratio is sufficient to obviate the need for a specific allocation in spite of significant deterioration in real estate values in Mid Penn’s primary market area. These circumstances are determined on a case by case analysis of the impaired loans. Mid Penn actively monitors the values of collateral on impaired loans. This monitoring may require the modification of collateral values over time or changing circumstances by some factor, either positive or negative, from the original values. All collateral values will be assessed by management at least every 18 months for possible revaluation by an independent third party. Mid Penn does not currently, or plan in the future to, use automated valuation methodologies as a method of valuing real estate collateral. An unallocated component is maintained to cover uncertainties that could affect management’s estimate of probable losses. The unallocated component of the allowance reflects the margin of imprecision inherent in the underlying assumptions used in the methodologies for estimating specific and general losses in the portfolio. Large groups of smaller balance homogeneous loans are collectively evaluated for impairment. Accordingly, Mid Penn does not separately identify individual residential mortgage loans, home equity loans and leasesother consumer loans for impairment disclosures, unless such loans are utilizedthe subject of a troubled debt restructuring agreement. Loans whose terms are modified are classified as troubled debt restructurings if the borrowers have been granted concessions and it is deemed that those borrowers are experiencing financial difficulty. Concessions granted under a troubled debt restructuring generally involve a temporary reduction in interest rate or an extension of a loan’s stated maturity date. Non-accrual troubled debt restructurings are restored to determineaccrual status if principal and interest payments, under the modified terms, are current for six consecutive months after modification. Loans classified as troubled debt restructurings are designated as impaired. The allowance calculation methodology includes further segregation of loan classes into risk rating categories. The borrower’s overall financial condition, repayment sources, guarantors, and value of collateral, if appropriate, are evaluated annually for commercial loans or when credit deficiencies arise, such as delinquent loan payments. Credit quality risk ratings include regulatory classifications of special mention, substandard, doubtful, and loss. Loans criticized as special mention have potential weaknesses that deserve management’s close attention. If uncorrected, the potential weaknesses may result in deterioration of the repayment prospects. Loans classified substandard have a plan forwell-defined weakness or weaknesses that jeopardize the liquidation of the debt. They include loans that are inadequately protected by the current sound net worth and paying capacity of the obligor or of the collateral pledged, if any. Loans classified doubtful have all the weaknesses inherent in loans classified substandard with the added characteristic that collection or liquidation in full, on the basis of current conditions and if necessary,facts, is highly improbable. Loans classified as a recommendation to the Board of Directors for charge-off. Future additionsloss are considered uncollectible and are charged to the allowance for loan losses. Any loans not classified as noted above are rated pass.
MID PENN BANCORP, INC.Notes to Consolidated Financial Statements In addition, Federal and lease losses through a provision for loan and lease losses will be made based on identified changes in the above factors coupled with loss experience. VariousState regulatory agencies, as an integral part of their examination process, periodically review the Bank’s allowance for loan and lease losses. These agencieslosses and may require the Bank to recognize changesadditions to the allowance based on their judgmentjudgments about information available to them at the time of their examinations.examination, which may not be currently available to management. Based on management’s comprehensive analysis of the loan portfolio, management believes the current level of the allowance for loan losses is adequate.
(e) | (e) | Bank Premises and Equipment |
Land is carried at cost. Buildings, furniture, fixtures, equipment, land improvements, and leasehold improvements are stated at cost less accumulated depreciation. Depreciation is computed by the straight-line method over the estimated useful lives of the assets. Building assets are depreciated using an estimated useful life of five to fifty years. Furniture, fixtures, and equipment are depreciated using an estimated useful life of three to ten years. Land improvements are depreciated over an estimated useful life of ten to twenty years. Leasehold improvements are depreciated using an estimated useful life that is the lesser of the remaining life of the lease or ten to thirty years. ��Maintenance and normal repairs are charged to expense when incurred, while major additions and improvements are capitalized. Gains and losses on disposals are reflected in current operations. (f) | (f) | Restricted Investment in Federal Home Loan Bank Stock |
The Bank owns restricted stock investments in the Federal Home Loan Bank (“FHLB”). Federal law requires a member institution of the FHLB to hold stock according to a predetermined formula. The stock is carried at cost. In December 2008, the FHLB of Pittsburgh notified member banks that it was suspending dividend payments and the repurchase of capital stock; however, the dividend was reinstated in February 2012. Total dividends received in 2012 totaled $5,000. During 2012, the FHLB of Pittsburgh performed limited excess capital stock and as of December 31, 2009 has not changed its position.repurchases each calendar quarter. Any future capital stock repurchases will be made on a quarterly basis if conditions warrant such repurchases. Management evaluates the restricted stock for impairment on an annual basis. Management’s determination of whether these investments are impaired is based on their assessment of the ultimate recoverability of their cost rather than by recognizing temporary declines in value. The determination of whether a decline affects the ultimate recoverability of their cost is influenced by criteria such as (1) the significance of the decline in net assets of the FHLB as compared to the capital stock amount for the FHLB and the length of time this situation has persisted, (2) commitments by the FHLB to make payments required by law or regulation and the level of such payments in relation to the operating performance of the FHLB, and (3) the impact of legislative and regulatory changes on institutions and, accordingly, on the customer base of the FHLB. Management believes no impairment charge is necessary related to the FHLB restricted stock as of December 31, 2009.2012 and 2011. 42
(g) | | | MID PENN BANCORP, INC. | | Notes to Consolidated Financial Statements |
| (g) | Foreclosed Assets Held for Sale |
Foreclosed assets held for sale consist primarily of real estate acquired through, or in lieu of, foreclosure in settlement of debt and are recorded at fair value less cost to sell at the date of transfer, establishing a new cost basis. Any valuation adjustments required at the date of transfer are charged to the allowance for loan losses. Subsequent to acquisition, foreclosed assets are carried at fair value less costs of disposal, based upon periodic evaluations that consider changes in market conditions and development and disposal costs. Operating results from assets acquired in satisfaction of debt, including rental income less operating costs and gains or losses on the sale of, or the periodic evaluation of foreclosed assets, are recorded in noninterest expense. (h) | Mortgage Servicing Rights |
Mortgage servicing rights are recognized as assets upon the sale of a mortgage loan. A portion of the cost of the loan is allocated to the servicing right based upon relative fair value. The fair value of servicing rights is based on the present value of estimated future cash flows of mortgages sold stratified by rate and maturity date. Assumptions that are incorporated in the valuation of servicing rights include assumptions about prepayment speeds on mortgages and the cost to service loans. Servicing rights are reported in other intangibles and are amortized over the estimated period of future servicing income to be received on the underlying mortgage loans. The carrying amount of mortgage servicing rights was $233,000 and $173,000 at December 31, 2012 and 2011, respectively. Amortization expense is netted against loan servicing fee income and is reflected in the Consolidated Statements of Income in mortgage banking income. Servicing rights are evaluated for impairment based upon estimated fair value as compared to unamortized book value.
MID PENN BANCORP, INC.Notes to Consolidated Financial Statements (i) | (h) | Investment in Limited Partnership |
Mid Penn invested as a limited partner in a partnership in September 2008 that provides low-income housing in Enola, Pennsylvania. The carrying value of Mid Penn’s investment in the limited partnership was $656,000$496,000 at December 31, 20092012 using the equitystraight-line method. Mid Penn’s maximum exposure to loss is limited to the carrying value of its investment at year-end. The project was not completed at year-end; therefore, there were no low income housing tax credits available as of December 31, 2009. The partnership anticipates receiving $76,000 annually in low-income housing tax credits once the project is complete.credits. Certain items of income and expense are recognized in different accounting periods for financial reporting purposes than for income tax purposes. Deferred income tax assets and liabilities are provided in recognition of these temporary differences at currently enacted income tax rates. As changes in tax laws or rates are enacted, deferred income tax assets and liabilities are adjusted through the provision for income taxes. Mid Penn recognizes interest and/or penalties related to income tax matters in income tax expense. (k) | (j) | Core Deposit Intangible |
Core deposit intangible is a measure of the value of consumer demand and savings deposits acquired in business combinations accounted for as purchases. The core deposit intangible is being amortized over an 8-year life on a straight-line basis. The core deposit intangible is subject to impairment testing whenever events or changes in circumstances indicate its carrying amount may not reflect benefit. Goodwill is the excess of the purchase price over the fair value of assets acquired in connection with 2004 and 2006 business acquisitions accounted for as purchases. Accounting Standards codificationCodification (“ASC”) Topic 350,Intangibles, Goodwill and Other requires a two-step process for testing the impairment of goodwill on at least an annual basis. NoIn 2010, Mid Penn changed the valuation methodology for evaluating goodwill impairment from using an internally prepared analysis based on Mid Penn’s stock price, to obtaining an independent valuation by a third party. This change in methodology did not have any effect on the results of operations of Mid Penn. Mid Penn did not identify any impairment on its outstanding goodwill from its most recent testing, which was recognizedperformed as of December 31, 2012. In addition, Mid Penn did not identify any impairment in 2009, 20082011 or 2007.2010. (m) | (l) | Bank Owned Life Insurance |
Mid Penn is the owner and beneficiary of bank owned life insurance (“BOLI”) policies on current and former directors. The earnings from the BOLI policies are an asset that can be liquidated, if necessary, with associated tax costs. However, Mid Penn intends to hold these policies and, accordingly, Mid Penn has not provided deferred income taxes on the earnings from the increase in cash surrender value. GAAP requires Split-Dollar Life Insurance Arrangements to have a liability recognized related to the postretirement benefits covered by an endorsement split-dollar life insurance arrangement, and a liability for the future death benefit. Mid Penn recorded a cumulative effect adjustment to the balance of retained earnings of $277,000, as of January 1, 2008. (n) | (m)
| Marketing and Advertising Costs |
Marketing and advertising costs are expensed as incurred and were $679,000 in 2009, $525,000 in 2008, and $403,000 in 2007.incurred. (o) | (n) | Postretirement Benefit Plans |
Mid Penn follows the guidance in ASC Topic 715,Compensation-Retirement Benefitsrelated to postretirement benefit plans. This guidance requires additional disclosures about defined benefit pension plans and other postretirement defined benefit plans. 43
(p) | | | MID PENN BANCORP, INC. | | Notes to Consolidated Financial Statements |
A funded contributory defined-contribution plan is maintained for substantially all employees. The cost of the Mid Penn defined contribution plan is charged to current operating expenses and is funded annually.
MID PENN BANCORP, INC.Notes to Consolidated Financial Statements (q) | (p) | Trust Assets and Income |
Assets held by the Bank in a fiduciary or agency capacity for customers of the Trust Department are not included in the consolidated financial statements since such items are not assets of the Bank. Trust income is recognized on the cash basis, which is not materially different than if it were reported on the accrual basis. (r) | (q) | (Loss) Earnings Per Share |
(Loss)
Earnings per share isare computed by dividing net (loss) income by the weighted average number of common shares outstanding during each of the years presented. The following data show the amounts used in computing basic and diluted (loss) earnings per share. As shown in the table that follows, diluted (loss) earnings per share is computed using weighted average common shares outstanding, plus weighted average common shares available from the exercise of all dilutive stock warrants issued to the U.S. Treasury under the provisions of the Capital Purchase Program, based on the average share price of Mid Penn’s common stock during the period. The computations of basic (loss) earnings per common share follow: | | | | | | | | | | | | | (Dollars in thousands, except per share data) | | | | | | | | | | | | 2009 | | | 2008 | | | 2007 | Net (Loss) Income | | $ | (2,295 | ) | | $ | 3,588 | | | $ | 4,671 | Less: Dividends on preferred stock | | | (500 | ) | | | (16 | ) | | | — | Accretion of preferred stock discount | | | (14 | ) | | | — | | | | — | | | | | | | | | | | | | Net (loss) income available to common stockholders | | $ | (2,809 | ) | | $ | 3,572 | | | $ | 4,671 | | | | | Weighted average common shares outstanding | | | 3,479,780 | | | | 3,483,097 | | | | 3,497,806 | Basic (loss) earnings per common share | | $ | (0.81 | ) | | $ | 1.03 | | | $ | 1.34 |
| | | | | | | | | (Dollars in thousands, except per share data) | | | | | | | | | | 2012 | | 2011 | | 2010 | Net Income | $ | 4,951 | | $ | 4,543 | | $ | 2,748 | Less: Dividends on preferred stock | | (500) | | | (500) | | | (500) | Accretion of preferred stock discount | | (14) | | | (14) | | | (14) | Net income available to common shareholders | $ | 4,437 | | $ | 4,029 | | $ | 2,234 | | | | | | | | | | Weighted average common shares outstanding | | 3,486,543 | | | 3,481,414 | | | 3,479,780 | Basic earnings per common share | $ | 1.27 | | $ | 1.16 | | $ | 0.64 |
The computations of diluted (loss) earnings per common share follow: | | | | | | | | | | | | | | | | (Dollars in thousands, except per share data) | | | | | | | | | | | | | | | | | | 2009 | | 2008 | | 2007 | 2012 | | 2011 | | 2010 | Net (loss) income available to common stockholders | | $ | (2,809 | ) | | $ | 3,572 | | $ | 4,671 | | Net income available to common stockholders | | $ | 4,437 | | $ | 4,029 | | $ | 2,234 | Weighted average number of common shares outstanding | | | 3,479,780 | | | | 3,483,097 | | | 3,497,806 | | 3,486,543 | | | 3,481,414 | | | 3,479,780 | Dilutive effect of potential common stock arising from stock warrants: | | | | | | | | | | | | | | | Exercise of outstanding stock warrants issued to U.S. Treasury under the Capital Repurchase Program | | | — | | | | 56 | | | — | | | | | | | | | | | Exercise of outstanding stock warrants issued to U.S. Treasury | | | | | | | | | | under the Capital Repurchase Program | | | - | | | - | | | - | Adjusted weighted-average common shares outstanding | | | 3,479,780 | | | | 3,483,153 | | | 3,497,806 | | 3,486,543 | | | 3,481,414 | | | 3,479,780 | Diluted (loss) earnings per common share | | $ | (0.81 | ) | | $ | 1.03 | | $ | 1.34 | | Diluted earnings per common share | | $ | 1.27 | | $ | 1.16 | | $ | 0.64 |
As of December 31, 2009,2012, 2011, and 2010 Mid Penn had 73,099 warrants that were anti-dilutive because the fair value of the common stock was below the $20.52 exercise price of these warrants. 44
| | | MID PENN BANCORP, INC. | | Notes to Consolidated Financial Statements |
57
MID PENN BANCORP, INC.Notes to Consolidated Financial Statements (4)Accumulated Other Comprehensive Income | Comprehensive Income (Loss) |
GAAP requires that recognized revenue, expenses, gains, and losses be included in net (loss) income. Changes in certain assets and liabilities such as unrealized gains on securities available for sale and the liability associated with defined benefit plans, are reported as a separate component of the shareholders’ equity section of the balance sheet. Such items, along with net (loss) income, are components of comprehensive income (loss). The components of other comprehensive income (loss), and the related tax effects, are as follows:
| | | | | | | | | | | | | | (Dollars in thousands) | | Years Ended December 31, | | | | | 2009 | | | 2008 | | | 2007 | | Change in unrealized holding gains on available for sale securities | | $ | 400 | | | $ | 191 | | | $ | 217 | | Less reclassification adjustment for gains realized in income | | | — | | | | (9 | ) | | | — | | | | | | | | | | | | | | | Net unrealized gains | | | 400 | | | | 182 | | | | 217 | | | | | | | | | | | | | | | | | | | Change in defined benefit plans | | | 161 | | | | — | | | | (266 | ) | | | | | | | | | | | | | | Other comprehensive income (loss) | | | 561 | | | | 182 | | | | (49 | ) | Income tax benefit (expense) | | | (192 | ) | | | (62 | ) | | | 16 | | | | | | | | | | | | | | | Net of tax amount | | $ | 369 | | | $ | 120 | | | $ | (33 | ) | | | | | | | | | | | | | |
The components of accumulated other comprehensive income, net of taxes, are as follows: | | | | | | | | | | | | (Dollars in thousands) | | Unrealized Gain
on Securities | | Defined Benefit
Plan Liability | | | Accumulated
Other
Comprehensive
Income | Balance - December 31, 2007 | | $ | 434 | | $ | (150 | ) | | $ | 284 | | | | | | | | | | | | | | | | Balance - December 31, 2008 | | $ | 554 | | $ | (150 | ) | | $ | 404 | | | | | | | | | | | | | | | | Balance - December 31, 2009 | | $ | 817 | | $ | (44 | ) | | $ | 773 | | | | | | | | | | | |
(5) | Restrictions on Cash and Due from Bank Accounts |
| | | | | | | | | | | | | | | | | | (Dollars in thousands) | Unrealized Gain on Securities | | Defined Benefit Plan Liability | | Accumulated Other Comprehensive Income | | | | | | | | | | Balance - December 31, 2011 | $ | 2,044 | | $ | (128) | | $ | 1,916 | | | | | | | | | | Balance - December 31, 2012 | $ | 2,433 | | $ | (140) | | $ | 2,293 |
(5) Restrictions on Cash and Due from Bank Accounts The Bank is required to maintain reserve balances with the Federal Reserve Bank of Philadelphia. The amounts of those required reserve balances were $163,000$554,000 at December 31, 2009,2012, and $182,000$254,000 at December 31, 2008.2011. (6) Investment Securities Securities to be held for indefinite periods, but not intended to be held to maturity, are classified as available for sale and carried at fair value. Securities held for indefinite periods include securities that management intends to use as part of its asset and liability management strategy and that may be sold in response to liquidity needs, changes in interest rates, resultant prepayment risk, and other factors related to interest rate and resultant prepayment risk changes. Realized gains and losses on dispositions are based on the net proceeds and the adjusted book value of the securities sold, using the specific identification method. Unrealized gains and losses on investment securities available for sale are based on the difference between book value and fair value of each security. These gains and losses are credited or charged to other comprehensive income, whereas realized gains and losses flow through the Corporation’s results of operations. ASC Topic 320, “InvestmentsInvestments – Debt and Equity Securities”Securities, clarifies the interaction of the factors that should be considered when determining whether a debt security is other-than-temporarily impaired. For debt securities, management must assess whether (a) it has the intent to sell the security and (b) it is more likely than not that it will be required to sell the security prior to its anticipated recovery. These steps are done before assessing whether the entity will recover the cost basis of the investment. Previously, this assessment required management to assert it has both the intent and the ability to hold a security for a period of time sufficient to allow for an anticipated recovery in fair value to avoid recognizing other-than-temporary impairment. This change does not affect the need to forecast recovery of the value of the security through either cash flows or market price. 45
| | | MID PENN BANCORP, INC. | | Notes to Consolidated Financial Statements |
In instances when a determination is made that other-than-temporary impairment exists but the investor does not intend to sell the debt security and it is not more likely than not that it will be required to sell the debt security prior to its anticipated recovery, this guidance changes the presentation and amount of the other-than-temporary impairment recognized in the income statement. The other-than-temporary impairment is separated into (a) the amount of the total other-than-temporary impairment related to a decrease in cash flows expected to be collected from the debt security (the credit loss) and (b) the amount of the total other-than-temporary impairment related to all other factors. The amount of the total other-than-temporary impairment related to the credit loss is recognized in earnings. The amount of the total other-than-temporary impairment related to all other factors is recognized in other comprehensive income.
MID PENN BANCORP, INC.Notes to Consolidated Financial Statements At December 31, 20092012 and 2008,2011, amortized cost, fair value, and unrealized gains and losses on investment securities are as follows: | | | | | | | | | | | | | | (Dollars in thousands) | | | | | | | | | | | | Amortized
Cost | | Unrealized
Gains | | Unrealized
Losses | | Fair
Value | December 31, 2009 | | | | | | | | | | | | | Available for sale securities: | | | | | | | | | | | | | U.S. Treasury and U.S. government agencies | | $ | 15,291 | | $ | 409 | | $ | — | | $ | 15,700 | Mortgage-backed U.S. government agencies | | | 4,522 | | | 97 | | | — | | | 4,619 | State and political subdivision obligations | | | 26,044 | | | 828 | | | 91 | | | 26,781 | Equity securities | | | 250 | | | — | | | 5 | | | 245 | | | | | | | | | | | | | | | | $ | 46,107 | | $ | 1,334 | | $ | 96 | | $ | 47,345 | | | | | | | | | | | | | | | | | | | | (Dollars in thousands) | | | | | | | | | | | | Amortized
Cost | | Unrealized
Gains | | Unrealized
Losses | | Fair
Value | December 31, 2008 | | | | | | | | | | | | | Available for sale securities: | | | | | | | | | | | | | U.S. Treasury and U.S. government agencies | | $ | 22,347 | | $ | 739 | | $ | — | | $ | 23,086 | Mortgage-backed U.S. government agencies | | | 4,153 | | | 26 | | | 6 | | | 4,173 | State and political subdivision obligations | | | 25,150 | | | 567 | | | 473 | | | 25,244 | Equity securities | | | 250 | | | — | | | 14 | | | 236 | | | | | | | | | | | | | | | | $ | 51,900 | | $ | 1,332 | | $ | 493 | | $ | 52,739 | | | | | | | | | | | | | |
| | | | | | | | | | | | (Dollars in thousands) | | | | | | | | | | | | | Amortized | | Unrealized | | Unrealized | | Fair | | Cost | | Gains | | Losses | | Value | December 31, 2012 | | | | | | | | | | | | Available for sale securities: | | | | | | | | | | | | U.S. Treasury and U.S. government agencies | $ | 16,394 | | $ | 1,346 | | $ | - | | $ | 17,740 | Mortgage-backed U.S. government agencies | | 66,783 | | | 393 | | | 490 | | | 66,686 | State and political subdivision obligations | | 67,033 | | | 2,542 | | | 96 | | | 69,479 | Equity securities | | 400 | | | - | | | 10 | | | 390 | | $ | 150,610 | | $ | 4,281 | | $ | 596 | | $ | 154,295 |
| | | | | | | | | | | | (Dollars in thousands) | | | | | | | | | | | | | Amortized | | Unrealized | | Unrealized | | Fair | | Cost | | Gains | | Losses | | Value | December 31, 2011 | | | | | | | | | | | | Available for sale securities: | | | | | | | | | | | | U.S. Treasury and U.S. government agencies | $ | 26,116 | | $ | 1,501 | | $ | - | | $ | 27,617 | Mortgage-backed U.S. government agencies | | 82,777 | | | 491 | | | 600 | | | 82,668 | State and political subdivision obligations | | 46,654 | | | 1,836 | | | 124 | | | 48,366 | Equity securities | | 400 | | | - | | | 8 | | | 392 | | $ | 155,947 | | $ | 3,828 | | $ | 732 | | $ | 159,043 |
Estimated fair values of debt securities are based on quoted market prices, where applicable. If quoted market prices are not available, fair values are based on quoted market prices of comparable instruments, adjusted for differences between the quoted instruments and the instruments being valued. Included in equity securities is an investment in Access Capital Strategies, an equity fund that invests in low to moderate income financing projects. This initial investment was purchased in 2004 to help fulfill the Bank’s regulatory requirement of the Community Reinvestment Act and atan additional investment was purchased in 2011. At December 31, 2008,2012 and December 31, 2009,2011, the investment is reported at fair value. Investment securities having a fair value of $37,434,000$96,124,000 at December 31, 2009,2012, and $41,847,000$85,591,000 at December 31, 2008,2011, were pledged to secure public deposits and other borrowings. 46
| | | MID PENN BANCORP, INC. | | Notes to Consolidated Financial Statements |
MID PENN BANCORP, INC.Notes to Consolidated Financial Statements The following table presents gross unrealized losses and fair value of investments aggregated by investment category and length of time that individual securities have been in a continuous unrealized loss position at December 31, 20092012 and 2008.2011. | | | | | | | | | | | | | | | | | | | | (Dollars in thousands) | | Less Than 12 Months | | 12 Months or More | | Total | | December 31, 2009 | | Fair | | Unrealized | | Fair | | Unrealized | | Fair | | Unrealized | | | | Value | | Losses | | Value | | Losses | | Value | | Losses | Available for sale securities: | | | | | | | | | | | | | | | | | | | U.S. Treasury and U.S. government agencies | | $ | — | | $ | — | | $ | — | | $ | — | | $ | — | | $ | — | Mortgage-backed U.S. government agencies | | | — | | | — | | | — | | | — | | | — | | | — | State and political subdivision obligations | | | 4,321 | | | 91 | | | — | | | — | | | 4,321 | | | 91 | Equity securities | | | — | | | — | | | 245 | | | 5 | | | 245 | | | 5 | | | | | | | | | | | | | | | | | | | | Total temporarily impaired available for sale securities | | $ | 4,321 | | $ | 91 | | $ | 245 | | $ | 5 | | $ | 4,566 | | $ | 96 | | | | | | | | | | | | | | | | | | | | | | | | | (Dollars in thousands) | | Less Than 12 Months | | 12 Months or More | | Total | | December 31, 2008 | | Fair | | Unrealized | | Fair | | Unrealized | | Fair | | Unrealized | | | | Value | | Losses | | Value | | Losses | | Value | | Losses | Available for sale securities: | | | | | | | | | | | | | | | | | | | U.S. Treasury and U.S. government agencies | | $ | — | | $ | — | | $ | — | | $ | — | | $ | — | | $ | — | Mortgage-backed U.S. government agencies | | | 1,400 | | | 6 | | | — | | | — | | | 1,400 | | | 6 | State and political subdivision obligations | | | 5,520 | | | 293 | | | 2,098 | | | 180 | | | 7,618 | | | 473 | Equity securities | | | — | | | — | | | 236 | | | 14 | | | 236 | | | 14 | | | | | | | | | | | | | | | | | | | | Total temporarily impaired available for sale securities | | $ | 6,920 | | $ | 299 | | $ | 2,334 | | $ | 194 | | $ | 9,254 | | $ | 493 | | | | | | | | | | | | | | | | | | | |
| | | | | | | | | | | | | | | | | | | | | | | | | | | | | | | | | | | | (Dollars in thousands) | Less Than 12 Months | | 12 Months or More | | Total | December 31, 2012 | Fair | | Unrealized | | Fair | | Unrealized | | Fair | | Unrealized | | Value | | Losses | | Value | | Losses | | Value | | Losses | Available for sale securities: | | | | | | | | | | | | | | | | | | Mortgage-backed U.S. government agencies | $ | 30,345 | | $ | 270 | | $ | 15,839 | | $ | 220 | | $ | 46,184 | | $ | 490 | State and political subdivision obligations | | 9,389 | | | 66 | | | 1,231 | | | 30 | | | 10,620 | | | 96 | Equity securities | | - | | | - | | | 390 | | | 10 | | | 390 | | | 10 | Total temporarily impaired | | | | | | | | | | | | | | | | | | available for sale securities | $ | 39,734 | | $ | 336 | | $ | 17,460 | | $ | 260 | | $ | 57,194 | | $ | 596 |
| | | | | | | | | | | | | | | | | | | | | | | | | | | | | | | | | | | | (Dollars in thousands) | Less Than 12 Months | | 12 Months or More | | Total | December 31, 2011 | Fair | | Unrealized | | Fair | | Unrealized | | Fair | | Unrealized | | Value | | Losses | | Value | | Losses | | Value | | Losses | Available for sale securities: | | | | | | | | | | | | | | | | | | Mortgage-backed U.S. government agencies | $ | 46,497 | | $ | 593 | | $ | 370 | | $ | 7 | | $ | 46,867 | | $ | 600 | State and political subdivision obligations | | 4,371 | | | 49 | | | 1,169 | | | 75 | | | 5,540 | | | 124 | Equity securities | | - | | | - | | | 392 | | | 8 | | | 392 | | | 8 | Total temporarily impaired | | | | | | | | | | | | | | | | | | available for sale securities | $ | 50,868 | | $ | 642 | | $ | 1,931 | | $ | 90 | | $ | 52,799 | | $ | 732 |
Management evaluates securities for other-than-temporary impairment at least on a quarterly basis; and more frequently when economic or market concerns warrant such evaluation. Consideration is given to the length of time and the extent to which the fair value has been less than cost, and the financial condition and near term prospects of the issuer. In addition, for debt securities, the Corporation considers (a) whether management has the intent to sell the security, (b) it is more likely than not that management will be required to sell the security prior to its anticipated recovery, and (c) whether management expects to recover the entire amortized cost basis. For equity securities, management considers the intent and ability to hold securities until recovery of unrealized losses. At December 31, 2009,2012, Mid Penn had 873 debt securities with unrealized losses. These securities have depreciated 2.07%1.03% from their amortized cost basis. At December 31, 2008, 212011, 45 debt securities with unrealized losses had depreciated 5.05%1.37% from the amortized cost basis. These securities are issued by either the U.S. Government or other governmental agencies. These unrealized losses were determined principally by reference to current interest rates for similar types of securities. In analyzing an issuer’sissuer's financial condition, management considers whether the U.S. Government or its agencies issued the securities, whether downgrades by bond rating agencies have occurred, and the results of reviews of the issuer’sissuer's financial condition. Based on the above conditions management has determined that no declines are deemed to be other-than-temporary. The table below is the maturity distribution of investment securities at amortized cost and fair value at December 31, 20092012 and 2008:2011: | | | | | | | | | | | | | | | | | | | | | | | | | | | | | | | | | (Dollars in thousands) | | December 31, 2009 | | December 31, 2008 | December 31, 2012 | | December 31, 2011 | | | Amortized | | Fair | | Amortized | | Fair | | | | Amortized
Cost | | Fair
Value | | Amortized
Cost | | Fair
Value | Cost | | Value | | Cost | | Value | Due in 1 year or less | | $ | 1,022 | | $ | 1,026 | | $ | 11,643 | | $ | 11,671 | $ | 325 | | $ | 326 | | $ | 2,563 | | $ | 2,576 | Due after 1 year but within 5 years | | | 11,878 | | | 12,121 | | | 9,053 | | | 9,378 | | 21,690 | | | 23,349 | | | 23,923 | | | 24,856 | Due after 5 years but within 10 years | | | 17,662 | | | 18,417 | | | 18,106 | | | 18,929 | | 26,208 | | | 27,282 | | | 17,626 | | | 18,979 | Due after 10 years | | | 10,773 | | | 10,917 | | | 8,696 | | | 8,352 | | 35,204 | | | 36,262 | | | 28,658 | | | 29,572 | | | | | | | | | | | 83,427 | | | 87,219 | | | 72,770 | | | 75,983 | | | | 41,335 | | | 42,481 | | | 47,498 | | | 48,330 | | | | | | | | | | | | Mortgage-backed securities (avg. life 2.6 years) | | | 4,522 | | | 4,619 | | | 4,154 | | | 4,173 | | Mortgage-backed securities | | | 66,783 | | | 66,686 | | | 82,777 | | | 82,668 | Equity securities | | | 250 | | | 245 | | | 250 | | | 236 | | 400 | | | 390 | | | 400 | | | 392 | | | | | | | | | | $ | 150,610 | | $ | 154,295 | | $ | 155,947 | | $ | 159,043 | | | $ | 46,107 | | $ | 47,345 | | $ | 51,902 | | $ | 52,739 | | | | | | | | | | | |
47
| | | MID PENN BANCORP, INC. | | Notes to Consolidated Financial Statements |
A summary of loansMortgage-backed securities at December 31, 2009 and 2008 is as follows:2012, had an average life of 2.5 years compared to an average life of 2.3 years at December 31, 2011.
MID PENN BANCORP, INC.Notes to Consolidated Financial Statements | | | | | | | | (Dollars in thousands) | | 2009 | | 2008 | Commercial real estate, construction and land development | | $ | 253,878 | | $ | 234,762 | Commercial, industrial and agricultural | | | 85,795 | | | 71,385 | Real estate - residential | | | 128,522 | | | 118,547 | Consumer | | | 12,190 | | | 9,949 | | | | | | | | | | $ | 480,385 | | $ | 434,643 | | | | | | | |
Net unamortized loan fees(7) Loans and costs of $504,000 in 2009Allowance for Loan and $303,000 in 2008 were deducted from loans.Lease Losses
The Bank has granted loans to certain of its executive officers, directors, and their related interests. These loans were made on substantially the same basis, including interest rates and collateral as those prevailing for comparable transactions with other borrowers at the same time. The aggregate amount of these loans was $6,244,000$4,817,000 and $1,449,000$6,791,000 at December 31, 20092012 and 2008,2011, respectively. During 2009, $12,713,0002012, $10,023,000 of new loans and advances were extended and repayments totaled $7,918,000.$11,848,000. $149,000 of loans are no longer considered related parties as of December 31, 2012. None of these loans were past due, in non-accrual status, or restructured at December 31, 2009.2012. (8) | Allowance for Loan and Lease Losses |
The classes of the loan portfolio, summarized by the aggregate pass rating and the classified ratings of special mention, substandard, and doubtful within Mid Penn’s internal risk rating system as of December 31, 2012 and 2011 are as follows: | | | | | | | | | | | | | | | | | | | | | | | | | | | | | | (Dollars in thousands) December 31, 2012 | Pass | | Special Mention | | Substandard | | Doubtful | | Total | | | | | | | | | | | | | | | | Commercial and industrial | $ | 74,763 | | $ | 1,651 | | $ | 1,469 | | $ | - | | $ | 77,883 | Commercial real estate | | 260,941 | | | 5,375 | | | 18,551 | | | - | | | 284,867 | Commercial real estate - construction | | 32,767 | | | 410 | | | 54 | | | - | | | 33,231 | Lease financing | | 1,305 | | | - | | | - | | | - | | | 1,305 | Residential mortgage | | 57,455 | | | - | | | - | | | - | | | 57,455 | Home equity | | 22,336 | | | 188 | | | 396 | | | - | | | 22,920 | Consumer | | 6,267 | | | 292 | | | - | | | - | | | 6,559 | | $ | 455,834 | | $ | 7,916 | | $ | 20,470 | | $ | - | | $ | 484,220 |
| | | | | | | | | | | | | | | | | | | | | | | | | | | | | | (Dollars in thousands) December 31, 2011 | Pass | | Special Mention | | Substandard | | Doubtful | | Total | | | | | | | | | | | | | | | | Commercial and industrial | $ | 68,467 | | $ | 3,836 | | $ | 4,627 | | $ | - | | $ | 76,930 | Commercial real estate | | 271,551 | | | 6,530 | | | 14,815 | | | - | | | 292,896 | Commercial real estate - construction | | 29,706 | | | 445 | | | 584 | | | - | | | 30,735 | Lease financing | | 1,724 | | | - | | | - | | | - | | | 1,724 | Residential mortgage | | 48,270 | | | - | | | - | | | - | | | 48,270 | Home equity | | 23,248 | | | 218 | | | 683 | | | - | | | 24,149 | Consumer | | 8,013 | | | - | | | - | | | - | | | 8,013 | | $ | 450,979 | | $ | 11,029 | | $ | 20,709 | | $ | - | | $ | 482,717 |
MID PENN BANCORP, INC.Notes to Consolidated Financial Statements Impaired loans by loan portfolio class as of December 31, 2012 and 2011 are summarized as follows: | | | | | | | | | | | | | | | | | | | | | | | | | | | | | | | | | | | | | December 31, 2012 | | December 31, 2011 | (Dollars in thousands) | Recorded Investment | | Unpaid Principal Balance | | Related Allowance | | Recorded Investment | | Unpaid Principal Balance | | Related Allowance | With no related allowance recorded: | | | | | | | | | | | | | | | | | | Commercial and industrial | $ | 192 | | $ | 870 | | $ | - | | $ | 463 | | $ | 1,382 | | $ | - | Commercial real estate | | 6,570 | | | 10,773 | | | - | | | 5,696 | | | 9,296 | | | - | Commercial real estate - construction | | - | | | - | | | - | | | 584 | | | 592 | | | - | Home equity | | 124 | | | 261 | | | - | | | 251 | | | 386 | | | - | Consumer | | - | | | 578 | | | - | | | - | | | - | | | - | | | | | | | | | | | | | | | | | | | With an allowance recorded: | | | | | | | | | | | | | | | | | | Commercial and industrial | $ | 223 | | $ | 351 | | $ | 111 | | $ | 656 | | $ | 792 | | $ | 451 | Commercial real estate | | 2,514 | | | 2,672 | | | 1,200 | | | 3,202 | | | 3,410 | | | 1,380 | Commercial real estate - construction | | 54 | | | 53 | | | 54 | | | - | | | - | | | - | Home equity | | 67 | | | 71 | | | 18 | | | 74 | | | 77 | | | 15 | | | | | | | | | | | | | | | | | | | Total: | | | | | | | | | | | | | | | | | | Commercial and industrial | $ | 415 | | $ | 1,221 | | $ | 111 | | $ | 1,119 | | $ | 2,174 | | $ | 451 | Commercial real estate | | 9,084 | | | 13,445 | | | 1,200 | | | 8,898 | | | 12,706 | | | 1,380 | Commercial real estate - construction | | 54 | | | 53 | | | 54 | | | 584 | | | 592 | | | - | Home equity | | 191 | | | 332 | | | 18 | | | 325 | | | 463 | | | 15 | Consumer | | - | | | 578 | | | - | | | - | | | - | | | - |
MID PENN BANCORP, INC.Notes to Consolidated Financial Statements Average recorded investment of impaired loans and related interest income recognized for the years ended December 31, 2012, 2011, and 2010 are summarized as follows: | | | | | | | | | | | | | | | | | | | | | | | | | | | | | | | | | | | | | December 31, 2012 | | December 31, 2011 | | December 31, 2010 | (Dollars in thousands) | Average Recorded Investment | | Interest Income Recognized | | Average Recorded Investment | | Interest Income Recognized | | Average Recorded Investment | | Interest Income Recognized | With no related allowance recorded: | | | | | | | | | | | | | | | | | | Commercial and industrial | $ | 462 | | $ | 1 | | $ | 752 | | $ | 84 | | $ | 1,222 | | $ | 11 | Commercial real estate | | 7,329 | | | 21 | | | 6,000 | | | 278 | | | 9,317 | | | - | Commercial real estate - construction | | - | | | - | | | 1,016 | | | 18 | | | 1,858 | | | - | Lease financing | | - | | | - | | | - | | | - | | | 181 | | | - | Residential mortgage | | - | | | - | | | - | | | 28 | | | 97 | | | - | Home equity | | 179 | | | 4 | | | 266 | | | - | | | 283 | | | - | Consumer | | 292 | | | - | | | - | | | - | | | - | | | - | | | | | | | | | | | | | | | | | | | With an allowance recorded: | | | | | | | | | | | | | | | | | | Commercial and industrial | $ | 242 | | $ | - | | $ | 670 | | $ | - | | $ | 938 | | $ | - | Commercial real estate | | 2,727 | | | - | | | 3,281 | | | - | | | 4,384 | | | - | Commercial real estate - construction | | 54 | | | - | | | - | | | - | | | - | | | - | Residential mortgage | | - | | | - | | | - | | | - | | | 10 | | | - | Home equity | | 71 | | | - | | | 76 | | | - | | | 25 | | | - | | | | | | | | | | | | | | | | | | | Total: | | | | | | | | | | | | | | | | | | Commercial and industrial | $ | 704 | | $ | 1 | | $ | 1,422 | | $ | 84 | | $ | 2,160 | | $ | 11 | Commercial real estate | | 10,056 | | | 21 | | | 9,281 | | | 278 | | | 13,701 | | | - | Commercial real estate - construction | | 54 | | | - | | | 1,016 | | | 18 | | | 1,858 | | | - | Lease financing | | - | | | - | | | - | | | - | | | 181 | | | - | Residential mortgage | | - | | | - | | | - | | | 28 | | | 107 | | | - | Home equity | | 250 | | | 4 | | | 342 | | | - | | | 308 | | | - | Consumer | | 292 | | | - | | | - | | | - | | | - | | | - |
Non-accrual loans by loan portfolio class as of December 31, 2012 and 2011 are summarized as follows: | | | | | | | | | | | | (Dollars in thousands) | 2012 | | 2011 | | | | | | | Commercial and industrial | $ | 264 | | $ | 1,117 | Commercial real estate | | 10,785 | | | 8,899 | Commercial real estate - construction | | 54 | | | 584 | Residential mortgage | | 537 | | | 703 | Home equity | | 191 | | | 496 | Consumer | | - | | | 1 | | $ | 11,831 | | $ | 11,800 |
MID PENN BANCORP, INC.Notes to Consolidated Financial Statements The performance and credit quality of the loan portfolio is also monitored by the analyzing the age of the loans receivable as determined by the length of time a recorded payment is past due. The classes of the loan portfolio summarized by the past due status as of December 31, 2012 and 2011 are summarized as follows: | | | | | | | | | | | | | | | | | | | | | | | | | | | | | | | | | | | | | | | | | | (Dollars in thousands) December 31, 2012 | 30-59 Days Past Due | | 60-89 Days Past Due | | Greater than 90 Days | | Total Past Due | | Current | | Total Loans | | Loans Receivable > 90 Days and Accruing | Commercial and industrial | $ | 123 | | $ | 361 | | $ | 234 | | $ | 718 | | $ | 77,165 | | $ | 77,883 | | $ | - | Commercial real estate | | 1,785 | | | 5,618 | | | 8,248 | | | 15,651 | | | 269,216 | | | 284,867 | | | - | Commercial real estate - construction | | - | | | - | | | 54 | | | 54 | | | 33,177 | | | 33,231 | | | - | Lease financing | | 1 | | | | | | - | | | 1 | | | 1,304 | | | 1,305 | | | - | Residential mortgage | | 495 | | | 35 | | | 531 | | | 1,061 | | | 56,394 | | | 57,455 | | | - | Home equity | | 96 | | | - | | | 147 | | | 243 | | | 22,677 | | | 22,920 | | | - | Consumer | | 1 | | | 2 | | | - | | | 3 | | | 6,556 | | | 6,559 | | | - | Total | $ | 2,501 | | $ | 6,016 | | $ | 9,214 | | $ | 17,731 | | $ | 466,489 | | $ | 484,220 | | $ | - |
| | | | | | | | | | | | | | | | | | | | | | | | | | | | | | | | | | | | | | | | | | (Dollars in thousands) December 31, 2011 | 30-59 Days Past Due | | 60-89 Days Past Due | | Greater than 90 Days | | Total Past Due | | Current | | Total Loans | | Loans Receivable > 90 Days and Accruing | Commercial and industrial | $ | 141 | | $ | 663 | | $ | 1,052 | | $ | 1,856 | | $ | 75,074 | | $ | 76,930 | | $ | - | Commercial real estate | | 1,037 | | | 909 | | | 6,204 | | | 8,150 | | | 284,746 | | | 292,896 | | | - | Commercial real estate - construction | | 6 | | | - | | | 584 | | | 590 | | | 30,145 | | | 30,735 | | | - | Lease financing | | - | | | - | | | - | | | - | | | 1,724 | | | 1,724 | | | - | Residential mortgage | | 410 | | | 11 | | | 691 | | | 1,112 | | | 47,158 | | | 48,270 | | | - | Home equity | | 111 | | | - | | | 428 | | | 539 | | | 23,610 | | | 24,149 | | | - | Consumer | | 15 | | | 3 | | | 1 | | | 19 | | | 7,994 | | | 8,013 | | | - | Total | $ | 1,720 | | $ | 1,586 | | $ | 8,960 | | $ | 12,266 | | $ | 470,451 | | $ | 482,717 | | $ | - |
MID PENN BANCORP, INC.Notes to Consolidated Financial Statements The allowance for loan and lease losses and recorded investment in financing receivables for the years ended December 31, 2012 and 2011 and as of December 31, 2012 and 2011 are as follows: | | | | | | | | | | | | | | | | | | | | | | | | | | | | | | | | | | | | | | | | | | | | | | | | | | | | | | (Dollars in thousands) December 31, 2012 | Commercial and industrial | | Commercial real estate | | Commercial real estate - construction | | Lease financing | | Residential mortgage | | Home equity | | Consumer | | Unallocated | | Total | Allowance for loan and lease losses: | | | | | | | | | | | | | | | | | | | | | | | | | | | Beginning balance | $ | 2,274 | | $ | 3,544 | | $ | 23 | | $ | 2 | | $ | 362 | | $ | 337 | | $ | 87 | | $ | 143 | | $ | 6,772 | Charge-offs | | (834) | | | (493) | | | (6) | | | - | | | (195) | | | (268) | | | (592) | | | - | | | (2,388) | Recoveries | | 31 | | | 13 | | | 2 | | | - | | | - | | | 10 | | | 33 | | | - | | | 89 | Provisions | | (173) | | | 48 | | | 45 | | | (1) | | | 414 | | | 264 | | | 573 | | | (134) | | | 1,036 | Ending balance | $ | 1,298 | | $ | 3,112 | | $ | 64 | | $ | 1 | | $ | 581 | | $ | 343 | | $ | 101 | | $ | 9 | | $ | 5,509 | Ending balance: individually evaluated for impairment | $ | 111 | | $ | 1,200 | | $ | 54 | | $ | - | | $ | - | | $ | 18 | | $ | - | | $ | - | | $ | 1,383 | Ending balance: collectively evaluated for impairment | $ | 1,187 | | $ | 1,912 | | $ | 10 | | $ | 1 | | $ | 581 | | $ | 325 | | $ | 101 | | $ | 9 | | $ | 4,126 | | | | | | | | | | | | | | | | | | | | | | | | | | | | Loans receivables: | | | | | | | | | | | | | | | | | | | | | | | | | | | Ending balance | $ | 77,883 | | $ | 284,867 | | $ | 33,231 | | $ | 1,305 | | $ | 57,455 | | $ | 22,920 | | $ | 6,559 | | $ | - | | $ | 484,220 | Ending balance: individually evaluated for impairment | $ | 415 | | $ | 9,084 | | $ | 54 | | $ | - | | $ | - | | | 191 | | $ | - | | $ | - | | $ | 9,744 | Ending balance: collectively evaluated for impairment | $ | 77,468 | | $ | 275,783 | | $ | 33,177 | | $ | 1,305 | | $ | 57,455 | | $ | 22,729 | | $ | 6,559 | | $ | - | | $ | 474,476 |
| | | | | | | | | | | | | | | | | | | | | | | | | | | | | | | | | | | | | | | | | | | | | | | | | | | | | | (Dollars in thousands) December 31, 2011 | Commercial and industrial | | Commercial real estate | | Commercial real estate - construction | | Lease financing | | Residential mortgage | | Home equity | | Consumer | | Unallocated | | Total | Allowance for loan and lease losses: | | | | | | | | | | | | | | | | | | | | | | | | | | | Beginning Balance | $ | 2,447 | | $ | 3,616 | | $ | 159 | | $ | 1 | | $ | 219 | | $ | 363 | | $ | 61 | | $ | 195 | | $ | 7,061 | Charge-offs | | (546) | | | (545) | | | - | | | (44) | | | (310) | | | (40) | | | (102) | | | - | | | (1,587) | Recoveries | | 10 | | | 26 | | | - | | | 6 | | | 19 | | | 5 | | | 27 | | | - | | | 93 | Provisions | | 363 | | | 447 | | | (136) | | | 39 | | | 434 | | | 9 | | | 101 | | | (52) | | | 1,205 | Ending balance | $ | 2,274 | | $ | 3,544 | | $ | 23 | | $ | 2 | | $ | 362 | | $ | 337 | | $ | 87 | | $ | 143 | | $ | 6,772 | Ending balance: individually evaluated for impairment | $ | 451 | | $ | 1,380 | | $ | - | | $ | - | | $ | - | | $ | 15 | | $ | - | | $ | - | | $ | 1,846 | Ending balance: collectively evaluated for impairment | $ | 1,823 | | $ | 2,164 | | $ | 23 | | $ | 2 | | $ | 362 | | $ | 322 | | $ | 87 | | $ | 143 | | $ | 4,926 | | | | | | | | | | | | | | | | | | | | | | | | | | | | Loans receivables: | | | | | | | | | | | | | | | | | | | | | | | | | | | Ending balance | $ | 76,930 | | $ | 292,896 | | $ | 30,735 | | $ | 1,724 | | $ | 48,270 | | $ | 24,149 | | $ | 8,013 | | $ | - | | $ | 482,717 | Ending balance: individually evaluated for impairment | $ | 1,119 | | $ | 8,898 | | $ | 584 | | $ | - | | $ | - | | $ | 325 | | $ | - | | $ | - | | $ | 10,926 | Ending balance: collectively evaluated for impairment | $ | 75,811 | | $ | 283,998 | | $ | 30,151 | | $ | 1,724 | | $ | 48,270 | | $ | 23,824 | | $ | 8,013 | | $ | - | | $ | 471,791 |
MID PENN BANCORP, INC.Notes to Consolidated Financial Statements The recorded investments in troubled debt restructured loans at December 31, 2012 and 2011 are as follows: | | | | | | | | | | | | | | | | | | (Dollars in thousands) December 31, 2012 | Pre-Modification Outstanding Recorded Investment | | Post-Modification Outstanding Recorded Investment | | Recorded Investment | Commercial and industrial | $ | 40 | | $ | 35 | | $ | 30 | Commercial real estate | | 7,326 | | | 3,748 | | | 2,916 | Residential mortgage | | 558 | | | 552 | | | 448 | | $ | 7,924 | | $ | 4,335 | | $ | 3,394 |
| | | | | | | | | (Dollars in thousands) December 31, 2011 | Pre-Modification Outstanding Recorded Investment | | Post-Modification Outstanding Recorded Investment | | Recorded Investment | Commercial and industrial | $ | 40 | | $ | 35 | | $ | 32 | Commercial real estate | | 8,315 | | | 4,568 | | | 3,955 | Residential mortgage | | 698 | | | 691 | | | 599 | Home equity | | 29 | | | 28 | | | 16 | | $ | 9,082 | | $ | 5,322 | | $ | 4,602 |
Mid Penn’s troubled debt restructured loans at December 31, 2012 totaled $3,394,000, of which, $426,000, representing seven loans, are accruing residential mortgages in compliance with the terms of the modification. The remaining $2,968,000, representing 10 loans, are nonaccrual impaired loans, and resulted in a collateral evaluation in accordance with the guidance on impaired loans. As a result of the evaluation, a specific allocation and, subsequently, charge offs have been taken as appropriate. As of December 31, 2012, charge offs associated with troubled debt restructured loans while under a forbearance agreement totaled $0. As of December 31, 2012, there were no defaulted troubled debt restructured loans as all troubled debt restructured loans were current with respect to their associated forbearance agreements. One forbearance agreement was negotiated during 2008, 12 forbearance agreements were negotiated during 2009, while the remaining four were negotiated during 2010. Mid Penn’s troubled debt restructured loans at December 31, 2011 totaled $4,602,000, of which, $571,000, representing nine loans, are accruing residential mortgages in compliance with the terms of the modification. The remaining $4,031,000, representing 15 loans, are nonaccrual impaired loans, and resulted in a collateral evaluation in accordance with the guidance on impaired loans. As a result of the evaluation, a specific allocation and, subsequently, charge offs have been taken as appropriate. As of December 31, 2011, charge offs associated with troubled debt restructured loans while under a forbearance agreement totaled $0. As of December 31, 2011, there were no defaulted troubled debt restructured loans as all troubled debt restructured loans were current with respect to their associated forbearance agreements. One forbearance agreement was negotiated during 2008, 18 forbearance agreements were negotiated during 2009, while the remaining five were negotiated during 2010. Mid Penn entered into forbearance agreements on all loans currently classified as troubled debt restructures and all of these agreements have resulted in additional principal repayment. The terms of these forbearance agreements vary whereby principal payments have been decreased, interest rates have been reduced and/or the loan will be repaid as collateral is sold. As a result of adopting the amendments in ASU No. 2011-02, Mid Penn reassessed all restructurings that occurred on or after January 1, 2011 for identification as troubled debt restructurings. Mid Penn identified no loans for which the allowance for loan losses had previously been measured under a general allowance for credit losses methodology that are now considered troubled debt restructurings in accordance with ASU No. 2011-02.
MID PENN BANCORP, INC.Notes to Consolidated Financial Statements Changes in the allowance for loan and lease losses for the years 2009, 20082012, 2011 and 20072010 are summarized as follows: | | | | | | | | | | | | | | (Dollars in thousands) | | 2009 | | | 2008 | | | 2007 | | Balance, January 1 | | $ | 5,505 | | | $ | 4,790 | | | $ | 4,187 | | Provision for loan and lease losses | | | 9,520 | | | | 1,230 | | | | 925 | | Loans and leases charged off | | | (7,431 | ) | | | (647 | ) | | | (460 | ) | Recoveries on loans and leases charged off | | | 92 | | | | 132 | | | | 138 | | | | | | | | | | | | | | | Balance, December 31 | | $ | 7,686 | | | $ | 5,505 | | | $ | 4,790 | | | | | | | | | | | | | | |
The recorded investment in loans and leases that are considered impaired amounted to $13,726,000 on December 31, 2009, and $6,858,000 on December 31, 2008. By definition, impairment of a loan or lease is considered when, based on current information and events, it is probable that all amounts due will not be collected according to the contractual terms of the loan or lease agreement. The allowance for loan and lease losses related to loans and leases classified as impaired amounted to $2,561,000 at December 31, 2009 and $856,000 at December 31, 2008. At December 31, 2009, impaired loans with a valuation allowance were $4,597,000 and those without a valuation allowance were $9,129,000. At December 31, 2008, impaired loans with a valuation allowance were $4,663,000 and those without a valuation allowance were $2,195,000. The average balances of total impaired loans and leases amounted to $13,293,000, $5,376,000 and $2,504,000 for the years 2009, 2008 and 2007, respectively. The Bank applies payments on impaired loans on a principal first basis. Interest income is recognized on impaired loans and leases on a cash basis. The cash receipts recognized as interest income were $982,000, $51,000, and $66,000 for the years ended December 31, 2009, 2008, and 2007.
| | | | | | | | | | | | | | | | | | (Dollars in thousands) | 2012 | | 2011 | | 2010 | Balance, January 1 | $ | 6,772 | | $ | 7,061 | | $ | 7,686 | Provision for loan and lease losses | | 1,036 | | | 1,205 | | | 2,635 | Loans and leases charged off | | (2,388) | | | (1,587) | | | (3,434) | Recoveries on loans and leases charged off | | 89 | | | 93 | | | 174 | Balance, December 31 | $ | 5,509 | | $ | 6,772 | | $ | 7,061 |
Loans and leases which were past due 90 days or more for which interest continued to be accrued amounted to $661,000 at December 31, 2009 and $1,860,000 at December 31, 2008. Total nonaccrual loans and leases amounted to $14,933,000 at December 31, 2009 and $4,113,000 at December 31, 2008. $4,278,000 of the 2009 non-accrual loans are also troubled debt restructured loans. If these nonaccrual loans and leases had been current in accordance with their original terms and had been outstanding throughout the period or since origination, if held for part of the period, Mid Penn would have recorded interest income on these loans of $608,000, $335,000,$2,974,000, $1,942,000, and $390,000$3,819,000, in the years ended December 31, 2009, 2008,2012, 2011, and 20072010, respectively. Mid Penn has no commitments to lend additional funds to borrowers with impaired or nonaccrual loans.
48
| | | MID PENN BANCORP, INC. | | Notes to Consolidated Financial Statements |
(9) | Bank Premises and Equipment |
67
MID PENN BANCORP, INC.Notes to Consolidated Financial Statements (8) Bank Premises and Equipment At December 31, 20092012 and 2008,2011, bank premises and equipment are as follows: | | | | | | | | | | (Dollars in thousands) | | 2009 | | | 2008 | | Land | | $ | 2,791 | | | $ | 2,791 | | Buildings | | | 9,239 | | | | 9,060 | | Furniture, fixtures, and equipment | | | 9,879 | | | | 8,001 | | Land and Leasehold improvements | | | 376 | | | | 326 | | Construction in progress | | | 692 | | | | 168 | | | | | | | | | | | | | | 22,977 | | | | 20,346 | | Less accumulated depreciation | | | (10,073 | ) | | | (8,969 | ) | | | | | | | | | | | | $ | 12,904 | | | $ | 11,377 | | | | | | | | | | |
| | | | | | | | | | | | (Dollars in thousands) | 2012 | | 2011 | Land | $ | 2,712 | | $ | 2,752 | Buildings | | 10,007 | | | 10,478 | Furniture, fixtures, and equipment | | 9,045 | | | 7,946 | Land and Leasehold improvements | | 828 | | | 725 | Construction in progress | | 3 | | | 254 | | | 22,595 | | | 22,155 | Less accumulated depreciation | | (9,472) | | | (8,831) | | $ | 13,123 | | $ | 13,324 |
Depreciation expense was $1,115,000$1,153,000 in 2009, $848,0002012, $1,230,000 in 20082011, and $809,000$1,302,000 in 2007.2010. (9) Deposits At December 31, 20092012 and 2008,2011, time deposits amounted to $268,460,000$163,653,000 and $248,060,000,$201,892,000, respectively. Interest expense on such certificates of deposit amounted to $9,293,000, $9,903,000$3,683,000, $5,358,000, and $9,006,000$6,877,000 for the years ended December 31, 2009, 20082012, 2011 and 2007,2010, respectively. These time deposits at December 31, 2009,2012, mature as follows: | | | | | | | | (Dollars in thousands) | | Time Deposits | | | | $100,000 or more | | Less than $100,000 | Maturing in 2010 | | $ | 60,155 | | $ | 110,802 | Maturing in 2011 | | | 12,911 | | | 26,385 | Maturing in 2012 | | | 7,835 | | | 32,276 | Maturing in 2013 | | | 796 | | | 3,243 | Maturing in 2014 | | | 3,480 | | | 7,984 | Maturing thereafter | | | 660 | | | 1,933 | | | | | | | | | | $ | 85,837 | | $ | 182,623 | | | | | | | |
| | | | | | | | | | | | (Dollars in thousands) | Time Deposits | | | Less than $100,000 | | | $100,000 or more | Maturing in 2013 | $ | 44,116 | | $ | 25,547 | Maturing in 2014 | | 28,381 | | | 15,276 | Maturing in 2015 | | 18,132 | | | 11,476 | Maturing in 2016 | | 8,103 | | | 3,433 | Maturing in 2017 | | 3,451 | | | 1,629 | Maturing thereafter | | 3,160 | | | 949 | | $ | 105,343 | | $ | 58,310 |
Brokered deposits included in the deposit totals equaled $27,889,000$4,128,000 at December 31, 20092012 and $46,108,000$13,354,000 at December 31, 2008.2011. Deposits and other funds from related parties held by Mid Penn at December 31, 20092012 and 20082011 amounted to $8,717,000$6,804,000 and $5,765,000,$9,201,000, respectively. (11) | Short-term Borrowings |
(10) Short-term Borrowings There were no short-term borrowings as of December 31, 2009 and 2008 consisted of: | | | | | | | | (Dollars in thousands) | | 2009 | | 2008 | Federal funds purchased | | $ | 12,886 | | $ | 17,928 | Repurchase agreements | | | 2,839 | | | 5,041 | Treasury, tax and loan notes | | | 319 | | | 1,008 | | | | | | | | | | $ | 16,044 | | $ | 23,977 | | | | | | | |
The weighted average interest rate on total short-term borrowings outstanding was 0.57% at December 31, 2009, and 2.09% at December 31, 2008.
Federal funds purchased represent overnight funds.2012 or 2011. The Bank has a line of credit commitment from the Federal Home Loan Bank (“FHLB”) for overnight borrowings up to $40,000,000 of which $12,886,000 was outstanding at December 31, 2009.$40,000,000. This line is collateralized by certain qualifying loans and investment securities of the Bank. Securities sold under repurchase agreements generally mature between one day and one year. Treasury, tax and loan notes are open-ended interest bearing notes payable to the U.S. Treasury upon call. All tax deposits accepted by the Bank are placed in the Treasury note account. The Bank also has unused lines of credit with a correspondent bankbanks amounting to $7,500,000$12,500,000 at December 31, 2009.2012.
49
| | | MID PENN BANCORP, INC. | | Notes to Consolidated Financial Statements |
MID PENN BANCORP, INC.Notes to Consolidated Financial Statements (11)Long-term Debt The Bank is a member of the Federal Home Loan Bank of Pittsburgh (“FHLB”) and through its membership, the Bank can access a number of credit products, which are utilized to provide liquidity. The maximum borrowing capacity available to the Bank at the FHLB at December 31, 20092012 was $218,483,000.$216,209,000, which includes the line of credit commitment for overnight borrowings. As of December 31, 20092012 and 2008,2011, the Bank had long-term debt in the amount of $38,057,000$22,510,000 and $55,223,000,$22,701,000, respectively, consisting of: | | | | | | | | (Dollars in thousands) | | At December 31, | | | | 2009 | | 2008 | Loans maturing in 2009 with rates ranging from 4.22% to 7.24% | | $ | — | | $ | 17,000 | Loans maturing in 2010 with rates ranging from 6.28% to 6.71% | | | 10,000 | | | 10,000 | Loans maturing in 2011 at a rate of 5.13% | | | 5,000 | | | 5,000 | Loans maturing in 2013 with rates ranging from 3.24% to 4.75% | | | 14,258 | | | 14,279 | Loans maturing in 2015 at a rate of 4.18% | | | 5,000 | | | 5,000 | Loans maturing in 2026 at a rate of 4.80% | | | 3,715 | | | 3,857 | Loans maturing in 2027 at a rate of 6.71% | | | 84 | | | 87 | | | | | | | | | | $ | 38,057 | | $ | 55,223 | | | | | | | |
| | | | | | | | | | | | (Dollars in thousands) | At December 31, | | 2012 | | 2011 | Loans maturing in 2013 with rates ranging from 3.24% to 4.75% | $ | 14,189 | | $ | 14,213 | Loans maturing in 2015 at a rate of 4.18% | | 5,000 | | | 5,000 | Loans maturing in 2026 at a rate of 4.80% | | 3,245 | | | 3,409 | Loans maturing in 2027 at a rate of 6.71% | | 76 | | | 79 | | $ | 22,510 | | $ | 22,701 |
The aggregate amounts due on long-term debt subsequent to December 31, 20092012 are $10,174,000 (2010), $5,182,000 (2011), $191,000 (2012), $14,365,000 (2013), $184,000 (2014), $5,193,000 (2015), $203,000 (2016), $213,000 (2017), and $7,961,000$2,352,000 thereafter. All of Mid Penn’s long-term debt, $778,000 of the Bank’s investments and the Bank’s entire mortgage loan portfolio are pledged to secure FHLB borrowings. (13) | Fair Value Measurement |
Mid Penn adopted Accounting Standards Codification (“ASC”) Topic 820,(12) Fair Value Measurements and Disclosures effective January 1, 2008 for financial assets and financial liabilities and on January 1, 2009, for non-financial assets and non-financial liabilities. This guidance defines fair value, establishes a framework for measuring fair value in accordance with generally accepted accounting principles, and expands disclosures about fair value measurements.Measurement
Fair value measurement and disclosure guidance defines fair value as the price that would be received to sell the asset or transfer the liability in an orderly transaction (that is, not a forced liquidation or distressed sale) between market participants at the measurement date under current market conditions. This guidance provides additional information on determining when the volume and level of activity for the asset or liability has significantly decreased. The guidance also includes information on identifying circumstances when a transaction may not be considered orderly. Fair value measurement and disclosure guidance provides a list of factors that a reporting entity should evaluate to determine whether there has been a significant decrease in the volume and level of activity for the asset or liability in relation to normal market activity for the asset or liability. When the reporting entity concludes there has been a significant decrease in the volume and level of activity for the asset or liability, further analysis of the information from that market is needed and significant adjustments to the related prices may be necessary to estimate fair value in accordance with the fair value measurement and disclosure guidance. This guidance clarifies that when there has been a significant decrease in the volume and level of activity for the asset or liability, some transactions may not be orderly. In those situations, the entity must evaluate the weight of the evidence to determine whether the transaction is orderly. The guidance provides a list of circumstances that may indicate that a transaction is not orderly. A transaction price that is not associated with an orderly transaction is given little, if any, weight when estimating fair value. Fair value is the price that would be received to sell an asset or paid to transfer a liability in an orderly transaction between market participants at the measurement date. Inputs to valuation techniques refer to the assumptions that market participants would use in pricing the asset or liability. Inputs may be observable, meaning those that reflect the assumptions market participants would use in pricing the asset or liability developed based on market data obtained from independent sources, or unobservable, meaning those that reflect the reporting entity’s own belief about the assumptions market participants would use in pricing the asset or liability based upon the best information available in the circumstances. Fair value measurement and disclosure guidance establishes a fair value hierarchy for valuation inputs that gives the highest priority to quoted prices in active markets for identical assets or liabilities and the lowest priority to unobservable inputs. The fair value hierarchy is as follows: | | | Level 1 Inputs - Level 1 Inputs - | | Unadjusted quoted prices in active markets that are accessible at the measurement date for identical, unrestricted assets or liabilities; |
50
Level 2 Inputs - Quoted prices in markets that are not active, or inputs that are observable either directly or
| | | MID PENN BANCORP, INC. | | Notes to Consolidated Financial Statements |
indirectly, for substantially the full term of the asset or liability; | | | Level 2 Inputs - | | Quoted prices in markets that are not active, or inputs that are observable either directly or indirectly, for substantially the full term of the asset or liability;
| | | Level 3 Inputs - | | Prices or valuation techniques that require inputs that are both significant to the fair value measurement and unobservable (i.e., supported by little or no market activity).
|
Level 3 Inputs - Prices or valuation techniques that require inputs that are both significant to the fair value measurement and unobservable (i.e., supported by little or no market activity).
MID PENN BANCORP, INC.Notes to Consolidated Financial Statements A description of the valuation methodologies used for instruments measured at fair value, as well as the general classification of such instruments pursuant to the valuation hierarchy, is set forth below. These valuation methodologies There were applied to allno transfers of Mid Penn’s financial assets and financial liabilities carried atbetween fair value effective JanuaryLevel 1 2008. and Level 2 for the year ended December 31, 2012. The following table illustrates the financial instrumentsassets measured at fair value on a recurring basis segregated by hierarchy fair value levels: | | | | | | | | | | | | | | | | | | | | | | | | | | | | | | | | | | | | (Dollars in thousands) | | | | Fair value measurements at December 31, 2009 using: | | | | | Fair value measurements at December 31, 2012 using: | | | | Total carrying value at | | Quoted prices in active markets | | Significant other observable inputs | | Significant unobservable inputs | Assets: | | Total carrying value at
December 31, 2009 | | Quoted prices in
active markets
(Level 1) | | Significant other
observable inputs
(Level 2) | | Significant
unobservable
inputs
(Level 3) | | December 31, 2012 | | (Level 1) | | (Level 2) | | (Level 3) | Securities available for sale | | $ | 47,345 | | $ | 245 | | $ | 47,100 | | $ | — | | U.S. Treasury and U.S. government agencies | | | $ | 17,740 | | $ | - | | $ | 17,740 | | $ | - | Mortgage-backed U.S. government agencies | | | | 66,686 | | | - | | | 66,686 | | | - | State and political subdivision obligations | | | | 69,479 | | | - | | | 69,479 | | | - | Equity securities | | | | 390 | | | 390 | | | - | | | - | | | | | $ | 154,295 | | $ | 390 | | $ | 153,905 | | $ | - | | (Dollars in thousands) | | | | Fair value measurements at December 31, 2008 using: | | Assets: | | Total carrying value at
December 31, 2008 | | Quoted prices in
active markets
(Level 1) | | Significant other
observable inputs
(Level 2) | | Significant
unobservable
inputs
(Level 3) | | Securities available for sale | | $ | 52,739 | | $ | 236 | | $ | 52,503 | | $ | — | |
| | | | | | | | | | | | | | | | | | | | | | | | | | (Dollars in thousands) | | | | | Fair value measurements at December 31, 2011 using: | | | Total carrying value at | | Quoted prices in active markets | | Significant other observable inputs | | Significant unobservable inputs | Assets: | | December 31, 2011 | | (Level 1) | | (Level 2) | | (Level 3) | U.S. Treasury and U.S. government agencies | | $ | 27,617 | | $ | - | | $ | 27,617 | | $ | - | Mortgage-backed U.S. government agencies | | | 82,668 | | | - | | | 82,668 | | | - | State and political subdivision obligations | | | 48,366 | | | - | | | 48,366 | | | - | Equity securities | | | 392 | | | 392 | | | - | | | - | | | $ | 159,043 | | $ | 392 | | $ | 158,651 | | $ | - |
Certain financial assets and financial liabilities are measured at fair value on a nonrecurring basis; that is, the instruments are not measured at fair value on an ongoing basis, but are subject to fair value adjustments in certain circumstances (for example, when there is evidence of impairment). The following table illustrates the financial instrumentsassets measured at fair value on a nonrecurring basis segregated by hierarchy fair value levels: | | | | | | | | | | | | | | | | | | | | | | | | | | | | | | | | | | | | (Dollars in thousands) | | | | Fair value measurements at December 31, 2009 using: | | | | | Fair value measurements at December 31, 2012 using: | | | | Total carrying value at | | Quoted prices in active markets | | Significant other observable inputs | | Significant unobservable inputs | Assets: | | Total carrying value at
December 31, 2009 | | Quoted prices in
active markets
(Level 1) | | Significant other
observable inputs
(Level 2) | | Significant
unobservable
inputs
(Level 3) | | December 31, 2012 | | (Level 1) | | (Level 2) | | (Level 3) | Impaired Loans | | $ | 2,036 | | | | | | $ | 2,036 | | $ | 3,075 | | $ | - | | $ | - | | $ | 3,075 | Foreclosed Assets | | | 663 | | | | | | | 663 | | | | (Dollars in thousands) | | | | Fair value measurements at December 31, 2008 using: | | Assets: | | Total carrying value at
December 31, 2008 | | Quoted prices in
active markets
(Level 1) | | Significant other
observable inputs
(Level 2) | | Significant
unobservable
inputs
(Level 3) | | Impaired Loans | | $ | 3,807 | | | | | | $ | 3,807 | | Foreclosed Assets | | | 1,516 | | | | | | | 1,516 | | Foreclosed Assets Held for Sale | | | | 105 | | | - | | | - | | | 105 |
Certain non-financial
| | | | | | | | | | | | | | | | | | | | | | | | | | (Dollars in thousands) | | | | | Fair value measurements at December 31, 2011 using: | | | Total carrying value at | | Quoted prices in active markets | | Significant other observable inputs | | Significant unobservable inputs | Assets: | | December 31, 2011 | | (Level 1) | | (Level 2) | | (Level 3) | Impaired Loans | | $ | 5,621 | | $ | - | | $ | - | | $ | 5,621 | Foreclosed Assets Held for Sale | | | 240 | | | - | | | - | | | 240 |
MID PENN BANCORP, INC.Notes to Consolidated Financial Statements The following table presents additional quantitative information about assets and non-financial liabilities measured at fair value on a recurringnonrecurring basis include reporting units measured atand for which Mid Penn has utilized Level 3 inputs to determine the fair value in the first stepas of a goodwill impairment test. Certain non-financial assets and non-financial liabilities measured at fair value on a non-recurring basis include non-financial assets and non-financial liabilities measured at fair value in the second step of a goodwill impairment test, as well as intangible assets and other non-financial long-lived assets measured at fair value for impairment assessment. As stated above, this guidance was applicable to these fair value measurements beginning January 1, 2009 and were not significant at December 31, 2009.2012: 51
| | | | | | | | | | MID PENN BANCORP, INC. | | Notes to Consolidated Financial Statements | | | | | | | | (Dollars in thousands) | | Quantitative Information about Level 3 Fair Value Measurements | | | Fair Value Estimate | | Valuation Technique | | Unobservable Input | | Range Weighted Average | Impaired Loans | | $ | 3,075 | | Appraisal of collateral (1) | | Appraisal adjustments (2) | | 10% - 95% (28%) | Foreclosed Assets Held for Sale | | $ | 105 | | Appraisal of collateral (1), (3) | | Appraisal adjustments (2) | | 15% - 40% (24%) |
(1) | Fair value is generally determined through independent appraisals of the underlying collateral, which generally includes various level 3 inputs which are not identifiable |
(2) | Appraisals may be adjusted by management for qualitative factors such as economic conditions and estimated liquidation expenses. The range of liquidation expenses and other appraisal adjustments are presented as a percent of the appraisal. |
(3) | Includes qualitative adjustments by management and estimated liquidation expenses. |
The following methodologies and assumptions were used to estimate the fair value of Mid Penn’s financial instruments: Cash and Cash Equivalents: The carrying value of cash and cash equivalents is considered to be a reasonable estimate of fair value. Interest-bearing Balances with other Financial Institutions: The estimate of fair value was determined by comparing the present value of quoted interest rates on like deposits with the weighted average yield and weighted average maturity of the balances. Securities Available for Sale: The fair value of securities classified as available for sale is determined by obtaining quoted market prices on nationally recognized securities exchanges (Level 1), or matrix pricing (level 2), which is a mathematical technique used widely in the industry to value debt securities without relying exclusively on quoted market prices for the specific securities but rather relying on the securities’ relationship to other benchmark quoted prices. Impaired Loans: CertainMid Penn’s rating system assumes any loans classified as sub-standard non-accrual to be impaired, and all of these loans are evaluated for impairment using the practical expedients includingconsidered collateral dependent; therefore, all of Mid Penn’s impaired loans, measured at an observable market price (if available),whether reporting a specific allocation or at the fair valuenot, are considered collateral dependent.
It is Mid Penn’s policy to obtain updated third party valuations on all impaired loans collateralized by real estate within 30 days of the loan’scredit being classified as sub-standard non-accrual. Prior to receipt of the updated real estate valuation Mid Penn will use any existing real estate valuation to determine any potential allowance issues; however no allowance recommendation will be made until which time Mid Penn is in receipt of the updated valuation. In some instances Mid Penn is not holding real estate as collateral (if the loanand is relying on business assets (personal property) for repayment. In these circumstances a collateral dependent).inspection is performed by Mid Penn personnel to determine an estimated value. The value is based on net book value, as provided by the financial statements, and discounted accordingly based on determinations made by management. Occasionally, Mid Penn will employ an outside service to provide a fair estimate of value based on auction sales or private sales. Management reviews the collateral is determined through appraisals performed by independent licensed appraisers. When the valueestimates of the collateral, less estimated costs to sell, is less than the principal balance of the loan, a specific allowance is established.these third parties and discounts them accordingly based on management’s judgment, if deemed necessary. Mid Penn considers the appraisalsestimates used in its impairment analysis to be Level 3 inputs. Impaired loans are reviewed and evaluated Mid Penn actively monitors the values of collateral on impaired loans. This monitoring may require the modification of collateral values over time or changing circumstances by some factor, either positive or negative, from the original values. All collateral values will be assessed by management at least every 18 months for possible revaluation by an independent third party. Mid Penn does not currently, or plan to in the future, use automated valuation methodologies as needed for additional impairment, and allowances are adjusted accordingly.a method of valuing real estate collateral. Loans: For variable-rate loans that reprice frequently and which entail no significant changes in credit risk, carrying values approximated fair value. The fair value of other loans are estimated by calculating the present value of the cash flow difference between the current rate and the market rate, for the average maturity, discounted quarterly at the market rate.
MID PENN BANCORP, INC.Notes to Consolidated Financial Statements Foreclosed Assets:Assets Held for Sale: Assets included in foreclosed assets held for sale are carried at fair value and accordingly is presented as measured on a non-recurring basis. Values are estimated using Level 3 inputs, based on appraisals that consider the sales prices of property in the proximate vicinity. Accrued Interest Receivable and Payable: The carrying amount of accrued interest receivable and payable approximates their fair values. Restricted Investment in Bank Stocks: The carrying amount of required and restricted investment in correspondent bank stock approximates fair value, and considers the limited marketability of such securities. Mortgage Servicing Rights: The fair value of servicing rights is based on the present value of estimated future cash flows on pools of mortgages stratified by rate and maturity date. Deposits: The fair value for demand deposits (e.g., interest and noninterest checking, savings, and money market deposit accounts) is by definition, equal to the amount payable on demand at the reporting date (i.e. their carrying amounts). Fair value for fixed-rate certificates of deposit was estimated using a discounted cash flow calculation by combining all fixed-rate certificates into a pool with a weighted average yield and a weighted average maturity for the pool and comparing the pool with interest rates currently being offered on a similar maturity. Short-term Borrowings: Because of time to maturity, the estimated fair value of short-term borrowings approximates the book value. Long-term Debt: The estimated fair values of long-term debt were determined using discounted cash flow analysis, based on currently available borrowing rates for similar types of borrowing arrangements. Commitments to Extend Credit and Letters of Credit: The fair value of commitments to extend credit is estimated using the fees currently charged to enter into similar agreements, taking into account market interest rates, the remaining terms and present credit worthiness of the counterparties. The fair value of guarantees and letters of credit is based on fees currently charged for similar agreements. 52
| | | MID PENN BANCORP, INC. | | Notes to Consolidated Financial Statements |
The following table summarizes the carrying value and fair value of financial instruments at December 31, 20092012 and 2008.2011. | | | | | | | | | | | | | | (Dollars in thousands) | | December 31, 2009 | | December 31, 2008 | | | | Book
Value | | Fair
Value | | Book
Value | | Fair
Value | Financial assets: | | | | | | | | | | | | | Cash and cash equivalents | | $ | 8,960 | | $ | 8,960 | | $ | 8,448 | | $ | 8,448 | Interest-bearing balances with other financial institutions | | | 38,604 | | | 38,604 | | | 50,076 | | | 50,076 | Investment securities | | | 47,345 | | | 47,345 | | | 52,739 | | | 52,739 | Net loans and leases | | | 472,699 | | | 487,476 | | | 429,138 | | | 456,323 | Restricted investment in bank stocks | | | 4,029 | | | 4,029 | | | 3,618 | | | 3,618 | Accrued interest receivable | | | 2,781 | | | 2,781 | | | 2,747 | | | 2,747 | | | | | | Financial liabilities: | | | | | | | | | | | | | Deposits | | $ | 500,015 | | $ | 506,616 | | $ | 436,824 | | $ | 447,482 | Short-term borrowing | | | 16,044 | | | 16,044 | | | 23,977 | | | 23,977 | Long-term debt | | | 38,057 | | | 39,578 | | | 55,223 | | | 58,721 | Accrued interest | | | 1,750 | | | 1,750 | | | 2,411 | | | 2,411 | | | | | | Off-balance sheet financial instruments: | | | | | | | | | | | | | Commitments to extend credit | | $ | — | | $ | — | | $ | — | | $ | — | Financial standby letters of credit | | | — | | | — | | | — | | | — |
(14) | Postretirement Benefit Plans |
| | | | | | | | | | | | | | | | | | | | | | | | (Dollars in thousands) | December 31, 2012 | | December 31, 2011 | | Carrying | | Fair | | Carrying | | Fair | | Value | | Value | | Value | | Value | Financial assets: | | | | | | | | | | | | Cash and cash equivalents | $ | 15,473 | | $ | 15,473 | | $ | 17,841 | | $ | 17,841 | Interest-bearing time balances with other financial institutions | | 23,563 | | | 23,563 | | | 27,477 | | | 27,477 | Investment securities | | 154,295 | | | 154,295 | | | 159,043 | | | 159,043 | Net loans and leases | | 478,711 | | | 495,181 | | | 475,945 | | | 498,029 | Restricted investment in bank stocks | | 2,503 | | | 2,503 | | | 3,120 | | | 3,120 | Accrued interest receivable | | 2,893 | | | 2,893 | | | 3,067 | | | 3,067 | Mortgage servicing rights | | 233 | | | 233 | | | 173 | | | 173 | | | | | | | | | | | | | Financial liabilities: | | | | | | | | | | | | Deposits | $ | 625,461 | | $ | 629,096 | | $ | 634,055 | | $ | 644,474 | Long-term debt | | 22,510 | | | 23,240 | | | 22,701 | | | 24,609 | Accrued interest payable | | 620 | | | 620 | | | 1,064 | | | 1,064 | | | | | | | | | | | | | Off-balance sheet financial instruments: | | | | | | | | | | | | Commitments to extend credit | $ | - | | $ | - | | $ | - | | $ | - | Financial standby letters of credit | | - | | | - | | | - | | | - |
MID PENN BANCORP, INC.Notes to Consolidated Financial Statements The following presents the carrying amount, fair value, and placement in the fair value hierarchy of Mid Penn’s financial instruments as of December 31, 2012. Carrying values approximate fair values for cash and cash equivalents, interest-bearing time balances with other financial institutions, restricted investment in bank stocks, mortgage servicing rights, and accrued interest receivable and payable. Other than cash and cash equivalents, which are considered Level 1 Inputs, these instruments are Level 2 Inputs. This table excludes financial instruments for which the carrying amount approximates fair value. | | | | | | | | | | | | | | | | | | | | | | | | | | | | | | | | | | | | | | | | Fair Value Measurements | | | | | | | | | Quoted Prices | | | | | | | | | | | | | in Active Markets | | | | Significant | | | | | | | | | for Identical Assets | | Significant Other | | Unobservable | | | Carrying | | | | | or Liabilities | | Observable Inputs | | Inputs | (Dollars in thousands) | | Amount | | Fair Value | | (Level 1) | | (Level 2) | | (Level 3) | Financial instruments - assets | | | | | | | | | | | | | | | | Net loans and leases | | $ | 478,711 | | $ | 495,181 | | $ | - | | $ | - | | $ | 495,181 | | | | | | | | | | | | | | | | | Financial instruments - liabilities | | | | | | | | | | | | | | | | Deposits | | $ | 625,461 | | $ | 629,096 | | $ | - | | $ | 629,096 | | $ | - | Long-term debt | | | 22,510 | | | 23,240 | | | - | | | 23,240 | | | - |
(13) Postretirement Benefit Plans Mid Penn has an unfunded noncontributory defined benefit planPlan for directors. The planPlan provides defined benefits based on years of service. Mid Penn also has other postretirement benefit plansPlans covering full-time employees. These health care and life insurance plansPlans are noncontributory. The significant aspects of each planPlan are as follows: For full-time employees who retire after at least 20 years of service, Mid Penn will pay premiums for major medical insurance (as provided to active employees) for a period ending on the earlier of the date the participant obtains other employment where major medical coverage is available or the date of the participant’sparticipant's death; however, in all cases payment of medical premiums by Mid Penn will not exceed five years. If the retiree becomes eligible for Medicare within the five-year period beginning on his/her retirement date, the Bank may pay, at its discretion, premiums for 65 Special coverage or a similar supplemental coverage. After the five-year period has expired, all Mid Penn paid benefits cease; however, the retiree may continue coverage through the Bank at his/her own expense. This planPlan was amended in 2008 to encompass only those employees that had achieved ten years of full-time continuous service to Mid Penn as of January 1, 2008. Employees hired after that date and those that had not achieved the service requirements are not eligible for the plan.Plan. For full-time employees who retire after at least 20 years of service, Mid Penn will provide term life insurance. The amount of coverage prior to age 65 will be three times the participant’sparticipant's annual salary at retirement or $50,000, whichever is less. After age 65, the life insurance coverage amount will decrease by 10% per year, subject to a minimum amount of $2,000. (c) | (c) | Directors’ Retirement Plan |
Mid Penn has an unfunded defined benefit retirement planPlan for directors with benefits based on years of service. The adoption of this planPlan generated unrecognized prior service cost of $274,000, which is being amortized over the expected future years of service of active directors. The unamortized balance at December 31, 2009,2012, was $197,000.$129,000. 53
| | | MID PENN BANCORP, INC. | | Notes to Consolidated Financial Statements |
MID PENN BANCORP, INC.Notes to Consolidated Financial Statements Health and Life The following tables provide a reconciliation of the changes in the plan’sPlan’s health and life insurance benefit obligations and fair value of planPlan assets for the years ended December 31, 20092012 and 2008,2011, and a statement of the funded status at December 31, 20092012 and 2008:2011: | | | | | | | | | | (Dollars in thousands) | | December 31, | | | | | 2009 | | | 2008 | | Change in benefit obligations: | | | | | | | | | Benefit obligations, January 1 | | $ | 607 | | | $ | 625 | | Service cost | | | 16 | | | | 26 | | Interest cost | | | 32 | | | | 34 | | Actuarial loss (gain) | | | (35 | ) | | | 9 | | Plan amendment | | | — | | | | (77 | ) | Change in assumptions | | | 34 | | | | 12 | | Benefit payments | | | (21 | ) | | | (22 | ) | | | | | | | | | | Benefit obligations, December 31 | | $ | 633 | | | $ | 607 | | | | | | | | | | | | | | Change in fair value of plan assets: | | | | | | | | | Fair value of plan assets, January 1 | | $ | — | | | $ | — | | Employer contributions | | | 21 | | | | 22 | | Benefit payments | | | (21 | ) | | | (22 | ) | | | | | | | | | | Fair value of plan assets, December 31 | | $ | — | | | $ | — | | | | | Funded status at year end | | $ | (633 | ) | | $ | (607 | ) | | | | | | | | | |
| | | | | | | | | | | | (Dollars in thousands) | December 31, | | 2012 | | 2011 | Change in benefit obligations: | | | | | | Benefit obligations, January 1 | $ | 904 | | $ | 868 | Service cost | | 21 | | | 22 | Interest cost | | 37 | | | 42 | Actuarial gain | | (76) | | | (78) | Change in assumptions | | 38 | | | 80 | Benefit payments | | (30) | | | (30) | Benefit obligations, December 31 | $ | 894 | | $ | 904 | | | | | | | | | | | | | Change in fair value of plan assets: | | | | | | Fair value of plan assets, January 1 | $ | - | | $ | - | Employer contributions | | 30 | | | 30 | Benefit payments | | (30) | | | (30) | Fair value of plan assets, December 31 | $ | - | | $ | - | | | | | | | | | | | | | Funded status at year end | $ | (894) | | $ | (904) |
The amount recognized in the consolidated balance sheet at December 31, 20092012 and 2008,2011, is as follows: | | | | | | | | (Dollars in thousands) | | 2009 | | 2008 | Accrued benefit liability | | $ | 633 | | $ | 607 |
| | | | | | (Dollars in thousands) | 2012 | | 2011 | Accrued benefit liability | $ | 894 | | $ | 904 |
The amounts recognized in accumulated other comprehensive income consist of: | | | | | | | | | | (Dollars in thousands) | | December 31, | | | | | 2009 | | | 2008 | | Net gain, net of tax effects | | $ | (126 | ) | | $ | (89 | ) | Prior service cost, net of tax effects | | | (5 | ) | | | (4 | ) |
| | | | | | (Dollars in thousands) | December 31, | | 2012 | | 2011 | Net loss, pretax | $ | 37 | | $ | 74 | Prior service cost, pretax | | (2) | | | (3) |
The accumulated benefit obligation for health and life insurance plans was $633,000$894,000 and $607,000$904,000 at December 31, 20092012 and 2008,2011, respectively. The estimated net actuarial gain that will be amortized from accumulated other comprehensive income (loss) into net periodic benefit cost during 2010 are $5,718 and ($1,053).
54
| | | MID PENN BANCORP, INC. | | Notes to Consolidated Financial Statements |
The components of net periodic postretirement benefit cost for 2009, 2008 and 2007 are as follows: | | | | | | | | | | | | | | (Dollars in thousands) | | 2009 | | | 2008 | | | 2007 | | Service cost | | $ | 16 | | | $ | 26 | | | $ | 41 | | Interest cost | | | 32 | | | | 34 | | | | 31 | | Amortization of transition obligation | | | — | | | | 4 | | | | 15 | | Amortization of prior service cost | | | (1 | ) | | | (1 | ) | | | — | | Amortization of net gain | | | (10 | ) | | | (7 | ) | | | (7 | ) | | | | | | | | | | | | | | Net periodic postretirement benefit cost | | $ | 37 | | | $ | 56 | | | $ | 80 | | | | | | | | | | | | | | |
Assumptions used in the measurement of Mid Penn’s benefit obligations at December 31, 2009 and 2008 are as follows:
| | | | | | | | | | 2009 | | | 2008 | | Weighted-average assumptions: | | | | | | | Discount rate | | 5.75 | % | | 5.75 | % | Rate of compensation increase | | 4.75 | % | | 4.75 | % |
Assumptions used in the measurement of Mid Penn’s net periodic benefit cost for the years ended December 31, 2009, 2008 and 2007 are as follows:
| | | | | | | | | | | | | 2009 | | | 2008 | | | 2007 | | Weighted-average assumptions: | | | | | | | | | | Discount rate | | 5.75 | % | | 5.75 | % | | 6.00 | % | Rate of compensation increase | | 4.75 | % | | 4.75 | % | | 5.00 | % |
Assumed health care cost trend rates at December 31, 2009, 2008 and 2007 are as follows:
| | | | | | | | | | | | | 2009 | | | 2008 | | | 2007 | | Health care cost trend rate assumed for next year | | 8.00 | % | | 8.50 | % | | 9.00 | % | Rate to which the cost trend rate is assumed to decline (the ultimate trend rate) | | 5.50 | % | | 5.50 | % | | 5.00 | % | Year that the rate reaches the ultimate trend rate | | 2014 | | | 2014 | | | 2011 | |
Assumed health care cost trend rates have a significant effect on the amounts reported for the health care plans. A one-percentage-point change in assumed health care cost trend rates would have the following effects:
| | | | | | | | (Dollars in thousands) | | One-Percentage Point | | | | Increase | | Decrease | Effect on total of service and interest cost | | $ | 5 | | $ | 5 | Effect on accumulated postretirement benefit obligation | | | 57 | | | 51 |
Mid Penn expects to contribute $23,000 to its life and health benefit plans in 2010. The following table shows the estimated benefit payments for future periods:
| | | | | (Dollars in thousands) | | | 1/1/2010 to 12/31/2010 | | $ | 23 | 1/1/2011 to 12/31/2011 | | | 29 | 1/1/2012 to 12/31/2012 | | | 31 | 1/1/2013 to 12/31/2013 | | | 30 | 1/1/2014 to 12/31/2014 | | | 40 | 1/1/2015 to 12/31/2019 | | | 342 |
Benefit obligations were measured as of December 31, 2009, for the postretirement benefit plan.
55
| | | MID PENN BANCORP, INC. | | Notes to Consolidated Financial Statements |
Retirement Plan
The following tables provide a reconciliation of the changes in the directors’ defined benefit plan’s benefit obligations and fair value of plan assets for the years ended December 31, 2009 and 2008 and a statement of the status at December 31, 2009 and 2008. This plan is unfunded.
| | | | | | | | | | (Dollars in thousands) | | December 31, | | | | | 2009 | | | 2008 | | Change in benefit obligations: | | | | | | | | | Benefit obligations, January 1 | | $ | 1,056 | | | $ | 1,098 | | Service cost | | | 20 | | | | 24 | | Interest cost | | | 56 | | | | 60 | | Actuarial gain | | | (33 | ) | | | (15 | ) | Plan amendment | | | — | | | | (60 | ) | Change in assumptions | | | — | | | | 1 | | Benefit payments | | | (124 | ) | | | (52 | ) | | | | | | | | | | Benefit obligations, December 31 | | $ | 975 | | | $ | 1,056 | | | | | | | | | | | | | | Change in fair value of plan assets: | | | | | | | | | Fair value of plan assets, January 1 | | $ | — | | | $ | — | | Employer contributions | | | 124 | | | | 52 | | Benefit payments | | | (124 | ) | | | (52 | ) | | | | | | | | | | Fair value of plan assets, December 31 | | $ | — | | | $ | — | | | | | Funded status at year end | | $ | (975 | ) | | $ | (1,056 | ) | | | | | | | | | |
Amounts recognized in the consolidated balance sheet at December 31, 2009 and 2008 are as follows:
| | | | | | | | (Dollars in thousands) | | 2009 | | 2008 | Accrued benefit liability | | $ | 975 | | $ | 1,056 |
Amounts recognized in accumulated other comprehensive income consist of:
| | | | | | | | | (Dollars in thousands) | | December 31, | | | | 2009 | | | 2008 | Net prior service cost, net of tax effect | | $ | 194 | | | $ | 142 | Net loss (gain), net of tax effect | | | (31 | ) | | | 2 |
The accumulated benefit obligation for the retirement plan was $975,000 at December 31, 2009 and $1,056,000 at December 31, 2008.
The estimated net actuarial gain and prior service costs that will be amortized from accumulated other comprehensive income (loss) into net periodic benefit cost during 2010 are $0 and $21,525.2013 is ($1,053).
The components of net periodic retirementpostretirement benefit cost for 2009, 20082012, 2011 and 20072010 are as follows: | | | | | | | | | | | (Dollars in thousands) | | 2009 | | 2008 | | 2007 | Service cost | | $ | 20 | | $ | 24 | | $ | 26 | Interest cost | | | 56 | | | 60 | | | 59 | Amortization of prior-service cost | | | 22 | | | 21 | | | 27 | | | | | | | | | | | Net periodic retirement cost | | $ | 98 | | $ | 105 | | $ | 112 | | | | | | | | | | |
| | | | | | | | | (Dollars in thousands) | 2012 | | 2011 | | 2010 | Service cost | $ | 21 | | $ | 22 | | $ | 22 | Interest cost | | 37 | | | 42 | | | 44 | Amortization of prior service cost | | (1) | | | (1) | | | (1) | Net periodic postretirement benefit cost | $ | 57 | | $ | 63 | | $ | 65 |
56
| | | MID PENN BANCORP, INC. | | Notes to Consolidated Financial Statements |
MID PENN BANCORP, INC.Notes to Consolidated Financial Statements Assumptions used in the measurement of Mid Penn’s benefit obligations at December 31, 20092012 and 20082011 are as follows: | | | | | | | | | | 2009 | | | 2008 | | Weighted-average assumptions: | | | | | | | Discount rate | | 5.75 | % | | 6.00 | % | Change in consumer price index | | 3.25 | % | | 3.50 | % |
| | | | | 2012 | | 2011 | Weighted-average assumptions: | | | | Discount rate | 4.00% | | 4.50% | Rate of compensation increase | 3.00% | | 3.50% |
Assumptions used in the measurement of Mid Penn’s net periodic benefit cost for the years ended December 31, 2009, 20082012, 2011 and 20072010 are as follows: | | | | | | | | | | | | | 2009 | | | 2008 | | | 2007 | | Weighted-average assumptions: | | | | | | | | | | Discount rate | | 5.75 | % | | 6.00 | % | | 5.75 | % | Change in consumer price index | | 3.25 | % | | 3.50 | % | | 3.25 | % |
| | | | | | | 2012 | | 2011 | | 2010 | Weighted-average assumptions: | | | | | | Discount rate | 4.50% | | 5.50% | | 5.75% | Rate of compensation increase | 3.50% | | 4.50% | | 4.75% |
Assumed health care cost trend rates at December 31, 2012, 2011 and 2010 are as follows: | | | | | | | 2012 | | 2011 | | 2010 | Health care cost trend rate assumed for next year | 7.50% | | 7.00% | | 7.50% | Rate to which the cost trend rate is assumed to decline (the | | | | | | ultimate trend rate) | 5.50% | | 5.50% | | 5.50% | Year that the rate reaches the ultimate trend rate | 2016 | | 2016 | | 2016 |
Assumed health care cost trend rates have a significant effect on the amounts reported for the health care Plans. A one-percentage-point change in assumed health care cost trend rates would have the following effects: | | | | | | (Dollars in thousands) | One-Percentage Point | | Increase | | Decrease | Effect on total of service and interest cost | $ | 5 | | $ | 4 | Effect on accumulated postretirement benefit obligation | | 68 | | | 61 |
Mid Penn expects to contribute $71,000$37,000 to its retirement planlife and health benefit Plans in 2010.2013. The following table shows the estimated benefit payments for future periods: | | | | | (Dollars in thousands) | | | 1/1/2010 to 12/31/2010 | | $ | 71 | 1/1/2011 to 12/31/2011 | | | 73 | 1/1/2012 to 12/31/2012 | | | 85 | 1/1/2013 to 12/31/2013 | | | 86 | 1/1/2014 to 12/31/2014 | | | 88 | 1/1/2015 to 12/31/2019 | | | 446 |
| | | (Dollars in thousands) | | | 1/1/2013 to 12/31/2013 | $ | 37 | 1/1/2014 to 12/31/2014 | | 47 | 1/1/2015 to 12/31/2015 | | 64 | 1/1/2016 to 12/31/2016 | | 73 | 1/1/2017 to 12/31/2017 | | 69 | 1/1/2018 to 12/31/2022 | | 370 |
Benefit obligations were measured as of December 31, 2012, for the postretirement benefit Plan.
MID PENN BANCORP, INC.Notes to Consolidated Financial Statements Retirement Plan The following tables provide a reconciliation of the changes in the directors’ defined benefit Plan’s benefit obligations and fair value of Plan assets for the years ended December 31, 2012 and 2011 and a statement of the status at December 31, 2012 and 2011. This Plan is unfunded. | | | | | | | | | | | | (Dollars in thousands) | December 31, | | 2012 | | 2011 | Change in benefit obligations: | | | | | | Benefit obligations, January 1 | $ | 1,069 | | $ | 998 | Service cost | | 22 | | | 24 | Interest cost | | 49 | | | 53 | Actuarial loss | | 10 | | | 3 | Change in assumptions | | 5 | | | 51 | Change due to plan amendment | | 53 | | | - | Benefit payments | | (69) | | | (60) | Benefit obligations, December 31 | $ | 1,139 | | $ | 1,069 | | | | | | | | | | | | | Change in fair value of plan assets: | | | | | | Fair value of plan assets, January 1 | $ | - | | $ | - | Employer contributions | | 69 | | | 60 | Benefit payments | | (69) | | | (60) | Fair value of plan assets, December 31 | $ | - | | $ | - | | | | | | | | | | | | | Funded status at year end | $ | (1,139) | | $ | (1,069) |
Amounts recognized in the consolidated balance sheet at December 31, 2012 and 2011 are as follows: | | | | | | (Dollars in thousands) | 2012 | | 2011 | Accrued benefit liability | $ | 1,139 | | $ | 1,069 |
Amounts recognized in accumulated other comprehensive income consist of: | | | | | | (Dollars in thousands) | December 31, | | 2012 | | 2011 | Net prior service cost, pretax | $ | 129 | | $ | 151 | Net loss, pretax | | 41 | | | 26 |
The accumulated benefit obligation for the retirement Plan was $1,139,000 at December 31, 2012 and $1,069,000 at December 31, 2011. The estimated prior service costs that will be amortized from accumulated other comprehensive income into net periodic benefit cost during 2013 is $21,525.
MID PENN BANCORP, INC.Notes to Consolidated Financial Statements The components of net periodic retirement cost for 2012, 2011 and 2010 are as follows: | | | | | | | | | (Dollars in thousands) | 2012 | | 2011 | | 2010 | Service cost | $ | 22 | | $ | 24 | | $ | 23 | Interest cost | | 49 | | | 53 | | | 54 | Amortization of prior-service cost | | 22 | | | 22 | | | 21 | Net periodic retirement cost | $ | 93 | | $ | 99 | | $ | 98 |
Assumptions used in the measurement of Mid Penn’s benefit obligations at December 31, 2012 and 2011 are as follows: | | | | | 2012 | | 2011 | Weighted-average assumptions: | | | | Discount rate | 4.00% | | 4.50% | Change in consumer price index | 2.00% | | 2.50% |
Assumptions used in the measurement of Mid Penn’s net periodic benefit cost for the years ended December 31, 2012, 2011 and 2010 are as follows: | | | | | | | 2012 | | 2011 | | 2010 | Weighted-average assumptions: | | | | | | Discount rate | 4.50% | | 5.50% | | 5.75% | Change in consumer price index | 2.50% | | 3.00% | | 3.25% |
Mid Penn expects to contribute $87,000 to its retirement Plan in 2013. The following table shows the estimated benefit payments for future periods: | | | (Dollars in thousands) | | | 1/1/2013 to 12/31/2013 | $ | 87 | 1/1/2014 to 12/31/2014 | | 89 | 1/1/2015 to 12/31/2015 | | 92 | 1/1/2016 to 12/31/2016 | | 94 | 1/1/2017 to 12/31/2017 | | 96 | 1/1/2018 to 12/31/2022 | | 491 |
Plan benefit obligations were measured as of December 31, 20092012 for the directors’ defined benefit plan.Plan. The Bank is the owner and beneficiary of insurance policies on the lives of certain officers and directors, which informally fund the retirement plan obligation. The aggregate cash surrender value of these policies was $3,178,000$3,513,000 and $3,204,000$3,408,000 at December 31, 20092012 and 2008,2011, respectively. (14) Other Benefit Plans (15)(a) | Other Benefit PlansDefined-Contribution Plan |
| (a) | Defined-Contribution Plan |
The Bank has a funded contributory defined-contribution planPlan covering substantially all employees. The Bank’s contributionBank did not contribute to the plan was $0 for 2009, $186,000 for 2008 and $238,000 for 2007.Plan in 2012, 2011, or 2010. (b) | (b) | Deferred Compensation Plans |
The Bank has an executive deferred compensation plan,Plan, which allows an executive officer to defer bonus compensation for a specified period in order to provide future retirement income. The only participant in this Plan is a former executive officer. At December 31, 20092012 and 2008,2011, the Bank had accrued a liability of approximately $166,000$192,000 and $164,000,$181,000, respectively, for this plan.Plan.
MID PENN BANCORP, INC.Notes to Consolidated Financial Statements The Bank also has a directors’ deferred compensation plan,Plan, which allows directors to defer receipt of fees for a specified period in order to provide future retirement income. At December 31, 20092012 and 2008,2011, the Bank had accrued a liability of approximately $377,000$423,000 and $365,000,$501,000, respectively, for this plan.Plan. (c) | (c) | Salary Continuation Agreement |
The Bank maintains a Salary Continuation Agreement (“Agreement”) for a former executive officer. The Agreement provides the former executive officer with a fixed annual benefit. The benefit is payable beginning at age 65 for a period of 15 years. At December 31, 20092012 and 2008,2011, the Bank has accrued a liability of approximately $156,000$192,000 and $145,000,$179,000, respectively, for the Agreement. The expense (income) related to the Agreement was $13,000 for 2012, $12,000 for 2011, and $11,000 for 2009, ($116,000) for 2008 and $29,000 for 2007. The income figure reflected for 2008 was the result of the resignation of the former executive officer and the resulting change in the vesting period related to the agreement.2010. 57
| | | MID PENN BANCORP, INC. | | Notes to Consolidated Financial Statements |
The Bank is the owner and beneficiary of an insurance policy on the life of the participating former executive officer, which informally funds the benefit obligation. The aggregate cash surrender value of this policy was approximately $1,036,000$1,143,000 and $1,000,000$1,107,000 at December 31, 20092012 and 2008,2011, respectively. (d) | (d) | Employee Stock Ownership Plan |
Mid Penn has an Employee Stock Ownership Plan (“ESOP”) covering substantially all employees. Contributions to the ESOP are made at the discretion of the Board of Directors. Total expense related to Mid Penn’s contribution to the ESOP for 2009, 20082012, 2011 and 20072010 was $0, $91,000 and $76,000, respectively. The ESOP held 46,27138,799 and 47,99541,873 common shares of Mid Penn stock as of December 31, 2009,2012, and December 31, 2008,2011, respectively, all of which were allocated to planPlan participants. The ESOP shares are valued using Level 1 inputs as there is an active market for identical assets at the measurement date. At December 31, 2009,2012, the fair value of Mid Penn stock on the NASDAQ Stock Market was $10.29$11.19 per common share, resulting in a total fair value of the ESOP of $476,129.$434,000. Shares held by the ESOP are considered outstanding for purposes of calculating earnings per share. Dividends paid on shares held by the ESOP are charged to retained earnings. (e) | (e) | Split Dollar Life Insurance Arrangements |
At December 31, 20092012 and 2008,2011, the Bank had Split Dollar Life Insurance arrangements with two former executives for which the aggregate collateral assignment and cash surrender values are approximately $1,588,000$1,694,000 and $1,552,000,$1,661,000, respectively. The Bank has a 401(k) planPlan that covers substantially all full-time employees. The planPlan allows employees to contribute a portion of their salaries and wages to the plan.Plan. The planPlan provides for the Bank to match a portion of employee-elected salary deferrals, subject to certain percentage maximums of their salaries and wages. The Bank’s contribution to the planPlan was $96,000, $87,000,$111,000, $115,000, and $80,000$90,000 for the years ending December 31, 2009, 2008,2012, 2011, and 20072010, respectively. 58
(g) | | | MID PENN BANCORP, INC. | | Notes to Consolidated Financial StatementsEmployee Stock Purchase Plan |
Mid Penn has an Employee Stock Purchase Plan (“ESPP”) in which all employees are eligible to participate. The Plan allows employees to use a portion of their salaries and wages to purchase common shares of Mid Penn stock at the market value of shares at the end of each calendar quarter.
MID PENN BANCORP, INC.Notes to Consolidated Financial Statements (15) Federal Income Taxes (16)
| Federal Income Taxes |
The following temporary differences gave rise to the net deferred tax asset at December 31, 20092012 and 2008:2011: | | | | | | | | | | (Dollars in thousands) | | 2009 | | | 2008 | | Deferred tax assets: | | | | | | | | | Allowance for loan and lease losses | | $ | 2,500 | | | $ | 1,758 | | Loan fees | | | 48 | | | | — | | Benefit plans | | | 864 | | | | 996 | | Nonaccrual interest | | | 207 | | | | 114 | | Legal fees | | | 12 | | | | — | | Disallowed charitable contributions | | | 26 | | | | — | | Core deposit intangible | | | — | | | | 4 | | Severance | | | 68 | | | | 150 | | | | | | | | | | | | | | 3,725 | | | | 3,022 | | | | | | | | | | | Deferred tax liabilities: | | | | | | | | | Depreciation | | | (651 | ) | | | (263 | ) | Loan fees | | | — | | | | (82 | ) | Core deposit intangible | | | (7 | ) | | | — | | Bond accretion | | | (96 | ) | | | (69 | ) | Prepaid expenses | | | (160 | ) | | | (73 | ) | Goodwill and intangibles | | | (133 | ) | | | (100 | ) | Unrealized gain on securities | | | (421 | ) | | | (285 | ) | | | | | | | | | | | | | (1,468 | ) | | | (872 | ) | | | | | | | | | | Deferred tax asset, net | | $ | 2,257 | | | $ | 2,150 | | | | | | | | | | |
| | | | | | | | | | | | (Dollars in thousands) | 2012 | | 2011 | Deferred tax assets: | | | | | | Allowance for loan and lease losses | $ | 1,873 | | $ | 2,283 | Loan fees | | 198 | | | 266 | Benefit plans | | 974 | | | 1,082 | Nonaccrual interest | | 1,204 | | | 882 | AMT Credit Carryforward | | 333 | | | - | Other | | 108 | | | 182 | | | 4,690 | | | 4,695 | | | | | | | Deferred tax liabilities: | | | | | | Depreciation | | (1,109) | | | (897) | Bond accretion | | (80) | | | (115) | Goodwill and intangibles | | (234) | | | (191) | Unrealized gain on securities | | (1,253) | | | (1,053) | Prepaid expenses | | (222) | | | - | Other | | (3) | | | - | | | (2,901) | | | (2,256) | Deferred tax asset, net | $ | 1,789 | | $ | 2,439 |
In assessing the realizability of federal or state deferred tax assets, management considers whether it is more likely than not that some portion or all of the deferred tax assets will not be realized. The ultimate realization of deferred tax assets is dependent upon the generation of future taxable income during periods in which those temporary differences become deductible. Management considers the scheduled reversal of deferred tax liabilities, projected future taxable income, and prudent, feasible and permissible as well as available tax planning strategies in making this assessment. Based on the level of historical taxable income and projections for future taxable income over the periods in which the deferred tax assets are deductible, management believes it is more likely than not that Mid Penn will realize the benefits of these deferred tax assets. The provision for (benefit from) provision for income taxes consists of the following: | | | | | | | | | | | | | | (Dollars in thousands) | | 2009 | | | 2008 | | | 2007 | | Current | | $ | (1,965 | ) | | $ | 1,264 | | | $ | 1,821 | | Deferred | | | (243 | ) | | | (160 | ) | | | (427 | ) | | | | | | | | | | | | | | Total (benefit from) provision for income taxes | | $ | (2,208 | ) | | $ | 1,104 | | | $ | 1,394 | | | | | | | | | | | | | | |
| | | | | | | | | (Dollars in thousands) | 2012 | | 2011 | | 2010 | Current | $ | 794 | | $ | 1,749 | | $ | 704 | Deferred | | 450 | | | (526) | | | (288) | Total provision for income taxes | $ | 1,244 | | $ | 1,223 | | $ | 416 |
A reconciliation of income tax at the statutory rate to Mid Penn’sPenn's effective rate is as follows: | | | | | | | | | | | | | | (Dollars in thousands) | | 2009 | | | 2008 | | | 2007 | | (Benefit) provision at the expected statutory rate | | $ | (1,531 | ) | | $ | 1,596 | | | $ | 2,001 | | Effect of tax-exempt income | | | (609 | ) | | | (571 | ) | | | (601 | ) | Effect of investment in life insurance | | | (149 | ) | | | (91 | ) | | | (92 | ) | Nondeductible interest | | | 62 | | | | 68 | | | | 81 | | Other items | | | 19 | | | | 102 | | | | 5 | | | | | | | | | | | | | | | (Benefit from) provision for income taxes | | $ | (2,208 | ) | | $ | 1,104 | | | $ | 1,394 | | | | | | | | | | | | | | |
| | | | | | | | | (Dollars in thousands) | 2012 | | 2011 | | 2010 | Provision at the expected statutory rate | $ | 2,106 | | $ | 1,960 | | $ | 1,076 | Effect of tax-exempt income | | (827) | | | (710) | | | (635) | Effect of investment in life insurance | | (84) | | | (88) | | | (92) | Nondeductible interest | | 49 | | | 49 | | | 51 | Other items | | - | | | 12 | | | 16 | Provision for income taxes | $ | 1,244 | | $ | 1,223 | | $ | 416 |
Mid Penn has no unrecognized tax benefits that, if recognized, would favorably affect the effective income tax rate in future periods. Mid Penn does not expect the total amount of unrecognized tax benefits to significantly increase or decrease in the next twelve months. No amounts for interest and penalties were recorded in income tax (benefit) expense in the consolidated statement of operationsincome for the years ended December 31, 20092012, 2011, or 2008.2010. There were no amounts accrued for interest and penalties at December 31, 20092012 or 2008.2011.
MID PENN BANCORP, INC.Notes to Consolidated Financial Statements Mid Penn and its subsidiaries are subject to U.S. federal income tax and income tax for the state of Pennsylvania. Mid Penn is no longer subject to examination by taxing authorities for years before 2006.2009. Tax years 20062009 through the present, with limited exception, remain open to examination. 59
| | | MID PENN BANCORP, INC. | | Notes to Consolidated Financial Statements |
(16) Core Deposit Intangible(17) | Core Deposit Intangible |
A summary of core deposit intangible is as follows at December 31, 2009.2012. | | | | | | | | | | | | | | (Dollars in thousands) | | 2004 | | | 2006 | | | Total | | | | | Acquisition | | | Acquisition | | | Gross carrying amount | | $ | 291 | | | $ | 232 | | | $ | 523 | | Less accumulated amortization | | | (202 | ) | | | (89 | ) | | | (291 | ) | | | | | | | | | | | | | | Net carrying amount | | $ | 89 | | | $ | 143 | | | $ | 232 | | | | | | | | | | | | | | |
| | | | | | | | | | | | | | | | | | (Dollars in thousands) | 2004 | | 2006 | | | | | Acquisition | | Acquisition | | Total | Gross carrying amount | $ | 291 | | $ | 232 | | $ | 523 | Less accumulated amortization | | (291) | | | (176) | | | (467) | Net carrying amount | $ | - | | $ | 56 | | $ | 56 |
The core deposit intangibles for the acquisitions are being amortized over the weighted average useful life of 8 years, with no estimated residual value. Amortization expense amounted to $45,000 in 2012 and $65,000 in 2009, $66,000 in 2008,2011 and $66,000 in 2007.2010. The estimated amortization expenses of intangible assets for each of the fivetwo succeeding fiscal years are as follows: | | | | | (Dollars in thousands) | | | 2010 | | $ | 65 | 2011 | | | 65 | 2012 | | | 45 | 2013 | | | 29 | 2014 | | | 28 | | | | | | | $ | 232 | | | | |
| | | (Dollars in thousands) | | | 2013 | $ | 29 | 2014 | | 27 | | $ | 56 |
(17) Regulatory Matters Mid Penn Bancorp, Inc., Inc. is a financialbank holding company and, as such, chooses to maintain a well-capitalized status in its bank subsidiary. Quantitative measures established by regulation to ensure capital adequacy require Mid Penn to maintain minimum amounts and ratios (set forth below) of Tier 1 capital to average assets and of total capital (as defined in the regulations) to risk-weighted assets. As of December 31, 20092012 and December 31, 2008,2011, Mid Penn met all capital adequacy requirements to which the Bank is subject, and the Bank is considered “well-capitalized”. However, future changes in regulations could increase capital requirements and may have an adverse effect on capital resources. The FDIC Board has adopted a restoration plan that raised assessment rates for deposit insurance premiums for 2009, and enacted a special emergency assessment that has significantly affected operating results for the Corporation. The assessment was .05% of total Bank Assets, less Tier 1 Capital as of June 30, 2009, and was paid on September 30, 2009. The special assessment for Mid Penn’s banking subsidiary was $265,000.
The FDIC has also adopted a prepayment of projected deposit insurance premiums for a three-year period that would be paid on December 30, 2009. The prepayment was approximately $2,719,000 for the Corporation. The prepayment will be carried as a prepaid expense in other assets on the balance sheet and amortized into expense in the operating period to which it applies. As of December 31, 2012, the unamortized balance was $12,000. The prepayment period ended on December 31, 2012, and any excess funds in the prepaid account will be refunded by the FDIC in 2013. Certain restrictions exist regarding the ability of the Bank to transfer funds to the Corporation in the form of cash dividends, loans or advances. At December 31, 2009,2012, $0 of undistributed earnings of the Bank included in the consolidated shareholders’ equity was available for distribution to the Corporation as dividends without prior regulatory approval, subject to regulatory capital requirements below.
| | | MID PENN BANCORP, INC. | | Notes to Consolidated Financial Statements |
MID PENN BANCORP, INC.Notes to Consolidated Financial Statements Mid Penn maintained the following regulatory capital levels, leverage ratios, and risk-based capital ratios as of December 31, 2009,2012, and December 31, 2008,2011, as follows: | | | | | | | | | | | | | | | | | | | | | | | | | | | | | | | | | | | | | | | | | | | | (Dollars in thousands) | | Capital Adequacy | | | | | | | Capital Adequacy | | | | | | | | | Actual: | | Minimum Capital
Required: | | To Be Well-Capitalized
Under Prompt
Corrective
Action Provisions: | | | | | | | | | | | | To Be Well-Capitalized | | | | Amount | | Ratio | | Amount | | Ratio | | Amount | | Ratio | | | | | | | | | | | | Under Prompt | | | | | | | | Minimum Capital | | Corrective | | | Actual: | | Required: | | Action Provisions: | | | Amount | Ratio | | Amount | Ratio | | Amount | Ratio | Corporation | | | | | | | | | | | | | | | | | | | | | | | | | | | As of December 31, 2009: | | | | | | | | | | | | | | As of December 31, 2012: | | | | | | | | | | | | | | | | Tier 1 Capital (to Average Assets) | | $ | 44,665 | | 7.4 | % | | $ | 24,033 | | 4.0 | % | | | N/A | | N/A | | $ | 48,822 | | 6.8% | | $ | 28,530 | | 4.0% | | $ | N/A | | N/A | Tier 1 Capital (to Risk Weighted Assets) | | | 44,665 | | 9.2 | % | | | 19,329 | | 4.0 | % | | | N/A | | N/A | | | 48,822 | | 10.0% | | | 19,593 | | 4.0% | | | N/A | | N/A | Total Capital (to Risk Weighted Assets) | | | 50,727 | | 10.5 | % | | | 38,658 | | 8.0 | % | | | N/A | | N/A | | | 54,421 | | 11.1% | | | 39,185 | | 8.0% | | | N/A | | N/A | | | | | | | | | | | | | | | | | Bank | | | | | | | | | | | | | | | | | | | | | | | | | | | As of December 31, 2009: | | | | | | | | | | | | | | As of December 31, 2012: | | | | | | | | | | | | | | | | Tier 1 Capital (to Average Assets) | | $ | 44,434 | | 7.4 | % | | $ | 23,913 | | 4.0 | % | | $ | 29,892 | | 5.0 | % | $ | 48,764 | | 6.9% | | $ | 28,111 | | 4.0% | | $ | 35,138 | | 5.0% | Tier 1 Capital (to Risk Weighted Assets) | | | 44,434 | | 9.2 | % | | | 19,329 | | 4.0 | % | | | 28,993 | | 6.0 | % | | 48,764 | | 10.0% | | | 19,593 | | 4.0% | | | 29,389 | | 6.0% | Total Capital (to Risk Weighted Assets) | | | 50,496 | | 10.4 | % | | | 38,658 | | 8.0 | % | | | 48,322 | | 10.0 | % | | 54,363 | | 11.1% | | | 39,185 | | 8.0% | | | 48,981 | | 10.0% | | | | | | | | | | | | | | | | | Corporation | | | | | | | | | | | | | | | | | | | | | | | | | | | As of December 31, 2008: | | | | | | | | | | | | | | As of December 31, 2011: | | | | | | | | | | | | | | | | Tier 1 Capital (to Average Assets) | | $ | 48,998 | | 8.7 | % | | $ | 23,641 | | 4.0 | % | | | N/A | | N/A | | $ | 50,451 | | 7.0% | | $ | 28,679 | | 4.0% | | $ | N/A | | N/A | Tier 1 Capital (to Risk Weighted Assets) | | | 48,998 | | 11.3 | % | | | 17,284 | | 4.0 | % | | | N/A | | N/A | | | 50,451 | | 10.3% | | | 19,566 | | 4.0% | | | N/A | | N/A | Total Capital (to Risk Weighted Assets) | | | 54,399 | | 12.6 | % | | | 34,568 | | 8.0 | % | | | N/A | | N/A | | | 56,513 | | 11.6% | | | 39,132 | | 8.0% | | | N/A | | N/A | | | | | | | | | | | | | | | | | Bank | | | | | | | | | | | | | | | | | | | | | | | | | | | As of December 31, 2008: | | | | | | | | | | | | | | As of December 31, 2011: | | | | | | | | | | | | | | | | Tier 1 Capital (to Average Assets) | | $ | 39,975 | | 7.2 | % | | $ | 22,146 | | 4.0 | % | | $ | 27,683 | | 5.0 | % | $ | 50,265 | | 7.1% | | $ | 28,326 | | 4.0% | | $ | 35,408 | | 5.0% | Tier 1 Capital (to Risk Weighted Assets) | | | 39,975 | | 9.3 | % | | | 17,278 | | 4.0 | % | | | 25,917 | | 6.0 | % | | 50,265 | | 10.4% | | | 19,367 | | 4.0% | | | 29,051 | | 6.0% | Total Capital (to Risk Weighted Assets) | | | 45,376 | | 10.5 | % | | | 34,556 | | 8.0 | % | | | 43,195 | | 10.0 | % | | 56,327 | | 11.6% | | | 38,735 | | 8.0% | | | 48,419 | | 10.0% |
(19) | Concentration of Risk and Off-Balance Sheet Risk |
(18) Concentration of Risk and Off-Balance Sheet Risk The Bank is a party to financial instruments with off-balance sheet risk in the normal course of business to meet the financing needs of its customers. These financial instruments include commitments to extend credit and financial standby letters of credit. Those instruments involve, to varying degrees, elements of credit and interest rate risk in excess of the amount recognized in the consolidated balance sheets. The Bank evaluates each customer’scustomer's creditworthiness on a case-by-case basis. The amount of collateral obtained, if deemed necessary by the Bank upon extension of credit, is based on management’smanagement's credit evaluation of the borrower. Collateral held varies but may include accounts receivable, inventory, property, plant, and equipment, and income-producing commercial properties. The Bank’sBank's exposure to credit loss in the event of nonperformance by the other party to the financial instrument for commitments to extend credit and financial standby letters of credit written is represented by the contractual amount of those instruments. The Bank uses the same credit policies in making commitments and conditional obligations as it does for direct, funded loans. Commitments to extend credit are agreements to lend to a customer as long as there is no violation of any condition established in the contract. Commitments generally have fixed expiration dates or other termination clauses and may require payment of a fee. Since many of the commitments are expected to expire without being drawn upon, the total commitment amounts do not necessarily represent future cash requirements. Financial standby
Standby letters of credit are conditional commitments issued by the Bank to guarantee the performance of a customer to a third party. The credit risk involved in issuing letters of credit is essentially the same as that involved in extending loan facilities to customers. The term of these financial standby letters of credit is generally one year or less. As of December 31, 2009,2012, commitments to extend credit amounted to $116,486,000$99,958,000 and financial standby letters of credit amounted to $10,697,000.$10,417,000.
| | | MID PENN BANCORP, INC. | | Notes to Consolidated Financial Statements |
MID PENN BANCORP, INC.Notes to Consolidated Financial Statements Significant concentration of credit risk may occur when obligations of parties engaged in similar activities occur and accumulate in significant amounts. In analyzing the Bank’sBank's exposure to significant concentration of credit risk, management set a parameter of 10% or more of the Bank’sBank's total net loans outstanding as the threshold in determining whether the obligations of the same or affiliated parties would be classified as significant concentration of credit risk. Concentrations by industry, product line, type of collateral, etc., are also considered. U.S. Treasury securities, obligations of U.S. government agencies and corporations, and any assets collateralized by the same were excluded. As of December 31, 2009,2012, commercial real estate financing was the only similar activity that met the requirements to be classified as a significant concentration of credit risk. However, there is a geographical concentration in that most of the Bank’sBank's business activity is with customers located in Central Pennsylvania, specifically within the Bank’sBank's trading area made up of Dauphin County, lower Northumberland County, western Schuylkill County and eastern Cumberland County. The Bank’sBank's highest concentrations of credit within the loan portfolio are in the areas of Commercial Real Estate financing (25.4%), Hotel/Motel financing (7.0%), Commercial Construction and Land Development (5.6%), and Restaurant financings (2.5%(52.7%) as of December 31, 2009.2012. (20) | Commitments and Contingencies |
(19) Commitments and Contingencies Operating Leases: In April 2005, Mid Penn entered into a non-cancelable operating lease agreement to lease approximately 2,500 square feet of office space in the downtown Harrisburg area, with the initial term extending through April 2010. Mid Penn has the option to renew this lease for two additional five-year periods and has exercised the first of these options, extending the term of the lease through April of 2015. Mid Penn also has entered into a non-cancelable lease on a drive-up ATM site in Halifax, PA. This lease was renewed in 2012 and runs through October of 2012.2015. In December 2011, Mid Penn entered into a non-cancelable operating lease agreement to lease approximately 5,900 square feet of office space on Derry St. in the Harrisburg area, with the initial term extending through November 2014. Mid Penn has the option to renew this lease for two additional three-year periods. Minimum future rental payments under these operating leases as of December 31, 20092012 are as follows: | | | | | (Dollars in thousands) | | | 2010 | | $ | 79 | 2011 | | | 81 | 2012 | | | 82 | 2013 | | | 78 | 2014 | | | 80 | Thereafter | | | 27 | | | | | | | $ | 427 | | | | |
| | | (Dollars in thousands) | | | | | | 2013 | $ | 114 | 2014 | | 113 | 2015 | | 28 | | $ | 255 |
Mid Penn paid rent payments in 2009, 2008,2012, 2011, and 20072010 of $97,000, $92,000,$120,000, $79,000, and $98,000$90,000, respectively. Litigation: Mid Penn is subject to lawsuits and claims arising out of its business. In the opinion of management, after consultation with legal counsel, the ultimate disposition of these matters is not expected to have a material adverse effect on the consolidated financial condition of Mid Penn. (20) Common Stock Mid Penn has reserved 50,000 of authorized, but unissued shares of its common stock for issuance under a Stock Bonus Plan (the “Plan”). Shares issued under the Plan are at the discretion of the boardBoard of directors.Directors. Under Mid Penn’s amended and restated dividend reinvestment plan, (DRIP), 200,000 of Mid Penn’s authorized but unissued common stock are reserved for issuance. The DRIP also allows for voluntary cash payments within specified limits, for the purchase of additional shares. In September of 2005, Mid Penn’s Board of Directors approved a Stock Repurchase Program under which the Corporation could buy back up to 250,000 shares of Mid Penn Bancorp, Inc., Inc. Common Stock. Through December 31, 2008, 53,560 shares had been repurchased at an average price of $24.75 per share. Mid Penn retired all treasury stock in December of 2008 and the Stock Repurchase Program was terminated on December 10, 2008.
62
| | | MID PENN BANCORP, INC. | | Notes to Consolidated Financial Statements |
MID PENN BANCORP, INC.Notes to Consolidated Financial Statements (21) Preferred Stock On December 19, 2008, Mid Penn entered into and closed a Letter Agreement with the United States Department of the Treasury (the “Treasury”) pursuant to which the Treasury invested $10,000,000 in the CorporationMid Penn Bank under the Treasury’s Capital Purchase Program (the “CPP”). Under the CPP,letter agreement, the Treasury received (1) 10,000 shares of Series A Fixed Rate Cumulative Perpetual Preferred Stock, $1,000 liquidation preference (“Series A Preferred Stock”), and (2) Warrantswarrants to purchase up to 73,099 shares of the Corporation’sMid Penn common stock at an exercise price of $20.52 per share. The $10,000,000 in new capital is treated as Tier 1 Capital.share (the “Warrants”). The Series A Preferred Stock pays cumulative dividends at
On December 28, 2012, Mid Penn entered into a rate of 5% per annum for the first five years and 9% per annum thereafter. Pursuant to the American Recovery and Reinvestment Act of 2009, the Secretary ofletter agreement with the Treasury shall permit, subjectpursuant to consultation with the appropriate Federal banking agency, the Corporation to redeem the Series A Preferred Stock. The Corporation may do so without regard to the source of the funds to be used to redeem the Series A Preferred Stock or any minimum waiting period. If the Corporation elects to redeem the Series A Preferred Stock prior to February 15, 2012, and receives approvalwhich Mid Penn repurchased from the Treasury and the Board of Governors of the Federal Reserve System, it must redeem at least $2,500,000 of the Series A Preferred Stock. Upon redemptionall 10,000 shares of the Series A Preferred Stock issued to the SecretaryTreasury which constitutes all of the Treasury shall liquidate the warrants associated with the Corporation’s participation in the CPP at the current market price. Upon the appropriate approval, the Corporation may redeemissued and outstanding shares of Series A Preferred Stock. Mid Penn repurchased the Series A Preferred Stock atfor a purchase price equal to the original purchase priceaggregate liquidation amount of the Preferred Stock of $10,000,000, plus accrued but unpaid dividends of $59,722. All 10,000 shares of Series A Preferred Stock have subsequently been cancelled. On January 23, 2013, Mid Penn entered into a letter agreement with the Treasury pursuant to which Mid Penn repurchased from the Treasury on that date the Warrants for $58,479. The Warrants have subsequently been cancelled. As of the date hereof, Mid Penn has no further financial obligations under the Series A Preferred Stock, the Warrants or the Treasury’s CPP. (22) Stock Issued Under Private Placement Offering On September 26, 2012, Mid Penn filed with the Pennsylvania Department of State a Statement with Respect to Shares which, effective upon filing, designated a series of preferred stock as “7% Non-Cumulative Non-Voting Non-Convertible Perpetual Preferred Stock, Series B” (“Series B Preferred Stock”), and set forth the voting and other powers, designations, preferences and relative, participating, optional or other rights, and the qualifications, limitations or restrictions of the Series B Preferred Stock. Sales of Preferred Stock Mid Penn sold shares of its Non-Cumulative Non-Voting Non-Convertible Perpetual Preferred Stock, Series B (“Series B Preferred Stock”), in transactions exempt from registration under the Securities Act of 1933, pursuant to Section 4(2) thereof. Between September 26, 2012, and December 31, 2012, Mid Penn sold 4,880 shares of its Series B Preferred Stock for total gross proceeds of $4,880,000, which have been offset by issuance costs of $50,000. On January 3, 2013, 120 additional shares were sold resulting in total gross proceeds of $5,000,000 for the Series B Preferred Stock offering. The following table summarizes the Series B Preferred Stock shares sold and the gross proceeds received through the private placement offering as of December 31, 2012: | | | | | | | (Dollars in thousands) | | | | | | | | | | | | | | Period | | Shares | | Gross Proceeds | September 26, 2012 - September 30, 2012 | | | 345 | | $ | 345,000 | October 1, 2012 - December 31, 2012 | | | 4,535 | | | 4,535,000 | Total | | | 4,880 | | $ | 4,880,000 |
Terms of the Series B Preferred Stock The annual dividend rate for the Series B Preferred Stock is 7% per annum of the liquidation preference of the Series B Preferred Stock or $70.00 per annum for each share of Series B Preferred Stock. The Board of Directors must approve each dividend payment from legally available funds. Dividends are payable to holders of record of the Series B Preferred Stock as they appear on our books on the record dates fixed by our Board of Directors. Dividends on any of Series B Preferred Stock are non-cumulative and we currently expect them to be declared quarterly for payment on February 15, May 15, August 15, and November 15 of each year. If a dividend payment date is not a business day, the dividend will be paid on the immediately preceding business day but no additional dividend payment will be prorated from the date of purchase to the first dividend payment date over a quarterly dividend period of 90 days.
MID PENN BANCORP, INC.Notes to Consolidated Financial Statements Mid Penn may redeem shares of its Series B Preferred Stock at its option, in whole or in part, at any time subject to prior approval of the Federal Reserve Board, if any. then required, at a redemption price of $1,020 per share of Series B Preferred Stock plus an amount equal to any declared but unpaid dividends and in accordance with the terms and conditions set forth in a Certificate of Designations for the Series B Preferred Stock as filed with the Pennsylvania Department of State. (23) Parent Company Statements | | | | | | CONDENSED BALANCE SHEETS | | | | | | (Dollars in thousands) | December 31, | | 2012 | | 2011 | ASSETS | | | | | | Cash and cash equivalents | $ | 48 | | $ | 50 | Investment in subsidiaries | | 52,162 | | | 53,322 | Other assets | | 25 | | | 80 | Total assets | $ | 52,235 | | $ | 53,452 | | | | | | | LIABILITIES AND SHAREHOLDERS' EQUITY | | | | | | Other liabilities | $ | 15 | | $ | - | Shareholders' equity | | 52,220 | | | 53,452 | Total liabilities and shareholders' equity | $ | 52,235 | | $ | 53,452 |
| | | | | | | | | CONDENSED STATEMENTS OF INCOME | | | | | | | | | (Dollars in thousands) | For Years Ended December 31, | | 2012 | | 2011 | | 2010 | | | | | | | | | | Other Income | $ | 4 | | $ | - | | $ | - | Dividends from subsidiaries | | 6,628 | | | 1,246 | | | 575 | Undistributed (loss) earnings of subsidiaries | | (1,538) | | | 3,398 | | | 2,301 | Other expenses | | (217) | | | (153) | | | (193) | Income tax benefit | | 74 | | | 52 | | | 65 | Net income | | 4,951 | | | 4,543 | | | 2,748 | Preferred stock dividends & discount accretion | | 514 | | | 514 | | | 514 | Net income available to common shareholders | $ | 4,437 | | $ | 4,029 | | $ | 2,234 |
| | | | | | | | | CONDENSED STATEMENTS OF CASH FLOWS | | | | | | | | | (Dollars in thousands) | For Years Ended December 31, | | 2012 | | 2011 | | 2010 | CASH FLOWS FROM OPERATING ACTIVITIES | | | | | | | | | Net income | $ | 4,951 | | $ | 4,543 | | $ | 2,748 | Undistributed loss (earnings) of subsidiaries | | 1,538 | | | (3,398) | | | (2,301) | Decrease (increase) in other assets | | 40 | | | (52) | | | - | Increase in other liabilities | | 15 | | | - | | | - | Net cash provided by operating activities | | 6,544 | | | 1,093 | | | 447 | | | | | | | | | | CASH FLOWS FROM FINANCING ACTIVITIES | | | | | | | | | | | | | | | | | | Investment in subsidiaries | | - | | | - | | | (5) | Dividends paid | | (1,432) | | | (1,196) | | | (500) | Series A preferred stock redemption | | (10,000) | | | - | | | - | Series B preferred stock issuance, net of costs | | 4,830 | | | - | | | - | Employee Stock Purchase Plan | | 56 | | | 38 | | | - | Net cash used in financing activities | | (6,546) | | | (1,158) | | | (505) | Net decrease in cash and cash equivalents | | (2) | | | (65) | | | (58) | Cash and cash equivalents, beginning of year | | 50 | | | 115 | | | 173 | Cash and cash equivalents, end of year | $ | 48 | | $ | 50 | | $ | 115 |
MID PENN BANCORP, INC.Notes to Consolidated Financial Statements (24) Recent Accounting Pronouncements Accounting Standard Update 2013-02: Comprehensive Income (Topic 220) - Reporting of Amounts Reclassified Out of Accumulated Other Comprehensive Income The related Warrants expire in ten years and are immediately exercisable upon their issuance. To participateobjective of this ASU is to improve the reporting of reclassifications out of accumulated other comprehensive income. This ASU requires an entity to report the effect of significant reclassifications out of accumulated other comprehensive income, by component, on the respective line items in the program,income statement if the Corporationamount being reclassified is required under U.S. generally accepted accounting principles (GAAP) to be reclassified in its entirety to net income. Reclassifications that are not required under U.S. GAAP to be reclassified in their entirety to net income in the same reporting period are required to be cross-referenced to other U.S. GAAP disclosures that provide additional detail about those amounts. This is the case when a portion of the amount reclassified out of accumulated other comprehensive income is reclassified to a balance sheet account rather than directly to income or expense in the same reporting period. For example, some portion of net periodic pension cost is immediately reported in net income, but other portions may be capitalized to an asset balance such as fixed assets or inventory. An entity with significant defined benefit pension costs reclassified out of accumulated other comprehensive income but not to net income in its entirety in the same reporting period should identify the amount of each pension cost component reclassified out of accumulated other comprehensive income and make reference to the relevant pension cost disclosure that provides greater detail about these reclassifications.
The amendments do not change the current requirements for reporting net income or other comprehensive income in financial statements. However, the amendments require an entity to provide information about the amounts reclassified out of accumulated other comprehensive income by component. In addition, an entity is required to meet certain standards, including; (1) ensuring that incentive compensation for senior executives does not encourage unnecessary and excessive risk that threatenpresent, either on the valueface of the Corporation; (2) requiring a clawback of any bonusstatement where net income is presented or incentive compensation paid to a senior executive based on statements of earnings, gains or other criteria that are later proven to be materially inaccurate; (3) prohibiting the Corporation from making any golden parachute payment to a senior executive based on applicable Internal Revenue Code provisions; and (4) agreeing not to deduct for tax purposes executive compensation in excess of $500,000 for each senior executive. Based on the Program term sheet provided by the Treasury, the following are the effects on holders of common stock from the issuance of Senior Preferred stock to the Treasury under the Program:
Restrictions on Dividends
For as long as any Senior Preferred shares are outstanding, no dividends could be declared or paid on common shares, nor could the Corporation repurchase or redeem any common shares, unless all accrued and unpaid dividends for all past dividend periods on the Senior Preferred shares had been fully paid. In addition, the consent of the Treasury would be required for any increase in the per share dividends on common shares until the third anniversarynotes, significant amounts reclassified out of the date of the Senior Preferred investment unless prior to such third anniversary, the Senior Preferred shares were redeemed in whole or the Treasury had transferred all of the Senior Preferred shares to third parties.
Repurchases
The Treasury’s consent would be required for any share repurchases (other than (1) repurchases of the Senior Preferred shares and (2) repurchases of common shares in connection with any benefit plan in the ordinary course of business consistent with past practice) until the third anniversary of the date of this investment unless prior to such third anniversary the Senior Preferred shares had been redeemed in whole or the Treasury had transferred all of the Senior Preferred shares to third parties. In addition, there could be no share repurchases of common shares if prohibited as described under “Restrictions on Dividends” above.
Voting Rights
The Senior Preferred shares would be non-voting,accumulated other than class voting rights on (1) any authorization or issuance of shares ranking senior to the Senior Preferred shares, (2) any amendment to the rights of senior Preferred, or (3) any merger, exchange or similar transaction which would adversely affect the rights of the Senior Preferred. If dividends on the Senior Preferred shares were not paid in full for six dividend periods, whether or not consecutive, the Senior Preferred shareholder(s) would have the right to elect two directors. The right to elect directors would end when full dividends had been paid for four consecutive dividend periods.comprehensive income.
63
| | | MID PENN BANCORP, INC. | | Notes to Consolidated Financial Statements |
(23) | Parent Company Statements |
CONDENSED BALANCE SHEETS
| | | | | | | | (Dollars in thousands) | | December 31, | | | | 2009 | | 2008 | ASSETS | | | | | | | Cash and cash equivalents | | $ | 173 | | $ | 57 | U.S. Treasury investments | | | — | | | 9,000 | Investment in subsidiaries | | | 46,475 | | | 41,779 | Other assets | | | 56 | | | 70 | | | | | | | | Total assets | | $ | 46,704 | | $ | 50,906 | | | | | | | | | | | LIABILITIES AND SHAREHOLDERS’ EQUITY | | | | | | | Other liabilities | | $ | — | | $ | 16 | Shareholders’ equity | | | 46,704 | | | 50,890 | | | | | | | | Total liabilities and shareholders’ equity | | $ | 46,704 | | $ | 50,906 | | | | | | | |
CONDENSED STATEMENTS OF OPERATIONS
| | | | | | | | | | | | | | (Dollars in thousands) | | For Years Ended December 31, | | | | | 2009 | | | 2008 | | | 2007 | | Dividends from subsidiaries | | $ | 2,498 | | | $ | 3,077 | | | $ | 3,224 | | Undistributed (loss) earnings of subsidiaries | | | (4,673 | ) | | | 628 | | | | 1,517 | | Other expenses | | | (182 | ) | | | (201 | ) | | | (107 | ) | Income tax benefit | | | 62 | | | | 84 | | | | 37 | | | | | | | | | | | | | | | Net (loss) income | | $ | (2,295 | ) | | $ | 3,588 | | | $ | 4,671 | | | | | | | | | | | | | | |
CONDENSED STATEMENTS OF CASH FLOWS
| | | | | | | | | | | | | | (Dollars in thousands) | | For Years Ended December 31, | | | | | 2009 | | | 2008 | | | 2007 | | CASH FLOWS FROM OPERATING ACTIVITIES | | | | | | | | | | | | | Net (loss) income | | $ | (2,295 | ) | | $ | 3,588 | | | $ | 4,671 | | Loss (income) from subsidiaries | | | 4,673 | | | | (628 | ) | | | (1,517 | ) | Decrease in other liabilities | | | — | | | | (16 | ) | | | — | | | | | | | | | | | | | | | Net cash provided by operating activities | | | 2,378 | | | | 2,944 | | | | 3,154 | | | | | | | | | | | | | | | | | | | CASH FLOWS FROM INVESTING ACTIVITIES | | | | | | | | | | | | | Proceeds from the maturity of investment securities | | | 9,000 | | | | — | | | | — | | Purchase of investment securities | | | — | | | | (9,000 | ) | | | — | | | | | | | | | | | | | | | Net cash provided by (used in) investing activities | | | 9,000 | | | | (9,000 | ) | | | — | | | | | | | | | | | | | | | | | | | CASH FLOWS FROM FINANCING ACTIVITIES | | | | | | | | | | | | | Issued senior preferred stock | | | — | | | | 10,000 | | | | — | | Investment in subsidiaries | | | (9,000 | ) | | | (1,000 | ) | | | — | | Dividends paid | | | (2,262 | ) | | | (2,787 | ) | | | (2,773 | ) | Purchase of treasury stock | | | — | | | | (252 | ) | | | (506 | ) | | | | | | | | | | | | | | Net cash (used in) provided by financing activities | | | (11,262 | ) | | | 5,961 | | | | (3,279 | ) | | | | | | | | | | | | | | Net increase (decrease) in cash and cash equivalents | | | 116 | | | | (95 | ) | | | (125 | ) | Cash and cash equivalents at beginning of period | | | 57 | | | | 152 | | | | 277 | | | | | | | | | | | | | | | Cash and cash equivalents at end of period | | $ | 173 | | | $ | 57 | | | $ | 152 | | | | | | | | | | | | | | |
64
| | | MID PENN BANCORP, INC. | | Notes to Consolidated Financial Statements |
(24) | Recent Accounting Pronouncements |
ASU 2009-16:In October 2009, the FASB issued Accounting Standards Update (“ASU”) 2009-16,Transfers and Servicing (Topic 860) - Accounting for Transfers of Financial Assets.This Update amends the Codification for the issuance of FASB Statement No. 166,Accounting for Transfers of Financial Assets-an amendment of FASB Statement No. 140.
The amendments in this Update improve financial reporting by eliminating the exceptions for qualifying special-purpose entities from the consolidation guidance and the exception that permitted sale accounting for certain mortgage securitizations when a transferor has not surrendered control over the transferred financial assets. In addition, the amendments require enhanced disclosures about the risks that a transferor continues to be exposed to because of its continuing involvement in transferred financial assets. Comparability and consistency in accounting for transferred financial assets will also be improved through clarifications of the requirements for isolation and limitations on portions of financial assets that are eligible for sale accounting. This Update is effective at the start of a reporting entity’s first fiscal year beginning after November 15, 2009. Early application is not permitted. The Corporation does not expect the adoptionprovisions of this standard will have a significant impact on its financial condition or results of operations.
ASU 2010-01:In January 2010, the FASB issued ASU 2010-01,Equity (Topic 505) - Accounting for Distributions to Shareholders with Components of Stock and Cash. The amendments in this Update clarify that the stock portion of a distribution to shareholders that allows them to elect to receive cash or stock with a potential limitation on the total amount of cash that all shareholders can elect to receive in the aggregate is considered a share issuance that is reflected in earnings per share prospectively and is not a stock dividend. This Update codifies the consensus reached in EITF Issue No. 09-E, “Accounting for Stock Dividends, Including Distributions to Shareholders with Components of Stock and Cash.” This Update isare effective for interim and annual periods ending on or after December 15, 2009, and should be applied on a retrospective basis. The adoption of this standard did not have a significant impact on the Corporation’s financial condition or results of operations.
ASU 2010-06:The FASB has issued ASU 2010-06,Fair Value Measurements and Disclosures (Topic 820): Improving Disclosures about Fair Value Measurements. This ASU requires some new disclosures and clarifies some existing disclosure requirements about fair value measurement as set forth in Codification Subtopic 820-10. The FASB’s objective is to improve these disclosures and, thus, increase the transparency in financial reporting. Specifically, ASU 2010-06 amends Codification Subtopic 820-10 to now require:
A reporting entity to disclose separately the amounts of significant transfers in and out of Level 1 and Level 2 fair value measurements and describe the reasonspublic entities prospectively for the transfers; and
In the reconciliation for fair value measurements using significant unobservable inputs, a reporting entity should present separately information about purchases, sales, issuances, and settlements.
In addition, ASU 2010-06 clarifies the requirements of the following existing disclosures:
For purposes of reporting fair value measurement for each class of assets and liabilities, a reporting entity needs to use judgment in determining the appropriate classes of assets and liabilities; and
A reporting entity should provide disclosures about the valuation techniques and inputs used to measure fair value for both recurring and nonrecurring fair value measurements.
ASU 2010-06 is effective for interim and annual reporting periods beginning after December 15, 2009, except for the disclosures about purchases, sales, issuances, and settlements2012. Mid Penn has included these reclassification adjustments in the roll forward of activity in Level 3 fair value measurements. Those disclosures are effective for fiscal years beginning after December 15, 2010, and for interim periods within those fiscal years.consolidated financial statements contained herein. Early adoption is permitted. The Corporation does not expect the adoption of this standard will have a significant impact on its financial condition or results of operations.
65
| | | MID PENN BANCORP, INC. | | Notes to Consolidated Financial Statements |
(25) | Summary of Quarterly Consolidated Financial Data (Unaudited) |
85
MID PENN BANCORP, INC.Notes to Consolidated Financial Statements (25) Summary of Quarterly Consolidated Financial Data (Unaudited) The following table presents summarized quarterly financial data for 20092012 and 2008.2011. | | | | | | | | | | | | | | | | | | | | | | | | | | | | | | | | | | (Dollars in thousands, except per share data) | | 2009 Quarter Ended | | 2012 Quarter Ended | | | | March 31 | | June 30 | | September 30 | | December 31 | | March 31 | | June 30 | | September 30 | | December 31 | Interest Income | | $ | 7,565 | | | $ | 7,993 | | $ | 7,886 | | | $ | 7,892 | | $ | 7,710 | | $ | 7,885 | | $ | 7,458 | | $ | 7,313 | Interest Expense | | | 3,609 | | | | 3,262 | | | 3,216 | | | | 3,217 | | | 2,033 | | | 1,862 | | | 1,688 | | | 1,542 | | | | | | | | | | | | | | Net Interest Income | | | 3,956 | | | | 4,731 | | | 4,670 | | | | 4,675 | | | 5,677 | | | 6,023 | | | 5,770 | | | 5,771 | Provision for Loan and Lease Losses | | | 933 | | | | 479 | | | 1,108 | | | | 7,000 | | | 300 | | | 225 | | | 150 | | | 361 | | | | | | | | | | | | | | Net Interest Income (Loss) After Provision for Loan Losses | | | 3,023 | | | | 4,252 | | | 3,562 | | | | (2,325 | ) | | Noninterest Income | | | 941 | | | | 861 | | | 909 | | | | 945 | | | Noninterest Expense | | | 3,868 | | | | 4,341 | | | 4,230 | | | | 4,232 | | | | | | | | | | | | | | | | Income (Loss) Before (Benefit from) Provision for Income Taxes | | | 96 | | | | 772 | | | 241 | | | | (5,612 | ) | | (Benefit from) Provision for Income Taxes | | | (117 | ) | | | 59 | | | (93 | ) | | | (2,057 | ) | | | | | | | | | | | | | | | Net Income (Loss) | | | 213 | | | | 713 | | | 334 | | | | (3,555 | ) | | Preferred Stock Dividends and Discount Accretion | | | 128 | | | | 129 | | | 128 | | | | 129 | | | | | | | | | | | | | | | | Net Income (Loss) Available to Common Shareholders | | $ | 85 | | | $ | 584 | | $ | 206 | | | $ | (3,684 | ) | | | | | | | | | | | | | | | Per Share Data: | | | | | | | | | | Basic (Loss) Earnings Per Share | | $ | 0.02 | | | $ | 0.17 | | $ | 0.06 | | | $ | (1.06 | ) | | Diluted (Loss) Earnings Per Share | | | 0.02 | | | | 0.17 | | | 0.06 | | | | (1.06 | ) | | Cash Dividends | | | 0.20 | | | | 0.16 | | | 0.16 | | | | — | | | | | (Dollars in thousands, except per share data) | | 2008 Quarter Ended | | | | | | March 31 | | June 30 | | September 30 | | December 31 | | | Interest Income | | $ | 8,077 | | | $ | 7,786 | | $ | 7,986 | | | $ | 8,007 | | | Interest Expense | | | 3,877 | | | | 3,639 | | | 3,694 | | | | 3,680 | | | | | | | | | | | | | | | | Net Interest Income | | | 4,200 | | | | 4,147 | | | 4,292 | | | | 4,327 | | | Provision for Loan and Lease Losses | | | 100 | | | | 155 | | | 275 | | | | 700 | | | | | | | | | | | | | | | | Net Interest Income After Provision for Loan Losses | | | 4,100 | | | | 3,992 | | | 4,017 | | | | 3,627 | | | 5,377 | | | 5,798 | | | 5,620 | | | 5,410 | Noninterest Income | | | 896 | | | | 906 | | | 998 | | | | 882 | | | 738 | | | 931 | | | 1,057 | | | 957 | Noninterest Expense | | | 3,446 | | | | 3,478 | | | 3,525 | | | | 4,277 | | | 4,738 | | | 4,947 | | | 5,082 | | | 4,926 | | | | | | | | | | | | | | Income Before Provision for (Benefit from) Income Taxes | | | 1,550 | | | | 1,420 | | | 1,490 | | | | 232 | | | Provision for (Benefit from) Income Taxes | | | 377 | | | | 360 | | | 368 | | | | (1 | ) | | | | | | | | | | | | | | | Income Before Provision for Income Taxes | | | 1,377 | | | 1,782 | | | 1,595 | | | 1,441 | Provision for Income Taxes | | | 243 | | | 422 | | | 329 | | | 250 | Net Income | | | 1,173 | | | | 1,060 | | | 1,122 | | | | 233 | | | 1,134 | | | 1,360 | | | 1,266 | | | 1,191 | Preferred Stock Dividends and Discount Accretion | | | — | | | | — | | | — | | | | 16 | | | 128 | | | 129 | | | 128 | | | 129 | | | | | | | | | | | | | | Net Income Available to Common Shareholders | | $ | 1,173 | | | $ | 1,060 | | $ | 1,122 | | | $ | 217 | | $ | 1,006 | | $ | 1,231 | | $ | 1,138 | | $ | 1,062 | | | | | | | | | | | | | | Per Share Data: | | | | | | | | | | | | | | | | | | | | Basic Earnings Per Share | | $ | 0.34 | | | $ | 0.30 | | $ | 0.32 | | | $ | 0.07 | | $ | 0.29 | | $ | 0.35 | | $ | 0.33 | | $ | 0.30 | Diluted Earnings Per Share | | | 0.34 | | | | 0.30 | | | 0.32 | | | | 0.07 | | | 0.29 | | | 0.35 | | | 0.33 | | | 0.30 | Cash Dividends | | | 0.20 | | | | 0.20 | | | 0.20 | | | | 0.20 | | | 0.05 | | | 0.05 | | | 0.05 | | | 0.10 |
66
| | | | | | | | | | | | | | | | | | | | | | | | (Dollars in thousands, except per share data) | 2011 Quarter Ended | | March 31 | | June 30 | | September 30 | | December 31 | Interest Income | $ | 7,453 | | $ | 8,075 | | $ | 7,994 | | $ | 8,023 | Interest Expense | | 2,470 | | | 2,485 | | | 2,375 | | | 2,192 | Net Interest Income | | 4,983 | | | 5,590 | | | 5,619 | | | 5,831 | Provision for Loan and Lease Losses | | 200 | | | 550 | | | 405 | | | 50 | Net Interest Income After Provision for Loan Losses | | 4,783 | | | 5,040 | | | 5,214 | | | 5,781 | Noninterest Income | | 758 | | | 705 | | | 764 | | | 769 | Noninterest Expense | | 4,300 | | | 4,408 | | | 4,534 | | | 4,806 | Income Before Provision for Income Taxes | | 1,241 | | | 1,337 | | | 1,444 | | | 1,744 | Provision for Income Taxes | | 241 | | | 278 | | | 312 | | | 392 | Net Income | | 1,000 | | | 1,059 | | | 1,132 | | | 1,352 | Preferred Stock Dividends and Discount Accretion | | 128 | | | 129 | | | 128 | | | 129 | Net Income Available to Common Shareholders | $ | 872 | | $ | 930 | | $ | 1,004 | | $ | 1,223 | Per Share Data: | | | | | | | | | | | | Basic Earnings Per Share | $ | 0.25 | | $ | 0.27 | | $ | 0.29 | | $ | 0.35 | Diluted Earnings Per Share | | 0.25 | | | 0.27 | | | 0.29 | | | 0.35 | Cash Dividends | | 0.05 | | | 0.05 | | | 0.05 | | | 0.05 |
ITEM 9.CHANGES IN AND DISAGREEMENTS WITH ACCOUNTANTS ON ACCOUNTING AND FINANCIAL DISCLOSURE None ITEM 9A.CONTROLS AND PROCEDURES Evaluation of Disclosure Controls and Procedures Mid Penn carried out an evaluation, under the supervision and with the participation of its management, including the Chief Executive Officer and Treasurer, of the effectiveness of the design and operation of our disclosure controls and procedures pursuant to Exchange Act Rule 13a-15 as of December 31, 2009.2012. Based upon that evaluation, the Chief Executive Officer and Treasurer concluded, as of December 31, 2009,2012, that, Mid Penn’s disclosure controls and procedures were effective in recording, processing, summarizing, and reporting information required to be disclosed by Mid Penn, within the time periods specified in the SEC’s rules and forms, and such information is accumulated and communicated to management to allow timely decisions regarding required disclosures. Changes in Internal Controls over Financial Reporting There have been no changes in Mid Penn’s internal control over financial reporting during the fourth quarter of 20092012 that have materially affected, or are reasonably likely to materially affect, Mid Penn’s internal control over financial reporting. Mid Penn Bancorp, Inc., Inc. Management Report on Internal Controls over Financial Reporting Management is responsible for establishing and maintaining adequate internal control over financial reporting as defined in Rule 13a and 15(d) – 15(f) under the Exchange Act of 1934 (“1934 Act”). The corporation’s internal control over financial reporting includes those policies and procedures that pertain to the corporation’s ability to record, process, summarize, and report reliable financial data. All internal control systems have inherent limitations in the effectiveness of any internal control over financial reporting, including the possibility of human error and the circumvention or overriding of internal control. Accordingly, even effective internal control over financial reporting can provide only reasonable assurance with respect to financial statement preparation and presentation. Further, because of changes in conditions, the effectiveness of internal control over financial reporting may vary over time. In order to ensure that the corporation’s internal control over financial reporting is effective, management regularly assesses such controls and did so most recently for its financial reporting as of December 31, 2009.2012. This assessment was based on criteria for effective internal control over financial reporting described inInternal Control-Integrated Framework issued by the Committee of Sponsoring Organizations of the Treadway Commission (“COSO”). Management has concluded that Mid Penn’s internal control over financial reporting, as of December 31, 2009,2012, is effective based on those criteria. The
This annual report does not include an attestation report of Mid Penn’s independent registered public accounting firm that auditedregarding internal control over financial reporting. Mid Penn’s consolidated financial statements has issued an audit report on the effectiveness of the corporation’s internal control over financial reporting aswas not subject to attestation by Mid Penn’s independent registered public accounting firm pursuant to rules of December 31, 2009.the Securities and Exchange Commission that permit Mid Penn to provide only management’s report in this annual report. /s/ Rory G. Ritrievi | | /s/ Kevin W. Laudenslager | | | | Rory G. Ritrievi | | Kevin W. Laudenslager | President and | | Vice President and | Chief Executive Officer | | Treasurer |
ITEM 9B.OTHER INFORMATION None 67
REPORT OF INDEPENDENT REGISTERED
PUBLIC ACCOUNTING FIRM
To the Board of Directors and Shareholders
Mid Penn Bancorp, Inc., Inc.:
We have audited Mid Penn Bancorp, Inc., Inc. and Subsidiaries’ (the “Corporation”) internal control over financial reporting as of December 31, 2009, based on criteria established inInternal Control-Integrated Framework issued by the Committee of Sponsoring Organizations of the Treadway Commission (“COSO”). The Corporation’s management is responsible for maintaining effective internal control over financial reporting and for its assessment of the effectiveness of internal control over financial reporting included in the accompanying Mid Penn Bancorp, Inc., Inc. Management Report on Internal Controls Over Financial Reporting. Our responsibility is to express an opinion on the Corporation’s internal control over financial reporting based on our audit.
We conducted our audit in accordance with the standards of the Public Company Accounting Oversight Board (United States). Those standards require that we plan and perform the audit to obtain reasonable assurance about whether effective internal control over financial reporting was maintained in all material respects. Our audit of internal control over financial reporting included obtaining an understanding of internal control over financial reporting, assessing the risk that a material weakness exists, and testing and evaluating the design and operating effectiveness of internal control based on the assessed risk. Our audit also included performing such other procedures as we considered necessary in the circumstances. We believe that our audit provides a reasonable basis for our opinion.
A company’s internal control over financial reporting is a process designed to provide reasonable assurance regarding the reliability of financial reporting and the preparation of financial statements for external purposes in accordance with generally accepted accounting principles. A company’s internal control over financial reporting includes those policies and procedures that (1) pertain to the maintenance of records that, in reasonable detail, accurately and fairly reflect the transactions and dispositions of the assets of the company; (2) provide reasonable assurance that transactions are recorded as necessary to permit preparation of financial statements in accordance with generally accepted accounting principles, and that receipts and expenditures of the company are being made only in accordance with authorizations of management and directors of the company; and (3) provide reasonable assurance regarding prevention or timely detection of unauthorized acquisition, use, or disposition of the company’s assets that could have a material effect on the financial statements.
Because of its inherent limitations, internal control over financial reporting may not prevent or detect misstatements. Also, projections of any evaluation of effectiveness to future periods are subject to the risk that controls may become inadequate because of changes in conditions, or that the degree of compliance with the policies or procedures may deteriorate.
In our opinion, the Corporation maintained, in all material respects, effective internal control over financial reporting as of December 31, 2009, based on criteria established inInternal Control-Integrated Frameworkissued by the Committee of Sponsoring Organizations of the Treadway Commission (“COSO”).
We have also audited, in accordance with the standards of the Public Company Accounting Oversight Board (United States), the consolidated balance sheets and related consolidated statements of operations, changes in shareholders’ equity, and cash flows of the Corporation and our report dated March 16, 2010 expressed an unqualified opinion.

ParenteBeard LLC
Harrisburg, Pennsylvania
March 16, 2010
68
PART III PART III
ITEM 10.DIRECTORS, EXECUTIVE OFFICERS AND CORPORATE GOVERNANCE The information required by this Item, relating to directors, executive officers, and control persons is set forth under the captions “Executive Officers”, “Information Regarding Director Nominees and Continuing Directors”, “Compliance with Section“Section 16(a) Reporting”Beneficial Ownership Reporting Compliance”, “Audit Committee Report”, and “Governance of the Corporation” in Mid Penn’s definitive proxy statement to be used in connection with the 20102013 Annual Meeting of Shareholders, which pages are incorporated herein by reference. The Corporation has adopted a Code of Ethics that applies to directors, officers and employees of the Corporation and the Bank. The Corporation amended the Code of Ethics twice in 2005 and a copy of the Code of Ethics is included as Exhibit 14 to the Form 8-K filed with the Securities and Exchange Commission on March 9, 2005. A request for the Corporation’s Code of Ethics can be made in writing to Kevin W. Laudenslager, 349 Union Street, Millersburg, PA 17061, by telephone at 717-692-2133,1-866-642-7736, or through the Mid Penn website atwww.midpennbank.com. midpennbank.com. ITEM 11.EXECUTIVE COMPENSATION The information required by this Item, relating to executive compensation, is set forth under the captions “Compensation Discussion and Analysis”, “Executive Compensation”, “Potential Payments Upon Termination or Change In Control”, “Election of“Information Regarding Director Nominees and Continuing Directors”, “Compensation Committee Report” and “Compensation Committee Interlocks and Insider Participation” of Mid Penn’s definitive proxy statement to be used in connection with the 20102013 Annual Meeting of Shareholders, which pages are incorporated herein by reference. ITEM 12.SECURITY OWNERSHIP OF CERTAIN BENEFICIAL OWNERS AND MANAGEMENT AND RELATED SHAREHOLDER MATTERS The information required by this Item, relating to beneficial ownership of Mid Penn’s common stock, is set forth under the caption “Beneficial Ownership of Mid Penn Bancorp, Inc.’sBancorp’s Stock Held By Principal Shareholders and Management” of Mid Penn’s definitive proxy statement to be used in connection with the 20102013 Annual Meeting of Shareholders, which pages are incorporated herein by reference. Mid Penn does not maintain any equity compensation plans. ITEM 13.CERTAIN RELATIONSHIPS AND RELATED TRANSACTIONS, AND DIRECTOR INDEPENDENCE The information required by this Item, relating to transactions with management and others, certain business relationships and indebtedness of management, is set forth under the captions “Certain Relationships and Related Transactions” and “Governance of the Corporation” of Mid Penn’s definitive proxy statement to be used in connection with the 20102013 Annual Meeting of Shareholders, which page is incorporated herein by reference. ITEM 14.PRINCIPAL ACCOUNTANTACCOUNTING FEES AND SERVICES The information required by this Item, relating to the fees and services provided by Mid Penn’s principal accountant, is set forth under the caption “Audit Committee Report” and “Proposal No. 4: Ratification of the Appointment of ParenteBeard, LLC as the Corporation’s Independent Registered Public Accounting firm for 2013” of Mid Penn’s definitive proxy statement to be used in connection with the 20102013 Annual Meeting of Shareholders, which page is incorporated herein by reference. 69
PART IV PART IV
ITEM 15.EXHIBITS AND FINANCIAL STATEMENT SCHEDULES 1. | Financial statements are incorporated by reference in Part II, Item 8 hereof. |
1. Financial statements are incorporated by reference in Part II, Item 8 hereof. Report of Independent Registered Public Accounting Firm Consolidated Balance Sheets Consolidated Statements of OperationsIncome Consolidated Statements of Cash FlowsComprehensive Income Consolidated Statements of Changes in Shareholders’ Equity Consolidated Statements of Cash Flows Notes to Consolidated Financial Statements 2. The financial statement schedules, required by Regulation S-X, are omitted because the information is either not applicable or is included elsewhere in the consolidated financial statements. 3. The following Exhibits are filed as part of this filing on Form 10-K, or incorporated by reference hereto: 3(i)The Registrant’s amended Articles of Incorporation. (Incorporated by reference to Exhibit 3(i) of Registrant’s Quarterly Report on Form 10-Q filed with the Securities and Exchange Commission on May 11, 2009.) 3(ii)Statement with Respect to Shares for Series B Preferred Stock. (Incorporated by reference to Exhibit 3.1 to Registrant’s Current Report on Form 8-K as filed with the Securities and Exchange Commission on September 28, 2012.) 3(iii)The Registrant’s By-laws. (Incorporated by reference to Exhibit 3(ii) of Registrant’s Current Report on Form 8-K filed with the Securities and Exchange Commission on August 30, 2010.) 10.1Mid Penn Bank’s Retirement Plan. (Incorporated by reference to Exhibit 10.1 of Registrant’s Annual Report on form 10-K filed with the Securities and Exchange Commission on March 10, 2008.) * 2. | The financial statement schedules, required by Regulation S-X, are omitted because the information is either not applicable or is included elsewhere in the consolidated financial statements. |
3. | The following Exhibits are filed as part of this filing on Form 10-K, or incorporated by reference hereto: |
| | | 3(i)7.2
| | The Registrant’s Articles of Incorporation. (Incorporated by reference to Exhibit 3.1 of Registrant’s Registration Statement on Form S-3 (Registration No. 333-156759.) | | | 3(ii)
| | Statement with Respect to Shares for Series A Preferred Stock. (Incorporated by reference to Exhibit 3.1 to Registrant’s Current Report on Form 8-K as filed with the Securities and Exchange Commission on December 22, 2008.) | | | 3(iii)
| | The Registrant’s By-laws. (Incorporated by reference to Exhibit 3(ii) of Registrant’s Annual Report on form 10-K filed with the Securities and Exchange Commission on March 10, 2008.) | | | 4.1
| | Warrants for Purchase of Shares of Common Stock. (Incorporated by reference to Exhibit 4.1 to Registrant’s Current Report on Form 8-K as filed with the Securities and Exchange Commission on December 22, 2008.) | | | 10.1
| | Mid Penn Bank’s Retirement Plan. (Incorporated by reference to Exhibit 10.1 of Registrant’s Annual Report on form 10-K filed with the Securities and Exchange Commission on March 10, 2008.) * | | | 10.2
| | Mid Penn Bank’s Employee Stock Ownership Plan. (Incorporated by reference to Exhibit 10.2 of Registrant’s Annual Report on form 10-K filed with the Securities and Exchange Commission on March 10, 2008.) * | | |
10.3 The Registrant’s Dividend Reinvestment Plan, as amended and restated. (Incorporated by reference to Registrant’s Registration Statement on Form S-3, filed with the SEC on October 12, 2005.) 10.37.4
| | The Registrant’s Dividend Reinvestment Plan, as amended and restated. (Incorporated by reference to Registrant’s Registration Statement on Form S-3, filed with the SEC on October 12, 2005.) | | | 10.4
| | Split Dollar Agreement between Mid Penn Bank and Eugene F. Shaffer. (Incorporated by reference to Registrant’s Annual Report on Form 10-K filed with the SEC on March 14, 2005.) * | | |
Report on Form 10-K filed with the SEC on March 14, 2005.) * 10.57.5
| | Death Benefit Plan and Agreement between Mid Penn Bank and the Trustee of the Eugene F. Shaffer Irrevocable Trust. (Incorporated by reference to Registrant’s Annual Report on Form 10-K filed with the SEC on March 14, 2005.) * | | | 10.6
| | Severance Agreement dated as of November 26, 2008 between Mid Penn Bank and Alan W. Dakey. (Incorporated by reference to Exhibit 10.1 to Registrant’s Current Report on Form 8-K as filed with the Securities and Exchange Commission on December 1, 2008.) * | | | 10.7
| | Letter Agreement, dated as of December 19, 2008, Between Mid Penn Bancorp, Inc., Inc. and the United States Department of the Treasury, which includes the Securities Purchase Agreement – Standard Terms attached thereto, with respect to the issuance and sale of the Series A Preferred Stock and the Warrants. (Incorporated by reference to Exhibit 10.1 to Registrant’s Current Report on Form 8-K as filed with the Securities and Exchange Commission on December 22, 2008.) | | | 11
| | Statement re: Computation of Per Share Earnings. (Incorporated by reference to Part II, Item 8 of this Annual Report on Form 10-K.) | | | 12
| | Statements re: Computation of Ratios. (Incorporated by reference to Part II, Item 8 of this Annual Report on Form 10-K.) | | |
(Incorporated by reference to Registrant’s Annual Report on Form 10-K filed with the SEC on March 14, 2005.) * 11Statement re: Computation of Per Share Earnings. (Incorporated by reference to Part II, Item 8 of this Annual Report on Form 10-K.) 12Statements re: Computation of Ratios. (Incorporated by reference to Part II, Item 8 of this Annual Report on Form 10-K.) 14 | | The Registrant’s Code of Ethics. (Incorporated by reference to Registrant’s Form 8-K filed with the Securities and Exchange Commission on March 9, 2005.) |
Commission on March 9, 2005.) 70
21 Subsidiaries of Registrant.23Consent of ParenteBeard LLC. 31.1 Rule 13a-14(a)/15d-14(a) Certification of the Principal Executive Officer. 31.2Rule 13a-14(a)/15d-14(a) Certification of the Principal Financial Officer. 32Principal Executive and Financial Officer’s §1350 Certifications. 99.1Listing of Mid-Atlantic Custom Peer Group Banks.
99.2Certification of Principal Executive Officer pursuant to the Economic Stabilization Act of 2008. | | | 21
99.3Certification of Principal Financial Officer pursuant to the Economic Stabilization Act of 2008. | | Subsidiaries of Registrant. | | | 23
| | Consent of ParenteBeard LLC. | | | 31.1
| | Rule 13a-14(a)/15d-14(a) Certification of the Principal Executive Officer. | | | 31.2
| | Rule 13a-14(a)/15d-14(a) Certification of the Principal Financial Officer. | | | 32
| | Principal Executive and Financial Officer’s §1350 Certifications. | | | 99.1
| | Listing of Mid-Atlantic Custom Peer Group Banks. | | | 99.2
| | Certification of Principal Executive Officer pursuant to the Economic Stabilization Act of 2008. | | | 99.3
| | Certification of Principal Financial Officer pursuant to the Economic Stabilization Act of 2008. |
* | Denotes a management contract or compensatory plan or arrangement. |
71
101.LAB XBRL Taxonomy Extension Label Linkbase.101.PRE XBRL Taxonomy Extension Presentation Linkbase. 101.INS XBRL Instance Document. 101.SCH XBRL Taxonomy Extension Schema. 101.CAL XBRL Taxonomy Extension Calculation Linkbase. 101.DEF XBRL Taxonomy Extension Definition Linkbase. *Denotes a management contract or compensatory plan or arrangement.
SIGNATURES SIGNATURES
Pursuant to the requirements of Section 12 of the Securities Exchange Act of 1934, the Registrant has duly caused this report to be signed on its behalf by the undersigned, thereunto duly authorized. | | | By: | | /s/ Rory G. Ritrievi | | | Rory G. Ritrievi | | | President and | | | Chief Executive Officer | | | (Principal Executive Officer) | | | Date: | | March 16, 201025, 2013 |
Pursuant to the requirements of the Securities Exchange Act of 1934, this report has been signed below by the following persons on behalf of the Registrant and in the capacities and on the dates indicated. Arch 25, 2012 | | | | | | | | | By: | | /s/ /s/ Rory G. Ritrievi
| | | | March 16, 2010 | | | | | Rory G. Ritrievi | | | | | | | | | President, Chief Executive Officer and | | | | | | | | | Director (Principal Executive Officer) | | | | | | | | | | | March 25, 2013 | By: | | /s/ /s/ Kevin W. Laudenslager
| | | | March 16, 2010 | | | | | Kevin W. Laudenslager | | | | | | | | | Vice President, Treasurer (Principal Financial Officer and Principal Accounting Officer) | | | | | | | | | | | March 25, 2013 | By: /s/ Robert A. Abel Robert A. Abel, Director | March 25, 2013 | By: /s/ Steven T. Boyer Steven T. Boyer, Director | /s/March 25, 2013
| By: /s/ Jere M. Coxon | | | | March 16, 2010 | | | | | Jere M. Coxon, Director | | | | | | | | | | | March 25, 2013 | By: | | /s/ Matthew G. DeSoto | | | | March 16, 2010 | | | | | Matthew G. DeSoto, Director | | | | | | | | | | | March 25, 2013 | By: | | /s/ A. James Durica
| | | | March 16, 2010 | | | | | A. James Durica, Director | | | | | | | | | | | | By:
| | /s/ /s/ Robert C. Grubic
| | | | March 16, 2010 | | | | | Robert C. Grubic, Director | | | | | | | | | | | March 25, 2013 | By: | | /s/ /s/ Gregory M. Kerwin
| | | | March 16, 2010 | | | | | Gregory M. Kerwin, Director | | | | | | | | | | | March 25, 2013 | By: /s/ Robert E. Klinger Robert E. Klinger, Director | March 25, 2013 | By:/s/ Theodore W. Mowery | | | | March 16, 2010 | | | | | Theodore W. Mowery, Director | | | | | | | | | | | March 25, 2013 | By: /s/ John E. Noone John E. Noone, Director | | /s/ Donald E. Sauve
| | | | March 16, 2010 | | | | | Donald E. Sauve, Director | | | | | | | | | | | 25, 2013 | By: | | /s/ Edwin D. Schlegel
| | | | March 16, 2010 | | | | | Edwin D. Schlegel, Director | | | | | | | | | | | | By:
| | /s/ /s/ William A. Specht, III
| | | | March 16, 2010 | | | | | William A. Specht, Director | | | | | | March 25, 2013 |
72
EXHIBIT 21 SUBSIDIARIES OF REGISTRANT Name | State of Incorporation | Mid Penn Bank | Pennsylvania | | | Mid Penn Insurance Services, LLC | Pennsylvania |
EXHIBIT 23 CONSENT OF INDEPENDENT REGISTERED PUBLIC ACCOUNTING FIRM We hereby consent to the incorporation by reference in the Registration Statements on Form S-8 (Registration No. 333-170833) filed with the SEC on November 24, 2010, Form S-3/A (Registration No. 333-39341) filed with the SEC on October 7, 2005, Form S-3D (Registration No. 333-128958) filed with the SEC on October 12, 2005, and Form S-3 (Registration No. 333-156759) filed with the SEC on January 16, 2009 (effective February 4, 2009) of Mid Penn Bancorp, Inc. of our report dated March 25, 2013, relating to the consolidated financial statements which appears in the Annual Report on Form 10-K for the year ended December 31, 2012. /s/ ParenteBeard LLC ParenteBeard LLC Harrisburg, Pennsylvania March 25, 2013
EXHIBIT 31.1 CERTIFICATION I, Rory G. Ritrievi, certify that: 1.I have reviewed this annual report on Form 10-K of Mid Penn Bancorp, Inc.; 2.Based on my knowledge, this report does not contain any untrue statement of a material fact or omit to state a material fact necessary to make the statements made, in light of the circumstances under which such statements were made, not misleading with respect to the period covered by this report. 3.Based on my knowledge, the financial statements, and other financial information included in this report, fairly present in all material respects the financial condition, results of operations and cash flows of the registrant as of, and for, the periods presented in this report. 4.The registrant’s other certifying officer and I are responsible for establishing and maintaining disclosure controls and procedures (as defined in Exchange Act Rules 13a-15(e) and 15d-15(e)) and internal control over financial reporting (as defined in Exchange Act Rules 13a-15(f) and 15d-15(f)) for the registrant and have: (a)Designed such disclosure controls and procedures, or caused such disclosure controls and procedures to be designed under our supervision, to ensure that material information relating to the registrant, including its consolidated subsidiaries, is made known to us by others within those entities, particularly during the period in which this report is being prepared; (b)Designed such internal control over financial reporting, or caused such internal control over financial reporting to be designed under our supervision, to provide reasonable assurance regarding the reliability of financial reporting and the preparation of financial statements for external purposes in accordance with generally accepted accounting principles; (c)Evaluated the effectiveness of the registrant's disclosure controls and procedures and presented in this report our conclusions about the effectiveness of the disclosure controls and procedures as of the end of the period covered by this report based on such evaluation; and (d)Disclosed in this report any change in the registrant’s internal control over financial reporting that occurred during the registrant’s most recent fiscal quarter (the registrant’s fourth fiscal quarter in the case of an annual report) that has materially affected, or is reasonably likely to materially affect, the registrant’s internal control over financial reporting; and 5.The registrant’s other certifying officer and I have disclosed, based on our most recent evaluation of internal control over financial reporting, to the registrant's auditors and the audit committee of the registrant's board of directors (or persons performing the equivalent functions): (a)All significant deficiencies and material weaknesses in the design or operation of internal control over financial reporting which are reasonably likely to adversely affect the registrant’s ability to record, process, summarize and report financial information; and (b)Any fraud, whether or not material, that involves management or other employees who have a significant role in the registrant's internal control over financial reporting. By __/s/ Rory G. Ritrievi__ ___ President and CEO Date: March 25, 2013
EXHIBIT 31.2 CERTIFICATION I, Kevin W. Laudenslager, certify that: 1.I have reviewed this annual report on Form 10-K of Mid Penn Bancorp, Inc.; 2.Based on my knowledge, this report does not contain any untrue statement of a material fact or omit to state a material fact necessary to make the statements made, in light of the circumstances under which such statements were made, not misleading with respect to the period covered by this report. 3.Based on my knowledge, the financial statements, and other financial information included in this report, fairly present in all material respects the financial condition, results of operations and cash flows of the registrant as of, and for, the periods presented in this report. 4.The registrant’s other certifying officer and I are responsible for establishing and maintaining disclosure controls and procedures (as defined in Exchange Act Rules 13a-15(e) and 15d-15(e)) and internal control over financial reporting (as defined in Exchange Act Rules 13a-15(f) and 15d-15(f)) for the registrant and have: (a)Designed such disclosure controls and procedures, or caused such disclosure controls and procedures to be designed under our supervision, to ensure that material information relating to the registrant, including its consolidated subsidiaries, is made known to us by others within those entities, particularly during the period in which this report is being prepared; (b)Designed such internal control over financial reporting, or caused such internal control over financial reporting to be designed under our supervision, to provide reasonable assurance regarding the reliability of financial reporting and the preparation of financial statements for external purposes in accordance with generally accepted accounting principles; (c)Evaluated the effectiveness of the registrant's disclosure controls and procedures and presented in this report our conclusions about the effectiveness of the disclosure controls and procedures as of the end of the period covered by this report based on such evaluation; and (d)Disclosed in this report any change in the registrant’s internal control over financial reporting that occurred during the registrant’s most recent fiscal quarter (the registrant’s fourth fiscal quarter in the case of an annual report) that has materially affected, or is reasonably likely to materially affect, the registrant’s internal control over financial reporting; and 5.The registrant’s other certifying officer and I have disclosed, based on our most recent evaluation of internal control over financial reporting, to the registrant's auditors and the audit committee of the registrant's board of directors (or persons performing the equivalent functions): (a)All significant deficiencies and material weaknesses in the design or operation of internal control over financial reporting which are reasonably likely to adversely affect the registrant’s ability to record, process, summarize and report financial information; and (b)Any fraud, whether or not material, that involves management or other employees who have a significant role in the registrant's internal control over financial reporting. By __/s/ Kevin W. Laudenslager__ ___ Vice President and Treasurer Date: March 25, 2013
Exhibit 32 CERTIFICATION OF PRINCIPAL EXECUTIVE OFFICER AND PRINCIPAL FINANCIAL OFFICER PURSUANT TO 18 U.S.C. SECTION 1350 AS ADDED BY SECTION 906 OF THE SARBANES-OXLEY ACT OF 2002 In connection with the annual report of Mid Penn Bancorp, Inc. (the “Corporation”) on Form 10-K for the period ending December 31, 2012, as filed with the Securities and Exchange Commission on the date hereof (the “Report”), I, Rory G. Ritrievi, President and CEO, and I, Kevin W. Laudenslager, Treasurer, certify, pursuant to 18 U.S.C. Section 1350, as added pursuant to Section 906 of the Sarbanes-Oxley Act of 2002, that: 1. | The Report fully complies with the requirements of Section 13(a) or 15(d) of the Securities Exchange Act of 1934. |
2. | To my knowledge, the information contained in the Report fairly presents, in all material respects the financial condition and results of operations of Mid Penn Bancorp, Inc. as of the dates and for the periods expressed in the Report. |
By __/s/ Rory G. Ritrievi________ President and CEO Date: March 25, 2013 By __/s/ Kevin W. Laudenslager ____ Vice President and Treasurer Date: March 25, 2013
Exhibit 99.1 Mid-Atlantic Custom Peer Group Company | City | State | | Company | City | State | 1st Colonial Bancorp, Inc. | Collingswood | NJ | | Emclaire Financial Corp. | Emlenton | PA | 1st Constitution Bancorp | Cranbury | NJ | | Empire National Bank | Islandia | NY | Absecon Bancorp | Absecon | NJ | | ENB Financial Corp | Ephrata | PA | Adirondack Trust Company | Saratoga Springs | NY | | Enterprise National Bank N.J. | Kenilworth | NJ | Allegheny Valley Bancorp, Inc. | Pittsburgh | PA | | ES Bancshares, Inc. | Newburgh | NY | American Bank Incorporated | Allentown | PA | | Evans Bancorp, Inc. | Hamburg | NY | Annapolis Bancorp, Inc. | Annapolis | MD | | Farmers and Merchants Bank | Upperco | MD | Apollo Bancorp, Inc. | Apollo | PA | | Fidelity D & D Bancorp, Inc. | Dunmore | PA | Ballston Spa Bancorp, Inc. | Ballston Spa | NY | | First Bank | Hamilton | NJ | Bancorp of New Jersey, Inc. | Fort Lee | NJ | | First Community Financial Corporation | Mifflintown | PA | Bank of Akron | Akron | NY | | First Keystone Corporation | Berwick | PA | Bank of Utica | Utica | NY | | First National Bank of Groton | Groton | NY | BCSB Bancorp, Inc. | Baltimore | MD | | First Resource Bank | Exton | PA | Berkshire Bancorp Inc. | New York | NY | | Fleetwood Bank Corporation | Fleetwood | PA | Brunswick Bancorp | New Brunswick | NJ | | FNB Bancorp, Inc. | Newtown | PA | Calvin B. Taylor Bankshares, Inc. | Berlin | MD | | FNBM Financial Corporation | Minersville | PA | Capital Bank of New Jersey | Vineland | NJ | | FNBPA Bancorp, Inc. | Port Allegany | PA | Carroll Bancorp, Inc. | Sykesville | MD | | Frederick County Bancorp, Inc. | Frederick | MD | Carrollton Bancorp | Columbia | MD | | Glen Burnie Bancorp | Glen Burnie | MD | CB Financial Services, Inc. | Carmichaels | PA | | GNB Financial Services, Inc. | Gratz | PA | CBT Financial Corporation | Clearfield | PA | | Greater Hudson Bank, National Assoc. | Middletown | NY | CCFNB Bancorp, Inc. | Bloomsburg | PA | | Hamlin Bank and Trust Company | Smethport | PA | Cecil Bancorp, Inc. | Elkton | MD | | Harford Bank | Aberdeen | MD | Citizens Financial Services, Inc. | Mansfield | PA | | Harvest Community Bank | Pennsville | NJ | Citizens National Bank of Meyersdale | Meyersdale | PA | | Highlands Bancorp, Inc. | Vernon | NJ | Clarion County Community Bank | Clarion | PA | | Hilltop Community Bancorp, Inc. | Summit | NJ | Commercial National Financial Corporation | Latrobe | PA | | Honat Bancorp, Inc. | Honesdale | PA | Community Bank of Bergen County | Maywood | NJ | | Hopewell Valley Community Bank | Pennington | NJ | Community First Bank | Somerset | NJ | | Howard Bancorp, Inc. | Ellicott City | MD | Community National Bank | Great Neck | NY | | IBW Financial Corporation | Washington | DC | Community National Bank of Northwestern PA | Albion | PA | | Jeffersonville Bancorp | Jeffersonville | NY | Community Partners Bancorp | Tinton Falls | NJ | | Jonestown Bank and Trust Co. | Jonestown | PA | Cornerstone Financial Corp. | Mount Laurel | NJ | | JTNB Bancorp, Inc. | Jim Thorpe | PA | County First Bank | La Plata | MD | | Juniata Valley Financial Corp. | Mifflintown | PA | Damascus Community Bank | Damascus | MD | | Kinderhook Bank Corporation | Kinderhook | NY | Delhi Bank Corp. | Delhi | NY | | Kish Bancorp, Inc. | Reedsville | PA | Delmar Bancorp | Salisbury | MD | | Landmark Bancorp, Inc. | Pittston | PA | Dimeco, Inc. | Honesdale | PA | | Liberty Bell Bank | Marlton | NJ | DNB Financial Corporation | Downingtown | PA | | Luzerne National Bank Corporation | Luzerne | PA | Elmer Bancorp, Inc. | Elmer | NJ | | Lyons Bancorp, Inc. | Lyons | NY | Elmira Savings Bank | Elmira | NY | | Manor Bank | Manor | PA | Embassy Bancorp, Inc. | Bethlehem | PA | | Mars National Bank | Mars | PA |
Exhibit 99.1 (continued) Mid-Atlantic Custom Peer Group (continued) Company | City | State | Mauch Chunk Trust Financial Corp. | Jim Thorpe | PA | Mid Penn Bancorp, Inc. | Millersburg | PA | Mifflinburg Bank & Trust Company | Mifflinburg | PA | MNB Corporation | Bangor | PA | Muncy Bank Financial, Inc. | Muncy | PA | National Bank of Coxsackie | Coxsackie | NY | National Capital Bank of Washington | Washington | DC | Neffs Bancorp, Inc. | Neffs | PA | New Jersey Community Bank | Freehold | NJ | New Millennium Bank | New Brunswick | NJ | New Tripoli Bancorp, Inc. | New Tripoli | PA | Northumberland Bancorp | Northumberland | PA | Norwood Financial Corp. | Honesdale | PA | Old Line Bancshares, Inc. | Bowie | MD | Orange County Bancorp, Inc. | Middletown | NY | Parke Bancorp, Inc. | Sewell | NJ | Pascack Bancorp, Inc. | Waldwick | NJ | Patapsco Bancorp, Inc. | Dundalk | MD | Penns Woods Bancorp, Inc. | Williamsport | PA | Penseco Financial Services Corporation | Scranton | PA | Peoples Financial Services Corp. | Hallstead | PA | Peoples Limited | Wyalusing | PA | Putnam County National Bank of Carmel | Carmel | NY | QNB Corp. | Quakertown | PA | Republic First Bancorp, Inc. | Philadelphia | PA | Royal Bancshares of Pennsylvania, Inc. | Narberth | PA | Rumson-Fair Haven Bank & Trust Co. | Rumson | NJ | Scottdale Bank & Trust Company | Scottdale | PA | Shore Community Bank | Toms River | NJ | Solvay Bank Corporation | Solvay | NY | Somerset Hills Bancorp | Bernardsville | NJ | Somerset Trust Holding Company | Somerset | PA | Stewardship Financial Corporation | Midland Park | NJ | Sussex Bancorp | Franklin | NJ | Tri-County Financial Corporation | Waldorf | MD | Turbotville National Bancorp, Inc. | Turbotville | PA | UNB Corporation | Mount Carmel | PA | Unity Bancorp, Inc. | Clinton | NJ | VSB Bancorp, Inc. | Staten Island | NY | West Milton Bancorp, Inc. | West Milton | PA | Woodlands Financial Services Company | Williamsport | PA |
Exhibit 99.2 I, Rory G. Ritrievi, certify, based on my knowledge, that: (i) The compensation committee of Mid Penn Bancorp, Inc. has discussed, reviewed, and evaluated with senior risk officer at least every six months during any part of the most recently completed fiscal year that was a TARP period (the applicable period), the senior executive officer (SEO) compensation plans and the employee compensation plans and the risks these plans pose to Mid Penn Bancorp, Inc.; (ii) The compensation committee of Mid Penn Bancorp, Inc. has identified and limited during the applicable period any features of the SEO compensation plans that could lead SEOs to take unnecessary and excessive risks that could threaten the value of Mid Penn Bancorp, Inc., and identified any features of the employee compensation plans that pose risks to Mid Penn Bancorp, Inc. and has limited those features to ensure that Mid Penn Bancorp, Inc. is not unnecessarily exposed to risks; (iii) The compensation committee has reviewed, at least every six months during the applicable period, the terms of each employee compensation plan and identified any features of the plan that could encourage the manipulation of reported earnings of Mid Penn Bancorp, Inc. to enhance the compensation of an employee, and has limited those features that would encourage the manipulation of reported earnings of Mid Penn Bancorp, Inc.; (iv) The compensation committee of Mid Penn Bancorp, Inc. will certify to the reviews of the SEO compensation plans and employee compensation plans required under (i) and (iii) above; (v) The compensation committee of Mid Penn Bancorp, Inc. will provide a narrative description of how it limited during the applicable period the features in (A) SEO compensation plans that could lead SEOs to take unnecessary and excessive risks that could threaten the value of Mid Penn Bancorp, Inc.; (B) Employee compensation plans that unnecessarily expose Mid Penn Bancorp, Inc. to risks; and (C) Employee compensation plans that could encourage the manipulation of reported earnings of Mid Penn Bancorp, Inc. to enhance the compensation of an employee; (vi) Mid Penn Bancorp, Inc. has required that bonus payments, as defined in the regulations and guidance established under section 111 of EESA (bonus payments), of the SEOs and twenty next most highly compensated employees be subject to a recovery or “clawback” provision during any part of the most recently completed fiscal year that was a TARP period if the bonus payments were based on materially inaccurate financial statements or any other materially inaccurate performance metric criteria; (vii) Mid Penn Bancorp, Inc. has prohibited any golden parachute payment, as defined in the regulations and guidance established under section 111 of EESA, to an SEO or any of the next five most highly compensated employees during the applicable period. (viii) Mid Penn Bancorp, Inc. has limited bonus payments to its applicable employees in accordance with section 111 of EESA and the regulations and guidance established thereunder during the applicable period; (ix) Mid Penn Bancorp, Inc. and its employees have complied with the excessive or luxury expenditures policy, as defined in the regulations and guidance established under section 111 of EESA, during the applicable period; and any expenses requiring approval of the board of directors, a committee of the board of directors, an SEO, or an executive officer with a similar level of responsibility, were properly approved; (x) Mid Penn Bancorp, Inc. will permit a non-binding shareholder resolution in compliance with any applicable Federal securities rules and regulations on the disclosures provided under the Federal securities laws related to SEO compensation paid or accrued during the applicable period; (xi) Mid Penn Bancorp, Inc. will disclose the amount, nature, and justification for the offering during the applicable period of any perquisites, as defined in the regulations and guidance established under section 111 of EESA, whose total value exceeds $25,000 for any employee who is subject to the bonus payment limitations identified in paragraph (viii); (xii) Mid Penn Bancorp, Inc. will disclose whether Mid Penn Bancorp, Inc., the board of directors of Mid Penn Bancorp, Inc., or the compensation committee of Mid Penn Bancorp, Inc. has engaged during the applicable period, a compensation consultant; and the services the compensation consultant or any affiliate of the compensation consultant provided during this period; (xiii) Mid Penn Bancorp, Inc. has prohibited the payment of any gross-ups, as defined in the regulations and guidance established under section 111 of EESA, to the SEOs and the next twenty most highly compensated employees during the applicable period;
Exhibit 99.2 (continued) (xiv) Mid Penn Bancorp, Inc. has substantially complied with all other requirements related to employee compensation that are provided in the agreement between Mid Penn Bancorp, Inc. and Treasury, including any amendments; (xv) Mid Penn Bancorp, Inc. has submitted to Treasury a complete and accurate list of the SEOs and the twenty next most highly compensated employees for the current fiscal year and the most recently completed fiscal year, with the non-SEOs ranked in descending order of level of annual compensation, and with the name, title, and employer of each SEO and most highly compensated employee identified; and (xvi) I understand that a knowing and willful false or fraudulent statement made in connection with this certification may be punished by fine, imprisonment, or both. Signed: /s/ Rory G. Ritrievi_________ Rory G. Ritrievi Date: March 25, 2013
Exhibit 99.3 I, Kevin W. Laudenslager, certify, based on my knowledge, that: (i) The compensation committee of Mid Penn Bancorp, Inc. has discussed, reviewed, and evaluated with senior risk officer at least every six months during any part of the most recently completed fiscal year that was a TARP period (the applicable period), the senior executive officer (SEO) compensation plans and the employee compensation plans and the risks these plans pose to Mid Penn Bancorp, Inc.; (ii) The compensation committee of Mid Penn Bancorp, Inc. has identified and limited during the applicable period any features of the SEO compensation plans that could lead SEOs to take unnecessary and excessive risks that could threaten the value of Mid Penn Bancorp, Inc., and identified any features of the employee compensation plans that pose risks to Mid Penn Bancorp, Inc. and has limited those features to ensure that Mid Penn Bancorp, Inc. is not unnecessarily exposed to risks; (iii) The compensation committee has reviewed, at least every six months during the applicable period, the terms of each employee compensation plan and identified any features of the plan that could encourage the manipulation of reported earnings of Mid Penn Bancorp, Inc. to enhance the compensation of an employee, and has limited those features that would encourage the manipulation of reported earnings of Mid Penn Bancorp, Inc.; (iv) The compensation committee of Mid Penn Bancorp, Inc. will certify to the reviews of the SEO compensation plans and employee compensation plans required under (i) and (iii) above; (v) The compensation committee of Mid Penn Bancorp, Inc. will provide a narrative description of how it limited during the applicable period the features in (A) SEO compensation plans that could lead SEOs to take unnecessary and excessive risks that could threaten the value of Mid Penn Bancorp, Inc.; (B) Employee compensation plans that unnecessarily expose Mid Penn Bancorp, Inc. to risks; and (C) Employee compensation plans that could encourage the manipulation of reported earnings of Mid Penn Bancorp, Inc. to enhance the compensation of an employee; (vi) Mid Penn Bancorp, Inc. has required that bonus payments, as defined in the regulations and guidance established under section 111 of EESA (bonus payments), of the SEOs and twenty next most highly compensated employees be subject to a recovery or “clawback” provision during any part of the most recently completed fiscal year that was a TARP period if the bonus payments were based on materially inaccurate financial statements or any other materially inaccurate performance metric criteria; (vii) Mid Penn Bancorp, Inc. has prohibited any golden parachute payment, as defined in the regulations and guidance established under section 111 of EESA, to an SEO or any of the next five most highly compensated employees during the applicable period. (viii) Mid Penn Bancorp, Inc. has limited bonus payments to its applicable employees in accordance with section 111 of EESA and the regulations and guidance established thereunder during the applicable period; (ix) Mid Penn Bancorp, Inc. and its employees have complied with the excessive or luxury expenditures policy, as defined in the regulations and guidance established under section 111 of EESA, during the applicable period; and any expenses requiring approval of the board of directors, a committee of the board of directors, an SEO, or an executive officer with a similar level of responsibility, were properly approved; (x) Mid Penn Bancorp, Inc. will permit a non-binding shareholder resolution in compliance with any applicable Federal securities rules and regulations on the disclosures provided under the Federal securities laws related to SEO compensation paid or accrued during the applicable period; (xi) Mid Penn Bancorp, Inc. will disclose the amount, nature, and justification for the offering during the applicable period of any perquisites, as defined in the regulations and guidance established under section 111 of EESA, whose total value exceeds $25,000 for any employee who is subject to the bonus payment limitations identified in paragraph (viii); (xii) Mid Penn Bancorp, Inc. will disclose whether Mid Penn Bancorp, Inc., the board of directors of Mid Penn Bancorp, Inc., or the compensation committee of Mid Penn Bancorp, Inc. has engaged during the applicable period, a compensation consultant; and the services the compensation consultant or any affiliate of the compensation consultant provided during this period; (xiii) Mid Penn Bancorp, Inc. has prohibited the payment of any gross-ups, as defined in the regulations and guidance established under section 111 of EESA, to the SEOs and the next twenty most highly compensated employees during the applicable period;
Exhibit 99.3 (continued) (xiv) Mid Penn Bancorp, Inc. has substantially complied with all other requirements related to employee compensation that are provided in the agreement between Mid Penn Bancorp, Inc. and Treasury, including any amendments; (xv) Mid Penn Bancorp, Inc. has submitted to Treasury a complete and accurate list of the SEOs and the twenty next most highly compensated employees for the current fiscal year and the most recently completed fiscal year, with the non-SEOs ranked in descending order of level of annual compensation, and with the name, title, and employer of each SEO and most highly compensated employee identified; and (xvi) I understand that a knowing and willful false or fraudulent statement made in connection with this certification may be punished by fine, imprisonment, or both. Signed: /s/ Kevin W. Laudenslager_________ Kevin W. Laudenslager Date: March 25, 2013
|