SECURITIES AND EXCHANGE COMMISSION
| x | ANNUAL REPORT PURSUANT TO SECTION 13 OR 15(d) OF THE SECURITIES EXCHANGE ACT OF 1934 |
For the fiscal year ended December 31,
20092012
| ¨ | TRANSITION REPORT PURSUANT TO SECTION 13 OR 15(d) OF THE SECURITIES EXCHANGE ACT OF 1934 |
Commission File Number 001-09240
Transcontinental Realty Investors, Inc.
(Exact name of registrant as specified in its charter)
| | |
| Nevada | | 94-6565852 |
(State or other jurisdiction of Incorporation or organization)
| | Identification Number)
|
1800 Valley View Lane,
1603 LBJ Freeway, Suite 300, Dallas, Texas
| | 75234 |
| (Address of principal executive offices) | | (Zip Code) |
Registrant’s Telephone Number, including area code
Securities registered pursuant to Section 12(b) of the Act:
| | |
| Title of Each Class | | Name of each exchange on which registered |
| Common Stock, $0.01 par value | | New York Stock Exchange |
Securities registered pursuant to Section 12(g) of the Act:
Indicate by check mark if the registrant is a well-known seasoned issuer, as defined in Rule 405 of the Securities Act. Yes
¨ No
x
Indicate by check mark if the registrant is not required to file reports pursuant to Section 13 or Section 15(d) of the Act. Yes ¨ No x Indicate by check mark whether the registrant (1) has filed all reports required to be filed by Section 13 or 15(d) of the Securities Exchange Act of 1934 during the preceding 12 months (or for such shorter period that the registrant was required to file such reports), and (2) has been subject to such filing requirements for the past 90 days. Yes x No ¨Indicate by check mark if disclosure of delinquent filers pursuant to Item 405 of Regulation S-K (§229.405 of this chapter) is not contained herein, and will not be contained, to the best of registrant’s knowledge, in definitive proxy or information statements incorporated by reference in Part III of this Form 10-K or any amendment to this Form 10-K. x
Indicate by check mark whether the registrant is a large accelerated filer, an accelerated filer, or a non-accelerated filer. “large accelerated filer”, “accelerated filer” and “smaller reporting company” in Rule 12b-2 of the Exchange Act
| | | | |
| | Large accelerated filer ¨ | | Accelerated filer ¨ |
| | Non-accelerated filer x (Do not check if smaller reporting company) | | Smaller Reporting Company ¨ |
Indicate by check mark whether the registrant is a shell company (as defined in Rule 12b-2 of the Exchange Act. Yes ¨ No x
Indicate by check mark whether the registrant has submitted electronically and posted on its corporate Web site, if any, every Interactive Data File required to be submitted and posted pursuant to Rule 405 of Regulation S-T (§232.405 of this chapter) during the preceding 12 months (or for such shorter period that the registrant was required to submit and post such files). Yes ¨x No ¨ Indicate by check mark if disclosure of delinquent filers pursuant to Item 405 of Regulation S-K (§229.405 of this chapter) is not contained herein, and will not be contained, to the best of registrant’s knowledge, in definitive proxy or information statements incorporated by reference in Part III of this Form 10-K or any amendment to this Form 10-K. x
Indicate by check mark whether the registrant is a large accelerated filer, an accelerated filer, or a non-accelerated filer. “large accelerated filer”, “accelerated filer” and “smaller reporting company” in Rule 12b-2 of the Exchange Act
| | |
| Large accelerated filer ¨ | Accelerated filer ¨ |
| Non-accelerated filer ¨ (Do not check if smaller reporting company) | Smaller Reporting Company x |
Indicate by check mark whether the registrant is a shell company (as defined in Rule 12b-2 of the Exchange Act. Yes ¨ No x
The aggregate market value of the shares of voting and non-voting common equity held by non-affiliates of the Registrant, computed by reference to the closing price at which the common equity was last sold which was the sales price of the Common
Stockstock on the New York Stock Exchange as of June 30,
20092012 (the last business day of the Registrant’s most recently completed second fiscal quarter) was
$13,737,241$3,080,327 based upon a total of
1,138,1311,104,060 shares held as of June 30,
20092012 by persons believed to be non-affiliates of the Registrant. The basis of the calculation does not constitute a determination by the Registrant as defined in Rule 405 of the Securities Act of 1933, as amended, such calculation, if made as of a date within sixty days of this filing, would yield a different value.
As of March
25, 2010,20, 2013, there were
8,113,6698,413,469 shares of common stock outstanding.
DOCUMENTS INCORPORATED BY REFERENCE:
Consolidated Financial Statements of Income Opportunity Realty Investors, Inc. Commission File No. 001-14784
Consolidated Financial Statements of American Realty Investors, Inc. Commission File No. 001-15663
ANNUAL REPORT ON FORM 10-K
FORWARD-LOOKING STATEMENTS
Certain Statements in this Form 10-K are forward-looking statements within the meaning of the Private Securities Litigation Reform Act of 1995, Section 27A of the Securities Act of 1933, and Section 21E of the Securities Exchange Act of 1934. The words “estimate”, “plan”, “intend”, “expect”, “anticipate”, “believe”, and similar expressions are intended to identify forward-looking statements. The forward-looking statements are found at various places throughout this Report and in the documents incorporated herein by reference. The Company disclaims any intention or obligations to update or revise any forward-looking statements, whether as a result of new information, future events or otherwise. Although we believe that our expectations are based upon reasonable assumptions, we can give no assurance that our goals will be achieved. Important factors that could cause our actual results to differ from estimates or projections contained in any forward-looking statements are described under Part I, Item 1A. “Risk Factors”.
As used herein, the terms “we”, “us”, “our”“TCI”, “the Company”, “We”, “Our”, or “TCI”“Us” refer to Transcontinental Realty Investors, Inc. a Nevada corporation. The Company is headquartered in Dallas, Texas and its common stock trades on the New York Stock Exchange (“NYSE”) under the symbol (“TCI”). TCI is the successor to a California business trust that was organized on September 6, 1983 and commenced operations on January 31, 1984. On November 30, 1999, TCI acquired all of the outstanding shares of beneficial interest of Continental Mortgage and Equity Trust (“CMET”), a real estate company, in a tax-free exchange of shares, issuing 1,181 shares of its Common Stockstock for each outstanding CMET share. Prior to January 1, 2000, TCI elected to be treated as a Real Estate Investment Trust (“REIT”) under Sections 856 through 860 of the Internal Revenue Code of 1986, as amended (the “Code”). During the third quarter of 2000, due to a concentration of ownership TCI no longer met the requirement for tax treatment as a REIT. Effective March 31, 2003, TCI financial results were consolidated in the American Realty Investors, Inc. (“ARL”) Form 10-K and related consolidated financial statements. As
TCI is a “C” corporation for U.S. federal income tax purposes and files an annual consolidated income tax return with ARL, whose common stock is traded on the New York Stock Exchange under the symbol (“ARL”). Subsidiaries of
December 31, 2009, ARL
through subsidiaries owned 82.8%own approximately 83.8% of the
outstanding TCICompany’s common
shares.stock.
On July 17, 2009, the Company acquired
from Syntek West, Inc., (“SWI”),an additional 2,518,934 shares of Common
Stock, par value $0.01 per sharestock of Income Opportunity Realty Investors, Inc. (“IOT”)
at an aggregate price of $17,884,431 (approximately $7.10 per share),
the full amount of which was paid by the Company through an assumption of an aggregate amount of indebtedness of $17,884,431 on the outstanding balance owed by SWIand in doing so, increased its ownership from approximately 25% to
IOT. The 2,518,934 shares of IOT Common Stock acquired by the Company constituted approximately 60.4% of the issued and outstanding Common Stock of IOT. The Company has owned for several years an aggregate of 1,037,184 shares of Common Stock of IOT (approximately 25% of the issued and outstanding). After giving effect to the transaction on July 17, 2009, the Company owns an aggregate of 3,556,118 shares of IOT Common Stock which constitutes approximately 85.3%over 80% of the shares of
Common Stockcommon stock of IOT
outstanding (which is a total of 4,168,214 shares). Shares of IOT are traded on the American Stock Exchange.With the Company’soutstanding. Upon acquisition of the additional shares on July 17, 2009, which increased the aggregate ownership to in excess of 80%, beginning in July 2009, IOT’s results of operations are now consolidatedbegan consolidating with those of the Company for tax and financial reporting purposes. As of December 31, 2012 TCI owned 81.1% of the outstanding IOT common shares. Shares of IOT are traded on the New York Stock Exchange Euronext (“NYSE MKT”) under the symbol (“IOT”).
At the time of the acquisition, the historical accounting value of IOT’s assets was $112 million and liabilities were $43 million. In that the shares of IOT acquired by TCI were from a related party, the values recorded by TCI are IOT’s historical accounting values at the date of transfer. The Company’s fair valuation of IOT’s assets and liabilities at the acquisition date approximated IOT’s book value. The net difference between the purchase price and historical accounting basis of the assets and liabilities acquired was
$35$26.9 million and has been reflected by TCI as deferred income. The deferred income will be recognized upon the sale of the land that IOT held on its books as of the date of sale, to an independent third party.
TCI’s Board of Directors
represents the Company’s shareholders and is responsible for directing the overall affairs of TCI and for setting the strategic policies that guide the Company.
TheAs of April 30, 2011, the Board of Directors
has delegated the day-to-day management of the Company to
PrimePillar Income Asset Management,
LLC,Inc., a Nevada
limited liability companycorporation (“
Prime”Pillar”) under a written Advisory Agreement that is reviewed annually by TCI’s Board of Directors. The directors of TCI are also directors of
ARL. Two directorsARL and IOT. The Chairman of the Board of Directors of TCI also
serveserves as
directorsthe Chairman of
the Board of Directors of ARL and IOT.
CertainThe officers of TCI also serve as officers of ARL, IOT and
Prime.TCI’s contractual advisor is Prime,Pillar.
Effective since April 30, 2011, Pillar, the sole
membershareholder of which is
Prime Income Asset Management, Inc. a Nevada corporation (“PIAMI”) which is owned 100% by Realty Advisors, LLC, a Nevada limited liability company, the sole member of which is Realty Advisors, Inc., a Nevada corporation,
the sole shareholder of which is
owned 100% byRealty Advisors Management, Inc., a
TrustNevada corporation, the sole shareholder of which is a trust known as the May
Trust. See also Part III, Item 10. “Directors, Executive OfficersTrust, became the Company’s external Advisor and
Corporate Governance—The Advisor.” Prime also serves as advisor to ARL and IOT.Prime’sCash Manager. Pillar’s duties include, but are not limited to, locating, evaluating and recommending real estate and real estate-related investment opportunities. PrimePillar also arranges, for TCI’sthe Company’s benefit, debt and equity financing with third party lenders and investors. PrimePillar also serves as an Advisor and Cash Manager to TCI and IOT. As the contractual advisor, Pillar is compensated by TCI under an Advisory Agreement that is more fully described in Part III, Item 10. “Directors, Executive Officers and Corporate Governance”Governance – The Advisor”.
For more than TCI has no employees. Employees of Pillar render services to TCI in accordance with the past three years,terms of the Advisory Agreement. Prime Income Asset Management, LLC (“Prime”) served as the Company’s contractual Advisor prior to April 30, 2011.
Effective since January 1, 2011, Regis Realty Prime, LLC, dba Regis Property Management, LLC (“Regis”), the sole member of which is Realty Advisors, LLC, manages our commercial properties and provides brokerage services. Regis receives property management fees, construction management fees and leasing commissions in accordance with the terms of its property-level management agreement. Regis is also entitled to receive real estate brokerage commissions in accordance with the terms of a non-exclusive brokerage agreement. See Part III, Item 10. “Directors, Executive Officers and Corporate Governance – Property Management and Real Estate Brokerage”. Prior to December 31, 2010, Triad Realty Services, LP.L.P. (“Triad”) an affiliate of Prime has, provided property management services for our commercial properties to TCI.properties. Triad subcontracts with other entities for the provision of property-level management services to TCI. The general partner of Triad is PIAMI. The limited partner of Triad is HRS Holdings, LLC (“HRSHLLC”). Triad subcontractssubcontracted the property-level management and leasing of our commercial properties (office buildings, shopping centers and industrial warehouses) to Regis Realty I, LLC (“Regis I”), which is owned by HRSHLLC. Regis I receives property. TCI engages third-party companies to lease and construction management fees and leasing commissions in accordance with the terms ofmanage its property-level managementapartment properties.
The Company has a development agreement with
Triad. Regis I isUnified Housing Foundation, Inc. (“UHF”) a non-profit corporation that provides management services for the development of residential apartment projects in the future. The Company has also
entitledinvested in surplus cash notes receivables from UHF and has sold several residential apartment properties to
receive real estate brokerage commissionsUHF in
accordance withprior years. Due to this ongoing relationship and the
terms of a non-exclusive brokerage agreement. The sole member of Regis I is HRSHLLC. See Part III, Item 10. “Directors, Executive Officers and Corporate Governance”.TCI has no employees. Employees of Prime render services to TCIsignificant investment in accordance with the termsperformance of the Advisory Agreement.
collateral secured under the notes receivable, UHF has been determined to be a related party.
Our primary business is the acquisition, development and ownership of income-producing residential and commercial real estate properties. In addition, we opportunistically acquire land for future development in in-fill or high-growth suburban markets. From time to time and when we believe it appropriate to do so, we will also sell land and income-producing properties. We generate revenues by leasing apartment units to residents, and leasing office, industrial and retail space to various for-profit businesses as well as certain local, state and federal agencies. We also generate revenues from gains on sales of income-producing properties and land.
At December 31,
2009,2012, our income-producing properties consisted of:
13 commercial properties consisting of 1910 office buildings, sixone industrial properties, threewarehouse, and two retail properties, comprising in aggregate almost 5.1approximately 3.4 million square feet; and
47 residential apartment communities comprising almost 11,354 units.8,553 units, excluding apartments being developed.
The following table sets forth the location of our real estate
held for investment (income-producing properties only) by asset type as of December 31,
2009: | | | | | | | | |
| | | Apartments | | Commercial |
Location | | No. | | Units | | No. | | SF |
Greater Dallas-Ft Worth, TX | | 23 | | 4,649 | | 16 | | 2,918,716 |
Greater Houston, TX | | 8 | | 2,272 | | | | |
San Antonio, TX | | 3 | | 852 | | | | |
Temple, TX | | 2 | | 452 | | | | |
Other Texas | | 6 | | 1,329 | | | | |
Mississippi | | 6 | | 328 | | 1 | | 26,000 |
Arkansas | | 4 | | 580 | | | | |
Tennessee | | 3 | | 532 | | | | |
Baton Rouge, LA | | 1 | | 160 | | | | |
Ohio | | 1 | | 200 | | | | |
New Orleans, LA | | | | | | 6 | | 1,369,388 |
Florida | | | | | | 1 | | 6,722 |
Indiana | | | | | | 1 | | 220,461 |
Michigan | | | | | | 1 | | 179,741 |
Oklahoma | | | | | | 1 | | 225,566 |
Wisconsin | | | | | | 1 | | 122,205 |
| | | | | | | | |
Total | | 57 | | 11,354 | | 28 | | 5,068,799 |
| | | | | | | | |
2012:
| | | Apartments | | | Commercial | |
| Location | | No. | | | Units | | | No. | | | SF | |
| Alaska | | | - | | | | - | | | | 1 | | | | 20,715 | |
| Arkansas | | | 4 | | | | 678 | | | | - | | | | - | |
| Florida | | | - | | | | - | | | | 1 | | | | 6,722 | |
| Louisiana-New Orleans | | | - | | | | - | | | | 3 | | | | 1,313,525 | |
| Louisiana-Other | | | 2 | | | | 384 | | | | - | | | | - | |
| Mississippi | | | 7 | | | | 568 | | | | 1 | | | | 26,000 | |
| Ohio | | | 1 | | | | 200 | | | | - | | | | - | |
| Oklahoma | | | - | | | | - | | | | 1 | | | | 225,566 | |
| Tennessee | | | 2 | | | | 312 | | | | | | | | - | |
| Texas-Greater Dallas-Ft Worth | | | 19 | | | | 3,712 | | | | 5 | | | | 1,652,986 | |
| Texas-Greater Houston | | | 3 | | | | 656 | | | | - | | | | - | |
| Texas-San Antonio | | | 2 | | | | 468 | | | | - | | | | - | |
| Texas -Temple | | | 1 | | | | 232 | | | | - | | | | - | |
| Texas-Other | | | 6 | | | | 1,343 | | | | - | | | | - | |
| Wisconsin | | | - | | | | - | | | | 1 | | | | 122,205 | |
| Total | | | 47 | | | | 8,553 | | | | 13 | | | | 3,367,719 | |
We finance our acquisitions primarily through operating cash flow, proceeds from the sale of land and income-producing properties, and debt financing primarily in the form of property-specific, first-lien mortgage loans from commercial banks and institutional lenders. We finance our development projects principally with short-term, variable-rate construction loans that are refinanced with the proceeds of long-term, fixed-rate amortizing mortgages when the development has been completed and occupancy has been stabilized. When we sell properties, we may carry a portion of the sales price generally in the form of a short-term, interest bearing seller-financed note receivable, secured by the property being sold. We may also from time to time enter into partnerships or joint ventures with various investors to acquire land or income-producing properties or to sell interests in certain of our properties. We
partnerjoin with various third-party development companies to construct residential apartment communities.
We are in the predevelopment process on several residential apartment communities but have not yet begun construction. At December 31, 2012, we had no apartment projects in development. The third-party developer typically holds a general partner, as well as a limited partner interest in a limited partnership formed for the purpose of building a single property while we generally take a limited partner interest in the limited partnership. We may contribute land to the partnership as part of our equity contribution or we may contribute the necessary funds to the partnership to acquire the land. We are required to fund all required equity contributions while the third-party developer is responsible for obtaining construction financing, hiring a general contractor and for the overall management, successful completion and delivery of the project. We generally bear all the economic risks and rewards of ownership in these partnerships and therefore include these partnerships in our consolidated financial statements. The third-party developer is paid a developer fee typically equal to a percentage of the construction costs. When the project reaches stabilized occupancy, we acquire the third-party developer’s partnership interests in exchange for any remaining unpaid developer fees.
At December 31, 2009, our apartment projects in development included (dollars in thousands):
| | | | | | | | | | |
Property | | Location | | No. of Units | | Costs to Date | | Total
Projected
Costs |
Denham Springs | | Garland, TX | | 224 | | $ | 3,092 | | $ | 20,632 |
Toulon | | Gautier, MS | | 240 | | | 2,876 | | | 27,350 |
| | | | | | | | | | |
Total | | | | 464 | | $ | 5,968 | | $ | 47,982 |
| | | | | | | | | | |
We have made investments in a number of large tracts of undeveloped and partially developed land and intend to a) continue to improve these tracts of land for our own development purposes or b) make the improvements necessary to ready the land for sale to other developers.
At December 31,
2009,2012, our investments in undeveloped and partially developed land consisted of the following (dollars in thousands):
| | | | | | | | | | | |
Property | | Location | | Date(s)
Acquired | | Acres | | Cost | | Primary Intended Use |
Avana (Circle C) | | Austin, TX | | 2006 | | 1,092 | | $ | 42,953 | | Single-family residential |
Dallas North Tollway Multi-Tracts | | Dallas, TX | | 2006 | | 17 | | | 16,005 | | Commercial |
Capital City Center | | Jackson, MS | | 2007-2008 | | 8 | | | 12,872 | | Mixed use |
Kaufman County Multi-Tracts | | Kaufman County, TX | | 2000-2008 | | 2,831 | | | 11,883 | | Single-family residential |
Las Colinas Multi-Tracts | | Irving, TX | | 1995-2006 | | 278 | | | 34,897 | | Commercial |
US Virgin Islands Multi-Tracts | | St. Thomas, USVI | | 2005-2008 | | 91 | | | 16,320 | | Single-family residential |
McKinney Multi-Tracts | | McKinney, TX | | 1997-2008 | | 238 | | | 30,544 | | Mixed use |
Mercer Crossing | | Dallas, TX | | 1996-2008 | | 507 | | | 99,201 | | Mixed use |
Pioneer Crossing | | Austin, TX | | 1997-2005 | | 56 | | | 3,690 | | Multi-family residential |
Travis Ranch | | Kaufman County, TX | | 2008 | | 25 | | | 2,780 | | Multi-family residential |
Valley Ranch Multi-Tracts | | Irving, TX | | 2004 | | 30 | | | 5,826 | | Commercial |
Waco Multi-Tracts | | Waco, TX | | 2005-2006 | | 502 | | | 4,911 | | Single-family residential |
Windmill Farms | | Kaufman County, TX | | 2008 | | 246 | | | 5,524 | | Single-family residential |
Woodmont Multi-Tracts | | Dallas, TX | | 2006-2008 | | 76 | | | 50,210 | | Mixed use |
| | | | | | | | | | | |
| | | | | |
Subtotal | | | | | | 5,997 | | | 337,618 | | |
Other land holdings | | Various | | 1990-2008 | | 816 | | | 57,747 | | Various |
| | | | | | | | | | | |
Total land holdings | | | | | | 6,813 | | $ | 395,365 | | |
| | | | | | | | | | | |
| | | | Date(s) | | | | | | | | Primary |
| Property | Location | | Acquired | | | Acres | | | Cost | | Intended Use |
| | | | | | | | | | | | |
| Capital City Center | Jackson, MS | | | 2007-2008 | | | | 8 | | | $ | 12,156 | | Mixed use |
| McKinney Multi-Tracts | McKinney, TX | | | 1997-2008 | | | | 112 | | | | 14,059 | | Mixed use |
| Mercer Crossing | Dallas, TX | | | 1996-2008 | | | | 405 | | | | 63,028 | | Mixed use |
| Travis Ranch | Kaufman County, TX | | | 2008 | | | | 25 | | | | 2,547 | | Multi-family residential |
| US Virgin Islands Multi-Tracts | St. Thomas, USVI | | | 2005-2008 | | | | 97 | | | | 16,315 | | Single-family residential |
| Waco Multi-Tracts | Waco, TX | | | 2005-2006 | | | | 173 | | | | 1,072 | | Single-family residential |
Windmill Farms(1) | Kaufman County, TX | | | 2011 | | | | 2,900 | | | | 43,126 | | Single-family residential |
| Other Land Holdings | Various | | | 1990-2010 | | | | 413 | | | | 20,828 | | Various |
| Total Land Holdings | | | | | | | | 4,133 | | | $ | 173,131 | | |
| | | | | | | | | | | | | | | |
(1) Windmill Farms Land was acquired by TCI in 2011 from a subsidiary of ARL, its parent, as part of the approved bankruptcy plan. |
Significant Real Estate Acquisitions/Dispositions and Financings
A summary of some of the significant transactions for the year ended December 31,
20092012 are discussed below:
In
On January 2009, we sold 9.31, 2012, ARL and TCI agreed to rescind the April 1, 2011 sale of 100% of the general and limited partnership interest in Garden Whispering Pines, LP, which owns Whispering Pines apartments, a 320-unit complex located in Topeka, Kansas.
On January 3, 2012, 82.2 acres of land known as
Woodmont Schiff-Park ForestDenton Coonrod land located in
Dallas,Denton County, Texas
for $7.7 million. We received $3.9 million in cash after paying offwas transferred to the existing
debt of $3.2 million and closing costs of $0.6 million. In addition, we bookedlender. This land parcel was previously sold, on March 23, 2011, to Cross County National Associates, LP, a
$2.1 million receivable. There was no gain or loss recorded on the sale of the land parcel.In April 2009, we sold the Cullman Shopping Center, a 92,500 square foot facility located in Cullman, Alabamarelated party, for a sales price of $4.0$1.8 million. The Company did not recognize or record the sale in accordance with ASC 360-20 due to our continuing involvement, which included the potential payment of cash shortfalls, future obligations under the existing mortgage and guaranty, the buyer’s inadequate initial investment and the Company’s questionable recovery of investment cost. The Company determined that no sale had occurred for financial reporting purposes and therefore the asset remained on the books and continued to record operating expenses and depreciation as a period cost until a sale occurred that met the requirements of ASC 360-20. A sale to an independent third party, that met the requirements of ASC 360-20, took place on January 3, 2012 at a sales price equal to the existing mortgage of $0.8 million, that was considered paid in full when ownership transferred to the existing lender. We recorded a gain on sale of $0.04 million on the land parcel sale.
On January 30, 2012, we refinanced the existing mortgage on Parc at Maumelle apartments, a 240-unit complex located in Little Rock, Arkansas, for a new mortgage of $16.8 million. We received $3.0 million in cash after payingpaid off the existing debtmortgage of $16.1 million and paid $1.0 million.million in closing costs and escrow reserves. The project was soldnote accrues interest at 3.00% and payments of interest and principal are due monthly based upon a 40-year amortization schedule, maturing on February 1, 2052.
On February 2, 2012, TCI and its subsidiary, 1340 Poydras, LLC, executed a guarantor settlement and consent agreement with the lender for the Amoco building, Petra CRE CDO 2007-1, Ltd (“Petra”) to transfer ownership of the Amoco building to a new entity, 1340 Owner, LLC, which is affiliated with the existing lender, Petra. Petra and its affiliate are independent third parties. Regis will continue to manage the property while under Petra’s ownership and TCI will have an option to re-acquire the property during the option term which shall end two years following the commencement of the agreement. We have deferred the recognition of the sale in accordance with ASC 360-20 due to our continuing involvement related party; thereforeto the gain of $1.9 million was deferredobligations under the note and will be recorded upon sale to a third party.In April 2009, we sold 3.02guaranty agreements and the re-acquisition option.
On February 7, 2012, 22.92 acres of land known as West EndAndrew B land, Denton County, Texas was transferred to the existing lender. This land parcel was previously sold, on September 1, 2011, to TCI Luna Ventures, LLC, a related party, for a sales price of $1.3 million. The Company did not recognize or record the sale in accordance with ASC 360-20 due to our continuing involvement, which included the potential payment of cash shortfalls, future obligations under the existing mortgage and guaranty, the buyer’s inadequate initial investment and the Company’s questionable recovery of investment cost. The Company determined that no sale had occurred for financial reporting purposes and therefore the asset remained on the books and continued to record operating expenses and depreciation as a period cost until a sale occurred that met the requirements of ASC 360-20. A sale to an independent third party, that met the requirements of ASC 360-20, took place on February 7, 2012, when the Company received a credit against the outstanding debt of $2.1 million, which is part of a multi-tract collateral obligation, and the existing lender took possession of the property. We recorded a gain on sale of $1.2 million on the land parcel sale.
On February 23, 2012, we sold a 220-unit apartment complex known as Wildflower Villas apartments located in Temple, Texas to an independent third party, for a sales price of $19.6 million. The buyer assumed the existing debt of $13.7 million secured by the property. We recorded a gain on sale of $3.6 million on the apartment sale.
On February 29, 2012, we refinanced the existing mortgage on Huntington Ridge apartments, a 198-unit complex located in DeSoto, Texas, for a new mortgage of $15.0 million. We paid off the existing mortgage of $14.6 million and paid $1.2 million in closing costs and escrow reserves. The note accrues interest at 3.03% and payments of interest and principal are due monthly based upon a 40-year amortization schedule, maturing on March 1, 2052.
On February 29, 2012, we refinanced the existing mortgage on Laguna Vista apartments, a 206-unit complex located in Dallas, Texas, for a new mortgage of $17.7 million. We paid off the existing mortgage of $17.0 million and paid $1.1 million in closing costs and escrow reserves. The note accrues interest at 3.03% and payments of interest and principal are due monthly based upon a 40-year amortization schedule, maturing on March 1, 2052.
On February 29, 2012, we refinanced the existing mortgage on Savoy of Garland apartments, a 144-unit complex located in Garland, Texas, for a new mortgage of $10.3 million. We paid off the existing mortgage of $10.2 million and paid $0.9 million in closing costs and escrow reserves. The note accrues interest at 3.03% and payments of interest and principal are due monthly based upon a 40-year amortization schedule, maturing on March 1, 2052.
On March 1, 2012, we sold 100% of our interests in LaDue, LLC to ABC Land & Development, Inc., a related party, for a sales price of $8.5$1.9 million. This entity owns 8.01 acres of land known as LaDue land located in Dallas County, Texas. We provided $1.3 million in seller-financing with a five-year note receivable. The note accrues interest at 5% and is payable at maturity on March 1, 2017. The buyer assumed the existing mortgage of $0.6 million, secured by the property. The Company did not recognize or record the sale in accordance with ASC 360-20 due to our continuing involvement, which included the potential payment of cash shortfalls, future obligations under the existing mortgage and guaranty, the buyer’s inadequate initial investment and the Company’s questionable recovery of investment cost. The Company determined that no sale had occurred for financial reporting purposes and therefore the asset remained on the books and continued to record operating expenses and depreciation as a period cost until a sale occurred that met the requirements of ASC 360-20. On August 10, 2012, we re-purchased 100% of the membership interests in LaDue, LLC from ABC Land & Development, Inc., a related party, for $1.9 million to be paid by assumption of debt of $0.6 million, secured by the property, and cancellation of a five-year seller-financed note of $1.3 million. There is no change in the financial statements related to the March 1, 2012 sale or the subsequent re-acquisition.
On March 1, 2012, the construction loan in the amount of $11.1 million that was taken out on July 30, 2010 to fund the development of Sonoma Court apartments, a 124-unit complex, closed into permanent financing. The note accrues interest at 5.35% and payments of interest and principal are due monthly based upon a 40-year amortization schedule, maturing on November 1, 2051.
On March 5, 2012, 7.39 acres of land known as DeSoto Ranch land located in DeSoto, Texas was transferred to the existing lender. This land parcel was previously sold, on September 1, 2011, to TCI Luna Ventures, LLC, a related party, for a sales price of $1.3 million. The Company did not recognize or record the sale in accordance with ASC 360-20 due to our continuing involvement, which included the potential payment of cash shortfalls, future obligations under the existing mortgage and guaranty, the buyer’s inadequate initial investment and the Company’s questionable recovery of investment cost. The Company determined that no sale had occurred for financial reporting purposes and therefore the asset remained on the books and continued to record operating expenses and depreciation as a period cost until a sale occurred that met the requirements of ASC 360-20. A sale to an independent third party, that met the requirements of ASC 360-20, took place on March 5, 2012, when the Company received a credit against the outstanding debt of $1.0 million, which is part of a multi-tract collateral obligation, and the existing lender took possession of the property. We recorded a gain on sale of $0.1 million on the land parcel sale.
On March 27, 2012, we sold 319.07 acres of land known as Waco Ritchie land located in Waco, Texas to an independent third party, for a sales price of $1.9 million. The existing mortgage of $1.5 million, secured by the property, was paid in full. We recorded a loss on sale of $0.8 million on the land parcel sale.
On March 28, 2012, the construction loan in the amount of $24.2 million that was taken out on February 18, 2010 to fund the development of Blue Ridge apartments, a 290-unit complex, closed into permanent financing. The note accrues interest at 5.37% and payments of interest and principal are due monthly based upon a 40-year amortization schedule, maturing on October 1, 2051.
On April 1, 2012, we purchased 1,000 shares of stock of Kelly Lot Development, Inc. from Tacco Financial, Inc., a related party, for $5.6 million. This entity owns six land parcels, comprising approximately 52.59 acres of undeveloped land located in Dallas County, Texas, Kaufman County, Texas, Nashville, Tennessee and Tarrant County, Texas, known as Kelly Lots land, Travis Ranch land, Nashville land, Cooks Lane land, Seminary West land and Vineyards land. We assumed the existing mortgages of $0.5 million and $0.4 million, secured by the property. The loans accrue interest at 15.00% and are payable at maturity on May 1, 2013 and November 1, 2013, respectively.
On April 3, 2012, 5.22 acres of land known as Andrew C land located in Denton, Texas was transferred to the existing lender. This land parcel was previously sold, on September 1, 2011, to TCI Luna Ventures, LLC, a related party, for a sales price of $0.4 million. The Company did not recognize or record the sale in accordance with ASC 360-20 due to our continuing involvement, which included the potential payment of cash shortfalls, future obligations under the existing mortgage and guaranty, the buyer’s inadequate initial investment and the Company’s questionable recovery of investment cost. The Company determined that no sale had occurred for financial reporting purposes and therefore the asset remained on the books and continued to record operating expenses and depreciation as a period cost until a sale occurred that met the requirements of ASC 360-20. A sale to an independent third party, that met the requirements of ASC 360-20, took place on April 3, 2012, when the Company received a credit against the outstanding debt of $0.5 million, which is part of a multi-tract collateral obligation, and the existing lender took possession of the property. We recorded a gain on sale of $0.2 million on the land parcel sale.
On April 5, 2012, we sold Clarke Garage, a 6,869 square foot parking garage, located in New Orleans, Louisiana to an independent third party, for a sales price of $6.0 million. All of the sale proceeds went to pay down existing mortgages, secured by the property. We recorded a loss on sale of $0.3 million on the parking garage sale.
On April 30, 2012, we refinanced the existing mortgage on Parc at Metro Center apartments, a 144-unit complex located in Nashville, Tennessee, for a new mortgage of $11.0 million. We received $4.6 million in cash after payingpaid off the existing mortgage of $10.5 million and paid $0.7 million in closing costs and escrow reserves. The note accrues interest at 2.95% and payments of interest and principal are due monthly based upon a 40-year amortization schedule, maturing on May 1, 2052.
On May 16, 2012, we sold 0.42 acres of land known as 1013 Common Street located in New Orleans, Louisiana to an independent third party, for a sales price of $650,000. All of the sale proceeds went to pay down an existing mortgage, secured by the property.
On May 17, 2012, we sold a 220-unit apartment complex known as Portofino at Mercer Crossing apartments located in Farmers Branch, Texas to an independent third party, for a sales price of $26.0 million. The existing mortgage of $19.9 million, secured by the property, was paid in full. We recorded a gain on sale of $2.0 million on the apartment sale.
On May 25, 2012, we refinanced the existing mortgage on Pecan Pointe apartments, a 232-unit complex located in Temple, Texas, for a new mortgage of $16.8 million. We paid off the existing mortgage of $16.4 million and paid $1.3 million in closing costs and escrow reserves. The note accrues interest at 3.03% and payments of interest and principal are due monthly based upon a 40-year amortization schedule, maturing on June 1, 2052.
On May 30, 2012, we refinanced the existing mortgage on Blue Lake Villas II apartments, a 70-unit complex located in Waxahachie, Texas, for a new mortgage of $4.1 million. We paid off the existing mortgage of $3.9 million and paid $0.2 million in closing costs and escrow reserves. The note accrues interest at 2.85% and payments of interest and principal are due monthly based upon a 40-year amortization schedule, maturing on June 1, 2052.
On June 1, 2012, we purchased 19.29 acres of Summer Breeze land located in Odessa, Texas, for $2.0 million. On June 12, 2012, we sold 13.31 acres of this land parcel to an independent third party.
On June 8, 2012, we sold 72.22 acres of land known as McKinney Ranch land located in McKinney, Texas to an independent third party, for a sales price of $5.4 million. We paid $5.4 million on the existing mortgage to satisfy a portion of the multi-tract collateral debt of $3.4$7.6 million, secured by the property. We recorded a gain on sale of $1.0 million on the land parcel sale.
On June 19, 2012, the construction loan in the amount of $16.4 million that was taken out on September 14, 2010 to fund the development of Lodge at Pecan Creek apartments, a 192-unit complex, closed into permanent financing. The note accrues interest at 5.05% and payments of interest and principal are due monthly based upon a 40-year amortization schedule, maturing on March 1, 2052.
On June 22, 2012, we sold 305 Baronne, a 37,081 square foot building, located in New Orleans, Louisiana to an independent third party, for a sales price of $825,000. We paid $0.7 million on an existing mortgage, secured by the property. We recorded a loss on sale of $0.4 million on the building sale.
On June 28, 2012, we refinanced the existing mortgage on Lake Forest apartments, a 222-unit complex located in Houston, Texas, for a new mortgage of $12.8 million. We paid off the existing mortgage of $12.0 million and paid $1.0 million in closing costs and escrow reserves. The note accrues interest at 2.85% and payments of $0.5interest and principal are due monthly based upon a 40-year amortization schedule, maturing on July 1, 2052.
On June 28, 2012, we refinanced the existing mortgage on Mission Oaks apartments, a 228-unit complex located in San Antonio, Texas, for a new mortgage of $15.6 million. We paid off the existing mortgage of $14.9 million and paid $1.0 million in closing costs and escrow reserves. The note accrues interest at 2.95% and payments of interest and principal are due monthly based upon a 40-year amortization schedule, maturing on July 1, 2052.
On June 28, 2012, we refinanced the existing mortgage on Paramount Terrace apartments, a 181-unit complex located in Amarillo, Texas, for a new mortgage of $3.2 million. We paid off the existing mortgage of $2.8 million and paid $0.4 million in closing costs and escrow reserves. The note accrues interest at 2.85% and payments of interest and principal are due monthly based upon a 40-year amortization schedule, maturing on July 1, 2045.
On June 28, 2012, we refinanced the existing mortgage on Sugar Mill apartments, a 160-unit complex located in Addis, Louisiana, for a new mortgage of $12.0 million. We paid off the existing mortgage of $11.8 million and paid $1.0 million in closing costs and escrow reserves. The note accrues interest at 2.85% and payments of interest and principal are due monthly based upon a 40-year amortization schedule, maturing on July 1, 2052.
On June 29, 2012, we sold 2.59 acres of land known as Vineyards land located in Grapevine, Texas to an independent third party, for a sales price of $2.4 million. The existing mortgage of $0.4 million, secured by the property, was paid in full. We recorded a gain on sale of $1.4 million on the land parcel sale.
On June 29, 2012, we sold 4.33 acres of land known as Vineyards land located in Grapevine, Texas to an independent third party, for a sales price of $3.9 million. We recorded a gain on sale of
$4.9$2.2 million on the land
parcel.In April 2009,parcel sale.
On July 1, 2012, we sold 3.13recorded the June 12, 2012 sale of 13.31 acres of land known as Verandas at City ViewSummer Breeze land located in Fort Worth,Odessa, Texas to an independent third party, for $2.2 million. We provided $2.2 million in seller-financing with a 15-month note receivable. The note accrues interest at 5% and is payable at maturity on September 8, 2013. We have deferred the recognition of the gain in accordance with ASC 360-20 due to the buyer’s inadequate initial investment.
On July 11, 2012, we sold Dunes Plaza, a 220,439 square foot retail center and 14.60 acres of land, located in Michigan City, Indiana to an independent third party, for a sales price of $1.3$3.0 million. We paid off$2.2 million on an existing mortgage, secured by the property and $0.8 million in closing costs and unpaid real estate taxes. We recorded a gain on sale of $0.1 million on the building sale.
On August 10, 2012, we purchased 100% of the membership interests in LaDue, LLC from ABC Land & Development, Inc., a related party, for $1.9 million to be paid by assumption of debt of $0.6 million, secured by the property, and cancellation of a five-year seller-financed note of $1.3 million. This entity owns 8.01 acres of land known as LaDue land located in Dallas County, Texas. TCI originally sold the membership interests in LaDue, LLC on March 1, 2012 but did not record the sale for accounting purposes. See the above March 1, 2012 sale disclosure for details of the accounting treatment.
On September 6, 2012, we sold 19.82 acres of land known as McKinney Ranch land located in McKinney, Texas to an independent third party, for a sales price of $3.0 million. The existing mortgage of $2.6 million, secured by the property, was paid in full. We recorded a gain on sale of $0.2 million on the land parcel sale.
On September 11, 2012, we sold 7.977 acres of land known as Kinwest Manor land located in Farmers Branch, Texas to an independent third party, for a sales price of $2.3 million. The existing multi-collateral mortgage was paid down by $1.2 million. We recorded a loss on sale of $14,000 on the land parcel sale.
On September 12, 2012, we sold 9.39 acres of land known as Lacy Longhorn land located in Farmers Branch, Texas to an independent third party, for a sales price of $3.1 million. All of the sale proceeds were used to pay down a portion of the multi-tract collateral debt, secured by the property. We recorded a gain on sale of $2.1 million on the land parcel sale.
On September 12, 2012, we sold two land parcels, comprising approximately 7.39 acres of undeveloped land located in Dallas, Texas and Farmers Branch, Texas, known as Lacy Longhorn land and Manhattan 2 land to an independent third party, for a sales price of $2.4 million. Seller-financing was provided for $1.9 million. We recorded a gain on sale of $1.3 million and closing costson the land parcels sale.
On September 24, 2012, we sold 3.89 acres of
$0.01.land known as Copperridge land located in Dallas, Texas to an independent third party for a sales price of $3.2 million. The existing mortgage of $2.3 million, secured by the property, was paid in full. We recorded a
gainloss on sale of $0.7 million on the land
parcel.In June 2009,parcel sale.
On September 28, 2012, we sold
3.9640.49 acres of land known as
TeleportMarine Creek land located in
Irving,Fort Worth, Texas
to an independent third party, for a sales price of
$1.1$1.8 million.
We received $1.0 million in cash after payingAll of the sale proceeds were used to pay off the
existingmulti-tract collateral debt,
of $0.1 million and closing costs.secured by the property. We recorded a gain on sale of
$0.4 million$35,000 on the land
parcel.In July 2009, we sold 29.53parcel sale.
On December 31, 2012, 21.26 acres of
Hines Meridianland known as Pioneer Crossing land located in
Dallas,Austin, Texas
and 807.90 acres of Travis Ranch land located in Kaufman County, Texas for $16.0 million. We paid offwas transferred to the existing
debt of $13.5 million. We recorded no gain or losslender. This land parcel was previously sold, on
the land parcels.In July 2009, we sold the 5000 Space Center,September 1, 2011, to TCI Luna Ventures, LLC, a 101,500 square foot commercial facility located in San Antonio, Texas and the 5360 Tulane, a 30,000 square foot commercial facility located in Atlanta, Georgiarelated party, for a sales price of $4.0$1.4 million. We received $2.7 millionThe Company did not recognize or record the sale in accordance with ASC 360-20 due to our continuing involvement, which included the potential payment of cash after paying offshortfalls, future obligations under the existing mortgage and guaranty, the buyer’s inadequate initial investment and the Company’s questionable recovery of investment cost. The Company determined that no sale had occurred for financial reporting purposes and therefore the asset remained on the books and continued to record operating expenses and depreciation as a period cost until a sale occurred that met the requirements of ASC 360-20. A sale to an independent third party A sale to an independent third party, that met the requirements of ASC 360-20, received a credit against the outstanding debt of $1.3 million.$0.3 million, which is part of a multi-tract collateral obligation, and the existing lender took possession of the property. We recorded a gainloss on sale of $3.0$1.0 million on the commercial properties.
In September 2009, we purchased 54.86 acres of Gautier land located at Gautier, Mississippi for $3.4 million.
In September 2009, we obtained a new $5 million loan with a commercial lender which was collateralized by 6.51 acres of Hines land located in Farmers Branch, Texas, 2.194 acres of Valley View 34 land located in Farmers Branch, Texas, and 15.066 acres of Travelers land located in Farmers Branch, Texas. We received cash of $2.0 million after paying off $2.6 million of existing debt and $0.4 million in closing costs.
In October 2009,parcel sale.
On December 31, 2012, we sold
100% of the
2010 Valley View office building;stock in T Southwood 1394, Inc., to One Realco Corporation, a
40,666 square foot facility located in Farmers Branch, Texas,related party, for a sales price of
$3.2$0.6 million.
We received $1.2 million in cash by wayThis entity owns 14.52 acres of
an intercompany note receivable increase after paying off the existing debt of $2.0 million. The property was sold to a related party; therefore the gain of $0.8 million was deferred and will be recorded upon sale to a third party. We also sold the Parkway Centre retail shopping center; a 28,374 square foot facilityland known as Southwood Land located in
Dallas, Texas, for a sales priceTallahassee, Florida. Under the terms of
$4.0 million. We received $1.3 million in cash by way of an intercompany note receivable increase after paying off the
existing debt of $2.6 million. The property was sold to a related party; therefore the gain of $0.6 million was deferred and will be recorded upon sale,
to a third party.In November 2009, we acquired 27.192 acres of McKinney Ranch land located in McKinney, Texas in lieu of a note receivable payoff of $6.4 million and existing mortgage assumption of $5.3 million.
In November 2009, we purchased the Keller Springs Technical Center, an 80,000 square foot commercial building located in Carrollton, Texas for $6.0 million. We assumed the current mortgage of $6.0 million.
In December 2009, we sold the Bridges on Kinsey Apartments, a 232-unit complex, located in Tyler, Texas for $20.5 million. We received $6.8 million in cash, and the buyer assumed the existing mortgage of $14.0$0.6 million, secured by the property. The Company did not recognize or record the sale in accordance with ASC 360-20 due to our continuing involvement, which included the potential payment of cash shortfalls, future obligations under the existing mortgage and guaranty, the buyer’s inadequate initial investment and the Company’s questionable recovery of investment cost. The Company determined that no sale had occurred for financial reporting purposes and therefore the asset remained on the books and continued to record operating expenses and depreciation as a period cost until a sale occurred that met the requirements of ASC 360-20. A sale to an independent third party, that met the requirements of ASC 360-20, took place on January 8, 2013, when the property was sold to a third party and sales proceeds were credited against the outstanding debt. We will not record a gain or loss on the land parcel sale.
In December 2010, there were various commercial and land holdings sold to FRE Real Estate, Inc., a related party; thereforeparty. During the gainfirst three months of $5.2 million was2011, many of these transactions were rescinded as of the original transaction date and were subsequently sold to related parties under the same ownership as FRE Real Estate, Inc. As of December 31, 2012, there is one commercial building, Thermalloy that remains in FRE Real Estate, Inc. We have deferred the recognition of the sales in accordance with ASC 360-20 due to our continuing involvement, the buyer’s inadequate initial investment and will be recorded upon salequestionable recovery of the Company’s investment cost.
The properties that we have sold to a
third party.related party and have deferred the recognition of the sale are treated as “subject to sales contract” on the Consolidated Balance Sheets and are listed in detail in Schedule III, “Real Estate and Accumulated Depreciation”. These properties were sold to a related party in order to help facilitate an appropriate debt or organizational restructure and may or may not be transferred back to the seller upon resolution. These properties have mortgages that are secured by the property and many have corporate guarantees. According to the loan documents, we are currently in default on these mortgages primarily due to lack of payment although we are actively involved in discussions with every lender in order to settle or cure the default situation. We have reviewed each asset and taken impairment to the extent we feel the value of the property was less than our current basis.
We continue to invest in the development of apartment projects. For the twelve months ended December 31,
2009,2012, we have expended
$26.1$5.7 million on the construction of various apartment
projects and capitalized $7.0 million of interest costs.projects.
Business Plan and Investment Policy
Our business objective is to maximize long-term value for our stockholders by investing in commercial real estate through the acquisition, development and ownership of apartments, commercial properties and land. We intend to achieve this objective through acquiring and developing properties in multiple markets and operating as an industry-leading landlord. We believe this objective will provide the benefits of enhanced investment opportunities, economies of scale and risk diversification, both in terms of geographic market and real estate
product type. We believe our objective will also result in continuing access to favorably priced debt and equity capital. In pursuing our business objective, we seek to achieve a combination of internal and external growth while maintaining a strong balance sheet and employing a strategy of financial flexibility. We maximize the value of our apartments and commercial properties by maintaining high occupancy levels while charging competitive rental rates, controlling costs and focusing on tenant retention. We also pursue attractive development opportunities either directly or in partnership with other investors.
For our portfolio of commercial properties, we generate increased operating cash flow through annual contractual increases in rental rates under existing leases. We also seek to identify best practices within our industry and across our business units in order to enhance cost savings and gain operating efficiencies. We employ capital improvement and preventive maintenance programs specifically designed to reduce operating costs and increase the long-term value of our real estate investments.
We seek to acquire properties consistent with our business objectives and strategies. We execute our acquisition strategy by purchasing properties which management believes will create stockholder value over the long-term. We will also sell properties when management believes value has been maximized or when a property is no longer considered an investment to be held long-term.
We are continuously in various stages of discussions and negotiations with respect to development, acquisition, and disposition
of projects. The consummation of any current or future development, acquisition, or disposition, if any, and the pace at which any may be completed cannot be assured or predicted.
Substantially all of our properties are owned by subsidiary companies, many of which are single-asset entities. This ownership structure permits greater access to financing for individual properties and permits flexibility in negotiating a sale of either the asset or the equity interests in the entity owning the asset. From time-to-time, our subsidiaries have invested in joint ventures with other investors, creating the possibility of risks that do not exist with properties solely owned by a TCI subsidiary. In those instances where other investors are involved, those other investors may have business, economic, or other objectives that are inconsistent with our objectives, which may in turn, require us to make investment decisions different from those if we were the sole owner.
Real estate generally cannot be sold quickly. We may not be able to promptly dispose of properties in response to economic or other conditions. To offset this challenge, selective dispositions have been a part of our strategy to maintain an efficient investment portfolio and to provide additional sources of capital. We finance acquisitions through mortgages, internally generated funds, and, to a lesser extent, property sales. Those sources provide the bulk of funds for future acquisitions. We may purchase properties by assuming existing loans secured by the acquired property. When properties are acquired in such a manner, we customarily seek to refinance the asset in order to properly leverage the asset in a manner consistent with our investment objectives.
Our businesses are not generally seasonal with regard to real estate investments. Our investment strategy seeks both current income and capital appreciation. Our plan of operation is to continue, to the extent our liquidity permits, to make equity investments in income-producing real estate such as apartments and commercial properties. We may also invest in the debt or equity securities of real estate-related entities. We intend to pursue higher risk, higher reward investments, such as improved and unimproved land where we can obtain reasonably-priced financing for substantially all of a property’s purchase price. We intend to continue the development of apartment properties in selected markets in Texas and in other locations where we believe adequate levels of demand exist. We intend to pursue sales opportunities for properties in stabilized real estate markets where we believe our properties’ value has been maximized. We also intend to be an opportunistic seller of properties in markets where demand exceeds current supply. Although we no longer actively seek to fund or purchase mortgage loans, we may, in selected instances, originate mortgage loans or we may provide purchase money financing in conjunction with a property sale.
Our Board of Directors has broad authority under our governing documents to make all types of investments, and we may devote available resources to particular investments or types of investments without restriction on the amount or percentage of assets that may be allocated to a single investment or to any particular type of investment, and without limit on the percentage of securities of any one issuer that may be acquired. Investment objectives and policies may be changed at any time by the Board without stockholder approval.
The specific composition from time-to-time of our real estate portfolio owned by TCI directly and through our subsidiaries depends largely on the judgment of management to changing investment opportunities and the level of risk associated with specific investments or types of investments. We intend to maintain a real estate portfolio that is diversified by both location and type of property.
The real estate business is highly competitive and TCI competes with numerous companies engaged in real estate activities (including certain entities described in Part III, Item 13. “Certain Relationships and Related Transactions, and Director Independence”), some of which have greater financial resources than TCI. We believe that success against such competition is dependent upon the geographic location of a property, the performance of property-level managers in areas such as leasing and marketing, collection of rents and control of operating expenses, the amount of new construction in the area and the maintenance and appearance of the property. Additional competitive factors include ease of access to a property, the adequacy of related facilities such as parking and other amenities, and sensitivity to market conditions in determining rent levels. With respect to apartments, competition is also based upon the design and mix of the units and the ability to provide a community atmosphere for the residents. We believe that beyond general economic circumstances and trends, the degree to which properties are renovated or new properties are developed in the competing submarket are also competitive factors. See also Part I, Item1A. “Risk Factors”.
To the extent that TCI seeks to sell any of its properties, the sales prices for the properties may be affected by competition from other real estate owners and financial institutions also attempting to sell properties in areas where TCI’s properties are located, as well as aggressive buyers attempting to dominate or penetrate a particular market.
As described above and in Part III, Item 13. “Certain Relationships and Related Transactions, and Director Independence”, the officers and directors of TCI serve as officers and directors of ARL
the officers of TCI serve as the officers of IOT and
two directors of TCI are also a directors of IOT. Both ARL and IOT have business objectives similar to
TCI’s.those of TCI. TCI’s officers and directors owe fiduciary duties to both IOT and ARL as well as to TCI under applicable law. In determining whether a particular investment opportunity will be allocated to TCI, IOT, or ARL, management considers the respective investment objectives of each Company and the appropriateness of a particular investment in light of each Company’s existing real estate and mortgage notes receivable portfolio. To the extent that any particular investment opportunity is appropriate to more than one of the entities, the investment opportunity may be allocated to the entity which has had funds available for investment for the longest period of time, or, if appropriate, the investment may be shared among all three or two of the entities.
In addition, as described in Part III, Item 13. “Certain Relationships and Related Transactions, and Director Independence”, TCI competes with
affiliatesrelated parties of
PrimePillar having similar investment objectives related to the acquisition, development, disposition, leasing and financing of real estate and real estate-related investments. In resolving any potential conflicts of interest which may arise,
PrimePillar has informed TCI that it intends to exercise its best judgment as to what is fair and reasonable under the circumstances in accordance with applicable law.
We have historically engaged in and will continue to engage in certain business transactions with related parties, including but not limited to asset acquisitions and dispositions. Transactions involving related parties cannot be presumed to be carried out on an arm’s length basis due to the absence of free market forces that naturally exist in business dealings between two or more unrelated entities. Related party transactions may not always be favorable to our business and may include terms, conditions and agreements that are not necessarily beneficial to or in the best interests of our company.
TCI maintains an internet site athttp://www.transconrealty-invest.com. We make available through our website free of charge Annual Reports on Form 10-K, Quarterly Reports on Form 10-Q, Current Reports on Form 8-K, reports filed pursuant to Section 16 and amendments to those reports as soon as reasonably practicable after we electronically file or furnish such materials to the Securities and Exchange Commission. In addition, we have posted the charters for our Audit Committee, Compensation Committee and Governance and Nominating Committee, as well as our Code of Business Conduct and Ethics, Corporate Governance Guidelines on Director Independence and other information on the website. These charters and principles are not incorporated in this Report by reference. We will also provide a copy of these documents free of charge to stockholders upon written request. The Company issues Annual Reports containing audited financial statements to its common
stockholders.shareholders. An investment in our securities involves various risks. All investors should carefully consider the following risk factors in conjunction with the other information in this
Reportreport before trading our securities.
Risk Factors Related to our Business
Adverse events concerning our existing tenants or negative market conditions affecting our existing tenants could have an adverse impact on our ability to attract new tenants, release space, collect rent or renew leases, and thus could adversely affect cash flow from operations and inhibit growth.
Cash flow from operations depends in part on the ability to lease space to tenants on economically favorable terms. We could be adversely affected by various facts and events over which the Company has limited or no control, such as:
lack of demand for space in areas where the properties are located;
inability to retain existing tenants and attract new tenants;
oversupply of or reduced demand for space and changes in market rental rates;
defaults by tenants or failure to pay rent on a timely basis;
the need to periodically renovate and repair marketable space;
physical damage to properties;
economic or physical decline of the areas where properties are located; and
potential risk of functional obsolescence of properties over time.
At any time, any tenant may experience a downturn in its business that may weaken its financial condition. As a result, a tenant may delay lease commencement, fail to make rental payments when due, decline to extend a lease upon its expiration, become insolvent or declare bankruptcy. Any tenant bankruptcy or insolvency, leasing delay or failure to make rental payments when due, could result in the termination of the tenant’s lease and material losses to the Company.
If tenants do not renew their leases as they expire, we may not be able to rent the space. Furthermore, leases that are renewed, and some new leases for space that is re-let, may have terms that are less economically favorable than expiring lease terms, or may require us to incur significant costs, such as renovations, tenant improvements or lease transaction costs. Any of these events could adversely affect cash flow from operations and our ability to make distributions to shareholders and service indebtedness. A significant portion of the costs of owning property, such as real estate taxes, insurance, and debt service payments, are not necessarily reduced when circumstances cause a decrease in rental income from the properties.
We may not be able to compete successfully with other entities that operate in our industry.
We experience a great deal of competition in attracting tenants for the properties and in locating land to develop and properties to acquire.
In our effort to lease properties, we compete for tenants with a broad spectrum of other landlords in each of the markets. These competitors include, among others, publicly-held REITs, privately-held entities, individual property owners and tenants who wish to sublease their space. Some of these competitors may be able to offer prospective tenants more attractive financial terms than we are able to offer.
If the availability of land or high quality properties in our markets diminishes, operating results could be adversely affected.
We may experience increased operating costs which could adversely affect our financial results and the value of our properties.
Our properties are subject to increases in operating expenses such as insurance, cleaning, electricity, heating, ventilation and air conditioning, administrative costs and other costs associated with security, landscaping, repairs, and maintenance of the properties. While some current tenants are obligated by their leases to reimburse us for a portion of these costs, there is no assurance that these tenants will make such payments or agree to pay these costs upon renewal or new tenants will agree to pay these costs. If operating expenses increase in our markets, we may not be able to increase rents or reimbursements in all of these markets to offset the increased expenses, without at the same time decreasing occupancy rates. If this occurs, our ability to make distributions to shareholders and service indebtedness could be adversely affected.
Our ability to achieve growth in operating income depends in part on itsour ability to develop additional properties.
We intend to continue to develop properties where warranted by market conditions. We have a number of ongoing development and land projects being readied for commencement.
Additionally, general construction and development activities include the following risks:
construction and leasing of a property may not be completed on schedule, which could result in increased expenses and construction costs, and would result in reduced profitability for that property;
construction costs may exceed original estimates due to increases in interest rates and increased cost of materials, labor or other costs, possibly making the property less profitable because of inability to increase rents to compensate for the increase in construction costs;
some developments may fail to achieve expectations, possibly making them less profitable;
we may be unable to obtain, or face delays in obtaining, required zoning, land-use, building, occupancy, and other governmental permits and authorizations, which could result in increased costs and could require us to abandon our activities entirely with respect to a project;
we may abandon development opportunities after the initial exploration, which may result in failure to recover costs already incurred. If we determine to alter or discontinue its development efforts, future costs of the investment may be expensed as incurred rather than capitalized and we may determine the investment is impaired resulting in a loss;
we may expend funds on and devote management’s time to projects which will not be completed; and
occupancy rates and rents at newly-completed properties may fluctuate depending on various factors including market and economic conditions, and may result in lower than projected rental rates and reduced income from operations.
We face risks associated with property acquisitions.
We acquire individual properties and various portfolios of properties and intend to continue to do so. Acquisition activities are subject to the following risks:
when we are able to locate a desired property, competition from other real estate investors may significantly increase the seller’s offering price;
acquired properties may fail to perform as expected;
the actual costs of repositioning or redeveloping acquired properties may be higher than original estimates;
acquired properties may be located in new markets where we face risks associated with an incomplete knowledge or understanding of the local market, a limited number of established business relationships in the area and a relative unfamiliarity with local governmental and permitting procedures; and
we may be unable to quickly and efficiently integrate new acquisitions, particularly acquisitions of portfolios of properties, into existing operations, and results of operations and financial condition could be adversely affected.
We may acquire properties subject to liabilities and without any recourse, or with limited recourse, with respect to unknown liabilities. However, if an unknown liability was later asserted against the acquired properties, we might be required to pay substantial sums to settle it, which could adversely affect cash flow.
Many of our properties are concentrated in our primary markets and the Company may suffer economic harm as a result of adverse conditions in those markets.
Our properties are located principally in specific geographic areas in the southwestern, southeastern, and mid-western United States. The Company’s overall performance is largely dependent on economic conditions in those regions.
We are leveraged and may not be able to meet our debt service obligations.
We had total indebtedness at December 31,
20092012 of approximately
$1.2 billion.$808.0 million. Substantially all assets have been pledged to secure debt. These borrowings increase the risk of loss because they represent a prior claim on assets and most require fixed payments regardless of profitability. Our leveraged position makes us vulnerable to declines in the general economy and may limit the Company’s ability to pursue other business opportunities in the future.
We may not be able to access financial markets to obtain capital on a timely basis, or on acceptable terms.
We rely on proceeds from property dispositions and third party capital sources for a portion of our capital needs, including capital for acquisitions and development. The public debt and equity markets are among the sources upon which the Company relies. There is no guarantee that we will be able to access these markets or any other source of capital. The ability to access the public debt and equity markets depends on a variety of factors, including:
general economic conditions affecting these markets;
our own financial structure and performance;
the market’s opinion of real estate companies in general; and
the market’s opinion of real estate companies that own similar properties.
We may suffer adverse effects as a result of terms and covenants relating to the Company’s indebtedness.
Required payments on our indebtedness generally are not reduced if the economic performance of the portfolio declines. If the economic performance declines, net income, cash flow from operations and cash available for distribution to stockholders may be reduced. If payments on debt cannot be made, we could sustain a loss or suffer judgments, or in the case of mortgages, suffer foreclosures by mortgagees. Further, some obligations contain cross-default and/or cross-acceleration provisions, which means that a default on one obligation may constitute a default on other obligations.
We anticipate only a small portion of the principal of its debt will be repaid prior to maturity. Therefore, we are likely to refinance a portion of its outstanding debt as it matures. There is a risk that we may not be able to refinance existing debt or the terms of any refinancing will not be as favorable as the terms of the maturing debt. If principal balances due at maturity cannot be refinanced, extended, or repaid with proceeds from other sources, such as the proceeds of sales of assets or new equity capital, cash flow may not be sufficient to repay all maturing debt in years when significant “balloon” payments come due.
Our credit facilities and unsecured debt contain customary restrictions, requirements and other limitations on the ability to incur indebtedness, including total debt to asset ratios, secured debt to total asset ratios, debt service coverage ratios, and minimum ratios of unencumbered assets to unsecured debt. Our continued ability to borrow is subject to compliance with financial and other covenants. In addition, failure to comply with such covenants could cause a default under credit facilities, and we may then be required to repay such debt with capital from other sources. Under those circumstances, other sources of capital may not be available, or be available only on unattractive terms.
Our degree of leverage could limit our ability to obtain additional financing or affect the market price of our common stock.
The degree of leverage could affect our ability to obtain additional financing for working capital, capital expenditures, acquisitions, development or other general corporate purposes. The degree of leverage could also make us more vulnerable to a downturn in business or the general economy.
An increase in interest rates would increase interest costs on variable rate debt and could adversely impact the ability to refinance existing debt.
We currently have, and may incur more, indebtedness that bears interest at variable rates. Accordingly, if interest rates increase, so will the interest costs, which could adversely affect cash flow and the ability to pay principal and interest on our debt and the ability to make distributions to shareholders. Further, rising interest rates could limit our ability to refinance existing debt when it matures.
Unbudgeted capital expenditures or cost overruns could adversely affect business operations and cash flow.
If capital expenditures for ongoing or planned development projects or renovations exceed expectations, the additional cost of these expenditures could have an adverse effect on business operations and cash flow. In addition, we might not have access to funds on a timely basis to pay the unexpected expenditures.
Construction costs are funded in large part through construction financing, which the Company may guarantee and the Company’s obligation to pay interest on this financing continues until the rental project is completed, leased up and permanent financing is obtained, or the for sale project is sold or the construction loan is otherwise paid. Unexpected delays in completion of one or more ongoing projects could also have a significant adverse impact on business operations and cash flow.
We may need to sell properties from time to time for cash flow purposes.
Because of the lack of liquidity of real estate investments generally, our ability to respond to changing circumstances may be limited. Real estate investments generally cannot be sold quickly. In the event that we must sell assets to generate cash flow, we cannot predict whether there will be a market for those assets in the time period desired, or whether we will be able to sell the assets at a price that will allow the Company to fully recoup its investment. We may not be able to realize the full potential value of the assets and may incur costs related to the early pay-off of the debt secured by such assets.
The Company intends
We intend to devote resources to the development of new projects.
We plan to continue developing new projects as opportunities arise in the future. Development and construction activities entail a number of risks, including but not limited to the following:
we may abandon a project after spending time and money determining its feasibility;
construction costs may materially exceed original estimates;
the revenue from a new project may not be enough to make it profitable or generate a positive cash flow;
we may not be able to obtain financing on favorable terms for development of a property, if at all;
we may not complete construction and lease-ups on schedule, resulting in increased development or carrying costs; and
we may not be able to obtain, or may be delayed in obtaining, necessary governmental permits.
The overall business is subject to all of the risks associated with the real estate industry.
We are subject to all risks incident to investment in real estate, many of which relate to the general lack of liquidity of real estate investments, including, but not limited to:
our real estate assets are concentrated primarily in the southwest and any deterioration in the general economic conditions of this region could have an adverse effect;
changes in interest rates may make the ability to satisfy debt service requirements more burdensome;
lack of availability of financing may render the purchase, sale or refinancing of a property more difficult or unattractive;
changes in real estate and zoning laws;
increases in real estate taxes and insurance costs;
federal or local economic or rent control;
hurricanes, tornadoes, floods, earthquakes and other similar natural disasters.
Our performance and value are subject to risks associated with our real estate assets and with the real estate industry.
Our economic performance and the value of our real estate assets, and consequently the value of our securities, are subject to the risk that if our properties do not generate revenues sufficient to meet our operating expenses, including debt service and capital expenditures, our cash flow will be adversely affected. The following factors, among others, may adversely affect the income generated by our properties:
downturns in the national, regional and local economic conditions (particularly increases in unemployment);
competition from other office and commercial buildings;
local real estate market conditions, such as oversupply or reduction in demand for office or other commercial space;
changes in interest rates and availability of financing;
vacancies, changes in market rental rates and the need to periodically repair, renovate and re-let space;
increased operating costs, including insurance expense, utilities, real estate taxes, state and local taxes and heightened security costs;
civil disturbances, earthquakes and other natural disasters, or terrorist acts or acts of war which may result in uninsured or underinsured losses;
significant expenditures associated with each investment, such as debt service payments, real estate taxes, insurance and maintenance costs which are generally not reduced when circumstances cause a reduction in revenues from a property;
declines in the financial condition of our tenants and our ability to collect rents from our tenants; and
decreases in the underlying value of our real estate.
Adverse economic conditions and dislocations in the credit markets could have a material adverse effect on our results of operations, and financial condition.
Our business may be affected by market and economic challenges experienced by the U.S. economy or real estate industry as a whole or by the local economic conditions in the markets in which our properties are located, including the current dislocations in the credit markets and general global economic recession. These current conditions, or similar conditions existing in the future, may adversely affect our results of operations, and financial condition as a result of the following, among other potential consequences:
the financial condition of our tenants may be adversely affected which may result in tenant defaults under leases due to bankruptcy, lack of liquidity, operational failures or for other reasons;
significant job losses within our tenants may occur, which may decrease demand for our office space, causing market rental rates and property values to be negatively impacted;
our ability to borrow on terms and conditions that we find acceptable, or at all, may be limited, which could reduce our ability to pursue acquisition and development opportunities and refinance existing debt, reduce our returns from our acquisition and development activities and increase our future interest expense;
reduced values of our properties may limit our ability to dispose of assets at attractive prices or to obtain debt financing secured by our properties and may reduce the availability of unsecured loans; and
one or more lenders could refuse to fund their financing commitment to us or could fail and we may not be able to replace the financing commitment of any such lenders on favorable terms, or at all.
Real estate investments are illiquid, and
the Companywe may not be able to sell properties if and when it is appropriate to do so.
Real estate generally cannot be sold quickly. We may not be able to dispose of properties promptly in response to economic or other conditions. In addition, provisions of the Internal Revenue Code may limit our ability to sell properties (without incurring significant tax costs) in some situations when it may be otherwise economically advantageous to do so, thereby adversely affecting returns to stockholders and adversely impacting our ability to meet our obligations.
ITEM 1B. UNRESOLVED STAFF COMMENTS On December 31,
2009,2012, our portfolio consisted of
85 properties. Our60 income-producing properties
consistedconsisting of
5747 apartments totaling
11,3548,553 units,
2813 commercial properties consisting of
1910 office buildings,
sixone industrial
warehouses,warehouse, and
three shoppingtwo retail centers. In addition, we own or control
6,8134,133 acres of improved and unimproved land for future development or sale. The average
annual rental and other property revenue dollar per square foot for the Company’s
apartment/residential
apartment portfolio is
$9.94$10.82 and
$12.10$10.67 for the commercial portfolio. The table below shows information relating to those properties in which we own or have an ownership
interest in. | | | | | | | |
Apartments | | Location | | Units | | Occupancy | |
Anderson Estates | | Oxford, MS | | 48 | | 86.90 | % |
Blue Lake Villas I | | Waxahachie, TX | | 186 | | 90.30 | % |
Blue Lake Villas II | | Waxahachie, TX | | 70 | | 95.70 | % |
Breakwater Bay | | Beaumont, TX | | 176 | | 90.90 | % |
Bridgewood Ranch | | Kaufman, TX | | 106 | | 98.10 | % |
Capitol Hill | | Little Rock, AR | | 156 | | 93.60 | % |
Curtis Moore Estates | | Greenwood, MS | | 104 | | 95.20 | % |
Dakota Arms | | Lubbock, TX | | 208 | | 93.80 | % |
David Jordan Phase II | | Greenwood, MS | | 32 | | 96.90 | % |
David Jordan Phase III | | Greenwood, MS | | 40 | | 87.50 | % |
Desoto Ranch | | DeSoto, TX | | 248 | | 96.20 | % |
Dorado Ranch | | Odessa, TX | | 224 | | 89.70 | % |
Falcon Lakes | | Arlington, TX | | 248 | | 92.70 | % |
Foxwood | | Memphis, TN | | 220 | | 80.00 | % |
Heather Creek | | Mesquite, TX | | 200 | | 92.00 | % |
Huntington Ridge | | DeSoto, TX | | 198 | | 89.90 | % |
Island Bay | | Galveston, TX | | 458 | | 0.00 | % |
Kingsland Ranch | | Houston, TX | | 398 | | 90.20 | % |
Laguna Vista | | Dallas, TX | | 206 | | 91.70 | % |
Lake Forest | | Houston, TX | | 240 | | 90.00 | % |
Legends of El Paso | | El Paso, TX | | 240 | | 97.10 | % |
Longfellow Arms | | Longview, TX | | 216 | | 94.40 | % |
Mansions of Mansfield | | Mansfield, TX | | 208 | | 94.70 | % |
Marina Landing | | Galveston, TX | | 256 | | 0.00 | % |
Mariposa Villas | | Dallas, TX | | 216 | | 93.10 | % |
Mason Park | | Katy, TX | | 312 | | 89.10 | % |
Mission Oaks | | San Antonio, TX | | 228 | | 94.70 | % |
Monticello Estate | | Monticello, AR | | 32 | | 93.80 | % |
Northside on Travis | | Sherman, TX | | 200 | | 82.50 | % |
Paramount Terrace | | Amarillo. TX | | 181 | | 92.80 | % |
Parc at Clarksville | | Clarksville, TN | | 168 | | 94.00 | % |
Parc at Maumelle | | Little Rock, AR | | 240 | | 91.30 | % |
Parc at Metro Center | | Nashville, TN | | 144 | | 94.40 | % |
Parc at Rogers | | Rogers, AR | | 152 | | 87.60 | % |
Pecan Pointe | | Temple, TX | | 232 | | 90.10 | % |
Portofino | | Farmers Branch, TX | | 224 | | 86.20 | % |
Preserve at Pecan Creek | | Denton, TX | | 192 | | 97.90 | % |
Quail Hollow | | Holland, OH | | 200 | | 92.80 | % |
Quail Oaks | | Balch Springs, TX | | 131 | | 90.84 | % |
River Oaks | | Wylie, TX | | 180 | | 91.10 | % |
Riverwalk Phase I | | Greenville, MS | | 32 | | 93.80 | % |
Riverwalk Phase II | | Greenville, MS | | 72 | | 97.20 | % |
| | | | | | | |
Apartments | | Location | | Units | | Occupancy | |
Savoy of Garland | | Garland, TX | | 144 | | 69.44 | % |
Spyglass | | Mansfield, TX | | 256 | | 91.00 | % |
Stonebridge at City Park | | Houston, TX | | 240 | | 90.80 | % |
Sugar Mill | | Baton Rouge, LA | | 160 | | 68.75 | % |
Treehouse | | Irving, TX | | 160 | | 90.60 | % |
Verandas at City View | | Fort Worth, TX | | 314 | | 92.60 | % |
Vistas of Pinnacle Park | | Dallas, TX | | 332 | | 94.00 | % |
Vistas of Vance Jackson | | San Antonio, TX | | 240 | | 96.30 | % |
Wildflower Villas | | Temple, TX | | 220 | | 96.40 | % |
Windsong | | Fort Worth, TX | | 188 | | 91.00 | % |
| | | | | | | |
Total Apartment Units | | | | 10,076 | | | |
| | | | | | | |
| | | |
Office Buildings | | Location | | SqFt | | Occupancy | |
1010 Common | | New Orleans, LA | | 512,593 | | 74.41 | % |
217 Rampart | | New Orleans, LA | | 11,913 | | 0.00 | % |
225 Baronne | | New Orleans, LA | | 422,037 | | 0.00 | % |
305 Baronne | | New Orleans, LA | | 37,081 | | 38.00 | % |
600 Las Colinas | | Las Colinas, TX | | 510,841 | | 72.29 | % |
Amoco Building | | New Orleans, LA | | 378,895 | | 89.00 | % |
Browning Place (Park West I) | | Dallas, TX | | 627,312 | | 100.00 | % |
Ergon Office Building | | Jackson, MS | | 26,000 | | 0.00 | % |
Eton Square | | Tulsa, OK | | 225,566 | | 71.23 | % |
Fenton Center (Park West II) | | Dallas, TX | | 696,458 | | 74.39 | % |
Fruitland Park | | Fruitland, FL | | 6,722 | | 100.00 | % |
Keller Springs Tech Center | | Carrollton, TX | | 80,000 | | 100.00 | % |
One Hickory Center | | Dallas, TX | | 97,361 | | 95.95 | % |
Parkway North | | Dallas, TX | | 69,009 | | 72.41 | % |
Signature Building | | Dallas, TX | | 58,910 | | 0.00 | % |
Stanford Center | | Dallas, TX | | 336,910 | | 100.00 | % |
Teleport | | Las Colinas, TX | | 6,833 | | 100.00 | % |
Two Hickory Center | | Dallas, TX | | 97,117 | | 91.33 | % |
Westgrove Air Plaza | | Addison, TX | | 79,652 | | 70.53 | % |
| | | | | | | |
| | | | 4,281,210 | | | |
| | | | | | | |
| | | |
Industrial Warehouses | | Location | | SqFt | | Occupancy | |
Addison Hanger I | | Addison, TX | | 25,102 | | 100.00 | % |
Addison Hanger II | | Addison, TX | | 24,000 | | 100.00 | % |
Alpenloan | | Dallas, TX | | 28,594 | | 0.00 | % |
Clark Garage | | New Orleans, LA | | 6,869 | | 0.00 | % |
Senlac (VHP) | | Dallas, TX | | 2,812 | | 100.00 | % |
Thermalloy | | Farmers Branch, TX | | 177,805 | | 100.00 | % |
| | | | | | | |
| | | | 265,182 | | | |
| | | | | | | |
| | | | | | | |
Shopping Centers | | Location | | SqFt | | Occupancy | |
Bridgeview Plaza | | LaCrosse, WI | | 122,205 | | 90.13 | % |
Dunes Plaza | | Michigan City, IN | | 220,461 | | 28.58 | % |
Willowbrook Village | | Coldwater, MI | | 179,741 | | 81.25 | % |
| | | | | | | |
| | | | 522,407 | | | |
| | | | | | | |
| | Total Commercial Square Feet | | 5,068,799 | | | |
| | | | | | | |
| | | |
Apartments Held for Sale | | Location | | Units | | Occupancy | |
Baywalk Apartments | | Galveston, TX | | 192 | | 0.00 | % |
| | | | | | | |
| | Total Held for Sale | | 192 | | | |
| | | |
Apartments Subject to Sales Contract | | Location | | Units | | Occupancy | |
Limestone Canyon | | Austin, TX | | 260 | | 90.00 | % |
Limestone Ranch | | Lewisville, TX | | 252 | | 91.70 | % |
Sendero Ridge | | San Antonio, TX | | 384 | | 91.90 | % |
Tivoli | | Dallas, TX | | 190 | | 90.00 | % |
| | | | | | | |
| Total Subject to Sales Contract | | | | 1,086 | | | |
interest:
| Residential Apartments | Location | Units | Occupancy |
| Anderson Estates | Oxford, MS | 48 | 95.80% |
| Blue Lake Villas I | Waxahachie, TX | 186 | 92.50% |
| Blue Lake Villas II | Waxahachie, TX | 70 | 94.30% |
| Blue Ridge | Midland, TX | 290 | 100.00% |
| Breakwater Bay | Beaumont, TX | 176 | 97.20% |
| Bridgewood Ranch | Kaufman, TX | 106 | 91.50% |
| Capitol Hill | Little Rock, AR | 156 | 93.60% |
| Curtis Moore Estates | Greenwood, MS | 104 | 93.30% |
| Dakota Arms | Lubbock, TX | 208 | 96.20% |
| David Jordan Phase II | Greenwood, MS | 32 | 93.80% |
| David Jordan Phase III | Greenwood, MS | 40 | 90.00% |
| Desoto Ranch | DeSoto, TX | 248 | 93.50% |
| Dorado Ranch | Odessa, TX | 224 | 100.00% |
| Falcon Lakes | Arlington, TX | 248 | 96.00% |
| Heather Creek | Mesquite, TX | 200 | 98.00% |
| Huntington Ridge | DeSoto, TX | 198 | 93.90% |
| Laguna Vista | Dallas, TX | 206 | 94.70% |
| Lake Forest | Houston, TX | 240 | 95.80% |
| Legends of El Paso | El Paso, TX | 240 | 85.80% |
| Lodge at Pecan Creek | Denton, TX | 192 | 97.40% |
| Mansions of Mansfield | Mansfield, TX | 208 | 93.30% |
| Mariposa Villas | Dallas, TX | 216 | 96.30% |
| Mission Oaks | San Antonio, TX | 228 | 97.40% |
| Monticello Estates | Monticello, AR | 32 | 96.90% |
| Northside on Travis | Sherman, TX | 200 | 95.00% |
| Paramount Terrace | Amarillo. TX | 181 | 91.70% |
| Parc at Clarksville | Clarksville, TN | 168 | 87.50% |
| Parc at Denham Springs | Denham Springs, LA | 224 | 97.30% |
| Parc at Maumelle | Little Rock, AR | 240 | 92.90% |
| Parc at Metro Center | Nashville, TN | 144 | 100.00% |
| Parc at Rogers | Rogers, AR | 250 | 98.40% |
| Pecan Pointe | Temple, TX | 232 | 96.60% |
| Preserve at Pecan Creek | Denton, TX | 192 | 94.30% |
| River Oaks | Wylie, TX | 180 | 93.90% |
| Riverwalk Phase I | Greenville, MS | 32 | 93.80% |
| Riverwalk Phase II | Greenville, MS | 72 | 86.10% |
| Savoy of Garland | Garland, TX | 144 | 97.20% |
| Sonoma Court | Rockwall, TX | 124 | 99.20% |
| Stonebridge at City Park | Houston, TX | 240 | 96.30% |
| Sugar Mill | Baton Rouge, LA | 160 | 95.60% |
| Toulon | Gautier, MS | 240 | 97.50% |
| Treehouse | Irving, TX | 160 | 93.10% |
| Vistas of Pinnacle Park | Dallas, TX | 332 | 94.30% |
| Vistas of Vance Jackson | San Antonio, TX | 240 | 96.30% |
| Windsong | Fort Worth, TX | 188 | 95.20% |
| | Total Apartment Units | 8,039 | |
| Apartments Subject to Sales Contract | Location | Units | Occupancy |
| Quail Hollow | Holland, OH | 200 | 98.00% |
| | Total Apartments Subject to Sale | 200 | |
| | | | |
| | | | |
| Apartments Held for Sale | Location | Units | Occupancy |
| Verandas at City View | Fort Worth, TX | 314 | 95.20% |
| | Total Apartments Held for Sale | 314 | |
| | | | |
| | | | |
| | Total Apartments | 8,553 | |
| | | | |
| | | | |
| | | | |
| | | | |
| Office Buildings | Location | SqFt | Occupancy |
225 Baronne (1) | New Orleans, LA | 422,037 | 0.00% |
| 600 Las Colinas | Las Colinas, TX | 510,173 | 66.42% |
| 1010 Common | New Orleans, LA | 512,593 | 38.45% |
| Browning Place (Park West I) | Farmers Branch, TX | 625,463 | 72.34% |
| Ergon Office Building | Jackson, MS | 26,000 | 0.00% |
| Senlac (VHP) | Farmers Branch, TX | 2,812 | 100.00% |
| Sesame Square | Anchorage, AK | 20,715 | 90.29% |
| Stanford Center | Dallas, TX | 336,733 | 97.54% |
| | Total Office Buildings | 2,456,526 | |
| | | | |
| | | | |
| Office Buildings Subject to Sales Contract | Location | SqFt | Occupancy |
| Amoco Building | New Orleans, LA | 378,895 | 61.15% |
Eton Square (2) | Tulsa, OK | 43,695 | 27.62% |
| | Total Office Buildings Subject to Sales Contract | 422,590 | |
| | | | |
| | | | |
| | | | |
| | | | |
| Retail Centers | Location | SqFt | |
| Bridgeview Plaza | LaCrosse, WI | 122,205 | 90.47% |
| Fruitland Plaza | Fruitland Park, FL | 6,722 | 100.00% |
| | Total Retail Centers | 128,927 | |
| | | | |
| | | | |
| Retail Centers Subject to Sales Contract | Location | SqFt | Occupancy |
Eton Square (2) | Tulsa, OK | 181,871 | 54.77% |
| | Total Retail Centers Subject to Sales Contract | 181,871 | |
| | | | |
| | | | |
| Industrial Warehouses Subject to Sales Contract | Location | SqFt | Occupancy |
| Thermalloy | Farmers Branch, TX | 177,805 | 100.00% |
| | Total Industrial Warehouses Subject to Sales Contract | 177,805 | |
| | | | |
| | | | |
| | Total Commercial | 3,367,719 | |
| | | | |
| (1) Vacant since 2005's hurricane Katrina. Plans to renovate in the future. | |
| (2) Eton Square is considered one commercial property that includes both office and retail space. |
Lease
expirationsExpirations
The table below shows the lease expirations of the commercial properties over a ten-year period (dollars in thousands):
| | | | | | | | | | | | | | |
Year of Lease Expiration | | Rentable
Square Feet
Subject to
Expiring
Leases | | Current
Annualized(1)
Contractual
Rent Under
Expiring
Leases | | Current
Annualized(1)
Contractual
Rent Under
Expiring
Leases
(P.S.F.) | | Percentage
of Total
Square
Feet | | | Percentage
of Gross
Rentals | |
2010 | | 406,687 | | $ | 7,863,560 | | $ | 19.34 | | 8.0 | % | | 13.3 | % |
2011 | | 676,328 | | | 10,942,024 | | | 16.18 | | 13.3 | % | | 18.5 | % |
2012 | | 524,472 | | | 10,823,665 | | | 20.64 | | 10.3 | % | | 18.3 | % |
2013 | | 618,441 | | | 6,881,905 | | | 11.13 | | 12.2 | % | | 11.7 | % |
2014 | | 270,391 | | | 7,716,042 | | | 28.54 | | 5.3 | % | | 13.1 | % |
2015 | | 63,389 | | | 1,734,771 | | | 27.37 | | 1.3 | % | | 2.9 | % |
2016 | | 106,481 | | | 3,020,107 | | | 28.36 | | 2.1 | % | | 5.1 | % |
2017 | | 385,072 | | | 6,977,105 | | | 18.12 | | 7.6 | % | | 11.8 | % |
2018 | | 42,042 | | | 841,567 | | | 20.02 | | 0.8 | % | | 1.4 | % |
2019 | | 107,707 | | | 2,300,147 | | | 21.36 | | 2.1 | % | | 3.9 | % |
Thereafter | | — | | | — | | | — | | — | | | — | |
| | | | | | | | | | | | | | |
Total | | 3,201,010 | | $ | 59,100,893 | | | | | 63 | % | | 100 | % |
| | | | | | | | | | | | | | |
Year of Lease Expiration | | Rentable Square Feet Subject to Expiring Leases | | | Current Annualized (1) Contractual Rent Under Expiring Leases | | | Current Annualized(1) Contractual Rent Under Expiring Leases (P.S.F.) | | | Percentage of Total Square Feet | | | Percentage of Gross Rentals | |
| | | | | | | | | | | | | | | | |
| 2013 | | | 291,720 | | | $ | 3,754,058 | | | $ | 12.87 | | | | 8.7 | % | | | 15.2 | % |
| 2014 | | | 319,679 | | | $ | 4,995,588 | | | $ | 15.63 | | | | 9.5 | % | | | 20.2 | % |
| 2015 | | | 102,109 | | | $ | 1,297,424 | | | $ | 12.71 | | | | 3.0 | % | | | 5.3 | % |
| 2016 | | | 404,353 | | | $ | 4,082,874 | | | $ | 10.10 | | | | 12.0 | % | | | 16.5 | % |
| 2017 | | | 329,371 | | | $ | 5,591,213 | | | $ | 16.98 | | | | 9.8 | % | | | 22.6 | % |
| 2018 | | | 47,399 | | | $ | 723,900 | | | $ | 15.27 | | | | 1.4 | % | | | 2.9 | % |
| 2019 | | | 105,483 | | | $ | 2,185,700 | | | $ | 20.72 | | | | 3.1 | % | | | 8.8 | % |
| 2020 | | | 29,267 | | | $ | 611,996 | | | $ | 20.91 | | | | 0.9 | % | | | 2.5 | % |
| 2021 | | | 20,121 | | | $ | 359,213 | | | $ | 17.85 | | | | 0.6 | % | | | 1.5 | % |
| Thereafter | | | 76,665 | | | $ | 1,099,230 | | | $ | 14.34 | | | | 2.3 | % | | | 4.5 | % |
| Total | | | 1,726,167 | | | $ | 24,701,196 | | | | | | | | 51.3 | % | | | 100 | % |
| (1) | Represents the monthly contractual base rent and recoveries from tenants under existing leases as of December 31, 20092012 multiplied by twelve. This amount reflects total rent before any rent abatements and includes expense reimbursements, which may be estimates as of such date. |
| Land | Location | | | Acres |
Land
| | Location
| | Acres |
1013 Common St
| | New Orleans, LA | | 0.41 |
Ackerley Land
| | Dallas, TX | | 1.31 |
Alliance Airport
| | Tarrant County, TX | | 12.70 |
Alliance Centurion
| | Tarrant County, TX | | 51.90 |
Alliance Hickman Bluestar
| | Tarrant County, TX | | 8.00 |
Archon Land
| | Irving, TX | | 24.14 |
Audubon | | Adams County, MS | | 48.20 |
Centura Land
| | Dallas, TX | | 10.08 |
Circle C Land
| | Austin, TX | | 1,092.00 |
Cooks Lane Land | | Fort Worth, TX | | 23.24 |
Copperridge
Dedeaux | Gulfport, MS | 10.00 |
| Denham Springs | Denham Springs, LA | 4.38 |
| Gautier | Gautier, MS | 40.06 |
| Hollywood Casino Tract II | Farmers Branch, TX | 13.85 |
| Hunter Equities | Dallas, TX | | 3.902.56 |
Creekside
Jackson Capital City Center | Jackson, MS | 7.95 |
| Kelly Lot | Farmers Branch, TX | 0.75 |
| Lacy Longhorn | Farmers Branch, TX | 5.08 |
| LaDue | Farmers Branch, TX | 8.01 |
| Lake Shore Villas | Humble, TX | 19.51 |
| Lubbock | Lubbock, TX | 2.86 |
| Luna (Carr) | Farmers Branch, TX | 2.60 |
| Manhanttan | Farmers Branch, TX | 32.02 |
| McKinney 36 | Collin County, TX | 34.05 |
| McKinney Ranch | McKinney,TX | 77.70 |
| Nashville | Nashville, TN | 11.87 |
| Nicholson Croslin | Dallas, TX | 0.80 |
| Nicholson Mendoza | Dallas, TX | 0.35 |
| Ocean Estates | Gulfport, MS | 12.00 |
| Seminary West | Fort Worth, TX | | 30.073.02 |
Crowley
Summer Breeze | | Fort Worth,Odessa, TX | | 24.905.98 |
Dedeaux
Texas Plaza | Irving, TX | | Gulfport, MS | | 10.0010.33 |
Denham Springs
| | Denham Springs, LA | | 0.50 |
Denton (Andrew B)
| | Denton, TX | | 22.90 |
Denton (Andrew C)
| | Denton, TX | | 5.20 |
Denton Coonrod
| | Denton, TX | | 82.80 |
Denton Land
| | Denton, TX | | 15.65 |
Desoto Ranch
| | Desoto, TX | | 8.02 |
Diplomat Drive
| Travelers | Farmers Branch, TX | | 11.65193.17 |
Dominion Tract
Travis Ranch | Kaufman County, TX | 16.80 |
| Travis Ranch Retail | Kaufman County, TX | 8.13 |
| Union Pacific Railroad | Dallas, TX | | 10.590.04 |
Eagle Crest
US Virgin Islands | US Virgin Islands | | Dallas, TX | | 18.6096.60 |
Ewing 8
| | Addison, TX | | 16.79 |
Fortune Drive
| | Irving, TX | | 14.88 |
Galleria East Center Retail
| | Dallas, TX | | 15.00 |
Gautier
| | Gautier, MS | | 40.06 |
Hines Meridian
| | Las Colinas, TX | | 6.51 |
Hollywood Casino (Dominion)
| Valley View 34 (Mercer Crossing) | Farmers Branch, TX | | 18.562.19 |
Hollywood Casino Land
| Valley View/Senlac | Farmers Branch, TX | | 13.853.45 |
Hunter Equities Land
Waco 151 | Waco,TX | 151.40 |
| Waco Swanson | Waco, TX | 21.58 |
| Walker | Dallas County, TX | | 2.5682.59 |
Jackson Convention Center
Willowick | Pensacola, FL | | Jackson, MS | | 7.9539.78 |
Kaufman-Adams
| Windmill Farms | Kaufman County, TX | | 193.732,900.00 |
Kaufman-Bridgewood
| Total Land/Development | 3,892.90 |
| | Kaufman County, |
| | |
| Land Subject to Sales Contract | Location | Acres |
| Dominion Tract | Dallas, TX | | 5.0410.59 |
Kaufman-Cogen
| | Forney, TX | | 2,567.00 |
Kaufman-Stagliano
| | Forney, TX | | 34.80 |
Kaufman-Taylor
| | Forney, TX | | 31.00 |
Keller Springs Lofts
| | Addison, TX | | 7.40 |
Kinwest Manor
| | Irving, TX | | 7.98 |
Lacy Longhorn Land
| Hollywood Casino Tract I | Farmers Branch, TX | | 17.1219.71 |
LaDue Land
| Luna Ventures | Farmers Branch, TX | | 8.0126.74 |
Lake Shore Villas
Mansfield | | Humble,Mansfield, TX | | 19.5121.89 |
Lamar/Palmer Land
| Pioneer Crossing Tract II | Austin, TX | | 17.0717.28 |
Las Colinas (Cigna)
| | Las Colinas, TX | | 4.70 |
Las Colinas Station
| | Las Colinas, TX | | 10.08 |
Las Colinas Village
| | Las Colinas, TX | | 16.81 |
LCLLP (Kinwest/Hackberry)
| | Las Colinas, TX | | 27.97 |
Limestone CanyonSenlac Tract II
| | Austin, TX | | 9.96 |
Lubbock Land
| | Lubbock, TX | | 2.86 |
Luna (Carr)
| | Farmers Branch, TX | | 2.6011.94 |
Luna Ventures
Sheffield Village | Grand Prairie, TX | 13.90 |
| Southwood Plantation 1394 | Tallahassee, FL | 14.52 |
| Stanley Tools | Farmers Branch, TX | | 26.74 |
Land (continued)
| | | | |
Mandahl Bay Land
| | US Virgin Islands | | 91.10 |
Manhattan Land
| | Farmers Branch, TX | | 108.90 |
Mansfield Land
| | Mansfield, TX | | 21.89 |
Marine Creek
| | Fort Worth, TX | | 44.17 |
McKinney 36
| | Collin County, TX | | 34.48 |
McKinney Corners II
| | Collin County, TX | | 6.76 |
McKinney Ranch Land
| | McKinney,TX | | 200.68 |
Nashville Land
| | Nashville, TN | | 6.25 |
Nicholson-Croslin
| | Dallas, TX | | 0.80 |
Nicholson-Mendoza
| | Dallas, TX | | 0.35 |
Ocean Estates
| | Gulfport, MS | | 12.00 |
Pac Trust Land
| | Farmers Branch, TX | | 7.07 |
Pantaze Land
| | Dallas, TX | | 6.00 |
Payne Land
| | Las Colinas, TX | | 149.70 |
Pioneer Crossing
| | Austin, TX | | 38.54 |
Polo Estates At Bent Tree
| | Dallas, TX | | 5.87 |
Pulaski Land
| | Pulaski County, AR | | 21.90 |
Ridgepoint Drive
| | Irving, TX | | 0.60 |
Seminary West Land
| | Fort Worth, TX | | 3.03 |
Senlac Land
| | Farmers Branch, TX | | 11.94 |
Sheffield Village
| | Grand Prairie, TX | | 13.90 |
Southwood Plantation 1394
| | Tallahassee, FL | | 14.52 |
Stanley Tools
| | Farmers Branch, TX | | 23.76 |
Temple Land
| | Temple, TX | | 10.69 |
Three Hickory
| | Dallas, TX | | 6.64 |
Travelers Land
| | Farmers Branch, TX | | 193.17 |
Travis Ranch Land
| | Kaufman County, TX | | 10.00 |
Travis Ranch Retail
| | Kaufman County, TX | | 14.93 |
Union Pacific Railroad Land
| | Dallas, TX | | 0.04 |
Valley Ranch Land
| | Irving, TX | | 30.00 |
Valley View (Hutton/Senlac)
| | Farmers Branch, TX | | 2.42 |
Valley View 34 (Mercer Crossing)
| | Farmers Branch, TX | | 2.19 |
Valley View/Senlac
| | Farmers Branch, TX | | 3.45 |
W Lofts
| | Dallas, TX | | 7.19 |
W Hotel
| | Dallas, TX | | 1.97 |
Waco 151 Land
| | Waco,TX | | 151.40 |
Waco Swanson
| | Waco, TX | | 350.70 |
Walker Land
| | Farmers Branch, TX | | 82.59 |
West End Land
| | Dallas, TX | | 5.50 |
Whorton Land | | Bentonville, AR | | 79.70 |
Willowick
| Total Land Subject to Sales Contract | | Pensacola, TX | | 39.78240.03 |
Wilmer 88
| | Dallas, TX | | 87.60 |
Windmill Farms-Harlan Land
| | Kaufman County, TX | | 245.95 |
| | | | |
| Total Land/DevelopmentLand | | | | 6,813.42 |
| | | | 4,132.93 |
ITEM 3. LEGAL PROCEEDINGS
The ownership of property and provision of services to the public as tenants entails an inherent risk of liability. Although the Company and its subsidiaries are involved in various items of litigation incidental to and in the ordinary course of its business, in the opinion of Management, the outcome of such litigation will not have a material adverse impact upon the Company’s financial condition, results of operation or
liquidity.liquidity, unless noted otherwise below.
The Company is involved in and vigorously defending against, a number of deficiency claims with respect to assets that have been foreclosed by various lenders. Such claims are generally against a consolidated subsidiary as the borrower or the Company as a guarantor of indebtedness or performance. Some of these proceedings may ultimately result in an unfavorable determination for the Company and/or one of its consolidated subsidiaries. While we cannot predict the final result of such proceedings, Management believes that the maximum exposure to the Company and its consolidated subsidiaries, if any, will not exceed approximately $20 million in the aggregate and will occur, if at all, in future years.
On February 13, 2013, the Court of Appeals, Fifth District of Texas at Dallas (the “Fifth Court of Appeals”) rendered an opinion involving Transcontinental Realty Investors, Inc. (the “Issuer” or “TCI”) in Case No. 05-04-01358-CV styled Basic Capital Management, Inc., American Realty Trust, Inc., Transcontinental Realty Investors, Inc., Continental Poydras Corp., Continental Common, Inc. and Continental Baronne, Inc. v. Dynex Commercial, Inc. and Dynex Capital, Inc. The case was on appeal from the 68th Judicial District Court of Dallas County, Texas, had previously been appealed to the Fifth Court of Appeals and further appealed to the Supreme Court of the State of Texas which had remanded the instant case back to the Fifth Court of Appeals to address certain issues. The case had its origin with Dynex Commercial making loans to Continental Poydras Corp., Continental Common, Inc. and Continental Baronne, Inc. (subsidiaries of Continental Mortgage & Equity Trust (“CMET”), an entity which merged into TCI in 1999 after the original suit was filed). Under the original loan commitment, $160,000,000 in loans were to be made to the entities. The loans were conditioned on the execution of a commitment between Dynex Commercial and Basic Capital Management, Inc. (“Basic”).
An original trial to a jury resulted in the jury awarding significant damages to Basic for “lost opportunity,” awarding damages in “increased costs” and “lost opportunity” damages to American Realty Trust, Inc. (“ART”) and damages of $960,646.28 in “increased costs” and $11,161,520 for “lost opportunity’ damages in favor of TCI and its subsidiaries (a total of $12,122,166.28). The original Trial Court ignored the jury’s findings and entered a “Judgment Notwithstanding the Verdict” (“JNOV”) in Dynex’s favor; the Fifth Court of Appeals has now ruled that the JNOV was improper because there was sufficient evidence to support the jury’s findings. As a result, the Fifth Court of Appeals ordered the Trial Court to enter a new judgment consistent with the jury’s original findings.
The Fifth Court of Appeals also determined that TCI was entitled to damages for “lost opportunities” relating to tenant improvements and awarded TCI an additional $252,577. Issues relating to attorneys fees were also addressed with the Fifth Court of Appeals ordering the Trial Court to “re-try” the issue of attorney’s fees to determine the amount of fees to which TCI would be entitled on a “breach of commitment” claim. In addition, as a result of the changes in amounts awarded and passage of time, the Fifth Court of Appeals also ordered the Trial Court to recalculate the correct amounts of pre and post-judgment interest owed to Appellants.
While the fifteen year old controversy is not yet fully resolved, the Fifth Court of Appeals opinion is favorable to TCI, but TCI expects continued challenges by Dynex to the Fifth Court of Appeals opinion and any ultimate award of damages by the Trial Court.
During the fourth quarter of the fiscal year covered by this Report, no proceeding previously reported was terminated.
ITEM 4. SUBMISSION | OF MATTERS TO A VOTE OF SECURITY HOLDERS |
The Annual Meeting of Stockholders was held on December 10, 2009, at which proxies were solicited pursuant to Regulation 14 under the Securities Exchange Act of 1934, as amended (the “Exchange Act”). There was no solicitation in opposition to management’s nominees listed in the Proxy Statement, all of which were elected. At the annual meeting, stockholders were asked to consider and vote upon the election of Directors and the ratification of the selection of the independent public accountants for TCI for the fiscal year ending December 31, 2009. With respect to each nominee for election as a director, the following table sets forth the number of votes cast for or withheld:
| | | | |
| | | Shares Voting |
Director | | For | | Withheld
Authority |
Henry A. Butler | | 6,962,572 | | 26,749 |
Sharon Hunt | | 6,917,502 | | 71,819 |
Robert A. Jakuszewski | | 6,917,325 | | 71,996 |
Ted R. Munselle | | 6,917,054 | | 72,267 |
There were no abstentions or broker non-votes on the election of Directors. With respect to the ratification of the appointment of Farmer, Fuqua & Huff, P.C. as independent auditors of the Company for the fiscal year ending December 31, 2009, and any interim period, at least 6,978,249 votes were received in favor of such proposal, 2,420 votes were received against such proposal, and 8,652 votes abstained.
ITEM 4. MINE SAFETY DISCLOSURES
Not applicable.
PART II
ITEM 5. MARKET FOR REGISTRANT’S COMMON EQUITY, RELATED STOCKHOLDER MATTERS AND ISSUER PURCHASES OF EQUITY SECURITIESITEM 5. MARKET | FOR REGISTRANT’S COMMON EQUITY, RELATED STOCKHOLDER MATTERS AND ISSUER PURCHASES OF EQUITY SECURITIES |
TCI’s Common
Stockstock is listed and traded on the New York Stock Exchange (“NYSE”) under the symbol “TCI”. The following table sets forth the high and low sales prices as reported in the consolidated reporting system of the NYSE for the quarters
ended. | | | | | | | | | | | | |
| | | 2009 | | 2008 |
| | | High | | Low | | High | | Low |
First Quarter | | $ | 13.70 | | $ | 8.04 | | $ | 17.99 | | $ | 13.88 |
Second Quarter | | $ | 14.12 | | $ | 10.55 | | $ | 20.50 | | $ | 14.69 |
Third Quarter | | $ | 14.50 | | $ | 10.16 | | $ | 15.12 | | $ | 10.25 |
Fourth Quarter | | $ | 12.50 | | $ | 10.23 | | $ | 13.44 | | $ | 9.15 |
ended:
| | | 2012 | | | 2011 | |
| | | High | | | Low | | | High | | | Low | |
| First Quarter | | $ | 2.60 | | | $ | 1.65 | | | $ | 7.20 | | | $ | 3.26 | |
| Second Quarter | | $ | 3.45 | | | $ | 2.35 | | | $ | 4.34 | | | $ | 2.06 | |
| Third Quarter | | $ | 6.01 | | | $ | 2.79 | | | $ | 3.91 | | | $ | 1.70 | |
| Fourth Quarter | | $ | 5.95 | | | $ | 3.46 | | | $ | 2.35 | | | $ | 1.56 | |
On March 25, 2010,20, 2013, the closing price of TCI’s Common Stockstock as reported in the consolidated reporting system of the NYSE was $12.13$5.75 per share, and was held by approximately 4,2003,700 holders of record.Performance Graph
The
TCI’s Board of Directors established a policy that dividend declarations on common stock would be determined on an annual basis following
performance graph compares the
cumulative total stockholder return on TCI’s sharesend of
Common Stockeach year. In accordance with
that policy, the
Dow Jones Industrial Average (“Dow Jones Industrial”) and the Real Estate Investment Index (“Real Estate Index”). The comparison assumes that $100 was invested on December 31, 2004, in TCI’s shares of Common Stock and in each of the indices and further assumes the reinvestment of all distributions. Past performance isboard determined not
necessarily an indicator of future performance.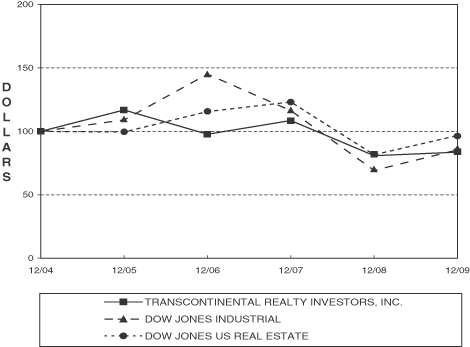
$100 invested on 12/31/04 in stock or index-including reinvestment of dividends.
Fiscal year ending December 31.
| | | | | | | | | | | | | | | | | | |
| | | 12/04 | | 12/05 | | 12/06 | | 12/07 | | 12/08 | | 12/09 |
Transcontinental Realty Investors, Inc. | | $ | 100.00 | | $ | 116.84 | | $ | 97.54 | | $ | 108.49 | | $ | 80.70 | | $ | 83.58 |
Dow Jones Industrial | | $ | 100.00 | | $ | 109.01 | | $ | 145.15 | | $ | 116.33 | | $ | 69.18 | | $ | 85.32 |
Dow Jones US Real Estate | | $ | 100.00 | | $ | 99.39 | | $ | 115.58 | | $ | 123.02 | | $ | 81.39 | | $ | 96.71 |
TCI paid noto pay any dividends on common stock in 2009, 20082012, 2011 or 2007. The payment of dividends, if any,2010. Future distributions to common stockholders will be determined by the Board of Directors in light of conditions then existing, including the Company’s financial condition and requirements, future prospects, restrictions in financing agreements, business conditions and other factors deemed relevant by the Board of Directors.
Board.
In December 1989, the Board of Directors approved a share repurchase program, authorizing the repurchase of a total of 687,000 shares of TCI’s Common
Stock.stock. In June 2000, the Board increased this authorization to
1,409,0001,387,000 shares.
TheOn August 10, 2010, the Board of Directors approved an increase in the share repurchase program for up to an additional 250,000 shares of common stock which results in a total authorization under the repurchase program for up to 1,637,000 shares of our common stock. This repurchase program has no termination date. The following table represents shares repurchased during each
forof the three months of the last quarter ended December 31,
2009: | | | | | | | | |
Period | | Total Number of
Shares Purchased | | Average Price
Paid per share | | Total Number of
Shares Purchased as
Part of Publicly
Announced Program | | Maximum Number
of Shares that May
Yet be Purchased
Under the Program |
Balance at September 30, 2009 | | | | | | 1,286,212 | | 122,788 |
October 31, 2009 | | — | | — | | 1,286,212 | | 122,788 |
November 30, 2009 | | — | | — | | 1,286,212 | | 122,788 |
December 31, 2009 | | — | | — | | 1,286,212 | | 122,788 |
| | | | | | | | |
Total | | — | | | | | | |
| | | | | | | | |
ITEM 6. SELECTED | FINANCIAL DATA |
| | | | | | | | | | | | | | | | | | | | |
| | | For the Years Ended December 31, | |
| | | 2009 | | | 2008 | | | 2007 | | | 2006 | | | 2005 | |
| | | (dollars in thousands, except share and per share amounts) | |
EARNINGS DATA | | | | | | | | | | | | | | | | | | | | |
Total operating revenues | | $ | 151,647 | | | $ | 138,337 | | | $ | 123,704 | | | $ | 96,392 | | | $ | 75,216 | |
Total operating expenses | | | 179,664 | | | | 140,444 | | | | 118,317 | | | | 90,997 | | | | 71,845 | |
| | | | | | | | | | | | | | | | | | | | |
Operating (loss) income | | | (28,017 | ) | | | (2,107 | ) | | | 5,387 | | | | 5,395 | | | | 3,371 | |
Other expenses | | | (61,214 | ) | | | (67,004 | ) | | | (24,532 | ) | | | (22,117 | ) | | | (30,866 | ) |
| | | | | | | | | | | | | | | | | | | | |
Loss before gain on land sales, non-controlling interest, and income tax benefit | | | (89,231 | ) | | | (69,111 | ) | | | (19,145 | ) | | | (16,722 | ) | | | (27,495 | ) |
Gain on land sales | | | 6,296 | | | | 4,798 | | | | 11,956 | | | | 11,421 | | | | 7,702 | |
Income tax benefit (expense) | | | 1,180 | | | | 33,441 | | | | 8,186 | | | | 5,265 | | | | 9,715 | |
| | | | | | | | | | | | | | | | | | | | |
Net income (loss) from continuing operations | | | (81,755 | ) | | | (30,872 | ) | | | 997 | | | | (36 | ) | | | (10,078 | ) |
| | | | | | | | | | | | | | | | | | | | |
Net income from discontinuing operations, net of non-controlling interest | | | 2,182 | | | | 62,427 | | | | 10,064 | | | | 3,149 | | | | 19,035 | |
| | | | | | | | | | | | | | | | | | | | |
Net income (loss) | | | (79,573 | ) | | | 31,555 | | | | 11,061 | | | | 3,113 | | | | 8,957 | |
Net income (loss) attributable to non-controlling interest | | | (125 | ) | | | 654 | | | | 50 | | | | 393 | | | | 112 | |
| | | | | | | | | | | | | | | | | | | | |
Net income (loss) attributable to Transcontinental Realty Investors, Inc. | | | (79,698 | ) | | | 32,209 | | | | 11,111 | | | | 3,506 | | | | 9,069 | |
Preferred dividend requirement | | | (1,023 | ) | | | (975 | ) | | | (925 | ) | | | (210 | ) | | | (210 | ) |
| | | | | | | | | | | | | | | | | | | | |
Net income (loss) applicable to common shares | | $ | (80,721 | ) | | $ | 31,234 | | | $ | 10,186 | | | $ | 3,296 | | | $ | 8,859 | |
| | | | | | | | | | | | | | | | | | | | |
PER SHARE DATA | | | | | | | | | | | | | | | | | | | | |
Earnings per share—basic | | | | | | | | | | | | | | | | | | | | |
Income (loss) from continuing operations | | $ | (10.22 | ) | | $ | (3.86 | ) | | $ | 0.02 | | | $ | 0.02 | | | $ | (1.29 | ) |
Discontinued operations | | | 0.27 | | | | 7.72 | | | | 1.26 | | | | 0.40 | | | | 2.41 | |
| | | | | | | | | | | | | | | | | | | | |
Net income (loss) applicable to common shares | | $ | (9.95 | ) | | $ | 3.86 | | | $ | 1.28 | | | $ | 0.42 | | | $ | 1.12 | |
| | | | | | | | | | | | | | | | | | | | |
Weighted average common share used in computing earnings per share | | | 8,113,669 | | | | 8,086,640 | | | | 7,953,676 | | | | 7,900,869 | | | | 7,900,869 | |
| | | | | |
Earnings per share—diluted | | | | | | | | | | | | | | | | | | | | |
Income (loss) from continuing operations | | $ | (10.22 | ) | | $ | (3.86 | ) | | $ | 0.01 | | | $ | 0.02 | | | $ | (1.29 | ) |
Discontinued operations | | | 0.27 | | | | 7.72 | | | | 1.23 | | | | 0.38 | | | | 2.41 | |
| | | | | | | | | | | | | | | | | | | | |
Net income (loss) applicable to common shares | | $ | (9.95 | ) | | $ | 3.86 | | | $ | 1.24 | | | $ | 0.40 | | | $ | 1.12 | |
| | | | | | | | | | | | | | | | | | | | |
Weighted average common share used in computing diluted earnings per share | | | 8,113,669 | | | | 8,086,640 | | | | 8,188,602 | | | | 8,180,401 | | | | 7,900,869 | |
| | | | | |
BALANCE SHEET DATA | | | | | | | | | | | | | | | | | | | | |
Real estate, net | | $ | 1,447,184 | | | $ | 1,480,791 | | | $ | 1,364,426 | | | $ | 1,113,416 | | | $ | 943,069 | |
Notes and interest receivable, net | | | 45,247 | | | | 39,120 | | | | 32,699 | | | | 39,566 | | | | 64,818 | |
Total assets | | | 1,608,287 | | | | 1,640,067 | | | | 1,521,189 | | | | 1,250,167 | | | | 1,089,079 | |
Notes and interest payables | | | 1,188,625 | | | | 1,168,015 | | | | 1,177,586 | | | | 901,464 | | | | 770,161 | |
Shareholders’ equity | | | 245,416 | | | | 324,696 | | | | 287,102 | | | | 282,095 | | | | 252,418 | |
Book value per share | | $ | 30.25 | | | $ | 40.15 | | | $ | 36.10 | | | $ | 35.70 | | | $ | 31.95 | |
ITEM 7. MANAGEMENT’S | DISCUSSION AND ANALYSIS OF FINANCIAL CONDITION AND RESULTS OF OPERATIONS |
2012:
| Period | | Total Number of Shares Purchased | | | Average Price Paid per share | | | Total Number of Shares Purchased as Part of Publicly Announced Program | | | Maximum Number of Shares that May Yet be Purchased Under the Program | |
| Balance at September 30, 2012 | | | | | | | | | 1,230,535 | | | | 406,465 | |
| October 31, 2012 | | | - | | | $ | - | | | | 1,230,535 | | | | 406,465 | |
| November 30, 2012 | | | - | | | $ | - | | | | 1,230,535 | | | | 406,465 | |
| December 31, 2012 | | | - | | | $ | - | | | | 1,230,535 | | | | 406,465 | |
| Total | | | - | | | | | | | | | | | | | |
ITEM 6. SELECTED FINANCIAL DATA
| | | 2012 | | | 2011 | | | 2010 | | | 2009 | | | 2008 | |
| | | (dollars in thousands, except share and per share amounts) | |
| EARNINGS DATA | | | | | | | | | | | | | | | |
| Total operating revenues | | $ | 116,051 | | | $ | 106,340 | | | $ | 102,683 | | | $ | 99,575 | | | $ | 93,975 | |
| Total operating expenses | | | 97,870 | | | | 132,324 | | | | 119,020 | | | | 137,969 | | | | 101,625 | |
| Operating income (loss) | | | 18,181 | | | | (25,984 | ) | | | (16,337 | ) | | | (38,394 | ) | | | (7,650 | ) |
| Other expenses | | | (37,100 | ) | | | (43,958 | ) | | | (41,606 | ) | | | (43,616 | ) | | | (49,356 | ) |
| Loss before gain on land sales, non-controlling interest, and tax | | | (18,919 | ) | | | (69,942 | ) | | | (57,943 | ) | | | (82,010 | ) | | | (57,006 | ) |
| Gain (loss) on land sales | | | 6,935 | | | | 17,011 | | | | (15,155 | ) | | | 6,296 | | | | 4,798 | |
| Income tax benefit (expense) | | | 1,358 | | | | 2,215 | | | | 2,131 | | | | (1,351 | ) | | | 29,317 | |
| Net loss from continuing operations | | | (10,626 | ) | | | (50,716 | ) | | | (70,967 | ) | | | (77,065 | ) | | | (22,891 | ) |
| Net income (loss) from discontinuing operations | | | 2,522 | | | | 4,113 | | | | 3,869 | | | | (2,508 | ) | | | 54,446 | |
| Net income (loss) | | | (8,104 | ) | | | (46,603 | ) | | | (67,098 | ) | | | (79,573 | ) | | | 31,555 | |
| Net (income) loss attributable to non-controlling interest | | | (220 | ) | | | 282 | | | | (98 | ) | | | (125 | ) | | | 654 | |
| Net income (loss) attributable to Transcontinental Realty Investors, Inc. | | | (8,324 | ) | | | (46,321 | ) | | | (67,196 | ) | | | (79,698 | ) | | | 32,209 | |
| Preferred dividend requirement | | | (1,112 | ) | | | (1,110 | ) | | | (1,073 | ) | | | (1,023 | ) | | | (975 | ) |
| Net income (loss) applicable to common shares | | $ | (9,436 | ) | | $ | (47,431 | ) | | $ | (68,269 | ) | | $ | (80,721 | ) | | $ | 31,234 | |
| | | | | | | | | | | | | | | | | | | | | |
| PER SHARE DATA | | | | | | | | | | | | | | | | | | | | |
| Earnings per share - basic | | | | | | | | | | | | | | | | | | | | |
| Loss from continuing operations | | $ | (1.42 | ) | | $ | (6.16 | ) | | $ | (8.89 | ) | | $ | (9.64 | ) | | $ | (2.86 | ) |
| Income (loss) from discontinued operations | | | 0.30 | | | | 0.49 | | | | 0.48 | | | | (0.31 | ) | | | 6.72 | |
| Net income (loss) applicable to common shares | | $ | (1.12 | ) | | $ | (5.67 | ) | | $ | (8.41 | ) | | $ | (9.95 | ) | | $ | 3.86 | |
| Weighted average common share used in computing earnings per share | | | 8,413,469 | | | | 8,370,729 | | | | 8,113,575 | | | | 8,113,669 | | | | 8,086,640 | |
| | | | | | | | | | | | | | | | | | | | | |
| Earnings per share - diluted | | | | | | | | | | | | | | | | | | | | |
| Loss from continuing operations | | $ | (1.42 | ) | | $ | (6.16 | ) | | $ | (8.89 | ) | | $ | (9.64 | ) | | $ | (2.86 | ) |
| Income (loss) from discontinued operations | | | 0.30 | | | | 0.49 | | | | 0.48 | | | | (0.31 | ) | | | 6.72 | |
| Net income (loss) applicable to common shares | | $ | (1.12 | ) | | $ | (5.67 | ) | | $ | (8.41 | ) | | $ | (9.95 | ) | | $ | 3.86 | |
| Weighted average common share used in computing diluted earnings per share | | | 8,413,469 | | | | 8,370,729 | | | | 8,113,575 | | | | 8,113,669 | | | | 8,086,640 | |
| | | | | | | | | | | | | | | | | | | | | |
| | | | | | | | | | | | | | | | | | | | | |
| BALANCE SHEET DATA | | | | | | | | | | | | | | | | | | | | |
| Real estate, net | | $ | 896,950 | | | $ | 988,339 | | | $ | 1,213,114 | | | $ | 1,447,184 | | | $ | 1,480,791 | |
| Notes and interest receivable, net | | | 59,098 | | | | 77,371 | | | | 67,025 | | | | 45,247 | | | | 39,120 | |
| Total assets | | | 1,045,344 | | | | 1,160,324 | | | | 1,384,761 | | | | 1,608,287 | | | | 1,640,067 | |
| Notes and interest payables | | | 808,043 | | | | 884,305 | | | | 1,022,015 | | | | 1,188,625 | | | | 1,168,015 | |
| Stockholders' equity | | | 133,129 | | | | 141,284 | | | | 183,448 | | | | 245,416 | | | | 324,696 | |
| Book value per share | | $ | 15.82 | | | $ | 16.88 | | | $ | 22.61 | | | $ | 30.25 | | | $ | 40.15 | |
ITEM 7. MANAGEMENT’S DISCUSSION AND ANALYSIS OF FINANCIAL CONDITION AND RESULTS OF OPERATIONS
The following discussion should be read in conjunction with the financial statements and notes thereto appearing elsewhere in this report.
The Annual Report on Form 10-K contains forward-looking statements within the meaning of the federal securities laws, principally, but not only, under the captions “Business”, “Risk Factors” and “Management’s Discussion and Analysis of Financial Condition and Results of Operations.” We caution investors that any forward-looking statements in this report, or which management may make orally or in writing from time to time, are based on management’s beliefs and on assumptions made by, and information currently available to, management. When used, the words “anticipate”, “believe”, “expect”, “intend”, “may”, “might”, “plan”, “estimate”, “project”, “should”, “will”, “result” and similar expressions which do not relate solely to historical matters are intended to identify forward-looking statements. These statements are subject to risks, uncertainties and assumptions and are not guarantees of future performance, which may be affected by known and unknown risks, trends, uncertainties and factors that are beyond our control. Should one or more of these risks or uncertainties materialize, or should underlying assumptions prove incorrect, actual results may vary materially from those anticipated, estimated or projected. We caution you that, while forward-looking statements reflect our good faith beliefs when we make them, they are not guarantees of future performance and are impacted by actual events when they occur after we make such statements. We expressly disclaim any responsibility to update our forward-looking statements, whether as a result of new information, future events or otherwise. Accordingly, investors should use caution in relying on past forward-looking statements, which are based on results and trends at the time they are made, to anticipate future results or trends.
Some of the risks and uncertainties that may cause our actual results, performance or achievements to differ materially from those expressed or implied by forward-looking statements include, among others, the following:
general risks affecting the real estate industry (including, without limitation, the inability to enter into or renew leases, dependence on tenants’ financial condition, and competition from other developers, owners and operators of real estate);
risks associated with the availability and terms of financing and the use of debt to fund acquisitions and developments;
failure to manage effectively our growth and expansion into new markets or to integrate acquisitions successfully;
risks and uncertainties affecting property development and construction (including, without limitation, construction delays, cost overruns, inability to obtain necessary permits and public opposition to such activities);
risks associated with downturns in the national and local economies, increases in interest rates, and volatility in the securities markets;
costs of compliance with the Americans with Disabilities Act and other similar laws and regulations;
potential liability for uninsured losses and environmental contamination;
risks associated with our dependence on key personnel whose continued service is not guaranteed; and
the other risk factors identified in this Form 10-K, including those described under the caption “Risk Factors.”
The risks included here are not exhaustive. Other sections of this report, including Part I Item 1A. “Risk Factors,” include additional factors that could adversely affect our business and financial performance. Moreover, we operate in a very competitive and rapidly changing environment. New risk factors emerge from time to time and it is not possible for management to predict all such risk factors, nor can we assess the impact of
all such risk factors on our business or the extent to which any factor, or combination of factors, may cause actual results to differ materially from those contained in any forward-looking statements. Given these risks and uncertainties, investors should not place undue reliance on forward-looking statements as a prediction of actual results. Investors should also refer to our quarterly reports on Form 10-Q for future periods and current reports on Form 8-K as we file them with the SEC, and to other materials we may furnish to the public from time to time through Forms 8-K or otherwise.
We are an externally advised and managed real estate investment company that owns a diverse portfolio of income-producing properties and land held for development. The Company’s portfolio of income-producing properties includes residential apartment communities, office buildings and other commercial properties. Our investment strategy includes acquiring existing income-producing properties as well as developing new properties on land already owned or acquired for a specific development project. We acquire land primarily in in-fill locations or high-growth suburban markets. We are an active buyer and seller and during
2009 acquired over $24 million and2012 sold
over $72$95.4 million of land and income-producing properties. As of December 31,
2009,2012, we owned
11,3548,553 units in
5747 residential apartment communities,
2813 commercial properties comprising
5.1approximately 3.4 million rentable square feet. In addition, we own
over 6,8134,133 acres of land held for
development and have two apartment projects under construction.development. The Company currently owns income-producing properties and land in
1110 states as well as in the U.S. Virgin Islands.
We finance our acquisitions primarily through operating cash flow, proceeds from the sale of land and income-producing properties and debt financing primarily in the form of property-specific first-lien mortgage loans from commercial banks and institutional lenders. We finance our development projects principally with short-term, variable interest rate construction loans that are converted to long-term, fixed rate amortizing mortgages when the development project is completed and occupancy has been stabilized. The Company will, from time to time, also enter into partnerships with various investors to acquire income-producing properties or land and to sell interests in certain of its wholly-owned properties. When the Company sells assets, it may carry a portion of the sales price generally in the form of a short-term, interest bearing seller-financed note receivable. The Company generates operating revenues primarily by leasing apartment units to
residents;residents and leasing office, retail and industrial space to commercial tenants.
TCI
Effective since April 30, 2011, Pillar is advised by Primethe Company’s external Advisor and Cash Manager under a contractual arrangement that is reviewed annually by our Board of Directors. OurPillar’s duties include, but are not limited to, locating, evaluating and recommending real estate and real estate-related investment opportunities. Pillar also arranges, for TCI’s benefit, debt and equity financing with third party lenders and investors. Pillar also serves as an Advisor and Cash Manager to ARL and IOT. As the contractual Advisor, Pillar is compensated by TCI under an Advisory Agreement that is more fully described in Part III, Item 10. “Directors, Executive Officers and Corporate Governance – The Advisor”. TCI has no employees. Employees of Pillar render services to TCI in accordance with the terms of the Advisory Agreement. Prior to April 30, 2011, the Company was advised by Prime.
Effective since January 1, 2011, Regis manages our commercial properties are managed byand provides brokerage services. Regis Commercial. We currently contractis entitled to receive a fee for its property management and brokerage services. See Part III, Item 10. “Directors, Executive Officers and Corporate Governance – Property Management and Real Estate Brokerage”. Prior to December 31, 2010, Triad provided management services for our commercial properties. Triad sub-contracted the property-level management and leasing of our commercial properties to Regis I. The Company contracts with third-party companies to lease and manage our apartment communities. Approximately 82.8%
The Company has historically engaged in and may continue to engage in certain business transactions with related parties, including but not limited to asset acquisition and dispositions. Transactions involving related parties cannot be presumed to be carried out on an arm’s length basis due to the absence of
free market forces that naturally exist in business dealings between two or more unrelated entities. Related party transactions may not always be favorable to our
common stock is owned by ARL,business and may include terms, conditions and agreements that are not necessarily beneficial to or in our
“Parent Company.”best interest.
Critical Accounting Policies
The company presents its
We present our financial statements in accordance with generally accepted accounting principles in the United States (“GAAP”). In June 2009, the Financial Accounting Standards Board (“FASB”) completed its accounting guidance codification project. The FASB Accounting Standards Codification (“ASC”) became effective for
the Company’sour financial statements issued subsequent to June 30, 2009 and is the single source of authoritative accounting principles recognized by the FASB to be applied by nongovernmental entities in the preparation of financial statements in conformity with GAAP. As of the effective date,
the company willwe no longer refer to the authoritative guidance dictating its accounting methodologies under the previous accounting standards hierarchy. Instead,
the Company willwe refer to the ASC Codification as the sole source of authoritative literature.
The accompanying Consolidated Financial Statements include
theour accounts,
of the Company, itsour subsidiaries, generally all of which are wholly-owned, and all entities in which
the Company haswe have a controlling interest. Arrangements that are not controlled through voting or similar rights are accounted for as a Variable
Interest Entity (VIE), in accordance with the provisions and guidance of ASC Topic 810 “Consolidation”, whereby the Company has beenwe have determined to bethat we are a primary beneficiary of the VIE and meetsmeet certain criteria of a sole general partner or managing member as identified in accordance with Emerging Issues Task Force (“EITF”) Issue 04-5, Investor’s Accounting for an Investment in a Limited Partnership when the Investor is the Sole General Partner and the Limited Partners have Certain Rights (“EITF 04-5”). VIEs are generally entities that lack sufficient equity to finance their activities without additional financial support from other parties or whose equity holders as a group lack adequate decision making ability, the obligation to absorb expected losses or residual returns of the entity, or have voting rights that are not proportional to their economic interests. The primary beneficiary generally is the entity that provides financial support and bears a majority of the financial risks, authorizes certain capital transactions, or makes operating decisions that materially affect the entity’s financial results. All significant intercompany balances and transactions have been eliminated in consolidation.
In determining whether we are the primary beneficiary of a VIE, we consider qualitative and quantitative factors, including, but not limited to: the amount and characteristics of our investment; the obligation or likelihood for us or other investors to provide financial support; our and the other investors’ ability to control or significantly influence key decisions for the VIE; and the similarity with and significance to the business activities of us and the other investors. Significant judgments related to these determinations include estimates about the current future fair values and performance of real estate held by these VIEs and general market conditions.
For entities in which
the Company haswe have less than a controlling financial interest or entities where
it iswe are not deemed to be the primary beneficiary, the entities are accounted for using the equity method of accounting. Accordingly,
the Company’sour share of the net earnings or losses of these entities
isare included in consolidated net income. TCI’s
investmentsinvestment in ARL
and Garden Centura, LP areis accounted for under the equity method.
Our investment in Garden Centura, L.P. was accounted for under the equity method until December 28, 2011, when it was sold to a third party.
Upon acquisitions of real estate, we assess the fair value of acquired tangible and intangible assets, including land, buildings, tenant improvements, “above-” and “below-market” leases, origination costs, acquired in-place leases, other identified intangible assets and assumed liabilities in accordance with ASC Topic 805 “Business Combinations”, and allocate the purchase price to the acquired assets and assumed liabilities, including land at appraised value and buildings at replacement cost.
We assess and consider fair value based on estimated cash flow projections that utilize appropriate discount and/or capitalization rates, as well as available market information. Estimates of future cash flows are based on a number of factors including the historical operating results, known and anticipated trends, and market and economic conditions. The fair value of the tangible assets of an acquired property considers the value of the property as if it were vacant. We also consider an allocation of purchase price of other acquired intangibles, including acquired in-place leases that may have a customer relationship intangible value, including (but not limited to) the nature and extent of the existing relationship with the tenants, the tenants’ credit quality and expectations of lease renewals. Based on our acquisitions to date, our allocation to customer relationship intangible assets has been immaterial.
We record acquired “above-” and “below-market” leases at their fair values (using a discount rate which reflects the risks associated with the leases acquired) equal to the difference between (1) the contractual amounts to be paid pursuant to each in-place lease and (2) management’s estimate of fair market lease rates for each corresponding in-place lease, measured over a period equal to the remaining term of the lease for above-market leases and the initial term plus the term of any below-market fixed rate renewal options for below-market leases.
Other intangible assets acquired include amounts for in-place lease values that are based on our evaluation of the specific characteristics of each tenant’s lease. Factors to be considered include estimates of carrying costs during hypothetical expected lease-up periods considering current market conditions, and costs to execute similar leases. In estimating carrying costs, we include real estate taxes, insurance and other operating expenses and
estimates of lost rentals at market rates during the expected lease-up periods, depending on local market conditions. In estimating costs to execute similar leases, we consider leasing commissions, legal and other related expenses.
Acquisitions from our parent, ARL, have previously been reflected at the fair value purchase price. Upon discussion with the SEC and in review of the guidance pursuant to ASC 250-10-45-22 to 24, we have adjusted those assets, in the prior year, to reflect a basis equal to ARL’s cost basis in the asset at the time of the sale. The related party payables to ARL were reduced for the lower asset price.
Depreciation and Impairment
Real estate is stated at depreciated cost. The cost of buildings and improvements includes the purchase price of property, legal fees and other acquisition costs. Costs directly related to the development of properties are capitalized. Capitalized development costs include interest, property taxes, insurance, and other
direct project costs incurred during the period of development.
Management reviews its long-lived assets used in operations for impairment when there is an event or change in circumstances that indicates impairment in value. An impairment loss is recognized if the carrying amount of its assets is not recoverable and exceeds its fair value. If such impairment is present, an impairment loss is recognized based on the excess of the carrying amount of the asset over its fair value. The evaluation of anticipated cash flows is highly subjective and is based in part on assumptions regarding future occupancy, rental rates and capital requirements that could differ materially from actual results in future periods. If we determine that impairment has occurred, the affected assets must be reduced to their face value.
ASC Topic 360 “Property, Plant and Equipment” requires that qualifying assets and liabilities and the results of operations that have been sold, or otherwise qualify as “held for sale,” be presented as discontinued operations in all periods presented if the property operations are expected to be eliminated and the Company will not have significant continuing involvement following the sale. The components of the property’s net income that is reflected as discontinued operations include the net gain (or loss) upon the disposition of the property held for sale, operating results, depreciation and interest expense (if the property is subject to a secured loan). We generally consider assets to be “held for sale” when the transaction has been approved by our Board of Directors, or a committee thereof, and there are no known significant contingencies relating to the sale, such that the property sale within one year is considered probable. Following the classification of a property as “held for sale,” no further depreciation is recorded on the assets.
A variety of costs are incurred in the acquisition, development and leasing of properties. After determination is made to capitalize a cost, it is allocated to the specific component of a project that is benefited. Determination of when a development project is substantially complete and capitalization must cease involves a degree of judgment. Our capitalization policy on development properties is guided by ASC Topic 835-20
“Capitalization“Interest - Capitalization of Interest” and ASC Topic 970 “Real Estate—General”. The costs of land and buildings under development include specifically identifiable costs. The capitalized costs include pre-construction costs essential to the development of the property, development costs, construction costs, interest costs, real estate taxes, salaries and related costs and other costs incurred during the period of development. We consider a construction project as substantially completed and held available for occupancy upon the receipt of certificates of occupancy, but no later than one year from cessation of major construction activity. We cease capitalization on the portion (1) substantially completed and (2) occupied or held available for occupancy, and we capitalize only those costs associated with the portion under construction.
Management reviews its long-lived assets used in operations for impairment when there is an event or change in circumstances that indicates impairment in value. An impairment loss is recognized if the carrying amount of its assets is not recoverable and exceeds its fair value. Fair value is determined by a recent appraisal, comparables based upon prices for similar assets, executed sales contract, a present value and/or a valuation technique based upon a multiple of earnings or revenue. If such impairment is present, an impairment loss is recognized based on the excess of the carrying amount of the asset over its fair value. The evaluation of anticipated cash flows is highly subjective and is based in part on assumptions regarding future occupancy, rental rates and capital requirements that could differ materially from actual results in future periods. If we determine that impairment has occurred, the affected assets must be reduced to their face value.
ASC Topic 360 “Property, Plant and Equipment” requires that qualifying assets and liabilities and the results of operations that have been sold, or otherwise qualify as “held for sale,” be presented as discontinued operations in all periods presented if the property operations are expected to be eliminated and the Company will not have significant continuing involvement following the sale. The components of the property’s net income that is reflected as discontinued operations include the net gain (or loss) upon the disposition of the property “held for sale”, operating results, depreciation and interest expense (if the property is subject to a secured loan). We generally consider assets to be “held for sale” when the transaction has been approved by our Board of Directors, or a committee thereof, and there are no known significant contingencies relating to the sale, such that the property sale within one year is considered probable. Following the classification of a property as “held for sale,” no further depreciation is recorded on the assets.
Any properties that are treated as “subject to sales contract” on the Consolidated Balance Sheets and are listed in detail in Schedule III, “Real Estate and Accumulated Depreciation” are those in which we have not recognized the legal sale according to the guidance in ASC 360-20 due to various factors, disclosed in each sale transaction under Item 1 Significant Real Estate Acquisitions/Dispositions and Financing. Any sale transaction where the guidance reflects that a sale had not occurred, the asset involved in the transaction, including the debt and property operations, remained on the books of the Company. We continue to charge depreciation to expense as a period costs for the property until such time as the property has been classified as held for sale in accordance with guidance reflected in ASC 360-10-45 “Impairment or Disposal of Long-Lived Assets”.
Investment in Unconsolidated Real Estate Ventures
Except for ownership interests in variable interest entities,
TCI accountswe account for our investments in unconsolidated real estate ventures under the equity method of accounting because the Company exercises significant influence over, but does not control, these entities. These investments are recorded initially at cost, as investments in unconsolidated real estate ventures, and subsequently adjusted for equity in earnings and cash contributions and distributions. Any difference between the carrying amount of these investments on the Company’s balance sheet and the underlying equity in net assets is amortized as an adjustment to equity in earnings of unconsolidated real estate ventures over the life of the related asset. Under the equity method of accounting, our net equity is reflected within the Consolidated Balance Sheets, and our share of net income or loss from the joint ventures is included within the Consolidated Statements of Operations. The joint venture agreements may designate different percentage allocations among investors for profits and losses; however, our
recognition of joint venture income or loss generally follows the joint venture’s distribution priorities, which may change upon the achievement of certain investment return thresholds. For ownership interests in variable interest entities, the Company consolidates those in which we are the primary beneficiary.
Recognition of Rental Income
Rental income for commercial property leases is recognized on a straight-line basis over the respective lease terms. In accordance with ASC Topic 805, we recognize rental revenue of acquired in-place “above-”and “below-market” leases at their fair values over the terms of the respective leases. On our Consolidated Balance Sheets, we include as a receivable the excess of rental income recognized over rental payments actually received pursuant to the terms of the individual commercial lease agreements.
Reimbursements of operating costs, as allowed under most of our commercial tenant leases, consist of amounts due from tenants for common area maintenance, real estate taxes and other recoverable costs, and are recognized as revenue in the period in which the recoverable expenses are incurred. We record these reimbursements on a “gross” basis, since we generally are the primary obligor with respect to purchasing goods and services from third-party suppliers; we have discretion in selecting the supplier and have the credit risk with respect to paying the supplier.
Rental income for residential property leases is recorded when due from residents and is recognized monthly as earned, which is not materially different than on a straight-line basis as lease terms are generally for periods of one year or less. An allowance for doubtful accounts is recorded for all past due rents and operating expense reimbursements considered to be uncollectible.
Revenue Recognition on the Sale of Real Estate
Sales and the associated gains or losses of real estate assets are recognized in accordance with the provisions of ASC Topic 360-20, “Property, Plant and Equipment—Real Estate Sale”. The specific timing of a sale is measured against various criteria in ASC 360-20 related to the terms of the transaction and any continuing involvement in the form of management or financial assistance associated with the properties. If the sales criteria for the full accrual method are not met,
the Company deferswe defer some or all of the gain recognition and
accountsaccount for the continued operations of the property by applying the finance, leasing, deposit, installment or cost recovery methods, as appropriate, until the sales criteria are met.
Non-performing Notes Receivable
TCI considers
We consider a note receivable to be non-performing when the maturity date has passed without principal repayment and the borrower is not making interest payments in accordance with the terms of the agreement.
Interest Recognition on Notes Receivable
For notes other than surplus cash notes, we
We record interest income as earned in accordance with the terms of the related loan agreements.
OnPrior to January 1, 2012, on cash flow notes where payments are based upon surplus cash from operations, accrued but unpaid interest income
iswas only recognized to the extent
that cash
iswas received.
As of January 1, 2012, due to the consistency of cash received on the surplus cash notes, we are recording interest as earned.
Allowance for Estimated Losses
We assess the collectability of notes receivable on a periodic basis, of which the assessment consists primarily of an evaluation of cash flow projections of the borrower to determine whether estimated cash flows are sufficient to repay principal and interest in accordance with the contractual terms of the note. We recognize impairments on notes receivable when it is probable that principal and interest will not be received in accordance with the contractual terms of the loan. The amount of the impairment to be recognized generally is based on the fair value of the partnership’s real estate that represents the primary source of loan repayment. See Note 3
“Notes and Interest Receivable” for details on our
Notes Receivable.notes receivable.
Fair Value of Financial Instruments
The company applies
We apply the guidance in ASC Topic 820, “Fair Value Measurements and Disclosures,” to the valuation of real estate assets. These provisions define fair value as the price that would be received to sell an asset or paid to transfer a liability in a transaction between market participants at the measurement date, establish a hierarchy that prioritizes the information used in developing fair value estimates and require disclosure of fair value measurements by level within the fair value hierarchy. The hierarchy gives the highest priority to quoted prices in active markets (Level 1 measurements) and the lowest priority to unobservable data (Level 3 measurements), such as the reporting entity’s own data.
The valuation hierarchy is based upon the transparency of inputs to the valuation of an asset or liability as of the measurement date and includes three levels defined as follows:
| | | | |
Level 1
| | — |
| Level 1 | — | Unadjusted quoted prices for identical and unrestricted assets or liabilities in active markets. |
Level 2 | | — | | Quoted prices for similar assets and liabilities in active markets, and inputs that are observable for the asset or liability, either directly or indirectly, for substantially the full term of the financial instrument. |
Level 3 | | — | | Unobservable inputs that are significant to the fair value measurement. |
A financial instrument’s categorization within the valuation hierarchy is based upon the lowest level of input that is significant to the fair value measurement.
Related parties
We apply ASC Topic 805, “Business Combinations”, to evaluate business relationships. Related parties are persons or entities who have one or more of the following characteristics, which include entities for which investments in their equity securities would be required, trust for the benefit of persons including principal owners of the entities and members of their immediate families, management personnel of the entity and members of their immediate families and other parties with which the entity may deal if one party controls or can significantly influence the decision making of the other to an extent that one of the transacting parties might be prevented from fully pursuing its own separate interests, or affiliates of the entity.
Results of Operations
The following discussion is based on our “Consolidated Statements of Operations—Years Ended December 31, 2009, 2008, and 2007” as included in Item 8. “Financial Statements and Supplementary Data”. The total property portfolio represents all income producing properties held as of December 31, for the year presented. Sales subsequent to year end represent properties that were previously included in continued operations, but subsequently sold or held for sale and reclassed to discontinued operations as of December 31, 2009. The number of properties included in continued operations for discussion purposes is shown below.
| | | | | | |
| | | 2009 | | 2008 | | 2007 |
Continued operations | | 85 | | 79 | | 60 |
Sales subsequent to year end | | — | | 4 | | 29 |
| | | | | | |
Total property portfolio | | 85 | | 83 | | 89 |
| | | | | | |
The discussion of our results of operations is based on management’s review of operations, which is based on our segments. Our segments consist of apartments, commercial buildings, land and other. For discussion purposes, we break these segments down into the following sub-categories; same property portfolio, acquired properties, and developed properties in the lease-up phase. The same property portfolio consists of properties that were held by us for the entire period for both years being compared. The acquired property portfolio consists of properties that we acquired but have not held for the entire period for both periods being compared. Developed properties in the lease-up phase consist of completed projects that are being leased-up. As we complete each phase of the project, we
lease uplease-up that phase and include those revenues in our continued operations. Once a developed property becomes
leased up (80% or more)leased-up and is held the entire period for both years under comparison, it is considered to be included in the same property portfolio.
IncomeIncome- producing properties that we have sold during the year are reclassified to
discontinuingdiscontinued operations for all periods
presented.Resultspresented
The following discussion is based on our Consolidated Statements of Operations for the twelve months ended December 31, 2012, 2011, and 2010 as included in Item 8. “Financial Statements and Supplementary Data”. The prior year’s property portfolios have been adjusted for subsequent sales. Continuing operations relates to income-producing properties that were held during those years as adjusted for sales in the subsequent years.
At December 31, 2012, 2011 and 2010, we owned or had interests in a portfolio of 60, 66 and 72 income-producing properties, respectively. For discussion purposes, we broke this out between continuing operations and discontinued operations. The total property portfolio represents all income-producing properties held as of December 31 for the year end presented. Sales subsequent to year end represent properties that were held as of year-end for the years presented, but sold in the next year. Continuing operations represents all properties that have not been reclassed to discontinued operations as of December 31, 2012 for the year presented. The table below shows the number of income-producing properties held by year:
| | | 2012 | | | 2011 | | | 2010 | |
| | | | | | | | | | |
| Continued operations | | | 59 | | | | 59 | | | | 53 | |
| Sales subsequent to year end | | | 1 | | | | 7 | | | | 19 | |
| Total property portfolio | | | 60 | | | | 66 | | | | 72 | |
Comparison of the year ended December 31,
2009 as compared2012 to the same period ended
2008;We had2011:
For the twelve months ended December 31, 2012, we reported a net loss applicable to common shares of
$80.7$9.4 million
in 2009, whichor $1.12 per diluted earnings per share, as compared to a net loss applicable to common shares of $47.4 million or $5.67 per diluted earnings per share for the same period ended 2011. The current year net loss applicable to common shares of $9.4 million includes gain on land sales of
$6.3$6.9 million,
$4.7 million of provisions on the impairment of notes receivable and real estate assets, and net income from discontinued operations
net of
non-controlling interest of $2.2$2.5 million, as
compared to the prior year net incomeloss applicable to common shares of $31.2$47.4 million, which includes gain on land sales of $4.8$17.0 million, $37.0 million of provisions on the impairment of notes receivable and real estate assets, and net income from discontinued operations, net of non-controlling interest of $62.4$4.1 million.
The majority of the $112.0 million decrease in our net income applicable to common shares is primarily due to our impairment on notes receivable and real estate assets of $42.5 million in the current period, as compared to $7.4 million in the prior period. There was also a significant amount of gain on the sales of assets recorded in 2008 due to sale of the Midland/Odessa Apartment complexes and the sale of three Chicago hotels where we recorded a gain of $65.5 million and $18.4 million, respectively. In the current year, we recorded gains of $3.5 million on the sale of income-producing properties and $6.3 million on the sale of land.
Rental and other property revenues increased by $13.3were $116.0 million for the twelve months ended December 31, 2012. This represents an increase of $9.7 million, as compared to the prior year revenues of which the apartment portfolio increased$106.3 million. This change, by $11.4 million, the commercial portfolio increased by $3.9 million and the land portfolio decreased $1.1 million with the remaining $0.9 million decrease in our other portfolios. There wassegment, is an increase withinin the apartment portfolio of $12.7$7.4 million, which was due to our developed properties in the lease up phase and reaching stabilization, $1.0 million of the increase was due to properties acquired in 2008 with a decrease of $2.3 million related to the properties damaged in Galveston, Texas by hurricane Ike. We have increased occupancies within our apartment portfolio and there is an overall increased demand for new apartments. The increase in the commercial portfolio of $2.6 million offset by a decrease in the land and other portfolios of $0.3 million. Within the apartment portfolio, there was duean increase of $6.1 million in the developed properties in the lease-up phase and an increase of $1.3 million in the same property portfolio. Our apartment portfolio continues to $2.9thrive in the current economic conditions with occupancies averaging 95%. Our existing commercial portfolio increased by $2.6 million of lease term buyouts received andin the remaining $1.0 millionsame store properties. This increase is due to a lease termination fee from a settlement agreement with a commercial tenant. We have directed our efforts to apartment development and put some additional land projects on hold until the economic conditions turn around. We are also continuing to market our properties acquiredaggressively to attract new tenants and strive for continuous improvement of our properties in late 2008order to maintain our existing tenants.
Expense
Depreciation and
2009. The decrease in revenues from our land portfolio is due to oil and gas royalties received inamortization expense was $21.6 million for the
prior year that were not applicable in the current year.Expenses
Property operating expenses decreased by $1.2twelve months ended December 31, 2012. This represents an increase of $2.6 million, as compared to the prior year of which the apartment portfolio increased $5.4 million, the commercial portfolio decreased by $2.6 million, the land portfolio decreased by $3.5 million and the other portfolios decreased by $0.5 million. There was an increase within the apartment portfolio of $5.8 million from our completed apartments in the lease up phase during 2008 and early 2009. Our properties, while they are being developed, are completed in phases. As a phase is completed, it is leased up while the remaining properties are still being completed. There was a decrease of $2.0 million in operating expenses related to the properties damaged in the Galveston, Texas by hurricane Ike. The remaining increase of $1.6 million was from properties acquired in 2008 and same properties. The commercial and land portfolio decrease was in the same properties due to lower overall operating expenses.
We had an increase in depreciation expense of $4.7 million as compared to prior year of which the apartment portfolio increased $3.4 million with the remainder due to the commercial portfolio. The$19.0 million. This change, by segment, is an increase in the apartment portfolio was from our completed projects in the lease up phase during 2008of $1.0 million and early 2009. Once the apartment complex is leased to 80%, the project is considered “stabilized” and we begin to depreciate the assets. Thean increase in the commercial portfolio of $1.6 million. Within the commercial portfolio, there was an increase of $1.6 million for the same store properties. The developed properties in the apartment portfolio increased by $1.0 million as the buildings became substantially complete and depreciation began.
General and administrative expenses were $5.4 million for the twelve months ended December 31, 2012. This represents a decrease of $4.0 million as compared to the prior year expenses of $9.4 million. This change is primarily due to
losses recorded in the
newly acquired propertiesprior period from investment write offs due to potential deals not realized along with a decrease in
2008.professional services by $1.1 million, a decrease in franchise taxes by $0.9 million and a decrease in costs reimbursements to our Advisor by $0.7 million.
The provision onfor impairment of notes receivable, investment in real estate partnerships, and real estate assets increased by $35.1was $4.7 million for the period ended December 31, 2012. This was a decrease of $32.3 million as compared to the prior year period. Impairmentexpense of $37.0 million. In the current year, impairment was recorded as an additional loss in the commercial and land portfolios. In our commercial portfolio, an impairment reserve of $2.4 million was taken in response to a deficiency agreement with the existing lender. The agreed upon deficiency, in the event the lender takes possession of the property, was the basis upon which fair value was calculated and an impairment reserve was taken for the difference in basis over fair value. The remaining $2.3 million in impairment reserves were related to our land holdings. A current year sale of adjacent land determined the fair value on a Waco, Texas land holding that resulted in an impairment reserve of $1.2 million, a comparable sale determined the fair value of a Florida land holding that resulted in an impairment reserve of $0.5 million and a recent appraisal determined the fair value of an Arkansas land holding that resulted in an impairment reserve of $0.6 million. In the prior period, impairment was recorded as an additional loss in the investment portfolio of $1.9$5.2 million in the apartment properties we currently hold, $2.0 million in commercial properties we currently hold, $33.5$2.4 million in land parcels we currently hold, and $7.1$27.0 million in land that was sold subsequent to the prior period and $0.4 million in impairment on our investments in joint ventures. Of the impairment reserves taken in the prior period, $22.1 million was related to the land holdings that were part of an overall strategic debt restructuring plan resulting in the disposal of the land for less than the market value, $9.3 million was related to a third quarterparty sales contract that was executed during the prior period for less than the carrying value, $5.2 million was related to the underperformance of property using a loss.valuation analysis based upon a multiple of earnings and $0.4 million was related to various investment in joint ventures that had were determined to have a questionable recovery of our investment.
Other
Income Expenseincome (expense)
Other income was $6.5 million for the twelve months ended December 31, 2012. This represents an increase of $4.0 million as compared to the prior year income of $2.5 million. The increase relates to the development agreement between UHF and TCI for consulting services related to the development of apartment projects, offset by miscellaneous revenue received by TCI in the prior year.
Interest income
increased by $2.2was $11.7 million
for the twelve months ended December 31, 2012. This represents an increase of $6.0 million, as compared to the prior year income of $5.7 million. The increase is due to the cash received on the cash flow notes from UHF. The residential apartments have generated more surplus cash in the current period,
duethan in the prior period, resulting in a larger recognition of previously unrecognized interest income. Prior to January 1, 2012, accrued interest was recognized to the
receipt ofextent cash was received and to the extent the cash received exceeds the interest
payments due on our Unified Housing surplus cash flow notes. Interestowed for the current period, prior unrecognized interest is
recognized when interest payments are received.earned.
Mortgage and loan interest
decreasedexpense was $55.1 million for the twelve months ended December 31, 2012. This represents an increase of $3.2 million, as compared to the prior year expense of $51.9 million. This change, by
$2.9 million whichsegment, is
due to an increase in the
apartmentsapartment portfolio of
$1.8$6.6 million,
offset by a decrease in the commercial portfolio of
$1.5 million, an increase in the land portfolio of $0.7$2.2 million, and a decrease in the
other portfoliosland portfolio of
$3.9$1.2 million.
Interest expense withinWithin the apartment portfolio,
the same apartment portfolio increased
from our$4.1 million due to the write off of the previous loan’s deferred financing charges and prepayment penalties that were paid as part of the closing costs associated with the refinancing of eleven apartment loans in the current period. The developed properties
increased by $2.5 million in the
lease up phase.current period. Once
an apartment
building is
substantially completed, the interest expense is no longer capitalized.
TheWithin the commercial
and land portfolio,
decrease was in the same properties
owneddecreased $2.2 million. This decrease is related to a commercial loan that was in
2008.default status in 2011 and was accruing interest at the default interest rate. The default rate is not longer applicable in the current period. The decrease in the
other portfolios of $3.9 millionland portfolio was due to
corporate loans paid off in 2008, thereby reducing the 2009 interest expense.land sales.
Gain on land sales decreased in the current year.
This decrease is in part due to the overall economic environment which, among other issues, has resulted in the tightening of the credit markets, causing an inability of potential buyers to obtain financing. Thus, we have found it difficult to complete land transactions. In the current year, we sold
857.12639.87 acres of land in
seven17 separate transactions for an aggregate sales price of
$36.7$38.4 million
receiving $9.5 million in cash and recorded a gain of
$6.3$6.9 million. The average sales price was
$42,818$60,034 per acre. In the prior year, we sold
91.73,809.49 acres of land in
eight34 separate transactions for an aggregate sales price of
$14.3$163.1 million
receiving $4.3 million in cash and recorded a gain
on sale of
$4.8$17.0 million. The average sales price was
$156,000$42,801 per acre.
Also included in the prior year gain on land sales is the sale of our mineral rights on 43.4 acres of land known as Marine Creek for $1.1 million.
Discontinued operations relates to properties that were either sold or held for sale as of the respective year end. Included in discontinued operations are a total of
sevenfive and
2518 income-producing properties as of
20092012 and
2008, respectively.2011, respectively and one held for sale as of 2012. In
2009,2012, we sold
sixtwo apartment complexes (Portofino and Wildflower Villas) and three commercial properties
which consists of(305 Baronne, Clarke Garage and Dunes Plaza), and one apartment complex
held for sale (Verandas at City View). In 2011, we sold 11 commercial properties (Addison Hanger I, Addison Hanger II, Alpenloan, Fenton Center, One Hickory, Parkway North, Signature, Teleport Blvd, Two Hickory, Westgrove Air Plaza and Willowbrook Village), one apartment complex (Spyglass), and 13 acres of land with a storage warehouse (Eagle Crest). In addition, in 2011, we recognized the deferred gains on the sales of two apartment complexes (Bridges on
Kinsey)Kinsey and
fiveLongfellow Arms) and four commercial
buildings (Cullmanproperties (2010 Valley View, Cullman Shopping Center,
5000 Space Center, 5360 Tulane, 2010 Valley ViewKmart Cary and Parkway Centre)
, that were sold in prior years in accordance with the requirements per ASC Topic 360-20 “Property, Plant, and
one property held for sale (Baywalk). In 2008, we sold 25 properties which consists of 18 apartment complexes (Arbor Pointe, Ashton Way, Autumn Chase, Courtyard, Coventry Pointe, Fairways, Forty-Four Hundred Apartments, Fountains at Waterford, Hunters Glen, SouthGate, Sunchase, Thornwood, Westwood Square, Woodview, Fairway View, Willow Creek, Fountain Lake, and Mountain Plaza), four hotels (City Suites, Majestic Inn, Willows, and Hotel Akademia), and three commercial buildings (Lexington Center, Executive Court, and Encon Warehouse)Equipment—Real Estate Sales”. The gains on sale of the
apartmentsproperties sold
in 2009 and 2008 are also included in the discontinued operations for those years
as shown in the table below (dollars in thousands)
. | | | | | | | | |
| | | For Years Ended
December 31, | |
| | | 2009 | | | 2008 | |
Revenue | | | | | | | | |
Rental | | $ | 4,500 | | | $ | 9,288 | |
Property operations | | | 2,373 | | | | 4,268 | |
| | | | | | | | |
| | | 2,127 | | | | 5,020 | |
Expenses | | | | | | | | |
Interest | | | (1,711 | ) | | | (7,177 | ) |
General and administration | | | (27 | ) | | | (672 | ) |
Depreciation | | | (715 | ) | | | (851 | ) |
| | | | | | | | |
| | | (2,453 | ) | | | (8,700 | ) |
| | | | | | | | |
Net loss from discontinued operations before gains on sale of real estate, taxes and fees | | | (326 | ) | | | (3,680 | ) |
Gain on sale of discontinued operations | | | 3,524 | | | | 104,411 | |
Equity in investee | | | 164 | | | | 6,306 | |
Net sales fee to affiliate | | | — | | | | (3,041 | ) |
Net income fee to affiliate | | | — | | | | (7,953 | ) |
| | | | | | | | |
Income from discontinued operations | | | 3,362 | | | | 96,043 | |
Tax expense | | | (1,180 | ) | | | (33,616 | ) |
| | | | | | | | |
Income from discontinued operations | | $ | 2,182 | | | $ | 62,427 | |
| | | | | | | | |
Results:
| | | For Years Ended December 31, | |
| | | 2012 | | | 2011 | |
| Revenues | | | | | | |
| Rental | | $ | 5,338 | | | $ | 18,215 | |
| | | | 5,338 | | | | 18,215 | |
| Expenses | | | | | | | | |
| Property operations | | | (3,249 | ) | | | (10,243 | ) |
| General and administration | | | (1,158 | ) | | | (1,148 | ) |
| Depreciation | | | (933 | ) | | | (4,032 | ) |
| Provision on impairment of real estate assets | | | - | | | | (8,005 | ) |
| | | | (6,730 | ) | | | (30,640 | ) |
| Net loss from discontinued operations before gains on sale of real estate, taxes and fees | | | (1,392 | ) | | | (12,425 | ) |
| Gain on sale of discontinued operations | | | 5,217 | | | | 18,300 | |
| Earnings from unconsolidated subsidiaries and investees | | | 55 | | | | 453 | |
| Income from discontinued operations | | | 3,880 | | | | 6,328 | |
| Income tax expense | | | (1,358 | ) | | | (2,215 | ) |
| Income from discontinued operations | | $ | 2,522 | | | $ | 4,113 | |
Comparison of
operations for the year ended December 31,
2008 as compared2011 to the same period ended
2007;We had2010:
For the twelve months ended December 31, 2011, we reported a net
incomeloss applicable to common shares of
$31.2$47.4 million
in 2008,or $5.67 per diluted earnings per share, as compared to a net loss applicable to common shares of $68.3 million or $8.41 per diluted earnings per share for the same period ended 2010. For the twelve months ended December 31, 2010, the net loss applicable to common shares of $47.4 million, which includes
gains ofgain on land sales of
$4.8$17.0 million,
$37.0 million of provisions on the impairment of notes receivable and real estate assets, and net income from discontinued operations,
net of
non-controlling interest of $62.4$4.1 million,
as compared to
the twelve months ended 2010 net
incomeloss applicable to common shares of
$10.2$68.3 million,
in 2007, including gainswhich includes loss on land sales
totaling $12.0of $15.2 million,
$22.6 million of provisions on the impairment of notes receivable and real estate assets, and net income from discontinued operations,
net of
non-controlling interest of $10.1$3.9 million.
Rental and other property
revenue increased $14.6revenues were $106.3 million
whichfor the twelve months ended December 31, 2011. This represents an increase of $3.6 million, as compared to the prior year revenues of $102.7 million. This change, by segment, is an increase in the
apartmentsapartment portfolio of
$13.1$9.1 million, an increase in
commercial of $0.8 million and an increase in ourthe land and other portfolios of
$0.7 million. The change within the apartment portfolio comes from an increase$0.1 million, offset by a decrease in
our same apartments of $2.5 million, of which $1.2 million is due to properties acquired in 2008 and $1.3 million is due to increases in the same properties held in 2007. There was an increase in our apartments in the lease up phase of $10.6 million. The increase within the commercial portfolio of
$0.8$5.6 million. Within the apartment portfolio, the same property portfolio increased by $4.3 million,
is attributableand the developed properties increased by $4.8 million. Our apartment portfolio continues to
our new acquisitions. The increasethrive in
our landthe current economic conditions with occupancies averaging 95%. Our existing commercial portfolio
isdecreased by $5.6 million in the same store properties due to an increase in
oilvacancy, which we attribute to the current state of the economy. We continue to market our properties aggressively to attract new tenants and
gas royalty revenues receivedstrive for continuous improvement of our properties in
2008 that were not applicable in 2007.Expenses
order to maintain our existing tenants.
Expense
Property operating expenses
increased by $11.9were $56.9 million
as compared to prior year, which is due tofor the twelve months ended December 31, 2011. This represents an increase
in our apartment portfolio of
$9.7 million, an increase in our commercial portfolio of $1.7 million, and an increase in our land and other portfolios of $0.5 million. The increases within the apartment portfolio were from increased operating costs and maintenance of $2.8 million in the same apartment portfolio. Our completed apartments in the lease up phase accounted for another $5.8 million of the increase. Our properties which are being developed are completed in phases. As a phase is completed, it is leased up while the remaining phases are still being completed. The remaining increase within the apartment portfolio of $1.1 million is from our properties acquired in the current year.Depreciation and amortization expense increased by $3.3 million, as compared to prior year, which was due to an increase in our apartment portfolio of $2.9 million, an increase in our commercial portfolio of $0.6 million and a decrease in our land and other portfolios of $0.2 million. The increases within the apartment portfolio were from a $1.2 million increase in the same apartment portfolio, a $1.3 million increase in the apartments in the lease up phase and a $0.4 million increase due to apartments acquired in the current year.
The provision for allowance on notes receivable and impairment were due to posting an allowance against various investments within our portfolio. The prior year amount of $3.7 million in 2007 was related to the write down of three properties; Foxwood apartments, a 220 unit complex located in Memphis, Tennessee, for $1.7 million; Executive Court Office building, a 222,000 square foot commercial building located in Memphis, Tennessee, for $1.2 million; and the Encon Warehouse, a 256,000 square warehouse located in Fort Worth, Texas for $800,000.
Advisory fees to affiliate increased by $1.4 million. The increase was due to higher gross assets in 2008 as compared to 2007. Our advisory fee is based in part on gross assets.
Other Income Expense
Other income increased by $1.6 million. The majority of the increase is due to receiving a dividend distribution from our investment in Realty Korea CR-REIT Co., Ltd in 2008.
Mortgage and loan interest expense increased by $7.2 million as compared to the prior year whichoperating expenses of $55.6 million. This change, by segment, is due to a $6.8 millionan increase in our apartments, an increasethe apartment portfolio of $2.8 million, offset by a decrease in the land and other portfolio of $0.9 million in our commercial portfolio and a decrease in ourthe commercial portfolio of $0.6 million. The decrease in the land and other portfolios of $0.5 million. Interest expense withinportfolio was due to land sales. Within the apartment portfolio, the same apartment properties increased $0.5 million due to overall operating costs and additional repair and maintenance expenses. The developed apartments increased by $2.3 million as these properties moved into the lease-up phase and began operations.
Depreciation and amortization expense was $19.0 million for the twelve months ended December 31, 2011. This represents a decrease of $1.6 million, as compared to the prior year expense of $20.6 million. This change, by segment, was an increase in the apartment portfolio of $0.8 million from our new acquisitionsoffset by a decrease in the commercial portfolio of $2.4 million. Within the apartment portfolio, the same property portfolio decreased by $0.4 million and $6.0 million from ourthe developed properties in the lease uplease-up phase increased by $1.2 million as the buildings became substantially complete and depreciation began.
General and administrative expenses were $9.4 million for the twelve months ended December 31, 2011. This represents an increase of $1.1 million as compared to the prior year expenses of $8.3 million. This change was due to an increase in administrative expenses and professional services.
Impairment was recorded as an additional loss in the investment portfolio of $37.0 million for the period ending December 31, 2011, of which $5.2 million was in the apartment properties we currently hold, $2.0 million in commercial properties we currently hold, $2.4 million in land parcels we currently hold, $27.0 million in land that was sold subsequent to the prior period and $0.4 million in impairment on our investments in joint ventures. Of the impairment reserves taken during that period, $22.1 million was related to the land holdings that were part of an overall strategic debt restructuring plan resulting in the disposal of the land for less than the market value, $9.3 million was related to a third party sales contract that was executed during the prior period for less than the carrying value, $5.2 million was related to the underperformance of property using a valuation analysis based upon a multiple of earnings and $0.4 million was related to various investment in joint ventures that had were determined to have a questionable recovery of our investment. Impairment was recorded as an additional loss in the investment portfolio of $22.6 million for the period ended December 31, 2010, of which $18.2 million was in land parcels we currently hold that were part of an overall strategic debt restructuring plan resulting in the disposal of the land for less than market value and $4.4 million was related to several notes receivable that were determined to have a questionable recovery and reserves were taken to reduce our potential loss in the future.
Other income (expense)
Other income was $2.5 million for the twelve months ended December 31, 2011. This represents a decrease of $5.9 million as compared to the prior year income of $8.4 million. The decrease was due to revenue received in prior year from an incentive fee from Regis I.
Interest income was $5.7 million for the twelve months ended December 31, 2011. This represents an increase of $0.5 million, as compared to the prior year income of $5.2 million. This change was due to the receipt of interest payments due on our Unified Housing surplus cash flow notes. Prior to January 1, 2012, accrued interest was recognized to the extent that cash was received.
Mortgage and loan interest expense was $51.9 million for the twelve months ended December 31, 2011. This represents a decrease of $2.3 million, as compared to the prior year expense of $54.2 million. This change, by segment, is a decrease in the land and other portfolio of $1.4 million, a decrease in the apartment portfolio of $0.8 million and a decrease in the commercial portfolio of $0.1 million. Within the apartment portfolio, the same apartment portfolio decreased $3.5 million, and the developed properties increased $2.7 million due to properties in the lease-up phase. Once an apartment is completed, the interest expense is no longer capitalized. WithinThe decrease in the commercialland and other portfolio we refinancedwas due to land sales.
Gain on land sales increased for the
existing loan on the Amoco building late last year pulling some of the equity out of the building and thus increasing interest expense.There were no gains or losses recorded for involuntary conversions in 2008, as compared to $34.8 million in 2007.twelve months ended December 31, 2011. In the prior year, we had a gain on involuntary conversion of $34.8 million. This was from the claims filed on our New Orleans property for damages resulting from hurricane Katrina in 2005.
In 2008,2011, we sold 91.73,809.49 acres of land in eight34 separate transactions for an aggregate sales price of $14.3$163.1 million receiving $4.3 million in cash and recorded a gain on sale of $4.8$17.0 million. The average sales price was $156,000$42,801 per acre. Also included in the prior year gain on land sales is the sale of our mineral rights on 43.4 acres of land known as Marine Creek for $1.1 million. In 2007,2010, we sold 127.61,227.53 acres of land in nine13 separate transactions withfor an aggregate sales price of $20.8$23.1 million receiving $8.4 million in cash and recordingrecorded a gain on saleloss of $12.0$15.1 million. The average sales price was $163,000$18,823 per acre. The sales relate to the properties known as; Desoto Ranch (easement), 28.9 acres of McKinney Ranch land, 3.4 acres Mandahl Bay, 2.3 acres West End Land, 3.0 acres Miro Lago, 4.0 acres Hines Meridian, and 86 acres RB Land.
Discontinued operations relates to properties that were either sold or held for
sale.sale as of the respective year end. Included in discontinued operations are a total of
2518 and
627 income-producing properties as of
20082011 and
2007, respectively.2010, respectively and one held for sale as of 2012. The prior periods discontinued operations have been adjusted to reflect properties held during those years that were subsequently sold or held for sale as of December 31,
2009.2012. In
2009,2011, we sold
six11 commercial properties
(Addison Hanger I, Addison Hanger II, Alpenloan, Fenton Center, One Hickory, Parkway North, Signature, Teleport Blvd, Two Hickory, Westgrove Air Plaza and
hadWillowbrook Village), one
propertyapartment complex (Spyglass), 13 acres of land with a storage warehouse (Eagle Crest), and one apartment complex held for
sale. These were reclassed to prior year discontinued operations, with the exception of thesale (Wildflower Villas). In 2010,
Valley View and Parkway Centre properties which were acquired in the IOT consolidation in 2009. In 2008, we sold
25 properties which consist of 18seven apartment complexes
(Arbor Pointe, Ashton Way, Autumn Chase, Courtyard, Coventry Pointe, Fairways, Forty-Four Hundred Apartments, Fountains at Waterford, Hunters Glen, SouthGate, Sunchase, Thornwood, Westwood Square, Woodview, Fairway View, Willow Creek, Fountain Lake,(Baywalk, Foxwood, Island Bay, Kingsland Ranch, Longfellow Arms, Marina Landing and
Mountain Plaza)Mason Park),
four hotels (City Suites, Majestic Inn, Willows, and Hotel Akademia), and three commercial buildings (Lexington Center, Executive Court, and Encon Warehouse). In 2007, we sold six properties which consist of five apartment complexes (Bluffs at Vista Ridge, Somerset, El Chaparral, Harpers Ferry, and Oak Park IV) and one commercial building
(Forum OB).The(217 Rampart), and transferred our limited partnership interest in a consolidated entity that owned an apartment complex (Quail Oaks). In addition, in 2011 and 2010, we recognized the deferred gains on the sales of six apartment complexes (Bridges on Kinsey, Limestone Canyon, Limestone Ranch, Longfellow Arms, Sendero Ridge and Tivoli) and four commercial properties (2010 Valley View, Cullman Shopping Center, Kmart Cary and Parkway Centre) that were sold in prior years in accordance with the requirements per ASC Topic 360-20 “Property, Plant, and Equipment—Real Estate Sales”. The gains on sale of the
apartmentsproperties sold
in 2008 and 2007 are also included in the discontinued operations for those years
as shown in the table below (dollars in thousands)
. | | | | | | | | |
| | | For Years Ended
December 31, | |
| | | 2008 | | | 2007 | |
Revenue | | | | | | | | |
Rental | | $ | 9,288 | �� | | $ | 42,862 | |
Property operations | | | 4,268 | | | | 28,374 | |
| | | | | | | | |
| | | 5,020 | | | | 14,488 | |
Expenses | | | | | | | | |
Interest | | | (7,177 | ) | | | (13,472 | ) |
General and administration | | | (672 | ) | | | (60 | ) |
Depreciation | | | (851 | ) | | | (4,341 | ) |
| | | | | | | | |
| | | (8,700 | ) | | | (17,873 | ) |
| | | | | | | | |
Net loss from discontinued operations before gains on sale of real estate, taxes and fees | | | (3,680 | ) | | | (3,385 | ) |
Gain on sale of discontinued operations | | | 104,411 | | | | 20,919 | |
Equity in investee | | | 6,306 | | | | — | |
Net income fee to affiliate | | | (3,041 | ) | | | 514 | |
Net sales fee to affiliate | | | (7,953 | ) | | | (2,564 | ) |
| | | | | | | | |
Income from discontinued operations | | | 96,043 | | | | 15,484 | |
Tax expense | | | (33,616 | ) | | | (5,420 | ) |
| | | | | | | | |
Income from discontinued operations | | $ | 62,427 | | | $ | 10,064 | |
| | | | | | | | |
:
| | | For Years Ended December 31, | |
| | | 2011 | | | 2010 | |
| Revenues | | | | | | |
| Rental | | $ | 18,215 | | | $ | 38,110 | |
| | | | 18,215 | | | | 38,110 | |
| Expenses (Other Income) | | | | | | | | |
| Property operations | | | (10,243 | ) | | | (21,013 | ) |
| Other income | | | - | | | | 4,065 | |
| Interest | | | (7,212 | ) | | | (15,819 | ) |
| General and administration | | | (1,148 | ) | | | (697 | ) |
| Depreciation | | | (4,032 | ) | | | (7,755 | ) |
| Provision on impairment of real estate assets | | | (8,005 | ) | | | (1,923 | ) |
| | | | (30,640 | ) | | | (43,142 | ) |
| Net loss from discontinued operations before gains on sale of real estate, taxes and fees | | | (12,425 | ) | | | (5,032 | ) |
| Gain on sale of discontinued operations | | | 18,300 | | | | 10,781 | |
| Earnings from unconsolidated subsidiaries and investees | | | 453 | | | | 203 | |
| Income from discontinued operations | | | 6,328 | | | | 5,952 | |
| Income tax expense | | | (2,215 | ) | | | (2,083 | ) |
| Income from discontinued operations | | $ | 4,113 | | | $ | 3,869 | |
Liquidity and Capital Resources
Our principal liquidity needs are:
fund normal recurring expenses;
meet debt service and principal repayment obligations including balloon payments on maturing debt;
fund capital expenditures, including tenant improvements and leasing costs;
fund development costs not covered under construction loans; and
fund possible property acquisitions.
Our principal sources of cash have been and will continue to be:
proceeds from land and income-producing property sales;
collection of mortgage notes receivable;
collections of receivables from affiliatedrelated companies;
refinancing of existing mortgage notes payable; and
additional borrowings, including mortgage notes payable, and lines of credit.
It is important to realize that the current status of the banking industry has had a significant effect on our industry. The
banksbanks’ willingness and/or ability to originate loans affects our ability to buy and sell property, and refinance existing debt. We are unable to foresee the extent and length of this
down turn.down-turn. A continued and extended decline could materially impact our cash flows. We draw on multiple financing sources to fund our long-term capital needs. We generally fund our development projects with construction loans, which are converted to traditional mortgages upon completion of the project.
We may also issue additional equity securities, including common stock and preferred stock. Management anticipates that our cash as of December 31,
2009,2012, along with cash that will be generated in
20102013 from property operations, may not be sufficient to meet all of our cash requirements. Management intends to selectively sell land and
income producingincome-producing assets, refinance or extend real estate debt and seek additional borrowings secured by real estate to meet its liquidity requirements. Although history cannot predict the future, historically, we have been successful at refinancing and extending a portion of the Company’s current maturity obligations.
Cash flow summary
The following summary discussion of our cash flows is based on the Consolidated Statements of Cash Flows in Part II, Item 8. “Consolidated Financial Statements and Supplementary Data” and is not meant to be an all inclusive discussion of the changes in our cash flows for the periods presented below (dollars in thousands):
| | | | | | | | | | | | |
| | | 2009 | | | 2008 | | | Variance | |
Net cash provided by (used in) operating activities | | $ | (27,586 | ) | | $ | 20,407 | | | $ | (47,993 | ) |
Net cash used in investing activities | | $ | 41,922 | | | $ | (65,209 | ) | | $ | 107,131 | |
Net cash provided by financing activities | | $ | (14,654 | ) | | $ | 39,546 | | | $ | (54,200 | ) |
The primary use of cash for operations is daily operating costs, general and administrative expenses, advisory fees, and land holding costs. Our primary source of cash from operating activities is from rental income on properties. In addition, we had a significant receivable due from affiliated entities that we receive interest income from.
Our primary cash outlays for investing activities are for construction and development, acquisition of land and income producing properties, and capital improvements to existing properties. We used $26.1 million on construction and development. This is a decrease of $104.0 million from prior year. We have discontinued certain projects and put some projects on hold, while continuing to development our apartment properties. We acquired approximately 5 tracts of land consisting of approximately 178 acres in 2009 for $11.8 million. We continue to make capital improvements on our existing properties but spent significantly less in 2009 than in the prior year. We acquired one commercial building in 2009 using $6.0 million, as compared to 2008 where we acquired five commercial buildings and two apartment complexes using $64.5 million. Our primary sources of cash from investing activities are from the proceeds on the sale of land and income producing properties. We sold one apartment complex and five commercial buildings, providing over $34.6 million along with 857.12 acres of land sales of providing $36.3 million.
Our primary sources of cash from financing activities are from proceeds on notes payables. Our primary cash outlays are for recurring debt payments and payments on maturing notes payable. Proceeds from notes payable associated with the new loans and refinancing provided $55.5 million. We used $18.6 million to make recurring note payments, and $49.5 million for maturing notes.
Management reviews the carrying values of TCI’s properties and mortgage notes receivable at least annually and whenever events or a change in circumstances indicate that impairment may exist. Impairment is considered to exist if, in the case of a property, the future cash flow from the property (undiscounted and without interest) is less than the carrying amount of the property. For notes receivable, impairment is considered to exist if it is probable that all amounts due under the terms of the note will not be collected. If impairment is found to exist, a provision for loss is recorded by a charge against earnings. The note receivable review includes an evaluation of the collateral property securing such note. The property review generally includes: (1) selective property inspections; (2) a review of the property’s current rents compared to market rents; (3) a review of the property’s expenses; (4) a review of maintenance requirements; (5) a review of the property’s cash flow; (6) discussions with the manager of the property; and (7) a review of properties in the surrounding area.
Cash Flow Summary
The following summary discussion of our cash flows is based on the Consolidated Statements of Cash Flows in Part II, Item 8. “Consolidated Financial Statements and Supplementary Data” and is not meant to be an all inclusive discussion of the changes in our cash flows for the periods presented below (dollars in thousands):
| | | 2012 | | | 2011 | | | Variance | |
| | | | | | | | | | |
| Net cash provided by (used in) operating activities | | $ | (21,119 | ) | | $ | (14,119 | ) | | $ | (7,000 | ) |
| Net cash provided by investing activities | | $ | 67,809 | | | $ | 43,850 | | | $ | 23,959 | |
| Net cash used in financing activities | | $ | (50,061 | ) | | $ | (20,999 | ) | | $ | (29,062 | ) |
The primary use of cash for operations is daily operating costs, general and administrative expenses, advisory fees, and land holding costs. Our primary source of cash from operating activities is from rental income on properties. In addition, we have a related account in which excess cash is transferred to or from. We used less cash to pay down related party payables than in the prior period. In the prior period, an adjustment was made to reflect the cost basis of ARL acquisitions, which reduced the related party payables by approximately $57.0 million. Obligations to related parties were further reduced in the prior period by other related party transactions.
Our primary cash outlays for investing activities are for construction and development, acquisition of land and income- producing properties, and capital improvements to existing properties. Our primary sources of cash from investing activities are from the proceeds on the sale of land and income-producing properties. During the prior period, we spent $41.0 million more on construction and development projects than in the current period due to the completion of construction on five apartment complexes. We have discontinued certain projects and put some projects on hold, while continuing to develop our apartment properties. We continue to make capital improvements on our existing properties but spent significantly less in 2012 on land development than in the prior year. Our primary sources of cash from investing activities are from the proceeds on the sale of land and income-producing properties. In addition, we received less proceeds on the sale of land and income-producing properties resulting from a decrease in sale transactions in the current period. The majority of the sales proceeds were used to cover the loan obligations.
Our primary sources of cash from financing activities are from proceeds on notes payables. Our primary cash outlays are for recurring debt payments and payments on maturing notes payable. Proceeds from notes payable associated with the new loans and refinancing provided $139.4 million. We used $21.5 million to make recurring note payments, $163.6 million for maturing notes, including payoffs required on sold properties.
Equity Investments
TCI has from time to time purchased shares of IOT and ARL. The Company may purchase additional equity securities of IOT and ARL through open market and negotiated transactions to the extent TCI’s liquidity permits.
Equity securities of ARL and IOT held by TCI may be deemed “restricted securities” under Rule 144 of the Securities Act of 1933 (“Securities Act”). Accordingly, TCI may be unable to sell such equity securities other than in a registered public offering or pursuant to an exemption under the Securities Act for a one-year period after they are acquired. Such restrictions may reduce TCI’s ability to realize the full fair value of such investments if TCI attempted to dispose of such securities in a short period of time.
We have contractual obligations and commitments primarily with regards to the payment of mortgages. The following table aggregates our expected contractual obligations and commitments and includes items not accrued, per Generally Accepted Accounting Principles, through the term of the obligation such as interest expense and operating leases. Our aggregate obligations subsequent to December 31,
20092012 are shown in the table below (dollars in thousands)
; | | | | | | | | | | | | | | | |
| | | Total | | 2010 | | 2011 | | 2012-2014 | | Thereafter |
Long-term debt obligation | | $ | 2,021,557 | | $ | 413,895 | | $ | 200,312 | | $ | 230,583 | | $ | 1,176,767 |
Capital lease obligation | | | — | | | — | | | — | | | — | | | — |
Operating lease obligation | | | 46,974 | | | 734 | | | 750 | | | 2,304 | | | 43,186 |
Purchase obligation | | | — | | | — | | | — | | | — | | | — |
Other long-term debt liabilities reflected on the Registrant’s Balance Sheet under GAAP | | | — | | | — | | | — | | | — | | | — |
| | | | | | | | | | | | | | | |
Total | | $ | 2,068,531 | | $ | 414,629 | | $ | 201,062 | | $ | 232,887 | | $ | 1,219,953 |
| | | | | | | | | | | | | | | |
:
| | | Total | | | 2013 | | | 2014 | | | | 2015-2017 | | | Thereafter | |
Long-term debt obligation (1) | | $ | 1,324,641 | | | $ | 220,496 | | | $ | 72,808 | | | $ | 158,119 | | | $ | 873,218 | |
| Capital lease obligation | | | - | | | | - | | | | - | | | | - | | | | - | |
| Operating lease obligation | | | 34,968 | | | | 525 | | | | 532 | | | | 1,635 | | | | 32,276 | |
| Purchase obligation | | | - | | | | - | | | | - | | | | - | | | | - | |
| Other long-term debt liabilities reflected on the | | | - | | | | - | | | | - | | | | - | | | | - | |
| Registrant's Balance Sheet under GAAP | | | | | | | | | | | | | | | | | | | | |
| Total | | $ | 1,359,609 | | | $ | 221,021 | | | $ | 73,340 | | | $ | 159,754 | | | $ | 905,494 | |
| | | | | | | | | | | | | | | | | | | | | |
(1) TCI's long-term debt may contain financial covenants that, if certain thresholds are not met, could allow the lender to accelerate principal payments or cause the note to become due immediately. | |
Under various federal, state and local environmental laws, ordinances and regulations, TCI may be potentially liable for removal or remediation costs, as well as certain other potential costs, relating to hazardous or toxic substances (including governmental fines and injuries to persons and property) where property-level managers have arranged for the removal, disposal or treatment of hazardous or toxic substances. In addition, certain environmental laws impose liability for release of asbestos-containing materials into the air, and third parties may seek recovery for personal injury associated with such materials.
Management is not aware of any environmental liability relating to the above matters that would have a material adverse effect on TCI’s business, assets or results of operations.
The effects of inflation on TCI’s operations are not quantifiable. Revenues from property operations tend to fluctuate proportionately with inflationary increases and decreases in housing costs. Fluctuations in the rate of inflation also affect sales values of properties and the ultimate gain to be realized from property sales. To the extent that inflation affects interest rates, TCI’s earnings from short-term investments, the cost of new financings and the cost of variable interest rate debt will be affected.
ITEM 7A. QUANTITATIVE | AND QUALITATIVE DISCLOSURES ABOUT MARKET RISK |
ITEM 7A. QUANTITATIVE AND QUALITATIVE DISCLOSURES ABOUT MARKET RISK
TCI’s primary market risk exposure consists of changes in interest rates on borrowings under our debt instruments that bear interest at variable rates that fluctuate with market interest rates and maturing debt that has to be refinanced. TCI’s future operations, cash flow and fair values of financial instruments are also partially dependent on the then existing market interest rates and market equity prices.
As of December 31,
2009,2012, our
$1.2 billion$799.6 million debt portfolio consisted of approximately
$791.7$661.6 million of fixed-rate
debt and approximately $138.0 million of variable-rate debt with interest rates ranging from
2.0%1.1% to
17.0% and approximately $391.5 million of variable-rate debt.12.5%. Our overall weighted average interest rate at December 31,
20092012 and
20082011 was
5.91%5.20% and
7.00%5.74%, respectively.
TCI’s interest rate sensitivity position is managed by the capital markets department. Interest rate sensitivity is the relationship between changes in market interest rates and the fair value of market rate sensitive assets and liabilities. TCI’s earnings are affected as changes in short-term interest rates affect its cost of variable-rate debt and maturing fixed-rate debt.
If market interest rates for variable-rate debt average 100 basis points more in
20102013 than they did during
2009,2012, TCI’s interest expense would increase and net income would decrease by
$3.9$1.4 million. This amount is determined by considering the impact of hypothetical interest rates on TCI’s borrowing cost. The analysis does not consider the effects of the reduced level of overall economic activity that could exist in such an environment. Further, in the event of a change of such magnitude, management would likely take actions to further mitigate its exposure to the change. However, due to the uncertainty of the specific actions that would be taken and their possible effects, the sensitivity analysis assumes no change in TCI’s financial structure.
The following table contains only those exposures that existed at December 31,
2009.2012. Anticipation of exposures or risk on positions that could possibly arise was not considered. TCI’s ultimate interest rate risk and its effect on operations will depend on future capital market exposures, which cannot be anticipated with a probable assurance level (dollars in thousands)
. | | | | | | | | | | | | | | | | | | | | | | | | | | |
| | | 2010 | | | 2011 | | | 2012 | | | 2013 | | | 2014 | | | Thereafter | | Total |
Assets | | | | | | | | | | | | | | | | | | | | | | | | | | |
Market securities at fair value | | | | | | | | | | | | | | | | | | | | | | | | | $ | — |
Note receivable | | | | | | | | | | | | | | | | | | | | | | | | | | |
Variable interest rate—fair value | | | | | | | | | | | | | | | | | | | | | | | | | $ | 2,775 |
Instrument’s maturities | | $ | — | | | $ | 2,775 | | | $ | — | | | $ | — | | | $ | — | | | $ | — | | $ | 2,775 |
Instrument’s amortization | | | — | | | | — | | | | — | | | | — | | | | — | | | | — | | | — |
Interest | | | 146 | | | | 121 | | | | — | | | | — | | | | — | | | | — | | | 267 |
Average rate | | | 5.25 | % | | | 5.25 | % | | | 0.00 | % | | | 0.00 | % | | | 0.00 | % | | | | | | |
Fixed interest rate—fair value | | | | | | | | | | | | | | | | | | | | | | | | | $ | 44,491 |
Instrument’s maturities | | $ | 22,052 | | | $ | — | | | $ | 1,875 | | | $ | 20,564 | | | $ | — | | | $ | — | | $ | 44,491 |
Instrument’s amortization | | | — | | | | — | | | | — | | | | — | | | | — | | | | — | | | — |
Interest | | | 4,907 | | | | 2,556 | | | | 2,556 | | | | 2,468 | | | | — | | | | — | | | 12,487 |
Average rate | | | 11.0 | % | | | 11.4 | % | | | 11.4 | % | | | 12.0 | % | | | 0.0 | % | | | | | | |
| | | | | | | |
| Notes Payable | | 2010 | | | 2011 | | | 2012 | | | 2013 | | | 2014 | | | Thereafter | | Total |
Variable interest rate—fair value | | | | | | | | | | | | | | | | | | | | | | | | | $ | 391,486 |
Instrument’s maturities | | $ | 284,140 | | | $ | 70,181 | | | $ | 7,846 | | | $ | 4,151 | | | $ | 5,796 | | | $ | 10,317 | | $ | 382,431 |
Instrument’s amortization | | | 4,595 | | | | 2,571 | | | | 606 | | | | 518 | | | | 123 | | | | 642 | | | 9,055 |
Interest | | | 7,336 | | | | 3,389 | | | | 1,087 | | | | 968 | | | | 652 | | | | 3,390 | | | 16,822 |
Average rate | | | 5.12 | % | | | 5.02 | % | | | 6.21 | % | | | 6.36 | % | | | 6.48 | % | | | | | | |
Fixed interest rate—fair value | | | | | | | | | | | | | | | | | | | | | | | | | $ | 791,736 |
Instrument’s maturities | | $ | 64,034 | | | $ | 74,518 | | | $ | 3,627 | | | $ | 81,356 | | | $ | 338 | | | $ | 10,892 | | $ | 234,765 |
Instrument’s amortization | | | 8,675 | | | | 8,282 | | | | 7,963 | | | | 6,011 | | | | 6,071 | | | | 519,969 | | | 556,971 |
Interest | | | 45,115 | | | | 41,371 | | | | 37,637 | | | | 33,512 | | | | 32,321 | | | | 631,557 | | | 821,513 |
Average rate | | | 6.34 | % | | | 6.24 | % | | | 6.11 | % | | | 6.10 | % | | | 6.13 | % | | | | | | |
ITEM 8. FINANCIAL | STATEMENTS AND SUPPLEMENTARY DATA |
:
| | | 2013 | | | 2014 | | | 2015 | | | 2016 | | | 2017 | | | Thereafter | | | Total | |
| Assets | | | | | | | | | | | | | | | | | | | | | |
| Market securities at fair value | | | | | | | | | | | | | | | | | | | | $ | - | |
| Note Receivable | | | | | | | | | | | | | | | | | | | | | | |
| Variable interest rate - fair value | | | | | | | | | | | | | | | | | | | | $ | - | |
| Instruments' maturities | | $ | - | | | $ | - | | | $ | - | | | $ | - | | | $ | - | | | $ | - | | | $ | - | |
| Instruments' amortization | | | - | | | | - | | | | - | | | | - | | | | - | | | | - | | | | - | |
| Interest | | | - | | | | - | | | | - | | | | - | | | | - | | | | - | | | | - | |
| Average Rate | | | 0.00 | % | | | 0.00 | % | | | 0.00 | % | | | 0.00 | % | | | 0.00 | % | | | | | | | | |
| | | | | | | �� | | | | | | | | | | | | | | | | | | | | | | |
| Fixed interest rate - fair value | | | | | | | | | | | | | | | | | | | | | | | | | | $ | 56,919 | |
| Instruments' maturities | | $ | 9,230 | | | $ | - | | | $ | 272 | | | $ | - | | | $ | - | | | $ | 47,417 | | | $ | 56,919 | |
| Instruments' amortization | | | - | | | | - | | | | - | | | | - | | | | - | | | | - | | | | - | |
| Interest | | | 2,882 | | | | 2,485 | | | | 2,482 | | | | 5,643 | | | | 5,643 | | | | 56,429 | | | | 75,564 | |
| Average Rate | | | 5.06 | % | | | 5.21 | % | | | 5.21 | % | | | 11.90 | % | | | 11.90 | % | | | 11.9 | % | | | | |
| | | | | | | | | | | | | | | | | | | | | | | | | | | | | |
| | | | | | | | | | | | | | | | | | | | | | | | | | | | | |
| | | | | | | | | | | | | | | | | | | | | | | | | | | | | |
| Notes Payable | | | 2013 | | | | 2014 | | | | 2015 | | | | 2016 | | | | 2017 | | | Thereafter | | | Total | |
| Variable interest rate - fair value | | | | | | | | | | | | | | | | | | | | | | | | | | $ | 137,972 | |
| Instruments' maturities | | $ | 131,043 | | | $ | - | | | $ | 223 | | | $ | 364 | | | $ | - | | | $ | 3,984 | | | $ | 135,614 | |
| Instruments' amortization | | | 1,111 | | | | 412 | | | | 383 | | | | 184 | | | | 114 | | | | 154 | | | | 2,358 | |
| Interest | | | 1,520 | | | | 362 | | | | 333 | | | | 298 | | | | 284 | | | | 343 | | | | 3,140 | |
| Average Rate | | | 5.36 | % | | | 6.59 | % | | | 6.60 | % | | | 6.69 | % | | | 6.75 | % | | | 1.84 | % | | | | |
| | | | | | | | | | | | | | | | | | | | | | | | | | | | | |
| Fixed interest rate - fair value | | | | | | | | | | | | | | | | | | | | | | | | | | $ | 661,609 | |
| Instruments' maturities | | $ | 48,754 | | | $ | 35,747 | | | $ | 7,667 | | | $ | 58,215 | | | $ | 256 | | | $ | 10,793 | | | $ | 161,432 | |
| Instruments' amortization | | | 9,023 | | | | 8,886 | | | | 9,026 | | | | 6,978 | | | | 6,810 | | | | 459,454 | | | | 500,177 | |
| Interest | | | 29,045 | | | | 27,401 | | | | 25,315 | | | | 21,129 | | | | 20,541 | | | | 398,490 | | | | 521,921 | |
| Average Rate | | | 4.70 | % | | | 4.67 | % | | | 4.60 | % | | | 4.68 | % | | | 4.66 | % | | | 4.62 | % | | | | |
ITEM 8. CONSOLIDATED FINANCIAL STATEMENTS AND SUPPLEMENTARY DATA INDEX TO FINANCIAL STATEMENTS
| | |
| | | Page |
Financial Statements | | |
Report of Independent Registered Public Accounting Firm | | 4137 |
Consolidated Balance Sheets—December 31, 20092012 and 2008 2011 | | 4238 |
Consolidated Statements of Operations—Years Ended December 31, 2009, 20082012, 2011 and 2007 2010 | | 4339 |
Consolidated Statements of Shareholders’ Equity—Years Ended December 31, 2009, 20082012, 2011 and 2007 2010 | | 4440 |
Consolidated Statements of Cash Flows—Years Ended December 31, 2009, 20082012, 2011 and 2007 2010 | | 4541 |
StatementStatements of Consolidated Comprehensive Income (Loss)
– Years Ended December 31, 2012, 2011 and 2010 | | 4642 |
Notes to Financial Statements | 43 |
| | 47 |
| |
Financial Statement Schedules | | |
Schedule III—Real Estate and Accumulated Depreciation | | 7172 |
Schedule IV—Mortgage Loans on Real Estate | | 8176 |
All other schedules are omitted because they are not required, are not applicable or the information required is included in the Financial Statements or the notes thereto.
REPORT OF INDEPENDENT REGISTERED PUBLIC ACCOUNTING FIRM
To the Board of Directors of and
Stockholders of Transcontinental Realty Investors, Inc.
We have audited the accompanying consolidated balance sheets of Transcontinental Realty Investors, Inc. and Subsidiaries as of December 31,
20092012 and
2008,2011, and the related consolidated statements of operations, stockholders’ equity, and cash flows each for each of the years in the three-year period ended December 31,
2009.2012. Transcontinental Realty Investors, Inc’s management is responsible for these consolidated financial statements. Our responsibility is to express an opinion on these consolidated financial statements based on our audits.
We conducted our audits in accordance with the standards of the Public Company Accounting Oversight Board (United States). Those standards require that we plan and perform the audit to obtain reasonable assurance about whether the consolidated financial statements are free of material misstatement. The Company is not required to have, nor were we engaged to perform, an audit of its internal control over financial reporting. Our audit included consideration of internal control over financial reporting as a basis for designing audit procedures that are appropriate in the circumstances, but not for the purpose of expressing an opinion on the effectiveness of the Company’s internal control over financial reporting. Accordingly, we express no such opinion. An audit also includes examining, on a test basis, evidence supporting the amounts and disclosures in the consolidated financial statements, assessing the accounting principles used and significant estimates made by management, as well as evaluating the overall consolidated financial statement presentation. We believe that our audits provide a reasonable basis for our opinion.
As described in Note
21,16, Transcontinental Realty Investors, Inc.’s management intends to sell land and
income producingincome-producing properties and refinance or extend debt secured by real estate to meet the Company’s liquidity needs.
In our opinion, the consolidated financial statements referred to above present fairly, in all material respects, the financial position of Transcontinental Realty Investors, Inc. as of December 31,
20092012 and
2008,2011, and the results of its operations and its cash flows for each of the years in the three-year period ended December 31,
2009,2012, in conformity with accounting principles generally accepted in the United States of America.
Our audits were made for the purpose of forming an opinion on the consolidated financial statements taken as a whole. Schedules III and IV are presented for the purpose of complying with the Securities and Exchange Commission’s rules and
isare not a required part of the basic consolidated financial statements. These schedules have been subjected to the auditing procedures applied in the audits of the consolidated financial statements and, in our opinion, fairly state, in all material respects, the financial data required to be set forth therein in relation to the basic consolidated financial statements taken as a whole.
FARMER, F
UQUA & H
UFF, P
CPlano,
| TRANSCONTINENTAL REALTY INVESTORS, INC. | |
| CONSOLIDATED BALANCE SHEETS | |
| | | | | | | |
| | | | | | | |
| | | December 31, | | | December 31, | |
| | | 2012 | | | 2011 | |
| | | (dollars in thousands, except share and par value amounts) | |
| Assets | | | | | | |
| Real estate, at cost | | $ | 978,781 | | | $ | 1,069,699 | |
| Real estate held for sale at cost, net of depreciation ($4,658 in 2012 and $1,752 in 2011) | | | 18,077 | | | | 15,015 | |
Real estate subject to sales contracts at cost, net of depreciation ($16,412 in 2012 and $7,213 in 2011) | | | 45,706 | | | | 52,555 | |
| Less accumulated depreciation | | | (145,614 | ) | | | (148,930 | ) |
| Total real estate | | | 896,950 | | | | 988,339 | |
| Notes and interest receivable | | | | | | | | |
Performing (including $58,007 in 2012 and $78,852 in 2011 from affiliates and related parties) | | | 60,637 | | | | 79,161 | |
| Non-Performing | | | 723 | | | | 2,152 | |
Less allowance for estimated losses (including $2,097 in 2012 and $2,097 in 2011 from affiliates and related parties) | | | (2,262 | ) | | | (3,942 | ) |
| Total notes and interest receivable | | | 59,098 | | | | 77,371 | |
| Cash and cash equivalents | | | 16,620 | | | | 19,991 | |
| Investments in unconsolidated subsidiaries and investees | | | 5,439 | | | | 6,362 | |
| Other assets | | | 67,237 | | | | 68,261 | |
| Total assets | | $ | 1,045,344 | | | $ | 1,160,324 | |
| | | | | | | | | |
| Liabilities and Shareholders’ Equity | | | | | | | | |
| Liabilities: | | | | | | | | |
| Notes and interest payable | | $ | 730,931 | | | $ | 829,617 | |
| Notes related to assets held for sale | | | 18,915 | | | | 13,830 | |
| Notes related to subject to sales contracts | | | 55,976 | | | | 38,376 | |
| Stock secured notes payable | | | 2,221 | | | | 2,482 | |
| Payable to related party | | | 10,057 | | | | 17,465 | |
| Deferred revenue (from sales to related parties) | | | 53,096 | | | | 65,607 | |
Accounts payable and other liabilities (including $4,282 in 2012 and $1,746 in 2011 from affiliates and related parties) | | | 41,019 | | | | 51,663 | |
| | | | 912,215 | | | | 1,019,040 | |
| | | | | | | | | |
| Shareholders’ equity: | | | | | | | | |
Preferred Stock, Series C: $.01 par value, authorized 10,000,000 shares, issued and outstanding 30,000 shares in 2012 and 2011 respectively (liquidation preference $100 per share). Series D: $.01 par value, authorized, issued and outstanding 100,000 shares in 2012 and 2011 respectively | | | 1 | | | | 1 | |
Common Stock, $.01 par value, authorized 10,000,000 shares; issued 8,413,669 in 2012 and 2011 respectively and outstanding 8,413,469 in 2012 and 2011 respectively | | | 84 | | | | 84 | |
| Treasury stock at cost; 200 shares in 2012 and 2011 | | | (2 | ) | | | (2 | ) |
| Paid-in capital | | | 272,774 | | | | 273,886 | |
| Retained earnings | | | (156,559 | ) | | | (148,235 | ) |
| Total Transcontinental Realty Investors, Inc. shareholders' equity | | | 116,298 | | | | 125,734 | |
| Non-controlling interest | | | 16,831 | | | | 15,550 | |
| Total equity | | | 133,129 | | | | 141,284 | |
| Total liabilities and equity | | $ | 1,045,344 | | | $ | 1,160,324 | |
| | | | | | | | | |
| The accompanying notes are an integral part of these consolidated financial statements. | |
| TRANSCONTINENTAL REALTY INVESTORS, INC. | |
| CONSOLIDATED STATEMENTS OF OPERATIONS | |
| | | | | | | | | | |
| | | For the Years Ended December 31, | |
| | | 2012 | | | 2011 | | | 2010 | |
| | | (dollars in thousands, except share and per share amounts) | |
| Revenues: | | | | | | | | | |
Rental and other property revenues (including $587 and $223 and $564 for the year ended 2012 and 2011 and 2010 respectively from affiliates and related parties) | | $ | 116,051 | | | $ | 106,340 | | | $ | 102,683 | |
| | | | | | | | | | | | | |
| Expenses: | | | | | | | | | | | | |
Property operating expenses (including $1,099 and $1,130 and $1,359 for year ended 2012 and 2011 and 2010 respectively from affiliates and related parties) | | | 57,242 | | | | 56,928 | | | | 55,636 | |
| Depreciation and amortization | | | 21,557 | | | | 19,003 | | | | 20,559 | |
General and administrative (including $2,427 and $2,908 and $3,065 for the year ended 2012 and 2011 and 2010 respectively from affiliates and related parties) | | | 5,426 | | | | 9,433 | | | | 8,327 | |
| Provision on impairment of notes receivable and real estate assets | | | 4,730 | | | | 37,002 | | | | 22,579 | |
| Advisory fee to affiliate | | | 8,915 | | | | 9,958 | | | | 11,919 | |
| Total operating expenses | | | 97,870 | | | | 132,324 | | | | 119,020 | |
| Operating income (loss) | | | 18,181 | | | | (25,984 | ) | | | (16,337 | ) |
| | | | | | | | | | | | | |
| Other income (expense): | | | | | | | | | | | | |
Interest income (including $11,677 and $5,275 and $4,406 for the year ended 2012 and 2011 and 2010 respectively from affiliates and related parties) | | | 11,725 | | | | 5,720 | | | | 5,187 | |
Other income (including $6,000 and $0 and $0 for the year ended 2012 and 2011 and 2010 respectively from affiliates and related parties) | | | 6,491 | | | | 2,480 | | | | 8,376 | |
Mortgage and loan interest (including $3,153 and $1,696 and $3,345 for the year ended 2012 and 2011 and 2010 respectively from affiliates and related parties) | | | (55,132 | ) | | | (51,886 | ) | | | (54,211 | ) |
| Loss on the sale of investments | | | (118 | ) | | | (514 | ) | | | - | |
| Earnings from unconsolidated subsidiaries and investees | | | (66 | ) | | | 242 | | | | (958 | ) |
| Total other expenses | | | (37,100 | ) | | | (43,958 | ) | | | (41,606 | ) |
| Loss before gain on land sales, non-controlling interest, and tax | | | (18,919 | ) | | | (69,942 | ) | | | (57,943 | ) |
| Gain (loss) on land sales | | | 6,935 | | | | 17,011 | | | | (15,155 | ) |
| Loss from continuing operations before tax | | | (11,984 | ) | | | (52,931 | ) | | | (73,098 | ) |
| Income tax benefit | | | 1,358 | | | | 2,215 | | | | 2,131 | |
| Net loss from continuing operations | | | (10,626 | ) | | | (50,716 | ) | | | (70,967 | ) |
| Discontinued operations: | | | | | | | | | | | | |
| Loss from discontinued operations | | | (1,337 | ) | | | (11,972 | ) | | | (4,829 | ) |
| Gain on sale of real estate from discontinued operations | | | 5,217 | | | | 18,300 | | | | 10,781 | |
| Income tax expense from discontinued operations | | | (1,358 | ) | | | (2,215 | ) | | | (2,083 | ) |
| Net income from discontinued operations | | | 2,522 | | | | 4,113 | | | | 3,869 | |
| Net loss | | | (8,104 | ) | | | (46,603 | ) | | | (67,098 | ) |
| Net (income) loss attributable to non-controlling interest | | | (220 | ) | | | 282 | | | | (98 | ) |
| Net loss attributable to Transcontinental Realty Investors, Inc. | | | (8,324 | ) | | | (46,321 | ) | | | (67,196 | ) |
| Preferred dividend requirement | | | (1,112 | ) | | | (1,110 | ) | | | (1,073 | ) |
| Net loss applicable to common shares | | $ | (9,436 | ) | | $ | (47,431 | ) | | $ | (68,269 | ) |
| | | | | | | | | | | | | |
| Earnings per share - basic | | | | | | | | | | | | |
| Loss from continuing operations | | $ | (1.42 | ) | | $ | (6.16 | ) | | $ | (8.89 | ) |
| Income from discontinued operations | | | 0.30 | | | | 0.49 | | | | 0.48 | |
| Net loss applicable to common shares | | $ | (1.12 | ) | | $ | (5.67 | ) | | $ | (8.41 | ) |
| Earnings per share - diluted | | | | | | | | | | | | |
| | | | | | | | | | | | | |
| Loss from continuing operations | | $ | (1.42 | ) | | $ | (6.16 | ) | | $ | (8.89 | ) |
| Income from discontinued operations | | | 0.30 | | | | 0.49 | | | | 0.48 | |
| Net loss applicable to common shares | | $ | (1.12 | ) | | $ | (5.67 | ) | | $ | (8.41 | ) |
| | | | | | | | | | | | | |
| Weighted average common share used in computing earnings per share | | | 8,413,469 | | | | 8,370,729 | | | | 8,113,575 | |
| Weighted average common share used in computing diluted earnings per share | | | 8,413,469 | | | | 8,370,729 | | | | 8,113,575 | |
| | | | | | | | | | | | | |
| | | | | | | | | | | | | |
| Amounts attributable to Transcontinental Realty Investors, Inc. | | | | | | | | | | | | |
| Loss from continuing operations | | $ | (10,833 | ) | | $ | (50,373 | ) | | $ | (71,065 | ) |
| Income (loss) from discontinued operations | | | 2,509 | | | | 4,052 | | | | 3,869 | |
| Net loss | | $ | (8,324 | ) | | $ | (46,321 | ) | | $ | (67,196 | ) |
| | | | | | | | | | | | | |
| | | | | | | | | | | | | |
| The accompanying notes are an integral part of these consolidated financial statements. | |
| TRANSCONTINENTAL REALTY INVESTORS, INC. | |
| CONSOLIDATED STATEMENTS OF SHAREHOLDERS’ EQUITY | |
| For the Three Years Ended December 31, 2012 | |
| (dollars in thousands) | |
| | | | | | | | | | | | | | | | | | | | | | | | | | | | | | | |
| | | | | | | | | | | | | | | | | | | | | | | | | | | Accumulated | | | | |
| | | | | | | | | | | | | | | | | | | | | | | | | | | Other | | | Non- | |
| | | | | | Comprehensive | | | Preferred | | | Common Stock | | | Treasury | | | Paid-in | | | Retained | | | Comprehensive | | | Controlling | |
| | | Total | | | Income (Loss) | | | Stock | | | Shares | | | Amount | | | Stock | | | Capital | | | Earnings | | | Income (Loss) | | | Interest | |
| Balance, December 31, 2009 | | $ | 245,416 | | | $ | (38,024 | ) | | $ | 1 | | | | 8,113,669 | | | $ | 81 | | | $ | - | | | $ | 262,118 | | | $ | (34,718 | ) | | $ | - | | | $ | 17,934 | |
| Series D preferred stock dividends (7% per year) | | | (863 | ) | | | - | | | | - | | | | - | | | | - | | | | - | | | | (863 | ) | | | - | | | | - | | | | - | |
| Series C preferred stock dividends (8.5% per year) | | | (210 | ) | | | - | | | | - | | | | - | | | | - | | | | - | | | | (210 | ) | | | - | | | | - | | | | - | |
| Net income (loss) | | | (67,098 | ) | | | (67,098 | ) | | | - | | | | - | | | | - | | | | - | | | | - | | | | (67,196 | ) | | | - | | | | 98 | |
| Sale of controlling interest | | | 49 | | | | - | | | | - | | | | - | | | | - | | | | - | | | | 27 | | | | - | | | | - | | | | 22 | |
| Acquisition of controlling interest | | | 6,202 | | | | - | | | | - | | | | - | | | | - | | | | - | | | | 10,610 | | | | - | | | | - | | | | (4,408 | ) |
| Distributions to non-controlling interests | | | (46 | ) | | | - | | | | - | | | | - | | | | - | | | | - | | | | - | | | | - | | | | - | | | | (46 | ) |
| Repurchase/sale of treasury shares, net | | | (2 | ) | | | | | | | - | | | | - | | | | - | | | | (2 | ) | | | - | | | | - | | | | - | | | | - | |
| Balance, December 31, 2010 | | $ | 183,448 | | | $ | (105,122 | ) | | $ | 1 | | | | 8,113,669 | | | $ | 81 | | | $ | (2 | ) | | $ | 271,682 | | | $ | (101,914 | ) | | $ | - | | | $ | 13,600 | |
| Series D preferred stock dividends (7% per year) | | | (900 | ) | | | - | | | | - | | | | - | | | | - | | | | - | | | | (900 | ) | | | - | | | | - | | | | - | |
| Series C preferred stock dividends (8.5% per year) | | | (210 | ) | | | - | | | | - | | | | - | | | | - | | | | - | | | | (210 | ) | | | - | | | | - | | | �� | - | |
| Net income (loss) | | | (46,603 | ) | | | (45,930 | ) | | | - | | | | - | | | | - | | | | - | | | | - | | | | (46,321 | ) | | | - | | | | (282 | ) |
| Issuance of common stock | | | 1,530 | | | | - | | | | - | | | | 300,000 | | | | 3 | | | | - | | | | 1,527 | | | | - | | | | - | | | | - | |
| Sale of controlling interest | | | 4,019 | | | | - | | | | - | | | | - | | | | - | | | | - | | | | 1,787 | | | | - | | | | - | | | | 2,232 | |
| Balance, December 31, 2011 | | $ | 141,284 | | | $ | (151,052 | ) | | $ | 1 | | | | 8,413,669 | | | $ | 84 | | | $ | (2 | ) | | $ | 273,886 | | | $ | (148,235 | ) | | $ | - | | | $ | 15,550 | |
| Series D preferred stock dividends (7% per year) | | | (902 | ) | | | - | | | | - | | | | - | | | | - | | | | - | | | | (902 | ) | | | - | | | | - | | | | - | |
| Series C preferred stock dividends (8.5% per year) | | | (210 | ) | | | - | | | | - | | | | - | | | | - | | | | - | | | | (210 | ) | | | - | | | | - | | | | - | |
| Net income (loss) | | | (8,104 | ) | | | (8,104 | ) | | | - | | | | - | | | | - | | | | - | | | | - | | | | (8,324 | ) | | | - | | | | 220 | |
| Issuance of common stock | | | - | | | | - | | | | - | | | | - | | | | - | | | | - | | | | - | | | | - | | | | - | | | | - | |
| Sale of controlling interest | | | 1,138 | | | | - | | | | - | | | | - | | | | - | | | | - | | | | - | | | | - | | | | - | | | | 1,138 | |
| Acquisition of controlling interest | | | (69 | ) | | | - | | | | - | | | | - | | | | - | | | | - | | | | - | | | | - | | | | - | | | | (69 | ) |
| Distributions to non-controlling interests | | | (8 | ) | | | - | | | | - | | | | - | | | | - | | | | - | | | | - | | | | - | | | | - | | | | (8 | ) |
| Repurchase/sale of treasury shares, net | | | - | | | | | | | | - | | | | - | | | | - | | | | - | | | | - | | | | - | | | | - | | | | - | |
| Balance, December 31, 2012 | | $ | 133,129 | | | $ | (159,156 | ) | | $ | 1 | | | | 8,413,669 | | | $ | 84 | | | $ | (2 | ) | | $ | 272,774 | | | $ | (156,559 | ) | | $ | - | | | $ | 16,831 | |
| | | | | | | | | | | | | | | | | | | | | | | | | | | | | | | | | | | | | | | | | |
| The accompanying notes are an integral part of these consolidated financial statements. | |
| TRANSCONTINENTAL REALTY INVESTORS, INC. | |
| CONSOLIDATED STATEMENTS OF CASH FLOWS | |
| | | | | | | | | | |
| | | | | | | | | | |
| | | For the Years Ended December 31, | |
| | | 2012 | | | 2011 | | | 2010 | |
| | | (dollars in thousands) | |
| Cash Flow From Operating Activities: | | | | | | | | | |
| Net loss | | $ | (8,104 | ) | | $ | (46,603 | ) | | $ | (67,098 | ) |
Adjustments to reconcile net loss applicable to common shares to net cash used in operating activities: | |
| (Gain) loss on sale of land | | | (6,935 | ) | | | (17,011 | ) | | | 15,155 | |
| Gain on sale of income producing properties | | | (5,217 | ) | | | (18,300 | ) | | | (10,781 | ) |
| Depreciation and amortization | | | 22,488 | | | | 23,034 | | | | 28,302 | |
| Provision on impairment of notes receivable and real estate assets | | | 4,730 | | | | 52,128 | | | | 24,502 | |
| Amortization of deferred borrowing costs | | | 2,428 | | | | 2,365 | | | | 2,613 | |
| Earnings due to non-controlling interest | | | - | | | | - | | | | - | |
| Earnings from unconsolidated subsidiaries and investees | | | 11 | | | | (695 | ) | | | 754 | |
| (Increase) decrease in assets: | | | | | | | | | | | | |
| Accrued interest receivable | | | (5,517 | ) | | | (4,050 | ) | | | (1,869 | ) |
| Other assets | | | 157 | | | | (799 | ) | | | 8,971 | |
| Prepaid expense | | | (236 | ) | | | 2,083 | | | | 551 | |
| Escrow | | | 1,157 | | | | 18,837 | | | | 8,476 | |
| Earnest money | | | 235 | | | | 1,385 | | | | 850 | |
| Rent receivables | | | (1,094 | ) | | | (6,158 | ) | | | (2,276 | ) |
| Increase (decrease) in liabilities: | | | | | | | | | | | | |
| Accrued interest payable | | | (7,498 | ) | | | 8,743 | | | | 1,764 | |
| Affiliate payables | | | (7,408 | ) | | | (29,795 | ) | | | (2,902 | ) |
| Other liabilities | | | (10,316 | ) | | | 717 | | | | (14,210 | ) |
| Net cash used in operating activities | | | (21,119 | ) | | | (14,119 | ) | | | (7,198 | ) |
| | | | | | | | | | | | | |
| Cash Flow From Investing Activities: | | | | | | | | | | | | |
| Proceeds from notes receivables | | | 11,993 | | | | 16,924 | | | | 3,967 | |
| Originations of notes receivables | | | 13,477 | | | | (22,421 | ) | | | (29,455 | ) |
| Acquisition of land held for development | | | (18,948 | ) | | | (43,193 | ) | | | (4,937 | ) |
| Acquisition of income producing properties | | | - | | | | 6,526 | | | | - | |
| Proceeds from sales of income producing properties | | | 31,751 | | | | 29,628 | | | | 119,123 | |
| Proceeds from sale of land | | | 36,648 | | | | 104,093 | | | | 44,419 | |
| Proceeds from sale of investments | | | 132 | | | | 586 | | | | - | |
| Investment in unconsolidated real estate entities | | | 780 | | | | (319 | ) | | | 458 | |
| Improvement of land held for development | | | (184 | ) | | | (1,562 | ) | | | (4,834 | ) |
| Improvement of income producing properties | | | (2,201 | ) | | | (3,657 | ) | | | (2,277 | ) |
| Acquisition of non-controlling interest | | | (69 | ) | | | - | | | | - | |
| Sale of controlling interest | | | 113 | | | | 4,019 | | | | 22 | |
| Investment in marketable equity securities | | | - | | | | - | | | | (89 | ) |
| Construction and development of new properties | | | (5,683 | ) | | | (46,774 | ) | | | (38,346 | ) |
| Net cash provided by investing activities | | | 67,809 | | | | 43,850 | | | | 88,051 | |
| | | | | | | | | | | | | |
| Cash Flow From Financing Activities: | | | | | | | | | | | | |
| Proceeds from notes payable | | | 139,459 | | | | 117,441 | | | | 182,849 | |
| Recurring amortization of principal on notes payable | | | (21,541 | ) | | | (16,383 | ) | | | (10,655 | ) |
| Payments on maturing notes payable | | | (163,553 | ) | | | (120,922 | ) | | | (242,795 | ) |
| Deferred financing costs | | | (3,305 | ) | | | (1,555 | ) | | | (3,539 | ) |
| Distributions to non-controlling interests | | | (8 | ) | | | - | | | | (46 | ) |
| Common stock issuance | | | - | | | | 1,530 | | | | - | |
| Preferred stock dividends - Series C | | | (212 | ) | | | (210 | ) | | | (210 | ) |
| Preferred stock dividends - Series D | | | (901 | ) | | | (900 | ) | | | (863 | ) |
| Net cash used in financing activities | | | (50,061 | ) | | | (20,999 | ) | | | (75,259 | ) |
| | | | | | | | | | | | | |
| Net increase (decrease) in cash and cash equivalents | | | (3,371 | ) | | | 8,732 | | | | 5,594 | |
| Cash and cash equivalents, beginning of period | | | 19,991 | | | | 11,259 | | | | 5,665 | |
| Cash and cash equivalents, end of period | | $ | 16,620 | | | $ | 19,991 | | | $ | 11,259 | |
| | | | | | | | | | | | | |
| | | | | | | | | | | | | |
| Supplemental disclosures of cash flow information: | | | | | | | | | | | | |
| Cash paid for interest | | $ | 44,737 | | | $ | 56,641 | | | $ | 61,439 | |
| Cash paid for income taxes, net of refunds | | $ | - | | | $ | - | | | $ | (48 | ) |
| | | | | | | | | | | | | |
| Schedule of noncash investing and financing activities: | | | | | | | | | | | | |
| Affiliate payable/receivable for ARL cost basis sales adjustment | | $ | 10,445 | | | $ | (34,234 | ) | | $ | - | |
| Acquisition of land for ARL cost basis sales adjustment | | $ | (10,445 | ) | | $ | 34,234 | | | $ | - | |
| Note receivable allowance | | $ | - | | | $ | - | | | $ | (1,937 | ) |
| Notes receivable received from affiliate | | $ | 6,000 | | | $ | 20,387 | | | $ | 28,554 | |
| Sale of notes receivable to affiliate | | $ | (20,387 | ) | | $ | - | | | $ | - | |
| | | | | | | | | | | | | |
| The accompanying notes are an integral part of these consolidated financial statements. | | | | | |
| TRANSCONTINENTAL REALTY INVESTORS, INC. | |
| STATEMENTS OF CONSOLIDATED COMPREHENSIVE INCOME (LOSS) | |
| For the Three Years Ended December 31, | |
| | | | | | | | | | |
| | | 2012 | | | 2011 | | | 2010 | |
| | | (dollars in thousands) | |
| | | | | | | | | | |
| Net loss | | $ | (8,104 | ) | | $ | (46,603 | ) | | $ | (67,098 | ) |
| Other comprehensive loss | | | | | | | | | | | | |
| Unrealized gain on investment securities | | | - | | | | - | | | | - | |
| Total other comprehensive loss | | | - | | | | - | | | | - | |
| Comprehensive loss | | | (8,104 | ) | | | (46,603 | ) | | | (67,098 | ) |
| Comprehensive (income) loss attributable to non-controlling interest | | | (220 | ) | | | 282 | | | | (98 | ) |
| Comprehensive loss attributable to Transcontinental Realty Investors, Inc. | | $ | (8,324 | ) | | $ | (46,321 | ) | | $ | (67,196 | ) |
| | | | | | | | | | | | | |
| | | | | | | | | | | | | |
| The accompanying notes are an integral part of these consolidated financial statements. | |
TRANSCONTINENTAL REALTY INVESTORS, INC.
CONSOLIDATED BALANCE SHEETS
| | | | | | | | |
| | | December 31,
2009 | | | December 31,
2008 | |
| | | (dollars in thousands, except
share and par value amounts) | |
Assets | | | | | | | | |
Real estate, at cost | | $ | 1,520,043 | | | $ | 1,526,016 | |
Real estate held for sale at cost, net of depreciation ($1,252 and $0 for 2009 and 2008) | | | 5,147 | | | | 8,018 | |
Real estate subject to sales contracts at cost, net of depreciation ($13,985 for 2009 and $12,226 for 2008) | | | 59,048 | | | | 60,807 | |
Less accumulated depreciation | | | (137,054 | ) | | | (114,050 | ) |
| | | | | | | | |
Total real estate | | | 1,447,184 | | | | 1,480,791 | |
Notes and interest receivable | | | | | | | | |
Performing (including $39,703 in 2009 and $17,323 in 2008 from affiliates and related parties) | | | 48,051 | | | | 42,413 | |
Less allowance for estimated losses | | | (2,804 | ) | | | (3,293 | ) |
| | | | | | | | |
Total notes and interest receivable | | | 45,247 | | | | 39,120 | |
Cash and cash equivalents | | | 5,665 | | | | 5,983 | |
Investments in securities | | | — | | | | 2,775 | |
Investments in unconsolidated subsidiaries and investees | | | 9,358 | | | | 23,365 | |
Other assets (including $0 in 2009 and $1,077 in 2008 from affiliates and related parties) | | | 100,833 | | | | 88,033 | |
| | | | | | | | |
Total assets | | $ | 1,608,287 | | | $ | 1,640,067 | |
| | | | | | | | |
Liabilities and Shareholders’ Equity | | | | | | | | |
Liabilities: | | | | | | | | |
Notes and interest payable (including $0 in 2009 and $9,103 in 2008 to affiliates and related parties) | | $ | 1,121,737 | | | $ | 1,100,852 | |
Notes related to assets held-for-sale | | | 5,002 | | | | 4,191 | |
Notes related to subject to sales contracts | | | 61,886 | | | | 62,972 | |
Affiliate payables | | | 50,163 | | | | 62,367 | |
Accounts payable and other liabilities (including $35,903 in 2009 and $0 in 2008 from affiliates and related parties) | | | 124,083 | | | | 84,989 | |
| | | | | | | | |
| | | 1,362,871 | | | | 1,315,371 | |
Commitments and contingencies: | | | | | | | | |
Shareholders’ equity: | | | | | | | | |
Preferred Stock, Series C: $.01 par value, authorized 10,000,000 shares, issued and outstanding 30,000 shares in 2009 and 2008 respectively (liquidation preference $100 per share). Series D: $.01 par value, authorized, issued and outstanding 100,000 shares in 2009 and 2008 respectively | | | 1 | | | | 1 | |
Common Stock, $.01 par value, authorized 10,000,000 shares; issued and outstanding 8,113,669 for 2009 and 2008 | | | 81 | | | | 81 | |
Paid-in capital | | | 262,118 | | | | 263,290 | |
Retained earnings | | | (34,718 | ) | | | 44,980 | |
Accumulated other comprehensive income | | | — | | | | 2,575 | |
| | | | | | | | |
Total Transcontinental Realty Investors, Inc. shareholders’ equity | | | 227,482 | | | | 310,927 | |
Non-controlling interest | | | 17,934 | | | | 13,769 | |
| | | | | | | | |
Total equity | | | 245,416 | | | | 324,696 | |
| | | | | | | | |
Total liabilities and equity | | $ | 1,608,287 | | | $ | 1,640,067 | |
| | | | | | | | |
The accompanying notes are an integral part of these consolidated financial statements.
TRANSCONTINENTAL REALTY INVESTORS, INC.
CONSOLIDATED STATEMENTS OF OPERATIONS
| | | | | | | | | | | | |
| | | For the Years Ended December 31, | |
| | | 2009 | | | 2008 | | | 2007 | |
| | | (dollars in thousands, except share and per share amounts) | |
Revenues: | | | | | | | | | | | | |
Rental and other property revenues (including $3,115 and $2,753 and $2,211 for the year ended 2009 and 2008 and 2007 respectively from affiliates and related parties) | | $ | 151,647 | | | $ | 138,337 | | | $ | 123,704 | |
Expenses: | | | | | | | | | | | | |
Property operating expenses (including $2,081 and $1,938 and $1,939 for year ended 2009 and 2008 and 2007 respectively from affiliates and related parties) | | | 85,087 | | | | 86,237 | | | | 74,294 | |
Depreciation and amortization | | | 29,098 | | | | 24,377 | | | | 21,118 | |
General and administrative (including $3,733 and $4,372 and $3,409 for the year ended 2009 and 2008 and 2007 respectively from affiliates and related parties) | | | 11,063 | | | | 10,349 | | | | 8,515 | |
Provision on impairment of notes receivable and real estate assets | | | 42,513 | | | | 7,417 | | | | 3,686 | |
Advisory fee to affiliate | | | 11,903 | | | | 12,064 | | | | 10,704 | |
| | | | | | | | | | | | |
Total operating expenses | | | 179,664 | | | | 140,444 | | | | 118,317 | |
| | | | | | | | | | | | |
Operating income (loss) | | | (28,017 | ) | | | (2,107 | ) | | | 5,387 | |
Other income (expense): | | | | | | | | | | | | |
Interest income (including $4,265 and $1,052 and $3,600 for the year ended 2009 and 2008 and 2007 respectively from affiliates and related parties) | | | 5,407 | | | | 3,227 | | | | 2,730 | |
Other income | | | 3,631 | | | | 3,918 | | | | 2,278 | |
Mortgage and loan interest (including $2,566 and $2,729 and $603 for the year ended 2009 and 2008 and 2007 respectively from affiliates and related parties) | | | (70,157 | ) | | | (73,053 | ) | | | (65,813 | ) |
Earnings from unconsolidated subsidiaries and investees | | | (451 | ) | | | (1,096 | ) | | | 1,502 | |
Involuntary conversion | | | — | | | | — | | | | 34,771 | |
Litigation Settlement | | | 356 | | | | — | | | | — | |
| | | | | | | | | | | | |
Total other expenses | | | (61,214 | ) | | | (67,004 | ) | | | (24,532 | ) |
| | | | | | | | | | | | |
Loss before gain on land sales, non-controlling interest, and tax | | | (89,231 | ) | | | (69,111 | ) | | | (19,145 | ) |
Gain on land sales | | | 6,296 | | | | 4,798 | | | | 11,956 | |
| | | | | | | | | | | | |
Loss from continuing operations before tax | | | (82,935 | ) | | | (64,313 | ) | | | (7,189 | ) |
Income tax benefit (expense) | | | 1,180 | | | | 33,441 | | | | 8,186 | |
| | | | | | | | | | | | |
Net income (loss) from continuing operations | | | (81,755 | ) | | | (30,872 | ) | | | 997 | |
| | | | | | | | | | | | |
Discontinued operations: | | | | | | | | | | | | |
Loss from discontinued operations | | | (162 | ) | | | (8,368 | ) | | | (5,435 | ) |
Gain on sale of real estate from discontinued operations | | | 3,524 | | | | 104,411 | | | | 20,919 | |
Income tax expense from discontinued operations | | | (1,180 | ) | | | (33,616 | ) | | | (5,420 | ) |
| | | | | | | | | | | | |
Net income (loss) | | | (79,573 | ) | | | 31,555 | | | | 11,061 | |
Net income (loss) attributable to non-controlling interest | | | (125 | ) | | | 654 | | | | 50 | |
| | | | | | | | | | | | |
Net income (loss) attributable to Transcontinental Realty
Investors, Inc. | | | (79,698 | ) | | | 32,209 | | | | 11,111 | |
Preferred dividend requirement | | | (1,023 | ) | | | (975 | ) | | | (925 | ) |
| | | | | | | | | | | | |
Net income (loss) applicable to common shares | | $ | (80,721 | ) | | $ | 31,234 | | | $ | 10,186 | |
| �� | | | | | | | | | | | |
Earnings per share—basic | | | | | | | | | | | | |
Gain (loss) from continuing operations | | $ | (10.22 | ) | | $ | (3.86 | ) | | $ | 0.02 | |
Discontinued operations | | | 0.27 | | | | 7.72 | | | | 1.26 | |
| | | | | | | | | | | | |
Net income (loss) applicable to common shares | | $ | (9.95 | ) | | $ | 3.86 | | | $ | 1.28 | |
| | | | | | | | | | | | |
Earnings per share—diluted | | | | | | | | | | | | |
Gain (loss) from continuing operations | | $ | (10.22 | ) | | $ | (3.86 | ) | | $ | 0.01 | |
Discontinued operations | | | 0.27 | | | | 7.72 | | | | 1.23 | |
| | | | | | | | | | | | |
Net income (loss) applicable to common shares | | $ | (9.95 | ) | | $ | 3.86 | | | $ | 1.24 | |
| | | | | | | | | | | | |
Weighted average common share used in computing earnings per share | | | 8,113,669 | | | | 8,086,640 | | | | 7,953,676 | |
Weighted average common share used in computing diluted earnings per share | | | 8,113,669 | | | | 8,086,640 | | | | 8,188,602 | |
| | | |
Amounts attributable to Transcontinental Realty Investors, Inc. | | | | | | | | | | | | |
Income (loss) from continuing operations | | $ | (81,755 | ) | | $ | (30,872 | ) | | $ | 997 | |
Income from discontinued operations | | | 2,182 | | | | 62,427 | | | | 10,064 | |
| | | | | | | | | | | | |
Net income (loss) | | $ | (79,573 | ) | | $ | 31,555 | | | $ | 11,061 | |
| | | | | | | | | | | | |
The accompanying notes are an integral part of these consolidated financial statements.
TRANSCONTINENTAL REALTY INVESTORS, INC.
CONSOLIDATED STATEMENTS OF SHAREHOLDERS’ EQUITY
For the Three Years Ended December 31, 2009
| | | | | | | | | | | | | | | | | | | | | | | | | | | | | | | | | | | | | |
| | | Total | | | Comprehensive
Income (Loss) | | | Preferred
Stock | | Common Stock | | Treasury
Stock | | | Paid-in
Capital | | | Retained
Earnings | | | Accumulated
Other
Comprehensive
Income (Loss) | | | Non-Controlling
Interest | |
| | | | | Shares | | Amount | | | | | |
| | | (dollars in thousands) | |
Balance, December 31, 2006 | | $ | 282,095 | | | $ | — | | | $ | 1 | | | 8,113,669 | | $ | 81 | | $ | (3,086 | ) | | $ | 266,206 | | | $ | 1,660 | | | $ | 1,067 | | | $ | 16,166 | |
Unrealized loss on foreign currency translation | | | 3,388 | | | | 3,388 | | | | | | | | | | | | | | | | | | | | | | | | | 3,388 | | | | | |
Unrealized gain on investment securities | | | (5,983 | ) | | | (5,983 | ) | | | — | | | — | | | — | | | — | | | | — | | | | — | | | | (5,983 | ) | | | — | |
Series D preferred stock dividends (7% per year) | | | (715 | ) | | | — | | | | — | | | — | | | — | | | — | | | | (715 | ) | | | — | | | | — | | | | — | |
Series C preferred stock dividends | | | (210 | ) | | | — | | | | — | | | — | | | — | | | — | | | | (210 | ) | | | — | | | | — | | | | — | |
Net income (loss) | | | 11,061 | | | | 11,061 | | | | — | | | — | | | — | | | — | | | | — | | | | 11,111 | | | | — | | | | (50 | ) |
Changes in controlling interest | | | — | | | | — | | | | — | | | — | | | — | | | — | | | | — | | | | — | | | | — | | | | — | |
Changes in non-controlling interest | | | (5,043 | ) | | | — | | | | — | | | — | | | — | | | — | | | | 9,452 | | | | — | | | | — | | | | (14,495 | ) |
Repurchase/sale of treasury shares, net | | | 2,509 | | | | — | | | | — | | | — | | | — | | | 2,509 | | | | — | | | | — | | | | — | | | | — | |
| | | | | | | | | | | | | | | | | | | | | | | | | | | | | | | | | | | | | |
Balance, December 31, 2007 | | $ | 287,102 | | | $ | 8,466 | | | $ | 1 | | | 8,113,669 | | $ | 81 | | $ | (577 | ) | | $ | 274,733 | | | $ | 12,771 | | | $ | (1,528 | ) | | $ | 1,621 | |
| | | | | | | | | | | | | | | | | | | | | | | | | | | | | | | | | | | | | |
Unrealized loss on foreign currency translation | | | 9,685 | | | | 9,685 | | | | | | | | | | | | | | | | | | | | | | | | | 9,685 | | | | | |
Unrealized gain on investment securities | | | (5,582 | ) | | | (5,582 | ) | | | — | | | — | | | — | | | — | | | | — | | | | — | | | | (5,582 | ) | | | — | |
Series D preferred stock dividends (7% per year) | | | (765 | ) | | | — | | | | — | | | — | | | — | | | — | | | | (765 | ) | | | — | | | | — | | | | — | |
Series C preferred stock dividends | | | (210 | ) | | | — | | | | — | | | — | | | — | | | — | | | | (210 | ) | | | — | | | | — | | | | — | |
Net income (loss) | | | 31,555 | | | | 31,555 | | | | — | | | — | | | — | | | — | | | | — | | | | 32,209 | | | | — | | | | (654 | ) |
Changes in controlling interest | | | — | | | | — | | | | — | | | — | | | — | | | — | | | | — | | | | — | | | | — | | | | — | |
Changes in non-controlling interest | | | 2,334 | | | | — | | | | — | | | — | | | — | | | — | | | | (10,468 | ) | | | — | | | | — | | | | 12,802 | |
Repurchase/sale of treasury shares, net | | | 577 | | | | — | | | | — | | | — | | | — | | | 577 | | | | — | | | | — | | | | — | | | | — | |
| | | | | | | | | | | | | | | | | | | | | | | | | | | | | | | | | | | | | |
Balance, December 31, 2008 | | $ | 324,696 | | | $ | 35,658 | | | $ | 1 | | $ | 8,113,669 | | $ | 81 | | $ | — | | | $ | 263,290 | | | $ | 44,980 | | | $ | 2,575 | | | $ | 13,769 | |
| | | | | | | | | | | | | | | | | | | | | | | | | | | | | | | | | | | | | |
Unrealized gain on investment securities | | | (2,575 | ) | | | (2,575 | ) | | | — | | | — | | | — | | | — | | | | — | | | | — | | | | (2,575 | ) | | | | |
Series D preferred stock dividends (7% per year) | | | (813 | ) | | | — | | | | — | | | — | | | — | | | — | | | | (813 | ) | | | — | | | | — | | | | — | |
Series C preferred stock dividends | | | (210 | ) | | | — | | | | — | | | — | | | — | | | — | | | | (210 | ) | | | — | | | | — | | | | — | |
Net income (loss) | | | (79,573 | ) | | | (79,573 | ) | | | — | | | — | | | — | | | — | | | | — | | | | (79,698 | ) | | | — | | | | 125 | |
Changes in controlling interest | | | (149 | ) | | | — | | | | — | | | — | | | — | | | — | | | | (149 | ) | | | — | | | | — | | | | — | |
Changes in non-controlling interest | | | 4,040 | | | | — | | | | — | | | — | | | — | | | — | | | | — | | | | — | | | | — | | | | 4,040 | |
| | | | | | | | | | | | | | | | | | | | | | | | | | | | | | | | | | | | | |
Balance, December 31, 2009 | | $ | 245,416 | | | $ | (82,148 | ) | | $ | 1 | | $ | 8,113,669 | | $ | 81 | | $ | — | | | $ | 262,118 | | | | $(34,718 | ) | | $ | — | | | $ | 17,934 | |
| | | | | | | | | | | | | | | | | | | | | | | | | | | | | | | | | | | | | |
The accompanying notes are an integral part of these consolidated financial statements.
TRANSCONTINENTAL REALTY INVESTORS, INC.
CONSOLIDATED STATEMENTS OF CASH FLOWS
| | | | | | | | | | | | |
| | | For the Years Ended December 31, | |
| | | 2009 | | | 2008 | | | 2007 | |
| | | (dollars in thousands) | |
Cash Flow From Operating Activities: | | | | | | | | | | | | |
Net (loss) income applicable to common shares | | $ | (80,721 | ) | | $ | 31,234 | | | $ | 10,186 | |
Adjustments to reconcile net loss applicable to common shares to net cash used in operating activities: | | | | | | | | | | | | |
Gain on sale of land | | | (6,296 | ) | | | (4,798 | ) | | | (11,956 | ) |
Depreciation and amortization | | | 29,813 | | | | 25,228 | | | | 25,459 | |
Provision on impairment of notes receivable and real estate assets | | | 42,513 | | | | 7,417 | | | | 1,317 | |
Amortization of deferred borrowing costs | | | 3,698 | | | | 7,110 | | | | 4,876 | |
Changes in non-controlling interest | | | 4,165 | | | | (654 | ) | | | (50 | ) |
Earnings from unconsolidated subsidiaries and investees | | | 287 | | | | (5,210 | ) | | | (1,502 | ) |
Gain on sale of income producing properties | | | (3,524 | ) | | | (104,411 | ) | | | (20,919 | ) |
(Increase) decrease in assets: | | | | | | | | | | | | |
Accrued interest receivable | | | 2,018 | | | | (1,749 | ) | | | (420 | ) |
Other assets | | | (2,783 | ) | | | 395 | | | | 2,753 | |
Prepaid expense | | | (494 | ) | | | (1,182 | ) | | | (2,496 | ) |
Escrow | | | (3,222 | ) | | | (21,758 | ) | | | (2,018 | ) |
Earnest money | | | (1,723 | ) | | | 1,618 | | | | 9,149 | |
Rent receivables | | | (422 | ) | | | (819 | ) | | | (1,271 | ) |
Increase (decrease) in liabilities: | | | | | | | | | | | | |
Accrued interest payable | | | (2,217 | ) | | | (2,983 | ) | | | (462 | ) |
Cash invested with Advisor | | | (12,204 | ) | | | 62,367 | | | | (6,614 | ) |
Other liabilities | | | 3,526 | | | | 28,602 | | | | (6,150 | ) |
| | | | | | | | | | | | |
Net cash provided by (used in) operating activities | | | (27,586 | ) | | | 20,407 | | | | (118 | ) |
| | | |
Cash Flow From Investing Activities: | | | | | | | | | | | | |
Proceeds from notes receivables ($3,940 in 2009, $0 in 2008 from affiliates) | | | 8,000 | | | | (4,487 | ) | | | 13,812 | |
Acquisition of land held for development | | | (11,844 | ) | | | (54,744 | ) | | | (24,940 | ) |
Proceeds from sales of income producing properties | | | 34,647 | | | | 162,859 | | | | 40,458 | |
Proceeds from sale of land | | | 36,289 | | | | 16,382 | | | | 59,699 | |
Investment in unconsolidated real estate entities | | | 16,495 | | | | 14,586 | | | | 1,115 | |
Improvement of land held for development | | | (10,115 | ) | | | (1,789 | ) | | | (2,859 | ) |
Improvement of income producing properties | | | (2,220 | ) | | | (15,547 | ) | | | (12,890 | ) |
Acquisition of non-controlling interest | | | — | | | | 12,148 | | | | 2,884 | |
Investment in marketable equity securities | | | 2,775 | | | | — | | | | — | |
Acquisition of income producing properties | | | (5,971 | ) | | | (64,466 | ) | | | (114,258 | ) |
Construction and development of new properties | | | (26,134 | ) | | | (130,151 | ) | | | (193,864 | ) |
| | | | | | | | | | | | |
Net cash provided by (used in) investing activities | | | 41,922 | | | | (65,209 | ) | | | (230,843 | ) |
| | | |
Cash Flow From Financing Activities: | | | | | | | | | | | | |
Proceeds from notes payable | | | 55,508 | | | | 190,444 | | | | 431,168 | |
Recurring amortization of principal on notes payable | | | (18,588 | ) | | | (17,111 | ) | | | — | |
Payments on maturing notes payable | | | (49,522 | ) | | | (140,202 | ) | | | (183,188 | ) |
Deferred financing costs | | | (2,052 | ) | | | 5,838 | | | | (10,006 | ) |
Repurchase of common stock | | | — | | | | 577 | | | | (577 | ) |
| | | | | | | | | | | | |
Net cash provided by financing activities | | | (14,654 | ) | | | 39,546 | | | | 237,397 | |
| | | | | | | | | | | | |
Net decrease in cash and cash equivalents | | | (318 | ) | | | (5,256 | ) | | | 6,436 | |
Cash and cash equivalents, beginning of period | | | 5,983 | | | | 11,239 | | | | 4,803 | |
| | | | | | | | | | | | |
Cash and cash equivalents, end of period | | $ | 5,665 | | | $ | 5,983 | | | $ | 11,239 | |
| | | | | | | | | | | | |
Supplemental disclosures of cash flow information: | | | | | | | | | | | | |
Cash paid for interest | | $ | 71,868 | | | $ | 77,247 | | | $ | 76,847 | |
Cash paid for income taxes, net of refunds | | $ | — | | | $ | — | | | $ | — | |
| | | |
Schedule of noncash investing and financing activities: | | | | | | | | | | | | |
Unrealized foreign currency translation gain | | $ | — | | | $ | 9,685 | | | $ | 3,388 | |
Unrealized loss on marketable securities | | $ | (2,575 | ) | | $ | (5,582 | ) | | $ | (5,983 | ) |
Note receivable allowance | | $ | — | | | $ | (1,500 | ) | | $ | — | |
Notes receivable received from affiliate | | $ | 2,341 | | | $ | — | | | $ | 3,353 | |
Note paydown from right to build sale | | $ | 1,500 | | | $ | — | | | $ | (900 | ) |
Acquisition of real estate to satisfy note receivable | | $ | (7,748 | ) | | $ | — | | | $ | — | |
The accompanying notes are an integral part of these consolidated financial statements.
TRANSCONTINENTAL REALTY INVESTORS, INC.
STATEMENTS OF CONSOLIDATED COMPREHENSIVE INCOME (LOSS)
For the Years Ended December 31, 2009
| | | | | | | | | | | | |
| | | 2009 | | | 2008 | | | 2007 | |
Net income (loss) | | $ | (79,573 | ) | | $ | 31,555 | | | $ | 11,061 | |
Other comprehensive income (loss) | | | | | | | | | | | | |
Unrealized loss on foreign currency translation | | | — | | | | 9,685 | | | | 3,388 | |
Unrealized gain on investment securities | | | (2,575 | ) | | | (5,582 | ) | | | (5,983 | ) |
| | | | | | | | | | | | |
Total other comprehensive income (loss) | | | (2,575 | ) | | | 4,103 | | | | (2,595 | ) |
| | | | | | | | | | | | |
Comprehensive income (loss) | | | (82,148 | ) | | | 35,658 | | | | 8,466 | |
Comprehensive income attributable to non-controlling interest | | | (125 | ) | | | 654 | | | | 50 | |
| | | | | | | | | | | | |
Comprehensive income (loss) attributable to Transcontinental Realty Investors, Inc. | | $ | (82,273 | ) | | $ | 36,312 | | | $ | 8,516 | |
| | | | | | | | | | | | |
The accompanying notes are an integral part of these consolidated financial statements.
TRANSCONTINENTAL REALTY INVESTORS, INC.
NOTES TO FINANCIAL STATEMENTS
The accompanying Consolidated Financial Statements of Transcontinental Realty Investors, Inc. and consolidated entities have been prepared in conformity with accounting principles generally accepted in the United States of America, the most significant of which are described in Note 1. “Summary of Significant Accounting Policies.” The Notes to Consolidated Financial Statements are an integral part of the Consolidated Financial Statements. The data presented in the Notes to Consolidated Financial Statements are as of December 31 of each year and for the year then ended, unless otherwise indicated. Dollar amounts in tables are in thousands, except per share amounts.
Certain balances for
20072010 and
20082011 have been reclassified to conform to the
20092012 presentation.
NOTE 1. ORGANIZATION AND SUMMARY OF SIGNIFICANT ACCOUNTING POLICIES NOTE 1. ORGANIZATION
| AND SUMMARY OF SIGNIFICANT ACCOUNTING POLICIES |
Organization and business. TCI, a Nevada corporation, is successor to a California business trust which was organized on September 6, 1983, and commenced operations on January 31, 1984. Effective March 31, 2003, TCI financial results were consolidated in the ARL Form 10-K and related consolidated financial statements. TCI invests in real estate through direct ownership, leases and partnerships and it also invests in mortgage loans on real estate. At December 31, 2009, we owned 55 residential apartment communities comprising of 11,354 units, two apartment projects in development, 28 commercial properties comprising an aggregate of approximately 5.1 million square feet, and an investment in 6,813 acres of undeveloped and partially developed land.
The Company is headquartered in Dallas, Texas and its Common Stock trades on the New York Stock Exchange under the symbol (“NYSE: TCI”). Subsidiaries of American Realty Investors, Inc. own approximately 84% of the Company’s Common Stock (“NYSE: ARL”). Prime Income Asset Management, LLC (“Prime”) is the Company’s external advisor. Regis Realty I, LLC, an affiliate of Prime, manages the Company’s commercial properties. Regis Hotel I, LLC, another Prime affiliate, manages the Company’s hotel investments. TCI engages four third-party companies to lease and manage its apartment properties. TCI is a “C Corporation” for U.S. federal income tax purposes and files an annual consolidated income tax return with ARL.
On July 17, 2009, the Company acquired from Syntek West, Inc., (“SWI”), 2,518,934 shares of Common Stock, par value $0.01 per share of IOT at an aggregate price of $17,884,431 (approximately $7.10 per share), the full amount of which was paid by the Company through an assumption of an aggregate amount of indebtedness of $17,884,431 on the outstanding balance owed by SWI to IOT. The 2,518,934 shares of IOT Common Stock acquired by the Company constituted approximately 60.4% of the issued and outstanding Common Stock of IOT. The Company has owned for several years an aggregate of 1,037,184 shares of Common Stock of IOT (approximately 25% of the issued and outstanding). After giving effect to the transaction on July 17, 2009, the Company owns an aggregate of 3,556,118 shares of IOT Common Stock which constitutes approximately 85.3% of the shares of Common Stock of IOT outstanding (which is a total of 4,168,214 shares). Shares of IOT are traded on the American Stock Exchange.
With the Company’s acquisition of the additional shares on July 17, 2009, which increased the aggregate ownership to in excess of 80%, beginning in July 2009, IOT’s results of operations are now consolidated with those of the Company for tax and financial reporting purposes. At the time of the acquisition, the historical accounting value of IOT’s assets was $112 million and liabilities were $43 million. In that the shares of IOT acquired by TCI were from a related party, the values recorded by TCI are IOT’s historical accounting values at the date of transfer. The Company’s fair valuation of IOT assets and liabilities at the acquisition date approximated IOT’s book value. The net difference between the purchase price and historical accounting basis of the assets and liabilities acquired was $35 million and has been reflected by TCI as deferred income. The deferred income will be recognized upon the sale of the land that IOT held on its books as of the date of sale, to an independent third party.
TRANSCONTINENTAL REALTY INVESTORS, INC.
NOTES TO FINANCIAL STATEMENTS—(Continued)
FASB Accounting Standards Codification.The companyCompany presents its financial statements in accordance with generally accepted accounting principles in the United States (“GAAP”). In June 2009, the Financial Accounting Standards Board (“FASB”) completed its accounting guidance codification project. The FASB Accounting Standards Codification (“ASC”) became effective for the Company’s financial statements issued subsequent to June 30, 2009 and is the single source of authoritative accounting principles recognized by the FASB to be applied by nongovernmental entities in the preparation of financial statements in conformity with GAAP. As of the effective date, the company will no longer refer to the authoritative guidance dictating its accounting methodologies under the previous accounting standards hierarchy. Instead, the Company will referrefers to the ASC Codification as the sole source of authoritative literature.
Organization and business. Transcontinental Realty Investors, Inc., a Nevada corporation, is headquartered in Dallas, Texas and its common stock trades on the New York Stock Exchange (“NYSE”) under the symbol (“TCI”). TCI is the successor to a California business trust that was organized on September 6, 1983 and commenced operations on January 31, 1984. On November 30, 1999, TCI acquired all of the outstanding shares of beneficial interest of Continental Mortgage and Equity Trust (“CMET”), a real estate company, in a tax-free exchange of shares, issuing 1,181 shares of its common stock for each outstanding CMET share. Prior to January 1, 2000, TCI elected to be treated as a Real Estate Investment Trust (“REIT”) under Sections 856 through 860 of the Internal Revenue Code of 1986, as amended (the “Code”). During the third quarter of 2000, due to a concentration of ownership TCI no longer met the requirement for tax treatment as a REIT. Effective March 31, 2003, TCI’s financial results were consolidated in the American Realty Investors, Inc. (“ARL”) Form 10-K and related consolidated financial statements.
TCI is a “C” corporation for U.S. federal income tax purposes and files an annual consolidated income tax return with ARL, whose common stock is traded on the New York Stock Exchange under the symbol (“ARL”). Subsidiaries of ARL own approximately 83.8% of the Company’s common stock.
On July 17, 2009, the Company acquired an additional 2,518,934 shares of common stock of Income Opportunity Realty Investors, Inc. (“IOT”), and in doing so, increased its ownership from approximately 25% to over 80% of the shares of common stock of IOT outstanding. Upon acquisition of the additional shares in 2009, IOT’s results of operations began consolidating with those of the Company for tax and financial reporting purposes. As of December 31, 2012 TCI owned 81.1% of the outstanding IOT common shares. Shares of IOT are traded on the New York Euronext Exchange (“NYSE MKT”) under the symbol (“IOT”).
At the time of the acquisition, the historical accounting value of IOT’s assets was $112 million and liabilities were $43 million. In that the shares of IOT acquired by TCI were from a related party, the values recorded by TCI are IOT’s historical accounting values at the date of transfer. The Company’s fair valuation of IOT’s assets and liabilities at the acquisition date approximated IOT’s book value. The net difference between the purchase price and historical accounting basis of the assets and liabilities acquired was $26.9 million and has been reflected by TCI as deferred income. The deferred income will be recognized upon the sale of the land that IOT held on its books as of the date of sale, to an independent third party.
TCI’s Board of Directors is responsible for directing the overall affairs of TCI and for setting the strategic policies that guide the Company. As of April 30, 2011, the Board of Directors delegated the day-to-day management of the Company to Pillar Income Asset Management, Inc., a Nevada corporation (“Pillar”) under a written Advisory Agreement that is reviewed annually by TCI’s Board of Directors. The directors of TCI are also directors of ARL and IOT. The Chairman of the Board of Directors of TCI also serves as the Chairman of the Board of Directors of ARL and IOT. The officers of TCI also serve as officers of ARL, IOT and Pillar.
Effective since April 30, 2011, Pillar, the sole shareholder of which is Realty Advisors, LLC, a Nevada limited liability company, the sole member of which is Realty Advisors, Inc., a Nevada corporation, the sole shareholder of which is Realty Advisors Management, Inc., a Nevada corporation, the sole shareholder of which is a trust known as the May Trust, became the Company’s external Advisor and Cash Manager. Pillar’s duties include, but are not limited to, locating, evaluating and recommending real estate and real estate-related investment opportunities. Pillar also arranges, for the Company’s benefit, debt and equity financing with third party lenders and investors. Pillar also serves as an Advisor and Cash Manager to TCI and IOT. As the contractual advisor, Pillar is compensated by TCI under an Advisory Agreement that is more fully described in Part III, Item 10. “Directors, Executive Officers and Corporate Governance – The Advisor”. TCI has no employees. Employees of Pillar render services to TCI in accordance with the terms of the Advisory Agreement. Prime Income Asset Management, LLC (“Prime”) served as the Company’s contractual Advisor prior to April 30, 2011.
Effective since January 1, 2011, Regis Realty Prime, LLC, dba Regis Property Management, LLC (“Regis”), the sole member of which is Realty Advisors, LLC, manages our commercial properties and provides brokerage services. Regis receives property management fees and leasing commissions in accordance with the terms of its property-level management agreement. Regis is also entitled to receive real estate brokerage commissions in accordance with the terms of a non-exclusive brokerage agreement. See Part III, Item 10. “Directors, Executive Officers and Corporate Governance – Property Management and Real Estate Brokerage”. Prior to December 31, 2010, Triad Realty Services, L.P. (“Triad”), provided management services for our commercial properties. Triad subcontracted the property-level management and leasing of our commercial properties (office buildings, shopping centers and industrial warehouses) to Regis Realty I, LLC (“Regis I”). TCI engages third-party companies to lease and manage its apartment properties.
The Company has a development agreement with Unified Housing Foundation, Inc. (“UHF”) a non-profit corporation that provides management services for the development of residential apartment projects in the future. The Company has also invested in surplus cash notes receivables from UHF and has sold several residential apartment properties to UHF in prior years. Due to this ongoing relationship and the significant investment in the performance of the collateral secured under the notes receivable, UHF has been determined to be a related party.
Our primary business is the acquisition, development and ownership of income-producing residential and commercial real estate properties. In addition, we opportunistically acquire land for future development in in-fill or high-growth suburban markets. From time to time and when we believe it appropriate to do so, we will also sell land and income-producing properties. We generate revenues by leasing apartment units to residents and leasing office, industrial and retail space to various for-profit businesses as well as certain local, state and federal agencies. We also generate revenues from gains on sales of income-producing properties and land. At December 31, 2012, we owned 47 residential apartment communities comprising of 8,553 units, 13 commercial properties comprising an aggregate of approximately 3.4 million square feet, and an investment in 4,133 acres of undeveloped and partially developed land.
Basis of presentation. presentation. The accompanying Consolidated Financial Statements include theour accounts, of the Company, itsour subsidiaries, generally all of which are wholly-owned, and all entities in which the Company haswe have a controlling interest. Arrangements that are not controlled through voting or similar rights are accounted for as a Variable Interest Entity (VIE), in accordance with the provisions and guidance of ASC Topic 810 “Consolidation”, whereby the Company has beenwe have determined to bethat we are a primary beneficiary of the VIE and meetsmeet certain criteria of a sole general partner or managing member as identified in accordance with Emerging Issues Task Force (“EITF”) Issue 04-5, Investor’s Accounting for an Investment in a Limited Partnership when the Investor is the Sole General Partner and the Limited Partners have Certain Rights (“EITF 04-5”). VIEs are generally entities that lack sufficient equity to finance their activities without additional financial support from other parties or whose equity holders as a group lack adequate decision making ability, the obligation to absorb expected losses or residual returns of the entity, or have voting rights that are not proportional to their economic interests. The primary beneficiary generally is the entity that provides financial support and bears a majority of the financial risks, authorizes certain capital transactions, or makes operating decisions that materially affect the entity’s financial results. All significant intercompany balances and transactions have been eliminated in consolidation. In determining whether we are the primary beneficiary of a VIE, we consider qualitative and quantitative factors, including, but not limited to: the amount and characteristics of our investment; the obligation or likelihood for us or other investors to provide financial support; our and the other investors’ ability to control or significantly influence key decisions for the VIE; and the similarity with and significance to the business activities of us and the other investors. Significant judgments related to these determinations include estimates about the current future fair values and performance of real estate held by these VIEs and general market conditions.
For entities in which
the Company haswe have less than a controlling financial interest or entities where it is not deemed to be the primary beneficiary, the entities are accounted for using the equity method of accounting. Accordingly,
the Company’sour share of the net earnings or losses of these entities
isare included in consolidated net income. TCI’s
investmentsinvestment in ARL
and Garden Centura, LP areis accounted for under the equity method.
Our investment in Garden Centura, L.P. was accounted for under the equity method until December 28, 2011, when it was sold to a third party.
Real estate, depreciation, and impairment.
Real estate assets are stated at the lower of depreciated cost or fair value, if deemed impaired. Major replacements and betterments are capitalized and depreciated over their estimated useful lives. Depreciation is computed on a straight-line basis over the useful lives of the properties (buildings and improvements—
20-4010-40 years; furniture, fixtures and equipment—5-10 years).
The CompanyWe continually
evaluatesevaluate the recoverability of the carrying value of its real estate assets using the methodology prescribed in ASC Topic 360, “Property, Plant and Equipment,” Factors considered by management in evaluating impairment of its existing real estate assets held for investment include significant declines in property operating profits, annually recurring property operating losses and other significant adverse changes in general market conditions that are considered permanent in nature. Under ASC Topic 360, a real estate asset held for investment is not considered impaired if the undiscounted, estimated future cash flows of an asset (both the annual estimated
TRANSCONTINENTAL REALTY INVESTORS, INC.
NOTES TO FINANCIAL STATEMENTS—(Continued)
cash flow from future operations and the estimated cash flow from the theoretical sale of the asset) over its estimated holding period are in excess of the asset’s net book value at the balance sheet date. If any real estate asset held for investment is considered impaired, a loss is provided to reduce the carrying value of the asset to its estimated fair value.
Any properties that are treated as “subject to sales contract” on the Consolidated Balance Sheets and are listed in detail in Schedule III, “Real Estate and Accumulated Depreciation” are those in which we have not recognized the legal sale according to the guidance in ASC 360-20 due to various factors, disclosed in each sale transaction under Item 1 Significant Real Estate Acquisitions/Dispositions and Financing. Any sale transaction where the guidance reflects that a sale had not occurred, the asset involved in the transaction, including the debt and property operations, remained on the books of the Company. We continue to charge depreciation to expense as a period costs for the property until such time as the property has been classified as held for sale in accordance with guidance reflected in ASC 360-10-45 “Impairment or Disposal of Long-Lived Assets”.
Real estate held-for-saleheld for sale.
The Company We periodically
classifiesclassify real estate assets as held for sale. An asset is classified as held for sale after the approval of the Company’s board of directors and after an active program to sell the asset has commenced. Upon the classification of a real estate asset as held for sale, the carrying value of the asset is reduced to the lower of its net book value or its estimated fair value, less costs to sell the asset. Subsequent to the classification of assets as held for sale, no further depreciation expense is recorded. Real estate assets held for sale are stated separately on the accompanying consolidated balance sheets. Upon a decision to no longer market as an asset for sale, the asset is classified as an operating asset and depreciation expense is reinstated. The operating results of real estate assets held for sale and sold are reported as discontinued operations in the accompanying statements of operations. Income from discontinued operations includes the revenues and expenses, including depreciation and interest expense, associated with the assets. This classification of operating results as discontinued operations applies retroactively for all periods presented. Additionally, gains and losses on assets designated as held for sale are classified as part of discontinued operations.
Cost Capitalization. The cost of buildings and improvements includes the purchase price of property, legal fees and other acquisition costs. Costs directly related to planning, developing, initial leasing and constructing a property are capitalized and classified as PropertiesReal Estate in the Consolidated Balance Sheets. Capitalized development costs include interest, property taxes, insurance, and other direct project costs incurred during the period of development.
A variety of costs are incurred in the acquisition, development and leasing of properties. After determination is made to capitalize a cost, it is allocated to the specific component of a project that is benefited. Determination of when a development project is substantially complete and capitalization must cease involves a degree of judgment. Our capitalization policy on development properties is guided by ASC Topic 835-20 “Interest – Capitalization of Interest” and ASC Topic 970 “Real Estate - General”. The
Company capitalizes interest to qualifying assetscosts of land and buildings under development
based on average accumulated expenditures outstanding duringinclude specifically identifiable costs. The capitalized costs include pre-construction costs essential to the
period. In capitalizingdevelopment of the property, development costs, construction costs, interest
to qualifying assets, the Company first uses the interest incurred on specific project debt, if any, and next uses the company’s weighted average interest rate of non-project specific debt.The company capitalizes interest,costs, real estate taxes, salaries and certain operating expensesrelated costs and other costs incurred during the period of development. We consider a construction project as substantially completed and held available for occupancy upon the receipt of certificates of occupancy, but no later than one year from cessation of major construction activity. We cease capitalization on the unoccupied portion of recently(1) substantially completed properties fromand (2) occupied or held available for occupancy, and we capitalize only those costs associated with the date a project receives its certificate of occupancy to the date on which the project achieves 80% economic occupancy.
The company capitalizesportion under construction.
We capitalize leasing costs which include commissions paid to outside brokers, legal costs incurred to negotiate and document a lease agreement and any internal costs that may be applicable.
The company allocatesWe allocate these costs to individual tenant leases and
amortizesamortize them over the related lease term.
Fair value measurement. The company appliesmeasurement. We apply the guidance in ASC Topic 820, “Fair Value Measurements and Disclosures,” to the valuation of real estate assets. These provisions define fair value as the price that would be received to sell an asset or paid to transfer a liability in a transaction between market participants at the measurement date, establish a hierarchy that prioritizes the information used in developing fair value estimates and require disclosure of fair value measurements by level within the fair value hierarchy. The hierarchy gives the highest priority to quoted prices in active markets (Level 1 measurements) and the lowest priority to unobservable data (Level 3 measurements), such as the reporting entity’s own data.
The valuation hierarchy is based upon the transparency of inputs to the valuation of an asset or liability as of the measurement date and includes three levels defined as follows:
| | | | |
Level 1
| | — |
| Level 1 | — | Unadjusted quoted prices for identical and unrestricted assets or liabilities in active markets. |
Level 2 | | — | | Quoted prices for similar assets and liabilities in active markets, and inputs that are observable for the asset or liability, either directly or indirectly, for substantially the full term of the financial instrument. |
Level 3 | | — | | Unobservable inputs that are significant to the fair value measurement. |
TRANSCONTINENTAL REALTY INVESTORS, INC.
NOTES TO FINANCIAL STATEMENTS—(Continued)
A financial instrument’s categorization within the valuation hierarchy is based upon the lowest level of input that is significant to the fair value measurement.
Related parties. We apply ASC Topic 805, “Business Combinations”, to evaluate business relationships. Related parties are persons or entities who have one or more of the following characteristics, which include entities for which investments in their equity securities would be required, trust for the benefit of persons including principal owners of the entities and members of their immediate families, management personnel of the entity and members of their immediate families and other parties with which the entity may deal if one party controls or can significantly influence the decision making of the other to an extent that one of the transacting parties might be prevented from fully pursuing its own separate interests, or affiliates of the entity.
Recognition of Revenue. revenue. Our revenues, which are composed largely of rental income, include rents reported on a straight-line basis over the lease term. In accordance with ASC 805 “Business Combinations”, the Company recognizeswe recognize rental revenue of acquired in-place “above-” and “below-market” leases at their fair values over the terms of the respective leases. Reimbursements of operating costs, as allowed under most of our commercial tenant leases, consist of amounts due from tenants for common area maintenance, real estate taxes and other recoverable costs, and are recognized as revenue in the period in which the recoverable expenses are incurred. We record these reimbursements on a “gross” basis, since we generally are the primary obligor with respect to purchasing goods and services from third-party suppliers; we have discretion in selecting the supplier and have the credit risk with respect to paying the supplier.
Rental income for residential property leases is recorded when due from residents and is recognized monthly as earned, which is not materially different than on a straight-line basis as lease terms are generally for periods of one year or less. An allowance for doubtful accounts is recorded for all past due rents and operating expense reimbursements considered to be uncollectible
Sales and the associated gains or losses of real estate assets are recognized in accordance with the provisions of ASC Topic 360-20, “Property, Plant and Equipment—Real Estate Sale”. The specific timing of a sale is measured against various criteria in ASC 360-20 related to the terms of the transaction and any continuing involvement in the form of management or financial assistance associated with the properties. If the sales criteria for the full accrual method are not met, the Company defers some or all of the gain recognition and accounts for the continued operations of the property by applying the finance, leasing, deposit, installment or cost recovery methods, as appropriate, until the sales criteria are met.
Non-performing notes receivable.TCI considers We consider a note receivable to be non-performing when the maturity date has passed without principal repayment and the borrower is not making interest payments in accordance with the terms of the agreement.
Interest recognition on notes receivable. For notes other than surplus cash notes, wereceivable. We record interest income as earned in accordance with the terms of the related loan agreements.
OnPrior to January 1, 2012, on cash flow notes where payments are based upon surplus cash from operations, accrued but unpaid interest income
iswas only recognized to the extent
that cash
iswas received.
As of January 1, 2012, due to the consistency of cash received on the surplus cash notes, we recorded interest as earned. Allowance for estimated losses. losses. We assess the collectability of notes receivable on a periodic basis, of which the assessment consists primarily of an evaluation of cash flow projections of the borrower to determine whether estimated cash flows are sufficient to repay principal and interest in accordance with the contractual terms of the note. We recognize impairments on notes receivable when it is probable that principal and interest will not be received in accordance with the contractual terms of the loan. The amount of the impairment to be recognized generally is based on the fair value of the partnership’s real estate that represents the primary source of loan repayment. See Note 3
“Notes and Interest Receivable” for details on our
Notes Receivable.notes receivable. Cash equivalents.For purposes of the Consolidated Statements of Cash Flows, all highly liquid investments purchased with an original maturity of three months or less are considered to be cash equivalents.
TRANSCONTINENTAL REALTY INVESTORS, INC.NOTES TO FINANCIAL STATEMENTS—(Continued)
Earnings per share. Earnings per share “(EPS)” have been. Income (loss) per share is presented in accordance with ASC 620 “Earnings per Share”. Income (loss) per share is computed pursuant tobased upon the provisions of ASC 260 “Earnings Per Share”. The computation of basic EPS is calculated by dividing income available to common shareholders by the weighted-averageweighted average number of shares of common sharesstock outstanding during the period. Shares issued during the period shall be weighted for the portion of the period that they were outstanding. As of December 31, 2009, we have 10,000 shares of stock options outstanding. These options are considered in the computation of diluted earnings per share if the effect of applying the treasury stock method is dilutive. We have 30,000 shares of Series C Cumulative Convertible Preferred Stock issued and outstanding. The stock has a liquidation preference of $100.00 per share. After September 30, 2006, the stock may be converted into Common Stock at 90% of the daily average closing price of the Common Stock for the prior five trading days. The effects of the Series C Cumulative Convertible Preferred Stock are included in the dilutive earnings per share if applying the if-converted method is dilutive. At December 31, 2009 and 2008, the preferred stock and the stock options were anti-dilutive and thus not included in the EPS calculation. At December 31, 2007, the preferred stock and stock options were dilutive and thus included in the EPS calculation.each year.
Use of estimates.In the preparation of Consolidated Financial Statements in conformity with accounting principles generally accepted in the United States of America, it is necessary for management to make estimates and assumptions that affect the reported amounts of assets and liabilities and disclosure of contingent assets and liabilities at the date of the Consolidated Financial Statements and the reported amounts of revenues and expense for the year ended. Actual results could differ from those estimates.
Income Taxes.Taxes. TCI is a “C Corporation” for U.S. federal income tax purposes.
For tax periods ending before August 31, 2012, TCI
filesfiled an annual consolidated income tax return with ARL and IOT and their subsidiaries. ARL
iswas the common parent for the consolidated group.
After that date, TCI
is partand the rest of
the American Realty Investors, Inc. group joined the Realty Advisors Management, Inc. (RAMI) consolidated group for tax purposes. The income tax expense (benefit) for the 2010 and 2011 tax periods in the accompanying financial statement was calculated under a tax sharing and compensating agreement
with respect to federal income taxes between ARL, TCI and
IOT and their subsidiaries that was entered into in July of 2009. Prior to 2009, ARL and TCI and their subsidiaries were inIOT. That agreement continued until August 31, 2012 at which time a
new tax sharing and compensating agreement
with respect to federal income taxeswas entered into by ARL, TCI, IOT and
IOT wasRAMI for the
parent companyremainder of
its own consolidated filing group.2012. The agreement specifies the manner in which the group will share the consolidated tax liability and also how certain tax attributes are to be treated among members of the group.
Recent Accounting Pronouncements.Pronouncements. There were no recent accounting pronouncements that our company has not implemented that materially affect our financial statements.
A summary of our real estate owned as of the end of the year is listed below (dollars in thousands):
| | | | | | | | |
| | | 2009 | | | 2008 | |
Apartments | | $ | 712,149 | | | $ | 653,023 | |
Apartments under construction | | | 5,296 | | | | 56,195 | |
Commercial properties | | | 409,301 | | | | 406,798 | |
Land held for development | | | 393,297 | | | | 410,000 | |
Real estate held for sale | | | 6,399 | | | | 8,018 | |
Real estate subject to sales contract | | | 73,033 | | | | 73,033 | |
| | | | | | | | |
Total real estate | | | 1,599,475 | | | | 1,607,067 | |
Less accumulated deprecation | | | (152,291 | ) | | | (126,276 | ) |
| | | | | | | | |
| | $ | 1,447,184 | | | $ | 1,480,791 | |
| | | | | | | | |
| | | 2012 | | | 2011 | |
| | | | | | | |
| Apartments | | $ | 609,093 | | | $ | 610,072 | |
| Apartments under construction | | | - | | | | - | |
| Commercial properties | | | 216,343 | | | | 214,111 | |
| Land held for development | | | 153,345 | | | | 173,996 | |
| Real estate held for sale | | | 22,735 | | | | 80,245 | |
| Real estate subject to sales contract | | | 62,118 | | | | 67,810 | |
| Total real estate, at cost, less impairment | | | 1,063,634 | | | | 1,146,234 | |
| Less accumulated deprecation | | | (166,684 | ) | | | (157,895 | ) |
| Total real estate, net of depreciation | | $ | 896,950 | | | $ | 988,339 | |
Expenditures for repairs and maintenance are charged to operations as incurred. Significant betterments are capitalized. When assets are sold or retired, their costs and related accumulated depreciation are removed from the accounts with the resulting gains or losses reflected in net income or loss for the period.
Depreciation is computed on a straight line basis over the estimated useful lives of the assets as follows:
Land improvements | 25 to 40 years |
Buildings and improvements | 10 to 40 years |
Tenant improvements | Shorter of useful life or terms of related lease |
Furniture, fixtures and equipment | 3 to 7 years |
Provision for Impairment Losses
The provision for impairment of notes receivable, investment in real estate partnerships, and real estate assets was $4.7 million for the period ended December 31, 2012. This was a decrease of $32.3 million as compared to the prior year expense of $37.0 million. In the current year, impairment was recorded as an additional loss in the commercial and land portfolios. In our commercial portfolio, an impairment reserve of $2.4 million was taken in response to a deficiency agreement with the existing lender. The agreed upon deficiency, in the event the lender takes possession of the property, was the basis upon which fair value was calculated and an impairment reserve was taken for the difference in basis over fair value. The remaining $2.3 million in impairment reserves were related to our land holdings. A current year sale of adjacent land determined the fair value on a Waco, Texas land holding that resulted in an impairment reserve of $1.2 million, a comparable sale determined the fair value of a Florida land holding that resulted in an impairment reserve of $0.5 million and a recent appraisal determined the fair value of an Arkansas land holding that resulted in an impairment reserve of $0.6 million.
In the prior period, impairment was recorded as an additional loss in the investment portfolio of $5.2 million in the apartment properties we currently hold, $2.0 million in commercial properties we currently hold, $2.4 million in land parcels we currently hold, $27.0 million in land that was sold subsequent to the prior period and $0.4 million in impairment on our investments in joint ventures. Of the impairment reserves taken in the prior period, $22.1 million was related to the land holdings that were part of an overall strategic debt restructuring plan resulting in the disposal of the land for less than the market value, $9.3 million was related to a third party sales contract that was executed during the prior period for less than the carrying value, $5.2 million was related to the underperformance of property using a valuation analysis based upon a multiple of earnings and $0.4 million was related to various investment in joint ventures that had were determined to have a questionable recovery of our investment.
Fair Value Measurement
The Company applies the guidance in ASC Topic 820, "Fair Value Measurements and Disclosures," to the valuation of real estate assets. The Company is required to assess the fair value of its consolidated real estate assets with indicators of impairment. The value of impaired real estate assets is determined using widely accepted valuation techniques, including discounted cash flow analyses on the expected cash flow of each asset, as well as the income capitalization approach, which considers prevailing. market capitalization rates, analyses of recent comparable sales transactions, information from actual sales negotiations and bona fide purchase offers received from third parties. The methods used to measure fair value may produce an amount that may not be indicative of net realizable value or reflective of future values. Furthermore, although the Company believes its valuation methods are appropriate and consistent with other market participants, the use of different methodologies or assumptions to determine the fair value of certain financial instruments could result in a different fair value measurement at the reporting date.
The fair value measurements used in these evaluations are considered to be Level 2 and 3 valuations within the fair value hierarchy in the accounting rules, as there are significant observable (Level 2) and unobservable inputs (Level 3). Examples of Level 2 inputs the Company utilizes in its fair value calculations are appraisals and bona fide purchase offers from third parties. Examples of Level 3 inputs the Company utilizes in its fair value calculations are discount rates, market capitalization rates, expected lease rental rates, timing of new leases, an estimate of future sales prices and comparable sales prices of similar assets, if available. All of the impairment charges outlined above were recorded in the statements of operations, either in continuing operations or discontinued operations.
| | | | | Fair Value Measurements Using: |
| December 31, 2012 | | Fair Value | | Level 1 | | Level 2 | | Level 3 |
| | | | | | | | | |
| Land | $ | 2,699 | $ | --- | $ | 1,800 | $ | 899 |
| Commercial | $ | 9,660 | $ | --- | $ | 9,660 | $ | --- |
Land with a carrying amount of $5,029,254 was written down to its fair value of $2,699,175 resulting in an impairment charge of $2,330,079 in 2012. Level 2 inputs used to determine the fair values above include bona fide purchase offers and third party appraisals. The Level 3 inputs used to determine the fair values above include comparable sales prices of similar assets.
A commercial building with a carrying amount of $12,060,247 was written down to its fair value of $9,660,247 resulting in an impairment charge of $2,400,000 in 2012. The method used to determine the fair value was agreement with lender as to value based on their evaluation of the property.
| | | | | Fair Value Measurements Using: |
| December 31, 2011 | | Fair Value | | Level 1 | | Level 2 | | Level 3 |
| | | | | | | | | |
| Land | $ | 55,806 | $ | --- | $ | 55,806 | $ | --- |
| Residential | $ | 30,539 | $ | --- | $ | --- | $ | 30,539 |
| Commercial | $ | 11,934 | $ | --- | $ | 11,934 | $ | --- |
Land with a carrying amount of $86,696,927 was written down to its fair value of $55,806,297 resulting in an impairment charge of $30,890,630 in 2011. Level 2 observable inputs used to determine the fair value includes bona fide purchase offers and third party appraisals.
Residential properties with a carrying amount of $35,717,146 were written down to their fair value of $30,539,462 resulting in an impairment charge of $5,177,684 in 2011. Level 3 unobservable inputs were used to determine the fair value includes a valuation technique, the income capitalization approach, which considers prevailing market capitalization rates.
Commerical properties with a carrying amount of $20,427,936 were written down to their fair value of $11,933,620 resulting in an impairment charge of $8,494,316 in 2011. Level 2 observable inputs used to determine the fair value includes bona fide purchase offers.
| | | | | Fair Value Measurements Using: |
| December 31, 2010 | | Fair Value | | Level 1 | | Level 2 | | Level 3 |
| | | | | | | | | |
| Commercial | $ | 0 | $ | --- | $ | 0 | $ | --- |
| Land | $ | 13,091 | $ | --- | $ | 13,091 | $ | --- |
A commercial property with a carrying amount of $1,092,838 was written down to its fair value of $0 resulting in an impairment charge of $1,092,838 in 2010. Level 2 observable inputs used to determine the fair value includes bona fide purchase offer.
Land with a carrying amount of $31,326,888 was written down to its fair value of $13,090,811 resulting in an impairment charge of $18,236,077 in 2010. Level 2 observable inputs used to determine the fair value includes bona fide purchase offer.
The following is a brief description of the most significant property acquisitions and sales in
2009.TRANSCONTINENTAL REALTY INVESTORS, INC.
NOTES TO FINANCIAL STATEMENTS—(Continued)
In2012:
On January 2009, we sold 9.31, 2012, ARL and TCI agreed to rescind the April 1, 2011 sale of 100% of the general and limited partnership interest in Garden Whispering Pines, LP, which owns Whispering Pines apartments, a 320-unit complex located in Topeka, Kansas.
On January 3, 2012, 82.2 acres of land known as
Woodmont Schiff-Park ForestDenton Coonrod land located in
Dallas,Denton County, Texas
for $7.7 million. We received $3.9 million in cash after paying offwas transferred to the existing
debt of $3.2 million and closing costs of $0.6 million. In addition, we bookedlender. This land parcel was previously sold, on March 23, 2011, to Cross County National Associates, LP, a
$2.1 million receivable. There was no gain or loss recorded on the sale of the land parcel.In April 2009, we sold the Cullman Shopping Center, a 92,500 square foot facility located in Cullman, Alabamarelated party, for a sales price of $4.0$1.8 million. The Company did not recognize or record the sale in accordance with ASC 360-20 due to our continuing involvement, which included the potential payment of cash shortfalls, future obligations under the existing mortgage and guaranty, the buyer’s inadequate initial investment and the Company’s questionable recovery of investment cost. The Company determined that no sale had occurred for financial reporting purposes and therefore the asset remained on the books and continued to record operating expenses and depreciation as a period cost until a sale occurred that met the requirements of ASC 360-20. A sale to an independent third party, that met the requirements of ASC 360-20, took place on January 3, 2012 at a sales price equal to the existing mortgage of $0.8 million, that was considered paid in full when ownership transferred to the existing lender. We recorded a gain on sale of $0.04 million on the land parcel sale.
On January 30, 2012, we refinanced the existing mortgage on Parc at Maumelle apartments, a 240-unit complex located in Little Rock, Arkansas, for a new mortgage of $16.8 million. We received $3.0 million in cash after payingpaid off the existing debtmortgage of $16.1 million and paid $1.0 million.million in closing costs and escrow reserves. The project was soldnote accrues interest at 3.00% and payments of interest and principal are due monthly based upon a 40-year amortization schedule, maturing on February 1, 2052.
On February 2, 2012, TCI and its subsidiary, 1340 Poydras, LLC, executed a guarantor settlement and consent agreement with the lender for the Amoco building, Petra CRE CDO 2007-1, Ltd (“Petra”) to transfer ownership of the Amoco building to a new entity, 1340 Owner, LLC, which is affiliated with the existing lender, Petra. Petra and its affiliate are independent third parties. Regis will continue to manage the property while under Petra’s ownership and TCI will have an option to re-acquire the property during the option term which shall end two years following the commencement of the agreement. We have deferred the recognition of the sale in accordance with ASC 360-20 due to our continuing involvement related party; thereforeto the gain of $1.9 million was deferredobligations under the note and will be recorded upon sale to a third party.In April 2009, we sold 3.02guaranty agreements and the re-acquisition option.
On February 7, 2012, 22.92 acres of land known as West EndAndrew B land, Denton County, Texas was transferred to the existing lender. This land parcel was previously sold, on September 1, 2011, to TCI Luna Ventures, LLC, a related party, for a sales price of $1.3 million. The Company did not recognize or record the sale in accordance with ASC 360-20 due to our continuing involvement, which included the potential payment of cash shortfalls, future obligations under the existing mortgage and guaranty, the buyer’s inadequate initial investment and the Company’s questionable recovery of investment cost. The Company determined that no sale had occurred for financial reporting purposes and therefore the asset remained on the books and continued to record operating expenses and depreciation as a period cost until a sale occurred that met the requirements of ASC 360-20. A sale to an independent third party, that met the requirements of ASC 360-20, took place on February 7, 2012, when the Company received a credit against the outstanding debt of $2.1 million, which is part of a multi-tract collateral obligation, and the existing lender took possession of the property. We recorded a gain on sale of $1.2 million on the land parcel sale.
On February 23, 2012, we sold a 220-unit apartment complex known as Wildflower Villas apartments located in Temple, Texas to an independent third party, for a sales price of $19.6 million. The buyer assumed the existing debt of $13.7 million secured by the property. We recorded a gain on sale of $3.6 million on the apartment sale.
On February 29, 2012, we refinanced the existing mortgage on Huntington Ridge apartments, a 198-unit complex located in DeSoto, Texas, for a new mortgage of $15.0 million. We paid off the existing mortgage of $14.6 million and paid $1.2 million in closing costs and escrow reserves. The note accrues interest at 3.03% and payments of interest and principal are due monthly based upon a 40-year amortization schedule, maturing on March 1, 2052.
On February 29, 2012, we refinanced the existing mortgage on Laguna Vista apartments, a 206-unit complex located in Dallas, Texas, for a new mortgage of $17.7 million. We paid off the existing mortgage of $17.0 million and paid $1.1 million in closing costs and escrow reserves. The note accrues interest at 3.03% and payments of interest and principal are due monthly based upon a 40-year amortization schedule, maturing on March 1, 2052.
On February 29, 2012, we refinanced the existing mortgage on Savoy of Garland apartments, a 144-unit complex located in Garland, Texas, for a new mortgage of $10.3 million. We paid off the existing mortgage of $10.2 million and paid $0.9 million in closing costs and escrow reserves. The note accrues interest at 3.03% and payments of interest and principal are due monthly based upon a 40-year amortization schedule, maturing on March 1, 2052.
On March 1, 2012, we sold 100% of our interests in LaDue, LLC to ABC Land & Development, Inc., a related party, for a sales price of $8.5$1.9 million. This entity owns 8.01 acres of land known as LaDue land located in Dallas County, Texas. We provided $1.3 million in seller-financing with a five-year note receivable. The note accrues interest at 5% and is payable at maturity on March 1, 2017. The buyer assumed the existing mortgage of $0.6 million, secured by the property. The Company did not recognize or record the sale in accordance with ASC 360-20 due to our continuing involvement, which included the potential payment of cash shortfalls, future obligations under the existing mortgage and guaranty, the buyer’s inadequate initial investment and the Company’s questionable recovery of investment cost. The Company determined that no sale had occurred for financial reporting purposes and therefore the asset remained on the books and continued to record operating expenses and depreciation as a period cost until a sale occurred that met the requirements of ASC 360-20. On August 10, 2012, we re-purchased 100% of the membership interests in LaDue, LLC from ABC Land & Development, Inc., a related party, for $1.9 million to be paid by assumption of debt of $0.6 million, secured by the property, and cancellation of a five-year seller-financed note of $1.3 million. There is no change in the financial statements related to the March 1, 2012 sale or the subsequent re-acquisition.
On March 1, 2012, the construction loan in the amount of $11.1 million that was taken out on July 30, 2010 to fund the development of Sonoma Court apartments, a 124-unit complex, closed into permanent financing. The note accrues interest at 5.35% and payments of interest and principal are due monthly based upon a 40-year amortization schedule, maturing on November 1, 2051.
On March 5, 2012, 7.39 acres of land known as DeSoto Ranch land located in DeSoto, Texas was transferred to the existing lender. This land parcel was previously sold, on September 1, 2011, to TCI Luna Ventures, LLC, a related party, for a sales price of $1.3 million. The Company did not recognize or record the sale in accordance with ASC 360-20 due to our continuing involvement, which included the potential payment of cash shortfalls, future obligations under the existing mortgage and guaranty, the buyer’s inadequate initial investment and the Company’s questionable recovery of investment cost. The Company determined that no sale had occurred for financial reporting purposes and therefore the asset remained on the books and continued to record operating expenses and depreciation as a period cost until a sale occurred that met the requirements of ASC 360-20. A sale to an independent third party, that met the requirements of ASC 360-20, took place on March 5, 2012, when the Company received a credit against the outstanding debt of $1.0 million, which is part of a multi-tract collateral obligation, and the existing lender took possession of the property. We recorded a gain on sale of $0.1 million on the land parcel sale.
On March 27, 2012, we sold 319.07 acres of land known as Waco Ritchie land located in Waco, Texas to an independent third party, for a sales price of $1.9 million. The existing mortgage of $1.5 million, secured by the property, was paid in full. We recorded a loss on sale of $0.8 million on the land parcel sale.
On March 28, 2012, the construction loan in the amount of $24.2 million that was taken out on February 18, 2010 to fund the development of Blue Ridge apartments, a 290-unit complex, closed into permanent financing. The note accrues interest at 5.37% and payments of interest and principal are due monthly based upon a 40-year amortization schedule, maturing on October 1, 2051.
On April 1, 2012, we purchased 1,000 shares of stock of Kelly Lot Development, Inc. from Tacco Financial, Inc., a related party, for $5.6 million. This entity owns six land parcels, comprising approximately 52.59 acres of undeveloped land located in Dallas County, Texas, Kaufman County, Texas, Nashville, Tennessee and Tarrant County, Texas, known as Kelly Lots land, Travis Ranch land, Nashville land, Cooks Lane land, Seminary West land and Vineyards land. We assumed the existing mortgages of $0.5 million and $0.4 million, secured by the property. The loans accrue interest at 15.00% and are payable at maturity on May 1, 2013 and November 1, 2013, respectively.
On April 3, 2012, 5.22 acres of land known as Andrew C land located in Denton, Texas was transferred to the existing lender. This land parcel was previously sold, on September 1, 2011, to TCI Luna Ventures, LLC, a related party, for a sales price of $0.4 million. The Company did not recognize or record the sale in accordance with ASC 360-20 due to our continuing involvement, which included the potential payment of cash shortfalls, future obligations under the existing mortgage and guaranty, the buyer’s inadequate initial investment and the Company’s questionable recovery of investment cost. The Company determined that no sale had occurred for financial reporting purposes and therefore the asset remained on the books and continued to record operating expenses and depreciation as a period cost until a sale occurred that met the requirements of ASC 360-20. A sale to an independent third party, that met the requirements of ASC 360-20, took place on April 3, 2012, when the Company received a credit against the outstanding debt of $0.5 million, which is part of a multi-tract collateral obligation, and the existing lender took possession of the property. We recorded a gain on sale of $0.2 million on the land parcel sale.
On April 5, 2012, we sold Clarke Garage, a 6,869 square foot parking garage, located in New Orleans, Louisiana to an independent third party, for a sales price of $6.0 million. All of the sale proceeds went to pay down existing mortgages, secured by the property. We recorded a loss on sale of $0.3 million on the parking garage sale.
On April 30, 2012, we refinanced the existing mortgage on Parc at Metro Center apartments, a 144-unit complex located in Nashville, Tennessee, for a new mortgage of $11.0 million. We received $4.6 million in cash after payingpaid off the existing mortgage of $10.5 million and paid $0.7 million in closing costs and escrow reserves. The note accrues interest at 2.95% and payments of interest and principal are due monthly based upon a 40-year amortization schedule, maturing on May 1, 2052.
On May 16, 2012, we sold 0.42 acres of land known as 1013 Common Street located in New Orleans, Louisiana to an independent third party, for a sales price of $650,000. All of the sale proceeds went to pay down an existing mortgage, secured by the property.
On May 17, 2012, we sold a 220-unit apartment complex known as Portofino at Mercer Crossing apartments located in Farmers Branch, Texas to an independent third party, for a sales price of $26.0 million. The existing mortgage of $19.9 million, secured by the property, was paid in full. We recorded a gain on sale of $2.0 million on the apartment sale.
On May 25, 2012, we refinanced the existing mortgage on Pecan Pointe apartments, a 232-unit complex located in Temple, Texas, for a new mortgage of $16.8 million. We paid off the existing mortgage of $16.4 million and paid $1.3 million in closing costs and escrow reserves. The note accrues interest at 3.03% and payments of interest and principal are due monthly based upon a 40-year amortization schedule, maturing on June 1, 2052.
On May 30, 2012, we refinanced the existing mortgage on Blue Lake Villas II apartments, a 70-unit complex located in Waxahachie, Texas, for a new mortgage of $4.1 million. We paid off the existing mortgage of $3.9 million and paid $0.2 million in closing costs and escrow reserves. The note accrues interest at 2.85% and payments of interest and principal are due monthly based upon a 40-year amortization schedule, maturing on June 1, 2052.
On June 1, 2012, we purchased 19.29 acres of Summer Breeze land located in Odessa, Texas, for $2.0 million. On June 12, 2012, we sold 13.31 acres of this land parcel to an independent third party.
On June 8, 2012, we sold 72.22 acres of land known as McKinney Ranch land located in McKinney, Texas to an independent third party, for a sales price of $5.4 million. We paid $5.4 million on the existing mortgage to satisfy a portion of the multi-tract collateral debt of $3.4$7.6 million, secured by the property. We recorded a gain on sale of $1.0 million on the land parcel sale.
On June 19, 2012, the construction loan in the amount of $16.4 million that was taken out on September 14, 2010 to fund the development of Lodge at Pecan Creek apartments, a 192-unit complex, closed into permanent financing. The note accrues interest at 5.05% and payments of interest and principal are due monthly based upon a 40-year amortization schedule, maturing on March 1, 2052.
On June 22, 2012, we sold 305 Baronne, a 37,081 square foot building, located in New Orleans, Louisiana to an independent third party, for a sales price of $825,000. We paid $0.7 million on an existing mortgage, secured by the property. We recorded a loss on sale of $0.4 million on the building sale.
On June 28, 2012, we refinanced the existing mortgage on Lake Forest apartments, a 222-unit complex located in Houston, Texas, for a new mortgage of $12.8 million. We paid off the existing mortgage of $12.0 million and paid $1.0 million in closing costs and escrow reserves. The note accrues interest at 2.85% and payments of $0.5interest and principal are due monthly based upon a 40-year amortization schedule, maturing on July 1, 2052.
On June 28, 2012, we refinanced the existing mortgage on Mission Oaks apartments, a 228-unit complex located in San Antonio, Texas, for a new mortgage of $15.6 million. We paid off the existing mortgage of $14.9 million and paid $1.0 million in closing costs and escrow reserves. The note accrues interest at 2.95% and payments of interest and principal are due monthly based upon a 40-year amortization schedule, maturing on July 1, 2052.
On June 28, 2012, we refinanced the existing mortgage on Paramount Terrace apartments, a 181-unit complex located in Amarillo, Texas, for a new mortgage of $3.2 million. We paid off the existing mortgage of $2.8 million and paid $0.4 million in closing costs and escrow reserves. The note accrues interest at 2.85% and payments of interest and principal are due monthly based upon a 40-year amortization schedule, maturing on July 1, 2045.
On June 28, 2012, we refinanced the existing mortgage on Sugar Mill apartments, a 160-unit complex located in Addis, Louisiana, for a new mortgage of $12.0 million. We paid off the existing mortgage of $11.8 million and paid $1.0 million in closing costs and escrow reserves. The note accrues interest at 2.85% and payments of interest and principal are due monthly based upon a 40-year amortization schedule, maturing on July 1, 2052.
On June 29, 2012, we sold 2.59 acres of land known as Vineyards land located in Grapevine, Texas to an independent third party, for a sales price of $2.4 million. The existing mortgage of $0.4 million, secured by the property, was paid in full. We recorded a gain on sale of $1.4 million on the land parcel sale.
On June 29, 2012, we sold 4.33 acres of land known as Vineyards land located in Grapevine, Texas to an independent third party, for a sales price of $3.9 million. We recorded a gain on sale of
$4.9$2.2 million on the land
parcel.In April 2009,parcel sale.
On July 1, 2012, we sold 3.13recorded the June 12, 2012 sale of 13.31 acres of land known as Verandas at City ViewSummer Breeze land located in Fort Worth,Odessa, Texas to an independent third party, for $2.2 million. We provided $2.2 million in seller-financing with a 15-month note receivable. The note accrues interest at 5% and is payable at maturity on September 8, 2013. We have deferred the recognition of the gain in accordance with ASC 360-20 due to the buyer’s inadequate initial investment.
On July 11, 2012, we sold Dunes Plaza, a 220,439 square foot retail center and 14.60 acres of land, located in Michigan City, Indiana to an independent third party, for a sales price of $1.3$3.0 million. We paid off$2.2 million on an existing mortgage, secured by the property and $0.8 million in closing costs and unpaid real estate taxes. We recorded a gain on sale of $0.1 million on the building sale.
On August 10, 2012, we purchased 100% of the membership interests in LaDue, LLC from ABC Land & Development, Inc., a related party, for $1.9 million to be paid by assumption of debt of $0.6 million, secured by the property, and cancellation of a five-year seller-financed note of $1.3 million. This entity owns 8.01 acres of land known as LaDue land located in Dallas County, Texas. TCI originally sold the membership interests in LaDue, LLC on March 1, 2012 but did not record the sale for accounting purposes. See the above March 1, 2012 sale disclosure for details of the accounting treatment.
On September 6, 2012, we sold 19.82 acres of land known as McKinney Ranch land located in McKinney, Texas to an independent third party, for a sales price of $3.0 million. The existing mortgage of $2.6 million, secured by the property, was paid in full. We recorded a gain on sale of $0.2 million on the land parcel sale.
On September 11, 2012, we sold 7.977 acres of land known as Kinwest Manor land located in Farmers Branch, Texas to an independent third party, for a sales price of $2.3 million. The existing multi-collateral mortgage was paid down by $1.2 million. We recorded a loss on sale of $14,000 on the land parcel sale.
On September 12, 2012, we sold 9.39 acres of land known as Lacy Longhorn land located in Farmers Branch, Texas to an independent third party, for a sales price of $3.1 million. All of the sale proceeds were used to pay down a portion of the multi-tract collateral debt, secured by the property. We recorded a gain on sale of $2.1 million on the land parcel sale.
On September 12, 2012, we sold two land parcels, comprising approximately 7.39 acres of undeveloped land located in Dallas, Texas and Farmers Branch, Texas, known as Lacy Longhorn land and Manhattan 2 land to an independent third party, for a sales price of $2.4 million. Seller-financing was provided for $1.9 million. We recorded a gain on sale of $1.3 million and closing costson the land parcels sale.
On September 24, 2012, we sold 3.89 acres of
$0.01.land known as Copperridge land located in Dallas, Texas to an independent third party for a sales price of $3.2 million. The existing mortgage of $2.3 million, secured by the property, was paid in full. We recorded a
gainloss on sale of $0.7 million on the land
parcel.In June 2009,parcel sale.
On September 28, 2012, we sold
3.9640.49 acres of land known as
TeleportMarine Creek land located in
Irving,Fort Worth, Texas
to an independent third party, for a sales price of
$1.1$1.8 million.
We received $1.0 million in cash after payingAll of the sale proceeds were used to pay off the
existingmulti-tract collateral debt,
of $0.1 million and closing costs.secured by the property. We recorded a gain on sale of
$0.4 million$35,000 on the land
parcel.In July 2009, we sold 29.53parcel sale.
On December 31, 2012, 21.26 acres of
Hines Meridianland known as Pioneer Crossing land located in
Dallas,Austin, Texas
and 807.90 acres of Travis Ranch land located in Kaufman County, Texas for $16.0 million. We paid offwas transferred to the existing
debt of $13.5 million. We recorded no gain or losslender. This land parcel was previously sold, on
the land parcels.In July 2009, we sold the 5000 Space Center,September 1, 2011, to TCI Luna Ventures, LLC, a 101,500 square foot facility located in San Antonio, Texas and the 5360 Tulane Commercial building, a 30,000 square foot facility located in Atlanta, Georgiarelated party, for a sales price of $4.0$1.4 million. We received $2.7 millionThe Company did not recognize or record the sale in accordance with ASC 360-20 due to our continuing involvement, which included the potential payment of cash after paying offshortfalls, future obligations under the existing mortgage and guaranty, the buyer’s inadequate initial investment and the Company’s questionable recovery of investment cost. The Company determined that no sale had occurred for financial reporting purposes and therefore the asset remained on the books and continued to record operating expenses and depreciation as a period cost until a sale occurred that met the requirements of ASC 360-20. A sale to an independent third party A sale to an independent third party, that met the requirements of ASC 360-20, received a credit against the outstanding debt of $1.3 million.$0.3 million, which is part of a multi-tract collateral obligation, and the existing lender took possession of the property. We recorded a gainloss on sale of $3.0$1.0 million on the properties.
In September 2009, we purchased 54.86 acres of Gautier land located at Gautier, Mississippi for $3.4 million.
In September 2009, we obtained a new $5.0 million loan with a commercial lender which was collateralized by 6.51 acres of Hines land located in Farmers Branch, Texas, 2.194 acres of Valley View 34 land located in Farmers Branch, Texas, and 15.066 acres of Travelers land located in Farmers Branch, Texas. We received cash of $2 million after paying off $2.6 million of existing debt and $0.4 million in closing costs.
In October 2009,parcel sale.
On December 31, 2012, we sold
100% of the
2010 Valley View office building;stock in T Southwood 1394, Inc., to One Realco Corporation, a
40,666 square foot facility located in Farmers Branch, Texas,related party, for a sales price of
$3.2$0.6 million.
We received $1.2 million in cash by wayThis entity owns 14.52 acres of
an intercompany note receivable increase after paying off the existing debt of $2.0 million. The property was sold to a related party; therefore the gain of $0.8 million was deferred and will be recorded upon sale to a third party. We also sold the Parkway Centre retail shopping center; a 28,374 square foot facilityland known as Southwood Land located in
Dallas, Texas, for a sales priceTallahassee, Florida. Under the terms of
$4.0 million. We received $1.3 million in cash by way of an intercompany note receivable increase after paying off the
existing debt of $2.6 million. The property was sold to a related party; therefore the gain of $0.6 million was deferred and will be recorded upon sale,
to a third party.In November 2009, we acquired 27.192 acres of McKinney Ranch land located in McKinney, Texas in lieu of a note receivable payoff of $6.4 million and existing mortgage assumption of $5.3 million.
TRANSCONTINENTAL REALTY INVESTORS, INC.
NOTES TO FINANCIAL STATEMENTS—(Continued)
In November 2009, we purchased the Keller Springs Technical Center, an 80,000 square foot commercial building located in Carrollton, Texas for $6.0 million. We assumed the current mortgage of $6.0 million.
In December 2009, we sold the Bridges on Kinsey Apartments, a 232-unit complex, located in Tyler, Texas for $20.5 million. We received $6.8 million in cash, and the buyer assumed the existing mortgage of $14.0$0.6 million, secured by the property. The Company did not recognize or record the sale in accordance with ASC 360-20 due to our continuing involvement, which included the potential payment of cash shortfalls, future obligations under the existing mortgage and guaranty, the buyer’s inadequate initial investment and the Company’s questionable recovery of investment cost. The Company determined that no sale had occurred for financial reporting purposes and therefore the asset remained on the books and continued to record operating expenses and depreciation as a period cost until a sale occurred that met the requirements of ASC 360-20. A sale to an independent third party, that met the requirements of ASC 360-20, took place on January 8, 2013, when the property was sold to a third party and sales proceeds were credited against the outstanding debt. We will not record a gain or loss on the land parcel sale.
In December 2010, there were various commercial and land holdings sold to FRE Real Estate, Inc. a related party. During the first three months of 2011, many of these transactions were rescinded as of the original transaction date and were subsequently sold to related parties under the same ownership as FRE Real Estate, Inc. and disclosed in the transactions above. As of December 31, 2012, there is one commercial building, Thermalloy that remains in FRE Real Estate, Inc. We have deferred the recognition of the sales in accordance with ASC 360-20 due to our continuing involvement, the buyer’s inadequate initial investment and questionable recovery of the Company’s investment cost.
The properties that we have sold to a related party
thereforeand have deferred the
gainrecognition of
$5.2 million was deferredthe sale are treated as “subject to sales contract” on the Consolidated Balance Sheets and
will be recorded upon saleare listed in detail in Schedule III, “Real Estate and Accumulated Depreciation”. These properties were sold to a
third party.NOTE 3. NOTES | AND INTEREST RECEIVABLE |
related party in order to help facilitate an appropriate debt or organizational restructure and may or may not be transferred back to the seller upon resolution. These properties have mortgages that are secured by the property and many have corporate guarantees. According to the loan documents, we are currently in default on these mortgages primarily due to lack of payment although we are actively involved in discussions with every lender in order to settle or cure the default situation. We have reviewed each asset and taken impairment to the extent we feel the value of the property was less than our current basis.
Acquisitions from our parent, ARL, have previously been reflected at the fair value purchase price. Upon discussion with the SEC and in review of the guidance pursuant to ASC 250-10-45-22 to 24, we have adjusted those assets, in the prior year, to reflect a basis equal to ARL’s cost basis in the asset at the time of the sale. The related party payables to ARL were reduced for the lower asset price.
NOTE 3. NOTES AND INTEREST RECEIVABLE
A portion of our assets are invested in mortgage notes receivable, principally secured by real estate. We may originate mortgage loans in conjunction with providing purchase money financing of property sales. Notes receivable are generally collateralized by real estate or interests in real estate and personal guarantees of the borrower and, unless noted otherwise, are so secured Management intends to service and hold for investment the mortgage notes in our portfolio. A majority of the notes receivable provide for principal to be paid at maturity. Our mortgage notes receivable consist of first, wraparound and junior mortgage loans (dollars in thousands)
. | | | | | | | | | | | | |
Borrower | | Maturity
Date | | | Interest
Rate | | | Amount | | | Security |
Performing loans: | | | | | | | | | | | | |
3334Z Apts, LP | | 04/12 | | | 6.50 | % | | $ | 1,875 | | | 100% Interest in 3334Z Apartments |
Basic Capital Management(1) | | 10/11 | | | prime + 2 | % | | | 1,252 | | | Industrial building, Arlington, TX |
Basic Capital Management(1) | | 10/11 | | | prime + 2 | % | | | 1,523 | | | Retail building, Cary, NC |
Dallas Fund XVII LP | | 10/09 | | | 9.00 | % | | | 1,116 | | | Assignment of partnership interests |
Garden Centura LP(1) | | N/A | | | 7.00 | % | | | 2,210 | | | Excess cash flow from partnership |
Miscellaneous related party
notes(1) | | Various | | | Various | | | | 1,233 | | | Various secured interest |
Miscellaneous non-related party notes | | Various | | | Various | | | | 454 | | | Various secured interest |
Ocean Beach Partners(1) | | 12/09 | | | 7.00 | % | | | 3,279 | | | Folsom Land (36 acres in Farmers Branch, TX) |
Pioneer Austin Development | | 10/08 | (2) | | 18.00 | % | | | 2,407 | | | 33 acres undeveloped land, Austin, TX |
Housing for Seniors of Humble, LLC(1) | | 12/13 | | | 11.50 | % | | | 2,000 | | | Unsecured |
Housing for Seniors of Humble, LLC(1) | | 12/13 | | | 11.50 | % | | | 6,363 | | | Interest in Unified Housing Foundation Inc. |
UHF Inc. (Marquis at Vista Ridge)(1) | | 12/13 | | | 12.00 | % | | | 2,735 | | | 100% Interest in Housing for Seniors of Lewisville LLC |
UHF Inc. (Echo Station)(1) | | 12/13 | | | 12.00 | % | | | 1,668 | | | 100% Interest in UH of Temple LLC |
UHF Inc. (Cliffs of El Dorado)(1) | | 09/10 | | | 10.00 | % | | | 2,990 | | | 100% Interest in UH of McKinney LLC |
UHF Inc. (Timbers of Terrell)(1) | | 12/13 | | | 12.00 | % | | | 1,323 | | | 100% Interest in UH of Terrell LLC |
UHF Inc. (Tivoli)(1) | | 12/13 | | | 12.00 | % | | | 1,826 | | | 100% Interest in UH of Tivoli LLC |
UHF Inc. (Parkside Crossing)(1) | | 12/13 | | | 12.00 | % | | | 1,936 | | | 100% Interest in UH of Parkside Crossing |
UHF Inc. (Sendero Ridge)(1) | | 12/13 | | | 12.00 | % | | | 5,227 | | | 100% Interest in UH of Sendero Ridge LLC |
UHF Inc. (Limestone Ranch)(1) | | 12/13 | | | 12.00 | % | | | 2,250 | | | 100% Interest in UH of Vista Ridge LLC |
UHF Inc. (Limestone Canyon)(1) | | 12/13 | | | 12.00 | % | | | 3,080 | | | 100% Interest in UH of Austin LLC |
Accrued interest | | | | | | | | | 1,304 | | | |
Allowance for estimated losses | | | | | | | | | (2,804 | ) | | |
| | | | | | | | | | | | |
Total | | | | | | | | $ | 45,247 | | | |
| | | | | | | | | | | | |
| | | Maturity | | Interest | | | | |
| Borrower | Date | | Rate | | Amount | | Security |
| Performing loans: | | | | | | | |
| | Miscellaneous related party notes (1) | Various | | Various | | $ 664 | | Various secured and unsecured interests |
| | S Breeze I-V, LLC | 09/13 | | 5.00% | | 2,590 | | 6% Class A and 25% Class B Limited Partner Interests |
| | Unified Housing Foundation, Inc. (Echo Station) (1) | 12/27 | | 5.25% | | 1,481 | | 100% Interest in Unified Housing of Temple, LLC |
| | Unified Housing Foundation, Inc. (Lakeshore Villas) (1) | 12/27 | | 5.25% | | 2,000 | | Unsecured |
| | Unified Housing Foundation, Inc. (Lakeshore Villas) (1) | 12/27 | | 5.25% | | 6,363 | | Membership interest in Housing for Seniors of Humble, LLC |
| | Unified Housing Foundation, Inc. (Limestone Canyon) (1) | 12/27 | | 5.25% | | 4,663 | | 100% Interest in Unified Housing of Austin, LLC |
| | Unified Housing Foundation, Inc. (Limestone Canyon) (1) | 12/27 | | 5.25% | | 3,057 | | 100% Interest in Unified Housing of Austin, LLC |
| | Unified Housing Foundation, Inc. (Limestone Ranch) (1) | 12/27 | | 5.25% | | 6,000 | | 100% Interest in Unified Housing of Vista Ridge, LLC |
| | Unified Housing Foundation, Inc. (Limestone Ranch) (1) | 12/27 | | 5.25% | | 2,250 | | 100% Interest in Unified Housing of Vista Ridge, LLC |
| | Unified Housing Foundation, Inc. (Parkside Crossing) (1) | 12/27 | | 5.25% | | 1,936 | | 100% Interest in Unified Housing of Parkside Crossing, LLC |
| | Unified Housing Foundation, Inc. (Sendero Ridge) (1) | 12/27 | | 5.25% | | 4,812 | | 100% Interest in Unified Housing of Sendero Ridge, LLC |
| | Unified Housing Foundation, Inc. (Sendero Ridge) (1) | 12/27 | | 5.25% | | 5,174 | | 100% Interest in Unified Housing of Sendero Ridge, LLC |
| | Unified Housing Foundation, Inc. (Timbers of Terrell) (1) | 12/27 | | 5.25% | | 1,323 | | 100% Interest in Unified Housing of Terrell, LLC |
| | Unified Housing Foundation, Inc. (Tivoli) (1) | 12/27 | | 5.25% | | 7,966 | | 100% Interest in Unified Housing of Tivoli, LLC |
| | Unified Housing Foundation, Inc. (1) | 12/13 | | 5.00% | | 6,000 | | Unsecured |
| | Accrued interest | | | | | 4,358 | | |
| Total Performing | | | | | $ 60,637 | | |
| | | | | | | | | |
| Non-Performing loans: | | | | | | | |
| | Miscellaneous non-related party notes | Various | | Various | | 640 | | Various secured and unsecured interests |
| | Accrued interest | | | | | 83 | | |
| Total Non-Performing | | | | | $ 723 | | |
| | | | | | | | | |
| | | | | | | | | |
| | Allowance for estimated losses | | | | | (2,262) | | |
| Total | | | | | $ 59,098 | | |
(1) | Related Partyparty notes |
On February 29, 2012, we received $3.3 million from UHF as payoff for the $3.0 note receivable due from UHF, related to Cliffs of El Dorado and $0.3 million in accrued interest.
(2)
| Renegotiating note
|
TRANSCONTINENTAL REALTY INVESTORS, INC.
NOTES TO FINANCIAL STATEMENTS—(Continued)
Junior Mortgage Loans.Loans. We may invest in junior mortgage loans, secured by mortgages that are subordinate to one or more prior liens either on the fee or a leasehold interest in real estate. Recourse on such loans ordinarily includes the real estate on which the loan is made, other collateral and personal guarantees by the borrower. The Board of Directors restricts investment in junior mortgage loans, excluding wraparound mortgage loans, to not more than 10.0% of our assets. At December 31, 2009, 2.8%2012, 5.4% of our assets were invested in junior and wraparound mortgage loans.
Interest income is recognized on performing notes receivable as it becomes due. Effective 2009,
We record interest income
is recordedas earned in accordance with the terms of the related loan agreements. Prior to January 1, 2012, on cash flow notes
receivable whenwhere payments are based upon surplus cash from operations, accrued but unpaid interest income was only recognized to the extent cash is received.
No accruedAs of January 1, 2012, due to the consistency of cash received on the surplus cash notes, we are recording interest
income is recorded on non-performing notes receivable.as earned.
As of December 31,
2009,2012, the obligors on
$39.7$53.7 million or
82.6%94.3% of the mortgage notes receivable portfolio were due from
affiliatedrelated entities.
At December 31, 2009, 2.8% of our assets were invested in notes and interest receivable.Related Party
In 2009, TCI paid Prime, its affiliates and related parties $11.9 million in advisory fees, $0.1 million incentive and net income fees,Also at that date, $0.6 million or 1.1% of the mortgage notes receivable portfolio was non-performing.
NOTE 4. ALLOWANCE FOR ESTIMATED LOSSES
The allowance account was reviewed and there were no additional allowances recorded for receivables in
mortgage brokerage and equity refinancing fees, $2.1 million2012. The decrease in
property and construction management, and leasing commissions, $0.1 million in property acquisition fees, $1.1 million in real estate brokerage commissions, $0.9 million in construction supervision fees. In addition, as provided2012 was due to two notes that were written off in the
Advisory Agreement, Prime received cost reimbursementscurrent year, both of
$3.7 million.NOTE 4. ALLOWANCE | FOR ESTIMATED LOSSES |
which were fully reserved. The decrease in 2011 was due to a loan payment that had an allowance. The allowance account was reviewed and increased in 2007 and 2008. There were no additional allowances for receivables in 2009;2010. The table below shows our allowance decreased in the current year due to a loan pay off that had an allowance, as shown belowfor estimated losses (dollars in thousands).
| | | | | | | | | | |
| | | 2009 | | | 2008 | | 2007 |
Balance January 1, | | $ | 3,293 | | | $ | 1,978 | | $ | — |
(Decrease) Increase in provision | | | (489 | ) | | | 1,315 | | | 1,978 |
| | | | | | | | | | |
Balance December 31, | | $ | 2,804 | | | $ | 3,293 | | $ | 1,978 |
| | | | | | | | | | |
NOTE 5. INVESTMENT | IN UNCONSOLIDATED SUBSIDIARIES AND INVESTEES |
:
| | | 2012 | | | 2011 | | | 2010 | |
| | | | | | | | | | |
| Balance January 1, | | $ | 3,942 | | | $ | 4,741 | | | $ | 2,804 | |
| (Decrease) Increase in provision | | | (1,680 | ) | | | (799 | ) | | | 1,937 | |
| Balance December 31, | | $ | 2,262 | | | $ | 3,942 | | | $ | 4,741 | |
NOTE 5. INVESTMENT IN UNCONSOLIDATED SUBSIDIARIES AND INVESTEES
Investments in unconsolidated subsidiaries, jointly owned companies and other investees in which we have a 20% to 50% interest or otherwise exercise significant influence are carried at cost, adjusted for the Company’s proportionate share of their undistributed earnings or losses, via the equity method of accounting. ARL is our parent
company. Income Opportunity Investors, Inc. (“IOT”) is a related entitycompany and
as of July, 2009 is now a fully consolidated subsidiary. Both ARL and IOT are considered unconsolidated subsidiaries for 2008, but only ARL is considered
as an unconsolidated
subsidiary for 2009.TRANSCONTINENTAL REALTY INVESTORS, INC.
NOTES TO FINANCIAL STATEMENTS—(Continued)
subsidiary.
Investments accounted for via the equity method consists of the following:
| | | Percentage ownership as of December 31, | |
| | | 2012 | | | 2011 | | | 2010 | |
American Realty Investors, Inc.(1) | | | 1.99 | % | | | 2.05 | % | | | 2.47 | % |
Garden Centura, L.P.(2) | | | 0.00 | % | | | 0.00 | % | | | 5.00 | % |
| | | | | |
| | | Percent ownership | |
Investee | | 2009 | | 2008 | |
American Realty Investors, Inc.(1) | | 3% | | 3 | % |
Income Opportunity Investors, Inc.(3) | | N/A | | 25 | % |
Garden Centura, LP(2) | | 5% | | 5 | % |
| | (1)Unconsolidated Investment in Parent Company | Unconsolidated subsidiary
| | | | | | | | |
(3) | Consolidated subsidiaryInvestees sold as of 7/09
December 28, 2011 | | | | | | | | | |
Our interest in the common stock of ARL and our partnership interest in Garden Centura, LP, in the amount of 3% and 5% respectively, are1.99% is accounted for under the equity method because we exercise significant influence over the operations and financial activities. Accordingly, the investments are carried at cost, adjusted for the companies’ proportionate share of earnings or losses. On December 28, 2011, we sold our investment in Garden Centura, L.P.
The market values, other than unconsolidated subsidiaries, as of the year ended December 31,
20092012, 2011 and
20082010 were not determinable as there were no readily traded markets for these entities.
The following is a summary of the financial position and results of operations from our unconsolidated subsidiaries and investees (dollars in thousands):
| | | | | | | | | | | | |
2009 | | Unconsolidated
Subsidiaries | | | Other
Investees | | | Total | |
Real estate, net of accumulated depreciation | | $ | 236,413 | | | $ | 77,043 | | | $ | 313,456 | |
Notes receivable | | | 41,176 | | | | — | | | | 41,176 | |
Other assets | | | 174,038 | | | | 6,466 | | | | 180,504 | |
Notes payable | | | (233,490 | ) | | | (48,261 | ) | | | (281,751 | ) |
Other liabilities | | | (111,780 | ) | | | (2,625 | ) | | | (114,405 | ) |
Shareholders equity/partners capital | | $ | (106,357 | ) | | $ | (32,623 | ) | | $ | (138,980 | ) |
| | | | | | | | | | | | |
Rents and interest and other income | | $ | 38,180 | | | $ | 9,819 | | | $ | 47,999 | |
Depreciation | | | (2,593 | ) | | | (3,215 | ) | | | (5,808 | ) |
Operating expenses | | | (35,029 | ) | | | (3,912 | ) | | | (38,941 | ) |
Gain on land sales | | | 5,309 | | | | — | | | | 5,309 | |
Interest expense | | | (18,000 | ) | | | (3,157 | ) | | | (21,157 | ) |
| | | | | | | | | | | | |
Income from continuing operations | | | (12,133 | ) | | | (465 | ) | | | (12,598 | ) |
Income from discontinued operations | | | — | | | | — | | | | — | |
| | | | | | | | | | | | |
Net income | | $ | (12,133 | ) | | $ | (465 | ) | | $ | (12,598 | ) |
| | | | | | | | | | | | |
Companys proportionate share of earnings | | $ | (298 | ) | | $ | (23 | ) | | $ | (321 | ) |
| | | | | | | | | | | | |
| 2012 | | Unconsolidated Subsidiaries | | | Other Investees | | | Total | |
| Real estate, net of accumulated depreciation | | $ | 45,860 | | | $ | - | | | $ | 45,860 | |
| Notes Receivable | | | 44,371 | | | | - | | | | 44,371 | |
| Other assets | | | 130,420 | | | | - | | | | 130,420 | |
| Notes payable | | | (61,720 | ) | | | - | | | | (61,720 | ) |
| Other liabilities | | | (53,207 | ) | | | - | | | | (53,207 | ) |
| Shareholders equity/partners' capital | | | (74,895 | ) | | | - | | | | (74,895 | ) |
| | | | | | | | | | | | | |
| | | | | | | | | | | | | |
| Rents and interest and other income | | $ | 8,198 | | | $ | - | | | $ | 8,198 | |
| Depreciation | | | (263 | ) | | | - | | | | (263 | ) |
| Operating expenses | | | (4,013 | ) | | | - | | | | (4,013 | ) |
| Loss on land sales | | | (1,869 | ) | | | - | | | | (1,869 | ) |
| Interest expense | | | (4,284 | ) | | | - | | | | (4,284 | ) |
| Loss from continuing operations | | | (2,231 | ) | | | - | | | | (2,231 | ) |
| Income from discontinued operations | | | 2,691 | | | | - | | | | 2,691 | |
| Net loss | | $ | 460 | | | $ | - | | | $ | 460 | |
| | | | | | | | | | | | | |
| Company's proportionate share of loss | | $ | 9 | | | $ | - | | | $ | 9 | |
| 2011 | | Unconsolidated Subsidiaries | | Other Investees | | Total | |
| Real estate, net of accumulated depreciation | | $ | 60,703 | | | $ | 71,987 | | | $ | 132,690 | |
| Notes Receivable | | | 27,447 | | | | - | | | | 27,447 | |
| Other assets | | | 138,927 | | | | 4,441 | | | | 143,368 | |
| Notes payable | | | (59,744 | ) | | | (47,091 | ) | | | (106,835 | ) |
| Other liabilities | | | (88,647 | ) | | | (2,849 | ) | | | (91,496 | ) |
| Shareholders equity/partners' capital | | | (78,686 | ) | | | (26,488 | ) | | | (105,174 | ) |
| | | | | | | | | | | | | |
| | | | | | | | | | | | | |
| Rents and interest and other income | | $ | 8,021 | | | $ | 7,096 | | | $ | 15,117 | |
| Depreciation | | | 56 | | | | (3,133 | ) | | | (3,077 | ) |
| Operating expenses | | | (8,196 | ) | | | (3,999 | ) | | | (12,195 | ) |
| Gain on land sales | | | 23,646 | | | | - | | | | 23,646 | |
| Interest expense | | | (7,562 | ) | | | (2,307 | ) | | | (9,869 | ) |
| Income (loss) from continuing operations | | | 15,965 | | | | (2,343 | ) | | | 13,622 | |
| Income from discontinued operations | | | 9,864 | | | | - | | | | 9,864 | |
| Net income (loss) | | $ | 25,829 | | | $ | (2,343 | ) | | $ | 23,486 | |
| | | | | | | | | | | | | |
| Company's proportionate share of earnings (loss) | | $ | 530 | | | $ | (117 | ) | | $ | 413 | |
| | | | | | | | | | | | | |
| | | | | | | | | | | | | |
| | | | | | | | | | | | | |
| 2010 | | Unconsolidated Subsidiaries | | Other Investees | | Total | |
| Real estate, net of accumulated depreciation | | $ | 203,367 | | | $ | 74,573 | | | $ | 277,940 | |
| Notes Receivable | | | 24,868 | | | | - | | | | 24,868 | |
| Other assets | | | 184,735 | | | | 5,333 | | | | 190,068 | |
| Notes payable | | | (232,952 | ) | | | (48,258 | ) | | | (281,210 | ) |
| Other liabilities | | | (119,425 | ) | | | (2,815 | ) | | | (122,240 | ) |
| Shareholders equity/partners' capital | | | (60,593 | ) | | | (28,833 | ) | | | (89,426 | ) |
| | | | | | | | | | | | | |
| | | | | | | | | | | | | |
| Rents and interest and other income | | $ | 8,307 | | | $ | 6,428 | | | $ | 14,735 | |
| Depreciation | | | (252 | ) | | | (3,089 | ) | | | (3,341 | ) |
| Operating expenses | | | (39,457 | ) | | | (3,858 | ) | | | (43,315 | ) |
| Gain on land sales | | | 5,286 | | | | - | | | | 5,286 | |
| Interest expense | | | (11,008 | ) | | | (3,271 | ) | | | (14,279 | ) |
| Loss from continuing operations | | | (37,124 | ) | | | (3,790 | ) | | | (40,914 | ) |
| Loss from discontinued operations | | | (3,690 | ) | | | - | | | | (3,690 | ) |
| Net loss | | $ | (40,814 | ) | | $ | (3,790 | ) | | $ | (44,604 | ) |
| | | | | | | | | | | | | |
| Company's proportionate share of loss | | $ | (1,010 | ) | | $ | (190 | ) | | $ | (1,200 | ) |
TRANSCONTINENTAL REALTY INVESTORS, INC.NOTE 6. NOTES TO FINANCIAL STATEMENTS—(Continued)AND INTEREST PAYABLE
| | | | | | | | | | | | |
2008 | | Unconsolidated
Subsidiaries | | | Other
Investees | | | Total | |
Real estate, net of accumulated depreciation | | $ | 274,242 | | | $ | 79,436 | | | $ | 353,678 | |
Notes receivable | | | 82,840 | | | | — | | | | 82,840 | |
Other assets | | | 229,081 | | | | 6,841 | | | | 235,922 | |
Notes payable | | | (272,328 | ) | | | (50,723 | ) | | | (323,051 | ) |
Other liabilities | | | (127,288 | ) | | | (2,466 | ) | | | (129,754 | ) |
Shareholders equity/partners capital | | $ | (186,547 | ) | | $ | (33,088 | ) | | $ | (219,635 | ) |
| | | | | | | | | | | | |
Rents and interest and other income | | $ | 48,132 | | | $ | 10,997 | | | $ | 59,129 | |
Depreciation | | | (2,914 | ) | | | (3,032 | ) | | | (5,946 | ) |
Operating expenses | | | (46,918 | ) | | | (4,149 | ) | | | (51,067 | ) |
Gain on land sales | | | 1,769 | | | | — | | | | 1,769 | |
Interest expense | | | (20,527 | ) | | | (3,336 | ) | | | (23,863 | ) |
| | | | | | | | | | | | |
Income from continuing operations | | | (20,458 | ) | | | 480 | | | | (19,978 | ) |
Income from discontinued operations | | | 41,686 | | | | — | | | | 41,686 | |
| | | | | | | | | | | | |
Net income | | $ | 21,228 | | | $ | 480 | | | $ | 21,708 | |
| | | | | | | | | | | | |
Companys proportionate share of earnings | | $ | 6,517 | | | $ | 24 | | | $ | 6,541 | |
| | | | | | | | | | | | |
| | | |
2007 | | Unconsolidated
Subsidiaries | | | Other
Investees | | | Total | |
Real estate, net of accumulated depreciation | | $ | 270,743 | | | $ | 81,389 | | | $ | 352,132 | |
Notes receivable | | | 87,247 | | | | — | | | | 87,247 | |
Other assets | | | 238,251 | | | | 7,302 | | | | 245,553 | |
Notes payable | | | (315,528 | ) | | | (53,614 | ) | | | (369,142 | ) |
Other liabilities | | | (109,513 | ) | | | (2,469 | ) | | | (111,982 | ) |
Shareholders equity/partners capital | | $ | (171,200 | ) | | $ | (32,608 | ) | | $ | (203,808 | ) |
| | | | | | | | | | | | |
Rents and interest and other income | | $ | 59,274 | | | $ | 9,844 | | | $ | 69,118 | |
Depreciation | | | (2,840 | ) | | | (2,829 | ) | | | (5,669 | ) |
Operating expenses | | | (52,038 | ) | | | (4,562 | ) | | | (56,600 | ) |
Gain on land sales | | | 7,495 | | | | — | | | | 7,495 | |
Interest expense | | | (25,844 | ) | | | (2,846 | ) | | | (28,690 | ) |
| | | | | | | | | | | | |
Income from continuing operations | | | (13,953 | ) | | | (393 | ) | | | (14,346 | ) |
Income from discontinued operations | | | 29,254 | | | | — | | | | 29,254 | |
| | | | | | | | | | | | |
Net income | | $ | 15,301 | | | $ | (393 | ) | | $ | 14,908 | |
| | | | | | | | | | | | |
Companys proportionate share of earnings | | $ | 850 | | | $ | (20 | ) | | $ | 830 | |
| | | | | | | | | | | | |
NOTE 6. INVESTMENTS | IN SECURITIES |
Our investments in securities include equity investments in Realty Korea CR-REIT, Ltd. (“CR-REIT”), which was traded on the Korean stock exchange until its dissolution in 2008. We received our final distribution in 2009 and recorded a gain of $2.8 million.
TRANSCONTINENTAL REALTY INVESTORS, INC.
NOTES TO FINANCIAL STATEMENTS—(Continued)
NOTE 7. NOTES | AND INTEREST PAYABLE |
The scheduled principal payments of our notes payable over the next five years and thereafter are due as follows (dollars in thousands):
| | | |
2010 | | $ | 361,444 |
2011 | | | 155,552 |
2012 | | | 20,042 |
2013 | | | 92,036 |
2014 | | | 12,328 |
Thereafter | | | 541,820 |
| | | |
| | $ | 1,183,222 |
| | | |
| Year | | Amount | |
| 2013 | | $ | 189,931 | |
| 2014 | | | 45,045 | |
| 2015 | | | 17,299 | |
| 2016 | | | 65,740 | |
| 2017 | | | 7,180 | |
| Thereafter | | | 474,385 | |
| Total | | $ | 799,580 | |
Interest payable at December 31, 20092012 was $5.4$8.5 million. Interest accrues at rates ranging from 2.0%1.1% to 13.0%12.5% per annum, and mature between 20092013 and 2049.2053. The mortgages were collateralized by deeds of trust on real estate having a net carrying value of $1.2 billion.$885.9 million. Of the total notes payable, the senior debt is $781.2 million, junior debt is $16.1 million, and other debt is $2.3 million. Included in other debt are property tax loans of $0.5 million.
With respect to the additional notes payable due to the acquisition of properties
or refinancing of existing mortgages, a summary of some of the more significant transactions are discussed below:
Commercial Properties
In connection with
On January 30, 2012, we refinanced the purchaseexisting mortgage on Parc at Maumelle apartments, a 240-unit complex located in Little Rock, Arkansas, for a new mortgage of Keller Springs Technical Center office building in Carrollton, Texas on November 9, 2009, we assumed$16.8 million. We paid off the existing mortgage of $6.0$16.1 million collateralized by the office building purchased.and paid $1.0 million in closing costs and escrow reserves. The note accrues interest at 7.41%. The note is payable in monthly installments3.00% and payments of interest and principal withare due monthly based upon a 40-year amortization schedule, maturing on February 1, 2052.
On February 29, 2012, we refinanced the
balance due along with all unpaid and accrued interest due at maturityexisting mortgage on
January 1, 2010.Huntington Ridge apartments, a 198-unit complex located in DeSoto, Texas, for a new mortgage of $15.0 million. We
are currently negotiating an extension with the current lender.Land
In connection with the purchase of Gautier land in Gautier, Mississippi on September 23, 2009, we financed the acquisition with seller financing of $750,000 and $1.6 million from the Katrina Community Development Block Grant (“KCDBG”) issued by the Mississippi Development Authority for the construction of an apartment complex. The seller financing accrues interest at 6% and is payable in monthly installments of interest only with the balance due along with all unpaid and accrued interest due at maturity on September 23, 2010. We used $1.6 million of the KCDBG funds to acquire the land parcel to develop into an apartment complex. 100% of the funds will be repaid from 50% of the distributable cash flow and as a priority payment from the proceeds of any refinancing or sale of the project.
In connection with the purchase of McKinney Ranch land in McKinney, Texas on November 9, 2009, we assumedpaid off the existing mortgage of $5.3$14.6 million collateralized by the land purchased.and paid $1.2 million in closing costs and escrow reserves. The note accrues interest at 4.25%3.03% and is payablepayments of interest and principal are due monthly based upon a 40-year amortization schedule, maturing on March 1, 2052.
On February 29, 2012, we refinanced the existing mortgage on Laguna Vista apartments, a 206-unit complex located in
monthly installmentsDallas, Texas, for a new mortgage of
principal$17.7 million. We paid off the existing mortgage of $17.0 million and
interest with the balance due along with all unpaid and accrued interest due at maturity on January 1, 2011.NOTE 8. RELATED | PARTY TRANSACTIONS |
TCI received $3.4paid $1.1 million in 2009, $2.8closing costs and escrow reserves. The note accrues interest at 3.03% and payments of interest and principal are due monthly based upon a 40-year amortization schedule, maturing on March 1, 2052.
On February 29, 2012, we refinanced the existing mortgage on Savoy of Garland apartments, a 144-unit complex located in Garland, Texas, for a new mortgage of $10.3 million. We paid off the existing mortgage of $10.2 million and paid $0.9 million in
2008, and $2.2 million in 2007 from Prime and its affiliates for rents of TCI-owned properties, including One Hickory, Two Hickory, Addison Hanger, Browning Place, Fenton Centre, 1010 Common, 600 Las Colinas, Amoco, Parkway North, Thermalloy, Senlac, Folsom land, Eagle Crest, and 2010 Valley View.TRANSCONTINENTAL REALTY INVESTORS, INC.
NOTES TO FINANCIAL STATEMENTS—(Continued)
TCI financial results are consolidated with ARL Form 10-K and related consolidated financial statements. As of December 31, 2009, ARL owned 82.8% of the outstanding TCI common shares.
The Advisory Agreement calls for Prime to receive an advisory fee from TCI comprised of a gross asset fee of .0625% per month of the average of the gross asset value and an annual net income fee equal to 7.5% of TCI’s net income, after certain adjustments (see Note 15). Prime receives cost reimbursement of certain expenses incurred by it in the performance of advisory services (See Note 15).
A sales incentive fee is paid to Prime equal to 10.0% of the amount by which the aggregate sales consideration for all real estate sold by TCI during the year exceeds the sum of the cost of each property, capital improvements and closing costs incurredand escrow reserves. The note accrues interest at 3.03% and payments of interest and principal are due monthly based upon a 40-year amortization schedule, maturing on March 1, 2052.
On March 1, 2012, the construction loan in
the sale of such real estate; provided, such real estate sold has produced an 8.0% simple annual return on the net investment and the aggregate net operating income from all real estate owned for each of the prior and current years shall be at least 5.0% higher in the current year than in the prior year (see Note 15).Prime is to receive a property acquisition fee for locating, leasing or purchasing real estate for TCI equal to 1.0% of the amount of $11.1 million that was taken out on July 30, 2010 to fund the development of Sonoma Court apartments, a 124-unit complex, closed into permanent financing. The note accrues interest at 5.35% and payments of interest and principal are due monthly based upon a 40-year amortization schedule, maturing on November 1, 2051.
On March 28, 2012, the construction loan purchased (See Note 15). Mortgage brokerage and equity refinancing fees are paid to Prime for obtaining loans or refinancing on properties equal to 1.0% ofin the amount of $24.2 million that was taken out on February 18, 2010 to fund the development of Blue Ridge apartments, a 290-unit complex, closed into permanent financing. The note accrues interest at 5.37% and payments of interest and principal are due monthly based upon a 40-year amortization schedule, maturing on October 1, 2051.
On April 30, 2012, we refinanced the existing mortgage on Parc at Metro Center apartments, a 144-unit complex located in Nashville, Tennessee, for a new mortgage of $11.0 million. We paid off the existing mortgage of $10.5 million and paid $0.7 million in closing costs and escrow reserves. The note accrues interest at 2.95% and payments of interest and principal are due monthly based upon a 40-year amortization schedule, maturing on May 1, 2052.
On May 25, 2012, we refinanced the existing mortgage on Pecan Pointe apartments, a 232-unit complex located in Temple, Texas, for a new mortgage of $16.8 million. We paid off the existing mortgage of $16.4 million and paid $1.3 million in closing costs and escrow reserves. The note accrues interest at 3.03% and payments of interest and principal are due monthly based upon a 40-year amortization schedule, maturing on June 1, 2052.
On May 30, 2012, we refinanced the existing mortgage on Blue Lake Villas II apartments, a 70-unit complex located in Waxahachie, Texas, for a new mortgage of $4.1 million. We paid off the existing mortgage of $3.9 million and paid $0.2 million in closing costs and escrow reserves. The note accrues interest at 2.85% and payments of interest and principal are due monthly based upon a 40-year amortization schedule, maturing on June 1, 2052.
On June 19, 2012, the construction loan in the amount of $16.4 million that was taken out on September 14, 2010 to fund the development of Lodge at Pecan Creek apartments, a 192-unit complex, closed into permanent financing. The note accrues interest at 5.05% and payments of interest and principal are due monthly based upon a 40-year amortization schedule, maturing on March 1, 2052.
On June 28, 2012, we refinanced the existing mortgage on Lake Forest apartments, a 222-unit complex located in Houston, Texas, for a new mortgage of $12.8 million. We paid off the existing mortgage of $12.0 million and paid $1.0 million in closing costs and escrow reserves. The note accrues interest at 2.85% and payments of interest and principal are due monthly based upon a 40-year amortization schedule, maturing on July 1, 2052.
On June 28, 2012, we refinanced the existing mortgage on Mission Oaks apartments, a 228-unit complex located in San Antonio, Texas, for a new mortgage of $15.6 million. We paid off the existing mortgage of $14.9 million and paid $1.0 million in closing costs and escrow reserves. The note accrues interest at 2.95% and payments of interest and principal are due monthly based upon a 40-year amortization schedule, maturing on July 1, 2052.
On June 28, 2012, we refinanced the existing mortgage on Paramount Terrace apartments, a 181-unit complex located in Amarillo, Texas, for a new mortgage of $3.2 million. We paid off the existing mortgage of $2.8 million and paid $0.4 million in closing costs and escrow reserves. The note accrues interest at 2.85% and payments of interest and principal are due monthly based upon a 40-year amortization schedule, maturing on July 1, 2045.
On June 28, 2012, we refinanced the existing mortgage on Sugar Mill apartments, a 160-unit complex located in Addis, Louisiana, for a new mortgage of $12.0 million. We paid off the existing mortgage of $11.8 million and paid $1.0 million in closing costs and escrow reserves. The note accrues interest at 2.85% and payments of interest and principal are due monthly based upon a 40-year amortization schedule, maturing on July 1, 2052.
NOTE 7. RELATED PARTY TRANSACTIONS AND FEES
We apply ASC Topic 805, “Business Combinations”, to evaluate business relationships. Related parties are persons or
amount refinanced (see Note 15).entities who have one or more of the following characteristics, which include entities for which investments in their equity securities would be required, trust for the benefit of persons including principal owners of the entities and members of their immediate families, management personnel of the entity and members of their immediate families and other parties with which the entity may deal if one party controls or can significantly influence the decision making of the other to an extent that one of the transacting parties might be prevented from fully pursuing its own separate interests, or affiliates of the entity.
The Company has historically engaged in and may continue to engage in certain business transactions with related parties, including but not limited to asset acquisition and dispositions. Transactions involving related parties cannot be presumed to be carried out on an arm’s length basis due to the absence of free market forces that naturally exist in business dealings between two or more unrelated entities. Related party transactions may not always be favorable to our business and may include terms, conditions and agreements that are not necessarily beneficial to or in our best interest.
Effective since April 30, 2011, Pillar, the sole shareholder of which is Realty Advisors, LLC, a Nevada limited liability company, the sole member of which is Realty Advisors, Inc., a Nevada corporation, the sole shareholder of which is Realty Advisors Management, Inc., a Nevada corporation, the sole shareholder of which is a trust known as the May Trust, became the Company’s external Advisor and Cash Manager. Pillar’s duties include, but are not limited to, locating, evaluating and recommending real estate and real estate-related investment opportunities. Pillar also arranges, for the Company’s benefit, debt and equity financing with third party lenders and investors. Pillar also serves as an Advisor and Cash Manager to TCI and
IOT. As the
contractual advisor,
agreed to charge interest on the outstanding balance of funds advanced to or from TCI.Pillar is compensated by TCI under an Advisory Agreement that is more fully described in Part III, Item 10. “Directors, Executive Officers and Corporate Governance – The
interest rate, set at the beginning of each month, is the prime rate plus 1% on the average daily cash balances advanced (see Note 15).Regis is entitled to receive a sliding scale real estate brokerage fee of 1.5% to 4.5% for property purchases and sales based on the transaction amount (see Note 15)Advisor”. TCI payshas no employees. Employees of Pillar render services to TCI in accordance with the terms of the Advisory Agreement. Prime Income Asset Management, LLC (“Prime”) served as the Company’s contractual Advisor prior to April 30, 2011.
Effective since January 1, 2011, Regis a construction supervision feeRealty Prime, LLC, dba Regis Property Management, LLC (“Regis”), the sole member of 6% on all construction projects in progress (see Note 13).which is Realty Advisors, LLC, manages our commercial properties and provides brokerage services. Regis receives property andmanagement fees, construction management fees and leasing commissions in accordance with the terms of its property-level management agreement. Regis is also entitled to receive real estate brokerage commissions in accordance with the terms of a non-exclusive brokerage agreement. See Part III, Item 10. “Directors, Executive Officers and Corporate Governance – Property Management and Real Estate Brokerage”. Prior to December 31, 2010, Triad Realty Services, L.P. (“Triad”), provided management services for our commercial properties. Triad subcontracted the property-level management and leasing of our commercial properties (office buildings, shopping centers and industrial warehouses) to Regis Realty I, LLC (“Regis I”). TCI engages third-party companies to lease and manage its apartment properties.
Below is a description of the related party transactions and fees between Pillar, Prime, Triad, Regis I, and Regis:
| Fees, expenses and revenue paid to and/or received from our advisor: | | | | | | | | | |
| | | | 2012 | | | 2011 | | | 2010 | |
| | | | | | | (dollars in thousands) | |
| Fees: | | | | | | | | | | |
| | Advisory fee | | $ | 8,915 | | | $ | 9,957 | | | $ | 11,919 | |
| | Construction advisory fee | | | 181 | | | | 2,429 | | | | 1,761 | |
| | Mortgage brokerage and equity refinancing | | | 1,873 | | | | 812 | | | | 1,569 | |
| | Net income fee | | | 180 | | | | 54 | | | | 99 | |
| | Property acquisition | | | 20 | | | | - | | | | 31 | |
| | | | $ | 11,169 | | | $ | 13,252 | | | $ | 15,379 | |
| Other Expense: | | | | | | | | | | | | | |
| | Cost reimbursements | | $ | 2,247 | | | $ | 2,908 | | | $ | 3,250 | |
| | Interest paid | | | 1,194 | | | | 1,048 | | | | 2,350 | |
| | | | $ | 3,441 | | | $ | 3,956 | | | $ | 5,600 | |
| Revenue: | | | | | | | | | | | | | |
| | Rental revenue | | $ | 587 | | | $ | 434 | | | $ | 2,248 | |
| | | | | | | | | | | | | | |
| | | | | | | | | | | | | | |
| | | | | | | | | | | | | | |
| Fees paid to Triad, an affiliate, Regis I, Regis and related parties: | | | | | | | | | | | | |
| | | | | 2012 | | | | 2011 | | | | 2010 | |
| | | | | | | | (dollars in thousands) | |
| Fees: | | | | | | | | | | | | | |
| | Property acquisition | | $ | 71 | | | $ | - | | | $ | 106 | |
| | Property management, construction management and leasing commissions | | | 2,087 | | | | 1,759 | | | | 1,905 | |
| | Real estate brokerage | | | 2,263 | | | | - | | | | 1,497 | |
| | | | $ | 4,421 | | | $ | 1,759 | | | $ | 3,508 | |
The Company received rental revenue of $0.6 million in 2012, $0.4 million in 2011, and $2.2 million in 2010 from Pillar, Prime and its related parties for properties owned by the Company, including Addison Hanger, Browning Place, Eagle Crest, Folsom land, One Hickory, Senlac, Thermalloy and Two Hickory.
As of December 31, 2012, the Company had notes and interest receivables of $58.0 million due from related parties. See Part 2, Item 8. Note 3. “Notes and Interest Receivable”. During the current period, TCI recognized $11.7 million of interest income from these related party notes receivables.
On February 29, 2012, we received $3.3 million from UHF as payoff for the $3.0 note receivable due from UHF, related to Cliffs of El Dorado and $0.3 million in accrued interest.
On September 30, 2012, we sold the Realty Advisors Management Inc. note to our parent, ARI, for full carrying value. Consideration for this note was a reduction of the Company’s payable to ARL.
The Company has a development agreement with Triad (see Note 15)Unified Housing Foundation, Inc. (“UHF”) a non-profit corporation that provides management services for the development of residential apartment projects in the future. The Company has also invested in surplus cash notes receivables from UHF and has sold several residential apartment properties to UHF in prior years. Due to this ongoing relationship and the significant investment in the performance of the collateral secured under the notes receivable, UHF has been determined to be a related party. The Company received $6 million in revenue, in the current period, from the development agreement.
The Company is part of a tax sharing and compensating agreement with respect to federal income taxes between ARL, TCI and IOT and their subsidiaries that was entered into in July of 2009. That agreement continued until August 31, 2012 at which time a new tax sharing and compensating agreement was entered into by ARL, TCI, IOT and RAMI for the remainder of 2012. The expense (benefit) in each year was calculated based on the amount of losses absorbed by taxable income multiplied by the maximum statutory tax rate of 35%.
The following table reconciles the beginning and ending balances of affiliated accountsrelated party payables as of December 31, 20092012 (dollars in thousands):
| | | Pillar | | | ARL | | | Total | |
| | | | | | | | | | |
| Related party payable, December 31, 2011 | | $ | - | | | $ | (17,465 | ) | | $ | (17,465 | ) |
| Cash transfers | | | 18,573 | | | | - | | | | 18,573 | |
| Advisory fees | | | (8,915 | ) | | | - | | | | (8,915 | ) |
| Net income fee | | | (180 | ) | | | - | | | | (180 | ) |
| Fees and commissions | | | (4,227 | ) | | | - | | | | (4,227 | ) |
| Construction advisory fees | | | (181 | ) | | | - | | | | (181 | ) |
| Cost reimbursements | | | (2,247 | ) | | | - | | | | (2,247 | ) |
| Interest (to) from advisor | | | (839 | ) | | | - | | | | (839 | ) |
| POA fees | | | (167 | ) | | | - | | | | (167 | ) |
| Expenses paid by advisor | | | (918 | ) | | | - | | | | (918 | ) |
| Financing (mortgage payments) | | | 1,793 | | | | - | | | | 1,793 | |
| Note receivable with affiliate | | | 21,282 | | | | - | | | | 21,282 | |
| Sales/Purchases transactions | | | (15,702 | ) | | | - | | | | (15,702 | ) |
| Intercompany property transfers | | | (864 | ) | | | - | | | | (864 | ) |
| Purchase of obligations | | | (7,408 | ) | | | 7,408 | | | | - | |
| Related party payable, December 31, 2012 | | $ | - | | | $ | (10,057 | ) | | $ | (10,057 | ) |
Below are sales and acquisitions that involve a related party:
On January 1, 2012, ARL and TCI agreed to rescind the April 1, 2011 sale of 100% of the general and limited partnership interest in Garden Whispering Pines, LP, which owns Whispering Pines apartments, a 320-unit complex located in Topeka, Kansas.
On January 3, 2012, 82.2 acres of land known as Denton Coonrod land located in Denton County, Texas was transferred to the existing lender. This land parcel was previously sold, on March 23, 2011, to Cross County National Associates, LP, a related party, for a sales price of $1.8 million. The Company did not recognize or record the sale in accordance with ASC 360-20 due to our continuing involvement, which included the potential payment of cash shortfalls, future obligations under the existing mortgage and guaranty, the buyer’s inadequate initial investment and the Company’s questionable recovery of investment cost. The Company determined that no sale had occurred for financial reporting purposes and therefore the asset remained on the books and continued to record operating expenses and depreciation as a period cost until a sale occurred that met the requirements of ASC 360-20. A sale to an independent third party, that met the requirements of ASC 360-20, took place on January 3, 2012 at a sales price equal to the existing mortgage of $0.8 million, that was considered paid in full when ownership transferred to the existing lender. We recorded a gain on sale of $0.04 million on the land parcel sale.
On February 7, 2012, 22.92 acres of land known as Andrew B land, Denton County, Texas was transferred to the existing lender. This land parcel was previously sold, on September 1, 2011, to TCI Luna Ventures, LLC, a related party, for a sales price of $1.3 million. The Company did not recognize or record the sale in accordance with ASC 360-20 due to our continuing involvement, which included the potential payment of cash shortfalls, future obligations under the existing mortgage and guaranty, the buyer’s inadequate initial investment and the Company’s questionable recovery of investment cost. The Company determined that no sale had occurred for financial reporting purposes and therefore the asset remained on the books and continued to record operating expenses and depreciation as a period cost until a sale occurred that met the requirements of ASC 360-20. A sale to an independent third party, that met the requirements of ASC 360-20, took place on February 7, 2012, when the Company received a credit against the outstanding debt of $2.1 million, which is part of a multi-tract collateral obligation, and the existing lender took possession of the property. We recorded a gain on sale of $1.2 million on the land parcel sale.
On March 1, 2012, we sold 100% of our interests in LaDue, LLC to ABC Land & Development, Inc., a related party, for a sales price of $1.9 million. This entity owns 8.01 acres of land known as LaDue land located in Dallas County, Texas. We provided $1.3 million in seller-financing with a five-year note receivable. The note accrues interest at 5% and is payable at maturity on March 1, 2017. The buyer assumed the existing mortgage of $0.6 million, secured by the property. The Company did not recognize or record the sale in accordance with ASC 360-20 due to our continuing involvement, which included the potential payment of cash shortfalls, future obligations under the existing mortgage and guaranty, the buyer’s inadequate initial investment and the Company’s questionable recovery of investment cost. The Company determined that no sale had occurred for financial reporting purposes and therefore the asset remained on the books and continued to record operating expenses and depreciation as a period cost until a sale occurred that met the requirements of ASC 360-20. On August 10, 2012, we re-purchased 100% of the membership interests in LaDue, LLC from ABC Land & Development, Inc., a related party, for $1.9 million to be paid by assumption of debt of $0.6 million, secured by the property, and cancellation of a five-year seller-financed note of $1.3 million. There is no change in the financial statements related to the March 1, 2012 sale or the subsequent re-acquisition.
On March 5, 2012, 7.39 acres of land known as DeSoto Ranch land located in DeSoto, Texas was transferred to the existing lender. This land parcel was previously sold, on September 1, 2011, to TCI Luna Ventures, LLC, a related party, for a sales price of $1.3 million. The Company did not recognize or record the sale in accordance with ASC 360-20 due to our continuing involvement, which included the potential payment of cash shortfalls, future obligations under the existing mortgage and guaranty, the buyer’s inadequate initial investment and the Company’s questionable recovery of investment cost. The Company determined that no sale had occurred for financial reporting purposes and therefore the asset remained on the books and continued to record operating expenses and depreciation as a period cost until a sale occurred that met the requirements of ASC 360-20. A sale to an independent third party, that met the requirements of ASC 360-20, took place on March 5, 2012, when the Company received a credit against the outstanding debt of $1.0 million, which is part of a multi-tract collateral obligation, and the existing lender took possession of the property. We recorded a gain on sale of $0.1 million on the land parcel sale.
On April 1, 2012, we purchased 1,000 shares of stock of Kelly Lot Development, Inc. from Tacco Financial, Inc., a related party, for $5.6 million. This entity owns six land parcels, comprising approximately 52.59 acres of undeveloped land located in Dallas County, Texas, Kaufman County, Texas, Nashville, Tennessee and Tarrant County, Texas, known as Kelly Lots land, Travis Ranch land, Nashville land, Cooks Lane land, Seminary West land and Vineyards land. We assumed the existing mortgages of $0.5 million and $0.4 million, secured by the property. The loans accrue interest at 15.00% and are payable at maturity on May 1, 2013 and November 1, 2013, respectively.
On April 3, 2012, 5.22 acres of land known as Andrew C land located in Denton, Texas was transferred to the existing lender. This land parcel was previously sold, on September 1, 2011, to TCI Luna Ventures, LLC, a related party, for a sales price of $0.4 million. The Company did not recognize or record the sale in accordance with ASC 360-20 due to our continuing involvement, which included the potential payment of cash shortfalls, future obligations under the existing mortgage and guaranty, the buyer’s inadequate initial investment and the Company’s questionable recovery of investment cost. The Company determined that no sale had occurred for financial reporting purposes and therefore the asset remained on the books and continued to record operating expenses and depreciation as a period cost until a sale occurred that met the requirements of ASC 360-20. A sale to an independent third party, that met the requirements of ASC 360-20, took place on April 3, 2012, when the Company received a credit against the outstanding debt of $0.5 million, which is part of a multi-tract collateral obligation, and the existing lender took possession of the property. We recorded a gain on sale of $0.2 million on the land parcel sale.
On August 10, 2012, we purchased 100% of the membership interests in LaDue, LLC from ABC Land & Development, Inc., a related party, for $1.9 million to be paid by assumption of debt of $0.6 million, secured by the property, and cancellation of a five-year seller-financed note of $1.3 million. This entity owns 8.01 acres of land known as LaDue land located in Dallas County, Texas. TCI originally sold the membership interests in LaDue, LLC on March 1, 2012 but did not record the sale for accounting purposes. See the above March 1, 2012 sale disclosure for details of the accounting treatment.
On December 31, 2012, 21.26 acres of land known as Pioneer Crossing land located in Austin, Texas was transferred to the existing lender. This land parcel was previously sold, on September 1, 2011, to TCI Luna Ventures, LLC, a related party, for a sales price of $1.4 million. The Company did not recognize or record the sale in accordance with ASC 360-20 due to our continuing involvement, which included the potential payment of cash shortfalls, future obligations under the existing mortgage and guaranty, the buyer’s inadequate initial investment and the Company’s questionable recovery of investment cost. The Company determined that no sale had occurred for financial reporting purposes and therefore the asset remained on the books and continued to record operating expenses and depreciation as a period cost until a sale occurred that met the requirements of ASC 360-20. A sale to an independent third party A sale to an independent third party, that met the requirements of ASC 360-20, received a credit against the outstanding debt of $0.3 million, which is part of a multi-tract collateral obligation, and the existing lender took possession of the property. We recorded a loss on sale of $1.0 million on the land parcel sale.
On December 31, 2012, we sold 100% of the stock in T Southwood 1394, Inc., to One Realco Corporation, a related party, for a sales price of $0.6 million. This entity owns 14.52 acres of land known as Southwood Land located in Tallahassee, Florida. Under the terms of the sale, the buyer assumed the existing mortgage of $0.6 million, secured by the property. The Company did not recognize or record the sale in accordance with ASC 360-20 due to our continuing involvement, which included the potential payment of cash shortfalls, future obligations under the existing mortgage and guaranty, the buyer’s inadequate initial investment and the Company’s questionable recovery of investment cost. The Company determined that no sale had occurred for financial reporting purposes and therefore the asset remained on the books and continued to record operating expenses and depreciation as a period cost until a sale occurred that met the requirements of ASC 360-20. A sale to an independent third party, that met the requirements of ASC 360-20, took place on January 8, 2013, when the property was sold to a third party and sales proceeds were credited against the outstanding debt. We will not record a gain or loss on the land parcel sale.
In December 2010, there were various commercial and land holdings sold to FRE Real Estate, Inc., a related party. During the first three months of 2011, many of these transactions were rescinded as of the original transaction date and were subsequently sold to related parties under the same ownership as FRE Real Estate, Inc. As of December 31, 2012, there is one commercial building, Thermalloy that remains in FRE Real Estate, Inc. We have deferred the recognition of the sales in accordance with ASC 360-20 due to our continuing involvement, the buyer’s inadequate initial investment and questionable recovery of the Company’s investment cost.
The properties that we have sold to a related party and have deferred the recognition of the sale are treated as “subject to sales contract” on the Consolidated Balance Sheets and are listed in detail in Schedule III, “Real Estate and Accumulated Depreciation”.
| | | | |
Balance, December 31, 2008 | | $ | (62,367 | ) |
Cash transfers | | | 69,035 | |
Cash repayments | | | (55,321 | ) |
Fees and commissions payable to affiliate | | | (21,581 | ) |
Advances due to financing proceeds | | | 13,886 | |
Note receivable with affiliate | | | 5,877 | |
Payables through Prime | | | 308 | |
| | | | |
Balance, December 31, 2009 | | $ | (50,163 | ) |
| | | | |
These properties were sold to a related party in order to help facilitate an appropriate debt or organizational restructure and may or may not be transferred back to the seller upon resolution. These properties have mortgages that are secured by the property and many have corporate guarantees. According to the loan documents, we are currently in default on these mortgages primarily due to lack of payment although we are actively involved in discussions with every lender in order to settle or cure the default situation. We have reviewed each asset and taken impairment to the extent we feel the value of the property was less than our current basis.
Acquisitions from our parent, ARL, have previously been reflected at the fair value purchase price. Upon discussion with the SEC and in review of the guidance pursuant to ASC 250-10-45-22 to 24, we have adjusted those assets, in the prior year, to reflect a basis equal to ARL’s cost basis in the asset at the time of the sale. The related party payables to ARL were reduced for the lower asset price.
TCI’s Board of Directors established a policy that dividend declarations on common stock would be determined on an annual basis following the end of each year. In accordance with that policy, no dividends on TCI’s common stock were declared for 2012, 2011, or 2010. Future distributions to common stockholders will be determined by the Board of Directors in light of conditions then existing, including the Company’s financial condition and requirements, future prospects, restrictions in financing agreements, business conditions and other factors deemed relevant by the Board.
TCI issued 30,000 shares of Series C Preferred Stock. TCI’s Series C Cumulative Convertible Preferred Stock consists of a maximum of 30,000 shares with a liquidation preference of $100.00 per share. Dividends are payable at the annual rate of $7.00 per share annually or $1.75 per quarter. After September 30, 2006, the Series C Preferred Stock may be converted into Common
Stockstock at 90.0% of the daily average closing price of the
TRANSCONTINENTAL REALTY INVESTORS, INC.
NOTES TO FINANCIAL STATEMENTS—(Continued)
Common Stock common stock for the prior five trading days. The Series C Preferred Stock is redeemable for cash at any time at the option of TCI. At December 31, 2009,2012, 30,000 shares of Series C Preferred Stock were issued and outstanding.
In November 2006, TCI
acquired approximately 3,000 acresissued 100,000 shares of
partially developed land in Forney, Texas, known as Windmill Farms for approximately $50.2 million. Forney is a suburb east of the Dallas/Fort Worth Metroplex. The purchase price was paid by issuance of $10.0 million in TCI Series D Preferred Stock
as well as additional financing arranged by Prime. Immediately upon closing, TCI sold its interest in the property to ARL, for an amount equal to its investment in the property, at no gain or loss. ARL assumed allwith a liquidation preference of
the liabilities incurred associated with the purchase.$100 per share. The
net $10.0 million proceeds from the sale to ARL were applied to reduce the balance due to Prime. The Series D Preferred Stock, whichpreferred stock is not convertible into any other security, requires dividends payable at the initial rate of 7% annually. The dividend rate increases ratably from 7% to 9% in future
periods.TCI paid no dividends on its Common Stockperiods and can be redeemed at any point after September 30, 2011. In the fourth quarter, a preferred stockholder submitted a redemption request that is currently in 2009, 2008 or 2007. The payment of dividends, if any,dispute and we believe will be determined byresolved in 2013 for no more than the Board of Directors in light of conditions then existing, including the Company’s financial condition and requirements, future prospects, restrictions in financing agreements, business conditions and other factors deemed relevant by the Board of Directors.
$1,300,000 original preferred stock issuance.
NOTE 10. STOCK OPTIONS
In October 2000, TCI’s stockholders approved the Director’s Stock Option Plan (the “Director’s Plan”) which provides for options to purchase up to 140,000 shares of TCI’s
Common Stock.common stock. Options granted pursuant to the Director’s Plan are immediately exercisable and expire on the earlier of the first anniversary of the date on which a Director ceases to be a Director or 10 years from the date of grant. Effective December 15, 2005 the plan was terminated. As of December 31,
2009, 10,0002012, there were 5,000 stock options
were outstanding
andwhich were exercisable at $14.25 per share.
NOTE 12. ADVISORY | AGREEMENT |
Prime, the sole member of which is PIAMI, is the contractual advisor to TCI. PIAMI is owned by Realty Advisors, LLC, a Nevada limited liability company the sole member of which is Realty Advisors, Inc., a Nevada corporation which is owned 100% by a Trust known as the May Trust. Until early 2009, SWI, which is 100% owned by Gene E. Phillips, owned 20% of PIAMI which SWI exchanged to Realty Advisors, Inc. for certain securities issued by SWI. The May Trust is a trust for the benefit of the children of Gene E. Phillips. Gene E. Phillips is These options will expire January 1, 2015, if not an officer, manager, or director of Prime, PIAMI, Realty Advisors, LLC, Realty Advisors, Inc. or TCI, nor is he a Trustee of the May Trust.
Under the Advisory Agreement, Prime is required to annually formulateexercised.
NOTE 11. INCOME TAXES
For 2012, 2011 and submit for Board approval a budget and business plan containing a twelve-month forecast of operations and cash flow, a general plan for asset sales and purchases, lending, foreclosure and borrowing activity and other investments. Prime is required to report quarterly to the Board on TCI’s performance against the business plan. In addition, all transactions require prior Board approval unless they are explicitly provided for in the approved business plan or are made pursuant to authority expressly delegated to Prime by the Board.The Advisory Agreement also requires prior Board approval for the retention of all consultants and third party professionals, other than legal counsel. The Advisory Agreement provides that Prime shall be deemed to be in a fiduciary relationship to the stockholders and contains a broad standard governing Prime’s liability for losses incurred by TCI.
TRANSCONTINENTAL REALTY INVESTORS, INC.
NOTES TO FINANCIAL STATEMENTS—(Continued)
The Advisory Agreement provides for Prime to be responsible for the day-to-day operations and to receive an advisory fee comprised of a gross asset fee of .0625% per month (.75% per annum) of the average of the gross asset value (total assets less allowance for amortization, depreciation or depletion and valuation reserves), and an annual net income fee equal to 7.5% of net income, after certain adjustments.
The Advisory Agreement also provides for Prime to receive an annual incentive sales fee. Prime or an affiliate of Prime is to receive an acquisition commission for supervising the purchase or long-term lease of real estate. Prime or an affiliate of Prime is also to receive a mortgage brokerage and equity refinancing fee for obtaining loans to or refinancing of TCI’s properties. In addition, Prime receives reimbursement of certain expenses incurred by it, in the performance of advisory services for TCI.
The Advisory Agreement requires Prime or any affiliate of Prime to pay to TCI one-half of any compensation received from third parties with respect to the origination, placement or brokerage of any loan made by TCI.
Under the Advisory Agreement, all or a portion of the annual advisory fee must be refunded if the Operating Expenses of TCI (as defined in the Advisory Agreement) exceed certain limits specified in the Advisory Agreement.
Additionally, if management were to request that Prime render services other than those required by the Advisory Agreement, Prime or an affiliate of Prime would be separately compensated for such additional services on terms to be agreed upon from time to time. As discussed in Note 13. “Property Management,” Triad Realty Services, Ltd. (“Triad”), an affiliate of Prime, provides property management services. As discussed in Note 14. “Real Estate Brokerage,” Regis Realty I, LLC (“Regis I”), a related party, provided, on a non-exclusive basis, brokerage services.
NOTE 13. PROPERTY | MANAGEMENT |
Triad provides property management services for a fee of 6.0% or less of the monthly gross rents collected on residential properties and 3.0% or less of the monthly gross rents collected on commercial properties under its management. Triad subcontracts with other entities for property-level management services at various rates. The general partner of Triad is PIAMI. The limited partner of Triad is HRS Holdings, LLC, (“HRSHLLC”), a related party. Triad subcontracts the property-level management and leasing of 28 of TCI’s commercial properties (office buildings, shopping centers and industrial warehouses). Regis I receives property and construction management fees and leasing commissions in accordance with the terms of its property-level management agreement with Triad. The sole member of Regis I is HRSHLLC.
Regis I provides construction management and supervision services for TCI’s properties under construction. Regis I charged fees of 6.0% of certain construction costs. Those fees totaled $0.9 million, $3.4 million and $5.4 million for 2009, 2008 and 2007, respectively.
NOTE 14. REAL | ESTATE BROKERAGE |
Regis I also provides brokerage services on a non-exclusive basis and is entitled to receive a commission for property purchases and sales, in accordance with a sliding scale of total brokerage fees to be paid by TCI.
TRANSCONTINENTAL REALTY INVESTORS, INC.
NOTES TO FINANCIAL STATEMENTS—(Continued)
NOTE 15. ADVISORY FEES, PROPERTY MANAGEMENT FEES, ETC.
Cost reimbursements are allocated based on the relative market values of the Company’s assets. The fees paid to our advisor and cost reimbursements are detailed below.
| | | | | | | | | | | |
| | | 2009 | | 2008 | | | 2007 | |
| | | (dollars in thousands) | |
Fees: | | | | | | | | | | | |
Advisory fee | | $ | 11,903 | | $ | 12,064 | | | $ | 10,704 | |
Sales incentive fee | | | — | | | 7,953 | | | | 2,564 | |
Net income fee | | | 115 | | | 3,041 | | | | (514 | ) |
Property acquisition | | | 41 | | | 1,041 | | | | 1,279 | |
Mortgage brokerage and equity refinancing | | | 592 | | | 176 | | | | 1,342 | |
| | | | | | | | | | | |
| | $ | 12,651 | | $ | 24,275 | | | $ | 15,375 | |
| | | | | | | | | | | |
Cost reimbursements | | $ | 3,733 | | $ | 4,372 | | | $ | 3,409 | |
| | | | | | | | | | | |
Rent revenue | | $ | 3,434 | | $ | 2,754 | | | $ | 2,211 | |
| | | | | | | | | | | |
Interest paid (received) | | $ | 1,593 | | $ | (500 | ) | | $ | 1,512 | |
| | | | | | | | | | | |
Fees paid to Triad, an affiliate, Regis I and related parties:
| | | | | | | | | |
| | | 2009 | | 2008 | | 2007 |
| | | (dollars in thousands) |
Fees: | | | | | | | | | |
Property acquisition | | $ | 136 | | $ | 2,910 | | $ | 2,494 |
Real estate brokerage | | | 1,129 | | | 4,724 | | | 2,367 |
Construction supervision | | | 941 | | | 3,409 | | | 5,422 |
Property and construction management and leasing commissions | | | 2,124 | | | 2,808 | | | 2,242 |
| | | | | | | | | |
| | $ | 4,330 | | $ | 13,851 | | $ | 12,525 |
| | | | | | | | | |
NOTE 16. INCOME TAXES
For 2009 and 2007,2010, TCI had net losses for federal tax purposes and for 2008,purposes.
For tax periods ending before August 31, 2012, TCI had a net taxable loss for federal income tax purposes afterwas part of the use of tax loss carry forwards.During 2009, TCI acquired stock of Income OpportunityAmerican Realty Investors, Inc. (IOT), suchconsolidated federal return. After that more than 80%date, TCI and the rest of IOT was owned by TCI. As a result, IOTthe American Realty Investors, Inc. (ARL) group joined the ARLRealty Advisors Management, Inc. (RAMI) consolidated group and joined a Tax Sharing and Compensating Agreement with TCI and ARL.for tax purposes. The income tax expense (benefit) for 20092010 and 2011 tax periods in the accompanying financial statement was calculated under the Tax Sharinga tax sharing and Compensating Agreement. In 2008 and 2007 thecompensating agreement between ARL, TCI and IOT. That agreement continued until August 31, 2012 at which time a new tax sharing and compensating agreement was entered into by ARL, TCI, only was in effect.IOT and RAMI for the remainder of 2012. For 2009,2012, ARL, and TCI had net losses and IOT had a combined net income. In 2008, ARI had a nettaxable loss and TRI had net income. In 2007, ARL had net income and TCI had a net loss. For 2009, TCI recorded no federalcurrent tax (benefit) or expense. For 2008, TCI recorded a Federal tax expense of $175,000. For 2007, TCI recorded a federal tax (benefit) of $2,766,000. The expense (benefit) in each year was calculated based on the amount of losses absorbed by taxable income multiplied by the maximum statutory tax rate of 35%.
TRANSCONTINENTAL REALTY INVESTORS, INC.NOTES TO FINANCIAL STATEMENTS—(Continued)
Current income tax expense (benefit) is attributable to:
| | | | | | | | | | | | |
| | | 2009 | | | 2008 | | | 2007 | |
Income from continuing operations | | ($ | 28,614 | ) | | ($ | 33,461 | ) | | ($ | 8,250 | ) |
Income from discontinued operations | | | 28,614 | | | | 33,636 | | | | 5,484 | |
| | | | | | | | | | | | |
| | ($ | 0 | ) | | $ | 175 | | | ($ | 2,766 | ) |
| | | | | | | | | | | | |
| | | 2012 | | | 2011 | | | 2010 | |
| Income from continuing operations | | $ | (10,401 | ) | | $ | (14,460 | ) | | $ | (26,645 | ) |
| Income from discontinued operations | | | 10,401 | | | | 14,460 | | | | 26,645 | |
| Total | | $ | - | | | $ | - | | | $ | - | |
There was no deferred tax expense (benefit) recorded for the period as a result of the uncertainty of the future use of the deferred tax asset.
The Federal income tax expense differs from the amount computed by the applying the corporate tax rate of 35% to the income before income taxes as follows: | | | | | | | | | |
| | | 2009 | | | 2008 | | | 2007 | |
Computed “expected” income tax (benefit) expense | | (27,315 | ) | | 11,273 | | | 3,888 | |
Book to tax differences for partnerships not consolidated for tax purposes | | 9,428 | | | 6,909 | | | 7,362 | |
Book to tax differences for depreciation and amortization | | 1,467 | | | 1,003 | | | 987 | |
Book to tax differences in gains on sale of property | | (12,216 | ) | | (20,033 | ) | | (4,161 | ) |
Book to tax differences from insurance proceeds | | 0 | | | 0 | | | (10,371 | ) |
Use of net operating loss carryforward | | 0 | | | (2,522 | ) | | 0 | |
Book provision for loss | | 3,990 | | | 2,450 | | | 0 | |
Partial valuation allowance against current net operating loss benefit | | 24,148 | | | 0 | | | 0 | |
Other | | 498 | | | 1,095 | | | (471 | ) |
| | | | | | | | | |
| | (0 | ) | | 175 | | | (2,766 | ) |
| | | | | | | | | |
Alternative minimum tax | | 0 | | | 0 | | | 0 | |
| | | | | | | | | |
| | | 2012 | | | 2011 | | | 2010 | |
| Computed "expected" income tax (benefit) expense | | $ | (4,211 | ) | | $ | (16,008 | ) | | $ | (24,627 | ) |
| Book to tax differences for partnerships not consolidated for tax purposes | | | -3,831 | | | | -6,442 | | | | -3,636 | |
| Book to tax differences of depreciation and amortization | | | 1,434 | | | | 1,140 | | | | 1,544 | |
| Book to tax differences in gains on sale of property | | | -4,835 | | | | -7,020 | | | | 6,056 | |
| Book provision for loss | | | 1,656 | | | | 10,132 | | | | 8,576 | |
| Partial valuation allowance against current net operating loss benefit | | | 10,401 | | | | 14,460 | | | | 11,324 | |
| Other | | | -614 | | | | 3,738 | | | | 763 | |
| Total | | $ | - | | | $ | - | | | $ | - | |
| Alternative Minimum Tax | | | | | | | | | | | | |
| | | $ | - | | | $ | - | | | $ | - | |
The tax effect of temporary differences that give rise to the deferred tax asset are as follows:
| | | | | | | | | | | | |
| | | 2009 | | | 2008 | | | 2007 | |
Net operating losses | | | 46,380 | | | | 15,552 | | | | 11,667 | |
AMT credits | | | 1,374 | | | | 1,210 | | | | 1,210 | |
Basis difference of: | | | | | | | | | | | | |
Real estate holdings | | | (46,124 | ) | | | (34,829 | ) | | | (18,381 | ) |
Notes receivable | | | 5,899 | | | | 5,962 | | | | 4,712 | |
Investments | | | (5,691 | ) | | | (4,469 | ) | | | (10,468 | ) |
Notes payable | | | 52,007 | | | | 32,143 | | | | 21,856 | |
Net deferred tax asset from IOT | | | 0 | | | | 0 | | | | 0 | |
Deferred gains | | | 15,078 | | | | 9,932 | | | | 5,707 | |
| | | | | | | | | | | | |
Total | | | 68,923 | | | | 25,655 | | | | 16,303 | |
Deferred tax valuation allowance | | | (68,923 | ) | | | (25,655 | ) | | | (16,303 | ) |
| | | | | | | | | | | | |
Net deferred tax asset | | $ | — | | | $ | — | | | $ | — | |
| | | | | | | | | | | | |
| | | 2012 | | | 2011 | | | 2010 | |
| Net operating losses | | $ | 53,857 | | | $ | 42,337 | | | $ | 55,746 | |
| ATM credits | | | 1,374 | | | | 1,374 | | | | 1,374 | |
| Basis difference of | | | | | | | | | | | | |
| Real estate holdings | | | (15,159 | ) | | | (13,514 | ) | | | (38,495 | ) |
| Notes receivable | | | 860 | | | | 1,726 | | | | 6,678 | |
| Investments | | | (4,757 | ) | | | (5,346 | ) | | | (5,495 | ) |
| Notes payable | | | 16,598 | | | | 22,966 | | | | 41,565 | |
| Deferred gains | | | 11,370 | | | | 14,985 | | | | 26,025 | |
| Total | | $ | 64,143 | | | $ | 64,528 | | | $ | 87,398 | |
| Deferred tax valuation allowance | | | (64,143 | ) | | | (64,528 | ) | | | (87,398 | ) |
| Net deferred tax asset | | $ | - | | | $ | - | | | $ | - | |
TCI has tax net operating loss carryforwards of approximately
$119.5$138.9 million expiring through the year
2029.2031.
TRANSCONTINENTAL REALTY INVESTORS, INC.Federal and state tax authorities generally have the right to examine and audit the previous three years of tax returns filed which would mean that the Company’s Forms 1120, U.S, Corporation Income Tax Returns, for the years ending December 31, 2011, 2010 and 2009 are still subject to examination by the IRS.
NOTES TO FINANCIAL STATEMENTS—(Continued)NOTE 17.12. FUTURE MINIMUM RENTAL INCOME UNDER OPERATING LEASES
TCI’S real estate operations include the leasing of commercial properties (office buildings, industrial warehouses and shopping centers). The leases thereon expire at various dates through
2019.2023. The following is a schedule of minimum future rents on non-cancelable operating leases at December 31,
2009.2012 (dollars in thousands):
| | | |
2010 | | $ | 37,417 |
2011 | | | 31,333 |
2012 | | | 24,062 |
2013 | | | 14,390 |
2014 | | | 10,685 |
Thereafter | | | 23,646 |
| | | |
| | $ | 141,533 |
| | | |
| Year | | Amount | |
| 2013 | | $ | 17,554 | |
| 2014 | | | 13,814 | |
| 2015 | | | 10,244 | |
| 2016 | | | 7,660 | |
| 2017 | | | 5,020 | |
| Thereafter | | | 7,823 | |
| Total | | $ | 62,115 | |
NOTE 18.13. OPERATING SEGMENTS Our segments are based on management’s method of internal reporting which classifies its operations by property type. The segments are commercial, apartments,
hotels, land and other. Significant differences among the accounting policies of the operating segments as compared to the Consolidated Financial Statements principally involve the calculation and allocation of administrative expenses. Management evaluates the performance of each of the operating segments and allocates resources to them based on their operating income and cash flow.
Items of income that are not reflected in the segments are interest, other income, gain on debt extinguishment, gain on condemnation award, equity in partnerships, and gains on sale of real estate. Expenses that are not reflected in the segments are provision for losses, advisory, net income and incentive fees, general and administrative, non-controlling interests
foreign currency transaction loss and net loss from discontinued operations before gains on sale of real estate.
TRANSCONTINENTAL REALTY INVESTORS, INC.
NOTES TO FINANCIAL STATEMENTS—(Continued)
The segment labeled as “Other” consists of revenue and operating expenses related to the notes receivable and corporate debt.
Presented below is the Company’s reportable segments’ operating income including segment assets and expenditures for the years
2009, 20082012, 2011 and
20072010 (dollars in thousands)
. | | | | | | | | | | | | | | | | | | | | | | | |
| | | Commercial
Properties | | | Apartments | | | Hotels | | Land | | | Other | | | Total | |
For year ended 12/31/09 | | | | | | | | | | | | | | | | | | | | | | | |
Operating revenue | | $ | 61,227 | | | $ | 91,274 | | | $ | — | | $ | 460 | | | $ | (1,314 | ) | | $ | 151,647 | |
Operating expenses | | | 31,725 | | | | 51,764 | | | | — | | | 1,516 | | | | 82 | | | | 85,087 | |
Depreciation and amortization | | | 12,047 | | | | 17,145 | | | | — | | | (94 | ) | | | — | | | | 29,098 | |
Mortgage and loan interest | | | 16,270 | | | | 38,219 | | | | — | | | 13,628 | | | | 2,040 | | | | 70,157 | |
Interest income | | | — | | | | — | | | | — | | | — | | | | 5,407 | | | | 5,407 | |
Gain on land sales | | | — | | | | — | | | | — | | | 6,296 | | | | — | | | | 6,296 | |
| | | | | | | | | | | | | | | | | | | | | | | |
Segment operating income (loss) | | $ | 1,185 | | | $ | (15,854 | ) | | $ | — | | $ | (8,294 | ) | | $ | 1,971 | | | $ | (20,992 | ) |
| | | | | | | | | | | | | | | | | | | | | | | |
Capital expenditures | | | 1,249 | | | | 517 | | | | — | | | 89 | | | | — | | | | 1,855 | |
Assets | | | 328,025 | | | | 718,646 | | | | — | | | 395,366 | | | | — | | | | 1,442,037 | |
| | | | | | |
Property Sales | | | | | | | | | | | | | | | | | | | | | | | |
Sales price | | $ | 8,000 | | | $ | 20,500 | | | $ | — | | $ | 37,678 | | | $ | — | | | $ | 66,178 | |
Cost of sale | | | 3,053 | | | | 15,310 | | | | — | | | 31,382 | | | | — | | | | 49,745 | |
Deferred current gain | | | 1,955 | | | | 5,190 | | | | — | | | — | | | | — | | | | 7,145 | |
Recognized prior deferred gain | | | — | | | | — | | | | — | | | — | | | | 532 | | | | 532 | |
| | | | | | | | | | | | | | | | | | | | | | | |
Gain on sale | | $ | 2,992 | | | $ | — | | | $ | — | | $ | 6,296 | | | $ | 532 | | | $ | 9,820 | |
| | | | | | | | | | | | | | | | | | | | | | | |
| | | | | | |
| | | Commercial
Properties | | | Apartments | | | Hotels | | Land | | | Other | | | Total | |
For year ended 12/31/08 | | | | | | | | | | | | | | | | | | | | | | | |
Operating revenue | | $ | 57,295 | | | $ | 79,906 | | | $ | — | | $ | 1,604 | | | $ | (468 | ) | | $ | 138,337 | |
Operating expenses | | | 34,346 | | | | 46,318 | | | | — | | | 5,048 | | | | 525 | | | | 86,237 | |
Depreciation and amortization | | | 10,800 | | | | 13,760 | | | | — | | | (183 | ) | | | — | | | | 24,377 | |
Mortgage and loan interest | | | 17,823 | | | | 36,376 | | | | — | | | 12,881 | | | | 5,973 | | | | 73,053 | |
Interest income | | | — | | | | — | | | | — | | | — | | | | 3,227 | | | | 3,227 | |
Gain on land sales | | | — | | | | — | | | | — | | | 4,798 | | | | — | | | | 4,798 | |
| | | | | | | | | | | | | | | | | | | | | | | |
Segment operating loss | | $ | (5,674 | ) | | $ | (16,548 | ) | | $ | — | | $ | (11,344 | ) | | $ | (3,739 | ) | | $ | (37,305 | ) |
| | | | | | | | | | | | | | | | | | | | | | | |
Capital expenditures | | | 5,045 | | | | 209 | | | | — | | | 544 | | | | — | | | | 5,798 | |
Assets | | | 338,898 | | | | 767,528 | | | | — | | | 366,347 | | | | — | | | | 1,472,773 | |
| | | | | | |
Property Sales | | | | | | | | | | | | | | | | | | | | | | | |
Sales price | | $ | 9,383 | | | $ | 111,727 | | | $ | 41,749 | | $ | 16,382 | | | $ | — | | | $ | 179,241 | |
Cost of sale | | | 8,521 | | | | 34,334 | | | | 15,593 | | | 11,434 | | | | — | | | | 69,882 | |
Deferred current gain | | | — | | | | — | | | | — | | | 150 | | | | — | | | | 150 | |
Recognized prior deferred gain | | | — | | | | — | | | | — | | | — | | | | — | | | | — | |
| | | | | | | | | | | | | | | | | | | | | | | |
Gain on sale | | $ | 862 | | | $ | 77,393 | | | $ | 26,156 | | $ | 4,798 | | | $ | — | | | $ | 109,209 | |
| | | | | | | | | | | | | | | | | | | | | | | |
| | | | | | |
| | | Commercial
Properties | | | Apartments | | | Hotels | | Land | | | Other | | | Total | |
For year ended 12/31/07 | | | | | | | | | | | | | | | | | | | | | | | |
Operating revenue | | $ | 56,534 | | | $ | 66,749 | | | $ | — | | $ | 393 | | | $ | 28 | | | $ | 123,704 | |
Operating expenses | | | 32,613 | | | | 36,636 | | | | — | | | 2,571 | | | | 2,474 | | | | 74,294 | |
Depreciation and amortization | | | 10,247 | | | | 10,857 | | | | — | | | 14 | | | | — | | | | 21,118 | |
Mortgage and loan interest | | | 16,923 | | | | 29,577 | | | | — | | | 14,003 | | | | 5,310 | | | | 65,813 | |
Interest income | | | — | | | | — | | | | — | | | — | | | | 2,730 | | | | 2,730 | |
Gain on land sales | | | — | | | | — | | | | — | | | 11,956 | | | | — | | | | 11,956 | |
| | | | | | | | | | | | | | | | | | | | | | | |
Segment operating loss | | $ | (3,249 | ) | | $ | (10,321 | ) | | $ | — | | $ | (4,239 | ) | | $ | (5,026 | ) | | $ | (22,835 | ) |
| | | | | | | | | | | | | | | | | | | | | | | |
Capital expenditures | | | 8,782 | | | | 1,096 | | | | — | | | 592 | | | | — | | | | 10,470 | |
Assets | | | 298,304 | | | | 693,702 | | | | — | | | 302,850 | | | | 9 | | | | 1,294,865 | |
| | | | | | |
Property Sales | | | | | | | | | | | | | | | | | | | | | | | |
Sales price | | $ | 9,350 | | | $ | 40,480 | | | $ | — | | $ | 42,588 | | | $ | — | | | $ | 92,418 | |
Cost of sale | | | 5,921 | | | | 28,089 | | | | — | | | 15,391 | | | | — | | | | 49,401 | |
Deferred current gain | | | — | | | | — | | | | — | | | 15,241 | | | | — | | | | 15,241 | |
Recognized prior deferred gain | | | 5,099 | | | | — | | | | — | | | — | | | | — | | | | 5,099 | |
| | | | | | | | | | | | | | | | | | | | | | | |
Gain on sale | | $ | 8,528 | | | $ | 12,391 | | | $ | — | | $ | 11,956 | | | $ | — | | | $ | 32,875 | |
| | | | | | | | | | | | | | | | | | | | | | | |
TRANSCONTINENTAL REALTY INVESTORS, INC.
NOTES TO FINANCIAL STATEMENTS—(Continued)
:
| | | Commercial | | | | | | | | | | |
| For the Twelve Months Ended December 31, 2012 | | Properties | | Apartments | | Land | | | Other | | | Total | |
| Operating revenue | | $ | 35,940 | | | $ | 80,035 | | | $ | 25 | | | $ | 51 | | | $ | 116,051 | |
| Operating expenses | | | 20,467 | | | | 35,745 | | | | 593 | | | | 437 | | | | 57,242 | |
| Depreciation and amortization | | | 6,766 | | | | 14,791 | | | | - | | | | - | | | | 21,557 | |
| Mortgage and loan interest | | | 8,203 | | | | 36,217 | | | | 6,482 | | | | 4,230 | | | | 55,132 | |
| Interest income | | | - | | | | - | | | | - | | | | 11,725 | | | | 11,725 | |
| Gain on land sales | | | - | | | | - | | | | 6,935 | | | | - | | | | 6,935 | |
| Segment operating loss | | $ | 504 | | | $ | (6,718 | ) | | $ | (115 | ) | | $ | 7,109 | | | $ | 780 | |
| Capital expenditures | | | 2,454 | | | | 839 | | | | - | | | | - | | | | 3,293 | |
| Assets | | | 165,697 | | | | 540,045 | | | | 173,132 | | | | - | | | | 878,874 | |
| | | | | | | | | | | | | | | | | | | | | |
| Property Sales | | | | | | | | | | | | | | | | | | | | |
| Sales price | | $ | 9,825 | | | $ | 47,131 | | | $ | 37,799 | | | $ | - | | | $ | 94,755 | |
| Less: Cost of sale | | | (10,152 | ) | | | (41,587 | ) | | | (31,479 | ) | | | - | | | | (83,218 | ) |
| Deferred current gain | | | - | | | | - | | | | 615 | | | | - | | | | 615 | |
| Recognized prior deferred gain | | | - | | | | - | | | | - | | | | - | | | | - | |
| Gain (loss) on sale | | $ | (327 | ) | | $ | 5,544 | | | $ | 6,935 | | | $ | - | | | $ | 12,152 | |
| | | | | | | | | | | | | | | | | | | | | |
| | | | | | | | | | | | | | | | | | | | | |
| | | Commercial | | | | | | | | | | | | | |
| For the Twelve Months Ended December 31, 2011 | | Properties | | Apartments | | Land | | | Other | | | Total | |
| Operating revenue | | $ | 33,284 | | | $ | 72,664 | | | $ | 133 | | | $ | 259 | | | $ | 106,340 | |
| Operating expenses | | | 20,619 | | | | 34,540 | | | | 1,571 | | | | 198 | | | | 56,928 | |
| Depreciation and amortization | | | 5,225 | | | | 13,778 | | | | - | | | | - | | | | 19,003 | |
| Mortgage and loan interest | | | 10,448 | | | | 29,563 | | | | 8,288 | | | | 3,587 | | | | 51,886 | |
| Interest income | | | - | | | | - | | | | - | | | | 5,720 | | | | 5,720 | |
| Gain on land sales | | | - | | | | - | | | | 17,011 | | | | - | | | | 17,011 | |
| Segment operating income (loss) | | $ | (3,008 | ) | | $ | (5,217 | ) | | $ | 7,285 | | | $ | 2,194 | | | $ | 1,254 | |
| Capital expenditures | | | 3,286 | | | | 1,248 | | | | 4,103 | | | | - | | | | 8,637 | |
| Assets | | | 172,446 | | | | 550,892 | | | | 197,301 | | | | - | | | | 920,639 | |
| | | | | | | | | | | | | | | | | | | | | |
| Property Sales | | | | | | | | | | | | | | | | | | | | |
| Sales price | | $ | 103,811 | | | $ | 21,590 | | | $ | 163,050 | | | $ | - | | | $ | 288,451 | |
| Less: Cost of sale | | | (108,243 | ) | | | (14,933 | ) | | | (154,122 | ) | | | - | | | | (277,298 | ) |
| Deferred current gain | | | - | | | | - | | | | - | | | | - | | | | - | |
| Recognized prior deferred gain | | | 7,287 | | | | 8,788 | | | | 8,083 | | | | - | | | | 24,158 | |
| Gain on sale | | $ | 2,855 | | | $ | 15,445 | | | $ | 17,011 | | | $ | - | | | $ | 35,311 | |
| | | | | | | | | | | | | | | | | | | | | |
| | | | | | | | | | | | | | | | | | | | | |
| | | Commercial | | | | | | | | | | | | | |
| For the Twelve Months Ended December 31, 2010 | | Properties | | Apartments | | Land | | | Other | | | Total | |
| Operating revenue | | $ | 38,884 | | | $ | 63,605 | | | $ | 55 | | | $ | 139 | | | $ | 102,683 | |
| Operating expenses | | | 21,246 | | | | 31,762 | | | | 2,679 | | | | (51 | ) | | | 55,636 | |
| Depreciation and amortization | | | 7,604 | | | | 12,955 | | | | - | | | | - | | | | 20,559 | |
| Mortgage and loan interest | | | 10,512 | | | | 30,408 | | | | 9,196 | | | | 4,095 | | | | 54,211 | |
| Interest income | | | - | | | | - | | | | - | | | | 5,187 | | | | 5,187 | |
| Loss on land sales | | | - | | | | - | | | | (15,155 | ) | | | - | | | | (15,155 | ) |
| Segment operating income (loss) | | $ | (478 | ) | | $ | (11,520 | ) | | $ | (26,975 | ) | | $ | 1,282 | | | $ | (37,691 | ) |
| Capital expenditures | | | 490 | | | | 649 | | | | 471 | | | | - | | | | 1,610 | |
| Assets | | | 184,525 | | | | 521,155 | | | | 311,860 | | | | (400 | ) | | | 1,017,140 | |
| | | | | | | | | | | | | | | | | | | | | |
| Property Sales | | | | | | | | | | | | | | | | | | | | |
| Sales price | | $ | 6,470 | | | $ | 191,617 | | | $ | 28,357 | | | $ | - | | | $ | 226,444 | |
| Less: Cost of sale | | | (8,376 | ) | | | (150,127 | ) | | | (43,509 | ) | | | - | | | | (202,012 | ) |
| Deferred current gain | | | - | | | | (28,803 | ) | | | (3 | ) | | | - | | | | (28,806 | ) |
| Recognized prior deferred gain | | | - | | | | - | | | | - | | | | - | | | | - | |
| Gain on sale | | $ | (1,906 | ) | | $ | 12,687 | | | $ | (15,155 | ) | | $ | - | | | $ | (4,374 | ) |
The tables below reconcile the segment information to the corresponding amounts in the Consolidated Statements of
Operations: | | | | | | | | | | | | |
| | | 2009 | | | 2008 | | | 2007 | |
Segment operating loss | | $ | (20,992 | ) | | $ | (37,305 | ) | | $ | (22,835 | ) |
Other non-segment items of income (expense) | | | | | | | | | | | | |
General and administrative | | | (11,063 | ) | | | (10,349 | ) | | | (8,515 | ) |
Advisory fees | | | (11,903 | ) | | | (12,064 | ) | | | (10,704 | ) |
Litigation | | | 356 | | | | — | | | | — | |
Provision on impairment of notes receivable and real estate assets | | | (42,513 | ) | | | (7,417 | ) | | | (3,686 | ) |
Gain on involuntary conversion | | | — | | | | — | | | | 34,771 | |
Other income (expense) | | | 3,631 | | | | 3,918 | | | | 2,278 | |
Equity in earnings of investees | | | (451 | ) | | | (1,096 | ) | | | 1,502 | |
Deferred tax | | | 1,180 | | | | 33,441 | | | | 8,186 | |
| | | | | | | | | | | | |
Income (loss) from continuing operations | | $ | (81,755 | ) | | $ | (30,872 | ) | | $ | 997 | |
| | | | | | | | | | | | |
Operations (dollars in thousands):
| | | For Twelve Months Ended December 31, | |
| | | | | | | | | | |
| | | 2012 | | | 2011 | | | 2010 | |
| Segment operating loss | | $ | 780 | | | $ | 1,254 | | | $ | (37,691 | ) |
| Other non-segment items of income (expense) | | | | | | | | | | | | |
| General and administrative | | | (5,426 | ) | | | (9,433 | ) | | | (8,327 | ) |
| Advisory fees | | | (8,915 | ) | | | (9,958 | ) | | | (11,919 | ) |
| Litigation settlement | | | - | | | | - | | | | - | |
| Provision on impairment of notes receivable and real estate assets | | | (4,730 | ) | | | (37,002 | ) | | | (22,579 | ) |
| Other income | | | 6,491 | | | | 2,480 | | | | 8,376 | |
| Loss on sale of investments | | | (118 | ) | | | (514 | ) | | | - | |
| Equity in earnings of investees | | | (66 | ) | | | 242 | | | | (958 | ) |
| Income tax benefit | | | 1,358 | | | | 2,215 | | | | 2,131 | |
| Loss from continuing operations | | $ | (10,626 | ) | | $ | (50,716 | ) | | $ | (70,967 | ) |
SEGMENT ASSET RECONCILIATION TO TOTAL ASSETS
| | | | | | | | | |
| | | 2009 | | 2008 | | 2007 |
Segment assets | | $ | 1,442,037 | | $ | 1,472,773 | | $ | 1,294,865 |
Investments in real estate partnerships | | | 9,358 | | | 23,365 | | | 27,569 |
Investments in marketable securities | | | — | | | 2,775 | | | 13,157 |
Other assets | | | 151,745 | | | 133,136 | | | 116,037 |
Assets held for sale | | | 5,147 | | | 8,018 | | | 69,561 |
| | | | | | | | | |
Total assets | | $ | 1,608,287 | | $ | 1,640,067 | | $ | 1,521,189 |
| | | | | | | | | |
The tables below reconcile the segment information to the corresponding amounts in the Consolidated Balance Sheets (dollars in thousands):
| | | For the Years Ended December 31, | |
| | | 2012 | | | 2011 | | | 2010 | |
| Segment assets | | $ | 878,874 | | | $ | 920,639 | | | $ | 1,017,140 | |
| Investments in real estate partnerships | | | 5,439 | | | | 6,362 | | | | 8,146 | |
| Other assets | | | 142,954 | | | | 165,622 | | | | 163,501 | |
| Assets held for sale | | | 18,077 | | | | 67,701 | | | | 195,974 | |
| Total assets | | $ | 1,045,344 | | | $ | 1,160,324 | | | $ | 1,384,761 | |
NOTE 19. 14. DISCONTINUED OPERATIONS The Company applies the provisions of ASC Topic 360, “Property, Plant and Equipment.” ASC Topic 360 requires that long-lived assets that are to be disposed of by sale be measured at the lesser of (1) book value or (2) fair value less cost to sell. In addition, it requires that one accounting model be used for long-lived assets to be disposed of by sale and broadens the presentation of discontinued operations to include more disposal transactions.
Discontinued operations relates to properties that were either sold or repositioned as held for sale as of the year ended
2009, 20082012, 2011 and
2007.2010. Income from discontinued operations relates to
seven, 25,6, 19, and
six28 properties that were sold or
repositionedheld for sale in
2009, 20082012, 2011 and
2007,2010, respectively. The following table summarizes revenue and expense information for these properties sold and held-for-sale (dollars in thousands)
.:
| | | For Years Ended December 31, | |
| | | 2011 | | | 2010 | |
| Revenues | | | | | | |
| Rental | | $ | 18,215 | | | $ | 38,110 | |
| | | | 18,215 | | | | 38,110 | |
| Expenses (Other Income) | | | | | | | | |
| Property operations | | | (10,243 | ) | | | (21,013 | ) |
| Other income | | | - | | | | 4,065 | |
| Interest | | | (7,212 | ) | | | (15,819 | ) |
| General and administration | | | (1,148 | ) | | | (697 | ) |
| Depreciation | | | (4,032 | ) | | | (7,755 | ) |
| Provision on impairment of real estate assets | | | (8,005 | ) | | | (1,923 | ) |
| | | | (30,640 | ) | | | (43,142 | ) |
| Net loss from discontinued operations before gains on sale of real estate, taxes and fees | | | (12,425 | ) | | | (5,032 | ) |
| Gain on sale of discontinued operations | | | 18,300 | | | | 10,781 | |
| Earnings from unconsolidated subsidiaries and investees | | | 453 | | | | 203 | |
| Income from discontinued operations | | | 6,328 | | | | 5,952 | |
| Income tax expense | | | (2,215 | ) | | | (2,083 | ) |
| Income from discontinued operations | | $ | 4,113 | | | $ | 3,869 | |
TRANSCONTINENTAL REALTY INVESTORS, INC.NOTES TO FINANCIAL STATEMENTS—(Continued)
| | | | | | | | | | | | |
| | | For Years Ended December 31, | |
| | | 2009 | | | 2008 | | | 2007 | |
Revenue | | | | | | | | | | | | |
Rental | | $ | 4,500 | | | $ | 9,288 | | | $ | 42,862 | |
Property operations | | | 2,373 | | | | 4,268 | | | | 28,374 | |
| | | | | | | | | | | | |
| | | 2,127 | | | | 5,020 | | | | 14,488 | |
Expenses | | | | | | | | | | | | |
Interest | | | (1,711 | ) | | | (7,177 | ) | | | (13,472 | ) |
General and administration | | | (27 | ) | | | (672 | ) | | | (60 | ) |
Depreciation | | | (715 | ) | | | (851 | ) | | | (4,341 | ) |
| | | | | | | | | | | | |
| | | (2,453 | ) | | | (8,700 | ) | | | (17,873 | ) |
| | | | | | | | | | | | |
Net loss from discontinued operations before gains on sale of real estate, taxes and fees | | | (326 | ) | | | (3,680 | ) | | | (3,385 | ) |
Gain on sale of discontinued operations | | | 3,524 | | | | 104,411 | | | | 20,919 | |
Equity in investee | | | 164 | | | | 6,306 | | | | — | |
Net income fee to affiliate | | | — | | | | (3,041 | ) | | | 514 | |
Net sales fee to affiliate | | | — | | | | (7,953 | ) | | | (2,564 | ) |
| | | | | | | | | | | | |
Income from discontinued operations | | | 3,362 | | | | 96,043 | | | | 15,484 | |
Tax expense | | | (1,180 | ) | | | (33,616 | ) | | | (5,420 | ) |
| | | | | | | | | | | | |
Income from discontinued operations | | $ | 2,182 | | | $ | 62,427 | | | $ | 10,064 | |
| | | | | | | | | | | | |
The Company’s application of ASC Topic 360 results in the presentation of the net operating results of these qualifying properties sold or held for sale during 2009, 20082012, 2011 and 20072010 as income from discontinued operations. The application of ASC Topic 360 does not have an impact on net income available to common shareholders. ASC Topic 360 only impacts the presentation of these properties within the Consolidated Statements of Operations.
TRANSCONTINENTAL REALTY INVESTORS, INC.NOTE 15. QUARTERLY RESULTS OF OPERATIONSNOTES TO FINANCIAL STATEMENTS—(Continued)
NOTE 20. QUARTERLY | RESULTS OF OPERATIONS |
The following is a tabulation of TCI’s quarterly results of operations for the years
2009, 20082012, 2011 and
20072010 (unaudited, dollars in thousands):
| | | | | | | | | | | | | | | | |
| | | Three Months Ended 2009 | |
| | | March 31, | | | June 30, | | | September 30, | | | December 31, | |
| | | (dollars in thousands, except share and per share amounts) | |
2009 | | | | | | | | | | | | | | | | |
Total operating revenues | | $ | 36,552 | | | $ | 37,570 | | | $ | 38,962 | | | $ | 38,563 | |
Total operating expenses | | | 35,116 | | | | 59,356 | | | | 35,599 | | | | 49,593 | |
| | | | | | | | | | | | | | | | |
Operating income | | | 1,436 | | | | (21,786 | ) | | | 3,363 | | | | (11,030 | ) |
Other expenses | | | (11,813 | ) | | | (17,574 | ) | | | (17,687 | ) | | | (14,140 | ) |
| | | | | | | | | | | | | | | | |
Loss before gain on land sales, non-controlling interest, and income tax benefit (expense) | | | (10,377 | ) | | | (39,360 | ) | | | (14,324 | ) | | | (25,170 | ) |
Gain on land sales | | | (252 | ) | | | 6,548 | | | | — | | | | — | |
Income tax benefit (expense) | | | (84 | ) | | | 271 | | | | 1,083 | | | | (90 | ) |
| | | | | | | | | | | | | | | | |
Loss from continuing operations | | | (10,713 | ) | | | (32,541 | ) | | | (13,241 | ) | | | (25,260 | ) |
| | | | | | | | | | | | | | | | |
Net income (loss) from discontinuing operations, net of non-controlling interest and income taxes | | | (155 | ) | | | 504 | | | | 2,010 | | | | (177 | ) |
| | | | | | | | | | | | | | | | |
Net loss | | | (10,868 | ) | | | (32,037 | ) | | | (11,231 | ) | | | (25,437 | ) |
Net income (loss) attributable to non-controlling interest | | | 109 | | | | 89 | | | | (62 | ) | | | (261 | ) |
| | | | | | | | | | | | | | | | |
Net loss attributable to Transcontinental Realty Investors, Inc. | | | (10,759 | ) | | | (31,948 | ) | | | (11,293 | ) | | | (25,698 | ) |
Preferred dividend requirement | | | (250 | ) | | | (252 | ) | | | (254 | ) | | | (267 | ) |
| | | | | | | | | | | | | | | | |
Net loss applicable to common shares | | $ | (11,009 | ) | | $ | (32,200 | ) | | $ | (11,547 | ) | | $ | (25,965 | ) |
| | | | | | | | | | | | | | | | |
| | | | |
PER SHARE DATA | | | | | | | | | | | | | | | | |
Earnings per share—basic | | | | | | | | | | | | | | | | |
Loss from continuing operations | | $ | (1.34 | ) | | $ | (4.03 | ) | | $ | (1.67 | ) | | $ | (3.18 | ) |
Discontinued operations | | | (0.02 | ) | | | 0.06 | | | | 0.25 | | | | (0.02 | ) |
| | | | | | | | | | | | | | | | |
Net loss applicable to common shares | | $ | (1.36 | ) | | $ | (3.97 | ) | | $ | (1.42 | ) | | $ | (3.20 | ) |
| | | | | | | | | | | | | | | | |
Weighted average common share used in computing earnings per share | | | 8,113,669 | | | | 8,113,669 | | | | 8,113,669 | | | | 8,113,669 | |
| | | | |
Earnings per share—diluted | | | | | | | | | | | | | | | | |
Loss from continuing operations | | $ | (1.34 | ) | | $ | (4.03 | ) | | $ | (1.67 | ) | | $ | (3.18 | ) |
Discontinued operations | | | (0.02 | ) | | | 0.06 | | | | 0.25 | | | | (0.02 | ) |
| | | | | | | | | | | | | | | | |
Net loss applicable to common shares | | $ | (1.36 | ) | | $ | (3.97 | ) | | $ | (1.42 | ) | | $ | (3.20 | ) |
| | | | | | | | | | | | | | | | |
Weighted average common share used in computing diluted earnings per share | | | 8,113,669 | | | | 8,113,669 | | | | 8,113,669 | | | | 8,113,669 | |
TRANSCONTINENTAL REALTY INVESTORS, INC.
NOTES TO FINANCIAL STATEMENTS—(Continued)
| | | | | | | | | | | | | | | | |
| | | Three Months Ended 2008 | |
| | | March 31, | | | June 30, | | | September 30, | | | December 31, | |
2008 | | | | | | | | | | | | | | | | |
Total operating revenues | | $ | 31,664 | | | $ | 34,718 | | | $ | 35,514 | | | $ | 36,441 | |
Total operating expenses | | | 39,557 | | | | 31,651 | | | | 32,831 | | | | 36,405 | |
| | | | | | | | | | | | | | | | |
Operating income (loss) | | | (7,893 | ) | | | 3,067 | | | | 2,683 | | | | 36 | |
Other expenses | | | (20,625 | ) | | | (21,198 | ) | | | (1,159 | ) | | | (24,022 | ) |
| | | | | | | | | | | | | | | | |
Income (loss) before gain on land sales, non-controlling interest, and income tax benefit (expense) | | | (28,518 | ) | | | (18,131 | ) | | | 1,524 | | | | (23,986 | ) |
Gain on land sales | | | 1,275 | | | | 2,580 | | | | 696 | | | | 247 | |
Income tax benefit (expense) | | | 33,104 | | | | 451 | | | | (3,103 | ) | | | 2,989 | |
| | | | | | | | | | | | | | | | |
Net income (loss) from continuing operations | | | 5,861 | | | | (15,100 | ) | | | (883 | ) | | | (20,750 | ) |
| | | | | | | | | | | | | | | | |
Net income (loss) from discontinuing operations, net of non-controlling interest and income taxes | | | 61,480 | | | | 838 | | | | (5,763 | ) | | | 5,872 | |
| | | | | | | | | | | | | | | | |
Net income (loss) | | | 67,341 | | | | (14,262 | ) | | | (6,646 | ) | | | (14,878 | ) |
Net income (loss) attributable to non-controlling interest | | | — | | | | — | | | | — | | | | 654 | |
| | | | | | | | | | | | | | | | |
Net income (loss) attributable to Transcontinental Realty Investors, Inc. | | | 67,341 | | | | (14,262 | ) | | | (6,646 | ) | | | (14,224 | ) |
Preferred dividend requirement | | | (240 | ) | | | (240 | ) | | | (240 | ) | | | (255 | ) |
| | | | | | | | | | | | | | | | |
Net income (loss) applicable to common shares | | $ | 67,101 | | | $ | (14,502 | ) | | $ | (6,886 | ) | | $ | (14,479 | ) |
| | | | | | | | | | | | | | | | |
| | | | |
PER SHARE DATA | | | | | | | | | | | | | | | | |
Earnings per share—basic | | | | | | | | | | | | | | | | |
Income (loss) from continuing operations | | $ | 0.70 | | | $ | (1.90 | ) | | $ | (0.14 | ) | | $ | (2.52 | ) |
Discontinued operations | | | 7.61 | | | | 0.10 | | | | (0.71 | ) | | | 0.72 | |
| | | | | | | | | | | | | | | | |
Net income (loss) applicable to common shares | | $ | 8.31 | | | $ | (1.80 | ) | | $ | (0.85 | ) | | $ | (1.80 | ) |
| | | | | | | | | | | | | | | | |
Weighted average common share used in computing earnings per share | | | 8,075,453 | | | | 8,073,659 | | | | 8,083,882 | | | | 8,113,669 | |
| Earnings per share—diluted | | | | | | | | | | | | |
Income (loss) from continuing operations | | $ | 0.68 | | | $ | (1.90 | ) | | $ | (0.14 | ) | | $ | (2.50 | ) |
Discontinued operations | | | 7.40 | | | | 0.10 | | | | (0.71 | ) | | | 0.93 | |
| | | | | | | | | | | | | | | | |
Net income (loss) applicable to common shares | | $ | 8.08 | | | $ | (1.80 | ) | | $ | (0.85 | ) | | $ | (1.57 | ) |
| | | | | | | | | | | | | | | | |
Weighted average common share used in computing diluted earnings per share | | | 8,311,693 | | | | 8,073,659 | | | | 8,083,882 | | | | 8,113,669 | |
TRANSCONTINENTAL REALTY INVESTORS, INC.
NOTES TO FINANCIAL STATEMENTS—(Continued)
| | | | | | | | | | | | | | | | |
| | | Three Months Ended 2007 | |
| | | March 31, | | | June 30, | | | September 30, | | | December 31, | |
2007 | | | | | | | | | | | | | | | | |
Total operating revenues | | $ | 29,652 | | | $ | 31,129 | | | $ | 29,728 | | | $ | 33,195 | |
Total operating expenses | | | 26,091 | | | | 28,066 | | | | 28,485 | | | | 35,675 | |
| | | | | | | | | | | | | | | | |
Operating income | | | 3,561 | | | | 3,063 | | | | 1,243 | | | | (2,480 | ) |
Other expenses | | | (12,542 | ) | | | (15,842 | ) | | | (19,477 | ) | | | 23,329 | |
| | | | | | | | | | | | | | | | |
Income (loss) before gain on land sales, non-controlling interest, and income tax benefit (expense) | | | (8,981 | ) | | | (12,779 | ) | | | (18,234 | ) | | | 20,849 | |
Gain on land sales | | | 4,769 | | | | (3,651 | ) | | | 5,755 | | | | 5,083 | |
Income tax benefit (expense) | | | (724 | ) | | | 995 | | | | 2,979 | | | | 4,936 | |
| | | | | | | | | | | | | | | | |
Net loss from continuing operations | | | (4,936 | ) | | | (15,435 | ) | | | (9,500 | ) | | | 30,868 | |
| | | | | | | | | | | | | | | | |
Net income (loss) from discontinuing operations, net of non-controlling interest and income taxes | | | (1,345 | ) | | | 1,848 | | | | 5,532 | | | | 4,029 | |
| | | | | | | | | | | | | | | | |
Net income (loss) | | | (6,281 | ) | | | (13,587 | ) | | | (3,968 | ) | | | 34,897 | |
Net income (loss) attributable to non-controlling interest | | | 30 | | | | (26 | ) | | | 19 | | | | 27 | |
| | | | | | | | | | | | | | | | |
Net income (loss) attributable to Transcontinental Realty Investors, Inc. | | | (6,251 | ) | | | (13,613 | ) | | | (3,949 | ) | | | 34,924 | |
Preferred dividend requirement | | | (228 | ) | | | (227 | ) | | | (229 | ) | | | (241 | ) |
| | | | | | | | | | | | | | | | |
Net income (loss) applicable to common shares | | $ | (6,479 | ) | | $ | (13,840 | ) | | $ | (4,178 | ) | | $ | 34,683 | |
| | | | | | | | | | | | | | | | |
| | | | |
PER SHARE DATA | | | | | | | | | | | | | | | | |
Earnings per share—basic | | | | | | | | | | | | | | | | |
Income (loss) from continuing operations | | $ | (0.65 | ) | | $ | (1.98 | ) | | $ | (1.23 | ) | | $ | 3.88 | |
Discontinued operations | | | (0.17 | ) | | | 0.23 | | | | 0.70 | | | | 0.50 | |
| | | | | | | | | | | | | | | | |
Net income (loss) applicable to common shares | | $ | (0.82 | ) | | $ | (1.75 | ) | | $ | (0.53 | ) | | $ | 4.38 | |
| | | | | | | | | | | | | | | | |
Weighted average common share used in computing earnings per share | | | 7,900,213 | | | | 7,881,232 | | | | 7,942,089 | | | | 8,082,949 | |
| | | | |
Earnings per share—diluted | | | | | | | | | | | | | | | | |
Income (loss) from continuing operations | | $ | (0.65 | ) | | $ | (1.98 | ) | | $ | (1.23 | ) | | $ | 3.87 | |
Discontinued operations | | | (0.17 | ) | | | 0.23 | | | | 0.70 | | | | 0.47 | |
| | | | | | | | | | | | | | | | |
Net income (loss) applicable to common shares | | $ | (0.82 | ) | | $ | (1.75 | ) | | $ | (0.53 | ) | | $ | 4.34 | |
| | | | | | | | | | | | | | | | |
Weighted average common share used in computing diluted earnings per share | | | 7,900,213 | | | | 7,881,232 | | | | 7,942,089 | | | | 8,317,885 | |
| | | For the Three Months Ended 2012 | |
| | | March 31, | | | June 30, | | | September 30, | | | December 31, | |
| | | (dollars in thousands, except share and per share amounts) | | | | |
| 2012 | | | | | | | | | | | | |
| Total operating revenues | | $ | 27,882 | | | $ | 28,390 | | | $ | 28,573 | | | $ | 31,206 | |
| Total operating expenses | | | 23,416 | | | | 22,219 | | | | 23,276 | | | | 28,961 | |
| Operating (loss) income | | | 4,466 | | | | 6,171 | | | | 5,297 | | | | 2,245 | |
| Other income (expense) | | | (12,067 | ) | | | (9,937 | ) | | | (7,905 | ) | | | (7,189 | ) |
| Income (loss) before gain on land sales, non-contolling interest, and taxes | | | (7,601 | ) | | | (3,766 | ) | | | (2,608 | ) | | | (4,944 | ) |
| Gain (loss) on land sales | | | 423 | | | | 4,738 | | | | 2,913 | | | | (1,139 | ) |
| Income tax benefit (expense) | | | 1,068 | | | | 520 | | | | (183 | ) | | | (47 | ) |
| Net income (loss) from continuing operations | | | (6,110 | ) | | | 1,492 | | | | 122 | | | | (6,130 | ) |
| Net income (loss) from discontinuing operations | | | 1,982 | | | | 965 | | | | (341 | ) | | | (84 | ) |
| Net income (loss) | | | (4,128 | ) | | | 2,457 | | | | (219 | ) | | | (6,214 | ) |
| Less: net income (loss) attributable to non-controlling interest | | | (79 | ) | | | (175 | ) | | | (43 | ) | | | 77 | |
| Preferred dividend requirement | | | (277 | ) | | | (277 | ) | | | (277 | ) | | | (281 | ) |
| Net income (loss) applicable to common shares | | $ | (4,484 | ) | | $ | 2,005 | | | $ | (539 | ) | | $ | (6,418 | ) |
| | | | | | | | | | | | | | | | | |
| PER SHARE DATA | | | | | | | | | | | | | | | | |
| Earnings per share - basic | | | | | | | | | | | | | | | | |
| Income (loss) from continuing operations | | $ | (0.78 | ) | | $ | 0.12 | | | $ | (0.02 | ) | | $ | (0.75 | ) |
| Discontinued operations | | | 0.24 | | | | 0.11 | | | | (0.04 | ) | | | (0.01 | ) |
| Net income (loss) applicable to common shares | | $ | (0.54 | ) | | $ | 0.24 | | | $ | (0.06 | ) | | $ | (0.76 | ) |
| Weighted average common shares used in computing earnings per share | | | 8,240,136 | | | | 8,413,469 | | | | 8,413,469 | | | | 8,413,469 | |
| | | | | | | | | | | | | | | | | |
| Earnings per share - diluted | | | | | | | | | | | | | | | | |
| Income (loss) from continuing operations | | $ | (0.78 | ) | | $ | 0.12 | | | $ | (0.02 | ) | | $ | (0.75 | ) |
| Discontinued operations | | | 0.24 | | | | 0.11 | | | | (0.04 | ) | | | (0.01 | ) |
| Net income (loss) applicable to common shares | | $ | (0.54 | ) | | $ | 0.24 | | | $ | (0.06 | ) | | $ | (0.76 | ) |
| Weighted average common shares used in computing diluted earnings per share | | | 8,240,136 | | | | 8,413,469 | | | | 8,413,469 | | | | 8,413,469 | |
| | | For the Three Months Ended 2011 | |
| | | March 31, | | | June 30, | | | September 30, | | December 31, | |
| | | (dollars in thousands, except share and per share amounts) | |
| 2011 | | | | | | | | | | | | |
| Total operating revenues | | $ | 25,496 | | | $ | 27,487 | | | $ | 28,614 | | | $ | 24,743 | |
| Total operating expenses | | | 28,594 | | | | 20,822 | | | | 25,472 | | | | 57,436 | |
| Operating (loss) income | | | (3,098 | ) | | | 6,665 | | | | 3,142 | | | | (32,693 | ) |
| Other income (expense) | | | (10,877 | ) | | | (12,045 | ) | | | (11,334 | ) | | | (9,702 | ) |
| Loss before gain on land sales, non-controlling interest, and taxes | | | (13,975 | ) | | | (5,380 | ) | | | (8,192 | ) | | | (42,395 | ) |
| Gain on land sales | | | 796 | | | | 1,285 | | | | 1,435 | | | | 13,495 | |
| Income tax benefit (expense) | | | 396 | | | | (3,546 | ) | | | 2,544 | | | | 2,821 | |
| Net loss from continuing operations | | | (12,783 | ) | | | (7,641 | ) | | | (4,213 | ) | | | (26,079 | ) |
| Net income (loss) from discontinuing operations | | | 735 | | | | (6,591 | ) | | | 4,724 | | | | 5,245 | |
| Net income (loss) | | | (12,048 | ) | | | (14,232 | ) | | | 511 | | | | (20,834 | ) |
| Less: net income (loss) attributable to non-controlling interest | | | 85 | | | | 46 | | | | 384 | | | | (233 | ) |
| Preferred dividend requirement | | | (274 | ) | | | (277 | ) | | | (279 | ) | | | (280 | ) |
| Net income (loss) applicable to common shares | | $ | (12,237 | ) | | $ | (14,463 | ) | | $ | 616 | | | $ | (21,347 | ) |
| | | | | | | | | | | | | | | | | |
| PER SHARE DATA | | | | | | | | | | | | | | | | |
| Earnings per share - basic | | | | | | | | | | | | | | | | |
| Income (loss) from continuing operations | | $ | (1.57 | ) | | $ | (0.94 | ) | | $ | (0.49 | ) | | $ | (3.16 | ) |
| Discontinued operations | | | 0.09 | | | | (0.78 | ) | | | 0.56 | | | | 0.62 | |
| Net income (loss) applicable to common shares | | $ | (1.49 | ) | | $ | (1.72 | ) | | $ | 0.07 | | | $ | (2.54 | ) |
| Weighted average common shares used in computing earnings per share | | | 8,240,136 | | | | 8,413,469 | | | | 8,413,469 | | | | 8,413,469 | |
| | | | | | | | | | | | | | | | | |
| Earnings per share - diluted | | | | | | | | | | | | | | | | |
| Income (loss) from continuing operations | | $ | (1.57 | ) | | $ | (0.94 | ) | | $ | (0.49 | ) | | $ | (3.16 | ) |
| Discontinued operations | | | 0.09 | | | | (0.78 | ) | | | 0.56 | | | | 0.62 | |
| Net income (loss) applicable to common shares | | $ | (1.49 | ) | | $ | (1.72 | ) | | $ | 0.07 | | | $ | (2.54 | ) |
| Weighted average common shares used in computing diluted earnings per share | | | 8,240,136 | | | | 8,413,469 | | | | 8,413,469 | | | | 8,413,469 | |
| | | | | | | | | | | | | | | | | |
| | | | | | | | | | | | | | | | | |
| | | For the Three Months Ended 2010 | |
| | | March 31, | | | June 30, | | | September 30, | | December 31, | |
| | | (dollars in thousands, except share and per share amounts) | |
| 2010 | | | | | | | | | | | | | | | | |
| Total operating revenues | | $ | 25,808 | | | $ | 26,012 | | | $ | 25,367 | | | $ | 25,496 | |
| Total operating expenses | | | 24,050 | | | | 24,765 | | | | 23,662 | | | | 46,543 | |
| Operating (loss) income | | | 1,758 | | | | 1,247 | | | | 1,705 | | | | (21,047 | ) |
| Other income (expense) | | | (12,018 | ) | | | (13,621 | ) | | | (11,475 | ) | | | (4,492 | ) |
| Loss before gain on land sales, non-controlling interest, and taxes | | | (10,260 | ) | | | (12,374 | ) | | | (9,770 | ) | | | (25,539 | ) |
| Gain (loss) on land sales | | | 6 | | | | (5,640 | ) | | | (371 | ) | | | (9,150 | ) |
| Income tax benefit (expense) | | | 87 | | | | (870 | ) | | | 353 | | | | 2,561 | |
| Net loss from continuing operations | | | (10,167 | ) | | | (18,884 | ) | | | (9,788 | ) | | | (32,128 | ) |
| Net income (loss) from discontinuing operations | | | 161 | | | | (1,618 | ) | | | 655 | | | | 4,671 | |
| Net loss | | | (10,006 | ) | | | (20,502 | ) | | | (9,133 | ) | | | (27,457 | ) |
| Less: net income (loss) attributable to non-controlling interest | | | (273 | ) | | | 113 | | | | 178 | | | | (116 | ) |
| Preferred dividend requirement | | | (262 | ) | | | (264 | ) | | | (269 | ) | | | (278 | ) |
| Net income (loss) applicable to common shares | | $ | (10,541 | ) | | $ | (20,653 | ) | | $ | (9,224 | ) | | $ | (27,851 | ) |
| | | | | | | | | | | | | | | | | |
| PER SHARE DATA | | | | | | | | | | | | | | | | |
| Earnings per share - basic | | | | | | | | | | | | | | | | |
| Income (loss) from continuing operations | | $ | (1.33 | ) | | $ | (2.35 | ) | | $ | (1.21 | ) | | $ | (4.01 | ) |
| Discontinued operations | | | 0.02 | | | | (0.20 | ) | | | 0.08 | | | | 0.58 | |
| Net income (loss) applicable to common shares | | $ | (1.31 | ) | | $ | (2.55 | ) | | $ | (1.13 | ) | | $ | (3.43 | ) |
| Weighted average common shares used in computing earnings per share | | | 8,113,669 | | | | 8,113,669 | | | | 8,113,495 | | | | 8,113,469 | |
| | | | | | | | | | | | | | | | | |
| Earnings per share - diluted | | | | | | | | | | | | | | | | |
| Income (loss) from continuing operations | | $ | (1.33 | ) | | $ | (2.35 | ) | | $ | (1.21 | ) | | $ | (4.01 | ) |
| Discontinued operations | | $ | 0.02 | | | $ | (0.20 | ) | | $ | 0.08 | | | $ | 0.58 | |
| Net income (loss) applicable to common shares | | $ | (1.31 | ) | | $ | (2.55 | ) | | $ | (1.13 | ) | | $ | (3.43 | ) |
| Weighted average common shares used in computing diluted earnings per share | | | 8,113,669 | | | | 8,113,669 | | | | 8,113,495 | | | | 8,113,469 | |
Quarterly results presented differ from those previously reported in TCI’s Form 10-Q due to the reclassification of the operations of properties sold or held for sale to discontinued operations in accordance with
SFAS No. 144.ASC Topic 360.
TRANSCONTINENTAL REALTY INVESTORS, INC.NOTES TO FINANCIAL STATEMENTS—(Continued)
NOTE 21.16. COMMITMENTS AND CONTINGENCIES AND LIQUIDITY
Liquidity. Management believes that TCI will generate excess cash from property operations in
2010;2013; such excess, however, will not be sufficient to discharge all of TCI’s obligations as they become due. Management intends to sell
income producingincome-producing assets, refinance real estate and obtain additional borrowings primarily secured by real estate to meet its liquidity requirements.
Partnership Buyouts. TCI is the limited partner in
twovarious partnerships
that are currently constructingrelated the construction of residential properties. As permitted in the respective partnership agreements, TCI intends to purchase the interests of the general and any other limited partners in these partnerships subsequent to the completion of these projects. The amounts paid to buy out the nonaffiliated partners are limited to development fees earned by the non-affiliated partners, and are set forth in the respective partnership agreements.
Other Litigation. TCI is also involved in various other lawsuits arising in the ordinary course of business. Management is of the opinion that the outcome of these lawsuits will have no material impact on TCI’s financial condition, results of operations or liquidity.
The Company is involved in and vigorously defending against, a number of deficiency claims with respect to assets that have been foreclosed by various lenders. Such claims are generally against a consolidated subsidiary as the borrower or the Company as a guarantor of indebtedness or performance. Some of these proceedings may ultimately result in an unfavorable determination for the Company and/or one of its consolidated subsidiaries. While we cannot predict the final result of such proceedings, Management believes that the maximum exposure to the Company and its consolidated subsidiaries, if any, will not exceed approximately $20 million in the aggregate and will occur, if at all, in future years.
SCHEDULE IIINOTE 17. EARNINGS PER SHARE
TRANSCONTINENTAL REALTY INVESTORS, INC.Earnings per share.REAL ESTATE AND ACCUMULATED DEPRECIATION
Earnings per share “(EPS)” have been computed pursuant to the provisions of ASC 260 “Earnings Per Share”. The computation of basic EPS is calculated by dividing income available to common shareholders by the weighted-average number of common shares outstanding during the period. Shares issued during the period shall be weighted for the portion of the period that they were outstanding. We have 30,000 shares of Series C Cumulative Convertible Preferred Stock issued and outstanding. The stock has a liquidation preference of $100.00 per share. After September 30, 2006, the stock may be converted into Common stock at 90% of the daily average closing price of the Common stock for the prior five trading days. The effects of the Series C Cumulative Convertible Preferred Stock are included in the dilutive earnings per share if applying the if-converted method is dilutive. As of December 31, 2009
| | | | | | | | | | | | | | | | | | | | | | | | | | | | | | |
Property/Location | | Encumbrances | | Initial Cost | | Cost Capitalized
Subsequent to
Acquisition | | Gross Amounts of Which
Carried at End of Year | | Accumulated
Depreciation | | Date of
Construction | | Date
Acquired | | Life on
Which
Depreciation
In Latest
Statement of
Operation is
Computed |
| | | Land | | Building &
Improvements | | Improvements | | Land | | Building &
Improvements | | Total | | | | |
| | | (dollars in thousands) |
Properties Held for Investment | | | | | | | | | | | | | | | | | | | | | | | | | | | | | | |
Apartments | | | | | | | | | | | | | | | | | | | | | | | | | | | | | | |
Anderson Estates, Oxford, MS | | $ | 941 | | $ | 378 | | $ | 2,683 | | $ | 313 | | $ | 691 | | $ | 2,683 | | $ | 3,373 | | $ | 263 | | 2003 | | 01/06 | | 40 years |
Blue Lake Villas I, Waxahachie, TX | | | 10,358 | | | 526 | | | 10,556 | | | 201 | | | 526 | | | 10,757 | | | 11,283 | | | 1,860 | | 2003 | | 01/02 | | 40 years |
Blue Lake Villas II, Waxahachie, TX | | | 3,957 | | | 287 | | | 4,451 | | | — | | | 287 | | | 4,451 | | | 4,738 | | | 233 | | 2004 | | 01/04 | | 40 years |
Breakwater Bay, Beaumont, TX | | | 9,428 | | | 740 | | | 10,435 | | | — | | | 740 | | | 10,435 | | | 11,175 | | | 1,277 | | 2004 | | 05/03 | | 40 years |
Bridgewood Ranch, Kaufman, TX | | | 5,014 | | | 762 | | | 6,856 | | | — | | | 762 | | | 6,856 | | | 7,618 | | | 348 | | 2007 | | 04/08 | | 5-40 years |
Capitol Hill, Little Rock, AR | | | 9,059 | | | 1,860 | | | 7,948 | | | — | | | 1,860 | | | 7,948 | | | 9,807 | | | 1,095 | | 2003 | | 03/03 | | 40 years |
Curtis Moore Estates, Greenwood, MS | | | 1,685 | | | 186 | | | 5,733 | | | 702 | | | 847 | | | 5,774 | | | 6,621 | | | 692 | | 2003 | | 01/06 | | 40 years |
Dakota Arms, Lubbock, TX | | | 12,123 | | | 921 | | | 12,644 | | | 168 | | | 921 | | | 12,812 | | | 13,733 | | | 1,581 | | 2004 | | 01/04 | | 40 years |
David Jordan Phase II, Greenwood, MS | | | 623 | | | 51 | | | 1,521 | | | 225 | | | 277 | | | 1,521 | | | 1,798 | | | 184 | | 1999 | | 01/06 | | 40 years |
David Jordan Phase III, Greenwood, MS | | | 658 | | | 83 | | | 2,115 | | | 356 | | | 439 | | | 2,115 | | | 2,554 | | | 207 | | 2003 | | 01/06 | | 40 years |
Denham Springs, Lake Charles, LA | | | 2,404 | | | 1,353 | | | — | | | 1,069 | | | 1,353 | | | 1,069 | | | 2,422 | | | — | | — | | 07/07 | | 40 years |
Desoto Ranch, Desoto, TX | | | 15,711 | | | 1,472 | | | 17,856 | | | — | | | 1,472 | | | 17,856 | | | 19,328 | | | 2,615 | | 2002 | | 05/02 | | 40 years |
Dorado Ranch, Odessa, TX | | | 16,570 | | | 761 | | | 18,374 | | | 10 | | | 761 | | | 18,384 | | | 19,145 | | | 384 | | 2009 | | 07/07 | | 40 years |
Falcon Lakes, Arlington, TX | | | 13,169 | | | 1,438 | | | 15,094 | | | 283 | | | 1,438 | | | 15,376 | | | 16,814 | | | 2,867 | | 2001 | | 10/01 | | 40 years |
Foxwood, Memphis, TN | | | 5,102 | | | 699 | | | 4,616 | | | — | | | 699 | | | 4,616 | | | 5,314 | | | 391 | | 1974 | | 08/79 | | 5-40 years |
Heather Creek, Mesquite, TX | | | 11,563 | | | 1,326 | | | 12,015 | | | — | | | 1,326 | | | 12,015 | | | 13,341 | | | 1,502 | | 2003 | | 03/03 | | 40 years |
Huntington Ridge, Desoto, TX | | | 14,889 | | | 1,693 | | | 15,927 | | | 9 | | | 1,693 | | | 15,936 | | | 17,630 | | | 527 | | 2007 | | 10/04 | | 40 years |
Island Bay, Galveston, TX | | | 13,956 | | | 2,095 | | | 17,659 | | | — | | | 2,095 | | | 17,659 | | | 19,754 | | | 3,172 | | 1973 | | 09/01 | | 40 years |
Kingsland Ranch, Houston, TX | | | 21,857 | | | 3,614 | | | 23,264 | | | — | | | 3,614 | | | 23,264 | | | 26,877 | | | 2,860 | | 2005 | | 03/03 | | 40 years |
Laguna Vista, Dallas, TX | | | 17,307 | | | 288 | | | 20,743 | | | 497 | | | 370 | | | 21,158 | | | 21,528 | | | 1,572 | | 2006 | | 12/04 | | 40 years |
Lake Forest, Houston, TX | | | 12,349 | | | 335 | | | 12,267 | | | 1,435 | | | 335 | | | 13,702 | | | 14,037 | | | 1,484 | | 2004 | | 01/04 | | 40 years |
Legends Of El Paso, El Paso, TX | | | 15,692 | | | 1,318 | | | 17,215 | | | 697 | | | 1,318 | | | 17,912 | | | 19,230 | | | 1,064 | | 2006 | | 07/05 | | 40 years |
Longfellow Arms, Longview, TX | | | 14,407 | | | 1,352 | | | 14,915 | | | — | | | 1,352 | | | 14,915 | | | 16,267 | | | 529 | | 2007 | | 12/06 | | 40 years |
SCHEDULE III
(Continued)
TRANSCONTINENTAL REALTY INVESTORS, INC.
REAL ESTATE AND ACCUMULATED DEPRECIATION
2012, we have 5,000 shares of stock options outstanding. These options will expire January 1, 2015, if not exercised. These options are considered in the computation of diluted earnings per share if the effect of applying the treasury stock method is dilutive. At December 31, 20092012, the preferred stock and the stock options were anti-dilutive and thus not included in the EPS calculation.
| | | | | | | | | | | | | | | | | | | | | | |
Property/Location | | Encumbrances | | Initial Cost | | Cost Capitalized
Subsequent to
Acquisition | | Gross Amounts of Which
Carried at End of Year | | Accumulated
Depreciation | | Date of
Construction | | Date
Acquired | | Life on
Which
Depreciation
In Latest
Statement of
Operation is
Computed |
| | | Land | | Building &
Improvements | | Improvements | | Land | | Building &
Improvements | | Total | | | | |
| | | (dollars in thousands) |
Mansion of Mansfield, Mansfield, TX | | 16,172 | | 977 | | 17,757 | | — | | 977 | | 17,757 | | 18,733 | | 112 | | 2009 | | 09/05 | | 40 years |
Marina Landing, Galveston, TX | | 11,929 | | 1,240 | | 11,160 | | — | | 1,240 | | 11,160 | | 12,401 | | 2,323 | | 1985 | | 09/01 | | 40 years |
Mariposa Villas, Dallas, TX | | 11,918 | | 788 | | 13,131 | | — | | 788 | | 13,131 | | 13,918 | | 1,435 | | 2002 | | 01/02 | | 40 years |
Mason Park, Katy, TX | | 19,300 | | 2,300 | | 20,530 | | — | | 2,300 | | 20,530 | | 22,831 | | 558 | | 2007 | | 08/06 | | 40 years |
Mission Oaks, San Antonio, TX | | 15,234 | | 1,266 | | 16,627 | | 122 | | 1,266 | | 16,749 | | 18,015 | | 1,079 | | 2005 | | 05/05 | | 40 years |
Monticello Estates, Monticello, AR | | 520 | | 36 | | 1,493 | | 263 | | 285 | | 1,508 | | 1,793 | | 156 | | 2001 | | 01/06 | | 40 years |
Northside on Travis, Sherman, TX | | 13,858 | | 1,301 | | 14,920 | | — | | 1,301 | | 14,920 | | 16,221 | | 124 | | 2009 | | 10/07 | | 40 years |
Paramount Terrace, Amarillo, TX | | 2,943 | | 340 | | 3,061 | | — | | 340 | | 3,061 | | 3,402 | | 877 | | 1983 | | 05/00 | | 40 years |
Parc at Maumelle, Little Rock, AR | | 16,377 | | 1,153 | | 17,688 | | 617 | | 1,153 | | 18,305 | | 19,458 | | 1,227 | | 2006 | | 12/04 | | 40 years |
Parc at Metro Center, Nashville, TN | | 10,764 | | 960 | | 12,226 | | 486 | | 960 | | 12,713 | | 13,673 | | 780 | | 2006 | | 05/05 | | 40 years |
Parc at Rogers, Rogers, AR | | 20,334 | | 1,482 | | 22,993 | | 266 | | 1,749 | | 22,993 | | 24,742 | | 772 | | 2007 | | 04/04 | | 40 years |
Park at Clarksville, Clarksville, TN | | 13,257 | | 571 | | 14,390 | | 102 | | 571 | | 14,492 | | 15,063 | | 435 | | 2007 | | 06/02 | | 40 years |
Pecan Pointe, Temple, TX | | 16,657 | | 1,744 | | 16,838 | | 144 | | 1,744 | | 16,982 | | 18,726 | | 613 | | 2007 | | 10/06 | | 40 years |
Portofino, Farmers Branch, TX | | 20,669 | | 1,729 | | 23,033 | | 13 | | 1,729 | | 23,045 | | 24,775 | | 707 | | 2007 | | 09/06 | | 40 years |
Preserve at Pecan Creek, Denton, TX | | 15,007 | | 885 | | 16,588 | | — | | 885 | | 16,588 | | 17,473 | | 546 | | 2008 | | 10/05 | | 40 years |
Quail Hollow, Holland, OH | | 11,159 | | 1,406 | | 12,650 | | — | | 1,406 | | 12,650 | | 14,056 | | 527 | | 2000 | | 04/08 | | 5-40 years |
Quail Oaks, Balch Springs, TX | | 2,429 | | 90 | | 1,959 | | 166 | | 125 | | 2,090 | | 2,215 | | 1,361 | | 1982 | | 02/87 | | 5-40 years |
River Oaks, Wylie, TX | | 9,456 | | 590 | | 11,674 | | 93 | | 590 | | 11,768 | | 12,358 | | 2,013 | | 2002 | | 10/01 | | 40 years |
Riverwalk Phase I, Greenville, MS | | 337 | | 23 | | 1,537 | | 175 | | 198 | | 1,537 | | 1,736 | | 193 | | 2003 | | 01/06 | | 40 years |
Riverwalk Phase II, Greenville, MS | | 1,284 | | 52 | | 4,007 | | 363 | | 297 | | 4,126 | | 4,423 | | 735 | | 2003 | | 01/06 | | 40 years |
Savoy of Garland, Garland, TX | | 9,645 | | 760 | | 11,031 | | — | | 760 | | 11,031 | | 11,791 | | 23 | | 2009 | | 10/06 | | 5-40 years |
Spyglass, Mansfield, TX | | 15,504 | | 1,280 | | 15,272 | | 787 | | 1,291 | | 16,048 | | 17,339 | | 2,167 | | 2002 | | 03/02 | | 40 years |
Stonebridge at City Park, Houston, TX | | 14,114 | | 1,545 | | 14,786 | | 97 | | 1,545 | | 14,883 | | 16,428 | | 1,797 | | 2004 | | 01/04 | | 40 years |
Sugar Mill, Baton Rouge, LA | | 11,218 | | 1,882 | | 12,371 | | 176 | | 1,882 | | 12,546 | | 14,428 | | 28 | | 2009 | | 08/08 | | 40 years |
Toulon Apts, Gautier, MS | | 2,524 | | 1,621 | | — | | 1,253 | | 1,993 | | 881 | | 2,874 | | — | | — | | 09/09 | | 40 years |
Treehouse, Irving, TX | | 5,268 | | 312 | | 2,807 | | — | | 312 | | 2,807 | | 3,119 | | 386 | | 1974 | | 05/04 | | 5-40 years |
Verandas at City View, Fort Worth, TX | | 17,475 | | 2,005 | | 19,463 | | 1,135 | | 2,005 | | 20,598 | | 22,604 | | 3,085 | | 2003 | | 09/01 | | 40 years |
Vistas of Pinnacle Park, Dallas, TX | | 18,413 | | 1,750 | | 19,808 | | 12 | | 1,750 | | 19,820 | | 21,570 | | 2,696 | | 2002 | | 10/02 | | 40 years |
SCHEDULE IIINOTE 18. SUBSEQUENT EVENTS(Continued)The Company has evaluated subsequent events through March 29, 2013, the date the financial statements were available to be issued.
TRANSCONTINENTAL REALTY INVESTORS, INC.REAL ESTATE AND ACCUMULATED DEPRECIATION
On January 8, 2013, 14.52 acres of land known as Southwood located in Tallahassee, Florida was sold at a foreclosure auction to a third party for $0.5 million. This land parcel was previously sold, on December 31, 20092012, to One Realco Corporation, a related party, for a sales price of $0.6 million. The Company did not recognize or record the sale in accordance with ASC 360-20 due to our continuing involvement, which included the potential payment of cash shortfalls, future obligations under the existing mortgage and guaranty, the buyer’s inadequate initial investment and the Company’s questionable recovery of investment cost. The Company determined that no sale had occurred for financial reporting purposes and therefore the asset remained on the books and continued to record operating expenses and depreciation as a period cost until a sale occurred that met the requirements of ASC 360-20. A sale to an independent third party, that met the requirements of ASC 360-20, took place on January 8, 2013, when the property was sold to a third party and sales proceeds were credited against the outstanding debt. We will not record a gain or loss on the land parcel sale.
| | | | | | | | | | | | | | | | | | | | | | | | | | | | | | |
Property/Location | | Encumbrances | | Initial Cost | | Cost Capitalized
Subsequent to
Acquisition | | Gross Amounts of Which
Carried at End of Year | | Accumulated
Depreciation | | Date of
Construction | | Date
Acquired | | Life on
Which
Depreciation
In Latest
Statement of
Operation is
Computed |
| | | Land | | Building &
Improvements | | Improvements | | Land | | Building &
Improvements | | Total | | | | |
| | | (dollars in thousands) |
Vistas of Vance Jackson, San Antonio, TX | | | 15,542 | | | 1,265 | | | 16,540 | | | 59 | | | 1,265 | | | 16,598 | | | 17,863 | | | 1,742 | | 2004 | | 01/04 | | 40 years |
Wildflower Villas, Temple, TX | | | 13,487 | | | 1,119 | | | 15,526 | | | 71 | | | 1,119 | | | 15,597 | | | 16,716 | | | 959 | | 2004 | | 03/04 | | 40 years |
Windsong, Fort Worth, TX | | | 10,386 | | | 790 | | | 11,526 | | | — | | | 790 | | | 11,526 | | | 12,316 | | | 1,685 | | 2002 | | 07/03 | | 40 years |
| | | | | | | | | | | | | | | | | | | | | | | | | | | | | | |
| | $ | 592,001 | | $ | 56,800 | | $ | 648,278 | | $ | 12,367 | | $ | 59,789 | | $ | 657,655 | | $ | 717,444 | | $ | 57,846 | | | | | | |
Commercial | | | | | | | | | | | | | | | | | | | | | | | | | | | | | | |
1010 Common, New Orleans, LA | | $ | 14,339 | | $ | 2,895 | | $ | 13,811 | | $ | 21,984 | | $ | 2,895 | | $ | 35,795 | | $ | 38,690 | | $ | 23,624 | | 1971 | | 03/98 | | 5-40 years |
217 Rampart, New Orleans, LA | | | — | | | 2,076 | | | — | | | 61 | | | 2,076 | | | 61 | | | 2,137 | | | 6 | | — | | 08/06 | | 40 years |
225 Baronne, New Orleans, LA | | | — | | | 1,162 | | | 1,444 | | | 7,139 | | | 1,162 | | | 8,582 | | | 9,744 | | | 7,525 | | 1960 | | 03/98 | | 5-40 years |
305 Baronne, New Orleans, LA | | | 5,929 | | | 211 | | | 1,953 | | | 475 | | | 211 | | | 2,428 | | | 2,640 | | | 207 | | 1902 | | 08/06 | | 5-40 years |
600 Las Colinas, Las Colinas, TX | | | 36,309 | | | 5,751 | | | 51,759 | | | 5,503 | | | 5,751 | | | 57,262 | | | 63,013 | | | 7,626 | | 1984 | | 08/05 | | 5-40 years |
Addison Hanger I, Addison, TX | | | — | | | 1,616 | | | 793 | | | 49 | | | 1,616 | | | 843 | | | 2,459 | | | 377 | | 1992 | | 12/99 | | 5-40 years |
Addison Hanger II, Addison, TX | | | — | | | — | | | 1,324 | | | 79 | | | — | | | 1,403 | | | 1,403 | | | 378 | | 2000 | | 12/99 | | 5-40 years |
Alpenloan, Dallas, TX | | | 384 | | | 1,061 | | | 261 | | | — | | | 1,061 | | | 261 | | | 1,322 | | | 10 | | — | | 05/08 | | 5-40 years |
Amoco Building, New Orleans, LA | | | 18,750 | | | 1,233 | | | 3,826 | | | 6,260 | | | 1,233 | | | 10,086 | | | 11,320 | | | 7,363 | | 1974 | | 07/97 | | 5-40 years |
Bridgeview Plaza, LaCrosse, WI | | | 6,365 | | | 870 | | | 7,830 | | | 223 | | | 870 | | | 8,053 | | | 8,923 | | | 1,380 | | 1979 | | 03/03 | | 5-40 years |
Browning Place (Park West I), Dallas, TX | | | 33,149 | | | 5,096 | | | 45,868 | | | 6,197 | | | 5,096 | | | 52,065 | | | 57,161 | | | 5,886 | | 1984 | | 04/05 | | 5-40 years |
Clark Garage, New Orleans, LA | | | — | | | 1,033 | | | 9,293 | | | 26 | | | 1,033 | | | 9,319 | | | 10,352 | | | 573 | | — | | 08/06 | | 40 years |
Dunes Plaza, Michigan City, IN | | | 3,319 | | | 1,343 | | | 3,412 | | | 1,534 | | | 1,529 | | | 4,760 | | | 6,289 | | | 2,996 | | 1978 | | 03/92 | | 5-40 years |
Ergon Office Building, Jackson, MS | | | 1,878 | | | 201 | | | 1,914 | | | — | | | 201 | | | 1,914 | | | 2,115 | | | 56 | | — | | 11/08 | | 5-40 years |
Eton Square, Tulsa, OK | | | 9,253 | | | 1,469 | | | 13,219 | | | 4,051 | | | 1,469 | | | 17,270 | | | 18,739 | | | 4,992 | | 1985 | | 09/99 | | 5-40 years |
SCHEDULE
On January 24, 2013, we refinanced the existing mortgage on Breakwater Bay apartments, a 176-unit complex located in Beaumont, Texas, for a new mortgage of $9.8 million. We paid off the existing mortgage of $9.1 million and $0.7 million in closing costs and escrows. The note accrues interest at 2.50% and payments of interest and principal are due monthly based upon a 40-year amortization schedule, maturing on February 1, 2053.
On January 25, 2013, we refinanced the existing mortgage on Northside on Travis apartments, a 200-unit complex located in Sherman, Texas, for a new mortgage of $13.9 million. We paid off the existing mortgage of $13.5 million and $1.3 million in closing costs and escrows. The note accrues interest at 2.50% and payments of interest and principal are due monthly based upon a 40-year amortization schedule, maturing on February 1, 2053.
On January 28, 2013, we refinanced the existing mortgage on Capitol Hill apartments, a 156-unit complex located in Little Rock, Arkansas, for a new mortgage of $9.4 million. We paid off the existing mortgage of $8.8 million and $0.6 million in closing costs and escrows. The note accrues interest at 2.50% and payments of interest and principal are due monthly based upon a 40-year amortization schedule, maturing on February 1, 2053.
On January 28, 2013, we sold a 314–unit apartment complex known as Verandas at City View located in Fort Worth, Texas for a sales price of $25.3 million. The buyer assumed the existing debt of $18.2 million secured by the property. We recorded a gain of $6.2 million on the sale.
On February 25, 2013, we refinanced the existing mortgage on Mansions of Mansfield apartments, a 208-unit complex located in Mansfield, Texas, for a new mortgage of $16.3 million. We paid off the existing mortgage of $15.8 million and $1.4 million in closing costs and escrows. The note accrues interest at 2.50% and payments of interest and principal are due monthly based upon a 40-year amortization schedule, maturing on March 1, 2053.
On February 25, 2013, we refinanced the existing mortgage on Preserve at Pecan Creek apartments, a 192-unit complex located in Denton, Texas, for a new mortgage of $15.1 million. We paid off the existing mortgage of $14.6 million and $1.2 million in closing costs and escrows. The note accrues interest at 2.50% and payments of interest and principal are due monthly based upon a 40-year amortization schedule, maturing on March 1, 2053.
Schedule III
(Continued)
TRANSCONTINENTAL REALTY INVESTORS, INC.
| TRANSCONTINENTAL REALTY INVESTORS, INC. |
| REAL ESTATE AND ACCUMULATED DEPRECIATION |
| December 31, 2012 |
| | | | Initial Cost | | Cost Capitalized Subsequent to Acquisition | Asset Impairment | Carried at End of Year | | | | | | |
Property/Location | Encumbrances | Land | Building & Improvements | Improvements | | Land | | Total | Accumulated Depreciation | | | | | Life on Which Depreciation |
| | (dollars in thousands) |
| Properties Held for Investment | | | | | | | | | | | | | | | | |
| Apartments | | | | | | | | | | | | | | | | | |
| Anderson Estates, Oxford, MS | $ 888 | | $ 378 | $ 2,683 | | $ 313 | | | $ 691 | $ 2,683 | $ 3,373 | $ 464 | | 2003 | | 01/06 | 40 years |
| Blue Lake Villas I, Waxahachie, TX | 10,481 | | 526 | 10,784 | | 201 | | | 526 | 10,985 | 11,511 | 2,713 | | 2003 | | 01/02 | 40 years |
| Blue Lake Villas II, Waxahachie, TX | 4,068 | | 287 | 4,451 | | - | | | 287 | 4,451 | 4,738 | 567 | | 2004 | | 01/04 | 40 years |
| Blue Ridge, Midland, TX | 24,028 | | 2,259 | 24,359 | | - | | | 2,259 | 24,359 | 26,618 | 963 | | 2011 | | 02/10 | 40 years |
| Breakwater Bay, Beaumont, TX | 9,132 | | 740 | 10,435 | | - | | | 740 | 10,435 | 11,175 | 2,059 | | 2004 | | 05/03 | 40 years |
| Bridgewood Ranch, Kaufman, TX | 4,639 | | 762 | 6,856 | | - | | | 762 | 6,856 | 7,618 | 863 | | 2007 | | 04/08 | 40 years |
| Capitol Hill, Little Rock, AR | 8,777 | | 1,860 | 7,948 | | - | | | 1,860 | 7,948 | 9,807 | 1,691 | | 2003 | | 03/03 | 40 years |
| Curtis Moore Estates, Greenwood, MS | 1,596 | | 186 | 5,733 | | �� 757 | | | 902 | 5,774 | 6,676 | 1,139 | | 2003 | | 01/06 | 40 years |
| Dakota Arms, Lubbock, TX | 12,279 | | 921 | 12,644 | | 231 | | | 921 | 12,875 | 13,796 | 2,568 | | 2004 | | 01/04 | 40 years |
| David Jordan Phase II, Greenwood, MS | 602 | | 51 | 1,521 | | 225 | | | 277 | 1,521 | 1,798 | 298 | | 1999 | | 01/06 | 40 years |
| David Jordan Phase III, Greenwood, MS | 627 | | 83 | 2,115 | | 356 | | | 439 | 2,115 | 2,554 | 366 | | 2003 | | 01/06 | 40 years |
| Desoto Ranch, DeSoto, TX | 15,915 | | 1,472 | 17,856 | | 65 | | | 1,472 | 17,921 | 19,393 | 3,961 | | 2002 | | 05/02 | 40 years |
| Dorado Ranch, Odessa, TX | 16,230 | | 761 | 18,544 | | 24 | | | 761 | 18,568 | 19,329 | 1,779 | | 2009 | | 07/07 | 40 years |
| Falcon Lakes, Arlington, TX | 13,265 | | 1,438 | 15,094 | | 327 | | | 1,438 | 15,420 | 16,858 | 4,046 | | 2001 | | 10/01 | 40 years |
| Heather Creek, Mesquite, TX | 11,770 | | 1,326 | 12,015 | | 69 | | | 1,344 | 12,065 | 13,410 | 2,404 | | 2003 | | 03/03 | 40 years |
| Huntington Ridge, DeSoto, TX | 14,887 | | 1,693 | 15,927 | | 40 | | | 1,693 | 15,967 | 17,660 | 1,731 | | 2007 | | 10/04 | 40 years |
| Laguna Vista, Dallas, TX | 17,568 | | 288 | 20,743 | | 497 | | | 370 | 21,158 | 21,528 | 3,305 | | 2006 | | 12/04 | 40 years |
| Lake Forest, Houston, TX | 12,743 | | 335 | 12,267 | | 1,519 | | | 335 | 13,786 | 14,121 | 2,515 | | 2004 | | 01/04 | 40 years |
| Legends Of El Paso, El Paso, TX | 15,269 | | 1,318 | 16,639 | | 697 | | | 1,318 | 17,336 | 18,654 | 2,477 | | 2006 | | 07/05 | 40 years |
| Lodge at Pecan Creek, Denton, TX | 16,303 | | 1,349 | 16,138 | | - | | | 1,349 | 16,138 | 17,486 | 419 | | 2011 | | 10/05 | 40 years |
| Mansions of Mansfield, Mansfield, TX | 15,784 | | 977 | 17,799 | | - | | | 977 | 17,799 | 18,775 | 1,668 | | 2009 | | 09/05 | 40 years |
| Mariposa Villas, Dallas, TX | 12,168 | | 788 | 13,131 | | - | | | 788 | 13,131 | 13,918 | 2,420 | | 2002 | | 01/02 | 40 years |
| Mission Oaks, San Antonio, TX | 15,550 | | 1,266 | 16,627 | | 212 | | | 1,266 | 16,839 | 18,105 | 2,384 | | 2005 | | 05/05 | 40 years |
| Monticello Estate, Monticello, AR | 492 | | 36 | 1,493 | | 263 | | | �� 285 | 1,508 | 1,793 | 273 | | 2001 | | 01/06 | 40 years |
| Northside on Travis, Sherman, TX | 13,544 | | 1,301 | 14,560 | | - | | | 1,301 | 14,560 | 15,861 | 1,214 | | 2009 | | 10/07 | 40 years |
| Paramount Terrace, Amarillo, TX | 3,152 | | 340 | 3,061 | | 179 | | | 340 | 3,241 | 3,581 | 1,108 | | 1983 | | 05/00 | 40 years |
| Park at Clarksville, Clarksville, TN | 12,983 | | 571 | 14,300 | | 118 | | | 587 | 14,403 | 14,990 | 1,551 | | 2007 | | 06/02 | 40 years |
| Parc at Denham Springs, Denham Springs, LA | 19,381 | | 1,022 | 20,131 | | - | | | 1,022 | 20,131 | 21,153 | 988 | | 2011 | | 07/07 | 40 years |
| Parc at Maumelle, Little Rock, AR | 16,643 | | 1,153 | 17,688 | | 617 | | | 1,153 | 18,305 | 19,458 | 2,738 | | 2006 | | 12/04 | 40 years |
| Parc at Metro Center, Nashville, TN | 10,939 | | 960 | 12,226 | | 503 | | | 960 | 12,729 | 13,689 | 1,994 | | 2006 | | 05/05 | 40 years |
| Parc at Rogers, Rogers, AR | 16,904 | | 1,482 | 22,993 | | 266 | | (3,180) | 1,749 | 19,813 | 21,562 | 2,496 | | 2007 | | 04/04 | 40 years |
| Pecan Pointe, Temple, TX | 16,728 | | 1,744 | 16,876 | | 197 | | | 1,744 | 17,073 | 18,817 | 1,942 | | 2007 | | 10/06 | 40 years |
| Preserve at Pecan Creek, Denton, TX | 14,645 | | 885 | 16,626 | | 59 | | | 902 | 16,668 | 17,570 | 1,794 | | 2008 | | 10/05 | 40 years |
| River Oaks, Wylie, TX | 9,633 | | 590 | 11,674 | | 148 | | | 590 | 11,822 | 12,412 | 2,901 | | 2002 | | 10/01 | 40 years |
| Riverwalk Phase I, Greenville, MS | 317 | | 23 | 1,537 | | 175 | | | 198 | 1,537 | 1,736 | 309 | | 2003 | | 01/06 | 40 years |
| Riverwalk Phase II, Greenville, MS | 1,212 | | 52 | 4,007 | | 363 | | | 297 | 4,126 | 4,423 | 1,062 | | 2003 | | 01/06 | 40 years |
| Savoy of Garland, Garland, TX | 10,198 | | 760 | 11,602 | | 147 | | | 760 | 11,749 | 12,509 | 993 | | 2009 | | 10/06 | 40 years |
| Sonoma Court, Rockwall, TX | 11,028 | | 941 | 11,132 | | - | | | 941 | 11,132 | 12,073 | 365 | | 2011 | | 07/10 | 40 years |
| Stonebridge at City Park, Houston, TX | 14,358 | | 1,545 | 14,786 | | 97 | | | 1,545 | 14,883 | 16,428 | 2,931 | | 2004 | | 01/04 | 40 years |
| Sugar Mill, Baton Rouge, LA | 11,904 | | 1,882 | 13,367 | | 135 | | | 1,882 | 13,502 | 15,384 | 1,110 | | 2009 | | 08/08 | 40 years |
| Toulon, Gautier, MS | 20,700 | | 1,993 | 19,727 | | - | | | 1,993 | 19,727 | 21,720 | 700 | | 2011 | | 09/09 | 40 years |
| Treehouse, Irving, TX | 4,917 | | 297 | 2,672 | | 85 | | | 297 | 2,757 | 3,054 | 601 | | 1974 | | 05/04 | 40 years |
| Vistas of Pinnacle Park, Dallas, TX | 18,735 | | 1,750 | 19,808 | | 111 | | | 1,750 | 19,920 | 21,670 | 4,206 | | 2002 | | 10/02 | 40 years |
| Vistas of Vance Jackson, San Antonio, TX | 15,814 | | 1,265 | 16,540 | | 189 | | | 1,327 | 16,666 | 17,993 | 3,047 | | 2004 | | 01/04 | 40 years |
| Windsong, Fort Worth, TX | 10,541 | | 790 | 11,526 | | - | | | 790 | 11,526 | 12,316 | 2,549 | | 2002 | | 07/03 | 40 years |
| Total Apartments Held for Investment | $ 509,337 | | $ 42,445 | $ 560,640 | | $ 9,187 | | $ (3,180) | $ 45,186 | $ 563,907 | $ 609,093 | $ 79,672 | | | | | |
| TRANSCONTINENTAL REALTY INVESTORS, INC. |
| REAL ESTATE AND ACCUMULATED DEPRECIATION |
| December 31, 2012 |
|
| | | Initial Cost | | Cost Capitalized Subsequent to Acquisition | Asset Impairment | Carried at End of Year | | | | | | |
Property/Location | Encumbrances | Land | Building & Improvements | Improvements | | Land | | Total | Accumulated Depreciation | | | | | Life on Which Depreciation |
| | (dollars in thousands) |
| Commercial | | | | | | | | | | | | | | | | | |
| 225 Baronne, New Orleans, LA | $ - | | $ 1,162 | $ 1,444 | | $ 7,318 | | | $ 1,162 | $ 8,761 | $ 9,923 | $ 7,713 | | 1960 | | 03/98 | 40 years |
| 600 Las Colinas, Las Colinas, TX | 32,800 | | 5,751 | 51,759 | | 7,038 | | | 5,751 | 58,797 | 64,548 | 13,395 | | 1984 | | 08/05 | 40 years |
| 1010 Common, New Orleans, LA | 13,489 | | 2,895 | 13,811 | | 23,051 | | | 2,895 | 36,862 | 39,757 | 27,250 | | 1971 | | 03/98 | 40 years |
| Bridgeview Plaza, LaCrosse, WI | 6,223 | | - | - | | 635 | | | - | 635 | 635 | 223 | | 1979 | | 03/03 | 40 years |
| Browning Place (Park West I), Farmers Branch, TX | 30,723 | | 5,096 | 45,868 | | 8,146 | | | 5,096 | 54,014 | 59,110 | 11,455 | | 1984 | | 04/05 | 40 years |
| Ergon Office Building, Jackson, MS | 1,878 | | 201 | 1,914 | | - | | (1,963) | 152 | - | 152 | 152 | | — | | 11/08 | 40 years |
| Fruitland Plaza, Fruitland Park, FL | - | | 23 | - | | 66 | | | 23 | 66 | 89 | 17 | | — | | 05/92 | 40 years |
| Senlac VHP, Farmers Branch, TX | 647 | | 622 | - | | 142 | | | 622 | 142 | 765 | 110 | | — | | 08/05 | 40 years |
| Sesame Square, Anchorage, AK | 960 | | 562 | 1,538 | | - | | | 562 | 1,538 | 2,101 | 1,459 | | 1981 | | 04/11 | 40 years |
| Stanford Center, Dallas, TX | 22,850 | | 3,878 | 34,862 | | 523 | | | 3,878 | 35,385 | 39,264 | 4,168 | | — | | 06/08 | 40 years |
| Total Commercial Held for Investment | $ 109,570 | | $ 20,191 | $ 151,195 | | $ 46,920 | | $ (1,963) | $ 20,142 | $ 196,201 | $ 216,343 | $ 65,942 | | | | | |
| | | | | | | | | | | | | | | | | | |
| Land | | | | | | | | | | | | | | | | | |
| Audubon, Adams County, MS | $ - | | $ 519 | $ - | | $ 297 | | | $ 815 | $ - | $ 815 | $ - | | — | | 03/07 | — |
| Cooks Lane, Fort Worth, TX | - | | 1,094 | - | | - | | | 1,094 | - | 1,094 | - | | — | | 06/04 | — |
| Dedeaux, Gulfport, MS | 1,734 | | 1,612 | - | | 46 | | (38) | 1,620 | - | 1,620 | - | | — | | 10/06 | — |
| Denham Springs, Denham Springs, LA | 165 | | 339 | - | | - | | | 339 | - | 339 | - | | — | | 08/08 | — |
| Gautier Land, Gautier, MS | 691 | | 2,526 | - | | 128 | | (298) | 2,356 | - | 2,356 | - | | — | | 07/98 | — |
| Hollywood Casino Land Tract II, Farmers Branch, TX | 3,440 | | 3,131 | - | | 381 | | | 3,512 | - | 3,512 | - | | — | | 03/08 | — |
| Hunter Equities Land, Dallas, TX | - | | 398 | - | | - | | | 398 | - | 398 | - | | — | | 07/08 | — |
| Jackson Capital City Center, Jackson, MS | 4,751 | | 8,986 | - | | 4,481 | | (1,310) | 12,156 | - | 12,156 | - | | — | | 11/08 | — |
| Kelly Lot, Farmers Branch, TX | - | | 81 | - | | - | | | 81 | - | 81 | - | | — | | 04/12 | — |
| Lacy Longhorn Land, Farmers Branch, TX | - | | 386 | - | | - | | | 386 | - | 386 | - | | — | | 06/04 | — |
| LaDue Land, Farmers Branch, TX | 606 | | 1,810 | - | | - | | | 1,810 | - | 1,810 | - | | — | | 07/98 | — |
| Lake Shore Villas, Humble, TX | - | | 81 | - | | 3 | | | 84 | - | 84 | - | | — | | 03/02 | — |
| Lubbock Land, Lubbock, TX | - | | 234 | - | | - | | | 234 | - | 234 | - | | — | | 01/04 | — |
| Luna (Carr), Farmers Branch, TX | 384 | | 589 | - | | - | | | 589 | - | 589 | - | | — | | 07/05 | — |
| Manhattan Land, Farmers Branch, TX | 2 | | 4,658 | - | | 53 | | - | 4,711 | - | 4,711 | - | | — | | 02/00 | — |
| McKinney 36, Collin County, TX | 3,578 | | 1,948 | - | | - | | (58) | 1,890 | - | 1,890 | - | | — | | 01/98 | — |
| McKinney Ranch Land, McKinney, TX | 6,611 | | 13,935 | - | | 459 | | (2,226) | 12,169 | - | 12,169 | - | | — | | 12/05 | — |
| Mira Lago, Farmers Branch, TX | - | | 59 | - | | 15 | | | 74 | - | 74 | - | | — | | 05/01 | — |
| Nakash, Malden, MO | - | | 113 | - | | - | | | 113 | - | 113 | - | | — | | 01/93 | — |
| Nashville, Nashville, TN | - | | 1,256 | - | | 53 | | | 1,309 | - | 1,309 | - | | — | | 06/02 | — |
| Nicholson Croslin, Dallas, TX | 116 | | 63 | - | | - | | | 63 | - | 63 | - | | — | | 10/98 | — |
| Nicholson Mendoza, Dallas, TX | 49 | | 27 | - | | - | | | 27 | - | 27 | - | | — | | 10/98 | — |
| Ocean Estates, Gulfport, MS | - | | 1,418 | - | | 390 | | | 1,808 | - | 1,808 | - | | — | | 10/07 | — |
| Seminary West, Fort Worth, TX | - | | 146 | - | | - | | | 146 | - | 146 | - | | — | | 07/01 | — |
| Summer Breeze, Odessa, TX | - | | 687 | - | | - | | | 687 | - | 687 | - | | — | | 06/12 | — |
| Texas Plaza Land, Irving, TX | 99 | | 1,738 | - | | - | | (238) | 1,500 | - | 1,500 | - | | — | | 12/06 | — |
| Travelers Land, Farmers Branch, TX | 27,715 | | 24,511 | - | | - | | | 24,511 | - | 24,511 | - | | — | | 11/06 | — |
| Travelers Land, Farmers Branch, TX | 1,777 | | 1,913 | - | | - | | | 1,913 | - | 1,913 | - | | — | | 11/06 | — |
| Travis Ranch Land, Kaufman County, TX | 757 | | 1,030 | - | | - | | | 1,030 | - | 1,030 | - | | — | | 08/08 | — |
| Travis Ranch Retail, Kaufman City, TX | - | | 1,517 | - | | - | | | 1,517 | - | 1,517 | - | | — | | 08/08 | — |
| Union Pacific Railroad Land, Dallas, TX | - | | 130 | - | | - | | | 130 | - | 130 | - | | — | | 03/04 | — |
| US Virgin Islands - Pearl, US Virgin Islands | 3,018 | | 14,031 | - | | 2,284 | | | 16,315 | - | 16,315 | - | | — | | 10/08 | — |
| Valley View 34 (Mercer Crossing), Farmers Branch, TX | 259 | | 228 | - | | - | | | 228 | - | 228 | - | | — | | 08/08 | — |
| | | | | | | | | | | | | | | | | | Schedule III |
| TRANSCONTINENTAL REALTY INVESTORS, INC. |
| REAL ESTATE AND ACCUMULATED DEPRECIATION |
| December 31, 2012 |
| | | | | | | | | | | | | | |
| | | | Initial Cost | | Cost Capitalized Subsequent to Acquisition | Asset Impairment | Gross Amounts of Which Carried at End of Year | | | | | | |
| Property/Location | Encumbrances | Land | | Improvements | Asset Impairment | Land | | Total | Accumulated Depreciation | | | | | Life on Which Depreciation |
| | (dollars in thousands) |
| Land (cont'd) | | | | | | | | | | | | | | | | | |
| Valley View/Senlac, Farmers Branch, TX | 609 | | 780 | - | | - | | | 780 | - | 780 | - | | — | | 12/05 | — |
| Waco 151 Land, Waco, TX | 1,218 | | 2,106 | - | | - | | (1,207) | 899 | - | 899 | - | | — | | 04/07 | — |
| Waco Swanson, Waco, TX | - | | 173 | - | | - | | | 173 | - | 173 | - | | — | | 08/06 | — |
| Walker Land, Dallas County, TX | 8,397 | | 12,613 | - | | - | | | 12,613 | - | 12,613 | - | | — | | 09/06 | — |
| Willowick Land, Pensacola, FL | - | | 137 | - | | - | | | 137 | - | 137 | - | | — | | 01/95 | — |
| Windmill Farms Land, Kaufman County, TX | 33,415 | | 49,879 | 14,140 | | 115 | | (21,009) | 43,126 | - | 43,126 | - | | — | | 11/11 | — |
| Total Land Held for Investment | $ 99,391 | | $ 156,883 | $ 14,140 | | $ 8,704 | | $ (26,383) | $ 153,345 | $ - | $ 153,345 | $ - | | | | | |
| | | | | | | | | | | | | | | | | | |
| Corporate Departments/Investments/Misc. | | | | | | | | | | | | | |
| TCI - Corporate | $ 11,481 | | $ - | $ - | | $ - | | $ - | $ - | $ - | $ - | $ - | | — | | — | — |
| | $ 11,481 | | $ - | $ - | | $ - | | $ - | $ - | $ - | $ - | $ - | | | | | |
| | | | | | | | | | | | | | | | | | |
| Total Properties Held for Investment | $ 729,779 | | $ 219,520 | $ 725,976 | | $ 64,811 | | $ (31,526) | $ 218,673 | $ 760,108 | $ 978,780 | $ 145,614 | | | | | |
| | | | | | | | | | | | | | | | | | |
| Properties Held for Sale | | | | | | | | | | | | | | | | | |
| Apartments | | | | | | | | | | | | | | | | | |
| Verandas at City View, Fort Worth, TX | $ 18,197 | | $ 2,005 | $ 19,463 | | $ 1,267 | | | $ 2,005 | $ 20,730 | $ 22,735 | $ 4,658 | | 2003 | | 09/01 | 40 years |
| Total Apartments Held for Sale | $ 18,197 | | $ 2,005 | $ 19,463 | | $ 1,267 | | $ - | $ 2,005 | $ 20,730 | $ 22,735 | $ 4,658 | | | | | |
| | | | | | | | | | | | | | | | | | |
| Total Properties Held for Sale | $ 18,197 | | $ 2,005 | $ 19,463 | | $ 1,267 | | $ - | $ 2,005 | $ 20,730 | $ 22,735 | $ 4,658 | | | | | |
| | | | | | | | | | | | | | | | | | |
| Properties Subject to Sales Contract | | | | | | | | | | | | | | |
| Apartments | | | | | | | | | | | | | | | | | |
| Quail Hollow, Holland, OH | $ 11,129 | | $ 1,406 | $ 12,650 | | $ 41 | | $ (1,998) | $ 1,406 | $ 10,694 | $ 12,100 | $ 1,476 | | 2000 | | 04/08 | 40 years |
| Total Apartments Subject to Sales Contract | $ 11,129 | | $ 1,406 | $ 12,650 | | $ 41 | | $ (1,998) | $ 1,406 | $ 10,694 | $ 12,100 | $ 1,476 | | | | | |
| | | | | | | | | | | | | | | | | | |
| Commercial | | | | | | | | | | | | | | | | | |
| Amoco Building, New Orleans, LA | $ 21,353 | | $ 1,233 | $ 3,826 | | $ 6,825 | | | $ 1,233 | $ 10,652 | $ 11,885 | $ 7,980 | | 1974 | | 07/97 | 40 years |
| Eton Square, Tulsa, OK | 9,213 | | 1,469 | 13,219 | | 4,207 | | (2,400) | 1,469 | 15,026 | 16,495 | 6,835 | | 1985 | | 09/99 | 40 years |
| Thermalloy, Farmers Branch, TX | 121 | | 791 | 1,061 | | - | | | 791 | 1,061 | 1,852 | 121 | | — | | 05/08 | 40 years |
| Total Commercial Subject to Sales Contract | $ 30,687 | | $ 3,493 | $ 18,107 | | $ 11,032 | | $ (2,400) | $ 3,493 | $ 26,740 | $ 30,232 | $ 14,936 | | | | | |
| | | | | | | | | | | | | | | | | | |
| Land | | | | | | | | | | | | | | | | | |
| Dominion Tract, Dallas, TX | $ 1,221 | | $ 2,393 | $ - | | $ - | | $ (133) | $ 2,260 | $ - | $ 2,260 | $ - | | — | | 03/99 | — |
| Hollywood Casino Tract I, Farmers Branch, TX | 2,124 | | 4,249 | - | | 135 | | (176) | 4,207 | - | 4,207 | - | | — | | 06/02 | — |
| Luna Ventures, Farmers Branch TX | 380 | | 2,934 | - | | - | | | 2,934 | - | 2,934 | - | | — | | 04/08 | — |
| Mansfield Land, Mansfield, TX | 304 | | �� 543 | - | | 3 | | | 546 | - | 546 | - | | — | | 09/05 | — |
| Pioneer Crossing, Austin, TX | 145 | | 229 | - | | - | | - | 229 | - | 229 | - | | — | | 03/06 | — |
| Senlac Land Tract II, Farmers Branch, TX | 116 | | 656 | - | | - | | | 656 | - | 656 | - | | — | | 08/05 | — |
| Sheffield Village, Grand Prairie, TX | 332 | | 1,643 | - | | 438 | | | 2,082 | - | 2,082 | - | | — | | 09/03 | — |
| Southwood Plantation 1394, Tallahassee, FL | 600 | | 1,209 | - | | 113 | | (823) | 500 | - | 500 | - | | — | | 02/06 | — |
| Stanley Tools, Farmers Branch, TX | 1,324 | | 5,373 | - | | - | | (301) | 5,072 | - | 5,072 | - | | — | | 02/04 | — |
| Whorton Land, Bentonville, AR | 3,242 | | 4,291 | - | | 6 | | (2,997) | 1,300 | - | 1,300 | - | | — | | 06/05 | — |
| Total Land Subject to Sales Contract | $ 9,788 | | $ 23,521 | $ - | | $ 695 | | $ (4,429) | $ 19,786 | $ - | $ 19,786 | $ - | | | | | |
| | | | | | | | | | | | | | | | | | |
| Total Properties Subject to Sales Contract | $ 51,604 | | $ 28,419 | $ 30,757 | | $ 11,769 | | $ (8,827) | $ 24,685 | $ 37,434 | $ 62,118 | $ 16,412 | | | | | |
| | | | | | | | | | | | | | | | | | |
| TOTAL: Real Estate | $ 799,580 | | $ 249,944 | $ 776,196 | | $ 77,847 | | $ (40,353) | $ 245,363 | $ 818,271 | $ 1,063,634 | $ 166,684 | | | | | |
| REAL ESTATE AND ACCUMULATED DEPRECIATION | |
| As of December 31, | |
| | | | | | | | | SCHEDULE III | |
| | | | | | | | | (Continued) | |
| | | | | | | | | | |
| | | 2012 | | | 2011 | | | 2010 | |
| | | (dollars in thousansds) | |
| Reconciliation of Real Estate | | | | | | | | | |
| Balance at January 1, | | $ | 1,146,234 | | | $ | 1,365,709 | | | $ | 1,599,475 | |
| Additions | | | | | | | | | | | | |
| Acquisitions, improvements and construction | | | 15,205 | | | | 83,493 | | | | 49,742 | |
| Deductions | | | | | | | | | | | | |
| Sale of real estate | | | (91,504 | ) | | | (312,944 | ) | | | (263,349 | ) |
| Asset impairments | | | (6,301 | ) | | | 9,976 | | | | (20,159 | ) |
| Balance at December 31, | | $ | 1,063,634 | | | $ | 1,146,234 | | | $ | 1,365,709 | |
| | | | | | | | | | | | | |
| Reconciliation of Accumulated Depreciation | | | | | | | | | | | | |
| Balance at January 1, | | $ | 157,895 | | | $ | 152,595 | | | $ | 152,291 | |
| Additions | | | | | | | | | | | | |
| Depreciation | | | 22,486 | | | | 27,166 | | | | 26,753 | |
| Deductions | | | | | | | | | | | | |
| Sale of real estate | | | (13,697 | ) | | | (21,866 | ) | | | (26,449 | ) |
| Balance at December 31, | | $ | 166,684 | | | $ | 157,895 | | | $ | 152,595 | |
| | | | | | | | | | SCHEDULE IV |
| | | | | | | | | | | | | | |
| TRANSCONTINENTAL REALTY INVESTORS, INC. |
| MORTGAGE LOANS ON REAL ESTATE |
| December 31, 2012 |
| Description | | Interest Rate | | | Final Maturity Date | | Periodic Payment Terms | | Prior Liens | | | Face Amount of Mortgate | | | Carrying Amount of Mortgage | | | Principal Amounts of Loans Subject To Delinquent Principal or Interest | |
| | | | | | | | | | (dollars in thousands) | | | | |
| Miscellaneous non-related party notes | | various | | | various | | | | | - | | | | 903 | | | | 640 | | | | - | |
| Miscellaneous related party notes | | various | | | various | | | | | - | | | | 664 | | | | 664 | | | | - | |
| S Breeze I-V, LLC | | | 5.00% | | | | 9/13 | | | | | - | | | | 2,590 | | | | 2,590 | | | | - | |
| 6% Class A and 25% Class B Limited Partner Interests | | | | | | | | | | | | | | | | | | | | | | | | | |
Unified Housing Foundation, Inc. (Echo Station) | | | 5.25% | | | | 12/27 | | Excess cash flow | | | 10,075 | | | | 1,668 | | | | 1,481 | | | | - | |
| 100% Interest in UH of Temple, LLC | | | | | | | | | | | | | | | | | | | | | | | | | |
| Unified Housing Foundation, Inc. (Lakeshore Villas/HFS of Humble,LLC) (31.5% of cash flow) | | | 5.25% | | | | 12/27 | | Excess cash flow | | | 16,313 | | | | 6,363 | | | | 6,363 | | | | - | |
| Interest in Unified Housing Foundation Inc. | | | | | | | | | | | | | | | | | | | | | | | | | |
| Unified Housing Foundation, Inc. (Limestone Canyon) | | | 5.25% | | | | 12/27 | | Excess cash flow | | | 13,637 | | | | 1,871 | | | | 3,057 | | | | - | |
| 100% Interest in UH of Austin, LLC | | | | | | | | | | | | | | | | | | | | | | | | | |
| Unified Housing Foundation, Inc. (Limestone Canyon) | | | 5.25% | | | | 12/27 | | Excess cash flow | | | 13,637 | | | | 3,300 | | | | 4,663 | | | | - | |
| 100% Interest in UH of Austin, LLC | | | | | | | | | | | | | | | | | | | | | | | | | |
| Unified Housing Foundation, Inc. (Limestone Ranch) | | | 5.25% | | | | 12/27 | | Excess cash flow | | | 12,683 | | | | 6,000 | | | | 8,250 | | | | - | |
| 100% Interest in UH of Vista Ridge, LLC | | | | | | | | | | | | | | | | | | | | | | | | | |
Unified Housing Foundation, Inc. (Parkside Crossing) | | | 5.25% | | | | 12/27 | | Excess cash flow | | | 11,240 | | | | 1,223 | | | | 1,936 | | | | - | |
| 100% Interest in UH of Parkside Crossing, LLC | | | | | | | | | | | | | | | | | | | | | | | | | |
Unified Housing Foundation, Inc. (Sendero Ridge) | | | 5.25% | | | | 12/27 | | Excess cash flow | | | 23,853 | | | | 6,942 | | | | 9,986 | | | | - | |
| 100% Interest in UH of Sendero Ridge, LLC | | | | | | | | | | | | | | | | | | | | | | | | | |
Unified Housing Foundation, Inc. (Timbers of Terrell) | | | 5.25% | | | | 12/27 | | Excess cash flow | | | 7,588 | | | | 1,323 | | | | 1,323 | | | | - | |
| 100% Interest in UH of Terrell, LLC | | | | | | | | | | | | | | | | | | | | | | | | | |
Unified Housing Foundation, Inc. (Tivoli) | | | 5.25% | | | | 12/27 | | Excess cash flow | | | 10,410 | | | | 6,140 | | | | 7,966 | | | | - | |
| 100% Interest in UH of Tivoli, LLC | | | | | | | | | | | | | | | | | | | | | | | | | |
| | | | | | | | | | SCHEDULE IV |
| | | | | | | | | | (Continued) |
| TRANSCONTINENTAL REALTY INVESTORS, INC. |
| MORTGAGE LOANS ON REAL ESTATE |
| December 31, 2012 |
| Description | | Interest Rate | | | Final Maturity Date | | Periodic Payment Terms | | Prior Liens | | | Face Amount of Mortgate | | Carrying Amount of Mortgage | | | Principal Amounts of Loans Subject To Delinquent Principal or Interest | |
| | | | | | | | | | (dollars in thousands) | | | | | | | |
| | | | | | | | | | | | | | | | | | | | |
| UNSECURED LOANS | | | | | | | | | | | | | | | | | | | |
| Unified Housing Foundation, Inc. (Lakeshore Villas/HFS of Humble,LLC) (68.5% of cash flow) | | | 5.25% | | | | 12/27 | | Excess cash flow | | | 16,313 | | | | 2,000 | | | | 2,000 | | | | - | |
| Unified Housing Foundation, Inc. | | | 5.00% | | | | 12/13 | | | | | - | | | | 6,000 | | | | 6,000 | | | | - | |
| | | | | | | | | | | | $ | 105,799 | | | $ | 46,987 | | | $ | 56,919 | | | $ | - | |
| | | | | | | | | | | | | | Accrued interest | | | 4,441 | | | | | |
| | | | | | | | | | | | | Allowance for estimated losses | | | (2,262 | ) | | | | |
| | | | | | | | | | | | | | | | | | | | $ | 59,098 | | | | | |
| | | | | | SCHEDULE IV | |
| | | | | | (Continued) | |
| | | | | | | | | | |
| TRANSCONTINENTAL REALTY INVESTORS, INC. | |
| MORTGAGE LOANS ON REAL ESTATE | |
| As of December 31, | |
| | | | | | | | | | |
| | | 2012 | | | 2011 | | | 2010 | |
| | | | | | | | | | |
| Balance at January 1 | | $ | 81,313 | | | $ | 71,766 | | | $ | 48,051 | |
| Additions | | | | | | | | | | | | |
| New mortgages | | | 8,590 | | | | 22,168 | | | | 29,310 | |
| Funding of existing loans | | | - | | | | - | | | | 8,919 | |
| Recognition of prior unaccrued interest, previously reserved | | | - | | | | - | | | | - | |
| Increase of interest receivable on mortgage loans | | | 10,113 | | | | 1,467 | | | | 3,967 | |
| Deductions | | | | | | | | | | | | |
| Amounts paid | | | (12,927 | ) | | | (8,018 | ) | | | (10,962 | ) |
| Non-cash reduction | | | (1,987 | ) | | | (500 | ) | | | (7,519 | ) |
| Cost of mortgages sold | | | (23,742 | ) | | | (5,570 | ) | | | - | |
| Balance at December 31 | | $ | 61,360 | | | $ | 81,313 | | | $ | 71,766 | |
ITEM 9. CHANGES IN AND ACCUMULATED DEPRECIATIONDecember 31, 2009
| | | | | | | | | | | | | | | | | | | | | | | | | | | | | | |
Property/Location | | Encumbrances | | Initial Cost | | Cost Capitalized
Subsequent to
Acquisition | | Gross Amounts of Which
Carried at End of Year | | Accumulated
Depreciation | | Date of
Construction | | Date
Acquired | | Life on
Which
Depreciation
In Latest
Statement of
Operation is
Computed |
| | | Land | | Building &
Improvements | | Improvements | | Land | | Building &
Improvements | | Total | | | | |
| | | (dollars in thousands) |
Fenton Center (Park West II), Dallas, TX | | | 61,237 | | | 6,968 | | | 62,712 | | | 4,771 | | | 6,968 | | | 67,484 | | | 74,452 | | | 5,889 | | — | | 01/07 | | 5-40 years |
Fruitland Park, Fruitland, FL | | | — | | | 23 | | | — | | | 16 | | | 23 | | | 16 | | | 39 | | | 15 | | — | | 05/92 | | 40 years |
Keller Springs Tech Center, Carrollton, TX | | | 5,970 | | | 597 | | | 5,374 | | | — | | | 597 | | | 5,374 | | | 5,971 | | | 12 | | — | | 11/09 | | 5-40 Years |
One Hickory Center, Dallas, TX | | | 8,775 | | | 1,221 | | | 10,993 | | | 25 | | | 1,221 | | | 11,017 | | | 12,239 | | | 997 | | 1998 | | 11/09 | | 7-40 years |
Parkway North, Dallas, TX | | | 2,934 | | | 1,173 | | | 4,692 | | | 2,071 | | | 1,173 | | | 6,763 | | | 7,936 | | | 2,966 | | 1980 | | 02/98 | | 2-40 years |
Signature Building, Dallas, TX | | | 1,311 | | | 1,075 | | | 2,482 | | | 592 | | | 1,116 | | | 3,033 | | | 4,149 | | | 1,106 | | 1985 | | 02/99 | | 5-40 years |
Senlac VHP, Farmers Branch, TX | | | 625 | | | 622 | | | — | | | 142 | | | 765 | | | — | | | 765 | | | 45 | | — | | 08/05 | | — |
Stanford Center, Dallas, TX | | | 25,713 | | | 3,878 | | | 34,862 | | | 208 | | | 3,878 | | | 35,070 | | | 38,948 | | | 1,343 | | — | | 06/08 | | 5-40 years |
Teleport, Las Colinas, TX | | | — | | | 642 | | | 28 | | | — | | | 642 | | | 28 | | | 670 | | | 1 | | — | | 05/08 | | 5-40 years |
Thermalloy, Farmers Branch, TX | | | — | | | 791 | | | 1,061 | | | — | | | 791 | | | 1,061 | | | 1,852 | | | 42 | | — | | 05/08 | | 5-40 years |
Two Hickoy Center, Dallas, TX | | | 9,003 | | | 1,150 | | | 10,352 | | | 902 | | | 1,150 | | | 11,255 | | | 12,405 | | | 1,493 | | 2000 | | 06/05 | | 3-40 years |
Westgrove Air Plaza, Addison, TX | | | 2,281 | | | 211 | | | 1,898 | | | 584 | | | 228 | | | 2,465 | | | 2,693 | | | 1,482 | | 1982 | | 10/97 | | 5-40 years |
Willowbrook Village, Coldwater, MI | | | 5,268 | | | 851 | | | 7,663 | | | 296 | | | 851 | | | 7,959 | | | 8,811 | | | 818 | | 1991 | | 10/05 | | 5-40 years |
| | | | | | | | | | | | | | | | | | | | | | | | | | | | | | |
| | $ | 252,792 | | $ | 45,221 | | $ | 298,824 | | $ | 63,189 | | $ | 45,607 | | $ | 361,627 | | $ | 407,234 | | $ | 79,208 | | | | | | |
Land | | | | | | | | | | | | | | | | | | | | | | | | | | | | | | |
1013 Common St, New Orleans, LA | | | — | | | 579 | | | — | | | 159 | | | 738 | | | — | | | 738 | | | — | | — | | 08/98 | | — |
Ackerley Land, Dallas, TX | | | — | | | 150 | | | — | | | — | | | 150 | | | — | | | 150 | | | — | | — | | 06/08 | | — |
Alliance Airport, Tarrant County, TX | | | 549 | | | 895 | | | — | | | — | | | 895 | | | — | | | 895 | | | — | | — | | 05/05 | | — |
Alliance Centurion, Tarrant County, TX | | | 1,599 | | | 2,656 | | | — | | | — | | | 2,656 | | | — | | | 2,656 | | | — | | — | | 10/05 | | — |
SCHEDULE III
(Continued)
TRANSCONTINENTAL REALTY INVESTORS, INC.
REAL ESTATEDISAGREEMENTS WITH ACCOUNTANTS ON ACCOUNTING AND ACCUMULATED DEPRECIATIONFINANCIAL DISCLOSURE
None.
December 31, 2009 | | | | | | | | | | | | | | | | | | | | | | |
Property/Location | | Encumbrances | | Initial Cost | | Cost Capitalized
Subsequent to
Acquisition | | Gross Amounts of Which
Carried at End of Year | | Accumulated
Depreciation | | Date of
Construction | | Date
Acquired | | Life on
Which
Depreciation
In Latest
Statement of
Operation is
Computed |
| | | Land | | Building &
Improvements | | Improvements | | Land | | Building &
Improvements | | Total | | | | |
| | | (dollars in thousands) |
Alliance Hickman Bluestar, Tarrant County, TX | | 405 | | 738 | | — | | 318 | | 1,056 | | — | | 1,056 | | — | | — | | 10/05 | | — |
Archon Land, Irving, TX | | 4,536 | | 6,671 | | — | | — | | 6,671 | | — | | 6,671 | | — | | — | | 07/08 | | — |
Audubon, Adams County, MS | | — | | 519 | | — | | 297 | | 815 | | — | | 815 | | — | | — | | — | | — |
Centura Land, Dallas, TX | | 6,900 | | 11,535 | | — | | 716 | | 12,251 | | — | | 12,251 | | — | | — | | 12/02 | | — |
Circle C Land, Austin, TX | | 32,348 | | 30,312 | | — | | 12,641 | | 42,953 | | — | | 42,953 | | — | | — | | 03/06 | | — |
Cooks Lane Land, Fort Worth, TX | | 515 | | 1,046 | | — | | 10 | | 1,056 | | — | | 1,056 | | — | | — | | 06/04 | | — |
Copperridge, Dallas, TX | | 4,326 | | 6,392 | | — | | 752 | | 7,144 | | — | | 7,144 | | — | | — | | 01/08 | | — |
Creekside, Fort Worth, TX | | 495 | | 2,201 | | — | | — | | 2,201 | | — | | 2,201 | | — | | — | | 07/06 | | — |
Crowley, Fort Worth, TX | | 422 | | 1,569 | | — | | — | | 1,569 | | — | | 1,569 | | — | | — | | 07/06 | | — |
Dedeaux, Gulfport, MS | | 1,520 | | 1,612 | | — | | 48 | | 1,659 | | — | | 1,659 | | — | | — | | 10/06 | | — |
Denham Springs, Denham Springs, LA | | — | | 8 | | — | | — | | 8 | | — | | 8 | | — | | — | | 08/08 | | — |
Denton (Andrew B), Denton, TX | | 550 | | 895 | | — | | 8 | | 903 | | — | | 903 | | — | | — | | 12/05 | | — |
Denton (Andrew C), Denton, TX | | 74 | | 1,349 | | — | | 477 | | 1,825 | | — | | 1,825 | | — | | — | | 12/05 | | — |
Denton Coonrod, Denton, TX | | 786 | | 1,848 | | — | | — | | 1,848 | | — | | 1,848 | | — | | — | | 10/05 | | — |
Denton Land, Denton, TX | | 195 | | 318 | | — | | — | | 318 | | — | | 318 | | — | | — | | 10/05 | | — |
Desoto Ranch, Desoto, TX | | 558 | | 898 | | — | | — | | 898 | | — | | 898 | | — | | — | | 10/04 | | — |
Diplomat Drive, Farmers Branch, TX | | 512 | | 1,775 | | — | | — | | 1,775 | | — | | 1,775 | | — | | — | | 12/06 | | — |
Dominion Tract, Dallas, TX | | 1,257 | | 2,393 | | — | | — | | 2,393 | | — | | 2,393 | | — | | — | | 03/99 | | — |
Eagle Crest, Dallas, TX | | 2,387 | | 2,066 | | — | | — | | 2,066 | | — | | 2,066 | | — | | — | | 12/03 | | — |
Ewing 8, Addison, TX | | 10,752 | | 15,981 | | — | | 24 | | 16,005 | | — | | 16,005 | | — | | — | | 12/06 | | — |
Fortune Drive, Irving, TX | | 1,150 | | 1,782 | | — | | — | | 1,782 | | — | | 1,782 | | — | | — | | 03/08 | | — |
Galleria East Center Retail, Dallas, TX | | 19,039 | | 25,653 | | — | | 10,476 | | 36,129 | | — | | 36,129 | | — | | — | | 11/06 | | — |
Galleria West Lofts, Dallas, TX | | 5,230 | | 6,094 | | — | | 2,969 | | 9,063 | | — | | 9,063 | | — | | — | | 11/06 | | — |
Gautier Land, Gautier, MS | | 750 | | 2,526 | | — | | 127 | | 2,653 | | — | | 2,653 | | — | | — | | 07/98 | | — |
Hines Meridian, Las Colinas, TX | | 1,369 | | 1,266 | | — | | — | | 1,266 | | — | | 1,266 | | — | | — | | 05/07 | | — |
SCHEDULE III
(Continued)
TRANSCONTINENTAL REALTY INVESTORS, INC.
REAL ESTATE AND ACCUMULATED DEPRECIATION
December 31, 2009
| | | | | | | | | | | | | | | | | | | | | | |
Property/Location | | Encumbrances | | Initial Cost | | Cost Capitalized
Subsequent to
Acquisition | | Gross Amounts of Which
Carried at End of Year | | Accumulated
Depreciation | | Date of
Construction | | Date
Acquired | | Life on
Which
Depreciation
In Latest
Statement of
Operation is
Computed |
| | | Land | | Building &
Improvements | | Improvements | | Land | | Building &
Improvements | | Total | | | | |
| | | (dollars in thousands) |
Hollywood Casino (Dominion), Farmers Branch, TX | | 2,188 | | 4,308 | | — | | 150 | | 4,457 | | — | | 4,457 | | — | | — | | 06/02 | | — |
Hollywood Casino Land, Farmers Branch, TX | | 3,660 | | 3,131 | | — | | — | | 3,131 | | — | | 3,131 | | — | | — | | 03/08 | | — |
Hunter Equities Land, Dallas, TX | | — | | 398 | | — | | — | | 398 | | — | | 398 | | — | | — | | 07/08 | | — |
Jackson Convention Center, Jackson, MS | | 8,302 | | 8,986 | | — | | 3,887 | | 12,872 | | — | | 12,872 | | — | | — | | 07/07 | | — |
Kaufman-Adams, Kaufman County, TX | | 357 | | 823 | | — | | — | | 823 | | — | | 823 | | — | | — | | 05/08 | | — |
Kaufman-Bridgewood, Kaufman County, TX | | 115 | | 262 | | — | | — | | 262 | | — | | 262 | | — | | — | | 04/08 | | — |
Kaufman-Cogen Land, Forney, TX | | 2,049 | | 6,126 | | — | | — | | 6,126 | | — | | 6,126 | | — | | — | | 12/05 | | — |
Kaufman- Stagliano,Forney, TX | | 1,456 | | 4,119 | | — | | 67 | | 4,185 | | — | | 4,185 | | — | | — | | 06/06 | | — |
Kaufman-Taylor, Kaufman County, TX | | 164 | | 486 | | — | | — | | 486 | | — | | 486 | | — | | — | | 11/05 | | — |
Keller Springs Lofts, Addison, TX | | 2,541 | | 3,378 | | — | | 2,157 | | 5,536 | | — | | 5,536 | | — | | — | | 10/06 | | — |
Kinwest Manor, Irving, TX | | 594 | | 1,819 | | — | | 1,583 | | 3,402 | | — | | 3,402 | | — | | — | | 10/06 | | — |
Lacy Longhorn Land, Farmers Branch, TX | | 1,784 | | 3,870 | | — | | — | | 3,870 | | — | | 3,870 | | — | | — | | 06/04 | | — |
LaDue Land, Farmers Branch, TX | | 924 | | 1,810 | | — | | — | | 1,810 | | — | | 1,810 | | — | | — | | 07/98 | | — |
Lakeshore Villas, Humble, TX | | — | | 81 | | — | | 3 | | 84 | | — | | 84 | | — | | — | | 03/02 | | — |
Lamar/ Palmer, Austin, TX | | 1,463 | | 1,589 | | — | | 607 | | 2,196 | | — | | 2,196 | | — | | — | | 05/08 | | — |
Las Colinas (Cigna), Las Colinas, TX | | 821 | | 995 | | — | | 5 | | 1,000 | | — | | 1,000 | | — | | — | | 01/96 | | — |
Las Colinas Station, Las Colinas, TX | | 5,663 | | 6,985 | | — | | 3,656 | | 10,641 | | — | | 10,641 | | — | | — | | 11/06 | | — |
Las Colinas Village, Las Colinas, TX | | 6,750 | | 3,484 | | — | | 2,393 | | 5,877 | | — | | 5,877 | | — | | — | | 11/06 | | — |
LCLLP (Kinwest/Hackberry), Las Colinas, TX | | 7,286 | | 4,506 | | — | | — | | 4,506 | | — | | 4,506 | | — | | — | | 12/04 | | — |
Limestone Canyon II, Austin, TX | | — | | 428 | | — | | 137 | | 565 | | — | | 565 | | — | | — | | 06/00 | | — |
SCHEDULE III
(Continued)
TRANSCONTINENTAL REALTY INVESTORS, INC.
REAL ESTATE AND ACCUMULATED DEPRECIATION
December 31, 2009
| | | | | | | | | | | | | | | | | | | | | | |
Property/Location | | Encumbrances | | Initial Cost | | Cost Capitalized
Subsequent to
Acquisition | | Gross Amounts of Which
Carried at End of Year | | Accumulated
Depreciation | | Date of
Construction | | Date
Acquired | | Life on
Which
Depreciation
In Latest
Statement
of Operation
is Computed |
| | | Land | | Building &
Improvements | | Improvements | | Land | | Building &
Improvements | | Total | | | | |
| | | (dollars in thousands) |
Lubbock Land, Lubbock, TX | | — | | 234 | | — | | — | | 234 | | — | | 234 | | — | | — | | 01/04 | | — |
Luna (Carr), Farmers Branch, TX | | 396 | | 589 | | — | | — | | 589 | | — | | 589 | | — | | — | | 07/05 | | — |
Luna Ventures, Farmers Branch, TX | | 1,123 | | 2,934 | | — | | — | | 2,934 | | — | | 2,934 | | — | | — | | 04/08 | | — |
Mandahl Bay Land, US Virgin Islands | | 3,772 | | 14,031 | | — | | 2,289 | | 16,320 | | — | | 16,320 | | — | | — | | 11/05 | | — |
Manhattan, Farmers Branch, TX | | 2,400 | | 24,487 | | — | | 169 | | 24,656 | | — | | 24,656 | | — | | — | | 02/00 | | — |
Mansfield Land, Mansfield, TX | | 936 | | 543 | | — | | — | | 543 | | — | | 543 | | — | | — | | 09/05 | | — |
Marine Creek, Fort Worth, TX | | 1,623 | | 2,923 | | — | | 243 | | 3,166 | | — | | 3,166 | | — | | — | | 06/02 | | — |
McKinney 36, Collin County, TX | | 4,000 | | 1,973 | | — | | — | | 1,973 | | — | | 1,973 | | — | | — | | 01/98 | | — |
McKinney Corners II, Collin County, TX | | 1,054 | | 1,918 | | — | | — | | 1,918 | | — | | 1,918 | | — | | — | | 05/08 | | — |
McKinney Ranch Land, McKinney, TX | | 14,247 | | 21,402 | | — | | 623 | | 22,026 | | — | | 22,026 | | — | | — | | 12/05 | | — |
McKinney Ranch Land, McKinney, TX | | 5,321 | | 4,627 | | — | | — | | 4,627 | | — | | 4,627 | | — | | — | | 07/98 | | — |
Nakash, Malden, MO | | — | | 113 | | — | | — | | 113 | | — | | 113 | | — | | — | | 01/93 | | — |
Nashville Land, Nashville, TN | | — | | 930 | | — | | 274 | | 1,204 | | — | | 1,204 | | — | | — | | 06/02 | | — |
Nicholson Croslin, Dallas, TX | | 117 | | 181 | | — | | — | | 181 | | — | | 181 | | — | | — | | 05/08 | | — |
Nicholson Mendoza Land, Dallas, TX | | 51 | | 78 | | — | | — | | 78 | | — | | 78 | | — | | — | | 05/08 | | — |
Ocean Estates, Gulfport, MS | | — | | 1,418 | | — | | 382 | | 1,800 | | — | | 1,800 | | — | | — | | 10/07 | | — |
Pac Trust, Farmers Branch, TX | | 1,237 | | 1,608 | | — | | — | | 1,608 | | — | | 1,608 | | — | | — | | 10/01 | | — |
Pantaze Land, Dallas, TX | | 299 | | 290 | | — | | 8 | | 299 | | — | | 299 | | — | | — | | 11/05 | | — |
Payne Land, Las Colinas, TX | | 13,362 | | 18,803 | | — | | 284 | | 19,087 | | — | | 19,087 | | — | | — | | 12/04 | | — |
Pioneer Crossing, Austin, TX | | 1,238 | | 542 | | — | | 952 | | 1,494 | | — | | 1,494 | | — | | — | | 03/06 | | — |
Polo Estates At Bent Tree, Dallas, TX | | 2,700 | | 4,003 | | — | | 1,819 | | 5,823 | | — | | 5,823 | | — | | — | | 11/06 | | — |
Pulaski Land, Pulaski County, AR | | 1,131 | | 2,095 | | — | | 257 | | 2,351 | | — | | 2,351 | | — | | — | | 06/03 | | — |
Ridgepointe Drive, Irving, TX | | 92 | | 189 | | — | | — | | 189 | | — | | 189 | | — | | — | | 12/06 | | — |
Seminary West Land, Fort Worth, TX | | — | | 136 | | — | | — | | 136 | | — | | 136 | | — | | — | | 07/01 | | — |
Senlac Land, Farmers Branch, TX | | 403 | | 656 | | — | | — | | 656 | | — | | 656 | | — | | — | | 08/05 | | — |
Sheffield Village, Grand Prairie, TX | | 968 | | 1,643 | | — | | 420 | | 2,063 | | — | | 2,063 | | — | | — | | 09/03 | | — |
SCHEDULE III
(Continued)
TRANSCONTINENTAL REALTY INVESTORS, INC.
REAL ESTATE AND ACCUMULATED DEPRECIATION
December 31, 2009
| | | | | | | | | | | | | | | | | | | | | | |
Property/Location | | Encumbrances | | Initial Cost | | Cost Capitalized
Subsequent to
Acquisition | | Gross Amounts of Which
Carried at End of Year | | Accumulated
Depreciation | | Date of
Construction | | Date
Acquired | | Life on
Which
Depreciation
In Latest
Statement
of Operation
is Computed |
| | | Land | | Building &
Improvements | | Improvements | | Land | | Building &
Improvements | | Total | | | | |
| | | (dollars in thousands) |
Southwood Plantation 1934, Tallahassee, FL | | 632 | | 1,209 | | — | | 119 | | 1,329 | | — | | 1,329 | | — | | — | | 02/06 | | — |
Stanley Tools, Farmers Branch, TX | | 1,480 | | 5,373 | | — | | — | | 5,373 | | — | | 5,373 | | — | | — | | 02/04 | | — |
Temple Land, Temple, TX | | — | | 415 | | — | | — | | 415 | | — | | 415 | | — | | — | | 07/98 | | — |
Three Hickory, Dallas, TX | | — | | 1,161 | | — | | 48 | | 1,210 | | — | | 1,210 | | — | | — | | 11/06 | | — |
Travelers Land, Farmers Branch, TX | | 27,793 | | 24,511 | | — | | — | | 24,511 | | — | | 24,511 | | — | | — | | 11/06 | | — |
Travelers Land, Farmers Branch, TX | | 3,169 | | 2,116 | | — | | — | | 2,116 | | — | | 2,116 | | — | | — | | 07/98 | | — |
Travis Ranch Land, Kaufman County, TX | | 821 | | 1,030 | | — | | — | | 1,030 | | — | | 1,030 | | — | | — | | 08/08 | | — |
Travis Ranch Retail, Kaufman City, TX | | — | | 1,750 | | — | | — | | 1,750 | | — | | 1,750 | | — | | — | | 07/98 | | — |
Union Pacific Railroad Land, Dallas, TX | | — | | 130 | | — | | — | | 130 | | — | | 130 | | — | | — | | 03/04 | | — |
Valley Ranch Land, Irving, TX | | 1,984 | | 5,826 | | — | | — | | 5,826 | | — | | 5,826 | | — | | — | | 12/04 | | — |
Valley View (Hutton/Senlac), Farmers Branch, TX | | 156 | | 544 | | — | | — | | 544 | | — | | 544 | | — | | — | | 05/06 | | — |
Valley View 34 (Mercer Crossing), Farmers Branch, TX | | 461 | | 496 | | — | | — | | 496 | | — | | 496 | | — | | — | | 08/08 | | — |
Valley View/Senlac, Farmers Branch, TX | | 610 | | 780 | | — | | — | | 780 | | — | | 780 | | — | | — | | 12/05 | | — |
W Hotel, Dallas, TX | | 1,225 | | 1,681 | | — | | 411 | | 2,092 | | — | | 2,092 | | — | | — | | 11/08 | | — |
Waco 151 Land, Waco, TX | | 1,300 | | 2,106 | | — | | — | | 2,106 | | — | | 2,106 | | — | | — | | 04/07 | | — |
Waco Swanson, Waco, TX | | 1,735 | | 2,805 | | — | | — | | 2,805 | | — | | 2,805 | | — | | — | | 08/06 | | — |
Walker Land, Farmers Branch, TX | | 8,429 | | 18,675 | | — | | — | | 18,675 | | — | | 18,675 | | — | | — | | 09/06 | | — |
Whorton Land, Bentonville, AR | | 2,950 | | 4,291 | | — | | 6 | | 4,297 | | — | | 4,297 | | — | | — | | 06/05 | | — |
Willowick Land, Pensacola, FL | | — | | 137 | | — | | — | | 137 | | — | | 137 | | — | | — | | 01/95 | | — |
SCHEDULE III
(Continued)
TRANSCONTINENTAL REALTY INVESTORS, INC.
REAL ESTATE AND ACCUMULATED DEPRECIATION
December 31, 2009
| | | | | | | | | | | | | | | | | | | | | | | | | | | | | | | | | |
Property/Location | | Encumbrances | | Initial Cost | | Cost Capitalized
Subsequent to
Acquisition | | Gross Amounts of Which
Carried at End of Year | | | Accumulated
Depreciation | | Date of
Construction | | Date
Acquired | | Life on Which
Depreciation
In Latest
Statement
of Operation
is Computed |
| | | Land | | | Building &
Improvements | | Improvements | | Land | | | Building &
Improvements | | Total | | | | | |
| | | (dollars in thousands) |
Wilmer 88, Dallas, TX | | | 1,474 | | | 673 | | | | — | | | — | | | 673 | | | | — | | | 673 | | | | — | | — | | 08/05 | | — |
Windmill Farms—Harlan Land, Kaufman County, TX | | | 5,524 | | | 5,524 | | | | — | | | — | | | 5,524 | | | | — | | | 5,524 | | | | — | | — | | 07/08 | | — |
Woodmont Reserve | | | — | | | (40,718 | ) | | | — | | | 5,224 | | | (35,494 | ) | | | — | | | (35,494 | ) | | | — | | — | | — | | — |
| | | | | | | | | | | | | | | | | | | | | | | | | | | | | | | | | |
| | $ | 260,555 | | $ | 338,171 | | | $ | — | | $ | 57,194 | | $ | 395,365 | | | $ | — | | $ | 395,365 | | | $ | — | | | | | | |
Corporate Departments/Investments/Misc. | | | | | | | | | | | | | | | | | | | | | | | | | | | | | | | | | |
TCI—Corporate | | $ | 11,364 | | $ | — | | | $ | — | | $ | — | | $ | — | | | $ | — | | $ | — | | | $ | — | | — | | — | | — |
| | | | | | | | | | | | | | | | | | | | | | | | | | | | | | | | | |
| | $ | 11,364 | | $ | — | | | $ | — | | $ | — | | $ | — | | | $ | — | | $ | — | | | $ | — | | | | | | |
Properties Held for Sale Apartments | | | | | | | | | | | | | | | | | | | | | | | | | | | | | | | | | |
Baywalk, Galveston, TX | | $ | 4,970 | | $ | 679 | | | $ | 5,720 | | $ | — | | $ | 679 | | | $ | 5,720 | | $ | 6,399 | | | $ | 1,252 | | 1979 | | 09/01 | | 5-40 years |
| | | | | | | | | | | | | | | | | | | | | | | | | | | | | | | | | |
| | $ | 4,970 | | $ | 679 | | | $ | 5,720 | | $ | — | | $ | 679 | | | $ | 5,720 | | $ | 6,399 | | | $ | 1,252 | | | | | | |
Properties Subject to Sales Contract Apartments | | | | | | | | | | | | | | | | | | | | | | | | | | | | | | | | | |
Limestone Canyon, Austin, TX | | $ | 14,093 | | $ | 1,997 | | | $ | 14,142 | | $ | — | | $ | 1,997 | | | $ | 14,142 | | $ | 16,140 | | | $ | 4,738 | | 1997 | | 07/98 | | 40 years |
Limestone Ranch, Lewisville, TX | | | 13,108 | | | 1,620 | | | | 12,173 | | | 885 | | | 1,620 | | | | 13,058 | | | 14,678 | | | | 3,000 | | 2001 | | 05/01 | | 40 years |
Sendero Ridge, San Antonio, TX | | | 23,580 | | | 2,635 | | | | 24,157 | | | 1,477 | | | 2,635 | | | | 25,634 | | | 28,269 | | | | 3,864 | | 2001 | | 11/01 | | 40 years |
Tivoli, Dallas, TX | | | 10,758 | | | 1,355 | | | | 12,120 | | | 473 | | | 1,355 | | | | 12,592 | | | 13,947 | | | | 2,383 | | 2001 | | 12/01 | | 40 years |
| | | | | | | | | | | | | | | | | | | | | | | | | | | | | | | | | |
| | $ | 61,540 | | $ | 7,607 | | | $ | 62,592 | | $ | 2,834 | | $ | 7,607 | | | $ | 65,426 | | $ | 73,033 | | | $ | 13,985 | | | | | | |
| | | | | | | | | | | | | | | | | | | | | | | | | | | | | | | | | |
TOTAL: Real Estate Held For Investment | | $ | 1,183,222 | | $ | 448,477 | | | $ | 1,015,414 | | $ | 135,584 | | $ | 509,047 | | | $ | 1,090,428 | | $ | 1,599,475 | | | $ | 152,291 | | | | | | |
| | | | | | | | | | | | | | | | | | | | | | | | | | | | | | | | | |
SCHEDULE III
(Continued)
TRANSCONTINENTAL REALTY INVESTORS, INC.
REAL ESTATE AND ACCUMULATED DEPRECIATION
December 31, 2009
| | | | | | | | | | | | |
| | | 2009 | | | 2008 | | | 2007 | |
| | | (dollars in thousands) | |
Reconciliation of real estate | | | | | | | | | | | | |
Balance at January 1, | | $ | 1,607,423 | | | $ | 1,492,105 | | | $ | 1,222,997 | |
Additions | | | | | | | | | | | | |
Acquisitions, improvements and construction | | | 93,991 | | | | 266,341 | | | | 325,676 | |
Deductions | | | | | | | | | | | | |
Sale of real estate | | | (59,025 | ) | | | (151,379 | ) | | | (52,882 | ) |
Asset impairments | | | (42,914 | ) | | | — | | | | (3,686 | ) |
| | | | | | | | | | | | |
Balance at December 31, | | $ | 1,599,475 | | | $ | 1,607,067 | | | $ | 1,492,105 | |
| | | | | | | | | | | | |
Reconciliation of accumulated depreciation | | | | | | | | | | | | |
Balance at January 1, | | $ | 126,632 | | | $ | 127,679 | | | $ | 109,581 | |
Additions | | | | | | | | | | | | |
Depreciation | | | 31,604 | | | | 24,582 | | | | 48,409 | |
Deductions | | | | | | | | | | | | |
Sale of real estate | | | (5,945 | ) | | | (25,985 | ) | | | (30,311 | ) |
| | | | | | | | | | | | |
Balance at December 31, | | $ | 152,291 | | | $ | 126,276 | | | $ | 127,679 | |
| | | | | | | | | | | | |
SCHEDULE IV
TRANSCONTINENTAL REALTY INVESTORS, INC.
MORTGAGE LOANS ON REAL ESTATE
December 31, 2009
| | | | | | | | | | | | | | | | |
Description | | Interest
Rate | | | Final
Maturity
Date | | Periodic Payment Terms | | Prior
Liens | | Face
Amount
of
Mortgate | | | Carrying
Amount
of
Mortgage | | Principal
Amounts
of Loans
Subject To
Delinquent
Principal
or Interest |
| | | | | | | | | | (dollars in thousands) |
JUNIOR MORTGAGE LOANS | | | | | | | | | | | | | | | | |
Dallas Fund XVII Secured by an assignment of partnership interests and litigation proceeds. | | 9.00 | % | | 10/09 | | Principle and Interest due at maturity. | | — | | 4,303
|
| | 1,116 | | — |
Housing for Seniors of Humble, LLC Unsecured | | 11.50 | % | | 12/13 | | Excess cash flow | | 16,223 | | 2,000 | | | 2,000 | | — |
Housing for Seniors of Humble, LLC Interest in Unified Housing Foundation Inc. | | 11.50 | % | | 12/13 | | Excess cash flow | | 16,223 | | 6,363 | | | 6,363 | | — |
Pioneer Development Secured by 33.33 acres of unimproved land in Travis County, TX. | | 18.00 | % | | 10/08 | | Interest only payments start in November 2007. | | 12,000 | | 2,386
|
| | 2,407 | | — |
UHF, Inc. (Marquis at Vista Ridge) 100% Interest in UH of Lewisville LLC | | 12.00 | % | | 12/13 | | Excess cash flow | | 14,961 | | 1,770 | | | 2,735 | | — |
UHF, Inc. (Echo Station) 100% Interest in UH of Temple LLC | | 12.00 | % | | 12/13 | | Excess cash flow | | 9,928 | | 1,054 | | | 1,668 | | — |
UHF, Inc. (Cliffs of El Dorado) 100% Interest in UH of McKinney LLC | | 10.00 | % | | 9/10 | | Excess cash flow | | 9,607 | | 2,990 | | | 2,990 | | — |
UHF, Inc. (Timbers of Terrell) 100% Interest in UH of Terrell LLC | | 12.00 | % | | 12/13 | | Excess cash flow | | 7,201 | | 837 | | | 1,323 | | — |
UHF, Inc. (Tivoli) 100% Interest in UH of Tivoli LLC | | 12.00 | % | | 12/13 | | Excess cash flow | | 10,759 | | 1,615 | | | 1,826 | | — |
UHF, Inc. (Parkside Crossing) 100% Interest in UH of Parkside Crossing LLC | | 12.00 | % | | 12/13 | | Excess cash flow | | 11,525 | | 1,223 | | | 1,936 | | — |
SCHEDULE IV
(Continued)
TRANSCONTINENTAL REALTY INVESTORS, INC.
MORTGAGE LOANS ON REAL ESTATE
December 31, 2009
| | | | | | | | | | | | | | | | | | | | |
Description | | Interest
Rate | | | Final
Maturity
Date | | Periodic Payment Terms | | Prior
Liens | | Face
Amount
of
Mortgate | | | Carrying
Amount
of
Mortgage | | | Principal
Amounts
of Loans
Subject To
Delinquent
Principal
or Interest |
| | | | | | | | | | (dollars in thousands) |
UHF, Inc. (Sendero Ridge) 100% Interest in UH of Sendero Ridge LLC | | 12.00 | % | | 12/13 | | Excess cash flow | | 23,581 | | | 2,942 | | | | 5,227 | | | | — |
UHF, Inc. (Limestone Ranch) 100% Interest in UH of Vista Ridge LLC | | 12.00 | % | | 12/13 | | Excess cash flow | | 13,108 | | | 2,320 | | | | 2,250 | | | | — |
UHF, Inc. (Limestone Canyon) 100% Interest in UH of Austin LLC | | 12.00 | % | | 12/13 | | Excess cash flow | | 14,093 | | | 3,080 | | | | 3,080 | | | | — |
OTHER | | | | | | | | | | | | | | | | | | | | |
Basic Capital Management Unsecured. | | 7.00 | % | | 10/11 | | Monthly interest payments. | | — | | | 1,252 | | | | 1,252 | | | | — |
Basic Capital Management Unsecured. | | 7.00 | % | | 10/11 | | Monthly interest payments. | | — | | | 1,523 | | | | 1,523 | | | | — |
Garden Centura, L.P. Unsecured. | | 7.00 | % | | None | | Excess property cash flow payments or property sales proceeds. | | — | | | — | | | | 2,210 | | | | — |
Miscellaneous related party notes | | various | | | various | | | | — | | | 1,233 | | | | 1,233 | | | | — |
Miscellaneous non-related party notes | | various | | | various | | | | — | | | 884 | | | | 454 | | | | — |
Ocean Beach Partners Secured by 36 acres in Farmers Branch, TX. | | 7.00 | % | | 12/09 | | — | | — | | | 3,279 | | | | 3,279 | | | | — |
3334Z APTS, LP Secured by 3334Z Apartments | | 6.50 | % | | 4/12 | | | | — | | | 1,875 | | | | 1,875 | | | | — |
| | | | | | | | | | | | | | | | | | | | |
| | | | | | | | | | | $ | 42,929 | | | $ | 46,747 | | | $ | — |
| | | | | | | | | | | | | | | | | | | | |
| | | | | | | Accrued interest | | | | 1,304 | | | | |
| | | | | | | Allowance for estimated losses | | | | (2,804 | ) | | | |
| | | | | | | | | | | | | | | | | | | | |
| | | | | | | | | | | | | | | $ | 45,247 | | | | |
| | | | | | | | | | | | | | | | | | | | |
SCHEDULE IV
(Continued)
TRANSCONTINENTAL REALTY INVESTORS, INC.
MORTGAGE LOANS ON REAL ESTATE
December 31, 2009
| | | | | | | | | | | | |
| | | 2009 | | | 2008 | | | 2007 | |
Balance at January 1 | | $ | 42,413 | | | $ | 34,677 | | | $ | 39,566 | |
Additions | | | | | | | | | | | | |
New mortgages | | | 32,096 | | | | 9,145 | | | | 8,554 | |
Funding of existing loans | | | 7,753 | | | | — | | | | — | |
Conversion of accrued interest to principal | | | 900 | | | | — | | | | — | |
Increase of interest receivable on mortgage loans | | | 2,240 | | | | 2,866 | | | | — | |
Deductions | | | | | | | | | | | | |
Amounts paid | | | (37,328 | ) | | | (4,275 | ) | | | (13,443 | ) |
Non-cash reduction | | | (23 | ) | | | — | | | | — | |
Cost of mortgages sold | | | — | | | | — | | | | — | |
| | | | | | | | | | | | |
Balance at December 31 | | $ | 48,051 | | | $ | 42,413 | | | $ | 34,677 | |
| | | | | | | | | | | | |
ITEM 9. CHANGES | IN AND DISAGREEMENTS WITH ACCOUNTANTS ON ACCOUNTING AND FINANCIAL DISCLOSURE |
None.
ITEM 9A(T). CONTROLS AND PROCEDURES
Evaluation of Disclosure Controls and Procedures
Under the supervision and with the participation of our management, including our Principal Executive Officer and Chief Financial Officer, we conducted an evaluation of the effectiveness of our disclosure controls and procedures (as defined in Rule 13a-15(e)) of the Securities Exchange Act of 1934, as amended (the “Exchange Act”), which are designed to ensure that information required to be disclosed by us in the reports that we file or submit under the Exchange Act is recorded, processed, summarized and reported within the time periods specified by the SEC’s rules and forms. Disclosure controls and procedures include, without limitation, controls and procedures designed to ensure that information required to be disclosed by us in the reports that we file or submit under the Exchange Act is accumulated and communicated to our management, including our Principal Executive Officer and Chief Financial Officer, as appropriate to allow timely decisions regarding required disclosure. Based on this evaluation, our Principal Executive Officer and Chief Financial Officer concluded that our disclosure controls and procedures were effective as of the end of the period covered by this report.
Management’s Report on Internal Control over Financial Reporting
Our management is responsible for establishing and maintaining adequate internal control over financial reporting for the Company. Our internal control over financial reporting is designed to provide reasonable assurance regarding the reliability of financial reporting and the preparation of financial statements in accordance with generally accepted accounting principles. There are inherent limitations to the effectiveness of any system of internal control over financial reporting. These limitations include the possibility of human error, the circumvention of overriding of the system and reasonable resource constraints. Because of its inherent limitations, our internal control over financial reporting may not prevent or detect misstatements. Projections of any evaluation of effectiveness to future periods are subject to the risk that controls may become inadequate because of changes in conditions or that the degree of compliance with policies or procedures may deteriorate.
Management assessed the effectiveness of the Company’s internal control over financial reporting as of December 31, 2009.2012. In making this assessment, management used the criteria set forth inInternal Control—Integrated Framework issued by the Committee of Sponsoring Organizations of the Treadway Commission (COSO). Based on management’s assessments and those criteria, management has concluded that Company’s internal control over financial reporting was effective as of December 31,
2009.2012. This annual report does not include an attestation report of the Company’s registered public accounting firm regarding internal control over financial report. Management’s report was not subject to attestation by the Company’s registered public accounting firm pursuant to temporary rules of the Securities and Exchange Commission that permit the Company to provide only management’s report in this annual report.
Changes in Internal Control over Financial Reporting
In preparation for management’s report on internal control over financial reporting, we documented and tested the design and operating effectiveness of our internal control over financial reporting. There were no changes in our internal controls over financial reporting (as such term is defined in Exchange Act Rule 13a-15(f)) that occurred during the quarter ended December 31,
20092012 that have materially affected, or are reasonably likely to materially affect, our internal control over financial reporting.
Item 9B. OTHER | INFORMATION |
Item 9B. OTHER INFORMATION
PART III
ITEM 10. DIRECTORS, EXECUTIVE OFFICERS AND CORPORATE GOVERNANCEITEM 10. DIRECTORS, | EXECUTIVE OFFICERS AND CORPORATE GOVERNANCE |
The affairs of TCI are managed by a Board of Directors. The Directors are elected at the annual meeting of stockholders or appointed by the incumbent Board and serve until the next annual meeting of stockholders or until a successor has been elected or approved.
It is the Board’s objective that a majority of the Board consists of independent directors. For a director to be considered independent, the Board must determine that the director does not have any direct or indirect material relationship with TCI. The Board has established guidelines to assist it in determining director independence which conform to, or are more exacting than, the independence requirements in the New York Stock Exchange listing rules. The independence guidelines are set forth in TCI’s “Corporate Governance Guidelines”. The text of this document has been posted on TCI’s internet website athttp://www.transconrealty-invest.com and is available in print to any shareholder who requests it. In addition to applying these guidelines, the Board will consider all relevant facts and circumstances in making an
independentindependence determination.
TCI has adopted a code of conduct that applies to all Directors, officers and employees, including our principal executive officer, principal financial officer and principal accounting officer. Stockholders may find our code of conduct on our website by going to our website address athttp://www.transconrealty-invest.com. We will post any amendments to the code of conduct, as well as any waivers that are required to be disclosed by the rules of the SEC or the New York Stock Exchange on our website.
Our Board of Directors has adopted charters for our Audit, Compensation and Governance and Nominating Committees of the Board of Directors. Stockholders may find these documents on our website by going to the website address athttp://www.transconrealty-invest.com. You may also obtain a printed copy of the materials referred to by contacting us at the following address:
Transcontinental Realty Investors, Inc.
Attn: Investor Relations
1800 Valley View Lane,
1603 LBJ Freeway, Suite
300800
All members of the Audit Committee and Nominating and Corporate Governance Committees must be independent directors. Members of the Audit Committee must also satisfy additional independence requirements, which provide (i) that they may not accept, directly or indirectly, any consulting, advisory, or compensatory fee from TCI or any of its subsidiaries other than their director’s compensation (other than in their capacity as a member of the Audit Committee, the Board of Directors, or any other committee of the Board), and (ii) no member of the Audit Committee may be an “affiliated person” of TCI or any of its subsidiaries, as defined by the Securities and Exchange Commission.
The current directors of TCI are listed below, together with their ages, terms of service, all positions and offices with TCI,
or its
former advisor Prime,
or current advisor Pillar, which took over as contractual advisor for
Basic Capital Management Inc. (“BCM”)Prime on
July 1, 2003,April 30, 2011, their principal occupations, business experience and directorships with other companies during the last five years or more. The designation
“Affiliated”“affiliated”, when used below with respect to a director, means that the director is an officer, director or employee of
Prime orPillar, an officer of
TCIthe Company, or an officer or director of
an affiliatea related party of
TCI.the Company. The designation
“Independent”“independent”, when used below with respect to a
director,Director, means that the
directorDirector is neither an officer of
TCIthe Company nor a director, officer or employee of
Prime,Pillar (but may be a director of the Company, although
TCIthe Company may have certain business or professional relationships with such
directorDirector as discussed in Item 13. Certain Relationships and Related Transactions, and Director Independence.
HENRY BUTLER: Age
59,62, Director (Affiliated) (since December 2001) and Chairman of the Board
since(since May
18, 20092009)Broker—
Mr. Butler is Vice President Land Sales for Pillar Income Asset Management, LLC (“Pillar”) since April 30, 2011, and its predecessor, Prime (since July 2003) for Prime and 1992 to June 2003 for BCM; Owner/Operator. Mr. Butler was owner/operator (1989 to 1991) of Butler Interests, Inc.; Mr. Butler is Chairman of the Board (since May 28, 2009) and a Director (since December 2001) of the Company. He is also Chairman of the Board (since May 28, 2009) and a Director (since July 2003) of ARL;ARL and Chairman of the Board (since May 2011) and a Director (December 2001 to July 2003) of IOT.SHARON HUNT: Age 67, Director (Independent)and again (since February 2004).
Licensed Realtor in Dallas, Texas with Virginia Cook Realtors; President and Owner2011) of Sharon’s Pretzels, Inc. (until sold in 1997); Director (since 1991) of a 501(c)(3) non-profit corporation involved in the acquisition, renovation and operation of real estate; and Director (since February 2004) of ARL.
IOT.
ROBERT A. JAKUSZEWSKI: Age
47,50, Director (Independent) (since November 2005)
Mr. Jakuszewski is currently the Senior Medical Liaison for Vein Clinics of America. Mr. Jakuszewski was Vice President
of Sales and Marketing
(since September 1998)(September 1998 to December 2012) of New
HorizonsHorizon Communications, Inc.
Mr. Jakuszewski was a Consultant (January 1998
–to September 1998) for New Horizon Communications, Inc.; Regional Sales Manager (1996-1998) of Continental Funding; Territory Manager (1992-1996) of Sigvaris, Inc.; Senior Sales Representative
(1988-1992)(1998-1992) of Mead Johnson Nutritional Division, USPNG;
and Sales Representative (1986-1987) of Muro Pharmaceutical, Inc. Mr. Jakuszewski has been a
directorDirector of
IOTthe Company since
his election on March 16,
2004 and2004. He is also a director of ARL
since(since November 22,
2005.2005) and a Director of IOT (since March 16, 2004).
SHARON HUNT: Age 70, Director (Independent) (since October 2011).
Ms. Hunt is a Licensed Realtor in Arkansas with Keystone Realty. She was President and Owner of Sharon’s Pretzels, Inc. (until sold in 1997), a Dallas, Texas food products entity; Director (1991 to 2000) of a 501(c)(3) non-profit corporation involved in the acquisition, renovation and operation of real estate. Ms. Hunt was a Director of the Company from February 20, 2004 to January 31, 2011, and was re-elected as a Director Company on October 25, 2011. She was a Director (February 20, 2004 to January 31, 2011) and again (since October 25, 2011) of ARL and elected as a Director of IOT on October 25, 2011.
TED R. MUNSELLE: Age 54,57, Director (Independent) (since February 2004). Mr. Munselle is Vice President and Chief Financial Officer (since October 1998) of Landmark Nurseries, Inc.
; On February 17, 2012, he
was appointed as a member of the Board of Directors for Spindletop Oil & Gas Company and as Chairman of their Audit Committee. Spindletop’s stock is traded on the Over-the-Counter (OTC) market. He was President (December 2004 to August 2007) of Applied Educational Opportunities LLC, an educational organization which had career training schools located in the cities of Richardson and Tyler, Texas. He is a certified public accountant (since 1980) who was employed as an Audit Partner in two Dallas, Texas based CPA firms (1986 to 1998), as an Audit Manager at Grant Thornton, LLP (1983 to 1986) and as Audit Staff to Audit Supervisor at Laventhol & Horwath (1977 to 1983). Mr. Munselle
haswas elected as a director of the Company on February 20, 2004. He was also
beenelected as a
directorDirector of ARL (since February 20, 2004)
and a Director of
ARL, a Nevada corporation which has its common stock listed and traded on the New York Stock Exchange (“NYSE”), as well as a directorIOT (since May
21, 2009)
of IOT, a Nevada corporation which has its common stock listed and traded on the American Stock Exchange (the “AMEX”). Mr. Munselle is qualified as an Audit Committee financial expert within the meaning of SEC regulations and the Board of Directors of TCI has determined that he has accounting and related financial management expertise within the meaning of the listing standards of the NYSE.
The Board of Directors held
9five meetings during
2009.2012. For such year, no incumbent director attended fewer than
100%94% of the aggregate of (1) the total number of meetings held by the Board during the period for which he or she had been a director and (2) the total number of meetings held by all committees of the Board on which he or she served during the period that he served.
Under TCI’s Corporate Governance Guidelines, each Director is expected to dedicate sufficient time, energy and attention to ensure the diligent performance of his or her duties, including by attending meetings of the stockholders of the Company, the Board and Committees of which he is a member.
The Board of Directors has standing Audit, Compensation and Governance and Nominating Committees.
Audit Committee. The current Audit Committee was formed on February 19, 2004, and its function is to review TCI’s operating and accounting procedures. A
Chartercharter of the Audit Committee has also been adopted by the Board. The charter of the Audit Committee was adopted on February 19, 2004, and is available on the Company’s Investor Relations website
(www.transconrealty-invest.com). The Audit Committee is an “audit committee” for purposes of Section 3(a)(58) of the Securities Exchange Act of 1934. The current members of the Audit Committee, all of whom are independent within the meaning of the SEC Regulations, the listing standards of the New York Stock Exchange, Inc. and TCI’s Corporate Governance Guidelines, are Messrs. Jakuszewski and Munselle (Chairman) and Ms. Hunt. Mr. Ted R. Munselle, a member of the Committee, is qualified as an Audit Committee financial expert within the meaning of SEC Regulations, and the Board has determined that he
has accounting and related financial management expertise within the meaning of the listing standards of the New York Stock Exchange, Inc. All of the members of the Audit Committee meet the experience requirements of the listing standards of the New York Stock Exchange. The Audit Committee met eightfive times during 2009.
2012.
Governance and Nominating Committee. The Governance and Nominating Committee is responsible for developing and implementing policies and practices relating to corporate governance, including reviewing and monitoring implementation of TCI’s Corporate Governance Guidelines. In addition, the Committee develops and reviews background information on candidates for the Board and makes recommendations to the Board regarding such candidates. The Committee also prepares and supervises the Board’s annual review of director independence and the Board’s performance self-evaluation. The Charter of the Governance and Nominating Committee was adopted on March 22, 2004 and is available on the Company’s Investor Relations website (
www.transconrealty-invest.com). The current members of the Committee are Messrs. Munselle
and Jakuszewski (Chairman) and Ms. Hunt. The Governance and Nominating Committee met once during
2009.2012. Compensation Committee. The Compensation Committee is responsible for overseeing the policies of the Company relating to compensation to be paid by the Company to the Company’s principal executive officer and any other officers designated by the Board and make recommendations to the Board with respect to such policies, produce necessary reports and executive compensation for inclusion in the Company’s Proxy Statement in accordance with applicable rules and regulations and to monitor the development and implementation of succession plans for the principal executive officers and other key executives and make recommendations to the Board with respect to such plans. The charter of the Compensation Committee was adopted on March 22, 2004, and is available on the Company’s Investor Relations website (
www.transconrealty-invest.com). The current members of the Compensation Committee are Ms. Hunt (Chairman) and Messrs. Jakuszewski and Munselle. All of the members of the Compensation Committee are independent within the meaning of the listing standards of the NYSE and the Company’s Corporate Governance Guidelines. The Compensation Committee is to be comprised of at least two directors who are independent of Management and the Company. The Compensation Committee met once during
2009.2012. The members of the Board of Directors on the date of this Report and the Committees of the Board on which they serve are identified below:
| | | | | | |
| | Audit Committee
| | Governance and
Nominating Committee | | Compensation Committee |
Henry A. Butler
| | | | | | |
Sharon Hunt
| | ü | | ü | | Chair |
Robert A. Jakuszewski
| | ü | | Chair | | ü |
Ted R. Munselle
| | Chair | | ü | | ü |
[Missing Graphic Reference]
In March 2004, the Board created a new position of presiding director, whose primary responsibility is to preside over periodic executive sessions of the Board in which Management directors and other members of Management do not participate. The presiding director also advises the Chairman of the Board and, as appropriate, Committee Chairs with respect to agendas and information needs relating to Board and Committee meetings, provides advice with respect to the selection of Committee Chairs and performs other duties that the Board may from time to time delegate to assist the Board in fulfillment of its responsibilities.
In
December 2009,May 2012, the non-management members of the Board designated Ted R. Munselle as presiding director to serve in this position until the Company’s annual meeting of stockholders to be held following the fiscal year ended December 31,
2009.2012.
Determination of Director’s Independence
In February 2004, the Board adopted its Corporate Governance Guidelines. The Guidelines adopted by the Board meet or exceed the new listing standards adopted during that year by the New York Stock Exchange. The full text of the Guidelines can be found on the Company’s Investor Relations website (www.transcontrealty-invest.com).
Pursuant to the Guidelines, the Board undertook its annual review of director independence
onin March
20082012 and during this review, the Board considered transactions and relationships between each director or any member of his or her immediate family and TCI and its subsidiaries and
affiliates,related parties, including those reported under Certain Relationships and Related Transactions below. The Board also examined transactions and relationship between directors or their
affiliatesrelated parties and members of TCI’s senior management or their
affiliates.related parties. As provided in the Guidelines, the purpose of such review was to determine whether such relationships or transactions were inconsistent with the determination that the director is independent.
As a result of this review, the Board affirmatively determined of the then directors, Messrs. Munselle and Jakuszewski and Ms. Hunt are each independent of the Company and its Management under the standards set forth in the Corporate Governance Guidelines.
Executive officers of the Company are listed below, all of whom are employed by
Prime.Pillar. Mr. Bertcher is employed by New Concept Energy, Inc (“NCE”). None of the executive officers receive any direct remuneration from the Company nor do any hold any options granted by the Company. Their positions with the Company are not subject to a vote of stockholders. In addition to the following executive officers, the Company has several vice presidents and assistant secretaries who are not listed herein. The ages, terms of service and all positions and offices with the Company,
Pillar, Prime, other
affiliatedrelated entities, other principal occupations, business experience and directorships with other publicly-held companies during the last five years or more are set forth below. No family relationships
existsexist among any of the executive officers or directors of the Company.
President (since April 2007) and Chief Executive Officer (effective March 2010) of ARL, TCI, IOT and (effective March 2007) of
Prime;Prime, and (effective April 30, 2011) of Pillar; Senior Vice President and Business Line Manager for U.S. Bancorp (NYSE:USB) working out of their offices in Houston, Texas from 2003 to April 2007: Executive Vice President and Chief Financial Officer, Fleetcor Technologies a privately held transaction processing company that was headquartered in New Orleans, Louisiana from 1998 to 2003; Senior Vice President and Chief Financial Officer, ICSA a privately held internet security and information company headquartered in Carlisle, Pennsylvania from 1996 to 1998; and for more than
tenfive years prior thereto was employed in various financial and operating roles for PhoneTel Technologies, Inc. which was a publicly traded telecommunication company on the American Stock Exchange headquartered in Cleveland, Ohio (1992-1996) and LDI Corporation which was a publicly traded computer equipment sales/service and asset leasing company listed on the NASDAQ and headquartered in Cleveland, Ohio.
Executive Vice President (since February 2008) and Chief Financial Officer (since Oct. 28, 2009) of the Company, ARL and IOT. Mr. Bertcher is also Chief Executive Officer (from December 2006 to present)
and, Chief Financial Officer (since
January 2003)November 1989) and a Director (from November 1989 to September 1996 and from June 1999 to present) of New Concept Energy, Inc. (“NCE”), a Nevada corporation which has its common stock listed on the AMEX. Mr. Bertcher has been employed by NCE since November 1989. He has been a Certified Public Accountant since 1973.
Mr. Bertcher is also a Director, Vice President and Treasurer (since March 24, 2009) of First Equity Properties, Inc., a Nevada corporation with securities registered under Section 12(g) of the Exchange Act.”Executive Vice President—General Counsel/Tax Counsel and Secretary (since February 2004), Executive Vice President—Tax (October 2001 to February 2004), Executive Vice President—Tax and Chief Financial Officer (June 2001 to October 2001) and Senior Vice President—Tax (December 2000 to June 2001) of the Company, ARL, IOT and BCM; Executive Vice President, General Counsel/Tax Counsel and Secretary (since February 2004), Executive Vice President—Tax (July 2003 to February 2004) of Prime,
(effective April 30, 2011) of Pillar and PIAMI; Private Attorney (January 2000 to December 2000); Vice President—Taxes and Assistant Treasurer (March 1998 to January 2000) of IMC Global, Inc.; Vice President—Taxes (July 1991 to February 1998) of Whitman Corporation.
“Mr.Mr. Corna
iswas also a Director and Vice President
(since June 1, 2004)(June 2004 to December 2010) and Secretary
(since January 14, 2005)(January 2005 to December 2010) of First Equity Properties, Inc., a Nevada corporation with securities registered under Section 12(g) of the Exchange Act.
”Executive Vice President—Residential
ConstructionDevelopment (since November 2006) of
Prime, (effective April 30, 2011) of Pillar, ARL, TCI and IOT; Managing Director of Development for Woodmont Investment Company GP, LLC of Dallas, Texas from November 2005 to November 2006; President of Sterling Builders, Inc. of Spring, Texas from October 2003 to November 2005; Vice president of Westchase Construction, Ltd. of Houston, Texas from August 2001 to September 2003. For more than five years prior thereto, Mr. Crozier was employed by various firms in the construction industry including Trammell Crow Residential (February 1995 through February 2000) and The Finger Companies (August 1991 through February 1995).
Mr. Crozier is a licensed architect.Although not an executive officer of the Company, Daeho Kim currently serves as Treasurer. His position with the Company is not subject to a vote of stockholders. His age, term of service and all positions and offices with the Company, other principal occupations, business experience and relationships with other entities during the last five years or more are set forth below.
Treasurer (since October 29, 2008) of ARL, TCI and IOT. For more than five years prior thereto, Mr. Kim
has beenwas employed by Prime
and (effective April 30, 2011) of Pillar in various financial capacities including cash manager and Assistant Director of Capital Markets.
AIMEE COLE, 33
Vice President, Corporate Controller (Since October 2011) of ARL, TCI and IOT. For five years prior thereto, Ms. Cole was employed by Pillar (effective April 30, 2011) or Prime (since May 2008) in various accounting capacities including Senior Controller and Accounting Manager. For more than seven years prior thereto, Ms. Cole was employed by Eenhoorn, LLC, a property management and investment company, in various accounting capacities, including Controller (January 2001 through February 2008).
TCI has adopted a code of ethics entitled “Code of Business Conduct and Ethics” that applies to all directors, officers, and employees (including those of the contractual Advisor to TCI). In addition, TCI has adopted a code of ethics entitled “Code of Ethics for Senior Financial Officers” that applies to the principal executive officer, president, principal financial officer, chief financial officer, principal accounting officer, and controller. The text of these documents has been posted on TCI’s internet website athttp://www.transconrealty-invest.com and are available in print to any stockholder who requests them.
Compliance with Section 16(a) of the Securities Exchange Act of 1934
Under the securities laws of the United States, the directors, executive officers, and any persons holding more than 10% of TCI’s shares of Common
Stockstock are required to report their share ownership and any changes in that ownership to the Securities and Exchange Commission (the “Commission”). Specific due dates for these reports have been established and TCI is required to report any failure to file by these dates. All of these filing requirements were satisfied by TCI’s directors, executive officers, and 10% holders during the fiscal year ending December 31,
2009.2012. In making these statements, TCI has relied on the written representations of its incumbent directors and executive officers and its 10% holders and copies of the reports they have filed with the Commission.
Pillar Income Asset Management, Inc. (“Pillar”) has been TCI’s Advisor and Cash Manager since April 30, 2011. Although the Board of Directors is directly responsible for managing the affairs of TCI, and for setting the policies which guide it,
TCI’sthe day-to-day operations
of TCI are performed by
PrimePillar, as the contractual advisor, under the supervision of the Board.
ThePillar’s duties
of Prime include,
among other things,but are not limited to, locating,
investigating, evaluating and recommending real estate and
mortgage notereal estate-related investment
opportunities and
sales opportunities as well asarranging debt and equity financing
for the Company with third party lenders and
refinancing sources. Prime alsoinvestors. Additionally, Pillar serves as a consultant to the Board
with regard to their decisions in connection with
theTCI’s business plan and investment
decisions madepolicy. Pillar also serves as an Advisor and Cash Manager to ARL and IOT. As the contractual advisor, Pillar is compensated by
TCI under an Advisory Agreement that is more fully described in Part III, Item 10. “Directors, Executive Officers and Corporate Governance – The Advisor”. TCI has no employees and as such, employees of Pillar render services to TCI in accordance with the
Board.Primeterms of the Advisory Agreement.
Pillar is a single member Nevada limited liability company,corporation, the sole membershareholder of which is PIAMI, which is owned 100% by Realty Advisors, LLC, a Nevada limited liability company, the sole member of which is Realty Advisors, Inc., Aa Nevada corporation, the sole shareholder of which is owned 100% byRealty Advisors Management, Inc., a TrustNevada corporation, the sole shareholder of which is a trust known as the May Trust. Until early 2009, SWI,
The May Trust is a Trust, the beneficiaries of which
is 100% owned byare the children of Gene E.
Phillips, owned 20% of PIAMI, which SWI exchanged to Realty Advisors, Inc. for certain securities issued by SWI. For the period December 31, 2009, Gene E. Phillips and SWI are each a “related party” for financial statement purposes because of the prior ownership arrangement of PIAMI.Phillips. Gene E. Phillips is not an officer, manager or
directorDirector of
Pillar, Prime, PIAMI, Realty Advisors, LLC, Realty Advisors, Inc.
, Realty Advisors Management, Inc. or
TCI,ARL, nor is he a Trustee of the May Trust.
Prime is a company of which Messrs. Moos, Bertcher, Corna, and Crozier, serve as executive officers. Under the Advisory Agreement,
PrimePillar is required to annually formulate and submit, for Board approval, a budget and business plan containing a twelve-month forecast of operations and cash flow, a general plan for asset sales and purchases, lending, foreclosure and borrowing activity, and other investments, and
PrimePillar is required to report quarterly to the Board on TCI’s performance against the business plan. In addition, all transactions require prior Board approval, unless they are explicitly provided for in the approved business plan or are made pursuant to authority expressly delegated to
PrimePillar by the Board.
The Advisory Agreement also requires prior Board approval for the retention of all consultants and third party professionals, other than legal counsel. The Advisory Agreement provides that
PrimePillar shall be deemed to be in a fiduciary relationship to the TCI stockholders; contains a broad standard governing
Prime’sPillar’s liability for losses incurred by TCI; and contains guidelines for
Prime’sPillar’s allocation of investment opportunities as among itself, TCI and other entities it advises.
Pillar is a company of which Messrs. Moos, Bertcher, Corna, and Crozier serve as executive officers.
The Advisory Agreement provides for PrimePillar to be responsible for the day-to-day operations of TCI and to receive, anas compensation for basic management and advisory fee comprised ofservices, a gross asset fee of .0625%0.0625% per month (.75%(0.75% per annum) of the average of the gross asset value (total assets less allowance for amortization, depreciation or depletion and valuation reserves) and an annual net income fee equal.
In addition to
7.5%base compensation, Pillar receives the following forms of
TCI’s net income, after certain adjustments.additional compensation:
| (1) | an annual net income fee equal to 7.5% of TCI’s net income as an incentive for successful investment and management of the Company’s assets; |
| (2) | an annual incentive sales fee to encourage periodic sales of appreciated real property at optimum value equal to 10.0% of the amount, if any, by which the aggregate sales consideration for all real estate sold by TCI during such fiscal year exceeds the sum of: |
| (a) | the cost of each such property as originally recorded in TCI’s books for tax purposes (without deduction for depreciation, amortization or reserve for losses); |
| (b) | capital improvements made to such assets during the period owned; and |
| (c) | all closing costs (including real estate commissions) incurred in the sale of such real estate; provided however, no incentive fee shall be paid unless (a) such real estate sold in such fiscal year, in the aggregate, has produced an 8.0% simple annual return on the net investment including capital improvements, calculated over the holding period before depreciation and inclusive of operating income and sales consideration, and (b) the aggregate net operating income from all real estate owned for each of the prior and current fiscal years shall be at least 5.0% higher in the current fiscal year than in the prior fiscal year; |
| (3) | an acquisition commission, from an unaffiliated party of any existing mortgage or loan, for supervising the acquisition, purchase or long-term lease of real estate equal to the lesser of: |
| (a) | up to 1.0% of the cost of acquisition, inclusive of commissions, if any, paid to non-affiliated brokers; or |
| (b) | the compensation customarily charged in arm’s-length transactions by others rendering similar property acquisition services as an ongoing public activity in the same geographical location and for comparable property, provided that the aggregate purchase price of each property (including acquisition fees and real estate brokerage commissions) may not exceed such property’s appraised value at acquisition; |
| (4) | a construction fee equal to 6.0% of the so-called “hard costs” only of any costs of construction on a completed basis, based upon amounts set forth as approved on any architect’s certificate issued in connection with such construction, which fee is payable at such time as the applicable architect certifies other costs for payment to third parties. The phrase “hard costs” means all actual costs of construction paid to contractors, subcontractors and third parties for materials or labor performed as part of the construction but does not include items generally regarded as “soft costs,” which are consulting fees, attorneys’ fees, architectural fees, permit fees and fees of other professionals; and |
| (5) | reimbursement of certain expenses incurred by the advisor in the performance of advisory services. |
The Advisory Agreement also provides
for Prime tothat Pillar receive
an annual incentive sales fee equal to 10.0%the following forms of
the amount, if any, by which the aggregate sales consideration for all real estate sold by TCI during such fiscal year exceeds the sum of: (1) the cost of each such property as originally recorded in TCI’s books for tax purposes (without deduction for depreciation, amortization or reserve for losses), (2) capital improvements made to such assets during the period owned, and (3) all closing costs, (including real estate commissions) incurred in the sale of such real estate; provided, however, no incentive fee shall be paid unless (a) such real estate sold in such fiscal year, in the aggregate, has produced an 8.0% simple annual return on the net investment including capital improvements, calculated over the holding period before depreciation and inclusive of operating income and sales consideration and (b) the aggregate net operating income from all real estate owned for each of the prior and current fiscal years shall be at least 5.0% higher in the current fiscal year than in the prior fiscal year.Additionally, pursuantcompensation:
| (1) | a mortgage or loan acquisition fee with respect to the acquisition or purchase from an unaffiliated party of any existing mortgage loan by TCI equal to the lesser of: |
| (a) | 1.0% of the amount of the mortgage or loan purchased; or |
| (b) | a brokerage or commitment fee which is reasonable and fair under the circumstances. Such fee will not be paid in connection with the origination or funding of any mortgage loan by TCI; and |
| (2) | a mortgage brokerage and equity refinancing fee for obtaining loans or refinancing on properties equal to the lesser of: |
| (a) | 1.0% of the amount of the loan or the amount refinanced; or |
| (b) | a brokerage or refinancing fee which is reasonable and fair under the circumstances; provided, however, that no such fee shall be paid on loans from Pillar, or a related party of Pillar, without the approval of TCI’s Board of Directors. No fee shall be paid on loan extensions. |
Under the Advisory Agreement,
Primeall or
an affiliate of Prime is to receive an acquisition commission for supervising the acquisition, purchase or long-term lease of real estate equal to the lesser of (1) up to 1.0%a portion of the
costannual advisory fee must be refunded by the Advisor if the operating expenses of
acquisition, inclusive of commissions, if any, paid to non-affiliated brokers or (2) the compensation customarily charged in arm’s-length transactions by others rendering similar property acquisition services as an ongoing public activityTCI (as defined in the
same geographical locationAdvisory Agreement) exceed certain limits specified in the Advisory Agreement based on the book value, net asset value and
for comparable property, providedthatnet income of TCI during the aggregate purchase price of each property (including acquisition fees and real estate brokerage commissions) may not exceed such property’s appraised value at acquisition. Prime does not receive such a commission on acquisitions from an affiliated or related party.
fiscal year.
The Advisory Agreement requires
Prime or any affiliate of PrimePillar to pay to TCI, one-half of any compensation received from third parties with respect to the origination, placement or brokerage of any loan made by TCI; provided, however, that the compensation retained by
PrimePillar, or any affiliate of
PrimePillar, shall not exceed the lesser of (1) 2.0% of the amount of the loan commitment or (2) a loan brokerage and commitment fee which is reasonable and fair under the circumstances.
The
TCI Advisory Agreement
alsofurther provides that
Prime or an affiliate of Prime is to receive a mortgage or loan acquisition fee with respect toPillar shall bear the
acquisition or purchase of any existing mortgage loan by TCI equal to the lesser of (1) 1.0% of the amount of the loan purchased or (2) a brokerage or commitment fee which is reasonable and fair under the circumstances. Such fee will not be paid in connection with the origination or funding of any mortgage loan by TCI.Under the Advisory Agreement, Prime or an affiliate of Prime also is to receive a mortgage brokerage and equity refinancing fee for obtaining loans or refinancing on properties equal to the lesser of (1) 1.0% of the amount of the loan or the amount refinanced or (2) a brokerage or refinancing fee which is reasonable and fair under the circumstances; provided, however, that no such fee shall be paid on loans from Prime or an affiliate of Prime without the approval of TCI’s Board of Directors. No fee shall be paid on loan extensions.
The Advisory Agreement also provides that for all activities in connection with or related to construction for the Company and its subsidiaries, Prime shall receive a fee equal to 6% of the so-called “hard costs” only of any costs of construction on a completed basis, based upon amounts set forth as approved on any architect certificate issued in connection with such construction, which fee is payable at such time as the applicable architect certifies other costs for payment to third parties. The phrase “hard costs” means all actual costs of construction paid to contractors, subcontractors and third parties for materials or labor performed as part of the construction but does not include items generally regarded as “soft costs,” which are consulting fees, attorneys’ fees, architectural fees, permit fees and fees of other professionals.
Under the Advisory Agreement, Prime receives reimbursementcost of certain expenses incurred by it inof its employees, excluding fees paid to TCI’s Directors; rent and other office expenses of both Pillar and TCI (unless TCI maintains office space separate from that of Pillar); costs not directly identifiable to TCI’s assets, liabilities, operations, business or financial affairs; and miscellaneous administrative expenses relating to the performance by Pillar of advisory services.
Underits duties under the Advisory Agreement, allAgreement.
If and to the extent that TCI shall request Pillar, or
a portionany director, officer, partner, or employee of
the annual advisory fee must be refunded by the Advisor if the Operating Expenses of TCI (as defined in the Advisory Agreement) exceed certain limits specified in the Advisory Agreement based on the book value, net asset value and net income of TCI during the fiscal year.Additionally, if management werePillar, to request that Prime render services tofor TCI other than those required to be rendered by the Advisory Agreement, Prime or an affiliate of PrimePillar separately would be compensated for such additional services on terms to be agreed upon between such party and TCI from time to time. As discussed below, under “Property Management and Real Estate Brokerage,” TCI has hired Triad Realty Services, Ltd. (“Triad”), an affiliate of Prime, to provide property management services for TCI’s commercial properties. Also as discussed below, under “Real Estate Brokerage” TCI had engaged, on a non-exclusive basis,effective January 1, 2011, Regis Realty Inc.Prime, LLC, dba Regis Property Management, LLC (“Regis”), a related party, to performthe sole member of which is Realty Advisors, LLC, manages our commercial properties and provides brokerage services for TCI until December 2002. Beginning January 1, 2003,under similar terms as the previous agreements with Triad and Regis Realty I LLC performs brokerage services for TCI.
I.
TCI entered into a Cash Management Agreement with Pillar on April 30, 2011 and terminated the previous agreement with Prime. The Company and
Prime havePillar entered into a Cash Management Agreement to further define the administration of the Company’s day-to-day investment operations, relationship contacts, flow of funds and deposit and borrowing of funds. Under the Cash Management Agreement, all funds of the Company are delivered to
PrimePillar which has a deposit liability to the Company and is responsible for payment of all payables and investment of all excess funds which earn interest at the Wall Street Journal Prime Rate plus
1%1.0% per annum, as set quarterly on the first day of each calendar quarter. Borrowings for the benefit of the Company bear the same interest rate. The term of the Cash Management Agreement is coterminous with the Advisory Agreement, and is automatically renewed each year unless terminated with the Advisory Agreement.
Prime TCI’s management believes that the terms of the Advisory Agreement are at least as fair as could be obtained from unaffiliated third parties.
Situations may develop in which the interests of TCI are in conflict with those of one or more directors or officers in their individual capacities, or of Pillar, or of their respective related parties. In addition to services performed for TCI, as described above, Pillar actively provides similar services as agent for, and advisor to, other real estate enterprises, including persons and entities involved in real estate development and financing, including ARL and IOT. The Advisory Agreement provides that Pillar may also serve as advisor to other entities.
As advisor, Pillar is a fiduciary of TCI’s public investors. In determining to which entity a particular investment opportunity will be allocated, Pillar will consider the respective investment objectives of each entity and the appropriateness of a particular investment in light of each such entity’s existing mortgage note and real estate portfolios and business plan. To the extent any particular investment opportunity is appropriate to more than one such entity, such investment opportunity will be allocated to the entity that has had funds available for investment for the longest period of time, or, if appropriate, the investment may be shared among various entities. See Part III, Item 13 “Certain Relationships and Related Transactions, and Director Independence.”
Pillar may assign the Advisory Agreement only with the prior consent of TCI.
The managers and principal executive officers of
PrimePillar are set forth below.
| Name | | |
Mickey N. Phillips: | | Manager
|
Ryan T. Phillips: | | Manager
Managers/Officer(s) |
Daniel J. Moos:Moos | | President and Chief Executive Officer |
| Gene S. Bertcher | | Executive Vice President, and Chief Financial Officer |
Louis J. Corna:Corna | | Executive Vice President, Secretary, Tax Counsel, General Legal Counsel Executive Vice President, Tax, Secretary |
Alfred Crozier:Crozier | | Executive Vice President, Residential Construction |
| Mickey N. Phillips | Manager |
| Ryan T. Phillips | Manager |
TCI had an Advisory Agreement with Prime Income Asset Management, LLC (“Prime”) until April 30, 2011 when the agreement with was terminated. During that period, Prime was a single member Nevada limited liability company, the sole member of which was Prime Income Asset Management, Inc. (“PIAMI”), the sole shareholder of which was Realty Advisors, LLC, a Nevada limited liability company, the sole member of which was Realty Advisors, Inc., a Nevada corporation, the sole shareholder of which was Realty Advisors Management, Inc., a Nevada corporation, the sole shareholder of which was a trust known as the May Trust.
Property Management
Affiliates
Effective since January 1, 2011, Regis Realty Prime, LLC, dba Regis Property Management, LLC (“Regis”), the sole member of Prime provide propertywhich is Realty Advisors, LLC, manages our commercial properties for a fee of 3.0% or less of the monthly gross rents collected on the commercial properties it manages, and leasing commissions of 6.0% or less in accordance with the terms of its property-level management agreement.
Prior to December 31, 2010, Triad Realty Services, L.P. (“Triad”), provided management services to TCI for theour commercial properties. Currently, Triad provides such property management services. Triad subcontracts with other entities for the provision of property-level management services to TCI. The general partner of Triad iswas PIAMI. The limited partner of Triad iswas HRS Holdings, LLCLLC. (“HRSHLLC”HRSH”). Triad subcontractssubcontracted the property-level management and leasing of TCI’sour commercial properties (office buildings, shopping centers and industrial warehouses) to Regis Realty I, LLC (“Regis I”), the sole member of which iswas HRSH, and was entitled to receive property and construction management fees and leasing commissions in accordance with the terms of its property-level management agreement with Triad. Regis I also receives real estate brokerage commissions in accordance with
TCI engages third-party companies to lease and manage our apartment properties for a fee of 6.0% or less of the
terms of a non-exclusive brokerage agreement. Regis Hotel I, LLC, a related party, manages TCI’s hotels. The sole member of Regis I and Regis Hotel I, LLC is HRSHLLC.monthly gross rents collected on the residential properties under their management.
Regis I also provides real estate brokerage services to TCI (onon a non-exclusive basis),basis, and is entitled to receive a real estate commission for property purchases and sales in accordance with the following sliding scale of total fees to be paid:
| (1) | maximum fee of 4.5% on the first $2.0 million of any purchase or sale transaction of which no more than 3.5% is to be paid to Regis; |
| (2) | maximum fee of 3.5% on transaction amounts between $2.0 million-$5.0 million of which no more than 3.0% is to be paid to Regis; |
| (3) | maximum fee of 2.5% on transaction amounts between $5.0 million-$10.0 million of which no more than 2.0% is to be paid to Regis; and |
| (4) | a maximum fee of 2.0% on transaction amounts in excess of $10.0 million of which no more than 1.5% is to be paid to Regis. |
Regis waived all fees or commissions payable other than cost reimbursements to TCI during the first
$2.0 millioncalendar year expiring December 31, 2011 of
any purchase or sale transaction of which no more than 3.5% is to be paid to Regis I or affiliates; (2) maximum fee of 3.5% on transaction amounts between $2.0 million-$5.0 million of which no more than 3.0% is to be paid to Regis I or affiliates; (3) maximum fee of 2.5% on transaction amounts between $5.0 million-$10.0 million of which no more than 2.0% is to be paid to Regis I or affiliates; and (4) maximum fee of 2.0% on transaction amounts in excess of $10.0 million of which no more than 1.5% is to be paid to Regis I or affiliates.ITEM 11. EXECUTIVE | COMPENSATION |
a five year agreement.
ITEM 11. EXECUTIVE COMPENSATION
TCI has no employees, payroll or benefit plans and pays no compensation to its executive officers. The executive officers of TCI, who are also officers or employees of
Prime,Pillar, TCI’s advisor, are compensated by
Prime.Pillar. Such executive officers perform a variety of services for
PrimePillar and the amount of their compensation is determined solely by
Prime. PrimePillar. Pillar does not allocate the cash compensation of its officers among the various entities for which it serves as advisor. See Item 10. “Directors, Executive Officers and Corporate Governance” for a more detailed discussion of the compensation payable to
Prime.Pillar by TCI.
The only remuneration paid by TCI is to the directors who are not officers or
directorsemployees of
PrimePillar or its
affiliatedrelated companies. The Independent Directors (1) review the business plan of TCI to determine that it is in the best interest of TCI’s stockholders, (2) review the advisory contract, (3) supervise the performance of the advisor and review the reasonableness of the compensation paid to the advisor in terms of the nature and quality of services performed, (4) review the reasonableness of the total fees and expenses of TCI and (5) select, when necessary, a qualified independent real estate appraiser to appraise properties acquired.
Each
Prior to January 2010, each Independent Director iswas entitled to receive compensation in the amount of $30,000 per year, plus reimbursement for expenses. The Chairman of the Board iswas entitled to receive an additional fee of $3,000 per year. In addition, each Independent Director receivesreceived an additional $250 for each Audit Committee meeting attended, plus each Independent Director receivesreceived an additional fee of $1,000 per day for any special services rendered by him to TCI outside of his ordinary duties as director, plus reimbursement of expenses. EffectiveOn January 4, 2010, the Board of Directors reduced their compensation to $15,000 per annum and no Audit Committee fees, with the Audit Committee Chairman to receive a one timeone-time annual fee of $500. The Company also reimburses Directors for travel expenses incurred in connection with attending Board, Committee and Stockholder meetings and for other Company-related business. Effective February 2011 each non-affiliated Director is entitled to receive an annual retainer of $12,000, with the Chairman of the Audit Committee to receive a one-time annual fee of $500. Directors who are also employees of the Company or its advisor receive no additional compensation for service as a Director.
During
2009, $58,309.362012, $41,051.89 was paid to
the Independentnon-employee Directors in total
directors’Directors’ fees for
allcurrent and prior years’ services including the annual fee for
serviceservices during the period January 1,
20092012 through December 31,
2009, and special service2012. The fees
paid to the directors are as follows: Sharon Hunt,
$15,000;$13,551.39 Robert A. Jakuszewski,
$15,000;$13,500; Ted R. Munselle,
$15,000; and Ted P. Stokely, $15,309.36.$14,000.
Director’s Stock Option Plan
TCI established a Director’s Stock Option Plan (“Director’s Plan”) for the purpose of attracting and retaining Directors who are not officers or employees of TCI or Prime.Pillar. The Director’s Plan provides for the grant of options that are exercisable at fair market value of TCI’s Common Stockstock on the date of grant. The Director’s Plan was approved by stockholders at their annual meeting on October 10, 2000, following which each then-serving Independent Director was granted options to purchase 5,000 shares of Common Stockstock of TCI. On January 1 of each year, each Independent Director receives options to purchase 5,000 shares of Common Stock.stock. The options are immediately exercisable and expire on the earlier of the first anniversary of the date on which a Director ceases to be a Director or 10 years from the date of grant. The Director’s Plan was terminated by the Board of Directors on December 15, 2005. As of March 25, 2010, options covering 25,000December 31, 2012, there were 5,000 shares of stock options outstanding which were exercisable at $14.25 per share. These options will expire January 1, 2015, if not exercised.
ITEM 12. SECURITYOWNERSHIP OF CERTAIN BENEFICIAL OWNERS AND MANAGEMENT
Securities Authorized for Issuance Under Equity Compensation Plans
The following table provides information as of December 31, 2012 regarding compensation plans under which equity securities of TCI
Common Stock were outstanding.ITEM 12. SECURITY | OWNERSHIP OF CERTAIN BENEFICIAL OWNERS AND MANAGEMENT |
are authorized for issuance.
Equity Compensation Plan Information
| Plan Category | | Number of Securities to be Issued Upon Exercise of Outstanding Options, Warrants and Rights | | | Weighted-Average Exercise Price of Outstanding Options, Warrants and Rights | | | Number of Securities Remaining Available for Future Issuance Under Compensation Plans (Excluding Securities Reflected in Column) | |
| | | (a) | | | (b) | | | (c) | |
| Equity compensation plans approved by | | | | | | | | | |
| security holders | | $ | 5,000 | | | | 14.25 | | | | — | |
See Note 10. to the financial statements “Stock Options” for information regarding the material features of the above plans.
Security Ownership of Certain Beneficial Owners
The following table sets forth the ownership of TCI’s Common
Stock,stock, both beneficially and of record, both individually and in the aggregate, for those persons or entities known to be beneficial owners of more than 5.0% of the outstanding shares of Common
Stockstock as of the close of business on March
25, 2010. | | | | | |
| | | Amount
and Nature
of Beneficial
Ownership | | Approximate
Percent of
Class(1) | |
American Realty Trust, Inc.(2) | | 5,507,710 | | 67.88 | % |
1800 Valley View Lane, Suite 300 | | | | | |
Dallas, Texas 75234 | | | | | |
| | |
American Realty Investors, Inc.(2)(3) | | 6,720,936 | | 82.83 | % |
1800 Valley View Lane, Suite 300 | | | | | |
Dallas, Texas 75234 | | | | | |
| | |
Basic Capital Management, Inc. | | 902,507 | | 11.37 | % |
1800 Valley View Lane, Suite 300 | | | | | |
Dallas, Texas 75234 | | | | | |
| | |
EQK Holdings, Inc.(2) | | 4,584,973 | | 56.51 | % |
1800 Valley View Lane | | | | | |
Suite 300 | | | | | |
Dallas, Texas 75234 | | | | | |
| | |
Transcontinental Realty Acquisition Corporation(3) | | 1,213,226 | | 14.95 | % |
1800 Valley View Lane | | | | | |
Suite 100 | | | | | |
Dallas, Texas 75234 | | | | | |
| | | Amount and Nature of Beneficial Ownership* | | | Approximate Percent of Class** | |
American Realty Investors, Inc. (1)(2)(3) | | | 7,052,420 | | | | 83.82 | % |
| 1603 LBJ Freeway, Suite 800 | | | | | | | | |
| Dallas, Texas 75234 | | | | | | | | |
| | | | | | | | | |
EQK Holdings, Inc.(1)(2) | | | 5,669,194 | | | | 67.38 | % |
| 1603 LBJ Freeway, Suite 800 | | | | | | | | |
| Dallas, Texas 75234 | | | | | | | | |
| | | | | | | | | |
Transcontinental Realty Acquisition Corporation(2) | | | 1,383,226 | | | | 16.44 | % |
| 1603 LBJ Freeway, Suite 800 | | | | | | | | |
| Dallas, Texas 75234 | | | | | | | | |
(1)* | “Beneficial Ownership” means the sole or shared power to vote, or to direct the voting of, a security or investment power with respect to a security, or any combination thereof. |
| ** | Percentage is based upon 8,113,6698,413,469 shares of Common Stockstock outstanding at March 5, 2010.20, 2013. |
(2)(1) | Includes 920,5075,669,194 shares (11.37%) owned by Basic Capital Management, Inc. (“BCM”), a wholly owned subsidiary of EQK Holdings, Inc. (“EQK”) directly, over which the director of EQK, Daniel J. Moos, may be deemed to be beneficial owner by virtue of his position as sole director of EQK. The director of EQK disclaims beneficial ownership of such shares. EQK is a wholly-owned subsidiary of American Realty Investors, Inc. (“ARL”). |
| (2) | Includes 1,383,226 shares owned by Transcontinental Realty Acquisition Corporation (“TRAC”), which is a wholly-owned subsidiary of ART,ARL, over which is a wholly-owned subsidiaryeach of the directors of TRAC, Daniel J. Moos and Gene S. Bertcher may be deemed to be beneficial owners by virtue of their positions as directors of TRAC. The directors of TRAC disclaim beneficial ownership of such shares. |
| (3) | Each of the directors of ARL, Henry A. Butler, Robert A. Jakuszewski, Ted R. Munselle and Sharon Hunt may be deemed to be the beneficial owners by virtue of their positions as current directors of ARL. EQK owns 3,664.466 shares direct and ART owns 922,737 shares direct.The directors of ARL disclaim such beneficial ownership. |
(3) | Transcontinental Realty Acquisition Corporation (“TRAC”) is a wholly-owned subsidiary of ARL.
|
Security Ownership of Management.
The following table sets forth the ownership of TCI’s Common
Stock,stock, both beneficially and of record, both individually and in the aggregate, for the directors and executive officers of TCI as of the close of business on March
25, 2010.20, 2013.| Name of Beneficial Owner | | Amount and Nature of Beneficial Ownership* | | | Approximate Percent of Class** | |
| | | | | | | | | | |
| Gene S. Bertcher | | | 7,052,420 | | | | (2) | | | 83.82 | % |
| Henry A. Butler | | | 7,052,420 | | | | (2) | | | 83.82 | % |
| Louis J. Corna | | | 7,052,420 | | | | (2) | | | 83.82 | % |
| Alfred Crozier | | | 7,052,420 | | | | (2) | | | 83.82 | % |
| Robert A. Jakuszewski | | | 7,052,420 | | | | (2) | | | 83.82 | % |
| Daniel J. Moos | | | 7,052,420 | | | | (2)(3) | | | 83.82 | % |
| Ted Munselle | | | 7,052,420 | | | | (1)(2) | | | 83.82 | % |
| Sharon Hunt | | | 7,052,420 | | | | (2) | | | 83.82 | % |
| All Directors and Executive Officers as a group (8 individuals) | | | 7,052,420 | | | | (1)(2)(3) | | | 83.82 | % |
| * | | | | | | |
Name“Beneficial Ownership” means the sole or shared power to vote, or to direct the voting of, Beneficial Owner
| | Amount and Nature of
Beneficial Ownership | | | Approximate
Percent of Class(1) | |
Gene S. Bertcher
| | 6,720,936 | (2) | | 82.83 | % |
Henry A. Butler
| | 6,720,936 | (2) | | 82.83 | % |
Louis J. Corna
| | 6,720,936 | (2) | | 82.83 | % |
Alfred Crozier
| | 6,720,936 | (2) | | 82.83 | % |
Sharon Hunt
| | 6,725,936 | (2)(3) | | 82.89 | % |
Robert A. Jakuszewski
| | 6,720,936 | (2) | | 82.83 | % |
Daniel J. Moos
| | 6,720,936 | (2) | | 82.83 | % |
Ted Munselle
| | 6,725,936 | (2)(4) | | 82.89 | % |
All Directors and Executive Officers as a group (8 individuals)
| | 6,745,936 | (2)(3)(4) | | 83.14 | % security or investment power with respect to a security, or any combination thereof. |
(1)** | Percentage isPercentages are based upon 8,113,6698,413,469 shares of Common Stockstock outstanding at March 25, 2010 and as20, 2013.
|
| (1) | Ted R. Munselle has options to Mr. Munselle, and Ms. Hunt,purchase 5,000 shares of Common stock which may be issued under existing Director Stock Options.are presently exercisable. |
| (2) | Includes 920,507 by BCM which is a subsidiary of EQK, 3,664,4665,669,194 shares owned by EQK 922,737 shares by ART and 1,213,2261,383,226 shares owned by TRAC. Eachb y TRAC, over which the executive officers and members of the executive officersBoard of Directors of ARL may be deemed to be the beneficial owners of such shares by virtue of their positionsposfitions as executive officers and members of ARL and its subsidiaries, EQK, ART, and TRAC.the Board of Directors of ARL. The executive officers and current members of the Board of Directors of ARL disclaim beneficial ownership of such beneficial ownership. shares. |
| (3) | IncludesDaniel J. Moos owns 5,000 shares which may be acquired by Ms. Hunt pursuant to the Director Stock Option Plan.
of Common stock |
(4) | Includes 5,000 shares which may be acquired by Mr. Munselle pursuant
ITEM 13. CERTAIN RELATIONSHIPS AND RELATED TRANSACTIONS, AND DIRECTOR INDEPENDENCE Policies with Respect to the Director Stock Option Plan. |
ITEM 13. | CERTAIN RELATIONSHIPS AND RELATED TRANSACTIONS, AND DIRECTOR INDEPENDENCE |
Certain Business Relationships
TheActivities
Article 14 of TCI’s Articles of Incorporation provides that TCI shall not, directly or indirectly, contract or engage in any transaction with (1) any director, officer or employee of TCI, (2) any director, officer or employee of the advisor, (3) the advisor, or (4) any affiliate or associate (as such terms are defined in Rule 12b-2 under the Securities Exchange Act of 1934, as amended) of any of the aforementioned persons, unless (a) the material facts as to the relationship among or financial interest of the relevant individuals or persons and as to the contract or transaction are disclosed to or are known by TCI’s Board of Directors or the appropriate committee thereof and (b) TCI’s Board of Directors or committee thereof determines that such contract or transaction is fair to TCI and simultaneously authorizes or ratifies such contract or transaction by the affirmative vote of a majority of independent directors of TCI retainsentitled to vote thereon.
Article 14 defines an “Independent Director” (for purposes of that Article) as one who is neither an officer or employee of TCI, nor a director, officer or employee of TCI’s advisor.
TCI’s policy is to have such contracts or transactions approved or ratified by a majority of the contractual advisor. Primedisinterested Directors with full knowledge of the character of such transactions, as being fair and reasonable to the stockholders at the time of such approval or ratification under the circumstances then prevailing. Such Directors also consider the fairness of such transactions to TCI. Management believes that, to date, such transactions have represented the best investments available at the time and they were at least as advantageous to TCI as other investments that could have been obtained.
TCI may enter into future transactions with entities, the officers, directors, or stockholders of which are also officers, directors, or stockholders of TCI, if such transactions would be beneficial to the operations of TCI and consistent with TCI’s then-current investment objectives and policies, subject to approval by a majority of disinterested Directors as discussed above.
TCI does not prohibit its officers, directors, stockholders, or related parties from engaging in business activities of the types conducted by TCI.
Certain Business Relationships
Pillar Income Asset Management, Inc. (“Pillar”) has been
TCI’s Advisor and Cash Manager since April 30, 2011. Although the Board of Directors is directly responsible for managing the affairs of TCI, and for setting the policies which guide it, the day-to-day operations of TCI are performed by Pillar, as the contractual advisor,
under the supervision of the Board. Pillar’s duties include, but are not limited to,
locating, evaluating and recommending real estate and real estate-related investment opportunities and arranging debt and equity financing for the Company with third party lenders and investors. Additionally, Pillar serves as a consultant to the Board with regard to their decisions in connection with TCI’s business plan and investment policy. Pillar also serves as an Advisor and Cash Manager to ARL and IOT. As the contractual advisor, Pillar is compensated by TCI
since July 1, 2004. Seeunder an Advisory Agreement that is more fully described in Part III, Item 10. “Directors, Executive Officers and Corporate
Governance—Governance – The Advisor”
for a description. TCI has no employees and as such, employees of
Prime, its duties and its compensation. See also Note 15 to the Financial Statements for a description of the fees paid to Prime as the advisor and cost reimbursements during the three fiscal years ended December 31, 2009.Affiliates of Prime provide commercial property managementPillar render services to TCI. Currently, Triad provides such property management services. Triad subcontracts the property-level management and leasing of TCI’s commercial properties to Regis I and three of its hotels to Regis Hotel I, LLC.
Regis I also provides real estate brokerage services for TCI on a non-exclusive basis, and receives brokerage commissions in accordance with the brokerage agreement.
Two of TCI’s Directors (Robert Jakuszewski and Ted Munselle) also serve as directors of IOT; Each owe fiduciary duties to IOT as well as to TCI under applicable law. At December 31, 2009, TCI owned approximately
85%terms of the outstanding common sharesAdvisory Agreement.
Pillar is a Nevada corporation, the sole shareholder of IOT.which is Realty Advisors, LLC, a Nevada limited liability company, the sole member of which is Realty Advisors, Inc., a Nevada corporation, the sole shareholder of which is Realty Advisors Management, Inc., a Nevada corporation, the sole shareholder of which is a trust known as the May Trust.
TCI had an Advisory Agreement with Prime also servesIncome Asset Management, LLC (“Prime”) until April 30, 2011 when the agreement with was terminated. During that period, Prime was a single member Nevada limited liability company, the sole member of which was Prime Income Asset Management, Inc. (“PIAMI”), the sole shareholder of which was Realty Advisors, LLC, a Nevada limited liability company, the sole member of which was Realty Advisors, Inc., a Nevada corporation, the sole shareholder of which was Realty Advisors Management, Inc., a Nevada corporation, the sole shareholder of which was a trust known as advisor tothe May Trust.
The May Trust is a Trust, the beneficiaries of which are the children of Gene E. Phillips. Gene E. Phillips is not an officer, manager or Director of Pillar, Prime, PIAMI, Realty Advisors, LLC, Realty Advisors, Inc., Realty Advisors Management, Inc. or ARL, and IOT. nor is he a Trustee of the May Trust.
All of TCI’s directors also serve as Directors of
ARL. Messrs. Moos, Bertcher, CornaARL and
CrozierIOT. The executive officers of TCI also serve as executive officers of ARL and IOT.
As such, they owe fiduciary duties to that entity as well as to Pillar under applicable law. ARL has the same relationship with Pillar, as does TCI. Mr. Bertcher is an officer, director and employee of NCE and as such also owes fiduciary duties to NCE as well as ARL, TCI and IOT under applicable law.
Effective since January 1, 2011, Regis Realty Prime, LLC, dba Regis Property Management, LLC (“Regis”), the sole member of which is Realty Advisors, LLC, manages our commercial properties for a fee of 3.0% or less of the monthly gross rents collected on the commercial properties it manages, and leasing commissions of 6.0% or less in accordance with the terms of its property-level management agreement.
Prior to December 31, 2010, Triad Realty Services, L.P. (“Triad”), provided management services for our commercial properties. The general partner of Triad was PIAMI. The limited partner of Triad was HRS Holdings, LLC. (“HRSH”) Triad subcontracted the property-level management and leasing of our commercial properties (office buildings, shopping centers and industrial warehouses) to Regis Realty I, LLC (“Regis I”), the sole member of which was HRSH, and was entitled to receive property management fees, construction management fees and leasing commissions in accordance with the terms of its property-level management agreement with Triad.
At December 31, 2012, TCI owned approximately 81.1% of the outstanding common shares of IOT.
The Company is part of a tax sharing and compensating agreement with respect to federal income taxes between ARL, TCI and IOT and their subsidiaries that was entered into in July of 2009. That agreement continued until August 31, 2012 at which time a new tax sharing and compensating agreement was entered into by ARL, TCI IOT and RAMI for the remainder of 2012. The expense (benefit) in each year was calculated based on the amount of losses absorbed by taxable income multiplied by the maximum statutory tax rate of 35%.
The Company has a development agreement with Unified Housing Foundation, Inc. (“UHF”) a non-profit corporation that provides management services for the development of residential apartment projects in the future. The Company has also invested in surplus cash notes receivables from UHF and has sold several residential apartment properties to UHF in prior years. Due to this ongoing relationship and the significant investment in the performance of the collateral secured under the notes receivable, UHF has been determined to be a related party.
Related Party Transactions
The Company has historically engaged in and may continue to engage in certain business transactions with related parties, including but not limited to asset acquisition and dispositions. Transactions involving related parties cannot be presumed to be carried out on an arm’s length basis due to the absence of free market forces that naturally exist in business dealings between two or more unrelated entities. Related party transactions may not always be favorable to our business and may include terms, conditions and agreements that are not necessarily beneficial to or in the best interest of our company.
TCI
In 2012, the Company paid advisory fees of
$11.9$8.9 million, construction advisory fees of $0.2 million, net income fees of
$0.1 million, acquisition fees of $.04$0.2 million, mortgage brokerage and equity refinancing fees of
$0.6$1.9 million,
costscost reimbursements of
$3.7$2.2 million, and interest of
$1.6$1.2 million to
Prime in 2009.TCIPillar.
The Company paid property
acquisitionmanagement fees,
of $0.1 million, real estate brokerage fees of $1.1 million, construction supervision fees of $0.9 million, and property and construction management
fees and leasing commissions of $2.1 million to Regis
I in
2009.Operating Relationships
2012.
As of December 31, 2012, the Company had notes and interest receivables of $58.0 million due from related parties. See Part 2, Item 8. Note 3. “Notes and Interest Receivable”. During the current period, TCI recognized $11.7 million of interest income from these related party notes receivables.
In 2012, the Company received rents of $3.4$6.0 million in 2009, $2.8compensation for the services provided under the development agreement with UHF.
Below are sales and acquisitions that involve a related party:
On January 1, 2012, ARL and TCI agreed to rescind the April 1, 2011 sale of 100% of the general and limited partnership interest in Garden Whispering Pines, LP, which owns Whispering Pines apartments, a 320-unit complex located in Topeka, Kansas.
On January 3, 2012, 82.2 acres of land known as Denton Coonrod land located in Denton County, Texas was transferred to the existing lender. This land parcel was previously sold, on March 23, 2011, to Cross County National Associates, LP, a related party, for a sales price of $1.8 million. The Company did not recognize or record the sale in accordance with ASC 360-20 due to our continuing involvement, which included the potential payment of cash shortfalls, future obligations under the existing mortgage and guaranty, the buyer’s inadequate initial investment and the Company’s questionable recovery of investment cost. The Company determined that no sale had occurred for financial reporting purposes and therefore the asset remained on the books and continued to record operating expenses and depreciation as a period cost until a sale occurred that met the requirements of ASC 360-20. A sale to an independent third party, that met the requirements of ASC 360-20, took place on January 3, 2012 at a sales price equal to the existing mortgage of $0.8 million, that was considered paid in full when ownership transferred to the existing lender. We recorded a gain on sale of $0.04 million on the land parcel sale.
On February 7, 2012, 22.92 acres of land known as Andrew B land, Denton County, Texas was transferred to the existing lender. This land parcel was previously sold, on September 1, 2011, to TCI Luna Ventures, LLC, a related party, for a sales price of $1.3 million. The Company did not recognize or record the sale in accordance with ASC 360-20 due to our continuing involvement, which included the potential payment of cash shortfalls, future obligations under the existing mortgage and guaranty, the buyer’s inadequate initial investment and the Company’s questionable recovery of investment cost. The Company determined that no sale had occurred for financial reporting purposes and therefore the asset remained on the books and continued to record operating expenses and depreciation as a period cost until a sale occurred that met the requirements of ASC 360-20. A sale to an independent third party, that met the requirements of ASC 360-20, took place on February 7, 2012, when the Company received a credit against the outstanding debt of $2.1 million, which is part of a multi-tract collateral obligation, and the existing lender took possession of the property. We recorded a gain on sale of $1.2 million on the land parcel sale.
On March 1, 2012, we sold 100% of our interests in LaDue, LLC to ABC Land & Development, Inc., a related party, for a sales price of $1.9 million. This entity owns 8.01 acres of land known as LaDue land located in Dallas County, Texas. We provided $1.3 million in 2008,seller-financing with a five-year note receivable. The note accrues interest at 5% and is payable at maturity on March 1, 2017. The buyer assumed the existing mortgage of $0.6 million, secured by the property. The Company did not recognize or record the sale in accordance with ASC 360-20 due to our continuing involvement, which included the potential payment of cash shortfalls, future obligations under the existing mortgage and guaranty, the buyer’s inadequate initial investment and the Company’s questionable recovery of investment cost. The Company determined that no sale had occurred for financial reporting purposes and therefore the asset remained on the books and continued to record operating expenses and depreciation as a period cost until a sale occurred that met the requirements of ASC 360-20. On August 10, 2012, we re-purchased 100% of the membership interests in LaDue, LLC from ABC Land & Development, Inc., a related party, for $1.9 million to be paid by assumption of debt of $0.6 million, secured by the property, and cancellation of a five-year seller-financed note of $1.3 million. There is no change in the financial statements related to the March 1, 2012 sale or the subsequent re-acquisition.
On March 5, 2012, 7.39 acres of land known as DeSoto Ranch land located in DeSoto, Texas was transferred to the existing lender. This land parcel was previously sold, on September 1, 2011, to TCI Luna Ventures, LLC, a related party, for a sales price of $1.3 million. The Company did not recognize or record the sale in accordance with ASC 360-20 due to our continuing involvement, which included the potential payment of cash shortfalls, future obligations under the existing mortgage and guaranty, the buyer’s inadequate initial investment and the Company’s questionable recovery of investment cost. The Company determined that no sale had occurred for financial reporting purposes and therefore the asset remained on the books and continued to record operating expenses and depreciation as a period cost until a sale occurred that met the requirements of ASC 360-20. A sale to an independent third party, that met the requirements of ASC 360-20, took place on March 5, 2012, when the Company received a credit against the outstanding debt of $1.0 million, which is part of a multi-tract collateral obligation, and the existing lender took possession of the property. We recorded a gain on sale of $0.1 million on the land parcel sale.
On April 1, 2012, we purchased 1,000 shares of stock of Kelly Lot Development, Inc. from Tacco Financial, Inc., a related party, for $5.6 million. This entity owns six land parcels, comprising approximately 52.59 acres of undeveloped land located in Dallas County, Texas, Kaufman County, Texas, Nashville, Tennessee and Tarrant County, Texas, known as Kelly Lots land, Travis Ranch land, Nashville land, Cooks Lane land, Seminary West land and Vineyards land. We assumed the existing mortgages of $0.5 million and $0.4 million, secured by the property. The loans accrue interest at 15.00% and are payable at maturity on May 1, 2013 and November 1, 2013, respectively.
On April 3, 2012, 5.22 acres of land known as Andrew C land located in Denton, Texas was transferred to the existing lender. This land parcel was previously sold, on September 1, 2011, to TCI Luna Ventures, LLC, a related party, for a sales price of $0.4 million. The Company did not recognize or record the sale in accordance with ASC 360-20 due to our continuing involvement, which included the potential payment of cash shortfalls, future obligations under the existing mortgage and guaranty, the buyer’s inadequate initial investment and the Company’s questionable recovery of investment cost. The Company determined that no sale had occurred for financial reporting purposes and therefore the asset remained on the books and continued to record operating expenses and depreciation as a period cost until a sale occurred that met the requirements of ASC 360-20. A sale to an independent third party, that met the requirements of ASC 360-20, took place on April 3, 2012, when the Company received a credit against the outstanding debt of $0.5 million, which is part of a multi-tract collateral obligation, and the existing lender took possession of the property. We recorded a gain on sale of $0.2 million on the land parcel sale.
On August 10, 2012, we purchased 100% of the membership interests in LaDue, LLC from ABC Land & Development, Inc., a related party, for $1.9 million to be paid by assumption of debt of $0.6 million, secured by the property, and cancellation of a five-year seller-financed note of $1.3 million. This entity owns 8.01 acres of land known as LaDue land located in Dallas County, Texas. TCI originally sold the membership interests in LaDue, LLC on March 1, 2012 but did not record the sale for accounting purposes. See the above March 1, 2012 sale disclosure for details of the accounting treatment.
On December 31, 2012, 21.26 acres of land known as Pioneer Crossing land located in Austin, Texas was transferred to the existing lender. This land parcel was previously sold, on September 1, 2011, to TCI Luna Ventures, LLC, a related party, for a sales price of $1.4 million. The Company did not recognize or record the sale in accordance with ASC 360-20 due to our continuing involvement, which included the potential payment of cash shortfalls, future obligations under the existing mortgage and guaranty, the buyer’s inadequate initial investment and the Company’s questionable recovery of investment cost. The Company determined that no sale had occurred for financial reporting purposes and therefore the asset remained on the books and continued to record operating expenses and depreciation as a period cost until a sale occurred that met the requirements of ASC 360-20. A sale to an independent third party A sale to an independent third party, that met the requirements of ASC 360-20, received a credit against the outstanding debt of $0.3 million, which is part of a multi-tract collateral obligation, and the existing lender took possession of the property. We recorded a loss on sale of $1.0 million on the land parcel sale.
On December 31, 2012, we sold 100% of the stock in T Southwood 1394, Inc., to One Realco Corporation, a related party, for a sales price of $0.6 million. This entity owns 14.52 acres of land known as Southwood Land located in Tallahassee, Florida. Under the terms of the sale, the buyer assumed the existing mortgage of $0.6 million, secured by the property. The Company did not recognize or record the sale in accordance with ASC 360-20 due to our continuing involvement, which included the potential payment of cash shortfalls, future obligations under the existing mortgage and guaranty, the buyer’s inadequate initial investment and the Company’s questionable recovery of investment cost. The Company determined that no sale had occurred for financial reporting purposes and therefore the asset remained on the books and continued to record operating expenses and depreciation as a period cost until a sale occurred that met the requirements of ASC 360-20. A sale to an independent third party, that met the requirements of ASC 360-20, took place on January 8, 2013, when the property was sold to a third party and sales proceeds were credited against the outstanding debt. We will not record a gain or loss on the land parcel sale.
In December 2010, there were various commercial and land holdings sold to FRE Real Estate, Inc., a related party. During the first three months of 2011, many of these transactions were rescinded as of the original transaction date and were subsequently sold to related parties under the same ownership as FRE Real Estate, Inc. As of December 31, 2012, there is one commercial building, Thermalloy that remains in FRE Real Estate, Inc. We have deferred the recognition of the sales in accordance with ASC 360-20 due to our continuing involvement, the buyer’s inadequate initial investment and questionable recovery of the Company’s investment cost.
The properties that we have sold to a related party and have deferred the recognition of the sale are treated as “subject to sales contract” on the Consolidated Balance Sheets and are listed in detail in Schedule III, “Real Estate and Accumulated Depreciation”. These properties were sold to a related party in order to help facilitate an appropriate debt or organizational restructure and may or may not be transferred back to the seller upon resolution. These properties have mortgages that are secured by the property and many have corporate guarantees. According to the loan documents, we are currently in default on these mortgages primarily due to lack of payment although we are actively involved in discussions with every lender in order to settle or cure the default situation. We have reviewed each asset and taken impairment to the extent we feel the value of the property was less than our current basis.
Acquisitions from our parent, ARL, have previously been reflected at the fair value purchase price. Upon discussion with the SEC and in review of the guidance pursuant to ASC 250-10-45-22 to 24, we have adjusted those assets, in the prior year, to reflect a basis equal to ARL’s cost basis in the asset at the time of the sale. The related party payables to ARL were reduced for the lower asset price.
Operating Relationships
The Company received rental revenue of $0.6 million in 2012, $0.4 million in 2011, and $2.2 million in
20072010 from
Pillar, Prime and its
affiliatesrelated parties for
rents of TCIproperties owned
properties,by the Company, including
1010 Commons, 2010 Valley View, 600 Las Colinas, Amoco, Addison Hanger, Browning Place, Eagle Crest,
Fenton Centre, Folsom,
land, One Hickory,
Parkway North, Senlac,
Stanford Centre, Thermalloy and Two Hickory.
Restrictions on Related Party Transactions
Article Fourteen of
Advances and Loans
From time to time, TCI and its related parties have made advances to each other, which generally have not had specific repayment terms, did not bear interest, are unsecured, and have been reflected in TCI’s
Articles of Incorporation provides thatfinancial statements as other assets or other liabilities. TCI
shall not, directly or indirectly, contract or engage in any transaction with (1) any director, officer or employee of TCI, (2) any director, officer or employee ofand the advisor
(3)charge interest on the
advisor or (4) any affiliate or associate (as such terms are defined in Rule12b-2 under the Securities Exchange Actoutstanding balance of
1934, as amended) of any of the aforementioned persons, unless (a) the material facts as to the relationship among or financial interest of the relevant individuals or persons and as to the contract or transaction are disclosedfunds advanced to or
are known byfrom TCI. The interest rate, set at the
Boardbeginning of
Directors oreach quarter, is the
appropriate committee thereof and (b)Prime rate plus 1.0% on the
Board of Directors or committee thereof determines that such contract or transaction is fair toaverage daily cash balances advanced. At December 31, 2012, TCI
and simultaneously authorizes or ratifies such contract or transaction by the affirmative vote of a majority of independent directors of TCI entitled to vote thereon. Article Fourteen defines an “Independent Director” as one who is neither an officer or employee of TCI nor a director, officer or employee of TCI’s advisor.ITEM 14. PRINCIPAL | ACCOUNTING FEES AND SERVICES |
owes ARL $10.1 million.
ITEM 14. PRINCIPAL ACCOUNTING FEES AND SERVICES
The following table sets for the aggregate fees for professional services rendered to or for TCI
for the years 2012 and 2011 by
TCI’s principal accounting firms, Farmer, Fuqua and Huff, L.P. and Swalm and Associates, P.C.
for 2009 and 2008: | | | | | | | | | | | | | |
| | | 2009 | | 2008 |
Type of Fee | | Farmer,
Fuqua & Huff | | Swalm &
Associates | | Farmer,
Fuqua & Huff | | | BDO
Seidman |
Audit fees | | $ | 405,992 | | $ | 75,835 | | $ | 402,492 | | | $ | — |
Audit related fees | | | — | | | — | | | — | | | | — |
Tax fees | | | 51,900 | | | 2,572 | | | 55,775 | | | | 8,000 |
All other fees | | | — | | | — | | | — | | | | |
| | | | | | | | | | | | | |
Total | | $ | 457,892 | | $ | 78,407 | | $ | 458,267 | | | $ | 8,000 |
| | | | | | | | | | | | | |
:
| | | 2012 | | | 2011 | |
| | | Farmer, Fuqua | | | Swalm & | | | Farmer, Fuqua | | | Swalm & | |
| Type of Fee | | & Huff | | | Associates | | | & Huff | | | Associates | |
| Audit Fees | | $ | 491,992 | | | $ | 46,104 | (1) | | $ | 476,992 | | | $ | 52,572 | (1) |
| Tax Fees | | | 40,825 | | | | - | | | | 45,200 | | | | - | |
| Total | | $ | 532,817 | | | $ | 46,104 | | | $ | 522,192 | | | $ | 52,572 | |
| | | | | | | | | | | | | | | | | |
(1) All IOT | | | | | | | | | | | | | | | | |
The audit fees for 20092012 and 2008,2011, respectively, were for professional services rendered for the audits and reviews of the consolidated financial statements of TCI.TCI and its subsidiaries. Tax fees for 20092012 and 2008,2011, respectively, were for services related to federal and state tax compliance and advice. All services rendered by the principal auditors are permissible under applicable laws and regulations and were pre-approved by either the Board of Directors or the Audit Committee, as required by law. The fees paid the principal auditors for services as described in the above table fall under the categories listed below:
Audit Fees. These are fees for professional services performed by the principal auditor for the audit of the Company’s annual financial statements and review of financial statements included in the Company’s 10-Q filings and services that are normally provided in connection with statutory and regulatory filing or engagements.
Audit-Related Fees. These are fees for assurance and related services performed by the principal auditor that are reasonably related to the performance of the audit or review of the Company’s financial statements. These services include attestations by the principal auditor that are not required by statute or regulation and consulting on financial accounting/reporting standards.
Tax Fees. These are fees for professional services performed by the principal auditor with respect to tax compliance, tax planning, tax consultation, returns preparation and review of returns. The review of tax returns includes the Company and its consolidated subsidiaries.
All Other Fees. These are fees for other permissible work performed by the principal auditor that do not meet the above category descriptions.
These services are actively monitored (as to both spending level and work content) by the Audit Committee to maintain the appropriate objectivity and independence in the principal auditor’s core work, which is the audit of the Company’s consolidated financial statements.
The Audit Committee has established policies and procedures for the approval and pre-approval of audit services and permitted non-audit services. The Audit Committee has the responsibility to engage and terminate TCI’s independent auditors, to pre-approve their performance of audit services and permitted non-audit services, to approve all audit and non-audit fees, and to set guidelines for permitted non-audit services and fees. All fees for
20092012 and
20082011 were pre-approved by the Audit Committee or were within the pre-approved guidelines for permitted non-audit services and fees established by the Audit Committee, and there were no instances of waiver of approved requirements or guidelines during the same periods.
Under the Sarbanes-Oxley Act of 2002 (the “SOX Act”), and the rules of the Securities and Exchange Commission (the “SEC”), the Audit Committee of the Board of Directors is responsible for the appointment,
compensation and oversight of the work of the independent auditor. The purpose of the provisions of the SOX Act and the SEC rules for the Audit Committee role in retaining the independent auditor is two-fold. First, the authority and responsibility for the appointment, compensation and oversight of the auditors should be with directors who are independent of management. Second, any non-audit work performed by the auditors should be reviewed and approved by these same independent directors to ensure that any non-audit services performed by the auditor do not impair the independence of the independent auditor. To implement the provisions of the SOX Act, the SEC issued rules specifying the types of services that an independent may not provide to its audit client, and governing the Audit Committee’s administration of the engagement of the independent auditor. As part of this responsibility, the Audit Committee is required to pre-approve the audit and non-audit services performed by the independent auditor in order to assure that they do not impair the auditor’s independence. Accordingly, the Audit Committee has adopted a pre-approval policy of audit and non-audit services (the “Policy”), which sets forth the procedures and conditions pursuant to which services to be performed by the independent auditor are to be pre-approved. Consistent with the SEC rules establishing two different approaches to pre-approving non-prohibited services, the Policy of the Audit Committee covers Pre-approval of audit services, audit-related services, international administration tax services, non-U.S. income tax compliance services, pension and benefit plan consulting and compliance services, and U.S. tax compliance and planning. At the beginning of each fiscal year, the Audit Committee will evaluate other known potential engagements of the independent auditor, including the scope of work proposed to be performed and the proposed fees, and will approve or reject each service, taking into account whether services are permissible under applicable law and the possible impact of each non-audit service on the independent auditor’s independence from management. Typically, in addition to the generally pre-approved services, other services would include due diligence for an acquisition that may or may not have been known at the beginning of the year. The Audit Committee has also delegated to any member of the Audit Committee designated by the Board or the financial expert member of the Audit Committee responsibilities to pre-approve services to be performed by the independent auditor not exceeding $25,000 in value or cost per engagement of audit and non-audit services, and such authority may only be exercised when the Audit Committee is not in session.
ITEM 15. EXHIBITS, FINANCIAL STATEMENT SCHEDULES | | (a) | The following documents are filed as part of this Report: |
| | | Reports of Independent Registered Public Accounting Firms |
| | | Consolidated Balance Sheets—December 31, 20092011 and 20082010 |
| | | Consolidated Statements of Operations—Years Ended December 31, 2009, 2008,2011, 2010, and 20072009 |
| | | Consolidated Statements of Stockholders’ Equity—Years Ended December 31, 2009, 2008,2011, 2010, and 20072009 |
| | | Consolidated Statements of Cash Flows—Years Ended December 31, 2009, 2008,2011, 2010, and 20072009 |
| Statements of Consolidated Comprehensive Income (Loss) – Years Ended December 31, 2011, 2010, and 2009 |
| | | Notes to Financial Statements |
| | 2. | Financial Statement Schedules |
| | | Schedule III—Real Estate and Accumulated Depreciation |
| | | Schedule IV—Mortgage Loan Receivables on Real Estate |
All other schedules are omitted because they are not applicable or because the required information is shown in the Consolidated Financial Statements or the Notes thereto.
| | 3. | Incorporated Financial Statements |
Consolidated Financial Statements of Income Opportunity Realty Investors, Inc. (incorporated by reference to Item 8 of Income Opportunity Realty Investors, Inc.’s Annual Report on Form 10-K for the year ended December 31,
2009.2012.
Consolidated Financial Statements of American Realty Investors, Inc. (incorporated by reference to Item 8 of American Realty Investors, Inc.’s Annual Report on Form 10-K for the year ended December 31,
2009)2012).
The following documents are filed as Exhibits to this Report:
| | | |
Exhibit
Number
| | |
Exhibit Number
| Description |
| 3.0 | | | Articles of Incorporation of Transcontinental Realty Investors, Inc., (incorporated by reference to Exhibit No. 3.1 to the Registrant’s Annual Report on Form 10-K for the year ended December 31, 1991). |
| 3.1 | | | Certificate of Amendment to the Articles of Incorporation of Transcontinental Realty Investors, Inc., (incorporated by reference to the Registrant’s Current Report on Form 8-K, dated June 3, 1996). |
| 3.2 | | | Certificate of Amendment of Articles of Incorporation of Transcontinental Realty Investors, Inc., dated October 10, 2000 (incorporated by reference to the Registrant’s Quarterly Report on Form 10-Q for the quarter ended September 30, 2000). |
| 3.3 | | | Articles of Amendment to the Articles of Incorporation of Transcontinental Realty Investors, Inc., setting forth the Certificate of Designations, Preferences and Rights of Series A Cumulative Convertible Preferred Stock, dated October 20, 1998 (incorporated by reference to Exhibit 3.1 to the Registrant’s Quarterly Report on Form 10-Q for the quarter ended September 30, 1998). |
| 3.4 | | | Certificate of Designation of Transcontinental Realty Investors, Inc., setting forth the Voting Powers, Designations, Preferences, Limitations, Restriction and Relative Rights of Series B Cumulative Convertible Preferred Stock, dated October 23, 2000 (incorporation by reference to the Registrant’s Quarterly Report on Form 10-Q for the quarter ended September 30, 2000). |
| 3.5 | | | Certificate of Designation of Transcontinental Realty Investors, Inc., Setting for the Voting Powers, Designating, Preferences, Limitations, Restrictions and Relative Rights of Series C Cumulative Convertible Preferred Stock, dated September 28, 2001 (incorporated by reference to Registrant’s Quarterly Report on Form 10-Q for the quarter ended September 30, 2001). |
| 3.6 | | | Articles of Amendment to the Articles of Incorporation of Transcontinental Realty Investors, Inc. Decreasing the Number of Authorized Shares of and Eliminating Series B Preferred Stock dated December 14, 2001 (incorporated by reference to Exhibit 3.7 to the Registrant’s Annual Report on Form 10-K for the year ended December 31, 2001). |
| 3.7 | | | By-Laws of Transcontinental Realty Investors, Inc. (incorporated by reference to Exhibit No. 3.2 to the Registrant’s Annual Report on Form 10-K for the year ended December 31, 1991). |
| 3.8 | Certificate of designation of Transcontinental Realty Investors, Inc. setting forth the Voting Powers, Designations, Preferences Limitations, Restrictions and Relative rights of Series D Cumulative Preferred Stock filed August 14, 2006 with the Secretary of State of Nevada (incorporated by reference to Registrants current report on Form 8-K for event dated November 21, 2006 at Exhibit 3.8 thereof. |
| 10.0 | Advisory Agreement dated as of April 30, 2011, between Transcontinental Realty Investors, Inc. and Pillar Income Asset Management LLC (incorporated by reference to Exhibit 10.0 to the Registrant’s Current Report on Form 8-K for event occurring April 30, 2011). |
| 10.1 | Leman Development Ltd. and Kaufman Land Partners, Ltd. (incorporated by reference to Registrant’s current report in Form 8-K dated November 21, 2006 at Exhibit 10.1 thereof. |
| 14.0 | Code of Ethics for Senior Financial Officers (incorporated by reference to Exhibit 14.0 to Registrant’s Annual Report on Form 10-K for the fiscal year ended December 31, 2004). |
| 21.0* | Subsidiaries of the Registrant. |
| 31.1* | Certification Pursuant to Rule 13a-14(a) under the Securities and Exchange Act of 1934 as amended of Principal Executive Officer. |
| 31.2* | Certification Pursuant to Rule 13a-14(a) under the Securities and Exchange Act of 1934 as amended of Principal Financial and Accounting Officer. |
| 32.1* | Certification Pursuant to 18 U.S.C. Section 1350, as Adopted Pursuant to Section 906 of the Sarbanes-Oxley Act of 2002 |
| 101 | Interactive data files pursuant to Rule 405 of Regulation S-T. |
_________________________
SIGNATURES
Pursuant to the requirements of Section 13 or 15(d) of the Securities Exchange Act of 1934, the registrant has duly caused this report to be signed on its behalf by the undersigned, thereunto duly authorized.
| | |
| | TRANSCONTINENTAL REALTY INVESTORS, INC. |
| | |
| Dated: March 29, 2013 | By: | /s/ GENE S BERTCHER |
| | Gene S. Bertcher Executive Vice President and Chief Financial Officer (Principal Financial and Accounting Officer) |
Pursuant to the requirements of the Securities Exchange Act of 1934, this report has been signed below by the following persons on behalf of the registrant and in the capacities and on the date indicated.
| | |
Signature | Title | Date |
| | |
/s/ HENRY A. BUTLER Henry A. Butler | Chairman of the Board and Director | March 29, 2013 |
| | |
/s/ SHARON HUNT Sharon Hunt | Director | March 29, 2013 |
| | |
/s/ ROBERT A. JAKUSZEWSKI Robert A. Jakuszewski | Director | March 29, 2013 |
| | |
/s/ TED R. MUNSELLE Ted R. Munselle | Director | March 29, 2013 |
| | |
/s/ DANIEL J. MOOS Daniel J. Moos | President and Chief Executive Officer (Principal Executive Officer) | March 29, 2013 |
| | |
/s/ GENE S. BERTCHER Gene S. Bertcher | Executive Vice President and Chief Financial Officer ( Principal Financial and Accounting Officer) | March 29, 2013 |
ANNUAL REPORT ON FORM 10-K
EXHIBIT INDEX
For the Year Ended December 31, 2012
| |
Exhibit Number | Description |
| 3.0 | Articles of Incorporation of Transcontinental Realty Investors, Inc., (incorporated by reference to Exhibit No. 3.1 to the Registrant’s Annual Report on Form 10-K for the year ended December 31, 1991). |
| 3.1 | Certificate of Amendment to the Articles of Incorporation of Transcontinental Realty Investors, Inc., (incorporated by reference to the Registrant’s Current Report on Form 8-K, dated June 3, 1996). |
| 3.2 | Certificate of Amendment of Articles of Incorporation of Transcontinental Realty Investors, Inc., dated October 10, 2000 (incorporated by reference to the Registrant’s Quarterly Report on Form 10-Q for the quarter ended September 30, 2000). |
| 3.3 | Articles of Amendment to the Articles of Incorporation of Transcontinental Realty Investors, Inc., setting forth the Certificate of Designations, Preferences and Rights of Series A Cumulative Convertible Preferred Stock, dated October 20, 1998 (incorporated by reference to Exhibit 3.1 to the Registrant’s Quarterly Report on Form 10-Q for the quarter ended September 30, 1998). |
| 3.4 | Certificate of Designation of Transcontinental Realty Investors, Inc., setting forth the Voting Powers, Designations, Preferences, Limitations, Restriction and Relative Rights of Series B Cumulative Convertible Preferred Stock, dated October 23, 2000 (incorporation by reference to the Registrant’s Quarterly Report on Form 10-Q for the quarter ended September 30, 2000). |
| 3.5 | Certificate of Designation of Transcontinental Realty Investors, Inc., Setting for the Voting Powers, Designating, Preferences, Limitations, Restrictions and Relative Rights of Series C Cumulative Convertible Preferred Stock, dated September 28, 2001 (incorporated by reference to Registrant’s Quarterly Report on Form 10-Q for the quarter ended September 30, 2001). |
| 3.6 | Articles of Amendment to the Articles of Incorporation of Transcontinental Realty Investors, Inc. Decreasing the Number of Authorized Shares of and Eliminating Series B Preferred Stock dated December 14, 2001 (incorporated by reference to Exhibit 3.7 to the Registrant’s Annual Report on Form 10-K for the year ended December 31, 2001). |
| 3.7 | By-Laws of Transcontinental Realty Investors, Inc. (incorporated by reference to Exhibit No. 3.2 to the Registrant’s Annual Report on Form 10-K for the year ended December 31, 1991). |
| 3.8 | Certificate of designation of Transcontinental Realty Investors, Inc. setting forth the Voting Powers, Designations, Preferences Limitations, Restrictions and Relative rights of Series D Cumulative Preferred Stock filed August 14, 2006 with the Secretary of State of Nevada (incorporated by reference to Registrants current report on Form 8-K for event dated November 21, 2006 at Exhibit 3.8 thereof. |
| 10.0 | | | Advisory Agreement dated as of October 1, 2003,April 30, 2011, between Transcontinental Realty Investors, Inc. and PrimePillar Income Asset Management LLC (incorporated by reference to Exhibit 10.0 to the Registrant’s Current Report on Form 8-K for event occurring October 1, 2003)April 30, 2011). |
| 10.1 | | | Inc. Leman Development Ltd. and Kaufman Land Partners, Ltd. (incorporated by reference to Registrant’s current report in Form 8-K dated November 21, 2006 at Exhibit 10.1 thereof. |
| 14.0 | | | Code of Ethics for Senior Financial Officers (incorporated by reference to Exhibit 14.0 to Registrant’s Annual Report on Form 10-K for the fiscal year ended December 31, 2004). |
21.0 | * | 21.0* | Subsidiaries of the Registrant. |
31.1 | * | | Certification Pursuant to Rule 13a-14(a) under the Securities and Exchange Act of 1934 as amended of Principal Executive Officer. |
31.2 | * | | Certification Pursuant to Rule 13a-14(a) under the Securities and Exchange Act of 1934 as amended of Principal Financial and Accounting Officer. |
32.1 | * | | Certification Pursuant to 18 U.S.C. Section 1350, as Adopted Pursuant to Section 906 of the Sarbanes-Oxley Act of 2002 |
SIGNATURES
Pursuant to the requirements of Section 13 or 15(d) of the Securities Exchange Act of 1934, the registrant has duly caused this report to be signed on its behalf by the undersigned, thereunto duly authorized.
| | | | |
| | | | TRANSCONTINENTAL REALTY INVESTORS, INC. |
| | |
Dated: March 31, 2010
| | By: | | /s/ GENE S BERTCHER
|
| | | | Gene S. Bertcher
Executive Vice President and Chief Financial Officer
(Principal Financial and Accounting Officer)
|
Pursuant to the requirements of the Securities Exchange Act of 1934, this report has been signed below by the following persons on behalf of the registrant and in the capacities and on the date indicated.
| | | | |
Signature
| | Title
| | Date
|
| | |
/s/ HENRY A. BUTLER
Henry A. Butler
| | Chairman of the Board and Director | | March 31, 2010 |
| | |
/s/ SHARON HUNT
Sharon Hunt
| | Director | | March 31, 2010 |
| | |
/s/ ROBERT A. JAKUSZEWSKI
Robert A. Jakuszewski
| | Director | | March 31, 2010 |
| | |
/s/ TED R. MUNSELLE
Ted R. Munselle
| | Director | | March 31, 2010 |
| | |
/s/ DANIEL J. MOOS
Daniel J. Moos
| | President and Chief Executive Officer (Principal Executive Officer)
| | March 31, 2010 |
| | |
/s/ GENE S. BERTCHER
Gene S. Bertcher
| | Executive Vice President and Chief Financial Officer ( Principal Financial and Accounting Officer)
| | March 31, 2010 |
ANNUAL REPORT ON FORM 10-K
EXHIBIT INDEX
For the Year Ended December 31, 2009
| | | |
Exhibit
Number
| | | Description
|
3.0 | | | Articles of Incorporation of Transcontinental Realty Investors, Inc., (incorporated by reference to Exhibit No. 3.1 to the Registrant’s Annual Report on Form 10-K for the year ended December 31, 1991). |
3.1 | | | Certificate of Amendment to the Articles of Incorporation of Transcontinental Realty Investors, Inc., (incorporated by reference to the Registrant’s Current Report on Form 8-K, dated June 3, 1996). |
3.2 | | | Certificate of Amendment of Articles of Incorporation of Transcontinental Realty Investors, Inc., dated October 10, 2000 (incorporated by reference to the Registrant’s Quarterly Report on Form 10-Q for the quarter ended September 30, 2000). |
3.3 | | | Articles of Amendment to the Articles of Incorporation of Transcontinental Realty Investors, Inc., setting forth the Certificate of Designations, Preferences and Rights of Series A Cumulative Convertible Preferred Stock, dated October 20, 1998 (incorporated by reference to Exhibit 3.1 to the Registrant’s Quarterly Report on Form 10-Q for the quarter ended September 30, 1998). |
3.4 | | | Certificate of Designation of Transcontinental Realty Investors, Inc., setting forth the Voting Powers, Designations, Preferences, Limitations, Restriction and Relative Rights of Series B Cumulative Convertible Preferred Stock, dated October 23, 2000 (incorporation by reference to the Registrant’s Quarterly Report on Form 10-Q for the quarter ended September 30, 2000). |
3.5 | | | Certificate of Designation of Transcontinental Realty Investors, Inc., Setting for the Voting Powers, Designating, Preferences, Limitations, Restrictions and Relative Rights of Series C Cumulative Convertible Preferred Stock, dated September 28, 2001 (incorporated by reference to Registrant’s Quarterly Report on Form 10-Q for the quarter ended September 30, 2001). |
3.6 | | | Articles of Amendment to the Articles of Incorporation of Transcontinental Realty Investors, Inc. Decreasing the Number of Authorized Shares of and Eliminating Series B Preferred Stock dated December 14, 2001 (incorporated by reference to Exhibit 3.7 to the Registrant’s Annual Report on Form 10-K for the year ended December 31, 2001). |
3.7 | | | By-Laws of Transcontinental Realty Investors, Inc. (incorporated by reference to Exhibit No. 3.2 to the Registrant’s Annual Report on Form 10-K for the year ended December 31, 1991). |
3.8 | | | Certificate of designation of Transcontinental Realty Investors, Inc. setting forth the Voting Powers, Designations, Preferences Limitations, Restrictions and Relative rights of Series D Cumulative Preferred Stock filed August 14, 2006 with the Secretary of State of Nevada (incorporated by reference to Registrants current report on Form 8-K for event dated November 21, 2006 at Exhibit 3.8 thereof. |
10.0 | | | Advisory Agreement dated as of October 1, 2003, between Transcontinental Realty Investors, Inc. and Prime Income Asset Management LLC (incorporated by reference to Exhibit 10.0 to the Registrant’s Current Report on Form 8-K for event occurring October 1, 2003). |
10.1 | | | Inc. Leman Development Ltd. and Kaufman Land Partners, Ltd. (incorporated by reference to Registrant’s current report in Form 8-K dated November 21, 2006 at Exhibit 10.1 thereof. |
14.0 | | | Code of Ethics for Senior Financial Officers (incorporated by reference to Exhibit 14.0 to Registrant’s Annual Report on Form 10-K for the fiscal year ended December 31, 2004). |
21.0 | * | | Subsidiaries of the Registrant. |
31.1 | * | 31.1* | Certification Pursuant to Rule 13a-14(a) and 15d-14 under the Securities Exchange Act of 1934, as amended of Principal Executive Officer. |
31.2 | * | 31.2* | Certification Pursuant to Rule 13a-14(a) and 15d-14 under the Securities Exchange Act of 1934, as amended of Principal Financial and Accounting Officer |
32.1 | * | 32.1* | Certification pursuant to 18 U.S.C. Section 1350. |
____________________________