Annual Report Pursuant to Section 13 or 15(d) of the Securities Exchange Act of 1934
OR Transition Report Pursuant to Section 13 or 15(d) of the Securities Exchange Act of 1934
_____

ADAPTEC,
| Delaware | ||
| 94-2748530 | ||
| (State | Incorporation) | (I.R.S. Employer Identification Number) |
691 S. Milpitas Blvd.
Milpitas, California 95035
| Securities registered pursuant to Section 12(g) of the Act: | ||
| Common Stock, $.001 | ||
Securities registered pursuant to Section 12(g) of the Act:None
Large accelerated filer ¨ Accelerated filer x Non-accelerated filer ¨
(Do not check if a smaller reporting company) Smaller reporting company ¨
Large accelerated filer £ | Accelerated filer S |
Non-accelerated filer £ (Do not check if a smaller reporting company | Smaller reporting company £ |
At May 12, 2010, the Registrant had 120,396,971 shares of common stock outstanding, $.001 par value per share.
outstanding.
Portions
Stockholders.
For your convenience,
Description
We currently provide innovative data center I/O solutions that protect, accelerate, optimize, and condition data in today’s most demanding data center environments. Our products are used in IT environments ranging from traditional enterprise environments to fast growing, on-demand cloud computing data centers. Our products enable data center managers, channel partners and OEMs to deploy best-in-class storage solutions to meet their customers’ evolving IT and business requirements. Aroundreflect the world, leading corporations, government organizations, and medium and small businesses trust Adaptec technology. Our software and hardware products include ASICs, HBAs, RAID controllers, Adaptec RAID software, storage management software, storage virtualization software and other solutions that span SCSI, SAS, SATA and iSCSI interface technologies,
3
including both hard disk and solid state drives. System integrators and white box suppliers build server and storage solutions based on Adaptec technology to deliver products with superior price and performance, data protection and interoperability to their clients and customers.
Reverse/Forward Split.
Business Outlook
In December 2009, we announced the retention of Blackstone Advisory Partners L.P. to serve as our exclusive financial advisor relating to a potential sale or disposition of certain of our assets or business operations. On May 8, 2010, subsequent to our fiscal year-end, we entered into an Asset Purchase Agreement with PMC-Sierra, Inc., or PMC-Sierra for the sale of certain assets and for PMC-Sierra to assume certain liabilities related to our business of providing data storage hardwareASICs, and software solutions and products including ASICs, HBAs, RAID controllers, Adaptec RAID software, Adaptec RAID code, or ARC, storage management software including Adaptec Storage Manager or ASM, option ROM BIOS, command line interface or CLI, storage virtualization software, and other solutions that span SCSI, SAS, and SATA interface technologies, and that optimize the performance of both hard disk and solid state drives, for a purchase price of approximately $34 million. In this Annual Reportto original equipment manufacturers. Currently, we are primarily focused on Form 10-K, we refer to the transactions contemplated by the Asset Purchase Agreement with PMC-Sierra as the PMC Transaction. Assuming satisfaction of the closing conditions in the Asset Purchase Agreement with PMC-Sierra, we anticipate that the PMC Transaction will be consummated in June 2010. As we continue to proceed with certain specific and other customary closing conditions necessary to consummate the PMC Transaction, we remain committed to providing service and support for our existing customers and end-users. Whether or not the PMC Transaction is consummated, our revenues may be negatively impacted during this pre-closing period as the transaction creates uncertainty in the marketplace for our existing customers and end-users, who may be less likely to place orders with us as a result of this uncertainty.
Assuming the PMC Transaction is consummated, we intend to explore all strategic alternatives to maximize stockholder value going forward, including deploying the proceeds of the PMC Transaction and our other assets in seeking business acquisition opportunities and other actions to redeploy our capital. Additionally, we will, as previously announced, continue to consider our options related to those products and technology obtained from our acquisition of Aristos Logic Corporation, or Aristos, which we refer to in this Annual Report on Form 10-K as our Aristos products, as well as our other remaining operating assets, including non-core patents and real estate holdings. With respect to our Aristos products, options that we may consider include (i) ceasing to invest additional funds in our Aristos products, winding-down the sale of our Aristos products and fulfilling our remaining contractual obligations with our existing customers, which we would expect to be completed in six months, or by September 2010, or (ii) seeking to sell the assets related to our Aristos products to a third party. We will also explore alternatives for maximizing the value of our non-core patent portfolio and remaining real estate assets. Following and assuming the consummation of the PMC Transaction, we remain committed to providing value to all of our stockholders and will aggressively pursue opportunities to deploy the significant cash and liquid assets on hand to create value for our stockholders, including exploring opportunities to deploy this cash and liquid assets to make acquisitions of businesses that will maximize stockholder value and/or engaging in stock buybacks and cash dividends. Going forward our business is expected to consist of capital redeployment and identification of new profitable business operations in which we can utilize our existing working capital and maximize the use of our net tax operating losses or NOLs.
If(“NOLs”) in the future. The identification of new business operations includes, but is not limited to, the oilfield services, sports, training, education, entertainment, and lifestyle businesses. During our fiscal year ended December 31, 2012, we consummate the PMC Transaction discussed above,acquired two oilfield services businesses (Eagle Well Services and Sun Well Service, Inc.) and two sports-related businesses (CrossFit South Bay and CrossFit Torrance). During our fiscal year ended December 31, 2011, we acquired two sports-related businesses (Baseball Heaven and The Show) and one oilfield services business (Rogue Pressure Services Ltd). We currently operate in these two reportable segments, Steel Sports and Steel Energy, but may incur significant chargesadd other segments in the future depending upon acquisition opportunities to further redeploy our working capital.
restructuring charges, accelerationoutstanding common stock. Both BNS and we appointed a special committee of compensation expense relatedindependent directors to unvested stock-based awards, potential cash bonus paymentsconsider and potential accelerated payments of certain of our contractual obligations, which may impact our results of operations and financial condition. The aggregate of these amounts cannot be quantified at this time. Further subsequent event disclosures related to expected changes tonegotiate the remaining useful lives of our long-lived assets, stock-based activity and associated compensation expense, and restructuring charges are discussed in Note 7, 9 and 11, respectively, to the Consolidated Financial Statements.
Except where noted, the discussion regarding our business in this Annual Report on Form 10-K is as of March 31, 2010. Astransaction because of the dateownership interest held by Steel Partners in each company.
Products Overview
WeWell Services was combined with Sun Well and both businesses now operate in one segment. For an analysis of financial information about our geographic areas, see “Note 19—Segment, Geographicas Sun Well and Significant Customer Information” to the Consolidated Financial Statementsare included in “Item 8: Financial StatementsSteel Energy.
We currentlythe newly formed CrossFit Torrance. As part of the transaction, we also agreed to loan CrossFit Torrance up to $1.1 million to fund leasehold improvements and equipment. Both CrossFit companies provide data protection storagestrength and conditioning services and are included in Steel Sports.
Components.
RAID Controllers and HBAs. We offer a wide range of HBAs and RAID controllers for use with SATA, SAS and Parallel SCSI drives, including our line of Unified Serial® cards, which can be used with both SATA and SAS drives, including Solid State Drives. The SATA and SAS technologies are offered in our Series 1, Series 2, Series 3, Series 5 and Series 5Z families. Our SATA products provide a flexible solution for cost effective, high capacity drives. Unified Serial RAID Controllers support both SATA and SAS disk drives with the same architecture to meet the need for maximum performance, reliability, scalability, and flexibility for enterprise-class applications, including NAS, online transaction processing, web, digital surveillance, and streaming applications. Our family of products is designed to meet evolving storage needs by providing high performance, reliable storage management tools, hardware and software compatibility and high levels of support. Our Series 5Z products, which were introduced in fiscal 2010, reduce the cost of data center maintenance by eliminating the need to monitor battery charge levels, service battery modules or power down servers for battery replacement. While we have used our own ASICs in these products in the past, our latest generation of products uses ROC technology from Intel Corporation. Our controller cards include 4, 8, 16, 20 and 28-port designs, which help end users simplify the design of their solutions.
Host I/O. Driven by market needs for capacity and data protection, the host I/O interfaces support various connectivity requirements between the central processor and internal and external peripherals, including external storage and tape devices. Our host I/O products provide customers with high-speed PCI-X, PCIe, SCSI, SAS or SATA connectivity. These technologies can be applied to a variety of applications, including storage of email, medical records, digital images, and records of financial transactions.
RSP.RSPs, which are related to our Aristos products, are ASIC devices incorporating a collection of hardware engines that fully automate the operation of the data path and eliminate the performance bottlenecks found in other silicon-based software RAID solutions. Our RSP products provide our customers with cost- and energy-efficiencies in data protection without compromising performance. Our primary markets include Blade Servers and External Storage applications where high performance and high availability features are required.
Data Center Data Conditioning Features. Our Intelligent Power Management technology allows users to reduce their power consumption without impacting storage performance providing a green footprint to public and private cloud data centers. Our MaxIQ SSD Cache Performance Solution, introduced in fiscal 2010, maximizes performance while minimizing capital and operating costs by utilizing both solid state drives and hard disk drives, to create High-Performance Hybrid Arrays.
5
Software.
Our products incorporate software that simplifies data management and protection for businesses of all sizes. We distribute the software through various methods.
Host RAID. We license our host RAID technology, which allows our customers to leverage the I/O components already incorporated on their server chipsets to connect them with RAID-providing low cost data protection. Host RAID enables customers not only to protect their data drives but also to include protection for the boot drives.
The following software products are available in combination with hardware or can be purchased as an upgrade.
RAID. Our RAID technology reduces a customer’s dependence on the reliability of a single disk drive by encoding data across multiple drives. We apply our RAID technology independent of the disk drive interface to provide data protection on SCSI, SATA and SAS disk drives. This independence enables our RAID software, firmware and hardware to be available across the full spectrum of servers from entry to enterprise.
Adaptec Storage Manager. Adaptec Storage Manager is a single storage management utility that enables customers and IT managers to easily manage storage across DAS environments, create storage solutions and protect data (RAID) from disk drive failure. Standard features that are included with our SATA or SAS RAID controllers allow our products to deliver a high level of data protection.
Other Software. We provide software development kits and command line interface tools to help simplify storage management and provide manufacturing tools to simplify the integration of our products into customer solutions.
services.
We sell our products
We also sell through our sales force to distribution channels worldwide, which market our products under the Adaptec brand; they, in turn, sell to VARs, system integrators and retail customers. We provide training and support for our distribution customers and to VARs. We also sell board-based products and provide technical support to end users worldwide through major computer-product retailers. Sales to distribution customers accounted for approximately 65%made up 86% of our total net revenues in fiscal 2010. Our primary distributors in fiscal 2010, in alphabetical order, were Bell Microproducts, CPI Computer Partner Handels GmbH, Ingram Micro, Synnex and Tech Data.
We emphasize customer service as a key element of our marketing strategy and maintain application engineers at our corporate headquarters and in the field. This includes assisting current and prospective2012. No customers in the use of our products, and providing the systems-level expertise and software experience of our engineering staff to customers with particularly difficult design problems. A high level of customer service is also maintained through technical support hotlines, email and dial-in-fax capabilities.
A small number of our customers account for a substantial portion of our net revenues. In fiscal 2010, IBM, Bell Microproducts and Ingram Micro accounted for 17%, 16% and 15% of our total net revenues, respectively. In fiscal 2009, IBM accounted for 36% of our total net revenues. In fiscal 2008, IBM accounted for 40% of our total net revenues.
International
We currently maintain operations in four countries and sell our products in additional countries through various representatives and distributors. We believe this geographic diversity allows us to draw on business and technical expertise from an international workforce, provides stability to our operations, diversifies revenue streams to offset geographic economic trends and offers us an opportunity to penetrate new markets.
A summarycomprised 10% or more of our net revenues in fiscal 2011.
Competition
The markets for all of our products are highly competitive and are characterized by rapid technological advances, frequent new product introductions, evolving industry and customer standards and competitive pricing pressures.
We believe the principal competitive factorsOctober 2012 resulted in the markets for our productscancellation of scheduled tournaments. We are product price versus performance, product featurescurrently constructing an indoor facility to increase utilization rates. CrossFit South Bay and functionality, reliability, technical serviceTorrance are expected to be less affected by seasonal factors but will have to compete against other established gyms in the area.
Backlog
We typically receive orders for our products within two weeks or less of the desired delivery date, and most ordersEnvironmental Factors
Manufacturing
We outsourcecondition, it is possible that substantial costs for compliance or penalties for non-compliance may be incurred in the manufacturingfuture.
Intellectual Property
We seek to establish and maintain our proprietary rights in our technology and products through the use of patents, copyrights, trademarks and trade secret laws. As of March 31, 2010, we had 465 issued patents, expiring between February 2011 and October 2027, covering various aspects of our technologies.stormwater. In addition, the Adaptec nameOil Pollution Act of 1990 imposes a multitude of requirements on responsible parties related to the prevention of oil spills and logoliability for damages resulting from such spills in the waters of the United States. These and similar state laws provide for administrative, civil and criminal penalties for unauthorized discharges and impose stringent requirements for spill prevention and response planning, as well as considerable potential liability for the costs of removal and damages in connection with unauthorized discharges.
7
Research and Development
The high technology industry is characterized by rapid technological innovation, evolving industry standards, changes in customer requirements and new product introductions and enhancements. Our future performance will depend in large part on our ability to maintain and enhance our current product line and to develop new products that achieve market acceptance, maintain competitiveness and meet an expanding range of customer requirements. To achieve these objectives, we may continue to leverage our technical expertise and product innovation capabilities to address storage-access products across a broad range of users and platforms. We may also enter into strategic alliances or partnerships where appropriate. We entered into a three-year strategic development agreement with HCL Technologies Limited, or HCL, to provide product development and engineering services for our product portfolio. However, the three-year strategic development agreement with HCL will be transferred to PMC-Sierra if the PMC Transaction is consummated.
Approximately 45% of our employees were engaged in research and development at March 31, 2010 as compared to 44% and 42% at March 31, 2009 and 2008, respectively. Our research and development expenses were $29.5 million, or 40% of total net revenues, $26.9 million, or 23% of total net revenues, and $34.0 million, or 23% of total net revenues, for fiscal years 2010, 2009 and 2008, respectively. Research and development expenses primarily consist of salaries and related costs of employees engaged in ongoing research, design and development activities and subcontracting costs.
Environmental Laws
Certain of our operations involve the use of substances regulated under various federal, state and international environmental laws. It is our policy to apply strict standards for environmental protection to sites inside and outside the United States, even if not subject to regulations imposed by local governments. The liability for environmental remediation and related costs is accrued when it is considered probable and the costs can be reasonably estimated. Environmental costs are presently not material to our operations or financial position.
Employees
As of March 31, 2010, we had a total of 187 employees, which excludes outsourced partners. Overall employee headcount declined by 19% in fiscal 2010 compared to fiscal 2009, and headcount declined by 41% in fiscal 2009 compared to fiscal 2008. We had a total of 232 and 391 employees at the end of fiscal 2009 and 2008, respectively. We expect our employee headcount to decline significantly if the PMC Transaction is consummated.
We believe that we currently have favorable employee relations. None of our employees are represented by aany collective bargaining agreement, nor have we ever experienced work stoppages.
agreements.
occur, occurs, our business, financial condition or results of operations could suffer, and the trading price of our common stock could decline. The risk factors outlined below include
Risks Related to Consummation of the PMC Transaction
If we do not complete the proposed sale of certain assets related to our business operations to PMC-Sierra, the continued operations of our business may result in losses from operations until an alternate course of action can be implemented. On May 8, 2010, subsequent to our fiscal year-end, we entered into an Asset Purchase Agreement with PMC-Sierra for the sale of certain of our assets related to our business operations. Assuming satisfaction of the closing conditions contained in the Asset Purchase Agreement with PMC-Sierra, we anticipate consummating this transaction in June 2010. Until the consummation of the PMC Transaction, we intend to continue operating our business, subject to the consent of PMC-Sierra as required in certain circumstances pursuant to the Asset Purchase Agreement. This includes seeking growth opportunities beyond those presented by our existing product lines by entering into strategic alliances or partnerships to grow our businessacquiring and increase our operating performance; however, we may not succeed in these efforts. The Asset Purchase Agreement with PMC–Sierra places a requirement of PMC-Sierra consent in certain specific circumstances with respect to our ability to operate, dispose of and maintain the assets subject to the PMC Transaction. The Asset Purchase Agreement with PMC-Sierra also includes closing conditions, which include among others (i) required regulatory approvals, (ii) absence of any law or order prohibiting closing, (iii) the absence of any change, development or event that would reasonably be expected to have a material adverse effect on the assets being purchased, (iv) certain third party consents, (v) the release of any non-excepted security interests in the assets being purchased, (vi) the absence of any proceedings which could reasonably challenge, restrain, prohibit or make illegal the PMC Transaction, (vii) the delivery of a legal opinion by our legal counsel in Delaware, (viii) the acceptance by certain employees of PMC-Sierra’s offers of employment, (ix) the accuracy of the representations and warranties of the parties, and (x) compliance by the parties with their obligations. If the PMC Transaction is not consummated, we may continue to incur operating losses until we can implement an alternate course of action, and we may also be adversely affected by negative market perceptions, which may have a material adverse effect on our financial results, including the loss of customers and employees. We may also be required to record impairment charges for our long-lived assets in the future.
If the PMC Transaction is not consummated, we will have incurred substantial costs that may adversely affect our business, financial condition and results of operations and the market price of our common stock. We have incurred and will incur substantial transaction costs and expenses in connection with the PMC Transaction. These costs are primarily associated with the fees of our financial advisors and attorneys. Management resources may be diverted in an additional effort to consummate the PMC Transaction, and we are subject to obtaining PMC-Sierra consent in certain specific circumstances with regards to the conduct of our business prior to closing the PMC Transaction. Further, the closing of the PMC Transaction is subject to closing conditions contained in the Asset Purchase Agreement with PMC-Sierra on the conduct of our business. If the PMC Transaction is not consummated, we will have incurred significant costs for which we will have received little or no benefit. In addition, if the PMC Transaction is not consummated, we may experience negative reactions from the financial markets and our stockholders, potential investors, customers and employees. Each of these factors may also adversely affect the trading price of our common stock and our business, financial condition and results of operations.
The pending PMC Transaction may create uncertainty for our customers and employees. While the PMC Transaction is pending, customers may delay or defer decisions to purchase our products and existing customers may experience uncertainty about our products. This may adversely affect our ability to gain new customers and retain existing customers, whichintegrating businesses could adversely affect our business, financial condition and resultsoperations. Acquisitions are a key element of operations. In addition, because of the uncertainty regarding our operations, customers may not order our products even if the PMC Transaction is not consummated. Even though we have implemented retention programs with our employees, current employees may experience uncertainty about their relationship with us, and key employees may depart because of issues relating to the uncertainty and difficulty involved in our continued operations. The loss of key employees could adversely affect our business financial condition and results of operations.
9
Risks Associated with Operations after Consummation of the PMC Transaction
If we are successful in consummating the PMC Transaction, our operating results and financial condition may be impacted by significant charges. If the PMC Transaction is consummated, it is likely that we will incur significant charges, at such time.strategy. We believe our potential exposure may include, but is not limited to, the following:
increased amortization or depreciation of our long-lived assets due to potential changes to the expected remaining useful lives;
potential impairment of our long-lived assets;
restructuring charges;
acceleration of compensation expense related to unvested stock-based awards;
potential cash bonus payments; and,
potential accelerated payments of certain of our contractual obligations.
Such charges, which we cannot quantify at this time, are likely to adversely impact our results of operations and financial condition.
We will likely incur significant restructuring expenses in the near future. Subsequent to our fiscal year-end, we approved a restructuring plan to reduce our operating expenses. We expect to complete our actions by December 2010, which is primarily contingent upon the consummation of the PMC Transaction, including the expected transition services we are required to provide to PMC-Sierra. The restructuring charges to be incurred will primarily result in cash expenditures related to severance and related benefits, and to a lesser extent, exiting certain operating facilities and disposing excess assets. In an effort to continue saving operational costs subsequent to our fiscal year-end, we notified certain of our engineering employees and provided them one-time severance benefits of approximately $1.8 million, which is expected to be recorded in the first quarter of fiscal 2011, as we intend to outsource our ASIC and silicon needs. We cannot quantify the remaining impact of this restructuring plan to our Consolidated Statements of Operations at this time as the remaining restructuring actions are contingent upon the consummation of the PMC Transaction. Moreover, we could encounter delays in executing our restructuring plan, which could cause further disruption and additional unanticipated expense to our Consolidated Statements of Operations in the near future.
If the PMC Transaction is consummated, the NASDAQ Stock Market may determine that we are operating as a “public shell” and may decide to subject us to delisting proceedings or additional and more stringent continued listing criteria. If the PMC Transaction is consummated, the NASDAQ Listings Qualification Panel may determine that after such sale we are a “public shell” company. While the NASDAQ Stock Market has no bright-line or qualitative test for determining whether a particular company is a “public shell,” the exchange has expressed the opinion that the securities of companies operating as “public shells” may be subject to market abuses or other volatile conduct that is detrimental to the interests of the investing public. The NASDAQ Stock Market has defined a public shell as a company with no or nominal operations and either no or nominal assets, assets consisting solely of cash and cash equivalents, or assets consisting of any amount of cash and cash equivalents and nominal other assets. Should the PMC Transaction close, the NASDAQ Listing Qualifications Panel may perform a facts and circumstances analysis to determine whether they believe we are a “public shell.” Listed companies determined to be “public shells” by the NASDAQ Listings Qualification Panel may be subject to delisting proceedings or additional and more stringent continued listing criteria. If our common stock were delisted from the NASDAQ Global Market, liquidity in our shares and the trading prices of our shares could be negatively impacted.
Should the PMC Transaction be consummated and our other operating assets sold, written-off or disposed of, we may be considered a “shell company” under federal securities laws and may become subject to more stringent reporting requirements. Under Rule 405 of the Securities Act and Exchange Act Rule 12b-2, a shell company is defined as an entity that has no or nominal operations and either (a) no or nominal assets; (b) assets consisting solely of cash and cash equivalents; or (c) assets consisting of any amount of cash and cash
equivalents and nominal other assets. Should the PMC Transaction be consummated, depending on our future activities and operations, we may be deemed a “shell company” under the federal securities laws and regulations. The Securities and Exchange Commission’s rules prohibit the use of Form S-8 for the registration of shares under equity incentive plans by a shell company and require a shell company to file a Form 8-K to report the same type of information that would be required if it were filing to register a class of securities under the Exchange Act whenever the shell company is reporting the event that caused it to cease being a shell company. Being a shell company may adversely impact our ability to offer our stock to officers, directors and consultants, and thereby make it more difficult to attract and retain qualified individuals to perform services for us, and will likely increase the costs of registration compliance following the completion of a business combination.
If the PMC Transaction is consummated and depending on our future activities and operations, we may be deemed an investment company, which could impose on us burdensome compliance requirements and restrict our activities, which may make it difficult for us to complete future business combinations or acquisitions. The Investment Company Act of 1940, as amended, or the Investment Company Act, requires registration, as an investment company, of companies that are engaged primarily in the business of investing, reinvesting, owning, holding or trading securities. Generally, companies may be deemed investment companies under the Investment Company Act if they are viewed as engaging in the business of investing in securities or they own investment securities having a value exceeding 40% of certain assets. After the consummation of the PMC Transaction and depending on our future activities and operations, we may become subject to the Investment Company Act. While Rule 3a-2 of the Investment Company Act provides an exemption that allows companies that may be deemed investment companies but that have a bona fide intent to engage primarily in a business other than that of investing in securities up to one year to engage in such other business activity, we may not qualify for this or any other exemption under the Investment Company Act. If we are deemed to be an investment company under the Investment Company Act, we may be subject to certain restrictions that may make it difficult for us to complete a business combination, including:
restrictions on the nature of and custodial requirements for holding our investments; and
restrictions on our issuance of securities which may make it difficult for us to complete a business combination.
In addition, we may have imposed upon us burdensome requirements, including:
registration as an investment company;
adoption of a specific form of corporate structure; and
reporting, record keeping, voting, proxy and disclosure requirements and other rules and regulations.
If we become subject to the Investment Company Act, compliance with these additional regulatory burdens would require additional costs and expenses. There can be no assurance that we will not be deemed to be an investment company, as defined under Sections 3(a)(1)(A) and (C) of the Investment Company Act or that we will qualify for the exemption under Rule 3a-2 of the Investment Company Act.
If the carrying value of our long-lived assets is not recoverable, an impairment loss must be recognized which would adversely affect our financial results. Certain events or changes in circumstances would require us to assess the recoverability of the carrying value amount of our long-lived assets. With the announcement made by us in December 2009 that we initiated a process to pursue the potential sale or disposition of certain of our assets or business operations, we evaluated our long-lived assets to determine whether the carrying value would be recoverable. As we continued through this sale process on certain of our assets or business operations in the fourth quarter of fiscal 2010, we reevaluated the recoverability of our long-lived assets’ carrying value at March 31, 2010. Based on our analysis, our long-lived assets were not considered impaired in either the third or fourth quarters of fiscal 2010 as the sum of the expected undiscounted future cash flows exceeded the carrying value of our long-lived assets of $ $27.4 million at March 31, 2010. However, if the PMC Transaction is consummated, the carrying value of our remaining long-lived assets may not be recoverable in the future whether or not we decide to continue our efforts in the sale of the Aristos products or wind down or dispose of the Aristos products. As a result, if certain events or changes in circumstances arise, we may be required to record
11
impairment charges for our long-lived assets in future periods or shorten the remaining useful life of our long-lived assets, which would require us to record higher amortization or depreciation expense in future periods.
If our common stock becomes subject to the SEC’s penny stock rules, broker-dealers may experience difficulty in completing customer transactions and trading activity in our securities may be adversely affected. Our common stock may become a “penny stock” pursuant to Rule 3a51-1 of the Exchange Act. Broker-dealer practices in connection with transactions in penny stocks are regulated by certain penny stock rules adopted by the SEC. Penny stocks generally are defined as equity securities with a price of less than $5.00 per share, with certain exemptions. The penny stock rules require a broker-dealer, prior to purchase or sale of a penny stock not otherwise exempt from the rules, to deliver to the customer a standardized risk disclosure document that provides information about penny stocks and the risks associated with the penny stock market. The broker-dealer also must provide the customer with current bid and offer quotations for the penny stock, the compensation of the broker-dealer and its salesperson in the transaction, and monthly account statements showing the market value of each penny stock held in the customer account. In addition, the penny stock rules generally require that, prior to a transaction in a penny stock, the broker-dealer make a special written determination that the penny stock is a suitable investment for the purchaser and receive the purchaser’s written agreement to the transaction. These disclosure requirements may have the effect of reducing the level of trading activity in the secondary market of a stock that becomes subject to the penny stock rules.
If the PMC Transaction is consummated, failure to successfully identify and enter into a new line of business or identify possible acquisition candidates could cause our stock price to decline. If the PMC Transaction is consummated, we expect to pursue actively a new line of business operations and to explore all strategic alternatives to maximize stockholder value going forward, including deploying the proceeds of the PMC Transaction and our other assets in seeking business acquisition opportunities and other actions to redeploy our capital, while we manage our remaining operations. In relation to pursuing such strategic alternatives and new business acquisition opportunities, our stock price may decline due to any or all of the following potential occurrences:
we may not be able to identify a profitable new lineand acquire acceptable acquisition candidates on favorable terms in the future. We may be required to issue equity securities in connection with future acquisitions, which could result in dilution of business or deploystockholders. Acquisitions may not perform as expected when the acquisition was made and may be dilutive to our overall operating results. We face additional acquisition risks, such as:
| · | retaining and attracting key employees; | ||||||||
| · | retaining and attracting new customers; | ||||||||
| · | increased administrative burden; | ||||||||
| · | developing our sales and marketing capabilities; | ||||||||
| · | managing our growth effectively; | ||||||||
| · | integrating operations; | ||||||||
| · | operating a new line of business; and | ||||||||
| · | increased logistical problems common to large, expansive operations. | ||||||||
we may notbusiness could be able to find suitable acquisition candidates or may not be able to acquire suitable candidates with our limited financial resources;
we may not be able to utilize our existing NOLs to offset future earnings;
we may have difficulty retaining our key remaining employees; and
we may have difficulty retaining our Board of Directors or attracting suitable qualified candidates should a current director resign.
There can be no assurance that we will be able to identify suitable acquisition candidates or business and investment opportunities once the PMC Transaction is consummated. We have incurred recurring operating losses related to our operations since 2001 (other than during 2004). If the PMC Transaction is consummated, we intend to explore strategic alternatives and identify new business acquisition opportunities in which we may utilize our NOLs. There is no guarantee that we will be able to identify such new business acquisition opportunities or strategic alternatives in which we may redeploy our assets and the proceeds of the PMC Transaction. If we are unable to identify new business opportunities or acquire suitable acquisition candidate(s), we may continue to incur operating losses and negative cash flows, and our results of operations and stock price may suffer.
Following the consummation of the PMC Transaction, ourOur stockholders may be subject to the broad discretion of management. Should the PMC Transaction be consummated, we will have limited operating assets,management and our business strategy will involve identifyingBoard of Directors. As we continue to identify new businessbusinesses and investment opportunities. Ouropportunities, our stockholders may not have an opportunity to evaluate the specific merits or risks of any such proposed transactions or investments. As a result, our stockholders may be dependentdepend on the broad discretion and judgment
of management and our Board of Directors in connection with the application of our capital and the selection of acquisition or investment targets. There can be no assurance that determinations ultimately made by us will permit us to achieve profitable operations.
We will incur significant costs in connection with our evaluation of new business opportunities and suitable acquisition candidates. If the PMC Transaction is consummated, our management intends to identify, analyze and evaluate potential new business opportunities, including possible acquisition and merger candidates. We will incur significant costs, such as due diligence and legal and other professional fees and expenses, as part of these efforts. Notwithstanding these efforts and expenditures, we cannot give any assurance that we will identify an appropriate new business opportunity, or any acquisition opportunity, in the near term, or at all.
We will likely have no operating history in our new line of business, which is yet to be determined, and therefore we will be subject to the risks inherent in establishing a new business. We have not identified what our new line or lines of business will be and, therefore, we cannot fully describe the specific risks presented by such business. It is likely that we will have had no operating history in the new line of business, and it is possible that any company we may acquire will have a limited operating history in its business. Accordingly, there can be no assurance that our future operations will generate operating or net income, and as such our success will be subject to the risks, expenses, problems and delays inherent in establishing a new line of business for us. The ultimate success of such new business cannot be assured.
We may be unable to realize the benefits of our NOLs. NOLs may be carried forward to offset federal and state taxable income in future years and eliminate income taxes otherwise payable on such taxable income, subject to certain limits and adjustments. Based on current income tax rates, our NOLs and other carry-forwards could provide a benefit to us, if fully utilized, of significant future tax savings. However, our ability to use these tax benefits in future years will depend upon our ability to comply with the rules relating to the use of NOLs and the amount of our otherwise taxable income. If we do not have sufficient taxable income in future years to use the tax benefits before they expire, we will lose the benefit of these NOLs permanently. Consequently, our ability to use the tax benefits associated with our NOLs will depend significantly on our success in identifying suitable new business opportunities and acquisition candidates that maximize our NOLs, and once identified, successfully becoming established in this new business line or consummating such an acquisition.
Additionally, if we underwent an ownership change, the NOLs would be subject to an annual limit on the amount of the taxable income that may be offset by our NOLs generated prior to the ownership change. If an ownership change were to occur, we may be unable to use a significant portion of our NOLs to offset taxable income.
The amount of NOLs that we have claimed has not been audited or otherwise validated by the U.S. Internal Revenue Service, or the IRS. The IRS could challenge our calculation of the amount of our NOLs, and our
13
determinations as to when a prior change in ownership occurred, and other provisions of the Internal Revenue Code, may limit our ability to carry forward our NOLs to offset taxable income in future years. If the IRS was successful with respect to any such challenge, the potential tax benefit of the NOLs to us could be substantially reduced.
We may issue a substantial amount of our common stock in the future which could cause dilution to our stockholders and otherwise adversely affect our stock price.A key element of our Our current primary business strategy will beis to make acquisitions. While we may make acquisition(s) in whole or in part with cash, as part of such strategy, we may issue additional shares of common stock as consideration for such acquisitions. These issuancesacquisition(s), which could be significant. To the extent that we make acquisitions and issue our shares of common stock as consideration, our existing stockholders’ equity interest may be diluted. Any such issuance will also increase the number of outstanding shares of common stock that will be eligible for sale in the future. Persons receiving shares of our common stock in connection with these acquisitions may be more likely to sell off their common stock, which may influence the price of our common stock. In addition, the potential issuance of additional shares in connection with anticipated acquisitions could lessen demand for our common stock and result in a lower price than might otherwise be obtained. We may also issue common stock in the future for other purposes as well, including in connection with financings, for compensation purposes, in connection with strategic transactions or for other purposes.purposes, including in connection with financings.
Risk Factors Related to Operations Should the PMC Transaction not be Consummated
As our revenue base continues to decline from our current operations,securities, which we may choose to exit or divest some or all of our current operations to focus on new opportunities. Should the PMC Transaction not be consummated, our management team will continue to review and evaluate our product portfolio, operating structure, and markets to determine the future viability of our existing products and market positions, including any possible alternative transaction(s), and the possible future divestitureuse as consideration in an alternate transaction of certain of our assets ora business operations, should it be determined that the infrastructure and expenses necessary to sustain our existing business or product offerings are greater than the potential contribution margin that will be obtainable in the future. As a result,combination.
| · | registration as an investment company; | |||
| · | adoption of a specific form of corporate structure; and | |||
| · | reporting, record keeping, voting, proxy and disclosure requirements and other rules and regulations. | |||
loss of customers;
reduced revenue base;
increased dependency on suppliers;
inability to obtain products or services in a timely manner for competitive prices;
increased operating costs;
employee attrition;
impairment of our long-lived assets;
material restructuring charges; and
loss of liquidity.
In the past, we have depended on a small number of large OEM customers for a significant portion of our revenues, and we may not be successful in obtaining new OEM designs wins, which may prevent us from sustaining or growing our revenues from OEM customers.We have evaluated the OEM portion of our business, and, should the PMC Transaction not be consummated, we are likely to focus many of our efforts on our channel business opportunities and selectively or opportunistically pursue future business from OEM customers with our current product portfolio, as we believe the future growth opportunities with OEMs for most of our current products are limited. While we gained some new OEM business and opportunities for products containing unified serial technologies as a result(C) of the Aristos acquisitionInvestment Company Act or that have resulted in sales, we believe such sales are unlikely to offsetwill qualify for the decline in OEM sales from our legacy products in the future as we continue to consider our options to sell, exit or divest our Aristos products.
We depend on a few key customers and the loss of any of them could significantly reduce our net revenues. Historically, a small number of our customers have accounted for a significant portion of our net revenues. For example, in fiscal 2010, IBM, Bell Microproducts and Ingram Micro accounted for 17%, 16% and 15% of our total net revenues, respectively, and in fiscal years 2009 and 2008, IBM accounted for 36% and 40% of our total net revenues, respectively. We believe that our major customers continually evaluate whether or not to purchase products from alternate or additional sources. Additionally, our customers’ economic and market conditions frequently change, and many of our customers may be negatively impacted by the current global economic turmoil. Accordingly, we cannot assure you that one or more of our major customers will not reduce, delay or eliminate its purchases from us, which would likely cause our revenues to decline further. Our current customers may also reduce or eliminate their purchases from us due to the uncertainty of our future operations. While we have gained some new OEM business and opportunities for products containing unified serial technologies as a resultexemption under Rule 3a-2 of the Aristos acquisition that have resulted in sales, such sales are unlikely to offset the decline in OEM sales from our legacy products in the future; therefore, we will currently be increasingly dependent on our channel products and customers for future revenue growth. This is particularly critical because our sales are made by means of standard purchase orders rather than long-term contracts. As a result, we cannot assure you that our few key customers will continue to purchase quantities of our products at current levels, or at all.
Investment Company Act.
Our operations depend on the efforts of our workforce, particularly our executives, principal engineers and other key employees, the loss of whom could affect the growth and success of our business. To be successful, we must retain and motivate our executives, our principal engineers and other key employees, including those in managerial, technical, marketing and information technology support positions. In particular, our product generation efforts depend on hiring and retaining qualified engineers. Competition for experienced management, technical, marketing and support personnel such as these remains intense. We must also continue to motivate all of our other employees and keep them focused on our strategies and goals, which may be particularly difficult due to morale challenges posed by the uncertainty of our future operations and their future employment with us. Each of our employees is an “at-will” employee, and, as a result, any of our employees could terminate their employment with us at any time without penalty. Due to the general uncertainty regarding the outlook of our company, we have implemented a retention plan in an effort to retain some of our key
15
employees. The loss of any of our key employees as well as a high level of attrition from all our other employees could have a significant impact on our operations. In addition, should the PMC Transaction be consummated, we will be required to fulfill certain transition services to PMC-Sierra, and the loss of any of our employees that are key to such transition activities could have an adverse effect on, and increase the cost of, providing these transition services.
If we do not meet our expense reduction and cost containment goals, we may have to continue to implement additional restructuring plans to reduce our operating costs. This may cause us to incur additional material restructuring charges and result in adverse effects on our employee capacities. We implemented several restructuring plans and recorded related restructuring charges of $1.6 million, $6.1 million and $6.3 million in fiscal years 2010, 2009 and 2008, respectively. These restructuring plans primarily involved the reduction of our workforce and the closure of certain facilities. The goals of our restructuring plans that were implemented were to bring our operational expenses to appropriate levels relative to our net revenues, while simultaneously implementing extensive company-wide expense-control programs. Subsequent to our fiscal year-end, we approved a restructuring plan to reduce our operating expenses. We expect to complete our actions by December 2010, which is primarily contingent upon the consummation of the PMC Transaction, including the expected transition services we are required to provide to PMC-Sierra. The restructuring charges to be incurred will primarily result in cash expenditures related to severance and related benefits, and to a lesser extent, exiting certain operating facilities and disposing excess assets. In an effort to continue saving operational costs subsequent to our fiscal year-end, we notified certain of our engineering employees and provided them one-time severance benefits of approximately $1.8 million, which is expected to be recorded in the first quarter of fiscal 2011, as we intend to outsource our ASIC and silicon needs. We cannot quantify the remaining impact of this restructuring plan to our Consolidated Statements of Operations at this time as the remaining restructuring actions are contingent upon the consummation of the PMC Transaction. Moreover, we could encounter delays in executing our restructuring plan, which could cause further disruption and additional unanticipated expense to our Consolidated Statements of Operations in the near future. Further, our restructuring plan could result in a potential adverse effect on employee capabilities that could harm our efficiency and our ability to act quickly and effectively.
Our operating results may be adversely affected by unfavorable economic and market conditions and the uncertain geopolitical environment.Economic conditions have deteriorated significantly in the past in many of the countries and regions in which we do business and may be depressed for the foreseeable future. Global economic conditions have also been challenged by worldwide liquidity and credit concerns and the related effects on economies around the world. While the liquidity crisis has passed and we have seen some improvement in global economic conditions, any adverse global economic conditions in our markets that may occur in the future would likely negatively impact our business, which could result in:
reduced demand for our products;
increased price competition for our products;
increased risk of excess and obsolete inventories;
increased risk in the collectibility of cash from our customers;
increased risk in potential reserves for doubtful accounts and write-offs of accounts receivable; and
higher operating costs as a percentage of revenues.
If the global economic crisis causes demand in the server and network storage markets to decline, demand for our products would also likely be negatively affected. Some of the factors that could influence demand in the server and network storage markets include continuing increases in fuel and other energy costs, labor costs, access to credit, consumer confidence and other macroeconomic factors affecting corporate spending behavior. It is difficult to predict future server sales growth, if any. If global economic conditions remain uncertain or deteriorate further, we may experience material adverse impacts on our business, operating results and financial condition.
We may sustain losses in our investment portfolio due to adverse changes in the global credit markets.Global economic conditions have been challenged in the past by slowing growth and the sub-prime debt devaluation crisis, causing worldwide liquidity and credit concerns. While the liquidityMore recently, credit and credit concernssovereign debt issues have passeddestabilized certain European economies and we have seen some improvement inthereby increased global economic conditions, anyuncertainties. An adverse change in global economic conditions may adversely impact our financial results. A substantial portion of our assets consists of investments in marketable securities that we hold as available-for-sale and we mark them to market. While there has been a decline in the trading values of certain of the securities in which we have invested, we have not recognized a material loss on our securities as the unrealized losses incurred were not deemed to be other-than-temporary.temporary. We expect to realize the full value of all our marketable securities upon maturity or sale, as we have the intent and ability to hold the securities until the full value is realized. However, we cannot provide any assurance that our invested cash, cash equivalents and marketable securities will not be impacted by adverse conditions in the financial markets, which may require us to record an impairment charge in the future that could adversely impact our financial results.
Due to the nature of this relationship, and the continuous changes in the prices of components and parts, we are in ongoing negotiations with Sanmina-SCI concerning product pricing. Any adverse outcome of future negotiations concerning product pricing could adversely impact our gross margins. We have no long-term agreements with our assembly and packaging subcontractors. We also employ Amkor Technology and Advanced Semiconductor Engineering to final assemble and test operations related to our ASIC products. We cannot assure you that these subcontractors will continue to be able and willing to meet our requirements. Any significant disruption in supplies from or degradation in the quality of components or services supplied by these contract manufacturers and subcontractors could delay shipments and result in the loss of customers or revenues, which could have an adverse effect on our operating results.
The impact of industry technology transitions and market acceptance of our new products may cause our revenues to continue to decline. We have experienced a significant decline in our revenues as the industry continues to transition from parallel to serial connectivity, as the revenues we generate from sales of our serial products has not grown at a fast enough ratecarried forward to offset declines in sales of our parallel products. We expect this trend to continuefederal and state taxable income in future periods. In addition, products that we may develop may not gain sufficient market
17
acceptanceyears and eliminate income taxes otherwise payable on such taxable income, subject to offset the declinecertain limits and adjustments. Based on current income tax rates, if fully utilized, our NOLs and other carry-forwards could provide a benefit to us of significant future tax savings. However, our ability to use these tax benefits in revenues from certain of our existing products or otherwise contribute significantly to revenues. These factors, individually or in the aggregate, could cause our revenues to continue to decline.
Our dependence on new products may cause our net revenues to fluctuate or decline. If the PMC Transaction is not consummated, our future success mayyears will depend upon our completingability to comply with the rules relating to the preservation and introducing enhanceduse of NOLs and new products at competitive prices and performance levels in a timely manner. The success of new product introductions depends on several factors, including the following:
designing products to meet customer needs;
product costs;
timely completion and introduction of new product designs;
quality of new products;
differentiation of new products from thoseamount of our competitors; and
market acceptance of our products.
Our product life cycles may be as brief as 12 months. As a result, we believe that we may continue to incur significant expenditures for research and development in the future. We may fail to identify new product opportunities and may not develop and bring new products to market in a timely manner. In addition, products or technologies developed by others may render our products or technologies obsolete or noncompetitive, or our targeted customers may not select our products for design or integration into their products. The failure of any of our new product development efforts could have an adverse effect on our business and financial results.
We have introduced RAID-enabled products based on the next generation SATA technology and delivered our products based on SAS technology to certain major customers for testing and integration. We will not succeed in generating significant revenues from our new SATA and SAS technology products if the market does not adapt to these new technologies, which would, over time, adversely affect our net revenues and operating results.
If we lose the cooperation of other hardware and software producers whose products are integral to ours, our ability to sustain or grow our revenues could be adversely affected. We must design our current products to operate effectively with a variety of hardware and software products supplied by other manufacturers, including the following:
I/O and RAID ASICs;
microprocessors;
peripherals;
system software;
server and desktop motherboards; and
enclosures.
We depend on significant cooperation from these manufacturers to achieve our design objectives and develop products that operate successfully with their products. These companies could, from time to time, elect to make it more difficult for us to design our products for successful operability with their products. For example, if one or more of these companies were to determine that as a result of competition or other factors, our products would not be broadly accepted by the markets we target, these companies may no longer work with us to plan for new products and new generations of our products, which would make it more difficult to introduce products on a timely basis or at all. Further, some of these companies might decide not to continue to offer products that are compatible with our technology and our markets could contract. If any of these events were to occur, our revenues and financial results could be adversely affected.
If we are unable to compete effectively, our net revenues and gross margins could be adversely affected. The markets for all of our products are intensely competitive and are characterized by the following:
rapid technological advances;
frequent new product introductions;
evolving industry standards; and
price erosion.
To be competitive, our current products must be enhanced and improved on a timely basis to keep pace with market demands.otherwise taxable income. If we do not do so, or if our competition is more effective in developing products that meet the needs of our existing and potential customers, we may lose market share and not participate in the future growth of our target markets. Revenues for our SATA products sold to our OEM customers have declined and we expect these revenues to continue to decline, as our products are at the end of their life cycles and certain of our customers have moved to other suppliers to obtain next generation SATA technologies. We also expect a negative impact on our net revenues from a decline in sales of our serial legacy products sold to OEMssufficient taxable income in future quarters as IBM notified us inyears to use the second quartertax benefits before they expire, we will lose the benefit of fiscal 2008 that we did not receive design wins for their new serial products.
Our future revenue growth remains largely dependent on the success of our new products addressing unified serial technologies and growing our market share in the channel, and our future operating results will be influenced bythese NOLs permanently. Consequently, our ability to participateuse the tax benefits associated with our NOLs will depend significantly on our success in identifying suitable new business opportunities and acquisition candidates that maximize our NOLs, and once identified, successfully becoming established in this new business line or consummating such an acquisition.
We cannot assure you that we will have sufficient resources to accomplish any or all of the following:
satisfy any growth in demand for our products;
make timely introductions of new products;
compete successfully in the future against existing or potential competitors; or
prevent price competition from eroding margins.
We depend on the efforts of our distributors, which if reduced, could result in a loss of sales of our products in favor of competitive offerings. We derived approximately 65% of our total net revenues for fiscal 2010 from independent distributor and reseller channels. Our financial results could be adversely affected if our relationships with these distributors or resellers were to deteriorate or if the financial condition of these distributors or resellers were to decline. We continue to monitor and evaluate our distributors and may terminate distributor relationships to improve our product placement or improve distribution channels; however, the termination of a distributor may adversely affect our financial results in the short term.
Our distributors generally offer a diverse array of products from several different manufacturers. Accordingly, we are at risk that these distributors may give higher priority to selling products from other suppliers. A reduction in sales efforts by our current distributors could adversely affect our business and financial results. Our distributors build inventories in anticipation of future sales, and if such sales do not occur as rapidly as they anticipate, our distributors will decrease the size of their product orders. If we decrease our price protection or distributor-incentive programs, our distributors may also decrease their orders from us. In addition, we have from time to time taken actions to reduce levels of products at distributors and may do so in the future. These actions may affect our net revenues and negatively affect our financial results.
We currently purchase all of the finished production silicon wafers, chips and other key components used in our products from suppliers, and if they fail to meet our manufacturing needs, it would delay our production and product shipments to customers and negatively affect our operations. Independent foundries manufacture to our specifications all of the finished silicon wafers and chips used for our products. We currently
19
purchase finished production silicon wafers used in our products from Taiwan Semiconductor Manufacturing Company, or TSMC, and purchase finished production chips from LSI Corporation. In addition, we purchase some of our key components used in our products from sole-source suppliers. The manufacture of semiconductor devices and other components are sensitive to a wide variety of factors, including the following:
the availability of raw materials;
the availability of manufacturing capacity;
transition to smaller geometries of semiconductor devices;
the level of contaminants in the manufacturing environment;
impurities in the materials used; and
the performance of personnel and equipment.
We cannot assure you that manufacturing problems may not occur in the future. A shortage of raw materials or production capacity could lead our suppliers to allocate available capacity to other customers. Any prolonged inability to obtain wafers and other key components with competitive performance and cost attributes, adequate yields or timely deliveries would delay our production and our product shipments, and could have an adverse effect on our business and financial results. We expect that our suppliers will continually seek to convert their processes for manufacturing wafers and key components to more advanced process technologies. Such conversions entail inherent technological risks that can affect yields and delivery times. If for any reason the suppliers we use are unable or unwilling to satisfy our wafer and other key component needs, we will be required to identify and qualify additional suppliers. Additional suppliers for wafers and other key components may be unavailable, may take significant amounts of time to qualify or may be unable to satisfyuse a significant portion or all of our requirements onNOLs to offset taxable income. We have adopted a timely basis.
Becausetax benefits preservation plan and filed an amendment to our sales are made by meansCertificate of standard purchase orders rather than long-term contracts, if demand forIncorporation that restricts certain transfers of our customers’ products declines or if our customers do not control their inventories effectively, they may cancel or reschedule shipments previously ordered from us or reduce their levelscommon stock with the intention of purchases from us. The volume and timingreducing the likelihood of orders received during a quarter are difficult to forecast. Our customers generally order based on their forecasts and they frequently encounter uncertain and changing demand for their products. If demand falls below such forecasts or if our customers do not control their inventories effectively, they may cancel or reschedule shipments previously ordered from us. Our customers have from time to time in the past canceled or rescheduled shipments previously ordered from us, and we cannot assure you that they will not do so in the future. As our sales are made by means of standard purchase orders rather than long-term contracts,an ownership change. However, we cannot assure you that these customers will continue to purchase quantities of our products at current levels, or at all. Historically, we have set our operating budget based on forecasts of future revenues because we do not have significant backlog. Because much of our operating budget is relatively fixed in the short-term, if revenues do not meet our expectations, then our financial resultsmeasures will be adversely affected.
If we fail to adequately forecast demand for our products, we may incur excess product inventory costs and our financial results will be adversely affected.As the sales of our products are completed through standard purchase orders rather than long-term contracts, we provide our contract manufacturer forecasts based on anticipated future demand from our customers. To the extent that our customers’ demands fall below their initial forecasts and we are unable to sell the product to another customer, and because our purchase commitment lead time to manufacture products with our contract manufacturer is longer than the lead time for a customer to canceleffective in deterring or reschedule an order, we may be exposed to excess product inventory costs and our financial results will be adversely affected.
Our operating results have fluctuated in the past, and are likely to continue to fluctuate, and if our future results are below the expectations of investors or securities analysts, the market pricepreventing all transfers of our common stock would likely decline significantly.Our quarterly operating results have fluctuated in the past, and are likely to vary significantly in the future, based on a number of factors related to our industry and the markets for our products. Factors that are likely to cause our operating results to fluctuate include those discussed in this Risk
Factors section. For example, in fiscal 2009, our operating results were materially impacted by unusual charges, such as a goodwill impairment charge of $16.9 million.
Our operating expenses are largely based on anticipated revenues, and a large portion of our expenses, including facility costs and salaries, are fixed in the short term. As a result, lower than anticipated revenues for any reason could cause significant variations in our operating results from quarter to quarter.
Due to the factors summarized above, and the other risks described in this section, we believe that you should not rely on period-to-period comparisons of our financial results as an indication of our future performance. In the event that our operating results fall below the expectations of securities analysts or investors, the market price of our common stock could decline substantially.
We may be subject to a higher effective tax rate that could negatively affect our results of operations and financial position. We are subject to income and other taxes in the United States and in the foreign taxing jurisdictions in which we operate. The determination of our worldwide provision for income taxes and current and deferred tax assets and liabilities requires judgment and estimation and is subject to audit and redetermination by the taxing authorities. Although we believe our tax estimates are reasonable, the following factors could cause our effective tax rate to be materially different than tax amounts recorded in our Consolidated Financial Statements:
the jurisdiction in which profits are determined to be earned and taxed;
adjustments to estimated taxes upon finalization of various tax returns;
changes in available tax credits;
changes in share-based compensation expense;
changes in tax laws, the interpretation of tax laws either in the United States or abroad or the issuance of new interpretative accounting guidance related to uncertain transactions and calculations where the tax treatment was previously uncertain; and
the resolution of issues arising from tax audits with various tax authorities.
The factors noted above may cause a higher effective tax rate that could materially affect our income tax provision, results of operations or cash flows in the period or periods for which such determination is made.
Our reliance on industry standards and technological changes in the marketplace may cause our net revenues to fluctuate or decline. The computer industry is characterized by various, evolving standards and protocols. We design our products to conform to certain industry standards and protocols such as the following:
|
| |
|
| |
|
| |
|
| |
|
| |
|
| |
|
| |
|
| |
|
| |
|
| |
|
| |
21
If user acceptance of these standards declines, or if new standards emerge, and if we do not anticipate these changes and develop new products accordingly, these changes could adversely affect our business and financial results.
We are subject to various environmental laws and regulations that could impose substantial costs upon us and may adversely affect our business. We may from time to time be subject to various state, federal, and international laws and regulations governing the environment, including laws regulating the manufacture and distribution of chemical substances and laws restricting the presence of certain substances in electronics products. Although not currently mandated by any laws and regulations, we experienced a delay in sales from some of our customers that required halogen-free products, which eliminated the use of environmentally sensitive materials, including certain “salt-formers.” If our products become non-compliant with the various environmental laws and regulations or no longer meet our customer specification for environmental products, we may suffer a loss of revenues, be unable to sell affected products in certain markets or countries and be at a competitive disadvantage. We could also incur substantial costs to comply our products to meet the environmental needs of our customers, laws and regulations, which could negatively affect our results of operations and financial position.
If we do not provide adequate support during our customers’ design and development stage, or if we are unable to provide such support in a timely manner, we may lose revenues to our competitors. Certain of our products are designed to meet our customers’ specifications and, to the extent we are not able to meet these expectations in a timely manner or provide adequate support during our customers’ design and development stage, our customers may choose to buy similar products from another company. If this were to occur, we may lose revenues and market share to our competitors.
If there is a shortage of components used in our customers’ products, our sales may decline, which could adversely affect our results of operations and financial position. If our customers are unable to purchase certain components that are embedded into their products, their demand for our products may decline. In addition, we or our customers may be impacted by component shortages if components that comply with the Restriction of Hazardous Substances directive are not available. Similar shortages of components used in our products or our customers’ products could adversely affect our net revenues and financial results in future periods.
Product quality problems could lead to reduced revenues and gross margins. We produce highly complex products that incorporate leading-edge technologies, including both hardware and software. Software often contains “bugs” which can interfere with expected operations. We cannot assure you that our pre-shipment testing programs will be adequate to detect all defects which might interfere with customer satisfaction, reduce sales opportunities, or affect our gross margins if the costs of remedying the problems exceed reserves established for that purpose. An inability to cure a product defect could result in such an ownership change.
To execute our strategies, we may enter into strategic alliances with, or partner with companies with complementary or strategic products or technologies or make other structural changes to our business. Costs associated with these strategic alliances or partnerships may adversely affect our results of operations. This impact could be exacerbated if we are unable to integrate the products or technologies. We may pursue strategic transactions or partnerships to scale our business as salesamount of our core parallel products continueNOLs and our determinations as to decline. These may include both strengthening our partnershipswhen a prior change in silicon-based technologyownership occurred, and broadening our silicon-based intellectual property to improve our business opportunities. To be successful in any strategic alliances or partnerships that we may enter into or make, we must:
conduct strategic alliances or partnerships that enhance our time to market with new products;
successfully prevail over competing bidders for target strategic alliances or partnerships at an acceptable price;
invest in technologies that contribute to the profitable growth of our business;
develop the capabilities necessary to exploit newly acquired technologies; and
consider structural changes to achieve additional stockholder return.
The benefits of any strategic alliances or partnerships may prove to be less than anticipated and may not outweigh the costs reported in our financial statements, and we may not obtain the operational leverage or realize the improvements we intend or desire with the actions we take.
Completing any potential future strategic alliances or partnerships could cause significant diversions of management time and resources and divert focus from the activities of our current operations. In addition, we may be required to invest significant resources to perform under a strategic alliance or partnership, which could adversely affect our results of operations, at least in the short-term, even if we believe the strategic alliance or partnership will benefit us in the long-term.
If we are not successful in completing strategic alliances or partnerships with companies with complementary or strategic products or technologies, our future growth may be hindered. To scale our operations relative to our cost basis, we may need to identify attractive strategic alliance or partnership candidates and complete a transaction with them. If we fail to identify and complete successful strategic alliances or partnerships, we expect that our revenues will continue to decline and we may be at a competitive disadvantage or we may be adversely affected by negative market perceptions, any of which may have a material adverse effect on our financial results.
Some of our products contain “open source” software, and any failure to comply with the terms of one or more of these open source licenses could negatively affect our business. Some of our products are distributed with software licensed by its authors or other third parties under so-called “open source” licenses, including, for example, the GNU General Public License, or GPL, GNU Lesser General Public License, or LGPL, the Mozilla Public License, the BSD License and the Apache License. Some of those licenses may require as a conditionprovisions of the license that we make available source code for modifications or derivative works we create based upon, incorporating, or using the open source software, that we provide notices with our products, and/or that we license such modifications or derivative works under the terms of a particular open source license or other license granting third parties certain rights of further use. If an author or other third party that distributes such open source software were to allege that we had not complied with the conditions of one or more of those open source licenses, we could be required to incur legal expenses in defending against such allegations, and if our defenses were not successful we could be enjoined from distribution of the products that contained the open source software and required to either make the source code for the open source software available, to grant third parties certain rights of further use of our software, or to remove the open source software from our products, which could disrupt our distribution and sale of some of our products. In addition, if we combine our proprietary software with open source software in a certain manner, we could under some of the open source licenses, be required to release the source code of our proprietary software. If an author or other third party that distributes open source software were to obtain a judgment against us based on allegations that we had not complied with the terms of any such open source licenses, we could also be subject to liability for copyright infringement damages and breach of contract for our past distribution of such open source software.
Our international operations involve a number of political, economic and other risks that could adversely affectInternal Revenue Code may limit our ability to sellcarry forward our productsNOLs to offset taxable income in certain countries, create local economic conditionsfuture years. If the IRS was successful with respect to any such challenge, the potential tax benefit that reduce demand for our products among our target markets and exposethe NOLs would provide us to potential disruption in the supply of necessary components. Our international operations and sales are subject to political and economic risks, including political instability, currency controls, and changes in import/export regulations, tariffs and freight rates. Many of our subcontractors are primarily located in Asia and we have sales offices and customers located throughout Europe, Japan and other countries. In addition, because our primary wafer supplier, TSMC, is located in Taiwan, we may be subject to certain risks resulting from political instability in Taiwan, including conflicts between Taiwan and the People’s Republic of China. These and other international risks could result in the creation of political or other non-economic barriers to our being able to sell our products in certain countries, create local economic conditions that reduce demand for our products among our target markets, expose us to potential disruption in the supply of necessary components or otherwise adversely affect our ability to generate
23
revenues and operate effectively. In addition, the operations of our remote locations are subject to management oversight and control. If our business practices and corporate controls are not adhered to worldwide, our business and financial results could be adversely affected.
substantially reduced.
If actual results or events differ materially from those contemplated by us in making estimates and assumptions, our reported financial condition and results of operations for future periods could be materially affected. The preparation of financial statements in conformity with accounting principles generally accepted in the United States of America requires management to make estimates and assumptions that affect the amounts reported in the Consolidated Financial Statements and accompanying notes. For example, we have identified key accounting estimates in our Critical Accounting Policies included in “Item 7: Management’s Discussion and Analysis of Financial Condition and Results of Operations” of this Annual Report on Form 10-K, which include revenue recognition, cash, cash equivalents and marketable securities valuation, inventory, impairment of long-lived assets, stock-based compensation and income taxes. Furthermore, Note 1 to the Consolidated Financial Statements included in “Item 8: Financial Statements and Supplementary Data” of this Annual Report on Form 10-K describes the significant accounting policies essential to preparing our Consolidated Financial Statements. The preparation of these financial statements requires estimates and assumptions that affect the reported amounts and disclosures. Although we believe that our judgments and estimates are appropriate and correct, actual future results may differ materially from our estimates.
If we are unable to protect and enforce our intellectual property rights, we may be unable to compete effectively. Although we actively maintain and defend our intellectual property rights, we may be unable to adequately protect our proprietary rights. In addition, the laws of certain territories in which our products are or may be developed, manufactured or sold, including Asia and Europe, may not protect our products and intellectual property rights to the same extent as the laws of the United States. Because we conduct a substantial portion of our operations outside of the United States and sell to a worldwide customer base, we are more dependent on our ability to protect our intellectual property in international environments than would be the case if a larger portion of our operations were domestic.
Despite our efforts, we may be unable to prevent third parties from infringing upon or misappropriating our intellectual property, which could harm our business and ability to compete effectively. We have from time to time discovered counterfeit copies of our products being manufactured or sold by others. Although we have programs to detect and deter the counterfeiting of our products, significant availability of counterfeit products could reduce our revenues and damage our reputation and goodwill with customers.
Third parties may assert infringement claims against us, which may be expensive to defend and could divert our resources. From time to time, third parties assert exclusive patent, copyright and other intellectual property rights to our key technologies, and we expect to continue to receive such claims in the future. The risks of receiving additional claims from third parties may be increased in periods when we begin to offer product lines employing new technologies relative to our existing products.
We cannot assure you that third parties will not assert other infringement claims against us, directly or indirectly, in the future, that assertions by third parties will not result in costly litigation or that we would prevail in such litigation or be able to license any valid and infringed intellectual property from third parties on commercially reasonable terms. These claims may be asserted in respect of intellectual property that we own or that we license from others. In addition to claims brought against us by third parties, we may also bring litigation against others to protect our rights. Intellectual property litigation, regardless of the outcome, could result in substantial costs to us and diversion of our resources and management time and attention, and could adversely affect our business and financial results.
We may be required to pay additional income taxes, which could negatively affect our results of operations and financial position. Our tax provision continues to reflect judgment and estimation regarding components of the settlement such as interest calculations and the application of the settlements to foreign, state and local taxing jurisdictions. Although we believe our tax estimates are reasonable, the ultimate tax outcome may materially differ from the tax amounts recorded in our Consolidated Financial Statements and may cause a higher effective tax rate that could materially affect our income tax provision, results of operations or cash flows in the period or periods for which such determination is made. In fiscal 2009, the IRS concluded its audit of our federal income tax returns for the fiscal 2004 through 2006 audit cycle. The IRS issued a No Change Report indicating no change to our tax liability; however, the IRS continues to have the ability to adjust tax attributes relating to these years in subsequent audits. We believe that we have provided sufficient tax provisions for these years and that the ultimate outcome of any future IRS audits that include the tax attributes will not have a material adverse impact on our financial position or results of operations in future periods. While the tax authorities in the foreign jurisdictions thatin which we operate informerly operated continue to audit our tax returns for fiscal years subsequent to 1999, the potential outcome of these audits is uncertain and could result in material tax provisions or additional tax payments in future periods.
| · | the jurisdiction in which profits were determined to be earned and taxed; | ||||||
| · | adjustments to estimated taxes upon finalization of various tax returns; | ||||||
| · | changes in available tax credits; | ||||||
| · | changes in share-based compensation expense; | ||||||
| · | changes in tax laws, the interpretation of tax laws either in the United States, Singapore or other foreign taxing jurisdictions or the issuance of new interpretative accounting guidance related to uncertain transactions and calculations where the tax treatment was previously uncertain; and | ||||||
| · | the resolution of issues arising from tax audits with various tax authorities. | ||||||
period or periods for which such determination is made.
We hold non-controlling interests in privately held venture funds, and if these venture funds face financial difficulties in their operations, our investments could be impaired. We continue to hold non-controlling interest in privately held venture funds. At March 31, 2010, the carrying value of such investments aggregated $1.2 million. These investments are inherently risky because these venture funds invest in companies that may still be in the development stage or depend on third parties for financing to support their ongoing operations. In addition, the markets for the technologies or products of these companies are typically in the early stages and may never develop. If these companies do not have adequate cash funding to support their operations, or if they encounter difficulties developing their technologies or products, the venture funds’ investments in these companies may be impaired, which in turn, could result in impairment of our investment in these venture funds. For example, in fiscal 2009, the value of our non-controlling interest in privately held venture funds, declined resulting in a recorded charge of $0.4 million. The carrying value of these investments is based on quarterly statements we receive from the funds. The statements are generally received one quarter in arrears, as more timely valuations are not practical. The statements reflect the net asset value, which we use to determine the fair value for these investments, which (a) do not have a readily determinable fair value and
25
(b) either have the attributes of an investment company or prepare their financial statements consistent with the measurement principles of an investment company. The assumptions we use due to lack of observable inputs may impact the fair value of these equity investments in future periods. While we have seen some improvement in global economic conditions, any adverse changes in equity investments and current market conditions may require us to record an impairment charge against all or a portion of the investments in the future. Such an action would adversely affect our financial results.
Changes in securities laws and regulations have increased and may continue to increase our costs. Changes in the laws and regulations affecting public companies, including the provisions of the Sarbanes-Oxley Act of 2002 and rules promulgated by the SEC, have increased and may continue to increase our expenses as we devote resources to respond to their requirements. In particular, we incurred additional administrative expense to implement Section 404 of the Sarbanes-Oxley Act, which requires management to report on, and our independent registered public accounting firm to attest to, the effectiveness of our internal control over financial reporting.
In addition, the NASDAQ Global Market, on which our common stock is listed, has also adopted comprehensive rules and regulations relating to corporate governance. These laws, rules and regulations have increased and may continue to increase the scope, complexity and cost of our corporate governance, reporting and disclosure practices. We also expect these developments may make it more difficult and more expensive for us to obtain director and officer liability insurance in the future, and we may be required to accept reduced coverage or incur substantially higher costs to obtain coverage.
Internal control deficiencies or weaknesses that are not yet identified could emerge. Over time we may identify and correct deficiencies or weaknesses in our internal control over financial reporting and, where and when appropriate, report on the identification and correction of these deficiencies or weaknesses. However, the internal control procedures can provide only reasonable, and not absolute, assurance that deficiencies or weaknesses are identified. Deficiencies or weaknesses that are not yet identified could emerge, and the identification and corrections of these deficiencies or weaknesses could have a material impact on our results of operations.
Internal control issues that appear minor now may later become material weaknesses. We are required to publicly report on deficiencies or weaknesses in our internal control over financial reporting that meet a materiality standard as required by law and related regulations and interpretations. Management may, at a point in time, accurately categorize a deficiency or weakness as immaterial or minor and therefore not be required to publicly report such deficiency or weakness. Such determination, however, does not preclude a change in circumstances such that the deficiency or weakness could, at a later time, become a material weakness that could have a material impact on our results of operations.
Manmade problems such as computer viruses or terrorism may disrupt our operations and harm our operating results. Despite our implementation of network security measures, our servers are vulnerable to computer viruses, break-ins and similar disruptions from unauthorized tampering with our computer systems. Any such event could have an adverse effect on our business, operating results, and financial condition. In addition, the effects of war or acts of terrorism could have an adverse effect on our business, operating results, and financial condition. In addition,Further, as a company with headquarters and significant operations located in the
United States, we may be impacted by actions against the United States. We are predominantly uninsured for losses and interruptions caused by terrorist acts and acts of war.
| · | the supply of and demand for oil and natural gas, including current natural gas storage capacity and usage; | |||||||||||||
| · | the level of prices and expectations about future prices of oil and natural gas; | |||||||||||||
| · | the cost of exploring for, developing, producing and delivering oil and natural gas; | |||||||||||||
| · | the expected rates of declining current production; | |||||||||||||
| · | the discovery rates of new oil and natural gas reserves; | |||||||||||||
| · | available pipeline and other transportation capacity; | |||||||||||||
| · | inclement weather conditions can affect oil and natural gas operations over a wide area; | |||||||||||||
| · | domestic and worldwide economic conditions; | |||||||||||||
| · | political instability in oil and natural gas producing countries; | |||||||||||||
| · | technical advances affecting energy consumption; | |||||||||||||
| · | the price and availability of alternative fuels; | |||||||||||||
| · | the access to and cost of capital for oil and natural gas producers; and | |||||||||||||
| · | merger and divesture activity among oil and natural gas producers. | |||||||||||||
| · | curtailment of services; | ||||
| · | weather-related damage to facilities and equipment, resulting in suspension of operations; | ||||
| · | inability to deliver equipment, personnel and products; and | ||||
| · | increased downtime and loss of productivity. | ||||
Directors and our Interim President and Chief Executive Officer, Mark Zorko, our Chief Financial Officer, and Leonard McGill, General Counsel.
As of March 31, 2010, we owned and leased various properties
Our principal executive offices are located in Milpitas, California and include research and development, technical support, sales, marketing and administrative functions. In addition, we lease buildings in Foothill Ranch, California, and Orlando, Florida. We use these properties primarily for research and development, technical support, and sales and marketing functions. Internationally, we operate in Australia, England, Germany and Japan. We use these properties primarily for research and development, technical design, technical support, sales and administrative functions.
The table below is a summary of the facilities we owned and leased at March 31, 2010:
| United States | Other Countries | Total | ||||||
| (in square feet) | ||||||||
Owned Facilities | 104,000 | (a) | — | 104,000 | ||||
Leased Facilities | 150,000 | (b) | 16,000 | (c) | 166,000 | |||
Total Facilities | 254,000 | 16,000 | 270,000 | |||||
We operate in one segment; therefore, all of our facilities are managed at the corporate level. We believe our existing facilities and equipment are well maintained and in good operating condition, and we believe our facilities are sufficient to meet our needs for the foreseeable future. Our future facilities requirements will depend upon our business, and we believe additional space, if required, can be obtained on reasonable terms.
27
As part of the PMC Transaction, PMC-Sierra has agreed to assume the obligations for certain of our leased facilities, primarilyclaims, including claims related to our international sites, if the transaction is consummated. There can be no guarantee the PMC Transaction will be consummatedbusinesses that we wound down or that PMC-Sierra will assume such leases.
We are a party to litigation matters and claims, including those related to intellectual property,sold, which are normal in the course of our operations,business, and while the results of such litigation matters and claims cannot be predicted with certainty, we believe that the final outcome of such matters will not have a material adverse impact on our financial position, or results of operations.operations or cash flows. However, because of the nature and inherent uncertainties of litigation, should the outcome of these actions be unfavorable, our business, financial condition, results of operations and cash flows could be materially and adversely affected.
In connection with our acquisitions of Aristos, and Eurologic Systems Group Limited, or Eurologic, a portion of the respective purchase prices and other future payments totaling $4.3 million and $3.8 million, respectively, were held back, which we refer to collectively as the Holdbacks, to secure potential indemnification obligations of Aristos and Eurologic stockholders for unknown liabilities that may have existed as of each acquisition date. The Aristos Holdback of $4.3 million was paid in full in fiscal 2010. In fiscal 2009, we resolved the remaining disputed, outstanding claims against the Eurologic Holdback by entering into a deed of indemnity and a written settlement agreement with the representative of the Eurologic stockholders, which resulted in an additional payment of $1.3 million. Our initial payment of $2.3 million to the Eurologic stockholders was recorded in fiscal 2005. The remaining Eurologic Holdback balance of $0.2 million was retained by us and was recognized as a gain in fiscal 2009 in “Loss from discontinued operations, net of taxes” in the Consolidated Statements of Operations.
Mine Safety Disclosures
| Fiscal 2010 | Fiscal 2009 | |||||||||||
| High | Low | High | Low | |||||||||
First quarter | $ | 3.00 | $ | 2.35 | $ | 3.40 | $ | 2.58 | ||||
Second quarter | 3.36 | 2.25 | 4.24 | 3.10 | ||||||||
Third quarter | 3.56 | 2.98 | 3.71 | 2.41 | ||||||||
Fourth quarter | 3.46 | 2.97 | 3.61 | 2.20 | ||||||||
10-K, we effected the Reverse/Forward Split on October 3, 2011. The prices shown below for the date ranges prior to October 3, 2011 have been retroactively adjusted to give effect to the Reverse/Forward Split.
| Fiscal Year Ended December 31, 2012 | High | Low | ||||||
| Three-month period ended March 31, 2012 | $ | 28.50 | $ | 23.97 | ||||
| Three-month period ended June 30, 2012 | $ | 28.49 | $ | 25.25 | ||||
| Three-month period ended September 29, 2012 | $ | 27.52 | $ | 24.90 | ||||
| Three-month period ended December 31, 2012 | $ | 25.51 | $ | 23.25 | ||||
| Fiscal Year Ended December 31, 2011 | High | Low | ||||||
| Three-month period ended April 1, 2011 | $ | 30.40 | $ | 28.00 | ||||
| Three-month period ended July 1, 2011 | $ | 30.40 | $ | 27.90 | ||||
| Three-month period ended September 30, 2011 | $ | 30.10 | $ | 26.20 | ||||
| Three-month period ended December 31, 2011 | $ | 26.90 | $ | 22.70 | ||||
This number of registered holders does not include holders that have shares of common stock held for them “in street name,” meaning the shares are held for their accounts by a broker or other nominee.
In the fourth quarter of fiscal 2010, we withheld less than 0.1 million shares to cover the applicable taxes, relatingpursuant to the vesting of shares of restricted stock. Theprogram at an average price per share of the shares withheld was $3.36.$24.82 for an aggregate repurchase price of $2.8 million, excluding brokerage commissions. The shares withheld for tax purposes are not considered common stock repurchases under our authorized plan.
29
program has no specific expiration date.
| (a) | (b) | (c) | (d) | |||||||||||||
| Period | Total Number of Shares Purchased | Average Price Paid per Share | Total Number of Shares Purchased as Part of Publicly Announced Plans or Programs | Maximum Number (or Approximate Dollar Value) of Shares that May Yet Be Purchased Under the Plans or Programs | ||||||||||||
| Month of October 2012 | - | $ | - | - | - | |||||||||||
| Month of November 2012 | 30,423 | $ | 24.76 | - | 169,577 | |||||||||||
| Month of December 2012 | 81,400 | $ | 24.85 | - | 88,177 | |||||||||||
| Total | 111,823 | $ | 24.82 | - | ||||||||||||
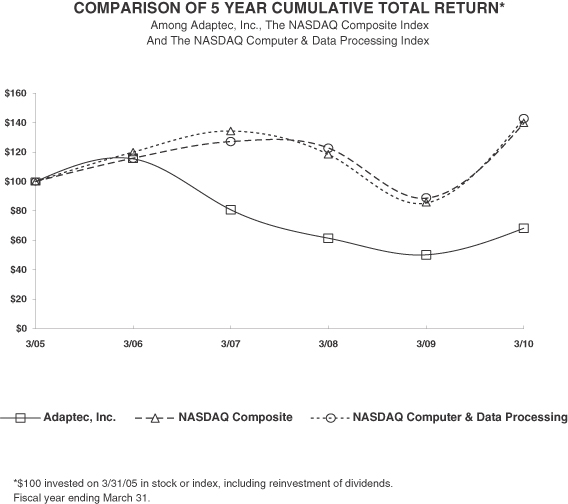
| 3/31/05 | 3/31/06 | 3/31/07 | 3/31/08 | 3/31/09 | 3/31/10 | |||||||
Adaptec, Inc. | 100.00 | 115.45 | 80.79 | 61.38 | 50.10 | 68.27 | ||||||
NASDAQ Composite | 100.00 | 119.97 | 134.27 | 118.46 | 85.30 | 142.80 | ||||||
NASDAQ Computer & Data Processing | 100.00 | 115.84 | 127.08 | 122.78 | 88.71 | 139.53 |
our common stock to the Russell 2000 index and PHLX Oil Service Sector. The graph assumes that $100 was invested on March 31, 2007 and its relative performance was tracked through December 31, 2012 in our common stock price performance includedand in this graph is not necessarily indicative of future stock price performance.
each index.
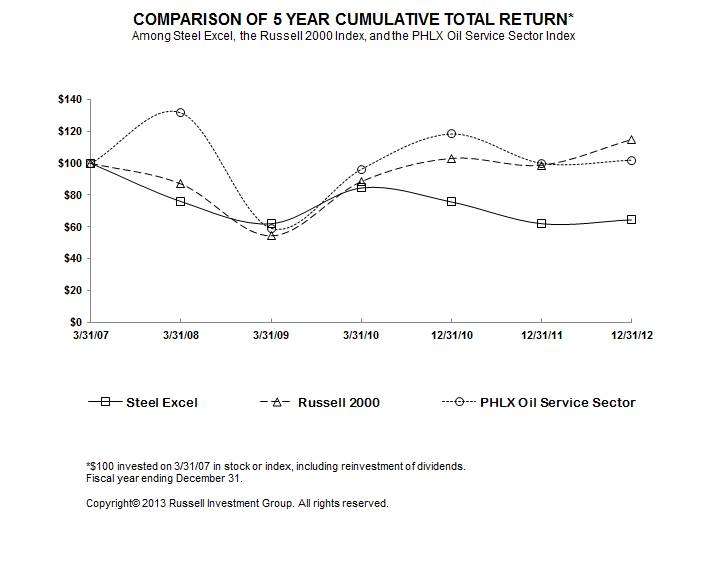
| Fiscal Years Ended March 31, | ||||||||||||||||||||
| 2010(2)(3) | 2009(2)(4) | 2008(2)(5) | 2007(2)(6) | 2006(2)(7) | ||||||||||||||||
| (in thousands, except per share amounts) | ||||||||||||||||||||
Consolidated Statements of Operations Data: | ||||||||||||||||||||
Net revenues(1) | $ | 73,682 | $ | 114,774 | $ | 145,501 | $ | 227,148 | $ | 310,145 | ||||||||||
Cost of revenues (inclusive of amortization of acquisition-related intangible assets)(1) | 40,288 | 65,413 | 88,925 | 150,759 | 201,876 | |||||||||||||||
Gross profit(1) | 33,394 | 49,361 | 56,576 | 76,389 | 108,269 | |||||||||||||||
Total operating expenses(1) | 64,994 | 85,721 | 89,612 | 115,290 | 235,906 | |||||||||||||||
Income (loss) from continuing operations, net of taxes | (18,670 | ) | (13,976 | ) | (5,372 | ) | 42,688 | (114,938 | ) | |||||||||||
Loss from discontinued operations, net of taxes | — | (941 | ) | (4,722 | ) | (18,388 | ) | (43,304 | ) | |||||||||||
Gain on disposal of discontinued operations, net of taxes | 1,236 | 4,727 | 479 | 6,543 | 9,810 | |||||||||||||||
Net income (loss) | $ | (17,434 | ) | $ | (10,190 | ) | $ | (9,615 | ) | $ | 30,843 | $ | (148,432 | ) | ||||||
Income (Loss) Per Share Data: | ||||||||||||||||||||
Basic: | ||||||||||||||||||||
Continuing operations | $ | (0.16 | ) | $ | (0.12 | ) | $ | (0.05 | ) | $ | 0.37 | $ | (1.01 | ) | ||||||
Discontinued operations | $ | 0.01 | $ | 0.03 | $ | (0.04 | ) | $ | (0.10 | ) | $ | (0.30 | ) | |||||||
Net income (loss) | $ | (0.15 | ) | $ | (0.09 | ) | $ | (0.08 | ) | $ | 0.26 | $ | (1.31 | ) | ||||||
Diluted: | ||||||||||||||||||||
Continuing operations | $ | (0.16 | ) | $ | (0.12 | ) | $ | (0.05 | ) | $ | 0.33 | $ | (1.01 | ) | ||||||
Discontinued operations | $ | 0.01 | $ | 0.03 | $ | (0.04 | ) | $ | (0.09 | ) | $ | (0.30 | ) | |||||||
Net income (loss) | $ | (0.15 | ) | $ | (0.09 | ) | $ | (0.08 | ) | $ | 0.25 | $ | (1.31 | ) | ||||||
Shares used in computing income (loss) per share: | ||||||||||||||||||||
Basic | 119,196 | 119,767 | 118,613 | 116,602 | 113,405 | |||||||||||||||
Diluted | 119,196 | 119,767 | 118,613 | 136,690 | 113,405 | |||||||||||||||
| March 31, | ||||||||||||||||||||
| 2010(3) | 2009(4) | 2008(5) | 2007(6) | 2006(7) | ||||||||||||||||
| (in thousands) | ||||||||||||||||||||
Consolidated Balance Sheets Data: | ||||||||||||||||||||
Cash, cash equivalents and marketable securities(8) | $ | 375,347 | $ | 376,592 | $ | 626,216 | $ | 572,423 | $ | 556,552 | ||||||||||
Restricted cash and marketable securities | — | — | 1,670 | 3,244 | 4,749 | |||||||||||||||
Total assets | 429,076 | 450,107 | 700,087 | 715,402 | 737,399 | |||||||||||||||
Long-term liabilities(8) | 9,568 | 14,974 | 19,231 | 228,009 | 229,349 | |||||||||||||||
Stockholders’ equity | 397,703 | 410,880 | 424,096 | 422,158 | 369,445 | |||||||||||||||
Working capital(8) | 377,035 | 385,219 | 424,663 | 616,033 | 522,039 | |||||||||||||||
31
operations and prior periods have been reclassified to conform to this presentation.
Notes:
Fiscal Year Ended December 31, | Nine-Month Period Ended | Fiscal Year Ended March 31, | ||||||||||||||||||
2012(8) | 2011(2) | 2010(3)(4) | 2010(3)(5) | 2009(3)(6) | ||||||||||||||||
| (in thousands, except per share amounts) | ||||||||||||||||||||
Consolidated Statements of Operations Data(1): | ||||||||||||||||||||
| Net revenues | $ | 100,104 | $ | 2,502 | $ | - | $ | - | $ | - | ||||||||||
| Cost of revenues | $ | 66,064 | $ | 1,459 | $ | - | $ | - | $ | - | ||||||||||
| Gross margin | $ | 34,040 | $ | 1,043 | $ | - | $ | - | $ | - | ||||||||||
| Total operating expenses | $ | 28,223 | $ | 9,554 | $ | 14,989 | $ | 30,535 | $ | 29,653 | ||||||||||
| Income (loss) from continuing operations, net of taxes | $ | 22,179 | $ | 68 | $ | (17,386 | ) | $ | (17,232 | ) | $ | (6,499 | ) | |||||||
Income (loss) from discontinued operations, net of taxes attributable to Steel Excel | $ | (1,508 | ) | $ | 1,696 | $ | (11,289 | ) | $ | (1,438 | ) | $ | (8,418 | ) | ||||||
Gain on disposal of discontinued operations, net of taxes attributable to Steel Excel | $ | - | $ | 5,005 | $ | 10,916 | $ | 1,236 | $ | 4,727 | ||||||||||
| Net income (loss) attributable to Steel Excel Inc. | $ | 20,693 | $ | 6,769 | $ | (17,759 | ) | $ | (17,434 | ) | $ | (10,190 | ) | |||||||
| Income (Loss) Per Share Data: | ||||||||||||||||||||
| Basic | ||||||||||||||||||||
| Income (loss) from continuing operations, net of taxes | $ | 1.83 | $ | 0.01 | $ | (1.50 | ) | $ | (1.45 | ) | $ | (0.54 | ) | |||||||
Income (loss) from discontinued operations, net of taxes | $ | (0.16 | ) | $ | 0.62 | $ | (0.03 | ) | $ | (0.02 | ) | $ | (0.31 | ) | ||||||
| Net income (loss) | $ | 1.71 | $ | 0.62 | $ | (1.53 | ) | $ | (1.46 | ) | $ | (0.85 | ) | |||||||
| Diluted | ||||||||||||||||||||
| Income (loss) from continuing operations, net of taxes | $ | 1.83 | $ | 0.01 | $ | (1.50 | ) | $ | (1.45 | ) | $ | (0.54 | ) | |||||||
Income (loss) from discontinued operations, net of taxes | $ | (0.16 | ) | $ | 0.61 | $ | (0.03 | ) | $ | (0.02 | ) | $ | (0.31 | ) | ||||||
| Net income (loss) | $ | 1.71 | $ | 0.62 | $ | (1.53 | ) | $ | (1.46 | ) | $ | (0.85 | ) | |||||||
| Shares used in computing income (loss) per share | ||||||||||||||||||||
| Basic | 12,110 | 10,882 | 11,609 | 11,920 | 11,977 | |||||||||||||||
| Diluted | 12,133 | 10,897 | 11,609 | 11,920 | 11,977 | |||||||||||||||
| December 31, | March 31, | |||||||||||||||||||
| 2012 | 2011 | 2010(3) | 2010(4) | 2009(5) | ||||||||||||||||
| (in thousands, except per share amounts) | ||||||||||||||||||||
| Consolidated Balance Sheets Data: | ||||||||||||||||||||
Cash, cash equivalents and marketable securities(7) | $ | 270,684 | $ | 323,428 | $ | 352,411 | $ | 375,347 | $ | 376,592 | ||||||||||
| Restricted cash and/or marketable securities | $ | - | $ | - | $ | 1,676 | $ | - | $ | - | ||||||||||
| Total assets | $ | 466,495 | $ | 368,677 | $ | 367,552 | $ | 429,076 | $ | 450,107 | ||||||||||
Long-term liabilities(7) | $ | 19,155 | $ | 10,767 | $ | 13,189 | $ | 9,568 | $ | 14,974 | ||||||||||
| Stockholders' equity | $ | 431,901 | $ | 351,469 | $ | 346,266 | $ | 397,703 | $ | 410,880 | ||||||||||
Working capital(7) | $ | 276,233 | $ | 324,130 | $ | 356,797 | $ | 377,035 | $ | 385,219 | ||||||||||
| (1) | Prior period information has been reclassified to conform to the current period presentation. The |
| (2) | The income from discontinued operations, net of taxes, for fiscal 2011 includes the release of a $5.0 million purchase price holdback related to the sales of our DPS Business to PMC-Sierra and the sale of $1.9 million of patents related to our DPS Business. | |
| (3) | We | |
| (4) | In the Transition Period, we (i) recorded stock-based compensation expense of $0.5 million and cash compensation expense of $1.2 million, which primarily reflected the acceleration of unvested stock-based awards and a settlement of unvested stock-based awards in |
| (5) | In fiscal 2010, we (i) recorded stock-based compensation expense of |
| (6) | In fiscal 2009, we (i) recorded an impairment charge of $16.9 million to |
| (7) | In |
| (8) | We recorded a benefit from income taxes of $15.7 million for the year ended December 31, 2012, primarily due to the |
This “Management’s Discussion and Analysis
Basis of Presentation
In September 2008, we acquired Aristos, a provider of RAID technologyApril 1, 2010 to the data storage industry, pursuant to an agreement and plan of merger by and among Adaptec, Aristos, Ariel Acquisition Corp., a wholly owned subsidiary of ours, and TPG Ventures, L.P., solely in its capacity as the representative of stockholders of Aristos. We refer to the agreement and plan of merger with AristosDecember 31, 2010 (the “Transition Period”). References in this Annual Report on Form 10-K asto “fiscal year 2012” or “fiscal 2012” refers to the Merger Agreement.calendar year of January 1, 2012 to December 31, 2012. References in this Annual Report on Form 10-K to “fiscal year 2011” or “fiscal 2011” refers to the calendar year of January 1, 2011 to December 31, 2011.
In June 2008, we sold the Snap Server Network Attached Storage business (the “Snap Server NAS businessbusiness”) to Overland.Overland Storage, Inc. (“Overland”), in June 2008. Accordingly, we reclassified the consolidated financial statements and related disclosures for all periods, presentedexcept for the historical Consolidated Balance Sheets and Statement of Stockholders’ Equity, to reflect this businessthese businesses as discontinued operations. These reclassifications had no impact on net loss, total assets or total stockholders’ equity. Unless otherwise indicated, the following discussion pertainsdiscussions pertain only to our continuing operations.
In addition, since
Overview
In December 2009, we announced the retention of Blackstone Advisory Partners L.P. to serve as our exclusive financial advisor relating to a potential sale or disposition of certain of our assets or business
33
operations. On May 8, 2010, subsequent to our fiscal year-end, we entered into an Asset Purchase Agreement with PMC-Sierraper share information for the sale of certain assets and for PMC-Sierra to assume certain liabilities related to our business of providing data storage hardware and software solutions and products including ASICs, HBAs, RAID controllers, Adaptec RAID software, ARC, storage management software including ASM, option ROM BIOS, CLI, storage virtualization software, and other solutions that span SCSI, SAS, and SATA interface technologies, and that optimize the performance of both hard disk and solid state drives, for a purchase price of approximately $34 million. Inprevious financial periods being reported in this Annual Report on Form 10-K we referhave been adjusted to reflect the transactions contemplated by the Asset Purchase Agreement with PMC-Sierra as the PMC Transaction. Reverse/Forward Split.
Assuming the PMC Transaction is consummated, we intend to explore all strategic alternatives to maximize stockholder value going forward, including deploying the proceeds of the PMC Transaction and our other assets in seeking business acquisition opportunities and other actions to redeploy our capital. Additionally, we will, as previously announced, continue to consider our options related to our Aristos products, as well as our other remaining operating assets, including non-core patents and real estate holdings. With respect to our Aristos products, options that we may consider include (i) ceasing to invest additional funds in our Aristos products, winding-down the sale of our Aristos products and fulfilling our remaining contractual obligations with our existing customers, which we would expect to be completed in six months, or by September 2010, or (ii) seeking to sell the assets related to our Aristos products to a third party. We will also explore alternatives for maximizing the value of our non-core patent portfolio and remaining real estate assets. Following and assuming the consummation of the PMC Transaction, we remain committed to providing value to all of our stockholders and will aggressively pursue opportunities to deploy the significant cash and liquid assetsfocus on hand to create value for our stockholders, including exploring opportunities to deploy this cash and liquid assets to make acquisitions of businesses that will maximize stockholder value and/or engaging in stock buybacks and cash dividends. Going forward our business is expected to consist of capital redeployment and identification of new profitable business operations in which we can utilize our existing working capital and maximize the use of our NOLs.
If we consummatenet tax operating losses (“NOLs”) in the PMC Transaction discussed above, wefuture. The identification of new business operations includes, but is not limited to, the oilfield servicing, sports, training, education, entertainment, and lifestyle businesses. For details regarding our historical business, which has been accounted for as discontinued operations, refer to Note 5 of the Notes to Consolidated Financial Statements.
In fiscal 2010, our net revenues decreased 36%areas as compared to fiscal 2009 due to a decrease in revenues associated with our legacy products of $49.8 million, which included our parallel SCSI products and our serial legacy products sold primarily to OEM customers, offset by an increase in sales volumes of our newer serial products, including data center data conditioning features, of $8.7 million. We expect revenues from our parallel SCSI products and our serial legacy products sold to OEM customers to continue to decline in future quarters, regardless of whether the PMC Transaction is consummated. Our gross margin in fiscal 2010 improved to 45% compared to 43% in fiscal 2009, primarily due to improved standard product contributions due to favorable customer mixes and lower inventory-related charges, offset by our lower sales volume over which our fixed costs were distributed. Operating expenses decreased in fiscal 2010 as compared to fiscal 2009 primarily due to the impairment charge of $16.9 million to write-off goodwill in fiscal 2009, our continued cost reductions, including temporary reductions in employees’ compensation in fiscal 2010, reductions in outside service providers, and
restructuring efforts implemented in fiscal years 2010 and 2009. This was partially offset by certain employee retention obligations of $0.7 million and higher stock-based compensation expense of $2.6 million primarily due to the modification of certain stock-based awards of $1.6 million in fiscal 2010, which included modifications of $0.9 million related to the separation agreement with Subramanian Sundaresh, our former CEO, a fiscal 2010 expense related to guaranteed cash payments of $1.6 million associated with the execution of the separation and consulting service agreements with Mr. Sundaresh, professional fees of $1.2 million incurred in fiscal 2010 related to our response to the consent solicitation initiated by Steel Partners II, L.P., Steel Partners Holdings L.P., Steel Partners LLC, Steel Partners II GP LLC, Warren Lichtenstein, Jack L. Howard, and John J. Quicke, collectively referred to in this Annual Report on Form 10-K as the Steel Group, on September 4, 2009 seeking stockholder approval on three proposals relating to our bylaws and the composition of our Board of Directors and a charge recorded in fiscal 2010 for the reimbursement of $0.7 million related to professional fees that the Steel Group incurred for the consent solicitation.
Results of Operations
well.
Fiscal Year Ended December 31, | ||||||||
| 2012 | 2011 | |||||||
| Net revenues | 100 | % | 100 | % | ||||
| Cost of revenues | 66 | % | 58 | % | ||||
| Gross margin | 34 | % | 42 | % | ||||
| Operating expenses: | ||||||||
| Selling, marketing and administrative | 28 | % | 383 | % | ||||
| Goodwill impairment | 0 | % | 0 | % | ||||
| Restructuring charges | 0 | % | -1 | % | ||||
| Total operating expenses | 28 | % | 382 | % | ||||
| Income (loss) from continuing operations | 6 | % | -340 | % | ||||
| Interest and other income, net | 1 | % | 334 | % | ||||
| Interest expense | 0 | % | 0 | % | ||||
| Income (loss) from continuing operations before income taxes | 7 | % | -6 | % | ||||
| Benefit from (provision for) income taxes | 16 | % | 9 | % | ||||
| Income (loss) from continuing operations, net of taxes | 23 | % | 3 | % | ||||
| Discontinued operations, net of taxes: | ||||||||
| Income (loss) from discontinued operations, net of taxes | -2 | % | 65 | % | ||||
| Gain on disposal of discontinued oeprations, net of taxes | 0 | % | 200 | % | ||||
| Income (loss) from discontinuend operations | -2 | % | 265 | % | ||||
| Net income (loss) | 21 | % | 268 | % | ||||
| Non-controlling interest of continuing operations | 0 | % | 0 | % | ||||
| Non-controlling interest of discontinued operations | 0 | % | -3 | % | ||||
| Net income (loss) attributable to Steel Excel Inc. | 21 | % | 271 | % | ||||
| Years Ended March 31, | |||||||||
| 2010 | 2009 | 2008 | |||||||
Net revenues | 100 | % | 100 | % | 100 | % | |||
Cost of revenues (inclusive of amortization of acquisition-related intangible assets) | 55 | 57 | 61 | ||||||
Gross margin | 45 | 43 | 39 | ||||||
Operating expenses: | |||||||||
Research and development | 40 | 23 | 23 | ||||||
Selling, marketing and administrative | 44 | 30 | 35 | ||||||
Amortization of acquisition-related intangible assets | 2 | 1 | 2 | ||||||
Restructuring charges | 2 | 5 | 4 | ||||||
Goodwill impairment | — | 15 | — | ||||||
Other gains, net | — | — | (2 | ) | |||||
Total operating expenses | 88 | 74 | 62 | ||||||
Loss from continuing operations | (43 | ) | (31 | ) | (23 | ) | |||
Interest and other income, net | 14 | 18 | 22 | ||||||
Interest expense | (0 | ) | (1 | ) | (3 | ) | |||
Loss from continuing operations before income taxes | (29 | ) | (14 | ) | (4 | ) | |||
Benefit from (provision for) income taxes | 3 | 2 | (0 | ) | |||||
Income (loss) from continuing operations, net of taxes | (26 | ) | (12 | ) | (4 | ) | |||
Discontinued operations, net of taxes: | |||||||||
Loss from discontinued operations, net of taxes | — | (1 | ) | (3 | ) | ||||
Gain on disposal of discontinued operations, net of taxes | 2 | 4 | 0 | ||||||
Income (loss) from discontinued operations, net of taxes | 2 | 3 | (3 | ) | |||||
Net loss | (24 | )% | (9 | )% | (7 | )% | |||
Net Revenues.
| FY2010 | Percentage Change | FY2009 | Percentage Change | FY2008 | |||||||||||
| (in millions, except percentage) | |||||||||||||||
Net revenues | $ | 73.7 | (36 | )% | $ | 114.8 | (21 | )% | $ | 145.5 | |||||
35
Net revenues decreasedand gross margin by $41.1reportable segment for the fiscal years ended December 31, 2012 and 2011. As disclosed above, we had no continuing operations prior to fiscal 2011.
Fiscal Year Ended December 31, | ||||||||
| 2012 | 2011 | |||||||
| (in millions) | ||||||||
| Steel Energy net revenues | $ | 97.2 | $ | 1.4 | ||||
| Steel Sports net revenues | $ | 2.9 | $ | 1.1 | ||||
| Consolidated net revenues | $ | 100.1 | $ | 2.5 | ||||
| Steel Energy gross margin | $ | 31.9 | $ | 0.2 | ||||
| Steel Sports gross margin | $ | 2.1 | $ | 0.8 | ||||
| Consolidated gross margin | $ | 34.0 | $ | 1.0 | ||||
| As a % of revenues | 34 | % | 42 | % | ||||
Net revenues decreased by $30.7$100.1 million in fiscal 2009 compared to fiscal 2008, primarily due to a decline in sales volume of our parallel SCSI products of $27.52012 and gross margins increased $33.0 million and an overall decline in sales volume of our serial products sold to OEM customers of $9.3 million. This was partially offset by an increase in average selling prices and sales volumes of our serial products sold to channel customers of $6.9 million, due to increased acceptance of these products.
The decline in sales volume of our parallel SCSI products was primarily attributable to the industry transition from parallel to serial products, in which we have a lower market share. The decline in sales volume of our serial legacy products sold to OEM customers was primarily attributable to the fact that certain OEM customers have moved to other suppliers to obtain the next generation serial technologies. We expect net revenues for our parallel SCSI products and our serial legacy products sold to OEM customers to continue to decline in future quarters, regardless of whether the PMC Transaction is consummated.
Geographical Revenues and Customer Concentration
| Years Ended March 31, | |||||||||
Geographical Revenues: | 2010 | 2009 | 2008 | ||||||
North America | 40 | % | 35 | % | 37 | % | |||
Europe | 33 | % | 32 | % | 29 | % | |||
Pacific Rim | 27 | % | 33 | % | 34 | % | |||
Total Revenues | 100 | % | 100 | % | 100 | % | |||
Our Pacific Rim revenues decreased as a percentage of our total revenues by 6% in fiscal 2010 compared to fiscal 2009 primarily due to a decline in revenues from IBM, our largest customer, who purchased products primarily in this region. IBM revenues declined in fiscal 2010 compared to fiscal 2009, as we did not receive design wins for their current generation products. We expect our Pacific Rim revenues to decrease as a percentage of our total revenues in the future as we expect the revenues from IBM to continue to decline. Our North America revenues improved as a percentage of our total revenues by 5% in fiscal 2010 compared to fiscal 2009 primarily due to revenue declines from IBM in the Pacific Rim, combined with the recovery of macroeconomic conditions in North America.
Our North America revenues decreased as a percentage of our total revenues by 2% in fiscal 2009 compared to fiscal 2008 primarily due to a decline in product sales to our OEM customers and to our customers shifting their manufacturing locations from North America to international sites, and, to a lesser extent, increased sales and acceptance of our serial products sold to our channel customers at our international locations.
A small number of our customers account for a substantial portion of our net revenues. In fiscal 2010, IBM, Bell Microproducts and Ingram Micro accounted for 17%, 16% and 15% of our total net revenues, respectively. In fiscal 2009, IBM accounted for 36% of our total net revenues. In fiscal 2008, IBM accounted for 40% of our total net revenues.
Gross Margin.
| FY2010 | Percentage Change | FY2009 | Percentage Change | FY2008 | ||||||||||||||
| (in millions, except percentage) | ||||||||||||||||||
Gross Profit | $ | 33.4 | (32 | )% | $ | 49.4 | (13 | )% | $ | 56.6 | ||||||||
Gross Margin | 45 | % | 43 | % | 39 | % | ||||||||||||
Our gross margin is impacted by amounts recorded in cost of revenues, which primarily consists of direct product costs, manufacturing support costs, shipping and handling costs, warranty costs, inventory-related charges and amortization of acquisition-related intangible assets.
The improvement in gross margin in fiscal 2010 compared to fiscal 2009 was primarily due to improved standard product contributions due to a shift in revenue mix from OEM to channel customers, with channel customers having higher average margins and our end-to-end supply chain efficiencies, including a reduction to our inventory-related charges of $2.8 million. This was partially offset by an increase in the amortization of acquisition-related intangible assets of $1.2$1.0 million in fiscal 2010 compared2011 to fiscal 2009 related to the purchased intangible assets for core and existing technologies and backlog from the acquisition of Aristos in September 2008. Although our fixed operating costs declined$34.0 million in fiscal 2010 compared to fiscal 2009, our gross margins were also impacted by these costs as they were distributed over lower sales volumes.
The improvement in gross margin in fiscal 2009 compared to fiscal 2008 was due to improved standard product contributions2012 as a result of the acquisitions of all our end-to-end supply chain efficienciesSteel Energy companies. Fiscal 2012 Steel Energy net revenues included revenues from seven months of Sun Well and a reductioneleven months of Well Services (which subsequently merged with Sun Well) aggregating $70.4 million with the remainder attributable to Rogue for the entire year. Consolidated unaudited pro forma net revenues were $123.9 million in our inventory-related chargesfiscal 2012. Fiscal 2011 included revenues from six months of $3.8 million. In addition, the improvement inBaseball Heaven and one month for Rogue only. As indicated above, all net revenues and gross margins was also duefor fiscal periods prior to a shift in revenue mixour fiscal year ended December 31, 2011 were reclassified as discontinued operations.
Research and Development Expense.
| FY2010 | Percentage Change | FY2009 | Percentage Change | FY2008 | |||||||||||
| (in millions, except percentage) | |||||||||||||||
Research and Development Expense | $ | 29.5 | 9 | % | $ | 26.9 | (21 | )% | $ | 34.0 | |||||
Research and development expenses primarily consist of salaries and related costs of employees engaged in ongoing research, design and development activities and subcontracting costs. Currently, our investment in research and development primarily focuses on developing new products for external storage, storage software and server storage markets. We also invest in research and development of new technologies, including iSCSI, SATA and SAS. A portion of our research and development expense fluctuates depending on the timing of major project costs such as prototype costs. We expect our research and development expense to decline in fiscal 2011 regardless of whether the PMC Transaction is consummated.
The increase in research and development expense in fiscal 2010 compared to fiscal 2009 was primarily due to the acquisition of the Aristos engineering team in September 2008 and the costs associated with the development of our technology to achieve new OEM design wins and to expand our channel offerings as well as engineering expenses related to certain chip design projects. We also recorded certain employee retention obligations of $0.4 million and higher stock-based compensation expense of $1.3 million primarily due to the impact from the true-up of actual forfeitures that occurred in fiscal 2009, which reduced our stock-based compensation expense during that period, and to a lesser extent, the modification of certain stock-based awards that increased stock-based compensation expense in fiscal 2010. This was partially offset by the temporary reductions in employees’ compensation, which began in the first quarter of fiscal 2010.
The decrease in research and development expense in fiscal 2009 compared to fiscal 2008 was primarily due to reduced headcount and related expenses as a result of restructuring programs implemented in fiscal 2008 and fiscal 2009, combined with additional attrition in our workforce, which was reflected by a 52% decrease in our direct headcount for employees engaged in research and development. A portion of this reduction in direct headcount includes the former employees that were transferred to HCL. The headcount reductions in research and development also resulted in lower stock-based compensation expense of $2.0$28.0 million in fiscal 2009 compared to2012. Fiscal 2012 and 2011 include sales expenditures from the recently acquired businesses, while all other periods presented include administrative expenses only. In addition, fiscal 2008. This was partially offset by compensation2011 included six months of Baseball Heaven and one month or Rogue only, while fiscal 2012 includes all our newly acquired Steel Energy companies.
37
Selling, Marketing and Administrative Expense.
| FY2010 | Percentage Change | FY2009 | Percentage Change | FY2008 | |||||||||||
| (in millions, except percentage) | |||||||||||||||
Selling, Marketing and Administrative Expense | $ | 32.6 | (7 | )% | $ | 35.0 | (31 | )% | $ | 50.4 | |||||
Our selling, marketing and administrative expenseyear ended December 31, 2011 consists primarily of salaries, including commissions. We expectconsulting fees and outside service provider fees. As of December 31, 2010, we had 15 employees engaged in administrative activities but reduced staffing to one employee by May 2011. Other general and administrative positions were converted to consultants during fiscal 2011. As we continue to make acquisitions, our selling, marketinggeneral and administrative expense to decline in fiscal 2011 based on the anticipated cost savings we expect to obtain from the reductions in workforce we implemented in fiscal 2010.
may increase.
Transition Period. The decrease in selling, marketing and administrative expense in fiscal 2009the Transition Period compared to fiscal 2008 was primarily a result of reductions in our workforce and infrastructure spending due to the restructuring plans we implemented in fiscal 2008 and fiscal 2009, which resulted in a 39% decrease in our average headcount for employees engaged in selling, marketing and administrative functions. The headcount reductions also resulted in lower stock-based compensation expense of $0.9 million in fiscal 2009 compared to fiscal 2008. Thisnine-month period ended January 1, 2010 was partially offset by cash compensation expense of $1.1$0.5 million related to the management liquidation pool established formodification and settlement of certain former employeesunvested stock-based awards in the form of Aristos pursuant to the Merger Agreement.
Amortizationa fixed cash payment and expense of Acquisition-Related Intangible Assets.
| FY2010 | Percentage Change | FY2009 | Percentage Change | FY2008 | |||||||||||
| (in millions, except percentage) | |||||||||||||||
Amortization of Acquisition-Related Intangible Assets | $ | 1.3 | 72 | % | $ | 0.8 | (70 | )% | $ | 2.5 | |||||
Acquisition-related intangible assets include patents, core and existing technologies, customer relationships, trade names, and backlog. We amortize the acquisition-related intangible assets over periods which reflect the pattern in which the economic benefits of the assets are expected to be realized, which is primarily using the straight-line method over their estimated useful lives, ranging from three to sixty months. Subsequent to our fiscal year-end, as a result of the PMC Transaction and our intent to either continue to pursue the sale of the Aristos products or wind down the sale or dispose of our Aristos products within the next six months, or by September 2010, as well as our consideration of the disposition or redeployment of our remaining non-core patents and real estate assets, we are expected to change the remaining useful life of our intangible assets of $16.0$0.5 million related to a discretionary bonus offered to Mr. Quicke, our Aristos products, which in turn, we expect to change the amount amortized prospectively during each reporting period.
The increase in amortization of acquisition-related intangible assetsInterim President and Chief Executive Officer.
The decrease in amortization of acquisition-related intangible assets in fiscal 2009 compared to fiscal 2008 was primarily due to the fact that in the fourth quarter of fiscal 2008, we wrote off our intangible assets associated with our acquisition of Elipsan Limited, or Elipsan, due to a revision in our forecasts that resulted in expected negative long-term cash flows for these assets for the first time. This was offsetput into place by the amortizationend of purchased intangible assets from the Aristos acquisition for customer relationships of $0.8 million, which was recorded in fiscal 2009.
Restructuring Charges.
| FY2010 | Percentage Change | FY2009 | Percentage Change | FY2008 | |||||||||||
| (in millions, except percentage) | |||||||||||||||
Restructuring Charges | $ | 1.6 | (74 | )% | $ | 6.1 | (3 | )% | $ | 6.3 | |||||
our Transition Period. We implemented several restructuring plans during the Transition Period and fiscal years 2010 2009 and 2008.2009. The goal of these plans was to bring our operational expenses to appropriate levels relative to our net revenues, while simultaneously implementing extensive company-wide expense-control programs.
Fiscal 2010
Plan: In the third quarter of fiscalJune 2010, we committed to a new restructuring plan to better aligncompleted our operating costs withactions and notified affected employees of the continued decline in our net revenues, resulting in a restructuring chargetermination of $1.6 million in fiscal 2010. We reduced our workforcetheir employment, primarily in theengineering and general administrative functions, in connection with a restructuring plan adopted on May 6, 2010, with expected restructuring charges of $3.9 million. The execution of this restructuring plan was substantially contingent upon the sale of the our DPS Business to PMC-Sierra, which transaction was consummated on June 8, 2010, and was intended to allow us to reduce our operating expenses following such sale. Certain of the employees notified continued to provide services through December 2010 in connection with the transition services we provided to PMC-Sierra, and to a lesser extent, to assist in corporate matters, including the completion of the wind down of the Aristos Business by the end of September 2010. We incurred severance and related benefits charges of $1.4 million.$3.7 million associated with this restructuring plan, all of which $3.7 million was recorded in the Transition Period. We also consolidated our facilities further and incurred a net estimated losstermination fee of $0.2 million forin the Transition Period upon vacating the premises.
We began to achieve reductionsa facility in our annual operating expenses by approximately $3.1 million asCalifornia.
Fiscal 2009 Restructuring Plans
We recorded a total of $5.9 million in restructuring charges for plans implemented in fiscal 2009, of which $5.1 million related to severance and benefits for employee reductions worldwide and $0.8 million related to vacating certain facilities and disposing of duplicative assets.
In the first quarter of fiscal 2009, we approved and initiated a restructuring plan to (1) reduce our operating expenses due to a declining revenue base, (2) streamline our operations and (3) better align our resources with our strategic business objectives, resulting in a restructuring charge of $3.8 million in fiscal 2009. This restructuring plan included workforce reductions in all functions of the organization worldwide and consolidation of our facilities, which resulted in restructuring charges of $3.0 million and $0.8 million, respectively. Of the $3.8 million recorded in fiscal 2009 related to this restructuring plan, $0.3 million was recorded in the fourth
39
quarter of fiscal 2009, related to accrual adjustments for the additional estimated loss on our facilities and disposing of duplicative assets.
In the third quarter of fiscal 2009, we initiated additional actions to reduce expenses as our business began to be impacted by the deterioration of macroeconomic conditions, resulting in a restructuring charge of $2.1 million in fiscal 2009 related to severance and benefits for employee reductions primarily in sales, marketing and administrative functions.
Fiscal 2008 Restructuring Plans
We recorded restructuring charges of $6.7 million for plans implemented in fiscal 2008, of which $5.4 million related to severance and benefits for employee reductions worldwide and $1.3 million related to vacating redundant facilities and contract termination costs. Additional adjustments of $0.2 million were recorded in fiscal 2009 related to plans implemented in fiscal 2008 for facility costs.
In the first quarter of fiscal 2008, we approved and initiated a plan to restructure our operations to reduce our operating expenses due to a declining revenue base by eliminating duplicative resources in all functions of the organization worldwide, resulting in a restructuring charge of $1.5 million related to severance and benefits for employee reductions. In the second quarter of fiscal 2008, we initiated additional actions in an effort to better align cost structure with our anticipated OEM revenue stream and to improve our results of operations and cash flows, resulting in a restructuring charge of $5.2 million in fiscal 2008. This restructuring plan included workforce reductions and consolidation of our facilities, which resulted in restructuring charges of $3.9 million and $1.3 million, respectively. During fiscal 2009, we recorded adjustments to the fiscal 2008 restructuring plan accrual of $0.2 million related to the additional estimated loss on our facilities.
Previous Restructuring Plans
In addition, we recorded provision adjustments of $(0.4) million in fiscal 2008 related to our restructuring plans that were implemented prior to fiscal 2008, including our previous Acquisition-Related Restructuring Plan accrual (see Note 11 to the Consolidated Financial Statements), primarily related to the reduction of lease costs related to the estimated loss on our facilities.
Goodwill Impairment.
| FY2010 | Percentage Change | FY2009 | Percentage Change | FY2008 | |||||||||||
| (in millions, except percentage) | |||||||||||||||
Goodwill Impairment | $ | — | (100 | )% | $ | 16.9 | 100 | % | $ | — | |||||
Goodwill is not amortized, but instead is reviewed for impairment annually and whenever events or changes in circumstances indicate the carrying value of goodwill may not be recoverable. During the fourth quarter of fiscal 2009, we experienced a significant and continued decline in the market value of our common stock, which resulted in our market capitalization falling below our net book value. Based on our annual review of goodwill, in the fourth quarter of fiscal 2009, we recorded an impairment charge of $16.9a $0.2 million to write-off goodwill primarily due to net book value exceeding the implied fair value. For further discussion of our goodwill impairment please refer to Note 7 to the Consolidated Financial Statements.
Other Gains, Net.
| FY2010 | Percentage Change | FY2009 | Percentage Change | FY2008 | ||||||||||||
| (in millions, except percentage) | ||||||||||||||||
Other gains, net: | �� | |||||||||||||||
Impairment of intangible assets | $ | — | — | % | $ | — | (100 | )% | $ | 2.2 | ||||||
Gain on sale of buildings | — | — | % | — | 100 | % | (6.7 | ) | ||||||||
Other | — | — | % | — | (100 | )% | 0.9 | |||||||||
Total Other Gains, Net | $ | — | — | % | $ | — | 100 | % | $ | (3.6 | ) | |||||
Other gains, net primarily consisted of a gain from the sale of long-lived assets, partially offset by asset impairment chargescharged related to certain properties or assets.
Impairment of Other Intangible Assets
We performedBaseball Heaven in fiscal 2012.
Gain on Sale of Buildings
In fiscal 2007, we decided to consolidate our properties in Milpitas, California to better align our business needs with existing operations and to provide more efficient use of our facilities. In May 2007, we completed the sale of certain of these properties that were previously classified as held for sale, with proceeds aggregating $19.9 million, exceeding our carrying value of $12.5 million. Net of selling costs, we recorded a gain of $6.7 million on the sale of the properties in fiscal 2008 within “Other gains, net” in the Consolidated Statements of Operations.
Other
In fiscal 2008, we recorded a charge of $0.8 million related to costs incurred to evaluate strategic options. These charges were recorded within “Other gains, net” in the Consolidated Statements of Operations. See Note 12 to the Consolidated Financial Statements for further details.
| FY2010 | Percentage Change | FY2009 | Percentage Change | FY2008 | ||||||||||||
| (in millions, except percentage) | ||||||||||||||||
Interest and other income, net: | ||||||||||||||||
Interest income | $ | 8.5 | (50 | )% | $ | 16.9 | (41 | )% | $ | 28.7 | ||||||
Gain on sale of marketable equity securities | — | (100 | )% | 2.3 | 100 | % | — | |||||||||
Gain on sale of investments | 0.4 | 100 | % | — | — | % | — | |||||||||
Gain on settlement of class action suit | 0.9 | 100 | % | — | — | % | — | |||||||||
Gain on extinguishment of debt, net | — | (100 | )% | 1.6 | 100 | % | — | |||||||||
Realized currency transaction gains (losses) | 0.4 | n/a | (0.8 | ) | n/a | % | 2.5 | |||||||||
Other | 0.2 | (81 | )% | 1.0 | 686 | % | 0.1 | |||||||||
Total Interest and Other Income, Net | $ | 10.4 | (50 | )% | $ | 21.0 | (33 | )% | $ | 31.3 | ||||||
Net
The decrease in interest and other income, net, in fiscal 2010the Transition Period compared to fiscal 2009 was primarily due to a decrease in interest earned on lower average cash balances as we used cash for the repurchase of certain portions of our 3/4% Notes and for the acquisition of Aristos in fiscal 2009, combined with lower interest rates. This was
41
partially offset by the receipt of $0.9 million from Micron Technology, Inc. as part of a class action settlement regarding DRAM antitrust matters and a gain of $0.4 million from the sale of an investment in a non-controlling interest of a non-public company.
The decrease in interest and other income, net, in fiscal 2009 compared to fiscal 2008nine-month period ended January 1, 2010 was primarily due to lower interest rates combined with interest earned on lower averageour cash, balances. In addition,cash equivalents and marketable securities' balances and gains of $1.3 million recognized in fiscal 2009, we experienced realized losses on our foreign currency transactions as comparedthe nine-month period ended January 1, 2010 related to realized gains in fiscal 2008 due tothe settlement of a weaker Euroclass action suit and Pound compared to United States Dollar, which was applied to our foreign currency entities. This was partially offset by a recorded gain, net of selling costs, of $2.3 million on the sale of marketable equity securities of a publicly traded company, and a gain on extinguishment of debt of $1.7 million (net of unamortized debt issuance costs) on the repurchase of our 3/4% Notes on the open market in fiscal 2009.
Interest Expense.
| FY2010 | Percentage Change | FY2009 | Percentage Change | FY2008 | ||||||||||||||
| (in millions, except percentage) | ||||||||||||||||||
Interest Expense | $ | (0.0 | ) | (100 | )% | $ | (1.2 | ) | (66 | )% | $ | (3.6 | ) | |||||
Interest expense is primarily associated with our 3/4% Notes issued in December 2003. The decrease in interest expense in fiscal 2010 compared to fiscal 2009 and fiscal 2009 compared to fiscal 2008 were primarily due to the reduction in the outstanding principal amount plus premium of the 3/4% Notes of $225.0 million, which was paid throughout fiscal 2009. We have repurchased all but $0.3 million of our 3/4% Notes as of March 31, 2010 and will not incur significant interest expense from these notes in future periods.
an investment.
| FY2010 | Percentage Change | FY2009 | Percentage Change | FY2008 | |||||||||||
| (in millions, except percentage) | |||||||||||||||
Benefit From (Provision For) Income Taxes | $ | 2.5 | (5 | )% | $ | 2.6 | n/a | $ | (0.0 | ) | |||||
For fiscal years 2010Taxes
In fiscal 2010, our tax benefit included discrete tax benefits of $1.3 million related to additional tax refunds that became available to us during fiscal 2010rates also include the Company realizing certain currency translation gains due to substantial liquidation of certain of its foreign subsidiaries and the enactmentreceipt of dividends from foreign subsidiaries.
In fiscal 2009, we recorded a net tax benefit of $1.4 million, which included the reversal of previously accrued liabilities related to reaching final settlement with the Singapore Tax Authorities for fiscal years 1998 through 2000 and the lapsing of the statute of limitations on a pre-acquisition tax issue related to Eurologic. This was offset by
changes in judgment related to on-going audits in our foreign jurisdictions and new foreign tax issues that were identified, which included our tax exposures that pre-date our acquisition of ICP vortex Computersysteme GmbH, or ICP vortex, resulting in increases in our liabilities for uncertain tax positions. Changes to the liabilities for uncertain tax benefits related to the Eurologic and ICP vortex items were recorded as part of the tax provision as opposed to adjusting amounts to purchase accounting as no goodwill or related intangible assets existed at March 31, 2009, due to impairments or the full amortization of intangible assets in previous fiscal years. In fiscal 2009, we also recorded a favorable tax impact due from the state of California, including accrued and unpaid interest, of approximately $1.6 million due to notices received from the California Franchise Tax Board in January 2009 as a result of their review of our amended fiscal years 1994 through 2003 tax returns. These notices indicated that certain adjustments were to be made in conjunction with adjustments made on our amended Federal tax returns for those fiscal years, due to reaching resolutions with the United States taxing authorities on all outstanding audit issues, as further discussed in Note 14 to the Consolidated Financial Statements.
We have concluded our negotiations with the IRS taxing authorities with regard to our tax disputes for our fiscal years 1994 through 2006, as discussed in Note 14 to the Consolidated Financial Statements. In fiscal 2009, the IRS issued a No Change Report indicating no change to our tax liability; however, the IRS continues to have the ability to adjust tax attributes relating to these years in subsequent audits. We believe that we have provided sufficient tax provisions for these years and that the ultimate outcome of any future IRS audits that include the tax attributes will not have a material adverse impact on our financial position or results of operations in future periods. The tax authorities in the foreign jurisdictions that we operate in continue to audit our tax returns for fiscal years subsequent to 1999. The potential outcome of these audits is uncertain and could result in material tax provisions or benefits in future periods. However, we cannot predict with certainty how these matters will be resolved and whether we will be required to make additional tax payments and believe that we have provided sufficient tax provisions for the tax exposures in our foreign jurisdictions.
We are2003.
We had a valuation allowance for deferredmonths; however, tax assetsaudits remain open and the outcome of $81.2 million and $75.9 million at March 31, 2010 and 2009, respectively, as we determined that it was more likely than not that all of our net U.S. deferredany tax assets will not be realized. This resultedaudits are inherently uncertain, which could change this judgment in an increase to the valuation allowance by $5.3 million and $31.4 million during the years ended March 31, 2010 and 2009, respectively. Factors that led to this conclusion included, but were not limited to, our past operating results, cumulative tax losses in the United States and uncertain future income on a jurisdiction by jurisdiction basis. We continuously monitor the circumstances impacting the expected realization of our deferred tax assets on a jurisdiction by jurisdiction basis.
any given quarter.
| FY2010 | Percentage Change | FY2009 | Percentage Change | FY2008 | |||||||||||
| (in millions, except percentage) | |||||||||||||||
Income (Loss) From Discontinued Operations, Net of Taxes | $ | 1.2 | (67 | )% | $ | 3.8 | n/a | $ | (4.2 | ) | |||||
43
Taxes
The change in discontinued operations in fiscal 2009 compared to fiscal 2008 was primarily driven by the sale of the Snap Server NAS business to Overland in June 2008. We recorded a gain of $4.6 million on the disposal of the Snap Server NAS business in fiscal 2009 in “Gain on disposal of discontinued operations, net of taxes,” which included a $1.2 million reserve on the receivable that was due to us 12 months after the closing of the transaction due to the financial difficulties Overland has reported, andalso incurred a “Loss“Income (loss) from discontinued operations, net of taxes” of $0.9$(18.1) million and $(3.3) million in the Consolidated Statements of Operations.
Transition Period and nine-month period ended January 1, 2010, respectively, related to the Aristos Business, DPS Business and Snap Server NAS business.
CrossFit Torrance. The decrease in working capital at MarchDecember 31, 20092011 compared to MarchDecember 31, 20082010 of $39.4$32.7 million wasis primarily attributable to (1) a decrease in total current assetsour acquisitions of $272.0 primarily driven by the utilization of $222.9 million to repurchase our 3/4% NotesBaseball Heaven, The Show, and to a lesser extent, $38.0 million of cash used to acquire Aristos; (2) a decrease in accounts receivable of $11.5 million primarily due to lower revenue levels and our improved collection efforts; (3) a decrease in inventory of $5.8 million due to improved efficiencies in our inventory and operations management; and (4) decreases in the combined balances of prepaid expenses and other current assets of $3.4 million as well as accounts payables and accrued liabilities of $7.7 as we operate on a smaller business scale, which included reducing and streamlining our operating expenses. These decreasesRogue that were offset by our positive cash flows from operations.
made with cash.
2011. The declineincrease in cash provided by operations is primarily the result of our acquisitions of operating activities was primarily due to an increasebusinesses in loss from continuing operations, net of taxes of $4.7 million, a non-cash charge related to a gain on extinguishment of debt of $1.7 million recorded in fiscal 20092011 and a decrease in inventory-related charges of $2.8 million. This was offset by changes in working capital assets and liabilities that decreased cash provided by operations by $4.6 million, an increase in non-cash charges related to depreciation and amortization of $2.3 million primarily due to the amortization of purchased intangible assets from the Aristos acquisition in September 2008 and an increase in stock-based compensation of $2.7 million due primarily to the modification of certain stock-based awards in fiscal 2010 and the impact caused by the true-up of actual forfeitures in fiscal 2009, which reduced our stock-based compensation expense during that period. In fiscal 2010, cash received from customers totaled $77.9 million and cash paid to suppliers and employees for payroll totaled $96.3 million. In fiscal 2010, income from continuing operations, net of taxes, included interest income of $8.5 million.
The decline in cash provided by operating activities in fiscal 2009 compared to fiscal 2008 was primarily due to changes in working capital assets and liabilities that decreased cash provided by operations by $9.3 million, an increase in loss from continuing operations, net of taxes by $8.6 million and a decrease in inventory-related charges of $3.8 million. This was offset by a non-cash charge due to the impairment of goodwill of $16.9 million recorded in fiscal 2009. In fiscal 2009, cash received from customers totaled $126.2 million and cash paid to suppliers and employees for payroll totaled $138.7 million. In fiscal 2009, loss from continuing operations, net of taxes, included interest income of $16.9 million.
2012.
Common Stock Repurchase Program
pursuant to the program at an average price of $24.82 for an aggregate repurchase price of $2.8 million, excluding brokerage commissions.
price were adjusted retroactively to give effect to the Reverse/Forward Split.
45
Our
In the fourth quarter
If the PMC Transaction is not consummated, we may enter into strategic alliances or partnerships that will enable us to better scale our operations relative to our cost basis. If we are successful in identifying attractive strategic alliances or partnerships, we may be required to use a significant portion of our available cash balances.
After taking into consideration the PMC Transaction, we expectbalances for such acquisitions or for working capital expenditures of approximately $0.2 million during fiscal 2011, without taking into account identifying and acquiring new, profitable business operations.
needs thereafter.
in seeking business acquisition opportunities and other actions to redeploy our capital. In addition, shouldfuture, prevailing economic conditions and/or financial, business and other factors beyond our control could adversely affect our estimates of our future cash requirements,requirements. As such, we wouldcould be required to fund our cash requirements by alternative financing. In these instances, we may seek to raise such additional funds through public or private equity or debt financings or from other sources. WeAs a result, we may not be able to obtain adequate or favorable equity financing, at that time.if needed, due in part to our shares of common stock currently trading on the OTCQB Market. Any equity financing we obtain may dilute existing ownership interests, and any debt financing could contain covenants that impose limitations on the conduct of our business. There can be no assurance that additional financing, if needed, would be available on terms acceptable to us or at all.
We
Risks and Uncertainties
In December 2009, we announced that we initiated a process to pursue the potential sale or disposition
Annual Report on Form 10-K.
In fiscal 2009, we repurchased a total of $191.0 million in principal amount of our 3/4% Notes on the open market for an aggregate price of $188.9 million, resulting in a gain on extinguishment of debt of $1.7 million (net of unamortized debt issuance costs of $0.4 million), which was recorded within “Interest and other income, net” in the Consolidated Statements of Operations. In addition, the majority of the remaining holders of the 3/4% Notes exercised their put option in December 2008 and January 2009, which required us to purchase our 3/4% Notes at a price equal to 100.25% of the principal of the 3/4% Notes, resulting in the redemption of the 3/4% Notes for an aggregate cost of $34.0 million, plus accrued and unpaid interest.
47
excluding, the redemption date. We may seek to make open market repurchases of the remaining balance of our 3/4% Notes within the next twelve months (See Note 89 to the Consolidated Financial Statements for a detailed discussion of our debt and equity transactions)discussion).
Intellectual Property and Other Indemnification Obligations
We have entered into agreements with customers and suppliers that include intellectual property indemnification obligations. These indemnification obligations generally require us to compensate the other party for certain damages and costs incurred as a result of third party intellectual property claims arising from these transactions. In each of these circumstances, payment by us is conditional on the other party making a claim pursuant to the procedures specified in the particular contract, which procedures typically allow us to challenge the other party’s claims. Further, our obligations under these agreements may be limited in terms of time and/or amount, and in some instances, we may have recourse against third parties for certain payments made by it under these agreements. In addition, we have agreements whereby we indemnify our directors and certain of our officers for certain events or occurrences while the officer or director is, or was, serving at our request in such capacity. These indemnification agreements are not subject to a maximum loss clause; however, we maintain a director and officer insurance policy which may cover all or a portion of the liabilities arising from our obligation to indemnify our directors and officers. It is not possible to make a reasonable estimate of the maximum potential amount of future payments under these or similar agreements due to the conditional nature of our obligations and the unique facts and circumstances involved in each particular agreement. Historically, we have not incurred significant costs to defend lawsuits or settle claims related to such agreements and no amount has been accrued in the accompanying Consolidated Financial Statements with respect to these indemnification guarantees.
| Payments Due By Period | |||||||||||||||
Contractual Obligations (in thousands) | Total | Less than 1 year | 1-3 years | 3-5 years | More than 5 years | ||||||||||
Long-term debt(1) | $ | 349 | $ | 349 | $ | — | $ | — | $ | — | |||||
Operating lease obligations(2) | 3,443 | 2,329 | 1,020 | 94 | — | ||||||||||
Purchase obligations(3) | 12,405 | 12,405 | — | — | — | ||||||||||
Other long-term liabilities(4) | 934 | — | — | — | 934 | ||||||||||
Tax obligations(5) | 3,656 | — | 3,656 | — | — | ||||||||||
HCL agreement(6) | 2,866 | 2,116 | 750 | — | — | ||||||||||
Certain compensation costs(7) | 1,241 | 1,241 | — | — | — | ||||||||||
Total | $ | 24,894 | $ | 18,440 | $ | 5,426 | $ | 94 | $ | 934 | |||||
| Payments Due By Period | ||||||||||||||||||||
| Total | Less than 1 year | 1-3 Years | 3-5 Years | More than 5 Years | ||||||||||||||||
| (in thousands) | ||||||||||||||||||||
Short-term debt(1) | $ | 346 | $ | 346 | $ | - | $ | - | $ | - | ||||||||||
Operating lease obligations(2) | 1,990 | 509 | 1,444 | 37 | - | |||||||||||||||
Capital lease obligations(3) | 1,550 | 490 | 1,060 | - | - | |||||||||||||||
Tax obligations(4) | 7,340 | - | 7,340 | - | - | |||||||||||||||
Long-term debt(5) | 13,000 | 4,000 | 9,000 | - | - | |||||||||||||||
| Total | $ | 24,226 | $ | 5,345 | $ | 18,844 | $ | 37 | $ | - | ||||||||||
| (1) | ||
| (2) | Operating lease obligations | |
| (3) | Capital lease obligations related to | |
|
| (4) |
| Tax obligations relate to liabilities for uncertain tax positions, which were reflected in “Other long-term liabilities.” The timing of any payments | ||
Our channel arrangements provide for certain product rotation rights. Additionally, we permit the return of products subject to certain conditions. We establish allowances for expected product returns. We also establish allowances for rebate payments under certain marketing programs entered into by our channel partners. These
49
allowances are recorded as direct reductions of revenue and accounts receivable. We make estimates of future returns and rebates based primarily on our past experience as well as the volume of productsprinciples generally accepted in the channel, trendsUnited States of America fair value hierarchy prioritizes observable and unobservable inputs used to measure fair value into three broad levels, as described below:
We maintain an allowance for doubtful accounts for losses that we estimate will arise from our customers’ inabilitylowest priority to make required payments. We make estimates of the collectibility of our accounts receivable by considering factors such as historical bad debt experience, specific customer creditworthiness, the age of the accounts receivable balances and current economic trends that may affect a customer’s ability to pay. If the financial condition of our customers deteriorates or if economic conditions worsen, increases in the allowance for doubtful accounts may be required in the future. We cannot predict future changes in the financial stability of our customers, and there can be no assurance that our allowance for doubtful accounts will be adequate.
Level 3 inputs.
| Steel Sports | Steel Energy | |||||||
| (in years) | ||||||||
| Buildings, improvements and sports fields | 10-25 | 7-39 | ||||||
| Rigs and workover equipment | N/A | 7-15 | ||||||
| Other equipment | 5-10 | 4-7 | ||||||
| Vehicles | N/A | 4-7 | ||||||
| Furniture and fixtures | 5 | 5 | ||||||
United States. Baseball Heaven is included in Steel Sports.
The recoverabilitycontingent consideration liability of the carrying value of the long-lived assets, other than goodwill, is$1.2 million pursuant to an earn-out clause based on the estimated future undiscounted cash flows derived fromachievement of certain performance levels. This acquisition marked the uselaunch of our new strategy to focus a portion of our acquisition efforts on new opportunities in the United States oilfield service industry presented by technological advances in supporting horizontal drilling and hydraulic fracturing. Rogue provides snubbing services (controlled installation and removal of all tubulars - drill strings and production strings) in and out of the asset. If a long-lived asset is determined to be impaired, the loss is measured based on the difference between the long-lived asset’s fair value and its carrying value. The estimate of fair value of long-lived assets is based on a discounted estimated future cash flows method and applying a discount rate commensuratewellbore with the risks inherentwell under full pressure, flowtesting, and hydraulic work over/simultaneous operations (allows customers to perform multiple tasks on multiple wells on one pad at the same time). Rogue is included in Steel Energy.
Impairment Review
In December 2009,Williston Basin of North Dakota and Montana.
51
Acquisitions
On September 3, 2008, we completed the acquisition of Aristos, a provider of RAID technology to the data storage industry. The Merger Agreement provided for our acquisition of Aristos through a merger in which Aristos became our wholly-owned subsidiary. The acquisition of Aristos was to allow us to expand into adjacent RAID markets that we believed would provide us with growth opportunities, including blade servers, enterprise-class external storage systems and performance desktops, and would provide us with a strong ASIC roadmap. In addition, this acquisition enabled us to pursue new OEM opportunities and expand our channel product offerings containing unified serial technologies.
We acquired Aristos for a purchase price of approximately $38.9 million, which consisted of: (i) approximately $28.7 million that was paid to certain Aristos senior preferred stockholders and warrant holders; (ii) approximately $3.2 million under a management liquidation pool established by Aristos prior to completion of the merger, which was immediately paid upon closing of the transaction; (iii) approximately $6.2 million to retire and satisfy certain commercial obligations and payables of Aristos; and (iv) $0.8 million accrued in direct transaction fees, including legal, valuation and accounting fees.
Aristos Holdback: A portion of the Aristos acquisition price totaling $4.3 million referred to herein as the Aristos Holdback, was held in an escrow account to secure potential indemnification obligations of Aristos stockholders for unknown liabilities that may have existed as of the acquisition date. The Aristos Holdback was to be paid in two installments to the former Aristos stockholders during the twelfth and eighteenth months after the acquisition closing date, except for funds necessary to provide for any pending claims. The Aristos Holdback of $4.3 million was paid in full in fiscal 2010.
Management Liquidation Pool:newly formed CrossFit Torrance. As part of the Merger Agreement,transaction, we also agreed to pay certain former employees of Aristos a total of $5.6loan CrossFit Torrance up to $1.1 million through a management liquidation pool established by Aristos prior to the completion of the merger. Of the $5.6 million, $3.2 million was immediately paid upon closing of the transactionfund leasehold improvements and wasequipment. Both CrossFit companies provide strength and conditioning services and are included in Steel Sports.
The Aristos acquisition was accounted for as a business combination and, accordingly, the results of Aristos have been included in our consolidated results of operations and financial position from the date of acquisition. The allocation of the Aristos purchase price to the tangible and identifiable intangible assets acquired and liabilities assumed was based on valuation techniques such as the discounted cash flows and weighted average cost methods used in the high technology industry using assumptions and estimates from management to calculate fair value.
Dispositions
On June 27, 2008, we entered into an asset purchase agreement with Overland for the sale of the Snap Server NAS business for $3.3DPS Business was $34.3 million, of which $2.1$29.3 million was received by us upon the closing of the transaction and the remaining $1.2$5.0 million was withheld in an escrow account (“DPS Holdback”). The DPS Holdback was released to be receivedus on June 8, 2011, one year after the twelve-month anniversaryconsummation of the closing ofsale, except for $0.1 million to provide for one disputed claim, and was recognized as contingent consideration in discontinued operations when received. The $0.1 million was received in September 30, 2011.
Operations. The gain recorded in fiscal 2010 was based on the cash received in connection with the amended promissory note agreement with Overland. To date, weprior periods have recorded a cumulative gain of $5.8 million through fiscal 2010 on the disposal of the Snap Server NAS business in “Gain on disposal of discontinued operations, net of taxes,” in the Consolidated Statements of Operations.
been reclassified to conform to this presentation.
53
See the index appearing under
supplementary data.
2012.
None.
Executive Officers and Directors
Information with respect to our executive officers, including their name, age, respective positions with Adaptec and biographical information as of May 12, 2010 are set forth below.
John J. Quicke has served as a member of our Board of Directors since 2007. In January 2010, Mr. Quicke was appointed to serve as our Interim President and Chief2013.
Compensation
Section 16(a) Beneficial Ownership Reporting Compliance
Information with respect to compliance by our directors, executive officers and 10% or greater stockholders with Section 16(a) of the Exchange Act required by this Item is incorporated in this Annual Report on Form 10-K by reference to the information under the caption “Section 16(a) Beneficial Ownership Reporting Compliance” of our Proxy Statement for our Annual Meeting of Stockholders to be held in 2010.
Audit Committee
Information regarding the Audit Committee of our Board of Directors and our Audit Committee financial expert is incorporated by reference from the information under the caption: “Proposal No. 1—Election of Directors” of the Proxy Statement for our Annual Meeting of Stockholders to be held in 2010.
55
Code of Conduct
We maintain a Code of Business Conduct, Ethics, and Compliance, which incorporates our code of ethics that is applicable to all employees, including all officers, and our independent directors with regard to their Adaptec-related activities. The Code of Business Conduct, Ethics, and Compliance incorporates our guidelines designed to deter wrongdoing and to promote honest and ethical conduct and compliance with applicable laws and regulations. It also incorporates our expectations of our employees that enable us to provide accurate and timely disclosure in our filings with the SEC, and other public communications. In addition, it incorporates our guidelines pertaining to topics such as health and safety compliance; diversity and non-discrimination; supplier expectations; and privacy. The full text of the Code of Business Conduct, Ethics, and Compliance is published on our website under Corporate Governance at http://investor.adaptec.com. We will post any amendments to the Code of Business Conduct, Ethics, and Compliance, as well as any waivers that are required to be disclosed by the rules of either the SEC or The NASDAQ Stock Market, on our website.
Stockholder Nominations of Directors
During fiscal 2010, we did not make any material changes to the procedures by which our security holders may recommend nominees to our Board of Directors.
Item 11.Executive Compensation
Information with respect to executive compensation required by this Item is incorporated in this Annual Report on Form 10-K by reference to the information under the captions “Executive Compensation,” “Compensation Committee Interlocks and Insider Participation” and “Compensation Committee Report” of our Proxy Statement, to be filed with the SEC within 120 days after the end of the fiscal year covered by this Annual Report, for our Annual Meeting of Stockholders to be held in 2010.
2013.
2013.
Information with respect to certain relationships of our directors, executive officers and 5% stockholders and related transactions required by this Item is incorporated in this Annual Report on Form 10-K by reference to the information under the caption “Transactions with Related Persons” of our Proxy Statement for our Annual Meeting of Stockholders to be held in 2010.
2013.
| (a) | The following documents are filed as |
| 1. | Index to Financial Statements |
| Page | ||
| ||
| F-1 | ||
| Independent Registered Public Accounting Firm on Internal Control Over Financial Reporting | F-2 |
| Report of Predecessor Independent Registered Public Accounting Firm | F-3 | |
| Consolidated Statements of Operations for the fiscal years ended December 31, 2012 and 2011, and the nine-month transition period ended December 31, 2010 | F-4 | |
| F-5 | ||
| Consolidated Balance Sheets as of December 31, 2012 and 2011 | F-6 | |
| Consolidated Statement of Stockholders’ Equity for the fiscal years December 31, 2012 and 2011, and the nine-month transition period ended December 31, 2010 | F-7 | |
| Consolidated Statements of Cash | ||
| ||
| F-9 | ||
| 2. | ||
|
| ||
| 3. | ||
| Exhibits | |
| (b) | Exhibits – see item 15(a)(3) above. |
See Item 15(a)(3), above.
| (c) | Financial Statement Schedules – see Item 15(a)(2) above. |
See Item 15(a)(2), above.
57
To the
In our opinion, the consolidated financial statements listed in the index appearing under Item 15(a)(1), present fairly, in all material respects, the financial position (formerly ADPT Corporation) as of Adaptec, Inc.December 31, 2012 and its subsidiaries at March 31, 2010 and March 31, 2009,2011 and the resultsrelated consolidated statements of their operations, comprehensive income (loss), stockholders’ equity and their cash flows for eachthe years then ended. In connection with our audits of the three years in the period ended March 31, 2010 in conformity with accounting principles generally accepted in the United States of America. In addition, in our opinion, the2012 and 2011 financial statement schedule listed in the index appearing under Item 15(a)(2) presents fairly, in all material respects, the information set forth therein when read in conjunction with the related consolidated financial statements. Also in our opinion, the Company maintained, in all material respects, effective internal control over financial reportingstatements, we have also audited Schedule II – Valuation and Qualifying Accounts as of Marchand for the years ended December 31, 2010, based on criteria established inInternal Control—Integrated Framework issued by the Committee of Sponsoring Organizations of the Treadway Commission (COSO). The Company’s management is responsible for these2012 and 2011. These financial statements and financial statement schedule for maintaining effective internal control over financial reporting and for its assessmentare the responsibility of the effectiveness of internal control over financial reporting, included in Management’s Report on Internal Control over Financial Reporting, appearing under Item 9A.Company’s management. Our responsibility is to express opinionsan opinion on these financial statements on the financial statementand schedule and on the Company’s internal control over financial reporting based on our integrated audits.
As discussed in Note 14 to the Consolidated Financial Statements, effective April 1, 2007, the Company changed the manner in which it accounts for uncertain tax positions.
opinion.
F-1
| Years Ended March 31, | ||||||||||||
| 2010 | 2009 | 2008 | ||||||||||
| (in thousands, except per share amounts) | ||||||||||||
Net revenues | $ | 73,682 | $ | 114,774 | $ | 145,501 | ||||||
Cost of revenues (inclusive of amortization of acquisition-related intangible assets) | 40,288 | 65,413 | 88,925 | |||||||||
Gross profit | 33,394 | 49,361 | 56,576 | |||||||||
Operating expenses: | ||||||||||||
Research and development | 29,486 | 26,929 | 33,966 | |||||||||
Selling, marketing and administrative | 32,600 | 34,995 | 50,432 | |||||||||
Amortization of acquisition-related intangible assets | 1,300 | 758 | 2,535 | |||||||||
Restructuring charges | 1,608 | 6,092 | 6,273 | |||||||||
Goodwill impairment | — | 16,947 | — | |||||||||
Other gains, net | — | — | (3,594 | ) | ||||||||
Total operating expenses | 64,994 | 85,721 | 89,612 | |||||||||
Loss from continuing operations | (31,600 | ) | (36,360 | ) | (33,036 | ) | ||||||
Interest and other income, net | 10,461 | 21,008 | 31,335 | |||||||||
Interest expense | (6 | ) | (1,229 | ) | (3,646 | ) | ||||||
Loss from continuing operations before income taxes | (21,145 | ) | (16,581 | ) | (5,347 | ) | ||||||
Benefit from (provision for) income taxes | 2,475 | 2,605 | (25 | ) | ||||||||
Loss from continuing operations, net of taxes | (18,670 | ) | (13,976 | ) | (5,372 | ) | ||||||
Discontinued operations, net of taxes: | ||||||||||||
Loss from discontinued operations, net of taxes | — | (941 | ) | (4,722 | ) | |||||||
Gain on disposal of discontinued operations, net of taxes | 1,236 | 4,727 | 479 | |||||||||
Income (loss) from discontinued operations, net of taxes | 1,236 | 3,786 | (4,243 | ) | ||||||||
Net loss | $ | (17,434 | ) | $ | (10,190 | ) | $ | (9,615 | ) | |||
Basic and diluted income (loss) per share: | ||||||||||||
Loss from continuing operations, net of taxes | $ | (0.16 | ) | $ | (0.12 | ) | $ | (0.05 | ) | |||
Income (loss) from discontinued operations, net of taxes | $ | 0.01 | $ | 0.03 | $ | (0.04 | ) | |||||
Net loss | $ | (0.15 | ) | $ | (0.09 | ) | $ | (0.08 | ) | |||
Shares used in computing income (loss) per share: | ||||||||||||
Basic and diluted | 119,196 | 119,767 | 118,613 | |||||||||
See accompanying Notes to the Consolidated Financial Statements.
CONSOLIDATED BALANCE SHEETS
| March 31, | ||||||
| 2010 | 2009 | |||||
| (in thousands, except par value) | ||||||
Assets | ||||||
Current assets: | ||||||
Cash and cash equivalents | $ | 63,948 | $ | 111,724 | ||
Marketable securities | 311,399 | 264,868 | ||||
Accounts receivable, net of allowance for doubtful accounts of $34 in 2010 and $46 in 2009 | 7,528 | 11,735 | ||||
Inventories | 2,342 | 4,095 | ||||
Prepaid expenses | 2,354 | 2,257 | ||||
Other current assets | 11,269 | 14,793 | ||||
Total current assets | 398,840 | 409,472 | ||||
Property and equipment, net | 11,353 | 11,664 | ||||
Intangible assets, net | 16,029 | 19,748 | ||||
Other long-term assets | 2,854 | 9,223 | ||||
Total assets | $ | 429,076 | $ | 450,107 | ||
Liabilities and Stockholders’ Equity | ||||||
Current liabilities: | ||||||
Accounts payable | $ | 9,188 | $ | 10,528 | ||
Accrued and other liabilities | 12,271 | 13,251 | ||||
3/4% Convertible Senior Subordinated Notes due 2023 | 346 | 474 | ||||
Total current liabilities | 21,805 | 24,253 | ||||
Other long-term liabilities | 4,755 | 7,310 | ||||
Deferred income taxes | 4,813 | 7,664 | ||||
Total liabilities | 31,373 | 39,227 | ||||
Commitments and contingencies (Note 10) | ||||||
Stockholders’ equity: | ||||||
Preferred stock; $0.001 par value | ||||||
Authorized shares, 1,000; Series A shares, 250 designated; outstanding shares, none | — | — | ||||
Common stock; $0.001 par value | ||||||
Authorized shares, 400,000; outstanding shares, 120,401 as of March 31, 2010 and 120,711 as of March 31, 2009 | 119 | 120 | ||||
Additional paid-in capital | 203,229 | 200,293 | ||||
Accumulated other comprehensive income, net of taxes | 4,286 | 2,964 | ||||
Retained earnings | 190,069 | 207,503 | ||||
Total stockholders’ equity | 397,703 | 410,880 | ||||
Total liabilities and stockholders’ equity | $ | 429,076 | $ | 450,107 | ||
Fiscal Year Ended December 31, | Nine-Month Fiscal Year | |||||||||||
| 2012 | 2011 | 2010 | ||||||||||
| Net revenues | $ | 100,104 | $ | 2,502 | $ | - | ||||||
| Cost of revenues | 66,064 | 1,459 | - | |||||||||
| Gross margin | 34,040 | 1,043 | - | |||||||||
| Operating expenses | ||||||||||||
| Selling, general and administrative | 28,031 | 9,585 | 11,045 | |||||||||
| Impairment of goodwill | 192 | - | - | |||||||||
| Restructuring charges | - | (31 | ) | 3,944 | ||||||||
| Total operating expenses | 28,223 | 9,554 | 14,989 | |||||||||
| Operating income (loss) | 5,817 | (8,511 | ) | (14,989 | ) | |||||||
| Interest and other income, net | 1,067 | 8,358 | 5,208 | |||||||||
| Interest expense | (417 | ) | (5 | ) | (3 | ) | ||||||
| Income (loss) from continuing operations before income taxes | 6,467 | (158 | ) | (9,784 | ) | |||||||
| Benefit from (provision for) income taxes | 15,712 | 226 | (7,602 | ) | ||||||||
| Income (loss) from continuing operations, net of taxes | 22,179 | 68 | (17,386 | ) | ||||||||
| Income (loss) from discontinued operations, net of taxes | (1,935 | ) | 1,624 | (11,289 | ) | |||||||
| Gain on disposal of discontinued operations, net of taxes | - | 5,005 | 10,916 | |||||||||
| Income (loss) from discontinued operations | (1,935 | ) | 6,629 | (373 | ) | |||||||
| Net income (loss) | 20,244 | 6,697 | (17,759 | ) | ||||||||
| Net loss attributable to non-controlling interests in consolidated entities | ||||||||||||
| Continuing operations | (22 | ) | - | - | ||||||||
| Discontinued operations | (427 | ) | (72 | ) | - | |||||||
| (449 | ) | (72 | ) | - | ||||||||
| Net income (loss) attributable to Steel Excel Inc. | $ | 20,693 | $ | 6,769 | $ | (17,759 | ) | |||||
| Basic income (loss) per share: | ||||||||||||
| Income (loss) from continuing operations, net of taxes | $ | 1.83 | $ | 0.01 | $ | (1.50 | ) | |||||
| Income (loss) from discontinued operations, net of taxes | $ | (0.16 | ) | $ | 0.61 | $ | (0.03 | ) | ||||
| Net income (loss) attributable to Steel Excel Inc. | $ | 1.71 | $ | 0.62 | $ | (1.53 | ) | |||||
| Diluted income (loss) per share: | ||||||||||||
| Income (loss) from continuing operations, net of taxes | $ | 1.83 | $ | 0.01 | $ | (1.50 | ) | |||||
| Income (loss) from discontinued operations, net of taxes | $ | (0.16 | ) | $ | 0.61 | $ | (0.03 | ) | ||||
| Net income (loss) attributable to Steel Excel Inc. | $ | 1.71 | $ | 0.62 | $ | (1.53 | ) | |||||
| Shares used in computing income (loss) per share: | ||||||||||||
| Basic | 12,110 | 10,882 | 11,609 | |||||||||
| Diluted | 12,133 | 10,897 | 11,609 | |||||||||
F-3
| Years Ended March 31, | ||||||||||||
| 2010 | 2009 | 2008 | ||||||||||
| (in thousands) | ||||||||||||
Cash Flows From Operating Activities: | ||||||||||||
Net loss | $ | (17,434 | ) | $ | (10,190 | ) | $ | (9,615 | ) | |||
Less: Income (loss) from discontinued operations, net of taxes | 1,236 | 3,786 | (4,243 | ) | ||||||||
Loss from continuing operations, net of taxes | (18,670 | ) | (13,976 | ) | (5,372 | ) | ||||||
Adjustments to reconcile loss from continuing operations, net of taxes, to net cash provided by operating activities of continuing operations: | ||||||||||||
Stock-based compensation expense | 5,816 | 3,159 | 5,999 | |||||||||
Inventory-related charges (credit) | (847 | ) | 1,987 | 5,753 | ||||||||
Depreciation and amortization | 10,051 | 7,801 | 7,840 | |||||||||
Impairment of goodwill and intangible assets | — | 16,947 | 2,205 | |||||||||
Gain on sale of long-lived assets | — | — | (6,735 | ) | ||||||||
Gain on sale of investments | (440 | ) | (2,255 | ) | — | |||||||
Gain on extinguishment of debt | — | (1,643 | ) | — | ||||||||
Other non-cash items | 47 | 346 | 751 | |||||||||
Changes in assets and liabilities, net of effects from the purchase of Aristos Logic Corporation: | ||||||||||||
Accounts receivable | 4,207 | 12,145 | 10,920 | |||||||||
Inventories | 2,600 | 2,297 | 11,140 | |||||||||
Prepaid expenses and other current assets | 1,959 | 4,031 | 6,506 | |||||||||
Other assets | 6,367 | (4,738 | ) | 2,497 | ||||||||
Accounts payable | (1,331 | ) | (2,036 | ) | (15,878 | ) | ||||||
Other liabilities | (7,582 | ) | (10,057 | ) | (4,206 | ) | ||||||
Net Cash Provided by Operating Activities of Continuing Operations | 2,177 | 14,008 | 21,420 | |||||||||
Net Cash Provided by (Used in) Operating Activities of Discontinued Operations | 1,236 | (358 | ) | 1,374 | ||||||||
Net Cash Provided by Operating Activities | 3,413 | 13,650 | 22,794 | |||||||||
Cash Flows From Investing Activities: | ||||||||||||
Purchase of Aristos Logic Corporation, net of cash acquired | — | (38,005 | ) | — | ||||||||
Purchase of intangible assets | (702 | ) | — | — | ||||||||
Proceeds from sale of long-lived assets | — | — | 19,881 | |||||||||
Proceeds from sale of investments | 440 | — | — | |||||||||
Purchases of property and equipment | (1,283 | ) | (622 | ) | (1,512 | ) | ||||||
Purchases of marketable securities | (236,947 | ) | (231,349 | ) | (181,295 | ) | ||||||
Sales of marketable securities | 102,856 | 273,132 | 175,603 | |||||||||
Maturities of marketable securities | 85,187 | 79,777 | 100,777 | |||||||||
Maturities of restricted marketable securities | — | 1,688 | 1,688 | |||||||||
Net Cash Provided by (Used in) Investing Activities of Continuing Operations | (50,449 | ) | 84,621 | 115,142 | ||||||||
Net Cash Provided by (Used in) Investing Activities of Discontinued Operations | — | 776 | (66 | ) | ||||||||
Net Cash Provided by (Used in) Investing Activities | (50,449 | ) | 85,397 | 115,076 | ||||||||
Cash Flows From Financing Activities: | ||||||||||||
Repurchases and redemption on long-term debt | (128 | ) | (222,915 | ) | — | |||||||
Proceeds from the issuance of common stock | 448 | 1,676 | 3,179 | |||||||||
Repurchase of common stock | (1,756 | ) | (2,401 | ) | — | |||||||
Net Cash Provided by (Used in) Financing Activities | (1,436 | ) | (223,640 | ) | 3,179 | |||||||
Effect of Foreign Currency Translation on Cash and Cash Equivalents | 696 | (3,594 | ) | 2,940 | ||||||||
Net Increase (Decrease) in Cash and Cash Equivalents | (47,776 | ) | (128,187 | ) | 143,989 | |||||||
Cash and Cash Equivalents at Beginning of Year | 111,724 | 239,911 | 95,922 | |||||||||
Cash and Cash Equivalents at End of Year | $ | 63,948 | $ | 111,724 | $ | 239,911 | ||||||
COMPREHENSIVE INCOME (LOSS)
Fiscal Year Ended | Nine-Month Fiscal Year | Transition Period Ended | ||||||||||
| Net income (loss) attributable to Steel Excel Inc. | $ | 20,693 | $ | 6,769 | $ | (17,759 | ) | |||||
| Other comprehensive income (loss), net of taxes | ||||||||||||
| Net foreign currency translation adjustment, net of taxes: | ||||||||||||
| Foreign currency translation adjustment, net of taxes | (100 | ) | 164 | 141 | ||||||||
| Release of foreign currency translation gains, net of taxes | - | (2,542 | ) | - | ||||||||
| Subtotal | (100 | ) | (2,378 | ) | 141 | |||||||
| Net unrealized gain (loss) on marketable securities, net of taxes | 303 | 260 | (1,566 | ) | ||||||||
| Comprehensive income | 20,896 | 4,651 | (19,184 | ) | ||||||||
| Comprehensive loss attributable to non-controlling interest | (449 | ) | (72 | ) | - | |||||||
| Comprehensive income (loss) attributable to Steel Excel Inc. | $ | 20,447 | $ | 4,579 | $ | (19,184 | ) | |||||
| December 31, | ||||||||
| 2012 | 2011 | |||||||
| Assets | ||||||||
| Current assets: | ||||||||
| Cash and cash equivalents | $ | 71,556 | $ | 8,487 | ||||
| Marketable securities | 199,128 | 314,941 | ||||||
| Accounts receivable, net of allowance for doubtful accounts of $0 | 17,257 | 4,660 | ||||||
| Prepaid expenses and other current assets | 3,670 | 2,055 | ||||||
| Total current assets | 291,611 | 330,143 | ||||||
| Property and equipment, net | 77,768 | 21,060 | ||||||
| Goodwill | 53,093 | 8,244 | ||||||
| Intangible assets, net | 39,887 | 5,786 | ||||||
| Other long-term assets | 4,136 | 3,444 | ||||||
| Total assets | $ | 466,495 | $ | 368,677 | ||||
| Liabilities and Stockholders' Equity: | ||||||||
| Current liabilities: | ||||||||
| Accounts payable | $ | 4,282 | $ | 1,841 | ||||
| Accrued expenses and other liabilities | 6,337 | 3,826 | ||||||
| Current portion of long-term debt | 4,000 | - | ||||||
| Current portion of capital lease obligations | 413 | - | ||||||
| 3/4% convertible senior subordinated notes due 2023 | 346 | 346 | ||||||
| Total current liabilities | 15,378 | 6,013 | ||||||
| Capital lease obligations, net of current portion | 984 | - | ||||||
| Long-term debt, net of current portion | 9,000 | - | ||||||
| Other long-term liabilities | 9,171 | 10,767 | ||||||
| Total liabilities | 34,533 | 16,780 | ||||||
| Commitments and contingencies (Note 13) | ||||||||
| Stockholders' equity: | ||||||||
Preferred stock; $0.001 par value; Authorized shares, 1,000; Series A Shares, 250 designated; outstanding shares, none | - | - | ||||||
Common stock; $0.001 par value; Authorized shares, 40,000; outstanding shares, 12,907 and 10,892 at December 31, 2012 and 2011, respectively | 13 | 11 | ||||||
| Additional paid-in capital | 231,170 | 171,636 | ||||||
| Accumulated other comprehensive income | 946 | 743 | ||||||
| Retained earnings | 199,772 | 179,079 | ||||||
| Total Steel Excel Inc. stockholders' equity | 431,901 | 351,469 | ||||||
| Non-controlling interest | 61 | 428 | ||||||
| Total stockholders' equity | 431,962 | 351,897 | ||||||
| Total liabilities and stockholders' equity | $ | 466,495 | $ | 368,677 | ||||
See accompanying Notes to Consolidated Financial Statements.
| Common Stock | Additional Paid-in Capital | Accumulated Other Comprehensive Income, Net of Taxes | Retained Earnings | Total | |||||||||||||||||||
| Shares | Amount | ||||||||||||||||||||||
| (in thousands) | |||||||||||||||||||||||
Balance, March 31, 2007 | 118,856 | $ | 119 | $ | 190,236 | $ | 3,178 | $ | 228,625 | $ | 422,158 | ||||||||||||
Cumulative effect adjustment, net of taxes related to the adoption of uncertain tax positions | — | — | — | — | (1,317 | ) | (1,317 | ) | |||||||||||||||
Adjusted balance, March 31, 2007 | 118,856 | 119 | 190,236 | 3,178 | 227,308 | 420,841 | |||||||||||||||||
Components of comprehensive loss: | |||||||||||||||||||||||
Net loss | — | — | — | — | (9,615 | ) | (9,615 | ) | |||||||||||||||
Unrealized gains on available-for-sale investments, net of taxes | — | — | — | 1,861 | — | 1,861 | |||||||||||||||||
Foreign currency translation adjustment, net of taxes | — | — | — | 1,954 | — | 1,954 | |||||||||||||||||
Total comprehensive loss, net of taxes | (5,800 | ) | |||||||||||||||||||||
Sale of common stock under employee stock purchase and option plans | 1,035 | 3 | 3,176 | — | — | 3,179 | |||||||||||||||||
Net issuance of restricted shares | 1,187 | — | — | — | — | — | |||||||||||||||||
Net settlement of restricted shares | (158 | ) | (1 | ) | (751 | ) | — | — | (752 | ) | |||||||||||||
Stock-based compensation | — | — | 6,628 | — | — | 6,628 | |||||||||||||||||
Balance, March 31, 2008 | 120,920 | 121 | 199,289 | 6,993 | 217,693 | 424,096 | |||||||||||||||||
Components of comprehensive loss: | |||||||||||||||||||||||
Net loss | — | — | — | — | (10,190 | ) | (10,190 | ) | |||||||||||||||
Unrealized losses on available-for-sale investments, net of taxes | — | — | — | (600 | ) | — | (600 | ) | |||||||||||||||
Foreign currency translation adjustment, net of taxes | — | — | — | (3,429 | ) | — | (3,429 | ) | |||||||||||||||
Total comprehensive loss, net of taxes | (14,219 | ) | |||||||||||||||||||||
Sale of common stock under employee option plans | 499 | 1 | 1,675 | — | — | 1,676 | |||||||||||||||||
Net issuance of restricted shares | 671 | — | — | — | — | — | |||||||||||||||||
Net settlement of restricted shares | (346 | ) | (1 | ) | (1,659 | ) | — | — | (1,660 | ) | |||||||||||||
Stock-based compensation | — | — | 3,388 | — | — | 3,388 | |||||||||||||||||
Repurchase of common stock | (1,033 | ) | (1 | ) | (2,400 | ) | — | — | (2,401 | ) | |||||||||||||
Balance, March 31, 2009 | 120,711 | 120 | 200,293 | 2,964 | 207,503 | 410,880 | |||||||||||||||||
Components of comprehensive loss: | |||||||||||||||||||||||
Net loss | — | — | — | — | (17,434 | ) | (17,434 | ) | |||||||||||||||
Unrealized gains on available-for-sale investments, net of taxes | — | — | — | 110 | — | 110 | |||||||||||||||||
Foreign currency translation adjustment, net of taxes | — | — | — | 1,212 | — | 1,212 | |||||||||||||||||
Total comprehensive loss, net of taxes | (16,112 | ) | |||||||||||||||||||||
Sale of common stock under employee option plans | 182 | 1 | 447 | — | — | 448 | |||||||||||||||||
Net issuance of restricted shares | 620 | — | — | — | — | — | |||||||||||||||||
Net settlement of restricted shares | (406 | ) | (1 | ) | (1,572 | ) | — | — | (1,573 | ) | |||||||||||||
Stock-based compensation | — | — | 5,816 | — | — | 5,816 | |||||||||||||||||
Repurchase of common stock | (706 | ) | (1 | ) | (1,755 | ) | — | — | (1,756 | ) | |||||||||||||
Balance, March 31, 2010 | 120,401 | $ | 119 | $ | 203,229 | $ | 4,286 | $ | 190,069 | $ | 397,703 | ||||||||||||
| Common Stock | Additional Paid-in | Accumulated Other | Retained | Non- controlling | ||||||||||||||||||||||||
| Shares | Amount | Capital | Income | Earnings | Interest | Total | ||||||||||||||||||||||
| Balance, March 31, 2010 | 12,040 | $ | 12 | $ | 203,336 | $ | 4,286 | $ | 190,069 | $ | - | $ | 397,703 | |||||||||||||||
| Net loss attributable to Steel Excel Inc. | - | - | - | - | (17,759 | ) | - | (17,759 | ) | |||||||||||||||||||
| Other comprehensive loss | - | - | - | (1,425 | ) | - | - | (1,425 | ) | |||||||||||||||||||
Sale of common stock under employee option plans | 76 | - | 2,169 | - | - | - | 2,169 | |||||||||||||||||||||
| Net issuance of restricted shares | (62 | ) | - | - | - | - | - | - | ||||||||||||||||||||
| Net settlement of restricted shares | 1 | - | (861 | ) | - | - | - | (861 | ) | |||||||||||||||||||
| Stock-based compensation | - | - | 1,123 | - | - | - | 1,123 | |||||||||||||||||||||
| Repurchase of common stock | (1,173 | ) | (1 | ) | (34,683 | ) | - | - | - | (34,684 | ) | |||||||||||||||||
| Balance, December 31, 2010 | 10,882 | 11 | 171,084 | 2,861 | 172,310 | - | 346,266 | |||||||||||||||||||||
| Net income attributable to Steel Excel Inc. | - | - | - | - | 6,769 | - | 6,769 | |||||||||||||||||||||
| Net loss attributable to non-controlling interest | - | - | - | - | - | (72 | ) | (72 | ) | |||||||||||||||||||
| Other comprehensive loss | (2,118 | ) | - | - | (2,118 | ) | ||||||||||||||||||||||
Sale of common stock under employee option plans | 1 | - | 29 | - | - | 29 | ||||||||||||||||||||||
| Net issuance of restricted shares | 5 | - | - | - | - | |||||||||||||||||||||||
| Net settlement of restricted shares | 4 | - | - | - | - | |||||||||||||||||||||||
| Stock-based compensation | - | - | 523 | - | - | 523 | ||||||||||||||||||||||
| Non-controlling interest investment | - | 500 | 500 | |||||||||||||||||||||||||
| Balance, December 31, 2011 | 10,892 | 11 | 171,636 | 743 | 179,079 | 428 | 351,897 | |||||||||||||||||||||
| Net income attributable to Steel Excel Inc. | - | - | - | - | �� | 20,693 | - | 20,693 | ||||||||||||||||||||
| Net loss attributable to non-controlling interest | - | - | - | - | - | (449 | ) | (449 | ) | |||||||||||||||||||
| Non-controlling interest investment in The Show | 75 | 75 | ||||||||||||||||||||||||||
| Other comprehensive income | - | - | - | 203 | - | - | 203 | |||||||||||||||||||||
| Net issuance of restricted shares | 85 | - | - | - | - | - | - | |||||||||||||||||||||
| Net settlement of restricted shares | 14 | - | - | - | - | - | - | |||||||||||||||||||||
| Stock-based compensation | - | - | 1,487 | - | - | - | 1,487 | |||||||||||||||||||||
| Issuance of common stock for acquisition | 2,027 | 2 | 60,823 | - | - | - | 60,825 | |||||||||||||||||||||
| Repurchase of common stock | (111 | ) | - | (2,776 | ) | - | - | - | (2,776 | ) | ||||||||||||||||||
| Non-controlling interest investment in CrossFit | - | - | - | - | - | 82 | 82 | |||||||||||||||||||||
| Write-off of non-controlling interest of The Show | - | - | - | - | - | (75 | ) | (75 | ) | |||||||||||||||||||
| Balance, December 31, 2012 | 12,907 | $ | 13 | $ | 231,170 | $ | 946 | $ | 199,772 | $ | 61 | $ | 431,962 | |||||||||||||||
F-5
Fiscal Year Ended | Fiscal Year Ended | Nine-Month Transition | ||||||||||
| Cash Flows From Operating Activities: | ||||||||||||
| Net income (loss) | $ | 20,693 | $ | 6,769 | $ | (17,759 | ) | |||||
| Less: Income (loss) from discontinued operations, net of taxes | (1,935 | ) | 6,915 | (373 | ) | |||||||
| Income (loss) from continuing operations, net of taxes | 22,628 | (146 | ) | (17,386 | ) | |||||||
Adjustments to reconcile income (loss) from continuing operations, net of taxes, to net cash provided by (used in) operating activities of continuing operations: | ||||||||||||
| Stock-based compensation expense | 1,487 | 523 | 470 | |||||||||
| Depreciation and amortization | 16,728 | 2,809 | 3,214 | |||||||||
| Adjustment of deferred taxes | (15,105 | ) | 1,395 | - | ||||||||
| Loss on disposal of long-lived assets | 819 | - | - | |||||||||
| Impairment of goodwill | 192 | - | - | |||||||||
| Gain on release of foreign currency translation, net of taxes | - | (2,542 | ) | - | ||||||||
| Changes in current assets and liabilities: | ||||||||||||
| Accounts receivable | (5,469 | ) | (569 | ) | - | |||||||
| Prepaid expenses and other current assets | (970 | ) | 2,835 | 6,554 | ||||||||
| Assets held for sale | - | 6,216 | - | |||||||||
| Other assets | (132 | ) | (802 | ) | 153 | |||||||
| Accounts payable | 1,903 | 177 | (7,120 | ) | ||||||||
| Accrued expenses and other liabilities | (2,098 | ) | (5,934 | ) | (6,717 | ) | ||||||
| Net loss attributable to non-controlling interest | (449 | ) | (72 | ) | - | |||||||
Net cash provided by (used in) operating activities of continuing operations | 19,534 | 3,890 | (20,832 | ) | ||||||||
Net cash provided by (used in) operating activities of discontinued operations | (847 | ) | 6,933 | 6,519 | ||||||||
| Net cash provided by (used in) operating activities | 18,687 | 10,823 | (14,313 | ) | ||||||||
| Cash Flows From Investing Activities: | ||||||||||||
| Purchases of net assets in acquisitions | (52,567 | ) | (36,530 | ) | - | |||||||
| Purchases of property and equipment | (11,818 | ) | (65 | ) | - | |||||||
| Investment by non-controlling interest | 75 | - | - | |||||||||
| Purchases of marketable securities | (523,443 | ) | (537,898 | ) | (198,403 | ) | ||||||
| Sales of marketable securities | 573,792 | 441,226 | 141,681 | |||||||||
| Maturities of marketable securities | 64,253 | 92,321 | 49,536 | |||||||||
| Net cash provided by (used in) investing activities of continuing operations | 50,292 | (40,946 | ) | (7,186 | ) | |||||||
| Net cash provided by investing activities of discontinued operations | - | - | 28,285 | |||||||||
| Net cash provided by (used in) investing activities | 50,292 | (40,946 | ) | 21,099 | ||||||||
| Cash Flows From Financing Activities: | ||||||||||||
| Proceeds from issuance of common stock | - | 29 | 2,169 | |||||||||
| Repurchases of common stock | (2,776 | ) | - | (34,684 | ) | |||||||
| Repayments of capital lease obligations | (230 | ) | - | - | ||||||||
| Repayments of long-term debt | (3,000 | ) | - | - | ||||||||
| Net cash provided by (used in) financing activities | (6,006 | ) | 29 | (32,515 | ) | |||||||
| Effect of foreign currency translation on cash and cash equivalents | 96 | 305 | 57 | |||||||||
| Net increase (decrease) in cash and cash equivalents | 63,069 | (29,789 | ) | (25,672 | ) | |||||||
| Cash and cash equivalents, beginning balance | 8,487 | 38,276 | 63,948 | |||||||||
| Cash and cash equivalents, ending balance | $ | 71,556 | $ | 8,487 | $ | 38,276 | ||||||
Subsequent EventsIn December 2009, Adaptec,
Assuming the PMC Transaction is consummated, the Company intends to explore all strategic alternatives to maximize stockholder value going forward, including deploying the proceeds of the PMC Transaction and the Company’s other assets in seekingidentify additional new business acquisition opportunities and other actions to redeploy its capital. Additionally, the Company will, as previously announced, continue to consider its options related to those products and technology (the “Aristos products”) obtained from its acquisition of Aristos Logic Corporation (“Aristos”), as well as its other remaining operating assets, including non-core patents and real estate holdings. With respect to the Aristos products, options that the Company may consider include (i) ceasing to invest additional funds in the Aristos products, winding-down the sale of Aristos products and fulfilling its remaining contractual obligations with the Company’s existing customers, which the Company would expect to be completed in six months, or by September 2010, or (ii) seeking to sell the assets related to Aristos products to a third party. The Company will also explore alternatives for maximizing the value of its non-core patent portfolio and remaining real estate assets. Going forward Adaptec’s business is expected to consist of capital redeployment and identification of new, profitable business operations in which the Company can utilize its existing working capital and maximize the use of its net operating losses (“NOLs”).
If the Company consummates the PMC Transaction discussed above, Adaptec may incur significant charges in the future, which charges include, but are not limited to, increased amortization or depreciation of its long-lived assets due to potential changes to the expected remaining useful lives, a potential impairment of its long-lived assets, restructuring charges, acceleration of compensation expense related to unvested stock-based awards, potential cash bonus payments and potential accelerated payments of certain of its contractual obligations, which may impact the Company’s results of operations and financial condition. The aggregate of these amounts cannot be quantified at this time. Further subsequent event disclosures related to expected changes to the remaining useful lives of our long-lived assets, stock-based activity and associated compensation expense, and restructuring charges are discussed in Note 7, 9 and 11, respectively, to the Consolidated Financial Statements.
Except where noted, the discussionsopportunities. For details regarding the Company’s historical business, in thesewhich has been accounted for as discontinued operations, refer to Note 5 of the Notes to the Consolidated Financial Statements isStatements. The Company was previously known as of March 31, 2010 and does not take into account the PMC Transaction, which, as of the date of the Consolidated Financial Statements and related Notes, has not been consummated and which may not be consummated.
Description
Adaptec currently provides innovative data center I/O solutions that protect, accelerate, optimize, and condition data in today’s most demanding data center environments. The Company’s products are used in IT environments ranging from traditional enterprise environments to fast growing, on-demand cloud computing data
ADAPTEC, INC.
NOTES TO CONSOLIDATED FINANCIAL STATEMENTS (Continued)
(Unaudited)
Note 1. Organization and Summary of Significant Accounting Policies (Continued)
centers. The Company’s products enable data center managers, channel partners and OEMs to deploy best-in-class storage solutions to meet their customers’ evolving IT and business requirements. The Company’s software and hardware products include ASICs, HBAs, RAID controllers, Adaptec RAID software, storage management software, storage virtualization software and other solutions that span SCSI, SAS, SATA and iSCSI interface technologies, including both hard disk and solid state drives. System integrators and white box suppliers build server and storage solutions based on Adaptec technology to deliver products with superior price and performance, data protection and interoperability to their clients and customers.
ADPT Corporation.
The Company’s Consolidated Financial Statements include the accounts of AdaptecSteel Excel and its subsidiaries. The equity attributable to non-controlling interests in subsidiaries is shown separately in the accompanying consolidated balance sheets. All significant intercompany accounts and transactions have been eliminated in consolidation. Key acronyms used in
calendar year of January 1, 2012 to December 31, 2012. References in these Notes to “fiscal year 2011” or “fiscal 2011” refer to the calendar year of January 1, 2011 to December 31, 2011.
investment policies.
F-7
ADAPTEC, INC.
NOTES TO CONSOLIDATED FINANCIAL STATEMENTS (Continued)
(Unaudited)
Note 1. Organization and Summary of Significant Accounting Policies (Continued)
Fair Value of Financial Instruments
For certain of the Company’s financial instruments, including cash and cash equivalents, accounts receivable, accounts payable and other current liabilities, the carrying amounts approximate their fair value due to the relatively short maturity of these items. Investments in available-for-sale securities are carried at fair value based on quoted market prices or estimated based on quoted market prices
Doubtful Accounts
Cash Equivalents and Marketable Securities
Cash equivalents consist of liquid investments with remaining maturities of three months or less from the date of purchase. Marketable securities consist of corporate obligations, commercial paper, municipal bonds, United States government securities, government agencies, and other debt securities related to mortgage-back and asset-backed securities with remaining maturities beyond three months from the date of purchase. The Company classifies its marketable securities as short-term, even though certain securities mature beyond one year, as the Company has the ability to liquidate these securities at any time. The Company’s policy is to protect the value of its investment portfolio and minimize principal risk by earning returns based on current interest rates.
Marketable securities, including equity securities, are classified as available-for-sale and are reported at fair market value and unrealized gains and losses, net of income taxes are included in “Accumulated other comprehensive income, net of taxes” as a separate component of stockholders’ equity in the Consolidated Balance Sheets. The marketable securities are adjusted for amortization of premiums and discounts and such amortization is included in “Interest and other income, net” in the Consolidated Statements of Operations. When the fair value of an investment declines below its original cost, the Company considers all available evidence to evaluate whether the decline in value is other-than-temporary. Among other things, the Company considers the duration and extent to which the market value has declined relative to its cost basis and economic factors influencing the markets. Unrealized losses considered other-than-temporary are charged to “Interest and other income, net” in the Consolidated Statements of Operations in the period in which the determination is made. Gains and losses on securities sold are determined based on the average cost method and are included in “Interest and other income, net” in the Consolidated Statements of Operations. The Company does not hold its securities for trading or speculative purposes.
Concentration of Risk
Financial instruments that potentially subject the Company to significant concentrations of credit risk consist principally of cash, cash equivalents, marketable securities and trade accounts receivable. The Company invests in high-credit quality investments, maintained with major financial institutions. The Company, by policy, limits the amount of credit exposure through diversification, and management regularly monitors the composition of its investment portfolio for compliance with the Company’s investment policies.
The Company sells its products to OEMs, distributors and retailers throughout the world. Sales to customers are predominantly denominated in United States Dollars and, as a result, the Company believes its foreign
ADAPTEC, INC.
NOTES TO CONSOLIDATED FINANCIAL STATEMENTS (Continued)
(Unaudited)
Note 1. Organization and Summary of Significant Accounting Policies (Continued)
currency risk relating to sales is minimal. The Company performs ongoing credit evaluations of its customers’ financial condition and generally does not require collateral from its customers. The Company maintains an allowance for doubtful accounts is based uponon the expected collectibilityCompany's assessment of all accounts receivable.
Three customers accounted for 32%, 15%the collectability of customer accounts. The Company regularly reviews its receivables that remain outstanding past their applicable payment terms and 13%establishes an allowance by considering factors such as historical experience, credit quality, age of grossthe accounts receivable balances, and current economic conditions that may affect a customer's ability to pay. There were no allowances for doubtful accounts as of December 31, 2012 and 2011.
| Steel Sports | Steel Energy | |||||||||
| (in years) | ||||||||||
| Buildings, improvements and sports fields | 10 | - | 25 | 7 | - | 39 | ||||
| Rigs and workover equipment | N/A | 7 | - | 15 | ||||||
| Other equipment | 5 | - | 10 | 4 | - | 7 | ||||
| Vehicles | N/A | 4 | - | 7 | ||||||
| Furniture and fixtures | 5 | 5 | ||||||||
The Company currently purchases the majority of its finished products from Sanmina-SCI Corporation (“Sanmina-SCI”), and if Sanmina-SCI fails to meet the Company’s manufacturing needs, it may be required to delay product shipmentsLong-Lived Assets
The industry in which the Company currently operates is characterized by rapid technological change, competitive pricing pressuresintangible assets and cyclical market patterns. The Company’s financial resultsproperty and equipment. Intangible assets are affected by a wide variety of factors, including general economic conditions worldwide, economic conditions specific to its industry, the timely implementation of new manufacturing technologies and the ability to safeguard patents and intellectual property in a rapidly evolving market. In addition, the market for its products has historically been cyclical and subject to significant economic downturns at various times. As a result, the Company may experience significant period-to-period fluctuations in future operating results due to the factors mentioned above or other factors. The Company believes that its existing sources of liquidity, including its cash, cash equivalents and marketable securities, will be adequate to support its operating and capital investment activities for the next twelve months.
Inventories
Inventories are stated at the lower of cost or market, with cost determinedamortized on a first-in, first-out basis. The Company writes down inventories based on estimated excessstraight-line and obsolete inventories, determined primarily by future demand forecasts. At the point of loss recognition, a new, lower costan accelerated basis for that inventory is established, and subsequent changes in facts and circumstances do not result in the restoration or increase in that newly established cost basis.
Goodwill
Goodwill represented the excess of the purchase price paid over the fair value of tangible and identifiable intangible net assets acquired in business combinations. Goodwill was not amortized, but instead was reviewed annually, in the Company’s fourth quarter of each year, and whenever events or changes in circumstances occurred which indicated that goodwill might be impaired. Impairment of goodwill was tested at the Company level, as the Company contained only one reporting unit, and compared the net book value, including goodwill, to the fair value. To determine fair value, the Company’s review process used the income approach and the market approach. The Company also considered its market capitalization on the dates of its impairment tests in determining the fair value of the Company. If the net book value of the Company exceeds its implied fair value, goodwill is considered impaired and a second step is performed to measure the amount of impairment loss, if any. For details regarding goodwill and associated impairment charges taken in fiscal 2009 refer to Note 7 to the Consolidated Financial Statements.
F-9
ADAPTEC, INC.
NOTES TO CONSOLIDATED FINANCIAL STATEMENTS (Continued)
(Unaudited)
Note 1. Organization and Summary of Significant Accounting Policies (Continued)
Intangible Assets, Net
Intangible assets, net, consist of acquisition-related intangible assets, software license agreement, intellectual property and warrants and are carried at cost less accumulated amortization. Intangible assets, net, are amortized over their estimated useful lives, rangingwhich range from three monthsfive to five years, reflecting the pattern in which the economic benefits of the assets are expected to be realized. For details regarding intangible assets, net, refer to Note 7 to the Consolidated Financial Statements.
Property and Equipment, Net
ten years. Property and equipment net, areis stated at cost and depreciated or amortized using the straight-line method over the estimated useful lives of the assets. The Company capitalizes substantially all costs relatedassets, which range from five to the purchase and implementation of software projects used for internal business operations. Capitalized internal-use software costs primarily include license fees, consulting fees and any associated direct labor costs and are amortized over the estimated useful life of the asset, typically a three- to five-year period.
Impairment of Long-Lived Assets
25 years.
Stock-Based Compensation
The Company has employeeuseful life of ten and director stock compensation plans which are described infive years, respectively, utilizing the accelerated amortization method that approximates the estimated future cash flows from the intangibles. Also, see Note 93 to the Consolidated Financial Statements. The Company measuresevaluates other intangible assets for impairment whenever events and recognizes stock-based compensation expense for all stock-based awards based on estimated fair values using a straight-line amortization method over the respective requisite service period of the awards and adjusts it for estimated forfeitures. In addition, the Company applies the simplified method to establish the beginning balance of the additional paid in capital pool related to the tax effects of employee stock-based compensation, which is available to absorb tax shortfalls. Tax shortfalls arise when actual tax benefits realized upon the exercise of stock options are less than the tax benefit recorded in the financial statements. Disclosure provisions related to equity instruments, including stock-based compensation expense, are discussed further in Note 9 to the Consolidated Financial Statements.
Revenue Recognition
circumstances indicate that such assets might be impaired.
ADAPTEC, INC.
NOTES TO CONSOLIDATED FINANCIAL STATEMENTS (Continued)
(Unaudited)
Note 1. Organization and Summary of Significant Accounting Policies (Continued)
environmental liabilities resulting from its oilfield services work. It does not anticipate significant environmental liabilities for work completed through December 31, 2012, so no reserve for environmental liabilities has been recorded.
existed.
Software Development Costs
The Company’s policy is to capitalize software development costs incurred after technological feasibility has been demonstrated, which is determined to be the time a working model has been completed. Through March 31, 2010, costs incurred subsequent to the establishment of technological feasibility have not been significant and all software development costs have been charged to “Research and development” in the Consolidated Statements of Operations.
F-11
ADAPTEC, INC.
NOTES TO CONSOLIDATED FINANCIAL STATEMENTS (Continued)
(Unaudited)
Note 1. Organizationcalculation of certain tax assets, tax credits, benefits, deductions and Summaryliabilities, which arise from differences in the timing of Significant Accounting Policies (Continued)
that accruedrecognition of revenue and expense for tax and financial statement purposes, as well as the interest and penalties do not ultimately become payable, amounts accrued will be reduced and reflected as a reduction of the overall incomerelated to those uncertain tax positions. Significant changes to these estimates may result in an increase or decrease to its tax provision in the period that such determination is made. The amount of interest and penalties accrued during fiscal years 2010, 2009 and 2008 was immaterial.subsequent periods. Due to the complexity and uncertainty associated with the Company’s tax contingencies, the Company cannot make a reasonably reliable estimate of the period in which the cash settlement will be made for the Company’s liabilities associated with uncertain tax positions.
these amounts is unnecessary, the Company reverses the liability and recognizes a tax benefit during the period in which it determines that the liability is no longer necessary. The Company records an additional charge in its provision for taxes in the period in which it determines that the recorded tax liability is less than it expects the ultimate assessment to be.
In June 2009, the FASB issued the ASC, which becomes the single source of authoritative, nongovernmental GAAP, except for rules and interpretive releases of the SEC, which are sources of authoritative GAAP for SEC registrants. All other literature, with the exception of non-grandfathered and non-SEC literature, will be considered non-authoritative. All guidance contained in the Codification carries an equal level of authority. The ASC, which was effective for interim and annual periods ending after September 15, 2009, or the Company’s second quarter of fiscal 2010, did not have an impact on the Company’s Consolidated Financial Statements as the Codification does not change GAAP, but is intended to make it easier to find and research applicable GAAP guidance to a particular transaction or specific accounting issue.
In September 2009, the FASB amended the requirements for revenue recognition, which eliminates the use of the residual method and incorporates the use of an estimated selling price to allocate arrangement consideration. In addition, the revenue recognition guidance amends the scope to exclude tangible products that contain software and non-software components that function together to deliver the product’s essential functionality. The amendments to the accounting standards related to revenue recognition are effectiveimpairment tests performed for fiscal years beginning after JuneSeptember 15, 2010, which will begin with the Company’s first quarter of fiscal 2012 unless adopted early. Uponand early adoption the Company may apply the guidance retrospectively or prospectively for new or materially modified arrangements.is permitted. The Company is currently evaluating the financial impact thatof this accounting standardASU and does not expect the adoption will have an impact on its Consolidated Financial Statements.
ADAPTEC, INC.
NOTES TO CONSOLIDATED FINANCIAL STATEMENTS (Continued)
(Unaudited)
consolidated results of operations or financial condition.
In January 2010,capital into operating businesses.
| Amount | ||||
| (in thousands) | ||||
| Accounts receivable | $ | 149 | ||
| Loan receivable | 15 | |||
| Property and equipment | 5,855 | |||
| Intangible assets | 235 | |||
| Deferred revenue | (416 | ) | ||
| Total identifiable net assets acquired | 5,838 | |||
| Goodwill | 192 | |||
| Net assets acquired | $ | 6,030 | ||
Note 2. Acquisitions
On September 3, 2008, the Company completed the acquisition of Aristos, a provider of RAID technology to the data storage industry, pursuant to an Agreement and Plan of Merger dated as of August 27, 2008 (the “Merger Agreement”) by and among Adaptec, Aristos, Ariel Acquisition Corp., a wholly owned subsidiary of Adaptec, and TPG Ventures, L.P., solely in its capacity as the representative of stockholders of Aristos. The Merger Agreement provided for the Company’s acquisition of Aristos through a merger in which Aristos became a wholly-owned subsidiary of the Company. The acquisition of Aristos was to allow the Company to expand into adjacent RAID markets that the Company believed would provide it with growth opportunities, including blade servers, enterprise-class external storage systems and performance desktops, and would provide the Companystraight-line basis with a strong ASIC roadmap. In addition, this acquisition enabled the Company to pursue new OEM opportunities and expand its channel product offerings containing unified serial technologies.
life of five years. The Company acquired Aristos for a purchase priceamortization expense of approximately $38.9 million, which consisted of: (i) approximately $28.7 million that was paid to certain Aristos senior preferred stockholders and warrant holders; (ii) approximately $3.2 million under a management liquidation pool established by Aristos prior to completion of the merger, which was immediately paid upon closing of the transaction; (iii) approximately $6.2 million to retire and satisfy certain commercial obligations and payables of Aristos; and (iv) $0.8 million accrued in direct transaction fees, including legal, valuation and accounting fees. A summary of the purchase cost was as follows (in thousands):
Cash paid to certain Aristos senior preferred stockholders and warrant holders, including escrow amount | $ | 28,727 | |
Cash paid under management liquidation pool | 3,221 | ||
Cash paid to retire and satisfy certain commercial obligations and payables of Aristos | 6,162 | ||
Direct acquisition-related transaction costs | 800 | ||
Total purchase price | $ | 38,910 | |
Aristos Holdback: A portion of the Aristos acquisition price totaling $4.3 million was held in an escrow account (“Aristos Holdback”) to secure potential indemnification obligations of Aristos stockholders for unknown liabilities that may have existed as of the acquisition date. The Aristos Holdback was to be paid in two installments to the former Aristos stockholders during the twelfth and eighteenth months after the acquisition
F-13
ADAPTEC, INC.
NOTES TO CONSOLIDATED FINANCIAL STATEMENTS (Continued)
(Unaudited)
Note 2. Acquisitions (Continued)
closing date, except for funds necessary to provide for any pending claims. The Aristos Holdback of $4.3 million was paid in full in fiscal 2010.
Management Liquidation Pool: As part of the Merger Agreement, the Company agreed to pay certain former employees of Aristos a total of $5.6 million through a management liquidation pool established by Aristos prior to the completion of the merger. Of the $5.6 million, $3.2 million was immediately paid upon closing of the transaction and was$20,000 is included in the purchase price allocation of the cost to acquire Aristos. The remaining $2.4 million was payable over time, not to exceed twelve months, contingent upon the continued employment of certain employees with the Company,“Selling, marketing, and was expensed to the Consolidated Statements of Operations as earned. In fiscal years 2010 and 2009, the Company recorded expense of $0.1 million and $2.3 million, respectively,administrative expenses” in the Consolidated Statements of Operations related to the management liquidation pool.
for fiscal year 2011. The Aristos acquisition was accounted for as a business combination and, accordingly, the resultsgoodwill of Aristos have been included in the Company’s consolidated results of operations and financial position$0.2 million arose from the date of acquisition. The allocation ofgrowth potential the Aristos purchase price to the tangibleCompany saw for Baseball Heaven and identifiable intangible assets acquired and liabilities assumed is summarized below, and was based on valuation techniques such as the discounted cash flows and weighted average cost methods used in the high technology industry using assumptions and estimates from management to calculate fair value.
| September 26, 2008 | ||||
| (in thousands) | ||||
Goodwill | $ | 16,947 | ||
Intangible assets: | ||||
Core and existing technologies | 18,800 | |||
Customer relationships | 3,900 | |||
Backlog | 340 | |||
Total intangible assets | 23,040 | |||
Tangible assets acquired and liabilities assumed: | ||||
Cash | 105 | |||
Accounts receivable, net | 201 | |||
Inventory | 580 | |||
Prepaid expenses and other current assets | 1,235 | |||
Property and equipment, net | 570 | |||
Total assets acquired | 2,691 | |||
Accounts payable | (352 | ) | ||
Current liabilities | (3,416 | ) | ||
Total liabilities assumed | (3,768 | ) | ||
Net liabilities assumed | (1,077 | ) | ||
Total purchase price | $ | 38,910 | ||
The values allocated to core and existing technologies, customer relationships and backlog created as a result of the acquisition of Aristos will be amortized over estimated useful lives of sixty months, thirty-six months and three months, respectively, reflecting the period in which the economic benefits of the assets are expected to be realized. The total value allocated to the acquired intangible assets as a result of the Aristos acquisition is being amortized over an estimated weighted average useful life of fifty-five months. No residual value was estimated for the intangible assets. Goodwill was not expected to be deductible for tax purposes.
F-14
As of December 31, 2012, the Company found this goodwill to be impaired. The $0.2 million goodwill impairment charge is included in the Consolidated Statements of Operations for fiscal 2012. The acquisition-related costs for the purchase of Baseball Heaven, included in “Selling, marketing, and administrative” expenses in the Consolidated Statements of Operations, were $0.2 million for fiscal year 2011.
ADAPTEC, INC.
NOTES TO CONSOLIDATED FINANCIAL STATEMENTS (Continued)
(Unaudited)
| Amount | ||||
| (in thousands) | ||||
| Inventory | $ | 53 | ||
| Property and equipment | 151 | |||
| Total identifiable net assets acquired | 204 | |||
| Non-controlling interest in The Show | (500 | ) | ||
| Goodwill | 1,796 | |||
| Net assets acquired | $ | 1,500 | ||
| Amount | ||||
| (in thousands) | ||||
| Accounts receivable | $ | 4,031 | ||
| Inventory | 138 | |||
| Prepaid expenses | 78 | |||
| Property and equipment | 15,309 | |||
| Intangible assets | 5,600 | |||
| Accrued expenses | (1,194 | ) | ||
| Total identifiable net assets acquired | 23,962 | |||
| Goodwill | 6,256 | |||
| Contingent consideration | (1,218 | ) | ||
| Net assets acquired | $ | 29,000 | ||
| Amount | ||||
| (in thousands) | ||||
| Property and equipment | $ | 23,842 | ||
| Intangible assets | 14,300 | |||
| Accrued expenses | (137 | ) | ||
| Total net identifiable assets | 38,005 | |||
| Goodwill | 10,126 | |||
| Net assets acquired | $ | 48,131 | ||
| Amount | ||||
| (in thousands) | ||||
| Cash | $ | 3,561 | ||
| Accounts receivable | 7,233 | |||
| Prepaid expense and other current assets | 782 | |||
| Property and equipment | 29,787 | |||
| Identifiable intangible assets | 27,300 | |||
| Other long-term assets | 714 | |||
| Accounts payable | (1,036 | ) | ||
| Accrued expenses and other current liabilities | (3,464 | ) | ||
| Long-term debt | (16,000 | ) | ||
| Capital lease obligations | (1,622 | ) | ||
| Deferred tax liabilities | (15,066 | ) | ||
| Total net identifiable assets | 32,189 | |||
| Goodwill | 36,557 | |||
| Net assets acquired | $ | 68,746 | ||
Company accounted for the CrossFit South Bay acquisition as a business combination and the total consideration of $82,500 has been allocated to the net assets and liabilities acquired based on their respective estimated fair values at November 5, 2012, as follows:
| Amount | ||||
| (in thousands) | ||||
| Cash | $ | 6 | ||
| Property and equipment | 18 | |||
| Accounts payable | (14 | ) | ||
| Total identifiable net assets acquired | 10 | |||
| Non-controlling interest in CrossFit South Bay | (82 | ) | ||
| Goodwill | 154 | |||
| Net assets acquired | $ | 82 | ||
For the Year Ended | For the Year Ended | |||||||
| (unaudited) | ||||||||
| (in thousands) | ||||||||
| Net revenues | $ | 123,876 | $ | 82,755 | ||||
| Income from continuing operations, net of taxes | $ | 24,997 | $ | 8,347 | ||||
| Income (loss) from discontinued operations, net of taxes | $ | (1,935 | ) | $ | 6,275 | |||
| Net income attributable to Steel Excel Inc. | $ | 23,511 | $ | 14,712 | ||||
| Shares | Weighted Average | Weighted Average Remaining | Aggregate Intrinsic | |||||||||||||
| (in thousands, except exercise price and contractual terms) | ||||||||||||||||
| Outstanding at March 31, 2010 | 488 | $ | 40.50 | |||||||||||||
| Granted | 9 | $ | 29.30 | |||||||||||||
| Exercised | (76 | ) | $ | 28.50 | ||||||||||||
| Forfeited | - | $ | 38.70 | |||||||||||||
| Expired | (341 | ) | $ | 44.00 | ||||||||||||
| Outstanding at December 31, 2010 | 80 | $ | 35.61 | |||||||||||||
| Granted | 28 | $ | 28.73 | |||||||||||||
| Exercised | (1 | ) | $ | 28.60 | ||||||||||||
| Forfeited | (1 | ) | $ | 28.40 | ||||||||||||
| Expired | (12 | ) | $ | 48.32 | ||||||||||||
| Outstanding at December 31, 2011 | 94 | $ | 31.89 | |||||||||||||
| Granted | 3 | $ | 13.32 | |||||||||||||
| Exercised | - | $ | - | |||||||||||||
| Forfeited | (5 | ) | $ | 37.60 | ||||||||||||
| Expired | (27 | ) | $ | 46.16 | ||||||||||||
| Outstanding at December 31, 2012 | 65 | $ | 30.93 | 7.76 | $ | - | ||||||||||
| Options vested and expected to vest at | ||||||||||||||||
| December 31, 2012 | 65 | $ | 30.93 | 7.76 | $ | - | ||||||||||
| Options exercisable at: | ||||||||||||||||
| December 31, 2010 | 69 | $ | 36.60 | |||||||||||||
| December 31, 2011 | 68 | $ | 33.12 | |||||||||||||
| December 31, 2012 | 46 | $ | 31.98 | 7.21 | $ | - | ||||||||||
| Year Ended March 31, | ||||||||
| 2009 | 2008 | |||||||
(in thousands, except per share amounts) | ||||||||
Net revenues | $ | 116,560 | $ | 150,267 | ||||
Loss from continuing operations, net of taxes | $ | (24,635 | ) | $ | (28,287 | ) | ||
Income from discontinued operations, net of taxes | 3,786 | (4,243 | ) | |||||
Net loss | $ | (20,849 | ) | $ | (32,530 | ) | ||
Basic and diluted income (loss) per share: | ||||||||
Loss from continuing operations, net of taxes | $ | (0.21 | ) | $ | (0.24 | ) | ||
Income (loss) from discontinued operations, net of taxes | $ | 0.03 | $ | (0.04 | ) | |||
Net loss | $ | (0.17 | ) | $ | (0.27 | ) | ||
Shares used in computing income (loss) per share: | ||||||||
Basic and diluted | 119,767 | 118,613 | ||||||
Note 3. Discontinued Operations
Snap Server NAS Portionno options “in-the-money.” During fiscal year 2011 and the Transition Period, the aggregate intrinsic value of its Systems Business:On June 27, 2008,options exercised under the Company’s equity incentive plans was minimal. The following table summarizes the Company’s options outstanding and exercisable at December 31, 2012:
| Options Outstanding | Options Exercisable | |||||||||||||||||||||
| Range of Exercise Prices | Number Outstanding | Weighted Average Remaining Contractual Life | Weighted Average Exercise Price | Number Exercisable | Weighted Average Exercise Price | |||||||||||||||||
| (in thousands, except exercise price and contractual life) | ||||||||||||||||||||||
| $25.00 | - | $30.00 | 45 | 8.56 | $ | 28.67 | 26 | $ | 28.88 | |||||||||||||
| $30.01 | - | $35.00 | 15 | 6.42 | $ | 32.84 | 12 | $ | 32.84 | |||||||||||||
| $35.01 | - | $40.00 | - | - | $ | - | - | $ | - | |||||||||||||
| $40.01 | - | $45.00 | 5 | 5.19 | $ | 40.72 | 8 | $ | 40.72 | |||||||||||||
| 65 | 46 | |||||||||||||||||||||
| Shares | Weighted Average Grant Date Fair Value | |||||||
| (in thousands) | ||||||||
| Non-vested stock at March 31, 2010 | 172 | $ | 30.10 | |||||
| Awarded | 8 | $ | 29.30 | |||||
| Vested | (45 | ) | $ | 32.80 | ||||
| Forfeited | (127 | ) | $ | 29.10 | ||||
| Non-vested stock at December 31, 2010 | 8 | $ | 29.40 | |||||
| Awarded | 17 | $ | 37.61 | |||||
| Vested | (10 | ) | $ | 28.97 | ||||
| Forfeited | - | $ | 28.39 | |||||
| Non-vested stock at December 31, 2011 | 15 | $ | 29.40 | |||||
| Awarded | 100 | $ | 27.34 | |||||
| Vested | (12 | ) | $ | 29.09 | ||||
| Forfeited | - | $ | - | |||||
| Non-vested stock at December 31, 2012 | 103 | $ | 23.34 | |||||
Fiscal Year Ended December 31, | Nine-Month Transition | |||||||||||
| 2012 | 2011 | 2010(2) | ||||||||||
| (in thousands) | ||||||||||||
| Stock-based compensation expense by caption | ||||||||||||
| Selling, marketing and administrative | $ | 1,487 | $ | 524 | $ | 470 | ||||||
Effect on income (loss) from continuing operations, net of taxes(1) | $ | 1,487 | $ | 524 | $ | 470 | ||||||
| Stock-based compensation expense by type of award: | ||||||||||||
| Stock options | $ | 92 | $ | 69 | $ | 215 | ||||||
| Restricted stock awards and restricted stock units | 1,395 | 455 | 255 | |||||||||
Effect on income (loss) from continuing operations, net of taxes(1) | $ | 1,487 | $ | 524 | $ | 470 | ||||||
| (1) | The total stock-based compensation, net of taxes, recorded on the Consolidated Statements of Operations and Consolidated Statements of Cash Flows for Transition Period and fiscal 2010, differs from the Consolidated Statements of Stockholders’ Equity as the Consolidated Statements of Stockholders’ Equity includes both continuing and discontinued operations. |
| (2) | The stock-based compensation recorded in the Transition Period excluded the cash compensation expense of $1.2 million paid to employees related to the settlement of unvested stock-based awards in the form of a fixed cash payment. |
Fiscal Year Ended December 31, | Nine-Month Transition | |||||||||||
| 2012 | 2011 | 2010 | ||||||||||
| Expected life (in years) | 1.1 | 4.3 | 5.5 | |||||||||
| Risk-free interest rate | 0.2 | % | 1.5 | % | 1.7 | % | ||||||
| Expected volatility | 58 | % | 44 | % | 44 | % | ||||||
| Dividend yield | - | - | - | |||||||||
| Forfeiture rate | 40 | % | 40 | % | 40 | % | ||||||
| Weighted average fair value | ||||||||||||
| Stock options | $ | 13.32 | $ | - | $ | 12.30 | ||||||
| Restricted stock | $ | 27.34 | $ | 28.40 | $ | 28.30 | ||||||
ADAPTEC, INC.
NOTES TO CONSOLIDATED FINANCIAL STATEMENTS (Continued)
(Unaudited)
Note 3. Discontinued Operations (Continued)
PMC-Sierra, which were reimbursed by PMC-Sierra.
Net revenuesaccompanying financial statements and prior periods have been reclassified to conform to this presentation.
| Year Ended March 31, | ||||||||
| 2009 | 2008 | |||||||
| (in thousands) | ||||||||
Net revenues | $ | 4,413 | $ | 21,899 | ||||
Loss from discontinued operations before provision for income taxes | (941 | ) | (7,441 | ) | ||||
Benefit from income taxes | — | 2,719 | ||||||
Loss from discontinued operations, net of taxes | $ | (941 | ) | $ | (4,722 | ) | ||
In the third quarter of
Fiscal Year Ended December 31, | Nine-Month Transition | |||||||||||
| 2012 | 2011 | 2010 | ||||||||||
| (in thousands) | ||||||||||||
| Revenues | $ | 451 | $ | 91 | $ | 20,620 | ||||||
| Income (loss) from discontinued operations before income taxes | $ | (1,935 | ) | $ | 1,624 | $ | (17,647 | ) | ||||
| Benefit from income taxes | - | - | 6,358 | |||||||||
| Income (loss) from discontinued operations, net of taxes | $ | (1,935 | ) | $ | 1,624 | $ | (11,289 | ) | ||||
DPS Business for $1.9 million and activity from The components of net liabilities, atShow. There was no financial activity from the time of the sale of the Snap Server NAS business, were as follows:
| June 27, 2008 | ||||
| (in thousands) | ||||
Inventories | $ | 1,466 | ||
Accounts receivable, net | (466 | ) | ||
Total current assets of discontinued operations | 1,000 | |||
Property and equipment, net | 53 | |||
Total assets of discontinued operations | 1,053 | |||
Accrued and other liabilities | (4,067 | ) | ||
Total current liabilities of discontinued operations | (4,067 | ) | ||
Net liabilities of discontinued operations | $ | (3,014 | ) | |
Accounts receivable and accounts payable on the Consolidated Balance Sheet at June 27, 2008, related to the Snap Server NAS business, were not included inAristos Business during fiscal year 2011. The loss from discontinued operations asfor the Company retained these assets and liabilities; however, since Overland assumed service and support liabilities for deferred revenue, deferred margin and warranty, the Company was relievedfiscal year ended December 31, 2012 includes activity of these liabilities as well as certain sales returns and allowances contained in accounts receivable.
IBM i/p Series RAID business:In fiscal 2008, the Company recorded $0.5 million to “Gain on disposal of discontinued operations, net of taxes” in its Consolidated Statements of Operations, which related to the reduction of accrued liabilities associated with the sale of the IBM i/p Series RAID business and related royalties in September 2005. The Company had recognized a cumulative gain of $4.8 million on the disposal of the IBM i/p Series RAID business through fiscal 2008.
4.6. Marketable SecuritiesThe
F-16
ADAPTEC, INC.
NOTES TO CONSOLIDATED FINANCIAL STATEMENTS (Continued)
(Unaudited)
Note 4. Marketable Securities (Continued)
policy also limitsor with any single asset manager without the final maturity on any investment and the overall duration of the portfolio.Board’s approval. Given the overall market conditions, the Company regularly reviews its investment portfolio to ensure adherence to itsthe investment policy and to monitor individual investments for risk analysis and proper valuation.
| Cost | Gross Unrealized Gains | Gross Unrealized Losses | Estimated Fair Value | ||||||||||||
| (in thousands) | |||||||||||||||
Available-for-Sale Marketable Securities: | |||||||||||||||
Short-term deposits | $ | 16,739 | $ | — | $ | — | $ | 16,739 | |||||||
United States government securities | 41,058 | 156 | (15 | ) | 41,199 | ||||||||||
Government agencies | 92,795 | 905 | (34 | ) | 93,666 | ||||||||||
Mortgage-backed securities | 42,309 | 559 | (55 | ) | 42,813 | ||||||||||
State and municipalities | 1,065 | — | (2 | ) | 1,063 | ||||||||||
Corporate obligations | 136,934 | 1,675 | (18 | ) | 138,591 | ||||||||||
Asset-backed securities | 7,791 | 119 | — | 7,910 | |||||||||||
Total available-for-sale securities | 338,691 | 3,414 | (124 | ) | 341,981 | ||||||||||
Amounts classified as cash equivalents | (30,582 | ) | — | — | (30,582 | ) | |||||||||
Amounts classified as marketable securities | $ | 308,109 | $ | 3,414 | $ | (124 | ) | $ | 311,399 | ||||||
| Cost | Gross Unrealized | Gross Unrealized | Estimated Fair | |||||||||||||
| (in thousands) | ||||||||||||||||
| Available-for-sale securities: | ||||||||||||||||
| Short-term deposits | $ | 48,596 | $ | - | $ | - | $ | 48,596 | ||||||||
| Mutual funds | 10,368 | 1,452 | - | 11,820 | ||||||||||||
| United States government securities | 99,299 | 178 | - | 99,477 | ||||||||||||
| Corporate securities | 20,842 | 1,255 | (1,980 | ) | 20,117 | |||||||||||
| Corporate obligations | 48,708 | 283 | (277 | ) | 48,714 | |||||||||||
| Commerical paper | 22,275 | 16 | - | 22,291 | ||||||||||||
| Total available-for-sale securities | 250,088 | 3,184 | (2,257 | ) | 251,015 | |||||||||||
| Amounts classified as cash equivalents | (51,887 | ) | - | - | (51,887 | ) | ||||||||||
| Amounts classified as marketable securities | $ | 198,201 | $ | 3,184 | $ | (2,257 | ) | $ | 199,128 | |||||||
| Cost | Gross Unrealized Gains | Gross Unrealized Losses | Estimated Fair Value | ||||||||||||
| (in thousands) | |||||||||||||||
Available-for-Sale Marketable Securities: | |||||||||||||||
Short-term deposits | $ | 62,657 | $ | — | $ | — | $ | 62,657 | |||||||
United States government securities | 6,511 | 144 | — | 6,655 | |||||||||||
Government agencies | 86,746 | 1,751 | — | 88,497 | |||||||||||
Mortgage-backed securities | 43,366 | 654 | (9 | ) | 44,011 | ||||||||||
Corporate obligations | 92,311 | 1,071 | (559 | ) | 92,823 | ||||||||||
Asset-backed securities | 32,755 | 198 | (71 | ) | 32,882 | ||||||||||
Total available-for-sale securities | 324,346 | 3,818 | (639 | ) | 327,525 | ||||||||||
Amounts classified as cash equivalents | (62,657 | ) | — | — | (62,657 | ) | |||||||||
Amounts classified as marketable securities | $ | 261,689 | $ | 3,818 | $ | (639 | ) | $ | 264,868 | ||||||
| Cost | Gross Unrealized | Gross Unrealized | Estimated Fair | |||||||||||||
| (in thousands) | ||||||||||||||||
| Available-for-sale securities: | ||||||||||||||||
| Short-term deposits | $ | 3,029 | $ | - | $ | - | $ | 3,029 | ||||||||
| United States government securities | 309,189 | 593 | (3 | ) | 309,779 | |||||||||||
| Government agencies | 3,505 | 21 | - | 3,526 | ||||||||||||
| Corporate obligations | 1,513 | 8 | - | 1,521 | ||||||||||||
| Total available-for-sale securities | 317,236 | 622 | (3 | ) | 317,855 | |||||||||||
| Amounts classified as cash equivalents | (2,914 | ) | - | - | (2,914 | ) | ||||||||||
| Amounts classified as marketable securities | $ | 314,322 | $ | 622 | $ | (3 | ) | $ | 314,941 | |||||||
ADAPTEC, INC.
NOTES TO CONSOLIDATED FINANCIAL STATEMENTS (Continued)
(Unaudited)
Note 4. Marketable Securities (Continued)
| Less than 12 Months | 12 Months or Greater | Total | ||||||||||||||||||
| Fair Value | Gross Unrealized Losses | Fair Value | Gross Unrealized Losses | Fair Value | Gross Unrealized Losses | |||||||||||||||
| (in thousands) | ||||||||||||||||||||
United States government securities | $ | 4,957 | $ | (15 | ) | $ | — | $ | — | $ | 4,957 | $ | (15 | ) | ||||||
Government agencies | 23,322 | (34 | ) | — | — | 23,322 | (34 | ) | ||||||||||||
Mortgage-backed securities | 7,702 | (55 | ) | — | — | 7,702 | (55 | ) | ||||||||||||
Corporate obligations | 1,064 | (2 | ) | — | — | 1,064 | (2 | ) | ||||||||||||
Asset-backed securities | 16,038 | (18 | ) | — | — | 16,038 | (18 | ) | ||||||||||||
Total | $ | 53,083 | $ | (124 | ) | $ | — | $ | — | $ | 53,083 | $ | (124 | ) | ||||||
2012:
| Less than 12 Months | 12 Months or Greater | Total | ||||||||||||||||||||||
Fair Value | Gross Unrealized | Fair Value | Gross Unrealized | Fair Value | Gross Unrealized | |||||||||||||||||||
| (in thousands) | ||||||||||||||||||||||||
| U.S. government securities | $ | 88,420 | $ | - | $ | 11,056 | $ | - | $ | 99,476 | $ | - | ||||||||||||
| Corporate oligations | 24,346 | (2 | ) | 24,370 | (272 | ) | 48,716 | (274 | ) | |||||||||||||||
| Total | $ | 112,766 | $ | (2 | ) | $ | 35,426 | $ | (272 | ) | $ | 148,192 | $ | (274 | ) | |||||||||
| Less than 12 Months | 12 Months or Greater | Total | |||||||||||||||||||
| Fair Value | Gross Unrealized Losses | Fair Value | Gross Unrealized Losses | Fair Value | Gross Unrealized Losses | ||||||||||||||||
| (in thousands) | |||||||||||||||||||||
Mortgage-backed securities | $ | 3,836 | $ | (9 | ) | $ | — | $ | — | $ | 3,836 | $ | (9 | ) | |||||||
Corporate obligations | 20,097 | (303 | ) | 8,154 | (256 | ) | 28,251 | (559 | ) | ||||||||||||
Asset-backed securities | 5,874 | (70 | ) | 499 | (1 | ) | 6,373 | (71 | ) | ||||||||||||
Total | $ | 29,807 | $ | (382 | ) | $ | 8,653 | $ | (257 | ) | $ | 38,460 | $ | (639 | ) | ||||||
2011:
| Less than 12 Months | 12 Months or Greater | Total | ||||||||||||||||||||||
Fair Value | Gross Unrealized | Fair Value | Gross Unrealized | Fair Value | Gross Unrealized | |||||||||||||||||||
| (in thousands) | ||||||||||||||||||||||||
| U.S. government securities | $ | 15,186 | $ | (3 | ) | $ | - | $ | - | $ | 15,186 | $ | (3 | ) | ||||||||||
F-18
ADAPTEC, INC.
NOTES TO CONSOLIDATED FINANCIAL STATEMENTS (Continued)
(Unaudited)
Note 4. Marketable Securities (Continued)
asset.
| March 31, 2010 | March 31, 2009 | |||||||||||
| Cost | Estimated Fair Value | Cost | Estimated Fair Value | |||||||||
| (in thousands) | ||||||||||||
Mature in one year or less | $ | 154,314 | $ | 155,728 | $ | 165,435 | $ | 166,294 | ||||
Mature after one year through three years | 184,060 | 185,934 | 155,980 | 158,236 | ||||||||
Mature after three years | 317 | 319 | 2,931 | 2,995 | ||||||||
| $ | 338,691 | $ | 341,981 | $ | 324,346 | $ | 327,525 | |||||
The maturities
| Cost | Estimated Fair Value | |||||||
| (in thousands) | ||||||||
| Mature in one year or less | $ | 214,784 | $ | 215,589 | ||||
| Mature after one year through three years | 19,550 | 19,854 | ||||||
| Mature in more than three years | 15,753 | 15,572 | ||||||
| Total | $ | 250,087 | $ | 251,015 | ||||
| Unrealized Gain on Securities | Cumulative Translation Adjustment | Total | ||||||||||
| Balance at December 31, 2011 | $ | 624 | $ | 119 | $ | 743 | ||||||
| Other comprehensive income (loss) | 303 | (100 | ) | 203 | ||||||||
| Balance at December 31, 2012 | $ | 927 | $ | 19 | $ | 946 | ||||||
5.8. Fair Value MeasurementsOn April 1, 2008, the Company partially adopted the accounting and disclosure requirements for measuring fair value related to all of the Company’s recurring non-financial assets and liabilities. On April 1, 2009, the Company adopted the remaining accounting and disclosure requirements for the non-recurring fair value measurements of non-financial assets and liabilities, including guidance provided by the FASB on how to determine the fair value of assets and liabilities when the volume and level of activity for the asset or liability has significantly decreased when compared with normal market activity for the asset or liability as well as guidance on identifying circumstances that indicate a transaction is not orderly. The adoption of these accounting standards did not have a material impact on the Company’s Consolidated Financial Statements.
ADAPTEC, INC.
NOTES TO CONSOLIDATED FINANCIAL STATEMENTS (Continued)
(Unaudited)
Note 5. Fair Value Measurements (Continued)
Financial assetsvalue, which includes the Company’s two venture fund investments and the Rogue contingent consideration. The carrying amount of the contingent consideration is measured at fair value on a recurring basis at March 31, 2010 and 2009 were as follows:
| Total | March 31, 2010 | Total | March 31, 2009 | |||||||||||||||
| Fair Value Measurements At Reporting Date Using | Fair Value Measurements At Reporting Date Using | |||||||||||||||||
| Quoted Prices in Active Markets for Identical Assets (Level 1) | Significant Other Observable Inputs (Level 2) | Quoted Prices in Active Markets for Identical Assets (Level 1) | Significant Other Observable Inputs (Level 2) | |||||||||||||||
| (in thousands) | ||||||||||||||||||
Cash,including short-term deposits(1) | $ | 50,105 | $ | 50,105 | $ | — | $ | 111,724 | $ | 111,724 | $ | — | ||||||
United States government securities(2) | 41,199 | 41,199 | — | 6,655 | 6,655 | — | ||||||||||||
Government agencies(3) | 93,666 | 93,666 | — | 88,497 | 88,497 | — | ||||||||||||
Mortgage-backed securities(3) | 42,813 | 41,696 | 1,117 | 44,011 | 41,821 | 2,190 | ||||||||||||
State and Municipalities(3) | 1,063 | 1,063 | — | — | — | — | ||||||||||||
Corporate obligations(4) | 138,591 | — | 138,591 | 92,823 | — | 92,823 | ||||||||||||
Asset-backed securities(3) | 7,910 | — | 7,910 | 32,882 | — | 32,882 | ||||||||||||
Total | $ | 375,347 | $ | 227,729 | $ | 147,618 | $ | 376,592 | $ | 248,697 | $ | 127,895 | ||||||
At March 31, 2010, the Company utilized level 3, which is categorized as significantusing unobservable inputs to valuein which little or no market activity exists. The Company periodically monitors its non-financial assets on a non-recurring basis. The non-financial assets related to the Company’s non-controlling interest in certain non-public companies through two venture capital funds Pacven Walden Ventures V Funds and APV Technology Partners II, L.P. Pacven Walden Venture V Funds invests in technology companies worldwide, primarily in the communications, electronics, IT services, internet, software, life sciences and semiconductor industries. APV Technology Partners II, L.P. invests in technology companies that are privately-held, which are organized in the United States. At March 31, 2010 and 2009, the carrying value of suchrecords these investments aggregated $1.2 million for each period, and was included within “Other Long Term Assets”long-term assets” on the ConsolidatedCondensed Balance Sheets. The Company regularly monitors these investments by recording these investmentsSheets based on quarterly statements the Company receives from each of the funds. The statements are generally received one quarter in arrears, as more timely valuations are not practical. The statements reflect the net asset value, which the Company uses to determine the fair value for these investments, which (a) do not have a readily determinable fair value and (b) either have the attributes of an investment company or prepare their financial statements consistent with the measurement principles of an investment company. AssumptionsThe assumptions used by the Company, due to
F-20
ADAPTEC, INC.
NOTES TO CONSOLIDATED FINANCIAL STATEMENTS (Continued)
(Unaudited)
Note 5. Fair Value Measurements (Continued)
lack of observable inputs, may impact the fair value of these equity investments in future periods. In the event that the carrying value of its equity investments exceeds their fair value, or the decline in value is determined to be other-than-temporary, the carrying value is reduced to its current fair value, which is recorded in “Interest and Other Income, Net,other income, net,” in the ConsolidatedCondensed Statements of Operations. At both MarchDecember 31, 2010 and 2009,2012, there were no significant transfers in or outthat occurred between any of level 3the levels of the Company’s financial assets.
Fair Value Measurements at Reporting Date Used | ||||||||||||||||
| Total | Quoted Prices in Active | Significant Other | Significant Unobservable | |||||||||||||
| (in thousands) | ||||||||||||||||
| Assets | ||||||||||||||||
Cash, including short-term deposits(1) | $ | 80,085 | $ | 80,085 | $ | - | $ | - | ||||||||
United States government securities(2) | 99,477 | 99,477 | - | - | ||||||||||||
Corporate securities(2) | 20,117 | 20,117 | - | - | ||||||||||||
Commercial paper(2) | 22,291 | - | 22,291 | - | ||||||||||||
Corporate obligations(2) | 48,714 | - | 46,931 | 1,783 | ||||||||||||
Non-controlling interests in certain funds(3) | 1,021 | - | - | 1,021 | ||||||||||||
| $ | 271,705 | $ | 199,679 | $ | 69,222 | $ | 2,804 | |||||||||
| Liabilities | ||||||||||||||||
Rogue contingent consideration(4) | $ | (475 | ) | $ | - | $ | - | $ | (475 | ) | ||||||
| (1) | At December 31 2012, the Company recorded $68.2 million and $11.9 million within “Cash and cash equivalents” and “Marketable securities,” respectively. | ||
| (2) | Recorded within “Marketable securities.” | ||
| (3) | Recorded within “Other long-term assets.” | ||
| (4) | Recorded within “Accrued expenses and other liabilities.” | ||
Fair Value Measurements at Reporting Date Used | ||||||||||||||||
| Total | Quoted Prices in Active | Significant Other | Significant Unobservable | |||||||||||||
| (in thousands) | ||||||||||||||||
| Assets | ||||||||||||||||
Cash, including short-term deposits(1) | $ | 8,601 | $ | 8,601 | $ | - | $ | - | ||||||||
U.S. government securities(2) | 309,780 | 309,780 | - | - | ||||||||||||
Government agencies(2) | 3,526 | 3,526 | - | - | ||||||||||||
Corporate obligations(2) | 1,521 | - | 1,521 | - | ||||||||||||
Non-controlling interests in certain funds(3) | 1,117 | - | - | 1,117 | ||||||||||||
| $ | 324,545 | $ | 321,907 | $ | 1,521 | $ | 1,117 | |||||||||
| Liabilities | ||||||||||||||||
Rogue contingent consideration(4) | $ | (1,218 | ) | $ | - | $ | - | $ | (1,218 | ) | ||||||
| (1) | At December 31 2011, the Company recorded $8.5 million and $0.1 million within “Cash and cash equivalents” and “Marketable securities,” respectively. | ||
| (2) | Recorded within “Marketable securities.” | ||
| (3) | Recorded within “Other long-term assets.” | ||
| (4) | Recorded within “Accrued expenses and other liabilities.” | ||
| Amount | ||||
| (in thousands) | ||||
| Balance, December 31, 2010 | $ | - | ||
| Acquisition of Rogue | (1,218 | ) | ||
| Change in fair value | - | |||
| Balance, December 31, 2011 | (1,218 | ) | ||
| Change in fair value | 743 | |||
| Balance, December 31, 2012 | $ | (475 | ) | |
Note 6. Balance Sheet Details
Inventories
basis. Level 3 is categorized as significant unobservable inputs. The componentsCompany has no non-financial assets measured at fair value on a non-recurring basis as of inventories at MarchDecember 31, 2012 and 2011. At December 31, 2010, the Company had $6.0 million of long-lived assets held-for-sale classified as Level 3 non-financial assets measured at fair value on a non-recurring basis. These assets were originally classified as held and 2009used for $10.1 million, but were as follows:
| March 31, | ||||||
| 2010 | 2009 | |||||
| (in thousands) | ||||||
Raw materials | $ | 8 | $ | 62 | ||
Work-in-process | 393 | 240 | ||||
Finished goods | 1,941 | 3,793 | ||||
Inventories | $ | 2,342 | $ | 4,095 | ||
written down to the impaired fair value of $6.0 million on July 2, 2010, resulting in an impairment charge of $4.1 million included in the Consolidated Statement of Operations for the Transition Period. Other long-lived assets held and used were written down to zero value during the Transition Period, resulting in an impairment charge of $6.1 million.
| March 31, | ||||||||||
| Life | 2010 | 2009 | ||||||||
| (in thousands) | ||||||||||
Land | — | $ | 2,855 | $ | 2,855 | |||||
Buildings and improvements | 5-40 years | 12,698 | 12,915 | |||||||
Machinery and equipment | 3-5 years | 3,672 | 20,545 | |||||||
Furniture and fixtures | 3-7 years | 13,279 | 33,470 | |||||||
Leasehold improvements | Lesser of useful life or life of lease | 123 | 626 | |||||||
| 32,627 | 70,411 | |||||||||
Accumulated depreciation and amortization | (21,274 | ) | (58,747 | ) | ||||||
Property and equipment, net | $ | 11,353 | $ | 11,664 | ||||||
| December 31, | ||||||||
| 2012 | 2011 | |||||||
| (in thousands) | ||||||||
| Rigs and workover equipment | $ | 42,945 | $ | 11,750 | ||||
| Buildings and improvements | 6,110 | - | ||||||
| Land | 1,068 | - | ||||||
| Leasehold improvements | 5,909 | 5,677 | ||||||
| Other equipment | 25,440 | 3,205 | ||||||
| Vehicles | 1,639 | 648 | ||||||
| Furniture and fixtures | 308 | 100 | ||||||
| Assets in progress | 2,342 | - | ||||||
| 85,761 | 21,380 | |||||||
| Accumulated depreciation | (7,993 | ) | (320 | ) | ||||
| Property and equipment, net | $ | 77,768 | $ | 21,060 | ||||
ADAPTEC, INC.
NOTES TO CONSOLIDATED FINANCIAL STATEMENTS (Continued)
(Unaudited)
Note 6. Balance Sheet Details (Continued)
Accrued and Other Liabilities
The components of accrued and other liabilities at March 31, 2010 and 2009 were as follows:
| March 31, | ||||||
| 2010 | 2009 | |||||
| (in thousands) | ||||||
Tax-related | $ | 1,075 | $ | 1,540 | ||
Acquisition-related | 418 | 616 | ||||
Accrued compensation and related taxes(1) | 4,717 | 5,652 | ||||
Deferred margin | 2,717 | 1,338 | ||||
Obligations under software license agreement | 1,053 | — | ||||
Other | 2,291 | 4,105 | ||||
Accrued and other liabilities | $ | 12,271 | $ | 13,251 | ||
Other Long-term Liabilities
The components of other long-term liabilities at March 31, 2010 and 2009 were as follows:
| March 31, | ||||||
| 2010 | 2009 | |||||
| (in thousands) | ||||||
Tax-related | $ | 3,656 | $ | 5,852 | ||
Acquisition-related | 165 | 614 | ||||
Other | 934 | 844 | ||||
Other long-term liabilities | $ | 4,755 | $ | 7,310 | ||
Accumulated Other Comprehensive Income, Net of Taxes
The components of accumulated other comprehensive income, net of taxes, at March 31, 2010 and 2009 were as follows:
| March 31, | ||||||
| 2010 | 2009 | |||||
| (in thousands) | ||||||
Unrealized gain on marketable securities, net of taxes of $1,365 in both fiscal years 2010 and 2009 | $ | 1,930 | $ | 1,820 | ||
Foreign currency translation, net of taxes of $1,287 in both fiscal years 2010 and 2009 | 2,356 | 1,144 | ||||
Accumulated other comprehensive income, net of taxes | $ | 4,286 | $ | 2,964 | ||
F-22
ADAPTEC, INC.
NOTES TO CONSOLIDATED FINANCIAL STATEMENTS (Continued)
(Unaudited)
Note 7. “Loss from discontinued operations.”
Goodwill
| ||||
| ||||
| ||||
| ||||
In September 2008, goodwill was increased by $16.9 million due to the acquisition of Aristos (Note 2). Goodwill was not allocated but managed at the Company level, as the Company contains only one reporting unit. During the fourth quarter of fiscal 2009, the Company experienced a significant and continued decline in the market value of its common stock, which resulted in the Company’s market capitalization falling below its net book value. In addition, the Company performed its annual review
| Amount | ||||
| (in thousands) | ||||
| Balance, December 31, 2010 | $ | - | ||
| Goodwill acquired in the acquisition of Baseball Heaven | 192 | |||
| Goodwill acquired in the acquisition of The Show | 1,796 | |||
| Goodwill acquired in the acquisition of Rogue | 6,256 | |||
| Balance, December 31, 2011 | 8,244 | |||
| Goodwill acquired in the acquisition of Eagle | 10,126 | |||
| Goodwill acquired in the acquisition of Sun Well | 36,557 | |||
| Goodwill acquired in the acquisition of CrossFit South Bay | 154 | |||
| Impairment of goodwill of The Show | (1,796 | ) | ||
| Impairment of goodwill of Baseball Heaven | (192 | ) | ||
| Balance, December 31, 2012 | $ | 53,093 | ||
at December 31, 2012 and 2011 are as follows:
| December 31, | ||||||||
| 2012 | 2,011 | |||||||
| (in thousands) | ||||||||
| Goodwill | $ | 55,081 | $ | 8,244 | ||||
| Accumulated impairment | (1,988 | ) | - | |||||
| Net goodwill | $ | 53,093 | $ | 8,244 | ||||
| March 31, 2010 | March 31, 2009 | |||||||||||||||||||
| Gross Carrying Amount | Accumulated Amortization | Net Carrying Amount | Gross Carrying Amount | Accumulated Amortization | Net Carrying Amount | |||||||||||||||
| (in thousands) | ||||||||||||||||||||
Acquisition-related intangible assets: | ||||||||||||||||||||
Patents, core and existing technologies | $ | 34,348 | $ | (21,501 | ) | $ | 12,847 | $ | 34,348 | $ | (17,742 | ) | $ | 16,606 | ||||||
Customer relationships | 4,233 | (2,391 | ) | 1,842 | 4,233 | (1,091 | ) | 3,142 | ||||||||||||
Trade names | 674 | (674 | ) | — | 674 | (674 | ) | — | ||||||||||||
Backlog | 340 | (340 | ) | — | 340 | (340 | ) | — | ||||||||||||
Subtotal | 39,595 | (24,906 | ) | 14,689 | 39,595 | (19,847 | ) | 19,748 | ||||||||||||
Intellectual property assets and warrants | 26,992 | (26,992 | ) | — | 26,992 | (26,992 | ) | — | ||||||||||||
Software license | 1,755 | (415 | ) | 1,340 | — | — | — | |||||||||||||
Intangible assets, net | $ | 68,342 | $ | (52,313 | ) | $ | 16,029 | $ | 66,587 | $ | (46,839 | ) | $ | 19,748 | ||||||
In July 2009, the Company entered into a software license agreement with Synopsys, Inc. for $1.8 million, of which $0.7 million was paid in fiscal 2010 and the remaining $1.1 million will be paid through March 2011.
| December 31, 2012 | |||||||||||||||
| Cost | Accumulated Amortization | Net | Amortization Method | Estimated Useful Life (years) | |||||||||||
| (in thousands) | |||||||||||||||
| Steel Sports: | |||||||||||||||
| Customer relationships | $ | 235 | $ | (67 | ) | 168 | Straight-line | 5 | |||||||
| Steel Energy: | |||||||||||||||
| Customer relationships | 43,100 | (6,356 | ) | 36,744 | Accelerated | 10 | |||||||||
| Trade names | 4,100 | (1,125 | ) | 2,975 | Accelerated | 5 | |||||||||
| 47,200 | (7,481 | ) | 39,719 | ||||||||||||
| $ | 47,435 | $ | (7,548 | ) | $ | 39,887 | |||||||||
Amortizationcomponents of intangible assets, net, at December 31, 2011and their amortization details are as follows:
| December 31, 2011 | |||||||||||||||
| Cost | Accumulated Amortization | Net | Amortization Method | Estimated Useful Life (years) | |||||||||||
| (in thousands) | |||||||||||||||
| Steel Sports: | |||||||||||||||
| Customer relationships | $ | 235 | $ | (20 | ) | 215 | Straight-line | 5 | |||||||
| Steel Energy: | |||||||||||||||
| Customer relationships | 4,700 | (29 | ) | 4,671 | Accelerated | 10 | |||||||||
| Trade names | 900 | - | 900 | Accelerated | 5 | ||||||||||
| 5,600 | (29 | ) | 5,571 | ||||||||||||
| $ | 5,835 | $ | (49 | ) | $ | 5,786 | |||||||||
| Steel Sports | Steel Energy | Total | ||||||||||
| (in thousands) | ||||||||||||
| For the year ended December 31: | ||||||||||||
| 2013 | $ | 47 | $ | 8,534 | $ | 8,581 | ||||||
| 2014 | 47 | 6,565 | 6,612 | |||||||||
| 2015 | 47 | 5,267 | 5,314 | |||||||||
| 2016 | 27 | 4,216 | 4,243 | |||||||||
| 2017 | - | 3,158 | 3,158 | |||||||||
| Thereafter | - | 11,979 | 11,979 | |||||||||
| $ | 168 | $ | 39,719 | $ | 39,887 | |||||||
F-23
ADAPTEC, INC.
NOTES TO CONSOLIDATED FINANCIAL STATEMENTS (Continued)
(Unaudited)
Note 7. Goodwill and Intangible Assets, Net (Continued)
notified its customers that final shipments would occur by the end of September 2010. The Company performedalso planned to put its regular reviewbuilding up for sale towards the end of the Transition Period. As a result of these actions, the Company evaluated the carrying value of its long-lived assets at July 2, 2010 and determined that an indicator was present in fiscal 2008 in which the carrying value wasof such assets may not be fully recoverable. The Company then measured the impairment loss and recognized the amount in which the carrying value exceeded the estimated fair value by recording an impairment charge of $2.2$10.2 million in fiscal 2008 to write-off the intangible assets related to the Elipsan acquisition due to a revisionTransition Period, which is included in the Company’s forecasts that resulted in expected negative long-term cash flows for these assets for the first time, which was recorded within “Other gains, net”“Loss from discontinued operations, net of taxes,” in the Consolidated Statements of Operations. Of the $10.2 million impairment charge, $6.1 million related to the write off of intangible assets and the remaining $4.1 million related to the reduction of the carrying value of its property and equipment, net, to its estimated fair value. The estimated fair value was based on the market approach and considered the perspective of market participants using or exchanging the Company’s long-lived assets. The estimation of the impairment involved numerous assumptions that requirerequired judgment by the Company, including, but not limited to, future use of the assets for the Company’s operations versus sale or disposal of the assets and future selling prices for the Company’s products.
In December 2009, the Company announced that it initiated a process to pursue the potential sale or disposition of certain of its assets or business operations. As a result of this announcement, the Company evaluated its long-lived assets to determine whether the carrying value would be recoverable in the third quarter of fiscal 2010. As the Company continued through this sale process on certain of its assets or business operations in the fourth quarter of fiscal 2010, the Company reevaluated the recoverability of its long-lived assets’ carrying value at March 31, 2010. Based on the Company’s analysis, its long-lived assets were not considered impaired in either the third or fourth quarters of fiscal 2010 as the sum of the expected undiscounted future cash flows exceeded the carrying value of its long-lived assets of $27.4 million at March 31, 2010. The sum of the expected undiscounted future cash flows was weighted to take into consideration the possible outcomes of whether the long-lived assets, which were considered as one asset group based on the lowest level of independent cash flows generated, would be retained and utilized as opposed to sold or disposed.
The annual amortization expense of the intangible assets, net, that existed as of March 31, 2010, is expected to be as follows:
| Estimated Amortization Expense | |||
| (in thousands) | |||
Fiscal years: | |||
2011 | $ | 5,645 | |
2012 | 4,887 | ||
2013 | 3,931 | ||
2014 | 1,566 | ||
Total | $ | 16,029 | |
Subsequent to the Company’s fiscal year-end, with entering into an Asset Purchase Agreement with PMC-Sierra with respect to the PMC Transaction and the Company’s intent to either continue to pursue the sale of the Aristos products or wind down the sale or dispose of its Aristos products within the next six months, or by September 2010, as well as the Company’s consideration of the disposition or redeployment of its remaining non-core patents and real estate assets, the Company is expected to change the remaining useful life of its intangible assets of $16.0 million related to the Aristos products, which in turn, the Company expects to change the amount amortized prospectively during each reporting period. However, if the PMC Transaction is not consummated, the Company may not be able to realize its expected undiscounted future cash flows based on foreseen negative market perceptions. This may lead the Company to exit or divest in some additional or all of our current operations to focus on new opportunities. As a result, the Company will continue to reevaluate and reassess whether the Company may be required to record impairment charges for its long-lived assets in future periods.
ADAPTEC, INC.
NOTES TO CONSOLIDATED FINANCIAL STATEMENTS (Continued)
(Unaudited)
Company.
In fiscal 2009, the Company repurchased a total of $191.0 million in principal amount of its 3/4% Notes on the open market for an aggregate price of $188.9 million, resulting in a gain on extinguishment of debt of $1.7 million (net of unamortized debt issuance costs of $0.4 million), which was recorded within “Interest and other income, net” in the Consolidated Statements of Operations. In addition, the majority of the remaining holders of the 3/4% Notes exercised their put option in December 2008 and January 2009, which required the Company to purchase its 3/4% Notes at a price equal to 100.25% of the principal of the 3/4% Notes, resulting in the redemption of the 3/4% Notes for an aggregate cost of $34.0 million, plus accrued and unpaid interest.
Convertible Bond Hedge
Concurrentother liabilities at December 31, 2012 and 2011 are as follows:
| December 31, | ||||||||
| 2012 | 2011 | |||||||
| (in thousands) | ||||||||
| Tax-related | $ | 1,197 | $ | 56 | ||||
| Accrued compensation and related taxes | 3,658 | 1,593 | ||||||
| Deferred revenue | 299 | 278 | ||||||
| Professional services | 282 | 485 | ||||||
| Accrued fuel and rig-related charges | 162 | - | ||||||
| Accrued workers compensation | - | 1,233 | ||||||
| Other | 739 | 181 | ||||||
| $ | 6,337 | $ | 3,826 | |||||
| December 31, | ||||||||
| 2012 | 2011 | |||||||
| (in thousands) | ||||||||
| Tax-related | $ | 7,373 | $ | 10,737 | ||||
| Phantom stock liability | 1,798 | - | ||||||
| $ | 9,171 | $ | 10,737 | |||||
F-25
ADAPTEC, INC.
NOTES TO CONSOLIDATED FINANCIAL STATEMENTS (Continued)
(Unaudited)
Note 8. 3/4% Notes (Continued)
common stock at a price of $11.704 per share. The convertible bond hedge transaction cost of $64.1 million was accounted for as an equity transaction. The Company did not receive net shares or cash from the convertible bond hedge as this instrument had no valueemployees and expired in December 2008.
In fiscal 2004, in conjunction with the issuance of the 3/4% Notes, the Company received $30.4 million from the issuance to an affiliate of one of the initial purchasers of the 3/4% Notes of a warrant to purchase up to 19.2 million shares of the Company’s common stock at an exercise price of $18.56 per share. The warrant was valued using the Black-Scholes valuation model using a volatility rate of 42%, risk-free interest rate of 3.6% and an expected life of 5 years.consultants. The value of the warrant of $30.4 millionphantom shares outstanding was classified as equity. The warrant expired unexercised in December 2008.
Note 9. Employee Stock and Other Benefit Plans
Subsequent to the Company’s fiscal year-end,fixed as a result of the signingacquisition. If employees or consultants terminate from the Company other than by death or disability, their unvested shares are returned to the Phantom Plan. Phantom stockholders are entitled to receive a cash payment for their vested shares on February 1, 2016, unless there is a change of control or employee death. The Company is accounting for the unvested portion of the Asset Purchase AgreementPhantom Plan as post-combination compensation expense by accreting a liability over the vesting period.
| Amount | ||||
| (in thousands) | ||||
| For the year ended December 31: | ||||
| 2013 | $ | 4,000 | ||
| 2014 | 4,000 | |||
| 2015 | 5,000 | |||
| $ | 13,000 | |||
| Amount | ||||
| (in thousands) | ||||
| For the year ended December 31: | ||||
| 2013 | $ | 490 | ||
| 2014 | 463 | |||
| 2015 | 463 | |||
| 2016 | 134 | |||
| Total minimum lease payments | 1,550 | |||
| Less amount representing interest | (153 | ) | ||
| Present value of net minimum lease payments | 1,397 | |||
| Less current portion | (413 | ) | ||
| Capital lease obligations, net of current portion | $ | 984 | ||
Stock Benefit Plans
The Company grants stock options and other stock-based awards to employees, directors and consultants under two equity incentive plans, the 2004 Equity Incentive Plan and the 2006 Director Plan.2009. In addition, the Company has outstanding options issued under equity incentivehad an acquisition-related restructuring plan in place from its fiscal year ended March 31, 2006. The goals of these plans that have terminated and equity plans that it assumed in connection with its previous acquisitions. The Company also maintained its 1986 Employee Stock Purchase Plan until that plan expired in April 2006. These plans are described in further detail below.
Equity Incentive Plans, including the 2004 Equity Incentive Plan, the 2000 Non-statutory Stock Option Plan, 1999 Stock Plan and 1990 Stock Plan: In August 2004,were to bring the Company’s Board of Directors andoperational expenses to appropriate levels relative to its stockholders approved the Company’s 2004 Equity Incentive Plan and reserved for issuance thereunder 10,000,000 shares of the Company’s common stock plus shares reserved but not issued under the Company’s 2000 Non-statutory Stock Option Plan, 1999 Stock Plan and 1990 Stock Plan. The 2004 Equity Incentive Plan provides for the granting of incentive stock options, non-statutory stock options, restricted stock, stock awards, restricted stock units and stock appreciation rights to employees, employee directors and consultants. Stock options are subject to terms and conditions as determined by the Compensation Committee of the Company’s Board of Directors. For new hires, 25% of the shares subject to stock options generally vest and become exercisable one year from the date of grant and the balance of the shares then vest quarterly thereafter for the next three years. Stock options expire seven years from the date of grant. The Company’s stockholders approved the amendment and restatement of its 2004 Equity Incentive Plan at the 2008 Annual Meeting of Stockholders. Amendments to the 2004 Equity Incentive Plan included (1) reducing the number of shares available for grant to 14,500,000; however, the reserve will be proportionately reduced if the Company’s Board of Directors chooses to effect a reverse stock split based on certain exchange ratios approved by the Company’s stockholders;
ADAPTEC, INC.
NOTES TO CONSOLIDATED FINANCIAL STATEMENTS (Continued)
(Unaudited)
Note 9. Employee Stock and Other Benefit Plans (Continued)
(2) removing the 5,000,000 share limitation with respect to stock-based awards granted at less than fair market value; (3) revising the categories of performance-related goals that may be applicable to stock-based awards granted under the plan; (4) removing the “single trigger” acceleration of vesting upon a change in control; and (5) modifying the definition of incumbent directors with respect to the definition of a change of control. As of March 31, 2010, the Company had an aggregate of 20.1 million shares of its common stock reserved for issuance under its 2004 Equity Incentive Plan, of which 6.2 million shares were subject to outstanding options and other stock awards, and 13.9 million shares were available for future grants of options and other stock awards.
Director Stock Option Plans,historical net revenues, while simultaneously implementing extensive company-wide expense-control programs. All expenses, including the 2006 Director Stock Option Plan, 2000 Director Stock Option Plan and 1990 Directors’ Stock Option Plan: In September 2006, the Company’s Board of Directors and its stockholders approved the Company’s 2006 Director Plan and reserved for issuance thereunder 1,200,000 shares of the Company’s common stock plus shares reserved but not issued under the Company’s 2000 Director Stock Option Plan and the 1990 Directors’ Stock Option Plan. The 2006 Director Plan provides for the granting of non-qualified stock options, restricted stock, restricted stock units and stock appreciation rights to non-employee directors. Although grants made under the 2006 Director Plan are discretionary, the Company’s compensation program practice was as follows for fiscal 2010: (1) each non-employee director received an option to purchase 12,500 shares of the Company’s common stock each year, with such option vesting quarterly over one year and, (2) each non-employee directors received 12,500 shares of restricted stock each year, which will fully vest one year after the date of grant. However, both the option to purchase 12,500 shares of the Company’s common stock and 12,500 shares of restricted stock will vest immediately if the relationship between the Company and the non-employee director ceases for any reason. In addition, in fiscal 2010, the Company’s Board of Directors modified the vesting terms for all grants made prior to fiscal 2010 such that the options to purchase the Company’s stock and shares of restricted stock will vest immediately if the relationship between the Company and the non-employee director ceases for any reason. As of March 31, 2010, the Company had an aggregate of 2.0 million shares of its common stock reserved for issuance under its 2006 Director Plan, of which 0.4 million shares were subject to outstanding options and other stock awards, and 1.6 million shares were available for future grants.
Assumed Stock Option Plans: The Company has assumed the stock option plans and the outstanding stock options of certain acquired companies, including Snap Appliance, Inc. in fiscal 2005 and Eurologic Systems Group Limited (“Eurologic”) in fiscal 2004. No further options may be granted under these assumed plans. However, options that were outstanding under these plans will continue to be governed by their existing terms and may be exercised for shares of the Company’s common stock at any time prior to the expiration of the option term. As of March 31, 2010, the Company had minimal shares of common stock reserved that are subject to outstanding options under these assumed plans.
F-27
ADAPTEC, INC.
NOTES TO CONSOLIDATED FINANCIAL STATEMENTS (Continued)
(Unaudited)
Note 9. Employee Stock and Other Benefit Plans (Continued)
Stock Benefit Plans Activities
Equity Incentive Plans: A summary of option activity under all of the Company’s equity incentive plans as of March 31, 2010 and changes during fiscal years 2008, 2009 and 2010 was as follows:
| Shares | Weighted Average Exercise Price | Weighted Average Remaining Contractual Term (Years) | Aggregate Intrinsic Value | ||||||||
| (in thousands, except exercise price and contractual terms) | |||||||||||
Outstanding at March 31, 2007 | 12,992 | $ | 7.11 | ||||||||
Granted | 544 | $ | 3.51 | ||||||||
Exercised | (605 | ) | $ | 3.29 | |||||||
Forfeited | (901 | ) | $ | 5.05 | |||||||
Expired | (3,051 | ) | $ | 9.10 | |||||||
Outstanding at March 31, 2008 | 8,979 | $ | 6.67 | ||||||||
Granted | 1,293 | $ | 3.45 | ||||||||
Exercised | (498 | ) | $ | 3.36 | |||||||
Forfeited | (792 | ) | $ | 4.78 | |||||||
Expired | (3,610 | ) | $ | 8.58 | |||||||
Outstanding at March 31, 2009 | 5,372 | $ | 5.21 | ||||||||
Granted | 1,584 | $ | 2.87 | ||||||||
Exercised | (182 | ) | $ | 2.46 | |||||||
Forfeited | (515 | ) | $ | 3.08 | |||||||
Expired | (1,377 | ) | $ | 7.78 | |||||||
Outstanding at March 31, 2010 | 4,882 | $ | 4.05 | 3.86 | $ | 594 | |||||
Options vested and expected to vest at March 31, 2010 | 4,655 | $ | 4.10 | 3.74 | $ | 512 | |||||
Options exercisable at | |||||||||||
March 31, 2008 | 7,118 | $ | 7.25 | ||||||||
March 31, 2009 | 3,763 | $ | 5.90 | ||||||||
March 31, 2010 | 3,844 | $ | 4.34 | 3.19 | $ | 252 | |||||
ADAPTEC, INC.
NOTES TO CONSOLIDATED FINANCIAL STATEMENTS (Continued)
(Unaudited)
Note 9. Employee Stock and Other Benefit Plans (Continued)
The aggregate intrinsic value is calculated as the difference between the price of the Company’s common stock on The NASDAQ Global Market and the exercise price of the underlying awards for the 1.5 million shares subject to options that were in-the-money at March 31, 2010. During fiscal years 2010 and 2009, the aggregate intrinsic value of options exercised under the Company’s equity incentive plans was $0.3 million for each period, determined as of the date of option exercise. During fiscal 2008, the aggregate intrinsic value of options exercised under the Company’s equity incentive plans was minimal. The following table summarizes information about the Company’s options outstanding and exercisable equity incentive plans as of March 31, 2010:
| Options Outstanding | Options Exercisable | |||||||||||
Range of Exercise Prices | Number Outstanding | Weighted Average Remaining Contractual Life | Weighted Average Exercise Price | Number Outstanding | Weighted Average Exercise Price | |||||||
| (in thousands, except exercise price and contractual life) | ||||||||||||
$2.41 - $2.84 | 153 | 7.46 | $ | 2.74 | 71 | $ | 2.84 | |||||
$2.86 - $2.86 | 1,041 | 6.34 | $ | 2.86 | 410 | $ | 2.86 | |||||
$2.87 - $3.30 | 515 | 6.41 | $ | 3.11 | 324 | $ | 3.11 | |||||
$3.45 - $3.45 | 770 | 0.47 | $ | 3.45 | 770 | $ | 3.45 | |||||
$3.48 - $3.78 | 855 | 4.24 | $ | 3.69 | 747 | $ | 3.70 | |||||
$3.81 - $4.24 | 744 | 3.00 | $ | 4.08 | 718 | $ | 4.09 | |||||
$4.28 - $9.31 | 655 | 2.16 | $ | 6.17 | 655 | $ | 6.17 | |||||
$9.36 - $21.12 | 149 | 0.96 | $ | 12.71 | 149 | $ | 12.71 | |||||
$2.41 - $21.12 | 4,882 | 3.86 | $ | 4.05 | 3,844 | $ | 4.34 | |||||
As of March 31, 2010, the total unamortized stock-based compensation expense related to non-vested stock options, net of estimated forfeitures, was $1.1 million, and this expense is expected to be recognized over a remaining weighted-average period of 2.09 years.
Restricted Stock: Restricted stock awards and restricted stock units (collectively, “restricted stock”) have been granted under the Company’s 2004 Equity Incentive Plan and 2006 Director Plan. The Company’s right to repurchase shares of restricted stock awards lapses upon vesting, at which time the shares of restricted stock awards are released to the employees or directors. Restricted stock units are converted into common stock upon the release to the employees or directors upon vesting. Upon the vesting of restricted stock, the Company primarily uses the net share settlement approach, which withholds a portion of the shares to cover the applicable taxes. As of March 31, 2010, there were 0.9 million shares of service-based restricted stock awards and 0.8 million shares of restricted stock units outstanding, all of which are subject to forfeiture if employment terminates prior to the release of restrictions, exclusive of certain change of control provisions. Under the 2004 Equity Incentive Plan, restrictions generally lapse in one of the following ways: (1) 50% one year from the date of grant and the remainder on the second anniversary of the grant date; (2) 100% one year from the date of grant; (3) 33–1/3% one year from the date of grant and the remainder on the second anniversary of the grant date; (4) 66–2/3% one year from the date of grant and the remainder on the second anniversary of the grant date or (5) upon meeting certain performance criteria after being evaluated over a specified period from the date of grant. Under the 2006 Director Plan, restrictions generally lapse one year from the date of grant for non-employee directors; however, restricted stock will vest immediately if the relationship between the Company and the non-employee director ceases for any reason. The cost of restricted stock, determined to be the fair market value of the shares at the date of grant, is expensed ratably over the period the restrictions lapse; except for those
F-29
ADAPTEC, INC.
NOTES TO CONSOLIDATED FINANCIAL STATEMENTS (Continued)
(Unaudited)
Note 9. Employee Stock and Other Benefit Plans (Continued)
restricted stock units that would vest over a specified period based upon meeting certain performance criteria from the date of grant, which would then be evaluated on a quarterly basis. Under the 2004 Equity Incentive Plan, the specified period for restricted stock units with performance-based vesting generally ranges from 18 months to 36 months. Of the 0.8 million shares of restricted stock units outstanding at March 31, 2010, 0.7 million represented restricted stock units with performance-based vesting. The Company assessed the probability of these performance criteria being achieved at March 31, 2010 and 2009 and determined its probability was remote. Therefore, the Company did not record any stock-based compensation expenseadjustments, associated with these restricted stock units with performance-based vesting in fiscal years 2010 and 2009.
A summary of activity for restricted stock as of March 31, 2010 and changes during fiscal years 2010, 2009 and 2008 was as follows:
| Shares | Weighted Average Grant-Date Fair Value | |||||
| (in thousands, except weighted average grant-date fair value) | ||||||
Non-vested stock at March 31, 2007 | 1,179 | $ | 4.37 | |||
Awarded | 1,949 | $ | 3.47 | |||
Vested | (544 | ) | $ | 4.37 | ||
Forfeited | (599 | ) | $ | 3.88 | ||
Non-vested stock at March 31, 2008 | 1,985 | $ | 3.64 | |||
Awarded | 2,146 | $ | 3.46 | |||
Vested | (1,105 | ) | $ | 3.68 | ||
Forfeited | (845 | ) | $ | 3.66 | ||
Non-vested stock at March 31, 2009 | 2,181 | $ | 3.43 | |||
Awarded | 1,811 | $ | 2.85 | |||
Vested | (1,258 | ) | $ | 3.64 | ||
Forfeited | (1,016 | ) | $ | 2.86 | ||
Non-vested stock at March 31, 2010 | 1,718 | $ | 3.01 | |||
All restricted stock was awarded at the par value of $0.001 per share. As of March 31, 2010, the total unrecognized compensation expense related to non-vested restricted stock that is expected to vest, net of estimated forfeitures, which is inclusive of the restricted stock units with performance-based vesting discussed above, was $2.8 million, and this expense is expected to be recognized over a remaining weighted-average period of 1.75 years.
ADAPTEC, INC.
NOTES TO CONSOLIDATED FINANCIAL STATEMENTS (Continued)
(Unaudited)
Note 9. Employee Stock and Other Benefit Plans (Continued)
Stock-Based Compensation
Stock-based compensation expense included in the Consolidated Statements of Operations for fiscal years 2010, 2009 and 2008 were as follows:
| Years Ended March 31, | ||||||||||
| 2010(2) | 2009 | 2008 | ||||||||
| (in thousands) | ||||||||||
Stock-based compensation expense by caption: | ||||||||||
Cost of revenues | $ | 441 | $ | 382 | $ | 380 | ||||
Research and development | 1,567 | 252 | 2,205 | |||||||
Selling, marketing and administrative | 3,808 | 2,525 | 3,414 | |||||||
Stock-based compensation expense effect on loss from continuing operations, net of taxes(1) | $ | 5,816 | $ | 3,159 | $ | 5,999 | ||||
Stock-based compensation expense by type of award: | ||||||||||
Stock options | $ | 2,098 | $ | 1,104 | $ | 2,092 | ||||
Restricted stock awards and restricted stock units | 3,718 | 2,055 | 4,253 | |||||||
Employee stock purchase plan(3) | — | — | (346 | ) | ||||||
Stock-based compensation expense effect on loss from continuing operations, net of taxes(1) | $ | 5,816 | $ | 3,159 | $ | 5,999 | ||||
Stock-based compensation expense in the above table does not reflect any significant income taxes, which is consistent with the Company’s treatment of income or loss from its United States operations. For fiscal years 2010, 2009 and 2008, there was no income tax benefits realized for the tax deductions from option exercises of the stock-based payment arrangements. In addition, there was no stock-based compensation costs capitalized as part of an assetrestructuring plans are included in fiscal years 2010, 2009 and 2008 as the amounts were not material.
F-31
ADAPTEC, INC.
NOTES TO CONSOLIDATED FINANCIAL STATEMENTS (Continued)
(Unaudited)
Note 9. Employee Stock and Other Benefit Plans (Continued)
Valuation Assumptions
The Company used the Black-Scholes option pricing model for determining the estimated fair value for stock-based awards. The use of the Black-Scholes model requires the use of extensive actual exercise behavior data and the use of a number of complex assumptions including expected volatility, risk-free interest rate, expected term, and expected dividends.
The Company’s policy is to estimate the volatility of its stock using historical volatility, as well as the implied volatility in market-traded options on its common stock. Given the lack of market data since April 1, 2006 relating to traded options in the Company’s common stock, only historical volatility has been used in the Company’s stock-based fair value calculations. The Company will continue to monitor these and other relevant factors used to measure expected volatility for future option grants.
The risk-free interest rate assumption is based upon observed interest rates using the implied yield currently available on U.S. Treasury zero-coupon issues that is appropriate for the term of the Company’s stock options.
The dividend yield assumption is based on the Company’s history and expectation of dividend payouts. The Company has historically not paid dividends and has no foreseeable plans to issue dividends as it is the Company’s current policy to reinvest earnings for its business.
The expected term of stock options represents the weighted-average period that the stock options are expected to remain outstanding. The Company derived the expected term assumption based on its historical settlement experience, while giving consideration to options that have life cycles less than the contractual terms and vesting.
The fair value of the Company’s outstanding stock options and other stock-based awards granted in fiscal years 2010, 2009 and 2008, was estimated using the following weighted-average assumptions:
| Years Ended March 31, | ||||||||||||
| 2010(1) | 2009 | 2008 | ||||||||||
Equity Incentive Plans: | ||||||||||||
Expected life (in years) | 4.0 | 4.4 | 4.3 | |||||||||
Risk-free interest rates | 2.2 | % | 2.7 | % | 3.7 | % | ||||||
Expected volatility | 49 | % | 38 | % | 38 | % | ||||||
Dividend yield | — | — | — | |||||||||
Weighted average fair value | ||||||||||||
Stock options | $ | 1.16 | $ | 1.21 | $ | 1.48 | ||||||
Restricted stock | $ | 2.86 | $ | 3.46 | $ | 3.47 | ||||||
There are significant variations among allowable valuation models, and there is a possibility that the Company may adopt a different valuation model or refine the inputs and assumptions under its current valuation model in the future resulting in a lack of consistency in future periods. The Company’s current or future valuation model and the inputs and assumptions it makes may also lack comparability to other companies that use different models, inputs, or assumptions, and the resulting differences in comparability could be material.
ADAPTEC, INC.
NOTES TO CONSOLIDATED FINANCIAL STATEMENTS (Continued)
(Unaudited)
Note 9. Employee Stock and Other Benefit Plans (Continued)
Other Benefit Plans
The Company has a defined contribution retirement plan under Section 401(k) of the Internal Revenue Code for eligible U.S. employees. The 401(k) allows participants to defer between 3% and 25% of their annual compensation for fiscal years 2008 and 2009 on a pre-tax basis and defer between 3% and 75% of their annual compensation for fiscal 2010 on a pre-tax basis, where were all subject to the statutory limits prescribed by the Internal Revenue Code. The Company matched employee contributions at a one to one ratio, with a maximum contribution of $2,000 per year per eligible employee. Effective January 1, 2008, the Company matches at a 50% rate for each dollar contributed by each eligible employee on their first $6,000 contributed during the calendar year. The Company may make additional variable matching contributions to eligible employees based on the Company’s performance. The matching contributions made by the Company are immediately vested. During fiscal years 2010, 2009 and 2008, the Company’s contributions to the 401(k) plan were $0.4 million, $0.5 million and $0.5 million, respectively. The Company also maintains other benefit plans for its non-U.S. employees in which the Company contributed $0.2 million, $0.3 million and $0.4 million in fiscal years 2010, 2009 and 2008.
Common Stock Repurchase Program
In July 2008, the Company’s Board of Directors authorized a stock repurchase program to purchase up to $40 million of the Company’s common stock. During fiscal 2010, the Company purchased approximately 0.7 million shares of its common stock at an average price of $2.46 for an aggregate purchase price of $1.7 million, excluding brokerage commissions. During fiscal 2009, the Company purchased approximately 1.0 million shares of its common stock at an average price of $2.29 for an aggregate purchase price of $2.4 million, excluding brokerage commissions. The Company has accounted for these treasury shares, which have not been retired or reissued, under the treasury method. All purchases made under the program were made in the open market. As of March 31, 2010, $35.9 million remained available for repurchase under the authorized stock repurchase program.
Note 10. Commitments and Contingencies
Operating Lease Obligations
The Company leases certain office facilities, vehicles, and equipment under operating lease agreements that expire at various dates through fiscal 2014. As of March 31, 2010, future minimum lease payments and future sublease income under non-cancelable operating leases and subleases were as follows:
| Future Minimum Lease Payments | Future Sublease Income | |||||
| (in thousands) | ||||||
2011 | $ | 2,329 | $ | 1,426 | ||
2012 | 913 | 797 | ||||
2013 | 107 | 91 | ||||
2014 | 94 | — | ||||
2015 and thereafter | — | — | ||||
Total | $ | 3,443 | $ | 2,314 | ||
Net rent expense was approximately $1.0 million, $1.5 million and $3.6 million during fiscal years 2010, 2009 and 2008, respectively.
F-33
ADAPTEC, INC.
NOTES TO CONSOLIDATED FINANCIAL STATEMENTS (Continued)
(Unaudited)
Note 10. Commitments and Contingencies (Continued)
As part of the PMC Transaction , PMC-Sierra has agreed to assume the obligations for certain of the Company’s leased facilities, primarily related to its international sites, if the transaction is consummated.
Purchase Obligations
Purchase obligations relate to the Company’s contractual commitments to purchase goods or services. At March 31, 2010, the Company’s purchase obligations aggregated $12.4 million, which was based on the Company’s current needs and the Company’s expectations that its vendors will fulfill these orders in fiscal 2011.
In July 2008, the Company entered into a three-year strategic development agreement with HCL Technologies Limited, (“HCL”), to provide product development and engineering services for its product portfolio. Under the terms of the agreement, HCL agreed to employ certain of the Company’s former engineering employees, who will work exclusively on the Company’s engineering projects. In connection with this agreement, the Company incurred costs of $2.4 million and $1.7 million in fiscal years 2010 and 2009, respectively, and has recorded these amounts within “Research and development expense” in the Consolidated Statements of Operations. The Company has committed to make additional payments up to $2.9 million through fiscal 2012, of which $2.1 million is expected to be due in fiscal 2011 and the remaining $0.8 million is expected to be due in fiscal 2012. However, this agreement will be transferred to PMC-Sierra assuming the PMC Transaction is consummated.
Legal Proceedings
The Company is a party to litigation matters and claims, including those related to intellectual property, which are normal in the course of its operations, and while the results of such litigation matters and claims cannot be predicted with certainty, the Company believes that the final outcome of such matters will not have a material adverse impact on its financial position or results of operations. However, because of the nature and inherent uncertainties of litigation, should the outcome of these actions be unfavorable, the Company’s business, financial condition, results of operations and cash flows could be materially and adversely affected.
In connection with the Company’s acquisitions of Aristos and Eurologic, a portion of the respective purchase prices and other future payments totaling $4.3 million and $3.8 million, respectively, were held back (the “Holdbacks”) to secure potential indemnification obligations of Aristos and Eurologic stockholders for unknown liabilities that may have existed as of each acquisition date. The Aristos Holdback of $4.3 million was paid in full in fiscal 2010. In fiscal 2009, the Company resolved the remaining disputed, outstanding claims against the Eurologic Holdback, by entering into a deed of indemnity and a written settlement agreement with the representative of the Eurologic stockholders, which resulted in an additional payment of $1.3 million. The Company’s initial payment of $2.3 million to the Eurologic stockholders was recorded in fiscal 2005. The remaining Eurologic Holdback balance of $0.2 million was retained by the Company and was recognized as a gain in fiscal 2009 in “Loss from discontinued operations, net of taxes” in the Consolidated Statements of Operations.
Risks and Uncertainties
In
Severance and Benefits | Other Charges | Total | ||||||||||
| (in thousands) | ||||||||||||
| Accrual balance at December 31, 2010 | $ | 881 | $ | 350 | $ | 1,231 | ||||||
| Accrual adjustments | (36 | ) | - | (36 | ) | |||||||
| Cash paid | (845 | ) | (350 | ) | (1,195 | ) | ||||||
| Accrual balance at December 31, 2011 | $ | - | $ | - | $ | - | ||||||
ADAPTEC, INC.
NOTES TO CONSOLIDATED FINANCIAL STATEMENTS (Continued)
(Unaudited)
Note 10. Commitments and Contingencies (Continued)
result of this uncertainty. If the Company consummates the PMC Transaction, it may incur significant charges in the future, which charges include, but are not limited to, increased amortization or depreciation of its long-lived assets due to potential changes to the expected remaining useful lives, potential impairment of its long-lived assets, restructuring charges, acceleration of compensation expense related to unvested stock-based awards, potential cash bonus payments and potential accelerated payments of certain of its contractual obligation, which may impact its results of operations and financial condition. The aggregate of these amounts cannot be quantified at this time. However,anticipate further subsequent event disclosures related to expected changes to the remaining useful lives of our long-lived assets, stock-based activity and associated compensation expense, and restructuring charges are discussed in Note 7, 9 and 11, respectively, to the Consolidated Financial Statements. The Company also recorded certain compensation costs of $1.1 million within “Accrued liabilities” on its Consolidated Balance Sheets at March 31, 2010, related to the expected payments based on the probability that specified objectives will be achieved, including objectives related to the potential sale or other disposition of certain of its assets and business operations based on a consulting service agreement that the Company entered into with Subramanian Sundaresh, the Company’s former CEO, and other contractual arrangements with certain members of management and executive officers.
11. Restructuring ChargesSubsequent to the Company’s fiscal year-end,13. Commitments and Contingencies
| Amount | ||||
| (in thousands) | ||||
| For the year ending December 31: | ||||
| 2013 | $ | 490 | ||
| 2014 | 463 | |||
| 2015 | 463 | |||
| 2016 | 134 | |||
| 2017 | - | |||
| $ | 1,550 | |||
The Company implemented several restructuring plans during fiscal years 2010, 2009 and 2008 and recorded restructuring charges of $1.6 million, $6.1 million and $6.3 million, respectively. The goal of these plans was to bring its operational expenses to appropriate levels relative to its net revenues, while simultaneously implementing extensive company-wide expense-control programs.
The restructuring charges of $1.6 million recorded in fiscal 2010 primarily related to the restructuring plan implemented duringequipment for the fiscal year with minimal adjustmentsended December 31, 2012 was $2.7 million as a result of the various acquisitions. Rent expense for fiscal 2011 and the Transition Period were immaterial.
F-35
ADAPTEC, INC.
NOTES TO CONSOLIDATED FINANCIAL STATEMENTS (Continued)
(Unaudited)
Note 11. Restructuring Charges (Continued)
Fiscal 2010 Restructuring Plan
In the third quarterresults of fiscal 2010, the Company committed to a new restructuring plan to better align its operating costssuch litigation matters and claims cannot be predicted with the continued decline in its net revenues, resulting in a restructuring charge of $1.6 million in fiscal 2010. The Company reduced its workforce primarily in the general administrative functions and provided severance and related benefits of $1.4 million. The Company also consolidated its facilities further and incurred a net estimated loss of $0.2 million for vacating the premises.
The following table sets forth the activity in the accrued restructuring balances related to the restructuring plan implemented in fiscal year 2010:
| Severance And Benefits | Other Charges | Total | ||||||||||
| (in thousands) | ||||||||||||
Charges for Fiscal 2010 Restructuring Plans | $ | 1,435 | $ | 220 | $ | 1,655 | ||||||
Cash paid | (1,355 | ) | (124 | ) | (1,479 | ) | ||||||
Accrual balance at March 31, 2010 | 80 | 96 | 176 | |||||||||
The Company anticipatescertainty, we believe that the remaining restructuring severance and benefits accrual balancefinal outcome of $0.1 million at March 31, 2010such matters will be substantially paid out by the endnot have a material adverse impact on our financial position, results of operations or cash flows. However, because of the first quarternature and inherent uncertainties of fiscal 2011, whilelitigation, should the remaining restructuring other chargesoutcome of $0.1 million, relating primarily to leases obligations, willthese actions be paid out through the third quarter of fiscal 2011, which was reflected in “Accrued and other liabilities” in the Consolidated Balance Sheets.
Fiscal 2009 Restructuring Plans
In the first quarter of fiscal 2009, the Company approved and initiated a restructuring plan to (1) reduce its operating expenses due to a declining revenue base, (2) streamline its operations and (3) better align its resources with its strategicunfavorable, our business, objectives, resulting in a restructuring charge of $3.8 million in fiscal 2009. This restructuring plan included workforce reductions in all functions of the organization worldwide and consolidation of its facilities, which resulted in restructuring charges of $3.0 million and $0.8 million, respectively. Of the $3.8 million recorded in fiscal 2009 related to this restructuring plan, $0.3 million was recorded in the fourth quarter of fiscal 2009, related to accrual adjustments for the additional estimated loss on the Company’s facilities and disposing of duplicative assets.
In the third quarter of fiscal 2009, the Company initiated additional actions to reduce expenses as its business began to be impacted by the deterioration of macroeconomic conditions, resulting in a restructuring charge of $2.1 million in fiscal 2009 related to severance and benefits for employee reductions primarily in sales, marketing and administrative functions.
ADAPTEC, INC.
NOTES TO CONSOLIDATED FINANCIAL STATEMENTS (Continued)
(Unaudited)
Note 11. Restructuring Charges (Continued)
The following table sets forth the activity in the accrued restructuring balances related to the restructuring plans implemented in fiscal year 2009:
| Severance And Benefits | Other Charges | Total | ||||||||||
| (in thousands) | ||||||||||||
Charges for Fiscal 2009 Restructuring Plans | $ | 5,186 | $ | 354 | $ | 5,540 | ||||||
Accrual adjustments | (54 | ) | 395 | 341 | ||||||||
Non-cash utilization | — | (124 | ) | (124 | ) | |||||||
Cash paid | (4,046 | ) | (455 | ) | (4,501 | ) | ||||||
Accrual balance at March 31, 2009 | 1,086 | 170 | 1,256 | |||||||||
Accrual adjustments | (16 | ) | — | (16 | ) | |||||||
Cash paid | (1,070 | ) | (157 | ) | (1,227 | ) | ||||||
Accrual balance at March 31, 2010 | $ | — | $ | 13 | $ | 13 | ||||||
The Company anticipates that the remaining restructuring at March 31, 2010, relating primarily to leases obligations, will be paid out through the first quarter of fiscal 2011, which was reflected in “Accrued and other liabilities” in the Consolidated Balance Sheets.
Fiscal 2008 Restructuring Plans
In the first quarter of fiscal 2008, the Company approved and initiated a plan to restructure its operations to reduce the Company’s operating expenses due to a declining revenue base by eliminating duplicative resources in all functions of the organization worldwide, resulting in a restructuring charge of $1.5 million related to severance and benefits for employee reductions. In the second quarter of fiscal 2008, the Company initiated additional actions in an effort to better align its cost structure with its anticipated OEM revenue stream and to improve the Company’sfinancial condition, results of operations and cash flows resulting in a restructuring chargecould be materially and adversely affected.
The following table sets forth the activity in the accrued restructuring balances related to the restructuring plans implemented in fiscal year 2008:
| Severance And Benefits | Other Charges | Total | ||||||||||
| (in thousands) | ||||||||||||
Charges for Fiscal 2008 Restructuring Plans | $ | 5,375 | $ | 1,289 | $ | 6,664 | ||||||
Non-cash utilization | — | (151 | ) | (151 | ) | |||||||
Cash paid | (5,354 | ) | (210 | ) | (5,564 | ) | ||||||
Accrual balance at March 31, 2008 | 21 | 928 | 949 | |||||||||
Accrual adjustments | (14 | ) | 195 | 181 | ||||||||
Cash paid | (7 | ) | (721 | ) | (728 | ) | ||||||
Accrual balance at March 31, 2009 | — | 402 | 402 | |||||||||
Accrual adjustments | — | (14 | ) | (14 | ) | |||||||
Cash paid | — | (378 | ) | (378 | ) | |||||||
Accrual balance at March 31, 2010 | $ | — | $ | 10 | $ | 10 | ||||||
F-37
ADAPTEC, INC.
NOTES TO CONSOLIDATED FINANCIAL STATEMENTS (Continued)
(Unaudited)
Note 11. Restructuring Charges (Continued)
The Company anticipates that the remaining restructuring accrual balance at March 31, 2010, relating to lease obligations, will be paid out through the first quarter of fiscal 2011, which was reflected in “Accrued and other liabilities” in the Consolidated Balance Sheets.
Previous Restructuring Plans
The Company’s management implemented several restructuring plans prior to fiscal 2008 to reduce expenses, streamline operations, improve operating efficiencies and simplify its infrastructure, which included employee reductions and consolidation of facilities. Other Indemnification Obligations
Previous Acquisition-Related Restructuring
In fiscal 2006, in connection with one of its previous acquisitions, the Company finalized its plan to integrate the acquired company’s operations to eliminate certain duplicative resources, including severance and related benefits in connection with the involuntary termination of employees, exiting duplicative facilities and disposing of duplicative assets. This plan was initially included in the purchase price allocation of the acquired company. The severance and related benefits was paid by fiscal 2007. The remaining liability related to long-term lease obligations, in which the lease term ends in October 2011. Any further changes to the Company’s finalized plan will be recorded in “Restructuring charges” in the Consolidated Statements of Operations. In fiscal 2009, the Company recorded adjustments of $0.2 million, due to additional estimated loss on these facilities that the Company subleased.
The following table sets forth the activity in the accrued restructuring balance related to its previous acquisition-related restructuring plan for fiscal 2010, 2009 and 2008:
| Other Charges | ||||
| (in thousands) | ||||
Accrual balance at March 31, 2007 | $ | 2,121 | ||
Cash paid | (385 | ) | ||
Accrual balance at March 31, 2008 | 1,736 | |||
Accrual adjustments | 214 | |||
Cash paid | (719 | ) | ||
Accrual balance at March 31, 2009 | 1,231 | |||
Accrual adjustments | (17 | ) | ||
Cash paid | (630 | ) | ||
Accrual balance at March 31, 2010 | $ | 584 | ||
The Company anticipates that the remaining restructuring balance of $0.6 million at March 31, 2010, related to long- term lease obligations, will be paid out through the third quarter of fiscal 2012. Of the remaining restructuring accrual balance of $0.6 million, $0.4 million was reflected in “Accrued and other liabilities” and $0.2 million was reflected in “Other long-term liabilities” in the Consolidated Balance Sheets.
ADAPTEC, INC.
NOTES TO CONSOLIDATED FINANCIAL STATEMENTS (Continued)
(Unaudited)
Note 12. Other Gains, Net
In fiscal 2007, the Company decided to consolidate its properties in Milpitas, California to better align its business needs with existing operations and to provide more efficient use of its facilities. In May 2007, the Company completed the sale of certain of these properties that were previously classified as held for sale, with proceeds aggregating $19.9 million, exceeding its carrying value of $12.5 million. Net of selling costs, the Company recorded a gain of $6.7 million on the sale of the properties in fiscal 2008 within “Other gains, net”DPS Business. These indemnification obligations generally required the Company to compensate the other party for certain damages and costs incurred as a result of third party claims. In these circumstances, payment by the Company was conditional on the other party making a claim pursuant to the procedures specified in the Consolidated Statements of Operations.
In fiscal 2008,particular agreements, which procedures typically allowed the Company also recordedto challenge the other party’s claims. Further, the Company’s obligations under these agreements was limited in terms of time and/or amount, and in some instances, the Company may have had recourse against third parties for certain payments made by it under these agreements. No liability resulted from the agreements with PMC-Sierra.
13.14. Interest and Other Income, Net
| Years Ended March 31, | ||||||||||
| 2010 | 2009 | 2008 | ||||||||
| (in thousands) | ||||||||||
Interest income | $ | 8,496 | $ | 16,932 | $ | 28,662 | ||||
Gain on sale of marketable equity securities | — | 2,255 | — | |||||||
Gain on sale of investments | 440 | — | — | |||||||
Gain on settlement of class action suit | 944 | — | — | |||||||
Gain on extinguishment of debt, net | — | 1,643 | — | |||||||
Realized currency transaction gains (losses) | 399 | (789 | ) | 2,550 | ||||||
Other | 182 | 967 | 123 | |||||||
Interest and other income, net | $ | 10,461 | $ | 21,008 | $ | 31,335 | ||||
In fiscal 2010, the Company received $0.9 million from Micron Technology, Inc. as part of a class action settlement regarding DRAM antitrust matters and recorded a gain of $0.4 million from the sale of an investment in a non-controlling interest of a non-public company.
In fiscal 2009, the Company recorded a gain, net of selling costs, of $2.3 million on the sale of marketable equity securities of a publicly traded company.
In fiscal 2009, the Company repurchased a total of $191.0 million in principal amount of its 3/4% Notes on the open market for an aggregate price of $188.9 million, resulting in a gain on extinguishment of debt of $1.7 million (net of unamortized debt issuance costs of $0.4 million). In addition, the majority of the remaining holders of the 3/4% Notes exercised their put option in December 2008, which required the Company to purchase its 3/4% Notes at a price equal to 100.25% of the principal of the 3/4% Notes, resulting in the redemption of the 3/4% Notes for an aggregate cost of $34.0 million, plus accrued and unpaid interest. See
Fiscal Year Ended | Fiscal Year Ended | Nine-Month Transition | ||||||||||
| (in thousands) | ||||||||||||
| Interest income | $ | 2,184 | $ | 4,088 | $ | 5,101 | ||||||
| Realized currency translation gains | 79 | 3,934 | 18 | |||||||||
| Loss on disposal of long-lived assets | (679 | ) | - | - | ||||||||
| Other | (517 | ) | 336 | 89 | ||||||||
| $ | 1,067 | $ | 8,358 | $ | 5,208 | |||||||
F-39
ADAPTEC, INC.
NOTES TO CONSOLIDATED FINANCIAL STATEMENTS (Continued)
(Unaudited)
Note 14.15. Income Taxes
| Years Ended March 31, | ||||||||||||
| 2010 | 2009 | 2008 | ||||||||||
| (in thousands) | ||||||||||||
Loss from continuing operations before income taxes: | ||||||||||||
Domestic | $ | (24,462 | ) | $ | (14,394 | ) | $ | 953 | ||||
Foreign | 3,317 | (2,187 | ) | (6,300 | ) | |||||||
Total loss from continuing operations before income taxes | $ | (21,145 | ) | $ | (16,581 | ) | $ | (5,347 | ) | |||
Fiscal Year Ended December 31, | Nine-Month Transition | |||||||||||
| 2012 | 2011 | 2010 | ||||||||||
| (in thousands) | ||||||||||||
| Income (loss) from continuing operations before income taxes: | ||||||||||||
| Domestic | $ | 6,326 | $ | (2,717 | ) | $ | (12,220 | ) | ||||
| Foreign | 141 | 2,559 | 2,436 | |||||||||
| $ | 6,467 | $ | (158 | ) | $ | (9,784 | ) | |||||
| Years Ended March 31, | |||||||||||
| 2010 | 2009 | 2008 | |||||||||
| (in thousands) | |||||||||||
Federal: | |||||||||||
Current | $ | 1,341 | $ | 344 | $ | 837 | |||||
Deferred | — | — | — | ||||||||
| 1,341 | 344 | 837 | |||||||||
Foreign: | |||||||||||
Current | 162 | 744 | (190 | ) | |||||||
Deferred | 1,018 | 6 | (1,001 | ) | |||||||
| 1,180 | 750 | (1,191 | ) | ||||||||
State: | |||||||||||
Current | (46 | ) | 1,511 | 329 | |||||||
Deferred | — | — | — | ||||||||
| (46 | ) | 1,511 | 329 | ||||||||
Benefit from (provision for) income taxes | $ | 2,475 | $ | 2,605 | $ | (25 | ) | ||||
Fiscal Year Ended December 31, | Nine-Month Transition | |||||||||||
| 2012 | 2011 | 2010 | ||||||||||
| (in thousands) | ||||||||||||
| Federal: | ||||||||||||
| Current | $ | 34 | $ | (2,666 | ) | $ | 76 | |||||
| Deferred | 15,066 | - | - | |||||||||
| 15,100 | (2,666 | ) | 76 | |||||||||
| Foreign: | ||||||||||||
| Current | 1,373 | 1,979 | (7,961 | ) | ||||||||
| Deferred | - | 921 | 276 | |||||||||
| 1,373 | 2,900 | (7,685 | ) | |||||||||
| State | ||||||||||||
| Current | (979 | ) | (8 | ) | 7 | |||||||
| Deferred | 218 | - | - | |||||||||
| (761 | ) | (8 | ) | 7 | ||||||||
| Benefit from (provision for) income taxes | $ | 15,712 | $ | 226 | $ | (7,602 | ) | |||||
| Years Ended March 31, | |||||||||
| 2010 | 2009 | 2008 | |||||||
Federal statutory rate | 35.0 | % | 35.0 | % | 35.0 | % | |||
State taxes, net of federal benefit | (0.2 | )% | (0.6 | )% | (1.9 | )% | |||
Foreign losses not benefited | (0.3 | )% | (18.7 | )% | (110.0 | )% | |||
Changes in tax reserves | 2.1 | % | 20.2 | % | 33.6 | % | |||
OID Interest | — | % | 15.0 | % | 60.2 | % | |||
Change in valuation allowance | (25.2 | )% | (2.5 | )% | 81.2 | % | |||
Distributions from foreign subsidiaries | — | % | — | % | (72.3 | )% | |||
Goodwill impairment charges | — | % | (35.8 | )% | — | % | |||
Other permanent differences | 0.3 | % | 3.1 | % | (26.3 | )% | |||
Effective income tax rate | 11.7 | % | 15.7 | % | (0.5 | )% | |||
Fiscal Year Ended December 31, | Nine-Month Transition | |||||||||||
| 2012 | 2011 | 2010 | ||||||||||
| Federal statutory rate | 35.0 | % | 35.0 | % | 35.0 | % | ||||||
| State taxes, net of federal benefit | 15.1 | % | -1.9 | % | 0.0 | % | ||||||
| Foreign losses not benefited | -0.6 | % | -19.6 | % | 1.2 | % | ||||||
| Changes in tax reserves | 0.0 | % | 640.3 | % | -78.2 | % | ||||||
| Change in valuation allowance | -297.8 | % | 5852.1 | % | -33.6 | % | ||||||
| Distributions from foreign subsidiaries | -4.9 | % | -6599.8 | % | -3.8 | % | ||||||
| Other permanent differences | 24.6 | % | 143.2 | % | 1.7 | % | ||||||
| -228.6 | % | 49.3 | % | -77.7 | % | |||||||
NOTES TO CONSOLIDATED FINANCIAL STATEMENTS (Continued)
(Unaudited)
Note 14. Income Taxes (Continued)
In fiscal 2010, the Company’s tax benefit included discrete tax benefits of $1.3 million related to additional tax refunds that became available to the Company during fiscal 2010 due to the enactment of the Worker, Homeownership and Business Act of 2009, which allowed for an extension of the net operating loss carryback period from two to five years for United States federal tax purposes. The Company also recorded discrete tax benefitsa benefit from income taxes of $4.4$15.7 million in fiscal 2010 primarily due to reaching final settlement withfor the German Tax Authorities for fiscal years 2001 through 2004 and the Singapore Tax Authorities for fiscal year 2001, reflecting the reversal of previously accrued liabilities and refunded tax amounts. This was partially offset by discrete tax expense of $3.6 million in fiscal 2010ended December 31, 2012, primarily due to the on-going auditsrelease of a portion of the valuation allowance and a refund received as a result of a tax settlement in Singapore. The valuation allowance release was related to deferred tax liabilities recognized for the difference between the fair value and carrying basis of certain tangible and intangible assets obtained as part of the business combination, which can be used as a source of income to support realization of certain domestic deferred tax assets. Under generally accepted accounting principles, changes in an acquirer's valuation allowance that stem from a business combination should be recognized as an element of the acquirer's deferred income tax expense (benefit) in the reporting period that includes the business combination. For income tax purposes, amounts assigned to particular assets acquired and liabilities assumed may be different than amounts used for financial reporting. The differences in assigned values for financial reporting and tax purposes result in temporary differences. In applying ASC 740, companies are required to recognize the tax effects of temporary differences related to all assets and liabilities. The Company paid $3.5 million in taxes in Singapore during fiscal 2012 for prior year assessments on a liability that was part of its foreign jurisdictions.
In fiscal 2009,FIN 48 reserve. The Singapore IRAS subsequently refunded $1.4 million of that assessment based on information the Company provided.
The Company has concluded its negotiations with the IRS taxing authorities with regard to its tax disputes for its fiscal years 1994 through 2006. In fiscal 2009, the IRS issued a No Change Report indicating no change to the Company’s tax liability; however, the IRS continues to have the ability to adjust tax attributes relating to these years in subsequent audits. The Company believes that it has provided sufficient tax provisions for these years and that the ultimate outcome of any future IRS audits that include the tax attributes will not have a material adverse impact on its financial position or results of operations in future periods. The tax authorities in the foreign jurisdictions that the Company operates in continue to audit its tax returns for fiscal years subsequent to 1999. The potential outcome of these audits is uncertain and could result in material tax provisions or benefits in future periods. However, the Company cannot predict with certainty how these matters will be resolved and whether the Company will be required to make additional tax payments and believes that it has provided sufficient tax provisions for the tax exposures in its foreign jurisdictions.
F-41
ADAPTEC, INC.
NOTES TO CONSOLIDATED FINANCIAL STATEMENTS (Continued)
(Unaudited)
Note 14. Income Taxes (Continued)
| March 31, | ||||||||
| 2010 | 2009 | |||||||
| (in thousands) | ||||||||
Deferred tax assets: | ||||||||
Intangible assets | $ | 26,790 | $ | 29,141 | ||||
Net operating loss carryover | 53,424 | 60,816 | ||||||
Research and development tax credits | 29,440 | 28,003 | ||||||
Capitalized research and development | 6,291 | 7,786 | ||||||
Compensatory and other accruals | 9,847 | 8,603 | ||||||
Restructuring charges | 265 | 1,145 | ||||||
Foreign tax credits | 9,826 | 17,968 | ||||||
Deferred revenue | 1,051 | 552 | ||||||
Inventory reserves | 2,188 | 3,309 | ||||||
Uniform capitalization adjustment | 561 | 787 | ||||||
Fixed assets accrual | 1,456 | 1,463 | ||||||
Other, net | 1,454 | 1,544 | ||||||
Gross deferred tax assets | 142,593 | 161,117 | ||||||
Deferred tax liabilities: | ||||||||
Acquisition-related charges | (329 | ) | (337 | ) | ||||
Unremitted earnings | (59,144 | ) | (78,908 | ) | ||||
Fixed assets accrual | — | (2,327 | ) | |||||
Unrealized loss on investments | (1,000 | ) | (957 | ) | ||||
Gross deferred tax liabilities | (60,473 | ) | (82,529 | ) | ||||
Valuation allowance | (81,218 | ) | (75,948 | ) | ||||
Net deferred tax assets | $ | 902 | $ | 2,640 | ||||
| December 31, | ||||||||
| 2012 | 2011 | |||||||
| (in thousands) | ||||||||
| Deferred tax assets: | ||||||||
| NOL carryover | $ | 40,771 | $ | 58,870 | ||||
| Research and development credits | 29,659 | 29,659 | ||||||
| Compensatory and other accruals | 1,200 | 688 | ||||||
| Foreign tax credits | 7,528 | 10,035 | ||||||
| Fixed assets | - | 155 | ||||||
| Other, net | 2,901 | 2,693 | ||||||
| Gross deferred tax assets | 82,059 | 102,100 | ||||||
| Deferred tax liabilities: | ||||||||
| Unremitted earnings | (29,425 | ) | (30,667 | ) | ||||
| Unrealized loss on investments | (321 | ) | (229 | ) | ||||
| Intangible assets | (8,886 | ) | - | |||||
| Fixed assets | (4,403 | ) | - | |||||
| Other, net | - | (30 | ) | |||||
| Gross deferred tax liabilities | (43,035 | ) | (30,926 | ) | ||||
| Valuation allowance | (37,173 | ) | (69,508 | ) | ||||
| Deferred tax assets, net | $ | 1,851 | $ | 1,666 | ||||
| March 31, | ||||||||
| 2010 | 2009 | |||||||
| (in thousands) | ||||||||
Deferred tax assets: | ||||||||
Other current assets | $ | 5,089 | $ | 6,597 | ||||
Other long-term assets | 626 | 3,608 | ||||||
Total deferred tax assets | 5,715 | 10,205 | ||||||
Deferred tax liabilities: | ||||||||
Other long-term liabilities | (4,813 | ) | (7,565 | ) | ||||
Total deferred tax liabilities | (4,813 | ) | (7,565 | ) | ||||
Net deferred tax assets | $ | 902 | $ | 2,640 | ||||
F-42
ADAPTEC, INC.
NOTES TO CONSOLIDATED FINANCIAL STATEMENTS (Continued)
(Unaudited)
Note 14. Income Taxes (Continued)
| December 31, | ||||||||
| 2012 | 2011 | |||||||
| (in thousands) | ||||||||
| Deferred tax assets: | ||||||||
| Other current assets | $ | 188 | $ | - | ||||
| Other long-term assets | 1,696 | 1,711 | ||||||
| Total deferred tax assets | 1,884 | 1,711 | ||||||
| Deferred tax liabilities: | ||||||||
| Other current liabilities | - | (15 | ) | |||||
| Other long-term liabilities | (33 | ) | (30 | ) | ||||
| Total deferred tax liabilities | (33 | ) | (45 | ) | ||||
| $ | 1,851 | $ | 1,666 | |||||
As
The Company adopted the accounting guidance regarding uncertain tax positions at the beginning of fiscal 2008, resulting in a cumulative effect adjustment of $1.3 million as a reduction to the beginning balance of “Retained earnings” reflected on its Consolidated Statements of Stockholders’ Equity.
| Years Ended March 31, | ||||||||||||
| 2010 | 2009 | 2008 | ||||||||||
| (in thousands) | ||||||||||||
Balance at beginning of period | $ | 27,779 | $ | 21,510 | $ | 20,325 | ||||||
Tax positions related to current year: | ||||||||||||
Additions | 430 | 1,534 | 1,209 | |||||||||
Tax positions related to prior years: | ||||||||||||
Additions | 423 | 6,854 | 2,019 | |||||||||
Reductions | (271 | ) | — | (904 | ) | |||||||
Settlements | (4,436 | ) | (1,319 | ) | (1,139 | ) | ||||||
Lapses in statutes of limitations | — | (800 | ) | — | ||||||||
Balance at end of period | $ | 23,925 | $ | 27,779 | $ | 21,510 | ||||||
F-43
ADAPTEC, INC.
NOTES TO CONSOLIDATED FINANCIAL STATEMENTS (Continued)
(Unaudited)
Note 14. Income Taxes (Continued)
As of March 31, 2010, the Company’s total gross unrecognized tax benefits were $23.9 million, of which $4.4 million, if recognized, would affect the effective tax rate. There was an overall decrease of $3.9 million in the Company’s gross unrecognized tax benefits from fiscal 2009 to fiscal 2010 due to benefits from the Singapore and Germany audit settlements noted above, offset by changes in judgment related to foreign audits during fiscal 2010.
The Company is subject to U.S. federal income tax as well as income taxes in many U.S. states and foreign jurisdictions. As of March 31, 2010, fiscal years 2004 onward remained open to examination by the U.S. taxing authorities and fiscal years 1999 onward remained open to examination in various foreign jurisdictions. U.S. tax attributes generated in fiscal years 2004 onward also remain subject to adjustment in subsequent audits when they are utilized.
Fiscal Year Ended December 31, | Nine-Month Transition | |||||||||||
| 2012 | 2011 | 2010 | ||||||||||
| (in thousands) | ||||||||||||
| Balance at beginning of period | $ | 29,903 | $ | 31,818 | $ | 23,925 | ||||||
| Tax positions related to current year: | ||||||||||||
| Additions | - | - | 84 | |||||||||
| Tax positions related to prior years: | ||||||||||||
| Additions | - | 951 | 7,809 | |||||||||
| Settlements | (3,484 | ) | (2,866 | ) | - | |||||||
| Balance at end of period | $ | 26,419 | $ | 29,903 | $ | 31,818 | ||||||
months; however, tax audits remain open and the outcome of any tax audits are inherently uncertain, which could change this judgment in any given quarter.
As disclosed in Note 1, all share information has been adjusted to reflect the Reverse/Forward Split.
| Years Ended March 31, | ||||||||||||
| 2010 | 2009 | 2008 | ||||||||||
| (in thousands, except per share amounts) | ||||||||||||
Numerator: | ||||||||||||
Loss from continuing operations, net of taxes—basic and diluted | $ | (18,670 | ) | $ | (13,976 | ) | $ | (5,372 | ) | |||
Income (loss) from discontinued operations, net of taxes—basic and diluted | 1,236 | 3,786 | (4,243 | ) | ||||||||
Net loss—basic and diluted | $ | (17,434 | ) | $ | (10,190 | ) | $ | (9,615 | ) | |||
Denominator: | ||||||||||||
Weighted average shares outstanding—basic | 119,196 | 119,767 | 118,613 | |||||||||
Effect of dilutive securities: | ||||||||||||
Employee stock awards and other | — | — | — | |||||||||
3/4% Notes | — | — | — | |||||||||
Weighted average shares and potentially dilutive common shares outstanding—diluted | 119,196 | 119,767 | 118,613 | |||||||||
Basic and diluted income (loss) per share: | ||||||||||||
Loss from continuing operations, net of taxes | $ | (0.16 | ) | $ | (0.12 | ) | $ | (0.05 | ) | |||
Income (loss) from discontinued operations, net of taxes | $ | 0.01 | $ | 0.03 | $ | (0.04 | ) | |||||
Net loss | $ | (0.15 | ) | $ | (0.09 | ) | $ | (0.08 | ) | |||
ADAPTEC, INC.
NOTES TO CONSOLIDATED FINANCIAL STATEMENTS (Continued)
(Unaudited)
Note 15. Net Loss Per Share (Continued)
Fiscal Year Ended December 31, | Nine-Month Transition | |||||||||||
| 2012 | 2011 | 2010 | ||||||||||
| (in thousands, except per share amounts) | ||||||||||||
| Numerators (basic and diluted): | ||||||||||||
| Income (loss) from continuing operations, net of taxes | $ | 22,179 | $ | 68 | $ | (17,386 | ) | |||||
| Income (loss) from discontinued opertions, net of taxes | $ | (1,935 | ) | $ | 6,629 | $ | (373 | ) | ||||
| Net income (loss) attributable to Steel Excel Inc. | $ | 20,693 | $ | 6,769 | $ | (17,759 | ) | |||||
| Denominators: | ||||||||||||
| Weighted average shares outstanding - basic | 12,110 | 10,882 | 11,609 | |||||||||
| Effect of common stock equivalents (if any): | ||||||||||||
| Stock-based awards | 23 | 15 | - | |||||||||
| 3/4% notes | - | - | - | |||||||||
| Weighted average shares outstanding - diluted | 12,133 | 10,897 | 11,609 | |||||||||
| Income (loss) per share: | ||||||||||||
| Basic | ||||||||||||
| Income (loss) from continuing operations, net of taxes | $ | 1.83 | $ | 0.01 | $ | (1.50 | ) | |||||
| Income (loss) from discontinued opertions, net of taxes | $ | (0.16 | ) | $ | 0.61 | $ | (0.03 | ) | ||||
| Net income (loss) | $ | 1.71 | $ | 0.62 | $ | (1.53 | ) | |||||
| Diluted | ||||||||||||
| Income (loss) from continuing operations, net of taxes | $ | 1.83 | $ | 0.01 | $ | (1.50 | ) | |||||
| Income (loss) from discontinued opertions, net of taxes | $ | (0.16 | ) | $ | 0.61 | $ | (0.03 | ) | ||||
| Net income (loss) | $ | 1.71 | $ | 0.62 | $ | (1.53 | ) | |||||
Fiscal Year Ended December 31, | Nine-Month Transition | |||||||||||
| 2012 | 2011 | 2010 | ||||||||||
| (in thousands) | ||||||||||||
| Outstanding stock options | - | - | 297 | |||||||||
| Outstanding restricted stock | - | 20 | 43 | |||||||||
| 3/4% convertible senior subordinated notes due 2023 | 3 | 3 | 3 | |||||||||
| Years Ended March 31, | ||||||
| 2010 | 2009 | 2008 | ||||
| (in thousands) | ||||||
Outstanding stock options | 5,557 | 6,881 | 11,262 | |||
Outstanding restricted stock | 2,296 | 1,951 | 1,730 | |||
Warrants(1) | 169 | 9,780 | 19,724 | |||
3/4% Notes | 34 | 9,293 | 19,224 | |||
Steel Sports | Steel Energy | General Corporate | Consolidated | |||||||||||||
| (in thousands) | ||||||||||||||||
| Net revenues | $ | 2,913 | $ | 97,191 | $ | - | $ | 100,104 | ||||||||
| Operating income (loss) | $ | (2,062 | ) | $ | 16,836 | $ | (8,957 | ) | $ | 5,817 | ||||||
| Depreciation and amortization expense | $ | 518 | $ | 14,940 | $ | - | $ | 15,458 | ||||||||
| Interest and other income (expense), net | $ | - | $ | (413 | ) | $ | 1,063 | $ | 650 | |||||||
| Total assets | $ | 7,613 | $ | 199,889 | $ | 258,993 | $ | 466,495 | ||||||||
| Accounts receivable | $ | 158 | $ | 17,099 | $ | - | $ | 17,257 | ||||||||
| Goodwill | $ | 154 | $ | 52,939 | $ | - | $ | 53,093 | ||||||||
| Property and equipment, net | $ | 6,005 | $ | 71,763 | $ | - | $ | 77,768 | ||||||||
Steel Sports | Steel Energy | General Corporate | Consolidated | ||||
| (in thousands) | |||||||
| Net revenues | $ 1,176 | $ 1,417 | $ - | $ 2,593 | |||
| Operating income (loss) | $ (354) | $ 165 | $ (8,322) | $ (8,511) | |||
| Depreciation and amortization expense | $ 206 | $ 144 | $ - | $ 350 | |||
| Interest and other income (expense), net | $ - | $ - | $ 8,353 | $ 8,353 | |||
| Total assets | $ 8,697 | $ 32,228 | $ 327,766 | $ 368,691 | |||
| Accounts receivable | $ 156 | $ 4,504 | $ - | $ 4,660 | |||
| Goodwill | $ 192 | $ 8,052 | $ - | $ 8,244 | |||
| Property and equipment, net | $ 5,866 | $ 15,194 | $ - | $ 21,060 | |||
In August 2004, the Company entered intoacquired all of the capital stock of SWH for an agreement to sell external storage products to IBM. In connection withacquisition price aggregating $68.7 million. The aggregate acquisition price consisted of the agreement, the Company issued IBM a warrant to purchase 250,000issuance of 2,027,500 shares of the Company’s common stock (valued at an exercise price$30 per share) and cash of $6.94 per share. The warrant has a term of five years from the date of issuance and was immediately exercisable; however, the warrant expired unexercised in August 2009. The warrant was valued at $1.0 million using the Black-Scholes valuation model using a volatility rate of 62%, a risk-free interest rate of 4.0% and an estimated life of five years. The value of the warrant was fully expensed, as the economic benefits were not considered probable, at March 31, 2005.
In connection with the IBM i/p Series RAID acquisition in June 2004, the Company issued a warrant to IBM to purchase 250,000 shares$7.9 million. Steel Partners owned approximately 40% of the Company’s outstanding common stock at an exercise priceand 85% of $8.13 per share. The warrant had a termBNS prior to the execution of five years from the date of issuance and was immediately exercisable; however, the warrant expired unexercised in June 2009. The warrant was valued at $1.1 million, net of registration costs, using the Black-Scholes valuation model using a volatility rate of 62%, a risk-free interest rate of 3.9% and an estimated life of five years.
Note 17. Guarantees
Intellectual Property and Other Indemnification Obligations
Share Purchase Agreement. The Company has entered into agreementsappointed a special committee (the “Special Committee”) comprised solely of independent directors to consider and negotiate the transaction, as did BNS, because of the interest of Steel Partners in each company. The Special Committee, with customers and suppliers that include intellectual property indemnification obligations. These indemnification obligations generally require the Company to compensateassistance of its independent financial advisor, considered a number of factors in negotiating the other party for certain damages and costs incurred asacquisition price, including, without limitation, the fairness opinion from its financial advisor.
F-45
ADAPTEC, INC.
NOTES TO CONSOLIDATED FINANCIAL STATEMENTS (Continued)
(Unaudited)
Note 17. Guarantees (Continued)
agreements may be limited in terms of time and/or amount, and in some instances, the Company may have recourse against third parties for certain payments made by it under these agreements. In addition, the Company has agreements whereby it indemnifies its directors and certain of its officers for certain events or occurrences while the officer or director is, or was, serving at the Company’s request in such capacity. These indemnification agreements are not subject to a maximum loss clause; however, the Company maintains a director and officer insurance policy which may cover all or a portion of the liabilities arising from its obligation to indemnify its directors and officers. It is not possible to make a reasonable estimate of the maximum potential amount of future payments under these or similar agreements due to the conditional natureopen market, Steel Partners beneficially owned approximately 51.1% of the Company’s obligations and the unique facts and circumstances involved in each particular agreement. Historically, the Company has not incurred significant costs to defend lawsuits or settle claims related to such agreements and no amount has been accrued in the accompanying Consolidated Financial Statements with respect to these indemnification guarantees.
Product Warranty
The Company provides an accrual for estimated future warranty costs based upon the historical relationship of warranty costs to sales. The estimated future warranty obligations related to product sales are recorded in the period in which the related revenue is recognized. The estimated future warranty obligations are affected by sales volumes, product failure rates, material usage and replacement costs incurred in correcting a product failure. If actual product failure rates, material usage or replacement costs differ from the Company’s estimates, revisions to the estimated warranty obligations would be required; however, the Company made no adjustments to pre-existing warranty accruals in fiscal years 2010, 2009 and 2008.
A reconciliation of the changes to the Company’s warranty accrual for fiscal years 2010, 2009 and 2008 was as follows:
| Years ended March 31, | ||||||||||||
| 2010 | 2009 | 2008 | ||||||||||
| (in thousands) | ||||||||||||
Balance at beginning of period | $ | 400 | $ | 741 | $ | 950 | ||||||
Warranties provided | 624 | 930 | 2,389 | |||||||||
Actual costs incurred | (714 | ) | (1,117 | ) | (2,598 | ) | ||||||
Warranty obligations transferred with discontinued operations | — | (154 | ) | — | ||||||||
Balance at end of period | $ | 310 | $ | 400 | $ | 741 | ||||||
Note 18. Related Party Transactions with Steel Partners LLC and Steel Partners II, L.P.
Warren G. Lichtenstein, Steel Partners, LLC and Steel Partners II, L.P. (collectively, “Steel Partners”) became a 5% stockholder of the Company in March 2007.outstanding common stock. Jack L. Howard, John J. Quicke, and John Mutch were nominated for election atWarren G. Lichtenstein are directors of the 2007 Annual Meeting of Stockholders. AtCompany and each such time, both Mr. Howard and Mr. Quicke wereperson is deemed to be affiliatesan affiliate of Steel Partners under the rules of the Securities Exchange Act of 1934, as amended; however, Mr. Mutch was not deemed to be an affiliateamended. Each of Steel Partners at such time. Messrs. Howard, Quickethe three directors is compensated with cash compensation and Mutch continue to serve onequity awards or equity-based awards in amounts that are consistent with the Company’s Board of Directors andNon-employee Director Compensation Policy. In addition, Mr. Quicke currently serves as the Interim President and CEO of the Company. Each of the three directors, including the two directors who are deemed affiliates of Steel Partners, areHe was previously compensated with equity awards or equity-based awards in amounts that are consistent with the Company’s Non-Employee Director Compensation Policy. In addition, in fiscal 2010,$30,000 by the Company agreed to pay Mr. Quicke $30,000 per month effective, January 4, 2010, in connection with histhis role as Interim President and CEO,(which was in addition to the compensation he receives as a non-executive board
ADAPTEC, INC.
NOTES TO CONSOLIDATED FINANCIAL STATEMENTS (Continued)
(Unaudited)
Note 18. Related Party Transactionsnon-employee Board member) prior to the entry into the Amended and Restated Management Services Agreement described below. Mr. Quicke also serves as an executive of other affiliates of Steel Partners.
member. Asadministrative services, including the services of March 31, 2010, Steel Partners beneficially owned approximately 19.5%a CFO. Under the terms of the services agreement, SP Corporate was receiving $35,000 monthly for the provision of such services. Effective August 1, 2012, the agreement was amended and restated whereby SP Corporate provides expanded services including the positions of CEO and CFO, responsibility for financing, regulatory reporting, and other administrative and operational functions. SP Corporate receives $300,000 per month for these expanded services. This services agreement was approved by a committee of the Company’s common stock. In fiscal 2010,independent directors. During the years ended December 31, 2012 and 2011, the Company reimbursed $0.7incurred $2.1 million related to professional fees thatand $0.3 million, respectively, under the terms of the services agreements with SP Corporate. In addition, the Company reimburses SP Corporate and other Steel Partners II, L.P.,affiliates, for certain expenses incurred on the Company’s behalf. During the years ended December 31, 2012 and 2011, the Company incurred $0.6 million and $0.1 million of expense reimbursements, respectively. As of December 31, 2012 and 2011, the Company owed SP Corporate $0.3 million and $0.1 million, respectively.
Note 19. Segment, Geographic and Significant Customer Information
Segment Information
Since the sale of its Snap Server NAS business in June 2008, the Company has operated in one segment. The Company currently provides data protection storage products and currently sells a broad rangeportion of the Company’s storage technologies, including ASICs, board-level I/Ocommission paid to Mutual Securities ultimately received by such Investment committee member is net of clearing and RAID controllers, and software. The Company sells these products directly to OEMs, ODMs that supply OEMs, system integrators, VARs and end users through its network of distribution and reseller channels. The Company considers all of its products to be similar in nature and function. The Company does not derive a significant amount of revenue from services or support.
Net revenues by countries based on the location of the selling entities for fiscal years 2010, 2009 and 2008, was as follows:
| Years Ended March 31, | |||||||||
| 2010 | 2009 | 2008 | |||||||
| (in thousands) | |||||||||
United States | $ | 73,682 | $ | 96,658 | $ | 50,852 | |||
Ireland | — | 18,116 | 94,649 | ||||||
Net revenues | $ | 73,682 | $ | 114,774 | $ | 145,501 | |||
Net property and equipment by countries based on the location of the assets at March 31, 2010 and 2009 was as follows:
| March 31, | ||||||
| 2010 | 2009 | |||||
| (in thousands) | ||||||
United States | $ | 11,097 | $ | 11,517 | ||
European Countries | 210 | 65 | ||||
Pacific Rim Countries | 46 | 82 | ||||
Property and equipment, net | $ | 11,353 | $ | 11,664 | ||
Significantly all other long-lived assets at March 31, 2010 and 2009 reside in the United States.
Interest paid Income taxes paid Income tax refund received Non-cash investing and financial activities: Unrealized gains (losses) on available-for-sale securities20.19. Supplemental DisclosureDisclosures of Cash Flows Years Ended March 31, 2010 2009 2008 (in thousands) $ 4 $ 2,011 $ 3,556 2,493 720 3,879 7,617 1,082 16,214 110 (600 ) 1,861 F-47
Fiscal Year Ended December 31, | Nine-Month Transition | |||||||||||
| 2012 | 2011 | 2010 | ||||||||||
| (in thousands) | ||||||||||||
| Interest paid | $ | 434 | $ | 3 | $ | 4 | ||||||
| Income taxes paid | $ | 364 | $ | 2 | $ | 759 | ||||||
| Income tax refund received | $ | 1,494 | $ | 544 | $ | 1,649 | ||||||
| Non-cash investing and financing activities: | ||||||||||||
| Acquisition of SWH, Inc. through issuance of common stock | $ | 60,825 | $ | - | $ | - | ||||||
| Unrealized gains (losses) on available-for-sale securities | $ | 303 | $ | 260 | $ | (1,566 | ) | |||||
ADAPTEC, INC.
NOTES TO CONSOLIDATED FINANCIAL STATEMENTS (Continued)
(Unaudited)
| Quarters | ||||||||||||||||||||
| First | Second | Third | Fourth | Year | ||||||||||||||||
| (in thousands, except per share amounts) | ||||||||||||||||||||
Fiscal 2010: | ||||||||||||||||||||
Net revenues | $ | 21,738 | $ | 18,442 | $ | 16,909 | $ | 16,593 | $ | 73,682 | ||||||||||
Gross profit | 10,103 | 8,163 | 7,468 | 7,660 | 33,394 | |||||||||||||||
Income (loss) from continuing operations, net of taxes | 154 | (4,091 | ) | (7,494 | ) | (7,239 | ) | (18,670 | ) | |||||||||||
Income from discontinued operations, net of taxes | 440 | 318 | 212 | 266 | 1,236 | |||||||||||||||
Net income (loss) | $ | 594 | $ | (3,773 | ) | $ | (7,282 | ) | $ | (6,973 | ) | $ | (17,434 | ) | ||||||
Income (loss) per share: | ||||||||||||||||||||
Basic | ||||||||||||||||||||
Continuing operations | $ | 0.00 | $ | (0.03 | ) | $ | (0.06 | ) | $ | (0.06 | ) | $ | (0.16 | ) | ||||||
Discontinued operations | $ | 0.00 | $ | 0.00 | $ | 0.00 | $ | 0.00 | $ | 0.01 | ||||||||||
Net income (loss) | $ | 0.00 | $ | (0.03 | ) | $ | (0.06 | ) | $ | (0.06 | ) | $ | (0.15 | ) | ||||||
Diluted | ||||||||||||||||||||
Continuing operations | $ | 0.00 | $ | (0.03 | ) | $ | (0.06 | ) | $ | (0.06 | ) | $ | (0.16 | ) | ||||||
Discontinued operations | $ | 0.00 | $ | 0.00 | $ | 0.00 | $ | 0.00 | $ | 0.01 | ||||||||||
Net income (loss) | $ | 0.00 | $ | (0.03 | ) | $ | (0.06 | ) | $ | (0.06 | ) | $ | (0.15 | ) | ||||||
Shares used in computing income | ||||||||||||||||||||
(loss) per share: | ||||||||||||||||||||
Basic | 119,284 | 118,961 | 119,137 | 119,403 | 119,196 | |||||||||||||||
Diluted | 119,869 | 118,961 | 119,137 | 119,403 | 119,196 | |||||||||||||||
Fiscal 2009: | ||||||||||||||||||||
Net revenues | $ | 31,503 | $ | 31,655 | $ | 28,205 | $ | 23,411 | $ | 114,774 | ||||||||||
Gross profit | 14,682 | 13,329 | 11,143 | 10,207 | 49,361 | |||||||||||||||
Income (loss) from continuing operations, net of taxes | (47 | ) | 3,312 | 90 | (17,331 | ) | (13,976 | ) | ||||||||||||
Income (loss) from discontinued operations, net of taxes | 5,060 | — | (1,396 | ) | 122 | 3,786 | ||||||||||||||
Net income (loss) | $ | 5,013 | $ | 3,312 | $ | (1,306 | ) | $ | (17,209 | ) | $ | (10,190 | ) | |||||||
Income (loss) per share: | ||||||||||||||||||||
Basic | ||||||||||||||||||||
Continuing operations | $ | (0.00 | ) | $ | 0.03 | $ | 0.00 | $ | (0.14 | ) | $ | (0.12 | ) | |||||||
Discontinued operations | $ | 0.04 | $ | — | $ | (0.01 | ) | $ | 0.00 | $ | 0.03 | |||||||||
Net income (loss) | $ | 0.04 | $ | 0.03 | $ | (0.01 | ) | $ | (0.14 | ) | $ | (0.09 | ) | |||||||
Diluted | ||||||||||||||||||||
Continuing operations | $ | (0.00 | ) | $ | 0.02 | $ | 0.00 | $ | (0.14 | ) | $ | (0.12 | ) | |||||||
Discontinued operations | $ | 0.04 | $ | — | $ | (0.01 | ) | $ | 0.00 | $ | 0.03 | |||||||||
Net income (loss) | $ | 0.04 | $ | 0.02 | $ | (0.01 | ) | $ | (0.14 | ) | $ | (0.09 | ) | |||||||
Shares used in computing income | ||||||||||||||||||||
(loss) per share: | ||||||||||||||||||||
Basic | 119,192 | 119,682 | 120,231 | 119,961 | 119,767 | |||||||||||||||
Diluted | 119,192 | 134,594 | 120,473 | 119,961 | 119,767 | |||||||||||||||
ADAPTEC, INC.
NOTES TO CONSOLIDATED FINANCIAL STATEMENTS (Continued)
(Unaudited)
Note 21. Comparative Quarterly Financial Data (unaudited) (Continued)
In the first, second, third and fourth quarters of fiscal 2010, the Company recorded restructuring charges (credits) of $0.1 million, $(0.1) million, $1.0 million and $0.6 million, respectively, primarily related to adjustmentsdata, which included reclassifications made to previous restructuring plansprior period reported amounts to conform to the current period presentation and a restructuring plan implemented during the fiscal year. In the first, second, third and fourth quarters of fiscal 2010, theto reflect discontinued operations:
| Three-Month Period Ended: | ||||||||||||||||
March 31, 2012 | June 30, 2012(1) | September 29, 2012 | December 31, 2012 | |||||||||||||
| (in thousands, except per share amounts) | ||||||||||||||||
| Net revenues | $ | 14,445 | $ | 24,450 | $ | 34,294 | $ | 26,915 | ||||||||
| Gross profit (loss) | $ | 5,686 | $ | 9,482 | $ | 12,204 | $ | 6,668 | ||||||||
Income (loss) from continuing operations, net of taxes | $ | (120 | ) | $ | 17,429 | $ | 4,866 | $ | 4 | |||||||
Income (loss) from discontinued operations, net of taxes | $ | (2,348 | ) | $ | (121 | ) | $ | 483 | $ | 51 | ||||||
| Net income (loss) attributable to Steel Excel Inc. | $ | (1,888 | ) | $ | 17,308 | $ | 5,349 | $ | (76 | ) | ||||||
| Income (loss) per share: | ||||||||||||||||
| Basic | ||||||||||||||||
Income (loss) from continuing operations, net of taxes | $ | (0.01 | ) | $ | 1.50 | $ | 0.37 | $ | 0.00 | |||||||
Income (loss) from discontinued operations, net of taxes | $ | (0.22 | ) | $ | (0.01 | ) | $ | 0.04 | $ | 0.00 | ||||||
| Net income (loss) attributable to Steel Excel Inc. | $ | (0.17 | ) | $ | 1.49 | $ | 0.41 | $ | (0.01 | ) | ||||||
| Diluted | ||||||||||||||||
Income (loss) from continuing operations, net of taxes | $ | (0.01 | ) | $ | 1.50 | $ | 0.37 | $ | 0.00 | |||||||
Income (loss) from discontinued operations, net of taxes | $ | (0.22 | ) | $ | (0.01 | ) | $ | 0.04 | $ | 0.00 | ||||||
| Net income (loss) attributable to Steel Excel Inc. | $ | (0.17 | ) | $ | 1.49 | $ | 0.41 | $ | (0.01 | ) | ||||||
Shares used for computing income (loss) per share: | ||||||||||||||||
| Basic | 10,891 | 11,588 | 12,982 | 12,984 | ||||||||||||
| Diluted | 10,891 | 11,605 | 13,001 | 13,007 | ||||||||||||
In the second and third quarters of fiscal 2009, the Company recorded a gain of $1.3 million and $0.4 million, respectively, on the repurchase of its 3/4% Notes on the open market. In the first, second, third and fourth quarters of fiscal 2009, the Company recorded restructuring charges of $1.8 million, $1.4 million, $0.9 million and $1.9 million, respectively, primarily related to restructuring plans implemented in the first and third quarters of fiscal 2009. Induring the second quarter of fiscal, 2009,2012, primarily due to the Company recordedrelease of a gain of $5.8 million on the saleportion of the Snap Server NAS business. In the third quartervaluation allowance as a result of fiscal 2009, the Company established a reserve of $1.2 million for the remaining receivable due from Overland, which was recorded within “Gain on disposal of discontinued operations, net of taxes” in the Consolidated Statements of Operations. In the fourth quarter of fiscal 2009, the Company recorded an impairment of $16.9 million to write-off goodwill and recorded a gain of $2.3 million on the sale of marketable equity securities.
acquired deferred tax liabilities.
| Three-Month Period Ended: | ||||||||||||||||
April 1, 2011 | July 1, 2011 | September 30, 2011 | December 31, 2011 | |||||||||||||
| (in thousands, except per share amounts) | ||||||||||||||||
| Net revenues | $ | - | $ | - | $ | 707 | $ | 1,795 | ||||||||
| Gross profit (loss) | $ | - | $ | - | $ | 531 | $ | 512 | ||||||||
Income (loss) from continuing operations, net of taxes | $ | 1,817 | $ | (1,550 | ) | $ | (1,543 | ) | $ | 1,344 | ||||||
Income (loss) from discontinued operations, net of taxes | $ | - | $ | 6,830 | $ | 85 | $ | (286 | ) | |||||||
| Net income (loss) attributable to Steel Excel | $ | 1,817 | $ | 5,280 | $ | 1,335 | $ | (1,663 | ) | |||||||
| Income (loss) per share: | ||||||||||||||||
| Basic | ||||||||||||||||
Income (loss) from continuing operations, net of taxes | $ | 0.17 | $ | (0.14 | ) | $ | (0.14 | ) | $ | 0.09 | ||||||
Income (loss) from discontinued operations, net of taxes | $ | - | $ | 0.63 | $ | 0.01 | $ | (0.03 | ) | |||||||
| Net income (loss) attributable to Steel Excel | $ | 0.17 | $ | 0.48 | $ | 0.12 | $ | (0.15 | ) | |||||||
| Diluted | ||||||||||||||||
Income (loss) from continuing operations, net of taxes | $ | 0.17 | $ | (0.14 | ) | $ | (0.14 | ) | $ | 0.09 | ||||||
Income (loss) from discontinued operations, net of taxes | $ | - | $ | 0.63 | $ | - | $ | (0.03 | ) | |||||||
| Net income (loss) | $ | 0.17 | $ | 0.48 | $ | 0.12 | $ | (0.15 | ) | |||||||
Shares used for computing income (loss) per share: | ||||||||||||||||
| Basic | 10,880 | 10,881 | 10,881 | 10,887 | ||||||||||||
| Diluted | 10,887 | 10,895 | 10,905 | 10,905 | ||||||||||||
The following is a list of accounting and business related acronyms, including accounting regulatory bodies, that are contained within this Annual Report on Form 10-K. They are listed in alphabetical order.
ARC: Adaptec RAID Code
ASC: Accounting Standards Codification
ASM: Adaptec Storage Manager
ASIC: Application Specific Integrated Circuit
CEO: Chief Executive Officer
CFO: Chief Financial Officer
CIFS:Common Internet File System
CLI:Command Line Interface
DAS:Direct Attached Storage
FASB: Financial Accounting Standards Board
FTP:File Transfer Protocol
HBA: Host Bus Adapter
F-49
ADAPTEC,STEEL EXCEL INC.
NOTES TO CONSOLIDATED FINANCIAL STATEMENTS (Continued)
(Unaudited)
Note 22. Glossary (unaudited) (Continued)
HTTP:Hypertext Transfer Protocol
I/O:Input/Output
IP: Internet Protocol
IPsec: Internet Protocol Security
IRS: Internal Revenue Service
iSCSI: Internet SCSI
IT: Information Technology
NAS: Network Attached Storage
NFS: Network File System
NOL: Net Operating Loss
ODM: Original Design Manufacturers
OEM: Original Equipment Manufacturer
PCI: Peripheral Component Interconnect
PCIe: Peripheral Component Interconnect Express
PCI-X: Peripheral Component Interconnect Extended
RAID: Redundant Array of Independent Disks
ROC: Raid on Chip
ROM BIOS:Read Only Memory Basic Input Output System
RSP:RAID Storage Processor
SAS: Serial Attached SCSI
SATA: Serial Advanced Technology Attachment
SEC: Securities and Exchange Commission
SCSI: Small Computer System Interface
SMBs: Small and Medium Businesses
SMI-S: Storage Management Initiative Specification
SSG: Storage Solutions Group
VAR: Value Added Reseller
FOR THE YEARS ENDED MARCH
| Balance at Beginning of Period | Additions | Deductions | Balance at End of Period | |||||||||
| (in thousands) | ||||||||||||
Year ended March 31, 2010 | ||||||||||||
Allowance for doubtful accounts(1) | $ | 46 | $ | — | $ | 12 | $ | 34 | ||||
Sales reserves(1) | 823 | 2,120 | 2,275 | 668 | ||||||||
Allowances(1) | 923 | 3,968 | 3,950 | 941 | ||||||||
Valuation allowance for deferred tax assets | 75,948 | 5,270 | — | 81,218 | ||||||||
Year ended March 31, 2009 | ||||||||||||
Allowance for doubtful accounts(1) | $ | 258 | $ | 25 | $ | 237 | $ | 46 | ||||
Sales reserves(1) | 2,275 | 3,314 | 4,766 | 823 | ||||||||
Allowances(1) | 2,055 | 6,220 | 7,352 | 923 | ||||||||
Valuation allowance for deferred tax assets | 44,591 | 31,357 | — | 75,948 | ||||||||
Year ended March 31, 2008 | ||||||||||||
Allowance for doubtful accounts(1) | $ | 519 | $ | 65 | $ | 326 | $ | 258 | ||||
Sales returns(1) | 2,399 | 8,020 | 8,144 | 2,275 | ||||||||
Allowances(1) | 3,303 | 10,506 | 11,754 | 2,055 | ||||||||
Valuation allowance for deferred tax assets | 124,070 | — | 79,479 | 44,591 | ||||||||
Notes:
Beginning Balance | Additions | Deductions | Ending Balance | |||||||||||||
| (in thousands) | ||||||||||||||||
| Fiscal year ended December 31, 2012: | ||||||||||||||||
Allowance for doubtful accounts(1)(2) | $ | 80 | $ | - | $ | (80 | ) | $ | - | |||||||
| Valuation allowance for deferred tax assets | $ | 69,508 | $ | - | $ | (32,335 | ) | $ | 37,173 | |||||||
| Fiscal year ended December 31, 2011: | ||||||||||||||||
Allowance for doubtful accounts(1)(2) | $ | - | $ | 80 | $ | - | $ | 80 | ||||||||
| Valuation allowance for deferred tax assets | $ | 70,449 | $ | - | $ | (941 | ) | $ | 69,508 | |||||||
| Transition Period ended December 31, 2010: | ||||||||||||||||
Allowance for doubtful accounts(2) | $ | 34 | $ | - | $ | (34 | ) | $ | - | |||||||
Sales reserves(2) | $ | 668 | $ | 270 | $ | (938 | ) | $ | - | |||||||
Allowances(2) | $ | 941 | $ | 703 | $ | (1,644 | ) | $ | - | |||||||
| Valuation allowance for deferred tax assets | $ | 81,218 | $ | - | $ | (10,769 | ) | $ | 70,449 | |||||||
| (1) | Amount relates to accounts receivables from our Steel Energy segment. | |
| (2) | Amounts are included in “Accounts receivable” in the Consolidated Balance Sheets. All other schedules are omitted because they are not applicable or the amounts are immaterial or the required information is presented in the Consolidated Financial Statements and Notes thereto. | |
II-1
| Steel Excel Inc. | ||||
|
| |||
John J. Quicke Interim President and Chief Executive Officer | ||||
| Date: March 8, 2013 | ||||
Signature | Title | Date | ||
| ||||
| /s/ JOHN J. QUICKE | Interim President and Chief Executive Officer, and Director | |||
| (principal executive officer) | |||
| /s/ MARK ZORKO | Chief Financial Officer | March 8, 2013 | ||
| Mark Zorko | (principal financial and accounting officer) | |||
|
| |||
|
| |||
|
| |||
|
| |||
INDEX TO EXHIBITS
Exhibit Number | Exhibit Description | Incorporated by Reference | Filed | |||||||||
Form | File Number | Exhibit | File Date | |||||||||
2.1 | Asset Purchase Agreement, dated June 27, 2008, by and between Overland Storage, Inc. and the Registrant | 8-K | 000-15071 | 2.01 | 07/03/08 | |||||||
2.2 | Agreement and Plan of Merger, dated as of August 27, 2008, by and among the Registrant., Ariel Acquisition Corp., Aristos Logic Corporation and TPG Ventures, L.P., as representative of certain former stockholders of Aristos Logic Corporation | 8-K | 000-15071 | 2.1 | 09/03/08 | |||||||
3.1 | Certificate of Incorporation of Registrant filed with Delaware Secretary of State on November 19, 1997. | 10-K | 000-15071 | 3.1 | 06/26/98 | |||||||
3.2 | Amended and Restated Bylaws of the Company. effective March 8, 2010 | 8-K | 000-15701 | 3.1 | 03/09/10 | |||||||
4.1 | Indenture, dated as of December 22, 2003, by and between the Registrant and Wells Fargo Bank, National Association. | 10-Q | 000-15071 | 4.01 | 02/09/04 | |||||||
4.2 | Form of 3/4% Convertible Senior Subordinated Note. | 10-Q | 000-15071 | 4.02 | 02/09/04 | |||||||
4.4 | Collateral Pledge and Security Agreement, dated as of December 22, 2003, by and among the Registrant, Wells Fargo Bank, National Association, as trustee, and Wells Fargo Bank, National Association, as collateral agent. | 10-Q | 000-15071 | 4.04 | 02/09/04 | |||||||
4.5 | Warrant Agreement, dated as of June 29, 2004, between the Registrant and International Business Machines Corporation | S-3 | 333-119266 | 4.03 | 09/24/04 | |||||||
4.6 | Warrant Agreement, dated as of August 10, 2004, between the Registrant and International Business Machines Corporation | S-3 | 333-119266 | 4.04 | 09/24/04 | |||||||
| Employment Agreements, Offer Letters and Separation Agreements | ||||||||||||
10.1† | Executive Employment Agreement of Subramanian “Sundi” Sundaresh, effective as of August 14, 2007. | 10-Q | 000-15071 | 10.1 | 11/06/07 | |||||||
10.2† | Offer Letter and Executive Employment Agreement between the Registrant and Mary L. Dotz, dated March 31, 2008 | 8-K | 000-15071 | 99.02 | 03/31/08 | |||||||
10.3† | Executive Employment Agreement of Marcus Lowe, effective August 21, 2007 | 10-Q | 000-15071 | 10.4 | 11/06/07 | |||||||
10.4† | Employment Agreement of Mr. John Noellert, effective as of August 14, 2007 | 8-K | 000-15071 | 10.1 | 10/30/08 | |||||||
10.5† | Employment Agreement of Mr. Anil Gupta, effective as of September 3, 2008 | 8-K | 000-15071 | 10.2 | 10/30/08 | |||||||
10.6† | Separation Agreement of Anil Gupta, effective March 31, 2009 | 8-K | 000-15071 | 10.1 | 04/03/09 | |||||||
|
|
|
| |||||||||
|
|
|
| |||||||||
| March 8, 2013 | |||||||||||
| Warren G. Lichtenstein | ||||||||||||
| /s/ JACK L. HOWARD | Director | March 8, 2013 | ||||||||||
| Jack L. Howard | ||||||||||||
| /s/ JOHN MUTCH | Director | March 8, 2013 | ||||||||||
| John Mutch | ||||||||||||
| /s/ GARY ULLMAN | Director | March 8, 2013 | ||||||||||
| Gary Ullman | ||||||||||||
| /s/ ROBERT VALENTINE | Director | March 8, 2013 | ||||||||||
| Robert Valentine | ||||||||||||
| Exhibit | File | |||||||||
| Number | Exhibit Description | Form | Number | Exhibit | File Date | |||||
| 2.1 | Asset Purchase Agreement between the Company and PMC-Sierra, Inc., | 10-Q | 000-15071 | 2.1 | 08/11/10 | |||||
| dated as of May 8, 2010 | ||||||||||
| 2.2 | Amended Asset Purchase Agreement between the Company and | |||||||||
| PMC-Sierra, Inc., dated as of June 8, 2010 | 10-Q | 000-15071 | 2.2 | 08/11/10 | ||||||
| 2.3 | Second Amendment to the Asset Purchase Agreement between the | |||||||||
| Company and PMC-Sierra, Inc., dated as of September 23, 2010 | 10-Q | 000-15071 | 2.1 | 11/05/10 | ||||||
| 3.1 | Unofficial Composite Certificate of Incorporation of Steel Excel Inc. | |||||||||
| as currently in effect | 10-Q | 000-15071 | 3.1 | 11/08/12 | ||||||
| 3.2 | Certificate of Designation of Series B Preferred Stock filed with the | |||||||||
| Delaware Secretary of State on December 20, 2011 | 8-K | 000-15071 | 3.1 | 12/22/11 | ||||||
| 3.3 | Amended and Restated Bylaws of the Company, effective | |||||||||
| October 14, 2010 | 8-K | 000-15071 | 3.1 | 10/20/10 | ||||||
| 4.1 | Specimen Common Stock Certificate | 10-Q | 000-15071 | 4.1 | 08/09/12 | |||||
| 4.2 | Tax Benefits Preservation Plan, dated December 21, 2011 | 8-K | 000-15071 | 4.1 | 12/22/11 | |||||
| 4.3 | First Amendment to the Tax Benefits Preservation Plan, dated as of | |||||||||
| May 1, 2012, by and between Steel Excel Inc. and Registrar and | ||||||||||
| Transfer Company, as Rights Agent | 10-Q | 000-15071 | 4.2 | 08/09/12 | ||||||
| 4.4 | Indenture, dated as of December 22, 2003, by and between the Registrant | |||||||||
| and Wells Fargo Bank, National Association | 10-Q | 000-15071 | 4.01 | 02/09/04 | ||||||
| 4.5 | Form of 3/4% Convertible Senior Subordinated Note | 10-Q | 000-15071 | 4.02 | 02/09/04 | |||||
| Employment Agreements, Offer Letters and Separation Agreements | ||||||||||
10.1† | Separation Agreement of John M. Westfield, effective November 17, 2009 | 10-Q | 000-15071 | 10.3 | 02/03/10 | |||||
10.2† | Separation Agreement of Subramanian Sundaresh, effective January 4, 2010 | 10-Q | 000-15071 | 10.1 | 02/03/10 | |||||
10.3† | Consulting Service Agreement of Subramanian Sundaresh, effective | |||||||||
January 4, 2010‡ | 10-Q | 000-15071 | 10.2 | 02/03/10 | ||||||
10.4† | Separation Agreement of John Noellert, effective February 4, 2010 | 10-K | 000-15071 | 10.11 | 05/27/10 | |||||
10.5† | Separation Agreement of Marcus Lowe, effective March 4, 2010 | 10-K | 000-15071 | 10.12 | 05/27/10 | |||||
10.6† | Separation Agreement of Mary L. Dotz, effective July 16, 2010 | 10-Q | 000-15071 | 10.1 | 08/11/10 | |||||
10.7† | Amended Separation Agreement of Mary L. Dotz, effective | F | ||||||||
| September 29, 2010 | 10-Q | 000-15071 | 10.1 | 11/05/10 | ||||||
10.8† | Amended Separation Agreement of Mary L. Dotz, effective | |||||||||
| December 10, 2010 | 10-KT | 000-15071 | 10.10 | 03/03/11 |
10.9† | Mary L. Dotz Retention Bonus Letter, effective June 15, 2010 | 10-KT | 000-15071 | 10.11 | 03/03/11 | |||||||
10.10† | Independent Contractor Agreement | 10-KT | 000-15071 | 10.12 | 03/03/11 | |||||||
| February 2, 2010 | ||||||||||||
10.11† | Amendment No. 1 to the Independent Contractor Agreement with | |||||||||||
| John J. Quicke, effective June 25, 2010 | 10-KT | 000-15071 | 10.13 | 03/03/11 | ||||||||
10.12† | Amendment No. 2 to the Independent Contractor Agreement with | |||||||||||
| John J.Quicke, effective December 7, 2010 | 10-KT | 000-15071 | 10.14 | 03/03/11 | ||||||||
10.13† | Amendment No. 3 to the Independent Contractor Agreement with | 8-K | 000-15071 | 04/ | ||||||||
| ||||||||||||
10.14† | Independent Contractor Agreement | 10-Q | 000-15071 | |||||||||
| ||||||||||||
| ||||||||||||
| ||||||||||||
| ||||||||||||
| Stock Plans and Related Forms | ||||||||||||
| ||||||||||||
| ||||||||||||
| ||||||||||||
10.15† | 2004 Equity Incentive Plan, as amended and restated on August 20, 2008 | 000-15071 | A | 09/08/08 | ||||||||
10.16† | Amendment No. 2 to 2004 Equity Incentive Plan, dated as of | |||||||||||
| November 17, 2011 | 10-Q | 000-15071 | 10.2 | 11/08/12 | |||||||
10.17† | Amendment No. 3 to 2004 Equity Incentive Plan, dated as of | |||||||||||
| August 7, 2012 | 10-Q | 000-15071 | 10.3 | 11/08/12 | ||||||||
10.18† | Form of Restricted Stock Award Agreement for 2004 Equity Incentive | |||||||||||
| Plan, as amended August 7, 2012 | 10-Q | 000-15071 | 10.4 | 11/08/12 | ||||||||
10.19† | Form of Stock Option Agreement under the 2004 Equity Incentive Plan | 10-Q | 000-15071 | 10.02 | 11/10/04 | |||||||
| ||||||||||||
| ||||||||||||
10.20† | Adaptec, Inc. 2006 Director Plan | 000-15071 | A | 07/28/06 | ||||||||
| ||||||||||||
10.21† | Amendment No. 1 to 2006 Director Plan, dated November 17, 2011 | 10-Q | 000-15071 | 10.1 | 11/08/12 | |||||||
10.22† | Form of Restricted Stock Award Agreement under 2006 Director Plan, | |||||||||||
| as amended on | 000-15071 | |||||||||||
10.23† | Stock Option Award Agreement under 2006 Director Plan, as amended on | |||||||||||
| December 7, 2010 | 10-KT | 000-15071 | ||||||||||
10.24† | Stock Appreciation Right Award Agreement under 2006 Director Plan as | |||||||||||
| amended on February 7, | 8-K | 000-15071 | 10.03 | 02/11/08 | ||||||||
| ||||||||||||
10.25† | SNAP Appliance, Inc. 2002 Stock Option and Restricted Stock | |||||||||||
| Purchase Plan, effective November 14, 2002 | S-8 | 333-118090 | 4.04 | 08/10/04 | ||||||||
| Other Compensatory Plans | ||||||||||||
10.26† | Director Compensation Policy, dated May 25, 2011 | 10-Q | 000-15071 | 10.5 | 08/09/11 | |||||||
10.27† | Fiscal 2010 Incentive Plan, effective for fiscal 2010 | 10-K | 000-15071 | 10.29 | 05/27/10 | |||||||
| 10.28 | Form of Indemnification Agreement | |||||||||||
| and its officers and directors | 10-K | 000-15071 | 10.47 | 06/06/07 | ||||||||
| Other Material Agreements | ||||||||||||
| 10.29 | Settlement Agreement, dated as | |||||||||||
| Steel Partners, L.L.C. and Steel Partners II, L.P. | 8-K | 000-15071 | ||||||||||
| 10.30 | ||||||||||||
| ||||||||||||
| Company and SP Corporate Services LLC | 8-K | 000-15071 | 10.1 | 10/06/11 | ||||||||
| 10.31 | Amended and Restated Management Services Agreement, dated as of | |||||||||||
| August 1, 2012, between the Company and SP Corporate Services LLC | 10-Q | 000-15071 | 10.6 | 11/08/12 | ||||||||
| 10.32 | Share Acquisition Agreement, dated as of April 30, 2012, by and among | |||||||||||
| the Company and BNS Holding, Inc., SWH, Inc. and SPH Group | ||||||||||||
| Holdings LLC | 8-K | 000-15071 | 2.1 | 04/ | ||||||||
Exhibit Number | Exhibit Description | Incorporated by Reference | Filed | |||||||||
Form | File Number | Exhibit | File Date | |||||||||
10.26† | Broadband Storage, Inc. 2001 Stock Option and Restricted Stock Purchase Plan | S-8 | 333-118090 | 4.03 | 08/10/04 | |||||||
10.27† | Snap Appliance, Inc. 2002 Stock Option and Restricted Stock Purchase Plan | S-8 | 333-118090 | 4.04 | 08/10/04 | |||||||
| Other Compensatory Plans | ||||||||||||
10.28† | Non-Employee Director Compensation Policy, as amended effective April 1, 2009 | X | ||||||||||
10.29† | Fiscal 2010 Adaptec Incentive Plan | X | ||||||||||
10.30† | Form of Indemnification Agreement entered into between the Company and its officers and directors | 10-K | 000-15071 | 10.47 | 06/06/07 | |||||||
| Other Material Agreements | ||||||||||||
10.31 | Base Agreement, dated as of March 24, 2002, by and between the Registrant and International Business Machines Corporation | 10-Q | 000-15071 | 10.03 | 08/09/04 | |||||||
10.32* | Manufacturing Services and Supply Agreement by and between the Registrant and Sanmina-SCI Corporation | 10-Q | 000-15071 | 10.1 | 02/07/06 | |||||||
10.33* | Amendment to Manufacturing Services and Supply Agreement by and between the Registrant and Sanmina-SCI Corporation | 10-Q | 000-15071 | 10.3 | 02/07/06 | |||||||
10.34 | Amendment to Manufacturing Services and Supply Agreement by and between the Registrant and Sanmina-SCI Corporation | 10K/A | 000-15071 | 10.37 | 06/16/08 | |||||||
10.35* | Manufacturing Services and Supply Agreement by and between the Registrant and Sanmina-SCI Corporation | 10-K | 000-15071 | 10.45 | 06/04/09 | |||||||
10.36 | Settlement Agreement, dated as of October 26, 2007, among the Registrant, Steel Partners, L.L.C. and Steel Partners II, L.P. | 8-K | 000-15071 | 10.01 | 10/31/07 | |||||||
21.1 | Subsidiaries of Registrant | X | ||||||||||
23.1 | Consent of Independent Registered Public Accounting Firm, PricewaterhouseCoopers LLP | X | ||||||||||
31.1 | Certification pursuant to Section 302 of the Sarbanes-Oxley Act of 2002. | X | ||||||||||
31.2 | Certification pursuant to Section 302 of the Sarbanes-Oxley Act of 2002. | X | ||||||||||
32.1 | Certification pursuant to Section 906 of the Sarbanes-Oxley Act of 2002. | X | ||||||||||
| Agreement of Purchase and Sale and Escrow Instructions, dated | ||||||||||
| March 26, 2011, between the Company and Swift Realty Partners, LLC | 10-Q | 000-15071 | 10.1 | 08/09/11 | ||||||
| 10.34 | First Amendment to | |||||||||
| Instructions, dated May 4, 2011, between the Company and | ||||||||||
| Swift Realty Partners, LLC | 10-Q | 000-15071 | 10.2 | 08/09/11 | ||||||
| 10.35 | Second Amendment to | |||||||||
| Instructions, dated May 26, 2011, between the Company and | ||||||||||
| Swift Realty Partners, LLC | 10-Q | 000-15071 | 10.3 | 08/09/11 | ||||||
| 21.1* | Subsidiaries of Registrant | |||||||||
| 23.1* | Consent of Independent Registered Public Accounting Firm, BDO USA, LLP | |||||||||
| 23.2* | Consent of Predecessor Independent Registered Public Accounting Firm, | |||||||||
| PricewaterhouseCoopers LLP | ||||||||||
| 31.1* | Certification pursuant to | |||||||||
| 31.2* | Certification pursuant to Section 302 of the Sarbanes-Oxley Act of 2002 | |||||||||
| 32.1* | Certification pursuant to Section 906 of the Sarbanes-Oxley Act of 2002 | |||||||||
| 101.INS** | XBRL Instance Document | |||||||||
| 101.SCH** | XBRL Taxonomy Extension Schema Document | |||||||||
| 101.CAL** | XBRL Taxonomy Extension Calculation Linkbase Document | |||||||||
| 101.DEF** | XBRL Taxonomy Extension Definition Linkbased Document | |||||||||
| 101.LAB** | XBRL Taxonomy Extension Labels Linkbase Document | |||||||||
| 101.PRE** | XBRL Taxonomy Extension Presentation Linkbase Document |