
UNITED STATES
SECURITIES AND EXCHANGE COMMISSION
Washington, D.C. 20549
FORM 10-K
(Mark One)
| x | ANNUAL REPORT PURSUANT TO SECTION 13 OR 15(d) OF THE SECURITIES EXCHANGE ACT OF 1934 |
For the fiscal year ended June 30, 20102011
OR
| ¨ | TRANSITION REPORT PURSUANT TO SECTION 13 OR 15(d) OF THE SECURITIES EXCHANGE ACT OF 1934 |
For the transition period from to
Commission File Number 001-31400
CACI International Inc
(Exact name of registrant as specified in its charter)
| Delaware | 54-1345888 | |
| (State or other jurisdiction of incorporation or organization) | (I.R.S. Employer Identification No.) |
1100 North Glebe Road, Arlington, VA 22201
(Address of principal executive offices)
(703) 841-7800
(Registrant’s telephone number, including area code)
Indicate by check mark whether the registrant is a well-known seasoned issuer, as defined in Rule 405 of the Securities Act. Yes x. No ¨.
Indicate by check mark whether the registrant is not required to file reports pursuant to Section 13 or Section 15(d) of the Act. Yes ¨. No x.
Indicate by check mark whether the registrant (1) has filed all reports required to be filed by Section 13 or 15(d) of the Securities Exchange Act of 1934 during the preceding 12 months (or for such shorter period that the registrant was required to file such reports), and (2) has been subject to such filing requirements for the past 90 days. Yes x. No ¨.
Indicate by check mark whether the registrant has submitted electronically and posted on its corporate Web site, if any, every Interactive Data File required to be submitted and posted pursuant to Rule 405 of Regulation S-T during the preceding 12 months (or for such shorter period that the registrant was required to submit and post such files). Yes ¨x. No ¨.
Indicate by check mark if disclosure of delinquent filers pursuant to Item 405 of Regulation S-K is not contained herein, and will not be contained, to the best of registrant’s knowledge, in definitive proxy or information statements incorporated by reference in Part III of this Annual Report on Form 10-K or any amendment to this Annual Report on Form 10-K. x
Indicate by check mark whether the registrant is a large accelerated filer, an accelerated filer, a non-accelerated filer or a smaller reporting company. See the definitions of “large accelerated filer,” “accelerated filer” and “smaller reporting company” in Rule 12b-2 of the Exchange Act.
Large accelerated filer x | Accelerated filer ¨ | Non-accelerated filer ¨ | Smaller reporting company ¨ |
Indicate by check mark whether the registrant is a shell company (as defined in Rule 12b-2 of the Exchange Act). Yes ¨. No x.
The aggregate market value of common shares held by non-affiliates of the registrant on December 31, 20092010 was $1,420,795,606,$1,567,662,785, based upon the closing price of the registrant’s common shares as quoted on the New York Stock Exchange composite tape on such date.
As of August 24, 2010,2011, the registrant had 30,304,63830,391,311 shares of common stock issued and outstanding.
DOCUMENTS INCORPORATED BY REFERENCE
Part III incorporates by reference certain information from the registrant’s proxy statement for its 20102011 annual meeting of stockholders. With the exception of the sections of the 2010 proxy statement2011 Proxy Statement specifically incorporated herein by reference, the 2010 proxy statement2011 Proxy Statement is not deemed to be filed as part of this Annual Report on Form 10-K.
Unless the context indicates otherwise, the terms “we”, “our”, “the Company” and “CACI” as used in Parts I, II and III include CACI International Inc and its subsidiaries and joint ventures that are more than 50 percent owned or otherwise controlled by it. The term “the registrant” as used in Parts I, II and III refers to CACI International Inc only.
INFORMATION RELATING TO FORWARD-LOOKING STATEMENTS
Certain information included or incorporated by reference in this document and in press releases, written statements or other documents filed with the United States (U.S.) Securities and Exchange Commission (SEC), or in the Company’s communications and discussions through webcasts, telephone calls and conference calls, may not address historical facts and, therefore, could be interpreted to be “forward-looking statements” as that term is defined in the Private Securities Litigation Reform Act of 1995 and other federal securities laws. All statements other than statements of historical fact are statements that could be deemed forward-looking statements, including projections of financial performance; statements of plans, strategies and objectives of management for future operations; any statement concerning developments, performance or industry rankings relating to products or services; any statements regarding future economic conditions or performance; any statements of assumptions underlying any of the foregoing; and any other statements that address activities, events or developments that CACI intends, expects, projects, believes or anticipates will or may occur in the future. Forward-looking statements may be characterized by terminology such as “believe,” “anticipate,” “expect,” “should,” “intend,” “plan,” “will,” “estimates,” “projects,” “strategy” and similar expressions. These statements are based on assumptions and assessments made by the Company’s management in light of its experience and its perception of historical trends, current conditions, expected future developments and other factors it believes to be appropriate. These forward-looking statements are subject to a number of risks and uncertainties that include but are not limited to the factors set forth under Item 1A, Risk Factors in this Annual Report on Form 10-K.
Any such forward-looking statements are not guarantees of future performance, and actual results, developments and business decisions may differ materially from those envisaged by such forward-looking statements. The forward-looking statements included herein speak only as of the date of this Annual Report on Form 10-K. The Company disclaims any duty to update such forward-looking statements, all of which are expressly qualified by the foregoing.
CACI International Inc
FORM 10-K
PART I | ||||||
Item 1. | Business | 4 | ||||
Item 1A. | Risk Factors | 13 | ||||
Item 1B. | Unresolved Staff Comments | 24 | ||||
Item 2. | Properties | 25 | ||||
Item 3. | Legal Proceedings | 25 | ||||
Item 4. | [Reserved] | 28 | ||||
PART II | ||||||
Item 5. | 29 | |||||
Item 6. | Selected Financial Data | 31 | ||||
Item 7. | Management’s Discussion and Analysis of Financial Condition & Results of Operations | 31 | ||||
Item 7A. | Quantitative and Qualitative Disclosure About Market Risk | 42 | ||||
Item 8. | Financial Statements and Supplementary Data | 42 | ||||
Item 9. | Changes in and Disagreements with Accountants on Accounting and Financial Disclosure | 42 | ||||
Item 9A. | Controls and Procedures | 42 | ||||
PART III | ||||||
Item 10. | Officers, Directors and Executive Officers of the Registrant | 44 | ||||
Item 11. | Executive Compensation | 44 | ||||
Item 12. | Security Ownership of Certain Beneficial Owners and Management | 44 | ||||
Item 13. | Certain Relationships and Related Transactions | 44 | ||||
Item 14. | Principal Accounting Fees and Services | 44 | ||||
PART IV | ||||||
Item 15. | 45 | |||||
| 97 | ||||||
PART I
Background
CACI International Inc was organized as a Delaware corporation under the name “CACI WORLDWIDE, INC.” on October 8, 1985. By a merger on June 2, 1986, the registrant became the parent of CACI, Inc., a Delaware corporation, and CACI N.V., a Netherlands corporation. Effective April 16, 2001, CACI, Inc. was merged into its wholly-owned subsidiary, CACI, INC.-FEDERAL, such that the registrant is now the corporate parent of CACI, INC.-FEDERAL, a Delaware corporation, and CACI N.V., a Netherlands corporation. The registrant is a holding company and its operations are conducted through subsidiaries, which are located in the U.S. and Europe, and a joint venture which is controlled by the registrant.
Our telephone number is (703) 841-7800 and our Internet page can be accessed at www.caci.com. We make our web site content available for information purposes only. It should not be relied upon for investment purposes, nor is it incorporated by reference into this Annual Report on Form 10-K.
Our Annual Reports on Form 10-K, Quarterly Reports on Form 10-Q, Current Reports on Form 8-K and amendments to those reports filed or furnished pursuant to Section 13(a) or 15(d) of the Exchange Act are made available free of charge on our Internet website at www.caci.com as soon as reasonably practicable after we electronically file such material with, or furnish it to, the SEC. Documents filed by us with the SEC can also be viewed at www.sec.gov.
Overview
CACI founded its business in 1962 in simulation technology. With revenue for the year ended June 30, 2010 (FY2010)2011 (FY2011) of $3.1$3.6 billion, we serve clients in the U.S. federal government and commercial markets, primarily throughout North America and internationally on behalf of U.S. customers, as well as in the United Kingdom.Kingdom (U.K.). We deliver professional services and information technology (IT) solutions to our clients. Through our service offerings, we provide comprehensive and practical solutions by adapting emerging technologies and continually evolving legacy strengths. As a result of our diverse capabilities and client mission understanding, many of our client relationships have existed for ten years or more.
Our reliable and high-quality services have enabled us to successfully compete for and win repeat business, sustain long-term client relationships and compete effectively for new clients and new contracts. We seek competitive business opportunities and have designed our operations to support major programs through centralized business development and business alliances. We have structured our business development organization to respond to the competitive marketplace, particularly within the federal government, and support that activity with full-time marketing, sales, communications, and proposal development specialists.
Our primary customers are agencies of the U.S. government. Our services are primarily targeted to the areas of defense, intelligence, homeland security and IT modernization. The demand for our services, in large measure, is created by the increasingly complex network, systems and information environments in which governments and businesses operate, and by the need to stay current with emerging technology while increasing productivity and, ultimately, improving performance.
At June 30, 2010,2011, CACI had approximately 13,10013,700 employees.
Domestic Operations
Our domestic operations are conducted through a number of subsidiaries and a joint venture which we control, and account for 100 percent of our U.S. government revenue and 20.529.3 percent of our commercial
revenue. Some of the contracts performed by our domestic operations involve assignment of employees to international locations. At June 30, 2010,2011, approximately 600900 employees were on assignments in international locations. We provide professional services and information technology solutions to our domestic clients through all of our major service offerings:
| • | Enterprise IT and network services—We support our clients’ critical networked operational missions by providing tailored end-to-end enterprise information technology services for the design, establishment, management, security and operations of client infrastructure. Our operational, analytic, consultancy and transformational services effectively use industry best practices and standards to enable and optimize the full life cycle of the networked environment, improve customer service, improve efficiency, and reduce total cost and complexity of large, geographically dispersed operations. |
| • | Data, information and knowledge management services—We deliver a full spectrum of solutions and services that automate the knowledge management life cycle from data capture through information analysis and understanding. We provide commercially-based products, custom solutions development, and operations and maintenance services that facilitate information sharing. Our information technology solutions are complemented by a suite of analytical expertise support offerings for our U.S. government Intelligence Community, Department of Defense (DoD), Department of Justice (DoJ), and Homeland Security customers. |
| • | Business system solutions—We provide solutions that address the full spectrum of requirements in the financial, procurement, human resources, healthcare, supply chain and other business domains. Our solutions employ an integrated cross-functional approach to maximize investments in existing systems, while leveraging the potential of advanced technologies to implement new, high payback solutions. Our offerings include services, consulting and software development/integration that support the full life cycle of commercial technology implementation from blueprint through application sustainment. |
| • | Logistics and material readiness services—We offer a full suite of solutions and service offerings that plan for, implement, and control the efficient and effective flow and storage of goods, services, and information in support of U.S. government agencies. We develop and manage logistics information systems, specialized simulation and modeling toolsets, and provide logistics engineering services. Our operational capabilities span the supply chain, including advance logistics planning, demand forecasting, total asset visibility (including the use of Radio Frequency Identification technology), and life cycle support for weapons systems. Our logistics services are a critical enabler in support of defense readiness and combat sustainability objectives. |
| • | C4ISR solutions and services—We provide rapid response services in support of military missions in a coordinated and controlled operational setting. We support the military efforts to ensure delivery and sustainment of integrated, enterprise-wide, Command, Control, Communications, Computers, Intelligence, Surveillance and Reconnaissance (C4ISR) programs. We integrate sensors, mission applications, and systems that connect with DoD data networks. |
| • | Cyber security—Our solutions and services support the full life cycle of preparing for, protecting against, detecting, reacting to and actively responding to the full range of cyber threats. We achieve this through comprehensive and consistently managed risk-based, cost-effective controls and measures to protect information operated by the U.S. government. We proactively support the operational use and availability/reliability of information. |
| • | Integrated security and intelligence solutions—The United States, its partners and its allies around the world face state, non-state, and transnational adversaries that do not recognize political boundaries; do not recognize international law; and will seek, through asymmetric and irregular means, ways to strike at seams in our national security. We assist clients in developing integrated solutions that close gaps between security, intelligence, and law enforcement in order to address complex threats to our national security. |
| • | Program management and system engineering and technical assistance (SETA) services—We support U.S. government Program Executive Offices and Program Management Offices via subject matter experts and comprehensive technical management processes that optimize program resources. This includes translating operational requirements into configured systems, integrating technical inputs, characterizing and managing risk, transitioning technology into program efforts, and verifying that designs meet operational needs, through the application of internationally recognized and accepted standards. Additionally, we provide SETA and advisory and assistance services that include contract and acquisition management, operations support, architecture and system engineering services, project and portfolio management, strategy and policy support, and complex trade analyses. |
In developing solutions utilizing the technologies of each of these service offerings, we make extensive use of our wide array of modeling and simulation products and services, thereby enabling clients to visualize the impact of proposed changes or new technologies before implementation. Our simulation offerings address client needs in the areas of military training and war-gaming, logistics, manufacturing, wide area networks, including satellites and land lines, local area networks, the study of business processes, and the design of distributed computer systems architecture.
International Operations
Our international operations are conducted primarily through our operating subsidiary in Europe, CACI Limited, and account for substantially all revenue generated from international clients and 79.570.7 percent of our commercial revenue. CACI Limited is headquartered in London, England, and operates primarily in support of our data, information and knowledge management services; business systems solutions; and enterprise IT and network services lines of business.
Our international service offerings focus primarily on planning, designing, implementing and managing solutions that resolve specific technical or business needs for commercial and government clients in the telecommunications, education, financial services, healthcare services, logistics planning, digital marketing, and transportation sectors.web-based data capture and forms processing areas. Our international operations also concentrate on combining data and technology in software products and services that provide strategic information on customers, buying patterns and market trends for clients who are engaged in retail sales of consumer products, direct marketing campaigns, franchise or branch site location projects, and similar endeavors.
Competition
We operate in a highly competitive industry that includes many firms, some of which are larger in size and have greater financial resources than we do. We obtain much of our business on the basis of proposals submitted in response to requests from potential and current customers, who may also receive proposals from other firms. Additionally, we face indirect competition from certain government agencies that perform services for themselves similar to those marketed by us. We know of no single competitor that is dominant in our fields of technology. We have a relatively small share of the available worldwide market for our products and services and intend to achieve growth and increasing market share both organically and through strategic acquisitions.
Strengths and Strategy
We offer substantially our entire range of professional services, information technology solutions, and proprietary products to defense, intelligence and civilian agencies of the U.S. government. Our work for U.S. government agencies may combine a wide range of skills drawn from our major service offerings. We occasionally contract through both our domestic and international operations to supply services and/or products to governments of other nations. As with other government contractors, our business is subject to government client funding decisions and actions that are beyond our control.
Although we are a supplier of proprietary computer-based technology products and marketing systems products, we are not primarily focused on being a software product developer-distributor (see discussion following under “Patents, Trademarks, Trade Secrets and Licenses”).
Our international commercial client base consists primarily of large corporations in the United Kingdom (U.K.).U.K. This market is the primary target of our proprietary marketing systems software and database products.
In order to effectively perform on our existing client contracts and secure new client contracts within the U.S. government, we must maintain expert knowledge of agency policies, operations and challenges. We combine this comprehensive knowledge with significant expertise in the design, integration, development and implementation of advanced information technology and communications solutions. This capability provides us with opportunities either to compete directly for, or to support other bidders in competition for, multi-million dollar and multi-year award contracts from the U.S. government.
We have strategic business relationships with a number of companies associated with the information technology industry. These strategic partners have business objectives compatible with ours and offer products and services that complement ours. We intend to continue development of these kinds of relationships wherever they support our growth objectives.
Our marketing and new business development is conducted by virtually all of our officers and managers including the Chief Executive Officer, executive officers, vice presidents, and division managers. We employ marketing professionals who identify and qualify major contract opportunities, primarily in the federal government market. Our proprietary software and marketing systems are sold primarily by full-time sales people. We also have established agreements for the resale of certain third party software and data products.
Much of our business is won through submission of formal competitive bids. Government and commercial clients typically base their decisions regarding contract awards on their assessment of the quality of past performance, responsiveness to proposal requirements, price, and other factors. Commercial bids are frequently negotiated as to terms and conditions for schedule, specifications, delivery and payment. The terms, conditions and form of contract of government bids, however, are in most cases specified by the client. In situations in which the client-imposed contract type and/or terms appear to expose us to inappropriate risk or do not offer us a sufficient financial return, we may seek alternate arrangements or opt not to bid for the work. Essentially all contracts with the U.S. government, and many contracts with other government entities, permit the government client to terminate the contract at any time for the convenience of the government or for default by the contractor. Although we operate under the risk that such terminations may occur and have a material impact on operations, such terminations have been rare and, generally, have not materially affected operations.
Our contracts and subcontracts are composed of a wide range of contract types, including firm fixed-price, cost reimbursement, time-and-materials (T&M), indefinite delivery/indefinite quantity (IDIQ) and government wide acquisition contracts (known as GWACS) such as General Services Administration (GSA) schedule contracts. By company policy, fixed-price contracts require the approval of at least two of our senior officers.
At any one time, we may have several thousand separate active contracts and/or task orders. In FY2010,FY2011, the ten top revenue-producing contracts accounted for 41.544.0 percent of our revenue, or $1.3$1.6 billion.
In FY2010, 94.8FY2011, 94.9 percent of our revenue came from U.S. government prime contracts or subcontracts consisting of 77.879.9 percent from DoD contracts and 17.015.0 percent from U.S. government civilian agency clients. The remaining 5.25.1 percent of revenue came from commercial businesses, both domestic and international, and state and local contracts.
Although we are continuously working to diversify our client base, we will continue to aggressively seek additional work from the DoD. In FY2010,FY2011, DoD revenue grew by 17.916.7 percent, or $372.1$408.3 million. Substantially allMost of the DoD revenue growth was attributable to existing operations.
Industry Trends
The federal government is the largest consumer of information technology services and solutions in the United States. We believe that the following trends will impact the federal government’s future spending on the types of services we provide:
| • | Federal government budget trends, pressures and opportunities |
| • | Administration and congressional changes—Legislative initiatives in the housing, financial, automotive, energy and health industries; lower revenue; recent budget submissions; and the ongoing weak economy have contributed to historically high actual and projected domestic budget increases and federal deficits. The efforts to control spending in the federal government’s FY11 appropriation process and the debt ceiling debate have compounded the pressures to reduce federal spending, especially in the non-security areas. These trends may limit funding of complex programs with long payout periods. |
| • | Budget pressures—We believe that deficit spending is at a level which may be unsustainable, and that spending reductions, entitlement reform, new revenue generation or some combination thereof may be necessary. Spending cuts and revenue increases may need to occur while the economy remains under significant stress. If the economic recovery stagnates or reverses, budget pressures could magnify. |
| • | Annual appropriations process—Ongoing delays in the approval of annual federal government budgets appear to be causing uncertainty in various federal agencies, resulting in delays in contract awards and uncertainty in the contracting community. This trend is especially pronounced in the civilian agencies, many of which have operated under continuing resolutions for several years. |
| • | Budget opportunities |
| • | Information technology services—As federal government agencies seek to make spending reductions, opportunities to achieve cost reductions through improved operational efficiency will receive higher priority. Many IT initiatives emerging in both DoD and Office of Management and Budget (OMB) directed programs for civilian agencies are based on infrastructure consolidation and cost effective upgrades. These consolidation and upgrade initiatives include infrastructure, applications and information. With greater technology infrastructure needs, we believe the demand will likely increase for information technology virtualization and the use of cloud computing technologies to achieve cost and performance efficiencies, along with smaller footprints and power needs. We expect our clients to shift resources to optimizing data, information and knowledge in shorter time frames. We continue to expect to see funding of transformational activity that yield results in a shorter timeframe to maximize investments with more stable and predictable information system outcomes. As the amount of data and information grows, and persistent threats to our national security continue, the demands for applications will grow as well, putting a higher value on faster and more efficient/effective technologies. We expect this demand to result in an increasing need for cyber security solutions. An additional area of cyber emphasis is the security of the supply chain. While technology provides part of the answer, the integration of processes and personnel using forward-looking systems and sound architectures is more likely to provide cost savings and performance efficiencies. |
| • | DoD Services—We continue to see a stable flow of funds to the intelligence, defense and security areas that directly support mission critical operations. While DoD is instituting a 10 percent reduction in funding for service support contractors in “knowledge-based” areas for each of the next three years, these reductions are affecting only a small percentage of the services market. We expect most of these reductions to be in areas where DoD is looking to consolidate functions and organizations. |
| • | Overseas contingency operations (OCO Supplemental) funding in support of Iraq and Afghanistan operations—The deployment of troops to Iraq is scheduled to end on December 31, 2011. Although negotiations are continuing for a longer term presence, U.S. ground combat operations have ended. The withdrawal of troops from Afghanistan has begun. The turnover of all combat operations to Afghanistan’s forces is scheduled for 2014. We expect intelligence gathering, processing and analysis to continue and remain important to the mission of the commanders in the field. Further, logistics and force protection operations will continue. We anticipate a reduction in the OCO Supplemental to begin in 2012 and continue into the future. Going forward, we anticipate a continuing need to re-set and modernize equipment and infrastructure as forces return from South West Asia. This need will likely fuel a continuing demand for logistics services and network-enabled mission capabilities that provide increased efficiency and cost-effectiveness. |
| • | Federal business and acquisition policy |
| • | Government acquisition reforms—A number of statutory acquisition reform provisions and initiatives continue to be considered at the legislative level. These reforms may lead to increased oversight of contractor support services, with a focus on specific role definitions, transparency, additional reporting, managed risks, avoidance of potential conflicts of interest, and the mix between contractor staff and government personnel. |
| • | Oversight and transparency—Oversight at the Congressional level and audit scrutiny at the agency level have increased |
| • | Contract type—One trend is a movement away from T&M and award fee contracts to more fixed price and cost reimbursable contracts. Better requirements definition and value based solutions should allow for more fixed price contracts where the contractor assumes more of the risk. Our fixed priced risk review and emphasis on qualified program managers should allow us to understand the risks and maintain margins. For cost reimbursable contracts, we may experience pricing pressures. Pricing is taking on an increasing role in best value determinations with more detailed pricing oversight. Further, technically acceptable lowest price is becoming more prevalent. |
| • | Contract award protests—We continue to experience a number of protests of contracts |
| • | More frequent recompetes of contracts—DoD has announced an intention to increase competition when possible and conduct more frequent recompetitions of existing contracts. While the intent is to control government costs, we are concerned that the government may have insufficient staff to manage the existing workload. |
| • |
|
We currently experience a strong flow of funds to the intelligence, defense and security areas even as there have been reductions in major defense weapons programs, and with the potential for further such reductions in the future. Secretary of Defense Gates recently announced a DoD efficiencies initiative to reduce excess overhead costs and reinvest these savings into priority programs supporting the warfighter and modernization. He also announced a 10 percent reduction in funding for service support contractors for each of the next three years. While it is too early to know the exact nature and specifics of these plans, or to accurately assess the impact of the reduction initiatives, we do know their intent with regard to the types of services we provide to our primary clients. An early indication of one type of action is the “reduction by consolidation” announced by the Secretary in the proposed closing down and redistribution of work currently being done by the U.S. Joint Forces Command, the Business Transformation Agency and the National Information Infrastructure.
|
Departments in the federal government will seek to make spending reductions, especially in areas where cost reductions can improve operational efficiency. These moves also generate opportunity. Secretary Gates commented on the need to improve efficiency and effectiveness of DoD IT infrastructures. He directed an effort to consolidate assets to take advantage of economies of scale. As the Office of Management and Budget (OMB) and the Federal Chief Information Officer have clearly indicated, properly developing and managing IT systems is essential to successful government. It will be critical for our clients to shift resources while optimizing data, information and knowledge in shorter time
frames. We expect to see a greater desire to fund transformational activity that yields better results in a shorter timeframe, thus maximizing investments with more stable and predictable information system outcomes. While technology provides part of the answer, the integration of processes and personnel using forward-looking systems and sound architectures is more likely to provide the cost savings and performance efficiencies.
|
| • |
|
One other trend is a movement away from T&M contracts to more cost reimbursable contracts as well as more fixed-price contracting. This change will have potential impact on margins (positive and negative) as these contract types change over time. In addition, the move to fixed-price contracts effectively shifts risk from the government to the contractor. Our fixed-price risk review approach and cost-type contracting flexibility enable us to address these impacts.
|
An additional area of cyber emphasis is the need for security of the supply chain. This includes infrastructure, applications and information, which adds more demand and complexity to the enterprise and the technology infrastructure supporting the enterprise. With the greater technology infrastructure needs, we believe the demand will increase for information technology virtualization, consolidation and the utilization of cloud computing technologies which help to achieve cost and performance efficiencies, along with the smaller footprints and power needs. We anticipate infrastructure needs, including the “green” initiatives that are commanding the attention and resources of the federal government and involve everything from buildings to the technology in the buildings. Tools, applications, and devices, can be expected to grow and have an increasing impact on solutions and services going forward.
|
|
|
In the PCI area, there will be an impact on how individuals are viewed with respect to procurements, as well as how efficiently and effectively more complex work is completed as knowledgeable people may be conflicted from providing solutions and services. Much of this impact is still developing and mitigation strategies are still a strong consideration for the government.
| • | Small business participation expectations—According to the Small Business Administration (SBA), as a whole, the government |
The General Accounting Office has issued some rulings in this regard and some agencies are already putting out procurements with up to 40 percent small business content for prime contracts. In the federal government’s FY2010, the SBA will be developing the agency’s FY2011 – 2016 Strategic Plan. We will be watching closely for any changes/updates to the small business requirements. We are also seeing increasing use of “Restricted Suites” for small business multiple award IDIQ solicitations, replacing the “reserved” awards that still required the small businesses to compete with large businesses on task orders. This may further reduce the addressable contract dollars available to large businesses.
|
| • |
|
| • | Strategic sourcing—The OMB has issued a directive to make business decisions about acquiring commodities and services more effectively and efficiently. In many cases, these strategies are designed to drive specific services to commodity status in order to leverage the government’s purchasing |
In addition to these trends, in the near term we face some uncertainties due to the current business environment.
Many of our federal government contracts require us to have security clearances and employ personnel with specific levels of education and work experience. Depending on the level, security clearances can be difficult and time-consuming to obtain, and competition for skilled personnel in the information technology services industry is intense.
| • | Security clearances and job specifications—Many of our federal government contracts require us to have security clearances and employ personnel with specific levels of education and work experience. Depending on the level, security clearances can be difficult and time-consuming to obtain, and competition for skilled personnel in the information technology services industry is intense. |
A shift of expenditures away from programs that we support could cause federal government agencies to reduce their purchases under contracts, to exercise their right to terminate contracts at any time without penalty, or to decide not to exercise options to renew contracts.
Our operations are also affected by local, national and worldwide economic conditions. The consequences of a prolonged global economic downturn or a continued weak U.S. economy and large federal budget deficits may include a lower level of government spending in the areas in which we provide our services.
Instability in the financial markets, as a result of an economic weakness or other factors, may also affect the cost of capital and our ability to raise capital. In addition, future material losses on assets invested in connection with our supplemental retirement plan would adversely affect our income tax expense.
| • | Macro economic trends—Our operations are also affected by local, national and global economic conditions. The consequences of a global economic downturn or a continued weak U.S. economy may include a lower level of government spending in the areas in which we provide our services. Instability in the financial markets, as a result of an economic weakness or other factors, may also affect the cost of capital and our ability to raise capital. Further, financial market performance can impact our tax structure and, consequently, our financial results. |
Recent Significant Acquisitions
During the past three fiscal years, we completed a total of elevennine acquisitions, four in the U.S. and sevenfive in the U.K. including:
The October 2007 acquisition of all of the outstanding stock of Athena Holding Corporation, a holding company which owned 100 percent of the outstanding shares of Athena Innovative Solutions, Inc (AIS), for $200.0 million. AIS and its wholly owned subsidiaries provided specialized professional services and solutions to United States intelligence organizations.
The November 2007 acquisition of all of the outstanding stock of Dragon Development Corporation (DDC) for $41.0 million. DDC provided professional, technical, and engineering services to United States intelligence organizations.
The October 2009 acquisition of all of the outstanding stock of a business in the United States which provides commercial security technology services for $60.0$62.8 million. In addition, the purchase agreement provided that we may bemight have been required to pay additional consideration of up to $32.5 million based upon events to occur subsequent to the acquisition date.(Contingent Consideration)
of up to $32.5 million based upon events to occur subsequent to the acquisition date. Subsequent to June 30, 2011, we and the sellers agreed to settle the Contingent Consideration for a payment of $15.5 million. Simultaneously, an entity controlled by the primary selling shareholder entered into an agreement with us to purchase certain equipment we customarily offer for sale. In addition, the parties are negotiating a joint sales and marketing agreement. |
The February 2010 acquisition of all of the outstanding stock of SystemWare Incorporated, which provides signal acquisition and analysis systems for cyber security and counterintelligence application, for $20.0 million. In addition, we may be required$23.6 million paid to paydate and the opportunity to earn additional consideration of up to $12.0$6.0 million, based upon events to occur subsequenton earnings of the acquired entity during the twelve months ending January 31, 2012.
The November 2010 acquisition of TechniGraphics, Inc., a provider of imaging and geospatial services to the U.S. government, for $104.6 million.
The November 2010 acquisition date.of Applied Systems Research, Inc., a provider of technical services and products to the U.S. government, for $25.1 million.
Over the past several years, the U.S. government has organized the armed services so that military personnel focus on combat and war-fighter roles, while many non-combatant roles are filled by personnel provided by contractors. The acquisitions we completed, including those as described above, have positioned us to respond to certain aspects of this transformation of DoD, and deliver contract personnel to fill some of these non-combatant roles including logistics, intelligence gathering and analysis, organizational realignment and training.
Seasonal Nature of Business
Our business in general is not seasonal, although the summer and holiday seasons affect our revenue because of the impact of holidays and vacations on our labor and on product and service sales by our international operations. Variations in our business also may occur at the expiration of major contracts until such contracts are renewed or new business obtained.
The U.S. government’s fiscal year ends on September 30 of each year. It is not uncommon for government agencies to award extra tasks or complete other contract actions in the weeks before the end of a fiscal year in order to avoid the loss of unexpended funds. Moreover, in years when the U.S. government does not complete the budget process for the next fiscal year before the end of September, government operations whose appropriations legislation has not been signed into law are funded under a continuing resolution that authorizes them to continue to operate, but traditionally does not authorize new spending initiatives.
CACI Employment and Benefits
Our employees are our most valuable resource. We are in continuing competition for highly skilled professionals in virtually all of our business areas. The success and growth of our business is significantly correlated with our ability to recruit, train, promote and retain high quality people at all levels of the organization. For these reasons, we endeavor to maintain competitive salary structures, incentive compensation programs, fringe benefits, opportunities for growth, and individual recognition and award programs. Fringe benefits are generally consistent across our subsidiaries, and include paid vacations, sick leave and holidays; medical, dental, disability and life insurance; tuition reimbursement for job-related education and training; and other benefits under various retirement savings and stock purchase plans.
We have published policies that set high standards for the conduct of our business. We require all of our employees, independent contractors working on client engagements, officers, and directors annually to execute and affirm to the code of ethics applicable to their activities. In addition, we require annual ethics and compliance training for all of our employees to provide them with the knowledge necessary to maintain our high standards of ethics and compliance.
Approximately 55 of our employees, all of whom are located at Fort Bliss, Texas, are represented by the International Union of Operating Engineers. We successfully negotiated a collective bargaining agreement with the union which was incorporated into our Fort Bliss contract with the Army. We believe that our relationship with the union is good.
Patents, Trademarks, Trade Secrets and Licenses
We own seveneight patents and patent applications in the United States. While we believe our patents are valid, we do not consider that our business is dependent on patent protection in any material way. We claim copyright, trademark and other proprietary rights in a variety of intellectual property, including each of our proprietary computer software and data products and the related documentation. We presently own 1719 registered trademarks and service marks and applications in the U.S. and 31 registered trademarks and service marks in other countries, primarily the U.K. All of our registered trademarks and service marks may be renewed indefinitely. In addition, we assert copyrights in essentially all of our electronic and hard copy publications, our proprietary software and data products and in software produced at the expense of the U.S. government, which rights can be maintained for up to 75 years. Because most of our business involves providing services to government entities, our operations generally are not substantially dependent upon obtaining and/or maintaining copyright or trademark protections, although our operations make use of such protections and benefit from them as discriminators in competition. We are also a party to agreements that give us the right to distribute computer software, data and other products owned by other companies, and to receive income from such distribution. As a systems integrator, it is important that we maintain access to software, data and products supplied by such third parties, but we generally have experienced little difficulty in doing so. The durations of such agreements vary according to the terms of the agreements themselves.
We maintain a number of trade secrets that contribute to our success and competitive distinction and endeavor to accord such trade secrets protection adequate to ensure their continuing availability to us. From time to time, we are required to assert our rights against former employees or other third parties who attempt to misappropriate our trade secrets and confidential information for their own personal or professional gain. We
take such matters seriously and pursue claims against such individuals to the extent necessary to adequately protect our rights. While retaining protection of our trade secrets and vital confidential information is important, we are not materially dependent on maintenance of a specific trade secret.
Backlog
Our backlog as of June 30, 2010,2011, which consists primarily of contracts with the U.S. government, was $6.8 billion, of which $1.9$1.8 billion was for funded orders. Total backlog as of June 30, 2009 was $7.8 billion. The decrease in backlog from June 30, 2009 to June 30, 2010 was primarily attributable to a lower level of recompete activity during the year ended June 30, 2010.$6.8 billion. We presently anticipate, based on current revenue projections, that the majority of the funded backlog as of June 30, 20102011 will result in revenue during the fiscal year ending June 30, 2011.2012.
Our backlog represents the aggregate contract revenue we estimate will be earned over the remaining life of our contracts. We include in estimated remaining contract value only the contract revenue we expect to earn over the remaining term of the contract, even in cases where more than one company is awarded work under a given contract. Funded backlog is based upon amounts appropriated by a customer for payment for goods and services and as the U.S. government operates under annual appropriations, agencies of the U.S. government generally fund contracts on an incremental basis. As a result, the majority of our estimated remaining contract value is not funded backlog. The estimates used to compile remaining contract value are based on our experience under contracts, and we believe the estimates are reasonable. However, there can be no assurance that existing contracts will result in earned revenue in any future period or at all.
Business Segments, Foreign Operations, and Major Customers
Additional business segment, foreign operations and major customer information is provided in our Consolidated Financial Statements contained in this Report. In particular, see Note 17,16, Business Segment, Customer and Geographic Information, in the Notes to Consolidated Financial Statements contained in this Annual Report on Form 10-K.
Revenue by Contract Type
The following information is provided on the amounts of our revenue attributable to time-and-materialsT&M contracts, cost reimbursable contracts and firm fixed-price contracts (including proprietary software product sales), during each of the last three fiscal years:
| Year ended June 30, | Year ended June 30, | |||||||||||||||||||||||||||||||||||||||||
| 2010 | 2009 | 2008 | 2011 | 2010 | 2009 | |||||||||||||||||||||||||||||||||||||
| (dollars in thousands) | (dollars in thousands) | |||||||||||||||||||||||||||||||||||||||||
Time and materials | $ | 1,467,556 | 46.6 | % | $ | 1,310,001 | 48.0 | % | $ | 1,232,942 | 50.9 | % | $ | 1,423,184 | 39.8 | % | $ | 1,467,556 | 46.6 | % | $ | 1,310,001 | 48.0 | % | ||||||||||||||||||
Cost reimbursable | 1,033,480 | 32.8 | 875,653 | 32.1 | 672,950 | 27.8 | 1,277,326 | 35.7 | 1,033,480 | 32.8 | 875,653 | 32.1 | ||||||||||||||||||||||||||||||
Firm fixed-price | 648,095 | 20.6 | 544,508 | 19.9 | 514,645 | 21.3 | 877,270 | 24.5 | 648,095 | 20.6 | 544,508 | 19.9 | ||||||||||||||||||||||||||||||
|
|
|
|
|
| |||||||||||||||||||||||||||||||||||||
Total | $ | 3,149,131 | 100.0 | % | $ | 2,730,162 | 100.0 | % | $ | 2,420,537 | 100.0 | % | $ | 3,577,780 | 100.0 | % | $ | 3,149,131 | 100.0 | % | $ | 2,730,162 | 100.0 | % | ||||||||||||||||||
|
|
|
|
|
| |||||||||||||||||||||||||||||||||||||
You should carefully consider the risks and uncertainties described below, together with the information included elsewhere in this Annual Report on Form 10-K and other documents we file with the SEC. The risks and uncertainties described below are those that we have identified as material, but are not the only risks and uncertainties facing us. Our business is also subject to general risks and uncertainties that affect many other companies, such as overall U.S. and non-U.S. economic and industry conditions, including a global economic
slowdown, geopolitical events, changes in laws or accounting rules, fluctuations in interest and exchange rates, terrorism, international conflicts, major health concerns, natural disasters or other disruptions of expected economic and business conditions. Additional risks and uncertainties not currently known to us or that we currently believe are immaterial also may impair our business operations and liquidity.
We depend on contracts with the federal government for a substantial majority of our revenue, and our business could be seriously harmed if the government significantly decreased or ceased doing business with us.
We derived 94.9 percent of our total revenue in FY2011 and 94.8 percent of our total revenue in FY2010 and 96.0 percent of our total revenue in FY2009 from federal government contracts, either as a prime contractor or a subcontractor. We derived 79.9 percent of our total revenue in FY2011 and 77.8 percent of our total revenue in FY2010 and 76.1 percent of our total revenue in FY2009 from contracts with agencies of the DoD. We expect that federal government contracts will continue to be the primary source of our revenue for the foreseeable future. If we were suspended or debarred from contracting with the federal government generally, the General Services Administration, or any significant agency in the intelligence community or the DoD, or if our reputation or relationship with government agencies were to be impaired, or if the government otherwise ceased doing business with us or significantly decreased the amount of business it does with us, our business, prospects, financial condition and operating results could be materially and adversely affected.
Our business could be adversely affected by delays caused by our competitors protesting major contract awards received by us, resulting in the delay of the initiation of work.
It can take many months to resolve protests by one or more of our competitors of contract awards we receive. The resulting delay in the start up and funding of the work under these contracts may cause our actual results to differ materially and adversely from those anticipated.
Our business could be adversely affected by changes in budgetary priorities of the federal government.
Because we derive a substantial majority of our revenue from contracts with the federal government, we believe that the success and development of our business will continue to depend on our successful participation in federal government contract programs. Changes in federal government budgetary priorities could directly affect our financial performance. A significant decline in government expenditures, a shift of expenditures away
from programs that we support or a change in federal government contracting policies could cause federal government agencies to reduce their purchases under contracts, to exercise their right to terminate contracts at any time without penalty or not to exercise options to renew contracts. Any such actions could cause our actual results to differ materially and adversely from those anticipated. Among the factors that could seriously affect our federal government contracting business are:
the demand for and priority of funding for combat operations in Iraq and Afghanistan, decreases to which may reduce the demand for our services on contracts supporting some operations and maintenance activities in the DoD;
the funding of some or all civilian agencies through a continuing resolution instead of a budget appropriation, which may cause our customers within those agencies to defer or reduce work under our current contracts;
a federal government shutdown resulting from the failure to pass budget appropriations or continuing resolutions, as well as other budgetary priorities limiting or delaying federal government spending generally, or specific departments or agencies in particular, and changes in fiscal policies or available funding;
an increase in set-asides for small businesses, which could result in our inability to compete directly for prime contracts; and
curtailmentreduction of the federal government’s use of information technology or professional services.
Our federal government contracts may be terminated by the government at any time and may contain other provisions permitting the government not to continue with contract performance, and if lost contracts are not replaced, our operating results may differ materially and adversely from those anticipated.
We derive substantially all of our revenue from federal government contracts that typically span one or more base years and one or more option years. The option periods typically cover more than half of the contract’s potential duration. Federal government agencies generally have the right not to exercise these option periods. In addition, our contracts typically also contain provisions permitting a government client to terminate the contract for its convenience. A decision not to exercise option periods or to terminate contracts could result in significant revenue shortfalls from those anticipated.
Federal government contracts contain numerous provisions that are unfavorable to us.
Federal government contracts contain provisions and are subject to laws and regulations that give the government rights and remedies, some of which are not typically found in commercial contracts, including allowing the government to:
cancel multi-year contracts and related orders if funds for contract performance for any subsequent year become unavailable;
claim rights in systems and software developed by us;
suspend or debar us from doing business with the federal government or with a governmental agency;
impose fines and penalties and subject us to criminal prosecution; and
control or prohibit the export of our data and technology.
If the government terminates a contract for convenience, we may recover only our incurred or committed costs, settlement expenses and profit on work completed prior to the termination. If the government terminates a contract for default, we may be unable to recover even those amounts, and instead may be liable for excess costs incurred by the government in procuring undelivered items and services from another source. Depending on the value of a contract, such termination could cause our actual results to differ materially and adversely from those anticipated. Certain contracts also contain OCI clauses that limit our ability to compete for or perform certain
other contracts. OCIs arise any time we engage in activities that (i) make us unable or potentially unable to render impartial assistance or advice to the government; (ii) impair or might impair our objectivity in performing contract work; or (iii) provide us with an unfair competitive advantage. For example, when we work on the design of a particular system, we may be precluded from competing for the contract to install that system. Depending upon the value of the matters affected, an OCI issue that precludes our participation in or performance of a program or contract could cause our actual results to differ materially and adversely from those anticipated.
As is common with government contractors, we have experienced and continue to experience occasional performance issues under certain of our contracts. Depending upon the value of the matters affected, a performance problem that impacts our performance of a program or contract could cause our actual results to differ materially and adversely from those anticipated.
If we fail to establish and maintain important relationships with government entities and agencies, our ability to successfully bid for new business may be adversely affected.
To facilitate our ability to prepare bids for new business, we rely in part on establishing and maintaining relationships with officials of various government entities and agencies. These relationships enable us to provide informal input and advice to government entities and agencies prior to the development of a formal bid. We may be unable to successfully maintain our relationships with government entities and agencies, and any failure to do so may adversely affect our ability to bid successfully for new business and could cause our actual results to differ materially and adversely from those anticipated.
We derive significant revenue from contracts and task orders awarded through a competitive bidding process. If we are unable to consistently win new awards over any extended period, our business and prospects will be adversely affected.
Substantially all of our contracts and task orders with the federal government are awarded through a competitive bidding process. We expect that much of the business that we will seek in the foreseeable future will continue to be awarded through competitive bidding. Budgetary pressures and changes in the procurement process have caused many government clients to increasingly purchase goods and services through IDIQ contracts, GSA schedule contracts and other government-wide acquisition contracts. These contracts, some of which are awarded to multiple contractors, have increased competition and pricing pressure, requiring that we make sustained post-award efforts to realize revenue under each such contract. In addition, in consideration of the practice of agencies awarding work under such contracts that is arguably outside the intended scope of the contracts, both the GSA and the DoD have initiated programs aimed to ensure that all work fits properly within the scope of the contract under which it is awarded. The net effect of such programs may reduce the number of bidding opportunities available to us. Moreover, even if we are highly qualified to work on a particular new contract, we might not be awarded business because of the federal government’s policy and practice of maintaining a diverse contracting base.
This competitive bidding process presents a number of risks, including the following:
we bid on programs before the completion of their design, which may result in unforeseen technological difficulties and cost overruns;
we expend substantial cost and managerial time and effort to prepare bids and proposals for contracts that we may not win;
we may be unable to estimate accurately the resources and cost structure that will be required to service any contract we win; and
we may encounter expense and delay if our competitors protest or challenge awards of contracts to us in competitive bidding, and any such protest or challenge could result in the resubmission of bids on modified specifications, or in the termination, reduction or modification of the awarded contract.
If we are unable to win particular contracts, we may be prevented from providing to clients services that are purchased under those contracts for a number of years. If we are unable to consistently win new contract awards over any extended period, our business and prospects will be adversely affected and that could cause our actual results to differ materially and adversely from those anticipated. In addition, upon the expiration of a contract, if the client requires further services of the type provided by the contract, there is frequently a competitive rebidding process. There can be no assurance that we will win any particular bid, or that we will be able to replace business lost upon expiration or completion of a contract, and the termination or non-renewal of any of our significant contracts could cause our actual results to differ materially and adversely from those anticipated.
Our business may suffer if we or our employees are unable to obtain the security clearances or other qualifications we and they need to perform services for our clients.
Many of our federal government contracts require us to have security clearances and employ personnel with specified levels of education, work experience and security clearances. Depending on the level of clearance, security clearances can be difficult and time-consuming to obtain. If we or our employees lose or are unable to obtain necessary security clearances, we may not be able to win new business and our existing clients could terminate their contracts with us or decide not to renew them. To the extent we cannot obtain or maintain the required security clearances for our employees working on a particular contract, we may not derive the revenue anticipated from the contract, which could cause our results to differ materially and adversely from those anticipated.
We must comply with a variety of laws and regulations, and our failure to comply could cause our actual results to differ materially from those anticipated.
We must observe laws and regulations relating to the formation, administration and performance of federal government contracts which affect how we do business with our clients and may impose added costs on our business. For example, the Federal Acquisition Regulation and the industrial security regulations of the DoD and related laws include provisions that:
allow our federal government clients to terminate or not renew our contracts if we come under foreign ownership, control or influence;
require us to divest work if an OCI related to such work cannot be mitigated to the government’s satisfaction;
require us to disclose and certify cost and pricing data in connection with contract negotiations; and
require us to prevent unauthorized access to classified information.
Our failure to comply with these or other laws and regulations could result in contract termination, loss of security clearances, suspension or debarment from contracting with the federal government, civil fines and damages and criminal prosecution and penalties, any of which could cause our actual results to differ materially and adversely from those anticipated.
The federal government may change its procurement or other practices in a manner adverse to us.
The federal government may change its procurement practices, such as in proposed acquisition reforms, or adopt new contracting rules and regulations, such as cost accounting standards. It could also adopt new contracting methods relating to GSA contracts or other government-wide contracts, or adopt new socio-economic requirements. In all such cases, there is uncertainty surrounding the changes and what actual impacts they may have on contractors. These changes could impair our ability to obtain new contracts or win re-competed contracts. Any new contracting methods could be costly or administratively difficult for us to satisfy and, as a result, could cause actual results to differ materially and adversely from those anticipated.
Restrictions on or other changes to the federal government’s use of service contracts may harm our operating results.
We derive a significant amount of revenue from service contracts with the federal government. The government may face restrictions from new legislation, regulations or government union pressures, on the nature and amount of services the government may obtain from private contractors (i.e., insourcing versus outsourcing). Any reduction in the government’s use of private contractors to provide federal services could cause our actual results to differ materially and adversely from those anticipated.
Our contracts and administrative processes and systems are subject to audits and cost adjustments by the federal government, which could reduce our revenue, disrupt our business or otherwise adversely affect our results of operations.
Federal government agencies, including the Defense Contract Audit Agency (DCAA), routinely audit and investigate government contracts and government contractors’ administrative processes and systems. These agencies review our performance on contracts, pricing practices, cost structure and compliance with applicable laws, regulations and standards. They also review our compliance with government regulations and policies and the adequacy of our internal control systems and policies, including our purchasing, accounting, estimating, compensation and management information processes and systems. Any costs found to be improperly allocated to a specific contract will not be reimbursed, and any such costs already reimbursed must be refunded and certain penalties may be imposed. Moreover, if any of the administrative processes and systems is found not to comply with requirements, we may be subjected to increased government scrutiny and approval that could delay or
otherwise adversely affect our ability to compete for or perform contracts or collect our revenue in a timely manner. Therefore, an unfavorable outcome of an audit by the DCAA or another government agency could cause actual results to differ materially and adversely from those anticipated. If a government investigation uncovers improper or illegal activities, we may be subject to civil and criminal penalties and administrative sanctions, including termination of contracts, forfeitures of profits, suspension of payments, fines and suspension or debarment from doing business with the federal government. In addition, we could suffer serious reputational harm if allegations of impropriety were made against us. Each of these results could cause actual results to differ materially and adversely from those anticipated. DCAA audits for costs incurred on work performed after June 30, 2005 have not yet been completed. In addition, DCAA audits for costs incurred by our recent acquisitions for certain periods prior to acquisition have not yet been completed. We do not know the outcome of any existing or future audits and if any future audit adjustments significantly exceed our estimates our profitability could be adversely affected.
Failure to maintain strong relationships with other contractors could result in a decline in our revenue.
We derive substantial revenue from contracts in which we act as a subcontractor or from teaming arrangements in which we and other contractors bid on particular contracts or programs. As a subcontractor or teammate, we often lack control over fulfillment of a contract, and poor performance on the contract could impact our customer relationship, even when we perform as required. We expect to continue to depend on relationships with other contractors for a portion of our revenue in the foreseeable future. Moreover, our revenue and operating results could differ materially and adversely from those anticipated if any prime contractor or teammate chose to offer directly to the client services of the type that we provide or if they team with other companies to provide those services.
We may not receive the full amounts authorized under the contracts included in our backlog, which could reduce our revenue in future periods below the levels anticipated.
Our backlog consists of funded backlog, which is based on amounts actually committed by a client for payment for goods and services, and unfunded backlog, which is based upon management’s estimate of the future potential of our existing contracts and task orders, including options, to generate revenue. Our backlog may not result in actual revenue in any particular period, or at all, which could cause our actual results to differ materially and adversely from those anticipated.
The maximum contract value specified under a government contract or task order awarded to us is not necessarily indicative of the revenue that we will realize under that contract. For example, we derive a substantial portion of our revenue from government contracts in which we are not the sole provider, meaning that the government could turn to other companies to fulfill the contract. We also derive revenue from IDIQ contracts, which do not require the government to purchase a pre-determined amount of goods or services under the contract. Action by the government to obtain support from other contractors or failure of the government to order the quantity of work anticipated could cause our actual results to differ materially and adversely from those anticipated.
Without additional Congressional appropriations, some of the contracts included in our backlog will remain unfunded, which could significantly harm our prospects.
Although many of our federal government contracts require performance over a period of years, Congress often appropriates funds for these contracts for only one year at a time. As a result, our contracts typically are only partially funded at any point during their term, and all or some of the work intended to be performed under the contracts will remain unfunded pending subsequent Congressional appropriations and the obligation of additional funds to the contract by the procuring agency. Nevertheless, we estimate our share of the contract values, including values based on the assumed exercise of options relating to these contracts, in calculating the amount of our backlog. Because we may not receive the full amount we expect under a contract, our estimate of our backlog may be inaccurate and we may generate results that differ materially and adversely from those anticipated.
Employee misconduct, including security breaches, could result in the loss of clients and our suspension or debarment from contracting with the federal government.
We may be unable to prevent our employees from engaging in misconduct, fraud or other improper activities that could adversely affect our business and reputation. Misconduct could include the failure to comply with federal government procurement regulations, regulations regarding the protection of classified information and legislation regarding the pricing of labor and other costs in government contracts. Many of the systems we develop involve managing and protecting information involved in national security and other sensitive government functions. A security breach in one of these systems could prevent us from having access to such critically sensitive systems. Other examples of employee misconduct could include time card fraud and violations of the Anti-Kickback Act. The precautions we take to prevent and detect this activity may not be effective, and we could face unknown risks or losses. As a result of employee misconduct, we could face fines and penalties, loss of security clearance and suspension or debarment from contracting with the federal government, which could cause our actual results to differ materially and adversely from those anticipated.
Our failure to attract and retain qualified employees, including our senior management team, could adversely affect our business.
Our continued success depends to a substantial degree on our ability to recruit and retain the technically skilled personnel we need to serve our clients effectively. Our business involves the development of tailored solutions for our clients, a process that relies heavily upon the expertise and services of our employees. Accordingly, our employees are our most valuable resource. Competition for skilled personnel in the information technology services industry is intense, and technology service companies often experience high attrition among their skilled employees. There is a shortage of people capable of filling these positions and they are likely to remain a limited resource for the foreseeable future. Recruiting and training these personnel require substantial resources. Our failure to attract and retain technical personnel could increase our costs of performing our contractual obligations, reduce our ability to efficiently satisfy our clients’ needs, limit our ability to win new business and cause our actual results to differ materially and adversely from those anticipated.
In addition to attracting and retaining qualified technical personnel, we believe that our success will depend on the continued employment of our senior management team and its ability to generate new business and
execute projects successfully. Our senior management team is very important to our business because personal reputations and individual business relationships are a critical element of obtaining and maintaining client engagements in our industry, particularly with agencies performing classified operations. The loss of any of our senior executives could cause us to lose client relationships or new business opportunities, which could cause actual results to differ materially and adversely from those anticipated.
Our markets are highly competitive, and many of the companies we compete against have substantially greater resources.
The markets in which we operate include a large number of participants and are highly competitive. Many of our competitors may compete more effectively than we can because they are larger, better financed and better known companies than we are. In order to stay competitive in our industry, we must also keep pace with changing technologies and client preferences. If we are unable to differentiate our services from those of our competitors, our revenue may decline. In addition, our competitors have established relationships among themselves or with third parties to increase their ability to address client needs. As a result, new competitors or alliances among competitors may emerge and compete more effectively than we can. There is also a significant industry trend towards consolidation, which may result in the emergence of companies which are better able to compete against us. The results of these competitive pressures could cause our actual results to differ materially and adversely from those anticipated.
Our quarterly revenue and operating results could be volatile due to the unpredictability of the federal government’s budgeting process and policy priorities.
Our quarterly revenue and operating results may fluctuate significantly and unpredictably in the future. In particular, if the federal government does not adopt, or delays adoption of, a budget for each fiscal year beginning on October 1, or fails to pass a continuing resolution, federal agencies may be forced to suspend our contracts and delay the award of new and follow-on contracts and orders due to a lack of funding. Further, the rate at which the federal government procures technology may be negatively affected following changes in presidential administrations and senior government officials. Therefore, period-to-period comparisons of our operating results may not be a good indication of our future performance.
Our quarterly operating results may not meet the expectations of securities analysts or investors, which in turn may have an adverse effect on the market price of our common stock.
We may lose money or generate less than anticipated profits if we do not accurately estimate the cost of an engagement which is conducted on a fixed-price basis.
We perform a portion of our engagements on a variety of fixed-price contract vehicles. We derived 24.5 percent of our total revenue in FY2011 and 20.6 percent of our total revenue in FY2010 and 19.9 percent of our total revenue in FY2009 from fixed-price contracts. Fixed-price contracts require us to price our contracts by predicting our expenditures in advance. In addition, some of our engagements obligate us to provide ongoing maintenance and other supporting or ancillary services on a fixed-price basis or with limitations on our ability to increase prices. Many of our engagements are also on a T&M basis. While these types of contracts are generally subject to less uncertainty than fixed-price contracts, to the extent that our actual labor costs are higher than the contract rates, our actual results could differ materially and adversely from those anticipated.
When making proposals for engagements on a fixed-price basis, we rely on our estimates of costs and timing for completing the projects. These estimates reflect our best judgment regarding our capability to complete the task efficiently. Any increased or unexpected costs or unanticipated delays in connection with the performance of fixed-price contracts, including delays caused by factors outside our control, could make these contracts less profitable or unprofitable. From time to time, unexpected costs and unanticipated delays have caused us to incur losses on fixed-price contracts, primarily in connection with state government clients. On rare occasions, these losses have been significant. In the event that we encounter such problems in the future, our actual results could differ materially and adversely from those anticipated.
Our earnings and margins may vary based on the mix of our contracts and programs.
At June 30, 2010,2011, our backlog included cost reimbursable, T&M and fixed-price contracts. Cost reimbursable and T&M contracts generally have lower profit margins than fixed-price contracts. Our earnings and margins may vary materially and adversely depending on the types of long-term government contracts undertaken, the costs incurred in their performance, the achievement of other performance objectives and the stage of performance at which the right to receive fees, particularly under incentive and award fee contracts, is finally determined.
Systems failures may disrupt our business and have an adverse effect on our results of operations.
Any systems failures, including network, software or hardware failures, whether caused by us, a third party service provider, unauthorized intruders and hackers, computer viruses, natural disasters, power shortages or terrorist attacks, could cause loss of data or interruptions or delays in our business or that of our clients. In addition, the failure or disruption of our mail, communications or utilities could cause us to interrupt or suspend our operations or otherwise harm our business. Our property and business interruption insurance may be inadequate to compensate us for all losses that may occur as a result of any system or operational failure or disruption and, as a result, our actual results could differ materially and adversely from those anticipated.
The systems and networks that we maintain for our clients, although highly redundant in their design, could also fail. If a system or network we maintain were to fail or experience service interruptions, we might experience loss of revenue or face claims for damages or contract termination. Our errors and omissions liability insurance may be inadequate to compensate us for all the damages that we might incur and, as a result, our actual results could differ materially and adversely from those anticipated.
We may have difficulty identifying and executing acquisitions on favorable terms and therefore may grow at slower than anticipated rates.
One of our key growth strategies has been to selectively pursue acquisitions. Through acquisitions, we have expanded our base of federal government clients, increased the range of solutions we offer to our clients and deepened our penetration of existing markets and clients. We may encounter difficulty identifying and executing suitable acquisitions. To the extent that management is involved in identifying acquisition opportunities or integrating new acquisitions into our business, our management may be diverted from operating our core business. Without acquisitions, we may not grow as rapidly as the market expects, which could cause our actual results to differ materially and adversely from those anticipated. We may encounter other risks in executing our acquisition strategy, including:
increased competition for acquisitions may increase the costs of our acquisitions;
our failure to discover material liabilities during the due diligence process, including the failure of prior owners of any acquired businesses or their employees to comply with applicable laws or regulations, such as the Federal Acquisition Regulation and health, safety and environmental laws, or their failure to fulfill their contractual obligations to the federal government or other customers; and
acquisition financing may not be available on reasonable terms or at all.
Each of these types of risks could cause our actual results to differ materially and adversely from those anticipated.
We may have difficulty integrating the operations of any companies we acquire, which could cause actual results to differ materially and adversely from those anticipated.
The success of our acquisition strategy will depend upon our ability to continue to successfully integrate any businesses we may acquire in the future. The integration of these businesses into our operations may result in unforeseen operating difficulties, absorb significant management attention and require significant financial
resources that would otherwise be available for the ongoing development of our business. These integration difficulties include the integration of personnel with disparate business backgrounds, the transition to new information systems, coordination of geographically dispersed organizations, loss of key employees of acquired companies, and reconciliation of different corporate cultures. For these or other reasons, we may be unable to retain key clients of acquired companies. Moreover, any acquired business may fail to generate the revenue or net income we expected or produce the efficiencies or cost-savings we anticipated. Any of these outcomes could cause our actual results to differ materially and adversely from those anticipated.
Changes in the estimated fair value of contingent consideration associated with our acquisitions could materially impact our results of operations.
We made judgments in determining the acquisition-date assumptions used in estimating the fair value of the contingent consideration associated with the acquisitions we made during our fiscal year ended June 30, 2010 and similar judgments are made as we revalue their fair value each reporting period. Our future operating results could be materially impacted if actual earnings before interest, taxes, depreciation and amortization of the acquired businesses vary from our estimates.
If our subcontractors fail to perform their contractual obligations, our performance as a prime contractor and our ability to obtain future business could be materially and adversely impacted and our actual results could differ materially and adversely from those anticipated.
Our performance of government contracts may involve the issuance of subcontracts to other companies upon which we rely to perform all or a portion of the work we are obligated to deliver to our clients. A failure by one or more of our subcontractors to satisfactorily deliver on a timely basis the agreed-upon supplies, perform the agreed-upon services, or appropriately manage their vendors may materially and adversely impact our ability to perform our obligations as a prime contractor.
A subcontractor’s performance deficiency could result in the government terminating our contract for default. A default termination could expose us to liability for excess costs of reprocurement by the government and have a material adverse effect on our ability to compete for future contracts and task orders. Depending upon the level of problem experienced, such problems with subcontractors could cause our actual results to differ materially and adversely from those anticipated.
The federal government’s appropriation process and other factors may delay the collection of our receivables, and our business may be adversely affected if we cannot collect our receivables in a timely manner.
We depend on the collection of our receivables to generate cash flow, provide working capital, pay debt and continue our business operations. If the federal government, any of our other clients or any prime contractor for whom we are a subcontractor fails to pay or delays the payment of their outstanding invoices for any reason, our business and financial condition may be materially and adversely affected. The government may fail to pay outstanding invoices for a number of reasons, including lack of appropriated funds or lack of an approved budget. In addition, the DCAA may revoke our direct billing privileges, which would adversely affect our ability to collect our receivables in a timely manner. Contracting officers have the authority to impose contractual withholdings, which can also adversely affect our ability to collect timely. Currently, proposed regulatory changesA new Defense Federal Acquisition Regulations interim rule became effective May 18, 2011, applying to solicitations issued on or after that would requiredate, requiring DoD contracting officers to impose contractual withholdings at no less than certain minimum levels based upon assessmentsif a contracting officer determines that one or more of a contractor’s business systems are in the public comment review process.have one or more significant deficiencies. Some prime contractors for whom we are a subcontractor have significantly less financial resources than we do, which may increase the risk that we may not be paid in full or payment may be delayed. If we experience difficulties collecting receivables, it could cause our actual results to differ materially and adversely from those anticipated.
We have substantial investments in recorded goodwill as a result of prior acquisitions, and changes in future business conditions could cause these investments to become impaired, requiring substantial write-downs that would reduce our operating income.
Goodwill accounts for $1.2$1.3 billion of our recorded total assets. We evaluate the recoverability of recorded goodwill amounts annually, or when evidence of potential impairment exists. The annual impairment test is based on several factors requiring judgment. Principally, a decrease in expected reporting unit cash flows or changes in market conditions may indicate potential impairment of recorded goodwill. If there is an impairment, we would be required to write down the recorded amount of goodwill, which would be reflected as a charge against operating income.
Our operations involve several risks and hazards, including potential dangers to our employees and to third parties that are inherent in aspects of our federal business (i.e., counterterrorism training services). If these risks and hazards are not adequately insured, it could adversely affect our operating results.
Our federal business includes the maintenance of global networks and the provision of special operations services (i.e., counterterrorism training) that require us to dispatch employees to various countries around the world. These countries may be experiencing political upheaval or unrest, and in some cases war or terrorism. It is possible that certain of our employees or executives will suffer injury or bodily harm, or be killed or kidnapped
in the course of these deployments. We could also encounter unexpected costs for reasons beyond our control in connection with the repatriation of our employees or executives. Any of these types of accidents or other incidents could involve significant potential claims of employees, executives and/or third parties who are injured or killed or who may have wrongful death or similar claims against us.
We maintain insurance policies that mitigate against risk and potential liabilities related to our operations. This insurance is maintained in amounts that we believe are reasonable. However, our insurance coverage may not be adequate to cover those claims or liabilities, and we may be forced to bear significant costs from an accident or incident. Substantial claims in excess of our related insurance coverage could cause our actual results to differ materially and adversely from those anticipated.
Our failure to adequately protect our confidential information and proprietary rights may harm our competitive position.
Our success depends, in part, upon our ability to protect our proprietary information and other intellectual property. Although our employees are subject to confidentiality obligations, this protection may be inadequate to deter misappropriation of our confidential information. In addition, we may be unable to detect unauthorized use of our intellectual property in order to take appropriate steps to enforce our rights. If we are unable to prevent third parties from infringing or misappropriating our copyrights, trademarks or other proprietary information, our competitive position could be harmed and our actual results could differ materially and adversely from those anticipated.
We face additional risks which could harm our business because we have international operations.
We conduct the majority of our international operations in the United Kingdom. Our U.K.-based operations comprised 3.3 percent of our revenue in FY2011 and 3.7 percent of our revenue in FY2010 and 2.9 percent of our revenue in FY2009.FY2010. Our U.K.-based operations are subject to risks associated with operating in a foreign country. These risks include fluctuations in the value of the British pound and the Euro, longer payment cycles, changes in foreign tax laws and regulations and unexpected legislative, regulatory, economic or political changes.
Our U.K.-based operations are also subject to risks associated with operating a commercial as opposed to a government contracting business, including the effects of general economic conditions in the United Kingdom on the telecommunications, computer software and computer services sectors and the impact of more concentrated and intense competition for the reduced volume of work available in those sectors. We are marketing our services
to clients in industries that are new to us and our efforts in that regard may be unsuccessful. Other factors that may adversely affect our international operations are difficulties relating to managing our business internationally, integrating recent acquisitions, multiple tax structures and adverse changes in foreign exchange rates. Any of these factors could cause our actual results to differ materially and adversely from those anticipated.
Our business could be adversely affected by the outcome of the various investigations/proceedings regarding our interrogation services work in Iraq.
In May 2004, press accounts disclosed an internal U.S. government report, the Taguba Report, which, among other things, alleged that one of our employees was involved in the alleged mistreatment of Iraqi prisoners at the Abu Ghraib facility. Another government report, the Jones/Fay Report, alleged that three of our employees, including the employee identified in the Taguba Report, acted improperly in performing their assigned duties in Iraq. The Jones/Fay Report included a recommendation that the information in the report regarding these employees be forwarded to the General Counsel of the U.S. Army for determination of whether each of them should be referred to the U.S. Department of Justice for prosecution and to the contracting officer for appropriate contractual action. Our investigation into these matters has not to date confirmed the allegations of abuse contained in either the Taguba Report or the Jones/Fay Report. To date, no charges have been brought by the government against us or any of our employees in connection with the Abu Ghraib allegations.
The results of the investigations and proceedings regarding our interrogation services in Iraq could affect our relationships with our clients and could cause our actual results to differ materially and adversely from those anticipated.
Our senior secured credit facility (the Credit Facility) imposes certain restrictions on our ability to take certain actions which may have an impact on our business, operating results and financial conditions.
The Credit Facility imposes certain operating and financial restrictions on us and requires us to meet certain financial tests. These restrictions may significantly limit or prohibit us from engaging in certain transactions, including the following:
incurring or guaranteeing certain amounts of additional debt;
paying dividends or other distributions to our stockholders or redeeming, repurchasing or retiring our capital stock in excess of specific limits;
making certain investments, loans and advances;
making capital expenditures above specified levels;
exceeding specific levels of liens on our assets;
issuing or selling equity in our subsidiaries;
transforming or selling certain assets currently held by us, including certain sale and lease-back transactions;
amending or modifying certain agreements, including those related to indebtedness; and
engaging in certain mergers, consolidations or acquisitions.
The failure to comply with any of these covenants would cause a default under the Credit Facility. A default, if not waived, could cause our debt to become immediately due and payable. In such situations, we may not be able to repay our debt or borrow sufficient funds to refinance it, and even if new financing is available, it may not contain terms that are acceptable to us.
Despite our substantialoutstanding debt, we may incur additional indebtedness.
The Credit Facility consists of a $240.0$600.0 million revolving credit facility (currently undrawn) and a $350.0$150.0 million term loan facility. In addition, we have $300.0 million outstanding under our convertible senior subordinated notes due 2014 (the Notes). We are able to incur additional debt in the future by drawing down on the unused portion of the revolving credit facility and have flexibility under the Credit Facility to increase the term loan facility or the revolving credit facility in an aggregate amount up to $450.0 million.$200.0 million with applicable lender approvals. In addition, the terms of the Credit Facility allow us to incur additional indebtedness from other sources so long as we satisfy the covenants in the agreement governing the Credit Facility. If new debt is added to our current debt levels, the risks related to our ability to service that debt could increase.
Servicing our debt requires a significant amount of cash, and we may not have sufficient cash flow from our business to pay our substantial debt.
OurInterest payments on the Notes are due each May and November and the outstanding principal amount comes due in May 2014. The Credit Facility expires in May 2011. Prior toOctober 2015. Principal payments under the expiration of the Credit Facility, we intend to establish a new multi-year term loan and revolving credit agreement.facility are due in quarterly installments. Our ability to refinance our indebtedness will depend on the capital markets and our financial condition at such time. Subsequently, our business may not generate cash flow from operations sufficient to service our debt and make necessary capital expenditures. If we are unable to generate such cash flow, we may be required to adopt one or more alternatives, such as selling assets, restructuring debt or obtaining additional equity capital on terms that may be onerous or highly dilutive.
A change in control or fundamental change may adversely affect us.
The Credit Facility provides that certain change in control events with respect to us will constitute a default. ACertain fundamental change,changes, as defined under the Notes, will constitute a change of control under the Credit Facility, and therefore will constitute a default under such facility. If investors in the Notes exercise the repurchase right due to a fundamental change, it may cause a default under the Credit Facility, even if the fundamental change itself does not cause a default on the Credit Facility, due to the financial effect of such a repurchase on us. Furthermore, the fundamental change provisions, including the provisions requiring the increase to the conversion rate for conversions under the Notes in connection with certain fundamental changes, may in certain circumstances make more difficult or discourage a takeover of our company and the removal of incumbent management.
The conditional conversion features of the Notes, if triggered, may adversely affect our financial condition and operating results.
In the event the conditional conversion features of the Notes are triggered, holders of the Notes will be entitled to convert the Notes at any time during specified periods at their option. If one or more holders elect to convert their notes, we would be required to settle any converted principal through the payment of cash, which could adversely affect our liquidity. In addition, even if holders do not elect to convert their notes, we could be required under applicable accounting rules to reclassify all or a portion of the outstanding principal of the Notes as a current rather than long-term liability, which would result in a material reduction of our net working capital. As of June 30, 2010,2011, we had $240.0$600.0 million available under our revolving credit facility, which we could use to satisfy payment obligations arising from conversions of the Notes. However, there can be no assurance that all or any portion of this facility will be available at the time any such conversion obligations arise. Our failure to pay the required cash upon conversion as required under the Notes would constitute an event of default which, if not waived, would result in the immediate acceleration of our payment obligations under all of the Notes. Any such default would also result in an event of default under the Credit Facility. In such a situation, we may not be able to repay our debt or borrow sufficient funds to refinance it, and, even if new financing is available, it may be available on terms less favorable than the terms of our existing debt and, potentially, on terms that are unacceptable to us. A material deterioration in our financial condition or operating results could inhibit our access to additional investment capital and may cause the price of our common stock to decline.
Item 1B. Unresolved Staff Comments
None.
As of June 30, 2010,2011, we leased office space at 125128 U.S. locations containing an aggregate of approximately 2.32.4 million square feet located in 2729 states and the District of Columbia. In four countries outside the U.S., we leased office space at 1513 locations containing an aggregate of approximately 73,000118,000 square feet. Our leases expire primarily within the next five years, with the exception of five leases in Northern Virginia and fourseven leases outside of Northern Virginia, which will expire within the next six to 12 years. We anticipate that most of these leases will be renewed or replaced by other leases. All of our offices are in reasonably modern and well-maintained buildings. The facilities are substantially utilized and adequate for present operations.
We maintain our corporate headquarters in approximately 118,000117,000 square feet of space at 1100 North Glebe Road, Arlington, Virginia. See Note 15,14, Leases, in the Notes to Consolidated Financial Statements contained in this Annual Report on Form 10-K for additional information regarding our lease commitments.
Saleh, et al. v. Titan Corp., et al.
Plaintiffs filed a twenty-six count class-action complaint on June 9, 2004, originally on behalf of seven named Plaintiffs and a class of similarly situated Plaintiffs, against a number of corporate Defendants and individual corporate employees. The complaint, originally filed in the United States District Court for the Southern District of California, named CACI International Inc, CACI, INC.-FEDERAL, and CACI N.V. as Defendants, along with Titan Corporation. The complaint also named CACI Premier Technology, Inc. employee Stephen A. Stefanowicz as a Defendant.
Plaintiffs alleged, inter alia, that Defendants formed a conspiracy to increase demand for interrogation services in Iraq and violated U.S. domestic and international law. Plaintiffs seek, inter alia, declaratory relief, a permanent injunction against contracting with the government, compensatory damages, treble damages and attorney’s fees.
Plaintiffs subsequently amended their complaint several times and the action was ultimately transferred to the United States District Court for the District of Columbia. In March 2006, Plaintiffs filed a third amended complaint adding several new counts, adding CACI Premier Technology, Inc. as a Defendant, dropping CACI, N.V. as a Defendant, and adding two former CACI Premier Technology employees, Timothy Dugan and Daniel Johnson, as Defendants. On June 29, 2006, the Court entered an Order granting the Defendants’ motions to dismiss with respect to numerous claims, and granting the motions of the three individual Defendants to dismiss for lack of personal jurisdiction. Finally, the Court consolidated theSaleh andIbrahim (noted below) actions for discovery purposes only.
On August 4, 2006, the CACI Defendants filed a summary judgment motion. On November 6, 2007, the Court issued its order denying CACI’s motion for summary judgment. On December 6, 2007, the Court denied Plaintiffs’ motion to have the action proceed as a class action. On December 17, 2007, the Court certified its November 6, 2007 Memorandum Order denying CACI’s motion for summary judgment for interlocutory appeal. On January 2, 2008, CACI filed a petition with the United States Court of Appeals for the District of Columbia Circuit asking for acceptance of an interlocutory appeal of the Court’s November 6, 2007 Memorandum Order. On January 4, 2008, CACI filed a Notice of Appeal to the United States Court of Appeals for the District of Columbia Circuit from the Court’s November 6, 2007 Memorandum Order.
On December 17, 2007, Plaintiffs filed a fourth amended complaint. On January 4, 2008, CACI filed a motion to dismiss the fourth amended complaint.
On December 21, 2007, the Court granted Titan’s motion for entry of a final judgment of the November 6, 2007 Memorandum Order as to Titan, and on January 17, 2008, Plaintiffs filed a Notice of Appeal to the United States Court of Appeals for the District of Columbia Circuit from that final judgment in favor of Titan.
CACI filed a motion with the United States Court of Appeals for the District of Columbia Circuit to pursue an interlocutory appeal of the decision denying its summary judgment motion. In February 2008, the United States District Court for the District of Columbia granted CACI’s motion to have all trial court proceedings adjourned until all appeals in the action are resolved. On March 17, 2008, the United States Court of Appeals for the District of Columbia Circuit granted CACI’s request for an interlocutory appeal.
On July 28, 2008, CACI submitted its brief to the United States Court of Appeals for the District of Columbia Circuit regarding its interlocutory appeal of the decision denying its summary judgment motion. On October 17, 2008, CACI filed its brief in support of its intervention in Plaintiffs’ appeal of the November 2007 decision by the United States District Court for the District of Columbia granting Titan’s summary judgment. On February 10, 2009, a three judge panel of the United States Court of Appeals for the District of Columbia Circuit held a hearing on both appeals and took the matters under advisement.
On September 11, 2009, the United States Court of Appeals for the District of Columbia Circuit reversed the decision of the United States District Court for the District of Columbia with respect to CACI and dismissed the remaining claims against CACI. On January 25, 2010, the United States District Court for the District of Columbia Circuit denied Plaintiffs’ petition for a rehearingen banc. On April 26, 2010, Plaintiffs filed a petition for a writ of certiorari in the United States Supreme Court to review the September 11, 2009 decision of the Court of Appeals. On June 28, 2010, CACI filed its brief in opposition to the certiorari petition. On October 4, 2010, the Supreme Court of the United States invited the United States Solicitor General to file a brief expressing the views of the United States on Plaintiffs’ petition for certiorari. The Solicitor General subsequently filed a brief recommending that the Supreme Court decline to review the September 11, 2009 Court of Appeals decision. On June 27, 2011, the United States Supreme Court issued an Order denying Plaintiffs’ petition for a writ of certiorari. On August 12, 2011, CACI filed a motion in the district court to implement the mandate of the Court of Appeals and for entry of final judgment with respect to all Plaintiffs named in the Fourth Amended Complaint. That petition ismotion remains pending.
Ibrahim, et al. v. Titan Corp. et al.
Plaintiffs filed a nine-count complaint on July 27, 2004 in the United States District Court for the District of Columbia. Plaintiffs are five Iraqis who claim they suffered significant physical injury, emotional distress, and/or wrongful death while they or their family members were held at Abu Ghraib prison in Iraq. The lawsuit names CACI International Inc, CACI, INC.-FEDERAL, and CACI N.V. as Defendants, along with Titan Corporation.
On August 12, 2005, the United States District Court for the District of Columbia issued a Memorandum Opinion dismissing many of the claims. Subsequently, CACI Premier Technology, Inc. was substituted as a Defendant in lieu of CACI International Inc, CACI, INC.-FEDERAL and CACI N.V.
In December 2005, CACI filed a motion for summary judgment. On November 6, 2007, the Court issued its order, denying CACI’s motion for summary judgment. On December 17, 2007, the Court certified its November 6, 2007 Memorandum Order denying CACI’s motion for summary judgment for interlocutory appeal. On January 2, 2008, CACI filed a petition with the United States Court of Appeals for the District of Columbia Circuit asking for acceptance of an interlocutory appeal of the Court’s November 6, 2007 Memorandum Order. On January 4, 2008, CACI filed a Notice of Appeal to the United States Court of Appeals for the District of Columbia Circuit from the Court’s November 6, 2007 Memorandum Order.
On December 21, 2007, the Court granted Titan’s motion for entry of a final judgment of the November 6, 2007 Memorandum Order as to Titan, and on January 17, 2008, Plaintiffs filed a Notice of Appeal to the United States Court of Appeals for the District of Columbia Circuit from the November 6, 2007 Memorandum Order.
On December 17, 2007, Plaintiffs filed a third amended complaint. On January 4, 2008, CACI filed a motion to dismiss the third amended complaint. On January 29, 2008, the Court granted Plaintiffs’ motion to adjourn the deadline for responding to the motion to dismiss until thirty days after final disposition of the pending appeals.
CACI filed a motion with the United States Court of Appeals for the District of Columbia Circuit to pursue an interlocutory appeal of the decision denying its summary judgment motion. On March 17, 2008, the United States Court of Appeals for the District of Columbia Circuit granted CACI’s request for an interlocutory appeal.
On July 28, 2008, CACI submitted its brief to the United States Court of Appeals for the District of Columbia Circuit regarding its interlocutory appeal of the decision denying its summary judgment motion. On October 17, 2008, CACI filed its brief in support of its intervention in Plaintiffs’ appeal of the November 2007 decision by the United States District Court for the District of Columbia granting Titan’s summary judgment. On February 10, 2009, a three judge panel of the United States Court of Appeals for the District of Columbia Circuit held a hearing on both appeals and took the matters under advisement.
On September 11, 2009, the United States Court of Appeals for the District of Columbia Circuit reversed the decision of the United States District Court for the District of Columbia with respect to CACI and dismissed the remaining claims against CACI. On January 25, 2010, the United States District Court for the District of Columbia Circuit denied Plaintiffs’ petition for a rehearingen banc. On April 26, 2010, Plaintiffs filed a petition for a writ of certiorari in the United States Supreme Court to review the September 11, 2009 decision of the Court of Appeals. On June 28, 2010, CACI filed its brief in opposition to the certiorari petition. ThatOn October 4, 2010, the Supreme Court of the United States invited the United States Solicitor General to file a brief expressing the views of the United States on Plaintiffs’ petition is pending.for certiorari. The Solicitor General subsequently filed a brief recommending that the Supreme Court decline to review the September 11, 2009 Court of Appeals decision. On June 27, 2011, the United States Supreme Court issued an Order denying Plaintiffs’ petition for a writ of certiorari. On August 12, 2011, CACI filed a motion in the district court to implement the mandate of the Court of Appeals and for entry of final judgment with respect to all Plaintiffs named in the Third Amended Complaint. On August 17, 2011, the district court granted CACI’s motion to dismiss the Third Amended Complaint with prejudice and directed the clerk to enter final judgment in favor of CACI. On August 19, 2011, the Clerk of the District Court entered final judgment in favor of CACI.
Al Shimari, et al. v. L-3 Services, Inc. et al.
On June 30, 2008, Plaintiff Al Shimari filed a twenty-count complaint in the United States District Court for the Southern District of Ohio. Plaintiff Al Shimari is an Iraqi who claims that he suffered significant physical injury and emotional distress while held at Abu Ghraib prison in Iraq. The lawsuit names CACI International Inc, CACI Premier Technology, Inc. and former CACI employee Timothy Dugan as Defendants, along with L-3 Services, Inc. The complaint alleges that the Defendants conspired with U.S. military personnel to engage in illegal treatment of Iraqi detainees. The complaint does not allege any interaction between Plaintiff Al Shimari and any CACI employee. Plaintiff Al Shimari seeks, inter alia, compensatory damages, punitive damages, and attorney’s fees. On August 8, 2008, the court granted CACI’s motion to transfer the action to the United States District Court for the Eastern District of Virginia. Thereafter, an amended complaint was filed adding three plaintiffs. On September 12, 2008, Mr. Dugan was dismissed from the case without prejudice. On October 2, 2008, CACI filed a motion to dismiss the case. CACI also moved to stay discovery pending further proceedings. The court granted CACI’s motion to stay discovery. On March 18, 2009, the court granted in part and denied in part CACI’s motion to dismiss. On March 23, 2009, CACI filed a notice of appeal with respect to the March 18, 2009 decision. Plaintiffs filed a motion to strike CACI’s notice of appeal and a motion to lift the stay on discovery. The United States District Court for the Eastern District of Virginia denied both motions. On April 27, 2009, Plaintiffs filed a motion to dismiss the appeal in the United States Court of Appeals for the Fourth Circuit. The United States Court of Appeals for the Fourth Circuit deferred any ruling on Plaintiffs’ motion and issued a briefing schedule. Plaintiffs filed a notice of cross-appeal, which CACI moved to dismiss. The Court of Appeals dismissed the Plaintiffs’ cross-appeal. On October 26, 2010, the United States Court of Appeals for the Fourth Circuit heard oral argument in the appeal and took the matter under advisement. The parties have completed their briefingCourt of Appeals determined to hold the matter in abeyance pending a decision by the U.S. Supreme Court on Plaintiffs’ certiorari petitions in theSaleh and are awaiting a schedule for oral argument.Ibrahim actions.
Abbas, et al. v. L-3 Services, Inc. et al.
In February 2009, Plaintiffs filed a complaint in the United States District Court for the District of Columbia. Plaintiffs are fifty-five Iraqi citizens who claim that they suffered significant physical injury, emotional distress, and/or wrongful death while being held as detainees at Abu Ghraib prison and elsewhere in Iraq. The lawsuit names CACI Premier Technology, Inc. and L-3 Services, Inc. as Defendants. Plaintiffs seek, inter alia, compensatory damages, punitive damages, and costs.
On April 9, 2009, the United States District Court for the District of Columbia granted a joint motion of the parties to stay the case pending resolution of the appeals in theSaleh andIbrahim cases described above. The case remains stayed pending final resolution of theSaleh andIbrahim cases.
We are vigorously defending the above-described legal proceedings, and, based on our present knowledge of the facts, believe the lawsuits are completely without merit.
PART II
Item 5. Market for the Registrant’s Common Equity, Related Stockholder Matters and Issuer Purchases of Equity Securities
Our common stock is listed on the New York Stock Exchange under the ticker symbol “CACI”.
The ranges of high and low sales prices of our common stock quoted on the New York Stock Exchange for each quarter during the fiscal years ended June 30, 20102011 and 20092010 were as follows:
| 2010 | 2009 | 2011 | 2010 | |||||||||||||||||||||||||
Quarter | High | Low | High | Low | High | Low | High | Low | ||||||||||||||||||||
1st | $ | 48.85 | $ | 42.00 | $ | 52.00 | $ | 41.84 | $ | 48.70 | $ | 40.00 | $ | 48.85 | $ | 42.00 | ||||||||||||
2nd | $ | 49.92 | $ | 44.65 | $ | 51.97 | $ | 36.02 | $ | 54.11 | $ | 43.61 | $ | 49.92 | $ | 44.65 | ||||||||||||
3rd | $ | 52.92 | $ | 45.36 | $ | 47.68 | $ | 33.96 | $ | 62.75 | $ | 50.91 | $ | 52.92 | $ | 45.36 | ||||||||||||
4th | $ | 51.93 | $ | 41.44 | $ | 42.84 | $ | 33.90 | $ | 64.40 | $ | 58.15 | $ | 51.93 | $ | 41.44 | ||||||||||||
We have never paid a cash dividend. Our present policy is to retain earnings to provide funds for the operation and expansion of our business. We do not intend to pay any cash dividends at this time. The Board of Directors will determine whether to pay dividends in the future based on conditions then existing, including our earnings, financial condition and capital requirements, as well as economic and other conditions as the board may deem relevant. In addition, our ability to declare and pay dividends on our common stock is restricted by the provisions of Delaware law and covenants in the Credit Facility.
In June 2010, our Board of Directors authorized the repurchase of up to one million shares of CACI stock where the total expenditure for the purchase of the shares under this repurchase program does not exceed $50.0 million.
As of August 24, 2010,2011, the number of stockholders of record of our common stock was approximately 355.332. The number of stockholders of record is not representative of the number of beneficial stockholders due to the fact that many shares are held by depositories, brokers, or nominees.
We administer an employee stock purchase plan (ESPP) under which eligible employees may purchaseThe following table provides certain information with respect to our purchases of shares of CACI International Inc’s common stock at a discount as provided by the plan. To provide the shares purchased under the plan, we can repurchase outstanding shares on the open market, issue shares previously acquired and held in treasury or issue authorized but unissued shares. Repurchased shares are acquired on a quarterly basis, generally within two weeks of the end of each quarter, and are distributed within three days thereafter to employees purchasing shares. Set forth below are equity securities purchased during the three months ended June 30, 2010 in order to satisfy our obligations under the ESPP:stock:
Period | Total Number of Shares Purchased | Average Price Paid Per Share | Total Number of Shares Purchased As Part of Publicly Announced Programs | Maximum Number of Shares that May Yet Be Purchased Under the Plans or Programs | |||||
April 2010 | 18,090 | $ | 48.96 | 716,859 | 283,141 | ||||
May 2010 | — | — | — | — | |||||
June 2010 | — | — | — | — | |||||
Total | 18,090 | $ | 48.96 | 716,859 | 283,141 | ||||
Period | Total Number of Shares Purchased(1)(2) | Average Price Paid Per Share | Total Number of Shares Purchased As Part of Publicly Announced Programs(2) | Maximum Number of Shares that May Yet Be Purchased Under the Plans or Programs(3) | ||||||||||||
April 2011 | 111,100 | $ | 59.37 | 95,965 | — | |||||||||||
May 2011 | — | — | — | 2,500,000 | ||||||||||||
June 2011 | — | — | — | 2,500,000 | ||||||||||||
|
|
|
|
|
| |||||||||||
Total | 111,100 | $ | 59.37 | 95,965 | ||||||||||||
|
|
|
|
|
| |||||||||||
| (1) | 15,135 shares at $60.30 per share were purchased in April 2011 to satisfy our obligations under the 2002 Employee Stock Purchase Plan (ESPP). The ESPP was adopted by the Company in 2002. There are 1.0 million shares authorized for grant under the ESPP. Through June 30, 2011, we have purchased a total of 0.8 million shares under the ESPP and there are 0.2 million shares available for purchase by our employees through payroll withholding. |
| (2) | In June 2010, our Board of Directors authorized a stock repurchase program under which we could repurchase up to 1.0 million shares of our common stock, where the total expenditure for the purchase of the shares under this repurchase program did not exceed $50.0 million. The repurchase program was announced on June 29, 2010. 95,965 shares at an average price of $59.22 per share were purchased in April 2011. As of April 25, 2011, we completed the acquisition of shares under this program. |
| (3) | In May 2011, our Board of Directors authorized a stock repurchase program under which we could repurchase up to 2.5 million shares of our common stock, where the total expenditure for the purchase of shares under this repurchase program did not exceed $175.0 million. This repurchase program was |
announced on May 2, 2011. As of June 30, 2011, we had not purchased any shares under this program. Subsequent to our year end, the Board of Directors replaced the May 2011 authorization by an authorization to repurchase up to 4.0 million shares of our common stock. See Note 26 in the Notes to Consolidated Financial Statements contained in our annual report on Form 10-K for additional information. |
The following graph compares the cumulative 5-year total return to shareholders on CACI International Inc’s common stock relative to the cumulative total returns of the Russell 1000 index and the Dow Jones U.S. Computer Services Total Stock Market index. The graph assumes that the value of the investment in our common stock and in each of the indexes (including reinvestment of dividends) was $100 on June 30, 20052006 and tracks it through June 30, 2010.2011.
Performance Graph for
CACI International Inc
| June 30, | ||||||||||||
| 2005 | 2006 | 2007 | 2008 | 2009 | 2010 | |||||||
CACI International Inc | 100.00 | 92.34 | 77.34 | 72.46 | 67.62 | 67.25 | ||||||
Russell 1000 | 100.00 | 109.08 | 131.37 | 115.12 | 84.19 | 97.01 | ||||||
Dow Jones U.S. Computer Services Total Stock Market | 100.00 | 107.90 | 144.22 | 153.42 | 134.40 | 165.09 | ||||||
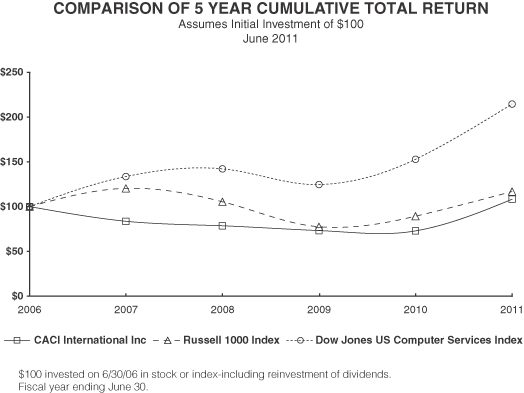
| June 30, | ||||||||||||||||||||||||
| 2006 | 2007 | 2008 | 2009 | 2010 | 2011 | |||||||||||||||||||
CACI International Inc | 100.00 | 83.75 | 78.47 | 73.23 | 72.83 | 108.15 | ||||||||||||||||||
Russell 1000 | 100.00 | 120.43 | 105.54 | 77.37 | 89.16 | 116.96 | ||||||||||||||||||
Dow Jones U.S. Computer Services Total Stock Market | 100.00 | 133.67 | 142.20 | 124.56 | 153.00 | 214.47 | ||||||||||||||||||
The stock price performance included in this graph is not necessarily indicative of future stock price performance.
Item 6. Selected Financial Data
The selected financial data set forth below is derived from our audited financial statements for each of the fiscal years in the five year period ended June 30, 2010.2011. This information should be read in conjunction with Management’s Discussion and Analysis of Financial Condition and Results of Operations and our consolidated financial statements and the notes thereto, included in Part II in this Annual Report on Form 10-K.
Income Statement Data
| Year ended June 30, | Year ended June 30, | ||||||||||||||||||||||||||||||||||
| 2010 | 2009 (As Adjusted(1)) | 2008 (As Adjusted(1)) | 2007 (As Adjusted(1)) | 2006 | 2011 | 2010 | 2009 (As Adjusted(1)) | 2008 (As Adjusted(1)) | 2007 (As Adjusted(1)) | ||||||||||||||||||||||||||
| (amounts in thousands, except per share data) | (amounts in thousands, except per share data) | ||||||||||||||||||||||||||||||||||
Revenue | $ | 3,149,131 | $ | 2,730,162 | $ | 2,420,537 | $ | 1,937,972 | $ | 1,755,324 | $ | 3,577,780 | $ | 3,149,131 | $ | 2,730,162 | $ | 2,420,537 | $ | 1,937,972 | |||||||||||||||
Costs of revenue | 2,954,349 | 2,546,048 | 2,257,708 | 1,792,119 | 1,605,044 | 3,326,379 | 2,954,349 | 2,546,048 | 2,257,708 | 1,792,119 | |||||||||||||||||||||||||
Net income attributable to CACI | 106,515 | 89,698 | 77,935 | 77,898 | 84,840 | 144,218 | 106,515 | 89,698 | 77,935 | 77,898 | |||||||||||||||||||||||||
Earnings per common share and common share equivalent: | |||||||||||||||||||||||||||||||||||
Basic: | |||||||||||||||||||||||||||||||||||
Weighted-average shares outstanding | 30,138 | 29,976 | 30,058 | 30,643 | 30,242 | 30,281 | 30,138 | 29,976 | 30,058 | 30,643 | |||||||||||||||||||||||||
Earnings per share | $ | 3.53 | $ | 2.99 | $ | 2.59 | $ | 2.54 | $ | 2.81 | $ | 4.76 | $ | 3.53 | $ | 2.99 | $ | 2.59 | $ | 2.54 | |||||||||||||||
Diluted: | |||||||||||||||||||||||||||||||||||
Weighted-average shares and equivalent shares outstanding | 30,676 | 30,427 | 30,606 | 31,256 | 31,161 | 31,300 | 30,676 | 30,427 | 30,606 | 31,256 | |||||||||||||||||||||||||
Earnings per share | $ | 3.47 | $ | 2.95 | $ | 2.55 | $ | 2.49 | $ | 2.72 | $ | 4.61 | $ | 3.47 | $ | 2.95 | $ | 2.55 | $ | 2.49 | |||||||||||||||
Balance Sheet Data
| Year ended June 30, | Year ended June 30, | ||||||||||||||||||||||||||||||||||
| 2010 | 2009 (As Adjusted(1)) | 2008 (As Adjusted(1)) | 2007 (As Adjusted(1)) | 2006 | 2011 | 2010 | 2009 (As Adjusted(1)) | 2008 (As Adjusted(1)) | 2007 (As Adjusted(1)) | ||||||||||||||||||||||||||
| (amounts in thousands) | (amounts in thousands) | ||||||||||||||||||||||||||||||||||
Total assets | $ | 2,244,766 | $ | 2,006,079 | $ | 1,892,222 | $ | 1,769,134 | $ | 1,368,090 | $ | 2,320,131 | $ | 2,244,766 | $ | 2,006,079 | $ | 1,892,222 | $ | 1,769,134 | |||||||||||||||
Long-term liabilities | 413,188 | 658,567 | 642,886 | 614,171 | 411,366 | 573,294 | 413,188 | 658,567 | 642,886 | 614,171 | |||||||||||||||||||||||||
Working capital | 182,323 | 406,928 | 312,555 | 413,982 | 238,464 | 344,857 | 182,323 | 406,928 | 312,555 | 413,982 | |||||||||||||||||||||||||
Shareholders’ equity | 1,173,155 | 1,029,608 | 959,067 | 859,942 | 745,359 | 1,309,616 | 1,173,155 | 1,029,608 | 959,067 | 859,942 | |||||||||||||||||||||||||
| (1) | Certain amounts as of and for the years ended June 30, 2007 through June 30, 2009 have been adjusted to reflect the retroactive application of new accounting standards. See Note |
Item 7. Management’s Discussion and Analysis of Financial Condition & Results of Operations
The following discussion and analysis of our financial condition and results of operations is provided to enhance the understanding of, and should be read together with, our consolidated financial statements and the notes to those statements that appear elsewhere in this Annual Report on Form 10-K. This discussion contains forward-looking statements that involve risks and uncertainties. Unless otherwise specifically noted, all years refer to our fiscal year which ends on June 30.
Overview
We are a leading provider of professional services and information technology solutions to the U.S. government. We derived 94.894.9 percent of our revenue during the year ended June 30, 20102011 from contracts
with U.S. government agencies, including 77.879.9 percent from DoD customers, and 17.015.0 percent from U.S. federal civilian agency customers including the Department of Homeland Security. We also provide services to state and local governments and commercial customers.
For the year ended June 30, 2010, 85.02011, 87.0 percent of our U.S. government revenue was from contracts where we were the lead, or “prime,” contractor. Our contract base has approximately 600 active contracts and 2,2002,100 active task orders. We have a diverse mix of contract types, with 46.639.8 percent, 32.835.7 percent, and 20.624.5 percent of our revenue for the year ended June 30, 2010,2011, derived from T&M, cost-reimbursable and fixed-price contracts, respectively. We generally do not pursue fixed-price software development contracts that may create financial risk.
Critical Accounting Policies
Critical accounting policies are defined as those that are reflective of significant judgments and uncertainties, and potentially result in materially different results under different assumptions and conditions. Application of these policies is particularly important to the portrayal of our financial condition and results of operations. The following are considered our critical accounting policies:
Revenue Recognition/Contract Accounting
We generate almost all of our revenue from three different types of contractual arrangements: cost-plus-fee contracts, T&M contracts, and fixed-price contracts. Revenue on cost-plus-fee contracts is recognized to the extent of allowable costs incurred plus an estimate of the applicable fees earned. We consider fixed fees under cost-plus-fee contracts to be earned in proportion to the allowable costs incurred in performance of the contract. For cost-plus-fee contracts that include performance based fee incentives, and that are subject to the provisions of Accounting Standards Codification (ASC) Section 605-35,Revenue Recognition—Construction-Type and Production-Type Contracts (ASC 605-35), we recognize the relevant portion of the expected fee to be awarded by the customer at the time such fee can be reasonably estimated, based on factors such as our prior award experience and communications with the customer regarding performance. For such cost-plus-fee contracts subject to the provisions of ASC 605-10-599,605-10-S99,Revenue Recognition—SEC Materials (ASC 605-10-599)605-10-S99), we recognize the relevant portion of the fee upon customer approval. Revenue on T&M contracts is recognized to the extent of billable rates times hours delivered for services provided, to the extent of material cost for products delivered to customers, and to the extent of expenses incurred on behalf of the customers. Shipping and handling fees charged to the customers are recognized as revenue at the time products are delivered to the customers.
We have four basic categories of fixed price contracts: fixed unit price, fixed price-level of effort, fixed price-completion, and fixed price-license. Revenue on fixed unit price contracts, where specified units of output under service arrangements are delivered, is recognized as units are delivered based on the specified price per unit. Revenue on fixed unit price maintenance contracts is recognized ratably over the length of the service period. Revenue for fixed price-level of effort contracts is recognized based upon the number of units of labor actually delivered multiplied by the agreed rate for each unit of labor.
A significant portion of our fixed price-completion contracts involve the design and development of complex client systems. For these contracts that are within the scope of ASC 605-35, revenue is recognized on the percentage of completion method using costs incurred in relation to total estimated costs. For fixed price-completion contracts that are not within the scope of ASC 605-35, revenue is generally recognized ratably over the service period. Our fixed price-license agreements and related services contracts are primarily executed in our international operations. As the agreements to deliver software require significant production, modification or customization of software, revenue is recognized using the contract accounting guidance of ASC 605-35. For
agreements to deliver data under license and related services, revenue is recognized as the data is delivered and services are performed. Except for losses on contracts accounted for under ASC 605-10-599,605-10-S99, provisions for
estimated losses on uncompleted contracts are recorded in the period such losses are determined. Losses on contracts accounted for under ASC 605-10-599605-10-S99 are recognized as the services and materials are provided.
Our contracts may include the provision of more than one of our services. In these situations, revenue recognition includes the proper identification of separate units of accounting and the allocation of revenue across all elements based on relative fair values, with proper consideration given to the guidance provided by other authoritative literature.
Contract accounting requires judgment relative to assessing risks, estimating contract revenue and costs, and making assumptions for schedule and technical issues. Due to the size and nature of many of our contracts, the estimation of total revenue and cost at completion is complicated and subject to many variables. Contract costs include material, labor, subcontracting costs, and other direct costs, as well as an allocation of allowable indirect costs. Assumptions have to be made regarding the length of time to complete the contract because costs also include expected increases in wages and prices for materials. For contract change orders, claims or similar items, we apply judgment in estimating the amounts and assessing the potential for realization. These amounts are only included in contract value when they can be reliably estimated and realization is considered probable. Incentives or penalties related to performance on contracts are considered in estimating sales and profit rates, and are recorded when there is sufficient information for us to assess anticipated performance. Estimates of award fees for certain contracts may also be a factor in estimating revenue and profit rates based on actual and anticipated awards.
Long-term development and production contracts make up a large portion of our business, and therefore the amounts we record in our financial statements using contract accounting methods are material. For our federal contracts, we follow U.S. government procurement and accounting standards in assessing the allowability and the allocability of costs to contracts.
Due to the significance of the judgments and estimation processes, it is likely that materially different amounts could be recorded if we used different assumptions or if the underlying circumstances were to change. We closely monitor compliance with, and the consistent application of, our critical accounting policies related to contract accounting. Business operations personnel conduct periodic contract status and performance reviews. When adjustments in estimated contract revenue or costs are required, any significant changes from prior estimates are included in earnings in the current period. Also, regular and recurring evaluations of contract cost, scheduling and technical matters are performed by management personnel who are independent from the business operations personnel performing work under the contract. Costs incurred and allocated to contracts with the U.S. government are scrutinized for compliance with regulatory standards by our personnel, and are subject to audit by the DCAA.
From time to time, we may proceed with work based on client direction prior to the completion and signing of formal contract documents. We have a formal review process for approving any such work. Revenue associated with such work is recognized only when it can be reliably estimated and realization is probable. We base our estimates on previous experiences with the client, communications with the client regarding funding status, and our knowledge of available funding for the contract or program.
Costs of Revenue
Costs of revenue include all direct contract costs as well as indirect overhead costs and selling, general and administrative expenses that are allowable and allocable to contracts under federal procurement standards. Costs of revenue also include costs and expenses that are unallowable under applicable procurement standards, and thus are not allocable to contracts for billing purposes. Such costs and expenses do not directly generate revenue, but are necessary for business operations.
Allowance For Doubtful Accounts
Management establishes bad debt reserves against certain billed receivables based upon the latest information available to determine whether invoices are ultimately collectible. Whenever judgment is involved in
determining the estimates, there is the potential for bad debt expense and the fair value of accounts receivable to be misstated. Given that we primarily serve the U.S. government and that, in our opinion, we have sufficient controls in place to properly recognize revenue, we believe the risk to be relatively low that a misstatement of accounts receivable would have a material impact on our financial results. Accounts receivable balances are written-off when the balance is deemed uncollectible after exhausting all reasonable means of collection.
Goodwill Valuation
Goodwill represents the excess of costs over the fair value of assets of businesses acquired. Goodwill and intangible assets acquired in a purchase business combination and determined to have an indefinite useful life are not amortized, but instead tested for impairment at least annually or if impairment indicators are present. The evaluation includes comparing the fair value of the relevant reporting unit to the carrying value, including goodwill, of such unit. If the fair value exceeds the carrying value, no impairment loss is recognized. However, if the carrying value of the reporting unit exceeds its fair value, the goodwill of the reporting unit may be impaired. Impairment is measured by comparing the derived fair value of the goodwill to its carrying value. Separately identifiable intangible assets with estimable useful lives are amortized over their respective estimated useful lives to their estimated residual values, and reviewed for impairment if impairment indicators are present.
We have two reporting units—domestic operations and international operations. Our reporting units are the same as our operating segments. Approximately 95 percent of our goodwill is attributable to our domestic operations. We estimate the fair value of our reporting units using both an income approach and a market approach. The valuation process considers our estimates of the future operating performance of each reporting unit. Companies in similar industries are researched and analyzed and we consider the domestic and international economic and financial market conditions, both in general and specific to the industry in which we operate, prevailing as of the valuation date. The income approach utilizes discounted cash flows. We calculate a weighted average cost of capital for each reporting unit in order to estimate the discounted cash flows. We perform our annual testing for impairment of goodwill and other indefinite life intangible assets as of June 30 of each year. The fair value of each of our reporting units as of June 30, 20102011 significantly exceeded its carrying value by more than 50 percent.value.
Stock-Based Compensation
Under our 2006 Stock Incentive Plan, we issue equity instruments on an annual basis to our directors and key employees. These instruments may take the form of, among others, shares of restricted stock, restricted stock units (RSUs), stock settled stock appreciation rights (SSARs) and non-qualified stock options (NQSOs). We also issue equity instruments in the form of RSUs under our Management Stock Purchase Plan and Director Stock Purchase Plan. With
We account for share-based payments to employees, including grants of employee stock awards and purchases under employee stock purchase plans, in accordance with ASC 718,Compensation—Stock Compensation, which requires that share-based payments (to the exceptionextent they are compensatory) be recognized in our consolidated statements of SSARs that were granted in June and July of 2007 to the Company’s Chief Executive Officer; President, U.S. Operations; and Chief Operating Officer, U.S. Operations with a market-based vesting feature,operations based on their fair values. We determine the fair value attributable toof our NQSOs and SSARs and NQSOs is generally computedat the date of grant using option-pricing models such as the Black-Scholes valuation model. SSARs containing market-based vesting features were valued with aor binomial lattice model. We determine the fair value of our market-based and performance-based RSUs at the date of grant using generally accepted valuation techniques and the closing market price of our stock. Stock-based compensation cost is recognized as expense over the requisite service period.
Prior to June 2007, we issued equity instruments to our key employees in the form of NQSOs and either RSUs or restricted stock. Effective in June 2007, we began issuing SSARs instead of NQSOs. RSUs and shares of restricted stock granted through June 2008 vest based on the passage of time and continued services as an employee. For our annual grants made in August 2008 and August 2009, we issued RSUs for which vesting is based on achievement of a performance metric in addition to grantee service (performance-based RSUs). Vesting is initially dependent upon our net after-tax profit (NATP) for a specified fiscal year. The maximum number of performance-based RSUs which will vest is based on the achievement of a certain NATP which has been established by our Board of Directors. No performance-based RSUs will vest if NATP is less than a pre-defined amount. In addition to achievement of a certain level of NATP, vesting is contingent upon the grantee’s service. Once the NATP for the applicable fiscal year is determined, performance-based RSUs vest in annual increments beginning one or two years after the grant date. All performance-based RSUs awarded for a given NATP level and for which service requirements are fulfilled will have fully vested four years after the grant date.
Under the terms of the various equity instrument agreements, vesting of awards may accelerate to varying degrees based on the age of the grantee and the type of equity instrument. Depending on the instrument, vesting may accelerate upon retirement at either age 62 or 65 with the amount of acceleration based on the length of service provided and, for performance-based RSUs, the NATP achieved for the applicable fiscal year.provided.
Results of Operations
The following table sets forth the relative percentages that certain items of expense and earnings bear to revenue.
Consolidated Statements of Operations
Years ended June 30, 2011, 2010, 2009 2008
| 2010 | 2009 (As Adjusted(1)) | 2008 (As Adjusted(1)) | 2010 | 2009 (As Adjusted(1)) | 2008 (As Adjusted(1)) | Year to Year Change | 2011 | 2010 | 2009 (As Adjusted(1)) | 2011 | 2010 | 2009 (As Adjusted(1)) | Year to Year Change | ||||||||||||||||||||||||||||||||||||||||||||||||||||||||||||||
| 2009 to 2010 | 2008 to 2009 | 2010 to 2011 | 2009 to 2010 | ||||||||||||||||||||||||||||||||||||||||||||||||||||||||||||||||||||||||
| Dollars | Percentages | Dollars | Percent | Dollars | Percent | Dollars | Percentages | Dollars | Percent | Dollars | Percent | ||||||||||||||||||||||||||||||||||||||||||||||||||||||||||||||||
| (dollar amounts in thousands) | (dollar amounts in thousands) | ||||||||||||||||||||||||||||||||||||||||||||||||||||||||||||||||||||||||||
Revenue | $ | 3,149,131 | $ | 2,730,162 | $ | 2,420,537 | 100.0 | % | 100.0 | % | 100.0 | % | $ | 418,969 | 15.3 | % | $ | 309,625 | 12.8 | % | $ | 3,577,780 | $ | 3,149,131 | $ | 2,730,162 | 100.0 | % | 100.0 | % | 100.0 | % | $ | 428,649 | 13.6 | % | $ | 418,969 | 15.3 | % | |||||||||||||||||||||||||||||||||||
|
|
|
|
|
|
|
| ||||||||||||||||||||||||||||||||||||||||||||||||||||||||||||||||||||
Costs of revenue | |||||||||||||||||||||||||||||||||||||||||||||||||||||||||||||||||||||||||||
Direct costs | 2,207,574 | 1,871,884 | 1,625,591 | 70.1 | 68.6 | 67.1 | 335,690 | 17.9 | 246,293 | 15.2 | 2,528,660 | 2,207,574 | 1,871,884 | 70.7 | 70.1 | 68.6 | 321,086 | 14.5 | 335,690 | 17.9 | |||||||||||||||||||||||||||||||||||||||||||||||||||||||
Indirect costs and selling expenses | 693,736 | 627,572 | 584,600 | 22.0 | 23.0 | 24.2 | 66,164 | 10.5 | 42,972 | 7.4 | 741,652 | 693,736 | 627,572 | 20.7 | 22.0 | 23.0 | 47,916 |
| 6.9 |
| 66,164 | 10.5 | |||||||||||||||||||||||||||||||||||||||||||||||||||||
Depreciation and amortization | 53,039 | 46,592 | 47,517 | 1.7 | 1.7 | 2.0 | 6,447 | 13.8 | (925 | ) | (1.9 | ) | 56,067 | 53,039 | 46,592 | 1.6 | 1.7 | 1.7 | 3,028 | 5.7 | 6,447 | 13.8 | |||||||||||||||||||||||||||||||||||||||||||||||||||||
|
|
|
|
|
|
|
| ||||||||||||||||||||||||||||||||||||||||||||||||||||||||||||||||||||
Total costs of revenue | 2,954,349 | 2,546,048 | 2,257,708 | 93.8 | 93.3 | 93.3 | 408,301 | 16.0 | 288,340 | 12.8 | 3,326,379 | 2,954,349 | 2,546,048 | 93.0 | 93.8 | 93.3 | 372,030 | 12.6 | 408,301 | 16.0 | |||||||||||||||||||||||||||||||||||||||||||||||||||||||
|
|
|
|
|
|
|
| ||||||||||||||||||||||||||||||||||||||||||||||||||||||||||||||||||||
Income from operations | 194,782 | 184,114 | 162,829 | 6.2 | 6.7 | 6.7 | 10,668 | 5.8 | 21,285 | 13.1 | 251,401 | 194,782 | 184,114 | 7.0 | 6.2 | 6.7 | 56,619 | 29.1 | 10,668 | 5.8 | |||||||||||||||||||||||||||||||||||||||||||||||||||||||
Interest expense and other, net | 26,353 | 31,125 | 33,595 | 0.9 | 1.1 | 1.4 | (4,772 | ) | (15.3 | ) | (2,470 | ) | (7.4 | ) | 23,144 | 26,353 | 31,125 | 0.6 | 0.9 | 1.1 | (3,209 | ) | (12.2 | ) | (4,772 | ) | (15.3 | ) | |||||||||||||||||||||||||||||||||||||||||||||||
|
|
|
|
|
|
|
| ||||||||||||||||||||||||||||||||||||||||||||||||||||||||||||||||||||
Income before income taxes | 168,429 | 152,989 | 129,234 | 5.3 | 5.6 | 5.3 | 15,440 | 10.1 | 23,755 | 18.4 | 228,257 | 168,429 | 152,989 | 6.4 | 5.3 | 5.6 | 59,828 | 35.5 | 15,440 | 10.1 | |||||||||||||||||||||||||||||||||||||||||||||||||||||||
Income taxes | 61,171 | 62,572 | 50,824 | 1.9 | 2.3 | 2.1 | (1,401 | ) | (2.2 | ) | 11,748 | 23.1 | 83,105 | 61,171 | 62,572 | 2.4 | 1.9 | 2.3 | 21,934 | 35.9 | (1,401 | ) | (2.2 | ) | |||||||||||||||||||||||||||||||||||||||||||||||||||
|
|
|
|
|
|
|
| ||||||||||||||||||||||||||||||||||||||||||||||||||||||||||||||||||||
Net income before noncontrolling interest in earnings of joint venture | 107,258 | 90,417 | 78,410 | 3.4 | 3.3 | 3.2 | 16,841 | 18.6 | 12,007 | 15.3 | 145,152 | 107,258 | 90,417 | 4.0 | 3.4 | 3.3 | 37,894 | 35.3 | 16,841 | 18.6 | |||||||||||||||||||||||||||||||||||||||||||||||||||||||
Noncontrolling interest in earnings of joint venture | (743 | ) | (719 | ) | (475 | ) | (0.0 | ) | (0.0 | ) | (0.0 | ) | (24 | ) | 3.3 | (244 | ) | 51.4 | (934 | ) | (743 | ) | (719 | ) | (0.0 | ) | (0.0 | ) | (0.0 | ) | (191 | ) | 25.7 | (24 | ) | 3.3 | |||||||||||||||||||||||||||||||||||||||
|
|
|
|
|
|
|
| ||||||||||||||||||||||||||||||||||||||||||||||||||||||||||||||||||||
Net income attributable to CACI | $ | 106,515 | $ | 89,698 | $ | 77,935 | 3.4 | % | 3.3 | % | 3.2 | % | $ | 16,817 | 18.7 | % | $ | 11,763 | 15.1 | % | $ | 144,218 | $ | 106,515 | $ | 89,698 | 4.0 | % | 3.4 | % | 3.3 | % | $ | 37,703 | 35.4 | % | $ | 16,817 | 18.7 | % | |||||||||||||||||||||||||||||||||||
|
|
|
|
|
|
|
| ||||||||||||||||||||||||||||||||||||||||||||||||||||||||||||||||||||
| (1) | Certain amounts for the |
Revenue
For FY2010,FY2011, our total revenue increased by $419.0$428.6 million, or 15.313.6 percent. Approximately 13.411.6 percent, or $364.9$364.5 million, of revenue growth was organic and resulted from an increase in services provided to a broad base of DoD, intelligence, and federal civilian agency customers. The remaining 1.92.0 percent increase, or $54.1$64.1 million, was from acquisitions completed in FY2009FY2010 and FY2010.
During FY2009,FY2010, total revenue increased by $309.6$419.0 million, or 12.815.3 percent. Approximately 9.913.4 percent, or $240.8$364.9 million, of revenue growth was organic and resulted primarily from increases in services and solutions provided to our DoD customers. The remaining 2.91.9 percent, or $68.8$54.1 million, of the FY2009FY2010 revenue growth was generated by acquisitions completed in FY2009FY2010 and FY2008.FY2009.
Revenue generated from the date a business is acquired through the first anniversary of that date is considered acquired revenue. Our acquired revenue for FY2010FY2011 and FY2009FY2010 is as follows (in millions):
Business Acquired | 2010 | 2009 | 2011 | 2010 | ||||||||||
TechniGraphics, Inc | $ | 27.6 | $ | — | ||||||||||
SystemWare Incorporated | $ | 4.3 | $ | — | 15.6 | 4.3 | ||||||||
Athena Innovative Solutions, Inc. | — | 37.6 | ||||||||||||
Dragon Development Corporation | — | 11.2 | ||||||||||||
Applied Systems Research, Inc. | 10.2 | — | ||||||||||||
Others | 49.8 | 20.0 | 10.7 | 49.8 | ||||||||||
|
| |||||||||||||
Total | $ | 54.1 | $ | 68.8 | $ | 64.1 | $ | 54.1 | ||||||
|
| |||||||||||||
The following table summarizes revenue earned by each of the customer groups for the three most recent fiscal years:
| Year ended June 30, | Year ended June 30, | |||||||||||||||||||||||||||||||||||||||||
| 2010 | 2009 | 2008 | 2011 | 2010 | 2009 | |||||||||||||||||||||||||||||||||||||
| (dollar amounts in thousands) | (dollar amounts in thousands) | |||||||||||||||||||||||||||||||||||||||||
Department of Defense | $ | 2,450,463 | 77.8 | % | $ | 2,078,338 | 76.1 | % | $ | 1,807,546 | 74.7 | % | $ | 2,858,721 | 79.9 | % | $ | 2,450,463 | 77.8 | % | $ | 2,078,338 | 76.1 | % | ||||||||||||||||||
Federal civilian agencies | 535,467 | 17.0 | 542,090 | 19.9 | 491,275 | 20.3 | 537,687 | 15.0 | 535,467 | 17.0 | 542,090 | 19.9 | ||||||||||||||||||||||||||||||
Commercial and other | 146,839 | 4.7 | 88,228 | 3.2 | 101,839 | 4.2 | 166,966 | 4.7 | 146,839 | 4.7 | 88,228 | 3.2 | ||||||||||||||||||||||||||||||
State and local governments | 16,362 | 0.5 | 21,506 | 0.8 | 19,877 | 0.8 | 14,406 | 0.4 | 16,362 | 0.5 | 21,506 | 0.8 | ||||||||||||||||||||||||||||||
|
|
|
|
|
| |||||||||||||||||||||||||||||||||||||
Total | $ | 3,149,131 | 100.0 | % | $ | 2,730,162 | 100.0 | % | $ | 2,420,537 | 100.0 | % | $ | 3,577,780 | 100.0 | % | $ | 3,149,131 | 100.0 | % | $ | 2,730,162 | 100.0 | % | ||||||||||||||||||
|
|
|
|
|
| |||||||||||||||||||||||||||||||||||||
Revenue from DoD customers increased 17.916.7 percent, or $372.1$408.3 million, to $2.5$2.9 billion for FY2010FY2011 as compared to FY2009. Substantially allFY2010. $40.5 million of the DoD revenue growthincrease was attributable to acquired DoD revenue and the remaining $367.8 million of the increase was attributable to revenue from existing operations. DoD revenue includes that earned for services provided to the U.S. Army, our largest customer, where our services focus on supporting readiness, tactical military intelligence, and communications of the combat operations in Iraq and Afghanistan. DoD revenue also includes work with the U.S. Navy, such as services to support the Navy’s automatic identification technologies and a mine countermeasure program that protects its fleet.
Revenue from DoD customers increased 15.017.9 percent, or $270.8$372.1 million, to $2.1$2.5 billion for FY2009FY2010 as compared to FY2008. Acquisitions accounted for 2.0FY2009. Substantially all of the DoD revenue growth was attributable to existing operations.
Revenue from federal civilian agencies increased $2.2 million, to $537.7 million during FY2011 as compared to FY2010. Of the federal civilian agency revenue growth, $1.8 million was attributable to acquisitions. Approximately 16.9 percent of this growth, contributing $36.6 million.federal civilian agency revenue for the year was derived from the Department of Justice (DoJ), for whom we provide litigation support services. Revenue from DoJ was $90.8 million in FY2011 versus $79.8 million in FY2010. Federal civilian agency revenue also includes services provided to non-DoD national intelligence agencies.
Revenue from federal civilian agencies decreased $6.6 million, or 1.2 percent, to $535.5 million during FY2010 as compared to FY2009. This decrease is primarily attributable to revenue earned on projects that were substantially completed prior to June 30, 2009 and the timing of the fees on certain contracts where we recognize a portion of the fees upon customer approvals. Approximately 14.9 percent of federal civilian agency revenue for the year was derived from the Department of Justice (DoJ), for whom we provide litigation support services.DoJ. Revenue from DoJ was $79.8 million in FY2010 versus $74.9 million in FY2009. Federal civilian agency revenue also includes services provided to non-DoD national intelligence agencies.
During FY2009Commercial and other revenue increased 13.7 percent, or $20.1 million, to $167.0 million in FY2011 as compared to FY2008, revenue from federal civilian agencies increased $50.8 million, or 10.3 percent, to $542.1 million.FY2010. This revenue growth came both organically andprimarily from acquisitions. AcquisitionsCommercial revenue is derived from both international and domestic operations. In FY2011, international operations accounted for 49.470.7 percent, or $118.1 million, of the increase. Approximately 13.8total commercial revenue, while domestic operations accounted for 29.3 percent, of federal civilian agency revenue for the year was derived from DoJ. Revenue from DoJ was $74.9 million in FY2009 versus $74.0 million in FY2008.or $48.9 million.
Commercial and other revenue increased 66.4 percent, or $58.6 million, to $146.8 million in FY2010 as compared to FY2009. This revenue growth came both organically and from acquisitions. Acquisitions accounted for $51.0 million or 86.9 percent of the increase. Commercial revenue is derived from both international and domestic operations. In FY2010, international operations accounted for 79.5 percent, or $116.8 million, of the total commercial revenue, while domestic operations accounted for 20.5 percent, or $30.0 million.
Commercial revenueRevenue from state and local governments decreased 13.4by 12.0 percent, or $13.6$2.0 million to $88.2 million in FY2009during FY2011, as compared to FY2008.FY2010. In FY2010 as compared to FY2009, international operations accounted for 90.0 percent, or $79.4 million, of the total commercial revenue while domestic operations accounted for 10.0 percent, or $8.8 million. The decrease in commercial revenue was primarily from our U.K. operations, which decreased by 14.5 percent, or $13.4 million, as a result of unfavorable exchange rates.
Revenue from state and local governments decreased by 23.9 percent, or $5.1 million during FY2010, as compared to FY2009. In FY2009 as compared to FY2008, revenue from state and local governments increased by 8.2 percent, or $1.6 million. Revenue from state and local governments represented less than one percent of our total revenue in each of FY2011, FY2010, FY2009, and FY2008.FY2009. Our continued focus on DoD and federal civilian agency opportunities has resulted in a relatively reduced emphasis on state and local government business.
Income from Operations
Operating incomeIncome from operations increased 29.1 percent or $56.6 million, in FY2011 as compared to FY2010. Our operating margin was 7.0 percent, up from 6.2 percent during the same period a year ago. This increase in operating margin was primarily the result of strong direct labor growth and ongoing cost control. Income from operations increased 5.8 percent, or $10.7 million, in FY2010 as compared to FY2009. Our operating margin in FY2010 of 6.2 percent decreased from 6.7 percent in each of FY2009 and FY2008. In FY2009 as compared to FY2008, operating income increased 13.1 percent, or $21.3 million.FY2009. The decrease in margin rate related primarily to an increase in subcontract labor and materials as a percent of total direct costs, a decline in the margins of our direct labor and higher variable cash and stock compensation expense.
During the fiscal years ended June 30, 2011, 2010, 2009, and 2008,2009, as a percentage of revenue, total direct costs were 70.7 percent, 70.1 percent, 68.6 percent, and 67.168.6 percent, respectively. The year-to-year increases in direct costs as a percentage of revenue were driven primarily by an increase in other direct costs (ODCs), specifically the use of subcontractors. These costs are common in our industry, are typically incurred in response to specific client tasks, and may vary from period to period.
The single largest component of direct costs, direct labor, was $888.0 million, $810.6 million and $751.0 million in FY2011, FY2010, and $670.3 million in FY2010, FY2009, and FY2008, respectively. The increase in direct labor during the last three fiscal years is attributable to the organic growth in our federal government business, both in the DoD and federal civilian agencies, and to acquisitions. ODCs, which include, among other costs, subcontractor labor and materials along with equipment purchases and travel expenses, were $1.6 billion, $1.4 billion, and $1.1 billion in FY2011, FY2010, and $955.3 million in FY2010, FY2009, and FY2008, respectively. The year over year increases were primarily the result of increased volume of tasking across all of our major service offerings including the aforementioned acquisitions.
Indirect costs and selling expenses include fringe benefits (attributable to both direct and indirect labor), marketing and bid and proposal costs, indirect labor and other discretionary costs. As a percentage of revenue, indirect costs and selling expenses were 20.7 percent, 22.0 percent and 23.0 percent for FY2011, FY2010, and 24.2 percent for FY2010, FY2009, and FY2008, respectively. The decrease in percentage experienced during these fiscal years is primarilyreflects the result of integrating acquired businesses while controlling our various indirect and general and administrative expenses in these periods of growth.
Indirect expense in both FY2011 and FY2010 reflected a reduction of expense associated with the reduction in the fair value of acquisition-related contingent consideration liabilities related to acquisitions completed in FY2010. The reduction recorded was $9.6 million in FY2011 and $2.0 million in FY2010. Indirect expense in FY2010 also reflected the benefit of higher forfeitures available to offset Company contributions under our 401(k) Plan. This higher level of forfeitures resulted from an amendment to the 401(k) Plan during FY2010 that provided that non-vested balances are forfeited upon the earlier of a distribution being taken or December 31 of the year the participant terminates employment. Previously, non-vested balances were forfeited upon the earlier of a distribution being taken or December 31 following a five year break in service. Indirect costs and selling expenses in FY2009 were impacted by a reduction in expense associated with a gain on a commercial legal matter.
A component of indirect costs and selling expenses is stock compensation. Total stock compensation expense was $17.9 million, $30.8 million, $16.8 million, and $17.6$16.8 million for the fiscal years ended June 30, 2011, 2010, and 2009, and 2008, respectively. The decrease in stock compensation expense from FY2008 to FY2009 was due primarily to a higher level of forfeitures in FY2009. The increase in stock compensation expense from FY2009 to FY2010 was due to the issuance of performance-based RSUs which require recording of associated stock compensation expense on an accelerated basis and the determination during FY2010 that, based on our performance during FY2010, the maximum number of RSUs associated with grants made during FY2009 and FY2010 would be earned. The decrease in stock compensation expense from FY2010 to FY2011 was due primarily to a higher level of forfeitures in FY2011 and a decrease in stock compensation expense associated with the FY2009 and FY2010 performance-based RSUs.
Depreciation and amortization expense increased $3.0 million, or 5.7 percent, in FY2011 as compared to FY2010. The increase was attributable to depreciation and amortization of both tangible and intangible assets, and included an increase in depreciation and leasehold amortization expense associated with a new lease in Northern Virginia. These costs were partially offset by a decrease in software amortization on externally marketed software. In FY2010 as compared to FY2009, depreciation and amortization expense increased $6.4 million, or 13.8 percent, in FY2010 as compared to FY2009. Thepercent. This increase was primarily attributable to amortization of acquired intangibles offset by a decrease in software amortization on externally marketed software. In FY2009
Net interest expense and other decreased $3.2 million, or 12.2 percent in FY2011, as compared to FY2008, depreciationFY2010 primarily as a result of lower interest rates, lower days sales outstanding, and amortizationthe prepayment of certain debt outstanding at the beginning of the year. In addition, interest expense decreased $0.9and other includes a reduction for our share of the net income of AC First, LLC, a joint venture between us and AECOM Government Services, Inc. of $1.8 million or 1.9 percent, primarily from a decrease in software amortization on externally marketed software.
FY2011 as compared to $70 thousand in FY 2010. Net interest expense and other decreased $4.8 million, or 15.3 percent, in FY2010 as compared to FY2009 primarily as a result of lower interest rates, lower days sales outstanding, and the July 2009 $50.0 million prepayment on our Term Loan. Net interest expense and other decreased $2.5 million, or 7.4 percent, in FY2009 as compared to FY2008 primarily as a result of lower interest rates.
The effective income tax rates in FY2011, FY2010, and FY2009, and FY2008, were 36.6 percent, 36.5 percent, 41.1 percent, and 39.541.1 percent, respectively. The lower tax rate in both FY2011 and FY2010 as compared to FY2009 related primarily to thebenefitted from tax benefits related to deductions claimed for income from qualified domestic production activities and to non-taxable gains on assets invested in corporate-owned life insurance (COLI) policies. In FY2009, such assets invested in COLI policies in FY2010 as compared togenerated non-deductible losses on those assets in FY2009.losses.
Quarterly Financial Information
Quarterly financial data for the two most recent fiscal years is provided in Note 26,25, Quarterly Financial Data, in the Notes to Consolidated Financial Statements contained in this Annual Report on Form 10-K.
Effects of Inflation
During FY2010, 32.8FY2011, 35.7 percent of our business was conducted under cost-reimbursable contracts which automatically adjust revenue to cover costs that are affected by inflation. 46.639.8 percent of our revenue was earned under T&M contracts, where labor rates for many of the services provided are often fixed for several years. Under certain T&M contracts containing indefinite-delivery, indefinite-quantityIDIQ procurement arrangements, we do adjust labor rates annually as permitted. The remaining portion of our business is fixed-price and may span multiple years. We generally have been able to price our T&M and fixed-price contracts in a manner that accommodates the rates of inflation experienced in recent years.
Liquidity and Capital Resources
Historically, our positive cash flow from operations and our available credit facilities have provided adequate liquidity and working capital to fund our operational needs. Cash flows from operations totaled $226.0 million, $209.3 million $150.9 million and $160.1$150.9 million for the years ended June 30, 2011, 2010 and 2009, and 2008, respectively.
The Credit Facility is a $590$750.0 million credit facility, which includes a $240$600.0 million revolving credit facility (the Revolving Facility), and a $350$150.0 million term loan (the Term Loan). The Revolving Facility has subfacilities of $50.0 million for same-day swing line borrowings and $25.0 million for stand-by letters of credit. At June 30, 2010, $278.72011, $146.3 million was outstanding under the Term Loan, nothing was outstanding under the Revolving Facility and we had no letters of credit outstanding. On August 5, 2010, we madeThe Credit Facility has an $80.0accordion feature that will allow the facility to be expanded by an additional $200.0 million prepayment on the Term Loan, reducing the outstanding balance to $198.7 million. From time to time, we may make additional prepayments, based on cash flows, working capital requirements and other capital needs.
The Term Loan portion of the Credit Facility is a seven-yearfive-year secured facility under which principal payments are due in quarterly installments of $0.7$1.9 million atthrough December 31, 2013 and $3.8 million from January 1, 2014 through September 30, 2015, with the end of each fiscal quarter through March 2011 and the balance is due in full on May 3, 2011. PriorOctober 21, 2015.
The interest rates applicable to the expiration ofloans under the Credit Facility we intend to establishare floating interest rates that, at our option, equal a new, multi-year term loan and revolving credit agreement.
Interest rates for both Revolving Facility and Term Loan borrowings are based on the London Inter-Bank Offered Rate (LIBOR), or the higher of the primebase rate or the federal fundsa Eurodollar rate plus, in each case, plusan applicable margins. Margins and unused facility fee rates are determined quarterlymargin based onupon our consolidated total leverage ratios.ratio.
We are requiredThe Credit Facility requires us to comply with certain financial covenants, under the Credit Facility that limit ourincluding a maximum senior secured leverage require us to maintainratio, a minimum net worthmaximum total leverage ratio and require us to meet a minimum fixed charge coverage ratio. These financialThe Credit Facility also includes customary negative covenants apply throughout the term ofrestricting or limiting our ability to guarantee or incur additional indebtedness, grant liens or other security interests to third parties, make loans or investments, transfer assets, declare dividends or redeem or repurchase capital stock or make other distributions, prepay subordinated indebtedness and engage in mergers, acquisitions or other business combinations, in each case except as expressly permitted under the Credit Facility. The Credit Agreement dated as of May 3, 2004, as amended, governing our Credit Facility provides the remedies available to the lenders in the event of an uncured violation of any of the financial covenants. Such remedies may include the termination of the Credit Facility and the demand for payment of all outstanding amounts due thereunder. Since the inception of the Credit Facility, we have always been in compliance with all of the financial covenants and expect to remain in compliance through the May 2011 expirationcovenants. A majority of the Credit Facility.
The total costs associated with securing the Credit Facility,our assets serve as amended, were $10.2 million and are being amortized over the life ofcollateral under the Credit Facility.
Effective May 16, 2007, we issued the Notes, which mature on May 1, 2014, in a private placement pursuant to Rule 144A of the Securities Act of 1933. The Notes are subordinate to our senior secured debt, and interest on the Notes is payable on May 1 and November 1 of each year.
Holders may convert their notes at a conversion rate of 18.2989 shares of CACI common stock for each $1,000 of note principal (an initial conversion price of $54.65 per share) under the following circumstances: 1) if the last reported sale price of CACI stock is greater than or equal to 130 percent of the conversion price for at least 20 trading days in the period of 30 consecutive trading days ending on the last trading day of the preceding fiscal quarter; 2) during the five consecutive business day period immediately after any ten consecutive trading day period (the note measurement period) in which the average of the trading price per $1,000 principal amount of convertible note was equal to or less than 97 percent of the average product of the closing price of a share of our common stock and the conversion rate of each date during the note measurement period; 3) upon the occurrence of certain corporate events, as defined; or 4) during the last three-month period prior to maturity. We are required to satisfy 100 percent of the principal amount of these notes solely in cash, with any amounts above the principal amount to be satisfied in common stock. As of June 30, 2010,2011, none of the conditions permitting conversion of the Notes had been satisfied.
In the event of a fundamental change, as defined, holders may require us to repurchase the Notes at a price equal to the principal amount plus any accrued interest. Also, if certain fundamental changes occur prior to maturity, we will in certain circumstances increase the conversion rate by a number of additional shares of common stock or, in lieu thereof, we may in certain circumstances elect to adjust the conversion rate and related conversion obligation so that these notes are convertible into shares of the acquiring or surviving company. We are not permitted to redeem the Notes.
The contingently issuable shares are not included in our diluted share count for the fiscal year ended June 30, 2010 or 2009, because our average stock price during those periods was below the conversion price. Of total debt issuance costs of $7.8 million, $5.8 million is being amortized to interest expense over seven years. The remaining $2.0 million of debt issuance costs are included in shareholders’ equity. Upon closing of the sale of the Notes, $45.5 million of the net proceeds was used to concurrently repurchase one million shares of our common stock.
In connection with the issuance of the Notes, we purchased in a private transaction at a cost of $84.4 million call options (the Call Options) to purchase approximately 5.5 million shares of our common stock at a price equal to the conversion price of $54.65 per share. The Call Options allow us to receive shares of our common stock
from the counterparties equal to the amount of common stock related to the excess conversion value that we would pay the holders of the Notes upon conversion. In addition, we sold warrants (the Warrants) to issue approximately 5.5 million shares of CACI common stock at an exercise price of $68.31 per share. The proceeds from the sale of the Warrants totaled $56.5 million.
For income tax reporting purposes, the Notes and the Call Options are integrated. This creates an original issue discount for income tax reporting purposes, and therefore the cost of the Call Options is being accounted for as interest expense over the term of the Notes for income tax reporting purposes. The associated income tax benefit of $32.8 million to be realized for income tax reporting purposes over the term of the Notes was recorded as an increase in additional paid-in capital and a long-term deferred tax asset. The majority of this deferred tax asset is offset in our balance sheet by the $30.7 million deferred tax liability that was recognized with the adoption of the updates to ASC 470-20,Debt with Conversion and Other Options (ASC 470-20) that were retroactively applied to May 16, 2007 (see below for additional information on the impact of adopting the updates to ASC 470-20).
On a combined basis, the Call Options and the Warrants are intended to reduce the potential dilution of CACI’s common stock in the event that the Notes are converted by effectively increasing the conversion price of these notes from $54.65 to $68.31. The Call Options are anti-dilutive and are therefore excluded from the calculation of diluted shares outstanding. The Warrants will result in additional diluted shares outstanding if our average common stock price exceeds $68.31. The Call Options and the Warrants are separate and legally distinct instruments that bind us and the counterparties and have no binding effect on the holders of the Notes.
Beginning July 1, 2009, we have accounted for the Notes in accordance with the updates to ASC 470-20. These rules were applied retrospectively and, accordingly, balances effected by ASC 470-20 as of and for the years ended June 30, 2009, 2008 and 2007 have been adjusted to reflect the impacts of the update. See Note 2 in the Notes to Consolidated Financial Statements contained in this Annual Report on Form 10-K for additional information.
In accordance with ASC 470-20, the Company accounts for the liability and the equity (conversion option) components of the Notes, and recognizes expense on the Notes, using an interest rate in effect for comparable debt instruments that do not contain conversion features. The effective interest rate for the Notes excluding its conversion option was determined to be 6.9 percent.
The fair value of the liability component of the Notes was calculated to be $221.9 million at May 16, 2007, the date of issuance. The excess of the $300.0 million of gross proceeds over the $221.9 million fair value of the liability component, or $78.1 million, represents the fair value of the equity component, which has been recorded, net of income tax effect, as additional paid-in capital within shareholders’ equity. This $78.1 million difference represents a debt discount that is amortized over the seven-year term of the Notes as a non-cash component of interest expense. While the new rules cause reported interest expense to increase, and correspondingly cause basic and diluted earnings per share to decrease, they have no effect on net cash flows.
We also maintain two lines of credit in addition to the Revolving Facility, one in the U.K., and one under a joint venture. The total amount available under the line-of-credit facility in the U.K., which is cancelable at any time upon notice from the bank, is 0.5 million pounds sterling. The amount available under the joint venture’s line of credit is $1.5 million, and is scheduled to expire in September 2011. As of June 30, 2010,2011, the Company had no outstanding borrowings under either of these lines of credit.
In June 2010, our Board of Directors approved a share repurchase program for up to 1 million shares of our common stock where the total expenditure for the purchase of the shares under this repurchase program does not exceed $50.0 million.
Cash and cash equivalents were $254.5$164.8 million and $208.5$254.5 million as of June 30, 20102011 and 2009,2010, respectively. The increasedecrease in cash and cash equivalents was primarily attributable to cash flow generated from operations.used for acquisitions and the paydown of debt. The paydown of current debt along with strong cash collections resulted in increased working capital. Working capital was $182.3$334.9 million and $406.9$182.3 million as of June 30, 2011 and 2010, and 2009, respectively. This decrease in working capital is the result of our term loan becoming due within the next twelve months. Our operating cash flow was $209.3$226.0 million for FY2010,FY2011, compared to $150.9$209.3 million for the same period a year ago. The current year increase in operating cash flow results from profits earned during the current year and our strong operational processes. Days-sales outstanding improved to 5552 at June 30, 2010,2011, compared to 5955 for the same period a year ago.
We used $112.9$152.6 million and $38.8$112.9 million of cash in investing activities during FY2010FY2011 and FY2009,FY2010, respectively. The increase in FY2010FY2011 was attributed primarily to the acquisitions completed during the year. In addition to the cash we paid at theto date ofrelated to each acquisition completed during FY2010, we may be required to pay additional consideration (Contingent Consideration) of up to a total of approximately $49.0$43.0 million in the event that the acquired businesses achieve certain specified earnings results during the two year periods subsequent to each acquisition. We determined the fair value of the Contingent Consideration as of each acquisition date using a valuation model which included the evaluation of all possible outcomes and the application of an appropriate discount rate. At the end of each reporting period, the fair value of the Contingent Consideration is remeasured and any changes are recorded in indirect costs and selling expenses. During the year ended June 30, 2010,2011, this remeasurement resulted in a $2.0$9.6 million reduction in the liability recorded. As of June 30, 2010,2011, the fair value of the expected Contingent Consideration to be paid was $33.4$20.8 million.
Purchases of office and computer related equipment of $14.4 million and $22.5 million in FY2011 and $12.4 million in FY2010, and FY2009, respectively, accounted for a majority of the remaining funds used in investing activities. The increasedecrease in capital expenditures in FY2010FY2011 was primarily the result of capital expenditures incurred in connection with our consolidation of office space in a new building in Northern Virginia.Virginia in the prior year. Generally, we have relatively low capital expenditure requirements for our business, and expect these expenditures in the coming years to remain consistent with the levels reported in fiscal years prior to FY2010.FY2011.
Cash flows used in financing activities were $164.3 million during FY2011 and $47.0 million during FY2010 and $21.1 million during FY2009.FY2010. During FY2010,FY2011, we prepaid $50.0 millionhad a net reduction of our Term Loan.Loan of $132.4 million. During FY2009,FY2011, we also used $20.0$50.0 million of cash to repurchase 1.0 million shares of our common stock pursuant to a share repurchase program approved by our Board of Directors in June 2008.2010. Cash flows from financing activities continued to benefit from proceeds received from the exercise of stock options and purchases of stock under our ESPP. Proceeds from these activities totaled $26.2 million and $10.1 million during FY2011 and $7.7 million during FY2010, and FY2009, respectively. These were offset by cash used to purchase stock to fulfill obligations under the ESPP. Cash used to acquire stock under the ESPP was $3.7 million and $3.5 million during FY2011 and $3.7 million during FY2010, and FY2009, respectively.
We believe that we will be able to refinance our Credit Facility prior to its May 2011 expiration on terms that will be acceptable to us. That, together with the combination of internally generated funds, available bank borrowings, and cash and cash equivalents on hand will provide the required liquidity and capital resources necessary to fund on-going operations, customary capital expenditures, debt service obligations, and other working capital requirements over the next twelve months. Over the longer term, our ability to generate sufficient cash flows from operations necessary to fulfill the obligations under our anticipated new credit facilitythe Credit Facility and the Notes will depend on our future financial performance which will be affected by many factors outside of our control, including current worldwide economic conditions.
Off-Balance Sheet Arrangements and Contractual Obligations
We use off-balance sheet arrangements to finance the lease of operating facilities. We have financed the use of all of our current office and warehouse facilities through operating leases. Operating leases are also used to finance the use of computers, servers, phone systems, and to a lesser extent, other fixed assets, such as furnishings, that are obtained in connection with business acquisitions. We generally assume the lease rights and
obligations of companies acquired in business combinations and continue financing equipment under operating leases until the end of the lease term following the acquisition date. We generally do not finance capital expenditures with operating leases, but instead finance such purchases with available cash balances. For additional information regarding our operating lease commitments, see Note 1514 in the Notes to Consolidated Financial Statements contained in this Annual Report on Form 10-K. The Credit Facility provides for stand-by letters of credit aggregating up to $25.0 million that reduce the funds available under the Revolving Facility when issued. As of June 30, 2010,2011, we had no outstanding letters of credit. We have no other material off-balance sheet financing arrangements.
The following table summarizes our contractual obligations as of June 30, 20102011 that require us to make future cash payments:
| Payments Due By Period | Payments Due By Period | ||||||||||||||||||||||||||||||||||
| Total | Less than 1 year | 1 to 3 years | 3 to 5 years | More than 5 years | Total | Less than 1 year | 1 to 3 years | 3 to 5 years | More than 5 years | ||||||||||||||||||||||||||
| (amounts in thousands) | (amounts in thousands) | ||||||||||||||||||||||||||||||||||
Contractual obligations(1): | |||||||||||||||||||||||||||||||||||
Credit facility(2) | $ | 278,653 | $ | 278,653 | $ | — | $ | — | $ | — | $ | 146,250 | $ | 7,500 | $ | 18,750 | $ | 120,000 | $ | — | |||||||||||||||
Convertible notes(2) | 300,000 | — | — | 300,000 | — | 300,000 | — | 300,000 | — | ||||||||||||||||||||||||||
Operating leases(3) | 227,948 | 37,460 | 59,092 | 51,860 | 79,536 | 222,487 | 35,289 | 60,899 | 50,292 | 76,007 | |||||||||||||||||||||||||
Other long-term liabilities reflected on our balance sheet under generally accepted accounting principles (GAAP) | |||||||||||||||||||||||||||||||||||
Deferred compensation(4) | 52,879 | 2,495 | 3,501 | 2,816 | 44,067 | 67,216 | 2,348 | 3,802 | 1,582 | 59,484 | |||||||||||||||||||||||||
|
|
|
|
| |||||||||||||||||||||||||||||||
Total | $ | 859,480 | $ | 318,608 | $ | 62,593 | $ | 354,676 | $ | 123,603 | $ | 735,953 | $ | 45,137 | $ | 383,451 | $ | 171,874 | $ | 135,491 | |||||||||||||||
|
|
|
|
| |||||||||||||||||||||||||||||||
| (1) | The liability related to unrecognized tax benefits has been excluded from the contractual obligations table because a reasonable estimate of the timing and amount of cash out flows from future tax settlements cannot be determined. See Note |
| (2) | See Note |
| (3) | See Note |
| (4) | This liability is substantially offset by investments held by the plan provider to be reimbursed to us upon the payment of the liability to the plan participant. See Note |
Item 7A. Quantitative and Qualitative Disclosure About Market Risk
The interest rates on both the Term Loan and the Revolving Facility are affected by changes in market interest rates. We have the ability to manage these fluctuations in part through interest rate hedging alternatives in the form of interest rate swaps and caps. We have maintained hedging relationships with various counterparties in recent years, including two interest rate swap agreements that expired in December 2009. These agreements allowed us to exchange a portion of our variable rate debt for fixed rate debt. We have not entered into new interest rate swaps at this time due to the relatively favorable interest rate environment and as our variable rate debt matures in May 2011.environment. Accordingly, effective in mid-December 2009, all outstanding balances under our Term Loan, and any amounts that may be borrowed under our Revolving Facility, are subject to interest rate fluctuations. Without interest rate swap agreements, our interest expense on our variable rate debt would have fluctuated by approximately $2.8 million for the year ended June 30, 2010 withfluctuations With every one percent fluctuation in the applicable interest rates.rates, interest expense on our variable rate debt for the year ended June 30, 2011 would have fluctuated by approximately $1.7 million.
Approximately 3.73.3 percent and 2.93.7 percent of our total revenue in FY2010FY2011 and FY2009,FY2010, respectively, was derived from our international operations in the U.K. Our practice in the U.K. is to negotiate contracts in the
same currency in which the predominant expenses are incurred, thereby mitigating the exposure to foreign currency exchange fluctuations. It is not possible to accomplish this in all cases; thus, there is some risk that profits will be affected by foreign currency exchange fluctuations. As of June 30, 20102011, we held a combination of euros and pounds sterling in the U.K. equivalent to approximately $13.4$25.5 million. This allows us to better utilize our cash resources on behalf of our foreign subsidiaries, thereby mitigating foreign currency conversion risks.
Item 8. Financial Statements and Supplementary Data
The Consolidated Financial Statements of CACI International Inc and subsidiaries are provided in Part IV in this Annual Report on Form 10-K.
Item 9. Changes in and Disagreements with Accountants on Accounting and Financial Disclosure
We had no disagreements with our independent registered public accounting firm on accounting principles, practices or financial statement disclosure during and through the date of the consolidated financial statements included in this report.
Item 9A. Controls and Procedures
| A. | Disclosure Controls and Procedures |
We maintain disclosure controls and procedures, as defined in the Exchange Act Ruling 13a-15(e) and 15d-15(e), that are designed to ensure that information required to be disclosed in our periodic filings with the Securities and Exchange Commission (SEC) is recorded, processed, summarized and reported within the time periods specified in the SEC’s rules and forms. Our disclosure controls and procedures are also designed to ensure that information required to be disclosed in the reports we file or submit under the Exchange Act is accumulated and communicated to our management, including our Chief Executive Officer (CEO) and Chief Financial Officer (CFO), as appropriate, to allow timely decisions regarding required disclosure.
The effectiveness of a system of disclosure controls and procedures is subject to various inherent limitations, including cost limitations, judgments used in decision making, assumptions about the likelihood of future events, the soundness of internal controls, and fraud. Due to such inherent limitations, there can be only reasonable, and not absolute, assurance that any system of disclosure controls and procedures will be successful in detecting or preventing all errors or fraud, or in making all material information known in a timely manner to the appropriate levels of management.
We performed an evaluation of the effectiveness of our disclosure controls and procedures under the supervision of the CEO and CFO, as of June 30, 2010.2011. Based on the evaluation procedures, our
management, including the CEO and CFO, concluded that our disclosure controls and procedures were effective at the reasonable assurance level as of June 30, 2010.2011.
| B. | Internal Control Over Financial Reporting |
The management of CACI International Inc is responsible for establishing and maintaining effective internal control over financial reporting, as such term is defined in Exchange Act Rules 13a-15(f) and 15d-15(f), and for its assessment of the effectiveness of internal control over financial reporting.
We maintain internal controls over financial reporting that are designed to provide reasonable assurance regarding the reliability of financial reporting, and the preparation of financial statements. CACI International Inc’s internal control over financial reporting includes those policies and procedures that 1) provide reasonable assurance that transactions are recorded as necessary to permit preparation of financial statements in accordance with U.S. generally accepted accounting principles; 2) ensure the maintenance of records that accurately and fairly reflect our transactions; 3) ensure that our receipts, expenditures and asset dispositions are made in accordance with director and management authorizations; and 4) provide reasonable assurance that our assets are properly safeguarded.
With the participation of our CEO and CFO, we performed an evaluation of the effectiveness of the internal control over financial reporting to comply with the rules on internal control over financial reporting issued pursuant to the Sarbanes-Oxley Act of 2002. In making this evaluation, management used the criteria set forth by the Committee of Sponsoring Organizations of the Treadway Commission (COSO) inInternal Control—Integrated Framework. Based on the evaluation procedures, our management, including the CEO and CFO, concluded that, as of June 30, 2010,2011, our internal control over financial reporting was effective based on those criteria. In addition, our independent registered public accounting firm evaluated the effectiveness of our internal control over financial reporting. Management’s report on the effectiveness of internal control over financial reporting, and the independent auditors’ report on internal control over financial reporting, are included in Part IV of this report.
| C. | Changes in Internal Control Over Financial Reporting |
Under the supervision and with the participation of our management, an evaluation was also performed of any changes in our internal control procedures over financial reporting that occurred during our last fiscal quarter. Based on this evaluation, management determined there were no changes in our internal control over financial reporting that occurred during our last fiscal quarter that have materially affected, or are reasonably likely to materially affect, our internal control over financial reporting.
PART III
The Information required by Items 10, 11, 12, 13 and 14 of Part III of Form 10-K has been omitted in reliance on General Instruction G(3) and is incorporated herein by reference to our proxy statement to be filed with the SEC pursuant to Regulation 14A promulgated under the Securities Exchange Act of 1934, as amended, as set forth below:
Item 10. Officers, Directors and Executive Officers of the Registrant
Except for the specific disclosures below, the information required by this Item 10 is included under the headings “Executive Officers” and “Corporate Governance” in our 20102011 Proxy Statement for the annual meeting to be held with respect to the fiscal year ended June 30, 2010 (20102011 (2011 Proxy Statement) and is incorporated by reference.
Code of Ethics
We have adopted a code of ethics that applies to our principal executive officer, principal financial officer, principal accounting officer and persons performing similar functions. That code, our Standards of Ethics and Business Conduct, is posted in the “Investors” section of our website atwww.caci.com and a printed copy of such code will be furnished free of charge to any shareholder who requests a copy.
We intend to disclose any amendment to the Standards of Ethics and Business Conduct that relates to any element of the code of ethics definition enumerated in Item 406(b) of Regulation S-K, and any waiver from a provision of the Standards of Ethics and Business Conduct granted to any director, principal executive officer, principal financial officer, principal accounting officer, or any other executive officer of the Company, in the “Investors” section of our website atwww.caci.com within four business days following the date of such amendment or waiver.
Corporate Governance Guidelines
We have adopted a set of corporate governance guidelines in accordance with the requirements of Section 303A of the New York Stock Exchange Listed Company Manual. Those guidelines can be found posted on our website atwww.caci.com and a printed copy will be furnished free of charge to any shareholder who requests a copy.
Item 11. Executive Compensation
The information required by this Item 11 is included in the text and tables under the headings “Compensation Discussion and Analysis” and “Executive Compensation” in our 20102011 Proxy Statement and is incorporated by reference.
Item 12. Security Ownership Of Certain Beneficial Owners And Management
The information required by this Item 12 is included under the headings “Security Ownership of Directors, Executive Officers, Certain Beneficial Owners and Management” and “Equity Compensation Plan Information” in our 20102011 Proxy Statement and is incorporated by reference.
Item 13. Certain Relationships and Related Transactions
The information required by this Item 13 is included under the headings “Corporate Governance”, “Compensation Discussion and Analysis” and “Executive Compensation” in our 20102011 Proxy Statement and is incorporated by reference.
Item 14. Principal Accounting Fees and Services
The information required by this Item 14 is included under the heading “Independent Auditor Fees” in our 20102011 Proxy Statement and is incorporated by reference.
PART IV
Item 15. Exhibits and Financial Statement Schedules
| (a) | Documents filed as part of this Report |
| 1. | Financial Statements |
| A. | Report of Management on Internal Control Over Financial Reporting |
| B. | Report of Independent Registered Public Accounting Firm on Internal Control Over Financial Reporting |
| C. | Report of Independent Registered Public Accounting Firm |
| D. | Consolidated Statements of Operations for the fiscal years ended June 30, 2011, 2010, |
| E. | Consolidated Balance Sheets as of June 30, |
| F. | Consolidated Statements of Cash Flows for the fiscal years ended June 30, 2011, 2010 |
| G. | Consolidated Statements of Shareholders’ Equity for the fiscal years ended June 30, 2011, 2010 |
| H. | Consolidated Statements of Comprehensive Income for the fiscal years ended June 30, 2011, 2010 |
| I. | Notes to Consolidated Financial Statements |
| 2. | Supplementary Financial Data |
Schedule II—Valuation and Qualifying Accounts for the fiscal years ended June 30, 2011, 2010, 2009, and 20082009
All other schedules for which provision is made in the applicable accounting regulation of the Securities and Exchange Commission are not required under the related instructions or are inapplicable and therefore have been omitted.
| (b) | Exhibits |
Exhibit No. | Description | Filed | Incorporated by Reference | |||||||
Form | Filing Date | Exhibit No. | ||||||||
| 3.1 | Certificate of Incorporation of CACI International Inc, as amended to date. | 10-K | September 13, 2006 | 3.1 | ||||||
| 3.2 | Amended and Restated By-laws of CACI International Inc, amended as of March 5, 2008. | 8-K | March 7, 2008 | 3.1 | ||||||
| 4.1 | Clause FOURTH of CACI International Inc’s Certificate of Incorporation, incorporated above as Exhibit 3.1. | 10-K | September 13, 2006 | 4.1 | ||||||
| 4.2 | The Rights Agreement dated July 11, 2003 between CACI International Inc and American Stock Transfer & Trust Company. | 8-K | July 11, 2003 | 4.1 | ||||||
Exhibit No. | Description | Filed | Incorporated by Reference | |||||||||
Form | Filing Date | Exhibit No. | ||||||||||
| 3.1 | Certificate of Incorporation of CACI International Inc, as amended to date. | 10-K | September 13, 2006 | 3.1 | ||||||||
| 3.2 | Amended and Restated By-laws of CACI International Inc, amended as of March 5, 2008. | 8-K | March 7, 2008 | 3.1 | ||||||||
| 4.1 | Clause FOURTH of CACI International Inc’s Certificate of Incorporation, incorporated above as Exhibit 3.1. | 10-K | September 13, 2006 | 4.1 | ||||||||
| 4.2 | The Rights Agreement dated July 11, 2003 between CACI International Inc and American Stock Transfer & Trust Company. | 8-K | July 11, 2003 | 4.1 | ||||||||
Exhibit No. Description Filed Incorporated by Reference Form Filing Date Exhibit No. Exhibit No. Description Filed Incorporated by Reference Form Filing Date Exhibit No.
with this
Form 10-K 4.3 Indenture, dated as of May 16, 2007, between CACI International Inc and The Bank of New York, including the form of Note. 8-K May 16, 2007 4.1 4.4 Registration Rights Agreement, dated as of May 16, 2007, among CACI International Inc and J.P. Morgan Securities Inc., Banc of America Securities LLC, Morgan Stanley & Co. Incorporated, Raymond James & Associates, Inc., SunTrust Capital Markets, Inc. and Wachovia Capital Markets, LLC. 8-K May 16, 2007 4.2 4.5 Letter Agreement re Call Option Transaction dated as of May 10, 2007, by and between CACI International Inc and Morgan Stanley & Co. International plc, as amended May 11, 2007. 8-K May 16, 2007 4.3 4.6 Letter Agreement re Warrants dated as of May 10, 2007, by and between CACI International Inc and Morgan Stanley & Co. International plc, as amended May 11, 2007. 8-K May 16, 2007 4.4 4.7 Letter Agreement re Call Option Transaction dated as of May 10, 2007, by and between CACI International Inc and J.P. Morgan Chase Bank, National Association, as amended May 11, 2007. 8-K May 16, 2007 4.5 4.8 Letter Agreement re Warrants dated as of May 10, 2007, by and between CACI International Inc and J.P. Morgan Chase Bank, National Association, as amended May 11, 2007. 8-K May 16, 2007 4.6 4.9 Letter Agreement re Call Option Transaction dated as of May 10, 2007, by and between CACI International Inc and Bank of America, N.A., as amended May 11, 2007. 8-K May 16, 2007 4.7 4.10 Letter Agreement re Warrants dated as of May 10, 2007, by and between CACI International Inc and Bank of America, N.A., as amended May 11, 2007. 8-K May 16, 2007 4.8
Exhibit No. Description Filed Incorporated by Reference Form Filing Date Exhibit No. Exhibit No. Description Filed Incorporated by Reference Form Filing Date Exhibit No.
with this
Form 10-K 10.1 The 1996 Stock Incentive Plan of CACI International Inc.* S-8 February 15, 2005 4.3 10.2 Form of Stock Option Agreement between CACI International Inc and certain employees.* 10-K September 27, 2002 10.10 10.3 Form of Performance Accelerated Stock Option Agreement between CACI International Inc and certain employees.* 10-K September 27, 2002 10.11 10.4 The 2002 Employee Stock Purchase Plan of CACI International Inc, as amended.* Def 14A October 7, 2009 Appendix A 10.5 Amended and Restated Management Stock Purchase Plan of CACI International Inc.* 10-K August 27, 2008 10.5 10.6 Amended and Restated Director Stock Purchase Plan of CACI International Inc.* X 10.7 The Credit Agreement dated as of May 3, 2004, among CACI International Inc, the guarantors identified therein, the lenders identified therein, and Bank of America, N.A., as Administrative Agent. 10-K September 13, 2004 10.21 10.8 First Amendment dated as of May 18, 2005 to the Credit Agreement dated as of May 3, 2004, among CACI International Inc, the guarantors identified therein, the lenders identified therein, and Bank of America, N.A., as Administrative Agent. 8-K May 18, 2005 99 10.9 The Amended and Restated Asset Purchase Agreement dated February 16, 2006 between CACI International Inc, CACI, INC.-FEDERAL, CACI Acquisition, Inc., Information Systems Support, Inc., Young Yong Lee, AE Kyung Lee, Jack A. Garson, as Voting Trustee. 8-K March 1, 2006 99b 10.10 Amended and Restated Severance Compensation Agreement dated December 13, 2006 between Paul M. Cofoni and CACI International Inc.* 10-Q February 9, 2007 10.2
with this
Form 10-K 10.1 The 1996 Stock Incentive Plan of CACI International Inc.* S-8 February 15, 2005 4.3 10.2 Form of Stock Option Agreement between CACI International Inc and certain employees.* 10-K September 27, 2002 10.10 10.3 Form of Performance Accelerated Stock Option Agreement between CACI International Inc and certain employees.* 10-K September 27, 2002 10.11 10.4 The 2002 Employee Stock Purchase Plan of CACI International Inc, as amended.* Def 14A October 7, 2009 Appendix A 10.5 Amended and Restated Management Stock Purchase Plan of CACI International Inc.* 10-K August 27, 2008 10.5 10.6 Amended and Restated Director Stock Purchase Plan of CACI International Inc.* 10-K August 25, 2010 10.6 10.7 Purchase Agreement, dated May 10, 2007, among CACI International Inc and J.P. Morgan Securities Inc., Banc of America Securities LLC, Morgan Stanley & Co. Incorporated, Raymond James & Associates, Inc., SunTrust Capital Markets, Inc. and Wachovia Capital Markets, LLC. 8-K May 16, 2007 10.1 10.8 Amended and Restated Employment Agreement dated July 1, 2007 between J.P. London and CACI International Inc.* 10-K August 29, 2007 10.21 10.9 Employment Agreement dated July 1, 2007 between Paul M. Cofoni and CACI International Inc.* 10-K August 29, 2007 10.22 10.10 Severance Compensation Agreement dated July 1, 2007 between William M. Fairl and CACI International Inc.* 10-K August 29, 2007 10.24 10.11 Severance Compensation Agreement dated October 1, 2007 between Thomas A. Mutryn and CACI International Inc.* S-1/A October 9, 2007 10.25 10.12 Severance Compensation Agreement dated June 16, 2008 between Gregory R. Bradford and CACI International Inc.* 10-K August 27, 2008 10.23
Exhibit No. Description Filed Incorporated by Reference Form Filing Date Exhibit No. Exhibit No. Description Filed Incorporated by Reference Form Filing Date Exhibit No.
with this
Form 10-K 10.11 Amended and Restated Severance Compensation Agreement dated December 18, 2006 between William M. Fairl and CACI International Inc.* 10-Q February 9, 2007 10.3 10.12 Second Amendment, dated as of May 9, 2007, to the Credit Agreement dated as of May 3, 2004, among CACI International Inc, the guarantors identified therein, the lenders identified therein, and Bank of America, N.A., as Administrative Agent. 8-K May 11, 2007 10.1 10.13 Purchase Agreement, dated May 10, 2007, among CACI International Inc and J.P. Morgan Securities Inc., Banc of America Securities LLC, Morgan Stanley & Co. Incorporated, Raymond James & Associates, Inc., SunTrust Capital Markets, Inc. and Wachovia Capital Markets, LLC. 8-K May 16, 2007 10.1 10.14 Stock Purchase Agreement by and among CACI International Inc, CACI, INC.—FEDERAL and The Wexford Group International, Inc. and the Stockholders of The Wexford Group International, Inc., dated May 30, 2007. 10-K August 29, 2007 10.20 10.15 Amended and Restated Employment Agreement dated July 1, 2007 between J.P. London and CACI International Inc.* 10-K August 29, 2007 10.21 10.16 Employment Agreement dated July 1, 2007 between Paul M. Cofoni and CACI International Inc.* 10-K August 29, 2007 10.22 10.17 Severance Compensation Agreement dated July 1, 2007 between William M. Fairl and CACI International Inc.* 10-K August 29, 2007 10.24 10.18 Severance Compensation Agreement dated October 1, 2007 between Thomas A. Mutryn and CACI International Inc.* S-1/A October 9, 2007 10.25
with this
Form 10-K 10.13 CACI International Inc 2006 Stock Incentive Plan, as amended and restated.* Def 14A October 7, 2009 Appendix B 10.14 Form of Performance Restricted Stock Unit Grant Agreement for Grantees Who are Grandfathered Executives.* S-8 February 4, 2009 10.2 10.15 Form of Performance Restricted Stock Unit Grant Agreement for Grantees who are Not Eligible for Grandfathered Retirement.* S-8 February 4, 2009 10.3 10.16 Form of Restricted Stock Unit Grant Agreement for Grantees Who are Grandfathered Executives.* S-8 February 4, 2009 10.4 10.17 Form of Restricted Stock Unit Grant Agreement for Grantees Who are Not Eligible for Grandfathered Retirement.* S-8 February 4, 2009 10.5 10.18 Form of Stock-Settled Stock Appreciation Rights Grant Agreement.* S-8 February 4, 2009 10.6 10.19 Form of Non-Employee Director Restricted Stock Unit Grant Agreement.* S-8 February 4, 2009 10.7 10.20 CACI International Inc Supplemental Executive Retirement Plan for Paul M. Cofoni, President and Chief Executive Officer.* 10-Q February 5, 2009 10.1 10.21 Amendment to the CACI International Inc 2006 Stock Incentive Plan dated June 23, 2010.* 10-K August 25, 2010 10.33 10.22 Amendment to the CACI International Inc Management Stock Purchase Plan dated June 23, 2010.* 10-K August 25, 2010 10.34 10.23 Form of Indemnification Agreement between CACI International Inc and its directors and certain executive officers. 10-K August 25, 2010 10.35
Exhibit No. Description Filed Incorporated by Reference Form Filing Date Exhibit No.
with this
Form 10-K 10.19 Severance Compensation Agreement dated October 1, 2007 between Randall C. Fuerst and CACI International Inc.* S-1/A October 9, 2007 10.26 10.20 Stock Purchase Agreement by and among Athena Holding LLC, Athena Holding Corp., Athena Innovative Solutions, Inc., CACI International Inc and CACI, INC.—FEDERAL, dated September 19, 2007. S-1/A October 9, 2007 10.27 10.21 Severance Compensation Agreement dated June 16, 2008 between Gregory R. Bradford and CACI International Inc.* 10-K August 27, 2008 10.23 10.22 Third Amendment, dated as of August 28, 2008, to the Credit Agreement dated as of May 3, 2004, among CACI International Inc, the guarantors identified therein, the lenders identified therein, and Bank of America, N.A., as Administrative Agent. 8-K September 4, 2008 10.5 10.23 Commitment Agreement dated as of August 28, 2008 to the Credit Agreement dated as of May 3, 2004, among CACI International Inc, the guarantors identified therein, the lenders identified therein, and Bank of America, N.A., as Administrative Agent. 8-K September 4, 2008 10.4 10.24 Fourth Amendment, dated as of May 27, 2009, to the Credit Agreement dated as of May 3, 2004, between CACI International Inc, the guarantors identified therein, the lenders identified therein, and Bank of America, N.A., as Administrative Agent. 8-K June 2, 2009 10.6 10.25 CACI International Inc 2006 Stock Incentive Plan, as amended.* Def 14A October 7, 2009 Appendix B 10.26 Form of Performance Restricted Stock Unit Grant Agreement for Grantees Who are Grandfathered Executives.* S-8 February 4, 2009 10.2
Exhibit No. Description Filed Incorporated by Reference Form Filing Date Exhibit No. Exhibit No. Description Filed Incorporated by Reference Form Filing Date Exhibit No.
with this
Form 10-K 10.27 Form of Performance Restricted Stock Unit Grant Agreement for Grantees who are Not Eligible for Grandfathered Retirement.* S-8 February 4, 2009 10.3 10.28 Form of Restricted Stock Unit Grant Agreement for Grantees Who are Grandfathered Executives.* S-8 February 4, 2009 10.4 10.29 Form of Restricted Stock Unit Grant Agreement for Grantees Who are Not Eligible for Grandfathered Retirement.* S-8 February 4, 2009 10.5 10.30 Form of Stock-Settled Stock Appreciation Rights Grant Agreement.* S-8 February 4, 2009 10.6 10.31 Form of Non-Employee Director Restricted Stock Unit Grant Agreement.* S-8 February 4, 2009 10.7 10.32 CACI International Inc Supplemental Executive Retirement Plan for Paul M. Cofoni, President and Chief Executive Officer.* 10-Q February 5, 2009 10.1 10.33 Amendment to the CACI International Inc 2006 Stock Incentive Plan dated June 23, 2010.* X 10.34 Amendment to the CACI International Inc Management Stock Purchase Plan dated June 23, 2010.* X 10.35 Form of Indemnification Agreement between CACI International Inc and its directors and certain executive officers. X 21.1 Significant Subsidiaries of the Registrant. X 23.1 Consent of Independent Registered Public Accounting Firm. X 31.1 Certification of Chief Executive Officer pursuant to Rule 13a-14(a)/15d-14(a) of the Securities and Exchange Commission. X
with this
Form 10-K 10.24 Credit Agreement by and among CACI International Inc as borrower; Bank of America, N.A. as administrative agent, swing line lender and L/C issuer; JP Morgan Chase Bank, N.A., as syndication agent; and each of the lenders named therein.* 10-Q November 4, 2010 10.1 10.25 Form of Performance Restricted Stock Unit Grant Agreement between CACI International Inc and certain employees.* 10-Q February 4, 2011 10.2 10.26 Form of Non-Employee Director Restricted Stock Unit Grant Agreement.* 10-Q February 4, 2011 10.3 10.27 Form of Restricted Stock Unit Grant Agreement for Grantees enrolled in the Management Stock Purchase Plan of CACI International Inc.* 10-Q February 4, 2011 10.4 10.28 Addendum to Employee Agreement and Severance Compensation Agreement Dated December 3, 2010 between Randall C. Fuerst and CACI International Inc.* 10-Q February 4, 2011 10.5 10.29 Form of CACI International Inc 2006 Stock Incentive Plan Restricted Stock Unit (RSU) Grant Agreement.* 10-Q May 6, 2011 10.1 10.30 Form of Non-Employee Director Restricted Stock Unit Grant Agreement.* X 21.1 Significant Subsidiaries of the Registrant. X 23.1 Consent of Independent Registered Public Accounting Firm. X 31.1 Certification of Chief Executive Officer pursuant to Rule 13a-14(a)/15d-14(a) of the Securities and Exchange Commission. X 31.2 Certification of Chief Financial Officer pursuant to Rule 13a-14(a)/15d-14(a) of the Securities and Exchange Commission. X 32.1 Certification of Chief Executive Officer pursuant to 18 U.S.C. Section 1350. X
Exhibit No. | Description | Filed | Incorporated by Reference | |||||||||
Form | Filing Date | Exhibit No. | ||||||||||
| 32.2 | ||||||||||||
| Certification of Chief Financial Officer pursuant to 18 U.S.C. Section 1350. | X | |||||||||||
| 99.1 | Certification of Chief Executive Officer pursuant to Regulation 303A.12(b) of the New York Stock Exchange. | X | ||||||||||
| 101 | The following materials from the CACI International Inc Annual Report on Form 10-K for the year ended June 30, 2011 formatted in eXtensible Business Reporting Language (XBRL): (i) Consolidated Statements of Operations for the years ended June 30, 2011, 2010 and 2009, (ii) Consolidated Balance Sheets as of June 30, 2011 and 2010, (iii) Consolidated Statements of Cash Flows for the years ended June 30, 2011, 2010 and 2009, (iv) Consolidated Statements of Shareholders’ Equity for the years ended June 30, 2011, 2010 and 2009, (v) Consolidated Statements of Comprehensive Income for the years ended June 30, 2011, 2010 and 2009, and (vi) Notes to Consolidated Financial Statements.** | |||||||||||
| * | Denotes a management contract, compensatory plan, or arrangement. |
| ** | Submitted electronically herewith. |
Report of Management on Internal Control Over Financial Reporting
August 25, 201029, 2011
To the Stockholders
CACI International Inc
The management of CACI International Inc is responsible for establishing and maintaining effective internal control over financial reporting, and for assessing the effectiveness of internal control over financial reporting. Management maintains a comprehensive system of internal controls intended to ensure that transactions are executed in accordance with management’s authorization, that assets are safeguarded, and that financial records are reliable. CACI International Inc’s internal control system is designed to provide reasonable assurance to Company management and its Board of Directors regarding the preparation and fair presentation of consolidated financial statements for external purposes in accordance with U.S. generally accepted accounting principles.
Due to inherent limitations, internal control systems can provide only reasonable assurance with respect to financial statement preparation and presentation, and may not prevent or detect financial statement misstatements. Also, projections of any evaluation of internal control effectiveness to future periods are subject to the risk that existing controls may become inadequate because of changing conditions, or that the degree of compliance with existing policies and procedures may deteriorate.
The Company’s management, with the participation of its Chief Executive Officer and Chief Financial Officer, conducted an evaluation of the effectiveness of CACI International Inc’s internal control over financial reporting based on the framework and criteria established inInternal Control-Integrated Framework, issued by the Committee of Sponsoring Organizations of the Treadway Commission (COSO). Based on this evaluation, our management has concluded that CACI International Inc’s internal control over financial reporting was effective as of June 30, 2010.2011.
Ernst & Young LLP, an independent registered public accounting firm, has audited the Company’s consolidated financial statements included herein and has reported on the Company’s internal control over financial reporting as of June 30, 2010.2011.
/s/ PAUL M. COFONI | /s/ THOMAS A. MUTRYN | |||
| Paul M. Cofoni | Thomas A. Mutryn | |||
| President and | Executive Vice President and | |||
| Chief Executive Officer | Chief Financial Officer |
Report of Independent Registered Public Accounting Firm
on Internal Control Over Financial Reporting
Board of Directors and Stockholders
CACI International Inc
We have audited CACI International Inc’s internal control over financial reporting as of June 30, 2010,2011, based on criteria established in Internal Control—Integrated Framework issued by the Committee of Sponsoring Organizations of the Treadway Commission (the COSO criteria). CACI International Inc’s management is responsible for maintaining effective internal control over financial reporting, and for its assessment of the effectiveness of internal control over financial reporting included in the accompanying Report of Management on Internal Control Over Financial Reporting. Our responsibility is to express an opinion on the Company’s internal control over financial reporting based on our audit.
We conducted our audit in accordance with the standards of the Public Company Accounting Oversight Board (United States). Those standards require that we plan and perform the audit to obtain reasonable assurance about whether effective internal control over financial reporting was maintained in all material respects. Our audit included obtaining an understanding of internal control over financial reporting, assessing the risk that a material weakness exists, testing and evaluating the design and operating effectiveness of internal control based on the assessed risk, and performing such other procedures as we considered necessary in the circumstances. We believe that our audit provides a reasonable basis for our opinion.
A company’s internal control over financial reporting is a process designed to provide reasonable assurance regarding the reliability of financial reporting and the preparation of financial statements for external purposes in accordance with generally accepted accounting principles. A company’s internal control over financial reporting includes those policies and procedures that (1) pertain to the maintenance of records that, in reasonable detail, accurately and fairly reflect the transactions and dispositions of the assets of the company; (2) provide reasonable assurance that transactions are recorded as necessary to permit preparation of financial statements in accordance with generally accepted accounting principles, and that receipts and expenditures of the company are being made only in accordance with authorizations of management and directors of the company; and (3) provide reasonable assurance regarding prevention or timely detection of unauthorized acquisition, use, or disposition of the company’s assets that could have a material effect on the financial statements.
Because of its inherent limitations, internal control over financial reporting may not prevent or detect misstatements. Also, projections of any evaluation of effectiveness to future periods are subject to the risk that controls may become inadequate because of changes in conditions, or that the degree of compliance with the policies or procedures may deteriorate.
In our opinion, CACI International Inc maintained, in all material respects, effective internal control over financial reporting as of June 30, 2010,2011, based on the COSO criteria.
We also have audited, in accordance with the standards of the Public Company Accounting Oversight Board (United States), the consolidated balance sheets of CACI International Inc as of June 30, 20102011 and 2009,2010, and the related consolidated statements of operations, shareholders’ equity, cash flows, and comprehensive income for each of the three years in the period ended June 30, 20102011 of CACI International Inc, and our report dated August 25, 201029, 2011 expressed an unqualified opinion thereon.
| /s/ ERNST & YOUNG LLP |
McLean, Virginia
August 25, 201029, 2011
Report of Independent Registered Public Accounting Firm
Board of Directors and Stockholders
CACI International Inc
We have audited the accompanying consolidated balance sheets of CACI International Inc as of June 30, 20102011 and 2009,2010, and the related consolidated statements of operations, shareholders’ equity, cash flows, and comprehensive income for each of the three years in the period ended June 30, 2010.2011. Our audits also included the financial statement schedule listed in the Index at Item 15(a). These financial statements and schedule are the responsibility of the Company’s management. Our responsibility is to express an opinion on these financial statements and schedule based on our audits.
We conducted our audits in accordance with the standards of the Public Company Accounting Oversight Board (United States). Those standards require that we plan and perform the audit to obtain reasonable assurance about whether the financial statements are free of material misstatement. An audit includes examining, on a test basis, evidence supporting the amounts and disclosures in the financial statements. An audit also includes assessing the accounting principles used and significant estimates made by management, as well as evaluating the overall financial statement presentation. We believe that our audits provide a reasonable basis for our opinion.
In our opinion, the financial statements referred to above present fairly, in all material respects, the consolidated financial position of CACI International Inc at June 30, 20102011 and 2009,2010, and the consolidated results of its operations and its cash flows for each of the three years in the period ended June 30, 2010,2011, in conformity with U.S. generally accepted accounting principles. Also, in our opinion, the related financial statement schedule, when considered in relation to the basic financial statements taken as a whole, presents fairly in all material respects the information set forth therein.
We also have audited, in accordance with the standards of the Public Company Accounting Oversight Board (United States), CACI International Inc’s internal control over financial reporting as of June 30, 2010,2011, based on criteria established in Internal Control—Integrated Framework issued by the Committee of Sponsoring Organizations of the Treadway Commission and our report dated August 25, 2010,29, 2011, expressed an unqualified opinion thereon.
| /s/ ERNST & YOUNG LLP |
McLean, Virginia
August 25, 201029, 2011
CACI INTERNATIONAL INC
CONSOLIDATED STATEMENTS OF OPERATIONS
(amounts in thousands, except per share data)
| Fiscal year ended June 30, | Fiscal year ended June 30, | |||||||||||||||||||||||
| 2010 | 2009 (As Adjusted(1)) | 2008 (As Adjusted(1)) | 2011 | 2010 | 2009 (As Adjusted(1)) | |||||||||||||||||||
Revenue | $ | 3,149,131 | $ | 2,730,162 | $ | 2,420,537 | $ | 3,577,780 | $ | 3,149,131 | $ | 2,730,162 | ||||||||||||
|
|
| ||||||||||||||||||||||
Costs of revenue: | ||||||||||||||||||||||||
Direct costs | 2,207,574 | 1,871,884 | 1,625,591 | 2,528,660 | 2,207,574 | 1,871,884 | ||||||||||||||||||
Indirect costs and selling expenses | 693,736 | 627,572 | 584,600 | 741,652 | 693,736 | 627,572 | ||||||||||||||||||
Depreciation and amortization | 53,039 | 46,592 | 47,517 | 56,067 | 53,039 | 46,592 | ||||||||||||||||||
|
|
| ||||||||||||||||||||||
Total costs of revenue | 2,954,349 | 2,546,048 | 2,257,708 | 3,326,379 | 2,954,349 | 2,546,048 | ||||||||||||||||||
|
|
| ||||||||||||||||||||||
Income from operations | 194,782 | 184,114 | 162,829 | 251,401 | 194,782 | 184,114 | ||||||||||||||||||
Interest expense and other | 26,353 | 31,864 | 38,463 | |||||||||||||||||||||
Interest income | — | (739 | ) | (4,868 | ) | |||||||||||||||||||
Interest expense and other, net | 23,144 | 26,353 | 31,125 | |||||||||||||||||||||
|
|
| ||||||||||||||||||||||
Income before income taxes | 168,429 | 152,989 | 129,234 | 228,257 | 168,429 | 152,989 | ||||||||||||||||||
Income taxes | 61,171 | 62,572 | 50,824 | 83,105 | 61,171 | 62,572 | ||||||||||||||||||
|
|
| ||||||||||||||||||||||
Net income before noncontrolling interest in earnings of joint venture | 107,258 | 90,417 | 78,410 | 145,152 | 107,258 | 90,417 | ||||||||||||||||||
Noncontrolling interest in earnings of joint venture | (743 | ) | (719 | ) | (475 | ) | (934 | ) | (743 | ) | (719 | ) | ||||||||||||
|
|
| ||||||||||||||||||||||
Net income attributable to CACI | $ | 106,515 | $ | 89,698 | $ | 77,935 | $ | 144,218 | $ | 106,515 | $ | 89,698 | ||||||||||||
|
|
| ||||||||||||||||||||||
Basic earnings per share | $ | 3.53 | $ | 2.99 | $ | 2.59 | $ | 4.76 | $ | 3.53 | $ | 2.99 | ||||||||||||
|
|
| ||||||||||||||||||||||
Diluted earnings per share | $ | 3.47 | $ | 2.95 | $ | 2.55 | $ | 4.61 | $ | 3.47 | $ | 2.95 | ||||||||||||
|
|
| ||||||||||||||||||||||
Weighted-average basic shares outstanding | 30,138 | 29,976 | 30,058 | 30,281 | 30,138 | 29,976 | ||||||||||||||||||
|
|
| ||||||||||||||||||||||
Weighted-average diluted shares outstanding | 30,676 | 30,427 | 30,606 | 31,300 | 30,676 | 30,427 | ||||||||||||||||||
|
|
| ||||||||||||||||||||||
| (1) | Certain amounts for the |
See Notes to Consolidated Financial Statements.
CACI INTERNATIONAL INC
CONSOLIDATED BALANCE SHEETS
(amounts in thousands, except per share data)
| June 30, | ||||||||
| 2010 | 2009 (As Adjusted(1)) | |||||||
ASSETS | ||||||||
Current assets: | ||||||||
Cash and cash equivalents | $ | 254,543 | $ | 208,488 | ||||
Accounts receivable, net | 531,033 | 477,025 | ||||||
Deferred income taxes | 12,641 | 18,191 | ||||||
Prepaid expenses and other current assets | 42,529 | 21,128 | ||||||
Total current assets | 840,746 | 724,832 | ||||||
Goodwill | 1,161,861 | 1,083,750 | ||||||
Intangible assets, net | 108,298 | 97,829 | ||||||
Property and equipment, net | 58,666 | 30,923 | ||||||
Supplemental retirement savings plan assets | 51,736 | 40,791 | ||||||
Accounts receivable, long-term | 9,291 | 8,677 | ||||||
Other long-term assets | 14,168 | 19,277 | ||||||
Total assets | $ | 2,244,766 | $ | 2,006,079 | ||||
LIABILITIES AND SHAREHOLDERS’ EQUITY | ||||||||
Current liabilities: | ||||||||
Current portion of long-term debt | $ | 278,653 | $ | 9,464 | ||||
Accounts payable | 98,421 | 87,300 | ||||||
Accrued compensation and benefits | 152,790 | 137,843 | ||||||
Other accrued expenses and current liabilities | 128,559 | 83,297 | ||||||
Total current liabilities | 658,423 | 317,904 | ||||||
Long-term debt, net of current portion | 252,451 | 570,078 | ||||||
Supplemental retirement savings plan obligations, net of current portion | 50,384 | 40,298 | ||||||
Deferred income taxes | 42,990 | 29,266 | ||||||
Other long-term liabilities | 67,363 | 18,925 | ||||||
Total liabilities | 1,071,611 | 976,471 | ||||||
Commitments and contingencies | ||||||||
Shareholders’ equity: | ||||||||
Preferred stock $0.10 par value, 10,000 shares authorized, no shares issued | — | — | ||||||
Common stock $0.10 par value, 80,000 shares authorized, 39,366 and 39,091 shares issued, respectively | 3,937 | 3,909 | ||||||
Additional paid-in capital | 468,959 | 425,993 | ||||||
Retained earnings | 794,277 | 687,762 | ||||||
Accumulated other comprehensive loss | (9,807 | ) | (3,248 | ) | ||||
Noncontrolling interest in joint venture | 2,442 | 1,875 | ||||||
Treasury stock, at cost (9,117 and 9,118 shares, respectively) | (86,653 | ) | (86,683 | ) | ||||
Total shareholders’ equity | 1,173,155 | 1,029,608 | ||||||
Total liabilities and shareholders’ equity | $ | 2,244,766 | $ | 2,006,079 | ||||
| June 30, | ||||||||
| 2011 | 2010 | |||||||
ASSETS | ||||||||
Current assets: | ||||||||
Cash and cash equivalents | $ | 164,817 | $ | 254,543 | ||||
Accounts receivable, net | 573,042 | 531,033 | ||||||
Deferred income taxes | 16,080 | 12,641 | ||||||
Prepaid expenses and other current assets | 28,139 | 42,529 | ||||||
|
|
|
| |||||
Total current assets | 782,078 | 840,746 | ||||||
Goodwill | 1,266,285 | 1,161,861 | ||||||
Intangible assets, net | 108,102 | 108,298 | ||||||
Property and equipment, net | 62,755 | 58,666 | ||||||
Supplemental retirement savings plan assets | 66,880 | 51,736 | ||||||
Accounts receivable, long-term | 8,657 | 9,291 | ||||||
Other long-term assets | 25,374 | 14,168 | ||||||
|
|
|
| |||||
Total assets | $ | 2,320,131 | $ | 2,244,766 | ||||
|
|
|
| |||||
LIABILITIES AND SHAREHOLDERS’ EQUITY | ||||||||
Current liabilities: | ||||||||
Current portion of long-term debt | $ | 7,500 | $ | 278,653 | ||||
Accounts payable | 98,893 | 98,421 | ||||||
Accrued compensation and benefits | 173,586 | 152,790 | ||||||
Other accrued expenses and current liabilities | 157,242 | 128,559 | ||||||
|
|
|
| |||||
Total current liabilities | 437,221 | 658,423 | ||||||
Long-term debt, net of current portion | 402,437 | 252,451 | ||||||
Supplemental retirement savings plan obligations, net of current portion | 64,868 | 50,384 | ||||||
Deferred income taxes | 68,123 | 42,990 | ||||||
Other long-term liabilities | 37,866 | 67,363 | ||||||
|
|
|
| |||||
Total liabilities | 1,010,515 | 1,071,611 | ||||||
|
|
|
| |||||
Commitments and contingencies | ||||||||
Shareholders’ equity: | ||||||||
Preferred stock $0.10 par value, 10,000 shares authorized, no shares issued | — | — | ||||||
Common stock $0.10 par value, 80,000 shares authorized, 40,273 and 39,366 shares issued, respectively | 4,027 | 3,937 | ||||||
Additional paid-in capital | 504,156 | 468,959 | ||||||
Retained earnings | 938,495 | 794,277 | ||||||
Accumulated other comprehensive loss | (3,115 | ) | (9,807 | ) | ||||
Noncontrolling interest in joint venture | 2,684 | 2,442 | ||||||
Treasury stock, at cost (10,077 and 9,117 shares, respectively) | (136,631 | ) | (86,653 | ) | ||||
|
|
|
| |||||
Total shareholders’ equity | 1,309,616 | 1,173,155 | ||||||
|
|
|
| |||||
Total liabilities and shareholders’ equity | $ | 2,320,131 | $ | 2,244,766 | ||||
|
|
|
| |||||
See Notes to Consolidated Financial Statements.
CACI INTERNATIONAL INC
CONSOLIDATED STATEMENTS OF CASH FLOWS
(amounts in thousands)
| Fiscal year ended June 30, | Fiscal year ended June 30, | |||||||||||||||||||||||
| 2010 | 2009 (As Adjusted(1)) | 2008 (As Adjusted(1)) | 2011 | 2010 | 2009 (As Adjusted(1)) | |||||||||||||||||||
CASH FLOWS FROM OPERATING ACTIVITIES | ||||||||||||||||||||||||
Net income before noncontrolling interest in earnings of joint venture | $ | 107,258 | $ | 90,417 | $ | 78,410 | $ | 145,152 | $ | 107,258 | $ | 90,417 | ||||||||||||
Reconciliation of net income to net cash provided by operating activities: | ||||||||||||||||||||||||
Depreciation and amortization | 53,039 | 46,592 | 47,517 | 56,067 | 53,039 | 46,592 | ||||||||||||||||||
Non-cash interest expense | 10,499 | 9,809 | 9,160 | 11,235 | 10,499 | 9,809 | ||||||||||||||||||
Amortization of deferred financing costs | 2,356 | 2,553 | 2,243 | 2,785 | 2,356 | 2,553 | ||||||||||||||||||
Stock-based compensation expense | 30,750 | 16,821 | 17,639 | 17,915 | 30,750 | 16,821 | ||||||||||||||||||
Deferred income tax (benefit) expense | (4,703 | ) | 9,624 | 2,603 | ||||||||||||||||||||
Deferred income tax expense (benefit) | 7,587 | (4,703 | ) | 9,624 | ||||||||||||||||||||
Undistributed earnings of unconsolidated joint venture | (1,755 | ) | — | — | ||||||||||||||||||||
Changes in operating assets and liabilities, net of effect of business acquisitions: | ||||||||||||||||||||||||
Accounts receivable, net | (49,291 | ) | (36,055 | ) | (27,001 | ) | (23,624 | ) | (49,291 | ) | (36,055 | ) | ||||||||||||
Prepaid expenses and other assets | (11,628 | ) | (5,555 | ) | 578 | (18,391 | ) | (11,628 | ) | (5,555 | ) | |||||||||||||
Accounts payable and other accrued expenses | 49,910 | 12,330 | 3,160 | (8,394 | ) | 49,910 | 12,330 | |||||||||||||||||
Accrued compensation and benefits | 9,423 | 5,030 | 22,237 | 13,085 | 9,423 | 5,030 | ||||||||||||||||||
Income taxes payable and receivable | 3,288 | 2,177 | 902 | 8,590 | 3,288 | 2,177 | ||||||||||||||||||
Deferred rent | (145 | ) | (1,585 | ) | (1,563 | ) | 809 | (145 | ) | (1,585 | ) | |||||||||||||
Supplemental retirement savings plan obligations and other long-term liabilities | 8,588 | (1,240 | ) | 4,201 | 14,903 | 8,588 | (1,240 | ) | ||||||||||||||||
|
|
| ||||||||||||||||||||||
Net cash provided by operating activities | 209,344 | 150,918 | 160,086 | 225,964 | 209,344 | 150,918 | ||||||||||||||||||
|
|
| ||||||||||||||||||||||
CASH FLOWS FROM INVESTING ACTIVITIES | ||||||||||||||||||||||||
Capital expenditures | (22,503 | ) | (12,369 | ) | (13,589 | ) | (14,388 | ) | (22,503 | ) | (12,369 | ) | ||||||||||||
Cash paid for business acquisitions, net of cash acquired | (87,943 | ) | (26,532 | ) | (315,855 | ) | (133,034 | ) | (87,943 | ) | (26,532 | ) | ||||||||||||
Investment in unconsolidated joint venture, net | (5,964 | ) | (2,428 | ) | — | |||||||||||||||||||
Other | (2,431 | ) | 133 | 101 | 798 | (3 | ) | 133 | ||||||||||||||||
|
|
| ||||||||||||||||||||||
Net cash used in investing activities | (112,877 | ) | (38,768 | ) | (329,343 | ) | (152,588 | ) | (112,877 | ) | (38,768 | ) | ||||||||||||
|
|
| ||||||||||||||||||||||
CASH FLOWS FROM FINANCING ACTIVITIES | ||||||||||||||||||||||||
Proceeds from borrowings under bank credit facilities | — | 628 | 9,790 | |||||||||||||||||||||
Principal payments made under bank credit facilities | (53,600 | ) | (4,547 | ) | (17,033 | ) | ||||||||||||||||||
Proceeds from note receivable | — | — | 3,891 | |||||||||||||||||||||
Proceeds from borrowings under bank credit facilities, net of financing costs | 343,978 | — | 628 | |||||||||||||||||||||
Payments made under bank credit facilities | (482,403 | ) | (53,600 | ) | (4,547 | ) | ||||||||||||||||||
Proceeds from employee stock purchase plans | 4,501 | 5,550 | 4,231 | 4,116 | 4,501 | 5,550 | ||||||||||||||||||
Proceeds from exercise of stock options | 5,589 | 2,129 | 4,079 | 22,077 | 5,589 | 2,129 | ||||||||||||||||||
Repurchases of common stock | (3,496 | ) | (23,705 | ) | (1,972 | ) | (53,647 | ) | (3,496 | ) | (23,705 | ) | ||||||||||||
Other | (7 | ) | (1,156 | ) | 1,088 | 1,546 | (7 | ) | (1,156 | ) | ||||||||||||||
|
|
| ||||||||||||||||||||||
Net cash (used in) provided by financing activities | (47,013 | ) | (21,101 | ) | 4,074 | |||||||||||||||||||
Net cash used in financing activities | (164,333 | ) | (47,013 | ) | (21,101 | ) | ||||||||||||||||||
|
|
| ||||||||||||||||||||||
Effect of exchange rate changes on cash and cash equivalents | (3,399 | ) | (2,957 | ) | (103 | ) | 1,231 | (3,399 | ) | (2,957 | ) | |||||||||||||
|
|
| ||||||||||||||||||||||
Net increase (decrease) in cash and cash equivalents | 46,055 | 88,092 | (165,286 | ) | ||||||||||||||||||||
Net (decrease) increase in cash and cash equivalents | (89,726 | ) | 46,055 | 88,092 | ||||||||||||||||||||
Cash and cash equivalents, beginning of year | 208,488 | 120,396 | 285,682 | 254,543 | 208,488 | 120,396 | ||||||||||||||||||
|
|
| ||||||||||||||||||||||
Cash and cash equivalents, end of year | $ | 254,543 | $ | 208,488 | $ | 120,396 | $ | 164,817 | $ | 254,543 | $ | 208,488 | ||||||||||||
|
|
| ||||||||||||||||||||||
SUPPLEMENTAL DISCLOSURES OF CASH FLOW INFORMATION | ||||||||||||||||||||||||
Cash paid for income taxes, net of refunds | $ | 66,713 | $ | 50,223 | $ | 44,799 | $ | 65,875 | $ | 66,713 | $ | 50,223 | ||||||||||||
|
|
| ||||||||||||||||||||||
Cash paid for interest | $ | 13,694 | $ | 19,537 | $ | 25,774 | $ | 10,709 | $ | 13,694 | $ | 19,537 | ||||||||||||
|
|
| ||||||||||||||||||||||
Non-cash financing and investing activities: | ||||||||||||||||||||||||
Landlord-financed leasehold improvements | $ | 16,815 | $ | 5,276 | $ | — | $ | 2,853 | $ | 16,815 | $ | 5,276 | ||||||||||||
|
|
| ||||||||||||||||||||||
| (1) | Certain amounts for the |
See Notes to Consolidated Financial Statements.
CACI INTERNATIONAL INC
CONSOLIDATED STATEMENTS OF SHAREHOLDERS’ EQUITY
(amounts in thousands)
| Preferred Stock | Common Stock | Additional Paid-in Capital (As Adjusted(1)) | Retained Earnings (As Adjusted(1)) | Accumulated Other Comprehensive Income (Loss) | Noncontrolling Interest in Joint Venture (As Adjusted(1)) | Treasury Stock | Total Shareholders’ Equity (As Adjusted(1)) | Preferred Stock | Common Stock | Additional Paid-in Capital (As Adjusted(1)) | Retained Earnings (As Adjusted(1)) | Accumulated Other Comprehensive Income (Loss) | Noncontrolling Interest in Joint Venture (As Adjusted(1)) | Treasury Stock | Total Shareholders’ Equity (As Adjusted(1)) | |||||||||||||||||||||||||||||||||||||||||||||||||||||||||||||||||
| Shares | Amount | Shares | Amount | Shares | Amount | |||||||||||||||||||||||||||||||||||||||||||||||||||||||||||||||||||||||||||
BALANCE, June 30, 2007, as previously reported | — | $ | — | 38,751 | $ | 3,875 | $ | 347,207 | $ | 521,234 | $ | 8,605 | $ | — | 8,772 | $ | (67,074 | ) | $ | 813,847 | ||||||||||||||||||||||||||||||||||||||||||||||||||||||||||||
Effects of adopting updates to ASC 470-20 and ASC 810 | — | — | — | — | 46,210 | (635 | ) | — | 520 | — | — | 46,095 | ||||||||||||||||||||||||||||||||||||||||||||||||||||||||||||||||||||
BALANCE, June 30, 2007 | — | — | 38,751 | 3,875 | 393,417 | 520,599 | 8,605 | 520 | 8,772 | (67,074 | ) | 859,942 | ||||||||||||||||||||||||||||||||||||||||||||||||||||||||||||||||||||
Net income attributable to CACI | — | — | — | — | — | 77,935 | — | — | — | — | 77,935 | |||||||||||||||||||||||||||||||||||||||||||||||||||||||||||||||||||||
Noncontrolling interest in earnings of joint venture | — | — | — | — | — | — | — | 475 | — | — | 475 | |||||||||||||||||||||||||||||||||||||||||||||||||||||||||||||||||||||
Stock-based compensation expense | — | — | — | — | 17,639 | — | — | — | — | — | 17,639 | |||||||||||||||||||||||||||||||||||||||||||||||||||||||||||||||||||||
Exercise of stock options and vesting of restricted stock units | — | — | 197 | 20 | 4,235 | — | — | — | — | — | 4,255 | |||||||||||||||||||||||||||||||||||||||||||||||||||||||||||||||||||||
Adjustment for unrecognized tax benefit | — | — | — | — | (630 | ) | (470 | ) | — | — | — | — | (1,100 | ) | ||||||||||||||||||||||||||||||||||||||||||||||||||||||||||||||||||
Currency translation adjustment | — | — | — | — | — | — | (465 | ) | — | — | — | (465 | ) | |||||||||||||||||||||||||||||||||||||||||||||||||||||||||||||||||||
Change in fair value of interest rate swap agreements | — | — | — | — | — | — | (1,350 | ) | — | — | — | (1,350 | ) | |||||||||||||||||||||||||||||||||||||||||||||||||||||||||||||||||||
Repurchases of common stock | — | — | — | — | — �� | — | — | — | 43 | (1,972 | ) | (1,972 | ) | |||||||||||||||||||||||||||||||||||||||||||||||||||||||||||||||||||
Treasury stock issued under stock purchase plans | — | — | — | — | 1,676 | — | — | — | (84 | ) | 2,054 | 3,730 | ||||||||||||||||||||||||||||||||||||||||||||||||||||||||||||||||||||
Post-retirement benefit costs | — | — | — | — | — | — | (22 | ) | — | — | — | (22 | ) | |||||||||||||||||||||||||||||||||||||||||||||||||||||||||||||||||||
| Shares | Amount | Shares | Amount | Additional Paid-in Capital (As Adjusted(1)) | Retained Earnings (As Adjusted(1)) | Accumulated Other Comprehensive Income (Loss) | Noncontrolling Interest in Joint Venture (As Adjusted(1)) | Shares | Amount | Total Shareholders’ Equity (As Adjusted(1)) | ||||||||||||||||||||||||||||||||||||||||||||||||||||||||||||||||||||||
BALANCE, June 30, 2008 | — | — | 38,948 | 3,895 | 416,337 | 598,064 | 6,768 | 995 | 8,731 | (66,992 | ) | 959,067 | — | $ | — | 38,948 | $ | 3,895 | 8,731 | $ | (66,992 | ) | ||||||||||||||||||||||||||||||||||||||||||||||||||||||||||
Net income attributable to CACI | — | — | — | — | — | 89,698 | — | — | — | — | 89,698 | — | — | — | — | — | 89,698 | — | — | — | — | 89,698 | ||||||||||||||||||||||||||||||||||||||||||||||||||||||||||
Noncontrolling interest in earnings of joint venture | — | — | — | — | — | — | — | 719 | — | — | 719 | — | — | — | — | — | — | — | 719 | — | — | 719 | ||||||||||||||||||||||||||||||||||||||||||||||||||||||||||
Stock-based compensation expense | — | — | — | — | 16,821 | — | — | — | — | — | 16,821 | — | — | — | — | 16,821 | — | — | — | — | — | 16,821 | ||||||||||||||||||||||||||||||||||||||||||||||||||||||||||
Exercise of stock options and vesting of restricted stock units | — | — | 143 | 14 | (240 | ) | — | — | — | — | — | (226 | ) | — | — | 143 | 14 | (240 | ) | — | — | — | — | — | (226 | ) | ||||||||||||||||||||||||||||||||||||||||||||||||||||||
Adjustment for unrecognized tax benefit | — | — | — | — | (6,682 | ) | — | — | — | — | — | (6,682 | ) | — | — | — | — | (6,682 | ) | — | — | — | — | — | (6,682 | ) | ||||||||||||||||||||||||||||||||||||||||||||||||||||||
Currency translation adjustment | — | — | — | — | — | — | (9,616 | ) | — | — | — | (9,616 | ) | — | — | — | — | — | — | (9,616 | ) | — | — | — | (9,616 | ) | ||||||||||||||||||||||||||||||||||||||||||||||||||||||
Change in fair value of interest rate swap agreements | — | — | — | — | — | — | (332 | ) | — | — | — | (332 | ) | — | — | — | — | — | — | (332 | ) | — | — | — | (332 | ) | ||||||||||||||||||||||||||||||||||||||||||||||||||||||
Repurchases of common stock | — | — | — | — | — | — | — | — | 482 | (23,705 | ) | (23,705 | ) | — | — | — | — | — | — | — | — | 482 | (23,705 | ) | (23,705 | ) | ||||||||||||||||||||||||||||||||||||||||||||||||||||||
Treasury stock issued under stock purchase plans | — | — | — | — | (243 | ) | — | — | — | (95 | ) | 4,014 | 3,771 | — | — | — | — | (243 | ) | — | — | — | (95 | ) | 4,014 | 3,771 | ||||||||||||||||||||||||||||||||||||||||||||||||||||||
Post-retirement benefit costs | — | — | — | — | — | — | (68 | ) | — | — | — | (68 | ) | — | — | — | — | — | — | (68 | ) | — | — | — | (68 | ) | ||||||||||||||||||||||||||||||||||||||||||||||||||||||
Other | — | — | — | — | — | — | — | 161 | — | — | 161 | — | — | — | — | — | — | — | 161 | — | — | 161 | ||||||||||||||||||||||||||||||||||||||||||||||||||||||||||
|
|
|
|
|
|
|
|
|
|
| ||||||||||||||||||||||||||||||||||||||||||||||||||||||||||||||||||||||
BALANCE, June 30, 2009 | — | $ | — | 39,091 | $ | 3,909 | $ | 425,993 | $ | 687,762 | $ | (3,248 | ) | $ | 1,875 | 9,118 | $ | (86,683 | ) | $ | 1,029,608 | — | — | 39,091 | 3,909 | 425,993 | 687,762 | (3,248 | ) | 1,875 | 9,118 | (86,683 | ) | 1,029,608 | ||||||||||||||||||||||||||||||||||||||||||||||
Net income attributable to CACI | — | — | — | — | — | 106,515 | — | — | — | — | 106,515 | |||||||||||||||||||||||||||||||||||||||||||||||||||||||||||||||||||||
Noncontrolling interest in earnings of joint venture | — | — | — | — | — | — | — | 743 | — | — | 743 | |||||||||||||||||||||||||||||||||||||||||||||||||||||||||||||||||||||
Stock-based compensation expense | — | — | — | — | 30,750 | — | — | — | — | — | 30,750 | |||||||||||||||||||||||||||||||||||||||||||||||||||||||||||||||||||||
Exercise of stock options and vesting of restricted stock units | — | — | 275 | 28 | 4,554 | — | — | — | — | — | 4,582 | |||||||||||||||||||||||||||||||||||||||||||||||||||||||||||||||||||||
Adjustment for unrecognized tax benefit | — | — | — | — | 7,775 | — | — | — | — | — | 7,775 | |||||||||||||||||||||||||||||||||||||||||||||||||||||||||||||||||||||
Currency translation adjustment | — | — | — | — | — | — | (7,751 | ) | — | — | — | (7,751 | ) | |||||||||||||||||||||||||||||||||||||||||||||||||||||||||||||||||||
Change in fair value of interest rate swap agreements | — | — | — | — | — | — | 1,045 | — | — | — | 1,045 | |||||||||||||||||||||||||||||||||||||||||||||||||||||||||||||||||||||
Repurchases of common stock | — | — | — | — | — | — | — | — | 75 | (3,496 | ) | (3,496 | ) | |||||||||||||||||||||||||||||||||||||||||||||||||||||||||||||||||||
Treasury stock issued under stock purchase plans | — | — | — | — | (113 | ) | — | — | — | (76 | ) | 3,526 | 3,413 | |||||||||||||||||||||||||||||||||||||||||||||||||||||||||||||||||||
Post-retirement benefit costs | — | — | — | — | — | — | 147 | — | — | — | 147 | |||||||||||||||||||||||||||||||||||||||||||||||||||||||||||||||||||||
Net distributions to noncontrolling interest | — | — | — | — | — | — | — | (176 | ) | — | — | (176 | ) | |||||||||||||||||||||||||||||||||||||||||||||||||||||||||||||||||||
|
|
|
|
|
|
|
|
|
|
| ||||||||||||||||||||||||||||||||||||||||||||||||||||||||||||||||||||||
BALANCE, June 30, 2010 | — | — | 39,366 | 3,937 | 468,959 | 794,277 | (9,807 | ) | 2,442 | 9,117 | (86,653 | ) | 1,173,155 | |||||||||||||||||||||||||||||||||||||||||||||||||||||||||||||||||||
CACI INTERNATIONAL INC
CONSOLIDATED STATEMENTS OF SHAREHOLDERS’ EQUITY—(Continued)
(amounts in thousands)
| Preferred Stock | Common Stock | Additional Paid-in Capital (As Adjusted(1)) | Retained Earnings (As Adjusted(1)) | Accumulated Other Comprehensive Income (Loss) | Noncontrolling Interest in Joint Venture (As Adjusted(1)) | Treasury Stock | Total Shareholders’ Equity (As Adjusted(1)) | Preferred Stock | Common Stock | Additional Paid-in Capital (As Adjusted(1)) | Retained Earnings (As Adjusted(1)) | Accumulated Other Comprehensive Income (Loss) | Noncontrolling Interest in Joint Venture (As Adjusted(1)) | Treasury Stock | Total Shareholders’ Equity (As Adjusted(1)) | |||||||||||||||||||||||||||||||||||||||||||||||||||||||||||||||||
| Shares | Amount | Shares | Amount | Shares | Amount | Shares | Amount | Shares | Amount | Shares | Amount | |||||||||||||||||||||||||||||||||||||||||||||||||||||||||||||||||||||
BALANCE, June 30, 2009 | — | $ | — | 39,091 | $ | 3,909 | $ | 425,993 | $ | 687,762 | $ | (3,248 | ) | $ | 1,875 | 9,118 | $ | (86,683 | ) | $ | 1,029,608 | |||||||||||||||||||||||||||||||||||||||||||||||||||||||||||
Net income attributable to CACI | — | — | — | — | — | 106,515 | — | — | — | — | 106,515 | — | $ | — | — | $ | — | $ | — | $ | 144,218 | $ | — | $ | — | — | $ | — | $ | 144,218 | ||||||||||||||||||||||||||||||||||||||||||||||||||
Noncontrolling interest in earnings of joint venture | — | — | — | — | — | — | — | 743 | — | — | 743 | — | — | — | — | — | — | — | 934 | — | — | 934 | ||||||||||||||||||||||||||||||||||||||||||||||||||||||||||
Stock-based compensation expense | — | — | — | — | 30,750 | — | — | — | — | — | 30,750 | — | — | — | — | 17,915 | — | — | — | — | — | 17,915 | ||||||||||||||||||||||||||||||||||||||||||||||||||||||||||
Exercise of stock options and vesting of restricted stock units | — | — | 275 | 28 | 4,554 | — | — | — | — | — | 4,582 | — | — | 907 | 90 | 16,773 | — | — | — | — | — | 16,863 | ||||||||||||||||||||||||||||||||||||||||||||||||||||||||||
Adjustment for unrecognized tax benefit | — | — | — | — | 7,775 | — | — | — | — | — | 7,775 | — | — | — | — | 335 | — | — | — | — | — | 335 | ||||||||||||||||||||||||||||||||||||||||||||||||||||||||||
Currency translation adjustment | — | — | — | — | — | — | (7,751 | ) | — | — | — | (7,751 | ) | — | — | — | — | — | — | 6,716 | — | — | — | 6,716 | ||||||||||||||||||||||||||||||||||||||||||||||||||||||||
Change in fair value of interest rate swap agreements | — | — | — | — | — | — | 1,045 | — | — | — | 1,045 | |||||||||||||||||||||||||||||||||||||||||||||||||||||||||||||||||||||
Repurchases of common stock | — | — | — | — | — | — | — | — | 75 | (3,496 | ) | (3,496 | ) | — | — | — | — | — | — | — | — | 1,041 | (53,647 | ) | (53,647 | ) | ||||||||||||||||||||||||||||||||||||||||||||||||||||||
Treasury stock issued under stock purchase plans | — | — | — | — | (113 | ) | — | — | — | (76 | ) | 3,526 | 3,413 | — | — | — | — | 174 | — | — | — | (81 | ) | 3,669 | 3,843 | |||||||||||||||||||||||||||||||||||||||||||||||||||||||
Post-retirement benefit costs | — | — | — | — | — | — | 147 | — | — | — | 147 | — | — | — | — | — | — | (24 | ) | — | — | — | (24 | ) | ||||||||||||||||||||||||||||||||||||||||||||||||||||||||
Net distributions to noncontrolling interest | — | — | — | — | — | — | — | (176 | ) | — | — | (176 | ) | — | — | — | — | — | — | — | (692 | ) | — | — | (692 | ) | ||||||||||||||||||||||||||||||||||||||||||||||||||||||
|
|
|
|
|
|
|
|
|
|
| ||||||||||||||||||||||||||||||||||||||||||||||||||||||||||||||||||||||
BALANCE, June 30, 2010 | — | $ | — | 39,366 | $ | 3,937 | $ | 468,959 | $ | 794,277 | $ | (9,807 | ) | $ | 2,442 | 9,117 | $ | (86,653 | ) | $ | 1,173,155 | |||||||||||||||||||||||||||||||||||||||||||||||||||||||||||
BALANCE, June 30, 2011 | — | $ | — | 40,273 | $ | 4,027 | $ | 504,156 | $ | 938,495 | $ | (3,115 | ) | $ | 2,684 | 10,077 | $ | (136,631 | ) | $ | 1,309,616 | |||||||||||||||||||||||||||||||||||||||||||||||||||||||||||
|
|
|
|
|
|
|
|
|
|
| ||||||||||||||||||||||||||||||||||||||||||||||||||||||||||||||||||||||
| (1) | Certain amounts as of and for the years ended June 30, |
See Notes to Consolidated Financial Statements.
CACI INTERNATIONAL INC
CONSOLIDATED STATEMENTS OF COMPREHENSIVE INCOME
(amounts in thousands)
| Fiscal year ended June 30, | Fiscal year ended June 30, | |||||||||||||||||||||||
| 2010 | 2009 (As Adjusted(1)) | 2008 (As Adjusted(1)) | 2011 | 2010 | 2009 (As Adjusted(1)) | |||||||||||||||||||
Net income before noncontrolling interest in earnings of joint venture | $ | 107,258 | $ | 90,417 | $ | 78,410 | $ | 145,152 | $ | 107,258 | $ | 90,417 | ||||||||||||
Change in foreign currency translation adjustment | (7,751 | ) | (9,616 | ) | (465 | ) | 6,716 | (7,751 | ) | (9,616 | ) | |||||||||||||
Effect of changes in actuarial assumptions and recognition of prior service cost | 147 | (68 | ) | (22 | ) | (24 | ) | 147 | (68 | ) | ||||||||||||||
Change in fair value of interest rate swap agreements | 1,045 | (332 | ) | (1,350 | ) | — | 1,045 | (332 | ) | |||||||||||||||
|
|
| ||||||||||||||||||||||
Comprehensive income | $ | 100,699 | $ | 80,401 | $ | 76,573 | $ | 151,844 | $ | 100,699 | $ | 80,401 | ||||||||||||
|
|
| ||||||||||||||||||||||
| (1) | Certain amounts for the |
See Notes to Consolidated Financial Statements.
CACI INTERNATIONAL INC
NOTES TO CONSOLIDATED FINANCIAL STATEMENTS
NOTE 1. ORGANIZATION AND BASIS OF PRESENTATION
Business Activities
CACI International Inc, along with its wholly-owned subsidiaries and joint ventures that are more than 50 percent owned or otherwise controlled by it (collectively, the Company), is an international information systems, high technology services, and professional services corporation. It delivers professional services and information technology solutions to its clients, primarily the U.S. government. Other customers include state and local governments, commercial enterprises and agencies of foreign governments.
The Company’s operations are subject to certain risks and uncertainties including, among others, the dependence on contracts with federal government agencies, dependence on revenue derived from contracts awarded through competitive bidding, existence of contracts with fixed pricing, dependence on subcontractors to fulfill contractual obligations, dependence on key management personnel, ability to attract and retain qualified employees, ability to successfully integrate acquired companies, and current and potential competitors with greater resources.
Basis of Presentation
The accompanying consolidated financial statements of the Company have been prepared pursuant to the rules and regulations of the Securities and Exchange Commission (SEC) and include the assets, liabilities, results of operations and cash flows for the Company, including its subsidiaries and joint ventures that are more than 50 percent owned or otherwise controlled by the Company. All intercompany balances and transactions have been eliminated in consolidation.
These notes to the consolidated financial statements contain references to various standards of U.S. generally accepted accounting principles (GAAP) that are based on a new nomenclature instituted by the Financial Accounting Standards Board (the FASB). In June 2009, the FASB issued Accounting Standards Codification 105,Generally Accepted Accounting Principles, which defines authoritative GAAP for nongovernmental entities to be comprised only of the FASB Accounting Standards Codification™ (the Codification) and, for SEC registrants, guidance issued by the SEC. This new standard states that effective July 1, 2009 the Codification became the authoritative source of U.S. GAAP and superseded all then existing non-SEC accounting and reporting standards. The Company adopted the provisions of this new standard effective July 1, 2009, and has changed the referencing conventions of GAAP in the notes to these financial statements. Accordingly, the notes contain references to Accounting Standards Codification (ASC) topics and Accounting Standard Updates (ASUs).
Certain amounts presented for prior periods have been adjusted to reflect the retroactive application of two FASB updates to accounting standards. Effective July 1, 2009, the Company adopted updates to ASC 470-20,Debt With Conversion and Other Options (ASC 470-20) and updates to ASC 810,Consolidation(ASC 810). These updates, which relate to convertible debt instruments and noncontrolling interests in subsidiaries, respectively, both require retrospective application. The FASB issued the updates to ASC 470-20 in May 2008, and the updates to ASC 810 in December 2007. The impacts to the Company’s financial position and results of operations are presented in Note 2.
NOTE 2. RETROACTIVE EFFECTS OF ACCOUNTING STANDARD UPDATES
As described in Note 1, the Company adopted the provisions of updates to ASC 470-20 and ASC 810 effective July 1, 2009.
CACI INTERNATIONAL INC
NOTES TO CONSOLIDATED FINANCIAL STATEMENTS—(Continued)
ASC 470-20 governs the accounting for convertible debt with cash settlement options and accordingly applies to the Company’s convertible debt. Under this new standard, the Company separately accounts for the liability and equity (conversion option) components of its $300.0 million of 2.125 percent convertible senior subordinated notes that were issued May 16, 2007 and mature on May 1, 2014 (the Notes), and recognizes interest expense on the Notes using an interest rate in effect for comparable debt instruments that do not contain conversion features. The effective interest rate used under the new standard, 6.9 percent, is significantly higher than the coupon rate of 2.125 percent previously used to record interest expense.
Based on the effective rate of 6.9 percent, the fair value of the liability component of the Notes at May 16, 2007 was measured at $221.9 million, and has been reflected as the carrying amount of the Notes at issuance. The $78.1 million difference between the recast initial carrying amount and the $300.0 million of gross proceeds is accounted for as an unamortized debt discount that is recognized over the seven year term of the Notes as a non-cash component of interest expense. This difference also represents the fair value of the embedded conversion option. This amount, net of the income tax effect of $30.7 million as of the date of issue, has been recorded within shareholders’ equity as additional paid-in capital. The income tax effect of $30.7 million has been retroactively recognized as a long-term deferred tax liability as of May 16, 2007. This deferred tax liability is netted against the deferred tax asset of $32.8 million associated with the original issue discount originally recorded as of May 16, 2007. Under the revised provisions of ASC 470-20, the Company also reclassified, as of the date of issue, $2.0 million of the Notes’ issuance costs from other long-term assets to additional paid-in capital, and recognized a deferred tax asset of $0.8 million related to this reclassification.
The updates to ASC 470-20 have the effect of significantly increasing interest expense with the amortization of the debt discount. Income tax expense decreases by the incremental benefit related to the increased interest expense, and net income and basic and diluted earnings per share decrease due to the after-tax effect of the incremental interest expense. The adoption of the updates to ASC 470-20 caused net income attributable to CACI and diluted earnings per share to decrease by $6.5 million and $0.21 per share, respectively, for the year ended June 30, 2010.
While there is no effect on operating or total cash flows, certain amounts within the cash flows from operating activities are retroactively adjusted to reflect the impact of changes to ASC 470-20 for the years ended June 30, 2009 and 2008.
The retroactive effects of the ASC 470-20 updates on the Company’s financial position as of June 30, 2009, and on the results of operations and cash flows for the years ended June 30, 2009 and 2008, are shown in the tables below. Current period balances related to the convertible debt and interest expense thereon are described in Note 14.
The updates to ASC 810 establish new accounting and reporting standards for 1) noncontrolling ownership interests in subsidiaries, 2) the amount of consolidated net income (loss) attributable to the Company and to the noncontrolling interests, 3) changes in the Company’s ownership interest and 4) the valuation of retained noncontrolling equity investments when a subsidiary is deconsolidated. ASC 810 also establishes additional reporting requirements that identify and distinguish between the ownership interest of the Company and that of the noncontrolling owners.
In accordance with the provisions of ASC 810, the Company retrospectively reclassified the “Minority interest in joint venture” balance associated with its investment in eVenture Technology, LLC (eVentures) previously included in “Other long-term liabilities” in the consolidated balance sheet to a new component of shareholders’ equity entitled “Noncontrolling interest in joint venture”. In the Statement of Operations for the
CACI INTERNATIONAL INC
NOTES TO CONSOLIDATED FINANCIAL STATEMENTS—(Continued)
years ended June 30, 2009 and 2008, the Company retrospectively included the minority interest in earnings of the joint venture within its consolidated net income before noncontrolling interest in earnings of joint venture, and deducted the same amount to derive net income attributable to CACI.
The impacts of the updates to ASC 470-20 and ASC 810 on the Company’s results of operations for the years ended June 30, 2009 and 2008 are as follows (in thousands, except per share data):
| Year Ended June 30, 2009 | |||||||||||||||
| Effects of Retroactively Adopting Accounting Standard Updates to: | |||||||||||||||
| As Previously Reported | ASC 470-20 | ASC 810 | As Adjusted | ||||||||||||
Interest expense and other | $ | 23,062 | $ | 9,521 | $ | (719 | ) | $ | 31,864 | ||||||
Income before income taxes | $ | 161,791 | $ | (9,521 | ) | $ | 719 | $ | 152,989 | ||||||
Income taxes | 66,311 | (3,739 | ) | — | 62,572 | ||||||||||
Net income before noncontrolling interest in earnings of joint venture | $ | 95,480 | $ | (5,782 | ) | $ | 719 | $ | 90,417 | ||||||
Noncontrolling interest in earnings of joint venture | — | (719 | ) | (719 | ) | ||||||||||
Net income attributable to CACI | $ | (5,782 | ) | $ | — | $ | 89,698 | ||||||||
Basic earnings per share | $ | 3.19 | $ | (0.20 | ) | $ | — | $ | 2.99 | ||||||
Diluted earnings per share | $ | 3.14 | $ | (0.19 | ) | $ | — | $ | 2.95 | ||||||
Weighted-average basic shares outstanding | 29,976 | — | — | 29,976 | |||||||||||
Weighted-average diluted shares outstanding | 30,427 | — | — | 30,427 | |||||||||||
| Year Ended June 30, 2008 | |||||||||||||||
| Effects of Retroactively Adopting Accounting Standard Updates to: | |||||||||||||||
| As Previously Reported | ASC 470-20 | ASC 810 | As Adjusted | ||||||||||||
Interest expense and other | $ | 30,066 | $ | 8,872 | $ | (475 | ) | $ | 38,463 | ||||||
Income before income taxes | $ | 137,631 | $ | (8,872 | ) | $ | 475 | $ | 129,234 | ||||||
Income taxes | 54,308 | (3,484 | ) | — | 50,824 | ||||||||||
Net income before noncontrolling interest in earnings of joint venture | $ | 83,323 | $ | (5,388 | ) | $ | 475 | $ | 78,410 | ||||||
Noncontrolling interest in earnings of joint venture | — | (475 | ) | (475 | ) | ||||||||||
Net income attributable to CACI | $ | (5,388 | ) | $ | — | $ | 77,935 | ||||||||
Basic earnings per share | $ | 2.77 | $ | (0.18 | ) | $ | — | $ | 2.59 | ||||||
Diluted earnings per share | $ | 2.72 | $ | (0.18 | ) | $ | — | $ | 2.55 | ||||||
Weighted-average basic shares outstanding | 30,058 | — | — | 30,058 | |||||||||||
Weighted-average diluted shares outstanding | 30,606 | — | — | 30,606 | |||||||||||
CACI INTERNATIONAL INC
NOTES TO CONSOLIDATED FINANCIAL STATEMENTS—(Continued)
The impacts of the updates to ASC 470-20 and ASC 810 on the Company’s financial position as of June 30, 2009 are as follows (in thousands):
| As of June 30, 2009 | ||||||||||||||
| Effects of Retroactively Adopting Accounting Standard Updates to: | ||||||||||||||
| As Previously Reported | ASC 470-20 | ASC 810 | As Adjusted | |||||||||||
Asset accounts: | ||||||||||||||
Other long-term assets | $ | 20,672 | $ | (1,395 | ) | $ | — | $ | 19,277 | |||||
Total assets | 2,007,474 | (1,395 | ) | — | 2,006,079 | |||||||||
Liability accounts: | ||||||||||||||
Long-term debt, net of current portion | 628,125 | (58,047 | ) | — | 570,078 | |||||||||
Deferred income taxes | 7,019 | 22,247 | — | 29,266 | ||||||||||
Other long-term liabilities | 20,800 | — | (1,875 | ) | 18,925 | |||||||||
Total liabilities | 1,014,146 | (35,800 | ) | (1,875 | ) | 976,471 | ||||||||
Shareholders’ equity accounts: | ||||||||||||||
Additional paid-in capital | 379,783 | 46,210 | — | 425,993 | ||||||||||
Retained earnings | 699,567 | (11,805 | ) | — | 687,762 | |||||||||
Noncontrolling interest in joint venture | — | — | 1,875 | 1,875 | ||||||||||
Total shareholders’ equity | 993,328 | 34,405 | 1,875 | 1,029,608 | ||||||||||
Total liabilities and shareholders’ equity | 2,007,474 | (1,395 | ) | — | 2,006,079 | |||||||||
The impacts of the updates to ASC 470-20 and ASC 810 on the Company’s statement of cash flows for the years ended June 30, 2009 and 2008 are as follows (in thousands):
| Year Ended June 30, 2009 | ||||||||||||||||
| Effects of Retroactively Adopting Accounting Standard Updates to: | ||||||||||||||||
| As Previously Reported | ASC 470-20 | ASC 810 | As Adjusted | |||||||||||||
Cash Flows from Operating Activities: | ||||||||||||||||
Net income before non-controlling interests | $ | 95,480 | $ | (5,782 | ) | $ | 719 | $ | 90,417 | |||||||
Non-cash interest expense | — | 9,809 | — | 9,809 | ||||||||||||
Amortization of deferred financing costs | 2,841 | (288 | ) | — | 2,553 | |||||||||||
Deferred income tax expense (benefit) | 13,363 | (3,739 | ) | — | 9,624 | |||||||||||
Changes in other liabilities | (359 | ) | — | (881 | ) | (1,240 | ) | |||||||||
Net cash provided by operating activities | 151,080 | — | (162 | ) | 150,918 | |||||||||||
Cash Flows from Financing Activities: | ||||||||||||||||
Other activities | (1,318 | ) | — | 162 | (1,156 | ) | ||||||||||
Net cash used in financing activities | (21,263 | ) | — | 162 | (21,101 | ) | ||||||||||
CACI INTERNATIONAL INC
NOTES TO CONSOLIDATED FINANCIAL STATEMENTS—(Continued)
| Year Ended June 30, 2008 | ||||||||||||||
| Effects of Retroactively Adopting Accounting Standard Updates to: | ||||||||||||||
| As Previously Reported | ASC 470-20 | ASC 810 | As Adjusted | |||||||||||
Cash Flows from Operating Activities: | ||||||||||||||
Net income before non-controlling interests | $ | 83,323 | $ | (5,388 | ) | $ | 475 | $ | 78,410 | |||||
Non-cash interest expense | — | 9,160 | — | 9,160 | ||||||||||
Amortization of deferred financing costs | 2,531 | (288 | ) | — | 2,243 | |||||||||
Deferred income tax expense (benefit) | 6,087 | (3,484 | ) | — | 2,603 | |||||||||
Changes in other liabilities | 4,676 | — | (475 | ) | 4,201 | |||||||||
Net cash provided by operating activities | 160,086 | — | — | 160,086 | ||||||||||
NOTE 3.2. SUMMARY OF SIGNIFICANT ACCOUNTING POLICIES
Revenue Recognition
The Company generates almost all of its revenue from three different types of contractual arrangements: cost-plus-fee contracts, time-and-materialstime and materials contracts, and fixed price contracts. Revenue on cost-plus-fee contracts is recognized to the extent of costs incurred plus an estimate of the applicable fees earned. The Company considers fixed fees under cost-plus-fee contracts to be earned in proportion to the allowable costs incurred in performance of the contract. For cost-plus-fee contracts that include performance based fee incentives, and that are subject to the provisions of ASCAccounting Standards Codification (ASC) 605-35, Revenue Recognition—Construction-Type and Production-Type Contracts (ASC 605-35), the Company recognizes the relevant portion of the expected fee to be awarded by the customer at the time such fee can be reasonably estimated, based on factors such as the Company’s prior award experience and communications with the customer regarding performance. For such cost-plus-fee contracts subject to the provisions of ASC 605-10-S99,Revenue Recognition—SEC Materials (ASC 605-10-S99), the Company recognizes the relevant portion of the fee upon customer approval. Revenue on time-and-materialtime and material contracts is recognized to the extent of billable rates times hours delivered for services provided, to the extent of material cost for products delivered to customers, and to the extent of expenses incurred on behalf of the customers. Shipping and handling fees charged to the customers are recognized as revenue at the time products are delivered to the customers.
The Company has four basic categories of fixed price contracts: fixed unit price, fixed price-level of effort, fixed price-completion, and fixed price-license. Revenue on fixed unit price contracts, where specified units of output under service arrangements are delivered, is recognized as units are delivered based on the specified price per unit. Revenue on fixed unit price maintenance contracts is recognized ratably over the length of the service period. Revenue for fixed price-level of effort contracts is recognized based upon the number of units of labor actually delivered multiplied by the agreed rate for each unit of labor.
CACI INTERNATIONAL INC
NOTES TO CONSOLIDATED FINANCIAL STATEMENTS—(Continued)
A significant portion of the Company’s fixed price-completion contracts involve the design and development of complex client systems. For these contracts that are within the scope of ASC 605-35, revenue is recognized on the percentage-of-completion method using costs incurred in relation to total estimated costs. For fixed price-completion contracts that are not within the scope of ASC 605-35, revenue is generally recognized ratably over the service period. The Company’s fixed price-license agreements and related services contracts are primarily executed in its international operations. As the agreements to deliver software require significant production, modification or customization of software, revenue is recognized using the contract accounting guidance of ASC 605-35. For agreements to deliver data under license and related services, revenue is recognized as the data is delivered and services are performed. Except for losses on contracts accounted for under
CACI INTERNATIONAL INC
NOTES TO CONSOLIDATED FINANCIAL STATEMENTS—(Continued)
ASC 605-10-S99, provisions for estimated losses on uncompleted contracts are recorded in the period such losses are determined. Losses on contracts accounted for under ASC 605-10-S99 are recognized as the services and materials are provided.
The Company’s contracts may include the provision of more than one of its services. In these situations, and for applicable arrangements, revenue recognition includes the proper identification of separate units of accounting and the allocation of revenue across all elements based on relative fair values, with proper consideration given to the guidance provided by other authoritative literature.
Contract accounting requires judgment relative to assessing risks, estimating contract revenue and costs, and making assumptions for schedule and technical issues. Due to the size and nature of many of the Company’s contracts, the estimation of total revenue and cost at completion is complicated and subject to many variables. Contract costs include material, labor, subcontracting costs, and other direct costs, as well as an allocation of allowable indirect costs. Assumptions have to be made regarding the length of time to complete the contract because costs also include expected increases in wages and prices for materials. For contract change orders, claims or similar items, the Company applies judgment in estimating the amounts and assessing the potential for realization. These amounts are only included in contract value when they can be reliably estimated and realization is considered probable. Incentives or penalties related to performance on contracts are considered in estimating sales and profit rates, and are recorded when there is sufficient information for the Company to assess anticipated performance. Estimates of award fees for certain contracts are also a factor in estimating revenue and profit rates based on actual and anticipated awards.
Long-term development and production contracts make up a large portion of the Company’s business, and therefore the amounts recorded in the Company’s financial statements using contract accounting methods are material. For federal government contracts, the Company follows U.S. government procurement and accounting standards in assessing the allowability and the allocability of costs to contracts. Due to the significance of the judgments and estimation processes, it is likely that materially different amounts could be recorded if the Company used different assumptions or if the underlying circumstances were to change. The Company closely monitors compliance with, and the consistent application of, its critical accounting policies related to contract accounting. Business operations personnel conduct thorough periodic contract status and performance reviews. When adjustments in estimated contract revenue or costs are required, any changes from prior estimates are generally included in earnings in the current period. Also, regular and recurring evaluations of contract cost, scheduling and technical matters are performed by management personnel who are independent from the business operations personnel performing work under the contract. Costs incurred and allocated to contracts with the U.S. government are scrutinized for compliance with regulatory standards by Company personnel, and are subject to audit by the Defense Contract Audit Agency (DCAA).
From time to time, the Company may proceed with work based on client direction prior to the completion and signing of formal contract documents. The Company has a formal review process for approving any such work. Revenue associated with such work is recognized only when it can be reliably estimated and realization is
CACI INTERNATIONAL INC
NOTES TO CONSOLIDATED FINANCIAL STATEMENTS—(Continued)
probable. The Company bases its estimates on previous experiences with the client, communications with the client regarding funding status, and its knowledge of available funding for the contract or program.
The Company’s U.S. government contracts (94.8(94.9 percent of total revenue in the year ended June 30, 2010)2011) are subject to subsequent government audit of direct and indirect costs. Incurred cost audits have been completed through June 30, 2005. Management does not anticipate any material adjustment to the consolidated financial statements in subsequent periods for audits not yet started or completed.
CACI INTERNATIONAL INC
NOTES TO CONSOLIDATED FINANCIAL STATEMENTS—(Continued)
Costs of Revenue
Costs of revenue include all direct contract costs as well as indirect overhead costs and selling, general and administrative expenses that are allowable and allocable to contracts under federal procurement standards. Costs of revenue also include costs and expenses that are unallowable under applicable procurement standards, and are not allocable to contracts for billing purposes. Such costs and expenses do not directly generate revenue, but are necessary for business operations.
Cash and Cash Equivalents
The Company considers all investments with an original maturity of three months or fewer on their trade date to be cash equivalents. The Company classifies investments with an original maturity of more than three months but less than twelve months on their trade date as short-term marketable securities.
Investments in Marketable Securities
From time to time, the Company invests in marketable securities that are classified as available-for-sale and are reported at fair value. Unrealized gains and losses as a result of changes in the fair value of the available-for-sale investments are recorded as a separate component within accumulated other comprehensive income in the accompanying consolidated balance sheets. For securities classified as trading securities, unrealized gains and losses are reported in the consolidated statement of operations and impact net earnings.
The fair value of marketable securities is determined based on quoted market prices at the reporting date for those securities. The cost of securities sold is determined using the specific identification method. Premiums and discounts are amortized over the period from acquisition to maturity, and are included in investment income, along with interest and dividends.
Allowance For Doubtful Accounts
The Company establishes bad debt reserves against certain billed receivables based upon the latest information available to determine whether invoices are ultimately collectible. Whenever judgment is involved in determining the estimates, there is the potential for bad debt expense and the fair value of accounts receivable to be misstated. Given that the Company primarily serves the U.S. government and that, in management’s opinion, the Company has sufficient controls in place to properly recognize revenue, the Company believes the risk to be relatively low that a misstatement of accounts receivable would have a material impact on its consolidated financial statements. Accounts receivable balances are written-off when the balance is deemed uncollectible after exhausting all reasonable means of collection.
Inventories
Inventories are stated at the lower of cost or market using the specific identification cost method, and are recorded within prepaid expenses and other current assets on the accompanying consolidated balance sheets.
CACI INTERNATIONAL INC
NOTES TO CONSOLIDATED FINANCIAL STATEMENTS—(Continued)
Goodwill
Goodwill represents the excess of costs over the fair value of assets of businesses acquired. Goodwill and intangible assets acquired in a purchase business combination and determined to have an indefinite useful life are not amortized, but instead tested for impairment at least annually or if impairment indicators are present. The evaluation includes comparing the fair value of the relevant reporting unit to the carrying value, including goodwill, of such unit. If the fair value exceeds the carrying value, no impairment loss is recognized. However, if
CACI INTERNATIONAL INC
NOTES TO CONSOLIDATED FINANCIAL STATEMENTS—(Continued)
the carrying value of the reporting unit exceeds its fair value, the goodwill of the reporting unit may be impaired. Impairment is measured by comparing the derived fair value of the goodwill to its carrying value. Separately identifiable intangible assets with estimable useful lives are amortized over their respective estimated useful lives to their estimated residual values, and reviewed for impairment at least annually or if impairment indicators are present.
The Company has two reporting units—domestic operations and international operations. Its reporting units are the same as its operating segments. Approximately 95 percent of the Company’s goodwill is attributable to its domestic operations. The Company estimates the fair value of its reporting units using both an income approach and a market approach. The valuation process considers management’s estimates of the future operating performance of each reporting unit. Companies in similar industries are researched and analyzed and management considers the domestic and international economic and financial market conditions, both in general and specific to the industry in which the Company operates, prevailing as of the valuation date. The income approach utilizes discounted cash flows. The Company calculates a weighted average cost of capital for each reporting unit in order to estimate the discounted cash flows. The Company performs its annual testing for impairment of goodwill and other indefinite life intangible assets as of June 30 of each year. The fair value of each of the Company’s reporting units as of June 30, 20102011 significantly exceeded its carrying value by more than 50 percent.value.
Long-Lived Assets (Excluding Goodwill)
Long-lived assets such as property and equipment and intangible assets subject to amortization are reviewed for impairment whenever events or circumstances indicate that the carrying amount of an asset may not be fully recoverable. An impairment loss iswould be recognized if the sum of the long-term undiscounted cash flows is less than the carrying amount of the long-lived asset being evaluated. Any write-downs are treated as permanent reductions in the carrying amount of the assets. The Company believes that the carrying values of its long-lived assets as of June 30, 2010 and 2009 are fully realizable.
Property and Equipment
Property and equipment is recorded at cost. Depreciation of equipment and furniture has been provided over the estimated useful life of the respective assets (ranging from three to eight years) using the straight-line method. Leasehold improvements are generally amortized using the straight-line method over the remaining lease term or the useful life of the improvements, whichever is shorter. Repairs and maintenance costs are expensed as incurred. Separately identifiable intangible assets with estimable useful lives are amortized over their respective estimated useful lives to their estimated residual values. The Company believes that the carrying values of its long-lived assets as of June 30, 2011 and 2010 are fully realizable.
External Software Development Costs
Costs incurred in creating a software product to be sold or licensed for external use are charged to expense when incurred as indirect costs and selling expenses until technological feasibility has been established for the software. Technological feasibility is established upon completion of a detailed program design or, in its absence, completion of a working software version. Thereafter, all such software development costs are capitalized and subsequently reported at the lower of unamortized cost or estimated net realizable value. Capitalized costs are amortized on a straight-line basis over the remaining estimated economic life of the product.
Internal Software Development Costs
The Company capitalizes both internal and external costs incurred to develop internal-use computer software during the application development stage. These costs are classified as property and equipment and are amortized over the estimated economic useful life of the software, ranging from five to 10 years.
CACI INTERNATIONAL INC
NOTES TO CONSOLIDATED FINANCIAL STATEMENTS—(Continued)
Supplemental Retirement Savings Plan
The Company maintains the CACI International Inc Group Executive Retirement Plan (the Supplemental Savings Plan) and maintains the underlying assets in a Rabbi Trust. The Supplemental Savings Plan is a
CACI INTERNATIONAL INC
NOTES TO CONSOLIDATED FINANCIAL STATEMENTS—(Continued)
non-qualified defined contribution supplemental retirement savings plan for certain key employees whereby participants may elect to defer and contribute a portion of their compensation, as permitted by the plan. Each participant directs his or her investments in the Supplemental Savings Plan (see Note 21)20).
A Rabbi Trust is a grantor trust established to fund compensation for a select group of management. The assets of this trust are available to satisfy the claims of general creditors in the event of bankruptcy of the Company. The assets held by the Rabbi Trust are invested in both corporate owned life insurance (COLI) products and in non-COLI products. The COLI products are recorded at cash surrender value in the consolidated financial statements as supplemental retirement savings plan assets and the non-COLI products are recorded at fair value in the consolidated financial statements as supplemental retirement savings plan assets. The amounts due to participants are based on contributions, participant investment elections, and other participant activity and are recorded at fair value as supplemental retirement savings plan obligations.
Deferred Financing Costs
Costs associated with obtaining the Company’s financing arrangements are deferred and amortized over the term of the financing arrangements using the effective interest method.
Income Taxes
Income taxes are accounted for using the asset and liability method whereby deferred tax assets and liabilities are recognized for the future tax consequences attributable to differences between the consolidated financial statement carrying amounts of assets and liabilities, and their respective tax bases, and operating loss and tax credit carry forwards. The Company accounts for tax contingencies in accordance with updates made to ASC 740-10-25,Income Taxes—Recognition. Deferred tax assets and liabilities are measured using enacted tax rates expected to apply to taxable income in the years in which those temporary differences are expected to be recovered or settled. The effect on deferred tax assets and liabilities due to a change in tax rates is recognized in income in the period that includes the enactment date. Estimates of the realizability of deferred tax assets are based on the scheduled reversal of deferred tax liabilities, projected future taxable income, and tax planning strategies. Any interest or penalties incurred in connection with income taxes are recorded as part of income tax expense for financial reporting purposes.
Costs of Acquisitions
Through June 30, 2009, costs incurred by the Company related to legal, financial and other professional advisors that were directly related to successful acquisitions were capitalized as a cost of the acquisition. Such costs for unsuccessful or terminated acquisition opportunities were expensed when the Company determined that the opportunity would no longer be pursued. Effective July 1, 2009, all such costs associated with acquisitions, successful or unsuccessful, are expensed as incurred.
Research and Development Costs
Company-sponsored research and development costs, including costs to develop proprietary software for external use prior to establishing technological feasibility, are expensed as incurred. Such expenses are included in indirect costs and selling expenses in the accompanying consolidated statements of operations.
CACI INTERNATIONAL INC
NOTES TO CONSOLIDATED FINANCIAL STATEMENTS—(Continued)
Foreign Currency Translation
The assets and liabilities of the Company’s foreign subsidiaries whose functional currency is other than the U.S. dollar are translated at the exchange rate in effect on the reporting date, and income and expenses are translated at the weighted-average exchange rate during the period. The Company’s primary practice is to negotiate contracts in the same currency in which the predominant expenses are incurred, thereby mitigating the exposure to foreign currency fluctuations. The net translation gains and losses are not included in determining net income, but are accumulated as a separate component of shareholders’ equity. Foreign currency transaction gains and losses are included in determining net income, but are insignificant. These costs are included as indirect costs and selling expenses in the accompanying consolidated statements of operations.
Earnings Per Share
Basic earnings per share is computed using the sum of the weighted-average number of shares of common stock outstanding during the period and shares issued during the period are weighted for the portion of the period
CACI INTERNATIONAL INC
NOTES TO CONSOLIDATED FINANCIAL STATEMENTS—(Continued)
that they were outstanding. Diluted earnings per share is computed in a manner similar to that used for basic earnings per share after giving effect to the dilutive effects of the exercise of stock settled stock appreciation rights and stock options and the vesting of restricted stock and restricted stock units. In addition, diluted earnings per share reflect the dilutive effects of restricted stock units with performance conditions in the reporting period in which the performance metric is achieved. When applicable, diluted earnings per share will reflect the dilutive effects of shares issuable under the Notes,Company’s $300.0 million of 2.125 percent convertible senior subordinated notes that were issued on May 16, 2007 and mature on May 1, 2014 (the Notes), and warrants to issue 5.5 million shares of CACI common stock at an exercise price of $68.31 per share that were issued in May 2007. Information about the weighted-average number of basic and diluted shares is presented in Note 24.
Derivative Instrument and Hedging Activities
The Company accounts for derivative instruments and hedging activities in accordance with ASC 815, Derivatives and Hedging(ASC 815). Derivatives are recognized as either assets or liabilities in the consolidated balance sheets, and gains and losses are recognized based on changes in the fair values. Gains and losses on derivatives designated as a hedge, or deemed to be an effective hedge, are deferred in accumulated other comprehensive loss in the accompanying consolidated balance sheets, and then recognized upon contract completion. Gains and losses on derivatives that are not designated as a hedge, or that are not intended to be an effective hedge, are recognized upon the changes in fair values and are recorded in the accompanying consolidated statements of operations. The classification of gains and losses resulting from the changes in fair values is dependent on the intended use of the derivative and its resulting designation. The Company uses the change in variable cash flow method to measure the effectiveness of its hedges. The Company classifies the cash flows associated with its derivative instruments in the same category as the cash flows for the debt being hedged.
From time to time, the Company will enter into interest rate hedging agreements to manage exposure to fluctuations in rates on its variable rate debt. These agreements effectively allow the Company to exchange variable rate debt for fixed rate debt, or to place an upper limit on variable rate debt through the use of an interest rate cap. The Company enters into such derivative instrument agreements only to hedge cash flows. The Company does not hold or issue such financial instruments for trading purposes, nor is it a party to leveraged derivatives. As of June 30, 2010, the Company had no outstanding interest rate hedging agreements (see Note 14).23.
Fair Value of Financial Instruments
The carrying amounts of cash and cash equivalents, accounts receivable, accounts payable and amounts included in other current assets and current liabilities that meet the definition of a financial instrument approximate fair value because of the short-term nature of these amounts.
CACI INTERNATIONAL INC
NOTES TO CONSOLIDATED FINANCIAL STATEMENTS—(Continued)
The fair value of the Company’s debt under its bank credit facility the entire balance of which has been classified on the consolidated balance sheet at June 30, 2010 as short-term as it expires in May 2011, approximates its carrying value at June 30, 2010.2011. The fair value of the Company’s debt under its bank credit facility was estimated using market data on companies with a corporate rating similar to CACI’s that have recently priced credit facilities. The fair value of the Notes is based on quoted market prices. Seeprices (see Note 14.13).
Concentrations of Credit Risk
Financial instruments that potentially subject the Company to credit risk include accounts receivable and cash equivalents. Management believes that credit risk related to the Company’s accounts receivable is limited due to a large number of customers in differing segments and agencies of the U.S. government. Accounts receivable credit risk is also limited due to the credit worthiness of the U.S. government. Management believes the credit risk associated with the Company’s cash equivalents is limited due to the credit worthiness of the obligors of the investments underlying the cash equivalents. In addition, although the Company maintains cash balances at financial institutions that exceed federally insured limits, these balances are placed with high quality financial institutions.
Comprehensive Income
Comprehensive income is the change in equity of a business enterprise during a period from transactions and other events and circumstances from non-owner sources. Other comprehensive income refers to revenue, expenses, and gains and losses that under U.S. GAAP are included in comprehensive income, but excluded from the determination of net income. The elements within other comprehensive income net of tax, consist of foreign currency translation adjustments,adjustments; the changes in the fair value of interest rate swap agreements, net of tax; and differences between actual amounts and estimates based on actuarial assumptions and the effect of changes in actuarial assumptions made under the Company’s post-retirement benefit plans, net of tax (see Note 16)15).
As of June 30, 20102011 and 2009,2010, accumulated other comprehensive loss included a loss of $9.1$2.4 million and $1.4$9.1 million, respectively, related to foreign currency translation adjustments and a loss of $0.7 million and $0.8 million, respectively,in both years, related to unrecognized post-retirement medical plan costs. Accumulated other comprehensive loss as of June 30, 2009 also included $1.0 million of losses related to the fair value of interest rate swaps.
Use of Estimates
The preparation of financial statements in conformity with U.S. GAAP requires management to make estimates and assumptions that affect the reported amounts of assets and liabilities and disclosure of contingent
CACI INTERNATIONAL INC
NOTES TO CONSOLIDATED FINANCIAL STATEMENTS—(Continued)
assets and liabilities at the date of the consolidated financial statements and the reported amounts of revenue and expenses during the reported periods. The significant management estimates include estimated costs to complete fixed-price contracts, estimated award fees for contracts accounted for under ASC 605-35, amortization periods for long-lived intangible assets, recoverability of long-lived assets, reserves for accounts receivable, reserves for contract related matters, reserves for unrecognized tax benefits, contingent consideration amounts to be earnedpaid in connection with certain acquisitions completed on or after July 1, 2009 and loss contingencies. Actual results could differ from these estimates.
Commitments and Contingencies
Liabilities for loss contingencies arising from claims, assessments, litigation, fines and penalties and other sources are recorded when it is probable that a liability has been incurred and the amount of the assessment and/or remediation can be reasonably estimated.
CACI INTERNATIONAL INCReclassifications
NOTES TO CONSOLIDATED FINANCIAL STATEMENTS—(Continued)Certain reclassifications have been made to the prior years’ financial statements in order to conform to the current presentation.
NOTE 4.3. RECENTLY ISSUED ACCOUNTING PRONOUNCEMENTS
In additionThe Company adopted the provisions of updates to the new accounting pronouncements described in Notes 1ASC 470-20,Debt with Conversion and 2 above, the FASB has recently published the following accounting pronouncements.
In September 2006, the FASB issued Other Options(ASC 820,Fair Value Measurements470-20) and DisclosuresASC 810,Consolidation (ASC 820). ASC 820 establishes a framework for measuring fair value under generally accepted accounting principles, clarifies the definition of fair value, and expands disclosures about fair value measurements. ASC 820 does not require any new fair value measurements. ASC 820 was810) effective for the Company on July 1, 2008. Its adoption did not have a material impact on the Company’s results of operations or financial position. See Note 23.2009.
In December 2007,ASC 470-20 governs the FASB issued ASC 805,Business Combinations (ASC 805). ASC 805 establishes principlesaccounting for convertible debt with cash settlement options and requirementsaccordingly applies to the Company’s convertible debt. Under this standard, the Company separately accounts for how companies recognizethe liability and measure identifiable assets acquired, liabilities assumed, and any noncontrolling interest in connection with a business combination; recognize and measure the goodwill acquired in a business combination or a gain from a bargain purchase; and determine what information to disclose to enable usersequity (conversion option) components of the financial statementsNotes, and recognizes interest expense on the Notes using an interest rate in effect for comparable debt instruments that do not contain conversion features. The effective interest rate used under the standard, 6.9 percent, is significantly higher than the coupon rate of 2.125 percent used prior to evaluateadoption to record interest expense.
Based on the nature and financial effectseffective rate of 6.9 percent, the fair value of the business combination. ASC 805liability component of the Notes at May 16, 2007 was effectivemeasured at $221.9 million, and has been reflected as the carrying amount of the Notes at issuance. The $78.1 million difference between the recast initial carrying amount and the $300.0 million of gross proceeds is accounted for as an unamortized debt discount that is recognized over the Company for business combinations completed on or after July 1, 2009. Its adoption did not haveseven year term of the Notes as a material impact onnon-cash component of interest expense. This difference also represents the Company’s resultsfair value of operations or financial positionthe embedded conversion option. This amount, net of the income tax effect of $30.7 million as of the date of adoption.issue, was recorded within shareholders’ equity as additional paid-in capital. The income tax effect of $30.7 million was retroactively recognized as a long-term deferred tax liability as of May 16, 2007. This deferred tax liability was netted against the deferred tax asset of $32.8 million associated with the original issue discount originally recorded as of May 16, 2007. Under the revised provisions of ASC 470-20, the Company also reclassified, as of the date of issue, $2.0 million of the Notes’ issuance costs from other long-term assets to additional paid-in capital, and recognized a deferred tax asset of $0.8 million related to this reclassification.
In February 2008, the FASB issued an update to ASC 820. This update amended ASC 820 to delay the effective date for the fair valuation of non-financial assets and liabilities, except for items that are recognized or disclosed at fair value in the financial statements on a recurring basis. For items within its scope, the update deferred the effective date of the fair value measurement to the start of the Company’s current fiscal year, or July 1, 2009. The Company has evaluated the effect of this update for its non-financial assets and liabilities and determined that there was no material impact.
In March 2008, the FASB issued updates to ASC 815 which requires expanded disclosures about derivative and hedging activities. This update changes the disclosure requirements for derivative instruments and hedging activities by requiring companies to provide enhanced disclosures about how and why they use derivative instruments, how derivative instruments and related hedged items are accounted for under ASC 815, and how derivative instruments and related hedged items affect a company’s financial position, financial performance, and cash flows. These updates were effective for fiscal periods beginning after November 15, 2008, with earlier adoption encouraged. The Company has included the additional disclosures in Note 14.
In April 2008, the FASB issued updates to ASC 350-30-35,General Intangibles Other Than Goodwill—Subsequent Measurement, which amends the factors that should be considered in developing renewal or extension assumptions used to determine the useful life of a recognized intangible asset. These updates were effective for the Company beginning July 1, 2009 and did not have a material effect on its results of operations or financial position.
In June 2008, the FASB issued updates to ASC 815-40,Derivatives and Hedging—Contracts in Entity’s Own Equity (ASC 815-40). The updates to ASC 815-40 provide guidance on how a company should determine if certain financial instruments (or embedded features) are considered indexed to its own stock, including instruments similar470-20 had the effect of significantly increasing interest expense with the amortization of the debt discount. Income tax expense decreased by the incremental benefit related to the conversion optionincreased interest expense, and net income and basic and diluted earnings per share decreased due to the after-tax effect of the Notes, convertible note hedges, and warrantsincremental interest expense. While there was no effect on operating or total cash flows, certain amounts within the cash flows from operating activities were retroactively adjusted to purchase Company stock. The updates require that a two-step approach be usedreflect the impact of changes to evaluate an instrument’s contingent exercise provisions and settlement provisions in determining whether the instrument is considered to be indexed to its own stock, and exempt from the application of derivative treatment under ASC 815.These updates were effective470-20 for the Company on July 1,year ended June 30, 2009. The Company has evaluated its financial instruments that are indexed to its common stock and concluded that they are excluded from the derivative treatment provisions of ASC 815.
CACI INTERNATIONAL INC
NOTES TO CONSOLIDATED FINANCIAL STATEMENTS—(Continued)
In December 2008,The retroactive effects of the FASB issuedASC 470-20 updates on the Company’s financial position as of June 30, 2009, and on the results of operations and cash flows for the year then ended, are shown in the tables below. Current period balances related to the convertible debt and interest expense thereon are described in Note 13.
The updates to ASC 715,Compensation—Retirement Benefits that require detailed disclosures about investment strategies, fair value measurements810 established new accounting and concentrationsreporting standards for 1) noncontrolling ownership interests in subsidiaries, 2) the amount of risk regarding plan assets of a company’s defined benefit plan or other postretirement plan. The new disclosures are requiredconsolidated net income (loss) attributable to be made forthe Company and to the noncontrolling interests, 3) changes in the Company’s fiscalownership interest and 4) the valuation of retained noncontrolling equity investments when a subsidiary is deconsolidated. ASC 810 also established additional reporting requirements that identify and distinguish between the ownership interest of the Company and that of the noncontrolling owners.
In accordance with the provisions of ASC 810, the Company retrospectively reclassified the “Minority interest in joint venture” balance associated with its investment in eVenture Technology, LLC (eVentures) previously included in “Other long-term liabilities” in the consolidated balance sheet to a new component of shareholders’ equity entitled “Noncontrolling interest in joint venture”. In the Statement of Operations for the year ended June 30, 2010. The impact2009, the Company retrospectively included the minority interest in earnings of the new disclosure requirements was minimal asjoint venture within its consolidated net income before noncontrolling interest in earnings of joint venture, and deducted the same amount to derive net income attributable to CACI.
The impacts of the updates to ASC 470-20 and ASC 810 on the Company’s retirement benefit plan and its post-retirement benefit arrangements are unfunded asresults of operations for the year ended June 30, 2010. See Note 16.2009 are as follows (in thousands, except per share data):
| Year Ended June 30, 2009 | ||||||||||||||||
| Effects of Retroactively Adopting Accounting Standard Updates to: | ||||||||||||||||
| As Previously Reported | ASC 470-20 | ASC 810 | As Adjusted | |||||||||||||
Interest expense and other | $ | 23,062 | $ | 9,521 | $ | (719 | ) | $ | 31,864 | |||||||
|
|
|
|
|
|
|
| |||||||||
Income before income taxes | $ | 161,791 | $ | (9,521 | ) | $ | 719 | $ | 152,989 | |||||||
Income taxes | 66,311 | (3,739 | ) | — | 62,572 | |||||||||||
|
|
|
|
|
|
|
| |||||||||
Net income before noncontrolling interest in earnings of joint venture | $ | 95,480 | $ | (5,782 | ) | $ | 719 | $ | 90,417 | |||||||
|
| |||||||||||||||
Noncontrolling interest in earnings of joint venture | — | (719 | ) | (719 | ) | |||||||||||
|
|
|
|
|
| |||||||||||
Net income attributable to CACI | $ | (5,782 | ) | $ | — | $ | 89,698 | |||||||||
|
|
|
|
|
| |||||||||||
Basic earnings per share | $ | 3.19 | $ | (0.20 | ) | $ | — | $ | 2.99 | |||||||
|
|
|
|
|
|
|
| |||||||||
Diluted earnings per share | $ | 3.14 | $ | (0.19 | ) | $ | — | $ | 2.95 | |||||||
|
|
|
|
|
|
|
| |||||||||
Weighted-average basic shares outstanding | 29,976 | — | — | 29,976 | ||||||||||||
|
|
|
|
|
|
|
| |||||||||
Weighted-average diluted shares outstanding | 30,427 | — | — | 30,427 | ||||||||||||
|
|
|
|
|
|
|
| |||||||||
CACI INTERNATIONAL INC
In April 2009,NOTES TO CONSOLIDATED FINANCIAL STATEMENTS—(Continued)
The impacts of the FASB updatedupdates to ASC 825,Financial Instruments, by requiring new disclosures about470-20 and ASC 810 on the fair valueCompany’s statement of financial instruments in interim periods whencash flows for the fair values are practicable to estimate. The updates were effective for interim and annual periods ending after June 15, 2009, and were adopted by the Company effectiveyear ended June 30, 2009. The additional reporting requirements did not materially change the Company’s disclosures of fair value.2009 are as follows (in thousands):
In May 2009, the FASB issued ASC 855,Subsequent Events (ASC 855), effective for financial periods ending after June 15, 2009. ASC 855 established principles and requirements for subsequent events, including the period after the balance sheet date during which management of a reporting entity shall evaluate events for potential disclosure in the financial statements, the circumstances that warrant disclosure, and the specific disclosure requirements for transactions that occur after the balance sheet date. The Company adopted ASC 855 as of June 30, 2009. The Company has evaluated all events and transactions that occurred after June 30, 2010, and found that during this period it did not have any subsequent events requiring financial statement recognition.
| Year Ended June 30, 2009 | ||||||||||||||||
| Effects of Retroactively Adopting Accounting Standard Updates to: | ||||||||||||||||
| As Previously Reported | ASC 470-20 | ASC 810 | As Adjusted | |||||||||||||
Cash Flows from Operating Activities: | ||||||||||||||||
Net income before non-controlling interests | $ | 95,480 | $ | (5,782 | ) | $ | 719 | $ | 90,417 | |||||||
Non-cash interest expense | — | 9,809 | — | 9,809 | ||||||||||||
Amortization of deferred financing costs | 2,841 | (288 | ) | — | 2,553 | |||||||||||
Deferred income tax expense (benefit) | 13,363 | (3,739 | ) | — | 9,624 | |||||||||||
Changes in other liabilities | (359 | ) | — | (881 | ) | (1,240 | ) | |||||||||
Net cash provided by operating activities | 151,080 | — | (162 | ) | 150,918 | |||||||||||
Cash Flows from Financing Activities: | ||||||||||||||||
Other activities | (1,318 | ) | — | 162 | (1,156 | ) | ||||||||||
Net cash used in financing activities | (21,263 | ) | — | 162 | (21,101 | ) | ||||||||||
In June 2009, the FASB issued updates to ASC 810,Consolidation (ASC 810). These ASC 810 updates amend the accounting standards pertaining to the consolidation of certain variable interest entities, and when and how to determine, or re-determine, whether an entity is a variable interest entity. In addition, ASC 810 replaces the quantitative approach for determining who has a controlling financial interest in a variable interest entity with a qualitative approach, and requires ongoing assessments of whether an entity is the primary beneficiary of a variable interest entity. The updates to ASC 810 arewere effective for the Company beginning July 1, 2010. CACI is currently evaluatingThe adoption of ASC 810 did not have a material effect on the accounting changes required by these updates and does not expect the impact, if any, to be material on itsCompany’s financial position or results of operations.
In October 2009, the FASB issued ASUAccounting Standard Update (ASU) No. 2009-13,Multiple-Deliverable Revenue Arrangements (ASU 2009-13) which amends ASC Topic 605,Revenue Recognition. This accounting update establishes a hierarchy for determining the value of each element within a multiple deliverable arrangement. ASU 2009-13 iswas effective for the Company beginning July 1, 2010 and applies to arrangements entered into on or after this date. The Company is currently evaluating the impact thatadoption of ASU 2009-13 maydid not have a material effect on itsthe Company’s financial position andor results of operations, and does not expect the impact, if any, to be material.operations.
In October 2009, the FASB issued ASU No. 2009-14,Certain Revenue Arrangements That Include Software Elements (ASU 2009-14), which updates ASC Topic 985, Software. ASU 2009-14 clarifies which accounting guidance should be used for purposes of measuring and allocating revenue for arrangements that contain both tangible products and software, and where the software is more than incidental to the tangible product as a whole. ASU 2009-14 iswas effective for the Company’s fiscal yearCompany beginning July 1, 2010 and applies to arrangements entered into on or after this date. The Company is currently evaluating the impact thatadoption of ASU 2009-14 maydid not have a material effect on itsthe Company’s financial position andor results of operations, and does not expect the impact, if any, to be material.operations.
In January 2010, the FASB issued ASU No. 2010-06,Fair Value Measurements and Disclosures (Topic 820)—Improving Disclosures about Fair Value Measurements(ASU 2010-06). This update requires new
CACI INTERNATIONAL INC
NOTES TO CONSOLIDATED FINANCIAL STATEMENTS—(Continued)
disclosures around transfers into and out of Levels 1 and 2 in the fair value hierarchy, and separate disclosures about purchases, sales, issuances, and settlements related to Level 3 measurements. ASU 2010-06 iswas effective for interim and annual reporting periods beginning after December 15, 2009 with early adoption permitted, except for the disclosures about purchases, sales, issuances, and settlements in the rollforward of Level 3 activity. Those disclosures are effective for fiscal years beginning after December 15, 2010 and for interim periods within those fiscal years with early adoption permitted. The Company has provided the required disclosures regarding
CACI INTERNATIONAL INC
NOTES TO CONSOLIDATED FINANCIAL STATEMENTS—(Continued)
the valuation techniques utilized in measuring its Level 3 assets and liabilities (see Note 23)22). The Company will adopt the provisions of ASU 2010-06 pertaining to transfers into and out of the Level 3 category effective July 1, 2011.
In December 2010, the FASB issued ASU No. 2010-29,Disclosure of Supplementary Pro Forma Information for Business Combinations (ASU 2010-29) which amends ASC Topic 805,Business Combinations. This accounting update specifies that if a public entity presents comparative financial statements, the entity should disclose revenue and earnings of the combined entity as though the business combination that occurred during the current year had occurred as of the beginning of the comparable prior annual reporting period only. ASU 2010-29 is effective for the Company beginning July 1, 2011 and applies to acquisitions entered into on or after this date. The adoption of ASU 2010-29 will not have a material impact on the Company’s financial position or results of operations.
In June 2011, the FASB issued ASU No. 2011-05,Presentation of Comprehensive Income (ASU 2011-05) which amends ASC Topic 220,Comprehensive Income. This accounting update requires companies to present the total of comprehensive income, the components of net income, and the components of other comprehensive income either in a single continuous statement of comprehensive income or in two separate but consecutive statements. ASU 2011-05 is effective for the Company beginning July 1, 2012. The adoption of ASU 2011-05 will impact disclosures only and will not impact the Company’s financial position or results of operations.
NOTE 5.4. ACQUISITIONS
Year Ended June 30, 20102011
During the year ended June 30, 2010,2011, the Company completed acquisitions of three businesses that have added to the Company’s portfolio of cyber security and information technology modernization solutions, two in the United States and one in the United Kingdom, as follows:
On October 6, 2009, the acquisition of 100 percent of a business in the United States that provides commercial security technology services;
On October 31, 2009, the acquisition of 100 percent of Monitor Media Limited, a United Kingdom-based company that builds complex transactional websites for commercial clients; and
On February 2,November 1, 2010, the acquisition of 100 percent of SystemWare Incorporated,TechniGraphics, Inc., a United States-based company that provides signalimaging and geospatial services to the U.S. government;
On November 1, 2010, the acquisition of 100 percent of Applied Systems Research, Inc, a United States-based company that provides technical services and analysis systemsproducts to the U.S. government; and
On February 10, 2011, the acquisition of 100 percent of Chronotech b.v., a Dutch company specializing in advanced on-line applications for cyber securitygovernment and counterintelligence applications.commercial organizations.
The combined initial purchase consideration to acquire these three businesses was approximately $87.5$132.5 million, of which $9.0$14.0 million was deposited into escrow accounts pending final determination of the net worth of the assets acquired and to secure the sellers’ indemnification obligations for the United States-based acquisitions and approximately $1.5 million was retained by CACI Limited to secure the United Kingdom-based sellers’ indemnification obligations (collectively, Indemnification Amounts). Remaining Indemnification Amounts, if any, at the end of the indemnification periods will be distributed to the Sellers. All remaining Indemnification Amounts, if any, are expected to be distributed to the sellers by October 2011.February 2013.
Subsequent to the dates of the acquisitions, the Company and the sellersSellers of each company agreed on the net worth of the assets acquired in each acquisition and, as a result, the Company paid an additional approximately $5.8$2.1 million of purchase consideration. In addition, the Company may be required to pay to the sellers of each company additional consideration (Contingent Consideration) of up to a total of approximately $49.0 million based upon events to occur in the first two years subsequent to the acquisition dates.
CACI INTERNATIONAL INC
NOTES TO CONSOLIDATED FINANCIAL STATEMENTS—(Continued)
The Company has completed its detailed valuations of the assets acquired and liabilities assumed, including recognizing a liability of $35.8 million for the fair value as of the acquisition date of Contingent Consideration. See Note 23 for additional informationassumed. Based on the valuation of Contingent Consideration. Based on itsCompany’s valuations, the total consideration of $129.1$134.6 million has been allocated to assets acquired, including identifiable intangible assets and goodwill, and liabilities assumed, as follows (in thousands):
Cash | $ | 4,843 | $ | 2,773 | ||||
Accounts receivable | 6,980 | 12,070 | ||||||
Prepaid expenses and other current assets | 6,950 | 1,267 | ||||||
Property and equipment | 2,220 | 2,143 | ||||||
Customer contracts, customer relationships, acquired technologies | 48,245 | |||||||
Customer contracts, customer relationships, non-compete agreements | 37,913 | |||||||
Goodwill | 83,049 | 98,800 | ||||||
Other assets | 93 | 51 | ||||||
Accounts payable | (705 | ) | (1,234 | ) | ||||
Accrued expenses and other current liabilities | (8,662 | ) | (7,153 | ) | ||||
Long-term deferred taxes | (13,944 | ) | (12,000 | ) | ||||
| ||||||||
Total consideration paid | $ | 129,069 | $ | 134,630 | ||||
| ||||||||
The value attributed to customer contracts, customer relationships and acquired technologiesnon-compete agreements is being amortized on an accelerated basis over periods ranging from twofour to 10 years.
During the year ended June 30, 2010,2011, these three businesses generated $28.5$40.0 million of revenue from the dates of acquisition through the Company’s fiscal year end.
Year Ended June 30, 2010
During the year ended June 30, 2010, the Company completed acquisitions of three businesses, two in the United States and one in the United Kingdom. The total consideration recorded to acquire these three businesses, including the amounts paid at closing, additional payments made subsequent to closing based on the final agreed net worth of the assets acquired in each acquisition, transaction costs paid, and the fair value at the date of each acquisition attributable to contingent consideration which may be paid to the sellers of each acquisition based on events to occur in the first two years subsequent to each acquisition date, was approximately $129.1 million. The Company recognized fair values of the assets acquired and liabilities assumed and allocated $83.0 million to goodwill and $48.2 million to other intangible assets, primarily customer relationships and acquired technologies, with the balance allocated to net tangible assets and liabilities assumed. These fair values represent management’s calculations of the fair values as of the acquisition dates and are based on analysis of supporting information.
The maximum contingent consideration that could have been paid in connection of all three acquisition was $49.0 million, and the combined acquisition date fair value was $35.8 million. During the year ended June 30, 2011, $3.3 million of contingent consideration was earned and paid in connection with one of the acquisitions, and the remaining fair value of the contingent consideration liability recorded as of June 30, 2011 related to all three acquisitions is $20.8 million. This amount is included in other accrued expenses and current liabilities on the accompanying consolidated balance sheet. See Notes 12 and 22 for additional information.
Year Ended June 30, 2009
During the year ended June 30, 2009, the Company completed acquisitions of three businesses in the United Kingdom. The total consideration paid for these three businesses, including transaction costs, was $27.4 million, using exchange rates in effect on the date of each acquisition. The Company recognized fair values of the assets
CACI INTERNATIONAL INC
NOTES TO CONSOLIDATED FINANCIAL STATEMENTS—(Continued)
acquired and liabilities assumed and allocated $21.0 million to goodwill; $4.1 million to other intangible assets, primarily computer software and customer relationships; and $2.3 million to net tangible assets. These fair values represent management’s calculations of the fair values as of the acquisition dates and are based on analysis of supporting information.
Two of the acquisitions contained provisions requiring that the Company pay additional consideration of up to a total of approximately $5.0 million, based upon events to occur subsequent to the acquisition date. During FY2010,the year ended June 30, 2010, in connection with one of the acquisitions, it was determined that no additional consideration would be due. In connection with the other acquisition, the events to determine the amount, if any, of such additional consideration will occur during the Company’s fiscal year ending June 30, 2011. Additional consideration earned in connection with this acquisition,due, if any, will be recordeddetermined as additional purchase price at such time as it is earned.
Year Ended June 30, 2008
During the year ended June 30, 2008, the Company completed acquisitions of five businesses, two in the United States and three in the United Kingdom. The acquisitions completed in the U.S. were:
On October 31, 2007, 100 percent of the outstanding shares of Athena Holding Corp., a holding company which owned 100 percentthree year anniversary of the outstanding shares of Athena Innovative Solutions, Inc.
CACI INTERNATIONAL INC
NOTES TO CONSOLIDATED FINANCIAL STATEMENTS—(Continued)
|
On November 1, 2007, 100 percent of the outstanding shares of Dragon Development Corporation (DDC), headquarteredacquisition in Columbia, Maryland. DDC provides professional, technical, and engineering services to United States intelligence organizations.January 2012.
The combined initial purchase consideration to acquire AIS and DDC was approximately $241 million, of which $13.3 million was originally deposited into escrow accounts (the Indemnification Escrow Accounts) pending final determination of the net worth of the assets acquired and to secure the sellers’ indemnification obligations and $2.4 million was deposited into a separate earn-out escrow account (the Earn-out Escrow Account) to be paid to the former DDC shareholders upon receipt of extension of certain contracts or achievement of a specified gross margin, as defined in the purchase agreement and schedules thereto. Subsequent to the date of acquisition, the Company and the sellers of each company agreed on the net worth of the assets acquired and as a result, the Company paid an additional $3.2 million of purchase consideration. In addition, the Company paid the entire $2.4 million in the Earn-out Escrow Account to the former DDC shareholders based upon contract extensions received subsequent to the date of acquisition. During the year ended June 30, 2009, the Company and the former shareholders of DDC agreed to retain $0.3 million of the DDC Indemnification Escrow Account pending resolution of a pre-acquisition matter and all other amounts in both Indemnification Escrow Accounts were distributed.
The combined purchase consideration for the three U.K. acquisitions was approximately $16.0 million.
NOTE 6.5. CASH AND CASH EQUIVALENTS
Cash and cash equivalents consisted of the following (cost approximates fair value) (in thousands):
| June 30, | June 30, | |||||||||||||
| 2010 | 2009 | 2011 | 2010 | |||||||||||
Cash | $ | 192,844 | $ | 2,114 | $ | 163,788 | $ | 192,844 | ||||||
Money market funds | 61,699 | 206,374 | 1,029 | 61,699 | ||||||||||
|
| |||||||||||||
Total cash and cash equivalents | $ | 254,543 | $ | 208,488 | $ | 164,817 | $ | 254,543 | ||||||
|
| |||||||||||||
NOTE 7.6. ACCOUNTS RECEIVABLE
Total accounts receivable, net of allowance for doubtful accounts of approximately $3.2$3.7 million and $3.5$3.2 million at June 30, 20102011 and 2009,2010, respectively, consisted of the following (in thousands):
| June 30, | ||||||
| 2010 | 2009 | |||||
Billed receivables | $ | 393,094 | $ | 384,421 | ||
Billable receivables at end of period | 84,107 | 71,341 | ||||
Unbilled receivables pending receipt of contractual documents authorizing billing | 53,832 | 21,263 | ||||
Total accounts receivable, current | 531,033 | 477,025 | ||||
Unbilled receivables, retainages and fee withholdings expected to be billed beyond the next 12 months | 9,291 | 8,677 | ||||
Total accounts receivable | $ | 540,324 | $ | 485,702 | ||
CACI INTERNATIONAL INC
NOTES TO CONSOLIDATED FINANCIAL STATEMENTS—(Continued)
| June 30, | ||||||||
| 2011 | 2010 | |||||||
Billed receivables | $ | 452,533 | $ | 393,094 | ||||
Billable receivables at end of period | 66,587 | 84,107 | ||||||
Unbilled receivables pending receipt of contractual documents authorizing billing | 53,922 | 53,832 | ||||||
|
|
|
| |||||
Total accounts receivable, current | 573,042 | 531,033 | ||||||
Unbilled receivables, retainages and fee withholdings expected to be billed beyond the next 12 months | 8,657 | 9,291 | ||||||
|
|
|
| |||||
Total accounts receivable | $ | 581,699 | $ | 540,324 | ||||
|
|
|
| |||||
NOTE 8.7. GOODWILL
For the year ended June 30, 2010,2011, goodwill increased as a result of the acquisitions made during the year (Note 5)4). Many of the acquisitions completed by the Company are structured in a manner whereby goodwill is deductible for income tax purposes. As of June 30, 2010,2011, the Company had $523.8$487.6 million of goodwill which is deductible for income tax purposes.
CACI INTERNATIONAL INC
NOTES TO CONSOLIDATED FINANCIAL STATEMENTS—(Continued)
NOTE 9.8. INTANGIBLE ASSETS
Intangible assets consisted of the following (in thousands):
| June 30, | June 30, | |||||||||||||||
| 2010 | 2009 | 2011 | 2010 | |||||||||||||
Customer contracts and related customer relationships | $ | 253,031 | $ | 233,531 | $ | 291,174 | $ | 253,031 | ||||||||
Acquired technologies | 27,177 | — | 27,177 | 27,177 | ||||||||||||
Covenants not to compete | 2,373 | 2,409 | 3,070 | 2,373 | ||||||||||||
Other | 1,631 | 851 | 1,637 | 1,631 | ||||||||||||
|
| |||||||||||||||
Intangible assets | 284,212 | 236,791 | 323,058 | 284,212 | ||||||||||||
Less accumulated amortization | (175,914 | ) | (138,962 | ) | (214,956 | ) | (175,914 | ) | ||||||||
|
| |||||||||||||||
Total intangible assets, net | $ | 108,298 | $ | 97,829 | $ | 108,102 | $ | 108,298 | ||||||||
|
| |||||||||||||||
Intangible assets are primarily amortized on an accelerated basis over periods ranging from 12 to 120 months. The weighted-average period of amortization for customer contracts and related customer relationships as of June 30, 20102011 is 8.38.5 years, and the weighted-average remaining period of amortization is 5.66.8 years. The weighted-average period of amortization for acquired technologies as of June 30, 20102011 is 6.7 years, and the weighted-average remaining period of amortization is 6.36.0 years.
Amortization expense for the years ended June 30, 2011, 2010 and 2009 and 2008 was $38.8 million, $37.2 million, and $32.1 million, respectively. Accumulated amortization as of June 30, 2011 for customer contracts and $31.8related customer relationships and for acquired technologies was $198.7 million and $13.0 million, respectively. Expected amortization expense for each of the fiscal years through June 30, 20152016 and for periods thereafter is as follows (in thousands):
| Amount | Amount | ||||||
Year ending June 30, 2011 | $ | 35,141 | |||||
Year ending June 30, 2012 | 23,467 | $ | 29,261 | ||||
Year ending June 30, 2013 | 15,938 | 21,677 | |||||
Year ending June 30, 2014 | 12,801 | 17,859 | |||||
Year ending June 30, 2015 | 9,003 | 13,296 | |||||
Year ending June 30, 2016 | 8,606 | ||||||
Thereafter | 11,948 | 17,403 | |||||
| |||||||
Total intangible assets, net | $ | 108,298 | $ | 108,102 | |||
| |||||||
NOTE 10.9. PROPERTY AND EQUIPMENT
Property and equipment consisted of the following (in thousands):
| June 30, | June 30, | |||||||||||||||
| 2010 | 2009 | 2011 | 2010 | |||||||||||||
Equipment and furniture | $ | 69,164 | $ | 56,120 | $ | 76,233 | $ | 69,164 | ||||||||
Leasehold improvements | 53,745 | 36,980 | 57,889 | 53,745 | ||||||||||||
|
| |||||||||||||||
Property and equipment, at cost | 122,909 | 93,100 | 134,122 | 122,909 | ||||||||||||
Less accumulated depreciation and amortization | (64,243 | ) | (62,177 | ) | (71,367 | ) | (64,243 | ) | ||||||||
|
| |||||||||||||||
Total property and equipment, net | $ | 58,666 | $ | 30,923 | $ | 62,755 | $ | 58,666 | ||||||||
|
| |||||||||||||||
Depreciation expense, including amortization of leasehold improvements, was $16.6 million, $13.9 million and $11.1 million for the years ended June 30, 2011, 2010 and 2009, respectively.
CACI INTERNATIONAL INC
NOTES TO CONSOLIDATED FINANCIAL STATEMENTS—(Continued)
Depreciation expense, including amortization of leasehold improvements, was $13.9 million, $11.1 million and $11.5 million for the years ended June 30, 2010, 2009 and 2008, respectively. The increase in the cost of property and equipment at June 30, 2010 as compared to June 30, 2009 was primarily attributable to office outfitting and tenant improvements at three new leased facilities.
NOTE 11.10. CAPITALIZED EXTERNAL SOFTWARE DEVELOPMENT COSTS
A summary of changes in capitalized external software development costs, including costs capitalized and amortized during each of the years in the three-year period ended June 30, 2010,2011, is as follows (in thousands):
| Year ended June 30, | Year ended June 30, | |||||||||||||||||||||||
| 2010 | 2009 | 2008 | 2011 | 2010 | 2009 | |||||||||||||||||||
Capitalized software development costs, beginning of year | $ | 2,001 | $ | 5,165 | $ | 9,452 | $ | 1,315 | $ | 2,001 | $ | 5,165 | ||||||||||||
Costs capitalized | 1,230 | 171 | — | 3,358 | 1,230 | 171 | ||||||||||||||||||
Amortization | (1,916 | ) | (3,335 | ) | (4,287 | ) | (624 | ) | (1,916 | ) | (3,335 | ) | ||||||||||||
|
|
| ||||||||||||||||||||||
Capitalized software development costs, end of year | $ | 1,315 | $ | 2,001 | $ | 5,165 | $ | 4,049 | $ | 1,315 | $ | 2,001 | ||||||||||||
|
|
| ||||||||||||||||||||||
Capitalized software development costs are presented within other current assets and other long-term assets in the accompanying consolidated balance sheets.
NOTE 12.11. ACCRUED COMPENSATION AND BENEFITS
Accrued compensation and benefits consisted of the following (in thousands):
| June 30, | June 30, | |||||||||||||
| 2010 | 2009 | 2011 | 2010 | |||||||||||
Accrued salaries and withholdings | $ | 86,748 | $ | 77,242 | $ | 102,116 | $ | 86,748 | ||||||
Accrued leave | 54,460 | 50,260 | 60,437 | 54,460 | ||||||||||
Accrued fringe benefits | 11,582 | 10,341 | 11,033 | 11,582 | ||||||||||
|
| |||||||||||||
Total accrued compensation and benefits | $ | 152,790 | $ | 137,843 | $ | 173,586 | $ | 152,790 | ||||||
|
| |||||||||||||
NOTE 13.12. OTHER ACCRUED EXPENSES AND CURRENT LIABILITIES
Other accrued expenses and current liabilities consisted of the following (in thousands):
| June 30, | June 30, | |||||||||||||
| 2010 | 2009 | 2011 | 2010 | |||||||||||
Vendor obligations | $ | 82,345 | $ | 48,988 | $ | 84,434 | $ | 82,345 | ||||||
Deferred revenue | 24,249 | 13,891 | 34,127 | 24,249 | ||||||||||
Income taxes payable | 9,566 | 9,019 | ||||||||||||
Deferred acquisition consideration | 24,779 | 3,420 | ||||||||||||
Other | 12,399 | 11,399 | 13,902 | 18,545 | ||||||||||
|
| |||||||||||||
Total other accrued expenses and current liabilities | $ | 128,559 | $ | 83,297 | $ | 157,242 | $ | 128,559 | ||||||
|
| |||||||||||||
The deferred acquisition consideration of $24.8 million as of June 30, 2011 includes $20.8 million of contingent consideration associated with acquisitions made by the Company during the year ended June 30, 2010 (see Note 22) and $3.5 million related to amounts retained by the Company to secure the Seller’s indemnification obligations in connection with three past U.K. acquisitions.
CACI INTERNATIONAL INC
NOTES TO CONSOLIDATED FINANCIAL STATEMENTS—(Continued)
NOTE 14.13. LONG TERM DEBT
Long-term debt consisted of the following (in thousands):
| June 30, | ||||||||
| 2010 | 2009 (As Adjusted(1)) | |||||||
Convertible notes payable | $ | 300,000 | $ | 300,000 | ||||
Bank credit facility—term loans | 278,653 | 331,625 | ||||||
U.K. notes payable | — | 5,336 | ||||||
Bank credit facility—revolver | — | 628 | ||||||
Principal amount of long-term debt | 578,653 | 637,589 | ||||||
Less unamortized discount | (47,549 | ) | (58,047 | ) | ||||
Total long-term debt | 531,104 | 579,542 | ||||||
Less current portion | (278,653 | ) | (9,464 | ) | ||||
Long-term debt, net of current portion | $ | 252,451 | $ | 570,078 | ||||
| June 30, | ||||||||
| 2011 | 2010 | |||||||
Convertible notes payable | $ | 300,000 | $ | 300,000 | ||||
Bank credit facility—term loans | 146,250 | 278,653 | ||||||
|
|
|
| |||||
Principal amount of long-term debt | 446,250 | 578,653 | ||||||
Less unamortized discount | (36,313 | ) | (47,549 | ) | ||||
|
|
|
| |||||
Total long-term debt | 409,937 | 531,104 | ||||||
Less current portion | (7,500 | ) | (278,653 | ) | ||||
|
|
|
| |||||
Long-term debt, net of current portion | $ | 402,437 | $ | 252,451 | ||||
|
|
|
| |||||
Bank Credit Facility
The Company has a $750.0 million credit facility (the Credit Facility), which consists of a $600.0 million revolving credit facility (the Revolving Facility) and a $150.0 million term loan (the Term Loan). The Revolving Facility has subfacilities of $50.0 million for same-day swing line loan borrowings and $25.0 million for stand-by letters of credit. The Credit Facility was entered into on October 21, 2010 and replaced the Company’s then outstanding term loan and revolving credit facility.
The Revolving Facility is a secured facility that permits continuously renewable borrowings of up to $600.0 million, with an expiration date of October 21, 2015. As of June 30, 2011, the Company had no borrowings outstanding under the Revolving Facility and no outstanding letters of credit. The Company pays a quarterly facility fee for the unused portion of the Revolving Facility.
The Term Loan is a five-year secured facility under which principal payments are due in quarterly installments of $1.9 million through December 31, 2013 and $3.8 million from January 1, 2014 through September 30, 2015, with the balance due in full on October 21, 2015.
At any time and so long as no default has occurred, the Company has the right to increase the Term Loan or Revolving Facility in an aggregate principal amount of up to $200.0 million with applicable lender approvals. The Credit Facility is available to refinance existing indebtedness and for general corporate purposes, including working capital expenses and capital expenditures.
The interest rates applicable to loans under the Credit Facility are floating interest rates that, at the Company’s option, equal a base rate or a Eurodollar rate plus, in each case, an applicable margin based upon the Company’s consolidated total leverage ratio. As of June 30, 2011, the effective interest rate, excluding the effect of amortization of debt financing costs, for the outstanding borrowings under the Credit Facility was 2.21 percent.
The Credit Facility requires the Company to comply with certain financial covenants, including a maximum senior secured leverage ratio, a maximum total leverage ratio and a minimum fixed charge coverage ratio. The Credit Facility also includes customary negative covenants restricting or limiting the Company’s ability to guarantee or incur additional indebtedness, grant liens or other security interests to third parties, make loans or investments, transfer assets, declare dividends or redeem or repurchase capital stock or make other distributions, prepay subordinated indebtedness and engage in mergers, acquisitions or other business combinations, in each
CACI INTERNATIONAL INC
NOTES TO CONSOLIDATED FINANCIAL STATEMENTS—(Continued)
case except as expressly permitted under the Credit Facility. Since the inception of the Credit Facility, the Company has been in compliance with all of the financial covenants. A majority of the Company’s assets serve as collateral under the Credit Facility.
The Company capitalized $6.0 million of debt issuance costs associated with the origination of the Credit Facility. All debt issuance costs are being amortized from the date incurred to the expiration date of the Credit Facility. The unamortized balance of $5.2 million at June 30, 2011 is included in other assets.
As of June 30, 2010 the Company had a $590.0 million credit facility (the 2004 Credit Facility), consisting of a $240.0 million revolving credit facility (the 2004 Revolving Facility) and a $350.0 million term loan (the 2004 Term Loan). The Credit Facility provides for stand-by letters of credit aggregating up to $25.0 million that reduce the funds available under the2004 Revolving Facility when issued.
The Revolving Facility iswas a seven-year, secured facility that permitspermitted continuously renewable borrowings of up to $240.0 million, with an expiration date of May 3, 2011, and annual sub-limits on amounts borrowed for acquisitions.2011. The Revolving Facility contains an accordion feature under which the Revolving Facility may be expanded to $450.0 million with applicable lender approvals. The Revolving Facility permits one, two, three and six month interest rate options. The Company pays a fee on the unused portion of the Revolving Facility, based on its leverage ratio, as defined in the Credit Facility. Any outstanding balances under the Revolving Facility are due in full May 3, 2011. As of June 30, 2010, the Company had no borrowings outstanding under the Revolving Facility and no outstanding letters of credit.
The2004 Term Loan iswas a seven-year secured facility under which principal payments arewere due in quarterly installments of $0.7 million at the end of each fiscal quarter through March 2011, and the balance iswould have been due in full on May 3, 2011. As the Term Loan expires on May 3, 2011, the balance due under the Term Loan as of June 30, 2010 has been classified as a current liability on the consolidated balance sheet as of that date. Subsequent to June 30, 2010, the Company made an $80.0 million prepayment on the Term Loan (see Note 27).
Borrowings under both the 2004 Revolving Facility and the 2004 Term Loan bearbore interest at rates based on the London Inter-Bank Offered Rate (LIBOR) or the higher of the prime rate or the federal funds rate plus 0.5 percent, as elected by the Company, in each case plus applicable margins based on the Company’s total leverage ratio as determined quarterly. As of June 30,On October 21, 2010 the effective interest rate, excluding the effect of amortization of debt financing costs, for the outstanding borrowings under2004 Credit Facility was replaced by the Credit Facility was 2.41 percent.
CACI INTERNATIONAL INC
NOTES TO CONSOLIDATED FINANCIAL STATEMENTS—(Continued)
The Credit Facility contains financial covenants that stipulate a minimum amount of net worth, a minimum fixed-charge coverage ratio, a maximum total leverage ratio, and a maximum senior leverage ratio. The Credit Agreement dated as of May 3, 2004, as amended, governing the Credit Facility provides the remedies available to the lenders in the event of an uncured violation of any of the financial covenants. Such remedies may include the termination of the Credit Facility and the demand for payment of all outstanding amounts due thereunder. Since the inception of the Credit Facility, the Company has always been in compliance with all of the financial covenants. Substantially all of the Company’s assets serve as collateral under the Credit Facility.
The Company has capitalized $10.2 million of debt issuance costs associated with the origination of and subsequent amendments to the Credit Facility. All debt financing costs are being amortized from the date incurred to the expiration date of the Credit Facility. The unamortized balance of $1.1 million at June 30, 2010 is included in prepaid expenses and other current assets.
Cash Flow Hedges
In December 2007, the Company entered into two interest rate swap agreements (the 2007 Swap) under which it exchanged floating-rate interest payments for fixed-rate interest payments on a notional amount of debt totaling $100.0 million. The agreements provided for swap payments over a twenty-four month period beginning in December 2007 and were settled on a quarterly basis. The weighted-average fixed interest rate provided by the agreements was 4.04 percent. The 2007 Swap expired in December 2009.
In June 2008, the Company entered into an interest rate cap agreement under which the floating-rate interest payments on a notional amount of debt of $68.0 million were capped at 7 percent (the 2008 Cap). The 2008 Cap became effective June 11, 2008 for a period of two years and provided for quarterly settlements, when applicable. The 2008 Cap expired in June 2010.
The Company determined that its swap and cap agreements qualified as effective hedges, and accordingly, the increase in fair value of the 2007 Swap between July 1, 2009 and its expiration in December 2009 of $1.7 million, net of an income tax effect of $0.7 million, is reported as other comprehensive income in the accompanying consolidated statement of comprehensive income for the year ended June 30, 2010. Changes in the fair value of the 2008 Cap during the fiscal year prior to its expiration were insignificant. The amounts paid and received on the 2007 Swap and the 2008 Cap were recorded in interest expense as yield adjustments in the period during which the related floating-rate interest was incurred.
The Company periodically uses derivative financial instruments as part of a strategy to manage exposure to market risks associated with interest rate fluctuations. The Company does not hold or issue derivative financial instruments for trading purposes. The Company does not consider its risk of loss in the event of nonperformance by any counterparty under derivative financial instrument agreements to be significant. Although the derivative financial instruments expose the Company to market risk, fluctuations in the value of the derivatives are mitigated by expected offsetting fluctuations in the matched exposures.
All outstanding derivative instruments, if any, are recorded in the consolidated balance sheets as assets or liabilities, measured at estimated fair value. Fair value estimates are based on relevant market information, including market rates. For a derivative designated as a cash-flow hedge, the effective portion of the change in the fair value of the derivative is recorded in accumulated other comprehensive income (loss) and is recognized in earnings when interest rate swap or cap payments are settled under the hedge agreements.
CACI INTERNATIONAL INC
NOTES TO CONSOLIDATED FINANCIAL STATEMENTS—(Continued)
The effect of derivative instruments in the consolidated statements of operations and accumulated other comprehensive income (loss) for the years ended June 30, 2010, 2009 and 2008 is as follows (in thousands):
| Interest Rate Swaps | ||||||||||||
| 2010 | 2009 | 2008 | ||||||||||
Gain (loss) recognized in other comprehensive income (loss) (effective portion) | $ | 1,045 | $ | (332 | ) | $ | (1,350 | ) | ||||
(Loss) gain reclassified to earnings from accumulated other comprehensive income (loss) (effective portion) | $ | (1,817 | ) | $ | (1,795 | ) | $ | 710 | ||||
Gain recognized in earnings (ineffective portion) | — | — | — | |||||||||
| $ | (1,817 | ) | $ | (1,795 | ) | $ | 710 | |||||
As of June 30, 2010, the Company had no outstanding derivative instruments.described above.
Convertible Notes Payable
Effective May 16, 2007, the Company issued the Notes in a private placement. The Notes were issued at par value and are subordinate to the Company’s senior secured debt. Interest on the Notes is payable on May 1 and November 1 of each year.
Holders may convert their notes at a conversion rate of 18.2989 shares of CACI common stock for each $1,000 of note principal (an initial conversion price of $54.65 per share) under the following circumstances: 1) if the last reported sale price of CACI stock is greater than or equal to 130 percent of the applicable conversion price for at least 20 trading days in the period of 30 consecutive trading days ending on the last trading day of the preceding fiscal quarter; 2) during the five consecutive business day period immediately after any ten consecutive trading day period (the note measurement period) in which the average of the trading price per $1,000 principal amount of convertible note was equal to or less than 97 percent of the average product of the closing price of a share of the Company’s common stock and the conversion rate of each date during the note measurement period; 3) upon the occurrence of certain corporate events constituting a fundamental change, as defined in the indenture governing the Notes; or 4) during the last three-month period prior to maturity. CACI is required to satisfy 100 percent of the principal amount of these notes solely in cash, with any amounts above the principal amount to be satisfied in common stock. As of June 30, 2010,2011, none of the conditions permitting conversion of the Notes had been satisfied.
In the event of a fundamental change, as defined in the indenture governing the Notes, holders may require the Company to repurchase the Notes at a price equal to the principal amount plus any accrued interest. Also, if certain fundamental changes occur prior to maturity, the Company will in certain circumstances increase the conversion rate by a number of additional shares of common stock or, in lieu thereof, the Company may in certain circumstances elect to adjust the conversion rate and related conversion obligation so that these notes are convertible into shares of the acquiring or surviving company. The Company is not permitted to redeem the Notes.
The Notes are accounted for under the updated provisions of ASC 470-20, which were adopted by the Company effective July 1, 2009. This accounting standard update was required to be applied retrospectively and, accordingly, balances affected by changes to ASC 470-20 as of June 30, 2009 and for the years ended June 30, 2009 and 2008, have been adjusted to reflect the impacts of the update. The effects on previously reported balances are described in Note 2.
CACI INTERNATIONAL INC
NOTES TO CONSOLIDATED FINANCIAL STATEMENTS—(Continued)
The Company separately accounts for the liability and the equity (conversion option) components of the Notes and recognizes interest expense on the Notes using an interest rate in effect for comparable debt instruments that do not contain conversion features. The effective interest rate for the Notes excluding the conversion option was determined to be 6.9 percent.
The fair value of the liability component of the Notes was calculated to be $221.9 million at May 16, 2007, the date of issuance. The excess of the $300.0 million of gross proceeds over the $221.9 million fair value of the liability component, or $78.1 million, represents the fair value of the equity component, which has beenwas recorded, net of income tax effect, as additional paid-in capital within shareholders’ equity. This $78.1 million difference represents a debt discount that is amortized over the seven-year term of the Notes as a non-cash component of interest expense. The components of interest expense related to the Notes were as follows (in thousands):
| Year Ended June 30, | Year Ended June 30, | ||||||||||||||||||||
| 2010 | 2009 | 2008 | 2011 | 2010 | 2009 | ||||||||||||||||
Coupon interest | $ | 6,375 | $ | 6,375 | $ | 6,375 | $ | 6,375 | $ | 6,375 | $ | 6,375 | |||||||||
Non-cash amortization of discount | 10,499 | 9,809 | 9,160 | 11,235 | 10,499 | 9,809 | |||||||||||||||
Amortization of issuance costs | 820 | 820 | 820 | 820 | 820 | 820 | |||||||||||||||
|
|
| |||||||||||||||||||
Total | $ | 17,694 | $ | 17,004 | $ | 16,355 | $ | 18,430 | $ | 17,694 | $ | 17,004 | |||||||||
|
|
| |||||||||||||||||||
The balance of the unamortized discount as of June 30, 2011 and 2010, and 2009, was $47.5$36.3 million and $58.0$47.5 million, respectively. The discount will continue to be amortized as additional, non-cash interest expense over the remaining term of the Notes (through May 1, 2014) using the effective interest method as follows (in thousands):
Fiscal year ending June 30, | Amount Amortized During Period | Amount Amortized During Period | |||||
2011 | $ | 11,235 | |||||
2012 | 12,024 | $ | 12,024 | ||||
2013 | 12,868 | 12,868 | |||||
2014 | 11,422 | 11,421 | |||||
| |||||||
| $ | 47,549 | $ | 36,313 | ||||
| |||||||
The fair value of the Notes as of June 30, 20102011 was $293.2$379.5 million based on quoted market values.
The contingently issuable shares arethat may result from the conversion of the Notes were included in CACI’s diluted share count for the fiscal year ended June 30, 2011 because CACI’s average stock price during the third and fourth quarters of the year ended June 30, 2011 was above the conversion price of $54.65 per share. The contingently issuable shares were not included in CACI’s diluted share count for the fiscal years ended June 30, 2010 or 2009 and 2008, because CACI’s average stock price during each three month period in those periodsyears was below the conversion price. Of total debt issuance costs of $7.8 million, $5.8 million is being amortized to interest expense over seven years. In connection with the adoption of the updates to ASC 470-20, the Company reclassified theThe remaining $2.0 million of debt issuance costs attributable to the embedded conversion option from other long-term assets towas recorded in additional paid-in capital. This adjustment was applied retroactively to the date of issue and has the effect of decreasing interest expense over the term of the Notes by $0.3 million annually. Upon closing of the sale of the Notes, $45.5 million of the net proceeds was used to concurrently repurchase one million shares of CACI’s common stock.
In connection with the issuance of the Notes, the Company purchased in a private transaction at a cost of $84.4 million call options (the Call Options) to purchase approximately 5.5 million shares of its common stock at
CACI INTERNATIONAL INC
NOTES TO CONSOLIDATED FINANCIAL STATEMENTS—(Continued)
a price equal to the conversion price of $54.65 per share. The cost of the Call Options was recorded as a reduction of additional paid-in capital. The Call Options allow CACI to receive shares of its common stock from the counterparties equal to the amount of common stock related to the excess conversion value that CACI would pay the holders of the Notes upon conversion.
CACI INTERNATIONAL INC
NOTES TO CONSOLIDATED FINANCIAL STATEMENTS—(Continued)
For income tax reporting purposes, the Notes and the Call Options are integrated. This created an original issue discount for income tax reporting purposes, and therefore the cost of the Call Options is being accounted for as interest expense over the term of the Notes for income tax reporting purposes. The associated income tax benefit of $32.8 million to be realized for income tax reporting purposes over the term of the Notes was recorded as an increase in additional paid-in capital and a long-term deferred tax asset. The majority of this deferred tax asset is offset in the Company’s balance sheet by the $30.7 million deferred tax liability that was recognizedassociated with the adoption of the update of ASC 470-20 that was retroactively appliednon-cash interest expense to May 16, 2007.be recorded for financial reporting purposes.
In addition, the Company sold warrants (the Warrants) to issue approximately 5.5 million shares of CACI common stock at an exercise price of $68.31 per share. The proceeds from the sale of the Warrants totaled $56.5 million and were recorded as an increase to additional paid-in capital.
On a combined basis, the Call Options and the Warrants are intended to reduce the potential dilution of CACI’s common stock in the event that the Notes are converted by effectively increasing the conversion price of these notes from $54.65 to $68.31. The Call Options are anti-dilutive and are therefore excluded from the calculation of diluted shares outstanding. The Warrants will result in additional diluted shares outstanding if CACI’s average common stock price exceeds $68.31. The Call Options and the Warrants are separate and legally distinct instruments that bind CACI and the counterparties and have no binding effect on the holders of the Notes.
U.K. Notes Payable
On April 2, 2008, in connection with its May 2006 acquisition of Sophron Partners Limited, CACI Limited issued loan notes totaling 3.2 million pounds sterling for earn-out consideration that is no longer contingent. These notes were paid in full during the year ended June 30, 2010.
JV Bank Credit Facility
eVentures, a joint venture between the Company and ActioNet, Inc. (see Note 18)17), entered into a $1.5 million revolving credit facility (the JV Facility). The JV Facility is a four-year, guaranteed facility that permits continuously renewable borrowings of up to $1.5 million with an expiration date of the earliest of September 14, 2011; the date of any restatement, refinancing, or replacement of the Credit Facility without the lender acting as the sole and exclusive administrative agent; or termination of the Credit Facility. Borrowings under the JV Facility bear interest at the lender’s prime rate plus 1.0 percent. eVentures pays a fee of 0.25 percent on the unused portion of the JV Facility. As of June 30, 2010,2011, eVentures had no borrowings outstanding under the JV Facility.
Cash Flow Hedges
The Company periodically uses derivative financial instruments as part of a strategy to manage exposure to market risks associated with interest rate fluctuations. In 2007, the Company entered into two interest rate swap agreements and in 2008, the Company entered into an interest rate cap agreement. Both agreements qualified as effective hedges and both expired during the Company’s fiscal year ended June 30, 2010. The Company does not hold or issue derivative financial instruments for trading purposes.
The effect of derivative instruments in the consolidated statements of operations and accumulated other comprehensive loss for the years ended June 30, 2011, 2010 and 2009 is as follows (in thousands):
| Interest Rate Swaps | ||||||||||||
| 2011 | 2010 | 2009 | ||||||||||
Gain (loss) recognized in other comprehensive income (loss) (effective portion) | $ | — | $ | 1,045 | $ | (332 | ) | |||||
|
|
|
|
|
| |||||||
Loss reclassified to earnings from accumulated other comprehensive loss (effective portion) | $ | — | $ | (1,817 | ) | $ | (1,795 | ) | ||||
Gain recognized in earnings (ineffective portion) | — | — | — | |||||||||
|
|
|
|
|
| |||||||
| $ | — | $ | (1,817 | ) | $ | (1,795 | ) | |||||
|
|
|
|
|
| |||||||
As of June 30, 2011, the Company had no outstanding derivative instruments.
CACI INTERNATIONAL INC
NOTES TO CONSOLIDATED FINANCIAL STATEMENTS—(Continued)
The aggregate maturities of long-term debt at June 30, 20102011 are as follows (in thousands):
Year ending June 30, | ||||||||
2011 | $ | 278,653 | ||||||
2012 | — | $ | 7,500 | |||||
2013 | — | 7,500 | ||||||
2014 | 300,000 | 311,250 | ||||||
2015 | — | 15,000 | ||||||
2016 | 105,000 | |||||||
| ||||||||
Principal amount of long-term debt | 578,653 | 446,250 | ||||||
Less unamortized discount | (47,549 | ) | (36,313 | ) | ||||
| ||||||||
Total long-term debt | $ | 531,104 | $ | 409,937 | ||||
| ||||||||
NOTE 15.14. LEASES
The Company conducts its operations from leased office facilities, all of which are classified as operating leases and expire over the next 1211 years. Future minimum lease payments due under non-cancelable leases as of June 30, 2010,2011, are as follows (in thousands):
Year ending June 30: | |||||||
2011 | $ | 37,460 | |||||
2012 | 30,887 | $ | 35,289 | ||||
2013 | 28,205 | 31,336 | |||||
2014 | 26,584 | 29,563 | |||||
2015 | 25,276 | 28,029 | |||||
2016 | 22,263 | ||||||
Thereafter | 79,536 | 76,007 | |||||
| |||||||
Total minimum lease payments | $ | 227,948 | $ | 222,487 | |||
| |||||||
The minimum lease payments above are shown net of sublease rental income of $0.2$0.1 million scheduled to be received over the next two yearseight months under non-cancelable sublease agreements.
Rent expense incurred under operating leases for the years ended June 30, 2011, 2010, and 2009 and 2008 totaled $45.9 million, $43.0 million, and $40.2 million, and $39.2 million, respectively.
NOTE 16.15. OTHER LONG-TERM LIABILITIES
Other long-term liabilities consisted of the following (in thousands):
| June 30, | ||||||
| 2010 | 2009 (As Adjusted(1)) | |||||
Deferred acquisition and contingent consideration | $ | 34,196 | $ | 2,730 | ||
Deferred rent, net of current portion | 23,272 | 8,058 | ||||
Reserve for unrecognized tax benefits | 4,296 | 4,588 | ||||
Accrued post-retirement obligations | 3,198 | 3,047 | ||||
Other | 2,401 | 502 | ||||
Total other long-term liabilities | $ | 67,363 | $ | 18,925 | ||
CACI INTERNATIONAL INC
NOTES TO CONSOLIDATED FINANCIAL STATEMENTS—(Continued)
The deferred acquisition consideration of $34.2 million at June 30, 2010 is related to the acquisitions made by the Company during the year ended June 30, 2010 (see Note 5) and consists of $33.8 million of Contingent Consideration (see Note 23) and $0.4 million related to amounts retained by the Company to secure the seller’s indemnification obligations in connection with the U.K. acquisition. The deferred acquisition consideration of $2.7 million at June 30, 2009 is related to amounts retained by the Company to secure the seller’s indemnification obligation associated with one of the U.K. acquisitions made in the year ended June 30, 2009. This amount is recorded as a current liability as of June 30, 2010.
| June 30, | ||||||||
| 2011 | 2010 | |||||||
Deferred rent, net of current portion | $ | 25,983 | $ | 23,272 | ||||
Reserve for unrecognized tax benefits | 5,095 | 4,296 | ||||||
Accrued post-retirement obligations | 3,447 | 3,198 | ||||||
Deferred acquisition and contingent consideration | 526 | 34,196 | ||||||
Other | 2,815 | 2,401 | ||||||
|
|
|
| |||||
Total other long-term liabilities | $ | 37,866 | $ | 67,363 | ||||
|
|
|
| |||||
Deferred rent liabilities result from recording rent expense and incentives for tenant improvements on a straight-line basis over the life of the respective lease. The increase of $15.2 million as of June 30, 2010 as compared to June 30, 2009 was primarily for incentives for tenant improvements on two new leases.
CACI INTERNATIONAL INC
NOTES TO CONSOLIDATED FINANCIAL STATEMENTS—(Continued)
Accrued post-retirement obligations include projected liabilities for benefits the Company is obligated to provide under a long-term care, a group health, and an executive life insurance plan, each of which is unfunded. Plan benefits are provided to certain current and former executives, their dependents and other eligible employees, as defined. The post-retirement obligations also include accrued benefits under a supplemental retirement benefit plan covering the Company’s chief executive officer. This plan became effective in August 2005 and replaced the retirement benefits that were forfeited to a former employer. The costs under this planthese plans were approximately $0.3 million during the year ended June 30, 2010.2011.
The deferred acquisition consideration of $0.5 million at June 30, 2011 is related to amounts retained by the Company to secure the seller’s indemnification obligations in connection with a U.K. acquisition made during the Company’s year ended June 30, 2011. The deferred acquisition consideration of $34.2 million at June 30, 2010 is related to acquisitions made by the Company during the year ended June 30, 2010 and consists of $33.8 million of contingent consideration and $0.4 million related to amounts retained by the Company to secure the seller’s indemnification obligations in connection with a U.K. acquisition. The related contingent consideration recorded as of June 30, 2011 is recorded as a current liability (see Note 12).
NOTE 17.16. BUSINESS SEGMENT, CUSTOMER AND GEOGRAPHIC INFORMATION
Segment Information
The Company reports operating results and financial data in two segments: domestic operations and international operations. Domestic operations provide professional services and information technology solutions to its customers. Its customers are primarily U.S. federal government agencies. The Company does not measure revenue or profit by its major service offerings, either for internal management or external financial reporting purposes, as it would be impractical to do so. In many cases more than one offering is provided under a single contract, to a single customer, or by a single employee or group of employees, and segregating the costs of the service offerings in situations for which it is not required would be difficult and costly. The Company also serves customers in the commercial and state and local governments sectors and, from time to time, serves a number of agencies of foreign governments. The Company places employees in locations around the world in support of its clients. International operations offer services to both commercial and non-U.S. government customers primarily through the Company’s data information and knowledge management services, business systems solutions, and enterprise IT and network services lines of business. The Company evaluates the performance of its operating segments based on net income. Summarized financial information concerning the Company’s reportable segments is shown in the following tables.
CACI INTERNATIONAL INC
NOTES TO CONSOLIDATED FINANCIAL STATEMENTS—(Continued)
| Domestic Operations | International Operations | Total | Domestic Operations | International Operations | Total | ||||||||||||||||
| (in thousands) | |||||||||||||||||||||
Year Ended June 30, 2011 | |||||||||||||||||||||
Revenue from external customers | $ | 3,459,715 | $ | 118,065 | $ | 3,577,780 | |||||||||||||||
Net income attributable to CACI | 135,158 | 9,060 | 144,218 | ||||||||||||||||||
Net assets | 1,211,517 | 98,099 | 1,309,616 | ||||||||||||||||||
Goodwill | 1,200,091 | 66,194 | 1,266,285 | ||||||||||||||||||
Total long-term assets | 1,457,505 | 80,548 | 1,538,053 | ||||||||||||||||||
Total assets | 2,176,380 | 143,751 | 2,320,131 | ||||||||||||||||||
Capital expenditures | 13,264 | 1,124 | 14,388 | ||||||||||||||||||
Depreciation and amortization | 53,179 | 2,888 | 56,067 | ||||||||||||||||||
| (in thousands) | |||||||||||||||||||||
Year Ended June 30, 2010 | |||||||||||||||||||||
Revenue from external customers | $ | 3,032,341 | $ | 116,790 | $ | 3,149,131 | $ | 3,032,341 | $ | 116,790 | $ | 3,149,131 | |||||||||
Net income attributable to CACI | 98,649 | 7,866 | 106,515 | 98,649 | 7,866 | 106,515 | |||||||||||||||
Net assets | 1,090,795 | 82,360 | 1,173,155 | 1,090,795 | 82,360 | 1,173,155 | |||||||||||||||
Goodwill | 1,105,055 | 56,806 | 1,161,861 | 1,105,055 | 56,806 | 1,161,861 | |||||||||||||||
Total long-term assets | 1,333,876 | 70,144 | 1,404,020 | 1,333,876 | 70,144 | 1,404,020 | |||||||||||||||
Total assets | 2,122,510 | 122,256 | 2,244,766 | 2,122,510 | 122,256 | 2,244,766 | |||||||||||||||
Capital expenditures | 20,954 | 1,549 | 22,503 | 20,954 | 1,549 | 22,503 | |||||||||||||||
Depreciation and amortization | 50,095 | 2,944 | 53,039 | 50,095 | 2,944 | 53,039 | |||||||||||||||
Year Ended June 30, 2009(1) | |||||||||||||||||||||
Revenue from external customers | $ | 2,650,769 | $ | 79,393 | $ | 2,730,162 | $ | 2,650,769 | $ | 79,393 | $ | 2,730,162 | |||||||||
Net income attributable to CACI | 84,772 | 4,926 | 89,698 | 84,772 | 4,926 | 89,698 | |||||||||||||||
Net assets | 971,685 | 57,923 | 1,029,608 | 971,685 | 57,923 | 1,029,608 | |||||||||||||||
Goodwill | 1,031,980 | 51,770 | 1,083,750 | 1,031,980 | 51,770 | 1,083,750 | |||||||||||||||
Total long-term assets | 1,214,944 | 66,303 | 1,281,247 | 1,214,944 | 66,303 | 1,281,247 | |||||||||||||||
Total assets | 1,907,677 | 98,402 | 2,006,079 | 1,907,677 | 98,402 | 2,006,079 | |||||||||||||||
Capital expenditures | 11,692 | 677 | 12,369 | 11,692 | 677 | 12,369 | |||||||||||||||
Depreciation and amortization | 44,788 | 1,804 | 46,592 | 44,788 | 1,804 | 46,592 | |||||||||||||||
Year Ended June 30, 2008(1) | |||||||||||||||||||||
Revenue from external customers | $ | 2,327,730 | $ | 92,807 | $ | 2,420,537 | |||||||||||||||
Net income attributable to CACI | 71,535 | 6,400 | 77,935 | ||||||||||||||||||
Net assets | 896,555 | 62,512 | 959,067 | ||||||||||||||||||
Goodwill | 1,032,214 | 35,258 | 1,067,472 | ||||||||||||||||||
Total long-term assets | 1,241,822 | 47,575 | 1,289,397 | ||||||||||||||||||
Total assets | 1,792,172 | 100,050 | 1,892,222 | ||||||||||||||||||
Capital expenditures | 12,263 | 1,326 | 13,589 | ||||||||||||||||||
Depreciation and amortization | 44,952 | 2,565 | 47,517 | ||||||||||||||||||
| (1) | Certain amounts as of and for the |
Interest income and interest expense are not presented above as the amounts attributable to the Company’s international operations are insignificant.
Customer Information
The Company earned 94.9 percent, 94.8 percent 96.0 percent and 95.096.0 percent of its revenue from various agencies and departments of the U.S. government for the years ended June 30, 2011, 2010 2009 and 2008,2009, respectively. Revenue by customer sector was as follows (dollars in thousands):
| Year ended June 30, | ||||||||||||||||||
| 2010 | % | 2009 | % | 2008 | % | |||||||||||||
Department of Defense | $ | 2,450,463 | 77.8 | % | $ | 2,078,338 | 76.1 | % | $ | 1,807,546 | 74.7 | % | ||||||
Federal civilian agencies | 535,467 | 17.0 | 542,090 | 19.9 | 491,275 | 20.3 | ||||||||||||
Commercial and other | 146,839 | 4.7 | 88,228 | 3.2 | 101,839 | 4. 2 | ||||||||||||
State and local governments | 16,362 | 0.5 | 21,506 | 0.8 | 19,877 | 0.8 | ||||||||||||
Total revenue | $ | 3,149,131 | 100.0 | % | $ | 2,730,162 | 100.0 | % | $ | 2,420,537 | 100.0 | % | ||||||
| Year ended June 30, | ||||||||||||||||||||||||
| 2011 | % | 2010 | % | 2009 | % | |||||||||||||||||||
Department of Defense | $ | 2,858,721 | 79.9 | % | $ | 2,450,463 | �� | 77.8 | % | $ | 2,078,338 | 76.1 | % | |||||||||||
Federal civilian agencies | 537,687 | 15.0 | 535,467 | 17.0 | 542,090 | 19.9 | ||||||||||||||||||
Commercial and other | 166,966 | 4.7 | 146,839 | 4.7 | 88,228 | 3.2 | ||||||||||||||||||
State and local governments | 14,406 | 0.4 | 16,362 | 0.5 | 21,506 | 0.8 | ||||||||||||||||||
|
|
|
|
|
|
|
|
|
|
|
| |||||||||||||
Total revenue | $ | 3,577,780 | 100.0 | % | $ | 3,149,131 | 100.0 | % | $ | 2,730,162 | 100.0 | % | ||||||||||||
|
|
|
|
|
|
|
|
|
|
|
| |||||||||||||
CACI INTERNATIONAL INC
NOTES TO CONSOLIDATED FINANCIAL STATEMENTS—(Continued)
Geographic Information
Revenue and net assets are attributed to geographic areas based on the location of the reportable segment’s management and are disclosed above.
NOTE 18.17. INVESTMENTS IN JOINT VENTURES
AC FIRST LLC
In July 2009, the Company entered into a joint venture with AECOM Government Services, Inc. (AGS), a division of AECOM Technology Corporation, called AC FIRST LLC (AC FIRST). The companies partnered in the venture to jointly pursue work under a U.S. Army contract. The Company owns 49 percent of AC FIRST and AGS owns 51 percent. The Company accounts for its interest in AC FIRST using the equity method of accounting. The Company’s investment in AC FIRST as of June 30, 2011 is $10.1 million and is included in other long-term assets on the Company’s consolidated balance sheets. The Company’s maximum exposure to loss cannot be determined as any losses incurred by AC FIRST would be allocated to each partner based on the joint venture agreement, however, AC FIRST has not experienced any losses to date. During the years ended June 30, 2011 and 2010, the Company’s share of the net income of AC FIRST was $1.8 million and $70 thousand, respectively. These amounts are included in interest expense and other on the accompanying consolidated statements of operations. The Company has determined that the primary beneficiary of AC FIRST is AGS as AGS owns the majority of AC FIRST and controls its operations. The Company contributed $6.0 million in cash to AC FIRST for general business purposes during the year ended June 30, 2011.
eVenture Technologies LLC
eVentures is a joint venture between the Company and ActioNet, Inc. (ActioNet), and is the entity through which work is being performed on a contract awarded in January 2007 by the United States Navy. The Company owns 60 percent of eVentures and ActioNet owns the remaining 40 percent. eVentures was funded through capital contributions made by the Company and by ActioNet. As the Company owns and controls more than 50 percent of eVentures, the Company’s results include those of eVentures. ActioNet’s share of eVentures’ assets, liabilities, results of operations, and cash flows have been accounted for as a noncontrolling interest.
Prior to July 1, 2009, the Company had accounted for ActioNet’s interest in eVentures as a minority interest. Effective July 1, 2009, the Company adopted the updates to ASC 810, and has retroactively adjusted its financial statements to account for ActioNet’s share of eVentures as a noncontrolling interest. See Note 2.3.
NOTE 19.18. OTHER COMMITMENTS AND CONTINGENCIES
General Legal Matters
The Company is involved in various lawsuits, claims, and administrative proceedings arising in the normal course of business. Management is of the opinion that any liability or loss associated with such matters, either individually or in the aggregate, will not have a material adverse effect on the Company’s operations and liquidity.
Iraq Investigations
On April 26, 2004, the Company received information indicating that one of its employees was identified in a report authored by U.S. Army Major General Antonio M. Taguba as being connected to allegations of abuse of Iraqi detainees at the Abu Ghraib prison facility. To date, despite the Taguba Report and the subsequently-issued Fay Report addressing alleged inappropriate conduct at Abu Ghraib, no present or former employee of the Company has been officially charged with any offense in connection with the Abu Ghraib allegations.
CACI INTERNATIONAL INC
NOTES TO CONSOLIDATED FINANCIAL STATEMENTS—(Continued)
The Company does not believe the outcome of this matter will have a material adverse effect on its financial statements.
CACI INTERNATIONAL INC
NOTES TO CONSOLIDATED FINANCIAL STATEMENTS—(Continued)
Government Contracting
Payments to the Company on cost-plus-fee and time-and-materials contracts are subject to adjustment upon audit by the DCAA. The DCAA is currently in the process of auditing the Company’s incurred cost submissions for the year ended June 30, 2006. In the opinion of management, audit adjustments that may result from audits not yet completed or started are not expected to have a material effect on the Company’s financial position, results of operations, or cash flows as the Company has accrued its best estimate of potential disallowances. Additionally, the DCAA continually reviews the cost accounting and other practices of government contractors, including the Company. In the course of those reviews, cost accounting and other issues are identified, discussed and settled.
In April 2007,December 2010, the DCAA conductedDefense Contract Management Agency (DCMA) issued a contract review and questioned certain costs on a contract in whichletter to the Company is a subcontractor.with its determination that the Company improperly allocated certain legal costs incurred in connection with the Iraq investigations described above. The Company believes that all costs allocated to this contract were appropriately allocated, butdoes not agree with the DCMA’s findings and, on March 9, 2011, filed a Notice of Appeal in the Armed Services Board of Contract Appeals. The Company’s appeal is pending. The Company has accrued its current best estimate of the potential outcome within its estimated range of zero to $3.4$2.9 million.
NOTE 20.19. INCOME TAXES
The domestic and foreign components of income before provision for income taxes are as follows (in thousands):
| Year ended June 30, | Year ended June 30, | ||||||||||||||||||||
| 2010 | 2009 (As Adjusted(1)) | 2008 (As Adjusted(1)) | 2011 | 2010 | 2009 (As Adjusted(1)) | ||||||||||||||||
Domestic | $ | 156,024 | $ | 144,888 | $ | 118,981 | $ | 215,200 | $ | 156,024 | $ | 144,888 | |||||||||
Foreign | 11,662 | 7,382 | 9,778 | 12,123 | 11,662 | 7,382 | |||||||||||||||
|
|
| |||||||||||||||||||
Income before income taxes | $ | 167,686 | $ | 152,270 | $ | 128,759 | $ | 227,323 | $ | 167,686 | $ | 152,270 | |||||||||
|
|
| |||||||||||||||||||
| (1) | Certain amounts for the |
CACI INTERNATIONAL INC
NOTES TO CONSOLIDATED FINANCIAL STATEMENTS—(Continued)
The components of income tax expense are as follows (in thousands):
| Year ended June 30, | Year ended June 30, | |||||||||||||||||||||||
| 2010 | 2009 (As Adjusted(1)) | 2008 (As Adjusted(1)) | 2011 | 2010 | 2009 (As Adjusted(1)) | |||||||||||||||||||
Current: | ||||||||||||||||||||||||
Federal | $ | 51,572 | $ | 41,884 | $ | 39,309 | $ | 59,095 | $ | 51,572 | $ | 41,884 | ||||||||||||
State and local | 11,155 | 8,404 | 5,705 | 13,578 | 11,155 | 8,404 | ||||||||||||||||||
Foreign | 3,147 | 2,660 | 3,207 | 2,845 | 3,147 | 2,660 | ||||||||||||||||||
|
|
| ||||||||||||||||||||||
Total current | 65,874 | 52,948 | 48,221 | 75,518 | 65,874 | 52,948 | ||||||||||||||||||
|
|
| ||||||||||||||||||||||
Deferred: | ||||||||||||||||||||||||
Federal | (4,082 | ) | 8,268 | 2,474 | 6,175 | (4,082 | ) | 8,268 | ||||||||||||||||
State and local | (820 | ) | 1,661 | 452 | 1,194 | (820 | ) | 1,661 | ||||||||||||||||
Foreign | 199 | (305 | ) | (323 | ) | 218 | 199 | (305 | ) | |||||||||||||||
|
|
| ||||||||||||||||||||||
Total deferred | (4,703 | ) | 9,624 | 2,603 | 7,587 | (4,703 | ) | 9,624 | ||||||||||||||||
|
|
| ||||||||||||||||||||||
Total income tax expense | $ | 61,171 | $ | 62,572 | $ | 50,824 | $ | 83,105 | $ | 61,171 | $ | 62,572 | ||||||||||||
|
|
| ||||||||||||||||||||||
| (1) | Certain amounts for the |
CACI INTERNATIONAL INC
NOTES TO CONSOLIDATED FINANCIAL STATEMENTS—(Continued)
Income tax expense differs from the amounts computed by applying the statutory U.S. income tax rate of 35 percent as a result of the following (in thousands):
| Year ended June 30, | Year ended June 30, | |||||||||||||||||||||||
| 2010 | 2009 (As Adjusted(1)) | 2008 (As Adjusted(1)) | 2011 | 2010 | 2009 (As Adjusted(1)) | |||||||||||||||||||
Expected tax expense computed at federal rate | $ | 58,690 | $ | 53,295 | $ | 45,066 | $ | 79,563 | $ | 58,690 | $ | 53,295 | ||||||||||||
State and local taxes, net of federal benefit | 6,759 | 6,479 | 3,971 | 9,602 | 6,759 | 6,479 | ||||||||||||||||||
(Nonincludible) nondeductible items | (861 | ) | 4,227 | 2,237 | (1,965 | ) | (861 | ) | 4,227 | |||||||||||||||
Incremental effect of foreign tax rates | (830 | ) | (513 | ) | (538 | ) | (914 | ) | (830 | ) | (513 | ) | ||||||||||||
Other | (2,587 | ) | (916 | ) | 88 | (3,181 | ) | (2,587 | ) | (916 | ) | |||||||||||||
|
|
| ||||||||||||||||||||||
Total income tax expense | $ | 61,171 | $ | 62,572 | $ | 50,824 | $ | 83,105 | $ | 61,171 | $ | 62,572 | ||||||||||||
|
|
| ||||||||||||||||||||||
| (1) | Certain amounts for the |
CACI INTERNATIONAL INC
NOTES TO CONSOLIDATED FINANCIAL STATEMENTS—(Continued)
The tax effects of temporary differences that give rise to deferred taxes are presented below (in thousands):
| June 30, | ||||||||
| 2010 | 2009 (As Adjusted(1)) | |||||||
Deferred tax assets: | ||||||||
Stock-based compensation | $ | 30,739 | $ | 22,188 | ||||
Reserves and accruals | 25,347 | 22,519 | ||||||
Deferred compensation and post-retirement obligations | 22,093 | 18,190 | ||||||
Depreciation | 2,923 | 5,519 | ||||||
Deferred rent | 1,746 | 1,191 | ||||||
Original issue discount related to the Notes | 1,355 | 1,897 | ||||||
Net operating loss carryforward | — | 431 | ||||||
Other | 215 | 676 | ||||||
Total deferred tax assets | 84,418 | 72,611 | ||||||
Deferred tax liabilities: | ||||||||
Goodwill and other intangible assets | (98,988 | ) | (76,052 | ) | ||||
Unbilled revenue | (10,360 | ) | (2,808 | ) | ||||
Prepaid expenses | (3,630 | ) | (3,823 | ) | ||||
Capitalized software | — | (719 | ) | |||||
Other | (1,789 | ) | (284 | ) | ||||
Total deferred tax liabilities | (114,767 | ) | (83,686 | ) | ||||
Net deferred tax liability | $ | (30,349 | ) | $ | (11,075 | ) | ||
| June 30, | ||||||||
| 2011 | 2010 | |||||||
Deferred tax assets: | ||||||||
Reserves and accruals | $ | 29,945 | $ | 25,347 | ||||
Stock-based compensation | 28,768 | 30,739 | ||||||
Deferred compensation and post-retirement obligations | 27,977 | 22,093 | ||||||
Deferred rent | 2,929 | 1,746 | ||||||
Original issue discount related to the Notes | 883 | 1,355 | ||||||
Other | 1,323 | 3,138 | ||||||
|
|
|
| |||||
Total deferred tax assets | 91,825 | 84,418 | ||||||
|
|
|
| |||||
Deferred tax liabilities: | ||||||||
Goodwill and other intangible assets | (121,842 | ) | (98,988 | ) | ||||
Unbilled revenue | (11,758 | ) | (10,360 | ) | ||||
Prepaid expenses | (4,011 | ) | (3,630 | ) | ||||
Other | (6,257 | ) | (1,789 | ) | ||||
|
|
|
| |||||
Total deferred tax liabilities | (143,868 | ) | (114,767 | ) | ||||
|
|
|
| |||||
Net deferred tax liability | $ | (52,043 | ) | $ | (30,349 | ) | ||
|
|
|
| |||||
The Company is subject to income taxes in the U.S. and various state and foreign jurisdictions. Tax statutes and regulations within each jurisdiction are subject to interpretation and require the application of significant judgment. TheDuring the Company’s year ended June 30, 2010, the Internal Revenue Service recently completed its field audit of the Company’s consolidated federal
CACI INTERNATIONAL INC
NOTES TO CONSOLIDATED FINANCIAL STATEMENTS—(Continued)
income tax returns for the years ended June 30, 2005 through 2007 and earlier years in connection with amended returns and carryback claims filed by the Company. The Company expects to receivereceived the refunds reflected on its amended returns and carryback claims, as adjusted for the results of the field audit, during the Company’s fiscal year endingended June 30, 2011. The resolutionDuring the year ended June 30, 2011, the Internal Revenue Service concluded its examination of the issues under examination in connectionCompany’s federal income tax return for the year ended June 30, 2008 with no significant adjustments to a previously recorded refund receivable. The Company collected this receivable during the adjustments reflected on its amended returns and carryback claims caused a reduction in the Company’s liability for unrecognized tax benefits of $6.7 million and a corresponding increase in additional paid-in capital and did not have a significant effect on the Company’s results of operations.year ended June 30, 2011. The Company is currently under examination by the Internal Revenue Service for the year ended June 30, 2008 and by onethree state jurisdictionjurisdictions and one foreign jurisdiction for years ended June 30, 20042003 through June 30, 2006.2009. The Company does not expect the resolution of these examinations to have a material impact on its results of operations, financial condition or cash flows.
During the yearyears ended June 30, 2011 and June 30, 2010, the Company’s income tax expense was favorably impacted by non-taxable gains on assets invested in corporate-owned life insurance (COLI) policies, interest earned for refunds due on prior year tax returns and tax benefits related to deductions claimed for income from domestic production activities. During theactivities and interest earned from refunds due on prior year ended June 30, 2009, the Company’s income tax expense was impacted by non-deductible losses on COLI policies.returns.
In connection with the issuance of the Notes, original issue discount (OID) was created for income tax purposes. Over the term of the Notes, this OID will generate additional interest expense for income tax reporting purposes (see Note 14)13).
U.S. income taxes have not been provided for with respect to undistributed earnings of foreign subsidiaries that have been permanently reinvested outside the United States. As of June 30, 2010,2011, the deferred liability associated with these undistributed earnings is $4.5$6.0 million.
CACI INTERNATIONAL INC
NOTES TO CONSOLIDATED FINANCIAL STATEMENTS—(Continued)
The Company’s total liability for unrecognized tax benefits as of June 30, 2011, 2010 and June 30, 2009 was $5.9 million, $5.2 million and $11.9 million, respectively. Of the $5.2$5.9 million unrecognized tax benefit at June 30, 2010, $2.12011, $2.0 million, if recognized, would impact the Company’s effective tax rate. A reconciliation of the beginning and ending amount of unrecognized benefits is shown in the table below (in thousands):
| June 30, | Year ended June 30, | ||||||||||||||||||
| 2010 | 2009 | 2011 | 2010 | 2009 | |||||||||||||||
Beginning of year | $ | 11,945 | $ | 4,612 | $ | 5,189 | $ | 11,945 | $ | 4,612 | |||||||||
Additions based on current year tax positions | 1,323 | 651 | 2,711 | 1,323 | 651 | ||||||||||||||
Reductions based on current year tax positions | — | — | — | — | — | ||||||||||||||
Additions based on prior year tax positions | — | 6,682 | — | — | 6,682 | ||||||||||||||
Reductions based on prior year tax positions | (7,332 | ) | — | (2,003 | ) | (7,332 | ) | — | |||||||||||
Lapse of statute of limitations | (630 | ) | — | — | (630 | ) | — | ||||||||||||
Settlements with taxing authorities | (117 | ) | — | — | (117 | ) | — | ||||||||||||
|
|
| |||||||||||||||||
End of year | $ | 5,189 | $ | 11,945 | $ | 5,897 | $ | 5,189 | $ | 11,945 | |||||||||
|
|
| |||||||||||||||||
The Company recognizes net interest and penalties as a component of income tax expense. During the yearyears ended June 30, 2011 and 2010, the Company’s income tax expense was reduced by $0.2 million and $0.7 million, respectively, related to interest earned in connection with amended returns and carryback claims filed by the Company, as described above. Net interest and penalties for the year ended June 30, 2009 were not material. Over the next 12 months, the Company does not expect a significant increase or decrease in the unrecognized tax benefits recorded at June 30, 2010.2011. As of June 30, 2010, $4.3 million and $0.72011, $5.1 million of the unrecognized tax benefits are included in other long-term liabilities, and as an offset to other long-term assets, respectively, with the remainder included in other balance sheets accounts.
CACI INTERNATIONAL INC
NOTES TO CONSOLIDATED FINANCIAL STATEMENTS—(Continued)
NOTE 21.20. RETIREMENT SAVINGS PLANS
401(k) Plan
The Company maintains a defined contribution plan under Section 401(k) of the Internal Revenue Code, the CACI $MART Plan (the 401(k) Plan). Employees can contribute up to 75 percent (subject to certain statutory limitations) of their total cash compensation. The Company provides matching contributions equal to 50 percent of the amount of salary deferral employees elect, up to 6 percent of each employee’s total calendar year cash compensation, as defined. The Company may also make discretionary profit sharing contributions to the 401(k) Plan. Employee contributions vest immediately. Employer contributions vest in full after three years of employment. Total Company contributions to the 401(k) Plan for the years ended June 30, 2011, 2010, and 2009 and 2008 were $21.6 million, $17.4 million, $21.0 million, and $18.6$21.0 million, respectively. During the year ended June 30, 2010, the Company amended the 401(k) Plan to provide that non-vested balances are forfeited upon the earlier of a distribution being taken or on December 31 of the year the participant terminated employment at the Company. Previously, non-vested balances were forfeited upon the earlier of a distribution being taken or on December 31 following a five year break in service. This change increased the amount of forfeitures available to offset Company contributions during the year ended June 30, 2010.
U.K. PensionDefined Contribution Plan
CACI LimitedThe Company maintains a defined contribution Group Person Pension Planplan in the U.K. Under CACI Limited’s flexible benefitsthe plan, employees can elect the amount of pension contributions that they wish to make out of their flexible benefit entitlements subject to certain U.K. tax limits. The contributions are deemed to be company contributions and vest immediately. Employees may also elect to make personal contributions into the plan. CACI Limited’s contributionsContributions to this plan and its predecessor plans for the years ended June 30, 2011, 2010, 2009, and 20082009 were $1.5 million, $1.5 million, and $1.3 million, and $1.5 million, respectively.
CACI INTERNATIONAL INC
NOTES TO CONSOLIDATED FINANCIAL STATEMENTS—(Continued)
Supplemental Savings Plan
The Company maintains the Supplemental Savings Plan through which, on a calendar year basis, officers at the vice presidentdirector level and above can elect to defer for contribution to the Supplemental Savings Plan up to 50 percent of their base compensation and up to 100 percent of their bonuses and commissions. Prior to January 1, 2011, officers at the vice president level and above were eligible to participate. During the year ended June 30, 2011, the Supplemental Savings Plan was amended to allow employees at the director level to participate. The Company provides a contribution of 5 percent of compensation for each participant’s compensation that exceeds the limit as set forth in IRC 401(a)(17) (currently $245,000 per year). The Company also has the option to make annual discretionary contributions. Company contributions vest over a 5-year period, and vesting is accelerated in the event of a change of control of the Company. Participant deferrals and Company contributions will be credited with the rate of return based on the investment options and asset allocations selected by the Participant. Participants may change their asset allocation as often as daily, if they so chose.choose. A Rabbi Trust has been established to hold and provide a measure of security for the investments that finance benefit payments. Distributions from the Supplemental Savings Plan are made upon retirement, termination, death, or total disability. The Supplemental Savings Plan also allows for in-service distributions.
Supplemental Savings Plan obligations due to participants totaled $52.9$67.2 million at June 30, 2010,2011, of which $2.5$2.3 million is included in accrued compensation and benefits in the accompanying consolidated balance sheet. Supplemental Savings Plan obligations increased by $10.2$14.3 million during the year ended June 30, 2010,2011, consisting of $5.4$9.1 million of investment gains, $7.9$9.3 million of participant compensation deferrals, and $1.0$1.1 million of Company contributions, offset by $4.1$5.2 million of distributions.
The Company maintains investment assets in a Rabbi Trust to offset the obligations under the Supplemental Savings Plan. The value of the investments in the Rabbi Trust was $51.7$66.9 million at June 30, 2010.2011. Investment gains were $5.3$8.9 million for the year ended June 30, 2010.
CACI INTERNATIONAL INC
NOTES TO CONSOLIDATED FINANCIAL STATEMENTS—(Continued)2011.
Contribution expense for the Supplemental Savings Plan during the years ended June 30, 2011, 2010, and 2009, and 2008, was $0.9$1.2 million, $0.9 million, and $0.8$0.9 million, respectively.
NOTE 22.21. STOCK PLANS AND STOCK-BASED COMPENSATION
For stock options, stock-settled stock appreciation rights (SSARs) and non-performance basednon-performance-based restricted stock units (RSUs), stock-based compensation expense is recognized on a straight-line basis ratably over the respective vesting periods. For RSUs subject to graded vesting schedules for which vesting is based on achievement of a performance metric in addition to grantee service (performance-based RSUs), stock-based compensation expense is recognized on an accelerated basis by treating each vesting tranche as if it was a separate grant. Stock-based compensation expense isfor performance-based grants dependent upon the net after tax profit (NATP) reported by the Company for the fiscal year ended June 30, 2010 was also adjusted for performance-based RSUsin each reporting period such that expense is recorded for the number of shares then expected to vest based on management’s then best estimate of the performance that willwould be achieved. A summary of the components of stock-based compensation expense recognized during the years ended June 30, 2011, 2010, 2009, and 2008,2009, together with the income tax benefits realized, is as follows (in thousands):
| Year ended June 30, | Year ended June 30, | ||||||||||||||||||||
| 2010 | 2009 | 2008 | 2011 | 2010 | 2009 | ||||||||||||||||
Stock-based compensation included in indirect costs and selling expense: | |||||||||||||||||||||
SSARs and non-qualified stock option expense | $ | 8,484 | $ | 9,926 | $ | 11,328 | $ | 3,714 | $ | 8,484 | $ | 9,926 | |||||||||
Restricted stock and RSU expense | 22,266 | 6,895 | 6,311 | 14,201 | 22,266 | 6,895 | |||||||||||||||
|
|
| |||||||||||||||||||
Total stock-based compensation expense | $ | 30,750 | $ | 16,821 | $ | 17,639 | $ | 17,915 | $ | 30,750 | $ | 16,821 | |||||||||
|
|
| |||||||||||||||||||
Income tax benefit recognized for stock-based compensation expense | $ | 11,218 | $ | 6,895 | $ | 6,960 | $ | 6,549 | $ | 11,218 | $ | 6,895 | |||||||||
|
|
| |||||||||||||||||||
CACI INTERNATIONAL INC
NOTES TO CONSOLIDATED FINANCIAL STATEMENTS—(Continued)
The Company recognizes the effect of expected forfeitures of equity grants by estimating an expected forfeiture rate for grants of equity instruments. Amounts recognized for expected forfeitures are subsequently adjusted periodically and at major vesting dates to reflect actual forfeitures.
The incremental income tax benefits realized upon the exercise or vesting of equity instruments are reported as financing cash flows. During the years ended June 30, 2011, 2010, 2009, and 2008,2009, the Company recognized $0.2$2.2 million, $0.2 million, and $1.5$0.2 million of excess tax benefits, respectively, which have been reported as financing cash inflows in the accompanying consolidated statements of cash flows.
Equity Grants and Valuation
Under the terms of its 2006 Stock Incentive Plan (the 2006 Plan), the Company may issue, among others, non-qualified stock options, restricted stock, RSUs, SSARs, and performance awards, collectively referred to herein as equity instruments. The 2006 Plan was approved by the Company’s stockholders in November 2006 and replaced the 1996 Stock Incentive Plan (the 1996 Plan) which was due to expire at the end of a ten-year period. During the periods presented, all equity instrument grants were made in the form of either SSARs or RSUs and the exercise price of all SSAR and non-qualified stock option grants and the value of restricted stock and RSU grants werewas set at the closing price of a share of the Company’s common stock on the date of grant, as reported by the New York Stock Exchange. Annual grants under the 2006 Plan (and previous grants under the 1996 Plan) are generally made to the Company’s key employees during the first quarter of the Company’s fiscal year and to members of the Company’s Board of Directors during the second quarter of the Company’s fiscal year. With the approval of its Chief Executive Officer, the Company also issues equity instruments to strategic new hires and to employees who have demonstrated superior performance.
CACI INTERNATIONAL INC
NOTES TO CONSOLIDATED FINANCIAL STATEMENTS—(Continued)
Prior to June 2007, the Company issued equity instruments to its key employees in the form of non-qualified stock options and either RSUs or shares of restricted stock. Effective in June 2007, the Company began issuing SSARs instead of non-qualified stock options. RSUs and shares of restricted stock granted through June 2008 vest based on the passage of time and continued service as an employee of the Company. Beginning in August 2008, the Company began also issuing performance-based RSUs. For performance-based RSUs granted as part of the Company’s annual grants made inBetween August 2008 and in August 2009,January 2010, the Company issued performance-based RSUs for which vesting iswas initially dependent upon the net after-tax profit (NATP)NATP reported by the Company for the fiscal year ended June 30, 2010. The maximum number of performance-based RSUs which will vest is based on the achievement of a certain NATP which has been established by the Company’s Board of Directors. No performance-based RSUs would vest if NATP was less than a lesser, pre-defined amount. In addition to achieving a certain level of NATP, vesting is contingent upon the grantee’s service. Based on the Company’s actual NATP for the year ended June 30, 2010, which is the same as the Company’s net income attributable to CACI as reported on the consolidated statementstatements of operations, the maximum numbers of performance-based RSUs were earned. Performance-based RSUs granted in August 2008 will vest in increments of one-third of the shares underlying the RSUs on an annual basis beginning two years after the grant date,in August 2010, and performance-based RSUs granted in August 2009 will vest in increments of one-fourth of the shares underlying the RSUs on an annual basis beginning onein August 2011.
On September 1, 2010, the Company made its annual grant to key employees, in the form of performance-based RSUs. The initial number of RSUs granted was 727,880. The final number of such performance-based RSUs which will vest is based on the achievement of an increased NATP for the year afterended June 30, 2011 as compared to NATP for the year ended June 30, 2010 and on the average share price of Company stock for the 90 day period ending September 1, 2011 as compared to the average share price for the 90 day period ended September 1, 2010. Once the final number of RSUs has been determined, one-half of the RSUs will vest three years from the grant date. All performance-based RSUs awarded for a given NATP leveldate and for which service requirements are fulfilledone-half will have fully vestedvest four years afterfrom the grant date.
The Company also issues equity instruments in the form of RSUs under its Management Stock Purchase Plan (MSPP) and Director Stock Purchase Plan (DSPP).
Prior to November 2008, the Company issued equity instruments In addition, annual grants are made to members of its Board of Directors in the form of a set number of non-qualified stock options. Effective in November 2008, the Company’s shareholders approved a change to grant equity to members of the Board of Directors in the form of a set dollar value of RSUs. The grantsGrants to members of the Board of Directors vest based on the passage of time and continued service as a Director of the Company.
Upon the exercise of stock options and SSARs and the vesting of restricted shares and RSUs, the Company fulfills its obligations under the equity instrument agreements by either issuing new shares of authorized common stock or by issuing shares from treasury. The total number of shares authorized by shareholders for grants under the 2006 Plan was 10,950,000 as of June 30, 2010.2011. The aggregate number of grants that may be made under the 2006 Plan may exceed this approved amount as forfeited SSARs, stock options, restricted stock and RSUs, and
CACI INTERNATIONAL INC
NOTES TO CONSOLIDATED FINANCIAL STATEMENTS—(Continued)
vested but unexercised SSARs and stock options that expire, become available for future grants. As of June 30, 2010,2011, cumulative grants of 10,688,37911,488,491 equity instruments underlying the shares authorized for the 2006 Plan have been awarded, and 2,138,8812,286,294 of these instruments have been forfeited.
Non-qualified stock options granted prior to January 1, 2004 lapse and are no longer exercisable if not exercised within ten years of the date of grant. Equity instruments granted on or after January 1, 2004 have a term of seven years. For SSAR and stock option awards, grantees whose employment has terminated have 60 days after their termination date to exercise vested SSARs and stock options, or they forfeit their right to the instruments. Grantees whose employment is terminated due to death or permanent disability will vest in 100 percent of their equity instrument grants. Also, effective for grants made on or after July 1, 2004, grantees who were age 62 on or before July 1, 2008 who retire on or after age 65 will vest in 100 percent of their equity instrument grants upon retirement, with the exception of performance-based RSUs, which must be held at least until the measurement period is complete. Grantees who were not age 62 on or before July 1, 2008, who retire on or after age 62, vest in a prorated portion of their equity instrument grants upon retirement, based upon their service during the vesting period, with the exception of performance-based RSUs, which must be held until the measurement period is complete.
Stock options vest ratably over a three, four, or five year period, depending on the year of grant. Restricted shares and non-performance basednon-performance-based RSUs vest in full three years from the date of grant. SSARs granted as part of
CACI INTERNATIONAL INC
NOTES TO CONSOLIDATED FINANCIAL STATEMENTS—(Continued)
the Company’s customary annual award vest ratably over a five year period in a manner consistent with the vesting of stock options. On July 2, 2007, the Company made a one-time special grantsgrant of 25,000 SSARs each to its then newly appointed President of U.S. Operations and its then newly appointed Chief Operating Officer and effective June 20, 2007, the Company made a one-time special grant of 300,000 SSARs to its then newly appointed Chief Executive Officer. These special grants of SSARs contain market-based vesting features under which, beginning one year from the date of award, a grantee may exercise portions of his SSARs if the average of the closing prices of a share of the Company’s common stock for 20 consecutive trading days equals or exceeds pre-defined amounts. Greater portions of the grants vest as the average of the closing prices increases. Any SSARs that do not vest under the market-based feature will vest in full five years from the date of grant.
During the year ended June 30, 2010, the annual equity grant to the Company’s key employees was made effective August 18, 2009 and was comprised of 462,965 RSUs, of which 447,285 wereOther than performance-based RSUs and 15,680 were non-performance based RSUs.
Thewhich contain a market-based element, the fair value of restricted shares and RSUs is determined based on the closing price of a share of the Company’s common stock on the date of grant. TheOther than SSARs which contain a market-based element, the fair value of each SSAR or stock option award is estimated on the date of grant using the Black-Scholes valuation model. The fair value of RSUs and SSARs with market-based vesting features is also measured on the grant date, but is done so using a binomial lattice model. The fair values of both stock options and SSARs aregranted during the year ended June 30, 2009 were based on the following assumptions (no stock options or SSARs were granted during the yearyears ended June 30, 2011 or 2010):
| For SSARs/Stock Options Granted During the year ended June 30, | ||||
| 2009 | 2008 | |||
Historical volatility | 30.7% - 38.7% | 26.5% - 31.9% | ||
Expected dividends | 0% | 0% | ||
Expected life (in years) | 5.5 | 2.7 - 5.5 | ||
Risk-free rate | 2.19% - 3.23% | 2.90% - 5.01% | ||
| For SSARs Granted During the year ended June 30, | ||
| 2009 | ||
Historical volatility | 30.7% - 38.7% | |
Expected dividends | 0% | |
Expected life (in years) | 5.5 | |
Risk-free rate | 2.19% - 3.23% |
The expected lives of the SSAR and stock option grants represent the period of time SSARs and stock options are expected to be outstanding and arewere based on the contractual terms of the grant and vesting schedules, and, for stock options, past exercise behaviors.schedules. The risk-free rates for periods approximating the expected lives arewere based on the U.S. treasury yield curve in effect at the time of the respective grant.
The weighted-average fair value of SSARs and stock options granted during the years ended June 30, 2009, and 2008, was $17.09 and $18.00, respectively, and the weighted-average fair value of restricted stock and RSUs granted during the years ended June 30, 2010, 2009, and 2008, was $46.01, $48.77, and $48.40, respectively.
CACI INTERNATIONAL INC
NOTES TO CONSOLIDATED FINANCIAL STATEMENTS—(Continued)
The weighted-average fair value of SSARs granted during the year ended June 30, 2009, was $17.09 and the weighted-average fair value of RSUs granted during the years ended June 30, 2011, 2010, and 2009, was $43.79, $46.01, and $48.77, respectively.
Activity for all outstanding SSARs and stock options, and the corresponding exercise price and fair value information, for the years ended June 30, 2011, 2010, 2009, and 2008,2009, is as follows:
| Number of Shares | Exercise Price | Weighted Average Exercise Price | Weighted Average Grant Date Fair Value | |||||||||
Outstanding, June 30, 2007 | 2,702,393 | $ | 8.44 - 65.04 | $ | 45.40 | $ | 18.60 | |||||
Exercisable, June 30, 2007 | 1,236,243 | 8.44 - 64.36 | 31.79 | 12.85 | ||||||||
Issued | 861,700 | 41.58 - 52.14 | 48.54 | 18.00 | ||||||||
Exercised | (183,469 | ) | 9.38 - 47.59 | 22.23 | 9.58 | |||||||
Forfeited | (72,775 | ) | 10.69 - 62.48 | 50.97 | 20.41 | |||||||
Outstanding, June 30, 2008 | 3,307,849 | 8.44 - 65.04 | 47.37 | 18.91 | ||||||||
Exercisable, June 30, 2008 | 1,267,681 | 8.44 - 65.04 | 37.00 | 14.68 | ||||||||
Issued | 346,300 | 37.67 - 49.78 | 49.13 | 17.09 | ||||||||
Exercised | (71,215 | ) | 9.41 - 40.00 | 29.89 | 13.54 | |||||||
Forfeited | (172,889 | ) | 9.94 - 62.48 | 50.66 | 19.27 | |||||||
Expired | (31,000 | ) | 8.44 - 49.43 | 46.79 | 16.61 | |||||||
Outstanding, June 30, 2009 | 3,379,045 | 9.25 - 65.04 | 47.76 | 18.84 | ||||||||
Exercisable, June 30, 2009 | 1,335,207 | 9.25 - 65.04 | 40.22 | 16.03 | ||||||||
Issued | — | — | — | — | ||||||||
Exercised | (191,337 | ) | 9.25 - 46.37 | 29.21 | 11.17 | |||||||
Forfeited | (56,667 | ) | 45.77 - 62.48 | 51.10 | 19.55 | |||||||
Expired | (44,613 | ) | 11.19 - 64.36 | 60.59 | 23.44 | |||||||
Outstanding, June 30, 2010 | 3,086,428 | 9.94 - 65.04 | 48.66 | 19.23 | ||||||||
Exercisable, June 30, 2010 | 1,455,220 | $ | 9.94 - 65.04 | $ | 44.99 | $ | 18.08 | |||||
| Number of Shares | Exercise Price | Weighted Average Exercise Price | Weighted Average Grant Date Fair Value | |||||||||||||
Outstanding, June 30, 2008 | 3,307,849 | $ | 8.44 - 65.04 | $ | 47.37 | $ | 18.91 | |||||||||
|
|
|
|
|
|
|
| |||||||||
Exercisable, June 30, 2008 | 1,267,681 | 8.44 - 65.04 | 37.00 | 14.68 | ||||||||||||
|
|
|
|
|
|
|
| |||||||||
Issued | 346,300 | 37.67 - 49.78 | 49.13 | 17.09 | ||||||||||||
Exercised | (71,215 | ) | 9.41 - 40.00 | 29.89 | 13.54 | |||||||||||
Forfeited | (172,889 | ) | 9.94 - 62.48 | 50.66 | 19.27 | |||||||||||
Expired | (31,000 | ) | 8.44 - 49.43 | 46.79 | 16.61 | |||||||||||
|
|
|
|
|
|
|
| |||||||||
Outstanding, June 30, 2009 | 3,379,045 | 9.25 - 65.04 | 47.76 | 18.84 | ||||||||||||
|
|
|
|
|
|
|
| |||||||||
Exercisable, June 30, 2009 | 1,335,207 | 9.25 - 65.04 | 40.22 | 16.03 | ||||||||||||
|
|
|
|
|
|
|
| |||||||||
Exercised | (191,337 | ) | 9.25 - 46.37 | 29.21 | 11.17 | |||||||||||
Forfeited | (56,667 | ) | 45.77 - 62.48 | 51.10 | 19.55 | |||||||||||
Expired | (44,613 | ) | 11.19 - 64.36 | 60.59 | 23.44 | |||||||||||
|
|
|
|
|
|
|
| |||||||||
Outstanding, June 30, 2010 | 3,086,428 | 9.94 - 65.04 | 48.66 | 19.23 | ||||||||||||
|
|
|
|
|
|
|
| |||||||||
Exercisable, June 30, 2010 | 1,455,220 | 9.94 - 65.04 | 44.99 | 18.08 | ||||||||||||
|
|
|
|
|
|
|
| |||||||||
Exercised | (791,722 | ) | 9.94 - 62.48 | 36.36 | 14.82 | |||||||||||
Forfeited | (85,460 | ) | 45.77 - 54.39 | 49.47 | 18.88 | |||||||||||
Expired | (98,942 | ) | 48.83 - 63.20 | 58.61 | 22.09 | |||||||||||
|
|
|
|
|
|
|
| |||||||||
Outstanding, June 30, 2011 | 2,110,304 | 34.10 - 65.04 | 52.78 | 20.77 | ||||||||||||
|
|
|
|
|
|
|
| |||||||||
Exercisable, June 30, 2011 | 1,177,209 | $ | 34.10 - 65.04 | $ | 55.19 | $ | 22.17 | |||||||||
|
|
|
|
|
|
|
| |||||||||
CACI INTERNATIONAL INC
NOTES TO CONSOLIDATED FINANCIAL STATEMENTS—(Continued)
Changes in the number of unvested SSARs and stock options and in unvested restricted stock and RSUs during each of the years in the three-year period ended June 30, 2010,2011, together with the corresponding weighted-average fair values, are as follows:
| SSARs and Stock Options | Restricted Stock and Restricted Stock Units | SSARs and Stock Options | Restricted Stock and Restricted Stock Units | |||||||||||||||||||||||||
| Number of Shares | Weighted Average Grant Date Fair Value | Number of Shares | Weighted Average Grant Date Fair Value | |||||||||||||||||||||||||
Unvested at June 30, 2007 | 1,466,150 | $ | 23.45 | 226,565 | $ | 58.70 | ||||||||||||||||||||||
Granted | 861,700 | 18.00 | 153,290 | 48.40 | ||||||||||||||||||||||||
Vested | (223,907 | ) | 20.46 | (21,243 | ) | 55.37 | ||||||||||||||||||||||
Forfeited | (63,775 | ) | 21.62 | (12,452 | ) | 56.77 | ||||||||||||||||||||||
| Number of Shares | Weighted Average Grant Date Fair Value | Number of Shares | Weighted Average Grant Date Fair Value | |||||||||||||||||||||||||
Unvested at June 30, 2008 | 2,040,168 | 21.53 | 346,160 | 54.19 | 2,040,168 | $ | 21.53 | 346,160 | $ | 54.19 | ||||||||||||||||||
|
|
|
| |||||||||||||||||||||||||
Granted | 346,300 | 17.09 | 410,699 | 48.77 | 346,300 | 17.09 | 410,699 | 48.77 | ||||||||||||||||||||
Vested | (178,575 | ) | 24.59 | (115,475 | ) | 50.40 | (178,575 | ) | 24.59 | (115,475 | ) | 50.40 | ||||||||||||||||
Forfeited | (164,055 | ) | 19.59 | (62,570 | ) | 49.71 | (164,055 | ) | 19.59 | (62,570 | ) | 49.71 | ||||||||||||||||
|
|
|
| |||||||||||||||||||||||||
Unvested at June 30, 2009 | 2,043,838 | 20.67 | 578,814 | 49.37 | 2,043,838 | 20.67 | 578,814 | 49.37 | ||||||||||||||||||||
|
|
|
| |||||||||||||||||||||||||
Granted | — | — | 499,466 | 46.01 | — | — | 499,466 | 46.01 | ||||||||||||||||||||
Vested | (355,963 | ) | 22.73 | (101,715 | ) | 51.56 | (355,963 | ) | 22.73 | (101,715 | ) | 51.56 | ||||||||||||||||
Forfeited | (56,667 | ) | 19.55 | (26,935 | ) | 48.13 | (56,667 | ) | 19.55 | (26,935 | ) | 48.13 | ||||||||||||||||
|
|
|
| |||||||||||||||||||||||||
Unvested at June 30, 2010 | 1,631,208 | $ | 20.26 | 949,630 | $ | 47.41 | 1,631,208 | 20.26 | 949,630 | 47.41 | ||||||||||||||||||
|
|
|
| |||||||||||||||||||||||||
Granted | — | — | 800,112 | 43.79 | ||||||||||||||||||||||||
Vested | (612,653 | ) | 22.38 | (357,954 | ) | 47.87 | ||||||||||||||||||||||
Forfeited | (85,460 | ) | 18.88 | (69,687 | ) | 45.01 | ||||||||||||||||||||||
|
|
|
| |||||||||||||||||||||||||
Unvested at June 30, 2011 | 933,095 | $ | 18.99 | 1,322,101 | $ | 45.23 | ||||||||||||||||||||||
|
|
|
| |||||||||||||||||||||||||
Information regarding the cash proceeds received, and the intrinsic value and total tax benefits realized resulting from stock option exercises is as follows (in thousands):
| Year ended June 30, | Year ended June 30, | ||||||||||||||||||||
| 2010 | 2009 | 2008 | 2011 | 2010 | 2009 | ||||||||||||||||
Cash proceeds received | $ | 5,589 | $ | 2,129 | $ | 4,079 | $ | 22,077 | $ | 5,589 | $ | 2,129 | |||||||||
Intrinsic value realized | $ | 1,557 | $ | 989 | $ | 5,263 | $ | 14,561 | $ | 1,557 | $ | 989 | |||||||||
Income tax benefit realized | $ | 612 | $ | 388 | $ | 2,047 | $ | 5,731 | $ | 612 | $ | 388 | |||||||||
The total intrinsic value of RSUs that vested during the years ended June 30, 2011, 2010, and 2009 and 2008 was $15.4 million, $4.5 million $5.3 million and $1.0$5.3 million, respectively, and the tax benefit realized for these vestings was $6.1 million, $1.7 million $2.1 million and $0.4$2.1 million, respectively.
The grant date fair value of stock options that vested during each of the years in the three-year period ended June 30, 20102011 was $13.7 million, $8.1 million, and $4.4 million, and $4.5 million, respectively.
CACI INTERNATIONAL INC
NOTES TO CONSOLIDATED FINANCIAL STATEMENTS—(Continued)
Outstanding SSAR and Stock Option Information
Information regarding the SSARs and stock options outstanding and exercisable as of June 30, 2010,2011, is as follows (intrinsic value in thousands):
| SSARs and Options Outstanding | SSARs and Options Exercisable | SSARs and Options Outstanding | SSARs and Options Exercisable | |||||||||||||||||||||||||||||||||||||||||||||||||
Range of exercise Price | Number of Instruments | Weighted Average Exercise Price | Weighted Average Remaining Contractual Life | Intrinsic Value | Number of Instruments | Weighted Average Exercise Price | Weighted Average Remaining Contractual Life | Intrinsic Value | Number of Instruments | Weighted Average Exercise Price | Weighted Average Remaining Contractual Life | Intrinsic Value | Number of Instruments | Weighted Average Exercise Price | Weighted Average Remaining Contractual Life | Intrinsic Value | ||||||||||||||||||||||||||||||||||||
$0.00-$9.99 | 9,998 | $ | 9.94 | 0.08 | $ | 325 | 9,998 | $ | 9.94 | 0.08 | $ | 325 | ||||||||||||||||||||||||||||||||||||||||
$10.00-$19.99 | 3,500 | 19.10 | 0.83 | 82 | 3,500 | 19.10 | 0.83 | 82 | ||||||||||||||||||||||||||||||||||||||||||||
$20.00-$29.99 | 184,116 | 21.58 | 1.05 | 3,848 | 184,116 | 21.58 | 1.05 | 3,848 | ||||||||||||||||||||||||||||||||||||||||||||
$30.00-$39.99 | 362,881 | 34.97 | 2.66 | 2,725 | 357,761 | 34.93 | 2.63 | 2,700 | 156,509 | $ | 34.59 | 1.94 | $ | 4,458 | 152,669 | $ | 34.52 | 1.89 | $ | 4,361 | ||||||||||||||||||||||||||||||||
$40.00-$49.99 | 1,216,191 | 47.25 | 4.09 | 498 | 347,606 | 43.57 | 2.58 | 498 | 786,761 | 48.71 | 3.66 | 11,309 | 215,826 | 48.73 | 3.66 | 3,097 | ||||||||||||||||||||||||||||||||||||
$50.00-$59.99 | 648,005 | 52.71 | 3.35 | — | 136,580 | 54.88 | 2.43 | — | 568,140 | 52.49 | 2.51 | 6,017 | 209,820 | 54.10 | 2.14 | 1,883 | ||||||||||||||||||||||||||||||||||||
$60.00-$69.99 | 661,737 | 63.10 | 2.14 | — | 415,659 | 63.03 | 2.13 | — | 598,894 | 63.17 | 1.13 | 255 | 598,894 | 63.17 | 1.13 | 255 | ||||||||||||||||||||||||||||||||||||
|
|
|
| |||||||||||||||||||||||||||||||||||||||||||||||||
| 3,086,428 | $ | 48.66 | 3.15 | $ | 7,478 | 1,455,220 | $ | 44.99 | 2.23 | $ | 7,453 | 2,110,304 | $ | 52.78 | 2.51 | $ | 22,039 | 1,177,209 | $ | 55.19 | 1.87 | $ | 9,596 | |||||||||||||||||||||||||||||
|
|
|
| |||||||||||||||||||||||||||||||||||||||||||||||||
As of June 30, 2010,2011, there was $8.7$3.4 million of unrecognized compensation cost related to SSARs and stock options scheduled to be recognized over a weighted-average period of 2.11.5 years, and $15.3$18.8 million of unrecognized compensation cost related to restricted stock and RSUs scheduled to be recognized over a weighted-average period of 2.62.5 years.
Stock Purchase Plans
The Company adopted the 2002 Employee Stock Purchase Plan (ESPP), MSPP and DSPP in November 2002, and implemented these plans beginning July 1, 2003. There are 1,000,000, 500,000, and 75,000 shares authorized for grants under the ESPP, MSPP and DSPP, respectively.
The ESPP allows eligible full-time employees to purchase shares of common stock at 95 percent of the fair market value of a share of common stock on the last day of the quarter. The maximum number of shares that an eligible employee can purchase during any quarter is equal to two times an amount determined as follows: 20 percent of such employee’s compensation over the quarter, divided by 95 percent of the fair market value of a share of common stock on the last day of the quarter. The ESPP is a qualified plan under Section 423 of the Internal Revenue Code and, for financial reporting purposes, was amended effective July 1, 2005 so as to be considered non-compensatory. Accordingly, there is no stock-based compensation expense associated with shares acquired under the ESPP. As of June 30, 2010,2011, participants have purchased 716,859792,180 shares under the ESPP, at a weighted-average price per share of $44.97.$45.16. Of these shares, 75,08875,321 were purchased by employees at a weighted-average price per share of $44.48$47.00 during the year ended June 30, 2010.2011. To satisfy its obligations under the ESPP, the Company can purchase shares in the open market, issue shares previously acquired and held in treasury or issue authorized but unissued shares. During the year ended June 30, 2010,2011, the Company purchased 75,08875,321 shares in the open market to fulfill the employees’ share purchases.
The MSPP provides those senior executives with stock holding requirements a mechanism to receive RSUs in lieu of up to 100 percent of their annual bonus. For the fiscal years ended June 30, 2011, 2010 2009 and 2008,2009, RSUs awarded in lieu of bonuses earned are granted at 85 percent of the closing price of a share of the Company’s common stock on the date of the award, as reported by the New York Stock Exchange. For bonuses earned
CACI INTERNATIONAL INC
NOTES TO CONSOLIDATED FINANCIAL STATEMENTS—(Continued)
during the fiscal year ended June 30, 2007, RSUs were granted at 95 percent of the closing price of a share of the Company’s common stock on the date of grant. RSUs granted under the MSPP vest at the earlier of 1) three years from the grant date, 2) upon a change of control of the Company, 3) upon a participant’s retirement at or after age 65, or 4) upon a participant’s death or permanent disability. Vested RSUs are settled in shares of common stock. The Company recognizes the value of the discount applied to RSUs granted under the MSPP as stock compensation expense ratably over the three-year vesting period.
CACI INTERNATIONAL INC
NOTES TO CONSOLIDATED FINANCIAL STATEMENTS—(Continued)
The DSPP allows directors to elect to receive RSUs at the market price of the Company’s common stock on the date of the award in lieu of up to 100 percent of their annual retainer fees. Vested RSUs are settled in shares of common stock.
Activity related to the MSPP and the DSPP during the year ended June 30, 20102011 is as follows:
| MSPP | DSPP | MSPP | DSPP | ||||||||||||
RSUs outstanding, June 30, 2009 | 60,733 | 162 | |||||||||||||
RSUs outstanding, June 30, 2010 | 72,844 | 427 | |||||||||||||
Granted | 28,361 | 265 | 15,171 | 241 | |||||||||||
Issued | (13,754 | ) | — | (9,005 | ) | — | |||||||||
Forfeited | (2,496 | ) | — | (1,518 | ) | — | |||||||||
|
| ||||||||||||||
RSUs outstanding, June 30, 2010 | 72,844 | 427 | |||||||||||||
RSUs outstanding, June 30, 2011 | 77,492 | 668 | |||||||||||||
|
| ||||||||||||||
Weighted average grant date fair value as adjusted for the applicable discount | $ | 39.46 | $ | 36.46 | |||||||||||
| |||||||||||||||
Weighted average grant date fair value | $ | 47.17 | $ | 51.87 | |||||||||||
| |||||||||||||||
NOTE 23.22. FAIR VALUE OF FINANCIAL INSTRUMENTS
ASC 820 defines fair value, establishes a framework for measuring fair value and expands disclosures about fair value measurements. Fair value is the price that would be received to sell an asset or paid to transfer a liability between market participants in an orderly transaction. The market in which the reporting entity would sell the asset or transfer the liability with the greatest volume and level of activity for the asset or liability is known as the principal market. When no principal market exists, the most advantageous market is used. This is the market in which the reporting entity would sell the asset or transfer the liability with the price that maximizes the amount that would be received or minimizes the amount that would be paid. Fair value is based on assumptions market participants would make in pricing the asset or liability. Generally, fair value is based on observable quoted market prices or derived from observable market data when such market prices or data are available. When such prices or inputs are not available, the reporting entity should use valuation models.
The Company’s financial assets and liabilities recorded at fair value on a recurring basis are categorized based on the priority of the inputs used to measure fair value. The inputs used in measuring fair value are categorized into three levels, as follows:
Level 1 Inputs—unadjusted quoted prices in active markets for identical assets or liabilities.
Level 2 Inputs—unadjusted quoted prices for similar assets and liabilities in active markets, quoted prices for identical or similar assets and liabilities in markets that are not active, inputs other than quoted prices that are observable, and inputs derived from or corroborated by observable market data.
Level 3 Inputs—amounts derived from valuation models in which unobservable inputs reflect the reporting entity’s own assumptions about the assumptions of market participants that would be used in pricing the asset or liability.
CACI INTERNATIONAL INC
NOTES TO CONSOLIDATED FINANCIAL STATEMENTS—(Continued)
As of June 30, 2010,2011, the Company’s financial instruments measured at fair value included non-COLI money market investments and mutual funds held in the Company’s Supplemental Savings Plan the obligations to participants under the same plan, and Contingent Considerationcontingent consideration in connection with business combinations completed subsequent toduring the year ended June 30, 2009.2010. The following table summarizes the financial assets and liabilities measured at fair value on a recurring basis as of June 30, 2010,2011, and the level they fall within the fair value hierarchy (in thousands):
Description of Financial Instrument | Financial Statement | Fair Value | Fair Value | Financial Statement Classification | Fair Value Hierarchy | Fair Value | |||||||||
Non-COLI assets held in connection with Supplemental Savings Plan | Long-term asset | Level 1 | $ | 4,199 | Long-term asset | Level 1 | $ | 6,514 | |||||||
Obligations under Supplemental Savings Plan | Current liability | Level 2 | $ | 2,495 | |||||||||||
Obligations under Supplemental Savings Plan | Long-term liability | Level 2 | $ | 50,384 | |||||||||||
Contingent Consideration | Long-term liability | Level 3 | $ | 33,813 | Current liability | Level 3 | $ | 20,839 | |||||||
Changes in the fair value of the assets held in connection with the Supplemental Savings Plan as well as changes in the related deferred compensation obligation, are recorded in indirect costs and selling expenses.
All three acquisitions completed during the year ended June 30, 2010 (see Note 5)4) contained provisions requiring that the Company pay contingent consideration in the event the acquired businesses achieved certain specified earnings results during the two year periods subsequent to each acquisition. The Company determined the fair value of the contingent consideration as of each acquisition date using a valuation model which included the evaluation of all possible outcomes and the application of an appropriate discount rate. At the end of each reporting period, the fair value of the contingent consideration is remeasured and any changes are recorded in indirect costs and selling expenses. During the yearyears ended June 30, 2011 and 2010, this remeasurement resulted in a $9.6 million and $2.0 million, respectively, reduction in the liability recorded.
NOTE 24.23. EARNINGS PER SHARE
Earnings per share and the weighted-average number of diluted shares are computed as follows (in thousands, except per share data):
| Year ended June 30, | Year ended June 30, | ||||||||||||||||||||
| 2010 | 2009 (As Adjusted(1)) | 2008 (As Adjusted(1)) | 2011 | 2010 | 2009 (As Adjusted(1)) | ||||||||||||||||
Net income attributable to CACI | $ | 106,515 | $ | 89,698 | $ | 77,935 | $ | 144,218 | $ | 106,515 | $ | 89,698 | |||||||||
|
|
| |||||||||||||||||||
Weighted-average number of basic shares outstanding during the period | 30,138 | 29,976 | 30,058 | 30,281 | 30,138 | 29,976 | |||||||||||||||
Dilutive effect of stock-based awards after application of treasury stock method | 538 | 451 | 548 | ||||||||||||||||||
Dilutive effect of SSARs/stock options and RSUs/restricted shares after application of treasury stock method | 816 | 538 | 451 | ||||||||||||||||||
Dilutive effect of the Notes | 203 | — | — | ||||||||||||||||||
|
|
| |||||||||||||||||||
Weighted-average number of diluted shares outstanding during the period | 30,676 | 30,427 | 30,606 | 31,300 | 30,676 | 30,427 | |||||||||||||||
|
|
| |||||||||||||||||||
Basic earnings per share | $ | 3.53 | $ | 2.99 | $ | 2.59 | $ | 4.76 | $ | 3.53 | $ | 2.99 | |||||||||
|
|
| |||||||||||||||||||
Diluted earnings per share | $ | 3.47 | $ | 2.95 | $ | 2.55 | $ | 4.61 | $ | 3.47 | $ | 2.95 | |||||||||
|
|
| |||||||||||||||||||
| (1) | Certain amounts for the |
CACI INTERNATIONAL INC
NOTES TO CONSOLIDATED FINANCIAL STATEMENTS—(Continued)
The total number of weighted-average common stock equivalents excluded from the diluted per share computations due to their anti-dilutive effects for the years ended June 30, 2011, 2010 and 2009, and 2008, were 1.9 million, 2.4 million, 2.5 million, and 2.32.5 million, respectively. The performance-based RSUs granted in August 2008 were excluded from the calculation of diluted earnings per share for the fiscal year ended June 30, 2009 as the underlying shares were considered to be contingently issuable shares until June 30, 2010, the date on which the performance metric was measured. With the resolution of the performance metric, shares underlying the performance basedperformance-based RSUs granted in August 2008 and August 2009 are included in the calculation of diluted earnings per share for the years ended June 30, 2010 and 2011. The shares underlying the performance-based RSUs granted in September 2010 are included in the calculation of diluted earnings per share for the year ended June 30, 2010.2011 as the NATP performance metric associated with the shares was met and as if the performance metric based on the share price was computed as of June 30, 2011. The shares underlying the Notes were not included in the computation of diluted earnings per share for any of the periods presentedyears ended June 30, 2009 and 2010 because the conversion price of $54.65 exceeded the average share price during all periods since issuance througheach three month period in those years. The shares underlying the Notes were included in the computation of diluted earnings per share for the year ended June 30, 2010.2011 because the average share price during the quarters ended March 31, 2011 and June 30, 2011 exceeded the conversion price of $54.65. The Warrants were also excluded from the computation of diluted earnings per share because the Warrants’ exercise price of $68.31 was greater than the average market price of a share of Company common stock during the periods in which the Warrants were outstanding.
NOTE 25.24. COMMON STOCK DATA (UNAUDITED)
The ranges of high and low sales prices of the Company’s common stock as reported by the New York Stock Exchange for each quarter during the fiscal years ended June 30, 20102011 and 20092010 were as follows:
| 2010 | 2009 | |||||||||||
Quarter | High | Low | High | Low | ||||||||
1st | $ | 48.85 | $ | 42.00 | $ | 52.00 | $ | 41.84 | ||||
2nd | $ | 49.92 | $ | 44.65 | $ | 51.97 | $ | 36.02 | ||||
3rd | $ | 52.92 | $ | 45.36 | $ | 47.68 | $ | 33.96 | ||||
4th | $ | 51.93 | $ | 41.44 | $ | 42.84 | $ | 33.90 | ||||
Since May 4, 2009, the Company’s stock has traded on the New York Stock Exchange under the ticker symbol “CACI”. Previously, the Company’s stock traded on the New York Stock Exchange under the ticker symbol “CAI”.
| 2011 | 2010 | |||||||||||||||
Quarter | High | Low | High | Low | ||||||||||||
1st | $ | 48.70 | $ | 40.00 | $ | 48.85 | $ | 42.00 | ||||||||
2nd | $ | 54.11 | $ | 43.61 | $ | 49.92 | $ | 44.65 | ||||||||
3rd | $ | 62.75 | $ | 50.91 | $ | 52.92 | $ | 45.36 | ||||||||
4th | $ | 64.40 | $ | 58.15 | $ | 51.93 | $ | 41.44 | ||||||||
CACI INTERNATIONAL INC
NOTES TO CONSOLIDATED FINANCIAL STATEMENTS—(Continued)
NOTE 26.25. QUARTERLY FINANCIAL DATA (UNAUDITED)
This data is unaudited, but in the opinion of management, includes and reflects all adjustments that are normal and recurring in nature, and necessary, for a fair presentation of the selected data for these interim periods. Quarterly condensed financial operating results of the Company for the years ended June 30, 20102011 and 2009,2010, are presented below (in thousands except per share data).
| Year ended June 30, 2010 | ||||||||||||
| First | Second | Third | Fourth | |||||||||
Revenue | $ | 739,518 | $ | 776,727 | $ | 784,169 | $ | 848,717 | ||||
Income from operations | $ | 46,028 | $ | 47,461 | $ | 47,322 | $ | 53,971 | ||||
Net income attributable to CACI | $ | 23,855 | $ | 26,052 | $ | 26,708 | $ | 29,900 | ||||
Basic earnings per share | $ | 0.79 | $ | 0.87 | $ | 0.89 | $ | 0.99 | ||||
Diluted earnings per share | $ | 0.78 | $ | 0.85 | $ | 0.87 | $ | 0.96 | ||||
Weighted-average shares outstanding: | ||||||||||||
Basic | 30,034 | 30,109 | 30,171 | 30,241 | ||||||||
Diluted | 30,464 | 30,580 | 30,641 | 31,022 | ||||||||
| Year ended June 30, 2009(1) | ||||||||||||
| First | Second | Third | Fourth | |||||||||
Revenue | $ | 654,760 | $ | 672,507 | $ | 673,994 | $ | 728,901 | ||||
Income from operations | $ | 41,318 | $ | 45,249 | $ | 44,974 | $ | 52,573 | ||||
Net income attributable to CACI | $ | 19,580 | $ | 20,662 | $ | 21,972 | $ | 27,484 | ||||
Basic earnings per share | $ | 0.65 | $ | 0.69 | $ | 0.73 | $ | 0.92 | ||||
Diluted earnings per share | $ | 0.64 | $ | 0.68 | $ | 0.72 | $ | 0.91 | ||||
Weighted-average shares outstanding: | ||||||||||||
Basic | 30,103 | 29,895 | 29,939 | 29,965 | ||||||||
Diluted | 30,567 | 30,362 | 30,410 | 30,369 | ||||||||
| Year ended June 30, 2011 | ||||||||||||||||
| First | Second | Third | Fourth | |||||||||||||
Revenue | $ | 833,971 | $ | 867,278 | $ | 913,369 | $ | 963,162 | ||||||||
Income from operations | $ | 52,097 | $ | 59,435 | $ | 61,785 | $ | 78,084 | ||||||||
Net income attributable to CACI | $ | 28,655 | $ | 33,235 | $ | 36,427 | $ | 45,901 | ||||||||
Basic earnings per share | $ | 0.95 | $ | 1.10 | $ | 1.20 | $ | 1.52 | ||||||||
Diluted earnings per share | $ | 0.92 | $ | 1.08 | $ | 1.16 | $ | 1.44 | ||||||||
Weighted-average shares outstanding: | ||||||||||||||||
Basic | 30,304 | 30,288 | 30,373 | 30,162 | ||||||||||||
Diluted | 31,102 | 30,906 | 31,300 | 31,895 | ||||||||||||
| Year ended June 30, 2010 | ||||||||||||||||
| First | Second | Third | Fourth | |||||||||||||
Revenue | $ | 739,518 | $ | 776,727 | $ | 784,169 | $ | 848,717 | ||||||||
Income from operations | $ | 46,028 | $ | 47,461 | $ | 47,322 | $ | 53,971 | ||||||||
Net income attributable to CACI | $ | 23,855 | $ | 26,052 | $ | 26,708 | $ | 29,900 | ||||||||
Basic earnings per share | $ | 0.79 | $ | 0.87 | $ | 0.89 | $ | 0.99 | ||||||||
Diluted earnings per share | $ | 0.78 | $ | 0.85 | $ | 0.87 | $ | 0.96 | ||||||||
Weighted-average shares outstanding: | ||||||||||||||||
Basic | 30,034 | 30,109 | 30,171 | 30,241 | ||||||||||||
Diluted | 30,464 | 30,580 | 30,641 | 31,022 | ||||||||||||
NOTE 27.26. SUBSEQUENT EVENTEVENTS
On August 5, 2010,July 1, 2011, the Company made an $80.0 million prepayment oncompleted its transaction to acquire Pangia Technologies, LLC, for $41.0 million. Pangia is a software engineering company that provides technical solutions in the Term Loan, reducingareas of computer network operations, information assurance, mission systems, software and systems engineering, and IT infrastructure support. This acquisition furthers CACI’s growth in cybersecurity solutions and increases its presence in the outstanding balance to $198.7 million. From time to time,Intelligence Community.
On July 25, 2011, the Company may make additional prepayments, based on cash flows, working capital requirementsannounced that it had signed a definitive agreement to acquire Paradigm Holdings, Inc., the parent of Paradigm Solutions Corporation. Paradigm provides cybersecurity and other capital needs.enterprise IT solutions to clients in federal civilian agencies, the Department of Defense, and the Intelligence Community. This acquisition expands CACI’s cybersecurity capabilities and its presence in supporting national security missions. The Company anticipates that it will complete the acquisition during the first half of its fiscal year ending June 30, 2012.
In August 2011, the Company’s Board of Directors rescinded its May 2011 authorization to repurchase up to $175.0 million in value of shares of the Company’s common stock, and adopted a resolution authorizing the repurchase of up to 4.0 million shares of the Company’s common stock. On August 29, 2011, the Company announced its agreement with Bank of America, N.A. to repurchase 4.0 million shares of its common stock under an accelerated share repurchase program.
SCHEDULE II
CACI INTERNATIONAL INC
VALUATION AND QUALIFYING ACCOUNTS
FOR YEARS ENDED JUNE 30, 2011, 2010 2009 AND 20082009
(in thousands)
| Balance at Beginning of Period | Additions at Cost | Deductions | Other Changes | Balance at End of Period | |||||||||||||||||||||||||||||||||
2011 | |||||||||||||||||||||||||||||||||||||
Reserves deducted from assets to which they apply: | |||||||||||||||||||||||||||||||||||||
Allowances for doubtful accounts | $ | 3,212 | $ | 1,802 | $ | (1,383 | ) | $ | 107 | $ | 3,738 | ||||||||||||||||||||||||||
| Balance at Beginning of Period | Additions at Cost | Deductions | Other Changes | Balance at End of Period |
|
|
|
|
| ||||||||||||||||||||||||||||
2010 | |||||||||||||||||||||||||||||||||||||
Reserves deducted from assets to which they apply: | |||||||||||||||||||||||||||||||||||||
Allowances for doubtful accounts | $ | 3,501 | $ | 1,285 | $ | (1,394 | ) | $ | (180 | ) | $ | 3,212 | $ | 3,501 | $ | 1,285 | $ | (1,394 | ) | $ | (180 | ) | $ | 3,212 | |||||||||||||
|
|
|
|
| |||||||||||||||||||||||||||||||||
2009 | |||||||||||||||||||||||||||||||||||||
Reserves deducted from assets to which they apply: | |||||||||||||||||||||||||||||||||||||
Allowances for doubtful accounts | $ | 3,937 | $ | 1,208 | $ | (1,047 | ) | $ | (597 | ) | $ | 3,501 | $ | 3,937 | $ | 1,208 | $ | (1,047 | ) | $ | (597 | ) | $ | 3,501 | |||||||||||||
|
|
|
|
| |||||||||||||||||||||||||||||||||
2008 | |||||||||||||||||||||||||||||||||||||
Reserves deducted from assets to which they apply: | |||||||||||||||||||||||||||||||||||||
Allowances for doubtful accounts | $ | 3,469 | $ | 1,642 | $ | (1,479 | ) | $ | 305 | $ | 3,937 | ||||||||||||||||||||||||||
Items included as “Other Changes” include acquisition date reserves of acquired businesses and foreign currency exchange differences.
The decreases from June 30, 2009 to June 30, 2010 and from June 30, 2008 to June 30, 2009 are primarily due to a decrease in the foreign currency exchange rate between the pound sterling and the United States dollar.
Pursuant to the requirements of Section 13 or 15(d) of the Securities Exchange Act of 1934, the Registrant has duly caused this report to be signed on its behalf by the undersigned, hereunto duly authorized, on the 25th29th day of August 2010.2011.
| CACI International Inc | ||||
| Registrant | ||||
| Date: August | By: | |||
/s/ PAUL M. COFONI | ||||
Paul M. Cofoni President Chief Executive Officer and Director (Principal Executive Officer) | ||||
Pursuant to the requirements of the Securities Exchange Act of 1934, this report has been signed below by the following persons on behalf of the Registrant and in capacities and on the dates indicated.
Signatures | Title | Date | ||
/s/ PAUL M. COFONI Paul M. Cofoni | President, Chief Executive Officer and Director
| August | ||
/s/ THOMAS A. MUTRYN Thomas A. Mutryn | Executive Vice President, Chief Financial Officer and Treasurer (Principal Financial Officer) | August | ||
/s/ CAROL P. HANNA Carol P. Hanna | Senior Vice President, Corporate Controller
| August | ||
/s/ DR. J. P. LONDON Dr. J. P. London | Chairman of the Board, Executive Chairman | August | ||
|
| |||
/s/ GREGORY G. JOHNSON Adm Gregory G. Johnson, USN (Ret.) | Director | August | ||
/s/ DR. RICHARD L. LEATHERWOOD Dr. Richard L. Leatherwood | Director | August | ||
/s/ JAMES L. PAVITT James L. Pavitt | Director | August | ||
/s/ DR. WARREN R. PHILLIPS Dr. Warren R. Phillips | Director | August | ||
/s/ CHARLES P. REVOILE Charles P. Revoile | Director | August 29, 2011 | ||
Signatures | Title | Date | ||
/s/
|
| |||
James S. Gilmore, III | Director | August | ||
/s/ WILLIAM S. WALLACE Gen William S. Wallace, USA (Ret.) | Director | August | ||
/s/ GORDON R. ENGLAND Gordon R. England | Director | August | ||
10598